
god's desire to reveal himself versus humankind's inherent ...
Upload
khangminh22Category
view
2download
0
INCORPORATION OF INHERENT SAFETY AND ENVIRONMENTAL ASPECTS
IN PROCESS DESIGN AND SUPPLY CHAIN OPTIMIZATION
A Thesis
by
CHI QUANG NGUYEN
Submitted to the Office of Graduate and Professional Studies of
Texas A&M University
in partial fulfillment of the requirements for the degree of
MASTER OF SCIENCE
Chair of Committee, Mahmoud M. El-Halwagi
Committee Members, Mahboobul Mannan
Sergiy Butenko
Head of Department, M. Nazmul Karim
December 2015
Major Subject: Safety Engineering
Copyright 2015 Chi Quang Nguyen
ii
ABSTRACT
The integration of inherently safer design and environmental aspects at the early
phases of supply chain selection and process design provides significant benefits. It allows
the highest ability to positively influence lifecycle safety, environmental impact, and cost
of the project. Because of the preliminary nature of conceptual process design, it is crucial
to have a simple yet effective approach to evaluate and compare the design alternatives
based on the safety and environmental aspects at the early stage of the project when
available engineering information and data are limited. This work proposes a framework
to incorporating life-cycle safety measures in the supply chain design and the process
technologies included in the supply chain.
A hierarchical approach is developed for conceptual-phase engineering project to
facilitate the inclusion of safety objectives in the process synthesis and supply chain design
engineering work in a consistent manner. Design options are first generated and screened
based on economic criteria. Next, safety metrics are used in addition to economic
objectives to evaluate the various designs and transportation options. Findings from the
hazard and risk assessment are used to generate design alternatives to improve the safety
performance. Economic evaluation is updated for acceptable options to guide the decision
making.
To demonstrate the approach, a case study is solved for a conceptual design of a
high density polyethylene (HDPE) supply chain from shale gas. Various conceptual design
options that considered different elements such as process technology, manufacturing

iii
network and capacity were screened and evaluated per proposed framework. A high-level
quantitative risk assessment approach was used for assessing the safety aspects of the
design options.

iv
DEDICATION
To my parents, my wife, and my children
v
ACKNOWLEDGEMENTS
I would like to express my gratitude and appreciation to Dr. Mahmoud M. El-
Halwagi for the kind support and guidance on my research and graduate study program at
the Texas A&M University. I feel blessed to have Dr. El-Halwagi as my academic advisor.
I would like to thank Dr. Mannan and Dr. Butenko for being members of my
advisory committee and their time and support. I would also like to thank Dr. Fadwa Ejack
from the Texas A&M University at Qatar for her advices and inputs.
I would like to acknowledge the assistance from my friend, Ms. Thuy Le from
Shell E&P for the industrial insight related to the processes in this study.
And last but not least, I would like to express my appreciation to my parents and
my family for their love, encouragement and support to me during my graduate studies in
College Station. Special thanks goes to my wife who inspired me to pursue higher
education.
vi
NOMENCLATURE
ANP annual net after-tax profit
AR total annual revenue
BLEVE boiling liquid expanding vapor explosion
CEI chemical exposure index
CEPCI chemical engineering plant cost index
CISI comprehensive inherent safety index
CSTR continuous stirred tank reactor
D the distance between source port and receiving port
DC total annual depreciation cost
DME dimethyl ether
EF shipping tanker emission factor
EHS environmental health safety index
EISI enhanced inherent safety index
𝐹𝑖 explosion frequency of the process unit i
FBR fluid bed reactor
FC shipping vessel fuel consumption factor
FCI fixed capital investment
FEED front end engineering design
F&EI fire & explosion index
F,E&T fire, explosion and toxicity index

vii
GHG greenhouse gas
HAZID hazard identification study
HAZOP hazard and operability study
HI hazard index
HDPE high density polyethylene
HYSYS hyprotech systems process modeling software by AspenTech
I2SI integrated inherent safety index
INSET inherent safety health environment evaluation tool
IRA inherent risk assessment
ISD inherently safer design
ISI inherent safety index
ISIM inherent safety index module
ISRisk inherent safety risk for alternative design
𝐼𝑆𝐵𝐿𝑖 the inside battery limits investment of process i
ISPI inherent safety potential index
IST inherently safer technology
KPIs key performance indicators
𝐿1 manufacturing location 1
𝐿𝑘 manufacturing location k
LCA life cycle assessment
LDPE low-density polyethylene
LLDPE linear low-density polyethylene

viii
LNG liquefied natural gas
LOC loss of containment
M set of materials
MTO methanol to olefins
MTP methanol to propylene
OC total annual operating cost
𝑂𝑆𝐵𝐿𝑖 the outside battery limits investment of process i
𝑃1𝑖 unit process 1 of process i
𝑃2𝑖 unit process 2 of process i
𝑃𝑛𝑖 unit process n of process i
𝑃𝑥𝑖 unit process x of process i
𝑃1𝑗 unit process 1 of process j
𝑃2𝑗 unit process 2 of process j
𝑃𝑚𝑗 unit process m of process j
𝑃𝑦𝑗 unit process y of process j
P&ID piping and instrumentation diagram
PE polyethylene
PI potential hazard index
PIIS prototype index for inherent safety
Pre-FEED pre-front end engineering design
PRI process route index
PSD Prevention of Significant Deterioration permitting program

ix
QRA quantitative risk analysis
RISI risk-based inherent safety index
𝑅𝑥,𝑦 maximum individual risk at specific location x,y of a manufacturing plant
RiskBD risk for base design
ROI return of investment
SC supply chain
SM the shipping amount of natural gas (in cubic feet) or methanol (in tonnes)
shipped between plants
SWeHI safety weighted hazard index
TCI total capital investment
UHI unit inherent hazard index
UPI unit potential hazard index
𝑉𝑥,𝑦,𝑖 Occupant vulnerability at point x,y by the explosion event of the process
unit i.
WCI working capital investment
𝑇𝑥,𝑦 Fractional time of attendance at the point x,y; calculated as hours per
week/168 hours.
TC shipping tanker capacity
TR corporate tax rate
x
TABLE OF CONTENTS
Page
ABSTRACT .......................................................................................................................ii
DEDICATION .................................................................................................................. iv
ACKNOWLEDGEMENTS ............................................................................................... v
NOMENCLATURE .......................................................................................................... vi
TABLE OF CONTENTS ................................................................................................... x
LIST OF FIGURES ..........................................................................................................xii
LIST OF TABLES ......................................................................................................... xiii
CHAPTER I INTRODUCTION ....................................................................................... 1
CHAPTER II LITERATURE REVIEWS ......................................................................... 5
Inherent Safety Indices ................................................................................................... 5 Dow Fire and Explosion Hazards Index ..................................................................... 7
Academia Proposed Inherent Safety Indices .............................................................. 9
Quantitative Risk Analysis ........................................................................................... 12 Supply Chain Design .................................................................................................... 15
CHAPTER III A FRAMEWORK FOR SAFETY INTEGRATION IN
CONCEPTUAL PROCESS DESIGN ............................................................................. 16
Problem Statement ....................................................................................................... 16
Framework ................................................................................................................... 16 Methodology ................................................................................................................ 20
Process Design Study Initiation ............................................................................... 20 Option Development ................................................................................................ 20 Option Evaluation ..................................................................................................... 23
Economic Evaluation ........................................................................................... 23
Safety and Risk Evaluation .................................................................................. 25 Environmental Evaluation .................................................................................... 27
Option Refinement ................................................................................................... 27
CHAPTER IV CASE STUDY ........................................................................................ 29
Introduction .................................................................................................................. 29
xi
Technology Overview .................................................................................................. 31 HDPE Process Technology ...................................................................................... 31 Ethylene Technology ................................................................................................ 36
Thermal Cracking ................................................................................................. 36
Methanol to Olefins Technology Overview ......................................................... 38 Case Study .................................................................................................................... 40
CHAPTER V CASE STUDY RESULT AND ANALYSIS ........................................... 44
Economic Analysis ....................................................................................................... 44 Safety and Risk Evaluation .......................................................................................... 49
Hazard Identification ................................................................................................ 49
Risk Assessment ....................................................................................................... 52
Environmental Impact .............................................................................................. 58
CHAPTER VI CONCLUSION AND FUTURE WORK ................................................ 63
Conclusions .................................................................................................................. 63 Future work .................................................................................................................. 64
REFERENCES ................................................................................................................. 65
APPENDIX A .................................................................................................................. 74
APPENDIX B .................................................................................................................. 86
APPENDIX C .................................................................................................................. 90
APPENDIX D .................................................................................................................. 92

xii
LIST OF FIGURES
Page
Figure I-1 Ability to influence safety and cost curve by project phases ………….. 3
Figure I-2 Information accuracy and level of detail by project phases …………… 3
Figure III-1 Process synthesis and conceptual design block diagram ………………. 18
Figure III-2 Process synthesis and conceptual design framework ………………….. 19
Figure III-3 Schematic representation of process design alternatives based on
materials, chemical routes and manufacturing locations ………………. 22
Figure III-4 Current ISD assessment approaches and applicable time frame in
project life cycle ……………………………………………………….. 26
Figure IV-1 World Ethylene Supply Profile 2014 ………………………………….. 31
Figure IV-2 Polymerization simplified process flow diagram
– Slurry phase process …………………………………………………. 32
Figure IV-3 Simplified Process Flow Diagram – Ethane Thermal Cracking ……….. 36
Figure IV-4 Simplified Process Flow Diagram – MTO process ……………………. 39
Figure IV-5 A schematic representation of the case study’s process design
alternatives ……………………………………………………………... 42
Figure V-1 ROI summary of the design options …………………………………… 46
Figure V-2 Maximum individual risk summary …………………………………… 57
Figure V-3 Maximum individual risk – no LNG scope for ethane cracking route … 58
xiii
LIST OF TABLES
Page
Table II-1 Required data for some ISD metric calculation ………………………... 7
Table IV-1 World Polyethylene Demand …………………………………………... 29
Table IV-2 Major active PE process technology licensing – Gas phase process …... 34
Table IV-3 Major active PE process technology licensing – Solution process .......... 34
Table IV-4 Major active PE process technology licensing – Slurry phase process … 35
Table IV-5 Major active PE process technology licensing – Hybrid process ……... 35
Table IV-6 Typical range of operating parameters – Ethylene Cracking processes ... 37
Table IV-7 Major active ethylene thermal cracking process technology licensing ... 38
Table IV-8 Active MTO process technology licensing ……………………………. 40
Table IV-9 U.S. Barnett shale gas composition ……………………………………. 40
Table IV-10 Case study process design option matrix ………………………………. 43
Table V-1 Process Cost Correlations ……………………………………………… 45
Table V-2 Sensitivity analysis for the ROI of all design options at various prices
of shale gas and HDPE ………………………………………………… 48
Table V-3 Generic process hazards of Methanol route …………………………… 50
Table V-4 Generic process hazards of Ethane cracking route …………………….. 51
Table V-5 Incident scenarios for case study risk assessment ……………………… 53
Table V-6 Unit core explosion frequency of process units in the case study ……... 54
Table V-7 Assumption on meteorological data of manufacturing locations ……… 55
Table V-8 Assumption of distance of plant buildings from release points ……….. 56
Table V-9 Process plant energy consumption …………………………………….. 60

xiv
Table V-10 GHG emissions result for methanol route options …………………….. 61
Table V-11 GHG emission results for ethane cracking route options ……………… 61
Table V-12 GHG emission result per MMBtu feed gas ……………………………. 62
Table A-1 Option 1 economic analysis ……………………………………………. 74
Table A-2 Option 2 economic analysis ……………………………………………. 75
Table A-3 Option 3 economic analysis ……………………………………………. 76
Table A-4 Option 4 economic analysis ……………………………………………. 77
Table A-5 Option 5 economic analysis ……………………………………………. 78
Table A-6 Option 6 economic analysis ……………………………………………. 79
Table A-7 Option 7 economic analysis ……………………………………………. 80
Table A-8 Option 8 economic analysis ……………………………………………. 81
Table A-9 Option 9 economic analysis ……………………………………………. 82
Table A-10 Option 10 economic analysis …………………………………………... 83
Table A-11 Option 11 economic analysis ………………………………………….. 84
Table A-12 Option 12 economic analysis ………………………………………….. 85
Table B-1 Case study chemicals and their properties …………………………….. 86
Table C-1 Detailed individual risks of methanol route single complex
manufacturing options …………………………………………………. 90
Table C-2 Detailed individual risks of methanol route dispersed manufacturing
options …………………………………………………………………. 90
Table C-3 Detailed individual risks of ethane cracking route single complex
manufacturing options ……………………………………………….. 91
Table C-4 Detailed individual risks of ethane cracking route dispersed
manufacturing options ……………………………………………….. 91
1
CHAPTER I
INTRODUCTION
Inherent Safety, also known as Inherently Safer Design, ISD, or Inherently Safer
Technology, IST, is a philosophy, a different way of thinking toward safety that is applied
to the design and operation of a chemical process. (Hendershot 2006) It is considered the
first-order strategy in process risk management. Other strategies of process risk
management include passive, active and procedural. (CCPS 2010) Unlike those strategies
that accept the hazards and try to control them, the ISD concept is based on avoiding or
reducing the hazards associated to the process due to material properties, equipment
failures, human error and operational conditions; thus reducing the consequences of the
incidents. Similarly, environment friendly design is based on preventing the pollution
from the processes.
There are four principles to apply ISD:
Minimization. Application of this principle is such as using smaller quantities
of hazardous substances.
Substitution. This principle looks for replacing a material with a less hazardous
one.
Moderation. Examples are using less hazardous forms of a material or utilizing
process alternatives that operate at less hazardous conditions.
Simplification. This strategy aims to eliminate unnecessary complexity.
(CCPS 2010)
2
These four strategies help designers identify ISD alternatives. However, a
technology cannot be claimed as safer simply by comparing it to other alternatives. In
some cases a technological alternative is less safe with respect to certain hazards while
proving superior and safer in other aspects. The ultimate decision must be based on the
process conditions that apply to each specific design. These conditions can include several
elements such as the raw materials used, chemical reaction path, transportation methods
and storage arrangements. Therefore the alternative design assessment shall consider all
aspects for an accurate and reliable result.
The ISD concept can apply to all stages in a chemical supply chain lifecycle.
Applying inherently safer design in the conceptual phase brings with it many significant
benefits. (Maher et al. 2012) The most important of which is being the reduction of serious
and minor incidents, as well as saving money in the process. Additionally, implementing
safer design in the conceptual stage avoids the engineering rework and modifications at
later phases. However it is sometimes difficult to analyze the benefits early on in the
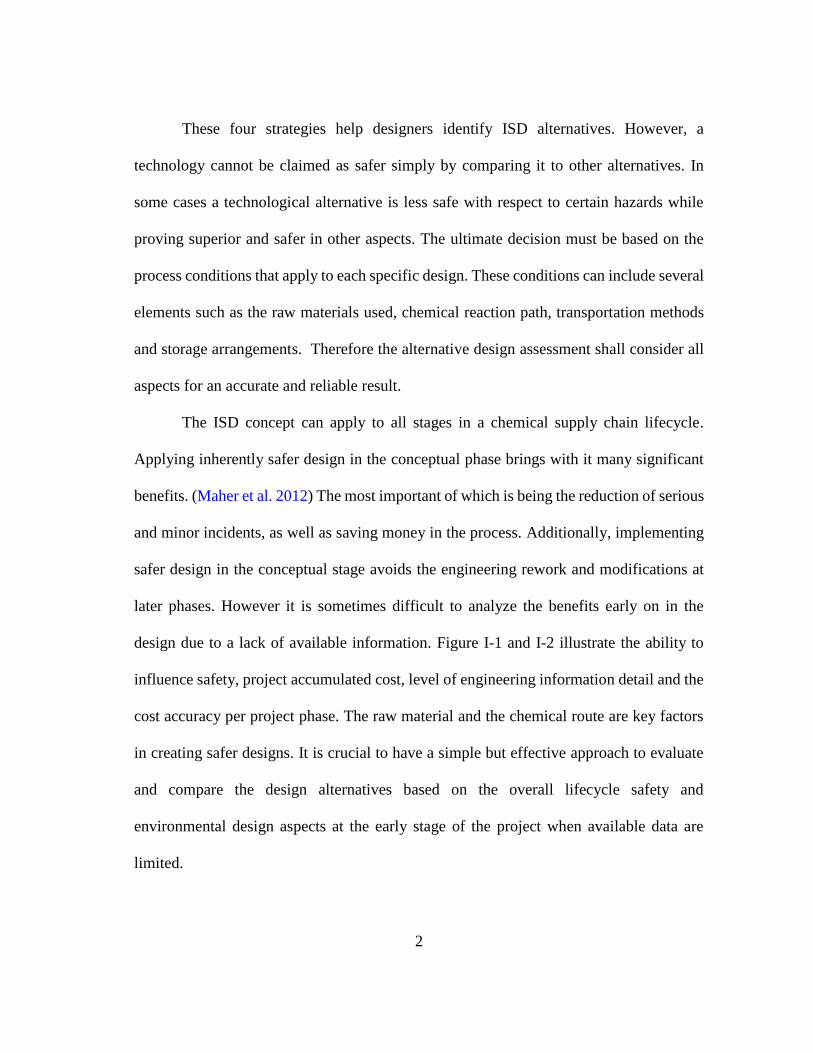
design due to a lack of available information. Figure I-1 and I-2 illustrate the ability to
influence safety, project accumulated cost, level of engineering information detail and the
cost accuracy per project phase. The raw material and the chemical route are key factors
in creating safer designs. It is crucial to have a simple but effective approach to evaluate
and compare the design alternatives based on the overall lifecycle safety and
environmental design aspects at the early stage of the project when available data are
limited.

3
Figure I-1 - Ability to influence safety and cost curve by project phases. Adapted
from (Kletz and Amyotte 2010)
Figure I-2 - Information accuracy and level of detail by project phases.
The main objective of this study is to establish a systematic approach to integrate
safety measures to the process and supply chain design in addition to traditional objectives
4
(e.g. economic, environmental) that are used in the early phase of a project. A framework
is developed in order to enable process engineering to “do right thing right the first time”
by:
Identifying affordable process technologies and supply chain options that meet
business needs. This includes life cycle cost and financial analysis to choose
design options.
Screening and assessing process technology options in term of safety and
environment and providing basis for decision making.
Enabling the project to meet corporate goals on safety and sustainability.
To illustrate the developed framework, a case study is solved for a conceptual
design of a high density polyethylene (HDPE) supply chain from shale gas.
5
CHAPTER II
LITERATURE REVIEWS
Inherent Safety Indices
The ISD concept was first introduced publicly by Dr. Travor Kletz after a
catastrophic accident happened in Flixborough, a chemical plant in England in 1974.
(Kletz 1978) Since that time, the concept of ISD has been widely studied by industry.
There have been relentless efforts from both academic and industrial sectors to develop
safety metrics for use in ISD evaluation. Some of them have been applied for years in
industries, such as Dow Fire & Explosion Index (F&EI), (AIChE 1994b) Dow Chemical
Exposure Index, (AIChE 1994a) Mond Index. (Tyler 1985) Those indices were developed
by companies in industry initially for use internally. Later they were adopted by American
Institute of Chemical Engineers and published for wider application. Others were
developed and proposed from academic fields, such as Prototype Index for Inherent Safety
(PIIS), (Edwards and Lawrence 1993) Inherent Safety Index (ISI), (Heikkilä 1999) Expert
System for Inherently Safer Process (i-Safe), (Palaniappan et al. 2002a; Palaniappan et al.
2002b) Safety Weighted Hazard Index (SWeHI), (Khan et al. 2001) Integrated Inherent
Safety Index (I2SI), (Khan and Amyotte 2005) Fuzzy based Inherent Safety Index,
(Gentile et al. 2003) Environmental Health Safety Index (EHS a.k.a SHE), (Koller et al.
2000) Key Performance Indicators (KPIs), (Tugnoli et al. 2007) and much more.
Overall, these metrics were developed for assessing the ISD of a single technology,
single plant process or comparing safety of multiple processes/technologies. They
6
employed different approaches such as hazard indices (i.e. fire, explosion and/or toxic
hazards) with expert judgment; consequence-based indexes; modeling and simulation.
Some indices were proposed to use during process chemical route/process flow sheet
development phase and other indexes require intensive data which is only available at the
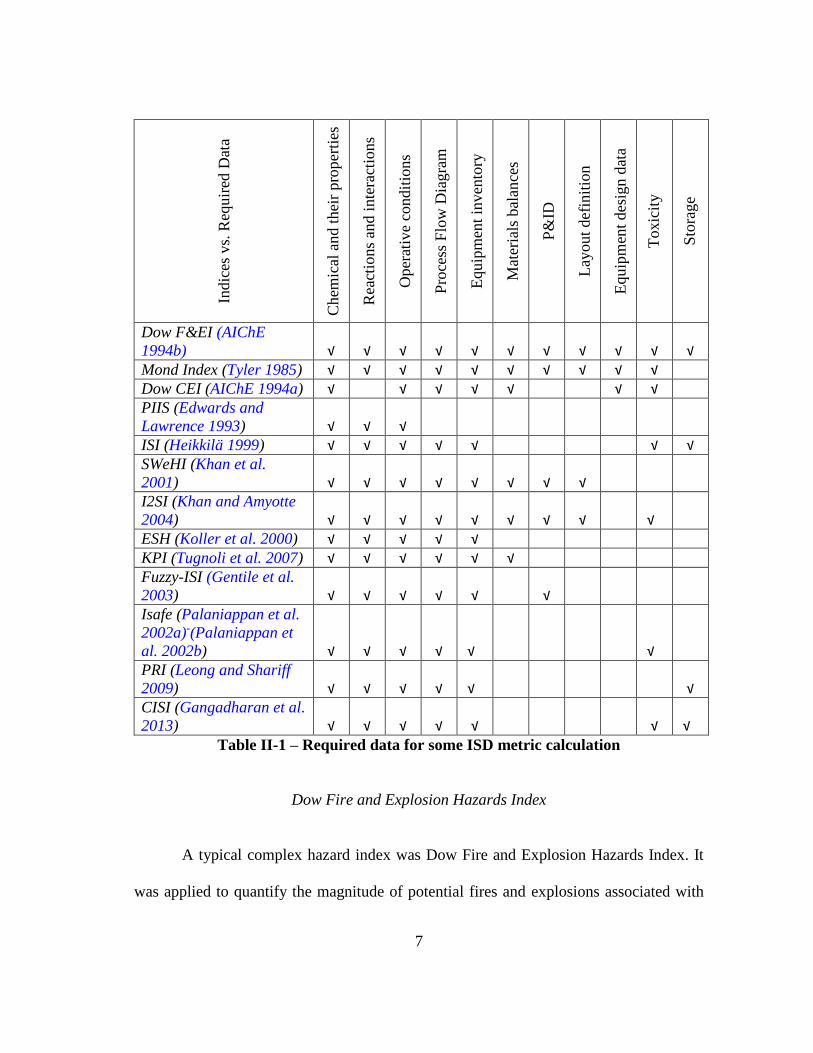
end of detailed engineering design. Table II-1 below summarizes some of the data required
in order to do the calculations of some quantitative indexes for ISD assessments. From the
table, required data varies from one approach to another. Variations range from a few
simple things such as chemical properties, reactions and interactions in the processes, and
key operating conditions to more complex changes like complete engineering information
(P&ID, layout, equipment design), process information (flow sheet, chemical properties,
reactions, material balances) and operation parameters (temperature, pressure,
inventory…).
7
Indic
es v
s. R
equir
ed D
ata
Chem
ical
and t
hei
r pro
per
ties
Rea
ctio
ns
and i
nte
ract
ions
Oper
ativ
e co
ndit
ions
Pro
cess
Flo
w D
iagra
m
Equip
men
t in
ven
tory
Mat
eria
ls b
alan
ces
P&
ID
Lay
out
def
init
ion
Equip
men
t des
ign d
ata
Toxic
ity
Sto
rage
Dow F&EI (AIChE
1994b) √ √ √ √ √ √ √ √ √ √ √
Mond Index (Tyler 1985) √ √ √ √ √ √ √ √ √ √
Dow CEI (AIChE 1994a) √ √ √ √ √ √ √
PIIS (Edwards and
Lawrence 1993) √ √ √
ISI (Heikkilä 1999) √ √ √ √ √ √ √
SWeHI (Khan et al.
2001) √ √ √ √ √ √ √ √
I2SI (Khan and Amyotte
2004) √ √ √ √ √ √ √ √ √
ESH (Koller et al. 2000) √ √ √ √ √
KPI (Tugnoli et al. 2007) √ √ √ √ √ √
Fuzzy-ISI (Gentile et al.
2003) √ √ √ √ √ √
Isafe (Palaniappan et al.
2002a)-(Palaniappan et
al. 2002b) √ √ √ √ √ √
PRI (Leong and Shariff
2009) √ √ √ √ √ √
CISI (Gangadharan et al.
2013) √ √ √ √ √ √ √
Table II-1 – Required data for some ISD metric calculation
Dow Fire and Explosion Hazards Index
A typical complex hazard index was Dow Fire and Explosion Hazards Index. It
was applied to quantify the magnitude of potential fires and explosions associated with
8
specific equipment or unit processes in a facility. In order to compute Dow F&EI, the
whole process is conceptually divided into separate process units. (AIChE 1994b) The
F&EI is the product of a process unit hazard factor (F3) and material factor (MF). The
material factor MF of a specific process unit takes into account the most hazardous
chemical in the process unit. The MF is obtained from the flammability and reactivity of
the substance rating by NFPA. A list of MFs for a number of chemical compounds and
materials were also provided in the Dow F&EI guidebook. (AIChE 1994b)
The process unit hazard factor (F3) is the product of the general process hazard
factor (F1) and the special process hazard factor (F2). F1 is the sum of all penalties applied
to different factors associated with the process: exothermic reactions, endothermic
reactions, material handling and transfer, enclosed process units, limited access, drainage
of materials, etc. F2 is also the sum of all penalties for toxic materials: operation at
vacuum, operation in or near the flammable limits, dust explosion risks, higher pressure
than atmospheric pressure, low temperature, quantity of flammable material, corrosion
and erosion, leakage around joints and packing, use of fired heaters, hot oil heat exchange
systems, large rotating equipment, and more.
Supplementing to Dow F&EI is the Dow Chemical Exposure Index (CEI) which
provides rating for potential health hazards associated with possible chemical release
incidents. (AIChE 1994a)
One limitation of these indices is that they are only addressing certain hazards, not
considering the full range of hazards. (CCPS 2010) Other limitation is the requirement of
extensive engineering information and process data in order to compute. It is best used at

9
the end of the design phase of a project when detailed engineering information is available.
Other application is to survey the existing plants for hazards identification and safety
improvements.
Academia Proposed Inherent Safety Indices
Several inherent safety indices have been developed by researchers around the
world in attempt to quantify the inherent safety aspects at early phase of projects. The
methods used for indices vary in term of goal, structure, required data and computation
technique. Comprehensive reviews and comparative studies on some of these indices can
be found in literatures. (Khan et al. 2003; Koller et al. 2001; Rahman et al. 2005;
Srinivasan and Natarajan 2012)
The first published index by Edwards and Lawrence proposed an inherent safety
index called Prototype Index for Inherent Safety (PIIS). (Edwards and Lawrence 1993)
This index was intended for analyzing the choice of a process route, the raw materials
used and the sequence of the reaction steps. The PIIS of a process route is calculated by
aggregating a Chemical Score and a Process Score. The Chemical Score takes into account
inventory, flammability, explosiveness and toxicity, and the Process Score considers
temperature, pressure and yield. These factors are scored on a numeric scale corresponding
to the ranges of values of the parameter. The route with highest numerical score is
considered the least safe route.
Heikkila has extended the PIIS by adding more parameters into the assessment and
suggested the Inherent Safety Index (ISI). (Heikkilä 1999) The ISI consists of two indices,

10
a chemical inherent safety index and a process inherent safety index. The chemical
inherent safety index has two sub-index groups: one for reaction hazards covering main
reaction, side reactions and chemical interaction; the other group for hazardous substances
including flammability, explosiveness, toxicity and corrosivity. The process inherent
safety index also consists of two sub-indices, one for process conditions (inventory,
process temperature and pressure) and the other for the process system (equipment safety
and safe process structure). The scoring of the parameters in this method is also based on
existing indices such as the Mond Index for toxic exposure and the Dow F&EI for the
pressure. Worst case situation basis is assumed for the calculations of the ISI. Similar to
the PIIS, a low index value represents an inherently safer process.
Koller and Co-workers have broadened the scope of the assessment with the EHS
index that covers environment, health and safety. (Koller et al. 2000) The EHS index is
design to apply for the specialty chemical process such as pharmaceuticals, argo and fine
chemicals. The safety aspects include mobility, fire and explosion, acute toxicity, reaction
and decomposition (the probability for undesired reaction or decomposition and
evaluating the probable energy potential). In term of health, two elements were evaluated:
irritation and chronic toxicity. For environmental aspects, five areas were analyzed: water-
mediated effects, air-mediated effects, solid waste, degradation (persistence of organic
substances) and dangerous property accumulation. A flexible approach is used for
calculation of individual index value based on availability of information. In case data is
not available either from databases or estimation, the index value could be calculated using
an error value at the worst case principle.
11
There were some expansions and improved indices over the PIIS and ISI suggested
by other researchers such as isafe, (Palaniappan et al. 2002a; Palaniappan et al. 2002b)
process route index (PRI), (Leong and Shariff 2009) enhanced inherent safety index
(EISI), (Li et al. 2011) comprehensive inherent safety index (CISI). (Gangadharan et al.
2013) In general these index based approaches are based on subjective scaling and
weighting, with limited coverage and often unclear granularity. (Srinivasan and Natarajan
2012)
Khan and Amyotte proposed a structured guideword based approach called
integrated inherent safety index (I2SI). (Khan and Amyotte 2004; Khan and Amyotte
2005) The I2SI is composed of two main sub-indices: hazard index (HI) and inherent
safety potential index (ISPI). The HI measures the damage potential of the process, taking
into account the hazard control measures. The process damage potential is assessed in four
areas: fire and explosion, acute toxicity, chronic toxicity, and environmental damage. The
hazard control measures are quantified subjectively on a scale from 1 to 10 based on
process safety expert’s experiences. The ISPI addresses the applicability of inherent safety
principles to the process, also measured on subjective scaling basis. The I2SI is the
combination of ISPI and HI. Inherent safety cost indices were introduced in order to
evaluate the economic potential of the option. A conceptual framework was suggested to
provide a procedure for calculation of HI and ISPI of process units and cost indices.
Tugnoli et al. used different approach in their recommended Inherent safety key
performance indicators (IS KPIs). (Tugnoli et al. 2007; Tugnoli et al. 2012) The IS KPIs
is based on the estimated consequences of potential loss of containment (LOC) events
12
associated to equipment and processes. In KPIs, the safety performance of process units
are measured by two indices: unit potential hazard index (UPI) and unit inherent hazard
index (UHI). The UPI measures the maximum impact area of the worst case scenario while
UHI captures the maximum damage area of likely safety scenarios, which takes into
account the credibility factors of the equipment in term of safety. The potential hazard
index (PI) and inherent hazard index (HI) of a process are the sum of all UPIs and UHIs
of all units in the process respectively. Both PI and HI are used to compare the inherent
safety of process options; with lower values of PI and HI indicating an inherently safer
process.
Although many approaches have been proposed, the methodologies for
incorporating ISD into technical, economic, safety and security design considerations are
not yet in place.
Quantitative Risk Analysis
The quantitative risk analysis (QRA) is a probabilistic methodology used in
industries around the world to quantify overall risk and analyze potential risk reduction
strategies. It was considered the best available analytic predictive tool to assess the risks
of complex processes, storage facilities, and hazardous material transport systems to
contribute to process safety. (Pasman and Reniers 2014) It was recognized as one of useful
tool and input in risk-informed decision making process. Many countries and territories
require QRA for licensing/permit purposes and provide risk criteria for facilities
processing, storage, handling and transportation of hazardous materials. (CCPS 2009)
13
QRA can be used from the beginning of a project and throughout the life cycle of
a facility. (Crowl 2011) Depending on the availability of information for use in the QRA,
the depth of study might vary.
There are five major steps to perform a QRA study, including:
1. Defining the potential event consequences and potential incidents.
2. Evaluate the incident consequences. Typical tools such as vapor dispersion
modeling and fire and explosion effect modeling can be used.
3. Estimate the potential incident frequencies using fault trees and event trees.
4. Estimate the incident impacts on people, environment and property.
5. Estimate the risk by combining the potential consequence for each event with
the event frequency, and summing over all events. (CCPS 2000)
A QRA study requires a major investment of time and effort, especially for a
comprehensive study involving the estimation of the frequency and consequences of a
range of hazard scenarios and of individual and societal risk. (Mannan and Lees 2005) On
the other hand, the uncertainty of the estimated risk could cause argument on the reliability
of the result.
Application of QRA in ISD assessment is one of research directions pursued by
many academic researchers. Shariff and Leong adopted QRA principles in their proposed
inherent risk assessment (IRA) approach by using a risk assessment tool integrated with
process design simulator (HYSYS). (Shariff and Leong 2009) Process design data from
HYSYS will be used to calculate the probability and the consequences relating to possible
risk. The tool is recommended to use at design phase.

14
Rathnayaka, Khan and Amyotte recently suggested a risk-based inherent safety
index (RISI), which is an extension of the I2SI developed earlier. (Rathnayaka et al. 2014)
Unlike I2SI which focused on hazard reduction, the authors included estimated occurrence
probability in RISI calculation. The index is measured by two risk estimations: risk for
base design (RiskBD) and inherent safety risk for alternative design (ISRisk). The RiskDB
is estimated based potential damage of major incident hazards in the process, taking into
account the probability of occurrence and the risk control measures. Similar to hazard
control measures in I2SI, the risk control measures is quantified subjectively based on ten
elements with scaling from 1 to 10 for each element. The ISRisk is computed similar to
RiskBD with the inclusion of inherent safety applicability factors, which the authors called
applicability indices. Two applicability indices were considered: one index accounts for
the magnitude of IS principles application to reduce hazard; the other index for the level
of applicability of ISD principles to reduce the occurrence probability of accident
scenarios. Both indices are subjectively scored on a one-to-ten scale basis. Finally RISI is
calculated as ratio between ISRisk and RiskBD. Alternative design with lower RISI is
considered inherently safer.
As ISD strategies can help reduce hazards, consequence and probability of the
incident, QRA based approaches for ISD are quite promising for assessing and comparison
of alternative designs.

15
Supply Chain Design
Supply network design in the process industry involves some key challenges.
Certain strategic configuration decisions need to be made in the early phases of the project
such as where to locate the new facilities or how to upgrade or expand of an existing
facility; how to assign sources of materials to each manufacturing facility; what are the
optimal size and scale of the manufacturing network, and which customer/market region
should each manufacturing facility/warehouse distribution serve …(Shah 2005) In
addition, the current strong industrial focus on sustainability is broadening the basis for
these strategic decisions to include environmental and social aspects in addition to cost.
The inclusion of multiple aspects as design objectives has been considered by
various studies on sustainable supply chains. Hugo and Pitstikopoulos developed a
methodology to include environmental impact criteria with the traditional economic
criteria for deciding location and capacity expansion of facilities, and transportation issues
in supply chain design and planning. The proposed multi-objective mixed-integer model
aims to maximize profit and minimize the environmental impact of the supply chain using
LCA criteria, while satisfying the market demand for products. (Hugo and Pistikopoulos
2005)
El-Halwagi et al. (2013) introduced an approach to include safety criteria into the
decision-making process for selection, location, and sizing of a biorefinery supply chain
in addition to the techno-economic objectives. Life cycle cumulative risk was considered,
covering storage and transportation, process conversion into biofuels or bioproducts, and
product storage. (El-Halwagi et al. 2013)
16
CHAPTER III
A FRAMEWORK FOR SAFETY INTEGRATION IN CONCEPTUAL PROCESS
DESIGN
Problem Statement
Consider a conceptual-phase engineering project with the objective of synthesizing
and screening flow sheet configurations in a supply chain for the conversion of certain
raw materials to certain products and a desired production capacity. The process synthesis
and initial conceptual design activities include the generation of design alternatives and
the preliminary screening ahead of detailed analysis. In addition to the technical,
economic, and environmental criteria used in screening the alternatives, the purpose of
this work is to introduce safety considerations early enough in process synthesis and
conceptual design. The typical safety analysis follows the initial generation and selection
of alternatives and requires relatively extensive data. The objective of this research is to
develop a hierarchical approach to the inclusion of safety objectives in process synthesis
and conceptual design in a consistent manner to how process engineering work is carried
out and using the data that are typically available early enough in design.
Framework
The main objective of the conceptual phase is to define “the best approach” to do
the project to meet the business need. Process engineering plays an active role in studying
17
a number of options and determining the viable processes and SC proposal to move
forward.
While there are many activities and deliverables which result from the conceptual
phase, the proposed work process focuses on five major blocks of activities that process
engineering should carry out in conceptual phase, including:
- Initiate process design study.
- Develop options
- Evaluate options
- Refine options
- Summarize and recommend
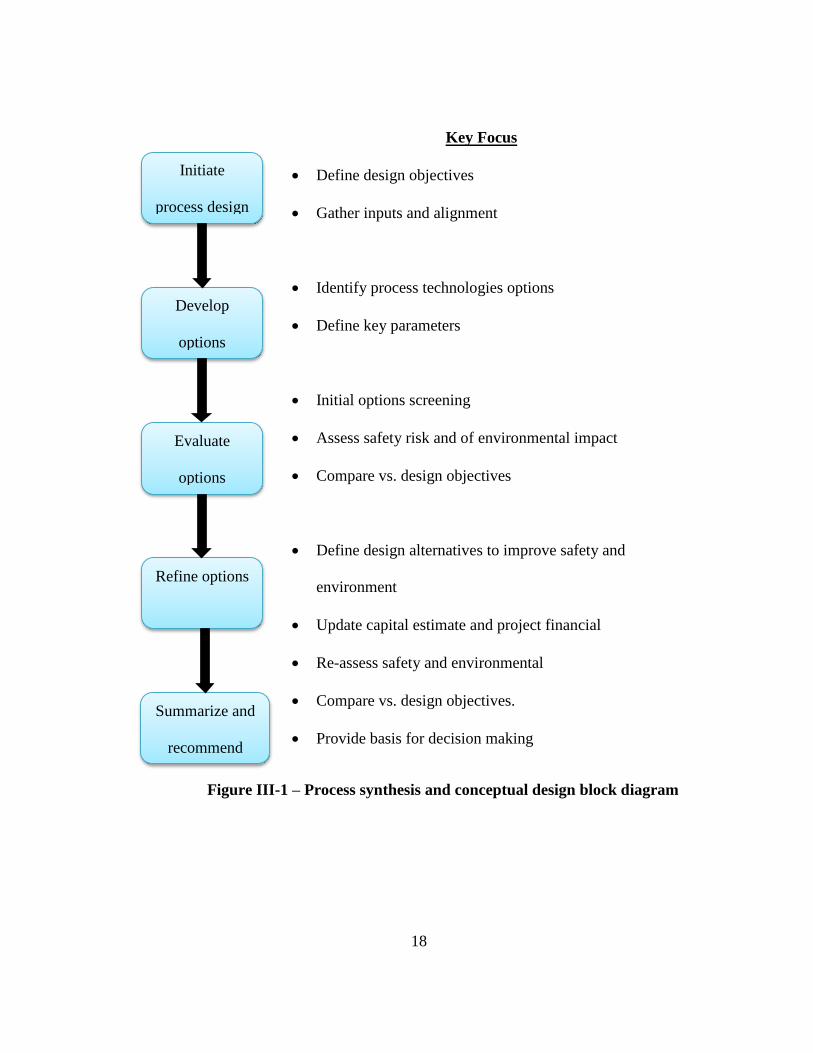
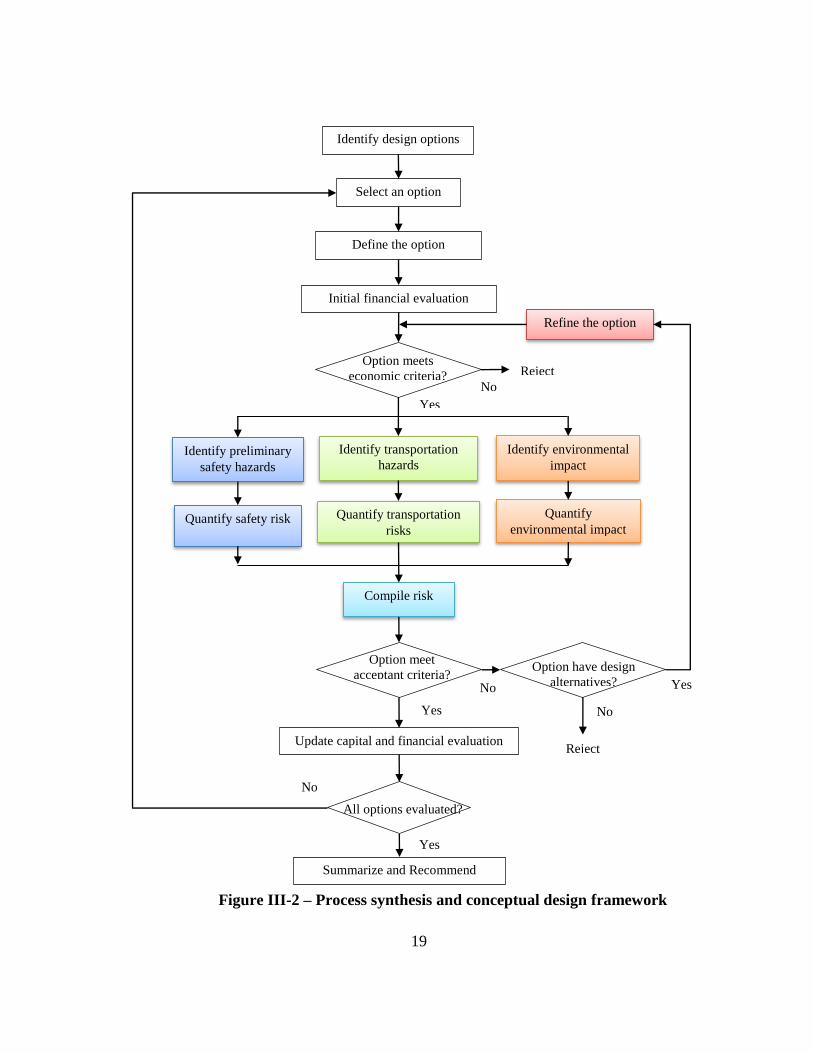
Figure III-1 illustrates this sequence of activities in graphic form and provides key
focuses of each block. Figure III-2 is a systematic approach to integrating safety and
environmental objectives in conceptual design. In this framework, design options are first
financially evaluated and screened versus economic acceptant criteria. Next, process
engineers shall perform hazard and risk evaluation covering safety, health, transportation
and environment for those options that pass the initial economic check. Overall risk
assessment result will be compiled for each options, then compared with the risk
acceptance criteria. The result will also be used to identify and generate design alternatives
to improve the safety and environment performances. Cost estimate and economics
evaluation will be updated for acceptable options for decision making.
18
Figure III-1 – Process synthesis and conceptual design block diagram
Key Focus
Define design objectives
Gather inputs and alignment
Identify process technologies options
Define key parameters
Initial options screening
Assess safety risk and of environmental impact
Compare vs. design objectives
Define design alternatives to improve safety and
environment
Update capital estimate and project financial
Re-assess safety and environmental
Compare vs. design objectives.
Provide basis for decision making
Initiate
process design
Develop
options
Evaluate
options
Refine options
Summarize and
recommend
19
Figure III-2 – Process synthesis and conceptual design framework
Yes
All options evaluated?
Identify design options
Initial financial evaluation
Compile risk
Refine the option
Define the option
Identify preliminary
safety hazards
Identify transportation
hazards
Identify environmental
impact
Quantify safety risk Quantify transportation
risks
Quantify
environmental impact
Yes
Option meets
economic criteria? Reject
No
Update capital and financial evaluation
Summarize and Recommend
Option meet
acceptant criteria?
Yes
No
Reject
No
Option have design
alternatives? Yes
Select an option
No

20
Methodology
Process Design Study Initiation
The process engineering initiates the process design work by obtaining following
information and inputs:
- Process design objectives.
- Available feedstock sources, characteristics, location and delivery approach
(i.e. by pipeline, tank truck, railroad…).
- Corporate’s vision, goal, policy and standards on safety and environment;
current status and gaps as well as expectations for the project. These inputs are
basis for setting up the safety and environment risk acceptant criteria.
- Company’s requirement and guidelines on project financial aspect to establish
project’s economics acceptant criteria.
- Applicable law and regulation as well as company design codes and standards.
Acceptant criteria shall be clearly defined, reviewed and agreed (with senior
management) in advance before design can begin.
Option Development
The main focus of this step is generating process design options (process
synthesis). Many process synthesis techniques are available in literature and can be
utilized, for example Sustainable Design through Process Integration by El-Halwagi. (El-
Halwagi 2012)
21
There are some factors that impact the process synthesis and supply chain design.
Generating applicable process design options should consider choices of feedstock,
chemical routes and technologies. Other considerations are supply aspects such as size and
scale of the process; single manufacturing site versus multiple smaller-capacity sites;
consolidated supply chain or dispersed supply chain; size and means of transportation of
materials, intermediates and finished products. For example, intermediate products can be
produced in one geographic location then shipped to another manufacturing location to
process for final products.
Manufacturing location is also an important dimension in generation of supply
network design options. There are various factors impacting manufacturing location
selection, including the following:
- Availability of materials
- Availability of skilled labors and resource
- Infrastructure
- Availability of transportation and means
- Characteristic of the location and its neighbor whether it’s located in adjacent
to residential area or in industrial park
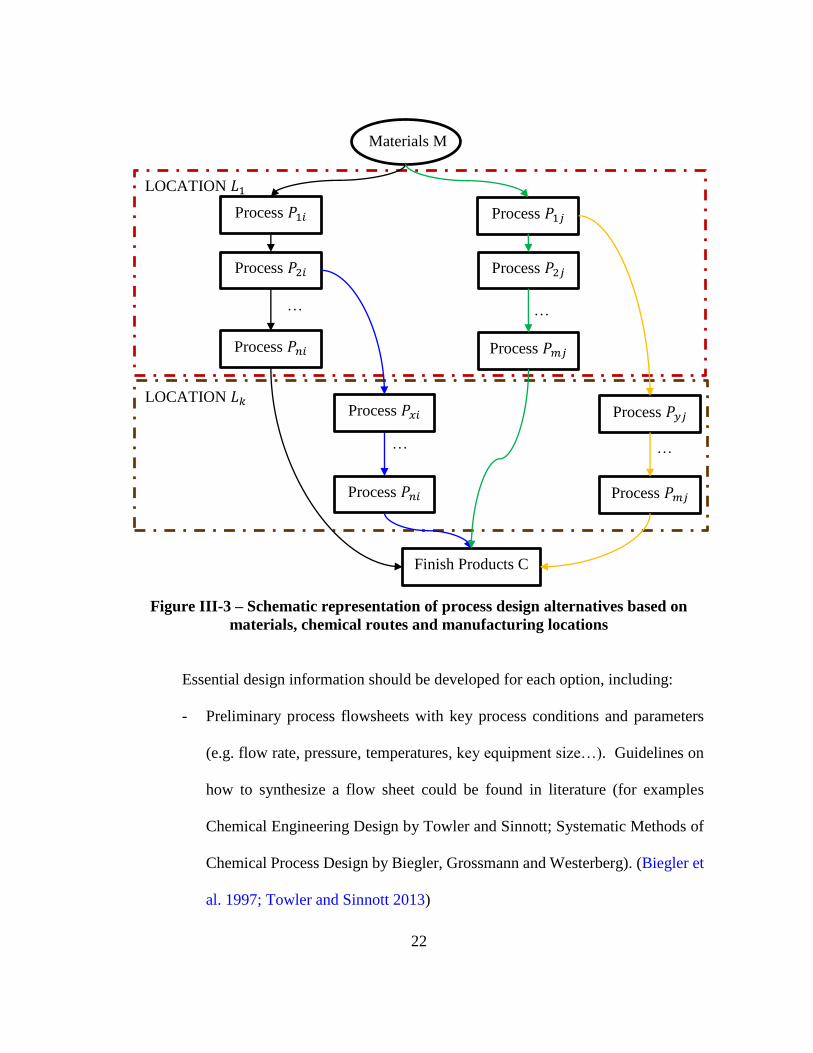
Figure III-3 shows a schematic representation of process design alternatives
considering 3 dimensions: materials choices, process routes and manufacturing locations.
22
LOCATION 𝐿1
LOCATION 𝐿𝑘
…
…
…
…
Process 𝑃1𝑖
Materials M
Process 𝑃1𝑗
Process 𝑃2𝑖
Process 𝑃𝑥𝑖 Process 𝑃𝑦𝑗
Process 𝑃𝑛𝑖
Process 𝑃𝑛𝑖 Process 𝑃𝑚𝑗
Process 𝑃2𝑗
Process 𝑃𝑚𝑗
Finish Products C
Figure III-3 – Schematic representation of process design alternatives based on
materials, chemical routes and manufacturing locations
Essential design information should be developed for each option, including:
- Preliminary process flowsheets with key process conditions and parameters
(e.g. flow rate, pressure, temperatures, key equipment size…). Guidelines on
how to synthesize a flow sheet could be found in literature (for examples
Chemical Engineering Design by Towler and Sinnott; Systematic Methods of
Chemical Process Design by Biegler, Grossmann and Westerberg). (Biegler et
al. 1997; Towler and Sinnott 2013)

23
- Rough-cut capacity analysis and material balance
- Physical and chemical properties of feedstock and chemicals used in processes.
- Inventory (feedstock, intermediate, finished product) and frequency of
replenishment/shipment
- Information on potential sites where the manufacturing plant might be located,
including climate data, seismic conditions, infrastructure and mean of
transportation availability.
Option Evaluation
As mentioned earlier, evaluation in this proposed framework includes economic
evaluation; hazard and risk assessment, covering safety, health, transportation and
environment.
Economic Evaluation
Economic evaluation on generated design options will screen out unattractive
cases. This will help focus effort of process engineering on more viable options. Given
limited available data at this phase, simple return of investment (ROI) calculation can be
used to assess and compare economic yield of the options. The ROI is a ratio of annual
net (after-tax) profit (ANP) and total capital investment (TCI). (El-Halwagi 2012)
[III.1] ROI =Annual Net (after−tax)Profit
TCI× 100%
Total capital investment (TCI) is made up of fixed capital investment (FCI) and
working capital investment (WCI).
24
[III.2] TCI = FCI + WCI
A number of methods can be utilized for estimation of capital cost. The following
are some of the most commonly used methods:
- Manufacture’s quotation.
- Computer-aid tools.
- Capacity ratio with exponent.
- Updates using cost indices.
- Factors based on equipment cost.
- Empirical correlations.
- Turnover ratio. (El-Halwagi 2012)
Based on availability of engineering information, process engineers may choose
an appropriate approach to estimate the capital cost. Some cases, combination of these
methods can be used.
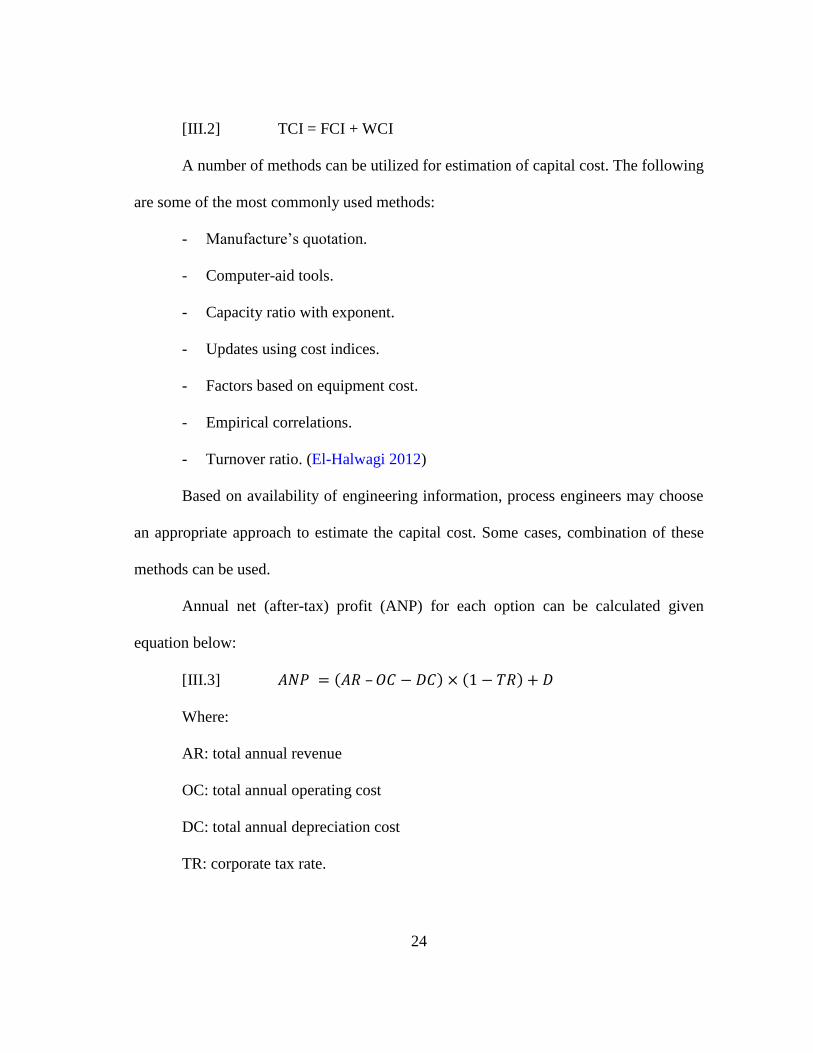
Annual net (after-tax) profit (ANP) for each option can be calculated given
equation below:
[III.3] 𝐴𝑁𝑃 = (𝐴𝑅 – 𝑂𝐶 − 𝐷𝐶) × (1 − 𝑇𝑅) + 𝐷
Where:
AR: total annual revenue
OC: total annual operating cost
DC: total annual depreciation cost
TR: corporate tax rate.
25
Techniques for estimation of these cost components can be found in literatures, for
instant, Chemical Engineering Design by Towler and Sinnott, Sustainable Design through
Process Integration by El-Halwagi. (El-Halwagi 2012; Towler and Sinnott 2013)
Safety and Risk Evaluation
Hazard identification (HAZID) shall be performed for each design option that
passed the economic screening. Technique for HAZID can be found in literature, for
example “Guidelines for Hazard Evaluation Procedures” by Center for Chemical Process
Safety. (CCPS 2008)
Hazard and risk evaluation are undertaken using limited information available by
the phase data, such as
- Capacity/flow
- Material balance
- Material properties: flammability, toxicity, explosion and reactivity
- Initial flow sheet and key process equipment
- Key process conditions i.e. temperatures, pressure
Hazards and risk evaluation shall consider the entire life cycle of the supply chain
option, including storage and transportation.
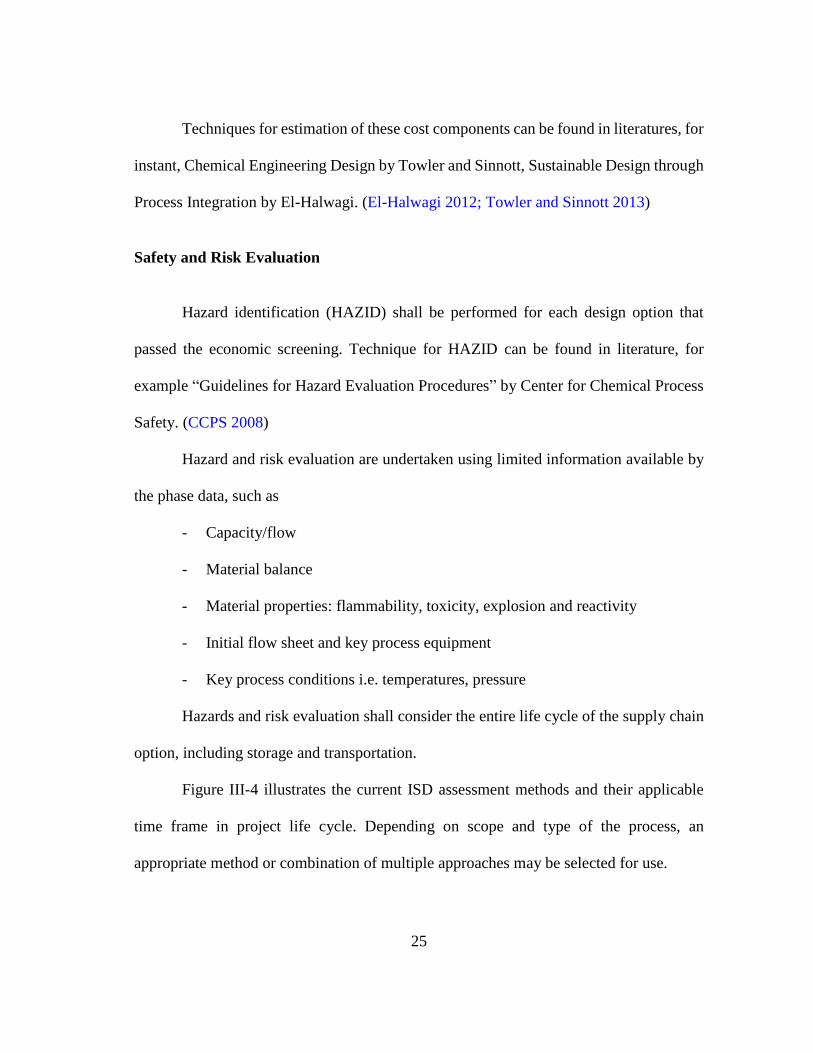
Figure III-4 illustrates the current ISD assessment methods and their applicable
time frame in project life cycle. Depending on scope and type of the process, an
appropriate method or combination of multiple approaches may be selected for use.
26
Figure III-4 – Current ISD assessment approaches and applicable time frame in project life cycle

27
Environmental Evaluation
Environmental assessment for design options can be undertaken in different
aspects such as energy, environmental discharge (solid waste, water, air emission) and
land use. One or more environmental aspects could be evaluated in corresponding to
acceptance criteria. Life cycle approach shall be employed in the context of limited
available data at conceptual phase.
Benchmarking technique is widely applied in chemical and petrochemical
industries. Many benchmarking studies have been completed on various industry sectors
at global level and country basis, especially in energy efficiency and greenhouse gas
(GHG) emissions. Best-in-class data from these studies on relevant process technologies
and operations could be used for the evaluation.
Option Refinement
Evaluation results and findings from previous steps will be critical inputs for
refining options. ISD guide word approach can be used for design alternative
identification. Substitution of hazardous materials with less hazardous ones and
minimizing hazardous material inventory are usually the most effective ISD strategies
applied in conceptual design phase. (Maher et al. 2012) Opportunities on moderation and
simplification strategies could also be applied such as less severe operation condition
processes or fewer steps processes. Many examples, success stories and case studies of
ISD can be found in published literatures for consideration of reapplication, such as
“Process Plants: A Handbook for Inherently Safer Design” by Kletz and Amyotte (2010).
28
Implementation of inherent safety for refining options is not the only risk reduction
strategy available. In some cases it may not be the most reasonably practicable application.
Combination of various risk management strategies; for instance inherently safer design
and additional layers of protection might be used in finding design alternatives to reduce
risks to an acceptable level.
One important note that any change to the base design option to form an
alternatives could impact the other processes or steps in the entire supply chain. Therefore
life cycle re-evaluations on hazards and risk as well as environmental impact are needed.
29
CHAPTER IV
CASE STUDY
Introduction
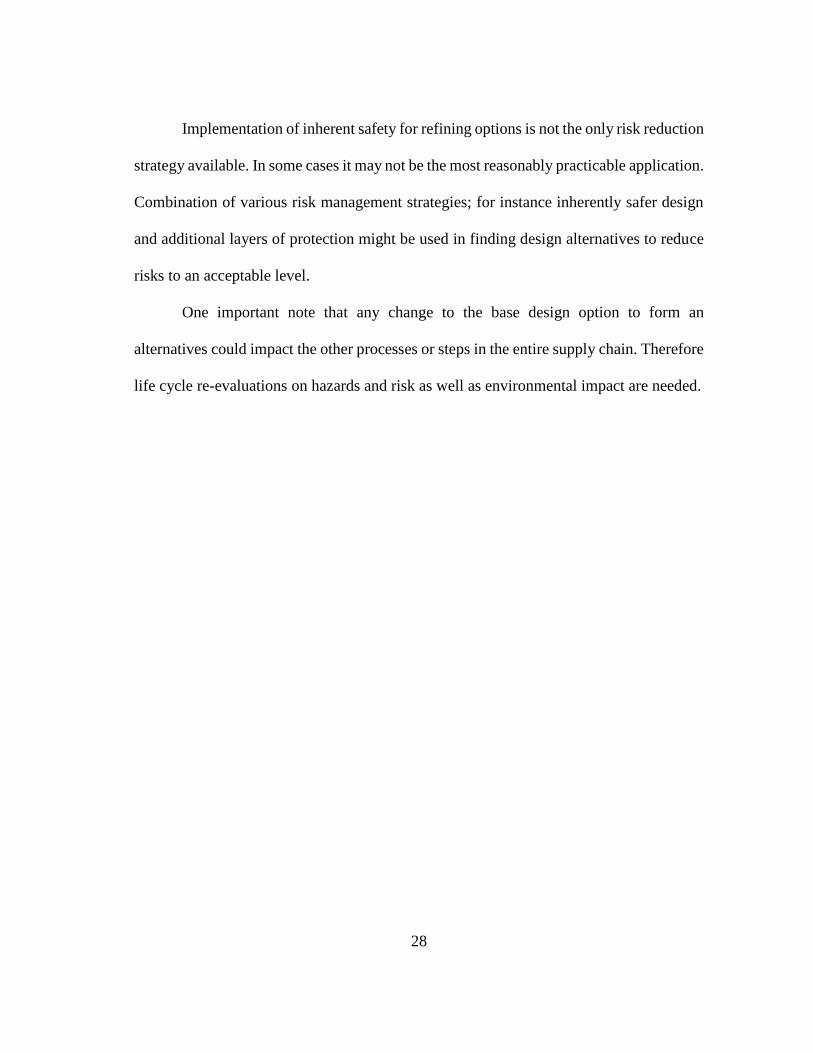
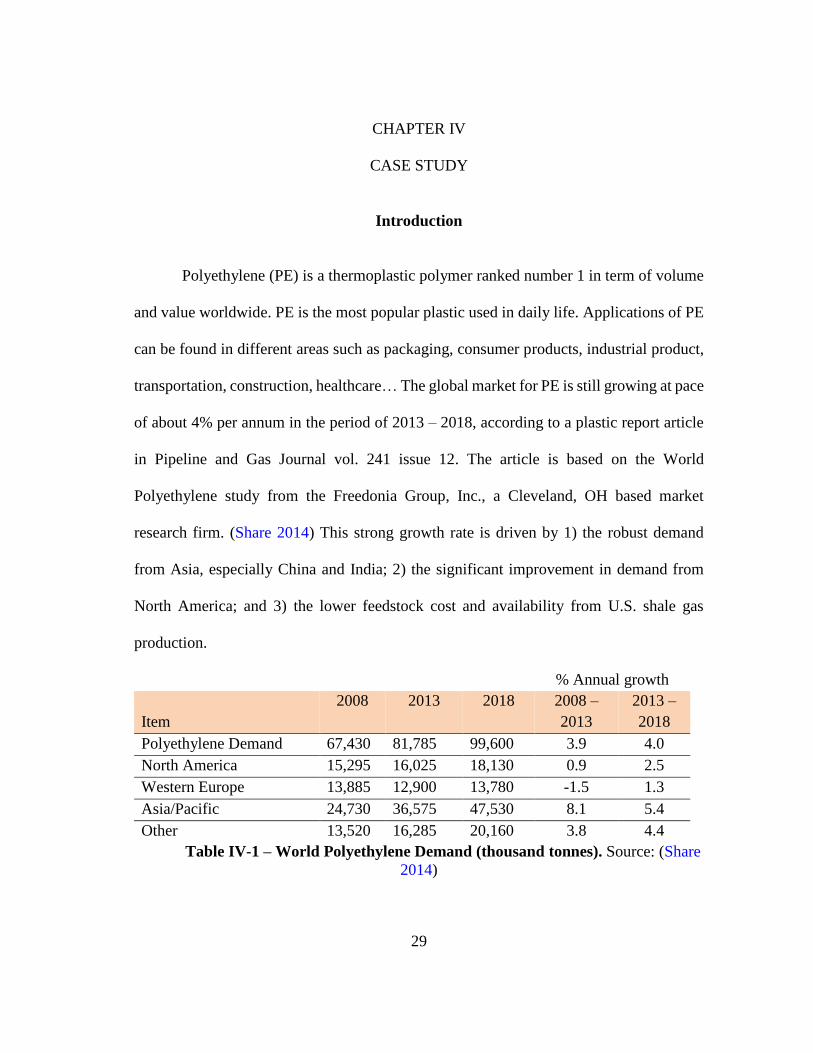
Polyethylene (PE) is a thermoplastic polymer ranked number 1 in term of volume
and value worldwide. PE is the most popular plastic used in daily life. Applications of PE
can be found in different areas such as packaging, consumer products, industrial product,
transportation, construction, healthcare… The global market for PE is still growing at pace
of about 4% per annum in the period of 2013 – 2018, according to a plastic report article
in Pipeline and Gas Journal vol. 241 issue 12. The article is based on the World
Polyethylene study from the Freedonia Group, Inc., a Cleveland, OH based market
research firm. (Share 2014) This strong growth rate is driven by 1) the robust demand
from Asia, especially China and India; 2) the significant improvement in demand from
North America; and 3) the lower feedstock cost and availability from U.S. shale gas
production.
% Annual growth
Item
2008 2013 2018 2008 –
2013
2013 –
2018
Polyethylene Demand 67,430 81,785 99,600 3.9 4.0
North America 15,295 16,025 18,130 0.9 2.5
Western Europe 13,885 12,900 13,780 -1.5 1.3
Asia/Pacific 24,730 36,575 47,530 8.1 5.4
Other 13,520 16,285 20,160 3.8 4.4
Table IV-1 – World Polyethylene Demand (thousand tonnes). Source: (Share
2014)

30
PE is produced by converting ethylene into long-chain polymers. Based on the
properties of the product, PE can be classified into three main types:
- Low-density polyethylene (LDPE)
- Linear low-density polyethylene (LLDPE)
- High-density polyethylene (HDPE)
Different types of PE are made based on the conditions of polymerization process.
LDPE is produced on free radical processes at high pressure reaction. HDPE and LLDPE
are made with coordination catalysts using low pressure processes. Density of LLDPE and
LDPE is typically in range of 910 – 940 g/L; of HDPE is at 940 – 970 g/L. LDPE structure
contains short chain branches and long chain branches while HDPE and LLDPE generally
have short chain branches. (Soares and McKenna 2012)
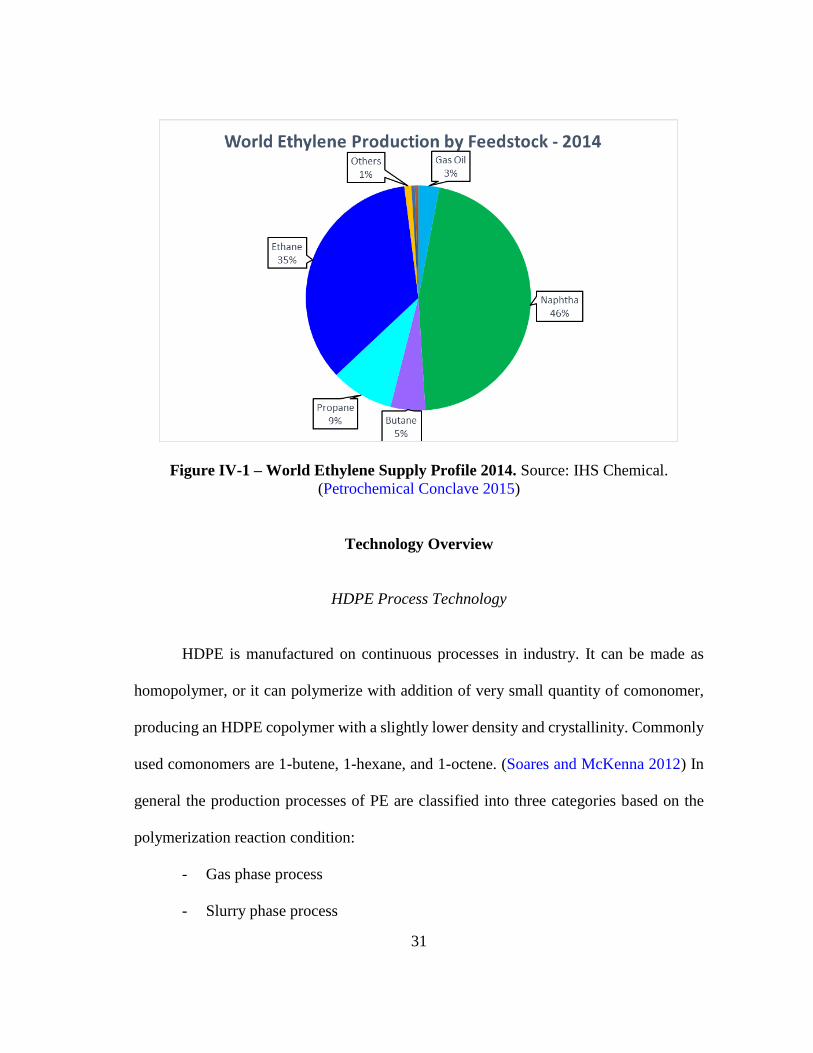
In industry, ethylene is primarily produced by thermal cracking of natural gas feed
stocks (ethane, propane, and butane) and petroleum liquids (naphtha, condensate, and gas
oils). Other routes producing ethylene from different feed stocks include catalytic
dehydration of bioethanol, (Morschbacker 2009) catalytic conversion of methanol, (Chen
et al. 2005) and coal based methanol conversion. Figure IV-2 illustrates the estimated
world ethylene production portfolio in 2014 by various feedstock.
This case study addresses the conceptual process design and supply chain of
HDPE, the most widely used of the three PE plastics, with natural/shale gas as feedstock
source. Overview of process technologies for HDPE and ethylene productions will be
discussed in the next section. The case study is solved using the proposed approach
discussed previously in the chapter III.
31
Figure IV-1 – World Ethylene Supply Profile 2014. Source: IHS Chemical.
(Petrochemical Conclave 2015)
Technology Overview
HDPE Process Technology
HDPE is manufactured on continuous processes in industry. It can be made as
homopolymer, or it can polymerize with addition of very small quantity of comonomer,
producing an HDPE copolymer with a slightly lower density and crystallinity. Commonly
used comonomers are 1-butene, 1-hexane, and 1-octene. (Soares and McKenna 2012) In
general the production processes of PE are classified into three categories based on the
polymerization reaction condition:
- Gas phase process
- Slurry phase process

32
- Solution process
Figure IV-2 represents a simplified process diagram of a slurry phase
polymerization process. (Soares and McKenna 2012)
Figure IV-2 – Polymerization simplified process flow diagram – Slurry phase
process
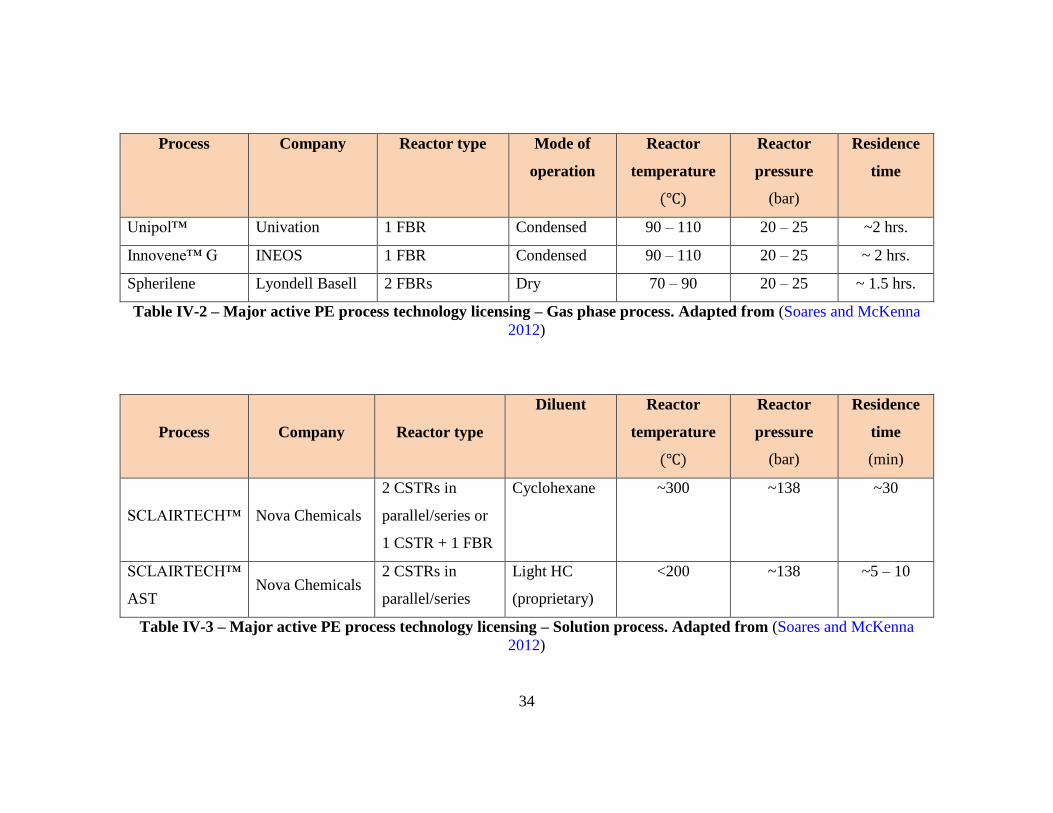
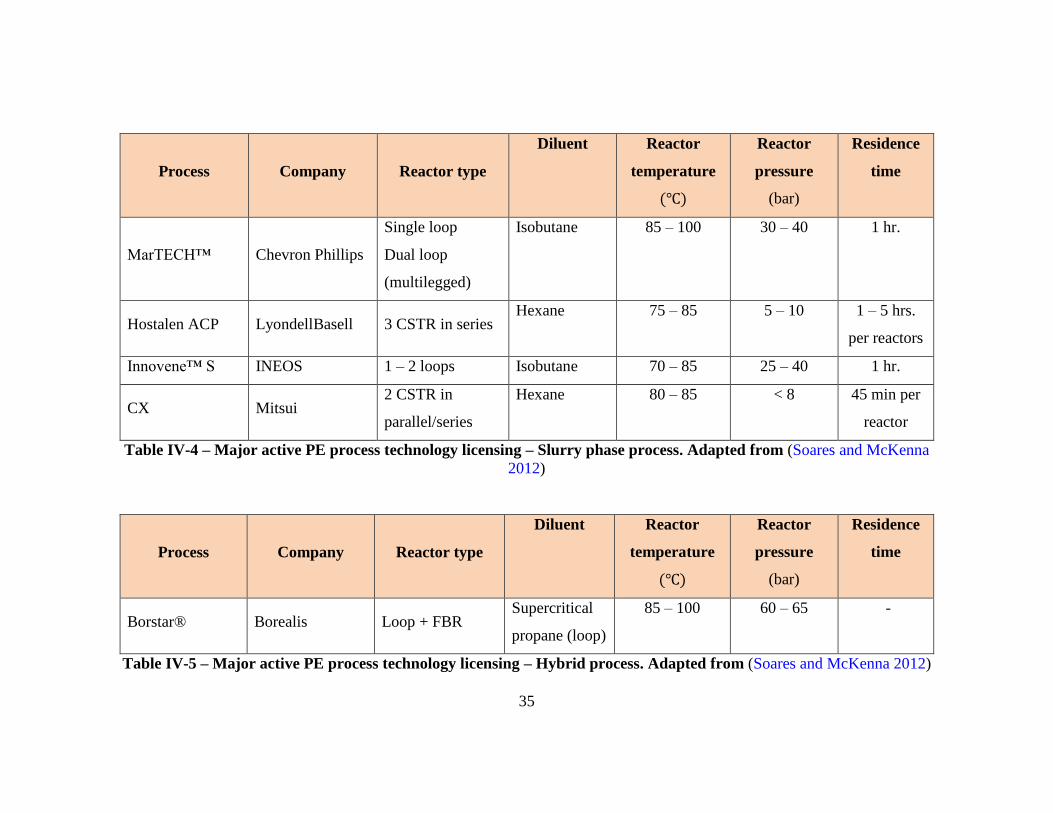
The key equipment in the polymerization is the reactor. There are three types of
reactor utilized in existing commercially HDPE processes: fluid bed reactor (FBR),
continuous stirred tank reactor (CSTR), and loop reactor. Table IV-2, IV-3, IV-4 and IV-
5 lists some of major active HDPE process technology licensors today. Note that there are
more HDPE process technologies being used globally. However, these processes are no
longer active in licensing market. Therefore they are not included in the table.
Most of listed process technologies are capable to produce HDPE and LLDPE
(swing process) with wide density range. Different grades of HDPE (regarding density,
Feedstock Purification
FeedStocks
ReactorMonomer/
Diluent Separation
Catalyst
DegassingPelletizationStorage
To Purge
Monomer Recycle
Diluent Recycle

33
melt index, mechanical strength…) for various applications can be achieved based on the
configurations of reactors (i.e. single or dual, multiple reactors in series) and type of
catalyst used. The catalysts used in HDPE processes are Ziegler-Natta catalyst and
Chromium based catalyst. Further details of commercial process and catalysts can be
found in (Nowlin 2014; Soares and McKenna 2012).
34
Process Company Reactor type Mode of
operation
Reactor
temperature
(℃)
Reactor
pressure
(bar)
Residence
time
Unipol™ Univation 1 FBR Condensed 90 – 110 20 – 25 ~2 hrs.
Innovene™ G INEOS 1 FBR Condensed 90 – 110 20 – 25 ~ 2 hrs.
Spherilene Lyondell Basell 2 FBRs Dry 70 – 90 20 – 25 ~ 1.5 hrs.
Table IV-2 – Major active PE process technology licensing – Gas phase process. Adapted from (Soares and McKenna
2012)
Process Company Reactor type
Diluent Reactor
temperature
(℃)
Reactor
pressure
(bar)
Residence
time
(min)
SCLAIRTECH™ Nova Chemicals
2 CSTRs in
parallel/series or
1 CSTR + 1 FBR
Cyclohexane ~300 ~138 ~30
SCLAIRTECH™
AST Nova Chemicals
2 CSTRs in
parallel/series
Light HC
(proprietary)
<200 ~138 ~5 – 10
Table IV-3 – Major active PE process technology licensing – Solution process. Adapted from (Soares and McKenna
2012)
35
Process Company Reactor type
Diluent Reactor
temperature
(℃)
Reactor
pressure
(bar)
Residence
time
MarTECH™ Chevron Phillips
Single loop
Dual loop
(multilegged)
Isobutane 85 – 100 30 – 40 1 hr.
Hostalen ACP LyondellBasell 3 CSTR in series Hexane 75 – 85 5 – 10 1 – 5 hrs.
per reactors
Innovene™ S INEOS 1 – 2 loops Isobutane 70 – 85 25 – 40 1 hr.
CX Mitsui 2 CSTR in
parallel/series
Hexane 80 – 85 < 8 45 min per
reactor
Table IV-4 – Major active PE process technology licensing – Slurry phase process. Adapted from (Soares and McKenna
2012)
Process Company Reactor type
Diluent Reactor
temperature
(℃)
Reactor
pressure
(bar)
Residence
time
Borstar® Borealis Loop + FBR Supercritical
propane (loop)
85 – 100 60 – 65 -
Table IV-5 – Major active PE process technology licensing – Hybrid process. Adapted from (Soares and McKenna 2012)

36
Ethylene Technology
Thermal Cracking
Ethylene production in U.S is increasing in the last couple years, majority from
ethane thermal cracking, thanks to the abundant ethane rich shale gas from U.S. The
process is called pyrolysis or steam cracking. Figure IV-3 illustrates a simplified process
flow diagram of ethylene steam cracking.
Figure IV-3 – Simplified Process Flow Diagram – Ethane Thermal Cracking
Cracking of ethane is carried out in the cracking furnaces. The ethane stream is
heated and mixed with steam then enters a fired tubular reactor (radiant tube or radiant
coil) where the pyrolysis happens under controlled residence time, temperature profile,
and partial pressure. The design and arrangement of the radiant coil are quite varied from
different technology providers. The conversion is highly endothermic, therefore it requires
Ethane/Steam
Fuel oil
Ethylene
Propylene
Mix C4
C5+
Propane
FurnacesQuenchTower
Causticwash
Gas compressor
Dryer
Acetylenereactor
De-ethanizer
De-methanizer
C2 Splitter
De-propanizer
De-butanizer
C3 Splitter
Gas Compressor
Methane rich gasHydrogen rich gas

37
high energy inputs. The reaction products will be quickly cooled down at a water quench
tower to prevent degradation of the highly reactive products by secondary reactions. The
cracked gas leaving the water quench tower is compressed to 32 – 37 bar in a four-stage
centrifugal compressor. Water and acid gas are separated from cracked gas between the
stages. After that the dried streams are sent to a series of fractionators that separate the
cracked gases into different products such as methane, hydrogen, ethane, propane,
propylene… The final ethylene product stream is taken from the C2 splitter. Typical range
of operating parameters of ethylene cracking and fractionation processes are shown in the
table IV-6 below.
Parameters Value
Cracking heater outlet temperature 750 – 900 ℃
Cracking heater outlet pressure 1.5 – 2.8 bar (22 – 40 psia)
Dilution steam/hydrocarbon ratio (ethane
feed)
0.25 – 0.35 (Zimmermann and Walzl
2000)
Charge gas compressor discharge 30 – 38 bar (425 – 550 psia)
Demethanizer 7 – 32 bar (100 – 465 psia)
Deethanizer 20 – 27 bar (300 – 400 psia)
Depropanizer 10 – 18 bar (150 – 270 psia)
Debutanizer 4 – 6 bar (60 – 90 psia)
Ethylene fractionator 8 – 20 bar (110 – 300 psia)
Propylene fractionator 8 – 20 bar (110 – 300 psia)
Table IV-6 – Typical range of operating parameters – Ethylene Cracking
processes (Meyers 2005)
38
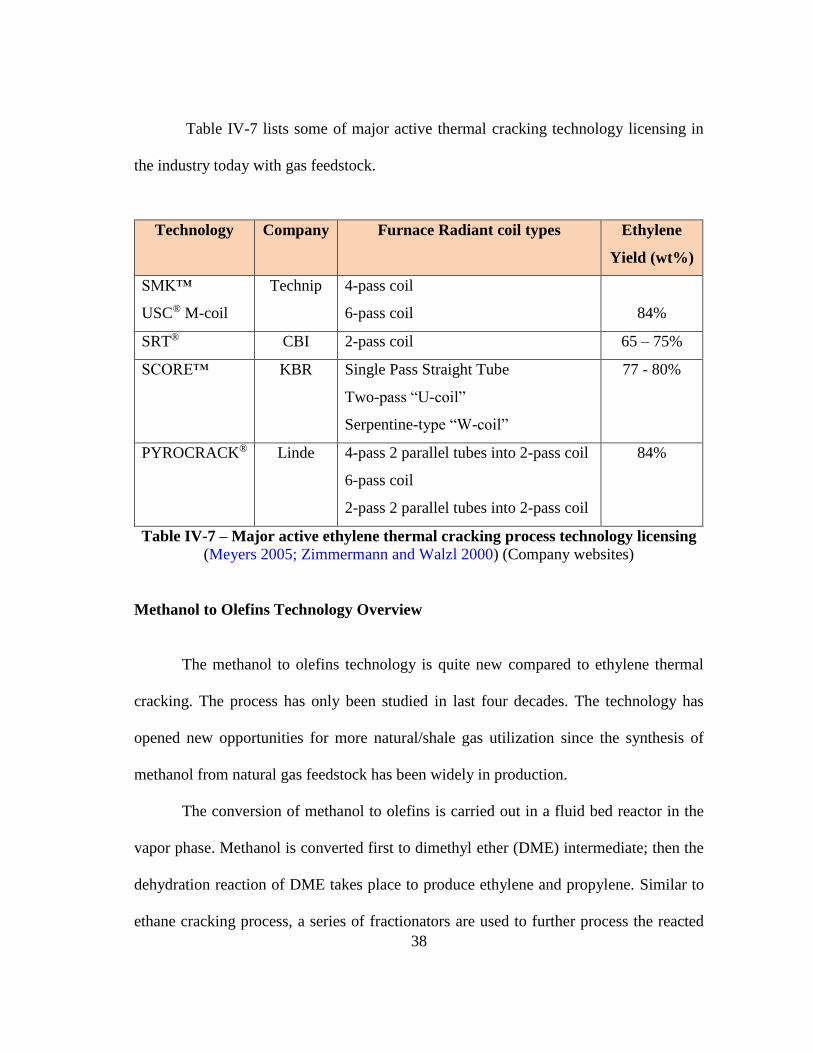
Table IV-7 lists some of major active thermal cracking technology licensing in
the industry today with gas feedstock.
Table IV-7 – Major active ethylene thermal cracking process technology licensing
(Meyers 2005; Zimmermann and Walzl 2000) (Company websites)
Methanol to Olefins Technology Overview
The methanol to olefins technology is quite new compared to ethylene thermal
cracking. The process has only been studied in last four decades. The technology has
opened new opportunities for more natural/shale gas utilization since the synthesis of
methanol from natural gas feedstock has been widely in production.
The conversion of methanol to olefins is carried out in a fluid bed reactor in the
vapor phase. Methanol is converted first to dimethyl ether (DME) intermediate; then the
dehydration reaction of DME takes place to produce ethylene and propylene. Similar to
ethane cracking process, a series of fractionators are used to further process the reacted
Technology Company Furnace Radiant coil types Ethylene
Yield (wt%)
SMK™
USC® M-coil
Technip 4-pass coil
6-pass coil
84%
SRT® CBI 2-pass coil 65 – 75%
SCORE™ KBR Single Pass Straight Tube
Two-pass “U-coil”
Serpentine-type “W-coil”
77 - 80%
PYROCRACK® Linde 4-pass 2 parallel tubes into 2-pass coil
6-pass coil
2-pass 2 parallel tubes into 2-pass coil
84%
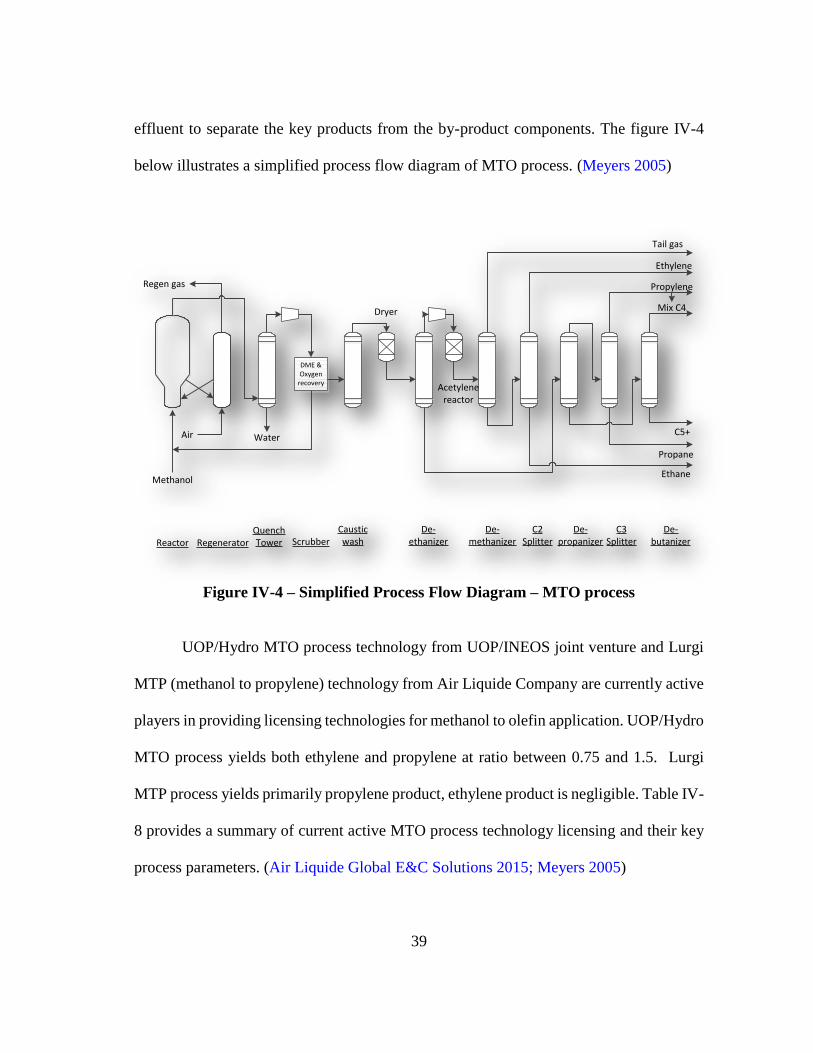
39
effluent to separate the key products from the by-product components. The figure IV-4
below illustrates a simplified process flow diagram of MTO process. (Meyers 2005)
Figure IV-4 – Simplified Process Flow Diagram – MTO process
UOP/Hydro MTO process technology from UOP/INEOS joint venture and Lurgi
MTP (methanol to propylene) technology from Air Liquide Company are currently active
players in providing licensing technologies for methanol to olefin application. UOP/Hydro
MTO process yields both ethylene and propylene at ratio between 0.75 and 1.5. Lurgi
MTP process yields primarily propylene product, ethylene product is negligible. Table IV-
8 provides a summary of current active MTO process technology licensing and their key
process parameters. (Air Liquide Global E&C Solutions 2015; Meyers 2005)
DME & Oxygen
recovery
Air
Methanol
Water
Regen gas
Tail gas
Ethylene
Propylene
Mix C4
C5+
Propane
Ethane
Reactor RegeneratorQuenchTower
CausticwashScrubber
Dryer
Acetylenereactor
De-ethanizer
De-methanizer
C2 Splitter
De-propanizer
De-butanizer
C3 Splitter
40
Process Company Reactor
type
Wt% Yield
(Carbon
basis)
Reactor
temperature
(℃)
Reactor
pressure
(bar g)
UOP/Hydro UOP
LLC/INEOS FBR
~ 80% 350 – 550 1 – 3
Lurgi MTP Air Liquide Fixed bed NA 400 - 450 1.5
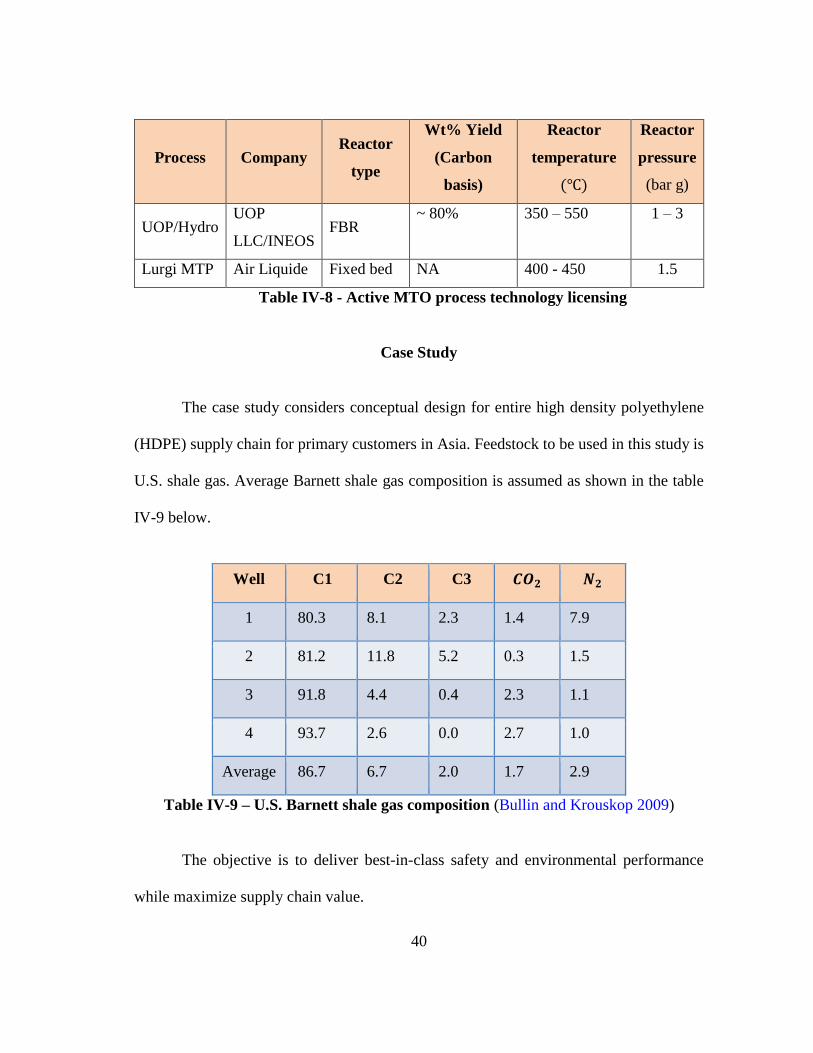
Table IV-8 - Active MTO process technology licensing
Case Study
The case study considers conceptual design for entire high density polyethylene
(HDPE) supply chain for primary customers in Asia. Feedstock to be used in this study is
U.S. shale gas. Average Barnett shale gas composition is assumed as shown in the table
IV-9 below.
Well C1 C2 C3 𝑪𝑶𝟐 𝑵𝟐
1 80.3 8.1 2.3 1.4 7.9
2 81.2 11.8 5.2 0.3 1.5
3 91.8 4.4 0.4 2.3 1.1
4 93.7 2.6 0.0 2.7 1.0
Average 86.7 6.7 2.0 1.7 2.9
Table IV-9 – U.S. Barnett shale gas composition (Bullin and Krouskop 2009)
The objective is to deliver best-in-class safety and environmental performance
while maximize supply chain value.
41
The process synthesis and supply chain option development will take into account
following dimensions:
- Choices of chemical pathways: 1) through thermal cracking of ethane to
ethylene (ethane cracking route) or 2) reforming of shale gas to syn gas for
methanol synthesis then converting methanol to olefins (methanol route).
- Supply chain model and location choices: 1) single manufacturing complex
that the entire manufacturing happens at single location close to feedstock
source, then ship finished product to customer; or 2) dispersed manufacturing
plants that have partial manufacturing carried out in location 1 then
intermediate product shipped to location 2 to finish.
- Scale of manufacturing plant: considering throughput options of HDPE at 500
KTA; 1,000 KTA and 1,500 KTA (thousands tonnes per annum).
Given limited available information in literatures and public domain, the case
study will not consider the technology choice aspect, but assume the preselected
technologies such as HDPE pellets slurry phase polymerization by Phillips, generic
ethylene thermal cracking from ethane. LNG processing facility is also included in the
scope for ethane thermal cracking route design options in order to maximize the utilization
of shale gas. Figure IV-5 provides a schematic representation of process design
alternatives considering in this case study based on process routes and manufacturing
locations. In total, twelve design options will be evaluated. Table IV-10 illustrates the
process design option matrix of the case study. From framework demonstration viewpoint,
the case study will cover economic evaluation, safety and risk assessment and
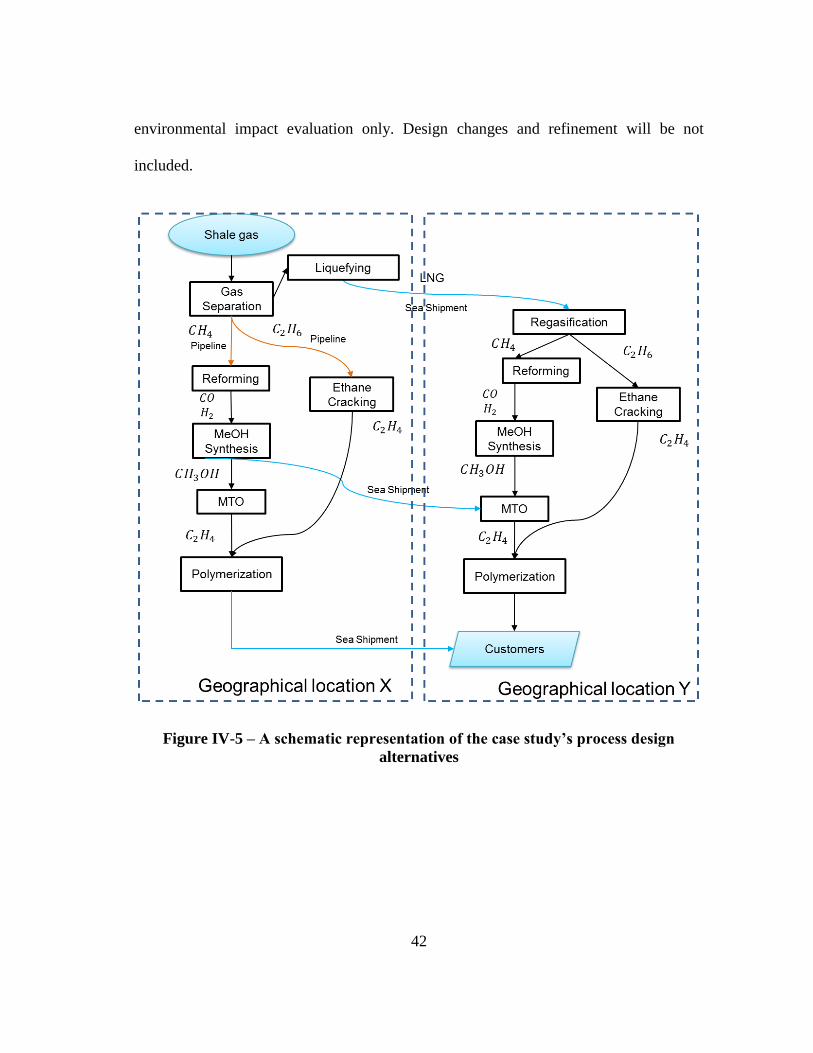
42
environmental impact evaluation only. Design changes and refinement will be not
included.
Figure IV-5 – A schematic representation of the case study’s process design
alternatives

43
Process Route Supply Chain Model Capacity (KTA)
500 1000 1500
Methanol Route Single Complex Option 1 Option 2 Option 3
Dispersed mode Option 4 Option 5 Option 6
Ethane Cracking
Route
Single Complex Option 7 Option 8 Option 9
Dispersed mode Option 10 Option 11 Option 12
Table IV-10 – Case study process design option matrix
44
CHAPTER V
CASE STUDY RESULT AND ANALYSIS
Economic Analysis
The estimated TCI for each design option is calculated based on the following
equation:
[V.1] 𝑇𝐶𝐼 = ∑(𝐼𝑆𝐵𝐿𝑖 + 𝑂𝑆𝐵𝐿𝑖)
where:
𝐼𝑆𝐵𝐿𝑖: the inside battery limits investment of process i
𝑂𝑆𝐵𝐿𝑖: the outside battery limits investment of process i
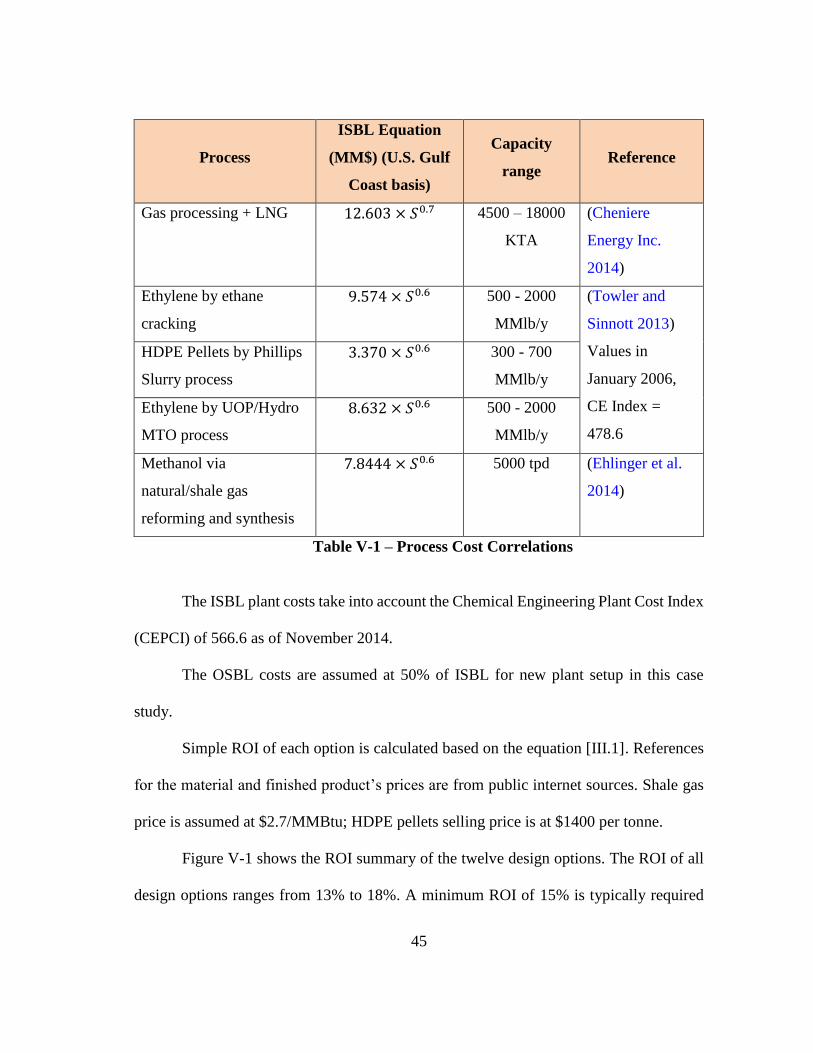
The ISBL plant cost is defined as
[V.2] 𝐼𝑆𝐵𝐿 = 𝑎𝑆𝑛
where:
S is the desired capacity of the selected process
Parameters a and n are related to the selected process and provided in the table
V-1. Process cost correlation for Gas processing and LNG process is estimated based on
published information of Chenier Sabine Pass Liquefaction project, $12B investment,
18000 KTA capacity, 4 trains.
45
Process
ISBL Equation
(MM$) (U.S. Gulf
Coast basis)
Capacity
range Reference
Gas processing + LNG 12.603 × 𝑆0.7 4500 – 18000
KTA
(Cheniere
Energy Inc.
2014)
Ethylene by ethane
cracking
9.574 × 𝑆0.6 500 - 2000
MMlb/y
(Towler and
Sinnott 2013)
Values in
January 2006,
CE Index =
478.6
HDPE Pellets by Phillips
Slurry process
3.370 × 𝑆0.6 300 - 700
MMlb/y
Ethylene by UOP/Hydro
MTO process
8.632 × 𝑆0.6 500 - 2000
MMlb/y
Methanol via
natural/shale gas
reforming and synthesis
7.8444 × 𝑆0.6 5000 tpd (Ehlinger et al.
2014)
Table V-1 – Process Cost Correlations
The ISBL plant costs take into account the Chemical Engineering Plant Cost Index
(CEPCI) of 566.6 as of November 2014.
The OSBL costs are assumed at 50% of ISBL for new plant setup in this case
study.
Simple ROI of each option is calculated based on the equation [III.1]. References
for the material and finished product’s prices are from public internet sources. Shale gas
price is assumed at $2.7/MMBtu; HDPE pellets selling price is at $1400 per tonne.
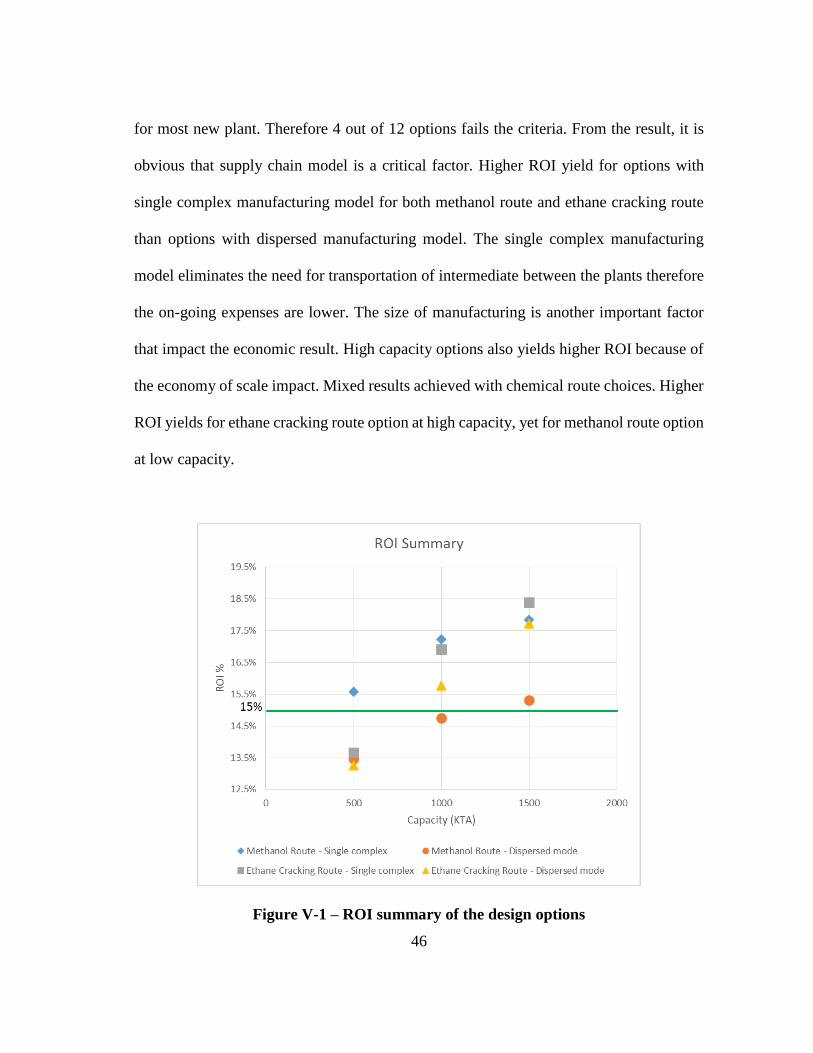
Figure V-1 shows the ROI summary of the twelve design options. The ROI of all
design options ranges from 13% to 18%. A minimum ROI of 15% is typically required
46
for most new plant. Therefore 4 out of 12 options fails the criteria. From the result, it is
obvious that supply chain model is a critical factor. Higher ROI yield for options with
single complex manufacturing model for both methanol route and ethane cracking route
than options with dispersed manufacturing model. The single complex manufacturing
model eliminates the need for transportation of intermediate between the plants therefore
the on-going expenses are lower. The size of manufacturing is another important factor
that impact the economic result. High capacity options also yields higher ROI because of
the economy of scale impact. Mixed results achieved with chemical route choices. Higher
ROI yields for ethane cracking route option at high capacity, yet for methanol route option
at low capacity.
Figure V-1 – ROI summary of the design options
47
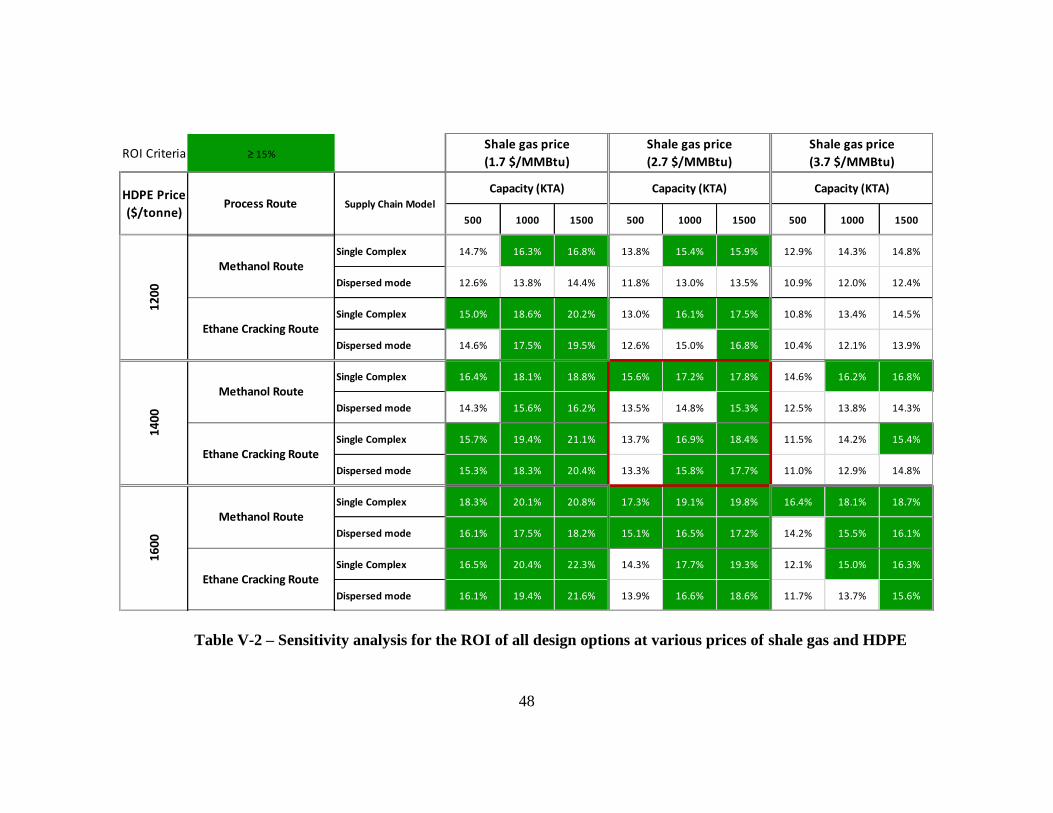
A sensitivity analysis was performed to assess the impact of various feedstock
prices and finished product prices to ROI. Table V-2 provides a summary of the ROI of
all design options at shale gas price range of 1.7 – 3.7 $/MMBtu and HDPE price range of
1,200 – 1,600 $/tonne. More attractive ROIs are attained for lower shale gas prices and
higher HDPE selling prices. The ethane cracking route options are still yielded attractive
ROIs at lower shale gas prices and lower HDPE selling prices in these range mentioned
about. On the other side, at higher shale gas prices the methanol route options could
achieve some attractive ROIs with higher HDPE selling price. If the HDPE selling price
drops to 900 $/tonne, both process routes become economically unattractive regardless of
the shale gas prices, scale and mode of the manufacturing plant.
Detailed economic analysis of each option is provided in the Appendix A of the
thesis.
48
Table V-2 – Sensitivity analysis for the ROI of all design options at various prices of shale gas and HDPE
ROI Criteria ≥ 15%
500 1000 1500 500 1000 1500 500 1000 1500
Single Complex 14.7% 16.3% 16.8% 13.8% 15.4% 15.9% 12.9% 14.3% 14.8%
Dispersed mode 12.6% 13.8% 14.4% 11.8% 13.0% 13.5% 10.9% 12.0% 12.4%
Single Complex 15.0% 18.6% 20.2% 13.0% 16.1% 17.5% 10.8% 13.4% 14.5%
Dispersed mode 14.6% 17.5% 19.5% 12.6% 15.0% 16.8% 10.4% 12.1% 13.9%
Single Complex 16.4% 18.1% 18.8% 15.6% 17.2% 17.8% 14.6% 16.2% 16.8%
Dispersed mode 14.3% 15.6% 16.2% 13.5% 14.8% 15.3% 12.5% 13.8% 14.3%
Single Complex 15.7% 19.4% 21.1% 13.7% 16.9% 18.4% 11.5% 14.2% 15.4%
Dispersed mode 15.3% 18.3% 20.4% 13.3% 15.8% 17.7% 11.0% 12.9% 14.8%
Single Complex 18.3% 20.1% 20.8% 17.3% 19.1% 19.8% 16.4% 18.1% 18.7%
Dispersed mode 16.1% 17.5% 18.2% 15.1% 16.5% 17.2% 14.2% 15.5% 16.1%
Single Complex 16.5% 20.4% 22.3% 14.3% 17.7% 19.3% 12.1% 15.0% 16.3%
Dispersed mode 16.1% 19.4% 21.6% 13.9% 16.6% 18.6% 11.7% 13.7% 15.6%
1600
Methanol Route
Ethane Cracking Route
1200
Methanol Route
Ethane Cracking Route
1400
Methanol Route
Ethane Cracking Route
Shale gas price
(1.7 $/MMBtu)
Shale gas price
(2.7 $/MMBtu)
Shale gas price
(3.7 $/MMBtu)
HDPE Price
($/tonne)Process Route Supply Chain Model
Capacity (KTA) Capacity (KTA) Capacity (KTA)
49
Safety and Risk Evaluation
Hazard Identification
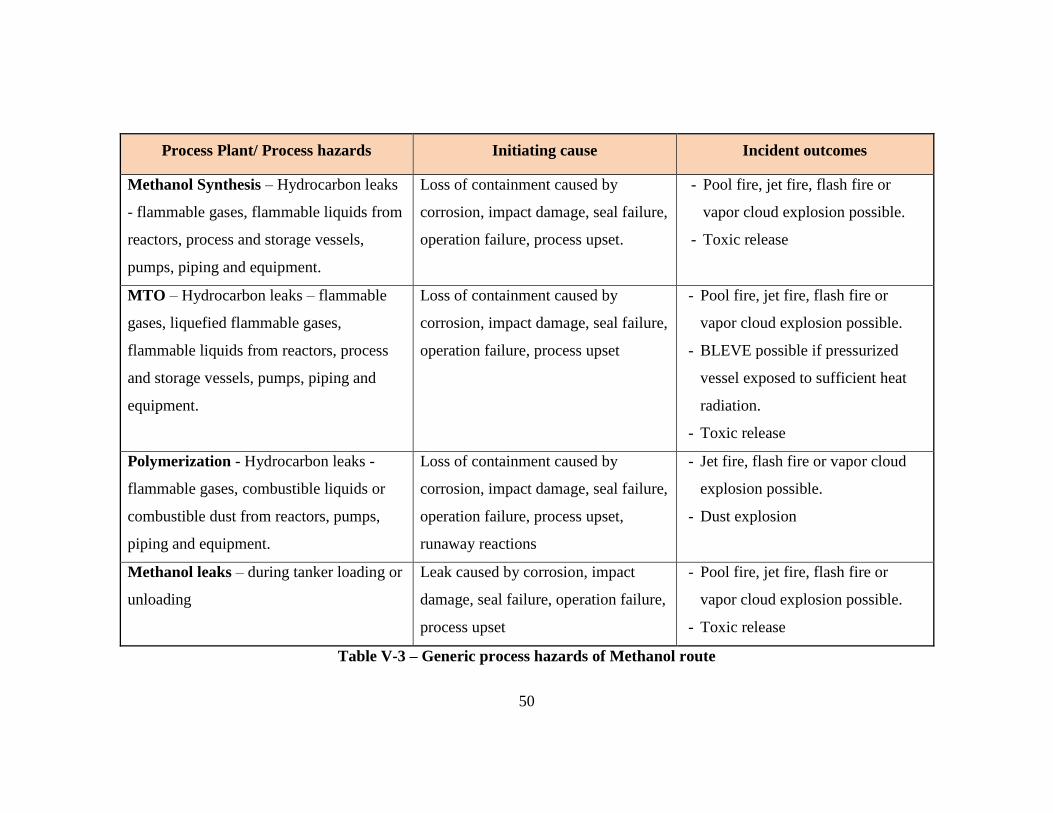
A generic hazard identification was performed for the case study process design
options using hazard evaluation procedures from the Center for Chemical Process Safety.
(CCPS 2008) List of chemicals and substances used or produced in the processes of the
case study with their properties are provided in the Appendix B.
In general both ethane cracking and methanol routes have various processes of
high flammable gas, flammable and combustible liquids and volatile toxic materials,
which have the potential to cause injury, property damage or even fatality. Leaks of
hydrocarbons from the process equipment, piping or storage vessels in an abnormal event
can lead to a fire, explosions or toxic release that impact plant personnel, property and
community surrounding. Tables V-4 and V-5 represent generic process hazards, initiating
causes and potential incident outcomes for each process facility of the methanol route and
ethane cracking route respectively. All of the processes in this case study are prone to fire
and explosion hazards.
50
Process Plant/ Process hazards Initiating cause Incident outcomes
Methanol Synthesis – Hydrocarbon leaks
- flammable gases, flammable liquids from
reactors, process and storage vessels,
pumps, piping and equipment.
Loss of containment caused by
corrosion, impact damage, seal failure,
operation failure, process upset.
- Pool fire, jet fire, flash fire or
vapor cloud explosion possible.
- Toxic release
MTO – Hydrocarbon leaks – flammable
gases, liquefied flammable gases,
flammable liquids from reactors, process
and storage vessels, pumps, piping and
equipment.
Loss of containment caused by
corrosion, impact damage, seal failure,
operation failure, process upset
- Pool fire, jet fire, flash fire or
vapor cloud explosion possible.
- BLEVE possible if pressurized
vessel exposed to sufficient heat
radiation.
- Toxic release
Polymerization - Hydrocarbon leaks -
flammable gases, combustible liquids or
combustible dust from reactors, pumps,
piping and equipment.
Loss of containment caused by
corrosion, impact damage, seal failure,
operation failure, process upset,
runaway reactions
- Jet fire, flash fire or vapor cloud
explosion possible.
- Dust explosion
Methanol leaks – during tanker loading or
unloading
Leak caused by corrosion, impact
damage, seal failure, operation failure,
process upset
- Pool fire, jet fire, flash fire or
vapor cloud explosion possible.
- Toxic release
Table V-3 – Generic process hazards of Methanol route

51
Process Plant/ Process hazards Initiating cause Incident outcomes
Gas Processing – Hydrocarbon leaks –
flammable gases, liquefied flammable
gases, combustible liquids from process
and storage vessels, pumps, piping and
equipment.
Loss of containment caused by
corrosion, impact damage, seal failure,
operation failure, process upset.
- Pool fire, jet fire, flash fire or
vapor cloud explosion possible.
- BLEVE possible if pressurized
vessel exposed to sufficient heat
radiation.
Ethylene Cracking – Hydrocarbon leaks –
flammable gases, liquefied flammable
gases, combustible liquids from process
and storage vessels, pumps, piping and
equipment.
Loss of containment caused by
corrosion, impact damage, seal failure,
operation failure, process upset.
- Pool fire, jet fire, flash fire or
vapor cloud explosion possible.
- BLEVE possible if pressurized
vessel exposed to sufficient heat
radiation.
Polymerization – Hydrocarbon leaks –
flammable gases, combustible liquids or
combustible dust from reactors, pumps,
piping and equipment.
Loss of containment caused by
corrosion, impact damage, seal failure,
operation failure, process upset,
runaway reactions.
- Jet fire, flash fire or vapor cloud
explosion possible.
- Dust explosion
LNG – LNG leaks during tanker loading
or unloading.
Leak caused by corrosion, impact
damage, seal failure, operation failure,
process upset.
- Pool fire, jet fire, flash fire or
vapor cloud explosion possible.
Table V-4 – Generic process hazards of Ethane cracking route
52
Risk Assessment
A high-level quantitative risk assessment approach was used for assessing and
calculating of individual risk of the design options. The approach was adopted from the
QRA method described in the CCPS book, “Guidelines for Chemical Process Quantitative
Risk Analysis” and the risk-based building siting evaluation for explosion hazards from
the CCPS book, “Guidelines for Evaluating Process Plant Buildings”. (CCPS 2000; CCPS
2012) For each process design options that passed the economic screening, a risk
evaluation was performed at process unit level. Table V-5 shows the incident scenarios
included in the risk assessment.
Maximum individual risk was selected to compare among the option. Maximum
individual risk is defined as the individual risk to the person exposed to the highest risk in
an exposed population. (CCPS 2012) The maximum individual risk of explosion was
estimated using equation [V.3]
[V.3] 𝑅𝑥,𝑦 = ∑ 𝐹𝑖𝑉𝑥,𝑦,𝑖𝑇𝑥,𝑦𝑖∈𝑁
where:
𝑅𝑥,𝑦: maximum individual risk at specific location x,y of the manufacturing plant
with N process units
𝐹𝑖: the explosion frequency of the process unit i
𝑉𝑥,𝑦,𝑖: Occupant vulnerability at point x,y by the explosion event of the process
unit i.

53
𝑇𝑥,𝑦: Fractional time of attendance at the point x,y, calculated as hours per
week/168 hours.
Process Unit Scenario description Incident outcome
Methanol
route
Shale gas processing Release of shale gas Explosion
Methanol synthesis Release of methanol Explosion
Methanol storage Release of methanol Late explosion
Methanol conversion Release of reactor’s mixture Explosion
Ethylene Release of ethylene Explosion
Propylene Release of propylene Explosion
HDPE Release of ethylene Explosion
Ethane
Cracking route
Shale gas processing Release of shale gas Explosion
LNG production Release of shale gas Explosion
LNG storage Release of LNG Explosion
Steam cracking Release of cracked gas Explosion
Ethylene Release of ethylene Explosion
Propylene Release of propylene Explosion
HDPE Release of ethylene Explosion
Table V-5 – Incident scenarios for case study risk assessment
The explosion frequency of each scenario is estimated based on the unit core
explosion frequency and adjustment factors: unit capacity, electrical classification,
confinement, and management system effectiveness. (Moosemiller 2010) The unit
explosion frequency is the product of unit core frequency and the multipliers:
Unit core frequency × throughput multiplier × electrical classification multiplier ×
indoor multiplier × management system multiplier.
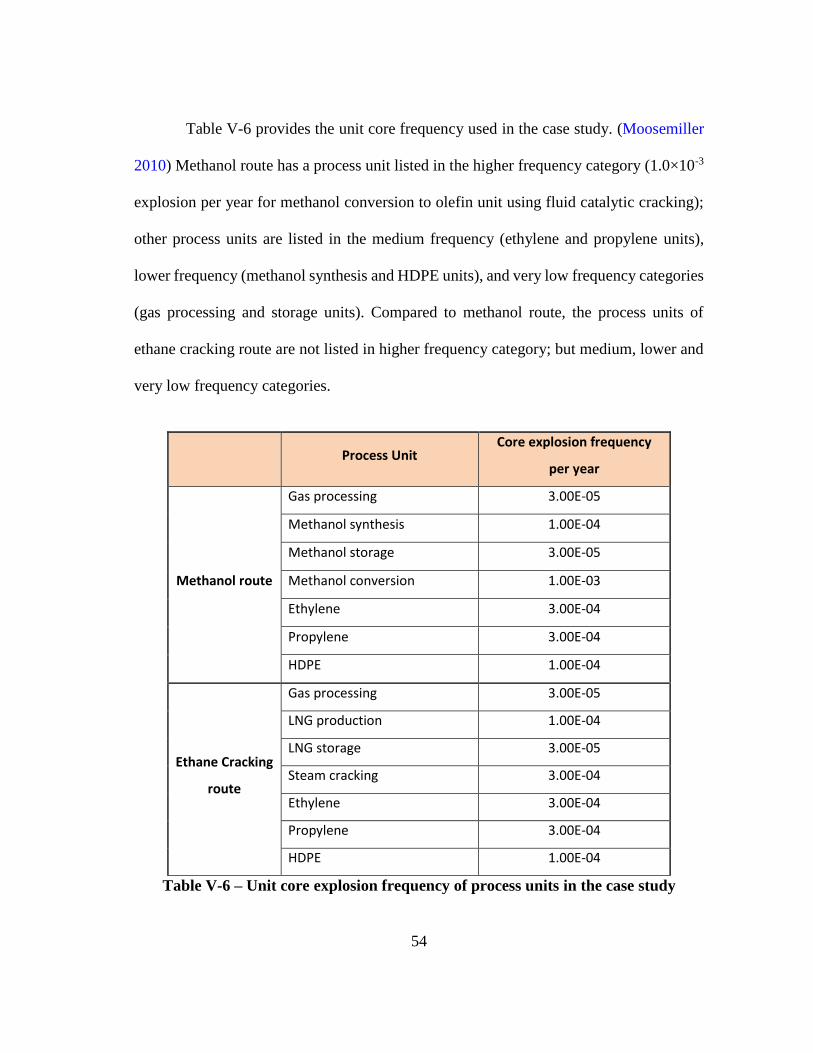
54
Table V-6 provides the unit core frequency used in the case study. (Moosemiller
2010) Methanol route has a process unit listed in the higher frequency category (1.0×10⁻³
explosion per year for methanol conversion to olefin unit using fluid catalytic cracking);
other process units are listed in the medium frequency (ethylene and propylene units),
lower frequency (methanol synthesis and HDPE units), and very low frequency categories
(gas processing and storage units). Compared to methanol route, the process units of
ethane cracking route are not listed in higher frequency category; but medium, lower and
very low frequency categories.
Process Unit
Core explosion frequency
per year
Methanol route
Gas processing 3.00E-05
Methanol synthesis 1.00E-04
Methanol storage 3.00E-05
Methanol conversion 1.00E-03
Ethylene 3.00E-04
Propylene 3.00E-04
HDPE 1.00E-04
Ethane Cracking
route
Gas processing 3.00E-05
LNG production 1.00E-04
LNG storage 3.00E-05
Steam cracking 3.00E-04
Ethylene 3.00E-04
Propylene 3.00E-04
HDPE 1.00E-04
Table V-6 – Unit core explosion frequency of process units in the case study

55
Occupant vulnerability was determined based on the consequence analysis of the
above release scenarios. Hydrocarbon release quantities were estimated based on nominal
flowrates of standard process units. 10-minute release scenarios were assumed. For
example, 10-minute release quantity of methanol from 5000 tonne/day methanol synthesis
unit is approximately 34700 kg of methanol in vapor phase at 513oK.
The TNT equivalency method was used to estimate the overpressure of the blast
wave to the plant buildings. Occupant vulnerability was calculated using probit equation
[V.4] for structure damage due to explosion. (Crowl 2011)
[V.4] 𝑉𝑥,𝑦,𝑖 = −23.8 + 2.92 ln(𝑃𝑥,𝑦,𝑖)
with 𝑉𝑥,𝑦,𝑖 is the occupant vulnerability at point x,y by the explosion event of the process
unit i; and 𝑃𝑥,𝑦,𝑖 is the overpressure of the blast wave at the point x,y by the explosion
event of the process unit i.
Table V-7 provides the assumption of meteorological data of manufacturing
locations included in the consequence models. The assumption on the distances of plant
buildings from release points are shown in the table V-8.
Average
temperature
Relative
humidity %
Wind velocity
(m/s)
Stability class
Location 1 89 70 3.13 D
Location 2 78.8 70 3.6 D
Table V-7 – Assumption on meteorological data of manufacturing locations
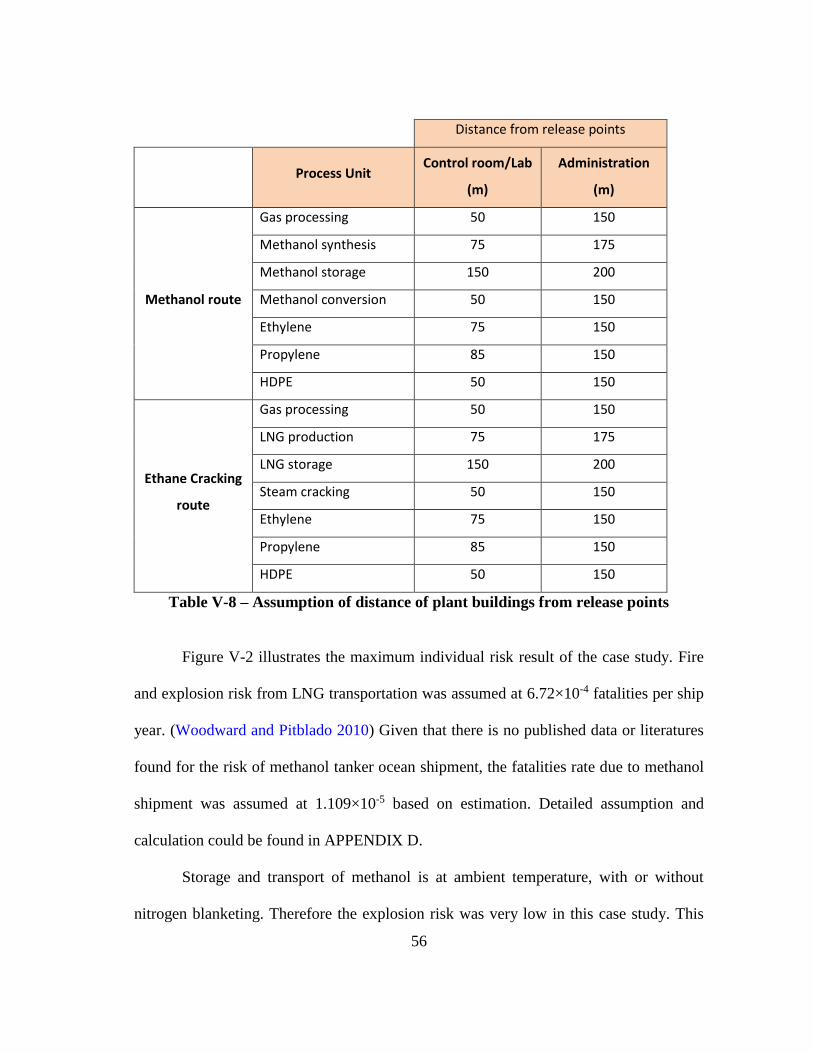
56
Distance from release points
Process Unit
Control room/Lab
(m)
Administration
(m)
Methanol route
Gas processing 50 150
Methanol synthesis 75 175
Methanol storage 150 200
Methanol conversion 50 150
Ethylene 75 150
Propylene 85 150
HDPE 50 150
Ethane Cracking
route
Gas processing 50 150
LNG production 75 175
LNG storage 150 200
Steam cracking 50 150
Ethylene 75 150
Propylene 85 150
HDPE 50 150
Table V-8 – Assumption of distance of plant buildings from release points
Figure V-2 illustrates the maximum individual risk result of the case study. Fire
and explosion risk from LNG transportation was assumed at 6.72×10⁻⁴ fatalities per ship
year. (Woodward and Pitblado 2010) Given that there is no published data or literatures
found for the risk of methanol tanker ocean shipment, the fatalities rate due to methanol
shipment was assumed at 1.109×10⁻⁵ based on estimation. Detailed assumption and
calculation could be found in APPENDIX D.
Storage and transport of methanol is at ambient temperature, with or without
nitrogen blanketing. Therefore the explosion risk was very low in this case study. This

57
makes very minor differences between single complex options and dispersed mode
options for methanol route.
Most of ethane cracking route options have individual risk exceed 1.0×10⁻³ /year
while the methanol route options were below this limit. Comparing the plant processes for
single manufacturing complex supply chain model, the maximum individual risk of ethane
cracking route options were higher than of methanol route options as they included
additional risk of LNG production, storage and shipment. Without LNG scopes, the risks
of ethane cracking route options are lower than of the methanol route options (Figure V-
3). Process design changes or further risk investigation are required in order to reduce the
risk.
Figure V-2 – Maximum individual risk summary
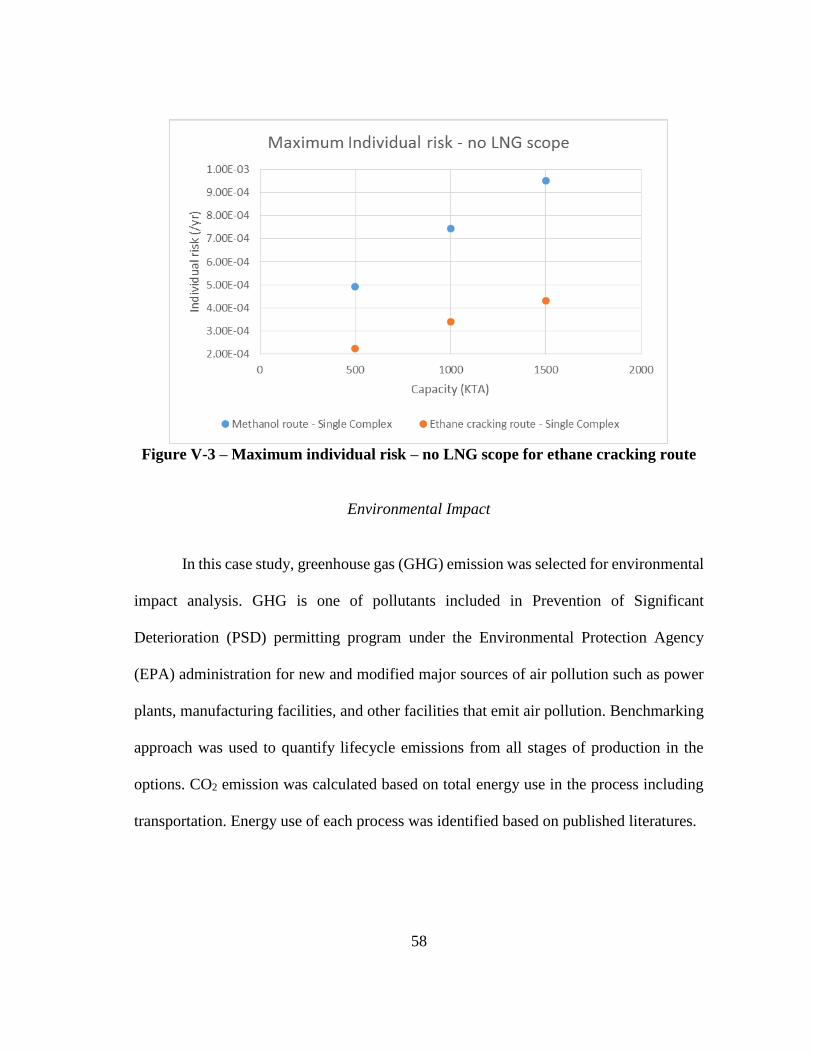
58
Figure V-3 – Maximum individual risk – no LNG scope for ethane cracking route
Environmental Impact
In this case study, greenhouse gas (GHG) emission was selected for environmental
impact analysis. GHG is one of pollutants included in Prevention of Significant
Deterioration (PSD) permitting program under the Environmental Protection Agency
(EPA) administration for new and modified major sources of air pollution such as power
plants, manufacturing facilities, and other facilities that emit air pollution. Benchmarking
approach was used to quantify lifecycle emissions from all stages of production in the
options. CO2 emission was calculated based on total energy use in the process including
transportation. Energy use of each process was identified based on published literatures.

59
Table V-9 lists the assumptions and data used in the process GHG emission
calculation. Process and energy efficiency opportunities were not considered in this
exercise. Emission factor is assumed 0.053 tonne CO2e per 1 MMBtu energy consumed.
CO2 emission related to tanker transportation of LNG was calculated using the
equation [V.5] (Jaramillo et al. 2007)
[V.5] CO2 = (𝐸𝐹)(2 × 𝑟𝑜𝑢𝑛𝑑𝑢𝑝 (𝑆𝑀
𝑇𝐶) ×
𝐷
𝑇𝑆× 𝐹𝐶 ×
1
24
Where:
EF: the shipping tanker emission factor of 3,200 kg CO2/tonne of fuel consumed;
2: the number of trips each tanker does for every load (one bringing the chemicals
and one going back empty);
SM: the shipment amount of natural gas (in cubic feet) or methanol (in tonnes)
shipped between plants;
TC: the shipping tanker capacity; assumed to be 120,000 cubic meters of LNG (1
m3 LNG = 21,537 ft3 NG); and 20,000 tonnes of methanol.
D: the distance between source port and receiving port; 10015 nautical miles
assumed in this case study (port of Freeport, Texas – port of Incheon, S. Korea);
TS: the tanker speed of 14 Knots;
FC: shipping vessel fuel consumption factor of 41 tonnes of fuel per day;
24: hours per day.
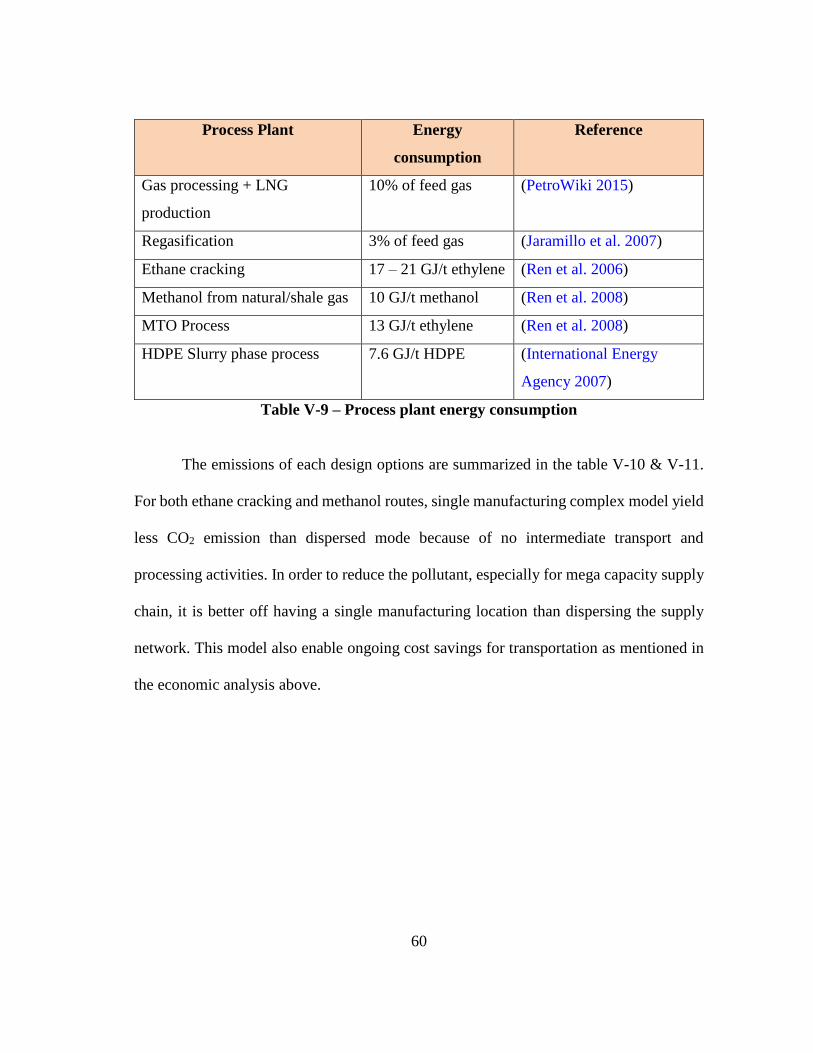
60
Process Plant Energy
consumption
Reference
Gas processing + LNG
production
10% of feed gas (PetroWiki 2015)
Regasification 3% of feed gas (Jaramillo et al. 2007)
Ethane cracking 17 – 21 GJ/t ethylene (Ren et al. 2006)
Methanol from natural/shale gas 10 GJ/t methanol (Ren et al. 2008)
MTO Process 13 GJ/t ethylene (Ren et al. 2008)
HDPE Slurry phase process 7.6 GJ/t HDPE (International Energy
Agency 2007)
Table V-9 – Process plant energy consumption
The emissions of each design options are summarized in the table V-10 & V-11.
For both ethane cracking and methanol routes, single manufacturing complex model yield
less CO2 emission than dispersed mode because of no intermediate transport and
processing activities. In order to reduce the pollutant, especially for mega capacity supply
chain, it is better off having a single manufacturing location than dispersing the supply
network. This model also enable ongoing cost savings for transportation as mentioned in
the economic analysis above.
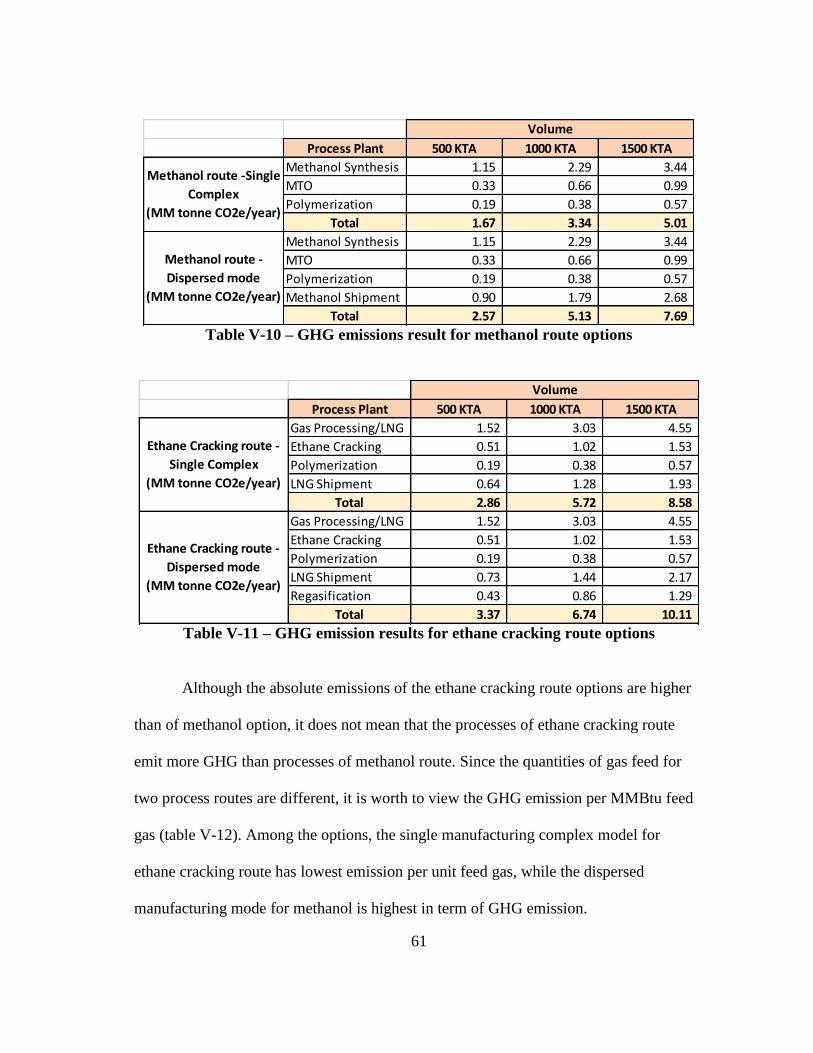
61
Table V-10 – GHG emissions result for methanol route options
Table V-11 – GHG emission results for ethane cracking route options
Although the absolute emissions of the ethane cracking route options are higher
than of methanol option, it does not mean that the processes of ethane cracking route
emit more GHG than processes of methanol route. Since the quantities of gas feed for
two process routes are different, it is worth to view the GHG emission per MMBtu feed
gas (table V-12). Among the options, the single manufacturing complex model for
ethane cracking route has lowest emission per unit feed gas, while the dispersed
manufacturing mode for methanol is highest in term of GHG emission.
Process Plant 500 KTA 1000 KTA 1500 KTA
Methanol Synthesis 1.15 2.29 3.44
MTO 0.33 0.66 0.99
Polymerization 0.19 0.38 0.57
Total 1.67 3.34 5.01
Methanol Synthesis 1.15 2.29 3.44
MTO 0.33 0.66 0.99
Polymerization 0.19 0.38 0.57
Methanol Shipment 0.90 1.79 2.68
Total 2.57 5.13 7.69
Volume
Methanol route -Single
Complex
(MM tonne CO2e/year)
Methanol route -
Dispersed mode
(MM tonne CO2e/year)
Process Plant 500 KTA 1000 KTA 1500 KTA
Gas Processing/LNG 1.52 3.03 4.55
Ethane Cracking 0.51 1.02 1.53
Polymerization 0.19 0.38 0.57
LNG Shipment 0.64 1.28 1.93
Total 2.86 5.72 8.58
Gas Processing/LNG 1.52 3.03 4.55
Ethane Cracking 0.51 1.02 1.53
Polymerization 0.19 0.38 0.57
LNG Shipment 0.73 1.44 2.17
Regasification 0.43 0.86 1.29
Total 3.37 6.74 10.11
Volume
Ethane Cracking route -
Single Complex
(MM tonne CO2e/year)
Ethane Cracking route -
Dispersed mode
(MM tonne CO2e/year)

62
Table V-12 – GHG emission result per MMBtu feed gas
Supply Chain model CO2e Emission
(T CO2e/MMBtu feed gas)
Single Complex 0.037
Dispersed mode 0.056
Single Complex 0.010
Dispersed mode 0.012Ethane Cracking Route
Methanol Route
63
CHAPTER VI
CONCLUSION AND FUTURE WORK
Conclusions
Incorporation of safety aspects in early stage of process synthesis and conceptual
design of supply chains is challenging but important for generating valuable insights early
enough in the project. A hierarchical approach has been developed to enable process
engineers to include safety objectives in the design of a supply chain and the processes
within the supply chain design. According to this framework, the design options are first
generated and screened based on economic criteria. Economically infeasible options are
removed from further consideration. Next, safety criteria are coupled with the economic
metrics to assess the various designs and transportation options. The results of the risk
assessment for each options are checked versus acceptable limits to remove unacceptable
options. Findings from the hazard and risk assessment are used to generate design
alternatives to improve the safety performance. Economic evaluation is updated for
acceptable options to guide the decision making. The developed framework was applied
to a case study on conceptual design of HDPE supply chain from shale gas. Various
conceptual design options that considered different elements such as process technology,
supply chain network and capacity were screened and evaluated per proposed framework.
The safety aspects of the design options were evaluated by utilizing a high-level
quantitative risk assessment approach with the limited engineering information that was
available by the project phase.
64
Future work
This research can be expanded to include a multi-objective approach in
conjunction with an algorithmic model to explore an optimum solution for process design
and supply chain considering the multiple aspects as outlined in this research. Other
direction is the integration of feedstock distribution that takes into account the capacity of
supply sources, safety, risk and cost of transportation. Finally, mass and energy integration
can be used to methodically generate and optimize design alternatives.
65
REFERENCES
AIChE (1994a) Dow's Chemical Exposure Index Guide. 1st edn. American Institute of
Chemical Engineers, New York, NY
AIChE (1994b) Dow's Fire & Explosion Index Hazard Classification Guide. 7th edn.
John Wiley & Sons, Inc., New York, NY
Air Liquide Global E&C Solutions (2015) Methanol-to-Propylene - Lurgi MTP Process.
http://www.engineering-
solutions.airliquide.com/file/otherelementcontent/pj/42/9e/ec/af/methanol-to-
propylene%20flyer5517811988317851881.pdf. Accessed Sep 18, 2015
Biegler L. T., Grossmann I. E., Westerberg A. W. (1997) Systematic Methods of
Chemical Process Design. Prentice Hall International Series in the Physical and
Chemical Engineering Sciences. Prentice Hall, Upper Saddle River, NJ
Bullin K. A., Krouskop P. E. (2009) Compositional Variety Complicates Processing
Plans for US Shale Gas, Oil & Gas Journal 107:50-55
CAMEO Chemicals (2015) Database of Hazardous Materials.
http://cameochemicals.noaa.gov/. Accessed Aug 28, 2015
CCPS (2000) Guidelines for Chemical Process Quantitative Risk Analysis (2nd Edition).
Center for Chemical Process Safety/AIChE, New York, NY
CCPS (2008) Guidelines for Hazard Evaluation Procedures (3rd Edition). Center for
Chemical Process Safety/AIChE, New York, NY
66
CCPS (2009) Guidelines for Developing Quantitative Safety Risk Criteria. Center for
Chemical Process Safety/AIChE, New York, NY
CCPS (2010) Inherently Safer Chemical Processes - A Life Cycle Approach. 2nd edn.
John Wiley & Sons, Inc., New York, NY
CCPS (2012) Guidelines for Evaluating Process Plant Buildings for External Explosions,
Fires, and Toxic Releases. 2nd edn. John Wiley & Sons, Inc., New York, NY.
doi:10.1002/9781118312995.ch9
Chen J. Q., Bozzano A., Glover B., Fuglerud T., Kvisle S. (2005) Recent Advancements
in Ethylene and Propylene Production Using the UOP/Hydro MTO Process,
Catalysis Today 106:103-107 doi:http://dx.doi.org/10.1016/j.cattod.2005.07.178
Cheniere Energy Inc. (2014) Cheniere Energy Analyst/Investor Day.
http://media.corporate-
ir.net/media_files/IROL/10/101667/Analyst_Day_Presentation_WEBrev.pdf.
Accessed Feb 19, 2015
Crowl D. A. (2011) Chemical Process Safety : Fundamentals with Applications. 3rd edn.
Prentice Hall, Upper Saddle River, NJ
Edwards D. W., Lawrence D. (1993) Assessing The Inherent Safety of Chemical Process
Routes: Is There a Relation Between Plant Costs and Inherent Safety?, Process
Safety and Environmental Protection 71b:252 - 258
Ehlinger V. M., Gabriel K. J., Noureldin M. M. B., El-Halwagi M. M. (2014) Process
Design and Integration of Shale Gas to Methanol, ACS Sustainable Chemistry &
Engineering 2:30-37 doi:10.1021/sc400185b
67
El-Halwagi A. M., Rosas C., Ponce-Ortega J. M., Jiménez-Gutiérrez A., Mannan M. S.,
El-Halwagi M. M. (2013) Multiobjective Optimization of Biorefineries with
Economic and Safety Objectives, AIChE Journal 59:2427-2434
doi:10.1002/aic.14030
El-Halwagi M. M. (2012) Sustainable Design Through Process Integration :
Fundamentals and Applications to Industrial Pollution Prevention, Resource
Conservation, and Profitability Enhancement. Elsevier Butterworth-Heinemann,
Boston, MA
Gangadharan P., Singh R., Cheng F., Lou H. H. (2013) Novel Methodology for Inherent
Safety Assessment in the Process Design Stage, Industrial & Engineering
Chemistry Research 52:5921-5933
Gentile M., Rogers W. J., Mannan M. S. (2003) Development of a Fuzzy Logic-Based
Inherent Safety Index, Process Safety and Environmental Protection 81:444-456
Heikkilä A. M. (1999) Inherent Safety in Process Plant Design: An Index-based
Approach. D.Sc.Tech., Teknillinen Korkeakoulu (Helsinki) (Finland)
Hendershot D. C. (2006) An Overview of Inherently Safer Design, Process Safety
Progress 25:98-107
Hugo A., Pistikopoulos E. N. (2005) Environmentally Conscious Long-range Planning
and Design of Supply Chain Networks, Journal of Cleaner Production 13:1471-
1491 doi:http://dx.doi.org/10.1016/j.jclepro.2005.04.011
International Energy Agency (2007) Tracking Industrial Energy Efficiency and CO2
Emissions. International Energy Agency, France
68
Jaramillo P., Griffin W. M., Matthews H. S. (2007) Comparative Life-Cycle Air
Emissions of Coal, Domestic Natural Gas, LNG, and SNG for Electricity
Generation, Environmental Science & Technology 41:6290-6296
doi:10.1021/es063031o
Khan F. I., Amyotte P. R. (2004) Integrated Inherent Safety Index (I2SI): A Tool for
Inherent Safety Evaluation, Process Safety Progress 23:136-148
doi:10.1002/prs.10015
Khan F. I., Amyotte P. R. (2005) I2SI: A Comprehensive Quantitative Tool for Inherent
Safety and Cost Evaluation, Journal of Loss Prevention in the Process Industries
18:310-326
Khan F. I., Husain T., Abbasi S. A. (2001) Safety Weighted Hazard Index (SWeHI),
Process Safety and Environmental Protection 79:65-80
Khan F. I., Sadiq R., Amyotte P. R. (2003) Evaluation of Available Indices for
Inherently Safer Design Options, Process Safety Progress 22:83-97
doi:10.1002/prs.680220203
Kletz T. A. (1978) What You Don't Have, Can't Leak, Chemistry and Industry:287-292
Kletz T. A., Amyotte P. R. (2010) Process Plants: A Handbook for Inherently Safer
Design, 2nd Edition. CRC Press, Taylor & Francis Group,
Koller G., Fischer U., Hungerbühler K. (2000) Assessing Safety, Health, and
Environmental Impact Early during Process Development, Industrial &
Engineering Chemistry Research 39:960-972
69
Koller G., Fischer U., Hungerbühler K. (2001) Comparison of Methods Suitable for
Assessing the Hazard Potential of Chemical Processes During Early Design
Phases, Process Safety and Environmental Protection 79:157-166
doi:http://dx.doi.org/10.1205/09575820150511939
Leong C. T., Shariff A. M. (2009) Process Route Index (PRI) to Assess Level of
Explosiveness for Inherent Safety Quantification, Journal of Loss Prevention in
the Process Industries 22:216-221
Li X., Zanwar A., Jayswal A., Lou H. H., Huang Y. (2011) Incorporating Exergy
Analysis and Inherent Safety Analysis for Sustainability Assessment of Biofuels,
Industrial & Engineering Chemistry Research 50:2981-2993
doi:10.1021/ie101660q
Maher S. T., Norton K. D., Surmeli S. (2012) Design an Inherently Safer Plant,
Chemical Engineering Progress 108:43-47
Mannan S., Lees F. P. (2005) Lees' Loss Prevention in the Process Industries: Hazard
Identification, Assessment, and Control. 3rd edn. Elsevier Butterworth-
Heinemann, Boston, MA
Methanol Institute (2013) Methanol Safe Handling Manual.
http://www.methanol.org/getattachment/05f122f1-c9d3-47d8-8c16-
5a5d39717cbe/Methanol-Safe-Handling-Manual-Final---English.pdf.aspx.
Accessed Sep 6, 2015

70
Methanol Market Services Asia (MMSA) (2013) Methanol Shipping: A Snapshot.
http://www.methanolmsa.com/wp-content/uploads/2013/11/Karan-Grover.pdf.
Accessed Feb 25, 2015
Meyers R. A. (2005) Handbook of Petrochemicals Production Processes. McGraw-Hill,
New York, NY
Moosemiller M. (2010) Development of Algorithms for Predicting Ignition Probabilities
and Explosion Frequencies, Process Safety Progress 29:155-161
doi:10.1002/prs.10360
Morschbacker A. (2009) Bio-Ethanol Based Ethylene, Polymer Reviews 49:79-84
doi:10.1080/15583720902834791
Nowlin T. E. (2014) Business and Technology of the Global Polyethylene Industry : An
In-depth Look at the History, Technology, Catalysts, and Modern Commercial
Manufacture of Polyethylene and Its Products. Scrivener Publishing, Beverly,
MA
Palaniappan C., Srinivasan R., Tan R. B. (2002a) Expert System for the Design of
Inherently Safer Processes. 1. Route Selection Stage, Industrial & Engineering
Chemistry Research 41:6698-6710
Palaniappan C., Srinivasan R., Tan R. B. (2002b) Expert System for the Design of
Inherently Safer Processes. 2. Flowsheet Development Stage, Industrial &
Engineering Chemistry Research 41:6711-6722
71
Pasman H., Reniers G. (2014) Past, Present and Future of Quantitative Risk Assessment
(QRA) and the Incentive It Obtained from Land-Use Planning (LUP), Journal of
Loss Prevention in the Process Industries 28:2-9
Petrochemical Conclave (2015) Outlook for Olefins and Polyolefins...and the Great
Energy Price Deflation.
http://petrochemconclave.com/presentation/2015/Mr.TPotter.pdf. Accessed Aug
21, 2015
PetroWiki (2015) Liquified Natural Gas (LNG).
http://petrowiki.org/Liquified_natural_gas_(LNG). Accessed Feb 18, 2015
Rahman M., Heikkilä A.-M., Hurme M. (2005) Comparison of Inherent Safety Indices
in Process Concept Evaluation, Journal of Loss Prevention in the Process
Industries 18:327-334 doi:http://dx.doi.org/10.1016/j.jlp.2005.06.015
Rathnayaka S., Khan F., Amyotte P. (2014) Risk-based Process Plant Design
Considering Inherent Safety, Safety Science 70:438-464
doi:http://dx.doi.org/10.1016/j.ssci.2014.06.004
Ren T., Patel M., Blok K. (2006) Olefins from Conventional and Heavy Feedstocks:
Energy Use in Steam Cracking and Alternative Processes, Energy 31:425-451
doi:http://dx.doi.org/10.1016/j.energy.2005.04.001
Ren T., Patel M. K., Blok K. (2008) Steam Cracking and Methane to Olefins: Energy
Use, CO2 Emissions and Production Costs, Energy 33:817-833
doi:http://dx.doi.org/10.1016/j.energy.2008.01.002
72
Shah N. (2005) Process Industry Supply Chains: Advances and Challenges, Computers
& Chemical Engineering 29:1225-1235
doi:http://dx.doi.org/10.1016/j.compchemeng.2005.02.023
Share J. (2014) Global Demand for Polyethylene to Reach 99.6 Million Tons in 2018,
Pipeline & Gas Journal 241:52
Shariff A. M., Leong C. T. (2009) Inherent Risk Assessment—A New Concept to
Evaluate Risk in Preliminary Design Stage, Process Safety and Environmental
Protection 87:371-376 doi:http://dx.doi.org/10.1016/j.psep.2009.08.004
Soares J. B. P., McKenna T. F. L. (2012) Polyolefin Reaction Engineering. Wiley-VCH
Verlag GmbH & Co. KGaA. doi:10.1002/9783527646944.ch4
Srinivasan R., Natarajan S. (2012) Developments in Inherent Safety: A Review of the
Progress During 2001–2011 and Opportunities Ahead, Process Safety and
Environmental Protection 90:389-403
doi:http://dx.doi.org/10.1016/j.psep.2012.06.001
Towler G., Sinnott R. (2013) Chemical Engineering Design. 2nd edn. Elsevier
Butterworth-Heinemann, Boston, MA
Tugnoli A., Cozzani V., Landucci G. (2007) A Consequence Based Approach to the
Quantitative Assessment of Inherent Safety, AIChE Journal 53:3171-3182
Tugnoli A., Landucci G., Salzano E., Cozzani V. (2012) Supporting the Selection of
Process and Plant Design Options by Inherent Safety KPIs, Journal of Loss
Prevention in the Process Industries 25:830-842
doi:http://dx.doi.org/10.1016/j.jlp.2012.03.008

73
Tyler B. J. (1985) Using the Mond Index to Measure Inherent Hazards, Plant/Operations
Progress 4:172-175 doi:10.1002/prsb.720040313
Woodward J. L., Pitblado R. M. (2010) LNG Risk Based Safety. John Wiley & Sons,
Inc. doi:10.1002/9780470590232.ch4
Zimmermann H., Walzl R. (2000) Ethylene. In: Ullmann's Encyclopedia of Industrial
Chemistry. Wiley-VCH Verlag GmbH & Co. KGaA.
doi:10.1002/14356007.a10_045.pub3
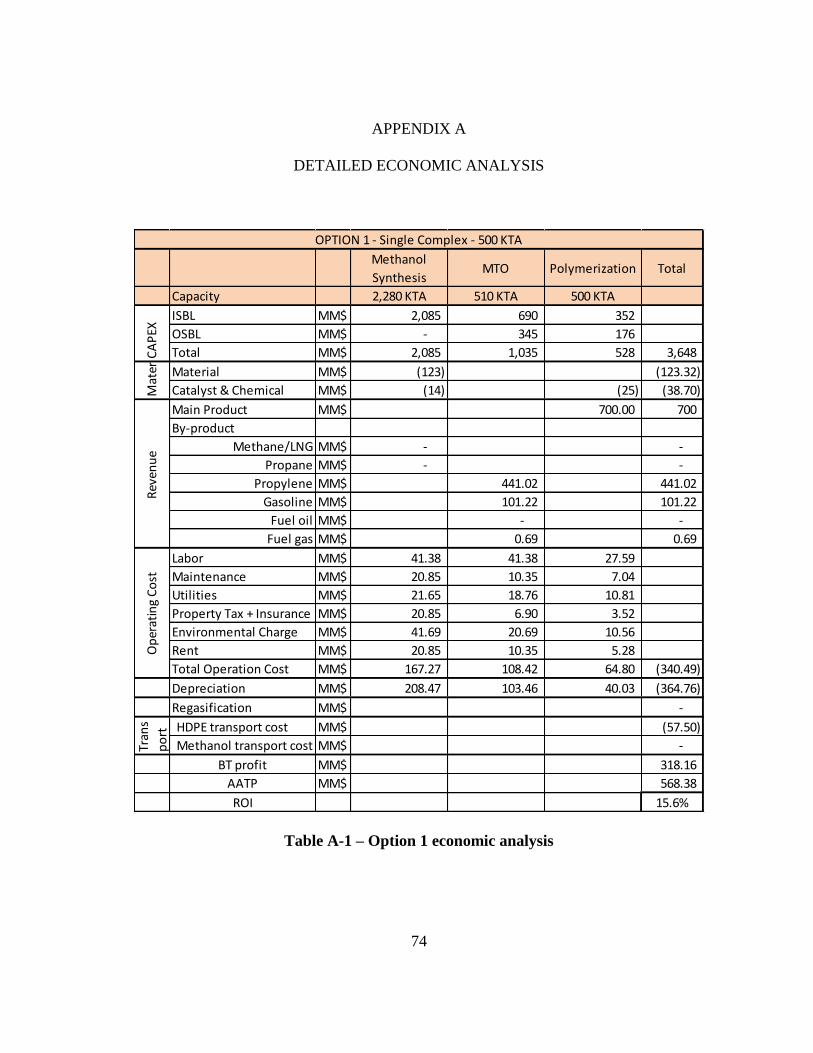
74
APPENDIX A
DETAILED ECONOMIC ANALYSIS
Table A-1 – Option 1 economic analysis
Methanol
SynthesisMTO Polymerization Total
Capacity 2,280 KTA 510 KTA 500 KTA
ISBL MM$ 2,085 690 352
OSBL MM$ - 345 176
Total MM$ 2,085 1,035 528 3,648
Material MM$ (123) (123.32)
Catalyst & Chemical MM$ (14) (25) (38.70)
Main Product MM$ 700.00 700
By-product
Methane/LNG MM$ - -
Propane MM$ - -
Propylene MM$ 441.02 441.02
Gasoline MM$ 101.22 101.22
Fuel oil MM$ - -
Fuel gas MM$ 0.69 0.69
Labor MM$ 41.38 41.38 27.59
Maintenance MM$ 20.85 10.35 7.04
Utilities MM$ 21.65 18.76 10.81
Property Tax + Insurance MM$ 20.85 6.90 3.52
Environmental Charge MM$ 41.69 20.69 10.56
Rent MM$ 20.85 10.35 5.28
Total Operation Cost MM$ 167.27 108.42 64.80 (340.49)
Depreciation MM$ 208.47 103.46 40.03 (364.76)
Regasification MM$ -
HDPE transport cost MM$ (57.50)
Methanol transport cost MM$ -
BT profit MM$ 318.16
AATP MM$ 568.38
ROI 15.6%
CA
PEX
Op
erat
ing
Co
st
OPTION 1 - Single Complex - 500 KTA
Tran
s
po
rtM
ater
ial C
ost
Rev
enu
e
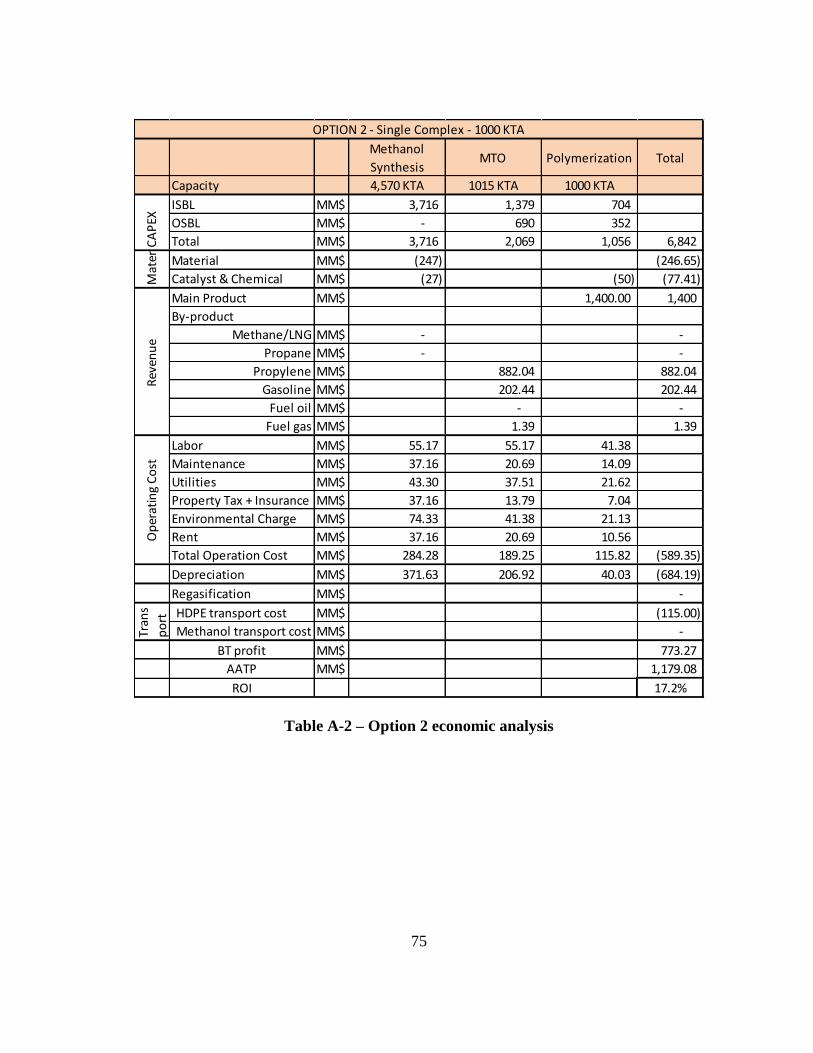
75
Table A-2 – Option 2 economic analysis
Methanol
SynthesisMTO Polymerization Total
Capacity 4,570 KTA 1015 KTA 1000 KTA
ISBL MM$ 3,716 1,379 704
OSBL MM$ - 690 352
Total MM$ 3,716 2,069 1,056 6,842
Material MM$ (247) (246.65)
Catalyst & Chemical MM$ (27) (50) (77.41)
Main Product MM$ 1,400.00 1,400
By-product
Methane/LNG MM$ - -
Propane MM$ - -
Propylene MM$ 882.04 882.04
Gasoline MM$ 202.44 202.44
Fuel oil MM$ - -
Fuel gas MM$ 1.39 1.39
Labor MM$ 55.17 55.17 41.38
Maintenance MM$ 37.16 20.69 14.09
Utilities MM$ 43.30 37.51 21.62
Property Tax + Insurance MM$ 37.16 13.79 7.04
Environmental Charge MM$ 74.33 41.38 21.13
Rent MM$ 37.16 20.69 10.56
Total Operation Cost MM$ 284.28 189.25 115.82 (589.35)
Depreciation MM$ 371.63 206.92 40.03 (684.19)
Regasification MM$ -
HDPE transport cost MM$ (115.00)
Methanol transport cost MM$ -
BT profit MM$ 773.27
AATP MM$ 1,179.08
ROI 17.2%
Tran
s
po
rt
OPTION 2 - Single Complex - 1000 KTA
CA
PEX
Mat
eria
l Co
stR
even
ue
Op
erat
ing
Co
st

76
Table A-3 – Option 3 economic analysis
Methanol
SynthesisMTO Polymerization Total
Capacity 6,850 KTA 1525 KTA 1500 KTA
ISBL MM$ 5,814 1,759 982
OSBL MM$ - 880 491
Total MM$ 5,814 2,639 1,473 9,927
Material MM$ (370) (369.97)
Catalyst & Chemical MM$ (41) (25) (116.11)
Main Product MM$ 2,100.00 2,100
By-product
Methane/LNG MM$ - -
Propane MM$ - -
Propylene MM$ 1,323.05 1,323.05
Gasoline MM$ 303.65 303.65
Fuel oil MM$ - -
Fuel gas MM$ 2.08 2.08
Labor MM$ 82.76 82.76 55.17
Maintenance MM$ 58.14 26.39 19.64
Utilities MM$ 64.95 56.27 32.42
Property Tax + Insurance MM$ 58.14 17.59 9.82
Environmental Charge MM$ 116.29 52.78 29.46
Rent MM$ 58.14 26.39 14.73
Total Operation Cost MM$ 438.43 262.19 161.25 (861.87)
Depreciation MM$ 581.44 263.91 40.03 (992.67)
Regasification MM$ -
HDPE transport cost MM$ (172.50)
Methanol transport cost MM$ -
BT profit MM$ 1,215.68
AATP MM$ 1,770.70
ROI 17.8%
Tran
s
po
rt
OPTION 3 - Single Complex - 1500 KTA
CA
PEX
Mat
eria
l Co
stR
even
ue
Op
erat
ing
Co
st

77
Table A-4 – Option 4 economic analysis
Methanol
SynthesisMTO Polymerization Total
Capacity 2,2800 KTA 510 KTA 500 KTA
ISBL MM$ 2,085 766 391
OSBL MM$ - 383 195
Total MM$ 2,085 1,148 586 3,819
Material MM$ (123) (123.32)
Catalyst & Chemical MM$ (14) (25) (38.70)
Main Product MM$ 700.00 700
By-product
Methane/LNG MM$ - -
Propane MM$ - -
Propylene MM$ 441.02 441.02
Gasoline MM$ 101.22 101.22
Fuel oil MM$ - -
Fuel gas MM$ 0.69 0.69
Labor MM$ 41.38 24.83 16.55
Maintenance MM$ 20.85 11.48 7.82
Utilities MM$ 21.65 18.76 10.81
Property Tax + Insurance MM$ 20.85 7.66 3.91
Environmental Charge MM$ 41.69 22.97 11.73
Rent MM$ 20.85 11.48 5.86
Total Operation Cost MM$ 167.27 97.18 56.68 (321.12)
Depreciation MM$ 208.47 114.84 40.03 (381.95)
Regasification MM$ -
HDPE transport cost MM$ -
Methanol transport cost MM$ (171.28)
BT profit MM$ 206.56
AATP MM$ 514.15
ROI 13.5%
Tran
s
po
rt
OPTION 4 - Dispersed Mode - 500 KTA
CA
PEX
Mat
eria
l Co
stR
even
ue
Op
erat
ing
Co
st

78
Table A-5 – Option 5 economic analysis
Methanol
SynthesisMTO Polymerization Total
Capacity 4,570 KTA 1015 KTA 1000 KTA
ISBL MM$ 3,716 1,531 782
OSBL MM$ - 766 391
Total MM$ 3,716 2,297 1,173 7,186
Material MM$ (247) (246.65)
Catalyst & Chemical MM$ (27) (50) (77.41)
Main Product MM$ 1,400.00 1,400
By-product
Methane/LNG MM$ - -
Propane MM$ - -
Propylene MM$ 882.04 882.04
Gasoline MM$ 202.44 202.44
Fuel oil MM$ - -
Fuel gas MM$ 1.39 1.39
Labor MM$ 55.17 33.10 24.83
Maintenance MM$ 37.16 22.97 15.64
Utilities MM$ 43.30 37.51 21.62
Property Tax + Insurance MM$ 37.16 15.31 7.82
Environmental Charge MM$ 74.33 45.94 23.45
Rent MM$ 37.16 22.97 11.73
Total Operation Cost MM$ 284.28 177.80 105.07 (567.16)
Depreciation MM$ 371.63 229.68 40.03 (718.57)
Regasification MM$ -
HDPE transport cost MM$ -
Methanol transport cost MM$ (342.56)
BT profit MM$ 533.52
AATP MM$ 1,060.02
ROI 14.8%
Tran
s
po
rt
OPTION 5 - Dispersed Mode - 1000 KTA
CA
PEX
Mat
eria
l Co
stR
even
ue
Op
erat
ing
Co
st

79
Table A-6 – Option 6 economic analysis
Methanol
SynthesisMTO Polymerization Total
Capacity 6,850 KTA 1525 KTA 1500 KTA
ISBL MM$ 5,814 1,953 1,090
OSBL MM$ - 976 545
Total MM$ 5,814 2,929 1,635 10,379
Material MM$ (370) (369.97)
Catalyst & Chemical MM$ (41) (75) (116.11)
Main Product MM$ 2,100.00 2,100
By-product
Methane/LNG MM$ - -
Propane MM$ - -
Propylene MM$ 1,323.05 1,323.05
Gasoline MM$ 303.65 303.65
Fuel oil MM$ - -
Fuel gas MM$ 2.08 2.08
Labor MM$ 82.76 49.65 33.10
Maintenance MM$ 58.14 29.29 21.80
Utilities MM$ 64.95 56.27 32.42
Property Tax + Insurance MM$ 58.14 19.53 10.90
Environmental Charge MM$ 116.29 58.59 32.71
Rent MM$ 58.14 29.29 16.35
Total Operation Cost MM$ 438.43 242.63 147.29 (828.35)
Depreciation MM$ 581.44 292.94 40.03 (1,037.90)
Regasification MM$ -
HDPE transport cost MM$ -
Methanol transport cost MM$ (513.84)
BT profit MM$ 862.63
AATP MM$ 1,589.98
ROI 15.3%
Tran
s
po
rt
OPTION 6 - Dispersed Mode - 1500 KTA
CA
PEX
Mat
eria
l Co
stR
even
ue
Op
erat
ing
Co
st

80
Table A-7 – Option 7 economic analysis
Gas Processing/
LiquefractionCracking Polymerization Total
Capacity 286 Tcf 510 KTA 500 KTA
ISBL MM$ 5,166 765 352
OSBL MM$ 2,583 382 176
Total MM$ 7,749 1,147 528 9,425
Material MM$ (773) (772.64)
Catalyst & Chemical MM$ (86) (25) (110.85)
Main Product MM$ 700.00 700
By-product
Methane/LNG MM$ 3,010.12 3,010.12
Propane MM$ 77.09 77.09
Propylene MM$ 6.78 6.78
Gasoline MM$ 0.34 0.34
Fuel oil MM$ 0.07 0.07
Fuel gas MM$ 17.64 17.64
Labor MM$ 55.17 41.38 27.59
Maintenance MM$ 51.66 11.47 7.04
Utilities MM$ 85.85 36.95 10.81
Property Tax + Insurance MM$ 51.66 7.65 3.52
Environmental Charge MM$ 154.98 22.95 10.56
Rent MM$ 77.49 11.47 5.28
Total Operation Cost MM$ 476.80 131.88 64.80 (673.48)
Depreciation MM$ 774.88 114.75 40.03 (942.45)
Regasification MM$ -
HDPE transport cost MM$ (57.50)
LNG transport cost MM$ (715.92)
BT profit MM$ 539.19
AATP MM$ 1,287.54
ROI 13.7%
CA
PEX
Op
erat
ing
Co
st
OPTION 7 - Single Complex - 500 KTATr
ans
po
rtM
ater
ial C
ost
Rev
enu
e

81
Table A-8 – Option 8 economic analysis
Gas Processing/
LiquefractionCracking Polymerization Total
Capacity 572.4 Tcf 1015 KTA 1000 KTA
ISBL MM$ 8,392 1,160 704
OSBL MM$ 4,196 580 352
Total MM$ 12,588 1,739 1,056 15,384
Material MM$ (1,545) (1,545.27)
Catalyst & Chemical MM$ (172) (50) (221.70)
Main Product MM$ 1,400.00 1,400
By-product
Methane/LNG MM$ 6,020.23 6,020.23
Propane MM$ 154.18 154.18
Propylene MM$ 13.57 13.57
Gasoline MM$ 0.67 0.67
Fuel oil MM$ 0.14 0.14
Fuel gas MM$ 35.27 35.27
Labor MM$ 68.97 55.17 41.38
Maintenance MM$ 83.92 17.39 14.09
Utilities MM$ 171.70 73.90 21.62
Property Tax + Insurance MM$ 83.92 11.60 7.04
Environmental Charge MM$ 251.76 34.79 21.13
Rent MM$ 125.88 17.39 10.56
Total Operation Cost MM$ 786.14 210.24 115.82 (1,112.19)
Depreciation MM$ 1,258.80 173.93 40.03 (1,538.37)
Regasification MM$ -
HDPE transport cost MM$ (115.00)
LNG transport cost MM$ (1,431.83)
BT profit MM$ 1,659.70
AATP MM$ 2,600.58
ROI 16.9%
Tran
s
po
rt
OPTION 8 - Single Complex - 1000 KTA
CA
PEX
Mat
eria
l Co
stR
even
ue
Op
erat
ing
Co
st
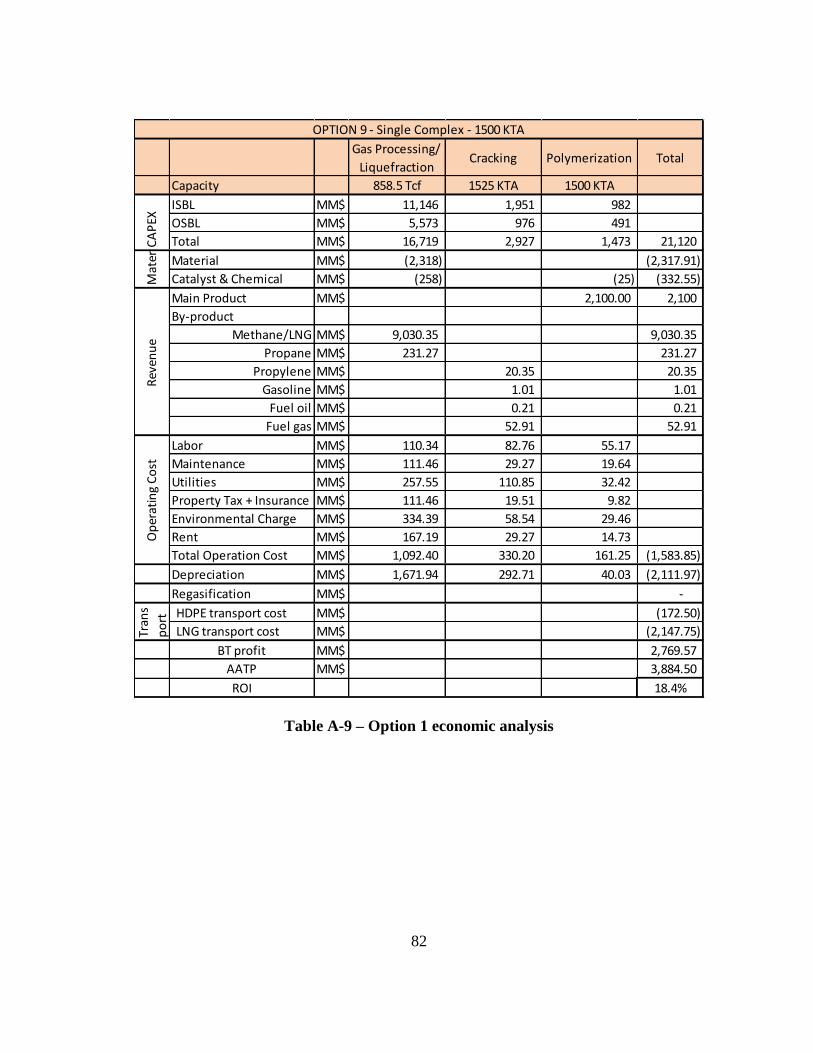
82
Table A-9 – Option 1 economic analysis
Gas Processing/
LiquefractionCracking Polymerization Total
Capacity 858.5 Tcf 1525 KTA 1500 KTA
ISBL MM$ 11,146 1,951 982
OSBL MM$ 5,573 976 491
Total MM$ 16,719 2,927 1,473 21,120
Material MM$ (2,318) (2,317.91)
Catalyst & Chemical MM$ (258) (25) (332.55)
Main Product MM$ 2,100.00 2,100
By-product
Methane/LNG MM$ 9,030.35 9,030.35
Propane MM$ 231.27 231.27
Propylene MM$ 20.35 20.35
Gasoline MM$ 1.01 1.01
Fuel oil MM$ 0.21 0.21
Fuel gas MM$ 52.91 52.91
Labor MM$ 110.34 82.76 55.17
Maintenance MM$ 111.46 29.27 19.64
Utilities MM$ 257.55 110.85 32.42
Property Tax + Insurance MM$ 111.46 19.51 9.82
Environmental Charge MM$ 334.39 58.54 29.46
Rent MM$ 167.19 29.27 14.73
Total Operation Cost MM$ 1,092.40 330.20 161.25 (1,583.85)
Depreciation MM$ 1,671.94 292.71 40.03 (2,111.97)
Regasification MM$ -
HDPE transport cost MM$ (172.50)
LNG transport cost MM$ (2,147.75)
BT profit MM$ 2,769.57
AATP MM$ 3,884.50
ROI 18.4%
Tran
s
po
rt
OPTION 9 - Single Complex - 1500 KTA
CA
PEX
Mat
eria
l Co
stR
even
ue
Op
erat
ing
Co
st
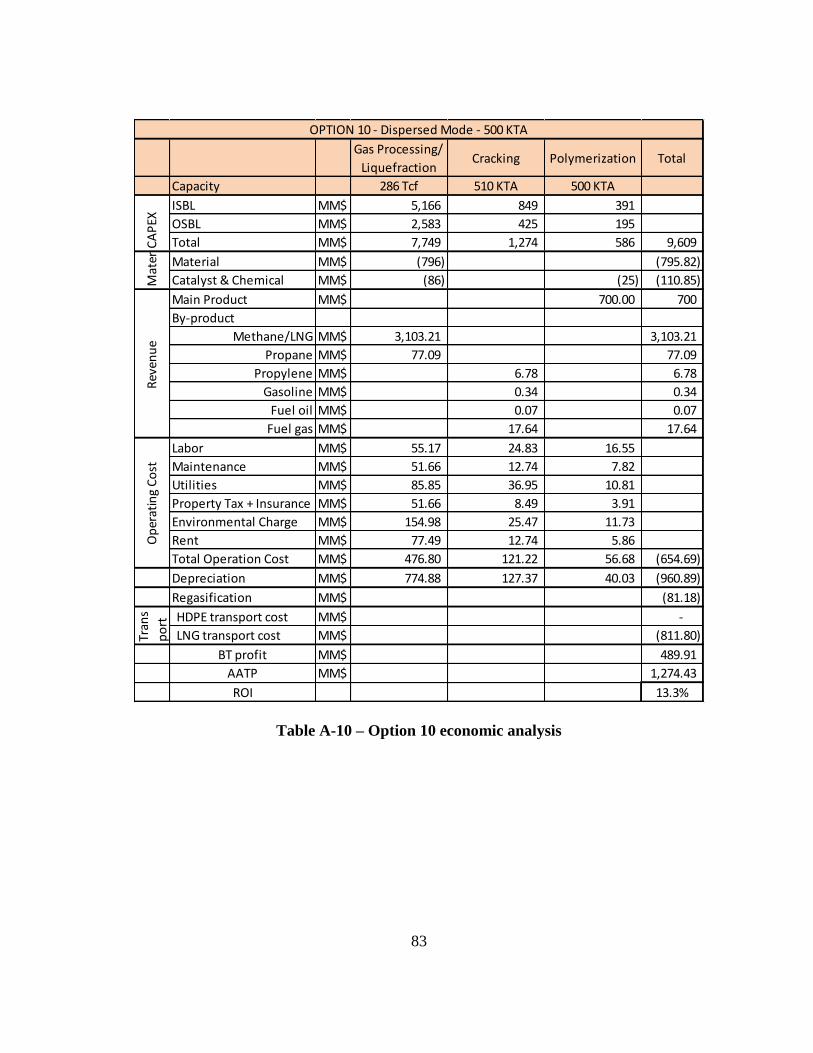
83
Table A-10 – Option 10 economic analysis
Gas Processing/
LiquefractionCracking Polymerization Total
Capacity 286 Tcf 510 KTA 500 KTA
ISBL MM$ 5,166 849 391
OSBL MM$ 2,583 425 195
Total MM$ 7,749 1,274 586 9,609
Material MM$ (796) (795.82)
Catalyst & Chemical MM$ (86) (25) (110.85)
Main Product MM$ 700.00 700
By-product
Methane/LNG MM$ 3,103.21 3,103.21
Propane MM$ 77.09 77.09
Propylene MM$ 6.78 6.78
Gasoline MM$ 0.34 0.34
Fuel oil MM$ 0.07 0.07
Fuel gas MM$ 17.64 17.64
Labor MM$ 55.17 24.83 16.55
Maintenance MM$ 51.66 12.74 7.82
Utilities MM$ 85.85 36.95 10.81
Property Tax + Insurance MM$ 51.66 8.49 3.91
Environmental Charge MM$ 154.98 25.47 11.73
Rent MM$ 77.49 12.74 5.86
Total Operation Cost MM$ 476.80 121.22 56.68 (654.69)
Depreciation MM$ 774.88 127.37 40.03 (960.89)
Regasification MM$ (81.18)
HDPE transport cost MM$ -
LNG transport cost MM$ (811.80)
BT profit MM$ 489.91
AATP MM$ 1,274.43
ROI 13.3%
Tran
s
po
rt
OPTION 10 - Dispersed Mode - 500 KTA
CA
PEX
Mat
eria
l Co
stR
even
ue
Op
erat
ing
Co
st
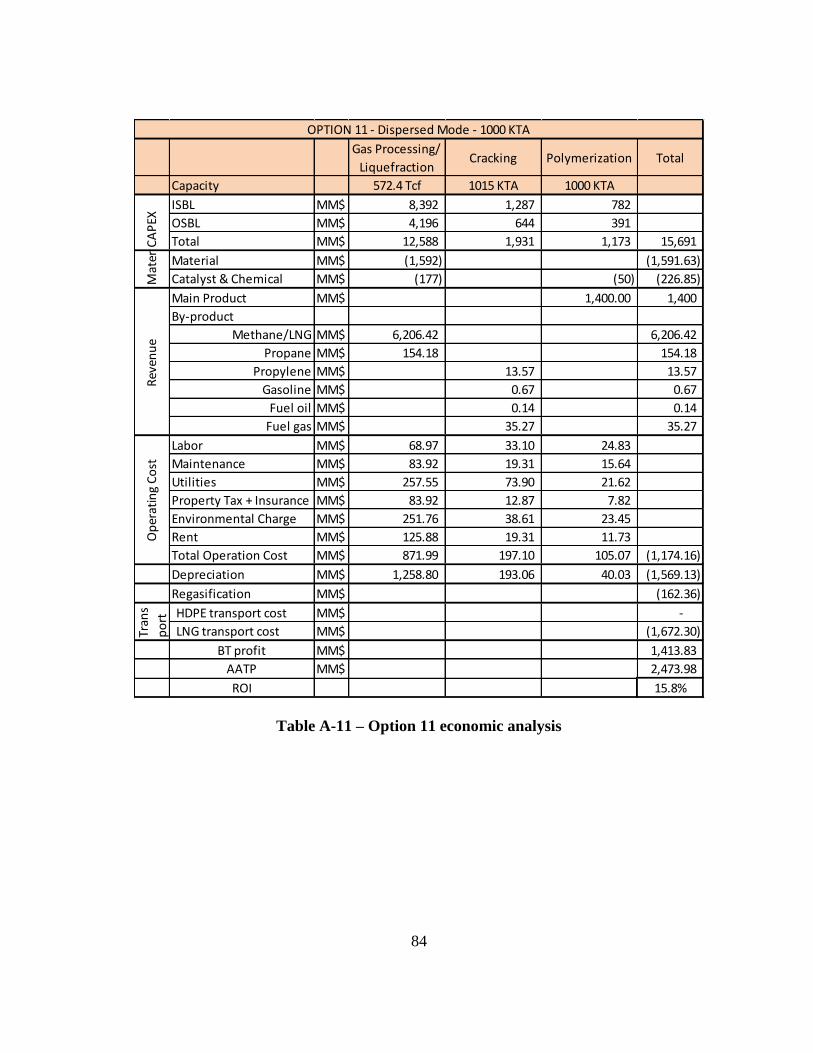
84
Table A-11 – Option 11 economic analysis
Gas Processing/
LiquefractionCracking Polymerization Total
Capacity 572.4 Tcf 1015 KTA 1000 KTA
ISBL MM$ 8,392 1,287 782
OSBL MM$ 4,196 644 391
Total MM$ 12,588 1,931 1,173 15,691
Material MM$ (1,592) (1,591.63)
Catalyst & Chemical MM$ (177) (50) (226.85)
Main Product MM$ 1,400.00 1,400
By-product
Methane/LNG MM$ 6,206.42 6,206.42
Propane MM$ 154.18 154.18
Propylene MM$ 13.57 13.57
Gasoline MM$ 0.67 0.67
Fuel oil MM$ 0.14 0.14
Fuel gas MM$ 35.27 35.27
Labor MM$ 68.97 33.10 24.83
Maintenance MM$ 83.92 19.31 15.64
Utilities MM$ 257.55 73.90 21.62
Property Tax + Insurance MM$ 83.92 12.87 7.82
Environmental Charge MM$ 251.76 38.61 23.45
Rent MM$ 125.88 19.31 11.73
Total Operation Cost MM$ 871.99 197.10 105.07 (1,174.16)
Depreciation MM$ 1,258.80 193.06 40.03 (1,569.13)
Regasification MM$ (162.36)
HDPE transport cost MM$ -
LNG transport cost MM$ (1,672.30)
BT profit MM$ 1,413.83
AATP MM$ 2,473.98
ROI 15.8%
Tran
s
po
rt
OPTION 11 - Dispersed Mode - 1000 KTA
CA
PEX
Mat
eria
l Co
stR
even
ue
Op
erat
ing
Co
st

85
Table A-12 – Option 12 economic analysis
Gas Processing/
LiquefractionCracking Polymerization Total
Capacity 858.5 Tcf 1525 KTA 1500 KTA
ISBL MM$ 11,146 2,166 1,090
OSBL MM$ 5,573 1,083 545
Total MM$ 16,719 3,249 1,635 21,604
Material MM$ (2,387) (2,387.45)
Catalyst & Chemical MM$ (258) (75) (332.55)
Main Product MM$ 2,100.00 2,100
By-product
Methane/LNG MM$ 9,309.64 9,309.64
Propane MM$ 231.27 231.27
Propylene MM$ 20.35 20.35
Gasoline MM$ 1.01 1.01
Fuel oil MM$ 0.21 0.21
Fuel gas MM$ 52.91 52.91
Labor MM$ 110.34 49.65 33.10
Maintenance MM$ 111.46 32.49 21.80
Utilities MM$ 257.55 110.85 32.42
Property Tax + Insurance MM$ 111.46 21.66 10.90
Environmental Charge MM$ 334.39 64.98 32.71
Rent MM$ 167.19 32.49 16.35
Total Operation Cost MM$ 1,092.40 312.13 147.29 (1,551.81)
Depreciation MM$ 1,671.94 324.91 40.03 (2,160.38)
Regasification MM$ (243.54)
HDPE transport cost MM$ -
LNG transport cost MM$ (2,435.39)
BT profit MM$ 2,604.28
AATP MM$ 3,827.11
ROI 17.7%
Tran
s
po
rt
OPTION 12 - Dispersed Mode- 1500 KTA
CA
PEX
Mat
eria
l Co
stR
even
ue
Op
erat
ing
Co
st
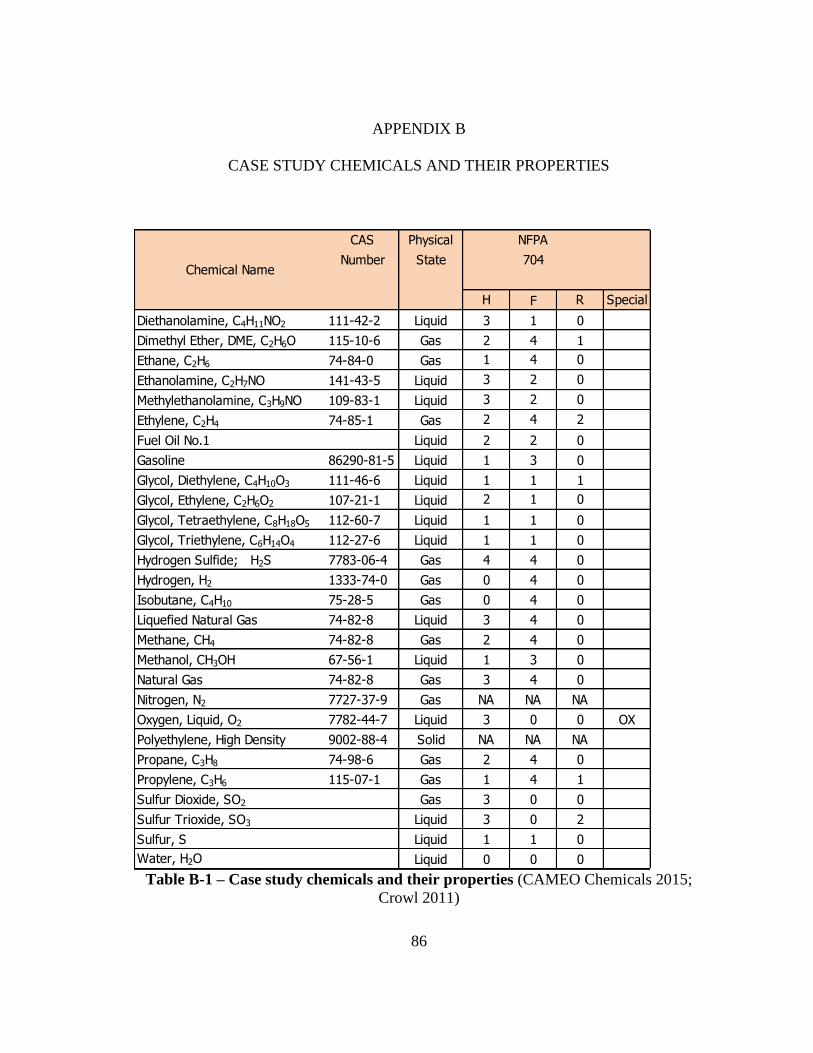
86
APPENDIX B
CASE STUDY CHEMICALS AND THEIR PROPERTIES
Table B-1 – Case study chemicals and their properties (CAMEO Chemicals 2015;
Crowl 2011)
CAS Physical NFPA
Number State 704
H F R Special
Diethanolamine, C4H11NO2 111-42-2 Liquid 3 1 0
Dimethyl Ether, DME, C2H6O 115-10-6 Gas 2 4 1
Ethane, C2H6 74-84-0 Gas 1 4 0
Ethanolamine, C2H7NO 141-43-5 Liquid 3 2 0
Methylethanolamine, C3H9NO 109-83-1 Liquid 3 2 0
Ethylene, C2H4 74-85-1 Gas 2 4 2
Fuel Oil No.1 Liquid 2 2 0
Gasoline 86290-81-5 Liquid 1 3 0
Glycol, Diethylene, C4H10O3 111-46-6 Liquid 1 1 1
Glycol, Ethylene, C2H6O2 107-21-1 Liquid 2 1 0
Glycol, Tetraethylene, C8H18O5 112-60-7 Liquid 1 1 0
Glycol, Triethylene, C6H14O4 112-27-6 Liquid 1 1 0
Hydrogen Sulfide; H2S 7783-06-4 Gas 4 4 0
Hydrogen, H2 1333-74-0 Gas 0 4 0
Isobutane, C4H10 75-28-5 Gas 0 4 0
Liquefied Natural Gas 74-82-8 Liquid 3 4 0
Methane, CH4 74-82-8 Gas 2 4 0
Methanol, CH3OH 67-56-1 Liquid 1 3 0
Natural Gas 74-82-8 Gas 3 4 0
Nitrogen, N2 7727-37-9 Gas NA NA NA
Oxygen, Liquid, O2 7782-44-7 Liquid 3 0 0 OX
Polyethylene, High Density 9002-88-4 Solid NA NA NA
Propane, C3H8 74-98-6 Gas 2 4 0
Propylene, C3H6 115-07-1 Gas 1 4 1
Sulfur Dioxide, SO2 Gas 3 0 0
Sulfur Trioxide, SO3 Liquid 3 0 2
Sulfur, S Liquid 1 1 0
Water, H2O Liquid 0 0 0
Chemical Name
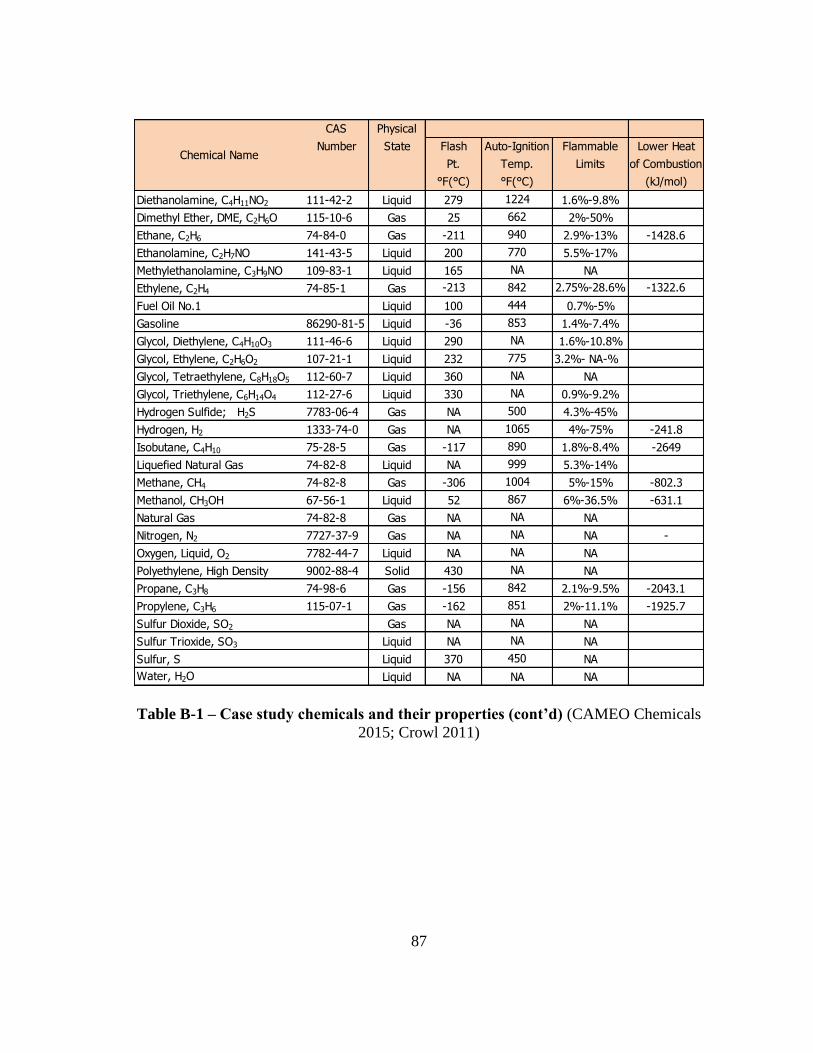
87
Table B-1 – Case study chemicals and their properties (cont’d) (CAMEO Chemicals
2015; Crowl 2011)
CAS Physical
Number State Flash Auto-Ignition Flammable Lower Heat
Pt. Temp. Limits of Combustion
°F(°C) °F(°C) (kJ/mol)
Diethanolamine, C4H11NO2 111-42-2 Liquid 279 1224 1.6%-9.8%
Dimethyl Ether, DME, C2H6O 115-10-6 Gas 25 662 2%-50%
Ethane, C2H6 74-84-0 Gas -211 940 2.9%-13% -1428.6
Ethanolamine, C2H7NO 141-43-5 Liquid 200 770 5.5%-17%
Methylethanolamine, C3H9NO 109-83-1 Liquid 165 NA NA
Ethylene, C2H4 74-85-1 Gas -213 842 2.75%-28.6% -1322.6
Fuel Oil No.1 Liquid 100 444 0.7%-5%
Gasoline 86290-81-5 Liquid -36 853 1.4%-7.4%
Glycol, Diethylene, C4H10O3 111-46-6 Liquid 290 NA 1.6%-10.8%
Glycol, Ethylene, C2H6O2 107-21-1 Liquid 232 775 3.2%- NA-%
Glycol, Tetraethylene, C8H18O5 112-60-7 Liquid 360 NA NA
Glycol, Triethylene, C6H14O4 112-27-6 Liquid 330 NA 0.9%-9.2%
Hydrogen Sulfide; H2S 7783-06-4 Gas NA 500 4.3%-45%
Hydrogen, H2 1333-74-0 Gas NA 1065 4%-75% -241.8
Isobutane, C4H10 75-28-5 Gas -117 890 1.8%-8.4% -2649
Liquefied Natural Gas 74-82-8 Liquid NA 999 5.3%-14%
Methane, CH4 74-82-8 Gas -306 1004 5%-15% -802.3
Methanol, CH3OH 67-56-1 Liquid 52 867 6%-36.5% -631.1
Natural Gas 74-82-8 Gas NA NA NA
Nitrogen, N2 7727-37-9 Gas NA NA NA -
Oxygen, Liquid, O2 7782-44-7 Liquid NA NA NA
Polyethylene, High Density 9002-88-4 Solid 430 NA NA
Propane, C3H8 74-98-6 Gas -156 842 2.1%-9.5% -2043.1
Propylene, C3H6 115-07-1 Gas -162 851 2%-11.1% -1925.7
Sulfur Dioxide, SO2 Gas NA NA NA
Sulfur Trioxide, SO3 Liquid NA NA NA
Sulfur, S Liquid 370 450 NA
Water, H2O Liquid NA NA NA
Chemical Name

88
Table B-1 – Case study chemicals and their properties (cont’d) (CAMEO Chemicals
2015; Crowl 2011)
CAS Physical PHYSICAL PROPERTIES
Number State Molecular Boiling Melting Heat of
Wt. Point Point Vaporization
°F(°C) °F(°C) (BTU/lb)
Diethanolamine, C4H11NO2 111-42-2 Liquid 105.14 516.40 82.0
Dimethyl Ether, DME, C2H6O 115-10-6 Gas 46.07 -8.00 -217.3
Ethane, C2H6 74-84-0 Gas 30.07 -127.50 -279.9 210.41
Ethanolamine, C2H7NO 141-43-5 Liquid 61.08 338.00 50.5
Methylethanolamine, C3H9NO 109-83-1 Liquid 75.11 316.00 23.9
Ethylene, C2H4 74-85-1 Gas 28.05 -154.70 -272.4
Fuel Oil No.1 Liquid 170 380-560 -55 70.19
Gasoline 86290-81-5 Liquid 72 140 - 390 NA 67.89
Glycol, Diethylene, C4H10O3 111-46-6 Liquid 106.12 473.00 14.0 393
Glycol, Ethylene, C2H6O2 107-21-1 Liquid 62.07 387.70 9.0 449
Glycol, Tetraethylene, C8H18O5 112-60-7 Liquid 194.23 621.00 24.8 273
Glycol, Triethylene, C6H14O4 112-27-6 Liquid 150.17 545.00 24.3 270
Hydrogen Sulfide; H2S 7783-06-4 Gas 34.08 -76.59 -121.9 235.6
Hydrogen, H2 1333-74-0 Gas 2.016 -423.00 -434 194
Isobutane, C4H10 75-28-5 Gas 58.12 10.80 -427.5
Liquefied Natural Gas 74-82-8 Liquid >16 -258 -296
Methane, CH4 74-82-8 Gas 16.04 -258.70 -296.5 219.22
Methanol, CH3OH 67-56-1 Liquid 32.04 148.30 -144
Natural Gas 74-82-8 Gas NA NA NA NA
Nitrogen, N2 7727-37-9 Gas 28.013 -320.10 -354 85.6
Oxygen, Liquid, O2 7782-44-7 Liquid 32 -297.30 -361 91.6
Polyethylene, High Density 9002-88-4 Solid100000 - 500000 NA 185 - 230
Propane, C3H8 74-98-6 Gas 44.097 -43.8 -305.9 185
Propylene, C3H6 115-07-1 Gas 42.08 -53.9 -301.4
Sulfur Dioxide, SO2 Gas 64.05 14.00 -104.8 166.7
Sulfur Trioxide, SO3 Liquid 80.06 112.60 62.2 235.3
Sulfur, S Liquid 32.06 279.22 233-246 651.6
Water, H2O Liquid 18.015 212.00 32.0 970.3
Chemical Name

89
Table B-1 – Case study chemicals and their properties (cont’d) (CAMEO Chemicals
2015; Crowl 2011)
CAS Physical PHYSICAL PROPERTIES
Number State Specific Vapor Vapor
Gravity Pressure Density
(7) mm Hg (related to air)
Diethanolamine, C4H11NO2 111-42-2 Liquid 1.095 5.000 3.650
Dimethyl Ether, DME, C2H6O 115-10-6 Gas 0.724 2.128 1.617
Ethane, C2H6 74-84-0 Gas 0.546 NA NA
Ethanolamine, C2H7NO 141-43-5 Liquid 1.016 0.4 2.100
Methylethanolamine, C3H9NO 109-83-1 Liquid 0.941 0.7 2.590
Ethylene, C2H4 74-85-1 Gas 0.569 NA NA
Fuel Oil No.1 Liquid 0.81-0.85 5.000 NA
Gasoline 86290-81-5 Liquid 0.7321 382.58 NA
Glycol, Diethylene, C4H10O3 111-46-6 Liquid 1.118 < 0.01 3.660
Glycol, Ethylene, C2H6O2 107-21-1 Liquid 1.115 0.060 2.140
Glycol, Tetraethylene, C8H18O5 112-60-7 Liquid 1.120 NA NA
Glycol, Triethylene, C6H14O4 112-27-6 Liquid 1.125 < 0.001 5.170
Hydrogen Sulfide; H2S 7783-06-4 Gas 0.916 15200.000 1.190
Hydrogen, H2 1333-74-0 Gas 0.071 NA NA
Isobutane, C4H10 75-28-5 Gas 0.557 3.100 NA
Liquefied Natural Gas 74-82-8 Liquid 0.415 - 0.45 NA NA
Methane, CH4 74-82-8 Gas 0.422 258574 0.550
Methanol, CH3OH 67-56-1 Liquid 0.792 100 - 237.87 1.110
Natural Gas 74-82-8 Gas NA NA NA
Nitrogen, N2 7727-37-9 Gas 0.807 NA NA
Oxygen, Liquid, O2 7782-44-7 Liquid 1.140 NA NA
Polyethylene, High Density 9002-88-4 Solid 0.920 NA NA
Propane, C3H8 74-98-6 Gas 0.590 9823.000 1.500
Propylene, C3H6 115-07-1 Gas 0.609 760.000 1.460
Sulfur Dioxide, SO2 Gas 1.434
Sulfur Trioxide, SO3 Liquid 1.840
Sulfur, S Liquid 0.234
Water, H2O Liquid 1.000
Chemical Name

90
APPENDIX C
CASE STUDY DETAILED INDIVIDUAL RISKS OF PROCESS OPTIONS
Table C-1 – Detailed individual risks of methanol route single complex
manufacturing options
Table C-2 – Detailed individual risks of methanol route dispersed manufacturing
options
Process Unit Control room Admin Control room Admin Control room Admin
Natural gas processing 9.80E-06 6.23E-06 1.48E-05 9.39E-06 1.89E-05 1.20E-05
Methanol synthesis 3.27E-05 0.00E+00 4.93E-05 0.00E+00 6.29E-05 0.00E+00
Methanol storage 0.00E+00 0.00E+00 0.00E+00 0.00E+00 0.00E+00 0.00E+00
Methanol conversion 2.97E-04 0.00E+00 4.49E-04 0.00E+00 5.73E-04 0.00E+00
Ethylene 7.30E-05 0.00E+00 1.10E-04 0.00E+00 1.41E-04 0.00E+00
Propylene 4.75E-05 0.00E+00 7.17E-05 0.00E+00 9.16E-05 0.00E+00
HDPE 2.68E-05 0.00E+00 4.07E-05 0.00E+00 5.17E-05 0.00E+00
Subtotal 4.87E-04 6.23E-06 7.35E-04 9.39E-06 9.39E-04 1.20E-05
Total
500 KTA 1000 KTA 1500 KTA
4.93E-04 7.45E-04 9.51E-04
Sin
gle
com
ple
x
Process Unit Control room Admin Control room Admin Control room Admin
Natural gas processing 9.80E-06 6.23E-06 1.48E-05 9.39E-06 1.89E-05 1.20E-05
Methanol synthesis 3.27E-05 0.00E+00 4.93E-05 0.00E+00 6.29E-05 0.00E+00
Methanol storage 0.00E+00 0.00E+00 0.00E+00 0.00E+00 0.00E+00 0.00E+00
Methanol storage 0.00E+00 0.00E+00 0.00E+00 0.00E+00 0.00E+00 0.00E+00
Methanol conversion 2.97E-04 0.00E+00 4.49E-04 0.00E+00 5.73E-04 0.00E+00
Ethylene 7.30E-05 0.00E+00 1.10E-04 0.00E+00 1.41E-04 0.00E+00
Propylene 4.75E-05 0.00E+00 7.17E-05 0.00E+00 9.16E-05 0.00E+00
HDPE 2.68E-05 0.00E+00 4.07E-05 0.00E+00 5.17E-05 0.00E+00
Subtotal 4.87E-04 6.23E-06 7.35E-04 9.39E-06 9.39E-04 1.20E-05
Total
Methanol transportation
Loca
tio
n 1
1.109E-05 1.109E-05 1.109E-05
Loca
tio
n 2
500 KTA 1000 KTA 1500 KTA
4.93E-04 7.45E-04 9.51E-04
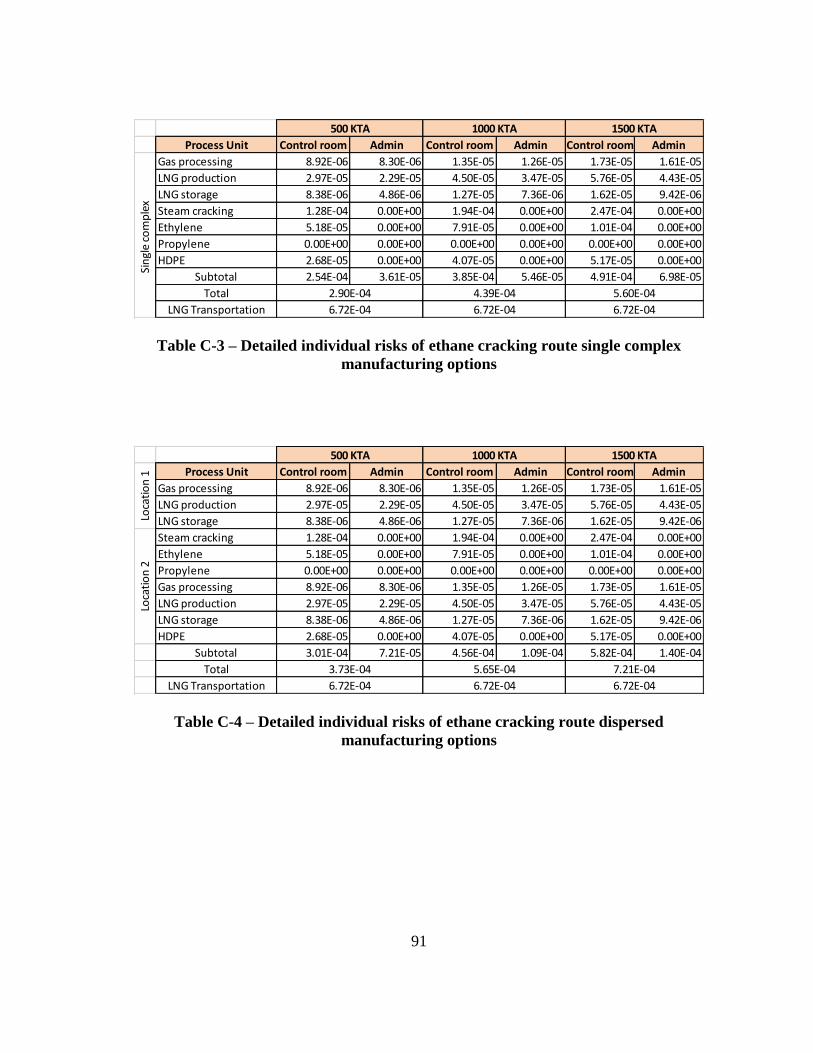
91
Table C-3 – Detailed individual risks of ethane cracking route single complex
manufacturing options
Table C-4 – Detailed individual risks of ethane cracking route dispersed
manufacturing options
Process Unit Control room Admin Control room Admin Control room Admin
Gas processing 8.92E-06 8.30E-06 1.35E-05 1.26E-05 1.73E-05 1.61E-05
LNG production 2.97E-05 2.29E-05 4.50E-05 3.47E-05 5.76E-05 4.43E-05
LNG storage 8.38E-06 4.86E-06 1.27E-05 7.36E-06 1.62E-05 9.42E-06
Steam cracking 1.28E-04 0.00E+00 1.94E-04 0.00E+00 2.47E-04 0.00E+00
Ethylene 5.18E-05 0.00E+00 7.91E-05 0.00E+00 1.01E-04 0.00E+00
Propylene 0.00E+00 0.00E+00 0.00E+00 0.00E+00 0.00E+00 0.00E+00
HDPE 2.68E-05 0.00E+00 4.07E-05 0.00E+00 5.17E-05 0.00E+00
Subtotal 2.54E-04 3.61E-05 3.85E-04 5.46E-05 4.91E-04 6.98E-05
Total
LNG Transportation
Sin
gle
com
ple
x
6.72E-04
2.90E-04 4.39E-04 5.60E-04
500 KTA 1000 KTA 1500 KTA
6.72E-04 6.72E-04
Process Unit Control room Admin Control room Admin Control room Admin
Gas processing 8.92E-06 8.30E-06 1.35E-05 1.26E-05 1.73E-05 1.61E-05
LNG production 2.97E-05 2.29E-05 4.50E-05 3.47E-05 5.76E-05 4.43E-05
LNG storage 8.38E-06 4.86E-06 1.27E-05 7.36E-06 1.62E-05 9.42E-06
Steam cracking 1.28E-04 0.00E+00 1.94E-04 0.00E+00 2.47E-04 0.00E+00
Ethylene 5.18E-05 0.00E+00 7.91E-05 0.00E+00 1.01E-04 0.00E+00
Propylene 0.00E+00 0.00E+00 0.00E+00 0.00E+00 0.00E+00 0.00E+00
Gas processing 8.92E-06 8.30E-06 1.35E-05 1.26E-05 1.73E-05 1.61E-05
LNG production 2.97E-05 2.29E-05 4.50E-05 3.47E-05 5.76E-05 4.43E-05
LNG storage 8.38E-06 4.86E-06 1.27E-05 7.36E-06 1.62E-05 9.42E-06
HDPE 2.68E-05 0.00E+00 4.07E-05 0.00E+00 5.17E-05 0.00E+00
Subtotal 3.01E-04 7.21E-05 4.56E-04 1.09E-04 5.82E-04 1.40E-04
Total
LNG Transportation 6.72E-04
Loca
tio
n 2
Loca
tio
n 1
5.65E-04 7.21E-04
6.72E-04 6.72E-04
500 KTA 1000 KTA 1500 KTA
3.73E-04
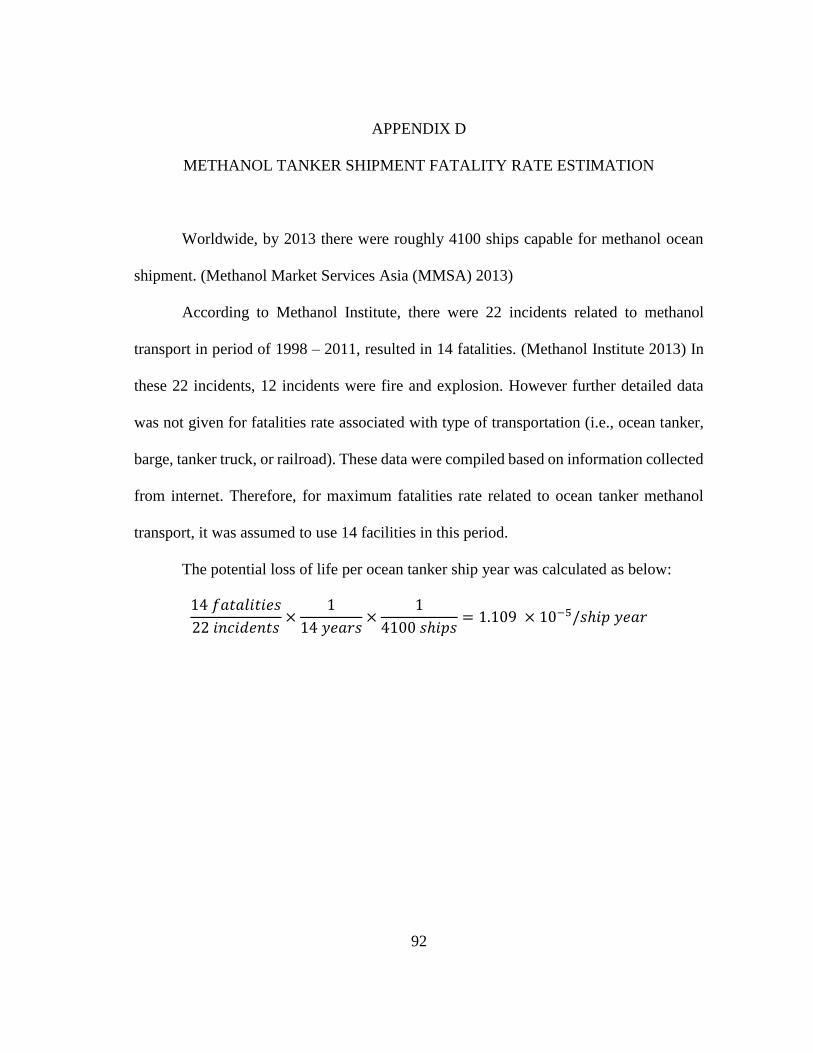
92
APPENDIX D
METHANOL TANKER SHIPMENT FATALITY RATE ESTIMATION
Worldwide, by 2013 there were roughly 4100 ships capable for methanol ocean
shipment. (Methanol Market Services Asia (MMSA) 2013)
According to Methanol Institute, there were 22 incidents related to methanol
transport in period of 1998 – 2011, resulted in 14 fatalities. (Methanol Institute 2013) In
these 22 incidents, 12 incidents were fire and explosion. However further detailed data
was not given for fatalities rate associated with type of transportation (i.e., ocean tanker,
barge, tanker truck, or railroad). These data were compiled based on information collected
from internet. Therefore, for maximum fatalities rate related to ocean tanker methanol
transport, it was assumed to use 14 facilities in this period.
The potential loss of life per ocean tanker ship year was calculated as below:
14 𝑓𝑎𝑡𝑎𝑙𝑖𝑡𝑖𝑒𝑠
22 𝑖𝑛𝑐𝑖𝑑𝑒𝑛𝑡𝑠×
1
14 𝑦𝑒𝑎𝑟𝑠×
1
4100 𝑠ℎ𝑖𝑝𝑠= 1.109 × 10⁻⁵/𝑠ℎ𝑖𝑝 𝑦𝑒𝑎𝑟
Copyright © 2022 FDOKUMEN