Suppression of inherent ferromagnetism in Pr-doped CeO2 nanocrystals
8
Suppression of inherent ferromagnetism in Pr-doped CeO 2 nanocrystals Novica Paunovi c, a Zorana Doh cevi c-Mitrovi c, * a Rares x Scurtu, b Sonja A skrabi c, a Marija Prekajski, c Branko Matovi c c and Zoran V. Popovi c a Received 3rd April 2012, Accepted 5th July 2012 DOI: 10.1039/c2nr30799e Ce 1x Pr x O 2d (0 # x # 0.4) nanocrystals were synthesized by self-propagating method and thoroughly characterized using X-ray diffraction, Raman and X-ray photoelectron spectroscopy and magnetic measurements. Undoped CeO 2 nanocrystals exhibited intrinsic ferromagnetism at room temperature. Despite the increased concentration of oxygen vacancies in doped samples, our results showed that ferromagnetic ordering rapidly degrades with Pr doping. The suppression of ferromagnetism can be explained in terms of the different dopant valence state, the different nature of the vacancies formed in Pr-doped samples and their ability/disability to establish the ferromagnetic ordering. Introduction Among the rare-earth oxides, nanostructured cerium oxide (CeO 2 ) has recently emerged as one of the most interesting oxides due to its exceptional properties which make it useful for various applications. It is an important catalyst for automotive catalytic converters, production of hydrogen, crude oil refining and the water–gas shift reaction 1–4 and is widely used as electrolyte in solid oxide fuel cells due to its high ionic conductivity. 5 These applications of nanocrystalline CeO 2 mostly stem from its remarkable oxygen-storage capability, which is especially pronounced on a particle surface, i.e. ability to absorb oxygen in oxygen-rich environment and release oxygen in an oxygen-poor environment without changing its fluorite structure. Since the report of Matsumoto et al. 6 that TiO 2 doped with Co shows room-temperature ferromagnetism (RTFM), there were a lot of reports about oxide semiconductors and insulators such as TiO 2 , SnO 2 , Al 2 O 3 , In 2 O 3 , ZnO, HfO 2 or CeO 2 which become ferromagnetic at RT when they were in the nanophase. 7–12 The FM in these nanostructures can be enhanced through doping with small amount of transition metals (TM) such as Cr, Mn, Fe, Co, Ni or Cu. 10,13 These diluted magnetic oxides (DMO) are inten- sively explored, since they challenge our understanding of the FM. The generally accepted picture of the exchange mechanisms between nearest-neighbors is inadequate to explain the FM in these materials. The FM ordering in DMO can be established far below the percolation threshold (sometimes with only 1% of dopant atoms), with Curie temperatures well in excess of RT. In some cases the achieved moment per dopant atom can exceed the maximum possible moment for the individual dopant atoms. The FM in DMO is different from the FM in III–V diluted magnetic semiconductors such as Mn doped GaAs, for which Dietl et al. gave an explanation of the FM interaction in the framework of the Zener model of hole-mediated ferromagnetism. 14 The origin of the FM in DMO is still under investigation, but it is widely believed that the oxygen vacancies play a crucial role. It has been shown that there is a strong correlation between the presence of oxygen vacancies and ferromagnetism. 9,15–19 One of the frequently used models to explain the FM ordering in DMO is the F-center exchange mechanism, proposed by Coey et al. 20,21 According to this mechanism, an electron trapped in an oxygen vacancy (F center) acts as a coupling agent between magnetic ions. These materials have become very interesting nowadays, especially for spintronic applications. In this respect, CeO 2 attracts great attention since it has a high dielectric constant (3 ¼ 26) and almost perfect crystal lattice constant matching with silicon single crystals, making it very suitable for epitaxial growth of various silicon based structures. RTFM in CeO 2 thin films and nanopowders has been extensively studied both experimentally and theoretically. In the majority of previous experimental reports the attention was paid to the influence of TM doping or oxygen vacancies on the FM. 9,15–19,22–28 To the best of our knowledge, there are few papers dealing with RTFM in rare-earth doped ceria nanocrystals 29,30 but none with Pr as dopant. In most of the papers dealing with CeO 2 doped with rare earth elements, 31–39 research was mostly focused on structural, optical, electronic or catalytic properties. In the present work our objec- tive was to investigate the influence of Pr dopant, as an f element, on the magnetic properties of nanostructured CeO 2 and to explore the role played by oxygen vacancies on the magnetic properties. Experimental Nanocrystalline powders of pure CeO 2 and doped with 1, 3, 5, 10, 15, 20, 30 and 40 at.% of praseodymium were prepared by a a Institute of Physics, Center for Solid State Physics and New Materials, University of BelgradeSerbia. E-mail: [email protected] b National Institute for Research and Development in Microtechnologies (IMT), Bucharest, Romania c Institute of Nuclear Sciences ‘Vin ca’, University of BelgradeSerbia This journal is ª The Royal Society of Chemistry 2012 Nanoscale, 2012, 4, 5469–5476 | 5469 Dynamic Article Links C < Nanoscale Cite this: Nanoscale, 2012, 4, 5469 www.rsc.org/nanoscale PAPER Downloaded by University of Belgrade on 28 January 2013 Published on 10 July 2012 on http://pubs.rsc.org | doi:10.1039/C2NR30799E View Article Online / Journal Homepage / Table of Contents for this issue
Transcript of Suppression of inherent ferromagnetism in Pr-doped CeO2 nanocrystals

Dynamic Article LinksC<Nanoscale
Cite this: Nanoscale, 2012, 4, 5469
www.rsc.org/nanoscale PAPER
Dow
nloa
ded
by U
nive
rsity
of
Bel
grad
e on
28
Janu
ary
2013
Publ
ishe
d on
10
July
201
2 on
http
://pu
bs.r
sc.o
rg |
doi:1
0.10
39/C
2NR
3079
9EView Article Online / Journal Homepage / Table of Contents for this issue
Suppression of inherent ferromagnetism in Pr-doped CeO2 nanocrystals
Novica Paunovi�c,a Zorana Doh�cevi�c-Mitrovi�c,*a Raresx Scurtu,b Sonja A�skrabi�c,a Marija Prekajski,c
Branko Matovi�cc and Zoran V. Popovi�ca
Received 3rd April 2012, Accepted 5th July 2012
DOI: 10.1039/c2nr30799e
Ce1�xPrxO2�d (0# x# 0.4) nanocrystals were synthesized by self-propagating method and thoroughly
characterized using X-ray diffraction, Raman and X-ray photoelectron spectroscopy and magnetic
measurements. Undoped CeO2 nanocrystals exhibited intrinsic ferromagnetism at room temperature.
Despite the increased concentration of oxygen vacancies in doped samples, our results showed that
ferromagnetic ordering rapidly degrades with Pr doping. The suppression of ferromagnetism can be
explained in terms of the different dopant valence state, the different nature of the vacancies formed in
Pr-doped samples and their ability/disability to establish the ferromagnetic ordering.
Introduction
Among the rare-earth oxides, nanostructured cerium oxide
(CeO2) has recently emerged as one of the most interesting oxides
due to its exceptional properties which make it useful for various
applications. It is an important catalyst for automotive catalytic
converters, production of hydrogen, crude oil refining and the
water–gas shift reaction1–4 and is widely used as electrolyte in
solid oxide fuel cells due to its high ionic conductivity.5 These
applications of nanocrystalline CeO2 mostly stem from its
remarkable oxygen-storage capability, which is especially
pronounced on a particle surface, i.e. ability to absorb oxygen in
oxygen-rich environment and release oxygen in an oxygen-poor
environment without changing its fluorite structure.
Since the report of Matsumoto et al.6 that TiO2 doped with Co
shows room-temperature ferromagnetism (RTFM), there were a
lot of reports about oxide semiconductors and insulators such as
TiO2, SnO2, Al2O3, In2O3, ZnO, HfO2 or CeO2 which become
ferromagnetic at RT when they were in the nanophase.7–12 The
FM in these nanostructures can be enhanced through dopingwith
small amount of transition metals (TM) such as Cr, Mn, Fe, Co,
Ni or Cu.10,13 These diluted magnetic oxides (DMO) are inten-
sively explored, since they challenge our understanding of the
FM. The generally accepted picture of the exchange mechanisms
between nearest-neighbors is inadequate to explain the FM in
these materials. The FM ordering in DMO can be established far
below the percolation threshold (sometimes with only 1% of
dopant atoms), with Curie temperatures well in excess of RT. In
some cases the achieved moment per dopant atom can exceed the
maximum possible moment for the individual dopant atoms. The
aInstitute of Physics, Center for Solid State Physics and New Materials,University of BelgradeSerbia. E-mail: [email protected] Institute for Research and Development in Microtechnologies(IMT), Bucharest, RomaniacInstitute of Nuclear Sciences ‘Vin�ca’, University of BelgradeSerbia
This journal is ª The Royal Society of Chemistry 2012
FM in DMO is different from the FM in III–V diluted magnetic
semiconductors such as Mn doped GaAs, for which Dietl et al.
gave an explanation of theFM interaction in the framework of the
Zener model of hole-mediated ferromagnetism.14 The origin of
the FM in DMO is still under investigation, but it is widely
believed that the oxygen vacancies play a crucial role. It has been
shown that there is a strong correlation between the presence of
oxygen vacancies and ferromagnetism.9,15–19One of the frequently
used models to explain the FM ordering in DMO is the F-center
exchange mechanism, proposed by Coey et al.20,21 According to
this mechanism, an electron trapped in an oxygen vacancy
(F center) acts as a coupling agent between magnetic ions.
These materials have become very interesting nowadays,
especially for spintronic applications. In this respect, CeO2
attracts great attention since it has a high dielectric constant (3 ¼26) and almost perfect crystal lattice constant matching with
silicon single crystals, making it very suitable for epitaxial growth
of various silicon based structures. RTFM in CeO2 thin films and
nanopowders has been extensively studied both experimentally
and theoretically. In the majority of previous experimental
reports the attention was paid to the influence of TM doping or
oxygen vacancies on the FM.9,15–19,22–28 To the best of our
knowledge, there are few papers dealing withRTFM in rare-earth
doped ceria nanocrystals29,30 but none with Pr as dopant. In most
of the papers dealing with CeO2 doped with rare earth
elements,31–39 research was mostly focused on structural, optical,
electronic or catalytic properties. In the present work our objec-
tive was to investigate the influence of Pr dopant, as an f element,
on themagnetic properties of nanostructuredCeO2 and to explore
the role played by oxygen vacancies on the magnetic properties.
Experimental
Nanocrystalline powders of pure CeO2 and doped with 1, 3, 5,
10, 15, 20, 30 and 40 at.% of praseodymium were prepared by a
Nanoscale, 2012, 4, 5469–5476 | 5469

Dow
nloa
ded
by U
nive
rsity
of
Bel
grad
e on
28
Janu
ary
2013
Publ
ishe
d on
10
July
201
2 on
http
://pu
bs.r
sc.o
rg |
doi:1
0.10
39/C
2NR
3079
9E
View Article Online
self propagating room temperature (SPRT) synthesis method40
using Ce(NO3)3$6H2O (Acros Organics) and Pr(NO3)3$6H2O
(Merck) as the precursors. The purity of cerium nitrate salt was
99.5%. The major impurities were rare earth oxides and some
other impurities (CaO, Na2O, SO4), without any magnetic ion
impurity (such as Fe, Co etc.). The purity of Pr salt was 99.9%.
The structural characteristics of the samples were determined by
powder X-ray diffraction (XRD) at room temperature on a
Siemens D5000 diffractometer using filtered Cu Ka radiation.
XRD patterns were collected in the 2q range from 20 to 80� usinga position sensitive detector with an 8� acceptance angle. Raman
scattering measurement was performed using a TriVista 557
Spectrometer in triple subtractive configuration and a nitrogen-
cooled charge coupled device detector. The Ar+ laser line of 514.5
nm was employed as an excitation source. Micro-Raman spectra
of the samples were collected at room temperature. The incident
laser power on the samples was kept low in order to prevent
heating effects. X-ray photoelectron spectroscopy (XPS) was
used for the oxidation state and atomic ratio analysis. XPS was
carried out on a PHI Quantera equipment with a base pressure in
the analysis chamber of 10�9 Torr. The X-ray source was mon-
ochromatized Al Ka radiation (1486.6 eV) and the energy reso-
lution was 0.7 eV. The spectra were calibrated using the C 1s line
(284.8 eV) of the adsorbed hydrocarbon on the sample surface.
The magnetic properties of the samples were measured with a
vibrating sample magnetometer in a high field measuring system
(HFMS, Cryogenic Ltd).
Results and discussion
XRD patterns of the Ce1�xPrxO2�d (0# x# 0.4) nanocrystalline
samples are shown in Fig. 1. It can be seen that diffraction
patterns of the samples exclusively correspond to a fluorite-like
structure. None of the samples in the compositional range up to
x¼ 0.4 show any evidence of phase separation. In the case of x¼0.4 sample there is an indication (marked with an asterisk) of a
Pr2O3 phase. This finding is in accordance with Luo et al. who
have noticed the onset of a secondary Pr6O11 phase for x$ 0.5 in
the case of Pr doped ceria.39
Fig. 1 XRD patterns of undoped and Pr-doped CeO2 nanocrystalline
powders. The appearance of Pr2O3 phase is indicated with an asterisk.
5470 | Nanoscale, 2012, 4, 5469–5476
The average particle size (D), lattice parameter (a) and lattice
strain (3) were obtained after Rietveld data refinement. Fig. 2a
shows particle size change with Pr doping. The general tendency
is particle size decrease with Pr doping, especially for higher
doping concentrations. This suggests that Pr doping hinders
crystallite growth similarly to TM-doped metal oxide
systems.25,41,42
Fig. 2b shows the lattice parameter change in Ce1�xPrxO2�d
samples. The lattice parameter of pure CeO2 nanocrystalline
samples (0.5427 nm) is higher in comparison with bulk coun-
terpart (0.541 nm) as a consequence of the increased presence of
oxygen vacancies and Ce3+ ions.43–45 The lattice parameter line-
arly increases with increasing Pr content according to Vegard’s
law. The ionic radius of Pr4+ (96 pm) is slightly smaller than the
Ce4+ radius (97 pm), so if Ce4+ is replaced by Pr4+ no significant
change of the lattice parameter is expected. The presence of Pr3+
ions in ceria lattice will cause a lattice expansion because of the
larger Pr3+ ionic radius (112.6 pm). Therefore, from the lattice
parameter change we can conclude that, with doping, the content
of Pr3+ ions increases. From Fig. 2c it can be seen that the
undoped CeO2 sample has a moderate strain. This is in agree-
ment with other reports on nanosized CeO2 particles.43 The
strain originates from the presence of Ce3+ ions and oxygen
deficiency in the host matrix. In doped samples, the strain
increases because of the higher content of Pr3+ ions. With
increasing amount of Pr the diffraction peak widths also increase
due to the crystallite size decrease and lattice strain increase.
The Raman spectra of Ce1�xPrxO2�d samples are shown in
Fig. 3a. The Raman spectra of highly doped samples (x > 15%)
are given in the inset of Fig. 3a for clarity. The most prominent
feature in the spectra is the F2g mode characteristic of a fluorite
crystal structure, which is positioned around 456 cm�1 in
Fig. 2 Particle size (a), lattice parameter (b) and strain (c) of pure and
Pr-doped CeO2 nanocrystals.
This journal is ª The Royal Society of Chemistry 2012

Fig. 3 (a) Raman spectra of pure and Pr-doped ceria samples and (b) the
intensity of the intrinsic–extrinsic vacancy modes relative to the F2g mode
intensity, as a function of Pr concentration. Inset: Raman spectra of
highly doped Ce1�xPrxO2�d samples (x > 15%).
Dow
nloa
ded
by U
nive
rsity
of
Bel
grad
e on
28
Janu
ary
2013
Publ
ishe
d on
10
July
201
2 on
http
://pu
bs.r
sc.o
rg |
doi:1
0.10
39/C
2NR
3079
9E
View Article Online
nanocrystalline CeO2. This mode in the nanocrystalline CeO2
sample experiences a red shift and an asymmetrical broadening
in comparison with its bulk counterpart.46 Phonon confinement,
inhomogeneous strain and the presence of defects cause the
observed changes of the Raman spectra.47,48 In Pr-doped ceria
samples, the lattice expands with increased concentration of Pr3+
ions, leading to the shift of the F2g mode energy to lower
frequencies. In the samples with higher Pr content (15% and
more) the F2g mode becomes slightly broader due to the
increased strain. The systematic shift and small broadening of the
F2g mode with increasing Pr content shows that Pr has incor-
porated into the ceria lattice forming solid solutions.36,38,49
Besides the F2g mode, in the Raman spectra of Pr-doped
samples there are two additional modes positioned at�540 cm�1
and �600 cm�1. These modes are related to the local vibrations
of different oxygen vacancy (VO) complexes. The mode at 600
cm�1 originates from the existence of Ce3+–VO complexes in the
ceria lattice. This mode is referred to as the intrinsic vacancy
mode.50 The extrinsic vacancy mode appears in doped samples
and mostly originates from different types of oxygen vacancy
complexes formed by doping.38,50This mode is positioned around
540 cm�1 in our Pr-doped samples. The intensity change of these
two modes relative to the F2g mode intensity is given in Fig. 3b.
With increasing Pr content, the intensity of the extrinsic vacancy
mode increases much faster than the intensity of the intrinsic
This journal is ª The Royal Society of Chemistry 2012
vacancy mode, implying faster increase of the extrinsic vacancy
concentration with doping. From this behavior we can conclude
that the concentrations of both kinds of defect complexes
increase and at certain point, defect complexes introduced by Pr
doping surpass the Ce3+–VO complexes.
Fig. 4a shows the Ce 3d XPS spectra of Ce1�xPrxO2�d samples
for x¼ 3, 10, 15 and 30%Pr content. The fitting of the spectra was
done using Gaussian Lorentzian profiles and the overall fit is
presented for the 3% Pr-doped sample. The deconvolution of
the spectra gives four spin-orbit doublets (3d5/2 and 3d3/2) labeled
v–v00 0 and u–u00 0 using the notation of Ce peaks introduced by
Burroughs et al.,51 and a small extra satellite feature labeled as t
which could be a contribution from multiplet splitting effect. The
position of the peaks and their binding energies (BE) are
summarized in Table 1. Doublets u/v, u00/v00 and u0 0 0/v0 0 0 belong to
Ce4+, while u0/v0 belong to Ce3+. The relative concentration of
Ce3+ ions can be calculated from the integrated areas (Ai) of the
respective peaks as [Ce3+]/[Ce3+ + Ce4+]¼(Au0+Av0)/(Au + Av +
Au0 + Av0 + Au0 0 + Av0 0 + Au0 0 0 + Av0 0 0), and the obtained values are
listed in Table 2. It can be seen that the relative concentration of
Ce3+ ions is almost constant, indicating that the Pr doping does
not significantly change the Ce3+/Ce4+ ratio in the samples.
In the Pr 3d spectra, shown in Fig. 4b, the most prominent
features are two spin-orbit doublets labeled c/c0’ and b/b0 withapproximate energies of ca. 929/949 eV and 933/954 eV respec-
tively. These doublets represent the 3d5/2 (c, b) and 3d3/2 (c0, b0)
components of the spectra. An additional structure t is present in
the 3d3/2 component and can be explained by a multiplet effect.52
The characteristic oxygen Auger peak labeled OKLL is also
present in the spectra. Contrary to the Ce 3d spectra, for the Pr
3d spectra there is no precise and reliable method for quantitative
analysis of the oxidation states by deconvolution of the spectra.
Doublets c/c0 and b/b0 are present in both PrO2 and Pr2O3
compounds53 and hence cannot be exclusively assigned to Pr4+ or
Pr3+. On the other hand, in the XPS spectra of the PrO2
compound exists a doublet a/a0 with energies of ca. 946/967 eV.
This doublet feature is exclusively characteristic of the PrO2
compound.34,52–56 The position of the peak a at 946 eV is very
close to the stronger c0 peak and is hardly observable. On the
contrary, the peak a0 at 967 eV is very distinctive and can be used
for qualitative assessment of the Pr4+ presence.34,53–55 The
expected positions of these peaks are also indicated in Fig. 4b. As
can be seen from the Pr 3d spectra, the peak a0 is absent and the
overall look of the spectra is more similar to the spectra of Pr2O3
then to PrO2.52,53This analysis indicates that in the nanoparticles’
surface layer, most of the Pr ions are in the Pr3+ state, although a
small amount of Pr4+ cannot be completely ruled out.
In order to estimate the relative amount of Pr and Ce in the
samples, the total areas of Pr 3d and Ce 3d peaks were divided
and corrected for the atomic sensitivity factors taken from the
literature.57 The obtained values are given in Table 2. It should be
emphasized that these values correspond to the samples’ surface
layer of about 1 nm to which the XPS technique is the most
sensitive. The estimated and nominal sample composition is in
quite good agreement at higher Pr content. For the lowest Pr
content (3% Pr) the measured Pr atomic fraction is much higher
than the nominal one. This indicates that for low Pr content there
is a higher tendency of Pr segregation in the surface layer of
nanocrystals.
Nanoscale, 2012, 4, 5469–5476 | 5471
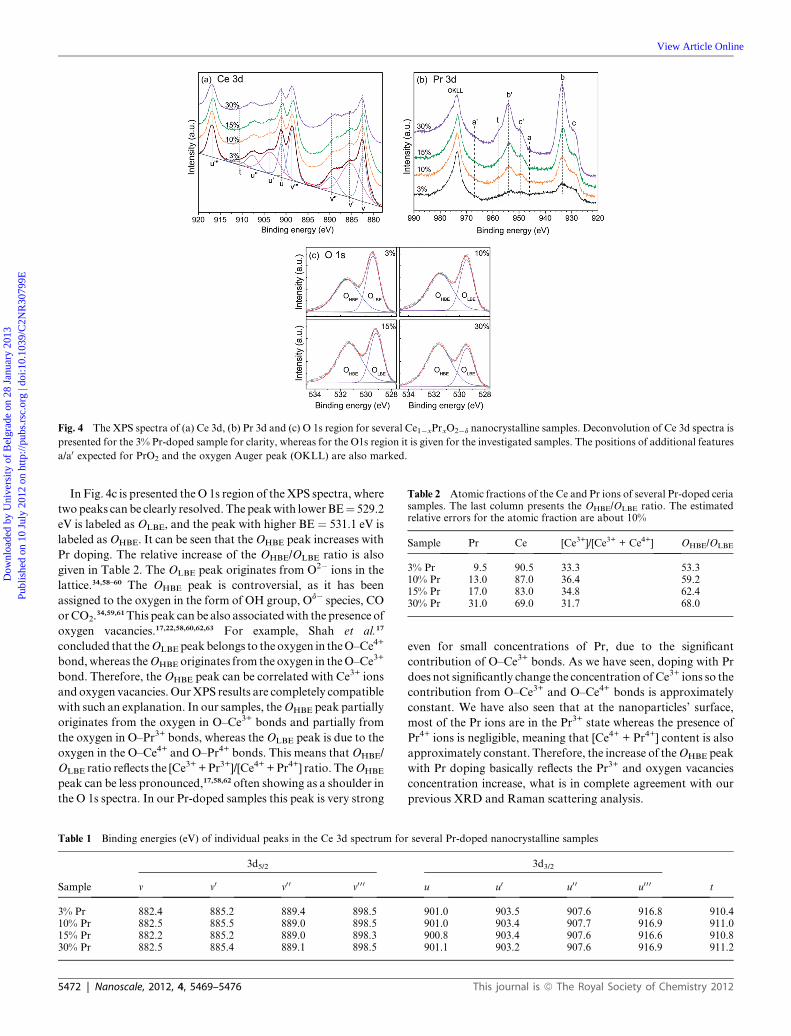
Fig. 4 The XPS spectra of (a) Ce 3d, (b) Pr 3d and (c) O 1s region for several Ce1�xPrxO2�d nanocrystalline samples. Deconvolution of Ce 3d spectra is
presented for the 3% Pr-doped sample for clarity, whereas for the O1s region it is given for the investigated samples. The positions of additional features
a/a0 expected for PrO2 and the oxygen Auger peak (OKLL) are also marked.
Table 2 Atomic fractions of the Ce and Pr ions of several Pr-doped ceriasamples. The last column presents the OHBE/OLBE ratio. The estimatedrelative errors for the atomic fraction are about 10%
Sample Pr Ce [Ce3+]/[Ce3+ + Ce4+] OHBE/OLBE
3% Pr 9.5 90.5 33.3 53.310% Pr 13.0 87.0 36.4 59.215% Pr 17.0 83.0 34.8 62.430% Pr 31.0 69.0 31.7 68.0
Dow
nloa
ded
by U
nive
rsity
of
Bel
grad
e on
28
Janu
ary
2013
Publ
ishe
d on
10
July
201
2 on
http
://pu
bs.r
sc.o
rg |
doi:1
0.10
39/C
2NR
3079
9E
View Article Online
In Fig. 4c is presented theO 1s region of theXPS spectra, where
twopeaks can be clearly resolved. The peakwith lowerBE¼ 529.2
eV is labeled as OLBE, and the peak with higher BE ¼ 531.1 eV is
labeled asOHBE. It can be seen that theOHBE peak increases with
Pr doping. The relative increase of the OHBE/OLBE ratio is also
given in Table 2. The OLBE peak originates from O2� ions in the
lattice.34,58–60 The OHBE peak is controversial, as it has been
assigned to the oxygen in the form of OH group, Od� species, CO
orCO2.34,59,61This peak can be also associatedwith the presence of
oxygen vacancies.17,22,58,60,62,63 For example, Shah et al.17
concluded that theOLBE peakbelongs to theoxygen in theO–Ce4+
bond,whereas theOHBE originates from the oxygen in theO–Ce3+
bond. Therefore, theOHBE peak can be correlated with Ce3+ ions
and oxygen vacancies. OurXPS results are completely compatible
with such an explanation. In our samples, theOHBE peak partially
originates from the oxygen in O–Ce3+ bonds and partially from
the oxygen in O–Pr3+ bonds, whereas theOLBE peak is due to the
oxygen in the O–Ce4+ and O–Pr4+ bonds. This means thatOHBE/
OLBE ratio reflects the [Ce3+ +Pr3+]/[Ce4+ +Pr4+] ratio. TheOHBE
peak can be less pronounced,17,58,62 often showing as a shoulder in
the O 1s spectra. In our Pr-doped samples this peak is very strong
Table 1 Binding energies (eV) of individual peaks in the Ce 3d spectrum fo
Sample
3d5/2
v v0 v0 0 v0 0 0
3% Pr 882.4 885.2 889.4 898.510% Pr 882.5 885.5 889.0 898.515% Pr 882.2 885.2 889.0 898.330% Pr 882.5 885.4 889.1 898.5
5472 | Nanoscale, 2012, 4, 5469–5476
even for small concentrations of Pr, due to the significant
contribution of O–Ce3+ bonds. As we have seen, doping with Pr
does not significantly change the concentration of Ce3+ ions so the
contribution from O–Ce3+ and O–Ce4+ bonds is approximately
constant. We have also seen that at the nanoparticles’ surface,
most of the Pr ions are in the Pr3+ state whereas the presence of
Pr4+ ions is negligible, meaning that [Ce4+ + Pr4+] content is also
approximately constant. Therefore, the increase of theOHBE peak
with Pr doping basically reflects the Pr3+ and oxygen vacancies
concentration increase, what is in complete agreement with our
previous XRD and Raman scattering analysis.
r several Pr-doped nanocrystalline samples
3d3/2
tu u0 u0 0 u0 0 0
901.0 903.5 907.6 916.8 910.4901.0 903.4 907.7 916.9 911.0900.8 903.4 907.6 916.6 910.8901.1 903.2 907.6 916.9 911.2
This journal is ª The Royal Society of Chemistry 2012

Fig. 6 (a) The saturation magnetization MS of undoped and Pr-doped
CeO2 nanocrystals. (b) The magnetic moment meff per Pr ion calculated
using eqn (1).
Dow
nloa
ded
by U
nive
rsity
of
Bel
grad
e on
28
Janu
ary
2013
Publ
ishe
d on
10
July
201
2 on
http
://pu
bs.r
sc.o
rg |
doi:1
0.10
39/C
2NR
3079
9E
View Article Online
Fig. 5a shows magnetization (M) vs. magnetic field (H)
dependence for undoped and Pr-doped CeO2 nanocrystals
measured at RT. The doped samples show FM behavior which is
significantly weaker than in the undoped sample except for the
lowest Pr concentrations. The FM component is superimposed
over a linear background which is diamagnetic for the undoped
and 1% Pr-doped sample and paramagnetic for the rest of the
samples. From the inset of Fig. 5a it can be seen that the
susceptibility of this background component linearly increases
with Pr content. Stoichiometric CeO2 is diamagnetic and the
presence of paramagnetic Ce3+ ions (4f1) in the undoped nano-
crystalline sample leads to an increase in susceptibility. Pr4+ (4f1)
and Pr3+ (4f2) ions are also paramagnetic leading to a further
increase in the paramagnetic background with Pr doping.
Fig. 5b presents M vs. H dependence for the samples after
subtracting the linear background, showing well-defined hyster-
esis curves. The saturation magnetization (MS) values are plotted
in Fig. 6a. In the case of the undoped CeO2, theMS takes value of
0.018 emu g�1, which is comparable with previous reports on
RTFM in CeO2 nanoparticles.9,15,18,26,64 The composition of
cerium nitrate precursor excludes the possibility that the FM in
the pure CeO2 sample originates from the FM impurities such as
Fe, Co or Ni, but contains the traces of nonmagnetic impurities
such as rare earth oxides. This is in accordance with finding of
Ackland et al.64 that the presence of rare earth traces in cerium
salt of lower purity (in their case La in 99% pure cerium nitrate)
can favor the establishment of the FM, compared to the samples
synthesized from 99.999% pure cerium nitrate, for which they
found no ferromagnetism.
The obtained value of the saturation magnetization supports
the opinion that only a small fraction of the sample volume (f) is
Fig. 5 Room temperature magnetization (M) versus field (H) depen-
dence of undoped and Pr-doped CeO2 nanocrystals: (a) raw magnetiza-
tion and (b) the magnetization after subtracting the linear background
component. Inset: susceptibility of the subtracted background
component.
This journal is ª The Royal Society of Chemistry 2012
magnetic,12,64,65 which is in our case the surface layer of nano-
particles. Using the procedure described by Coey et al.12 and
Ackland et al.,64we estimated that the value of f is about 0.5% for
the undoped CeO2, which is in agreement with their results.
Therefore we can conclude that the RTFM is an intrinsic prop-
erty of nanocrystalline CeO2 originating from the surface of the
nanoparticles.
The MS rapidly decreases with Pr-doping and for 5% of Pr it
takes a value of 0.002 emu g�1 which is almost 10 times lower
than for the undoped CeO2. Further increase of Pr content does
not change the MS significantly. It can be concluded that even a
small amount of Pr severely reduces the saturation magnetization
and weakens the FM ordering in ceria nanoparticles.
The effective magnetic moment meff per Pr ion, given in Fig. 6b
is calculated from the susceptibility data according to the
equation66
meff ¼ffiffiffiffiffiffiffiffiffiffiffiffiffiffiffiffiffiffiffiffiffiffiffiffiffiffi3kBTMmolcc
xNA
s(1)
where x is Pr content in a formula unit,Mmol is the molar mass, T
is temperature (300 K), kB is the Boltzmann constant and NA is
Avogadro’s number. In the eqn (1), cc is the corrected value of
susceptibility obtained by subtracting the susceptibility of the
undoped CeO2 nanocrystalline sample from the susceptibility of
the doped samples. This is done in order to eliminate the
diamagnetic contribution of CeO2 and paramagnetic contribu-
tion due to Ce3+ ions and to calculate more correctly the para-
magnetism originating from Pr doping. From Fig. 6b it can be
seen that with doping the magnetic moment per Pr ion increases
from about 2.49 mB to 2.96 mB. For lanthanides, because of the
strong LS coupling, the orbital moment is not quenched and the
total angular momentum J ¼ L + S has to be used for
the calculation of the magnetic moment: meff ¼ gJffiffiffiffiffiffiffiffiffiffiffiffiffiffiffiffiffiffiJðJ þ 1Þp
mB,
where gJ is the Lande g-factor. In the case of Ce3+ ions (ground
state 2F5/2, S¼ 1/2, L¼ 3, J¼ 5/2, gJ¼ 6/7) the magnetic moment
is meff ¼ 2.54 mB. The same is valid for Pr4+ ions. For Pr3+ ions
Nanoscale, 2012, 4, 5469–5476 | 5473
Dow
nloa
ded
by U
nive
rsity
of
Bel
grad
e on
28
Janu
ary
2013
Publ
ishe
d on
10
July
201
2 on
http
://pu
bs.r
sc.o
rg |
doi:1
0.10
39/C
2NR
3079
9E
View Article Online
(3H4, S¼ 1, L¼ 5, J¼ 4, gJ ¼ 4/5) the magnetic moment is meff ¼3.58 mB.
67 Hence, the increase of the magnetic moment per Pr ion
with doping implies that with increased Pr content the Pr3+/Pr4+
ratio increases. This conclusion is already supported by XRD
and XPS results.
Systematic studies of magnetic properties of nanosized CeO2
and other semiconductor oxide nanostructures demonstrated
that oxygen vacancies play a pivotal role in establishing FM in
these materials. It has been shown that there is a strong corre-
lation between the concentration of oxygen vacancies and the
saturation magnetization.9,15–19 One of the widely used mecha-
nisms for the explanation of FM ordering in nanocrystalline
CeO2 is the so called F-center exchange mechanism
(FCE).20,21,28,68 According to this mechanism, an electron trapped
in an oxygen vacancy (F center) acts as a coupling agent between
magnetic Ce3+ ions, effectively forming overlapping magnetic
polarons. The oxygen vacancy can actually exist in three possible
charge states: (a) an F2+ center with no trapped electrons; (b) an
F+ center with one trapped electron which can mediate the FM
interaction; and (c) an F0 center with two trapped electrons
which are in the singlet (S ¼ 0) state and can only mediate weak
antiferromagnetic interactions.17,21 Theoretical calculations also
predict that vacancies tend to migrate from the nanoparticles’
interior to the surface.69 These calculations are supported by
many reports which undoubtedly show that the FM originates
mostly from the surface layer.9,15,16,70
Our results have pointed out that the inherent FM ordering in
nanocrystalline CeO2 rapidly degrades even with the smallest
amount of Pr content. Fig. 7 schematically presents a possible
scenario for the degradation of the FM ordering with increased
Pr content. In the undoped sample (Fig. 7a), there is a consid-
erable concentration of oxygen vacancies and Ce3+ ions which
are mostly located at the nanocrystals’ surface. They are
responsible for the establishment of the FM ordering trough the
F-center exchange mechanism. When CeO2 nanocrystals are
doped with Pr ions, for lower doping concentrations (Fig. 7b),
the Pr ions segregate at the nanocrystals’ surface, in the form of
Pr3+ ions. Due to this segregation in the thin surface layer, the
Pr3+ concentration is several times higher than might be expected
from the nominal Pr content. The presence of Pr3+ ions in this
layer weakens the FM ordering and drastically reduces the
saturation magnetization. With further doping (Fig. 7c), Pr4+
and Pr3+ ions enter in the core of the nanocrystals with increasing
Pr3+ portion. The increased concentration of Pr3+ ions in the
surface and core of nanocrystals is responsible for the lattice
expansion, F2g Raman mode red shift, and increase of suscepti-
bility and magnetic moment per Pr ion. Raman and XPS results
Fig. 7 Schematic representation of CeO2 nanocrystals: (a) undop
5474 | Nanoscale, 2012, 4, 5469–5476
showed that the concentration of oxygen vacancies increased
with Pr doping. However, the presence of additional vacancies
does not enhance the FM as is usually observed. We believe this
is because of the inhibiting effect of Pr3+ ions which can provoke
the conversion of F+ centers into F2+ or F0 centers. Doping with
Pr can produce different magnetic/nonmagnetic complexes in the
ceria lattice. Here we will restrict our attention only to certain
types of complexes which can be held responsible for the
degradation of the FM ordering.
When an oxygen vacancy is created in a ceria lattice, two
electrons are left behind. If one electron localizes on a Ce4+ ion
creating a Ce4+–VO–Ce3+ complex, and the other electron is
trapped in a hydrogenic orbital around VO, it will create an F+
center responsible for the establishment of the FM. In doped
samples, in a similar way, the formation of Pr4+–VO–Ce3+
complexes can favour the FM ordering. However, if both elec-
trons are localized on cations then a significant portion of the
Pr3+–VO–Ce3+ or Pr3+–VO–Pr
3+ complexes can be formed in the
ceria lattice. The vacancies in these complexes turn into F2+
centers with no trapped electrons and do not mediate the FM
ordering any more. In our recent paper71 we experimentally
showed that in highly oxygen deficient nanoceria, electrons are
not only localized on Ce3+ or dopant ions but also on vacancy
sites. The incorporation of Pr3+ ions in the ceria lattice brings
additional vacancies and electrons are left behind. If two elec-
trons remain localized on a vacancy then the oxygen vacancy
becomes doubly occupied (F0 centers). Contrary to the singly
occupied oxygen vacancies which mediate the FM, the doubly
occupied vacancies can only mediate weak antiferromagnetic
exchange.21 The creation of F2+ and F0 centers would decrease a
number of F+ centers, and more importantly, would reduce their
concentration below the percolation threshold of the related
magnetic polarons, preventing the establishment of the long-
range FM ordering. Hence, the inhibiting effect of Pr3+ ions on
the FM ordering in a ceria lattice manifests through the
appearance of F2+ and F0 centers which do not promote ferro-
magnetic exchange. Some possible magnetic/nonmagnetic
complexes, already discussed, are illustrated in Fig. 8.
It should be noted that, besides the FCE mechanism, the band
ferromagnetism approach or its variation, the charge transfer
model,65 can also be taken under consideration. Following this
approach, if the Fermi level (EF) is near the local maximum of
density of states of a band and the Stoner criterion is satisfied, a
spontaneous band spin-splitting occurs giving rise to the FM. In
such a way, a defect-related band formed due to a high oxygen
deficiency can be responsible for the FM in CeO2.65,71 The
influence of Pr doping would manifest as rise in EF if Pr ions give
ed and doped with (b) lower and (c) higher Pr concentrations.
This journal is ª The Royal Society of Chemistry 2012

Fig. 8 The complexes (a) and (b) mediate FM ordering through F+
centers, whereas complexes (c) and (d) do not establish long-range FM
ordering because of the formation of F2+ centers. Bold arrows indicate
the electrons left after oxygen vacancy (VO) creation.
Dow
nloa
ded
by U
nive
rsity
of
Bel
grad
e on
28
Janu
ary
2013
Publ
ishe
d on
10
July
201
2 on
http
://pu
bs.r
sc.o
rg |
doi:1
0.10
39/C
2NR
3079
9E
View Article Online
away electrons to the oxygen deficiency band. On the other hand,
Pr doping can introduce an unfilled impurity band below the
oxygen deficiency band. Electrons from the oxygen deficiency
band can transfer to this band, leading to lowering of EF, a
failure to fulfil the Stoner criterion and the destruction of
the FM.
Furthermore, the reduction of the FM ordering in a case of
high dopant concentrations can be explained through the near-
est-neighbor antiferromagnetic exchange via oxygen anions
which would suppress the FM ordering.21 All of this can have
negative effect on the establishment of the ferromagnetism in
CeO2 nanocrystals.
Conclusions
In summary, we investigated structural, vibrational and
magnetic properties of Ce1�xPrxO2�d (0# x# 0.4) nanocrystals,
synthesized by the SPRT method, using X-ray diffraction,
Raman and X-ray photoelectron spectroscopy and magnetic
measurements. The pure nanocrystalline ceria exhibits room-
temperature ferromagnetism mediated by oxygen vacancies (F+
centers). Our results showed that Pr ions enter into ceria lattice in
a mixed valence state and segregate at the nanocrystals’ surface
predominantly in the Pr3+ valence state. The presence of Pr3+
ions in thin surface layer, where oxygen vacancies are mostly
located, is responsible for the rapid degradation of ferromagne-
tism. The formation of different complexes like Pr3+–VO–Ce3+ or
Pr3+–VO–Pr3+ favors creation of unoccupied oxygen vacancies
(F2+ centers) which do not mediate ferromagnetic ordering.
Electron localization on vacancies can promote a formation of
doubly occupied oxygen vacancies (F0 centers) which can only
mediate weak antiferromagnetic exchange. The creation of F2+
and F0 centers reduces the number of F+ centers and suppresses
ferromagnetism in Pr-doped ceria samples. For high Pr concen-
trations, the nearest-neighbor antiferromagnetic exchange via
oxygen anions can additionally weaken the ferromagnetic
ordering. On the other hand, from the band ferromagnetism
point of view, Pr doping can shift the Fermi level away from a
This journal is ª The Royal Society of Chemistry 2012
maximum of density of states of defect band leading to a failure
to fulfil the Stoner criterion and suppression of ferromagnetism.
Our results indicate that room temperature ferromagnetism in
diluted magnetic oxides such as CeO2 can be strongly dependent
on the doping element and its valence state, as well as on the type
of oxygen vacancies and their ability/disability to mediate
ferromagnetism.
Acknowledgements
We thank Dr Petre Osiceanu for valuable and fruitful discus-
sions. This work was financially supported by the Serbian
Ministry of Education and Science under the projects ON171032
and III45018, SASA project F-134, Swiss National Science
Foundation through grant IZ73Z0-128169 and Spanish Ministry
of Science and Innovation through grant AIB2010SE-00160. Dr
Raresx Scurtu acknowledges the support of the Sectorial Opera-
tional Programme Human Resource Development (SOPHRD)
under the contract number POSDRU/89/1.5/S/63700.
References
1 S. D. Park, J. M. Vohs and R. J. Gorte, Nature, 2000, 404, 265–267.
2 Q. Fu, H. Saltsburg and M. Flytzani-Stephanopoulos, Science, 2003,301, 935–938.
3 K. Otsuka, T. Ushiyama and I. Yamanaka, Chem. Lett., 1993, 22,1517–1520.
4 G. A. Deluga, J. R. Salge, L. D. Schmidt and X. E. Verykios, Science,2004, 303, 993–997.
5 E. P. Murray, T. Tsai and S. A. Barnett, Nature, 1999, 400, 649–651.6 Y. Matsumoto, M. Murakami, T. Shono, T. Hasegawa,T. Fukumura, M. Kawasaki, P. Ahmet, T. Chikyow, S. Koshiharaand H. Koinuma, Science, 2001, 291, 854–856.
7 M. Venkatesan, C. B. Fitzgerald and J. M. D. Coey, Nature, 2004,430, 630.
8 N. H. Hong, J. Sakai, N. Poirot and V. Briz�e, Phys. Rev. B: Condens.Matter Mater. Phys., 2006, 73, 132404.
9 A. Sundaresan and C. N. R. Rao, Nano Today, 2009, 4, 96–106.10 N. Izyumskaya, Y. Alivov and H. Morkoc, Crit. Rev. Solid State
Mater. Sci., 2009, 34, 89–179.11 M. Tatiana, inHandbook of Nanophysics, CRC Press, 2010, pp. 1–30.12 J. M. D. Coey, J. T. Mlack, M. Venkatesan and P. Stamenov, IEEE
Trans. Magn., 2010, 46, 2501–2503.13 J. M. D. Coey, Curr. Opin. Solid State Mater. Sci., 2006, 10, 83–92.14 T. Dietl, H. Ohno, F. Matsukura, J. Cibert and D. Ferrand, Science,
2000, 287, 1019–1022.15 M. Y. Ge, H. Wang, E. Z. Liu, J. F. Liu, J. Z. Jiang, Y. K. Li,
Z. A. Xu and H. Y. Li, Appl. Phys. Lett., 2008, 93, 062505.16 S.-Y. Chen, Y.-H. Lu, T.-W. Huang, D.-C. Yan and C.-L. Dong,
J. Phys. Chem. C, 2010, 114, 19576–19581.17 L. R. Shah, A. Bakhtyar, Z. Hao, W. G. Wang, Y. Q. Song,
H. W. Zhang, S. I. Shah and J. Q. Xiao, J. Phys.: Condens. Matter,2009, 21, 486004.
18 Q.-Y. Wen, Z. Huai-Wu, S. Yuan-Qiang, Y. Qing-Hui, Z. Hao andQ. X. John, J. Phys.: Condens. Matter, 2007, 19, 246205.
19 V. Fernandes, P. Schio, A. J. A. de Oliveira, W. A. Ortiz, P. Fichtner,L. Amaral, I. L. Graff, J. Varalda, N. Mattoso, W. H. Schreiner andD. H. Mosca, J. Phys.: Condens. Matter, 2010, 22, 216004.
20 J. M. D. Coey, A. P. Douvalis, C. B. Fitzgerald and M. Venkatesan,Appl. Phys. Lett., 2004, 84, 1332–1334.
21 J. M. D. Coey, M. Venkatesan and C. B. Fitzgerald, Nat. Mater.,2005, 4, 173–179.
22 Y.-Q. Song, Z. Huai-Wu, W. Qi-Ye, P. Long and Q. X. John,J. Phys.:Condens. Matter, 2008, 20, 255210.
23 S. Maensiri, S. Phokha, P. Laokul and S. Seraphin, J. Nanosci.Nanotechnol., 2009, 9, 6415–6420.
24 S. Kumar, G. W. Kim, B. H. Koo, S. K. Sharma, M. Knobel,H. Chung and C. G. Lee, J. Nanosci. Nanotechnol., 2011, 11, 555–559.
Nanoscale, 2012, 4, 5469–5476 | 5475

Dow
nloa
ded
by U
nive
rsity
of
Bel
grad
e on
28
Janu
ary
2013
Publ
ishe
d on
10
July
201
2 on
http
://pu
bs.r
sc.o
rg |
doi:1
0.10
39/C
2NR
3079
9E
View Article Online
25 A. Thurber, K. M. Reddy, V. Shutthanandan, M. H. Engelhard,C. Wang, J. Hays and A. Punnoose, Phys. Rev. B: Condens. MatterMater. Phys., 2007, 76, 165206.
26 Z. D. Doh�cevi�c-Mitrovi�c, N. Paunovi�c, M. Radovi�c, Z. V. Popovi�c,B. Matovi�c, B. Ceki�c and V. Ivanovski, Appl. Phys. Lett., 2010, 96,203104–203103.
27 Y. Liu, Z. Lockman, A. Aziz and J. MacManus-Driscoll, J. Phys.:Condens. Matter, 2008, 20, 165201.
28 S. Y. Chen, C. H. Tsai, M. Z. Huang, D. C. Yan, T. W. Huang,A. Gloter, C. L. Chen, H. J. Lin, C. T. Chen and C. L. Dong,J. Phys. Chem. C, 2012, 116, 8707–8713.
29 G.-R. Li, D.-L. Qu, L. Arurault and Y.-X. Tong, J. Phys. Chem. C,2009, 113, 1235–1241.
30 M. C. Dimri, H. Khanduri, H. Kooskora, J. Subbi, I. Heinmaa,A. Mere, J. Krustok and R. Stern, Phys. Status Solidi A, 2012, 209,353–358.
31 H. Guo and Y. Qiao, Appl. Surf. Sci., 2008, 254, 1961–1965.32 M. A. Malecka, U. Burkhardt, D. Kaczorowski, M. P. Schmidt,
D. Goran and L. Kepinski, J. Nanopart. Res., 2008, 11, 2113–2124.33 V. Belliere, G. Joorst, O. Stephan, F. M. F. de Groot and
B. M. Weckhuysen, J. Phys. Chem. B, 2006, 110, 9984–9990.34 H. Borchert, Y. V. Frolova, V. V. Kaichev, I. P. Prosvirin,
G. M. Alikina, A. I. Lukashevich, V. I. Zaikovskii, E. M. Moroz,S. N. Trukhan, V. P. Ivanov, E. A. Paukshtis, V. I. Bukhtiyarovand V. A. Sadykov, J. Phys. Chem. B, 2005, 109, 5728–5738.
35 S. Rossignol, F. Gerard, D.Mesnard, C. Kappenstein andD. Duprez,J. Mater. Chem., 2003, 13, 3017–3020.
36 J. R. McBride, K. C. Hass, B. D. Poindexter and W. H. Weber,J. Appl. Phys., 1994, 76, 2435–2441.
37 Z.-Y. Pu, J.-Q. Lu, M.-F. Luo and Y.-L. Xie, J. Phys. Chem. C, 2007,111, 18695–18702.
38 M. Guo, J. Lu, Y. Wu, Y. Wang and M. Luo, Langmuir, 2011, 27,3872–3877.
39 M.-F. Luo, Z.-L. Yan, L.-Y. Jin and M. He, J. Phys. Chem. B, 2006,110, 13068–13071.
40 S. Boskovic, D. Djurovic, Z. Dohcevic-Mitrovic, Z. Popovic,M. Zinkevich and F. Aldinger, J. Power Sources, 2005, 145, 237–242.
41 A. Punnoose, J. Hays, A. Thurber, M. H. Engelhard,R. K. Kukkadapu, C. Wang, V. Shutthanandan andS. Thevuthasan, Phys. Rev. B: Condens. Matter Mater. Phys., 2005,72, 054402.
42 J. Hays, A. Punnoose, R. Baldner, M. H. Engelhard, J. Peloquin andK. M. Reddy, Phys. Rev. B: Condens. Matter Mater. Phys., 2005, 72,075203.
43 S. Deshpande, S. Patil, S. V. N. T. Kuchibhatla and S. Seal, Appl.Phys. Lett., 2005, 87, 133113.
44 F. Zhang, S.-W. Chan, J. E. Spanier, E. Apak, Q. Jin, R. D. Robinsonand I. P. Herman, Appl. Phys. Lett., 2002, 80, 127.
45 S. Tsunekawa, S. Ito and Y. Kawazoe, Appl. Phys. Lett., 2004, 85,3845–3847.
46 Z. D. Doh�cevi�c-Mitrovi�c, M. J. �S�cepanovi�c, M. U. Gruji�c-Broj�cin,Z. V. Popovi�c, S. B. Bo�skovi�c, B. M. Matovi�c, M. V. Zinkevich andF. Aldinger, Solid State Commun., 2006, 137, 387–390.
5476 | Nanoscale, 2012, 4, 5469–5476
47 I. H. Campbell and P. M. Fauchet, Solid State Commun., 1986, 58,739–741.
48 Z. V. Popovi�c, Z. Doh�cevi�c-Mitrovi�c, M. �S�cepanovi�c, M. Gruji�c-Broj�cin and S. A�skrabi�c, Ann. Phys., 2011, 523, 62–74.
49 H. Li, G. Lu, Y. Wang, Y. Guo and Y. Guo, Catal. Commun., 2010,11, 946–950.
50 Z. D. Doh�cevi�c-Mitrovi�c, M. Gruji�c-Broj�cin, M. �S�cepanovi�c,Z. V. Popovi�c, S. Bo�skovi�c, B. Matovi�c, M. Zinkevich andF. Aldinger, J. Phys.: Condens. Matter, 2006, 18, S2061.
51 P. Burroughs, A. Hamnett, A. F. Orchard and G. Thornton, J. Chem.Soc., Dalton Trans., 1976, 1686–1698.
52 H. Ogasawara, A. Kotani, R. Potze, G. A. Sawatzky and B. T. Thole,Phys. Rev. B: Condens. Matter, 1991, 44, 5465–5469.
53 S. L€utkehoff, M. Neumann and A. �Slebarski, Phys. Rev. B: Condens.Matter, 1995, 52, 13808–13811.
54 M. Y. Sinev, G. W. Graham, L. P. Haack and M. Shelef, J. Mater.Res., 1996, 11, 1960–1971.
55 A. N. Kharlanov, L. N. Ikryannikova, V. V. Lunin andA. Y. Stakheev, Russ. J. Phys. Chem. A, 2007, 81, 1117–1123.
56 A. Bianconi, A. Kotani, K. Okada, R. Giorgi, A. Gargano,A. Marcelli and T. Miyahara, Phys. Rev. B, 1988, 38, 3433–3437.
57 J. F. Moulder and J. Chastain, Handbook of X-ray PhotoelectronSpectroscopy: A Reference Book of Standard Spectra forIdentification and Interpretation of XPS Data, Physical ElectronicsDivision, Perkin-Elmer Corp., 1992.
58 A. Q. Wang, P. Punchaipetch, R. M. Wallace and T. D. Golden,J. Vac. Sci. Technol., B, 2003, 21, 1169–1175.
59 D. R. Mullins, S. H. Overbury and D. R. Huntley, Surf. Sci., 1998,409, 307–319.
60 A. E. C. Palmqvist, M. Wirde, U. Gelius and M. Muhammed,Nanostruct. Mater., 1999, 11, 995–1007.
61 J. El Fallah, L. Hilaire, M. Rom�eo and F. Le Normand, J. ElectronSpectrosc. Relat. Phenom., 1995, 73, 89–103.
62 M. Naeem, S. K. Hasanain, M. Kobayashi, Y. Ishida, A. Fujimori,B. Scott and S. I. Shah, Nanotechnology, 2006, 17, 2675.
63 E. J. Preisler, O. J. Marsh, R. A. Beach and T. C. McGill, J. Vac. Sci.Technol., B, 2001, 19, 1611–1618.
64 K. Ackland, L. M. A. Monzon, M. Venkatesan and J. M. D. Coey,IEEE Trans. Magn., 2011, 47, 3509.
65 J. M. D. Coey, P. Stamenov, R. D. Gunning, M. Venkatesan andK. Paul, New J. Phys., 2010, 12, 053025.
66 B. D. Cullity and C. D. Graham, Introduction to Magnetic Materials,Wiley-IEEE Press, 2008.
67 J. M. D. Coey, Magnetism and Magnetic Materials, CambridgeUniversity Press, 2010.
68 R. K. Singhal, P. Kumari, A. Samariya, S. Kumar, S. C. Sharma,Y. T. Xing and E. B. Saitovitch, Appl. Phys. Lett., 2010, 97, 172503.
69 J. C. Conesa, Surf. Sci., 1995, 339, 337–352.70 X. Chen, L. Guangshe, S. Yiguo, Q. Xiaoqing, L. Liping and
Z. Zhigang, Nanotechnology, 2009, 20, 115606.71 Z. V. Popovi�c, Z. D. Doh�cevi�c-Mitrovi�c, N. Paunovi�c and
M. Radovi�c, Phys. Rev. B: Condens. Matter Mater. Phys., 2012, 85,014302.
This journal is ª The Royal Society of Chemistry 2012