Water–Gas Shift and CO Methanation Reactions over Ni–CeO2(111) Catalysts
8
ORIGINAL PAPER Water–Gas Shift and CO Methanation Reactions over Ni–CeO 2 (111) Catalysts Sanjaya D. Senanayake • Jaime Evans • Stefano Agnoli • Laura Barrio • Tsung-Liang Chen • Jan Hrbek • Jose ´ A. Rodriguez Published online: 25 January 2011 Ó Springer Science+Business Media, LLC 2011 Abstract X-ray and ultraviolet photoelectron spectros- copies were used to study the interaction of Ni atoms with CeO 2 (111) surfaces. Upon adsorption on CeO 2 (111) at 300 K, nickel remains in a metallic state. Heating to ele- vated temperatures (500–800 K) leads to partial reduction of the ceria substrate with the formation of Ni 2? species that exists as NiO and/or Ce 1-x Ni x O 2-y . Interactions of nickel with the oxide substrate significantly reduce the density of occupied Ni 3d states near the Fermi level. The results of core-level photoemission and near-edge X-ray absorption fine structure point to weakly bound CO species on CeO 2 (111) which are clearly distinguishable from the formation of chemisorbed carbonates. In the presence of Ni, a stronger interaction is observed with chemisorption of CO on the admetal. When the Ni is in contact with Ce ?3 cations, CO dissociates on the surface at 300 K forming NiC x compounds that may be involved in the formation of CH 4 at higher temperatures. At medium and large Ni coverages ( [ 0.3 ML), the Ni/CeO 2 (111) surfaces are able to catalyze the production of methane from CO and H 2 , with an activity slightly higher than that of Ni(100) or Ni(111). On the other hand, at small coverages of Ni ( \ 0.3 ML), the Ni/CeO 2 (111) surfaces exhibit a very low activity for CO methanation but are very good catalysts for the water–gas shift reaction. Keywords Nickel Ceria Carbon monoxide CO methanation Water Water–gas shift reaction 1 Introduction Nickel-based catalyst are often used in industrial processes that involve the hydrogenation of olefins, the hydrotreating and hydrogenolysis of hydrocarbons, the production of hydrogen through the steam reforming of hydrocarbons or the water–gas shift (WGS) reaction, and CO methanation [1–4]. Oxide supports such as alumina, silica, zirconia, ceria, and titania have been used to disperse the nickel particles. The activity and selectivity of the supported nickel catalysts are strongly dependent on the amount of metal employed, the size of the dispersed metal particles, metal-support interactions and the composition of the support [1, 2]. A fundamental understanding of these parameters is necessary for a rational design of nickel- based catalysts [1–5]. In this article, we investigate the WGS and CO methanation reactions over Ni–CeO 2 (111) catalysts. X-ray and ultraviolet photoelectron spectrosco- pies (XPS and UPS) are used to study the interaction of Ni atoms with CeO 2 (111) surfaces. The chemisorption of CO on the Ni–CeO 2 (111) systems is studied with synchrotron- based core-level photoemission and near-edge X-ray absorption fine-structure (NEXAFS). Previous studies of scanning tunneling microscopy (STM) have revealed that Ni grows on CeO 2 (111) at 300 K S. D. Senanayake S. Agnoli L. Barrio J. Hrbek J. A. Rodriguez (&) The Department of Chemistry, Brookhaven National Laboratory, Upton, New York 11973, USA e-mail: [email protected] J. Evans Facultad de Ciencias, Universidad Central de Venezuela, Caracas 1020 A, Venezuela T.-L. Chen Chemical Sciences Division, Oak Ridge National Laboratory, Oak Ridge, TN 37831, USA 123 Top Catal (2011) 54:34–41 DOI 10.1007/s11244-011-9645-6
-
Upload
independent -
Category
Documents
-
view
1 -
download
0
Transcript of Water–Gas Shift and CO Methanation Reactions over Ni–CeO2(111) Catalysts

ORIGINAL PAPER
Water–Gas Shift and CO Methanation Reactionsover Ni–CeO2(111) Catalysts
Sanjaya D. Senanayake • Jaime Evans •
Stefano Agnoli • Laura Barrio • Tsung-Liang Chen •
Jan Hrbek • Jose A. Rodriguez
Published online: 25 January 2011
� Springer Science+Business Media, LLC 2011
Abstract X-ray and ultraviolet photoelectron spectros-
copies were used to study the interaction of Ni atoms with
CeO2(111) surfaces. Upon adsorption on CeO2(111) at
300 K, nickel remains in a metallic state. Heating to ele-
vated temperatures (500–800 K) leads to partial reduction
of the ceria substrate with the formation of Ni2? species
that exists as NiO and/or Ce1-xNixO2-y. Interactions of
nickel with the oxide substrate significantly reduce the
density of occupied Ni 3d states near the Fermi level. The
results of core-level photoemission and near-edge X-ray
absorption fine structure point to weakly bound CO species
on CeO2(111) which are clearly distinguishable from the
formation of chemisorbed carbonates. In the presence of
Ni, a stronger interaction is observed with chemisorption of
CO on the admetal. When the Ni is in contact with Ce?3
cations, CO dissociates on the surface at 300 K forming
NiCx compounds that may be involved in the formation of
CH4 at higher temperatures. At medium and large Ni
coverages ([0.3 ML), the Ni/CeO2(111) surfaces are able
to catalyze the production of methane from CO and H2,
with an activity slightly higher than that of Ni(100) or
Ni(111). On the other hand, at small coverages of Ni (\0.3
ML), the Ni/CeO2(111) surfaces exhibit a very low activity
for CO methanation but are very good catalysts for the
water–gas shift reaction.
Keywords Nickel � Ceria � Carbon monoxide �CO methanation � Water � Water–gas shift reaction
1 Introduction
Nickel-based catalyst are often used in industrial processes
that involve the hydrogenation of olefins, the hydrotreating
and hydrogenolysis of hydrocarbons, the production of
hydrogen through the steam reforming of hydrocarbons or
the water–gas shift (WGS) reaction, and CO methanation
[1–4]. Oxide supports such as alumina, silica, zirconia,
ceria, and titania have been used to disperse the nickel
particles. The activity and selectivity of the supported
nickel catalysts are strongly dependent on the amount of
metal employed, the size of the dispersed metal particles,
metal-support interactions and the composition of the
support [1, 2]. A fundamental understanding of these
parameters is necessary for a rational design of nickel-
based catalysts [1–5]. In this article, we investigate the
WGS and CO methanation reactions over Ni–CeO2(111)
catalysts. X-ray and ultraviolet photoelectron spectrosco-
pies (XPS and UPS) are used to study the interaction of Ni
atoms with CeO2(111) surfaces. The chemisorption of CO
on the Ni–CeO2(111) systems is studied with synchrotron-
based core-level photoemission and near-edge X-ray
absorption fine-structure (NEXAFS).
Previous studies of scanning tunneling microscopy
(STM) have revealed that Ni grows on CeO2(111) at 300 K
S. D. Senanayake � S. Agnoli � L. Barrio � J. Hrbek �J. A. Rodriguez (&)
The Department of Chemistry, Brookhaven National Laboratory,
Upton, New York 11973, USA
e-mail: [email protected]
J. Evans
Facultad de Ciencias, Universidad Central de Venezuela,
Caracas 1020 A, Venezuela
T.-L. Chen
Chemical Sciences Division, Oak Ridge National Laboratory,
Oak Ridge, TN 37831, USA
123
Top Catal (2011) 54:34–41
DOI 10.1007/s11244-011-9645-6

forming three dimensional particles [5]. Annealing to
higher temperatures (500–800 K) induces the sintering of
the Ni particles [5] and also a possible migration of the
admetal into the ceria substrate [5, 6]. Photoemission
experiments for the deposition of nickel on reduced ceria
films point to intermixing with the ceria covering Ni or
NiOx particles [6]. CeO2 exhibits a fluorite structure, in
which each Ce4? cation is surrounded by eight oxygen
atoms [7]. On the other hand, NiO adopts a rock-salt
structure with each Ni2? cation surrounded by ‘‘only’’ six
oxygen atoms [7]. Experiments of X-ray diffraction (XRD)
and X-ray absorption fine-structure (XAFS) performed in
our laboratory for powders of Ce1-x NixO2-y mixed-oxides
show a low stability for Ni inside the typical fluorite
structure of ceria [8]. A limit of 10–12% was found
for a stable Ce $ Ni exchange within a fluorite lattice.
For higher concentrations of Ni, formation of NiO/
Ce1-xNixO2-y mixtures was observed [8].
The reaction of low concentrations of CO in a mixture
with H2 to form CH4 was developed as a gas purification
process in the 1950s [1, 9]. At the present time, the metha-
nation reaction has a critical role in the production of syn-
thetic natural gas from hydrogen-deficient carbonaceous
materials. In addition, the reaction is an obvious starting
point in studies of fuel and chemical synthesis from carbon
sources [1, 9]. In the 1980s and 1990s, the CO methanation
reaction over single-crystal surfaces was the subject of many
investigations [3]. Detailed studies have been carried out for the
CO ? 3H2 ? CH4 ? H2O reaction on Ni(100) and Ni(111)
[3, 10, 11]. Strong similarities were found in the kinetic data for
the close-packed (111) and for the more open (100) crystal
plane of Ni, indicating that the methanation reaction is structure
insensitive [10, 11]. Subsequent studies for Ni/TiO2(100) cat-
alysts indicate that the formation of bonds between the admetal
and oxide support can enhance the methanation activity of Ni
[12, 13]. It is worthwhile to investigate if the same phenomenon
occurs in Ni/CeO2(111) catalysts.
The water–gas shift (WGS, CO ? H2O ? CO2 ? H2) is
an important reaction used in the chemical industry for the
production of clean H2 [1, 14]. At the present time, mixtures
of Fe–Cr oxides and Cu/ZnO are the commercially used
catalysts for the WGS reaction at temperatures between
350–500 �C and 180–250 �C, respectively. However, these
oxide catalysts are pyrophoric and normally require lengthy
and complex activation steps before usage [1, 14]. Conse-
quently better catalysts are being sought [4, 15]. In this
respect, ceria-supported metal catalysts are receiving a lot of
attention [15–19]. Our studies indicate that Ni/CeO2 cata-
lysts display a higher WGS activity than Cu/ZnO catalysts.
The deposition of small coverages of Ni on CeO2(111)
produces systems that are very efficient for the dissociation
of water and catalyzing the OH ? CO ? CO2 ? 0.5 H2
reaction.
2 Experimental Methods
The experiments presented in this work were undertaken in
three different chambers [17–21]. Beamline U12A at the
National Synchrotron Light Source (NSLS) was used to
collect the core-level photoemission and NEXAFS data.
The ultra-high vacuum (UHV) end-station (background
pressure * 1 9 10-10 Torr) with all necessary surface
science tools has been described previously in great detail
[20, 21]. The C 1s core-level spectra were recorded with a
photon energy of 400 eV and an energy resolution of
0.3 eV. NEXAFS spectroscopy was undertaken in the
partial yield mode with a grid bias of -225 eV at an energy
resolution of 0.5 eV. Higher order contributions of the Ce
L edge were subtracted from the presented spectra. The
energy calibration in the photoemission spectra was
undertaken using the satellite feature in the Ce 4d region at
122.3 eV, while NEXAFS spectra were aligned to the C
feature from the mesh at 284.7 eV. The XPS (Mg Ka) and
UPS (He I and II) data reported in ‘‘Sect. 3’’ for the Ni/
CeO2(111) systems were collected in a second chamber
described elsewhere [22]. UPS measurements were
obtained at normal incidence with respect to the sample
normal while XPS was at 45� with respect to the sample
normal.
The studies of CO methanation and the WGS were
conducted in a third UHV chamber which has a batch
reactor attached [17–19]. After preparing and characteriz-
ing the Ni/CeO2(111) surfaces in the UHV chamber, the
sample was transferred to the reactor at *300 K, then the
reactant gases were introduced (20 Torr of CO and 10 Torr
of H2O for the WGS [17–19]; 26 Torr of CO and 94 Torr
of H2 for CO methanation [10, 11]) and the sample was
rapidly heated to reaction temperatures in the range of
550–650 K. The reaction conditions used to investigate CO
methanation and the WGS were taken from previous
studies [10, 11, 17–19]. The reported rates in Sects. 3.3 and
3.4 are for steady-state conditions. The WGS was followed
during reaction times of 1–20 min, while reaction times of
1–75 min were used to monitor CO methanation. The
amount of molecules produced was normalized by the
active area exposed by the front of the sample, which was
the one that contained nickel.
The kinetic tests were done using a CeO2(111) single
crystal which was cleaned following standard procedures
used in our previous studies for Cu/CeO2(111) and Au/
CeO2(111) surfaces [17–19]. To avoid problems with
charging in the photoemission and NEXAFS experiments,
films of CeO2(111) were grown in situ onto a hot Ru(0001)
substrate (700 K) using a commercial built four pocket
Oxford evaporator in an O2 atmosphere (1 9 10-7 Torr).
Previous studies have been devoted to understanding this
growth and the formation of well defined 111 surfaces
Top Catal (2011) 54:34–41 35
123

[5, 21, 23]. Ni was evaporated on to CeO2(111) surfaces at
300 K. The Ni/CeO2(111) systems were exposed to CO
(99.99% Sigma-Aldrich) in the UHV chambers at 100 or
300 K.
3 Results and Discussion
3.1 The Interaction of Ni with CeO2(111)
Figure 1 depicts XPS data, Ni 2p and Ce 3d regions in top
panel and the Ni 2p3/2 peak in closer detail in the bottom
panel, upon deposition of Ni (*0.4 ML) at 300 K followed
by incremental annealing to 500, 700 and 800 K. The
deposition of the metal at room temperature produces a Ni
2p3/2 peak close to the binding energy of 853 eV reported
for bulk metallic nickel [2]. A weak shoulder is observed
near 854 eV, the position reported for the Ni 2p3/2 peak of
NiO [2]. This feature increased in intensity when the
sample was annealed to 500 K. The Ce 3d region is very
sensitive to changes in the oxidation state of the Ce cations,
showing distinctive line shapes for Ce4? and Ce3? species
[22, 24]. An analysis of the Ce 3d spectra indicate that the
clean CeO2(111) surface contains only Ce4? cations before
the deposition of nickel. After the adsorption of Ni and
annealing to 800 K, there are some minor changes in the
Ce 3d region that point to reduction of a small amount of
Ce4? into Ce3? cations. From studies of STM [5], it is
known that Ni grows on CeO2(111) at 300 K forming three
dimensional particles that sinter upon annealing to higher
temperatures (500–800 K) [5]. Since Ni and Ce can form
mixed-metal oxides [6, 8], migration of the Ni admetal into
the CeO2(111) substrate upon annealing is possible. In
principle, the appearance of Ni2? features in the XPS data
of Fig. 1 could be a consequence of the formation of NiO
or a Ce1-xNixO2-y mixed metal oxide. The line-shape of
the Ni 2p XPS spectrum of NiO has characteristic features
that disappear if Ni2? is dissolved in a lattice of another
oxide [25, 26]. These typical features of NiO are not seen
in Fig. 1, reinforcing the idea that the nickel is migrating
into the oxide substrate. After depositing small coverages
of Ni (\0.5 ML) on CeO2(111) and annealing to
500–800 K, we always saw a signal for Ni2? in XPS. When
the Ni coverages were increased above 0.5 ML, the ratio of
the Ni2?/Ni0 signals in XPS decreased in a continuous way
(i.e., no substantial amounts of additional Ni2? were pro-
duced). This is consistent with the low stability for Ni
inside the typical fluorite structure of ceria [8]. A limit of
10–12% has been found for a stable Ce $ Ni exchange
within a fluorite lattice [8].
Figure 2 shows He II (hm = 40.8 eV) valence band
spectra for CeO2(111) and Ni/CeO2(111) surfaces as a
function of temperature. The valence spectrum at the
bottom matches that reported in the literature for
CeO2(111) [21] with negligible signal (a band gap) from 0
to 2.5 eV. The deposition of Ni (*0.4 ML) at 300 K
produces new features in the region between 0 and 3 eV
where the occupied Ni 3d states are expected [27, 28].
There is also a new peak at *10.5 eV that probably cor-
responds to CO chemisorbed from the background gases
present inside the UHV chamber [27, 28]. Annealing from
300 to 500 or 800 K produces drastic changes in the
Fig. 1 a Evolution of the Ce 3d and Ni 2p photoemission lines as a
function of the annealing temperature measured using a Mg Ka source
(1253.6 eV). The spectrum of the clean CeO2 prior to the Ni
deposition (*0.4 ML) is reported at the bottom. Spectra have been
normalized to the same height of the f2 (v) peak in the Ce 3d features
[24]. b Evolution of the Ni 2p3/2 photoemission peak as a function of
the annealing temperature (hv = 1253.6 eV)
36 Top Catal (2011) 54:34–41
123
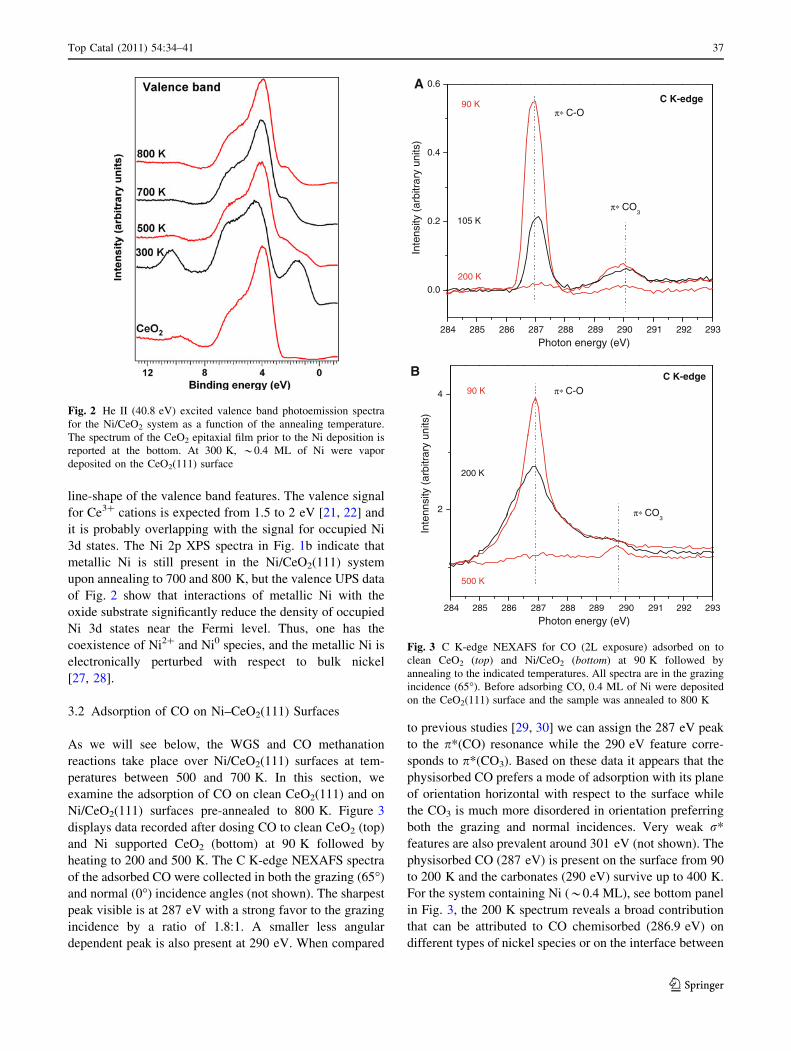
line-shape of the valence band features. The valence signal
for Ce3? cations is expected from 1.5 to 2 eV [21, 22] and
it is probably overlapping with the signal for occupied Ni
3d states. The Ni 2p XPS spectra in Fig. 1b indicate that
metallic Ni is still present in the Ni/CeO2(111) system
upon annealing to 700 and 800 K, but the valence UPS data
of Fig. 2 show that interactions of metallic Ni with the
oxide substrate significantly reduce the density of occupied
Ni 3d states near the Fermi level. Thus, one has the
coexistence of Ni2? and Ni0 species, and the metallic Ni is
electronically perturbed with respect to bulk nickel
[27, 28].
3.2 Adsorption of CO on Ni–CeO2(111) Surfaces
As we will see below, the WGS and CO methanation
reactions take place over Ni/CeO2(111) surfaces at tem-
peratures between 500 and 700 K. In this section, we
examine the adsorption of CO on clean CeO2(111) and on
Ni/CeO2(111) surfaces pre-annealed to 800 K. Figure 3
displays data recorded after dosing CO to clean CeO2 (top)
and Ni supported CeO2 (bottom) at 90 K followed by
heating to 200 and 500 K. The C K-edge NEXAFS spectra
of the adsorbed CO were collected in both the grazing (65�)
and normal (0�) incidence angles (not shown). The sharpest
peak visible is at 287 eV with a strong favor to the grazing
incidence by a ratio of 1.8:1. A smaller less angular
dependent peak is also present at 290 eV. When compared
to previous studies [29, 30] we can assign the 287 eV peak
to the p*(CO) resonance while the 290 eV feature corre-
sponds to p*(CO3). Based on these data it appears that the
physisorbed CO prefers a mode of adsorption with its plane
of orientation horizontal with respect to the surface while
the CO3 is much more disordered in orientation preferring
both the grazing and normal incidences. Very weak r*
features are also prevalent around 301 eV (not shown). The
physisorbed CO (287 eV) is present on the surface from 90
to 200 K and the carbonates (290 eV) survive up to 400 K.
For the system containing Ni (*0.4 ML), see bottom panel
in Fig. 3, the 200 K spectrum reveals a broad contribution
that can be attributed to CO chemisorbed (286.9 eV) on
different types of nickel species or on the interface between
Fig. 2 He II (40.8 eV) excited valence band photoemission spectra
for the Ni/CeO2 system as a function of the annealing temperature.
The spectrum of the CeO2 epitaxial film prior to the Ni deposition is
reported at the bottom. At 300 K, *0.4 ML of Ni were vapor
deposited on the CeO2(111) surface
0.6
π∗ C-O90 K C K-edge
0.4
0.2
200 K
105 K
π∗ CO3
Inte
nsity
(ar
bitr
ary
units
)
0.0
Photon energy (eV)
A
4 90 K π∗ C-O
C K-edge
2
200 K
π∗ CO
Inte
nnsi
ty (
arbi
trar
y un
its)
500 K
π CO3
B
Photon energy (eV)
285284 286 287 288 289 290 291 292 293
285284 286 287 288 289 290 291 292 293
Fig. 3 C K-edge NEXAFS for CO (2L exposure) adsorbed on to
clean CeO2 (top) and Ni/CeO2 (bottom) at 90 K followed by
annealing to the indicated temperatures. All spectra are in the grazing
incidence (65�). Before adsorbing CO, 0.4 ML of Ni were deposited
on the CeO2(111) surface and the sample was annealed to 800 K
Top Catal (2011) 54:34–41 37
123

Ni–CeO2. CO desorbs from NiO at 200–260 K. A shoulder
at 289.5 eV is also seen in Fig. 3 and it is likely a contri-
bution from the p*(CO3) bound to CeO2, Ni or the Ni–CeO2
interface. Annealing to 500 K shows desorption of the
chemisorbed CO and only the CO3 is left on the surface.
Figure 4 shows the C 1s region upon adsorption of CO
(2L) onto Ni/CeO2(111) and Ni/CeO2-x (111) systems
containing *0.4 ML of nickel. CO was dosed to
Ni/CeO2(111) at 90 K followed by annealing to the indi-
cated temperatures. On the Ni/CeO2 surface two broad
peaks centered nominally at 286.2 and 292 eV appear. The
same exposure of CO to clean CeO2 (not shown) exhibited
only features coming from CO–Ce at *291–292 eV, and
hence the 286.2 eV peak is likely a photoemission feature
for CO–Ni. A peak at 286.5 eV was found when metals
(M = Rh, Pd) were deposited on CeO2(111) and CO was
bound directly to them (M–CO) [31, 32]. The broad
291–292 eV peak has been reported previously in several
studies dealing with CO adsorption on ceria surfaces and
was attributed to CO3 species based on the expected BE
fingerprint for a carbonate species [29, 30] but, on the basis
of the NEXAFS data in Fig. 3, it can also have contribu-
tions of physisorbed CO up to 200 K. Annealing beyond
200 K shows the gradual desorption of CO species and by
500 K only traces of CO3 are left on the surface. There was
no clear signal for the decomposition of CO on the Ni/
CeO2(111) surface. On the other hand, when CO was
adsorbed onto a Ni/CeO2-x(111) surface at 300 K, bottom
of the figure, we observed the CO–Ni peak and a weak
contribution of CO3 species together with an additional
C–M species at 281.8 eV, which appears in between the C
1s binding energies of Ni3C (283.9 eV) and NiCx
(281.2 eV) [2]. The fact that CO dissociates on Ni/
CeO2-x(111) has important implications for the WGS and
CO methanation reactions. The NiO/Ce1-xNixO2-y species
formed upon annealing of Ni/CeO2(111) to 700 or 800 K
(Figs. 1, 2) are not stable under the conditions of the WGS
and CO methanation reactions being reduced by CO and
hydrogen to Ni/CeO2-x(111).
3.3 WGS Reaction on Ni/CeO2(111) Surfaces
Previous studies have examined the WGS reaction on
model catalysts such as Cu(111) [33], Cu(100) [17–19] or
Cu(110) [33], and on copper nanoparticles dispersed on
well-defined oxide surfaces [17–19, 34]. In this work, we
investigated the WGS activity of Ni/CeO2(111) surfaces
prepared following the steps shown in Figs. 1 and 2.
Figure 5 displays the WGS activity of model Ni/CeO2(111)
catalysts as a function of admetal coverage. The clean
CeO2(111) surface displayed no activity for the WGS under
the reaction conditions investigated here [17–19]. Upon
adding Ni to CeO2(111), there is a continuous increase in the
catalytic activity until a maximum is reached at coverages of
0.2–0.25 ML. For these systems, the production of methane
is negligible. On the other hand, when the coverage of Ni is
around 0.4 ML, one sees the appearance of CH4 as a reaction
product. For Ni coverages in the range of 0.4–2.5 ML, there
is a continuous decrease in the WGS activity while the rate
of formation of methane increases. This trend can be
attributed to a decrease in the WGS catalytic activity when
the Ni particle size becomes very large [5]. A similar phe-
nomenon has been seen for copper dispersed on well-defined
oxide surfaces [17–19, 34].
The kinetic data in Fig. 5 were collected using a reaction
cell attached to an ultra-high vacuum chamber for surface
characterization [17–19]. The gases were pumped out from
the reaction cell and the Ni/CeO2(111) surfaces were post-
characterized using standard XPS. In the C 1s region we
found typical peaks for adsorbed formate- or carbonate-like
species near 290 eV [20]. These species have been pro-
posed by some authors as intermediates in the WGS
reaction [15, 20] but they also could be the product of
readsorption of CO2. In the C 1s region we also detected a
small peak near 281.5 eV that could arise from carbon
bound to nickel [2]. In the post-reaction XPS, the Ni 2p
core-level showed that all the Ni2? present in the fresh
samples as NiO or Ce1-xNixO2-y was reduced during
reaction to metallic Ni or NiCx which both have a Ni 2p3/2
binding energy close to 853.2 eV [2]. An analysis of the
line-shape for the Ce 3d core levels [22, 35] indicated that
the ceria support underwent a partial reduction (CeO1.92–
CeO1.96 as final stoichiometries). Thus, systems consisting
of Ni or NiCx particles supported on CeO2-x(111) were
probably the active phase during the WGS reaction.
2.0
1.6
1.8
CO
CO3
CO
90 K
200 K
400K
1.0
1.2
1.4
Ni / CeO2Clean
C
Ce4s
500 K
0.4
0.6
0.8
Ni / CeO2-x
300 K
C
C1s
Inte
nsity
(ar
bitr
ary
units
)
C1s
Binding energy (eV)292294 290 288 286 284 282 280 278
Fig. 4 C 1s spectra for the adsorption of CO (2L exposure) on Ni
deposited CeO2(111), top, and CeO2-x(111), bottom. The electrons
were excited with a photon energy of 400 eV. Before adsorbing CO,
0.4 ML of Ni were deposited on the CeO2(111) and CeO2-x(111)
surfaces and the sample was annealed to 800 K
38 Top Catal (2011) 54:34–41
123

Figure 6 compares the WGS activity of Ni/CeO2(111)
and Cu/CeO2(111) [17–19]. Cu–CeO2 is a well known
catalyst for the WGS [15, 36]. For small coverages of the
admetal (\0.25 ML), Ni/CeO2(111) is a better WGS cat-
alyst than Cu/CeO2(111). However, the deposition of
0.4–0.6 ML of copper on CeO2(111) produces surfaces
with the highest catalytic activity in Fig. 6. At large cov-
erages of the admetal ([0.4 ML), the Cu/CeO2(111) sys-
tems are better WGS catalysts than the Ni/CeO2(111)
systems. This trend seems to reflect the fact that metallic
Cu is a better WGS catalyst than metallic Ni [37].
Figure 7 shows Arrhenius plots for the best Ni/
CeO2(111) and Cu/CeO2(111) catalysts in Fig. 6. For
comparison we also include the corresponding data for Cu/
ZnO(000ı) and Cu(100) surfaces [17–19]. Cu/ZnO is a
common industrial catalyst for the WGS [1, 15], and
Cu(100) has become a benchmark to study the WGS on
extended surfaces of metals [17–19, 37]. The data in Fig. 7
indicate that the metal/oxide catalysts are more active than
Cu(100) at temperatures between 575 and 650 K. Ni/CeO2
always has a WGS activity smaller than that of Cu/CeO2,
but it has a higher activity than Cu/ZnO. If one normalizes
the production of H2 by the admetal coverage (0.25 ML of
Ni; 0.5 ML of Cu), then Ni/CeO2 becomes an even better
catalyst than Cu/ZnO. The slopes of the Arrhenius plots
gave apparent activation energies of 15.2 kcal/mol for
Cu(100) [17–19], 12.4 kcal/mol for Cu/ZnO(000ı) [17–19],
10.4 kcal/mol for Ni/CeO2(111), and 8.6 kcal/mol for Cu/
CeO2(111) [17–19]. The rate-determining step for the
WGS on Cu(100) is the dissociation of water [37]. In the
metal/oxide systems, the oxide may help with the
dissociation of water [17–19, 35, 38] lowering in this way
the apparent activation energy for the reaction. Indeed,
tests experiments showed that Ni/CeO2(111) is more active
for the dissociation of water than clean CeO2(111),
Cu(100) [17–19, 39] and Ni(100) [39].
mo
lecu
le c
m-2
6
7
820 Torr CO, 10 Torr H2O 625 K
17
2
3
4
5
CO2H2
Nikcel (111) / ML0.0 0.4 0.8 1.2 1.6 2.0 2.4
mo
lecu
les
pro
du
ced
/ 10
0
1
2
CH4
coverage on COe2 /
Fig. 5 WGS activity of model Ni/CeO2(111) catalysts as a function
of admetal coverage. The Ni/CeO2(111) catalysts were prepared by
depositing Ni on CeO2(111) at 300 K followed by annealing to
800 K. Each Ni/CeO2(111) surface was exposed to a mixture of
20 Torr of CO and 10 Torr of H2O at 625 K for 5 min. Steady-state
was reached 2–3 min after introducing the gases in the batch reactor2
11
17 m
ole
cule
cm
-2
7
8
9
10 20 Torr CO, 10 Torr H2O 625 K
C
s p
rod
uce
d /
101
3
4
5
6Cu
H2
mo
lecu
les
0
1
2
3 Ni
Admetal coverage on CeO2(111) / ML0.0 0.4 0.8 1.2 1.6 2.0 2.4
Fig. 6 Comparison of the WGS activity of Ni/CeO2(111) and Cu/
CeO2(111) [17–19] catalysts. Each Ni/CeO2(111) or Cu/CeO2(111)
surface was exposed to a mixture of 20 Torr of CO and 10 Torr of
H2O at 625 K for 5 min)}
1.5
s cm
-2 s
-1
0.5
1.0
Cu/CeO2
mo
lecu
le
0.0 Cu/ZnO
Ni/CeO2
n{r
ate/
(1015
-1.0
-0.5
Cu(100)
1000 K/T
Ln
-1.5
( )
WGS reaction
1.55 1.60 1.65 1.70 1.75
Fig. 7 Arrhenius plot for the WGS reaction rate on a CeO2(111)
surface containing 0.25 ML of nickel. For comparison we also include
the corresponding results for Cu(100), 0.5 ML of Cu on ZnO(000ı),
and 0.5 ML of Cu on CeO2(111) [17–19]. All the data were acquired
with a pressure of 20 Torr of CO and 10 Torr of H2O
Top Catal (2011) 54:34–41 39
123

3.4 CO Methanation Reaction on Ni/CeO2(111)
Surfaces
Since CO methanation is a secondary reaction competing
with the WGS on Ni/CeO2(111) catalysts, we decided to
study it in more detail using mixtures of CO/H2 as reactants
[10, 11]. The CO methanation activity of Ni-based catalysts
is well established [2, 10–13]. The top panel in Fig. 8 shows
data for the production of CH4 from CO and H2 over a series
of Ni/CeO2(111) surfaces. For Ni coverages below 0.2 ML
the production of methane is very small. For these Ni/
CeO2-x(111) systems, there was CO dissociation and
deposition of C on the surface (In post-reaction character-
ization, a peak was seen in the C 1s region near 281.5 eV that
could arise from carbon bound to nickel [2]). The interac-
tions between small nickel particles and the carbon were
probably too strong to allow the efficient dissociation of H2
and the subsequent formation of methane (Ca ? 4Ha ?CH4,gas) [10]. At Ni coverages above 0.2 ML, there was a
substantial enhancement in the rate for methane formation.
As the Ni particle size increased [5], the strength of the
Ni $ C interactions probably decreased, and there were
more Ni sites available for the dissociation of H2 and the full
hydrogenation of C. In the bottom panel of Fig. 8, we present
the estimated turnover number (TON) for the methanation of
CO on Ni/CeO2(111) surfaces with an admetal coverage
below 1 ML. To estimate the TON, we divided the rate of
production of methane under steady-state conditions by the
total number of Ni atoms present in the catalysts. For Ni(100)
and Ni(111), under identical reaction conditions, a TON of
*0.7 CH4 molecules site-1 s-1 has been measured [10].
This value is comparable to the range of TONs estimated for
Ni coverages of 0.5–1 ML on CeO2(111): 0.72–0.84 CH4
molecules site-1 s-1. As in the case of Ni/TiO2(100) [12],
one finds that a Ni/CeO2(111) system can exhibit a CO
methanation activity higher than that of Ni(100) or Ni(111).
Experiments similar to those in Fig. 8 were also done at
temperatures of 550, 575, 600, and 650 K. We constructed
the Arrhenius plot shown in Fig. 9 for a Ni/CeO2(111) cat-
alyst with 0.6 ML of Ni. The plot gives an apparent activation
energy of 22.6 kcal/mol, which is close to the value of
24.7 kcal/mol reported for Ni(100) or Ni(111) [10], and to
the value of 25.2 kcal/mol obtained for Ni/TiO2(100) [12].
4 Summary and Conclusions
X-ray and ultraviolet photoelectron spectroscopies were
used to study the interaction of Ni atoms with CeO2(111)
surfaces. Upon adsorption on CeO2(111) at 300 K, nickel
remains in a metallic state. Heating to elevated tempera-
tures (500–800 K) leads to partial reduction of the ceria
substrate with the formation of Ni2? species that exists as
NiO and/or Ce1-xNixO2-y. The NiO/Ce1-xNixO2-y spe-
cies formed during the annealing of Ni/CeO2(111) are not
stable under the conditions of the WGS and CO metha-
nation reactions being reduced by CO and hydrogen to Ni/
CeO2-x(111).
The results of core-level photoemission and NEXAFS
point to weakly bound CO species on CeO2(111) which are
clearly distinguishable from the formation of chemisorbed
carbonates. In the presence of Ni, a stronger interaction is
observed with chemisorption of CO on the admetal. When
ule
cm
-2
4 24 Torr CO, 96 Torr H2625 K
uce
d /
1017
mo
lecu
2
3
625
4 m
ole
cule
s p
rodu
1
e c-1
Nickel coverage on CeO2 (111) / ML0.0 0.4 0.8 1.2 1.6 2.0 2.4C
H
0
mo
lecu
les
site
-1 s
0.8
1.0 24 Torr CO, 96 Torr H2 625 K
e r N
um
ber
/ C
H4
m
0.4
0.6
Est
imat
ed T
urn
ove
0.0
0.2
Nickel coverage on CeO2(111) / ML0.0 0.2 0.4 0.6 0.8 1.0E
Fig. 8 Top panel CO methanation activity of model Ni/CeO2(111)
catalysts as a function of admetal coverage. The Ni/CeO2(111)
catalysts were prepared by depositing Ni on CeO2(111) at 300 K
followed by annealing to 800 K. Each Ni/CeO2(111) surface was
exposed to a mixture of 24 Torr of CO and 96 Torr of H2 at 625 K.
The reported values correspond to the number of CH4 molecules
produced after a reaction time of 5 min under steady state conditions.
Bottom panel Estimated turnover number for CO methanation over
Ni/CeO2(111) catalysts with a nickel coverage of 0.05–1.0 ML
40 Top Catal (2011) 54:34–41
123

the Ni is in contact with a partially reduced CeO2-x(111)
surface, adsorbed CO dissociates at 300 K forming NiCx
compounds that may be involved in the formation of CH4
at higher temperatures.
At medium and large Ni coverages ([0.3 ML), the Ni/
CeO2(111) surfaces are able to catalyze the production of
methane from CO and H2, with an activity slightly higher
than that of Ni(100) or Ni(111). On the other hand, at small
coverages of Ni (\0.3 ML), the Ni/CeO2(111) surfaces
exhibit a very low activity for CO methanation but are very
good catalysts for the WGS reaction.
Acknowledgments The authors are grateful to J. Hanson, G. Zhou
and M. Perez for thought-provoking discussions about the catalytic
properties of Ni/CeO2(111). The research carried out at Brookhaven
National Laboratory was supported by the Division of Chemical
Sciences, Geosciences, and Biosciences, Office of Basic Energy
Sciences of the US Department of Energy (DE-AC02-98CH10886
contract). J. Evans thanks INTEVEP and IDB for research grants that
made possible part of this work at the Universidad Central de
Venezuela. T.-L. Chen was supported by the Division of Chemical
Sciences, Geosciences, and Biosciences, Office of Basic Energy
Sciences, US Department of Energy, under contract DE-AC05-
00OR22725 with Oak Ridge National Laboratory, managed and
operated by UT-Battelle, LLC. Use of the National Synchrotron Light
Source, Brookhaven National Laboratory, was supported by the US
Department of Energy, Office of Science, Office of Basic Energy
Sciences, under Contract No. DE-AC02-98CH10886.
References
1. Ertl G, Knozinger H, Weitkamp J (1997) Handbook of hetero-
geneous catalysis. Wiley, New York
2. Czekaj I, Loviat F, Raimondi F, Wambach J, Biollaz S, Wokaun
A (2007) Appl Catal A Gen 329:68
3. Rodriguez JA, Goodman DW (1981) Surf Sci Rep 14:1
4. Wen W, Calderon JE, Brito JL, Marinkovic N, Hanson JC,
Rodriguez JA (2008) J Phys Chem C 112:2128
5. Zhou Y, Perket JM, Crooks AB, Zhou J (2010) J Phys Chem Lett
1:1447
6. Caballero A, Holgado JP, Gonzalez-delaCruz VM, Habas SE,
Herranz T, Salmeron M (2010) Chem Commun 46:1097
7. Wyckoff RW (1964) Crystal structures, 2nd edn. Wiley, New
York
8. Barrio L, Kubacka A, Zhou G, Estrella M, Martınez-Arias A,
Hanson JC, Fernandez-Garcıa M, Rodriguez JA (2010) J Phys
Chem C 114:12689
9. Vannice MA (1976) J Catal 44:152
10. Kelley RD, Goodman DW (1982) J Catal 123:L743
11. Goodman DW, Kelley RD, Madey TE, Yates JT (1980) J Catal
63:226
12. Kao CC, Tsai SC, Chung YW (1982) J Catal 73:136
13. Chung YW, Xiong G, Kao CC (1984) J Catal 85:237
14. Thomas JM, Thomas WJ (1997) Principles and practice of het-
erogeneous catalysis. VCH, New York
15. Burch R (2006) Phys Chem Chem Phys 8:5483
16. Fu Q, Saltsburg H, Flytzani-Stephanopoulos M (2003) Science
301:935
17. Rodriguez JA, Liu P, Hrbek J, Evans J, Perez M (2007) Angew
Chem Int Ed 46:1329
18. Wang X, Rodriguez JA, Hanson JC, Perez M, Evans J (2005) J
Chem Phys 123:221101
19. Ferriz RM, Gorte RJ, Vohs JM (2002) Catal Lett 82:123
20. Senanayake SD, Stacchiola D, Liu P, Mullins CB, Hrbek J,
Rodriguez JA (2009) J Phys Chem C 113:19536
21. Mullins DR, Radulovic PV, Overbury SH (1999) Surf Sci
429:186
22. Park JB, Graciani J, Evans J, Stacchiola D, Ma S, Liu P, Nambu
A, Fernandez-Sanz J, Hrbek J, Rodriguez JA (2009) Proc Natl
Acad Sci 106:4975
23. Lu JL, Gao HJ, Shaikhutdinov SK, Freund HJ (2007) Catal Lett
114:8
24. Pfau A, Schierbaum KD (1994) Surf Sci 321:71–80
25. Reinert F, Hufner S (2005) New J Phys 7:97
26. Sanz JM, Tyuliev GT (1996) Surf Sci 367:196
27. Gordon DEA, Lambert RM (1993) Surf Sci 287/288:114
28. Cederbaum LS, Domcke W, von Niessen W, Brenig W (1975) Z
Phys B 21:381
29. Cappus D, Klinkmann J, Kuhlenbeck H, Freund H-J (1995) Surf
Sci 325:L421
30. Senanayake SD, Stacchiola D, Evans J, Estrella M, Barrio L,
Perez M, Hrbek J, Rodriguez JA (2010) J Catal 271:392
31. Senanayake SD, Zhou J, Baddorf AP, Mullins DR (2007) J Phys
Chem C 601:3215
32. Mullins DR, Overbury SH (1999) J Catal 188:340
33. Nakamura J, Campbell JM, Campbell CT (1990) J Chem Soc
Faraday Trans 86:2725
34. Rodriguez JA, Liu P, Wang X, Wen W, Hanson J, Hrbek J, Perez
M, Evans J (2009) Catal Today 143:45
35. Rodriguez JA, Ma S, Liu P, Hrbek J, Evans J, Perez M (2007)
Science 318:1757
36. Wang X, Rodrıguez JA, Hanson JC, Gamarra D, Martınez-Arias
A, Fernandez-Garcıa M (2006) J Phys Chem B 110:428
37. Liu P, Rodriguez JA (2007) J Chem Phys 126:164705
38. Park JB, Graciani J, Evans J, Stacchiola D, Senanayake SD,
Barrio L, Liu P, Fernandez-Sanz J, Hrbek J, Rodriguez JA (2010)
J Am Chem Soc 132:356
39. Thiel PA, Madey TA (1987) Surf Sci Rep 7:211
s-1)} 1 0.6 ML Ni on CeO2(111)
cule
s cm
-2
0
24 Torr CO, 96 Torr H2
(1015
mo
le
-1
Ln
{rat
e/
-2CO methanation
1000 K/T1.55 1.60 1.65 1.70 1.75 1.80 1.85
Fig. 9 Arrhenius plot for the CO methanation reaction rate on a
CeO2(111) surface containing 0.6 ML of nickel. All the data were
acquired with a pressure of 24 Torr of CO and 96 Torr of H2
Top Catal (2011) 54:34–41 41
123