Pt/Re/CeO2 Based Catalysts for CO-Water–Gas Shift Reaction
16
catalysts Article Pt/Re/CeO 2 Based Catalysts for CO-Water–Gas Shift Reaction: from Powders to Structured Catalyst Vincenzo Palma 1 , Fausto Gallucci 2 , Pluton Pullumbi 3 , Concetta Ruocco 1 , Eugenio Meloni 1 and Marco Martino 1, * 1 Department of Industrial Engineering, University of Salerno, Via Giovanni Paolo II 132, 84084 Fisciano (SA), Italy; [email protected] (V.P.); [email protected] (C.R.); [email protected] (E.M.) 2 Inorganic Membranes and Membrane Reactors, Department of Chemical Engineering and Chemistry, Eindhoven University of Technology, 5600 MB Eindhoven, The Netherlands; [email protected] 3 Air Liquide, Paris Innovation Campus. 1, chemin de la Porte des Loges, 78350 Les Loges en Josas, France; [email protected] * Correspondence: [email protected]; Tel.: +39-089-969275 Received: 6 May 2020; Accepted: 18 May 2020; Published: 19 May 2020 Abstract: This work focuses on the development of a Pt/Re/CeO 2 -based structured catalyst for a single stage water–gas shift process. In the first part of the work, the activity in water–gas shift reactions was evaluated for three Pt/Re/CeO 2 -based powder catalysts, with Pt/Re ratio equal to 1/1, 1/2 ad 2/1 and total loading ≈ 1 wt%. The catalysts were prepared by sequential dry impregnation of commercial ceria, with the salts precursors of rhenium and platinum; the activity tests were carried out by feeding a reacting mixture with a variable CO/H 2 O ratio, equal to 7/14, 7/20 and 7/24, and the kinetic parameters were determined. The model which better described the experimental results involves the water–gas shift (WGS) reaction and CO as well as CO 2 methanation. The preliminary tests showed that the catalyst with the Pt/Re ratio equal to 2/1 had the best performance, and this was selected for further investigations. In the second part of the work, a structured catalyst, obtained by coating a commercial aluminum alloy foam with the chosen catalytic formulation, was prepared and tested in different reaction conditions. The results demonstrated that a single stage water–gas shift process is achievable, obtaining a hydrogen production rate of 18.7 mmol/min at 685 K, at τ = 53 ms, by feeding a simulated reformate gas mixture (37.61 vol% H 2 , 9.31 vol% CO 2 , 9.31 vol% CO, 42.19 vol% H 2 O, 1.37 vol% CH 4 ). Keywords: hydrogen; water–gas shift; process intensification; structured catalysts; kinetics; aluminum alloy foam; ceria; platinum; rhenium 1. Introduction The water–gas shift (WGS) reaction [1] is an exothermic reaction, whose process is generally performed through two adiabatic stages, at high (HTS) [2] and low temperatures (LTS) [3]. WGS can be considered as the first syngas purification step to obtain high purity hydrogen, and in fact, it allows for the reduction of the CO percentage and increase of the hydrogen yield in the reformate gas stream [4]. The two-stages process configuration allows us to achieve higher conversions at relatively smaller volumes. The reactors suffer limitations, however, due to the heat of the reaction developed during the process, which induces a temperature gradient on the catalytic bed. The low temperature at the inlet of the bed disfavors the kinetics, while the high temperature at the outlet of the bed thermodynamically limits the conversion. In previous work, the intensification of the WGS reaction through the use of highly thermal conductive structured catalysts has been proposed [5], laying the foundations for the realization of a single stage process [6]. In fact, the use of such a structure [7] assures a redistribution Catalysts 2020, 10, 564; doi:10.3390/catal10050564 www.mdpi.com/journal/catalysts
-
Upload
khangminh22 -
Category
Documents
-
view
0 -
download
0
Transcript of Pt/Re/CeO2 Based Catalysts for CO-Water–Gas Shift Reaction
catalysts
Article
Pt/Re/CeO2 Based Catalysts for CO-Water–Gas ShiftReaction: from Powders to Structured Catalyst
Vincenzo Palma 1 , Fausto Gallucci 2, Pluton Pullumbi 3, Concetta Ruocco 1 ,Eugenio Meloni 1 and Marco Martino 1,*
1 Department of Industrial Engineering, University of Salerno, Via Giovanni Paolo II 132, 84084 Fisciano (SA),Italy; [email protected] (V.P.); [email protected] (C.R.); [email protected] (E.M.)
2 Inorganic Membranes and Membrane Reactors, Department of Chemical Engineering and Chemistry,Eindhoven University of Technology, 5600 MB Eindhoven, The Netherlands; [email protected]
3 Air Liquide, Paris Innovation Campus. 1, chemin de la Porte des Loges, 78350 Les Loges en Josas, France;[email protected]
* Correspondence: [email protected]; Tel.: +39-089-969275
Received: 6 May 2020; Accepted: 18 May 2020; Published: 19 May 2020�����������������
Abstract: This work focuses on the development of a Pt/Re/CeO2-based structured catalyst for asingle stage water–gas shift process. In the first part of the work, the activity in water–gas shiftreactions was evaluated for three Pt/Re/CeO2-based powder catalysts, with Pt/Re ratio equal to 1/1,1/2 ad 2/1 and total loading ≈ 1 wt%. The catalysts were prepared by sequential dry impregnation ofcommercial ceria, with the salts precursors of rhenium and platinum; the activity tests were carriedout by feeding a reacting mixture with a variable CO/H2O ratio, equal to 7/14, 7/20 and 7/24, and thekinetic parameters were determined. The model which better described the experimental resultsinvolves the water–gas shift (WGS) reaction and CO as well as CO2 methanation. The preliminarytests showed that the catalyst with the Pt/Re ratio equal to 2/1 had the best performance, and this wasselected for further investigations. In the second part of the work, a structured catalyst, obtained bycoating a commercial aluminum alloy foam with the chosen catalytic formulation, was prepared andtested in different reaction conditions. The results demonstrated that a single stage water–gas shiftprocess is achievable, obtaining a hydrogen production rate of 18.7 mmol/min at 685 K, at τ = 53 ms,by feeding a simulated reformate gas mixture (37.61 vol% H2, 9.31 vol% CO2, 9.31 vol% CO, 42.19 vol%H2O, 1.37 vol% CH4).
Keywords: hydrogen; water–gas shift; process intensification; structured catalysts; kinetics;aluminum alloy foam; ceria; platinum; rhenium
1. Introduction
The water–gas shift (WGS) reaction [1] is an exothermic reaction, whose process is generallyperformed through two adiabatic stages, at high (HTS) [2] and low temperatures (LTS) [3]. WGS can beconsidered as the first syngas purification step to obtain high purity hydrogen, and in fact, it allows forthe reduction of the CO percentage and increase of the hydrogen yield in the reformate gas stream [4].The two-stages process configuration allows us to achieve higher conversions at relatively smallervolumes. The reactors suffer limitations, however, due to the heat of the reaction developed during theprocess, which induces a temperature gradient on the catalytic bed. The low temperature at the inlet ofthe bed disfavors the kinetics, while the high temperature at the outlet of the bed thermodynamicallylimits the conversion. In previous work, the intensification of the WGS reaction through the use ofhighly thermal conductive structured catalysts has been proposed [5], laying the foundations for therealization of a single stage process [6]. In fact, the use of such a structure [7] assures a redistribution
Catalysts 2020, 10, 564; doi:10.3390/catal10050564 www.mdpi.com/journal/catalysts

Catalysts 2020, 10, 564 2 of 16
of the heat of the reaction along the catalytic bed, with benefits in terms of CO conversion [8],while minimizing hot-spot occurrence [9]. Moreover, comparative studies have showed that the shapeof the selected structure plays a crucial role in determining the performance of a catalyst. In thiscontext, the use of foam structures guarantees an enhanced axial and radial heat dispersion and masstransfer [10]. Concerning the catalytic formulation, the conventionally used catalysts, both in HTS andLTS processes, are not suitable for the single stage process design, since the latter are readily deactivatedat high temperatures and are pyrophoric [11], while the former are not active at low temperatures andpresent waste toxicity problems [12]. A valuable alternative consists in noble metal-based catalysts [13],supported on reducible oxides such as titania or ceria [14], which are highly active in a wide range oftemperatures [15,16]. Among the investigated noble metals, platinum has showed the best compromisebetween catalytic activity, ease of preparation and stability [17]; moreover, it was reported that rheniumdoping enhances the activity of platinum-based catalysts for WGS reactions [18]. Some specific studieshave been published on the role of rhenium in these catalytic systems [19], however, the mechanismshave not yet been fully clarified [20]; CO chemisorption measurements have highlighted the betterplatinum dispersion [21] upon rhenium addition, thus achieving the enhancement in the WGS rate andcatalyst stability [22]. Transmission electron microscopy (TEM) and X-ray photoelectron spectroscopy(XPS) studies showed the formation of bimetallic surface clusters between rhenium and platinum;in addition, the stabilization of formate species and the acceleration of the H2 formation rate wereattributed to the presence of rhenium [23]. Azzam et al. studied the Pt–Re/TiO2 catalytic system andspeculated that rhenium remains as oxide, providing an additional redox WGS reaction pathway,in which ReOx is reduced by carbon monoxide generating carbon dioxide and oxidized by H2Oto give hydrogen [24]. Del Villar et al. studied a more complex catalytic system (RePt/CeO2–TiO2
catalyst) for the WGS reaction under conditions compatible with a membrane reactor [25]. The authorsascribed the enhanced WGS activity and stability to the improvement in the reduction behavior ofhighly dispersed CeO2 and ReOx species, as well as to the close contact between Pt and Re species,which could introduce further redox activity sites and prevent the Pt sintering.
In a process intensification view, the deposition of highly active catalytic formulations on properstructured catalysts was shown to be an effective option for minimizing the typical mass and heattransfer issues of packed bed reactors. In this regard, in our previous papers, we demonstratedthat the employment of aluminum open cells foams as structured carrier paddles in the directionof HTWGS-LTWGS integration in a single unit. In fact, due to the high thermal conductivity of theselected material, the heat was redistributed along the catalyst from the outlet to the inlet section witha flatter thermal profile and a global increase of CO conversion [5,7,10].
In the first part of this work, a preliminary study on the use of PtRe/CeO2-based powder catalystswas reported; the activity of three catalysts with a different Pt/Re ratio (Pt/Re ratio equal to 1/1, 1/2or 2/1) and total loading of 1 wt% was compared in WGS reaction and a kinetic investigation wasperformed for the three samples. The kinetic parameters were determined based on the results ofthree dedicated reaction tests carried out at different H2O/CO ratio (H2O/CO ratio equal to 24/7, 20/7or 14/7). In the second part of the work a structured catalyst was prepared by coating an open cellaluminum alloy foam with cerium oxide and loading the resulting structure with the active speciesin the ratio which gave the best performance in the preliminary study (Pt/Re = 2/1). The structuredcatalyst performance was evaluated by feeding the reacting mixture, previously used for the powdercatalysts, with a H2O/CO ratio equal to 24/7 in order to evaluate the effect of the scale up from powderto structured catalyst, in terms of activity. Moreover, the as-obtained structured catalyst was alsotested under a simulated reformate gas stream as feed, aiming to evaluate the possibility to realizea single stage water–gas shift reactor, which is highly desirable for the realization of a compact fuelprocessing system.
Catalysts 2020, 10, 564 3 of 16
2. Results and Discussion
2.1. Powder Catalysts
2.1.1. Characterization Results
Powder catalysts were characterized by means of a series of analytical techniques: energydispersive X-ray fluorescence (ED-XRF) was used to check the effective metals loading and the effectivePt/Re ratio; X-ray diffraction (XRD) was used to evaluate the crystallite size; Raman spectroscopy(Raman) was used to provide the structural features; transmission electron microscopy (TEM) wasused to evaluate the particle size and shape; the temperature programmed reduction with hydrogen(H2-TPR) to evaluate the reducibility of the catalysts.
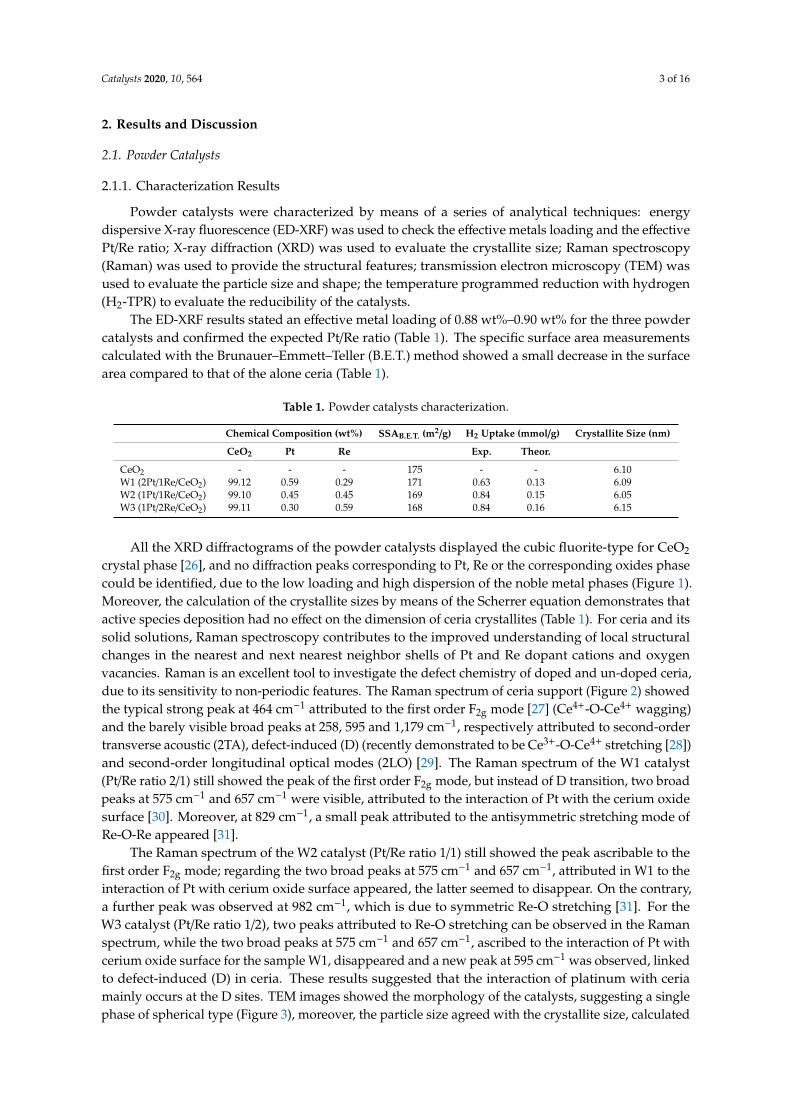
The ED-XRF results stated an effective metal loading of 0.88 wt%–0.90 wt% for the three powdercatalysts and confirmed the expected Pt/Re ratio (Table 1). The specific surface area measurementscalculated with the Brunauer–Emmett–Teller (B.E.T.) method showed a small decrease in the surfacearea compared to that of the alone ceria (Table 1).
Table 1. Powder catalysts characterization.
Chemical Composition (wt%) SSAB.E.T. (m2/g) H2 Uptake (mmol/g) Crystallite Size (nm)
CeO2 Pt Re Exp. Theor.
CeO2 - - - 175 - - 6.10W1 (2Pt/1Re/CeO2) 99.12 0.59 0.29 171 0.63 0.13 6.09W2 (1Pt/1Re/CeO2) 99.10 0.45 0.45 169 0.84 0.15 6.05W3 (1Pt/2Re/CeO2) 99.11 0.30 0.59 168 0.84 0.16 6.15
All the XRD diffractograms of the powder catalysts displayed the cubic fluorite-type for CeO2
crystal phase [26], and no diffraction peaks corresponding to Pt, Re or the corresponding oxides phasecould be identified, due to the low loading and high dispersion of the noble metal phases (Figure 1).Moreover, the calculation of the crystallite sizes by means of the Scherrer equation demonstrates thatactive species deposition had no effect on the dimension of ceria crystallites (Table 1). For ceria and itssolid solutions, Raman spectroscopy contributes to the improved understanding of local structuralchanges in the nearest and next nearest neighbor shells of Pt and Re dopant cations and oxygenvacancies. Raman is an excellent tool to investigate the defect chemistry of doped and un-doped ceria,due to its sensitivity to non-periodic features. The Raman spectrum of ceria support (Figure 2) showedthe typical strong peak at 464 cm−1 attributed to the first order F2g mode [27] (Ce4+-O-Ce4+ wagging)and the barely visible broad peaks at 258, 595 and 1,179 cm−1, respectively attributed to second-ordertransverse acoustic (2TA), defect-induced (D) (recently demonstrated to be Ce3+-O-Ce4+ stretching [28])and second-order longitudinal optical modes (2LO) [29]. The Raman spectrum of the W1 catalyst(Pt/Re ratio 2/1) still showed the peak of the first order F2g mode, but instead of D transition, two broadpeaks at 575 cm−1 and 657 cm−1 were visible, attributed to the interaction of Pt with the cerium oxidesurface [30]. Moreover, at 829 cm−1, a small peak attributed to the antisymmetric stretching mode ofRe-O-Re appeared [31].
The Raman spectrum of the W2 catalyst (Pt/Re ratio 1/1) still showed the peak ascribable to thefirst order F2g mode; regarding the two broad peaks at 575 cm−1 and 657 cm−1, attributed in W1 to theinteraction of Pt with cerium oxide surface appeared, the latter seemed to disappear. On the contrary,a further peak was observed at 982 cm−1, which is due to symmetric Re-O stretching [31]. For theW3 catalyst (Pt/Re ratio 1/2), two peaks attributed to Re-O stretching can be observed in the Ramanspectrum, while the two broad peaks at 575 cm−1 and 657 cm−1, ascribed to the interaction of Pt withcerium oxide surface for the sample W1, disappeared and a new peak at 595 cm−1 was observed, linkedto defect-induced (D) in ceria. These results suggested that the interaction of platinum with ceriamainly occurs at the D sites. TEM images showed the morphology of the catalysts, suggesting a singlephase of spherical type (Figure 3), moreover, the particle size agreed with the crystallite size, calculated

Catalysts 2020, 10, 564 4 of 16
by the Scherrer equation. However, the black area may represent groups of accumulated particles.The temperature programmed reduction (TPR) profiles of the three catalysts can be divided in twomain areas. The broad peak between 700 K and 750 K was attributed to ceria’s surface reduction [32](Figure 4). The peaks between 500 K and 600 K are ascribable to an overlapping of three reductionpeaks of PtOx and ReOx species and the ceria surface, as the result of the spillover effect from metalparticles to the support [33].Catalysts 2020, 10, x FOR PEER REVIEW 4 of 17
Figure 1. Diffractograms of powder catalysts: W1, W2 and W3.
Figure 2. Raman spectra of ceria and powder catalysts: W1, W2 and W3.
The Raman spectrum of the W2 catalyst (Pt/Re ratio 1/1) still showed the peak ascribable to the first order F2g mode; regarding the two broad peaks at 575 cm−1 and 657 cm−1, attributed in W1 to the interaction of Pt with cerium oxide surface appeared, the latter seemed to disappear. On the contrary, a further peak was observed at 982 cm−1, which is due to symmetric Re-O stretching [31]. For the W3 catalyst (Pt/Re ratio 1/2), two peaks attributed to Re-O stretching can be observed in the Raman spectrum, while the two broad peaks at 575 cm−1 and 657 cm−1, ascribed to the interaction of Pt with cerium oxide surface for the sample W1, disappeared and a new peak at 595 cm−1 was observed, linked to defect-induced (D) in ceria. These results suggested that the interaction of platinum with ceria mainly occurs at the D sites. TEM images showed the morphology of the catalysts, suggesting a single phase of spherical type (Figure 3), moreover, the particle size agreed with the crystallite size, calculated by the Scherrer equation. However, the black area may represent groups of accumulated particles. The temperature programmed reduction (TPR) profiles of the three catalysts can be divided in two main areas. The broad peak between 700 K and 750 K was attributed to ceria’s surface reduction [32] (Figure 4). The peaks between 500 K and 600 K are ascribable to an
Figure 1. Diffractograms of powder catalysts: W1, W2 and W3.
Catalysts 2020, 10, x FOR PEER REVIEW 4 of 17
Figure 1. Diffractograms of powder catalysts: W1, W2 and W3.
Figure 2. Raman spectra of ceria and powder catalysts: W1, W2 and W3.
The Raman spectrum of the W2 catalyst (Pt/Re ratio 1/1) still showed the peak ascribable to the first order F2g mode; regarding the two broad peaks at 575 cm−1 and 657 cm−1, attributed in W1 to the interaction of Pt with cerium oxide surface appeared, the latter seemed to disappear. On the contrary, a further peak was observed at 982 cm−1, which is due to symmetric Re-O stretching [31]. For the W3 catalyst (Pt/Re ratio 1/2), two peaks attributed to Re-O stretching can be observed in the Raman spectrum, while the two broad peaks at 575 cm−1 and 657 cm−1, ascribed to the interaction of Pt with cerium oxide surface for the sample W1, disappeared and a new peak at 595 cm−1 was observed, linked to defect-induced (D) in ceria. These results suggested that the interaction of platinum with ceria mainly occurs at the D sites. TEM images showed the morphology of the catalysts, suggesting a single phase of spherical type (Figure 3), moreover, the particle size agreed with the crystallite size, calculated by the Scherrer equation. However, the black area may represent groups of accumulated particles. The temperature programmed reduction (TPR) profiles of the three catalysts can be divided in two main areas. The broad peak between 700 K and 750 K was attributed to ceria’s surface reduction [32] (Figure 4). The peaks between 500 K and 600 K are ascribable to an
Figure 2. Raman spectra of ceria and powder catalysts: W1, W2 and W3.
Specifically, the TPR profile of W1 catalyst showed a perfect overlapping, with the peak centeredat 550 K, while in the case of W2 and W3 TPR profiles, the main peak shifted respectively to 593 K and608 K, and a shoulder on the left appeared in both the curves, centered between 505 k and 510 K.
These results suggest a correlation between the temperature of the main reduction peak andthe Pt/Re ratio, suggesting a strong interaction between platinum and rhenium. The evaluation ofhydrogen uptake, calculated by integrating the H2-TPR profiles, as expected, confirmed the advent ofthe spillover phenomenon; in fact, the hydrogen consumed in each experiment was more than oneorder of magnitude higher compared to the expected value (Table 1).

Catalysts 2020, 10, 564 5 of 16
Catalysts 2020, 10, x FOR PEER REVIEW 5 of 17
overlapping of three reduction peaks of PtOx and ReOx species and the ceria surface, as the result of the spillover effect from metal particles to the support [33].
Figure 3. Transmission electron microscopy (TEM) images of powder catalysts: W1, W2 and W3. Figure 3. Transmission electron microscopy (TEM) images of powder catalysts: W1, W2 and W3.

Catalysts 2020, 10, 564 6 of 16
Catalysts 2020, 10, x FOR PEER REVIEW 6 of 17
Specifically, the TPR profile of W1 catalyst showed a perfect overlapping, with the peak centered at 550 K, while in the case of W2 and W3 TPR profiles, the main peak shifted respectively to 593 K and 608 K, and a shoulder on the left appeared in both the curves, centered between 505 k and 510 K.
Figure 4. Temperature programmed reduction with hydrogen (H2-TPR) of powder the catalysts: W1, W2 and W3.
These results suggest a correlation between the temperature of the main reduction peak and the Pt/Re ratio, suggesting a strong interaction between platinum and rhenium. The evaluation of hydrogen uptake, calculated by integrating the H2-TPR profiles, as expected, confirmed the advent of the spillover phenomenon; in fact, the hydrogen consumed in each experiment was more than one order of magnitude higher compared to the expected value (Table 1).
2.1.2. Activity Tests
Figure 5a–c shows the catalytic activity of the three investigated catalysts towards the WGS reaction between 500 and 600 K as a function of the steam to carbon monoxide ratio. In Figure 5d the results obtained at the same H2O/CO ratio (24/7) are compared.
Figure 4. Temperature programmed reduction with hydrogen (H2-TPR) of powder the catalysts: W1,W2 and W3.
2.1.2. Activity Tests
Figure 5a–c shows the catalytic activity of the three investigated catalysts towards the WGSreaction between 500 and 600 K as a function of the steam to carbon monoxide ratio. In Figure 5d theresults obtained at the same H2O/CO ratio (24/7) are compared.
Catalysts 2020, 10, x FOR PEER REVIEW 6 of 17
Specifically, the TPR profile of W1 catalyst showed a perfect overlapping, with the peak centered at 550 K, while in the case of W2 and W3 TPR profiles, the main peak shifted respectively to 593 K and 608 K, and a shoulder on the left appeared in both the curves, centered between 505 k and 510 K.
Figure 4. Temperature programmed reduction with hydrogen (H2-TPR) of powder the catalysts: W1, W2 and W3.
These results suggest a correlation between the temperature of the main reduction peak and the Pt/Re ratio, suggesting a strong interaction between platinum and rhenium. The evaluation of hydrogen uptake, calculated by integrating the H2-TPR profiles, as expected, confirmed the advent of the spillover phenomenon; in fact, the hydrogen consumed in each experiment was more than one order of magnitude higher compared to the expected value (Table 1).
2.1.2. Activity Tests
Figure 5a–c shows the catalytic activity of the three investigated catalysts towards the WGS reaction between 500 and 600 K as a function of the steam to carbon monoxide ratio. In Figure 5d the results obtained at the same H2O/CO ratio (24/7) are compared.
Figure 5. CO conversion as function of temperature for different H2O/CO ratio (24/7, 20/7, 14/7) foreach powder catalyst: W1 (a), W2 (b) and W3 (c), and CO conversion comparison as function of thetemperature at the same H2O/CO ratio (24/7) for the three catalysts (d). τ = 131 ms.
As expected, the increase in the H2O/CO ratio favored the WGS reaction for all the three catalysts.In particular, for the W1 sample, the variation of the H2O/CO ratio from 20/7 to 24/7 resulted in a morepronounced improvement of the catalytic activity, with the profiles achieved for H2O/CO=20/7 and14/7 closer. For the other two catalysts, by changing the feeding conditions, such a strong enhancementin CO conversion was not observed. Moreover, at a fixed H2O/CO ratio of 24/7, the W1 catalystshowed higher CO conversion than the W2 and W3 catalysts, which essentially displayed similaractivity. For example, at 565 K, the W1 reached a conversion of almost 80%, while for the othertwo samples a value around 50% was recorded. These results demonstrated that the catalyst witha Pt/Re ratio equal to 2/1 is more active than the catalysts with the Pt/Re ratio equal to 1/1 and 1/2.
Catalysts 2020, 10, 564 7 of 16
This trend seems to suggest a direct correlation with the reduction temperature of the PtOx/ReOysystem in the H2-TPR experiments and thus with Pt/Re loading and the catalytic activity. The 2Pt/1Recatalyst, in fact, displayed lower reduction temperatures compared to the other two samples and thestrong correlation between the easy reducibility and the activity for WGS was already reported forCeO2-based catalysts [34]. The most active formulation was deposited on a foam structured carrierand further tested.
2.1.3. Kinetic Measurements
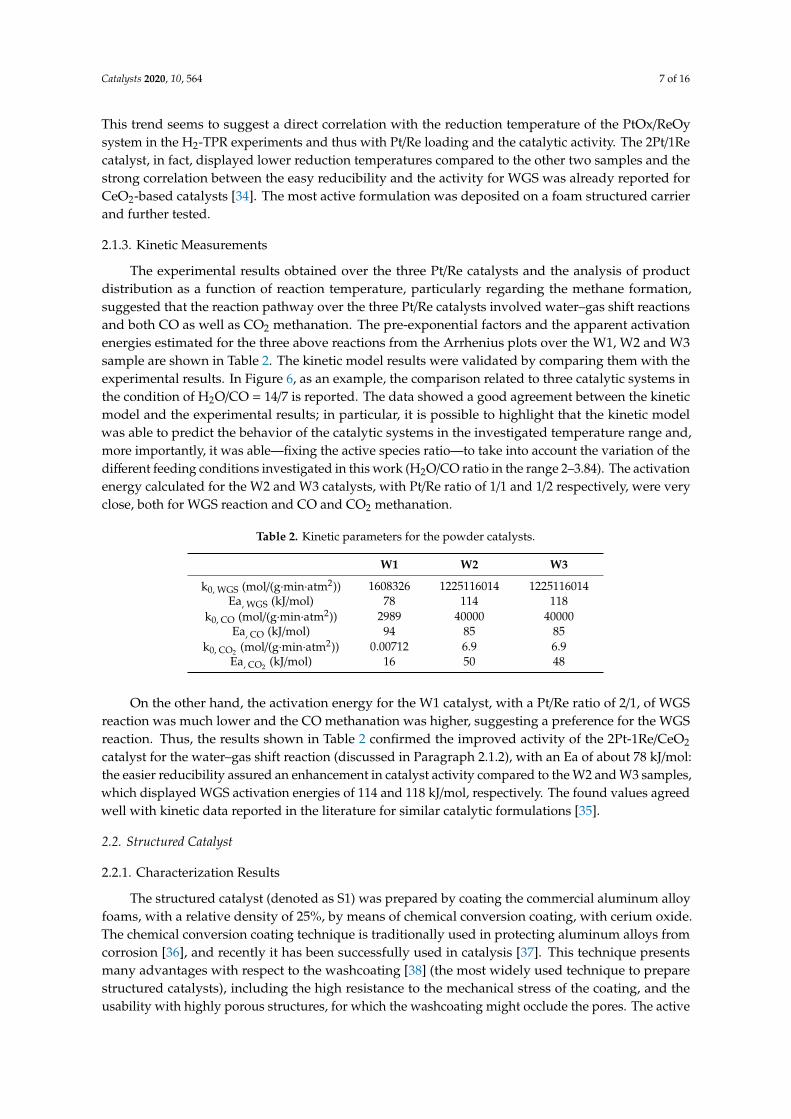
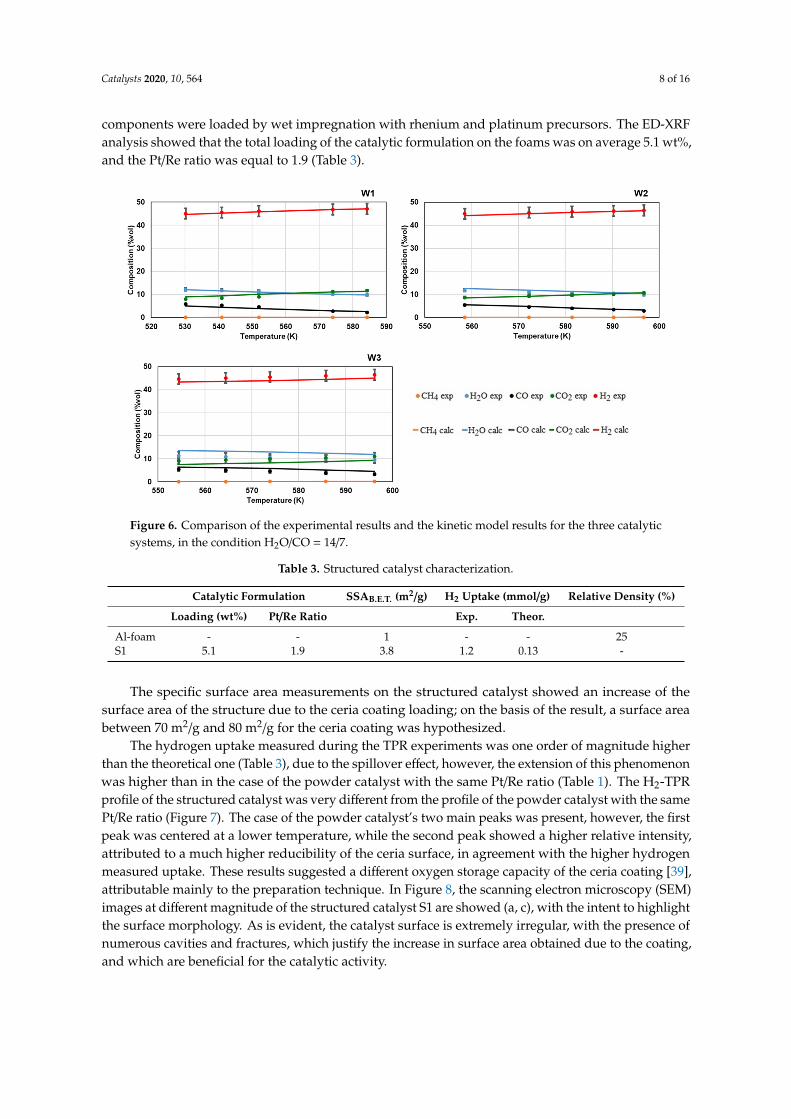
The experimental results obtained over the three Pt/Re catalysts and the analysis of productdistribution as a function of reaction temperature, particularly regarding the methane formation,suggested that the reaction pathway over the three Pt/Re catalysts involved water–gas shift reactionsand both CO as well as CO2 methanation. The pre-exponential factors and the apparent activationenergies estimated for the three above reactions from the Arrhenius plots over the W1, W2 and W3sample are shown in Table 2. The kinetic model results were validated by comparing them with theexperimental results. In Figure 6, as an example, the comparison related to three catalytic systems inthe condition of H2O/CO = 14/7 is reported. The data showed a good agreement between the kineticmodel and the experimental results; in particular, it is possible to highlight that the kinetic modelwas able to predict the behavior of the catalytic systems in the investigated temperature range and,more importantly, it was able—fixing the active species ratio—to take into account the variation of thedifferent feeding conditions investigated in this work (H2O/CO ratio in the range 2–3.84). The activationenergy calculated for the W2 and W3 catalysts, with Pt/Re ratio of 1/1 and 1/2 respectively, were veryclose, both for WGS reaction and CO and CO2 methanation.
Table 2. Kinetic parameters for the powder catalysts.
W1 W2 W3
k0, WGS (mol/(g·min·atm2)) 1608326 1225116014 1225116014Ea, WGS (kJ/mol) 78 114 118
k0, CO (mol/(g·min·atm2)) 2989 40000 40000Ea, CO (kJ/mol) 94 85 85
k0, CO2 (mol/(g·min·atm2)) 0.00712 6.9 6.9Ea, CO2 (kJ/mol) 16 50 48
On the other hand, the activation energy for the W1 catalyst, with a Pt/Re ratio of 2/1, of WGSreaction was much lower and the CO methanation was higher, suggesting a preference for the WGSreaction. Thus, the results shown in Table 2 confirmed the improved activity of the 2Pt-1Re/CeO2
catalyst for the water–gas shift reaction (discussed in Paragraph 2.1.2), with an Ea of about 78 kJ/mol:the easier reducibility assured an enhancement in catalyst activity compared to the W2 and W3 samples,which displayed WGS activation energies of 114 and 118 kJ/mol, respectively. The found values agreedwell with kinetic data reported in the literature for similar catalytic formulations [35].
2.2. Structured Catalyst
2.2.1. Characterization Results
The structured catalyst (denoted as S1) was prepared by coating the commercial aluminum alloyfoams, with a relative density of 25%, by means of chemical conversion coating, with cerium oxide.The chemical conversion coating technique is traditionally used in protecting aluminum alloys fromcorrosion [36], and recently it has been successfully used in catalysis [37]. This technique presentsmany advantages with respect to the washcoating [38] (the most widely used technique to preparestructured catalysts), including the high resistance to the mechanical stress of the coating, and theusability with highly porous structures, for which the washcoating might occlude the pores. The active
Catalysts 2020, 10, 564 8 of 16
components were loaded by wet impregnation with rhenium and platinum precursors. The ED-XRFanalysis showed that the total loading of the catalytic formulation on the foams was on average 5.1 wt%,and the Pt/Re ratio was equal to 1.9 (Table 3).
Catalysts 2020, 10, x FOR PEER REVIEW 8 of 17
samples, which displayed WGS activation energies of 114 and 118 kJ/mol, respectively. The found values agreed well with kinetic data reported in the literature for similar catalytic formulations [35].
Figure 6. Comparison of the experimental results and the kinetic model results for the three catalytic systems, in the condition H2O/CO = 14/7.
2.2. Structured Catalyst
2.2.1. Characterization Results
The structured catalyst (denoted as S1) was prepared by coating the commercial aluminum alloy foams, with a relative density of 25%, by means of chemical conversion coating, with cerium oxide. The chemical conversion coating technique is traditionally used in protecting aluminum alloys from corrosion [36], and recently it has been successfully used in catalysis [37]. This technique presents many advantages with respect to the washcoating [38] (the most widely used technique to prepare structured catalysts), including the high resistance to the mechanical stress of the coating, and the usability with highly porous structures, for which the washcoating might occlude the pores. The active components were loaded by wet impregnation with rhenium and platinum precursors. The ED-XRF analysis showed that the total loading of the catalytic formulation on the foams was on average 5.1 wt%, and the Pt/Re ratio was equal to 1.9 (Table 3).
Table 3. Structured catalyst characterization.
Catalytic formulation SSAB.E.T. (m2/g) H2 Uptake
(mmol/g)
Relative density
(%)
Loading
(wt%) Pt/Re ratio Exp. Theor.
Al-foam - - 1 - - 25
S1 5.1 1.9 3.8 1.2 0.13 -
The specific surface area measurements on the structured catalyst showed an increase of the surface area of the structure due to the ceria coating loading; on the basis of the result, a surface area between 70 m2/g and 80 m2/g for the ceria coating was hypothesized.
Figure 6. Comparison of the experimental results and the kinetic model results for the three catalyticsystems, in the condition H2O/CO = 14/7.
Table 3. Structured catalyst characterization.
Catalytic Formulation SSAB.E.T. (m2/g) H2 Uptake (mmol/g) Relative Density (%)
Loading (wt%) Pt/Re Ratio Exp. Theor.
Al-foam - - 1 - - 25S1 5.1 1.9 3.8 1.2 0.13 -
The specific surface area measurements on the structured catalyst showed an increase of thesurface area of the structure due to the ceria coating loading; on the basis of the result, a surface areabetween 70 m2/g and 80 m2/g for the ceria coating was hypothesized.
The hydrogen uptake measured during the TPR experiments was one order of magnitude higherthan the theoretical one (Table 3), due to the spillover effect, however, the extension of this phenomenonwas higher than in the case of the powder catalyst with the same Pt/Re ratio (Table 1). The H2-TPRprofile of the structured catalyst was very different from the profile of the powder catalyst with the samePt/Re ratio (Figure 7). The case of the powder catalyst’s two main peaks was present, however, the firstpeak was centered at a lower temperature, while the second peak showed a higher relative intensity,attributed to a much higher reducibility of the ceria surface, in agreement with the higher hydrogenmeasured uptake. These results suggested a different oxygen storage capacity of the ceria coating [39],attributable mainly to the preparation technique. In Figure 8, the scanning electron microscopy (SEM)images at different magnitude of the structured catalyst S1 are showed (a, c), with the intent to highlightthe surface morphology. As is evident, the catalyst surface is extremely irregular, with the presence ofnumerous cavities and fractures, which justify the increase in surface area obtained due to the coating,and which are beneficial for the catalytic activity.

Catalysts 2020, 10, 564 9 of 16
Catalysts 2020, 10, x FOR PEER REVIEW 9 of 17
The hydrogen uptake measured during the TPR experiments was one order of magnitude higher than the theoretical one (Table 3), due to the spillover effect, however, the extension of this phenomenon was higher than in the case of the powder catalyst with the same Pt/Re ratio (Table 1). The H2-TPR profile of the structured catalyst was very different from the profile of the powder catalyst with the same Pt/Re ratio (Figure 7). The case of the powder catalyst’s two main peaks was present, however, the first peak was centered at a lower temperature, while the second peak showed a higher relative intensity, attributed to a much higher reducibility of the ceria surface, in agreement with the higher hydrogen measured uptake. These results suggested a different oxygen storage capacity of the ceria coating [39], attributable mainly to the preparation technique. In Figure 8, the scanning electron microscopy (SEM) images at different magnitude of the structured catalyst S1 are showed (a, c), with the intent to highlight the surface morphology. As is evident, the catalyst surface is extremely irregular, with the presence of numerous cavities and fractures, which justify the increase in surface area obtained due to the coating, and which are beneficial for the catalytic activity.
Figure 7. H2-TPR of the structured catalyst. Figure 7. H2-TPR of the structured catalyst.Catalysts 2020, 10, x FOR PEER REVIEW 10 of 17
Figure 8. SEM (scanning electron microscopy) image of S1 structured catalyst at different magnitude (a,c), and a SEM image of a structured catalyst obtained by washcoating and loaded with Pt/Re/CeZrO4 catalytic formulation (b).
Figure 8. SEM (scanning electron microscopy) image of S1 structured catalyst at different magnitude(a,c), and a SEM image of a structured catalyst obtained by washcoating and loaded with Pt/Re/CeZrO4
catalytic formulation (b).

Catalysts 2020, 10, 564 10 of 16
Moreover, the nanometric nature of the coating is highlighted if compared with the SEM image ofa structured catalyst obtained by washcoating (Figure 8b), prepared in previous work, with a similarcatalytic formulation (1Pt/1Re/CeZrO4) [8].
2.2.2. Kinetic Measurements
The results of the kinetic study performed on the structured catalysts are summarized in Table 4in terms of pre-exponential factor and activation energy.
Table 4. Kinetic parameters for the structured catalyst.
k0 (mol/(g·min·atm2)) Ea (kJ/mol)
rWGS 1608326 80rCO 2500 85rCO2 1000 75
The kinetic model results were validated by comparing them with the experimental results.In Figure 9, the comparison related to the structured catalyst in the condition of H2O/CO = 24/7is reported.
Catalysts 2020, 10, x FOR PEER REVIEW 11 of 17
Moreover, the nanometric nature of the coating is highlighted if compared with the SEM image of a structured catalyst obtained by washcoating (Figure 8b), prepared in previous work, with a similar catalytic formulation (1Pt/1Re/CeZrO4) [8].
2.2.2. Kinetic Measurements
The results of the kinetic study performed on the structured catalysts are summarized in Table 4 in terms of pre-exponential factor and activation energy.
Table 4. Kinetic parameters for the structured catalyst.
k0 (mol/(g·min·atm2)) Ea (kJ/mol)
rWGS 1608326 80
rCO 2500 85
rCO2 1000 75
The kinetic model results were validated by comparing them with the experimental results. In Figure 9, the comparison related to the structured catalyst in the condition of H2O/CO = 24/7 is reported.
Figure 9. Comparison of the experimental results and the kinetic model results for the structured catalyst, in the condition H2O/CO = 24/7, at two different contact times, 23 ms (a) and 131 ms (b).
The data shown in Figure 9 evidence a good agreement between the predicted values and the experimental results, thus demonstrating the feasibility of the kinetic model. The comparison of the kinetic parameters related to the structured (Table 4) and powder catalyst W1 (Table 2) evidenced that the two catalytic systems were characterized by very similar values of the pre-exponential factor and activation energy for WGS, but they had different values regarding the methanation parameters. This result suggested that the two catalytic systems were different, due to the preparation technique, as was also confirmed by the TPR results. However, it is worthwhile noting that, as described above for the powder sample, the activation energy of the WGS is lower than the methanation ones, therefore evidencing a preference for the WGS reaction.
2.2.3. Activity Tests
The activity tests on the structured catalyst were carried out with the aim of testing the feasibility of a single stage WGS process, evaluating the performance for intermediate temperatures with a simulated syngas mixture feeding at a target contact time. In Figure 10a, the CO conversion as a function of the temperature, at three different contact times (τ = 23, 79 and 131 ms) and for a H2O/CO ratio = 24/7, is shown. The test carried out at 131 ms showed comparable activity with respect to the corresponding powder catalyst, the test were performed at 23 ms, although under a
Figure 9. Comparison of the experimental results and the kinetic model results for the structuredcatalyst, in the condition H2O/CO = 24/7, at two different contact times, 23 ms (a) and 131 ms (b).
The data shown in Figure 9 evidence a good agreement between the predicted values and theexperimental results, thus demonstrating the feasibility of the kinetic model. The comparison of thekinetic parameters related to the structured (Table 4) and powder catalyst W1 (Table 2) evidencedthat the two catalytic systems were characterized by very similar values of the pre-exponential factorand activation energy for WGS, but they had different values regarding the methanation parameters.This result suggested that the two catalytic systems were different, due to the preparation technique,as was also confirmed by the TPR results. However, it is worthwhile noting that, as described abovefor the powder sample, the activation energy of the WGS is lower than the methanation ones, thereforeevidencing a preference for the WGS reaction.
2.2.3. Activity Tests
The activity tests on the structured catalyst were carried out with the aim of testing the feasibilityof a single stage WGS process, evaluating the performance for intermediate temperatures with asimulated syngas mixture feeding at a target contact time. In Figure 10a, the CO conversion as afunction of the temperature, at three different contact times (τ = 23, 79 and 131 ms) and for a H2O/COratio = 24/7, is shown. The test carried out at 131 ms showed comparable activity with respect to thecorresponding powder catalyst, the test were performed at 23 ms, although under a space velocity of

Catalysts 2020, 10, 564 11 of 16
more than five times higher compared to the value selected for the powder sample, showed satisfactoryresults, with a CO conversion of almost 60% at 635 K (Figure 10a).
Catalysts 2020, 10, x FOR PEER REVIEW 12 of 17
space velocity of more than five times higher compared to the value selected for the powder sample, showed satisfactory results, with a CO conversion of almost 60% at 635 K (Figure 10a).
Figure 10. CO conversion as function of temperature (a) and comparison between hydrogen formation rate experimental vs. calculated values (b) for S1 catalyst with a H2O/CO = 24/7, at a τ = 23 ms.
The experimental hydrogen formation rate was also evaluated, highlighting once again a good agreement with the values predicted by the model (Figure 10b). The structured catalyst was also tested under a simulated reformate gas mixture coming from an ethanol pre-reformer followed by a methane reforming unit [40]. The catalyst activity was investigated in the temperature range 540–690 K and the results, showed in Figure 11, are presented in terms of CO conversion (a) and product gas distribution as a function of outlet reaction temperature (b). CO conversion linearly increased up to 610 K, showing a decreasing trend above 630 K; due to the negative effect of high temperatures on WGS thermodynamics. Only slight variations in methane concentration with reaction temperature were observed, suggesting that carbon oxide methanation was not the dominant pathway under the investigated conditions. A hydrogen production rate of 18.7 mmol/min was recorded at 685 K and this value (properly scaled on the basis of the different feeding flow-rates) was compared with the results of the simulations performed. The hydrogen productivity recorded over the structured catalyst is only 14% lower than the value reported, and this difference is mainly ascribable to the employment of a membrane in the WGS reactor in the reference process scheme. These very promising results allow us to conclude that the S1 structured catalyst is a suitable sample for the realization of a single-stage WGS process.
Figure 11. CO conversion (a) and product gas distribution as a function of reaction temperature (b) for S1 catalyst under a simulated reformate gas (37.61 vol% H2, 9.31 vol% CO2, 9.31 vol% CO, 42.19 vol% H2O, 1.37 vol% CH4), τ = 53 ms.
3. Materials and Methods
3.1. Powder Catalysts Preparation
The powder catalysts were prepared by sequential dry impregnation of Actalys HSA commercial ceria, with the rhenium and platinum precursors respectively, with a total loading of
Figure 10. CO conversion as function of temperature (a) and comparison between hydrogen formationrate experimental vs. calculated values (b) for S1 catalyst with a H2O/CO = 24/7, at a τ = 23 ms.
The experimental hydrogen formation rate was also evaluated, highlighting once again a goodagreement with the values predicted by the model (Figure 10b). The structured catalyst was alsotested under a simulated reformate gas mixture coming from an ethanol pre-reformer followed by amethane reforming unit [40]. The catalyst activity was investigated in the temperature range 540–690 Kand the results, showed in Figure 11, are presented in terms of CO conversion (a) and product gasdistribution as a function of outlet reaction temperature (b). CO conversion linearly increased up to610 K, showing a decreasing trend above 630 K; due to the negative effect of high temperatures onWGS thermodynamics. Only slight variations in methane concentration with reaction temperaturewere observed, suggesting that carbon oxide methanation was not the dominant pathway under theinvestigated conditions. A hydrogen production rate of 18.7 mmol/min was recorded at 685 K and thisvalue (properly scaled on the basis of the different feeding flow-rates) was compared with the resultsof the simulations performed. The hydrogen productivity recorded over the structured catalyst is only14% lower than the value reported, and this difference is mainly ascribable to the employment of amembrane in the WGS reactor in the reference process scheme. These very promising results allowus to conclude that the S1 structured catalyst is a suitable sample for the realization of a single-stageWGS process.
Catalysts 2020, 10, x FOR PEER REVIEW 12 of 17
space velocity of more than five times higher compared to the value selected for the powder sample, showed satisfactory results, with a CO conversion of almost 60% at 635 K (Figure 10a).
Figure 10. CO conversion as function of temperature (a) and comparison between hydrogen formation rate experimental vs. calculated values (b) for S1 catalyst with a H2O/CO = 24/7, at a τ = 23 ms.
The experimental hydrogen formation rate was also evaluated, highlighting once again a good agreement with the values predicted by the model (Figure 10b). The structured catalyst was also tested under a simulated reformate gas mixture coming from an ethanol pre-reformer followed by a methane reforming unit [40]. The catalyst activity was investigated in the temperature range 540–690 K and the results, showed in Figure 11, are presented in terms of CO conversion (a) and product gas distribution as a function of outlet reaction temperature (b). CO conversion linearly increased up to 610 K, showing a decreasing trend above 630 K; due to the negative effect of high temperatures on WGS thermodynamics. Only slight variations in methane concentration with reaction temperature were observed, suggesting that carbon oxide methanation was not the dominant pathway under the investigated conditions. A hydrogen production rate of 18.7 mmol/min was recorded at 685 K and this value (properly scaled on the basis of the different feeding flow-rates) was compared with the results of the simulations performed. The hydrogen productivity recorded over the structured catalyst is only 14% lower than the value reported, and this difference is mainly ascribable to the employment of a membrane in the WGS reactor in the reference process scheme. These very promising results allow us to conclude that the S1 structured catalyst is a suitable sample for the realization of a single-stage WGS process.
Figure 11. CO conversion (a) and product gas distribution as a function of reaction temperature (b) for S1 catalyst under a simulated reformate gas (37.61 vol% H2, 9.31 vol% CO2, 9.31 vol% CO, 42.19 vol% H2O, 1.37 vol% CH4), τ = 53 ms.
3. Materials and Methods
3.1. Powder Catalysts Preparation
The powder catalysts were prepared by sequential dry impregnation of Actalys HSA commercial ceria, with the rhenium and platinum precursors respectively, with a total loading of
Figure 11. CO conversion (a) and product gas distribution as a function of reaction temperature (b) forS1 catalyst under a simulated reformate gas (37.61 vol% H2, 9.31 vol% CO2, 9.31 vol% CO, 42.19 vol%H2O, 1.37 vol% CH4), τ = 53 ms.
3. Materials and Methods
3.1. Powder Catalysts Preparation
The powder catalysts were prepared by sequential dry impregnation of Actalys HSA commercialceria, with the rhenium and platinum precursors respectively, with a total loading of platinum andrhenium equal to 1 wt% with respect to the total weight of the catalyst. Three catalysts with a variable

Catalysts 2020, 10, 564 12 of 16
platinum/rhenium ratio of 2/1, 1/1 and 1/2 were prepared. The porous volume of the ceria was measuredby mixing 5 g of support with the minimum amount of distilled water needed, then the support wasdried at 393 K for 2 h and impregnated with an ammonium perrhenate solution, obtained by dissolvingthe desired amount of the rhenium salt in a volume of water corresponding to the porous volume ofthe ceria. The obtained mixture was dried at a temperature of 343 K for 16 h and calcined at 773 K for1 h. The resulting solid was treated as previously described, in order to evaluate its porous volume,then dried at 393 K for 2 h and impregnated with a solution of tetraamineplatinum (II) nitrate, obtainedby dissolving the desired amount of the platinum salt in a volume of water corresponding to theporous volume previously measured. The obtained mixture was dried at a temperature of 343 K for16 h and calcined at 773 K for 1 h.
3.2. Structured Catalyst Preparation
The structure was obtained by assembly 7 circular open cell aluminum alloy foams with a diameterof 1.4 cm, obtained by cutting and shaping 1 cm thick commercial sheet. The as obtained foams werecleaned and corroded by treating with 5 vol% HF solution for 4 min, then washed with distilledwater and dried at 393 K for 2 h. The ceria coating was realized by means of chemical conversioncoating described in a previous article [41]. The corroded foams were degreased with a 5 wt% solutionof NaOH for one minute, washed with distilled water, then etched in a 35 vol% solution of HNO3,washed with distilled water, then treated with a chemical bath to coating the surface with ceria support.The coating bath consisted of an acidic solution (pH = 2, by HCl) obtained by dissolving CeCl3*7H2O(1.3 wt%), 35% wt H2O2 (3.8 wt%) in distilled water. The foams were treated with this solution for 2 hat 328 K; the treatment was repeated three times. After each treatment, the reacted foams were washedwith distilled water and dried for 2 h at 393 K. After the third treatment the foams were calcined at773 K for 1 h. Rhenium and platinum were loaded by wet impregnation of the coated structures,by immersing in the metal salt precursor solution at 328 K for 20 min, followed by drying at 393 K for2 h and calcining at 773 K for 1 h.
3.3. Catalysts Characterization
The catalysts were characterized with a series of physical–chemical analytical techniques. The B.E.T.specific surface areas measurements were carried out with a Costech Sorptometer 1040 (CostechInternational, Milano, Italy), by dynamic N2 adsorption at 77 K. The crystal phases were obtainedby X-ray powder diffraction (Rigaku MiniFlex 600). The crystallite sizes were calculated from thediffractograms by applying the Scherrer equation. The chemical composition was checked by means ofan ARLTM QUANT’X ED-XRF spectrometer (Thermo Scientific, Rodano, Italy), while the structuralfeatures were evaluated with a Raman spectroscopy using an inVia Raman Microscope (Renishaw,Pianezza, Italy), equipped with a 514 nm Ar ion laser operating at 25 mW. TEM images were obtainedwith a FEI Tecnai 20 (Sphera) microscopy operating at 200 kV LaB6 filament. Samples morphologywas observed by a Field Emission Scanning Electron Microscope (FE-SEM, mod. LEO 1525, Carl ZeissSMT AG, Oberkochen, Germany). The H2-TPR experiments were carried out in the temperature rangeof 293–723 K, with a reducing stream of 500 Ncc/min containing 5 vol% of H2 in Ar, applying a heatingrate of 10 K/min, in the same reactor used for the activity tests, as described below.
3.4. Catalytic Activity Tests
The powder catalysts were previously compacted and sieved in the 180–355 µm range anddiluted with quartz glass at the same total volume. The activity tests were carried out on the reducedcatalysts, at atmospheric pressure, in the temperature range 500-620 K, at a contact time τc = 131 ms,with a reacting mixture 43 vol% H2, 7 vol% CO2, 7 vol% CO, X vol% H2O (X = 14, 20 or 24), balanceArgon. The structured catalyst was surrounded by a thermo expanding pad with a thickness of3 mm, and previously reduced in the H2-TPR experiments. The activity tests were carried out atatmospheric pressure, in the temperature range 500–620 K, at a contact time range τc = 23–131 ms,
Catalysts 2020, 10, 564 13 of 16
with two different reacting mixture, the first was 43 vol% H2, 7 vol% CO2, 7 vol% CO, 24 vol% H2O,19 vol% Argon, the second was 37.61 vol% H2, 9.31 vol% CO2, 9.31 vol% CO, 42.19 vol% H2O, 1.37 vol%CH4. The catalytic activity tests were performed in a stainless-steel tubular reactor with an internaldiameter of 22 mm and a length of 40 cm. The reaction products were dried through a refrigeratorJulabo F12 (JULABO Labortechnik GmbH77960 Seelbach, Germany)and sent to a Hiden Analyticalmass spectrometer (Hiden Analytical, 420 Europa Blvd, Westbrook, Warrington WA5 7 UN, UK).
3.5. Kinetic Measurements
The kinetic evaluation was performed by numerically analyzing the results of dedicatedexperimental tests, carried out at atmospheric pressure using mixtures of CO, CO2, H2, H2O, and Ar.The tests were performed as described in the previous paragraph, by varying the H2O/CO ratio ina wide temperature range. In particular, the data regarding the catalytic performance of the systemfar from the thermodynamic equilibrium conditions were considered, so that differential reactionconditions could be assumed, with negligible heat and mass transfer effects. The approach describedbelow was followed both for the powder and for the structured catalysts, even if for the structuredcatalyst only the operating condition corresponding to the H2O/CO ratio =24/7 (the condition in whichthe powder catalyst showed the best catalytic performance) was analyzed.
The reactions used for the numeric analysis are:
• The WGS reaction: CO + H2O = CO2 + H2
• The CO methanation: CO + 3H2 = CH4 + H2O• The CO2 methanation: CO2 + 4H2 = CH4 + 2H2O
The reaction rates of the above reported reactions were expressed as follows, considering that(i) for the WGS reaction the keq was calculated using the expression proposed by Moe [42], and (ii) forthe two methanation reactions a kinetic expression based on a Langmuir–Hinshelwood approachwas used:
• −rCO = kWGS
(PCOPH2O −
PCO2 PH2keq,WGS
)with keq,WGS = e
4577.8T −4.33
• −rCO = kCOPCOPH2
(1+KCOPCO+KH2OPH2O)2
• −rCO2 = kCO2
PCO2 PH2
(1+KCO2 PCO2+KCOPCO+KH2OPH2O)2
In the above reported expressions, the terms have the following meaning:
- Pi is the partial pressure of the component “i”.
- ki (T) is the reaction rate constant according to the Arrhenius law: ki = k0,ie−EA,iRT , with k0,i =
pre-exponential factor and EA,i = the activation energy.- Kj (T) are the adsorption constants for the component “j”, expressed according to the Arrhenius
law [41]: K j = K0, je−HA, jRT , with K0,j = pre-exponential factor and ∆HA,j = the adsorption heat.
The material balances on the single components allowed obtaining a set of equations, resolvedby applying the Eulero method by means of the Excel software. For each operating condition,the experimental results were compared with the one from the kinetic model, and the Solver of the Excel
software allowed the minimization of the function f = min(∑n
c=1
(xexpc − xmodc
)2). The optimization
procedure was performed several times with various initial values of the parameters, with the aim toconfirm the robustness of the optimization scheme.
4. Conclusions
In this work, a comparative study on Pt/Re/CeO2 powder catalysts, for CO water-gas shift reaction,has been presented. The activity of three catalysts, obtained by sequential dry impregnation of

Catalysts 2020, 10, 564 14 of 16
commercial ceria with the salts precursors of rhenium and platinum, has been evaluated in water–gasshift reaction, as function of the temperature, of the Pt/Re ratio and of the feeding conditions (H2O/COratio). The kinetic parameters have been calculated by means of numerical analysis, considering thewater–gas reaction and CO and CO2 methanation reactions. The results of the activity tests showedthe best performance of catalyst with Pt/Re ratio equal to 2/1, which was related to the reductiontemperature of the PtOx/ReOy system, observed in the H2-TPR experiments. This catalyst showedlower reduction temperatures compared to the catalysts with Pt/Re ratio equal to 1/1 and 1/2. In thesecond part of the work a structured catalyst, loaded with the 2Pt/1Re/CeO2 catalytic formulation,has been prepared, by coating with ceria a commercial alumina alloy foam by means of chemicalconversion coating technique. The SEM images highlighted the nanometric structure and the highrough of the coating. The catalytic activity tests and the kinetic evaluation have been showed a goodscale up of the performance from the powder to the structured catalyst. Moreover, the catalytic activityof the structured catalyst has been evaluated in simulated reformate gas feeding conditions, showingthat is possible to design a single-stage WGS process, with the prepared structured catalyst.
Author Contributions: Conceptualization, V.P. and M.M.; methodology, V.P., P.P., C.R., E.M. and M.M.;investigation, V.P., F.G., P.P., C.R., E.M. and M.M.; data curation, C.R., E.M. and M.M.; writing—originaldraft preparation, C.R., E.M. and M.M.; writing—review and editing, V.P., F.G., P.P., C.R., E.M. and M.M.;supervision, V.P.; funding acquisition, V.P., F.G., P.P. All authors have read and agreed to the published version ofthe manuscript.
Funding: This work has received funding from the European Union’s Horizon 2020 research and innovationprogramme under the Marie Skłodowska-Curie grant agreement No 734561.
Acknowledgments: The authors wish to acknowledge Mariarosa Scognamiglio (Department of IndustrialEngineering, University of Salerno) for SEM analysis, and Ing. Giovanni Festa for the valuable contribution.
Conflicts of Interest: The authors declare no conflict of interest.
References
1. Palma, V.; Ruocco, C.; Cortese, M.; Martino, M. Recent Advances in Structured Catalysts Preparation andUse in Water-Gas Shift Reaction. Catalysts 2019, 9, 991. [CrossRef]
2. Lee, D.-W.; Lee, M.S.; Lee, J.Y.; Kim, S.; Eom, H.-J.; Moon, D.J.; Lee, K.-Y. The review of Cr-free Fe-basedcatalysts for high-temperature water-gas shift reactions. Catal. Today 2013, 210, 2–9. [CrossRef]
3. Uchida, H.; Isogai, N.; Oba, M.; Hasegawa, T. The zinc oxide copper catalyst for carbon monoxide-shiftconversion. I. The dependency of the catalytic activity on the chemical composition of the catalyst. Bull. Chem.Soc. Jpn. 1967, 40, 1981–1986. [CrossRef]
4. Cifuentes, B.; Bustamante, F.; Cobo, M. Single and Dual Metal Oxides as Promising Supports for CarbonMonoxide Removal from an Actual Syngas: The Crucial Role of Support on the Selectivity of the Au–CuSystem. Catalysts 2019, 9, 852. [CrossRef]
5. Palma, V.; Pisano, D.; Martino, M. CFD modeling of the influence of carrier thermal conductivity forstructured catalysts in the WGS reaction. Chem. Eng. Sci. 2018, 178, 1–11. [CrossRef]
6. Van Dijk, H.A.J.; Boon, J.; Nyqvist, R.N.; Van Den Brink, R.W. Development of a single stage heat integratedwater-gas shift reactor for fuel processing. Chem. Eng. J. 2010, 159, 182–189. [CrossRef]
7. Palma, V.; Pisano, D.; Martino, M.; Ricca, A.; Ciambelli, P. High Thermal Conductivity Structured Carriersfor Catalytic Processes Intensification. Chem. Eng. Trans. 2015, 43, 2047–2052. [CrossRef]
8. Palma, V.; Pisano, D.; Martino, M. Structured noble metal-based catalysts for the WGS process intensification.Int. J. Hydrog. Energy 2018, 43, 11745–11754. [CrossRef]
9. Stiegler, T.; Meltzer, K.; Tremel, A.; Baldauf, M.; Wasserscheid, P.; Albert, J. Development of a StructuredReactor System for CO2 Methanation under Dynamic Operating Conditions. Energy Technol. 2019, 7, 1900047.[CrossRef]
10. Palma, V.; Pisano, D.; Martino, M. Comparative Study Between Aluminum Monolith and Foam as Carriersfor The Intensification of The CO Water Gas Shift Process. Catalysts 2018, 8, 489. [CrossRef]
Catalysts 2020, 10, 564 15 of 16
11. Kam, R.; Scott, J.; Amal, R.; Selomulya, C. Pyrophoricity and stability of copper and platinum basedwater-gas shift catalysts during oxidative shut-down/start-up operation. Chem. Eng. Sci. 2010, 65, 6461–6467.[CrossRef]
12. Zhu, M.; Wachs, I.E. Iron-Based Catalysts for the High-Temperature Water-Gas Shift (HTWGS) Reaction:A Review. ACS Catal. 2016, 6, 722–732. [CrossRef]
13. Ruettinger, W.; Ilinich, O.; Farrauto, R.J. A new generation of water gas shift catalysts for fuel cell applications.J. Power Sources 2003, 118, 61–65. [CrossRef]
14. Panagiotopoulou, P.; Kondarides, D.I. Effect of the nature of the support on the catalytic performance ofnoble metal catalysts for the water–gas shift reaction. Catal. Today 2008, 112, 49–52. [CrossRef]
15. de León, J.N.D.; Loera-Serna, S.; Zepeda, T.A.; Domínguez, D.; Pawelec, B.; Venezia, A.M.; Fuentes-Moyado, S.Noble metals supported on binary γ-Al2O3-α-Ga2O3 oxide as potential low temperature water-gas shiftcatalysts. Fuel 2020, 266, 117031. [CrossRef]
16. Chein, R.Y.; Lin, Y.H.; Chen, Y.C.; Chyou, Y.P.; Chung, J.N. Study on water-gas shift reaction performanceusing Pt-based catalysts at high temperatures. Int. J. Hydrog. Energy 2014, 39, 18854–18862. [CrossRef]
17. Castaño, M.G.; Reina, T.R.; Ivanova, S.; Centeno, M.A.; Odriozola, J.A. Pt vs. Au in water–gas shift reaction.J. Catal. 2014, 314, 1–9. [CrossRef]
18. Palma, V.; Martino, M. Pt-Re Based Catalysts for the Realization of a Single Stage Water Gas Shift Process.Chem. Eng. Trans. 2017, 57, 1657–1662. [CrossRef]
19. Sato, Y.; Terada, K.; Hasegawa, S.; Miyao, T.; Naito, S. Mechanistic study of water–gas-shift reaction overTiO2 supported Pt–Re and Pd–Re catalysts. Appl. Cat. A-Gen. 2005, 296, 80–89. [CrossRef]
20. Carrasquillo-Flores, R.; Gallo, J.M.R.; Hahn, K.; Dumesic, J.A.; Mavrikakis, M. Density Functional Theoryand Reaction Kinetics Studies of the Water–Gas Shift Reaction on Pt–Re Catalysts. ChemCatChem 2013, 5,3690–3699. [CrossRef]
21. Iida, H.; Igarashi, A. Structure characterization of Pt-Re/TiO2 (rutile) and Pt-Re/ZrO2 catalysts for water gasshift reaction at low-temperature. Appl. Cat. A-Gen. 2006, 303, 192–198. [CrossRef]
22. Choung, S.Y.; Ferrandon, M.; Krause, T. Pt-Re bimetallic supported on CeO2-ZrO2 mixed oxides as water–gasshift catalysts. Catal. Today 2005, 99, 257–262. [CrossRef]
23. Sato, Y.; Terada, K.; Soma, Y.; Miyao, T.; Naito, S. Marked addition effect of Re upon the water gas shiftreaction over TiO2 supported Pt, Pd and Ir catalysts. Catal. Commun. 2006, 7, 91–95. [CrossRef]
24. Azzam, K.G.; Babich, I.V.; Seshan, K.; Lefferts, L. Role of Re in Pt–Re/TiO2 catalyst for water gas shift reaction:A mechanistic and kinetic study. Appl. Cat. B-Environ. 2008, 80, 129–140. [CrossRef]
25. del Villar, V.; Barrio, L.; Helmi, A.; Van Sint Annaland, M.; Gallucci, F.; Fierro, J.L.G.; Navarro, R.M. Effect ofRe addition on the WGS activity and stability of Pt/CeO2–TiO2 catalyst for membrane reactor applications.Catal. Today 2016, 268, 95–102. [CrossRef]
26. Palma, V.; Ruocco, C.; Meloni, E.; Ricca, A. Renewable Hydrogen from Ethanol Reforming over CeO2-SiO2
Based Catalysts. Catalysts 2017, 7, 226. [CrossRef]27. Cooper, A.; Davies, T.E.; Morgan, D.J.; Golunski, S.; Taylor, S.H. Influence of the Preparation Method of
Ag-K/CeO2-ZrO2-Al2O3 Catalysts on Their Structure and Activity for the Simultaneous Removal of Sootand NOx. Catalysts 2020, 10, 294. [CrossRef]
28. Xu, Y.; Wang, F.; Liu, X.; Liu, Y.; Luo, M.; Teng, B.; Fan, M.; Liu, X. Resolving a Decade-Long Question ofOxygen Defects in Raman Spectra of Ceria-Based Catalysts at Atomic Level. J. Phys. Chem. C 2019, 123,18889–18894. [CrossRef]
29. Wu, Z.; Li, M.; Howe, J.; Mayer III, H.M.; Overbury, S.H. Probing Defect Sites on CeO2 Nanocrystals withWell-Defined Surface Planes by Raman Spectroscopy and O2 Adsorption. Langmuir 2010, 26, 16595–16606.[CrossRef]
30. Brogan, M.S.; Dines, T.J.; Cairns, J.A. Raman spectroscopic study of the Pt-CeO2 interaction in thePt/Al2O3-CeO2 catalyst. J. Chem. Soc. Faraday Trans. 1994, 90, 1461–1466. [CrossRef]
31. Hardcastle, F.D.; Wachs, I.E.; Horsley, J.A.; Via, G.H. The structure of surface rhenium oxide on aluminafrom laser raman spectroscopy and x-ray absorption near-edge spectroscopy. J. Mol. Catal. 1988, 46, 15–36.[CrossRef]
32. Rocchini, E.; Trovarelli, A.; Llorca, J.; Graham, G.W.; Weber, W.H.; Maciejewski, M.; Baiker, A. Relationshipsbetween Structural/Morphological Modifications and Oxygen Storage–Redox Behavior of Silica-Doped Ceria.J. Catal. 2000, 194, 461–478. [CrossRef]

Catalysts 2020, 10, 564 16 of 16
33. Prins, R. Hydrogen spillover. Facts and fiction. Chem. Rev. 2012, 112, 2714–2738. [CrossRef]34. Jeong, D.-W.; Potdar, H.S.; Shim, J.-O.; Jang, W.-J.; Roh, H.-S. H2 production from a single stage water-gas shift
reaction over Pt/CeO2, Pt/ZrO2, and Pt/Ce(1-x)Zr(x)O2 catalysts. Int. J. Hydrog. Energy 2013, 38, 4502–4507.[CrossRef]
35. Radhakrishnan, R.; Willigan, R.R.; Dardas, Z.; Vanderspurt, T.H. Water gas shift activity and kinetics of Pt/Recatalysts supported on ceria-zirconia oxides. Appl. Cat. B-Environ. 2006, 66, 23–28. [CrossRef]
36. Dabalà, M.; Armelao, L.; Buchberger, A.; Calliari, I. Cerium-based conversion layers on aluminum alloys.Appl. Surf. Sci. 2001, 172, 312–322. [CrossRef]
37. Palma, V.; Goodall, R.; Thompson, A.; Ruocco, C.; Renda, S.; Leach, R.; Martino, M. Ceria-coated ReplicatedAluminium Sponges as Catalysts for the CO-Water Gas Shift Process. Int J. Hydrog. Energy 2020, in press.[CrossRef]
38. Cristiani, C.; Visconti, C.G.; Finocchio, E.; Gallo Stampino, P.; Forzatti, P. Towards the rationalization of thewashcoating process conditions. Catal. Today 2009, 147, S24–S29. [CrossRef]
39. Lia, P.; Chen, X.; Li, Y.; Schwank, J.W. A review on oxygen storage capacity of CeO2-based materials: Influencefactors, measurement techniques, and applications in reactions related to catalytic automotive emissionscontrol. Catal. Today 2019, 327, 90–115. [CrossRef]
40. Mosca, L.; Medrano Jimenez, J.A.; Assefa Wassie, S.; Gallucci, F.; Palo, E.; Colozzi, M.; Taraschi, S.; Galdieri, G.Process design for green hydrogen production. Int. J. Hydrog. Energy 2020, 45, 7266–7277. [CrossRef]
41. Palma, V.; Martino, M.; Truda, L. Nano-CeO2 Coating on Aluminum Foam Carriers for Structured CatalystsPreparation. Chem. Eng. Trans. 2019, 73, 127–132. [CrossRef]
42. Ratnasamy, C.; Wagner, J. Water Gas Shift Catalysis. Catal. Rev.-Sci. Eng. 2009, 51, 325–440. [CrossRef]
© 2020 by the authors. Licensee MDPI, Basel, Switzerland. This article is an open accessarticle distributed under the terms and conditions of the Creative Commons Attribution(CC BY) license (http://creativecommons.org/licenses/by/4.0/).