
Ni supported high surface area CeO2–ZrO2 catalysts for hydrogen production from ethanol steam...
12
Ni supported high surface area CeO 2 –ZrO 2 catalysts for hydrogen production from ethanol steam reforming Mohamed A. Ebiad,* Dalia R. Abd El-Hafiz, Radwa A. Elsalamony and Lamia. S. Mohamed Received 14th February 2012, Accepted 5th July 2012 DOI: 10.1039/c2ra20258a The catalytic activity of nano-sized x%Ni/Ce 0.74 Zr 0.26 O 2 (x = 0, 2, 10 and 20wt%) catalysts have been investigated to develop highly active catalysts for ethanol steam reforming (ESR) into hydrogen. The structure and surface properties of the catalysts were tested by XRD, TPR, HRTEM and BET surface areas. The effect of reaction temperature from 200 uC to 600 uC was studied in a flow system at atmospheric pressure with an ethanol/water molar ratio of 1 : 8. Selectivity was calculated for the catalytic products H 2 , CO, CO 2 and CH 4 , as well as the intermediates C 2 H 6 ,C 2 H 4 ,C 3 H 8 , CH 3 CHO and CH 3 COCH 3 , at different reaction temperatures. It was found that complete conversion of ethanol with considerable amounts of H 2 was obtained at 400 uC over all catalysts. H 2 was produced at a very low temperature (200 uC) over 10% and 20% Ni loadings, while a maximum H 2 selectivity (75%) is reached at 600 uC over the 2%Ni/Ce 0.74 Zr 0.26 O 2 catalyst; this is most likely due to the small nickel particle size (2–4 nm) in 2%Ni, which results in enhancement of the metal–support interactions. Thermal decomposition of ethanol in an ethanol/water mixture under the same reaction conditions, but in the absence of catalyst, was also studied. HRTEM of the spent catalyst (8 h ESR) shows the deposition of carbon in the form of carbon nanotubes (CNTs). 1. Introduction Hydrogen is a potentially very attractive source of energy since its combustion produces only water and energy. Molecular hydrogen is a clean burning fuel, can be stored as a liquid or gas, is distributed via pipelines, and has been described as a long term replacement for natural gas, so increased attention is focused on hydrogen production technologies. 1 Several catalytic processes for hydrogen production from ethanol have been investigated, including steam reforming (SR), partial oxidation, and auto- thermal reforming. 2 Ethanol is a promising future bio-fuel because of its relatively high hydrogen content (on a molar basis), non-toxicity, ease of storage and handling safety. Ethanol can be readily produced from renewable feedstocks such as sugar cane, municipal solid waste and agro-waste. Another advantage of using ethanol is that the CO 2 produced during ethanol steam reforming (ESR) is equal to the CO 2 required for biomass growth and thus provides a closed cycle for CO 2 consumption. Therefore, no net pollutants are released into the environment. Nickel-based catalysts are widely used in commercial reform- ing processes and are recognized as appropriate catalyst systems in SR for their low cost, relatively high activity towards C–C bond cleavage and hydrogenation/dehydrogenation reactions. 3 The study by Kugai et al. 4 has shown that ethanol is adsorbed on the surface of Rh and Ni metals as ethoxide species, which form an oxametallacycle intermediate and favors C–C bond rupture. Ni has a high activity for C–C bond and O–H bond breaking, and has high activity for hydrogenation, facilitating H atoms to form molecular H 2 . 5 Supports also play important roles in the SR of ethanol, as supports help in the dispersion of the metal catalyst and may enhance the metal catalyst activity via metal–support interac- tions. Supports may promote migration of OH groups toward the metal catalyst in the presence of water at high temperature, facilitating SRR. 6 In Ni-based catalysts, CeO 2 has been used as either an effective promoter or support because of its characteristic oxygen storage capacity (OSC), which allows it to store and release oxygen, leading to the presence of highly active oxygen for the oxidation of CO and hydrocarbons. This makes the catalyst more active in many carbon formation-related reactions of hydrocarbons, such as SR, dry reforming and oxidation. The specific role of CeO 2 in SR involves improving the dispersion of the active phase and enhances interaction with the supported metal. 7 During the reforming process, in addition to the reactions on Ni surface, the gas–solid reactions between the gaseous components presented in the system (C 2 H 6 ,C 3 H 8 ,C 2 H 4 , CH 4 , CO 2 , CO, H 2 O, and H 2 ) and the lattice oxygen (O x ) on the ceria surface also take place. The reactions of adsorbed surface hydrocarbons with the lattice oxygen (O x ) on the ceria surface (C n H m +O x A nCO + m/2(H 2 ) + CO x2n ) prevent the formation of carbon species on Ni surface from hydrocarbons decomposition Egyptian Petroleum Research Institute, Cairo, 11727, Egypt. E-mail: [email protected] RSC Advances Dynamic Article Links Cite this: RSC Advances, 2012, 2, 8145–8156 www.rsc.org/advances PAPER This journal is ß The Royal Society of Chemistry 2012 RSC Adv., 2012, 2, 8145–8156 | 8145
-
Upload
independent -
Category
Documents
-
view
1 -
download
0
Transcript of Ni supported high surface area CeO2–ZrO2 catalysts for hydrogen production from ethanol steam...
Ni supported high surface area CeO2–ZrO2 catalysts for hydrogen productionfrom ethanol steam reforming
Mohamed A. Ebiad,* Dalia R. Abd El-Hafiz, Radwa A. Elsalamony and Lamia. S. Mohamed
Received 14th February 2012, Accepted 5th July 2012
DOI: 10.1039/c2ra20258a
The catalytic activity of nano-sized x%Ni/Ce0.74Zr0.26O2 (x = 0, 2, 10 and 20wt%) catalysts have been
investigated to develop highly active catalysts for ethanol steam reforming (ESR) into hydrogen. The
structure and surface properties of the catalysts were tested by XRD, TPR, HRTEM and BET
surface areas. The effect of reaction temperature from 200 uC to 600 uC was studied in a flow system
at atmospheric pressure with an ethanol/water molar ratio of 1 : 8. Selectivity was calculated for the
catalytic products H2, CO, CO2 and CH4, as well as the intermediates C2H6, C2H4, C3H8, CH3CHO
and CH3COCH3, at different reaction temperatures. It was found that complete conversion of
ethanol with considerable amounts of H2 was obtained at 400 uC over all catalysts. H2 was produced
at a very low temperature (200 uC) over 10% and 20% Ni loadings, while a maximum H2 selectivity
(75%) is reached at 600 uC over the 2%Ni/Ce0.74Zr0.26O2 catalyst; this is most likely due to the small
nickel particle size (2–4 nm) in 2%Ni, which results in enhancement of the metal–support interactions.
Thermal decomposition of ethanol in an ethanol/water mixture under the same reaction conditions,
but in the absence of catalyst, was also studied. HRTEM of the spent catalyst (8 h ESR) shows the
deposition of carbon in the form of carbon nanotubes (CNTs).
1. Introduction
Hydrogen is a potentially very attractive source of energy since
its combustion produces only water and energy. Molecular
hydrogen is a clean burning fuel, can be stored as a liquid or gas,
is distributed via pipelines, and has been described as a long term
replacement for natural gas, so increased attention is focused on
hydrogen production technologies.1 Several catalytic processes
for hydrogen production from ethanol have been investigated,
including steam reforming (SR), partial oxidation, and auto-
thermal reforming.2
Ethanol is a promising future bio-fuel because of its relatively
high hydrogen content (on a molar basis), non-toxicity, ease of
storage and handling safety. Ethanol can be readily produced
from renewable feedstocks such as sugar cane, municipal solid
waste and agro-waste. Another advantage of using ethanol is
that the CO2 produced during ethanol steam reforming (ESR) is
equal to the CO2 required for biomass growth and thus provides
a closed cycle for CO2 consumption. Therefore, no net pollutants
are released into the environment.
Nickel-based catalysts are widely used in commercial reform-
ing processes and are recognized as appropriate catalyst systems
in SR for their low cost, relatively high activity towards C–C
bond cleavage and hydrogenation/dehydrogenation reactions.3
The study by Kugai et al. 4 has shown that ethanol is adsorbed
on the surface of Rh and Ni metals as ethoxide species, which
form an oxametallacycle intermediate and favors C–C bond
rupture. Ni has a high activity for C–C bond and O–H bond
breaking, and has high activity for hydrogenation, facilitating H
atoms to form molecular H2.5
Supports also play important roles in the SR of ethanol, as
supports help in the dispersion of the metal catalyst and may
enhance the metal catalyst activity via metal–support interac-
tions. Supports may promote migration of OH groups toward
the metal catalyst in the presence of water at high temperature,
facilitating SRR.6
In Ni-based catalysts, CeO2 has been used as either an
effective promoter or support because of its characteristic oxygen
storage capacity (OSC), which allows it to store and release
oxygen, leading to the presence of highly active oxygen for the
oxidation of CO and hydrocarbons. This makes the catalyst
more active in many carbon formation-related reactions of
hydrocarbons, such as SR, dry reforming and oxidation. The
specific role of CeO2 in SR involves improving the dispersion of
the active phase and enhances interaction with the supported
metal.7
During the reforming process, in addition to the reactions
on Ni surface, the gas–solid reactions between the gaseous
components presented in the system (C2H6, C3H8, C2H4, CH4,
CO2, CO, H2O, and H2) and the lattice oxygen (Ox) on the ceria
surface also take place. The reactions of adsorbed surface
hydrocarbons with the lattice oxygen (Ox) on the ceria surface
(CnHm + Ox A nCO + m/2(H2) + COx2n) prevent the formation of
carbon species on Ni surface from hydrocarbons decompositionEgyptian Petroleum Research Institute, Cairo, 11727, Egypt.E-mail: [email protected]
RSC Advances Dynamic Article Links
Cite this: RSC Advances, 2012, 2, 8145–8156
www.rsc.org/advances PAPER
This journal is � The Royal Society of Chemistry 2012 RSC Adv., 2012, 2, 8145–8156 | 8145
reaction (CnHm « nC + m/2H2). Moreover, the formation of
carbon via the Boudouard reaction (2CO « CO2 + C) is also
reduced by the gas–solid reaction of carbon monoxide (produced
from SR) with the lattice oxygen (CO + Ox « CO2 + Ox21).8
Ceria easily forms solid solutions with transition metals and
other rare-earth elements. It has been established that introduc-
tion of zirconium into the ceria lattice greatly enhances the
surface area, thermal stability and oxygen storage capacity,
resulting in superior catalytic properties. Hence, ceria–zirconia
solid solutions have been investigated with huge interest among
other ceria-based mixed oxides.9,10 Seog et al.11 have been
confirmed that Ni/Ce0.8Zr0.2O2 shows a higher BET surface area
than Ni/CeO2 and better thermal resistance than Ni/ZrO2
during the reduction process at 600 uC. Electron paramagnetic
resonance (EPR) spectroscopy has identified three types of
paramagnetic defects in CeO2–ZrO2 oxides,12 viz. electrons,
quasi-free or trapped in anion vacancies, O2 ions and O22
ions.13 These species arise by the following interactions:
Ce3+ + O2 A Ce4+(O22) (1)
Ni+ + O2 A Ni2+(O22) (2)
Ce4+ + O22 A Ce3+(O2) (3)
The oxygen storage capacity of CeO2–ZrO2 catalysts was
correlated to the concentration of the oxide ion species.13
Although it had been postulated that CeO2 promotes NiO
reduction, no experimental evidence had been reported in the
literature so far. The work of Srinivas et al.12 offers such a
support, part of the Ni+ ions subsequently react with aerial
oxygen and form Ni2+(O2?2) species, as described:
Ce4+ 2 O22 2 Zr4+ « Ce3+ 2 O2 2 Zr4+ (4)
Ce3+ + Ni2+ A Ce4+ + Ni+ (5)
Ni+surf + O2 A Ni(O2?2) (6)
Three types of Ni species in NiO/CeO2–ZrO2 samples were
observed by Srinivas et al.,12 (I) Ni substituted in the lattice
forming Ni(O2?2) ions, (II) nanosize crystallites of NiO forming
super paramagnetic metallic Ni and (III) larger particles of NiO
forming ferromagnetic Ni. The sample containing 1% Ni
contained species I and II, the sample containing 5% Ni con-
tained all three species; while samples containing 40% Ni
contained species I and III. The reducibility of these species
decreased in the order: I > III > II.
Jones et al.14 suggested the elementary steps of ethanol
decomposition in order to gain some insights into the reasons
behind the product distribution. In the decomposition pathway
of the ethoxy species Ni has a unique effect. It abstracts H from
the CH3-group making a stable oxametallacycle intermediate
(adsCH2–CH2–Oads). The stoichiometry of the reaction for
maximum hydrogen production is given by:
CH3CH2OH + 3H2O A 6H2 + 2CO2 (7)
Our study aimed at developing the amount of H2 produced
from ESR over x%Ni/Ce0.74Zr0.26O2 catalysts. This goal was
intended to firstly demonstrate the occurrence of ESR over the
used catalysts by performing the reaction in the absence of the
catalysts, i.e., thermal decomposition of ethanol. Secondly, to
study the effect of the support and different Ni loadings on
product distribution in the ESR reaction, and finally, to study
the distribution in the gas and liquid phases to clarify the
mechanism from intermediate distribution at different tempera-
tures.
2. Experimental
2.1. Catalyst preparation
The Ce12xZrxO2 mixed oxide supports were prepared by co-
precipitation with ammonia using an aqueous solution of cerium
nitrate (Ce(NO3)2?6H2O, 99% Fluka) and zirconium oxychloride
(ZrOCl2?8H2O, 98% Aldrish). The weight ratio of CeO2/ZrO2
was 4 which corresponds to an x of 0.26. Aqueous ammonia
solution (28–30%) was added dropwise to the aqueous solution
containing (0.1 M) Ce and (0.1 M) Zr salts with constant stirring
until the pH was 9–10. After precipitation, the obtained
hydroxide was filtered, washed thoroughly with deionized water
until chloride free (tested with silver nitrate Ag2NO3), and then
dried overnight at 120 uC. The obtained solid was calcined in air
at 600 uC for 5 h.
Ni loading was carried out by an incipient wetness impregna-
tion method using an aqueous solution of (Ni(NO3)2?6H2O 99%
Aldrich) dissolved in deionized water. Ni loadings were 0, 2, 10
and 20 wt%. After impregnation, the catalyst was dried
overnight at 120 uC and then calcined at 600 uC for 6 h.
2.2. Characterization methods
Thermal gravimetric analysis (TGA) was carried out using
SETARAM Labsys TG-DSC16 equipment in the temperature
range of room temperature up to 1000 uC under a nitrogen flow,
in order to follow the thermal stability of the prepared catalyst.
X-Ray diffraction analysis (XRD) was carried out by Shimadzu
XD-1 diffractometer using Cu-target and Ni-filtered radiation,
to trace the various changes in the crystalline structure and the
different phases accompanied preparation method. Sample
powders were packed in a glass holder, then measurements were
taken of the diffraction intensity by step scanning in a 2h range
between 5u and 70u. The phase identification was made by
comparison with the Joint Committee on Powder Diffraction
Standards (JCPDS). The average crystallite size of the samples
was determined from the XRD peaks using the Scherrer
equation.
High resolution transmission electron microscopy (HRTEM)
and energy dispersive X-ray (EDS) spectroscopy were conducted
using a JEOL 2100F TEM at an accelerating voltage of 200 kV.
To prepare the TEM samples, a dilute particle–ethanol colloidal
mixture was ultrasonicated for 30 min and a drop of solution was
placed on a carbon coated Cu TEM grid.
The textural properties were determined from the N2 adsorp-
tion–desorption isotherms measured at liquid nitrogen tempera-
ture (2196 uC) using a NOVA2000 gas sorption analyzer
(Quantachrome Corporation) system. All samples were degassed
at 200 uC for 17 h in a nitrogen atmosphere prior to adsorption
to ensure a dry clean surface. The adsorption isotherm was
8146 | RSC Adv., 2012, 2, 8145–8156 This journal is � The Royal Society of Chemistry 2012
constructed as the volume adsorbed (V cm3 g21) versus the
equilibrium relative pressure P/Po, where P is the equilibrium
pressure and Po is the saturated vapor pressure of nitrogen.
Total amount of acidity was estimated from weight loss
measurements of adsorbed pyridine using SETARAM Labsys
TG-DSC16 equipment. First, a platinum crucible containing
50 mg of the sample was placed in a shallow porcelain plate and
inserted into a glass reactor adapted to a tubular furnace. The
sample was dehydrated in dried N2 (100 ml min21) at 120 uC for
2 h, cooled to 70 uC, and then gaseous pyridine diluted in N2 was
allowed to pass through the sample for 1.5 h. The temperature
was held at 70 uC under N2 for 1 h to remove the physically
adsorbed pyridine. After that, the samples were analysed by
TGA.
Temperature programmed reduction (TPR) measurements were
carried out to investigate the redox properties (the ease of
reducibility of the metal oxide) over the resultant materials. The
experiments were performed in automatic equipment (ChemBET
3000, Quantachrome). Typically, 100 mg of the pre-calcined
sample was loaded into a quartz reactor and pretreated by
heating under an inert atmosphere (20 ml min21 nitrogen) at
200 uC for 3 h prior to running the TPR experiment, and was
then cooled to room temperature in N2. Then the sample was
submitted to a constant rate of heat treatment (10 uC min21 up
to 1000 uC) in a gas flow (80 ml min21) of the hydrogen/nitrogen
(5/95 vol%) mixture as a reducing gas. A thermal conductivity
detector (TCD) was employed to monitor the amount of
hydrogen consumption.
2.3. Catalytic activity
The experimental system used in this work is schematically
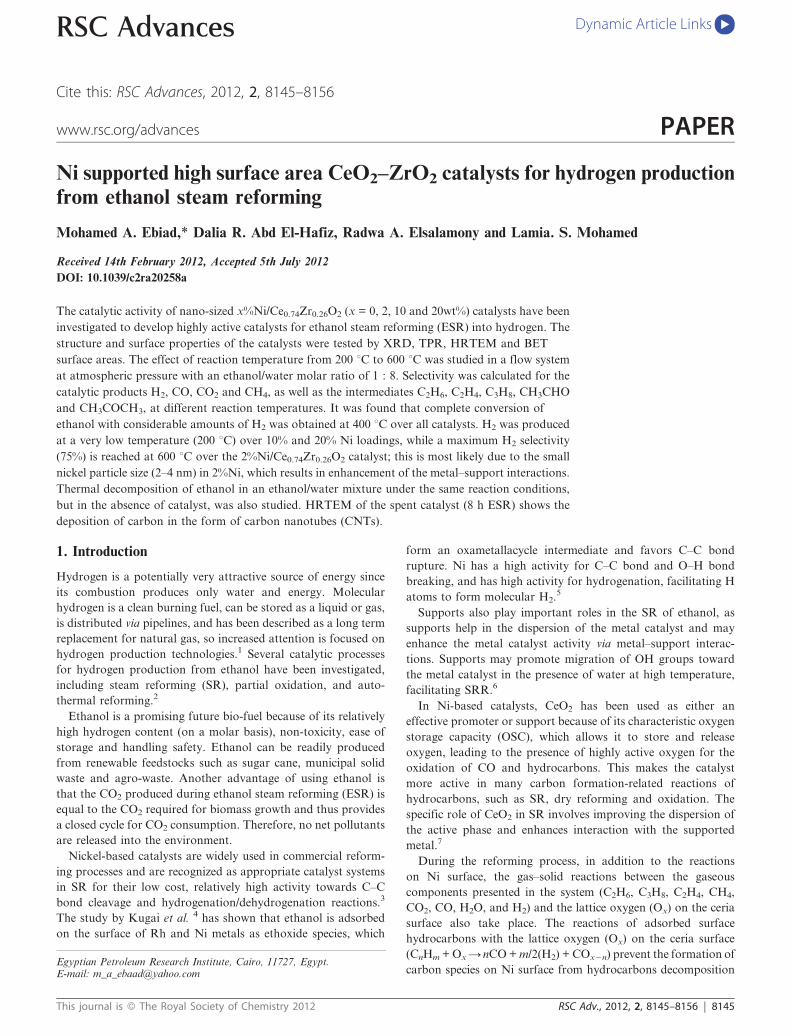
shown in Fig. 1. Experiments were performed at atmospheric
pressure in a continuous fixed-bed down flow vertical tubular
reactor consisting of a quartz tube, 300 mm in length and 10 mm
i.d. Another silica tube of 500 mm length and 14 mm i.d.
attached to the first one served as the outlet to facilitate fast
removal of the reactor effluent. The catalyst was placed on a
quartz wool bed inside the reactor. 2 g of catalyst diluted with
the same sized quartz particles was used for catalytic tests. Prior
to a run, the catalyst was reduced in situ at 600 uC for 2 h under a
hydrogen flow rate of 20 cm3 min21, where the catalyst showed
thermal stability up to 1000 uC (TGA, not shown). A water/
ethanol mixture (EtOH/H2O = 1 : 8 mol/mol) premixed in a
separate container was fed into the evaporator (at 150 uC) by a
pump (Model RP-G6; FMI, USA) with a flow rate of 0.2 ml
min21. Nitrogen gas was fed into the evaporator with a flow rate
40 cm3 min21 to uniformly carry the steam. This steam was then
fed into the reactor. The reaction temperature was varied from
200 uC to 600 uC. The thermal decomposition of ethanol was
studied under the same reaction conditions but in the absence of
catalyst.
The product stream was analyzed by the use of two gas
chromatographs (GC) (Agilent 6890 plus HP, Varian Natural
Gas Analyzer type C model CP-3800). The first one, equipped
with a molecular sieve 5 A capillary column (Molsive 5 A, 15 m
in length, 0.53 mm in internal diameter and 40 mm in film
thickness) and TCD with (He) as the carrier gas, was used for the
determination of H2. The first one was also used to analyze the
composition of condensed liquid products on the capillary
column (HP-30 50% phenyl/50% dimethyl polysiloxane, 30 meter
in length, 0.53 mm in internal diameter and 0.32 mm in film
thickness) using a flame ionization detector (FID) with N2 as the
carrier gas and isopropanol was used as the internal standard.
The second GC equipped with TCD and FID, three columns are
used to accomplish the single channel analysis of the gas. Firstly,
a molecular sieve column (4 ft in length, 1/8 inch in internal
diameter and Molsieve 13X with a 45/60 mesh size) for oxygen,
nitrogen, methane and carbon monoxide separation. Secondly, a
Hayesep P column (6 ft in length, 1/8 inch in internal diameter
and Hayesep P with an 80/100 mesh size) for separation of
methane, carbon dioxide, ethane. The two packed columns,
molecular sieve and Hayesep P, were attached with TCD. The
third capillary column (CPSil 5, 60 meter in length, 0.25 mm in
internal diameter and 1 mm in film thickness) used for separation
of methane, ethane, ethylene, acetaldehyde, ethanol, acetone,
was attached with FID. Helium gas was used as carrier gas with
constant pressure 20 psi, 23.5 psi and 13.4 psi for the CPSil 5,
Hayesep P and molecular sieve columns, respectively. The
quantitative analysis of the gas mixture is based on an external
standard, as the GC response is calibrated using a suite of
certified reference external standard gas samples with known
compositions and is used to calculate the response factor of each
component in the products. Selectivity values were calculated as
the molar percentage of products obtained, excluding water;
Selectivity of product = (mol of product/total mol of H2 and
carbon-containing products in the outlet) 6 100.
Fig. 1 Schematic diagram of experimental setup: (1) feeding tank
containing the water/ethanol mixture; (2) pump (Model RP-G6; FMI,
USA); (3) evaporator; (4) catalyst packed reactor; (5) cooler; (6) gas
collector; (7) liquid collector (8) hydrogen and nitrogen cylinder; and (9)
heating and temperature controller.
This journal is � The Royal Society of Chemistry 2012 RSC Adv., 2012, 2, 8145–8156 | 8147
3. Results and discussion
3.1. Catalyst characterization
3.1.1. X-Ray diffraction analysis. The X-ray diffraction pattern
of the CeO2–ZrO2 support, as well as the Ni/CeO2–ZrO2
catalysts calcined at 600 uC with various values of Ni loading
(2–20%), are represented in Fig. 2.
The XRD patterns of the CeO2–ZrO2 support (Fig. 2) showed
a number of peaks corresponding to 2h = 28.5, 33.3, 47.4 and
56.4, which are assigned to a typical cubic fluorite structure of
Ce0.74Zr0.26O2 [ref. JCPDS card (00-028-0271)]. No separate
phase due to CeO2 or ZrO2 was detected, which is ascribed to the
insertion of zirconium ions of a smaller radius (0.084 nm) into
the cubic lattice of CeO2 (0.097 nm) and the formation of a
homogenous Ce12xZxO2 solid solution (ss).15 This cubic phase
CeO2–ZrO2 has the maximum degree of structural defects and
oxygen storage capacity as reported by Kumar et al.16
The XRD patterns of the x%Ni/CeO2–ZrO2 catalysts impreg-
nated with different Ni loadings all showed peaks corresponding
to the cubic fluorite structure of the CeO2–ZrO2 solid solution.
No separate NiO phases were found by XRD for 2%Ni/CeO2–
ZrO2. The peak position of CeO2–ZrO2 was invariant with the
Ni content, and the peak width changed only marginally. At
higher Ni loadings (10 and 20% Ni), three new peaks at about
37u, 43u and 62u (2h) [ref. JCPDS card (00-001-1239)] indicating
a NiO phase were observed. The peak intensity was obviously
stronger with increasing Ni loading.
Table 1 summarizes the crystallite sizes and lattice parameters
of the prepared catalysts. The crystallite size of the support is in
the range 11.5–9.4 nm, which confirms that a nano-crystallite
size is achieved by the co-precipitation method. In addition, the
crystallite size of NiO in the (2%Ni) catalyst is too small to
measure, this indicates that the NiO species are finely dispersed
on the support beyond the XRD detection limit (,3 nm), this is
confirmed by the decrease in support lattice parameters, due to
the incorporation of Ni2+ with a small ionic radius of (0.072 nm)
into the support lattice.11,17 The dispersion and particle sizes
were not identified by XRD, therefore HRTEM was utilized
later (section 3.1.2) to discuss the presence and the size of NiO in
the 2%Ni/CeO2–ZrO2 catalyst. The size of the NiO crystallites
increased from 24.5 to 26.3 nm with increasing Ni content in the
samples (Table 1).
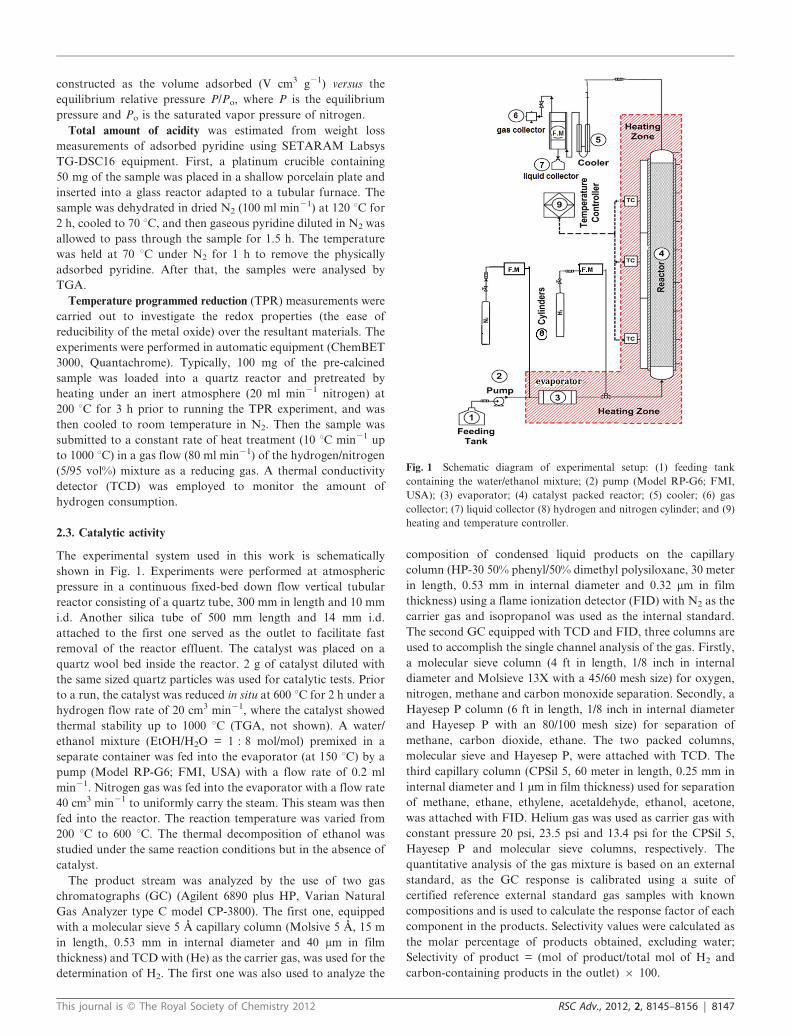
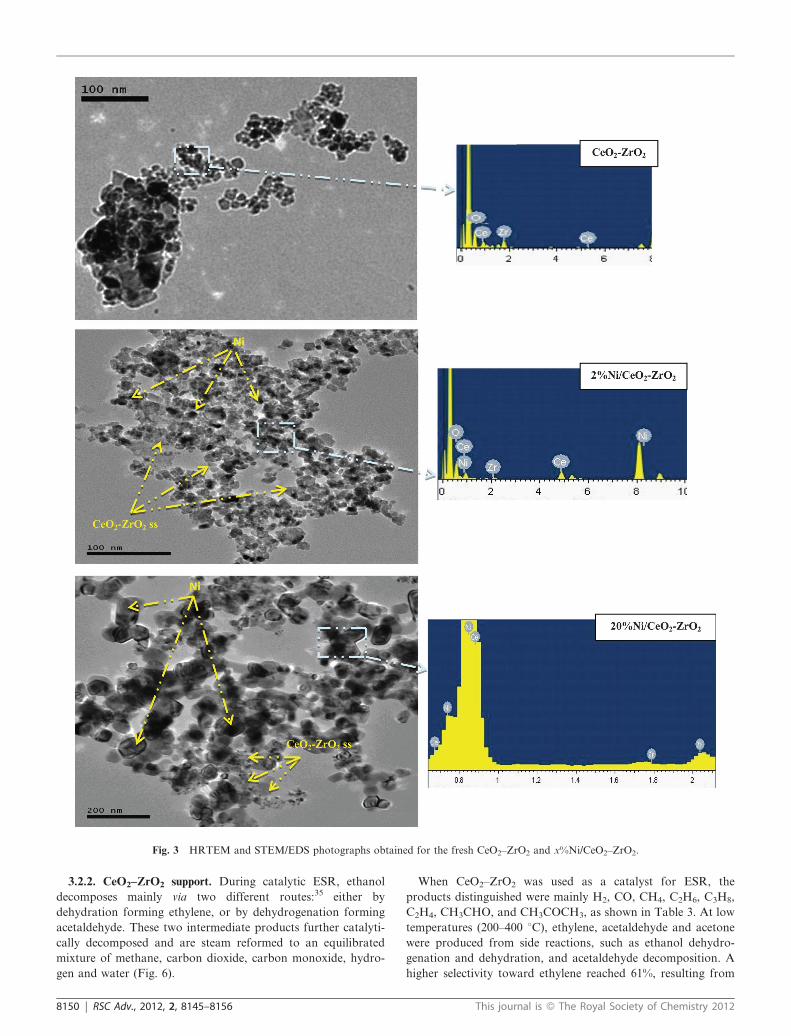
3.1.2. High resolution transmission electron microscopy. The
HRTEM and STEM/EDS photographs obtained from the
CeO2–ZrO2 and Ni/CeO2–ZrO2 catalysts are shown in Fig. 3.
Analysis of the photographs for CeO2–ZrO2 (Fig. 3a) revealed
particles with defined dimensions, having a grain size ranging
from 10–19 nm. As per the literature,18 and taking into account
the slight contraction of the crystal lattice, which is expected by
partial substitution of Ce ions by smaller Zr ions, the cubic
fluorite structure is quite obvious.19 Although no separate NiO
phases were discernible by the XRD of 2%Ni/CeO2–ZrO2,
STEM/EDS elemental mapping and HRTEM images (Fig. 3b)
identified nickel clusters that were well dispersed within the
CeO2–ZrO2 matrix. Therefore, at low Ni content, nickel oxide
was present in CeO2–ZrO2, but, in nanoparticle form (2–4 nm).20
The 20%Ni/CeO2–ZrO2 (Fig. 3c) system is not homogeneous. In
fact, two forms of crystals are observed, corresponding to the
presence of the CeO2–ZrO2 fluorite structure and nickel oxide, as
confirmed from XRD and STEM/EDS. The grains of NiO are
readily recognizable by their opaque hexagonal shape, in
contrast to the CeO2–ZrO2 particles, which are cubic and
transparent. The mean size of the NiO aggregates is estimated to
be in the range 57–95 nm and those of the CeO2–ZrO2 particles is
in the range 8–12 nm.
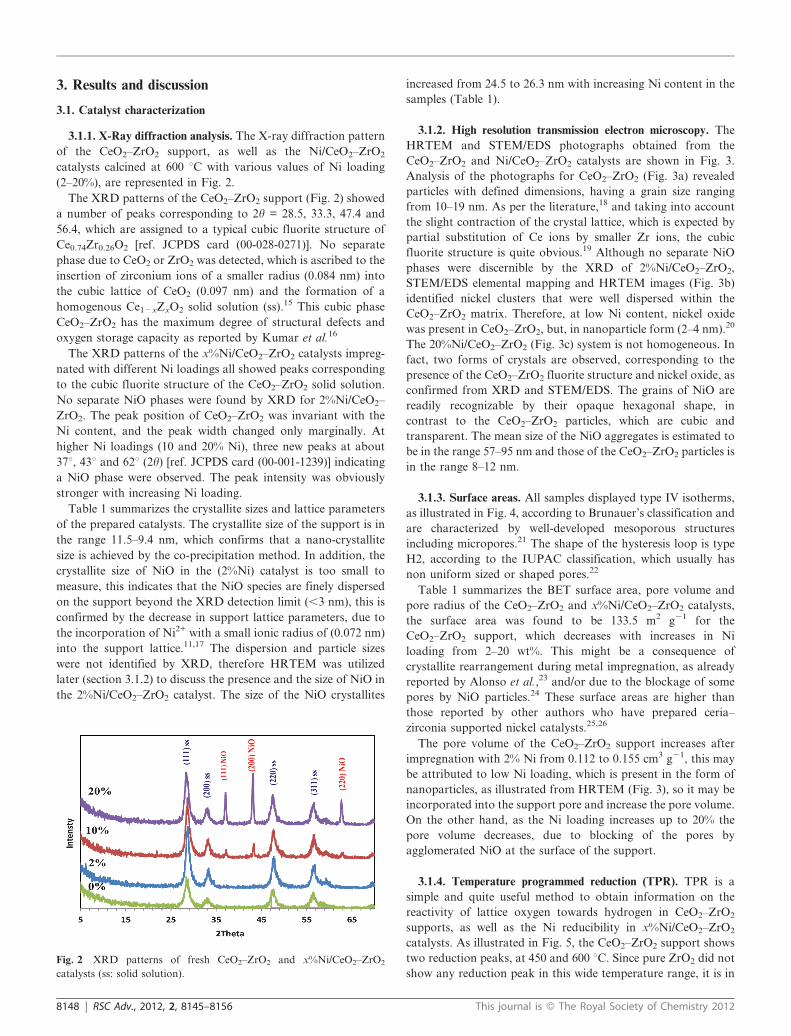
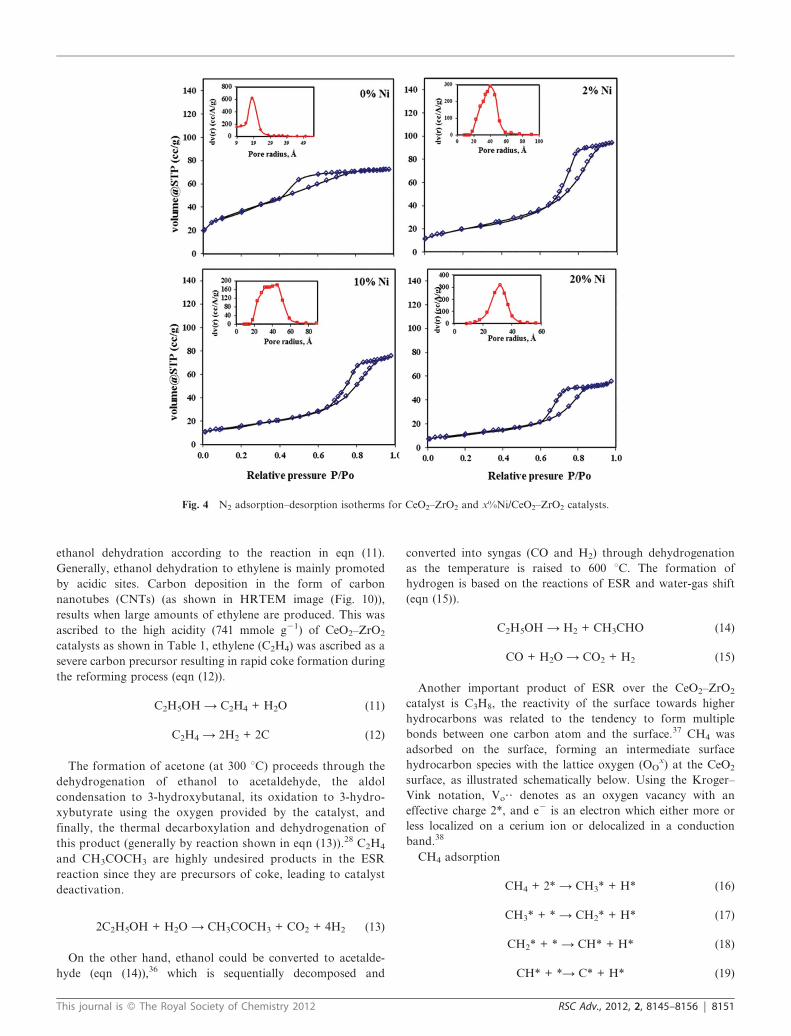
3.1.3. Surface areas. All samples displayed type IV isotherms,
as illustrated in Fig. 4, according to Brunauer’s classification and
are characterized by well-developed mesoporous structures
including micropores.21 The shape of the hysteresis loop is type
H2, according to the IUPAC classification, which usually has
non uniform sized or shaped pores.22
Table 1 summarizes the BET surface area, pore volume and
pore radius of the CeO2–ZrO2 and x%Ni/CeO2–ZrO2 catalysts,
the surface area was found to be 133.5 m2 g21 for the
CeO2–ZrO2 support, which decreases with increases in Ni
loading from 2–20 wt%. This might be a consequence of
crystallite rearrangement during metal impregnation, as already
reported by Alonso et al.,23 and/or due to the blockage of some
pores by NiO particles.24 These surface areas are higher than
those reported by other authors who have prepared ceria–
zirconia supported nickel catalysts.25,26
The pore volume of the CeO2–ZrO2 support increases after
impregnation with 2% Ni from 0.112 to 0.155 cm3 g21, this may
be attributed to low Ni loading, which is present in the form of
nanoparticles, as illustrated from HRTEM (Fig. 3), so it may be
incorporated into the support pore and increase the pore volume.
On the other hand, as the Ni loading increases up to 20% the
pore volume decreases, due to blocking of the pores by
agglomerated NiO at the surface of the support.
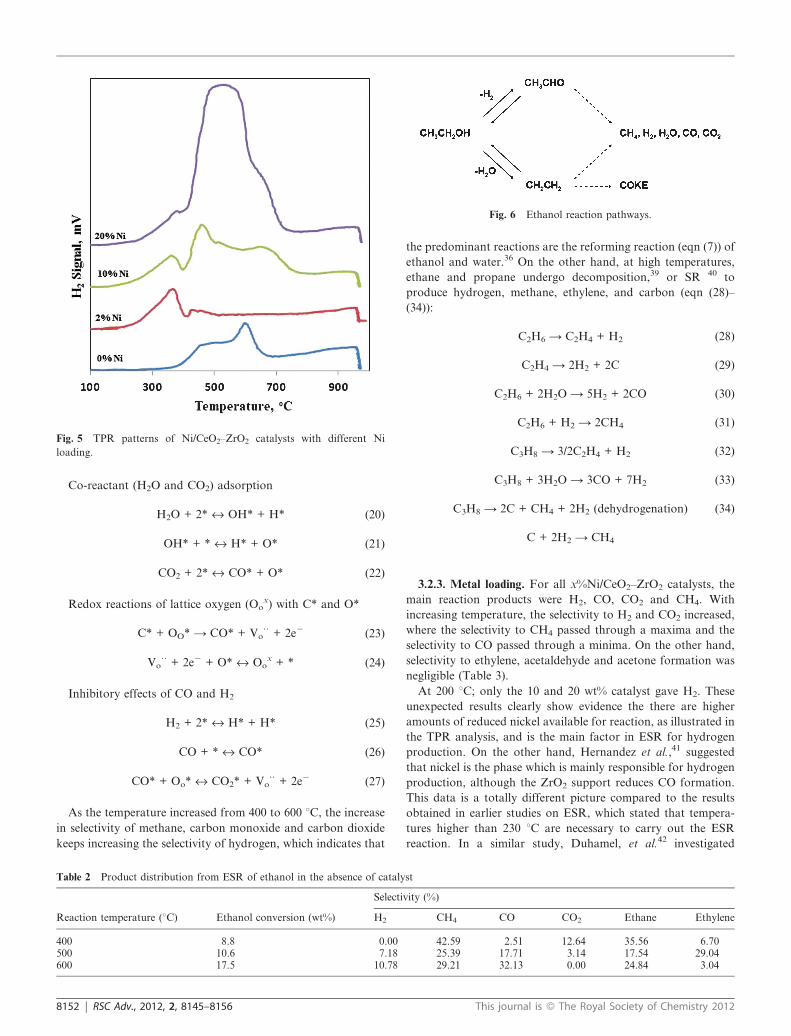
3.1.4. Temperature programmed reduction (TPR). TPR is a
simple and quite useful method to obtain information on the
reactivity of lattice oxygen towards hydrogen in CeO2–ZrO2
supports, as well as the Ni reducibility in x%Ni/CeO2–ZrO2
catalysts. As illustrated in Fig. 5, the CeO2–ZrO2 support shows
two reduction peaks, at 450 and 600 uC. Since pure ZrO2 did not
show any reduction peak in this wide temperature range, it is inFig. 2 XRD patterns of fresh CeO2–ZrO2 and x%Ni/CeO2–ZrO2
catalysts (ss: solid solution).
8148 | RSC Adv., 2012, 2, 8145–8156 This journal is � The Royal Society of Chemistry 2012
agreement with the reported result.25 All the consumed hydrogen
contributes to the reduction of Ce4+ to Ce3+. According to the
reduction mechanism of CeO2 proposed by Pantu and
Gavalas,27 the TPR profile of pure CeO2 shows a two-peak
pattern at 503 uC and 752 uC, due to surface and bulk reduction.
The outermost layers of the smaller crystalline CeO2 are first
reduced at lower temperatures due to a lower enthalpy of
reduction, and then bulk reduction occurrs at higher tempera-
tures. In context, the TPR profiles of the mixed CeO2–ZrO2
oxides show a main broad reduction feature, which is in
agreement with the promotion of the reduction of the mixed
oxide, this means that the presence of Zr weakens the Ce–O bond
in the solid solution of CeO2–ZrO2 and makes the CeO2
component more easily reduced.28 The low temperature peak
at 450 uC is due to the reduction of the surface layer of CeO2 and
the higher one at 600 uC is due to that of the material in the
bulk.15
The TPR profile of the 2%Ni/CeO2–ZrO2 catalyst possesses
two peaks: the first one is a peak at 370 uC, and the other peak is
at 430 uC. The first peak is attributed to the reduction of NiO to
Ni0 which is lower than the reduction at 490 uC in pure NiO.29 It
is obvious that the reduction peak of NiO is shifted to a lower
temperature when it is deposited on the high surface area
CeO2–ZrO2 support; due to appropriate interaction between the
metal and support. This interaction is an electronic interaction
between CeO2 and Ni because Ce is rich in d-electrons and Ni
has unfilled d-orbitals, where the unfilled d-orbitals of the Ni atoms
accept d-electrons from Ce, resulting in an increase in d-electron
density of the Ni atom.30 The second peak at 430 uC corresponds to
the reduction of surface CeO2 in the CeO2–ZrO2 support.
With an increase in the metal loading from 2% to 10%, the
intensity of the peaks at 370 uC and 430 uC increased and shifted
towards higher temperatures (460 uC and 660 uC, respectively),
which is significantly due to increasing NiO content. Also
another small peak at about 360 uC was observed, which might
be attributed to the reduction of free NiO particles 31 or the
hydrogen spillover effect.32 Further increase in metal loading to
20 wt%, resulted in the peak at 460 uC to be shifted towards
higher temperatures and merged with the second peak, which is
attributed to agglomerated NiO.25
3.2. Catalytic Activity
The effect of reaction temperature (200–600 uC) and metal
loading on ESR and product selectivity over the CeO2–ZrO2
support and x%Ni/CeO2–ZrO2 catalyst (x = 2, 10, 20) are
studied. The catalytic products were H2, CO, CO2 and CH4. The
presence of these products indicates that steam reforming (SR)
and the water gas shift (WGS) reaction took place simulta-
neously in the reactor.33 Minor amounts of by-products, such as
CH3CHO, C2H4, C2H6 and CH3COCH3, were also observed;
their concentration exhibiting a strong dependence on reaction
temperature. As expected, ethanol conversion increased with
increasing temperature and with an increase in metal loading.
Nearly complete conversion was obtained with nickel loaded
catalysts at 400 uC. The high activity and variety of products is
mainly attributed to the complex composition and multi-reactive
sites, such as metal Ni, acidic/basic centers, and oxygen vacancies
in the CeO2–ZrO2 solid solution.
3.2.1. Homogeneous contribution. Reforming of ethanol under
the same reaction conditions, but in the absence of catalyst, was
studied to completely understand the role of the catalyst in the
ESR reaction. The blank experiment shows that only 8.8–17.5%
of ethanol was converted at temperatures in the range 400–600
uC (Table 2), in the absence of catalyst, which is probably due to
ethanol thermal decomposition. The distribution of products
cannot be attributed to the ESR reaction, where water is being
produced and not consumed. The production of water can be
explained by ethanol dehydration yielding ethylene, which is a
coke precursor.
On the basis of the obtained products, after we systemically
investigated the variation of gaseous products, it was found that
the amount of H2 and CO increased while CH4 and CO2
decreased as the reaction temperature rises. The following
reactions may describe the changes in gaseous products with
temperatures in our reaction system.
CH3CH2OH A CO + H2 + CH4 (8)
CH4 A C + 2H2 (9)
2CO A C + CO2 (10)
The first reaction (eqn (8)) is the most endothermic one and it
is thermodynamically favorable,34 so the high temperature
favors the production of H2 and CO. Therefore, the higher the
temperature, the larger the amount of H2 and CO obtained. The
reaction in eqn (9) is also a thermodynamically favorable
reaction, thus the synthesized CH4 in eqn (8) will partially
decomposed to produce carbon and hydrogen. This is the reason
that the amount of CH4 decreased when the reaction tempera-
ture increased. The most exothermic reaction is the Boudouard
reaction (eqn (10)), which is favored at low temperatures, and
leads to a decrease in the amount of CO2 when increasing the
reaction temperature.
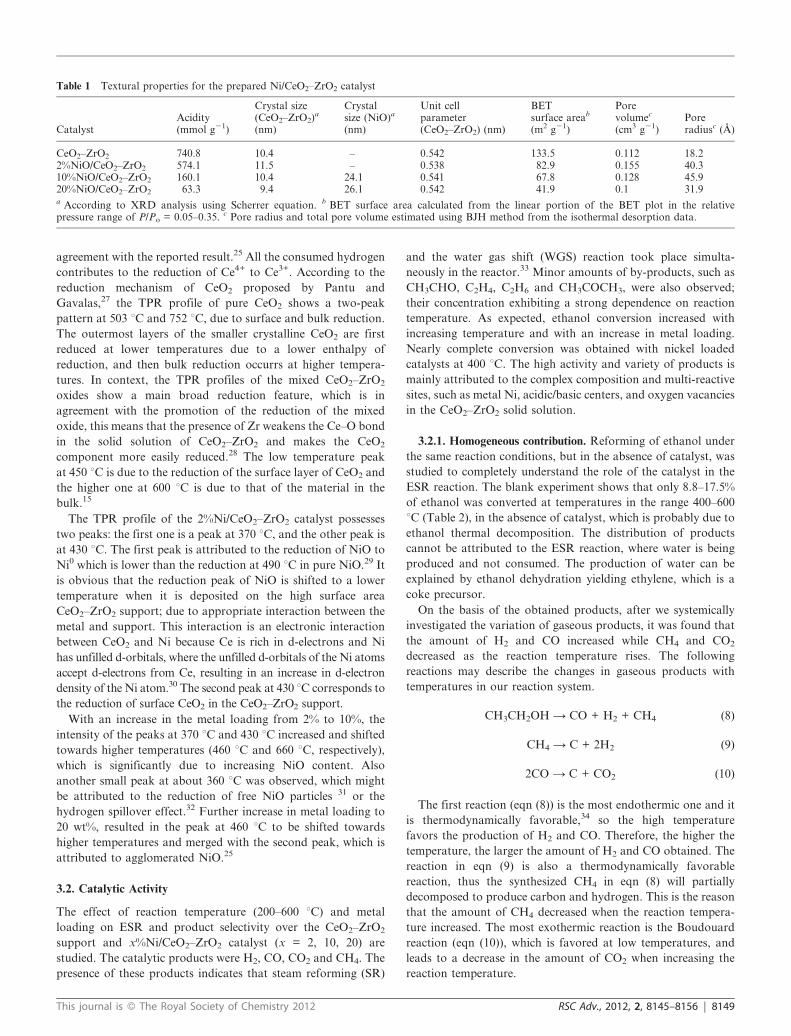
Table 1 Textural properties for the prepared Ni/CeO2–ZrO2 catalyst
CatalystAcidity(mmol g21)
Crystal size(CeO2–ZrO2)a
(nm)
Crystalsize (NiO)a
(nm)
Unit cellparameter(CeO2–ZrO2) (nm)
BETsurface areab
(m2 g21)
Porevolumec
(cm3 g21)Poreradiusc (A)
CeO2–ZrO2 740.8 10.4 – 0.542 133.5 0.112 18.22%NiO/CeO2–ZrO2 574.1 11.5 – 0.538 82.9 0.155 40.310%NiO/CeO2–ZrO2 160.1 10.4 24.1 0.541 67.8 0.128 45.920%NiO/CeO2–ZrO2 63.3 9.4 26.1 0.542 41.9 0.1 31.9a According to XRD analysis using Scherrer equation. b BET surface area calculated from the linear portion of the BET plot in the relativepressure range of P/Po = 0.05–0.35. c Pore radius and total pore volume estimated using BJH method from the isothermal desorption data.
This journal is � The Royal Society of Chemistry 2012 RSC Adv., 2012, 2, 8145–8156 | 8149
3.2.2. CeO2–ZrO2 support. During catalytic ESR, ethanol
decomposes mainly via two different routes:35 either by
dehydration forming ethylene, or by dehydrogenation forming
acetaldehyde. These two intermediate products further catalyti-
cally decomposed and are steam reformed to an equilibrated
mixture of methane, carbon dioxide, carbon monoxide, hydro-
gen and water (Fig. 6).
When CeO2–ZrO2 was used as a catalyst for ESR, the
products distinguished were mainly H2, CO, CH4, C2H6, C3H8,
C2H4, CH3CHO, and CH3COCH3, as shown in Table 3. At low
temperatures (200–400 uC), ethylene, acetaldehyde and acetone
were produced from side reactions, such as ethanol dehydro-
genation and dehydration, and acetaldehyde decomposition. A
higher selectivity toward ethylene reached 61%, resulting from
Fig. 3 HRTEM and STEM/EDS photographs obtained for the fresh CeO2–ZrO2 and x%Ni/CeO2–ZrO2.
8150 | RSC Adv., 2012, 2, 8145–8156 This journal is � The Royal Society of Chemistry 2012
ethanol dehydration according to the reaction in eqn (11).
Generally, ethanol dehydration to ethylene is mainly promoted
by acidic sites. Carbon deposition in the form of carbon
nanotubes (CNTs) (as shown in HRTEM image (Fig. 10)),
results when large amounts of ethylene are produced. This was
ascribed to the high acidity (741 mmole g21) of CeO2–ZrO2
catalysts as shown in Table 1, ethylene (C2H4) was ascribed as a
severe carbon precursor resulting in rapid coke formation during
the reforming process (eqn (12)).
C2H5OH A C2H4 + H2O (11)
C2H4 A 2H2 + 2C (12)
The formation of acetone (at 300 uC) proceeds through the
dehydrogenation of ethanol to acetaldehyde, the aldol
condensation to 3-hydroxybutanal, its oxidation to 3-hydro-
xybutyrate using the oxygen provided by the catalyst, and
finally, the thermal decarboxylation and dehydrogenation of
this product (generally by reaction shown in eqn (13)).28 C2H4
and CH3COCH3 are highly undesired products in the ESR
reaction since they are precursors of coke, leading to catalyst
deactivation.
2C2H5OH + H2O A CH3COCH3 + CO2 + 4H2 (13)
On the other hand, ethanol could be converted to acetalde-
hyde (eqn (14)),36 which is sequentially decomposed and
converted into syngas (CO and H2) through dehydrogenation
as the temperature is raised to 600 uC. The formation of
hydrogen is based on the reactions of ESR and water-gas shift
(eqn (15)).
C2H5OH A H2 + CH3CHO (14)
CO + H2O A CO2 + H2 (15)
Another important product of ESR over the CeO2–ZrO2
catalyst is C3H8, the reactivity of the surface towards higher
hydrocarbons was related to the tendency to form multiple
bonds between one carbon atom and the surface.37 CH4 was
adsorbed on the surface, forming an intermediate surface
hydrocarbon species with the lattice oxygen (OOx) at the CeO2
surface, as illustrated schematically below. Using the Kroger–
Vink notation, Vo?? denotes as an oxygen vacancy with an
effective charge 2*, and e2 is an electron which either more or
less localized on a cerium ion or delocalized in a conduction
band.38
CH4 adsorption
CH4 + 2* A CH3* + H* (16)
CH3* + * A CH2* + H* (17)
CH2* + * A CH* + H* (18)
CH* + *A C* + H* (19)
Fig. 4 N2 adsorption–desorption isotherms for CeO2–ZrO2 and x%Ni/CeO2–ZrO2 catalysts.
This journal is � The Royal Society of Chemistry 2012 RSC Adv., 2012, 2, 8145–8156 | 8151
Co-reactant (H2O and CO2) adsorption
H2O + 2* « OH* + H* (20)
OH* + * « H* + O* (21)
CO2 + 2* « CO* + O* (22)
Redox reactions of lattice oxygen (Oox) with C* and O*
C* + OO* A CO* + Vo?? + 2e2 (23)
Vo?? + 2e2 + O* « Oo
x + * (24)
Inhibitory effects of CO and H2
H2 + 2* « H* + H* (25)
CO + * « CO* (26)
CO* + Oo* « CO2* + Vo?? + 2e2 (27)
As the temperature increased from 400 to 600 uC, the increase
in selectivity of methane, carbon monoxide and carbon dioxide
keeps increasing the selectivity of hydrogen, which indicates that
the predominant reactions are the reforming reaction (eqn (7)) of
ethanol and water.36 On the other hand, at high temperatures,
ethane and propane undergo decomposition,39 or SR 40 to
produce hydrogen, methane, ethylene, and carbon (eqn (28)–
(34)):
C2H6 A C2H4 + H2 (28)
C2H4 A 2H2 + 2C (29)
C2H6 + 2H2O A 5H2 + 2CO (30)
C2H6 + H2 A 2CH4 (31)
C3H8 A 3/2C2H4 + H2 (32)
C3H8 + 3H2O A 3CO + 7H2 (33)
C3H8 A 2C + CH4 + 2H2 (dehydrogenation) (34)
C + 2H2 A CH4
3.2.3. Metal loading. For all x%Ni/CeO2–ZrO2 catalysts, the
main reaction products were H2, CO, CO2 and CH4. With
increasing temperature, the selectivity to H2 and CO2 increased,
where the selectivity to CH4 passed through a maxima and the
selectivity to CO passed through a minima. On the other hand,
selectivity to ethylene, acetaldehyde and acetone formation was
negligible (Table 3).
At 200 uC; only the 10 and 20 wt% catalyst gave H2. These
unexpected results clearly show evidence the there are higher
amounts of reduced nickel available for reaction, as illustrated in
the TPR analysis, and is the main factor in ESR for hydrogen
production. On the other hand, Hernandez et al.,41 suggested
that nickel is the phase which is mainly responsible for hydrogen
production, although the ZrO2 support reduces CO formation.
This data is a totally different picture compared to the results
obtained in earlier studies on ESR, which stated that tempera-
tures higher than 230 uC are necessary to carry out the ESR
reaction. In a similar study, Duhamel, et al.42 investigated
Table 2 Product distribution from ESR of ethanol in the absence of catalyst
Reaction temperature (uC) Ethanol conversion (wt%)
Selectivity (%)
H2 CH4 CO CO2 Ethane Ethylene
400 8.8 0.00 42.59 2.51 12.64 35.56 6.70500 10.6 7.18 25.39 17.71 3.14 17.54 29.04600 17.5 10.78 29.21 32.13 0.00 24.84 3.04
Fig. 5 TPR patterns of Ni/CeO2–ZrO2 catalysts with different Ni
loading.
Fig. 6 Ethanol reaction pathways.
8152 | RSC Adv., 2012, 2, 8145–8156 This journal is � The Royal Society of Chemistry 2012
hydrogen production from ethanol in the presence of water
(H2O/C2H5OH = 3) over cerium–nickel CeNixOy (0, x ¡ 5)
mixed oxide catalysts. The influence of different reaction
temperatures showed that a stable activity, i.e., ethanol conver-
sion and H2 selectivity, was obtained at a very low temperature
(200 uC) when the solid is previously in situ treated in H2, in a
temperature range between 200 and 300 uC. After such a
treatment, the solids studied are hydrogen reservoirs, called
oxyhydrides, with the presence of a hydrogen species of hydride
nature in the anionic vacancies of the solid.42 David et al.43
indicated that reduction experiments under SR conditions, in the
presence of both H2 and hydrocarbons, have shown an increased
reducibility of nickel ions in the presence of hydrocarbons and
alcohol.
On the other hand, from the analysis of product distribution
obtained at 200 uC, it can be observed that methane selectivity is
equal to CO selectivity, suggesting that ethanol decomposition to
CO, CH4 and H2 (eqn (8)) is the main reaction at 200 uC, while
the lower selectivity to CO2 could be produced either by the
WGS reaction (eqn (15)) or by ESR (eqn (7)). As the temperature
increases from 200 to 300 uC, CH4 and CO2 selectivity increases
while CO selectivity decreases. This means that at 300 uC the
ESR (eqn (7)) instead ethanol decomposition (eqn (8)) becomes
significant and low quantities of CO are produced by the
reaction in eqn (35).
CH4 + H2O « CO + 3H2 (35)
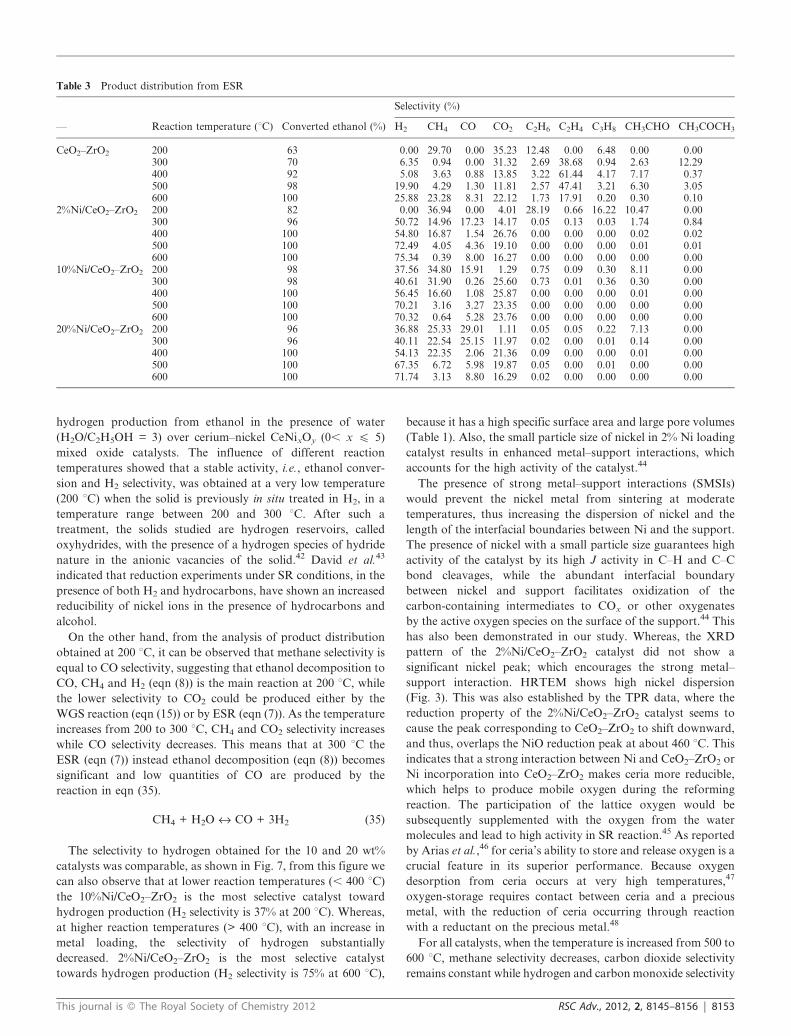
The selectivity to hydrogen obtained for the 10 and 20 wt%
catalysts was comparable, as shown in Fig. 7, from this figure we
can also observe that at lower reaction temperatures (, 400 uC)
the 10%Ni/CeO2–ZrO2 is the most selective catalyst toward
hydrogen production (H2 selectivity is 37% at 200 uC). Whereas,
at higher reaction temperatures (> 400 uC), with an increase in
metal loading, the selectivity of hydrogen substantially
decreased. 2%Ni/CeO2–ZrO2 is the most selective catalyst
towards hydrogen production (H2 selectivity is 75% at 600 uC),
because it has a high specific surface area and large pore volumes
(Table 1). Also, the small particle size of nickel in 2% Ni loading
catalyst results in enhanced metal–support interactions, which
accounts for the high activity of the catalyst.44
The presence of strong metal–support interactions (SMSIs)
would prevent the nickel metal from sintering at moderate
temperatures, thus increasing the dispersion of nickel and the
length of the interfacial boundaries between Ni and the support.
The presence of nickel with a small particle size guarantees high
activity of the catalyst by its high J activity in C–H and C–C
bond cleavages, while the abundant interfacial boundary
between nickel and support facilitates oxidization of the
carbon-containing intermediates to COx or other oxygenates
by the active oxygen species on the surface of the support.44 This
has also been demonstrated in our study. Whereas, the XRD
pattern of the 2%Ni/CeO2–ZrO2 catalyst did not show a
significant nickel peak; which encourages the strong metal–
support interaction. HRTEM shows high nickel dispersion
(Fig. 3). This was also established by the TPR data, where the
reduction property of the 2%Ni/CeO2–ZrO2 catalyst seems to
cause the peak corresponding to CeO2–ZrO2 to shift downward,
and thus, overlaps the NiO reduction peak at about 460 uC. This
indicates that a strong interaction between Ni and CeO2–ZrO2 or
Ni incorporation into CeO2–ZrO2 makes ceria more reducible,
which helps to produce mobile oxygen during the reforming
reaction. The participation of the lattice oxygen would be
subsequently supplemented with the oxygen from the water
molecules and lead to high activity in SR reaction.45 As reported
by Arias et al.,46 for ceria’s ability to store and release oxygen is a
crucial feature in its superior performance. Because oxygen
desorption from ceria occurs at very high temperatures,47
oxygen-storage requires contact between ceria and a precious
metal, with the reduction of ceria occurring through reaction
with a reductant on the precious metal.48
For all catalysts, when the temperature is increased from 500 to
600 uC, methane selectivity decreases, carbon dioxide selectivity
remains constant while hydrogen and carbon monoxide selectivity
Table 3 Product distribution from ESR
— Reaction temperature (uC) Converted ethanol (%)
Selectivity (%)
H2 CH4 CO CO2 C2H6 C2H4 C3H8 CH3CHO CH3COCH3
CeO2–ZrO2 200 63 0.00 29.70 0.00 35.23 12.48 0.00 6.48 0.00 0.00300 70 6.35 0.94 0.00 31.32 2.69 38.68 0.94 2.63 12.29400 92 5.08 3.63 0.88 13.85 3.22 61.44 4.17 7.17 0.37500 98 19.90 4.29 1.30 11.81 2.57 47.41 3.21 6.30 3.05600 100 25.88 23.28 8.31 22.12 1.73 17.91 0.20 0.30 0.10
2%Ni/CeO2–ZrO2 200 82 0.00 36.94 0.00 4.01 28.19 0.66 16.22 10.47 0.00300 96 50.72 14.96 17.23 14.17 0.05 0.13 0.03 1.74 0.84400 100 54.80 16.87 1.54 26.76 0.00 0.00 0.00 0.02 0.02500 100 72.49 4.05 4.36 19.10 0.00 0.00 0.00 0.01 0.01600 100 75.34 0.39 8.00 16.27 0.00 0.00 0.00 0.00 0.00
10%Ni/CeO2–ZrO2 200 98 37.56 34.80 15.91 1.29 0.75 0.09 0.30 8.11 0.00300 98 40.61 31.90 0.26 25.60 0.73 0.01 0.36 0.30 0.00400 100 56.45 16.60 1.08 25.87 0.00 0.00 0.00 0.01 0.00500 100 70.21 3.16 3.27 23.35 0.00 0.00 0.00 0.00 0.00600 100 70.32 0.64 5.28 23.76 0.00 0.00 0.00 0.00 0.00
20%Ni/CeO2–ZrO2 200 96 36.88 25.33 29.01 1.11 0.05 0.05 0.22 7.13 0.00300 96 40.11 22.54 25.15 11.97 0.02 0.00 0.01 0.14 0.00400 100 54.13 22.35 2.06 21.36 0.09 0.00 0.00 0.01 0.00500 100 67.35 6.72 5.98 19.87 0.05 0.00 0.01 0.00 0.00600 100 71.74 3.13 8.80 16.29 0.02 0.00 0.00 0.00 0.00
This journal is � The Royal Society of Chemistry 2012 RSC Adv., 2012, 2, 8145–8156 | 8153
increase. CO produced from the reverse water gas shift reaction
(WGSR) was expected (eqn (36)) to increase with increases in
temperature.49 The decrease in CO2 and CH4 yields with increased
temperature was ascribed to the RWGS, SR of CH4 (eqn (35))
and/or dry reforming, resulting in increase in the selectivity to H2
and CO2.50
CO2 + H2 A CO + H2O (36)
CH4 + CO2 A 2CO + 2H2 (37)
On the basis of intermediate distribution at lower and higher
reaction temperatures (Table 3), we can conclude that ethanol
dehydrogenation to acetaldehyde (eqn (14)) and ethanol decom-
position to methane and carbon monoxide (eqn (8)) were the
primary reactions at low temperatures. At higher temperatures,
where all the ethanol and the intermediate compounds, like
acetaldehyde and acetone (eqn (38) and (39)), were completely
converted into hydrogen, carbon oxides and methane, SR of
methane and WGS became the major reactions, which is in
agreement with Zhang et al.51
CH3CHO A CH4 + CO (38)
CH3CHO + H2O A 2CO + 3H2 (39)
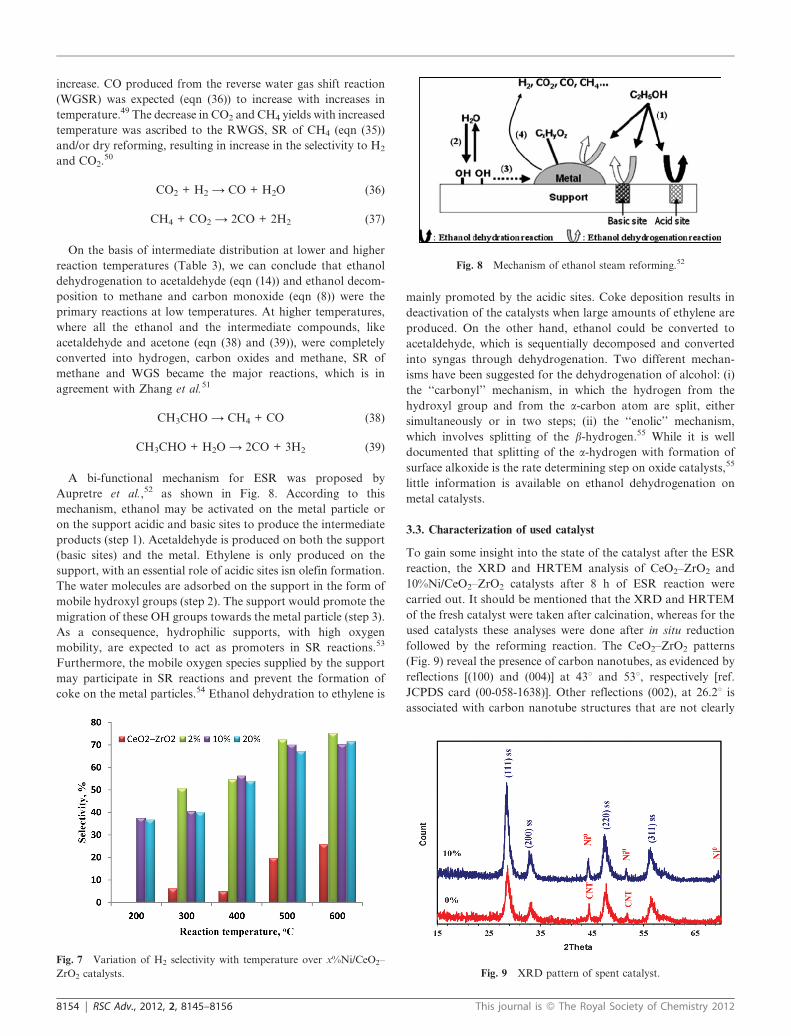
A bi-functional mechanism for ESR was proposed by
Aupretre et al.,52 as shown in Fig. 8. According to this
mechanism, ethanol may be activated on the metal particle or
on the support acidic and basic sites to produce the intermediate
products (step 1). Acetaldehyde is produced on both the support
(basic sites) and the metal. Ethylene is only produced on the
support, with an essential role of acidic sites isn olefin formation.
The water molecules are adsorbed on the support in the form of
mobile hydroxyl groups (step 2). The support would promote the
migration of these OH groups towards the metal particle (step 3).
As a consequence, hydrophilic supports, with high oxygen
mobility, are expected to act as promoters in SR reactions.53
Furthermore, the mobile oxygen species supplied by the support
may participate in SR reactions and prevent the formation of
coke on the metal particles.54 Ethanol dehydration to ethylene is
mainly promoted by the acidic sites. Coke deposition results in
deactivation of the catalysts when large amounts of ethylene are
produced. On the other hand, ethanol could be converted to
acetaldehyde, which is sequentially decomposed and converted
into syngas through dehydrogenation. Two different mechan-
isms have been suggested for the dehydrogenation of alcohol: (i)
the ‘‘carbonyl’’ mechanism, in which the hydrogen from the
hydroxyl group and from the a-carbon atom are split, either
simultaneously or in two steps; (ii) the ‘‘enolic’’ mechanism,
which involves splitting of the b-hydrogen.55 While it is well
documented that splitting of the a-hydrogen with formation of
surface alkoxide is the rate determining step on oxide catalysts,55
little information is available on ethanol dehydrogenation on
metal catalysts.
3.3. Characterization of used catalyst
To gain some insight into the state of the catalyst after the ESR
reaction, the XRD and HRTEM analysis of CeO2–ZrO2 and
10%Ni/CeO2–ZrO2 catalysts after 8 h of ESR reaction were
carried out. It should be mentioned that the XRD and HRTEM
of the fresh catalyst were taken after calcination, whereas for the
used catalysts these analyses were done after in situ reduction
followed by the reforming reaction. The CeO2–ZrO2 patterns
(Fig. 9) reveal the presence of carbon nanotubes, as evidenced by
reflections [(100) and (004)] at 43u and 53u, respectively [ref.
JCPDS card (00-058-1638)]. Other reflections (002), at 26.2u is
associated with carbon nanotube structures that are not clearly
Fig. 7 Variation of H2 selectivity with temperature over x%Ni/CeO2–
ZrO2 catalysts.
Fig. 8 Mechanism of ethanol steam reforming.52
Fig. 9 XRD pattern of spent catalyst.
8154 | RSC Adv., 2012, 2, 8145–8156 This journal is � The Royal Society of Chemistry 2012
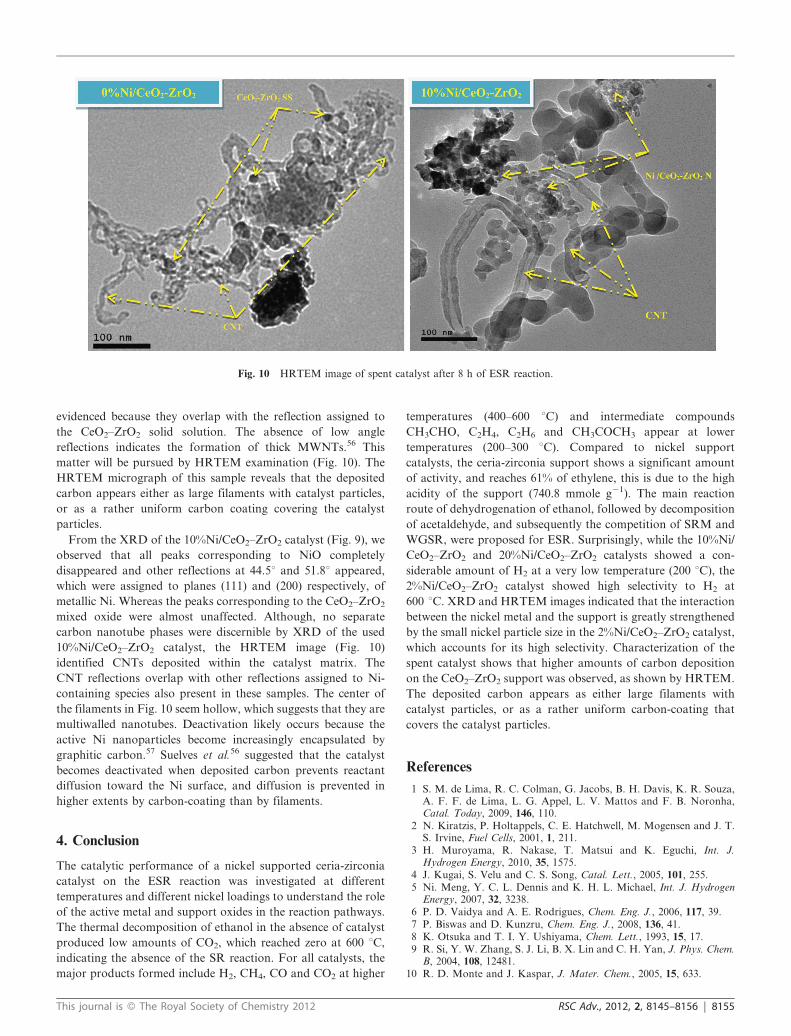
evidenced because they overlap with the reflection assigned to
the CeO2–ZrO2 solid solution. The absence of low angle
reflections indicates the formation of thick MWNTs.56 This
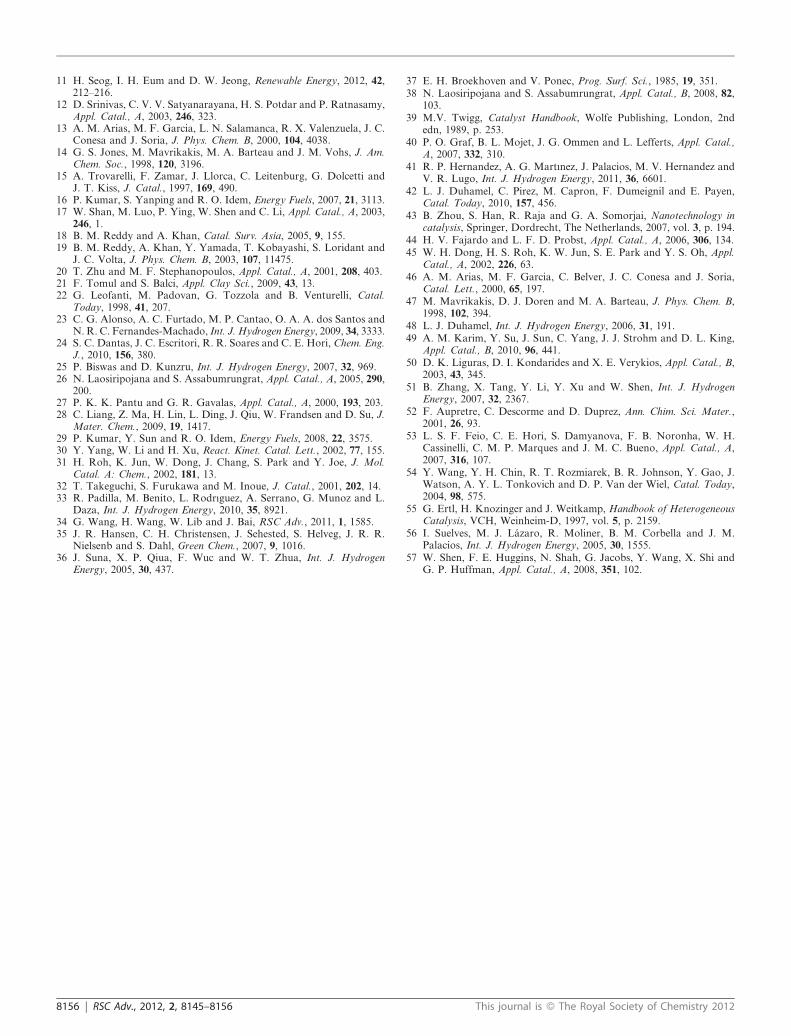
matter will be pursued by HRTEM examination (Fig. 10). The
HRTEM micrograph of this sample reveals that the deposited
carbon appears either as large filaments with catalyst particles,
or as a rather uniform carbon coating covering the catalyst
particles.
From the XRD of the 10%Ni/CeO2–ZrO2 catalyst (Fig. 9), we
observed that all peaks corresponding to NiO completely
disappeared and other reflections at 44.5u and 51.8u appeared,
which were assigned to planes (111) and (200) respectively, of
metallic Ni. Whereas the peaks corresponding to the CeO2–ZrO2
mixed oxide were almost unaffected. Although, no separate
carbon nanotube phases were discernible by XRD of the used
10%Ni/CeO2–ZrO2 catalyst, the HRTEM image (Fig. 10)
identified CNTs deposited within the catalyst matrix. The
CNT reflections overlap with other reflections assigned to Ni-
containing species also present in these samples. The center of
the filaments in Fig. 10 seem hollow, which suggests that they are
multiwalled nanotubes. Deactivation likely occurs because the
active Ni nanoparticles become increasingly encapsulated by
graphitic carbon.57 Suelves et al.56 suggested that the catalyst
becomes deactivated when deposited carbon prevents reactant
diffusion toward the Ni surface, and diffusion is prevented in
higher extents by carbon-coating than by filaments.
4. Conclusion
The catalytic performance of a nickel supported ceria-zirconia
catalyst on the ESR reaction was investigated at different
temperatures and different nickel loadings to understand the role
of the active metal and support oxides in the reaction pathways.
The thermal decomposition of ethanol in the absence of catalyst
produced low amounts of CO2, which reached zero at 600 uC,
indicating the absence of the SR reaction. For all catalysts, the
major products formed include H2, CH4, CO and CO2 at higher
temperatures (400–600 uC) and intermediate compounds
CH3CHO, C2H4, C2H6 and CH3COCH3 appear at lower
temperatures (200–300 uC). Compared to nickel support
catalysts, the ceria-zirconia support shows a significant amount
of activity, and reaches 61% of ethylene, this is due to the high
acidity of the support (740.8 mmole g21). The main reaction
route of dehydrogenation of ethanol, followed by decomposition
of acetaldehyde, and subsequently the competition of SRM and
WGSR, were proposed for ESR. Surprisingly, while the 10%Ni/
CeO2–ZrO2 and 20%Ni/CeO2–ZrO2 catalysts showed a con-
siderable amount of H2 at a very low temperature (200 uC), the
2%Ni/CeO2–ZrO2 catalyst showed high selectivity to H2 at
600 uC. XRD and HRTEM images indicated that the interaction
between the nickel metal and the support is greatly strengthened
by the small nickel particle size in the 2%Ni/CeO2–ZrO2 catalyst,
which accounts for its high selectivity. Characterization of the
spent catalyst shows that higher amounts of carbon deposition
on the CeO2–ZrO2 support was observed, as shown by HRTEM.
The deposited carbon appears as either large filaments with
catalyst particles, or as a rather uniform carbon-coating that
covers the catalyst particles.
References
1 S. M. de Lima, R. C. Colman, G. Jacobs, B. H. Davis, K. R. Souza,A. F. F. de Lima, L. G. Appel, L. V. Mattos and F. B. Noronha,Catal. Today, 2009, 146, 110.
2 N. Kiratzis, P. Holtappels, C. E. Hatchwell, M. Mogensen and J. T.S. Irvine, Fuel Cells, 2001, 1, 211.
3 H. Muroyama, R. Nakase, T. Matsui and K. Eguchi, Int. J.Hydrogen Energy, 2010, 35, 1575.
4 J. Kugai, S. Velu and C. S. Song, Catal. Lett., 2005, 101, 255.5 Ni. Meng, Y. C. L. Dennis and K. H. L. Michael, Int. J. Hydrogen
Energy, 2007, 32, 3238.6 P. D. Vaidya and A. E. Rodrigues, Chem. Eng. J., 2006, 117, 39.7 P. Biswas and D. Kunzru, Chem. Eng. J., 2008, 136, 41.8 K. Otsuka and T. I. Y. Ushiyama, Chem. Lett., 1993, 15, 17.9 R. Si, Y. W. Zhang, S. J. Li, B. X. Lin and C. H. Yan, J. Phys. Chem.
B, 2004, 108, 12481.10 R. D. Monte and J. Kaspar, J. Mater. Chem., 2005, 15, 633.
Fig. 10 HRTEM image of spent catalyst after 8 h of ESR reaction.
This journal is � The Royal Society of Chemistry 2012 RSC Adv., 2012, 2, 8145–8156 | 8155
11 H. Seog, I. H. Eum and D. W. Jeong, Renewable Energy, 2012, 42,212–216.
12 D. Srinivas, C. V. V. Satyanarayana, H. S. Potdar and P. Ratnasamy,Appl. Catal., A, 2003, 246, 323.
13 A. M. Arias, M. F. Garcia, L. N. Salamanca, R. X. Valenzuela, J. C.Conesa and J. Soria, J. Phys. Chem. B, 2000, 104, 4038.
14 G. S. Jones, M. Mavrikakis, M. A. Barteau and J. M. Vohs, J. Am.Chem. Soc., 1998, 120, 3196.
15 A. Trovarelli, F. Zamar, J. Llorca, C. Leitenburg, G. Dolcetti andJ. T. Kiss, J. Catal., 1997, 169, 490.
16 P. Kumar, S. Yanping and R. O. Idem, Energy Fuels, 2007, 21, 3113.17 W. Shan, M. Luo, P. Ying, W. Shen and C. Li, Appl. Catal., A, 2003,
246, 1.18 B. M. Reddy and A. Khan, Catal. Surv. Asia, 2005, 9, 155.19 B. M. Reddy, A. Khan, Y. Yamada, T. Kobayashi, S. Loridant and
J. C. Volta, J. Phys. Chem. B, 2003, 107, 11475.20 T. Zhu and M. F. Stephanopoulos, Appl. Catal., A, 2001, 208, 403.21 F. Tomul and S. Balci, Appl. Clay Sci., 2009, 43, 13.22 G. Leofanti, M. Padovan, G. Tozzola and B. Venturelli, Catal.
Today, 1998, 41, 207.23 C. G. Alonso, A. C. Furtado, M. P. Cantao, O. A. A. dos Santos and
N. R. C. Fernandes-Machado, Int. J. Hydrogen Energy, 2009, 34, 3333.24 S. C. Dantas, J. C. Escritori, R. R. Soares and C. E. Hori, Chem. Eng.
J., 2010, 156, 380.25 P. Biswas and D. Kunzru, Int. J. Hydrogen Energy, 2007, 32, 969.26 N. Laosiripojana and S. Assabumrungrat, Appl. Catal., A, 2005, 290,
200.27 P. K. K. Pantu and G. R. Gavalas, Appl. Catal., A, 2000, 193, 203.28 C. Liang, Z. Ma, H. Lin, L. Ding, J. Qiu, W. Frandsen and D. Su, J.
Mater. Chem., 2009, 19, 1417.29 P. Kumar, Y. Sun and R. O. Idem, Energy Fuels, 2008, 22, 3575.30 Y. Yang, W. Li and H. Xu, React. Kinet. Catal. Lett., 2002, 77, 155.31 H. Roh, K. Jun, W. Dong, J. Chang, S. Park and Y. Joe, J. Mol.
Catal. A: Chem., 2002, 181, 13.32 T. Takeguchi, S. Furukawa and M. Inoue, J. Catal., 2001, 202, 14.33 R. Padilla, M. Benito, L. Rodr|guez, A. Serrano, G. Munoz and L.
Daza, Int. J. Hydrogen Energy, 2010, 35, 8921.34 G. Wang, H. Wang, W. Lib and J. Bai, RSC Adv., 2011, 1, 1585.35 J. R. Hansen, C. H. Christensen, J. Sehested, S. Helveg, J. R. R.
Nielsenb and S. Dahl, Green Chem., 2007, 9, 1016.36 J. Suna, X. P. Qiua, F. Wuc and W. T. Zhua, Int. J. Hydrogen
Energy, 2005, 30, 437.
37 E. H. Broekhoven and V. Ponec, Prog. Surf. Sci., 1985, 19, 351.38 N. Laosiripojana and S. Assabumrungrat, Appl. Catal., B, 2008, 82,
103.39 M.V. Twigg, Catalyst Handbook, Wolfe Publishing, London, 2nd
edn, 1989, p. 253.40 P. O. Graf, B. L. Mojet, J. G. Ommen and L. Lefferts, Appl. Catal.,
A, 2007, 332, 310.41 R. P. Hernandez, A. G. Mart|nez, J. Palacios, M. V. Hernandez and
V. R. Lugo, Int. J. Hydrogen Energy, 2011, 36, 6601.42 L. J. Duhamel, C. Pirez, M. Capron, F. Dumeignil and E. Payen,
Catal. Today, 2010, 157, 456.43 B. Zhou, S. Han, R. Raja and G. A. Somorjai, Nanotechnology in
catalysis, Springer, Dordrecht, The Netherlands, 2007, vol. 3, p. 194.44 H. V. Fajardo and L. F. D. Probst, Appl. Catal., A, 2006, 306, 134.45 W. H. Dong, H. S. Roh, K. W. Jun, S. E. Park and Y. S. Oh, Appl.
Catal., A, 2002, 226, 63.46 A. M. Arias, M. F. Garcia, C. Belver, J. C. Conesa and J. Soria,
Catal. Lett., 2000, 65, 197.47 M. Mavrikakis, D. J. Doren and M. A. Barteau, J. Phys. Chem. B,
1998, 102, 394.48 L. J. Duhamel, Int. J. Hydrogen Energy, 2006, 31, 191.49 A. M. Karim, Y. Su, J. Sun, C. Yang, J. J. Strohm and D. L. King,
Appl. Catal., B, 2010, 96, 441.50 D. K. Liguras, D. I. Kondarides and X. E. Verykios, Appl. Catal., B,
2003, 43, 345.51 B. Zhang, X. Tang, Y. Li, Y. Xu and W. Shen, Int. J. Hydrogen
Energy, 2007, 32, 2367.52 F. Aupretre, C. Descorme and D. Duprez, Ann. Chim. Sci. Mater.,
2001, 26, 93.53 L. S. F. Feio, C. E. Hori, S. Damyanova, F. B. Noronha, W. H.
Cassinelli, C. M. P. Marques and J. M. C. Bueno, Appl. Catal., A,2007, 316, 107.
54 Y. Wang, Y. H. Chin, R. T. Rozmiarek, B. R. Johnson, Y. Gao, J.Watson, A. Y. L. Tonkovich and D. P. Van der Wiel, Catal. Today,2004, 98, 575.
55 G. Ertl, H. Knozinger and J. Weitkamp, Handbook of HeterogeneousCatalysis, VCH, Weinheim-D, 1997, vol. 5, p. 2159.
56 I. Suelves, M. J. Lazaro, R. Moliner, B. M. Corbella and J. M.Palacios, Int. J. Hydrogen Energy, 2005, 30, 1555.
57 W. Shen, F. E. Huggins, N. Shah, G. Jacobs, Y. Wang, X. Shi andG. P. Huffman, Appl. Catal., A, 2008, 351, 102.
8156 | RSC Adv., 2012, 2, 8145–8156 This journal is � The Royal Society of Chemistry 2012