
A Thermodynamic Analysis of Naphtha Catalytic Reforming ...
22
Citation: Martínez, J.; Zúñiga- Hinojosa, M.A.; Ruiz-Martínez, R.S. A Thermodynamic Analysis of Naphtha Catalytic Reforming Reactions to Produce High-Octane Gasoline. Processes 2022, 10, 313. https://doi.org/10.3390/pr10020313 Academic Editor: Alessandro D’ Adamo Received: 10 January 2022 Accepted: 4 February 2022 Published: 6 February 2022 Publisher’s Note: MDPI stays neutral with regard to jurisdictional claims in published maps and institutional affil- iations. Copyright: © 2022 by the authors. Licensee MDPI, Basel, Switzerland. This article is an open access article distributed under the terms and conditions of the Creative Commons Attribution (CC BY) license (https:// creativecommons.org/licenses/by/ 4.0/). processes Article A Thermodynamic Analysis of Naphtha Catalytic Reforming Reactions to Produce High-Octane Gasoline Jeremías Martínez *, María Antonieta Zúñiga-Hinojosa and Richard Steve Ruiz-Martínez * Unidad Iztapalapa, División de Ciencias Básicas e Ingeniería, Departamento de Ingeniería de Procesos e Hidráulica, Universidad Autónoma Metropolitana, Av. San Rafael Atlixco 186, Leyes de Reforma 1ra Secc. Iztapalapa, Ciudad de Mexico 09340, Mexico; [email protected] * Correspondence: [email protected] (J.M.); [email protected] (R.S.R.-M.) Abstract: The catalytic naphtha reforming process is key to producing high-octane gasoline. Dozens of components are involved in this process in hundreds of individual catalytic reactions. Calcula- tions of concentrations at equilibrium, using equilibrium constants, are commonly performed for a small number of simultaneous reactions. However, the Gibbs free energy minimization method is recommended for the solution of complex reaction systems. This work aims to analyze, from the point of view of thermodynamic equilibrium, the effect of temperature, pressure, and the H 2 /HC ratio on the reactions of the catalytic reformation process and evaluate their impact on the produc- tion of high-octane gasoline. Gibbs’s free energy minimization method was used to evaluate the molar concentrations at equilibrium. The results were compared with those obtained in the simu- lation of a catalytic reforming process to evaluate the optimal conditions under which the process should operate. Keywords: thermodynamic equilibrium; Gibbs free energy; catalytic reforming; Research Octane Number 1. Introduction The maximum amounts of products formed from a specific reaction are achieved at equilibrium under specific pressure and temperature [1]. Therefore, knowing equilibrium compositions can help design new catalysts and processes and improve existing plant operations by maximizing the production of desired products and eliminating or reducing the undesired side reactions [1]. There are two general approaches for calculating chemical equilibrium compositions for multi-reaction systems based on the minimum free energy: the constant equilibrium method and the free energy minimization method. In the first method, the overall reactions are written, and their equilibrium constants are calculated. The mathematical expres- sions for the equilibrium reaction equations are usually non-linear, and their number and complexity increase as the number of species in a reaction increases. Some of the disadvan- tages of this method are complications for the appropriate component selection; numerical troubles with compositions that become extremely small; inconvenience in testing for the presence of some condensed species; difficulties in extending the generalized method to non-ideal equations of state [1–3]. Free energy minimization is a more direct and general method for solving complex chemical systems [4,5]. Gibbs’s free energy minimization method does not consider indi- vidual equilibrium constants nor the chemistry of reactions; it is based on the principle that the total Gibbs free energy of the system has its minimum value at chemical equilibrium [4]. Gibbs’s free energy minimization problems are typically based on equation solving methods and direct optimization strategies and are widely discussed elsewhere [2,3,6,7]. Equation- solving methods solve the non-linear equations obtained from the stationary conditions subjected to mass balance and chemical equilibrium constraints [8]. However, this method Processes 2022, 10, 313. https://doi.org/10.3390/pr10020313 https://www.mdpi.com/journal/processes
-
Upload
khangminh22 -
Category
Documents
-
view
0 -
download
0
Transcript of A Thermodynamic Analysis of Naphtha Catalytic Reforming ...

�����������������
Citation: Martínez, J.; Zúñiga-
Hinojosa, M.A.; Ruiz-Martínez, R.S.
A Thermodynamic Analysis of
Naphtha Catalytic Reforming
Reactions to Produce High-Octane
Gasoline. Processes 2022, 10, 313.
https://doi.org/10.3390/pr10020313
Academic Editor: Alessandro
D’ Adamo
Received: 10 January 2022
Accepted: 4 February 2022
Published: 6 February 2022
Publisher’s Note: MDPI stays neutral
with regard to jurisdictional claims in
published maps and institutional affil-
iations.
Copyright: © 2022 by the authors.
Licensee MDPI, Basel, Switzerland.
This article is an open access article
distributed under the terms and
conditions of the Creative Commons
Attribution (CC BY) license (https://
creativecommons.org/licenses/by/
4.0/).
processes
Article
A Thermodynamic Analysis of Naphtha Catalytic ReformingReactions to Produce High-Octane GasolineJeremías Martínez *, María Antonieta Zúñiga-Hinojosa and Richard Steve Ruiz-Martínez *
Unidad Iztapalapa, División de Ciencias Básicas e Ingeniería, Departamento de Ingeniería de Procesos eHidráulica, Universidad Autónoma Metropolitana, Av. San Rafael Atlixco 186, Leyes de Reforma 1ra Secc.Iztapalapa, Ciudad de Mexico 09340, Mexico; [email protected]* Correspondence: [email protected] (J.M.); [email protected] (R.S.R.-M.)
Abstract: The catalytic naphtha reforming process is key to producing high-octane gasoline. Dozensof components are involved in this process in hundreds of individual catalytic reactions. Calcula-tions of concentrations at equilibrium, using equilibrium constants, are commonly performed fora small number of simultaneous reactions. However, the Gibbs free energy minimization methodis recommended for the solution of complex reaction systems. This work aims to analyze, from thepoint of view of thermodynamic equilibrium, the effect of temperature, pressure, and the H2/HCratio on the reactions of the catalytic reformation process and evaluate their impact on the produc-tion of high-octane gasoline. Gibbs’s free energy minimization method was used to evaluate themolar concentrations at equilibrium. The results were compared with those obtained in the simu-lation of a catalytic reforming process to evaluate the optimal conditions under which the processshould operate.
Keywords: thermodynamic equilibrium; Gibbs free energy; catalytic reforming; Research OctaneNumber
1. Introduction
The maximum amounts of products formed from a specific reaction are achieved atequilibrium under specific pressure and temperature [1]. Therefore, knowing equilibriumcompositions can help design new catalysts and processes and improve existing plantoperations by maximizing the production of desired products and eliminating or reducingthe undesired side reactions [1].
There are two general approaches for calculating chemical equilibrium compositionsfor multi-reaction systems based on the minimum free energy: the constant equilibriummethod and the free energy minimization method. In the first method, the overall reactionsare written, and their equilibrium constants are calculated. The mathematical expres-sions for the equilibrium reaction equations are usually non-linear, and their number andcomplexity increase as the number of species in a reaction increases. Some of the disadvan-tages of this method are complications for the appropriate component selection; numericaltroubles with compositions that become extremely small; inconvenience in testing for thepresence of some condensed species; difficulties in extending the generalized method tonon-ideal equations of state [1–3].
Free energy minimization is a more direct and general method for solving complexchemical systems [4,5]. Gibbs’s free energy minimization method does not consider indi-vidual equilibrium constants nor the chemistry of reactions; it is based on the principle thatthe total Gibbs free energy of the system has its minimum value at chemical equilibrium [4].Gibbs’s free energy minimization problems are typically based on equation solving methodsand direct optimization strategies and are widely discussed elsewhere [2,3,6,7]. Equation-solving methods solve the non-linear equations obtained from the stationary conditionssubjected to mass balance and chemical equilibrium constraints [8]. However, this method
Processes 2022, 10, 313. https://doi.org/10.3390/pr10020313 https://www.mdpi.com/journal/processes

Processes 2022, 10, 313 2 of 22
fails to converge to the correct solution when initial estimates are unsuitable, especially fornon-ideal multicomponent and multi-reactive systems [6,8]. The use of Lagrange multipli-ers is usually the preferred approach for Gibbs minimization, but its performance is highlydependent on initial estimates of Lagrange multipliers [2,3,6,9]. Alternatively, stochasticoptimization techniques have also been applied for minimizing the Gibbs free energy [3,6].
Gibbs’s free energy minimization method has been used to study chemical systemsof moderate complexity such as methanation reactions [4], steam reforming of methanol,ethanol, and glycerin for hydrogen production [10–12], reduction of silicon dioxide [13] andthe esterification reaction [14]; and more complex systems such as the Claus process [1].
One of the objectives of this work is to apply Gibbs’s free energy minimization methodto the naphtha reforming process for calculating equilibrium compositions. Catalytic naph-tha reforming is a key process to produce high-octane gasoline and aromatic feedstocksfor petrochemical industries [15]. It is a multi-reactive system with more than 100 com-pounds participating in hundreds of individual catalytic reactions [16]. Since catalystsdo not change the thermodynamics of a chemical reaction, we compared the equilibriumcompositions with those obtained for a catalytic process.
The present work aims to thermodynamically analyze the effect of temperature, pres-sure, and H2/HC ratio on catalytic naphtha reforming. We compared the thermodynamiccalculations with the simulated results obtained for a catalytic naphtha reforming plant.We analyzed the impact of the operating conditions on the Research Octane Number, oneof the main parameters used in the quality control of gasoline.
To our knowledge, no thermodynamic analysis has been made for the catalytic naphthareforming process based on Gibbs’s free energy minimization method.
2. Methodology2.1. Problem Delimitation
The naphtha feed to the catalytic reformer is a fraction of crude oil that boils betweenapproximately 70 and 200 ◦C. It is a very complex mixture consisting of about threehundred components with the carbon number range from 5 to 9+ [17,18], mainly alkanesand cycloalkanes, although there may also be a small fraction of aromatics [19].
The naphtha reforming process aims to increase the low Research Octane Number(RON). A Pt/Re bifunctional catalyst promotes the dehydrogenation and dehydroisomeriza-tion of naphthenes to aromatics, dehydrogenation of paraffins to olefins, dehydrocyclizationof paraffins and olefins to aromatics, isomerization or hydroisomerization to iso-paraffins,isomerization of alkyl cyclopentanes and substituted aromatics and hydrocracking ofparaffins and naphthenes to lower hydrocarbons [18,19].
Many studies related to new catalyst development, kinetic and deactivation models,reactor configuration, and operation modes have been accomplished for the catalyticnaphtha reforming process and are widely discussed in [18,20].
A detailed reaction network, considering all components and reactions, is beyondthe scope of this work. Subsequently, for the thermodynamics analysis, we grouped thecomponents in gases, paraffins, naphthenes, and aromatics, and we assumed that theycould be well represented for the model compounds given in Table 1.

Processes 2022, 10, 313 3 of 22
Table 1. Model compounds for the thermodynamics analysis.
Symbol Model Compound Symbol Model Compound
Gases Isoparaffins
H2 Hydrogen ip6 2-MethylpentaneC1 Methane ip7 2-MethylhexaneC2 Ethane ip8+ 2-MethylheptaneC3 Propane NaphthenesC4 Butane N6 MethylcyclopentaneC5 Pentane N7 Methylcyclohexane
N8+ EthylcyclohexaneParaffins Aromatics
np6 n-hexane A6 Benzenenp7 n-heptane A7 Toluene
np8+ n-octane A8+ Ethylbenzene
2.2. Thermodynamic Analysis
According to Gibbs’s free energy minimization method, the total Gibbs free energy ofa reactive system reaches a minimum value at equilibrium [4,21]. Equilibrium calculationsinvolve the global minimization of Gibbs free energy constrained by the material balancesand chemical equilibrium restrictions.
The total Gibbs free energy of the system is given as follows [5]:
nG(ni, T, P) =N
∑i=1
ni∆G0f i +
N
∑i=1
niRT ln P +N
∑i=1
niRT ln yi +N
∑i=1
niRT ln ∅̂i (1)
The global optimization problem can be solved by finding the set of ni that minimizesnG (Equation (1)) for specified T and P. In a reactive system, molecular species are notconserved; nevertheless, the total number of atoms of each element remains constant [21].Subsequently, the material balance constraints are formulated as follow:
∑i
niaij = bj, j = 1, . . . , K (2)
The subscript j identifies a particular atom, and K is the total number of the differentelements present in the system. The bj parameter is the total number of atomic masses ofthe kth element in the system, while the aij parameter is the number of atoms of the kthelement present in each molecule of chemical species i.
When liquid and gas phases are both present in an equilibrium mixture of reacting species,a vapor/liquid equilibrium criterion must be satisfied along with Equations (1) and (2). Inour particular case, it is assumed that reforming reactions occur only in the gas phase, sincethey are carried out at high temperatures (>600 K).
2.3. Standard Gibbs-Energy Change of Reaction
The Standard Gibbs-energy change for the reactions at equilibrium is calculated asfollows [21]:
∆Go
RT=
∆Go0 − ∆Ho
0RT0
+∆Ho
0RT
+1T
∫ T
T0
∆CoP
RdT −
∫ T
T0
∆CoP
RdT (3)
Calculation of the Fugacity Coefficients
The fugacity coefficients were calculated according to the Soave–Redlich–Kwongequation of state [22]:
ln ∅̂i =BiB(z− 1)− ln(z− B) +
AB
[BiB− 2
aα
m
∑j
yj(aα)ij
]ln(
1 +Bz
)(4)

Processes 2022, 10, 313 4 of 22
Binary interaction parameters kij were taken as 0 for hydrocarbon pairs and hydrogenas given in [22].
The SRK equation of state gives the compressibility factor z:
f (z) = z3 − z2 +(
A− B− B2)
z− AB = 0 (5)
The critical properties and ideal gas standard Gibbs free energy at standard conditionsand constants for CP calculations are shown in Tables 2 and 3, respectively.
Table 2. Critical properties and ideal gas standard Gibbs free energy [21].
Compound w Tc, K Pc, bar ∆H0298, J/mol G0
298, J/mol
H2 −0.2160 33.19 13.13 0 0C1 0.0120 190.60 45.99 −74,520 −50,460C2 0.1000 305.30 48.72 −83,820 −31,855C3 0.1520 369.80 42.48 −104,680 −24,290C4 0.2000 425.10 37.96 −125,790 −16,570C5 0.2520 469.70 33.70 −146,760 −8650ip6 0.3010 507.60 30.25 −174,300 * −2800 *ip7 0.3500 540.20 27.40 −196,200 * 5620 *
ip8+ 0.4000 568.70 24.90 −215,500 * 14,040 *np6 0.2774 497.50 30.05 −166,920 150np7 0.3277 530.37 27.34 −187,780 8260
np8+ 0.3772 559.64 24.84 −208,750 16,260N6 0.2300 532.80 37.85 −108,100 * 36,190 *N7 0.2350 572.2 34.71 −154,770 27,480
N8+ 0.2455 609.15 30.40 −172,600 * 40,930 *A6 0.2100 562.20 48.98 82,930 129,665A7 0.2620 591.80 41.06 50,170 122,050
A8+ 0.3030 617.20 36.06 29,920 130,890* Taken from Chemical and Physical Properties by Cheméo [23].
Table 3. Constants for ideal gas heat capacity [24].
∆CoP
R = ∆A + ∆BT + ∆CT2 + ∆DT3 + ∆ET4
Compound A B × 103 C × 106 D × 1010 E × 1014
C −0.50686 6.45776 −4.70494 15.59118 −19.04428H2 3.24631 1.43467 −2.89398 25.8003 −73.9095C1 4.34610 −6.14488 26.62607 −219.29980 588.89965C2 4.00447 −1.33847 42.86416 −452.24460 1440.48530C3 3.55751 10.07312 39.13602 −475.72200 1578.16560C4 2.91601 28.06907 15.37435 −292.92550 1028.04620C5 4.06063 29.87141 30.46993 −461.35230 1559.89710ip6 0.44073 60.77573 −10.93570 −180.70573 833.40865ip7 0.57808 70.71556 −15.00679 −187.48705 899.92106
ip8+ 0.92650 78.42561 −11.24742 −281.97592 1265.61161np6 3.89054 41.42970 24.35860 −457.52220 1599.41000np7 4.52739 47.36877 31.09932 −570.22085 1999.68224
np8+ 4.47277 57.81747 29.07465 −621.09106 2265.33690N6 −6.81073 80.58175 −50.42977 141.93915 −107.77270N7 −8.75751 100.20540 −62.47659 169.33320 −123.27361
N8+ −5.50074 91.59292 −26.04906 −192.84542 1021.80248A6 −7.29786 75.33056 −69.66390 336.46848 −660.39655A7 −2.46286 57.69575 −19.66557 −106.61110 −654.52596
A8+ 4.72510 9.02760 141.18870 −1989.23470 8167.18050
The fmincon Matlab function was used to find the ni set that minimizes the total Gibbsfree energy (Equation (1)), constrained to the elemental balances (of Equation (2)), and the

Processes 2022, 10, 313 5 of 22
z function (Equation (5)). To evaluate the equilibrium, we use the molar flow compositionat the inlet of the catalytic naphtha reforming process given in Table 4.
Table 4. Molar composition of the feed flow rate [25].
Model Compound Molar Flow kmol/h mol% Model Compound Molar Flow kmol/h mol%
H2 4173.8 69.69 ip6 4.53 0.08C1 579.25 9.67 ip7 52.80 0.88C2 292.33 4.88 ip8+ 143.11 2.39C3 232.78 3.89 N6 1.16 0.02C4 113.68 1.90 N7 7.94 0.13C5 21.66 0.36 N8+ 18.35 0.31np6 15.83 0.26 A6 88.50 1.48np7 65.95 1.10 A7 81.02 1.35
np8+ 91.93 1.53 A8+ 4.60 0.08
2.4. Composition of the Catalytic Reforming Products
Experimental results and ample plant experience have shown that catalytic naphthareforming reactions are quite sensitive to operating temperature and pressure and on thehydrogen to hydrocarbon ratio (H2/HC). However, their effect on the various reformingreactions can differ. A simplified classification of the main reactions that take place duringnaphtha reforming is exemplified in Figure 1 and consist of: (a) Naphtenes dehydrogena-tion to aromatics, (b) alkyl cyclopentanes dehydroisomerization to aromatics, (c) alkanesdehydrocyclization to aromatics, (d) n-alkanes isomerization to branched alkanes, and(e) cracking reactions leading to lower carbon products with regard to the reactants [26].These reactions are not affected in the same way by the operating conditions, while reac-tions that form aromatics (Figure 1a–c) are highly endothermic and thermodynamicallybenefit from higher temperatures and lower hydrogen partial pressures, operating undersuch conditions will clearly have negative effects on catalyst deactivation by coke depo-sition. Furthermore, exothermic reactions such as paraffin isomerization to alkenes andhydrocracking and hydrogenolysis (Figure 1e,d) will be facilitated by lower temperaturesand the latter higher hydrogen partial pressure. Therefore, it is evident that the mutualinterference of the operating factors on the main reactions makes naphtha reforming acomplicated process.
For the simulation of catalytic naphtha reforming, we used the kinetic model reportedby Arani et al., 2009, and the naphtha composition given in Table 4. In the kinetic model,C1–C5 hydrocarbons are considered light paraffins. The C6 to C8+ naphtha cuts are labeledas iso-paraffins, normal paraffins, and naphthenes aromatics. In reaction network, thereversible reactions of iso-paraffins produce normal paraffins, normal paraffins react toform naphthenes, and naphthenes form aromatics. Light paraffins are formed from theirreversible hydrocracking reactions of the iso-paraffins and aromatic fractions. The maindifference between Arani et al. and this work is that in the first, the mole fractions ofnaphtha cuts with more than eight carbon numbers are lumped together, while we assumethat a model compound can effectively represent eight carbon cuts.
The reaction section is split into three catalytic reactors. A furnace heats the feedstockback to the desired temperature to maintain an appropriate temperature between eachreactor. Reactors are of different sizes, with the smallest one located in the first positionand the largest one in the last. The typical reactor inlet temperature is around 774 K, andthe typical pressure is around 2.8 MPa.
A typical Pt/Al2O3 catalyst promotes the reforming reactions. Both Pt and Aluminaprovide a different role in the reforming reactions. The metal sites catalyze hydrocarbons’hydrogenation and dehydrogenation reactions, while the alumina’s acid sites are known tocatalyze hydrocarbon rearrangements reactions [26].

Processes 2022, 10, 313 6 of 22Processes 2022, 10, x FOR PEER REVIEW 6 of 24
Figure 1. Catalytic reforming reactions. a) Naphtenes dehydrogenation to aromatics, (b) alkyl cyclo-pentanes dehydroisomerization to aromatics, (c) alkanes dehydrocyclization to aromatics, (d) n-al-kanes isomerization to branched alkanes, and (e) cracking reactions to lower carbon products.
For the simulation of catalytic naphtha reforming, we used the kinetic model re-ported by Arani et al., 2009, and the naphtha composition given in Table 4. In the kinetic model, C1–C5 hydrocarbons are considered light paraffins. The C6 to C8+ naphtha cuts are labeled as iso-paraffins, normal paraffins, and naphthenes aromatics. In reaction network, the reversible reactions of iso-paraffins produce normal paraffins, normal paraffins react to form naphthenes, and naphthenes form aromatics. Light paraffins are formed from the irreversible hydrocracking reactions of the iso-paraffins and aromatic fractions. The main difference between Arani et al. and this work is that in the first, the mole fractions of naph-tha cuts with more than eight carbon numbers are lumped together, while we assume that a model compound can effectively represent eight carbon cuts.
The reaction section is split into three catalytic reactors. A furnace heats the feedstock back to the desired temperature to maintain an appropriate temperature between each reactor. Reactors are of different sizes, with the smallest one located in the first position and the largest one in the last. The typical reactor inlet temperature is around 774 K, and the typical pressure is around 2.8 MPa.
A typical Pt/Al2O3 catalyst promotes the reforming reactions. Both Pt and Alumina provide a different role in the reforming reactions. The metal sites catalyze hydrocarbons’ hydrogenation and dehydrogenation reactions, while the alumina’s acid sites are known to catalyze hydrocarbon rearrangements reactions [26].
Tables 5–8 summarize the expected reforming reactions according to the model com-pounds given in Table 1.
Figure 1. Catalytic reforming reactions. (a) Naphtenes dehydrogenation to aromatics, (b) alkylcyclopentanes dehydroisomerization to aromatics, (c) alkanes dehydrocyclization to aromatics, (d) n-alkanes isomerization to branched alkanes, and (e) cracking reactions to lower carbon products.
Tables 5–8 summarize the expected reforming reactions according to the model com-pounds given in Table 1.
Table 5. Isomerization of paraffins.
Chemical Reaction Reaction Rate
i-C6H14 n-C6H14
iso-hexane 2-Methylpentane rIso iP6 = φkI iP6 e(−Ea/RT)
(PiP6−
PnP6KiP6↔nP6
)PH2 Γ
i-C7H16 n-C7H16
iso-heptane 2-Methylhexane rIso iP7 = φkI iP7 e(−Ea/RT)
(PiP7−
PnP7KiP7↔nP7
)PH2 Γ
i-C8H18 n-C8H18
iso-octane 2-Methylheptane rIso iP8 = φkI iP8 e(−Ea/RT)
(PiP8−
PnP8KiP8↔nP8
)PH2 Γ
Table 6. Dehydrocyclization of paraffins.
Chemical Reaction Reaction Rate
C6H14
n-hexane
C6H12
Methylcyclopentane+ H2 rDHC nP6 = φkDHC nP6 e(−Ea/RT)
(PnP6−
PN6PH2
KnP6 ↔N6
)PH2 Γ
C7H16
n-heptane
C7H14
Methylcyclohexane+ H2 rDHC nP7 = φkDHC nP7 e(−Ea/RT)
(PnP7−
PN7PH2
KnP7 ↔N7
)PH2 Γ
C8H18n-octane
C8H16
Ethylcyclohexane+ H2 rDHC nP8 = φkDHC nP8 e(−Ea/RT)
(PnP8−
PN8PH2
KnP8 ↔N8
)PH2 Γ

Processes 2022, 10, 313 7 of 22
Table 7. Dehydrogenation of naphthenes.
Chemical Reaction Reaction Rate
C6H12
Methylcyclopentane
C6H6
Benzene+ 3H2 rDH N6 = φkDH N6 e(−Ea/RT)
(PN6−
PA6PH2
KnP6 ↔N6
)PH2 Γ
C7H14
Methylcyclohexane
C7H8
Toluene+ 3H2 rDH N7 = φkDH N7 e(−Ea/RT)
(PN7−
PA8PH2
KN7 ↔A7
)PH2 Γ
C8H16
Ethylcyclohexane
C8H10
Ethylbenzene+ 3H2 rDH N8 = φkDH N8 e(−Ea/RT)
(PN8−
PA8PH2
KN8 ↔A8
)PH2 Γ
Table 8. Hydrocracking reactions.
Chemical Reaction Reaction Rate
n-C5H12 + H2 → 1/2 CH4 + 1/2 C2H6 + 1/2 C3H8 + 1/2 C4H10 rHDCrack iP5 = φkHDCrack iP5 e(−Ea/RT) PiP5Γ
i-C6H14 + H2 → 1/3 CH4 + 1/3 C2H6 + 2/3 C3H8 + 1/3 C4H10 + 1/3 C5H12 rHDCrack iP6 = φkHDCrack iP6 e(−Ea/RT) PiP6Γ
i-C7H16 + H2 → 1/3 CH4 + 1/3 C2H6 + 1/3 C3H8 + 1/3 C4H10 + 1/3 C5H12 + 1/3 i-C6H14 rHDCrack iP7 = φkHDCrack iP7 e(−Ea/RT) PiP7Γ
i-C8H18 + H2 →1/4 CH4 + 1/4 C2H6 + 1/4 C3H8 + 1/2 C4H10 + 1/4 C5H12 + 1/4 i-C6H14 +
1/4 i-C7H16rHDCrack iP8 = φkHDCrack iP8 e(−Ea/RT) PiP8
Γ
C7H8 Toluene + H2 → C6H6 Benzene + CH4 rHDCrack A7 = φkHDCrack A7 e(−Ea/RT) PA7Γ
C8H10Ethylbenzene + H2 →
1/2 C7H8 Toluene + 1/2 C6H6Benzene
+ 1/2 CH4
+ 1/2 C2H6
rHDCrack A8 = φkHDCrack A8 e(−Ea/RT) PA8Γ
The catalyst deactivation function is as follow:
φ =
[−kde(−
EdR [ 1
T−1
TR])(−m + 1)(t) + 1
]( 1−m+1 )
(6)
The kinetic parameters for the reaction rate expressions given in Tables 5–8 and thedeactivation parameters for Equation (15) were taken from Arani et al., 2009.
Pressure drops were calculated according to Ergun’s Equation.
dPdw
= − Gρdp ϕ3
[150(1− ϕ)µ
dp+
1Acρc
](7)
Temperature variations in the catalytic bed were attained by the following differentialequation:
dTdw
=nr
∑j=1
rj∆HRj /nC
∑i=1
FiCpi (8)
Since radial and axial dispersion effects are minimal under usual reactor operatingconditions [27], the material balances were defined in terms of molar flow by assuming aperfect plug flow reactor.
dFH2dw =
[rDHC nP6
]+[rDHC nP7
]+[rDHC nP8
]+ (3)
[rDH N6
]+ (3)
[rDH N7
]+ (3)
[rDH N8
]−[rHDCrack iP5
]−[rHDCrack iP6
]−[rHDCrack iP7
]−[rHDCrack iP8
]−[rHDCrack A7
]−[rHDCrack A8
] (9)
dFC1
dw= (1/2)
[rHDCrack iP5
]+ (1/3)
[rHDCrack iP6
]+ (1/3)
[rHDCrack iP7
]+ (1/4)
[rHDCrack iP8
]+[rHDCrack A7
]+ (1/2)
[rHDCrack A8
](10)
dFC2
dw= (1/2)
[rHDCrack iP5
]+ (1/3)
[rHDCrack iP6
]+ (1/3)
[rHDCrack iP7
]+ (1/4)
[rHDCrack iP8
]+ (1/2)
[rHDCrack A8
](11)
dFC3
dw= (1/2)
[rHDCrack iP5
]+ (2/3)
[rHDCrack iP6
]+ (1/3)
[rHDCrack iP7
]+ (1/4)
[rHDCrack iP8
](12)

Processes 2022, 10, 313 8 of 22
dFC4
dw= (1/2)
[rHDCrack iP5
]+ (1/3)
[rHDCrack iP6
]+ (1/3)
[rHDCrack iP7
]+ (2/4)
[rHDCrack iP8
](13)
dFC5
dw= −
[rHDCrack nP5
]+ (1/3)
[rHDCrack iP6
]+ (1/3)
[rHDCrack iP7
]+ (1/4)
[rHDCrack iP8
](14)
dFnP6
dw=[rIso iP6
]−[rDHC nP6
](15)
dFnP7
dw= (1)
[rIso iP7
]− (1)
[rDHC nP7
](16)
dFnP8
dw=[rIso iP8
]−[rDHC nP8
](17)
dFiP6
dw= −[rIso iP6]−
[rHDCrack iP6
]+ (1/3)
[rHDCrack iP7
]+ (1/4)
[rHDCrack iP8
](18)
dFiP7
dw= −
[rIso iP7
]−[rHDCrack iP7
]+ (1/4)
[rHDCrack iP8
](19)
dFiP8
dw= −
[rIso iP8
]−[rHDCrack iP8
](20)
dFN6
dw=[rDHC nP6
]−[rDH N6
](21)
dFN7
dw=[rDHC nP7
]−[rDH N7
](22)
dFN8
dw=[rDHC nP8
]−[rDH N8
](23)
dFA6
dw=[rDH N6
]+[rHDCrack A7
]+ (1/2)
[rHDCrack A8
](24)
dFA7
dw=[rDH N7
]−[rHDCrack A7
]+ (1/2)
[rHDCrack A8
](25)
dFA8+
dw=[rDH N8
]−[rHDCrack A8
](26)
To validate the assumption of the model compounds given in Table 1, Equations (6)–(26)were solved simultaneously by using the Runge-Kutta fourth order method to simulate theindustrial data reported for a catalytic naphtha reforming process given in [25].
The results are given in Table 9. We satisfactorily predict the aromatic fractions andfor most cases, the absolute error is below 5% when compared with the plant data. For thecases where the error is higher than 5%, we can observe that it is close to the error reportedby Arani et al., 2009.
Table 9. Model prediction of the industrial plant data.
Molar Composition % Abs ErrorPlant Data Arani et al. This Work Arani et al. This Work
H2 68.89 69.02 68.30 0.19 0.85C1 9.62 9.56 9.87 0.62 2.64C2 5.05 5.29 5.12 4.75 1.40C3 4.53 4.36 4.71 3.75 4.04C4 2.89 2.87 2.95 0.69 2.12C5 1.3 1.16 1.19 10.77 8.81np6 0.27 0.23 0.24 14.81 10.27np7 0.26 0.26 0.27 0.0 4.52np8+ 0.08 0.07 0.07 12.5 9.47ip6 0.63 0.67 0.65 6.35 3.83

Processes 2022, 10, 313 9 of 22
Table 9. Cont.
Molar Composition % Abs ErrorPlant Data Arani et al. This Work Arani et al. This Work
ip7 0.9 0.82 0.99 8.89 10.42ip8+ 0.32 0.36 0.35 12.5 10.64
N6–10 0.1 0.09 0.11 10.0 7.64A6 0.38 0.44 0.40 15.79 4.35A7 1.81 1.86 1.8 2.76 0.6A8+ 2.97 2.94 2.89 1.01 2.58
3. Results and Discussion
Catalytic reformers are designed for flexibility in operation, and changes in operatingparameters, such as temperature, pressure, and H2/HC ratio, which affect reformate qualityand yield. Reformers generally consist of a series of reactors that operate at a differenttemperature. The weight average bed temperature (WAIT) is a parameter of everydaypractice that refers to the sum of the inlet temperature to each reactor multiplied by theweight percent of the total catalyst in each reactor. Reaction temperatures are chosen topromote a catalyst activity that could counterbalance the catalyst deactivation rate. In thisregard, maximum reaction temperatures are reported in the range 733–798 K. However, inorder to optimize high octane products, some low-pressure processes operate at slightlyhigher temperatures. As reformate RON increases with reactor temperature, for instance,a RON range of 90–95, WAIT should increase approximately by a 2–3 K/RON increase,depending on feedstock [25].
Operating pressure is an important parameter that influences product quality andyield. Reformer reactors operate in the 0.5 to 1.1 MPa pressure range, and it is commonpractice that each of the reactors in series operates at different pressures. For instance, oper-ation under a decreasing pressure scheme on one side increases aromatics and hydrogenyield, but on the other increases coke formation and hence, catalyst deactivation. It hasbeen demonstrated that a decrease in pressure increases product yield. At a 100 RON level,liquid yield increases or decreases by about 2 volume percent of charge per each 0.8 MPachange in pressure [26].
Finally, the presence of hydrogen is essential to avoid catalyst deactivation and unde-sirable side reactions. However, operating at high hydrogen-to-hydrocarbon ratios impliesincreased energy costs from more significant hydrogen recycling rates. Therefore, thelower boundary is often dictated by the desired amount of hydrocracking and maximumacceptable catalyst deactivation to save energy. Former designs used H2/HC ratios in therange 8–10 while modern reformers, that benefit from highly active catalysts, operate in the2–5 range and 0.5–1.1 H2 partial pressure range.
3.1. Temperature Effect
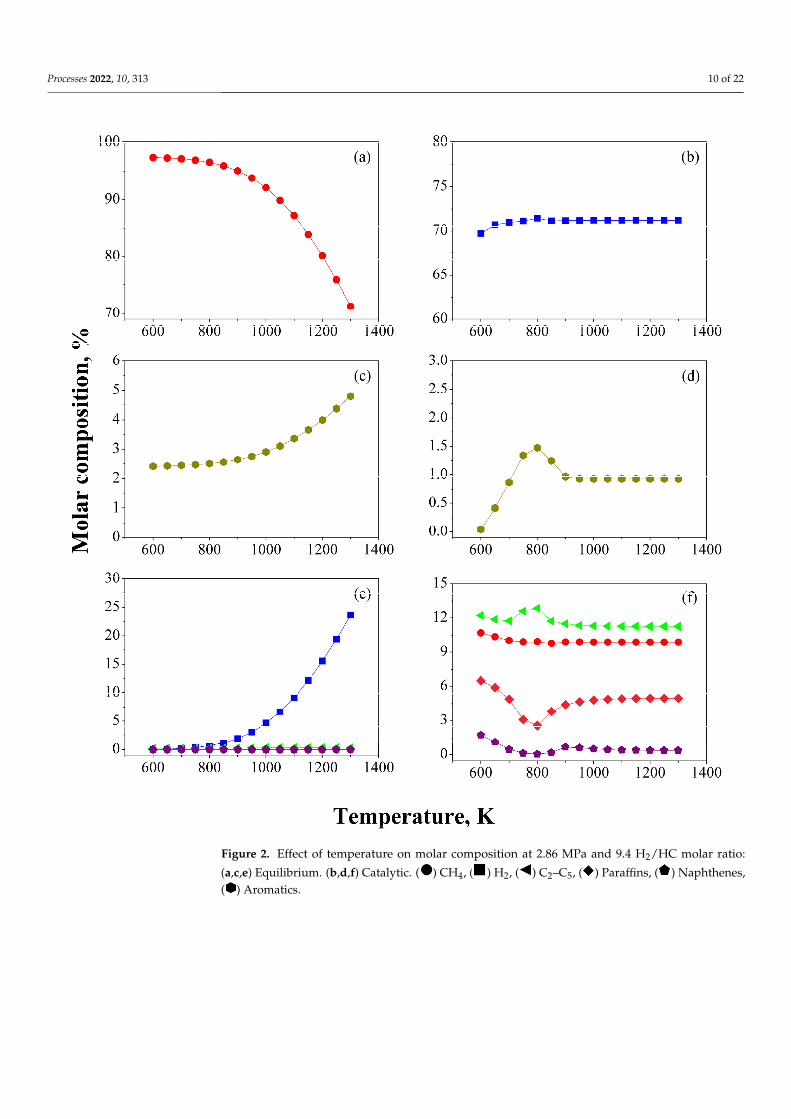
According to the equilibrium calculations, it can be seen in Figure 2c that aromat-ics and hydrogen formation are favored at temperatures higher than 800 K. Moreover,paraffins, naphthenes, and C2–C5 are entirely consumed in the range of 600–1300 K. Attemperatures lower than 800 K, there is an important methane production (Figure 2a),while the hydrogen production is less than 1% (Figure 2c). Methane production is associ-ated with the hydrocracking reactions, since they typically occur at temperatures in therange of 573–723 K [28–30]. Additionally, they demand a large amount of hydrogen, about0.5–0.8 wt% relative to the feed, for saturating the cracking fractions [31]. At temperatureshigher than 800 K, the isomerization reaction of iso-paraffins to paraffins, the hydroacyla-tion reactions of paraffins to naphthene, and the dehydrogenation of naphthenes are highlyfavored to increase aromatic production.
Processes 2022, 10, 313 10 of 22
Processes 2022, 10, x FOR PEER REVIEW 11 of 24
Figure 2. Effect of temperature on molar composition at 2.86 MPa and 9.4 H2/HC molar ratio: (a), (c), (e) Equilibrium. (b), (d), (f) Catalytic. ( ) CH4, ( ) H2, ( ) C2–C5, ( ) Paraffins, ( ) Naph-thenes, ( ) Aromatics.
The hydrogen production increase correlates to the dehydrogenation of naphthenes to aromatics, which boosts hydrogen production at temperatures higher than 900 K (Figure 2e). In Figure 2a, it can also be observed that methane production decreases as reaction temperature increases, indicating that reforming reactions become more favored than hydrocracking reactions at such conditions.
On the other hand, we observed in Figure 2d that for the catalytic reforming, there is a maximum in the production of the aromatics at 800 K, which matches with the maxi-mum observed in the hydrogen production (Figure 2b) and the minimum observed in the paraffins and naphthenes composition (Figure 2f). The molar composition of methane
Figure 2. Effect of temperature on molar composition at 2.86 MPa and 9.4 H2/HC molar ratio:
(a,c,e) Equilibrium. (b,d,f) Catalytic. (
1
) CH4, (
1
) H2, (
1
) C2–C5, (
1
) Paraffins, (
1
) Naphthenes,(
1
) Aromatics.

Processes 2022, 10, 313 11 of 22
The hydrogen production increase correlates to the dehydrogenation of naphthenes toaromatics, which boosts hydrogen production at temperatures higher than 900 K (Figure 2e).In Figure 2a, it can also be observed that methane production decreases as reaction tempera-ture increases, indicating that reforming reactions become more favored than hydrocrackingreactions at such conditions.
On the other hand, we observed in Figure 2d that for the catalytic reforming, thereis a maximum in the production of the aromatics at 800 K, which matches with the max-imum observed in the hydrogen production (Figure 2b) and the minimum observed inthe paraffins and naphthenes composition (Figure 2f). The molar composition of methaneremains almost constant in the temperature range of 600 to 1300 K. The C2–C5 productionshows a maximum that agrees with the production of the aromatic. This confirmed that thedehydrogenation of naphthenes is favored by high reaction temperatures since they werealmost wholly converted [32].
Whether or not a catalyst is present, thermodynamics determines the equilibriumcomposition of reactants and products. Nonetheless, the presence of a catalyst allows thesystem to reach equilibrium faster. Based on this, it can be said that the catalyst used incatalytic naphtha reforming can still be improved to increase aromatics production. At800 K, molar composition for this fraction is only 1.5% for the catalytic process (Figure 2d),while at equilibrium it is about 2.5% (Figure 2c). Additionally, an increase in aromaticsproduction will also result in an increase in hydrogen production.
3.2. Pressure Effect
It is shown in Figures 3 and 4 that high pressures at both thermodynamics andcatalytic conditions are not favorable for the naphtha reforming process, which agrees withprevious studies reported in the literature [20]. Higher pressures promote the formationof light hydrocarbons (Figure 3a,b), and the formation of C1–C5 gases (Figure 3e,f), whichis mainly attributed to the hydrocracking reactions. This is confirmed by the increase inthe hydrogen consumption observed in Figure 3c,d since such reactions consume highamounts of hydrogen [33].
It can be seen in Figure 4a,c that at the equilibrium paraffins and naphthenes are whollyconverted to their corresponding intermediate compound to finally produce aromatics.Conversely, in the catalytic process, we observed that paraffins and naphthenes reach aminimum at 800 K (Figure 4b,d), which agrees with the maximum production of aromaticobserved in Figure 4f.
Dehydrocyclization and dehydrogenation are desired reactions, since they producehydrogen, and both are favored by low pressure and high temperature [34]. We observe inFigure 4b that the concentration of paraffin components increases as the pressure increases.This is probably because the dehydrocyclization reactions are favored at a higher reactionpressure and higher molecular weight of carbon number [32].
Figure 4e,f shows that low pressures favor aromatics production. The increase in pres-sure results in a lower rate of catalytic aromatization reactions [35], increasing naphthenes(Figure 4d) and decreasing aromatics (Figure 4f) composition.

Processes 2022, 10, 313 12 of 22
Processes 2022, 10, x FOR PEER REVIEW 13 of 24
Figure 3. Effect of pressure on gas products: (a), (c), (e) Equilibrium. (b), (d), (f) Catalytic. ( / ) CH4, ( / ) H2, ( / ) C2–C5.
Figure 4e,f shows that low pressures favor aromatics production. The increase in pressure results in a lower rate of catalytic aromatization reactions [35], increasing naph-thenes (Figure 4d) and decreasing aromatics (Figure 4f) composition.
Figure 3. Effect of pressure on gas products: (a,c,e) Equilibrium. (b,d,f) Catalytic. (
1
/
1
) CH4,
(
1
/
1
) H2, (
1
/
1
) C2–C5.

Processes 2022, 10, 313 13 of 22
Processes 2022, 10, x FOR PEER REVIEW 14 of 24
Figure 4. Effect of pressure on liquid products: (a), (c), (e) Equilibrium. (b), (d), (f) Catalytic. ( / ) Paraffins, ( / ) Naphthenes, and ( / ) Aromatics.
3.3. Effect of the H2/HC Ratio The molar H2/HC ratio (R) effect is depicted in Figures 5 and 6. We noted an increase
in CH4 (Figure 5a,b) and C2–C5 gas production (Figure 5e,f) when the molar H2/HC ratio increased.
Figure 4. Effect of pressure on liquid products: (a,c,e) Equilibrium. (b,d,f) Catalytic. (
1
/
1
) Paraffins,(
1
/
1
) Naphthenes, and (
1
/
1
) Aromatics.
3.3. Effect of the H2/HC Ratio
The molar H2/HC ratio (R) effect is depicted in Figures 5 and 6. We noted an increasein CH4 (Figure 5a,b) and C2–C5 gas production (Figure 5e,f) when the molar H2/HCratio increased.
These indicate that a higher R-value reduces aromatization and increases hydrocrack-ing [25]. Nonetheless, the C2–C5 contribution is less than 1% at both 10 MPa and 0.1 MPain the catalytic process (Figure 5f).
An increase in the H2/HC promotes the hydrocracking of paraffins, which decreasesparaffins composition when the R-value is increased (Figure 6b). This is confirmed inFigure 6d since naphthenes’s composition remains constant for all the R values at 800 K,

Processes 2022, 10, 313 14 of 22
the temperature at which the production of the maximum aromatic was observed for thecatalytic process (Figure 4f).
Figure 6e,f depict that an increase in the R-value significantly decreases aromaticproduction at low and high pressures. At 800 K, the production of the aromatic decreasesabout ten percentage points when the H2/HC ratio increases from 2 to 12, at both 0.1 and10 MPa.
Processes 2022, 10, x FOR PEER REVIEW 15 of 24
Figure 5. Effect of H2/HC molar ratio on gas products: (a), (c), (e) Equilibrium. (b), (d), (f) Catalytic. ( / ) CH4, ( / ) H2, ( / ) C2–C5.
These indicate that a higher R-value reduces aromatization and increases hy-drocracking [25]. Nonetheless, the C2–C5 contribution is less than 1% at both 10 MPa and 0.1 MPa in the catalytic process (Figure 5f).
Figure 5. Effect of H2/HC molar ratio on gas products: (a,c,e) Equilibrium. (b,d,f) Catalytic. (
1
/
1
)
CH4, (
1
/
1
) H2, (
1
/
1
) C2–C5.

Processes 2022, 10, 313 15 of 22
Processes 2022, 10, x FOR PEER REVIEW 16 of 24
Figure 6. Effect of H2/HC molar ratio on liquid products: (a), (c), (e) Equilibrium. (b), (d), (f) Cata-lytic. ( / ) Paraffins, ( / ) Naphthenes, and ( / ) Aromatics.
An increase in the H2/HC promotes the hydrocracking of paraffins, which decreases paraffins composition when the R-value is increased (Figure 6b). This is confirmed in Fig-ure 6d since naphthenes’s composition remains constant for all the R values at 800 K, the temperature at which the production of the maximum aromatic was observed for the cat-alytic process (Figure 4f).
Figure 6e,f depict that an increase in the R-value significantly decreases aromatic pro-duction at low and high pressures. At 800 K, the production of the aromatic decreases about ten percentage points when the H2/HC ratio increases from 2 to 12, at both 0.1 and 10 MPa.
3.4. Aromatics Distribution In Figure 7, we present the effect of pressure and temperature on the aromatic distri-
bution. We observed that, at the equilibrium, high temperatures favor the A6 aromatic production (Figure 7a), while low temperatures favor the production of A7 and A8+ aro-matics (Figure 7c,e). Regarding the pressure, we found that low pressure favors the A6
Figure 6. Effect of H2/HC molar ratio on liquid products: (a,c,e) Equilibrium. (b,d,f) Catalytic.(
1
/
1
) Paraffins, (
1
/
1
) Naphthenes, and (
1
/
1
) Aromatics.
3.4. Aromatics Distribution
In Figure 7, we present the effect of pressure and temperature on the aromatic dis-tribution. We observed that, at the equilibrium, high temperatures favor the A6 aromaticproduction (Figure 7a), while low temperatures favor the production of A7 and A8+ aro-matics (Figure 7c,e). Regarding the pressure, we found that low pressure favors the A6aromatic production (Figure 7a), while high pressures favor the production of A7 and A8+aromatics (Figure 7c,e).

Processes 2022, 10, 313 16 of 22
Processes 2022, 10, x FOR PEER REVIEW 17 of 24
aromatic production (Figure 7a), while high pressures favor the production of A7 and A8+ aromatics (Figure 7c,e).
Figure 7. Effect of pressure on aromatics molar composition (R = 9.4 H2/HC): (a), (c), (e) Equilibrium. (b), (d), (f) Catalytic. ( / ) C6 Aromatics, ( / ) C7 Aromatics, ( / ) C8 Aromatics.
We analyzed the aromatic distribution at 800 K for the catalytic process, the tempera-ture at which the maximum aromatic production was achieved. We observed in Figure 7b that the A6 aromatic production increases, while A7 an A8+ aromatic production decrease when pressure is increased (Figure 7d,f). It has been reported that C7 and C8+ aromatics formation increases when pressure is increased [32], which is the opposite of the behavior observed in Figures 7d,f, respectively. However, it is important to highlight that the reac-tivity of dehydrogenation reactions increases with an increase in the carbon number of naphthenes [36]. The larger the hydrocarbon chain of the non-aromatic compounds of the naphtha feedstock, the larger the carbon number of the naphthene produced, so that the higher reactivity towards C7 and C8+ aromatics.
Figure 7. Effect of pressure on aromatics molar composition (R = 9.4 H2/HC): (a,c,e) Equilibrium.(b,d,f) Catalytic. (
1
/
1
) C6 Aromatics, (
1
/
1
) C7 Aromatics, (
1
/
1
) C8 Aromatics.
We analyzed the aromatic distribution at 800 K for the catalytic process, the tempera-ture at which the maximum aromatic production was achieved. We observed in Figure 7bthat the A6 aromatic production increases, while A7 an A8+ aromatic production decreasewhen pressure is increased (Figure 7d,f). It has been reported that C7 and C8+ aromaticsformation increases when pressure is increased [32], which is the opposite of the behaviorobserved in Figure 7d,f, respectively. However, it is important to highlight that the reac-tivity of dehydrogenation reactions increases with an increase in the carbon number ofnaphthenes [36]. The larger the hydrocarbon chain of the non-aromatic compounds of thenaphtha feedstock, the larger the carbon number of the naphthene produced, so that thehigher reactivity towards C7 and C8+ aromatics.

Processes 2022, 10, 313 17 of 22
Additionally, we also analyzed the effect of the H2/HC ratio on the distribution ofaromatics (Figure 8). We found that the low R-value favors the production of the A6, A7,and A8+ aromatics at the equilibrium conditions as shown in Figure 8a,c,e, respectively.
Processes 2022, 10, x FOR PEER REVIEW 18 of 24
Additionally, we also analyzed the effect of the H2/HC ratio on the distribution of aromatics (Figure 8). We found that the low R-value favors the production of the A6, A7, and A8+ aromatics at the equilibrium conditions as shown in Figure 8a,c,e, respectively.
Figure 8. Effect of H2/HC ratio on aromatics distribution: (a), (c), (e) Equilibrium. (b), (d), (f) Cata-lytic. ( / ) C6 Aromatics, ( / ) C7 Aromatics, ( / ) C8+ Aromatics.
Otherwise, we noticed in Figure 8b,d,f that the H2/HC ratio does not significantly impact the C6–C8+ aromatic production in the catalytic process, neither at high nor at low pressure.
3.5. Research Octane Number If the composition of fuel is known, the Research Octane Number (RON) may be es-
timated in the following form [24]: 𝑅𝑂𝑁 = 𝑣 𝑅𝑂𝑁 + 𝑣 𝑅𝑂𝑁 + 𝑣 𝑅𝑂𝑁 + 𝑣 𝑅𝑂𝑁 + 𝑣 𝑅𝑂𝑁 (27)
The Research Octane Number for individual hydrocarbons was calculated as follow:
Figure 8. Effect of H2/HC ratio on aromatics distribution: (a,c,e) Equilibrium. (b,d,f) Catalytic.(
1
/
1
) C6 Aromatics, (
1
/
1
) C7 Aromatics, (
1
/
1
) C8+ Aromatics.
Otherwise, we noticed in Figure 8b,d,f that the H2/HC ratio does not significantlyimpact the C6–C8+ aromatic production in the catalytic process, neither at high nor atlow pressure.

Processes 2022, 10, 313 18 of 22
3.5. Research Octane Number
If the composition of fuel is known, the Research Octane Number (RON) may beestimated in the following form [24]:
RON = ∑ vNPi (RON)NPi+ ∑ vIPi (RON)IPi
+ ∑ vOi (RON)Oi+ ∑ vNi (RON)Ni
+ ∑ vAi (RON)Ai(27)
The Research Octane Number for individual hydrocarbons was calculated as follow:
RON = a + bT + cT2 + cT3 + eT4 (28)
T =Tb − 273.15
100(29)
The coefficients a–e are given in Table 10.
Table 10. Coefficients for RON estimation [24].
Hydrocarbons a b c d e
n-Paraffins 92.809 −70.97 −53 20 10Isoparaffins
2-Methyl-pentanes 95.927 −157.53 561 −600 2003-Methyl-pentanes 92.069 57.63 −65 0 0
2,2 Dimethyl-pentanes 109.38 −38.83 −26 0 02,2 Dimethyl-pentanes 97.652 −20.8 58 −200 100
Naphthenes −77.536 471.59 −418 100 0Aromatics 145.668 −54.336 16.276 0 0
Figure 9 shows the value of the octane number obtained with molar compositionobtained at both equilibrium and catalytic conditions. It is observed that an increase intemperature induces an increase in the octane number; however, an increase in pressureresults in a decrease in this property (Figure 9a,b). The impact of the H2/HC ratio on theRON at equilibrium is minimal. Increasing the R-value from 1 to 12 only increases theoctane number by approximately 0.5 units (Figure 9c).
We can see in Figure 9c,d that there is a maximum increase in the octane number attemperatures close to 800 K for the different pressures and H2/HC ratios that were analyzed.This behavior is linked to the hydrocracking reactions inasmuch as they are favored attemperatures higher than 800 K. Consequently, the fraction of aromatic compounds isdiminished, and so is that of the RON value.
According to Figure 9, it is convenient to operate at low pressure. Nevertheless, it hasbeen reported that decreasing the total pressure increases the coke formation over Pt/Al2O3catalysts. The increase in operating pressure contributes to less coke deposition on the metalfunction and higher stability, which is similar to adding Re or Ir to Pt to the catalyst [20].When analyzing the effect of the H2/HC ratio on the RON value, we observed that it has nosignificant impact, but it has been found in previous literature reports that H2/HC ratioslower than 3.6 decreases aromatic production and increase carbon deposition [37].
It is essential to highlight that the catalytic naphtha reforming process is accompaniedby side reactions that lead to carbonaceous deposits on both catalyst support and metallicsites, causing catalyst deactivation. Coke significantly alters the catalyst activity, selectivity,and lifetime [38].
Decreasing the H2/HC ratio at constant pressure produces more coke deposition onthe support [20]. Carbon deposition decreased with increasing pressure [20]; nevertheless,it has been reported that coke deposits predominantly on the support at high pressuresand can only be burned off at high temperatures, while the coke deposited under lowpressure is more easily removed by regeneration [38]. Increasing the reaction temperatureusually causes an increase in aromatics and reformate yields but also an increase in cokeamount [20].

Processes 2022, 10, 313 19 of 22
Processes 2022, 10, x FOR PEER REVIEW 20 of 24
Figure 9. Effect of operating conditions on the Research Octane Number. Effect of pressure: (a) Equi-librium, (b) Catalytic. Effect of H2/H ratio (10 MPa): (c) Equilibrium, (d) Catalytic.
It is essential to highlight that the catalytic naphtha reforming process is accompa-nied by side reactions that lead to carbonaceous deposits on both catalyst support and metallic sites, causing catalyst deactivation. Coke significantly alters the catalyst activity, selectivity, and lifetime [38].
Decreasing the H2/HC ratio at constant pressure produces more coke deposition on the support [20]. Carbon deposition decreased with increasing pressure [20]; nevertheless, it has been reported that coke deposits predominantly on the support at high pressures and can only be burned off at high temperatures, while the coke deposited under low pressure is more easily removed by regeneration [38]. Increasing the reaction temperature usually causes an increase in aromatics and reformate yields but also an increase in coke amount [20].
High severity accelerates coke formation and produces a decrease in aromatics and reformate yields [28], resulting in a decrease in the research octane. The decrease in the research octane number observed in Figure 9b,d at temperatures higher than 800 K agrees with the catalyst deactivation, which is incorporated in the reaction rate expressions for the catalytic reforming process (Tables 5–8) through the catalyst deactivation function given in Equation (15). It is recommended to operate below 823 K, since an irreversible deactivation of the catalyst occurs beyond this temperature due to sintering and loss of surface area and mechanical resistance [37].
Figure 9. Effect of operating conditions on the Research Octane Number. Effect of pressure: (a) Equi-librium, (b) Catalytic. Effect of H2/H ratio (10 MPa): (c) Equilibrium, (d) Catalytic.
High severity accelerates coke formation and produces a decrease in aromatics andreformate yields [28], resulting in a decrease in the research octane. The decrease in theresearch octane number observed in Figure 9b,d at temperatures higher than 800 K agreeswith the catalyst deactivation, which is incorporated in the reaction rate expressions for thecatalytic reforming process (Tables 5–8) through the catalyst deactivation function given inEquation (15). It is recommended to operate below 823 K, since an irreversible deactivationof the catalyst occurs beyond this temperature due to sintering and loss of surface area andmechanical resistance [37].
4. Conclusions
The effect of temperature, pressure, and H2/HC ratio on the products obtained fromthe naphtha reforming process was studied at equilibrium conditions and in the presenceof Pt/Al2O3 catalyst. In both cases, it is observed that an increase in temperature increasesthe production of aromatics. In contrast, an increase in pressure and H2/HC ratio decreasesaromatics production. This is directly related to the Research Octane Number since thisparameter highly depends on the aromatic content in the reformate.
It is important to highlight that the dehydrogenation of naphthenes towards aromaticsproduction is completely favored under equilibrium conditions. However, during catalyticreforming, the aromatization reaction competes with the hydrocracking of paraffins andaromatics, significantly reducing the production of high-octane number compounds.
According to equilibrium calculations, the highest value of the RON expected was 108.From the results of the simulation of the catalytic reforming, the highest RON value was 98,at 800 K. This gap in the RON value justifies the effort for the research for new catalysts

Processes 2022, 10, 313 20 of 22
and to evaluate alternative process configurations to reduce the severity of the process toobtain reformed gasoline with RON values greater than 98.
Author Contributions: Conceptualization, J.M. and M.A.Z.-H.; methodology, J.M. and M.A.Z.-H.;software, J.M. and M.A.Z.-H.; validation, J.M. and R.S.R.-M.; formal analysis, J.M. and R.S.R.-M.;investigation, J.M.; resources, J.M. and M.A.Z.-H.; data curation, J.M. and R.S.R.-M.; writing—originaldraft preparation, J.M. and M.A.Z.-H.; writing—review and editing, J.M., M.A.Z.-H. and R.S.R.-M.;visualization, R.S.R.-M.; supervision, R.S.R.-M. All authors have read and agreed to the publishedversion of the manuscript.
Funding: This research received no external funding.
Institutional Review Board Statement: Not applicable.
Informed Consent Statement: Not applicable.
Acknowledgments: The support provided by the UAM-Iztapalapa and Conacyt for this study isgratefully acknowledged by the authors.
Conflicts of Interest: The authors declare no conflict of interest.
Nomenclature
aij Number of gram atoms of element j in a mole of species iAc Cross section of flow in reactor∆A Sum of A coefficients in Table 3, according to reaction stoichiometryAij Matrix of aji’s∆B Sum of B coefficients in Table 3, according to reaction stoichiometryBi B value of the i-th component of the mixture∆C Sum of C coefficients in Table 3, according to reaction stoichiometry∆CP Standard heat-capacity change of reactionDH Dehydrogenation of naphthenesDHC Dehydrocyclization of paraffinsdp Diameter of catalyst particle∆D Sum of D coefficients in Table 3, according to reaction stoichiometryEa Activation energyEd Deactivation energy∆E Sum of E coefficients in Table 3, according to reaction stoichiometryFi Molar flow
GLight gases in Figure 1Superficial mass flux, kg/s·m2 in Equation (7)
∆G Standard Gibbs-energy change of reaction at temperature T∆G0 Standard Gibbs-energy change of reaction at reference temperature T0 (298 K)∆G0
f i Standard Gibbs-energy change of formation of species i∆H 0 Standard heat of reaction at reference temperature T0 (298 K)HDCrack Hydrocrackingi Carbon number: 6, 7, and 8+ip Iso-paraffinsISO Isomerization of paraffinsK Total number of atomic elementsKi Equilibrium constantkd Deactivation constantkDH Preexponential factor for the dehydrogenation reactionskDHC Preexponential factor for the dehydrocyclization reactionskDHCrack Preexponential factor for the hydrocracking reactionskI Preexponential factor for the isomeration reactionsm Deactivation ordernp Normal paraffins
NTotal number of species in the reaction mixture.Naphthenes in Figure 1

Processes 2022, 10, 313 21 of 22
nG Total Gibbs free energy of the systemni Number of moles of specie iP Total pressure of the systemPi Partial pressurePc Critical pressurePr Reduced pressureR Gas constantr Reaction rateRON Research Octane Numbert Time-on-stream
TTemperature of the systemTemperature for RON calculations defined in Equation (28)
Tb Boiling point, KTc Critical temperatureTr Reduced temperaturevAi Volumetric fraction of aromatic ivIPi Volumetric fraction of iso-paraffin ivNi Volumetric fraction of naphthene ivNPi Volumetric fraction of normal paraffin ivOi Volumetric fraction of olefin iyi, yj Mol fraction of species iw Weight of catalystz Compressibility factorGreek lettersΓ Adsorption term for the acid functionθ Adsorption term for the metal functionµ Viscosity of the mixtureρ Density of the mixtureρc Density of solid catalystϕ Bed void fractionφ Catalyst activity∅̂i Fugacity coefficient of species i in the gas mixture
References1. Maadah, G. Calculated Chemical Reaction Equilibrium for The Claus Process; Oklahoma State University: Stillwater, OK, USA, 1978.2. White, W.B.; Johnson, S.M.; Dantzig, G.B. Chemical Equilibrium in Complex Mixtures. J. Chem. Phys. 1958, 28, 751–755. [CrossRef]3. Tsanas, C. Simultaneous Chemical and Phase Equilibrium Calculations with Non-Stoichiometric Method. Ph.D. Thesis, Technical
University of Denmark, Lyngby, Denmark, 2018.4. Gao, J.; Wang, Y.; Ping, Y.; Hu, D.; Xu, G.; Gu, F.; Su, F. A thermodynamic analysis of methanation reactions of carbon oxides for
the production of synthetic natural gas. RSC Adv. 2012, 2, 2358–2368. [CrossRef]5. Lwin, Y. Chemical Equilibrium by Gibbs Energy Minimization on Spreadsheets. Int. J. Eng. Educ. 2000, 16, 335–339.6. Bonilla-Petriciolet, A.; Rangaiah, G.P.; Segovia-Hernández, J.G. Constrained and unconstrained Gibbs free energy minimization
in reactive systems using genetic algorithm and differential evolution with tabu list. Fluid Phase Equilibria 2011, 300, 120–134.[CrossRef]
7. Teh, Y.; Rangaiah, G. A Study of Equation-Solving and Gibbs Free Energy Minimization Methods for Phase EquilibriumCalculations. Chem. Eng. Res. Des. 2002, 80, 745–759. [CrossRef]
8. Seider, W.D.; Widagdo, S. Multiphase equilibria of reactive systems. Fluid Phase Equilibria 1996, 123, 283–303. [CrossRef]9. Koukkari, P.; Pajarre, R. Calculation of constrained equilibria by Gibbs energy minimization. Calphad 2006, 30, 18–26. [CrossRef]10. Lwin, Y.; Ramli, W.; Daud, W.; Mohamad, A.B.; Yaakob, Z. Hydrogen production from steam methanol reforming: Thermody-
namic analysis. Int. J. Hydrogen Energy 2000, 25, 47–53. [CrossRef]11. Adhikari, S.; Fernando, S.; Haryanto, A. A Comparative Thermodynamic and Experimental Analysis on Hydrogen Production by
Steam Reforming of Glycerin. Energy Fuels 2007, 21, 2306–2310. [CrossRef]12. Rossi, C.; Alonso, C.; Antunes, O.; Guirardello, R.; Cardozo-Filho, L. Thermodynamic analysis of steam reforming of ethanol and
glycerine for hydrogen production. Int. J. Hydrogen Energy 2009, 34, 323–332. [CrossRef]13. Wai, C.M.; Hutchison, S.G. Free energy minimization calculation of complex chemical equilibria: Reduction of silicon dioxide
with carbon at high temperature. J. Chem. Educ. 1989, 66. [CrossRef]14. Figueira, C.; Soares, R.; Lobato, F.; Steffen, V. A Comparative Study of Gibbs Free Energy Minimization in a Real System Using
Heuristic Methods. Comput. Aided Chem. Eng. 2009, 27, 1059–1064. [CrossRef]

Processes 2022, 10, 313 22 of 22
15. Ancheyta-Juárez, J.; Villafuerte-Macías, E. Experimental validation of a kinetic model for naphtha reforming. Stud. Surf. Sci. Catal.2001, 615–618. [CrossRef]
16. Zagoruiko, A.N.; Belyi, A.S.; Smolikov, M.D. Thermodynamically Consistent Kinetic Model for the Naphtha Reforming Process.Ind. Eng. Chem. Res. 2021, 60, 6627–6638. [CrossRef]
17. Hu, Y.; Su, H.; Chu, J. Modeling, simulation and optimization of commercial naphtha catalytic reforming process. In Proceedingsof the 42nd IEEE International Conference on Decision and Control (IEEE Cat. No.03CH37475), Maui, HI, USA, 9–12 December2003. [CrossRef]
18. Rodríguez, M.A.; Ancheyta, J. Detailed description of kinetic and reactor modeling for naphtha catalytic reforming. Fuel 2011, 90,3492–3508. [CrossRef]
19. Ross, J.R. Catalysis in the Production of Energy Carriers from Oil; Elsevier: Amsterdam, The Netherlands, 2018; pp. 233–249.[CrossRef]
20. Rahimpour, M.R.; Jafari, M.; Iranshahi, D. Progress in catalytic naphtha reforming process: A review. Appl. Energy 2013, 109,79–93. [CrossRef]
21. Joseph, M.; Smith, C.H.; van Ness, M.; Abbott, M.; Swihart, T. Introduction to Chemical Engineering Thermodynamics, 8th ed.;McGraw-Hill: Singapore, 2018.
22. Walas, S.M. Phase Equilibra in Chemical Engineering; Butterworth-Heinemann: Oxford, UK, 1985.23. Chemical & Physical Properties by Cheméo. Available online: https://www.chemeo.com/ (accessed on 14 July 2021).24. Riazi, M.R. Characterization and Properties of Petroleum Fractions, 1st ed.; ASTM: Philadelphia, PA, USA, 2005.25. Turaga, U.T.; Ramanathan, R. Catalytic Naphtha Reforming: Revisiting Its Importance in the Modern Refinery. J. Sci. Ind. Res.
2003, 62, 963–978.26. Arani, H.M.; Shirvani, M.; Safdarian, K.; Dorostkar, E. Lumping procedure for a kinetic model of catalytic naphtha reforming.
Braz. J. Chem. Eng. 2009, 26, 723–732. [CrossRef]27. Taskar, U.M. Modeling and Optimization of a Catalytic Naphtha Reformer; Texas Tech University: Lubbock, TX, USA, 1996.28. Prins, R.; Schuit, G.C.A. (Eds.) Chemistry and Chemical Engineering of Catalytic Processes; (NATO ASI series. Series E: Applied
sciences; Vol. 39); Sijthoff & Noordhoff: Noordwijkerhout, The Netherland, 1980.29. Rigutto, M.S.; van Veen, R.; Huve, L. Zeolites in Hydrocarbon Processing. Stud. Surf. Sci. Catal. 2007, 168, 855–913, XXVI.
[CrossRef]30. Ramírez, S.; Martínez, J.; Ancheyta, J. Kinetics of thermal hydrocracking of heavy oils under moderate hydroprocessing reaction
conditions. Fuel 2013, 110, 83–88. [CrossRef]31. Castañeda, L.; Muñoz, J.; Ancheyta, J. Comparison of approaches to determine hydrogen consumption during catalytic hy-
drotreating of oil fractions. Fuel 2011, 90, 3593–3601. [CrossRef]32. Elsayed, H.A.; Menoufy, M.F.; Shaban, S.A.; Ahmed, H.S.; Heakal, B.H. Optimization of the reaction parameters of heavy naphtha
reforming process using Pt-Re/Al2O3 catalyst system. Egypt. J. Pet. 2017, 26, 885–893. [CrossRef]33. Fink, J. Processes. In Guide to the Practical Use of Chemicals In Refineries and Pipelines; Gulf Professional Publishing: Houston, TX,
USA, 2016; pp. 185–223. [CrossRef]34. Kjell, M.; Gunn, H.H.; Anne, H.; Ingunn, T.; Knut, G.; Anders, H. Effect of Reaction Pressure on Octane Number and Reformate
and Hydrogen Yields in Catalytic Reforming. Ind. Eng. Chem. Res. 1996, 35, 99–105.35. Yusuf, A.Z.; John, Y.M.; Aderemi, B.O.; Patel, R.; Mujtaba, I.M. Effect of hydrogen partial pressure on catalytic reforming process
of naphtha. Comput. Chem. Eng. 2020, 143, 107090. [CrossRef]36. Mazzieri, V.A.; Grau, J.M.; Vera, C.R.; Yori, J.C.; Parera, J.M.; Pieck, C.L. Role of Sn in Pt–Re–Sn/Al2O3–Cl catalysts for naphtha
reforming. Catal. Today 2005, 107-108, 643–650. [CrossRef]37. Bishara, A.; Stanislaus, A.; Hussain, S.S. Effect of feed composition and operating conditions on catalyst deactivation and on
product yield and quality during naphtha catalytic reforming. Appl. Catal. 1984, 13, 113–125. [CrossRef]38. George, J.A.; Aitani, A.M. Catalytic Naphtha Reforming, 2nd ed.; Marcel Dekker, Inc.: New York, NY, USA, 2004.