
Thermodynamic Analysis of Reaction Profiles Between ...
9
ThermodynamicAnalysisof Reaction Profiles Between LaMO3 (M=Ni,Co,Mn) and ZrO2 Harumi Yokokawa*, Natsuko Sakai, Tatsuya Kawada, and Masayuki Dokiya* National Chemical Laboratory for Industry, Tsukuba Research Center, Ibaraki 305, Japan ABSTRACT Chemical reactions of LaMO3(M=Ni, Co, Mn) and ZrO2 have been analyzed using chemical potential diagrams for the La-Zr-M-O systems under a condition of P(O2)= 1 bar. A log{a(M)/a(Zr)} vs. log{a(La)/a(Zr)} plot is appropriate for repre- senting diffusion paths, because the layered arrangement of the reaction zone corresponds well to the geometrical con- figuration of stability polygons of reactants (LaMO~ and ZrO2) and products (La2Zr2OT,MO, La2ZrMO6, etc.). A complicated arrangement including a ternary perovskite phase, La2ZrNiO6, observed in the La2NiO~SZ couple can be represented by a simple diffusion path having the same slope in the chemcial potential diagram as in the LaCoOJYSZ couple. The effect of lanthanum nonstoichiometry for La~MnO3 has been discussed in relation to La2Zr2Ov formation and manganese dissolu- tion into YSZ cubic phases. Tedmon et al. (1) first reported in 1969 on potential use of transition metal perovskites as air electrodes for a solid oxide fuel cell and found that some perovskites react with zirconia, resulting in degradation of their electrode activ- ity. Similiar phenomena have been reported by many au- thors (2-6). The electrode/electrolyte interface should be chemically stable at high temperatures (1473-1673 K) dur- ing cell fabrication. In addition, a long-term (>50,000 h) stability around 1300 K is also required for the interface. To study chemical reactions at the electrode-electrolyte interface, investigations have been made by powder-reac- tion experiments and also by diffusion couple techniques. Hayami and Yabuki (2) found that LaCoO3 reacts with ZrO2 to form La2Zr207 and CoO at 1573 K. They found non- uniform, layered reaction zones. This layered arrangement has recently been confirmed by Echigoya et al. (5) using yt- tria stabilized zirconia (YSZ) single crystals. Lau and Sing- hal (3) found in their reaction between La0.gSr0.,MnO 3 and YSZ that La2Zr2Ov was formed, and that the lanthanum and manganese components dissolved into YSZ, whereas ZrO2 in turn dissolved into perovkites. However, no forma- tion of manganese binary oxides was observed in contrary to reaction between LaCoO3 and YSZ. We have published a series of thermodyanmic analyses to clarify the thermodynamic nature of the reactions be- tween perovskites and zirconia (7, 8). In a typical case, LaMO3 reacts with ZrO2 to form La2Zr207 and MO (M = Co,Ni); this reaction is accompanied with reduction of the transition metal ions from the trivalent state in per- ovskites to the divalent state in a precipitated phase. In contrast, the reaction between LayMnO3 and ZrO2 is gov- erned by the lanthanum nonstoichiometry, y, which is closely related to the relative stability of Mn 4+ in the per- ovskite structure. On the basis of these considerations, we can explain thermodynamically the observed reactions between per- ovskites and zirconia powders. On the other hand, results from reaction couples have not been thermodynamically explained so far. In the present study, an attempt has been made to explain these results under the local equilibrium approximation; that is, along reaction paths, the chemical potentials are assumed to vary continuously and also they should meet the requirement for the local equilibrium at any point in the reaction path. To do this, the chemical po- tential diagrams for the La-M-Zr-O systems have been con- structed under a condition of P(O2) = 1 bar. Reaction paths can be represented by simple lines in such a diagram within the approximation of the infinitely dilute solutions combined with the phenomenological equation for mass transfer in the dilute solutions. Although any detailed con- centration profile has not been investigated for LayMnO3 as a function of lanthanum nonstoichiometry, the La2Zr207 formation and the manganese dissolution are discussed in relation to the lanthanum nonstoichiometry using the chemical potential diagrams. * Electrochemical Society Active Member. Thermodynamic Data The thermodynamic data used in the present study are collected in Table I. Echigoya et al. (5) have recently found a new phase, La2Zr(Ni,Co)O6. Other similar compounds, La2,,M,,ZrO4,,+ 2 (M=Ni, Co), might also exist and be formed as reaction products. Since the thermodynamic properties of such ternary oxides are not available, these have been estimated as follows. First, estimation has been made on La2MZrO6 using an empirical correlation between the enthalphy of formation and the tolerance factor, t, given as = AfH'(AB03) - 1/2 [AfH'(A203) + AfH'(B203)] [1] = 2 [-90 + 720 (1 - t)] kJ mo1-1 which was originally proposed (9) for the rare earth-tran- sition metal perovskites, AB03. To apply this to ternary perovskites, La2MZrO6, their tolerance factors, t, were calculated from the averaged radii of B site cations (Zr4+ and M2+); a similar procedure has been used for La(Mg0.~Cr0.~)O3 with success (10). The entropy is assumed to be the sum of constituent oxide values in the present study. As a next step, the thermodynamic properties of La~M2ZrO10 were obtained from an assumed enthalpy change, - 10 kJ/mol, for the following reaction La2MO4 + La2MZrO6 = La4M2ZrO10 [2] This value of the enthalpy change is about the same as that for the formation of Sr4Ti3010 from Sr2TiO4 and SrTiO3(7). Utilization of Chemical Potentials of Metallic Elements The main objective of the present study is to examine con- centration profiles of reaction couples in terms of the associ- ated thermodynamic properties. For this purpose, chemical potential diagrams should be constructed for systems containing more than two metallic elements, and further- more diffusion processes associated with interface reac- tions should be presented in an appropriate way in such diagrams. Chemical potential diagrams for the present La-M-Zr-O (M=Ni,Co,Mn) systsems can be constructed only when chemical potentials of some metallic elements are used as coordinates. This gives rise to two aspects to be con- sidered: one is about methods of constructing such a dia- gram and the other is about its proper utilization. We have already proposed a simple convex-polygon method of automatically constructing chemical potential diagrams (11-14); in this method, metallic and nonmetallic elements are treated equivalently and any linear combina- tion of chemical potentials can be adopted as coordinates. The present diagrams have been constructed by this method using the chemical potentials of metallic ele- ments, or their differences, as coordinates. The chemical potential diagram approach (15,16) is quite effective when the chemical potential of some species as- sociated with coordinates [for example, log P(O2)] can be J. Electrochem. Soc., Vol. 138, No. 9, September 1991 9 The Electrochemical Society, Inc. 2719 ) unless CC License in place (see abstract). ecsdl.org/site/terms_use address. Redistribution subject to ECS terms of use (see 130.203.136.75 Downloaded on 2016-04-08 to IP
-
Upload
khangminh22 -
Category
Documents
-
view
1 -
download
0
Transcript of Thermodynamic Analysis of Reaction Profiles Between ...

Thermodynamic Analysis of Reaction Profiles Between LaMO3 (M=Ni,Co,Mn) and ZrO2
Harumi Yokokawa*, Natsuko Sakai, Tatsuya Kawada, and Masayuki Dokiya* Nat iona l Chemical Laboratory for Industry , Tsukuba Research Center, Ibarak i 305, J a p a n
ABSTRACT
Chemical reactions of LaMO3(M=Ni, Co, Mn) and ZrO2 have been analyzed using chemical potential diagrams for the La-Zr-M-O systems under a condition of P(O2)= 1 bar. A log{a(M)/a(Zr)} vs. log{a(La)/a(Zr)} plot is appropriate for repre- senting diffusion paths, because the layered arrangement of the reaction zone corresponds well to the geometrical con- figuration of stability polygons of reactants (LaMO~ and ZrO2) and products (La2Zr2OT, MO, La2ZrMO6, etc.). A complicated arrangement including a ternary perovskite phase, La2ZrNiO6, observed in the La2NiO~SZ couple can be represented by a simple diffusion path having the same slope in the chemcial potential diagram as in the LaCoOJYSZ couple. The effect of lan thanum nonstoichiometry for La~MnO3 has been discussed in relation to La2Zr2Ov formation and manganese dissolu- t ion into YSZ cubic phases.
Tedmon et al. (1) first reported in 1969 on potential use of transition metal perovskites as air electrodes for a solid oxide fuel cell and found that some perovskites react with zirconia, resulting in degradation of their electrode activ- ity. Similiar phenomena have been reported by many au- thors (2-6). The electrode/electrolyte interface should be chemically stable at high temperatures (1473-1673 K) dur- ing cell fabrication. In addition, a long-term (>50,000 h) stability around 1300 K is also required for the interface.
To study chemical reactions at the electrode-electrolyte interface, investigations have been made by powder-reac- t ion experiments and also by diffusion couple techniques. Hayami and Yabuki (2) found that LaCoO3 reacts with ZrO2 to form La2Zr207 and CoO at 1573 K. They found non- uniform, layered reaction zones. This layered arrangement has recently been confirmed by Echigoya et al. (5) using yt- tria stabilized zirconia (YSZ) single crystals. Lau and Sing- hal (3) found in their reaction between La0.gSr0.,MnO 3 and YSZ that La2Zr2Ov was formed, and that the lanthanum and manganese components dissolved into YSZ, whereas ZrO2 in turn dissolved into perovkites. However, no forma- tion of manganese binary oxides was observed in contrary to reaction between LaCoO3 and YSZ.
We have published a series of thermodyanmic analyses to clarify the thermodynamic nature of the reactions be- tween perovskites and zirconia (7, 8). In a typical case, LaMO3 reacts with ZrO2 to form La2Zr207 and MO (M = Co,Ni); this reaction is accompanied with reduction of the transit ion metal ions from the trivalent state in per- ovskites to the divalent state in a precipitated phase. In contrast, the reaction between LayMnO3 and ZrO2 is gov- erned by the lan thanum nonstoichiometry, y, which is closely related to the relative stability of Mn 4+ in the per- ovskite structure.
On the basis of these considerations, we can explain thermodynamical ly the observed reactions between per- ovskites and zirconia powders. On the other hand, results from reaction couples have not been thermodynamically explained so far. In the present study, an attempt has been made to explain these results under the local equil ibrium approximation; that is, along reaction paths, the chemical potentials are assumed to vary continuously and also they should meet the requirement for the local equilibrium at any point in the reaction path. To do this, the chemical po- tential diagrams for the La-M-Zr-O systems have been con- structed under a condit ion of P(O2) = 1 bar. Reaction paths can be represented by simple lines in such a diagram within the approximation of the infinitely dilute solutions combined with the phenomenological equation for mass transfer in the dilute solutions. Although any detailed con- centration profile has not been investigated for LayMnO3 as a function of l an thanum nonstoichiometry, the La2Zr207 formation and the manganese dissolution are discussed in relation to the lan thanum nonstoichiometry using the chemical potential diagrams.
* Electrochemical Society Active Member.
Thermodynamic Data The thermodynamic data used in the present study are
collected in Table I. Echigoya et al. (5) have recently found a new phase, La2Zr(Ni,Co)O6. Other similar compounds, La2,,M,,ZrO4,,+ 2 (M=Ni, Co), might also exist and be formed as reaction products. Since the thermodynamic properties of such ternary oxides are not available, these have been estimated as follows.
First, estimation has been made on La2MZrO6 using an empirical correlation between the enthalphy of formation and the tolerance factor, t, given as
= AfH'(AB03) - 1/2 [AfH'(A203) + AfH'(B203)] [1] = 2 [-90 + 720 (1 - t)] kJ mo1-1
which was originally proposed (9) for the rare earth-tran- sition metal perovskites, AB03. To apply this to ternary perovskites, La2MZrO6, their tolerance factors, t, were calculated from the averaged radii of B site cations (Zr 4+ and M2+); a similar procedure has been used for La(Mg0.~Cr0.~)O3 with success (10). The entropy is assumed to be the sum of consti tuent oxide values in the present study.
As a next step, the thermodynamic properties of La~M2ZrO10 were obtained from an assumed enthalpy change, - 10 kJ/mol, for the following reaction
La2MO4 + La2MZrO6 = La4M2ZrO10 [2]
This value of the enthalpy change is about the same as that for the formation of Sr4Ti3010 from Sr2TiO4 and SrTiO3(7).
Utilization of Chemical Potentials of Metallic Elements The main objective of the present study is to examine con-
centration profiles of reaction couples in terms of the associ- ated thermodynamic properties. For this purpose, chemical potential diagrams should be constructed for systems containing more than two metallic elements, and further- more diffusion processes associated with interface reac- tions should be presented in an appropriate way in such diagrams.
Chemical potential diagrams for the present La-M-Zr-O (M=Ni,Co,Mn) systsems can be constructed only when chemical potentials of some metallic elements are used as coordinates. This gives rise to two aspects to be con- sidered: one is about methods of constructing such a dia- gram and the other is about its proper utilization.
We have already proposed a simple convex-polygon method of automatically constructing chemical potential diagrams (11-14); in this method, metallic and nonmetallic elements are treated equivalently and any linear combina- tion of chemical potentials can be adopted as coordinates. The present diagrams have been constructed by this method using the chemical potentials of metallic ele- ments, or their differences, as coordinates.
The chemical potential diagram approach (15,16) is quite effective when the chemical potential of some species as- sociated with coordinates [for example, log P(O2)] can be
J. Electrochem. Soc., Vol. 138, No. 9, September 1991 �9 The Electrochemical Society, Inc. 2719
) unless CC License in place (see abstract). ecsdl.org/site/terms_use address. Redistribution subject to ECS terms of use (see 130.203.136.75Downloaded on 2016-04-08 to IP
2720 J. Electrochem. Soc., Vol. 138, No. 9, September 1991 �9 The Electrochemical Society, Inc.
Table I. Thermodynamic properties of complex oxides used in the present study to construct the chemical potential diagrams.
Compound
Functions at 298.15 K Coefficient of heat capacity eq2 Temp. limit
hfH hfG S a b c T AtrH State (kJ/mol) (kJ/mol) (J/K mol) (J/K tool) (K) (kJ/mol) Ref.
LaCoO3
La2CoZrO6 La4Ni3010 La2NiO4
La4Ni2ZrO10 La2NiZrO4 LaMnO3
La2MnZrO6 ZrO2
La2Zr207
cl -1258.2 -1170.4 100.0 -6.17 282.64 23.59 550(mtp) 0 c2 125.10 18.49 -19.17 1220(tp) 0 c3 115.10 18.49 -19.17 2500 c -3220.0 -3050.8 230.6 237.12 28.80 -32.82 2500 c -4478.6 -4194.7 390.0 402.00 54.293 -51.318 2500 cl -2037.7 -1925.7 178.0 162.334 21.314 -19.843 640(tp) 0.3 c2 162.334 21.314 -19.843 2500 c -5256.7 --4971.1 393.6 399.45 50.11 -52.66 c -3220.0 -3050.8 230.6 237.12 28.80 -32.82 cl -1425.1 -1345.8 130.5 117.35 16.50 -16.31 675(tp) 4.0 c2 117.35 16.50 -16.31 2500 c -3361.4 3193.8 237.42 237.12 28.80 -32.82 2500 cl -1100.6 -1042.8 50.38 68.329 9.081 -13.438 1445(tp) 8.4 c2 78.1 2620(tp) 13.0 c3 80.0 2983(mp) 90.0 1 100.0 3500
c -4082.9 -3882.8 238.08 256.26 32.676 -40.328 2500
(12) (12) (12) est. est. (37, 38) (37) est. est. (14) (14) est. unstable (35,36) (36) (36) (36) (7)
a C p = a + b • 10-3T+c• 105/T 2.
r e g u l a t e d b y a l l owing t he m a s s t r a n s f e r of t h e spec ies (O2) b e t w e e n t h e s y s t e m a n d t he e n v i r o n m e n t . Fo r th i s pur - pose, spec ies in ga seous m i x t u r e s or in a q u e o u s so lu t ions are u sua l l y s e l ec t ed as coo rd ina t e s , s ince t he i r m a s s t r ans - fer c an t a k e p lace v ia t he gases or t h e so lu t ions , e v e n w h e n d i f fus ion in so l ids is qu i t e slow. Fo r al loy or c o m p l e x o x i d e cases , t he c h e m i c a l p o t e n t i a l s of me ta l l i c e l e m e n t s are n o t u sua l l y a d o p t e d b e c a u s e t he me ta l l i c ac t iv i ty is dif- f icul t to r egu la t e a n d also b e c a u s e o t h e r rou te s t h a n diffu- s ion in sol ids a re no t a lways ava i l ab le for t he me ta l l i c ele- m e n t s . I n s t ead , t h e m o l a r rat ios, are o f t en a d o p t e d as one of c o o r d i n a t e s l ike n o r m a l p h a s e d i a g r a m s (17); th i s is par- t i cu la r ly u se fu l for t h e case w h e r e t h e c o m p o s i t i o n of t he in i t ia l r e a c t a n t s is i m p o r t a n t . Neve r the l e s s , t he mo le ra t io m a y no t b e a p p r o p r i a t e to cha r ac t e r i z e d i f fus ion p r o c e s s e s p r o m o t e d b y c h e m i c a l p o t e n t i a l g r a d i e n t s in c o n d e n s e d phases . In v i e w of this , i t s e e m s of c o n s i d e r a b l e i n t e r e s t to p r e s e n t s u c h d i f fus ion p r o c e s s e s in t h e d i a g r a m s to b e c o n s t r u c t e d u s i n g c h e m i c a l p o t e n t i a l s of me ta l l i c ele- m e n t s .
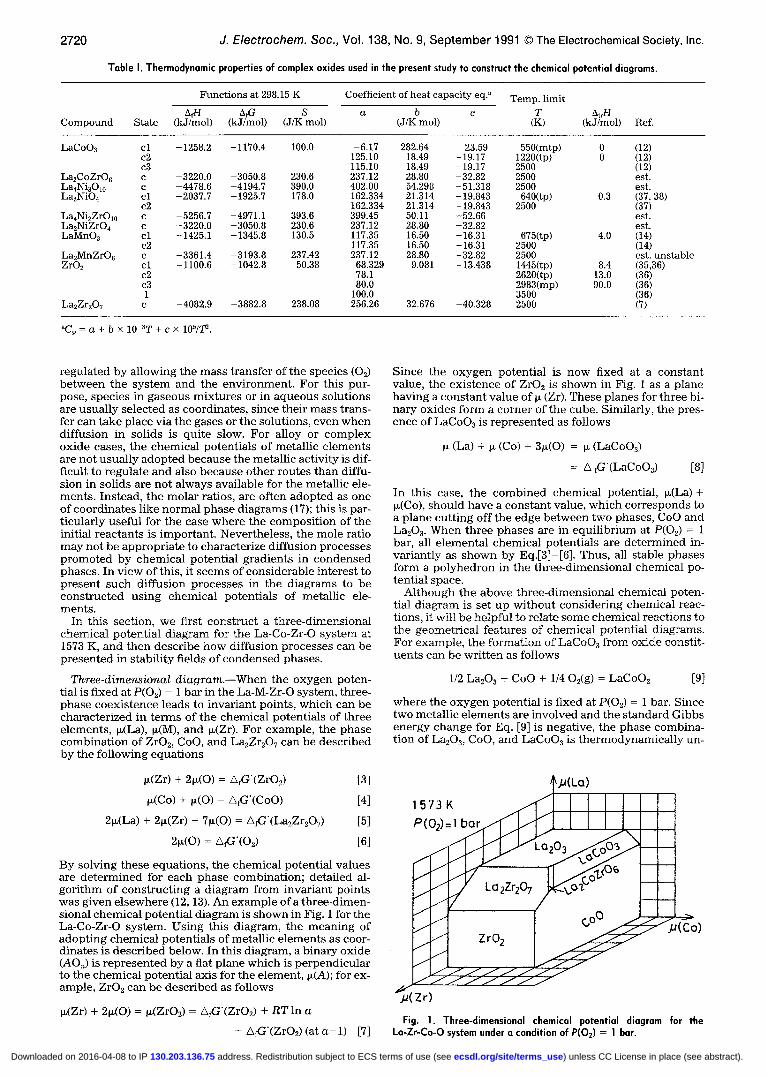
I n t h i s sec t ion , we first c o n s t r u c t a t h r e e - d i m e n s i o n a l c h e m i c a l p o t e n t i a l d i a g r a m for t h e La-Co-Zr-O s y s t e m a t 1573 K, a n d t h e n d e s c r i b e h o w d i f fu s ion p r o c e s s e s c an b e p r e s e n t e d in s t ab i l i ty f ields of c o n d e n s e d phases .
Three-dimensional diagram.--When t h e o x y g e n po ten - t ial is f ixed at P(O2) = 1 ba r in t he La-M-Zr-O sys tem, t h ree - p h a s e c o e x i s t e n c e leads to i n v a r i a n t po in t s , w h i c h can be c h a r a c t e r i z e d in t e r m s of t h e c h e m i c a l po t en t i a l s of t h r e e e l emen t s , ~(La), ~(M), a n d ~(Zr). F o r e x a m p l e , t he p h a s e c o m b i n a t i o n of ZrO2, CoO, a n d La2Zr207 can be d e s c r i b e d b y t h e fo l lowing e q u a t i o n s
~(Zr) + 2~(O) = AfG'(ZrO2) [31
~(Co) + ~(O) = A ~ ' ( C o O ) [4]
2~(La) + 2~(Zr) + 7~(O) = A~:T(La2Zr~OT) [5]
2~(O) = AfG'(O2) [6]
By so lv ing t h e s e e q u a t i o n s , t h e c h e m i c a l p o t e n t i a l va lues are d e t e r m i n e d for e a c h p h a s e c o m b i n a t i o n ; de ta i l ed al- g o r i t h m of c o n s t r u c t i n g a d i a g r a m f rom i n v a r i a n t p o i n t s was g iven e l s e w h e r e (12, 13). A n e x a m p l e of a t h r e e - d i m e n - s iona l c h e m i c a l p o t e n t i a l d i a g r a m is s h o w n in Fig. i for t h e La-Co-Zr-O sys t em. U s i n g th i s d iag ram, t h e m e a n i n g of a d o p t i n g c h e m i c a l p o t e n t i a l s of me ta l l i c e l e m e n t s as coor- d ina t e s is d e s c r i b e d be low. In th i s d i ag ram, a b i n a r y ox ide (AOn) is r e p r e s e n t e d b y a flat p l a n e w h i c h is p e r p e n d i c u l a r to t he c h e m i c a l p o t e n t i a l ax is for t h e e l emen t , ~(A); for ex- ample , ZrO2 c a n b e d e s c r i b e d as fo l lows
~(Zr) + 2~(O) = ~(ZrO2) = AfG'(ZrO2) + RT in a
= A~G'(ZrO2) (at a = l ) [7]
S i n c e t h e o x y g e n p o t e n t i a l is n o w f ixed at a c o n s t a n t va lue , t he e x i s t e n c e of ZrO2 is s h o w n in Fig. 1 as a p l a n e h a v i n g a c o n s t a n t v a l u e of ~ (Zr). T h e s e p l anes for t h r e e bi- n a r y ox ides fo rm a c o r n e r of t he cube . S imi lar ly , t he pres- e n c e of LaCoO3 is r e p r e s e n t e d as fo l lows
(La) + ~ (Co) + 3~(O) = ~ (LaCoO3)
= A fG'(LaCoO3) [8]
I n th i s case, t h e c o m b i n e d c h e m i c a l po ten t ia l , ~ ( L a ) + ~(Co), s h o u l d h a v e a c o n s t a n t va lue , w h i c h c o r r e s p o n d s to a p l a n e c u t t i n g off t he edge b e t w e e n two phases , CoO a n d La203. W h e n t h r e e p h a s e s are in e q u i l i b r i u m at P(O2) = 1 bar , all e l e m e n t a l c h e m i c a l p o t e n t i a l s are d e t e r m i n e d in- v a r i a n t l y as s h o w n by Eq.[3]-[6] . Thus , all s t ab le p h a s e s f o r m a p o l y h e d r o n in t h e t h r e e - d i m e n s i o n a l c h e m i c a l po- t en t i a l space .
A l t h o u g h t h e a b o v e t h r e e - d i m e n s i o n a l c h e m i c a l po t en - t ial d i a g r a m is se t u p w i t h o u t c o n s i d e r i n g c h e m i c a l reac- t ions , i t wil l b e h e l p f u l to r e l a t e s o m e c h e m i c a l r e a c t i o n s to t h e g e o m e t r i c a l f ea tu re s o f c h e m i c a l p o t e n t i a l d i ag rams . Fo r e x a m p l e , t h e f o r m a t i o n of LaCoO3 f rom ox ide cons t i t - u e n t s c a n b e w r i t t e n as fo l lows
1/2 La203 + CoO + 1/4 O2(g) = LaCoO3 [9]
w h e r e t h e o x y g e n p o t e n t i a l is f ixed at P ( Q ) = 1 bar. S ince two meta l l i c e l e m e n t s are i n v o l v e d a n d t h e s t a n d a r d G i b b s e n e r g y c h a n g e for Eq. [9] is nega t ive , t he p h a s e c o m b i n a - t i on of La203, CoO, a n d LaCoO3 is t h e r m o d y n a m i c a l l y un-
,573K I I I P(Og=, bor (J I I I
'~-(Zr)
~(Co)
Fig. 1. Three-dimensional chemical potential diagram for the La-Zr-Co-O system under a condition of P(02) = 1 bar.
) unless CC License in place (see abstract). ecsdl.org/site/terms_use address. Redistribution subject to ECS terms of use (see 130.203.136.75Downloaded on 2016-04-08 to IP

J. Electrochem. Soc., Vol. 138, No. 9, September 1991 �9 The Electrochemical Society, Inc. 2721
stable. From the local equil ibrium point of view, this chemical reaction should be rewritten as follows
1/2 La,0_3 + CoO + 1/4 O2(g) = LaCoO3 [10]
o r
1/2 La203 + CoO + 1/4 O2(g) = LaCoOa [11]
where LaLa~_O 3 or CoO are not the pure state. In what follows, chemical reactions are written in this manner within the local equil ibrium approximations except for the case where the standard Gibbs energy change is concerned. The former corresponds to the CoO/LaCoO3 two-phase co- existence, the latter being to the La2OJLaCoO~. In Fig 1, the above chemical feature is represented by the sequen- tial appearance of phases involved in the reaction. Equa- tions [10] and [11] should be compared with a normal chem- ical equil ibrium characterized in terms of the chemical potential of gaseous species. For example, the equil ibrium between CoO and C0304 can be written as follows.
3C00 + 1/2 Q(g) = C0304 [12]
This two-phase equil ibrium can be characterized in terms of the equil ibr ium oxygen potential and the mass transfer of oxygen is related to the shift of equil ibrium to either di- rection. In an analogous way, the activity of La203 in Eq. [10] can characterize the CoO/LaCoO3 phase equilbrium and the mass transfer of lanthanum should be related to the shift of the equilibrium. A difference is that oxygen can diffuse in gases as well as in solids, while lanthanum can diffuse only in solids. In this sense, it is important to clarify how diffusion properties in condensed phases are presented in the chemical potential diagrams.
Stabil i ty fields and related mass transfer.--In the above derivation of the three-dimensional chemical potential dia- gram, we assume that the stoichiometry of all phases does not change; within this approximation, it seems hard to treat mass transfer in condensed phases in a general way. However, this allows us to treat dissolved species. This is because the stability fields are characterized in terms, not of stoichiometry, but of chemical potentials. For example, the existence of ZrO2 phas~e is represented by a plane in which the activity of ZrO2 is equal to unity; the important point in Fig.1 is that within the stability field of ZrO2, the activities of CoO and La203 can have finite values. This im- plicitly assumes that the oxides can be dissolved in the ZrO2 phase, although their solubilities are assumed to be small. This kind of solution can be characterized as the in- finitely dilute solution in which the activity of solvent is al- ways defined as unity; the activities of solutes depend on their concentrations. When solute i diffuses in such a di- lute solution, the flux Ji, can be given as
Ji = - Midl~i/dx [13]
where dt~i/dx is the chemical potential gradient and M i is the phenomenological coefficient; the cross terms in the phenomenological equations were neglected (18). When there are two solutes, i and j, diffusing in a steady state, their chemical potential changes can be related as follows
(Mi/Ji)dp~ i = (M/Jj)dt i j [14]
The chemical potential change of the more rapidly diffus- ing solute can be expected to be smaller. This relation can be expressed by a straight line on the "solvent" stability field in the chemical potential diagrams. For example, in the stability field of ZrO2 in Fig. 1, the diffusion of La and Co in the same direction can be respresented by a line hav- ing a positive slope in the ~(La)-~(Co) plane, while the dif- fusion in the countercurrent flow can be represented by a line having a negative slope.
Since the above infinitely dilute solution approximation can be applied to all condensed phases in principle, any el- ement can diffuse in any condensed phase regardless of its stoichiometry. In such a case, the local equilibrium can be assumed at two-phase boundaries; that is, the chemical po- tentials of all elements involved are assumed to have the same values at both sides of the boundaries. In chemical
N
2
o coo t ~ ! 2
20 22 24 26 28 30
log aco/azr Fig. 2. Chemical potential diagram for Lo-Zr-Co-O system at 1573 K
under a condition of P(02) = 1 bar. The concentration profile after re- action between LaCo03 and Zr02 can be roughly represented by a dashed line from point a to c, along which log {a(Co)/a(Zr)} and Iog- {a(La)/a(Zr)] vary monotonically (see Fig. 6).
potential diagrams, diffusion paths in two phases should be connected at the border l ine of their stability fields.
Chemica l Potential Diagrams Since two-dimensional diagrams are convenient for
quantitative analysis, log {a(La)/a(Zr)} vs. log {a(M)/a(Zr)} two-dimensional plots are used in the present study.
La-Co-Zr-O system.--The diagram for the La-Co-Zr-O system is shown in Fig 2. The stability area of LaCoO3 is separated from that of Z r Q by La2Zr207 and CoO. This can be regarded as an alternative expression for the thermody- namic feature that the Gibbs energy change for the follow- ing reaction is negative at 1573 K
LaCoO3 + ZrO2 = 1/2 La2Zr207 + CoO + 1/4 Q(g) [15]
These four phases therefore cannot coexist in air, and the reaction proceeds until either LaCoO3 or ZrO2 disappears and finally a three-phase equil ibrium is established, when L a C o Q exists in excess, the reaction can be rewritten as follows
LaCoO3 + ZrO2 = 1/2 La2Zr207 + CoO + 1/4 O2(g) [16]
In this case, the ZrO2 component exists as one of constit- uents of La2Zr207 and also as dissolved states in CoO or LaCoQ.
Although Echigoya et al. (5) did not find a phase, La2CoZrO6, its thermodynamic properties have been esti- mated to calculate its plausible stability area. The forma- tion reaction of this phase from LaCoO3 and ZrO2 can be written as follows
2LaCoO~ + ZrO2 = La2CoZrO6 + CoO + 1/2 Q(g) [17]
This reaction is accompanied with the reduction of cobalt ions. This sugges ts - tha t with increasing temperature, La2CoZrO6 should tend to form easily; in the present esti- mates, the standard Gibbs energy change for Eq. [17] be- comes negative around 1573 K. When the ZrO2 component is further available. La2CoZrO6 reacts with the ZrO2 com- ponent to form La2Zr207 as follows
La2CoZrO6 + ZrO2 = La2Zr207 + CoO [18]
No further reduction may take place, since cobalt ions are in the divalent state in La2CoZrO6.
) unless CC License in place (see abstract). ecsdl.org/site/terms_use address. Redistribution subject to ECS terms of use (see 130.203.136.75Downloaded on 2016-04-08 to IP

2722 J. Electrochem. Soc., Vol. 138, No. 9, September 1991 �9 The Electrochemical Society, Inc.
10
O
2
20 22 24 26 28 30
log aNi /aZr
Fig. 3. Chemical potential diagram for La-Zr-Ni-O system at 1573 K under a condition of P(O~) = 1 bar. Although I-a4Ni~ZrOm phase has nat been confirmed yet experimentally, this is included using thermody- namic estimates.
La-Ni-Zr-O system.- The chemical potential diagram for the La-Ni-Zr-O system is shown in Fig. 3. The thermody- namic data used indicate that at 1573 K, La4Ni3010 as well as La2NiO4 are stable at P(Q) = 1 bar. In this diagram, the stability areas of La2NiZrO6 and La4Ni2ZrO10 appear along with those of La2Zr2OT, NiO, La4Ni3010, La2NiO4, and La203. This means that La2NiO4 reacts with the ZrO2 com- ponent to form La4Ni2ZrO,0 or La2NiZrO6 as follows
2La2NiO4 + ZrO~ = La4Ni2ZrO10 [19]
La4Ni30,0 + Zr02 = La4Ni2ZrO10 + NiO + 1/2 O2(g) [20]
La4Ni2ZrO10 + ZrO2 = 2La2NiZrO6 [21]
La2NiZrO6 reacts with the ZrO2 component to form La2Zr207 and NiO.
La~NiZrQ + ZrO~ = La2Zr2Ov + NiO [22]
The same relations are also presented in the triangle com- patibility diagram in Fig. 4. An interesting point is that only the reaction between La~Ni3Om and ZrO2 (Eq. [20]) evolves oxygen, while other reactions are not ac- companied with change in the valence state of nickel ions or with oxygen evolution. Note again that the valence state of nickel ions changes in a series of La~,+~Ni,~O~,+I com-
NiO
ZrOt 0
Zr 02 Lo2Zr207 1/2 LozO 3
Fig. 4. Compatibility triangle diagram for NiO-1/2 La203-ZrO2 sys- tem at 1573 K at P(O 2) = 1 bar (compare with Fig. 3).
10
8
\ 6
2
0 12 14 16 18 20 22
tog aMn/aZr Fig 5. Chemical potential diagram for La-Zr-Mn-O system at 1573 K
under a condition of P(O2) = 1 bar (compare with Fig. 8).
pounds, while the ternary phase, La~Ni~ZrO4,+2, contains the divalent nickel ions.
La-Mn-Zr-O system.--The chemical potential diagram for this system is shown in Fig. 5; in this diagram, La2MnZrO6 does not appear. The thermodynamic proper- ties of La2MnZrO 6 were estimated in the same way as La2CoZrO 6 and La2NiZrO6 (see Table I), and the standard Gibbs energy change for the following reaction
2LaMnO3 + ZrO2 = La2MnZrO6 + 1/3 Mn304 + 1/3 O2(g) [23]
was calculated to be 68.7 kJ/mol at 1573 K. The standard Gibbs energy change for the following reaction
LaMnO3 + ZrO2 = 1/2 La2Zr207 + 1/3 Mn304 + 1/12 O2(g) [24]
is also positive (7). As a result, LaMnO3 is in contact with ZrO2 in the chemical potential diagram, whereas La2Zr207 has no contact with Mn304. Since the lanthanum nonstoi- chiometry in L a M n Q affects its reaction with ZrO2, this will be discussed later together with the manganese disso- lution into yttria stabilized zirconia (YSZ).
Concentration Profile LaCoOJYSZ.- -The most interesting result from reaction
couples between LaCoO3 and YSZ is that reaction prod- ucts, La2Zr207 and CoO, tend to form a layered arrange- ment; that is, CoO appears next to LaCoO3, and La2Zr207 is formed between CoO and ZrO2. A similar concentration profile was observed also between PrCoO3 and YSZ (2). Since this reaction takes place between LaCoO3 and ZrO2, Zr and La (or Co) should interdiffuse in a countercurrent flow at the interface. The chemical potential difference be- tween Zr and La (or Co), {~t(La) - ~(Zr)} or {~(Co) - ~(Zr)}, should change monotonically from the ZrO2 side to the LaCoO3 side. This behavior can be represented as a line having a positive slope in Fig. 2. In order to account for the formation of CoO immediately next to LaCoO3, we can draw a diffusion path as a dashed line in Fig. 2, whose slope is less positive than the borderline between La2Zr207 and CoO but more positive than the borderline between LaCoO3 and CoO. To the first order of approximation, a straight line across several phases is assumed in the ab- sence of other appropriate assumptions. Figure 6 shows changes in chemical potentials along this diffusion path. As shown in Fig. 6c, log [a(Co)/a(Zr)] as well as log [a(La)/ a(Zr)] vary linearly along this line. The elemental chemical potentials given in Fig. 6b exhibit the following interesting features:
1. The chemical potential of cobalt has the max imum in the cobalt oxide phase. This seems to be of importance in
) unless CC License in place (see abstract). ecsdl.org/site/terms_use address. Redistribution subject to ECS terms of use (see 130.203.136.75Downloaded on 2016-04-08 to IP

J. Electrochem. Soc., Vol. 138, No. 9, September 1991 �9 The Electrochemical Society, Inc. 2723
t~
0
-1 \ - 2
0 ~ - 3
26
25 L
~ N 2 4
~ 2 3
~ 22 o
21
20
(o)
~ Co
. . . .
l
LoCoO 3 L( CoO
Zr
12Zr207
I ZrO
(b) Co i ....... *i ............. ~ v , - . . ~
~ r - - ~ " - �9 i ~'%N
/ ! i -,, N~'x : i ,\ ",~
" \ : - , !
:-. \. Lu.L,, :
(c) ! I i ' \ . ",,~ I :
~Co/Zr '~.,,,, i
i I "~.~ i " 'Q- , . i ":,,"> ! '-~
�9 @ |
6
5
4
3
2
1
0
0
26
25
~ 2 2 o
21
20
(o)
...... , LCl ; ~
/ ~, ~,~
Zr
I ]I ]]I IV Lo2Zr207 Zr02
Cb)L! _ i ! !Zr
, - . l
( c ) ~ \ . k i ' k - - - ! ] - i i - \ i i " - L O / / - r
i i "~ ! " \ I ~,, \ :
i i i i N ~ / Z r "-.~'.
! ! i "xx
i i i i ~
0
-1
-2
-3
5
3
2
1
0
Fig. 7. Schematic concentration profile andrelated chemical poten- tials along the diffusion path (Fig. 3) for reactants and products be- tween La2NiO4 and ZrO2. I, La2NiO4; II, La4Ni3Om; III, La4Ni2ZrO~; IV, La~NiZrO6.
Fig. 6. Schematic concentration profile and related chemical poten- tials along the diffusion path (Fig. 2) for reactants and products be- tween LaCoO3 and ZrO2. The points a, b, and c correspond to the same points in Fig. 2. (a) Dominant reaction products; (b) change of elemen- tal chemical potentials referred to their binary oxides (COO, ZrO2, La203) at P(O2) = 1 bar; (c) change of log {a(Co/a(Zr)} and log {a(La)/a(Zr)}.
determing the layered arrangement, since it is most likely that when the binary oxide is formed as one of the reaction products, it is precipitated adjacent to the reactant con- taining the binary oxide. Since the chemical potential of cobalt ions in perovskite phase is lower than that of the precipitated CoO as shown in Fig. 1, they do not have the driving force to diffuse beyond the precipitated CoO phase.
2. Lan thanum ions diffuse beyond the La203-depleted CoO phase to form La2Zr207 with ZrO2; the chemical po- tential of l an thanum decreases monotonically along this diffusion path. This implies that lan thanum ions can easily diffuse through the CoO-rich region. At present, it is not clear whether lan thanum ions migrate through bulk diffu- sion in the CoO-rich phase or through grain boundaries. From the thermodynamic point of view, the thermody- namic activity of l an thanum oxide should be lowered for the following reaction to proceed
LaCoO3 = CoO + 1/2 La~O~ (in CoO) + 1/4 O2(g) [25]
where La203 is in the dissolved state in CoO. Figure 6 indi- cates that the activity of La203 is on the order of 10 ~. This La203 component diffuses in the precipitated CoO phase to react with the ZrO2 component in the precipitated La2Zr207 phase as follows
La203 (in CoO) + 2ZrO2 (in La2Zr2OT) ~ La2Zr2Ov [26]
where the ZrO2 component is dissolved from the reactant ZrO2 and migrates to the CoO/La2Zr207 boundaries. Since the ZrO2 component is available in the La2Zr207 phase, there may be a possibility of the ZrO2 component migrat- ing from the La2Zr207 phase into the CoO phase. However,
the steep decrease of the Zr chemical potential in this phase in Fig. 6 implies that the ZrO2 component does not tend to diffuse into the CoO phase.
La2NiO4/YSZ.--Echiogoya et al. (5) observed that in couples of La2NiO4 and YSZ, the concentrations of La and Ni decrease gradually; in the vicinity of La2NiO4, the atomic ratio of Ni to La slightly increased. Figure 3 indi- cates that this may correspond to the formation of La4Ni3010. To account for this behavior, the diffusion path should have a slope greater than that of the borderline be- tween La2NiO4 and La4Ni3010 in Fig. 3. Since this behavior is quite similar to the fact that CoO precipitates immedi- ately next to LaCoO3, an attempt has been made to draw a diffusion path for the La2NiO4/YSZ couple similar to that for the L a C o O ~ S Z couple (Fig. 2 and 6). The concentra- tion profile and the chemical potentials along the diffusion path are given in Fig. 7, which reasonably reproduces the experimental concentration profiles found by Echig0ya et al. Because of the formation of La2Ni3010, the chemical potential of nickel shows the maximum at the border of La4Ni30 m and La4Ni2ZrOm. This is quite similar to the maximum of cobalt chemical potential in Fig. 6. The for- mation of La4Ni30~o can be written as follows
3La2NiO4 + 1/2 O2(g) = La4Ni3010 + La_L_~O 3 (in La4Ni3Ol0) [27]
where La203 is not the pure phase. Again, the lanthanum ions may tend to migrate through the La4Ni3OL0-rich re- gion. The formation of La4Ni~ZrO~0 next to La4Ni3O10 can be written as follows
La4Ni3Ol0 + La~.O3 (in La4Ni3Om) + 3/2 ZrO~. (in La4Ni2ZrOm)
= 3/2 La4Ni2ZrO10 + 1/2 O2(g) [28]
where not the NiO component, but the La203 component in La4Ni~O~0 is assumed to contribute the reaction. The ZrO2 component migrates through the La4Ni2ZrO10 phase which is in turn formed from the ZrO2 component in La2Zr207 as follows
) unless CC License in place (see abstract). ecsdl.org/site/terms_use address. Redistribution subject to ECS terms of use (see 130.203.136.75Downloaded on 2016-04-08 to IP
2724 J. Electrochem. Soc., Vol. 138, No. 9, September 1991 �9 The Electrochemical Society, Inc.
TQble II. Thermodynamic parameters for nonstoichiometric lanthanum manganites.
Constitute State
298.15 K Heat capacity eq.p
hfH S a b c (kJ/mol) (J/K mol) (J/K mol) Ref.
LaMnO3 sll La0.667MnO3 sll La0.667MnO=.~ sll LaMnO2.5 sll
-1425.1 130.5 117.35 16.50 -16.31 (7) -1106.0 107.29 97.42 14.08 -14.07 (7) -1180.0 103.50 107.53 16.56 -18.34 (7) -1270.0 123.37 107.69 14.03 -12.04 (7)
~Cp=a+b•215 10~/T 2 + d x 10-6T 2.
Table III. Redlich-Kister coefficients for ZrO2-MO, binary cubic solid solution.
298.15 K Heat capacity eq2
Constituent h=~=H/(XIX2) hfH S a b c d 1 2 (kJ/mol) (k J/tool) (J/K mol) J/K tool Ref.
ZrO2 - 1079.16 61.07 68.329 9.081 - 13.438 (24) ZrO2 YOI.5 -60.0 - 25.0(X1 - X2) -945.16 49.54 68.69 -8.93 -13.91 5.24 (24) ZrO2 LaO1.5 -52.0 + 30.0(Xl - X2) -881.85 63.66 59.802 7.207 -6.726 (24) ZrO= MnO2 0.0 -487.03 53.05 69.45 10.21 -16.23 (24) ZrO2 MnO1.5 13.0 -461.5 55.25 51.735 17.53 -6.755 (24) ZrO2 MnO -2.0-75.0(X1-X2) -330.22 69.71 46.48 8.12 -3.68 (24)
"Cp = a + b • 10-3T + c • 105/T 2 + d x 10-6T 2.
2La2NiO4 + ZrO2 (in La2Zr2OT) = La4Ni2ZrO10 [29]
Since the ternary compounds, La4Ni2ZrO~0 and La2NiZrO~, can be formed at the interface, the atomic ratio of Ni to La did not change significantly unlike the case for the LaCoOjYSZ.
M a n g a n e s e Dissolut ion vs. La2Zr207 Format ion in L a y M n O J Y S Z C o u p l e
No diffusion coupling has been reported between LaMnO3 and YSZ but between (La0.gSr0.1)MnQ and YSZ by Lau and Singhal (3); results show some interdiffusion of La, Mn, and Zr. However, it is not clear whether La2Zr207 was formed at the interface of their diffusion couple, although they confirmed La2Zr207 formation in powder experiments. Lau and Singhal (3) instead found significant manganese dissolution in YSZ. Recently, Khandkar e t a l . (19) confirmed that the formation of La2Zr=O7 and the manganese diffusion take place simulta- neously at the interface.
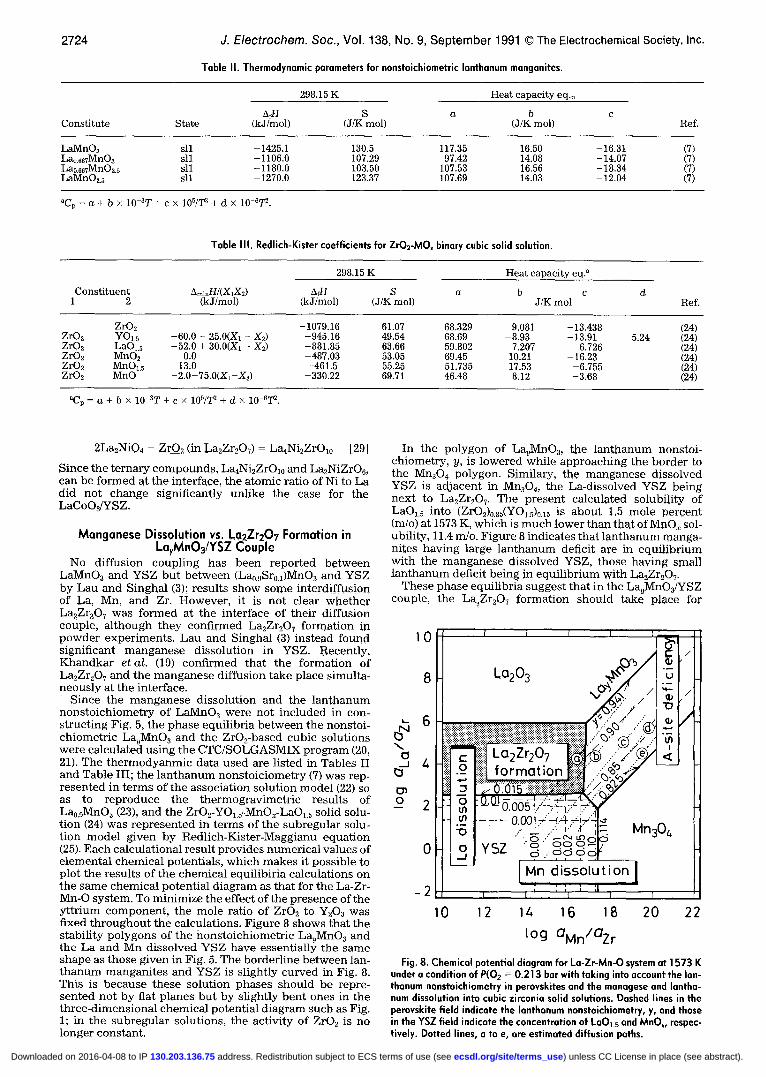
Since the manganese dissolution and the lanthanum nonstoichiometry of LaMnO3 were not included in con- structing Fig. 5, the phase equilibria between the nonstoi- chiometric La,MnO3 and the ZrO2-based cubic solutions were calculated using the CTC/SOLGASMIX program (20, 21). The therm0dyanmic data used are listed in Tables II and Table III; the lanthanum nonstoiciometry (7) was rep- resented in terms of the association solution model (22) so as to reproduce the thermogravimetric results of La0.gMnO3 (23), and the ZrO2-YO1.5-MnO~-LaO,.5 solid solu- tion (24) was represented in terms of the subregular solu- tion model given by Redlich-Kister-Maggianu equation (25). Each calculational result provides numerical values of elemental chemical potentials, which makes it possible to plot the results of the chemical equilibiria calculations on the same chemical potential diagram as that for the La-Zr- Mn-O system. To minimize the effect of the presence of the yttrium component, the mole ratio of ZrO2 to Y203 was fixed throughout the calculations. Figure 8 shows that the stability polygons of the nonstoichiometric La,MnO3 and the La and Mn dissolved u have essentially the same shape as those given in Fig. 5. The borderline between lan- thanum manganites and YSZ is slightly curved in Fig. 8. This is because these solution phases should be repre- sented not by flat planes but by slightly bent ones in the three-dimensional chemical potential diagram such as Fig. 1; in the subregular solutions, the activity of ZrO2 is no longer constant.
In the polygon of L%MnO3, the lanthanum nonstoi- chiometry, y, is lowered while approaching the border to the Mn304 polygon. Similary, the manganese dissolved YSZ is adjacent in Mn~O4, the La-dissolved YSZ being next to La2Zr2OT. The present calculated solubility of LaO,.5 into (ZrO2)0.85(YO1.5)015 i s about 1,5 mole percent (m/o) at 1573 K, which is much lower than that of MnO~ sol- ubility, 11.4 m/o. Figure 8 indicates that lanthanum manga- nites having large lanthanum deficit are in equilibrium with the manganese dissolved YSZ, those having small lanthanum deficit being in equilibrium with La2Zr207.
These phase equilibria suggest that in the La,MnOJYSZ couple, the La~Zr207 formation should take place for
10
8
2
0
-2
10 12 lZ, 16 18 20 22
log GMn/QZr Fig. 8. Chemical potential diagram for La-Zr-Mn-O system at 1573 K
under a condition of P(02 = 0.213 bar with taking into account the lan- thanum nonstoJchiometry in perovskites and the managese and lantha- num dissolution into cubic zirconia solid solutions. Dashed lines in the perovskite field indicate the lanthanum nonstoichiometry, y, and those in the YSZ field indicate the concentration of LaOl.s and MnO,, respec- tively. Dotted lines, a to e, are estimated diffusion paths.
) unless CC License in place (see abstract). ecsdl.org/site/terms_use address. Redistribution subject to ECS terms of use (see 130.203.136.75Downloaded on 2016-04-08 to IP

J. Efectrovhem. Soc., Vol. 138, No. 9, September 1991 �9 The Electrochemical Society, Inc. 2725
y > 0.86, whereas the manganese dissolution may become significant for y < 0.86. The La2Zr~O7 formation gives rise to the La depletion in the perovskite phase resulting in de- crease in y, whereas the manganese dissolution gives rise to the Mn depletion. This implies that after either the La2Zr207 formation or the manganese dissolution, the in- terface location in the diagram moves to the triple-phase point, that is, the junct ion among L%MnO3, La2Zr20~, and YSZ.
Since results by Echigoya et aL (5) on both LaCoO3 and La~NiO 4 show the enrichment of the transition metal ions in the perovskite side and this phenomena can be repre- sented by essentially straight lines having a steep slope, it will be of interest to examine the concentration profiles by assuming diffusion paths having the same slope as in the LaCoOJYSZ and La2NiO4/YSZ system. Since the lantha- num nonstoichiometry affects the reaction products, five lines, designated a to e, are drawn in Fig. 8. The concentra- tion profiles along these estimated diffusion paths are plot- ted in Fig. 9. The manganese ions are enriched in the vicin- ity of the interface; this is because of the steep slope of the adopted diffusion paths. For the case of the La2Zr207 for- mation, this analogous behavior to LaCoO3 system seems to be reasonable, since the lan thanum component should move to form La2Zr207. However, this seems to contradict the expected mass transfer for the case of manganese dis- solution, where manganese ions tend to move into YSZ re- sulting in the manganese depletion in the perovskite side.
Valence stability and reactivity with YSZ.--The reactiv- ity of lan thanum transition-metal perovskites has been discussed in terms of the relative stability of the divalent and the trivalent compounds (7). A typical reaction is, as shown in Eq. [11], the combinat ion of the La~Zr207 forma- tion and the reduction of cobalt ions from the trivalent to the divalent state.
For the case of LaMnO3, the relatively stable tetravalent manganese ions in the perovskite structure give rise to the
l a n t h a n u m nonstoichiometry. At 1573 K in air, the calcu- lated averaged valence number of manganese ions in- creases from 3.1 to 3.2 with decreasing lan thanum stoichi- ometry, y, from 0.94 to 0.825. On the basis of these valence numbers, we pointed out that when the La2Zr207 is formed between La,MnO3.~ and ZrO2, a small number of the man-
0 _.,J
t -
0.7
0.6
0.5
0.~.
0,3
0.2
0.1
0.0
O.
"~ ll!
LoMnO 3 side
La2Zr20 t formation
}} YSZ side _
.t! d issolut ion I
Fig. 9. Estimated concentration profiles along the diffusion paths, a to e, indicated in Fig. 8. Lines a and b traverse the La2Zr207 stability polygon.
ganese ions may be oxidized in the perovskite structure. In the present study, the manganese averaged valence num- ber in YSZ can be calculated to be 2.2; this means that when the manganese ions in the lanthanum nonstoichiomet- ric manganites dissolve into YSZ, the reduction of man- ganese ions is accompanied. Figure 8 shows that the slightly oxidative reaction of the La2Zr207 formation and the reductive Mn dissolution into YSZ occur independ- ently; this is the major difference from reactivity of LaCoO3 with ZrQ. This seems to orginate from the pecu- liarity of manganese ions when compared with other tran- sition metals; that is, the ionic radius of the tetravalent state is small, and this makes it easy to have the lanthanum non~toichiometry in the perovskite phase, whereas the rel- atively large size of the divalent ions ensures the large sol- ubility into YSZ (24).
Discussion
Lattice stability and cation diffusivity in perovskites.-- The present thermodynamic analysis on concentration profiles for LaCoOJYSZ and La2NiOJYSZ reactions has revealed that the transition metal ions (cobalt or nickel ions) do not tend to diffuse, whereas the lanthanum ions tend to move in perovskite phases. In the perovskite struc- ture, the transition metal ions occupy the B sites with six coordinates, and the lanthanum ions occupy the A sites with 12 coordinates. Vacancies are formed very often in oxide ion sites and in A sites, but rarely in B sites (26). This suggests that diffusivity of A-site cations may be much faster than that of B-site cations. This is consistent with the present analytical results.
Futhermore, a similar relation between the structural chemical feature and the chemical reactivity can be seen in experimental results by Hayami and Yabuki (2), who found that in PrCoOJYSZ, the reactivity was higher and a more significant layered arrangement was developed than in LaCoOJYSZ; this implies that praseodymium ions may diffuse faster than lan thanum ior~s. This can be related to the differences in tolerance factor as follows
1. The small tolerance factor among LnCoO3 (Ln=rare earth) suggests the small stabilization energy (9, 27). This means that the thermodynamic activity of Pr2Q in equilib- rium with PrCoO3 and CoO phases given by the following equation
PrCoO3 = CoO + 1/2 Pr~Q3 (in CoO) + 1/4 O2(g) [30]
is expected to be higher than the corresponding value for LaCoO3.
2. From the structural chemical point of view, the smaller tolerance factor than unity means that the A-site volume is larger than the ionic size of cations. This implies the lower diffusion barrier for the smaller A-site cations.
Possible phase arrangements.--For the LaCoOJZrO2 couple, reaction products, LazZr207 and CoO, can be ar- ranged in the following three possible ways; that is, LaCoOJCoO/La2Zr2Ov/Zr02 layered. LaCoOj(CoO, La2Zr2OT)/ZrO2 aggregate, and LaCoOJLa2Zr2OT/CoO/ZrO2 layered arrangements. In the last case, cobalt should dif- fuse and ascend to the maximum chemical potential; this is unrealistic. Thus, there remain the first two possibilities. For displacement reactions between AX and B (A, B: met- als; X: nonmetal), some theoretical and experimental in- vestigations have been made on the basis of the diffusion properties to obtain the criterion for whether the layered or the aggregate arrangement is developed in a particular displacement reaction (28, 29). Since the present systems contain three metallic elements and the diffusion proper- ties in La2Zr207 have not been investigated yet experimen- tally, the plausible arrangement in the present systems is discussed qualitatively in terms of the diffusion properties in CoO.
In a hypothetical aggregate arrangement, the diffusion path should be located in the vicinity of the La2Zr~O~/CoO borderline; along this line, the magnitude of change in chemical potential is the same between La and Zr, al- though the sign is different. In contrast, in the cobalt oxide appearing in the layered arrangement in Fig. 6, the slope of
) unless CC License in place (see abstract). ecsdl.org/site/terms_use address. Redistribution subject to ECS terms of use (see 130.203.136.75Downloaded on 2016-04-08 to IP

2726 J. Electrochem. Soc., Vol. 138, No. 9, September 1991 �9 The Electrochemical Society, Inc.
the lan thanum chemical potential is less steep than that of the zirconium chemical potential. This means that lantha- num can diffuse more easily in CoO than zirconium. This can be compared with experimental results by Hoshino and Peterson (30) on cation impurity diffusion in CoO and NiO. Their observed tracer diffusion coefficient for Zr is 1.80 • 10 -8 cm2/s at 1573 K, while those fo rSc and Y are 2.97 • 10 -9 and 3.13 • 10 -8 cm2/s, respectively; since they found that the larger ions diffuse more rapidly than the smaller ions with the same valence, La can be expected to diffuse more rapidly than Zr in CoO. This is consistent with the present interpretation of the concentration profile.
Hoshino and Peterson (30) indicated that in NiO, the tri- valent ions (Sc and Y) do not diffuse so rapidly as in CoO, whereas the lan thanum ions can be estimated to diffuse rather easily in the perovskite related lattices as described above. This can explain why the NiO layer was not de- veloped in the vicinity of perovskite phases.
Chemical potential diagram and diffusion path.--Hel- geson et al. (31-33) have extensively investigated on ki- netic phenomena between minerals and aqueous solutions under the local equil ibrium approximation. When com- pared with such systems, diffusion in solid states strongly depends on the crystal structures, the availability of vacan- cies and interstitial sites, grain size, grain boundaries, and so on. In view of this complexity, the reaction profiles in the perovskite/YSZ couples are surprisingly simple in the sense that the appearance of the reaction products and their sequence can be well accounted for in terms of the phase arrangement having gradual change in the chemical potentials. The reason for this simplicity seems to be the following: although the layered and the aggregate arrange- ments exhibit significant difference in concentration pro- file, they appear closely to each other and form a plausible zone connecting the stability fields of reactants in short distance in the chemical potential diagrams. In other words, knowing the proper driving force for a particular reaction, plausible reaction paths can be predicted as a zone using the geometrical phase arrangement in the chemical potential diagrams. Among plausible reaction paths, experiementally determined sequence of reaction products can specify a path. Since it is difficult to observe directly the chemical potentials of metallic elements dur- ing reaction, this kind of analysis can PrOvide useful infor- mation on chemical potential changes along the reaction path.
With the reaction proceeding, reactant layers may be thickened or the morphological arrangement may change; in some cases, particular phases may appear or disappear after some induct ion period. These changes should be also presented by diffusion paths moving in the chemical po- tential diagrams. In view of this, the geometrical arrange- ment of stability fields is quite important for the under- standing of the chemical nature of reaction couples, especially when many compounds are involved as reaction products in mul t icomponent systems. Recently, we have made an attempt to account for the multilayered oxide scales on alloys dipped in molten carbonates by a similar approach using the chemical potential diagrams for multi- component systems (34). Results show that although oxide scales of SUS316L and SUS31OS are quite different, there diffusion paths in the chemical potential diagram can be well represented by straight lines in parallel. These suc- cesses suggest that the chemical potential diagram ap- proach of representing reaction paths is quite appropriate for obtaining, even in the absence of the diffusion proper- ties, the fundamental chemical nature associated with re- actions in mul t icomponent systems.
Conclusions The chemical potential diagrams have been constructed
for the La-M-Zr-O (M = Co, Ni, Mn) systems under a condi- tion of P(Q) = 1 bar. Using the experimental concentra- tion profiles reported in literature, plausible reaction paths v~here presented in the diagrams of log [a(La)/a(Zr)] vs. log [a(M)/a(Zr)] plot with the aid of the infinitely dilute solu- tion approximation and of the phenomenological equation
for mass transfer in the solutions; resulting paths were found, to be relatively simple and almost linear in the dia- grams. The chemical potential diagram for the La-Mn-Zr-O system has been constructed by taking into account the lan thanum nonstoichiometry, y, in the lanthanum manga- nite perovskite, L%,MnO3 and also the Mn and La dissolu- tion into YSZ. The diagram shows that when y is close to unity, the La2Zr2Ov phase should appear between per- ovskite and YSZ and while y is small, the manganese dis- solution into YSZ becomes significant despite no La2Zr207 formation.
Manuscript submitted Dec. 18, 1990; revised manuscript received April 2, 1991.
The National Chemical Laboratory for Industry assisted in meeting the publication costs of this article.
REFERENCES 1. C. S. Tedmon, Jr., H. S. Spacil, and S. P. Mitoff, This
Journal, 116. 1170 (1969). 2. R. Hayami and T. Yabuki, Bull. Government Industrial
Research Institute, Osaka, 28 98 (1977). 3. S. K. Lau and S. C. Singhal in "Proceedings of Na-
tional Fuel Cell Seminar May 1985," Tucson, AZ, p. 107, Courtesy Associate Washington, DC (1985).
'4. O. Yamamoto, Y. Takeda, R. Kanno, and M. Noda, Solid State Ionics, 22, 241 (1987).
5. J. Echigoya, S. Hiratsuka, and H. Suto, Mater. Trans. JIM, 30, 789 (1989].
6. R. Okuyama, Private communication; see also R. Okuyama et al. in "Proceedings of 56th meeting of the Electrochemical Society of Japan," p. 195 (1989).
7. H. Yokokawa, N. Sakai, T. Kawada, and M. Dokiya, Denki Kagaku, 57, 821 (1989); 57, 829 (1989); 58, 161 (1990); 58, 489 (1990).
8. H. Yokokawa, N. Sakai, T. Kawada, and M. Dokiya, Solid State Ionics, 40/41, 398 (1990).
9. H. Yokokawa, T. Kawada, and M. Dokiya, J. Am. Ceram. Soc., 72, 152 (1989).
10. H. Yokokawa, N. Sakai, T. Kawada, and M. Dokiya, This Journal, 138, 1018 (1991).
11. H. Yokokawa, T. Kawada, and M. Dokiya, Denki Ka- gaku, 56, 751 (1988).
12. H. Yokokawa, T. Kawada, and M. Dokiya, J. Am. Ceram. Soc., 72, 2104 (1989).
13. H. Yokokawa, N. Sakai, T. Kawada, and M. Dokiya. This Journal, 137, 388 (1990).
14. H. Yokokawa, N. Sakai, T. Kawada, and M. Dokiya, J. Am. Ceram. Soc., 73, 649 (1990).
15. T. Rosenqvist, Met. Trans., 9B, 337 (1978). 16. See, for example, papers presented in "Diagrams of
Chemical and Electrochemical Equilibria Their Set- ting-up and Application," M. Pourbaix and A. Pour- baix, Editors, CEBELCOR, Brussels (1981).
17. H. Schmalzried and A. Pelton, Ber. Bunsenges. Phys. Chem., 77, 90 (1973); A. D. Pelton and W. T. Thompson, "Progress in Solid State Chemistry," Vol. 10, Part 3, pp. 119-155, Pengamon Press, Inc., Elmsford, NY (1975).
18. P. A. Shewmon, "Diffusion in Solids," Chap. 4, McGraw Hill, Inc., New York (1963).
19. C. Milliken, D. Tucker, S. Elangovan, and A. Khand- kar, Proc. Fall meeting of Electrochemical Society, 1990; C. Milliken, D. Tucker, S. Elangovan, and A. Khandkar, in 1990 Fuel Cell Seminar, Phoenix, No- vember 1990, Courtesy Associates, Inc. Washington, D.C. 1990, p. 218.
20. G. Eriksson, Chemica Scripta, 8, 100 (1975). 21. H. Yokokawa, M. Fujishige, S. Ujiie, and M. Dokiya, J.
Natl. Chem. Lab. for Industry, 83, Special Issue, p. 1 (1988).
22. A. S. Jordan, in "Calculation of Phase Diagrams and Thermochemistry of Alloy Phases," Y. A. Chang and J. F. Smiths, Editors, pp. 100-129, The Metallurgical Society of AIME, Warrendale, PA (1979).
23. J. Shimoyama, J. Mizusaki, and K. Fueki, in "Proceed- ings of 53rd Fall Meeting of the Chemical Society of Japan," p. 53 (1988).
24. H. Yokokawa, N. Sakai, T. Kawada, and M. Dokiya, ISSI Lett., 2, 7 (1991).
25. M. Hillert, CALPHAD, 4, 1 (1980). 26. C. N. R. Rao, J. Gopalakrishnan, and K. Vidyasagar,
Ind. J. Chem., 23A, 265 (April 1984). 27. K. Kitayama, J. Solid State Chem., 73, 381 (1988); 76,
) unless CC License in place (see abstract). ecsdl.org/site/terms_use address. Redistribution subject to ECS terms of use (see 130.203.136.75Downloaded on 2016-04-08 to IP

J. Electrochem. Soc., Vol. 138, No. 9, September 1991 �9 The Electrochemical Society, Inc. 2727
241 (1988); 77, 366 (1988). 28. C. Wagner, Z. Anorg. Allgem. Chem., 236, 320 (1938). 29. R. A. Rapp, A. Ezis, and G. J. Yurek, Metall~ Trans., 4,
1283 (1973). 30. K. Hoshino and N. L. Peterson, J. Phys. Chem. Solids,
45, 963 (1984). 31. P. Aagaard and H. C. Helgeson, Clays and Clay Miner-
als, 45, 963 (1984). 32. H. C. Helgeson, Pure Appl. Chem., 57, 31 (1985) and ref-
erences quoted therein. 33. T.S. Bowers, K. J. Jackson, and H. C. Helgeson, "Equi-
l ibrium Activity Diagrams for Coexisting Minerals and Aqueous Solutions at Pressures and Tempera- tures to 5 kb and 600~ '' Springer-Verlag, Tokyo (1984).
34. H. Yokol{awa, N. Sakai, T. Kawada, and M. Dokiya, in "Proceedings of 1990 Fuel Cell Seminar," p. 152,
Phoenix, AZ, November 1990, Courtesy Associates, Inc., Washington, DC (1990).
35. D. D. Wagman, W. H. Evans, V. B. Parker, I. Halow, S. M. Bailey, K. L. Churney, and R. L. Nuttall, "The NBS Tables of Chemical Thermodynamic Proper- ties, Selected Values for Inorganic and C1 and C2 Or- ganic Substances in SI Units," J. Phys. Chem. Ref. Data, Vol. 2, Suppl. No. 2 (1982).
36. V. P. Glushkov, L. V. Gurvich, G. A. Bergman, I. V. Veltz, V. A Medvedev, G. A. Khachkuruzov, and V. A. Yungman, "Thermodynamic Data for Individ- ual Substances," High Temperature Institute, Na- tional Academy of Sciences of the U.S.S.R., Moscow (1978-1982).
37. A. N. Petrov, V. A. Cherepanov, A. Yu. Zuyev, and V. M. Zhukovsky, J. Solid State Chem., 77, 1 (1988).
38 .K. Kitayama, ibid., 87, 165 (1990).
Development of Techniques for Real-Time Monitoring and Control in Plasma Etching
II. Multivariable Control System Analysis of Manipulated, Measured, and Performance Variables
S. W. Butler, *'1 K. J. McLaughlin, 2 T. F. Edgar, and I. Trachtenberg**
Department of Chemical Engineering, University of Texas, Austin, Texas 78712
ABSTRACT
Process control strategies have been developed for reactive ion etching of silicon and silicon dioxide in CF4/O2 and CF4/H2 plasmas. Four measured variables, four manipulated variables, and seven performance variables were considered for both gas mixtures. Relative gain array analysis and singular value decomposition were used to select manipulated/ process variable control loop pairings for feedback control and to evaluate potential difficulties in control system perform- ance. Singular value decomposit ion was also used to determine which process variable (measured real-time) correlated best with a given performance variable. Block relative gain analysis of multivariable interactions in the process indicated that single loop feedback control would be inadequate for Control of both CFjH2 and CF4/O2 etching, which was subse- quently verified by simulation. Multivariable control (partial decoupling) was much more effective in reducing dynamic fluctuations in the process variables.
The purpose of this paper is to present a systematic mod- eling and control analysis of the etching of silicon and sili- con dioxide using two gas mixtures: CF4/O2 and CF4/H2. As discussed in Part I (1), experimental testing in a RIE reac- tor yielded relationships between the process variables and the reactor manipulated variables as well as between performance variables and manipulated variables. In Part II, we present the results of dynamic testing used for the development of transfer function matrices, dynamic input- output models in the Laplace domain. These resulting dy- namic multivariable models of the system are used to sim- ulate the control system so that various control strategies can be studied. The key questions to be answered in this analysis are:
1. Which manipulated variables should be used to con- trol specific process variables (e.g., species concentrations, dc bias) at their set points in a real-time feedback control configuration?
2. Based on the results of 1, which performance variables (e.g., yield, uniformity, anisotropy) can be controlled in real-time to provide a measure of the process quality?
Several techniques from multivariable control theory were applied to the dynamic model to determine suitable pairings between inputs and outputs for feedback control, as well as controller settings for achieving acceptable closed-loop system performance. These techniques were also used to determine which performance variables could be controlled in real-time. The results indicate that addi- tional manipulated and process variables are needed to
* Electrochemical Society Student Member. ** Electrochemical Society Active Member.
Present address: Semiconductor Process and Design Center, Texas Instruments, Dallas, Texas 75265.
2present address: Vista Chemical Company, Austin, Texas 78726.
achieve the desired level of control for the plasma etching processes.
Development of a Dynamic Model of Plasma Etching In general, dynamics within a plasma are quite fast.
Electrons react to the alternating current from the RF gen- erator on a t ime scale similar to the plasma frequency (13.56 MHz). Free radicals and ions respond more slowly than electrons due to their far greater mass, but the time scale for movement of material and chemical reactions in a plasma are short, on the order of fractions of a second to several seconds for typical processes. The actual t ime con- stants are not well known, and they may be too small to be treated by a process control system. However, some un- derstanding of the relative magnitudes of these t ime con- stants is necessary for simulating the control system and evaluating the potential control algorithms.
To obtain estimates of the time constants, step changes of -+ 50 W (power), _+ 25 mtorr (pressure), and -+ 5% 02 (or H2) were made to the plasmas at steady state. The experimen- tal configuration did not permit implement ing a step change in total flow rate. Measurements of the process var- iables were made during the step tests to estimate the time constants for the systems, which were based on 63.2% of the final response (2). For these experiments, only the spectral (concentration) variables were measured due to the slow response of the dc bias meter. The spectral data were recorded every 0.01 s. The resulting histograms were quite noisy, so a moving-average filter (2) was used to re- duce the noise level in the system. The resulting time con- stants were not very accurate but were satisfactory for or- der-of-magnitude estimates. Time constants for the CF4/O2 and CF4/H2 systems can be found in Table I. Numbers marked with an asterisk (*) were not measured experimen-
) unless CC License in place (see abstract). ecsdl.org/site/terms_use address. Redistribution subject to ECS terms of use (see 130.203.136.75Downloaded on 2016-04-08 to IP