a thermodynamic study - University of Canterbury
292
COMPLEXES WITH ALIPHATIC OXIMES, KETONES AND AMINES A THERMODYNAMIC STUDY A the s presented for the degree of Doctor of Philosophy Chemistry in the University of Canterbury, Christchurch, New Zealand. by G.R. HEDWIG 1972
-
Upload
khangminh22 -
Category
Documents
-
view
0 -
download
0
Transcript of a thermodynamic study - University of Canterbury

COMPLEXES WITH ALIPHATIC OXIMES, KETONES AND AMINES
A THERMODYNAMIC STUDY
A the s presented for the degree of
Doctor of Philosophy Chemistry
in the University of Canterbury,
Christchurch, New Zealand.
by
G.R. HEDWIG
1972

ACKNOWLEDGEMENTS
I am grateful to Dr H.K.J. Powell for advice and
encouragement tbroughout this work.
I would like to express my thanks to the chnical
staff of the Chemistry Department, and particularly to
Mr R. Hooper, who designed and built the ectronic
equipment shown Appendix A.
I acknowledge the award of a University Grru~ts
Committee Post-Graduate Scholarship.
G.R. Hedwig
June 1972

ABSTRACT
The thesis describes the preparation of the ~-amino
ketone ligand 4,4,9,9-tetramethyl-5,8-diazadodecane-2,11-
dione (1) and of the derived diamine-dioxime and tetraamine
Thermodynamic data are reported for complex formation
of these ligands, and an analogous tetraa~ine, with protons
and copper( )
the protonation reactions, data are interpreted
in terms of the structure of the The thermodynamic
data for the formation of the copper complexes indicate that
the donor strength of the functional groups is in the order
amine >>oxime >>ketone.

C HAFI:.F.R 1
'1 • 1
1.2
"1. 3
CHAPTER 2
2.1
2.2
2.3
2.4
2.5
2.6
CHAPT~rt 3
Introduction
Preface
CONTENTS
Complex Formation
This Work
Aqueous Solution
Experimental
Preparation of the Ligands
Preparation of Solutions
Glassware
pH Measurements
The Design of an Isothermal Titration C
meter
Spectrophotometric Instruments
The Calibration of the Meter as a
Hydrogen Ion Concentration Probe
3.'1 pH(S) of the Standard Solutions
3.2 Hydrogen Ion Concentration
3.3 Choice of Concentration Quotients
3.4 Results and Calculations
3.5 Discussion
3.6 Summary and General Comments
1
3
16
18
22
24
25
28
43
45
46
47
49
54
60

CHAPTER 4 Calculation of Equilibrium Constants from
pH Titration Data
4.1 Calculation of the Protonation Equilibrium
Constants
4.2 Calculation for the Ligands of the Stability
Constants for the Copper Complexes
CHAPTER 5 Calculation of Enthalpy Data
5.1 Calculation of ~Hi for the Protonation of
bm-3,2,3-tet
Calculation of the ~H. for the Diamine-Dioxime l
Protonation
5.3 Calculation of the Enthalpy Changes for the
Formation of the Copper(II)/Diamine-D.ioxime
Complexes
5.4 Calculations in the Experimental Determination
of (~H1 + ~H2 ) for the Copper/Diamine-Dioxime
System
5.5 Calculation of the Enthalpy Change for the
61
74
78
78
81
Formation of the Copper Complexes of 3,2,3-tet 83
5.6 Calculation of the Enthalpy Change for the
Copper (hm-3,2,3-tet) Complex 86

CHAP'J:IER 6 Protonation of the Ligands
6.1 Protonation of the Diamine-Dioxime Ligand 88
6.2 Protonation of the Tetraamines 3,2,3-tet and
hm-3, 2, 3--tet
6.3 Protonation of the Diamine-Diketone Ligand 121
CHAP'J:IER 7 Formation of Copper(II) Complexes with the
Ligands
7.1 Formation of Copper Complexes with 3,2,3-tet
and hm-3,2,3-tet
7.2 Formation of Copper Complexes with the
Diamine-Dioxime Ligand
7.3 Formation of the Copper Complex with the
Diamine-Diketone Ligand
7.4 Copper Complexes - A Brief Summary
Appendix A
Appendix B
Appendix c
Appendix D
Appendix E
Appendix F
References
126
146
165
170

CHAPTER 1
INTRODUCTION
1 .1
The condensation reaction of Ni(en) 3(Cl04 ) 2 with
acetone yields as one product the nickel complex of the
cyclic tetradentate ligand hexa~ethyl-1,4,8,11-
tetraazacyclotetradecadiene (B) which exists in ru1d
t ( ) .. f '1 _rans ene 1somer1c orms . The trans form (1) is shown
Fig. '1.1. The hydrolysis of a solution of the ligand B
(cis) yie a amine-diketone ligand, 4,4,9,9-tetramethyl-
5, 8-diazadodecane-2, 11-dione ( 2) ( . 1.1) which can be
isolat as a dihydroperchlorate salt2 • The reaction of the
ligand B (cis) with aqueous hydroxylamine gives a diamine
dioxime ligand3 4,4,9,9-tetramethyl-5,8-diazadodecane-2,11-
dione dioxime (3). Sodium-in-alcohol reduction of the
ligand (3) gives the methyl substituted t
ligand4
, 2,11-diamino-4,4,9,9-tetramethyl-5,8-diazadodecane
(4). (Fig. 1.1).
The ligands (2), (3) and (4) are structurally similar,
the only difference being changes in two terminal
functional groupings. s sis s a thermodynamic
study (~G, ~Hand ~S) complex rmation by these ligands
and related tetraamine 1,2-bis(3'-aminopropylamino)
ethane (5) with copper ( ) and protons aqueous solution.
h~ II CNH /NJ NH 0
""N· [NH N( I"N 0
I I
( 1 ) (~}
q
c
+~ a
d r---NH CNH NH2-
~NH NOH NH NHL
~~ ( 3 ) ( 4-)
ll C
NH NHz.
NH · NH U"
( 5)
Fig 1.1
There are comparitively few thermodynamic data for
complex formation of ligands containing oxime groups5. The
complex formation of vic-dioximes6 '7 and related analytical
reagents has been studied but generally in dioxan-water
. t 6 mlx ures • Murmann and co-workers have determined the
energetics for complex formation by a number of amine
substituted aliphatic a-amine oximes8 in aqueous solution.
2
No thermodynamic data appear to be available5 for
complex formation with ligands analogous to (2) in Fig. 1.~.
However, there has been considerable work on complex
formation with ~-diketones9 (e.g. acetylacetone) and
.. k t ~0,~~,12 ~-lmlno e ones .
Since the pioneering work of Bjerrum1 3 complex format-
ion by amines has received much attention although most data
are for mono and diamine ligands5.
In relation to this work, the stability constants for
some complexes with ~,3-bis(3'-aminopropylamino)propane(tripen)
~4 have been reported and more recently those for some
complexes with N,N~bis(2-aminoethyl)-~,3-propanediamine . 15
(2,3,2-tet) were reported . However, enthalpy data for
polyamines is scarce and to date the only available data for
linear tetraamines is for the ligand
~,2-bis(2'-aminoethylamino)ethane(trien)~ 6 .

~.2 COMPLEX FORMATION IN AQUEOUS SOLUTION
A complex may be defined as a species formed by the
association of two or more simpler species each capable of
independent existence ln solution~7. Complex formation can
occur between species of like or unlike charges and also
between charged and neutral species. The reactions
Cu2+ + Cl -1==~CuCl +
are examples of complex formation. Each complex has a
certain stability which describes the amount of association
3
which occurs in a solution containing species in equilibrium.
G.uantitatively the stability is determined by an equilibrium
constant, e.g. for a reaction
K c
where { } denotes the activity of the species and Y. is the l
activity coefficient which re1ates the concentration to the
activity. For a particular equilibrium, the magnitude of
the constant will depend on the units used to express the
* Charges are omitted from the symbols used.

4
concentrations of the species involved. Only when the
concentrations are expressed on the mole fraction scale will
the equilibrium constant be dimensionless (see section
'1.2.3).
'1.2.'1 Free Energy Changes
For a reaction
ii + ji + ••• ~ uU + vV +
the change in free energy of the system is expressed
where ~ is the partial molal free energy or the chemical X
potential of species X~and S, T, V, P and n have their
1 . . '18
usua meanlngs The chemical potential is a differential
I
expression,thus only the difference in the chemical potential
between two states can be determined. It is usual to
express the chemical potential ~X for a component in solution
with respect to the chemical potential in some hypothetical
'19 0 standard state ~X'
where aX is the activity of component X. (In the standard
state aX is unity. The standard state is often defined as a
hypothetical solution of unit activity which possesses the

properties of an infinitely dilute solutionJ.
For reaction I at constant temperature and pressure
i j a. a. l J
where ~G0 is the free energy change when the substances are
5
in their standard states. When reaction I is at equilibrium
~G = 0 hence
u v
(a a ... \
= - RT ln u. v . ) \, l J ' a. a . . .. "
l 'J
where K0 is the equilibrium constant for the reaction. Thus
the free energy change can be calculated if the equilibrium
constant K0 can be determined.
Concentrations of species are more readily attained than
are their activities. One approach for the calculation of
thermodynamic equilibrium constants is to use the constant
ionic strength method.
Control of activity coefficients using a constant ionic medium
The concept of ionic strength was introduced by Lewis
20 and Randall who stated, "in dilute solutions, the activity
coefficient of a given strong electrolyte is the same in all
solutions of the same ionic strength". It follows from
equation 1.1 that K is related to K by a function of the c
ionic strength, i.e.

6
K = F(I).
The concentration quotients Kc are usually calcul ed from
studies in solutions containing relatively large concentrat-
ions of an inert electrolyte and are valid only for the
medium used. The choice of the background inert electrolyte
is important. ions must not form insoluble species with
reactants under study if ions of background
ectrolyte are associat with the reactant species then it
is necessary that at le t campo ion of associated
sp s constant throughout a s es exp
Sodium was used as the background electro
for s work. main reason for ce NaCl was
because cone on quotients for protonation of
ethylenediamine, us for the electrode calibration (see
Chapter 3), were determined NaCl.
Determination of thermodynamic equilibrium constants
The thermodynamic equilibrium con K0 can be
obtained by extrapolating concentration quotients, determined
at a number of ionic strengths, to inite dilution (I
i.e. K0 = lim (
r-o Kc + f(I))
0)
where Kc the concentration quoti and f(I) a function
22 . of the ionic strength. The usual approach 1s to use
of the extended form of Debye-Huckel equation,

log 'Y = ±
where A and B are the Debye-Huckel parameters23 and c is a
7
small parruneter. The value K0 can be obtained graphically
from
log K0
= log Kc -~ - c.I
- AzSLI where log Kc '1+BI[I is plotted against I,
I 0. Generally ionic
log Kc =
function
adjusted so that the plot is linear and of a small ope.
While this approach is purely empirical eliminates
uncertaint s due to extrapolations of highly curved
f t · 24 h l K . t I unc 1ons sue as og c aga1ns or This graphical
approach for the determination of log K0 is used
work.
1.2.2 Enthalpy Changes in Complex Formation
From the equation 1. 2 ,
and on substituting back into equation 1.2
An alternative ssion is
this
'] • 2

8
[.Q_(6G
0)] == -6H
0
aT T ; p T2
and as 6G0 == -RTlnK0
at constant pressure. Therefore the enthalpy change for a
particular reaction can be determined from the temperature
variation of the equilibrium constant. This approach
requires the knowledge of accurate equilibrium constants
over a wide temperature range. Without extreme care 6H0 and
68° values determined using the van't Hoff isochore (equation
1.3) are of little use. A far superior method is to measure
the enthalpy change by direct calorimetric methods. The
advent of thermistors has enabled accurate (errors < 0.5%)
determinations of the enthalpy changes by direct calorimet
ric methods. Many different designs of calorimeters2 5-29
have been used to determine the enthalpy changes for a
variety of complex formation reactions.
Effect of ionic strength on 6H
The enthalpy changes for many complex formation
reactions are determined in the presence of a background
electrolyte. The standard enthalpy change 6H0 can be
determined either by a short extrapolation to I = 0 using
enthalpy data at a number of ionic strengths or by applying
a small correction to the enthalpy change valid for a

9
particular ionic strength. From the van't Hoff isochore,
a ~H0 aT (lnKc + ~ lnY.) = ---
i l RT 2
where K is the concentration quotient and ~ lnY. is the c i l
algebraic sum of the activity coefficients of the reactants
ann nroducts in equilibrium. Rearranging equation 1.3
6H0 = RT 2 ]_ (lnK) + RT2 aaT (~ lny.) aT c i l
thus
By differentiating an extended form of the Debye-Huckel
equation~0
]_(logy.) = 2 x 10-3.log Y. aT l l
and substituting into equation 1.4
where 6H is the enthalpy change at the particular ionic c
strength and ~ z. 2 is the algebraic sum of the charge on . l l
1 .4
the ions in the equilibrium and log Yi is calculated using a
Debye-~uckel expression31 . For example, for the reaction
H+ +A~ HA+ ~ z. 2 = O,thus 6H0 "'"~H while for the
. l c + l + 2+
reaction HA + H ~ H2A ,~he correction to convert -6Hc
to -~H0 is -o.s3
kJ mol-1 •

10
Enthalpy cycle
The enthalpy change for a particular reaction is the
property most directly related to the changes in the number
and strength of chemical bonds. The enthalpy change for a
reaction in aqueous solution is composed of two parts, (i)
an internal part ~HI where contributions to ~H arise from
interactions that are independent of the environment and
(ii) an environmental part ~HE which results from inter
molecular interactions between the solvent and the molecules
and ions taking part in the reaction. These changes can be
related using an enthalpy cycle32 .
Consider the reaction between a metal ion Mn+ and a
neutral molecule L to form a complex MLn+. The enthalpy
cycle can be represented
~HI + L(g) ~
i\llsol (L)l
Using Hess's law~
MLn+(g)
1 1\llsol(ML)
where ~~ is the enthalpy change for the reaction in aqueous
solution (experimental quantity), ~Hh is the enthalpy of
hydration of the Mn+ ion and ~H 1(X) is the enthalpy of so

solution of the cies X. The enthalpy of reaction
DHR = DHI + DHE and the environmental enthalpy change
given by
11
Thus, to calculate (which will incorporate the coordin-
ate bond energy and any cyrstal field stabilisation energy
of the complex ML) has to be determined. Metal ion
hydration energies can be calculated33 ru~d for some ligands
DHs01 (L) can be determined34 , but DHs01 (ML) is not readily
estimated. However, for a s es complexes with a given
L reasonable assumptions about the variation of DH 1 (ML) so
can be made,and thus changes DH I for the s es can be
discussed33. cause of unc the estimation
DHs01 (ML),reference of aqueous solution thermodynamic
data to the gas phase has not generally been attempted.
1.2.3 Entropy Changes for Complex Formation
The role of the solvent is of paramount importance in
rationalisation of entropy changes in most complex
formation reactions. Ions in aqueous solution order water
molecules in the co-sphere due to the polarisation of the
water molecules by the charge on t ion.
Cons the reaction

Contributions to the observed entropy change
number of effects.
se from a
(i) liberation of water mo cules from the inner
coordination sphere of the metal ion M which will cause a
positive entropy e.
(ii) Changes in the solvent ordering ability of the
12
1 free 1 and. coordinated metal ion. the complex the ligand
will ld solvent from the effect of the charge on the
metal ion; the solvent is generally ss ordered around the
complex ion than in e metal ion35, This difference
wi malte a po ive contribution to the overall entropy
change. The uncoordinated will also possess a
hydration e, due to dipole-dipole interactions. On
coordination there will be a small positive entropy contrib
ution due to the 'release' of this hydration sphere.
( ) Contributions arising from the changes in the
number of ees of eedom (rotational, vibrational and
translational) of the ligand L on coordination to the metal
ion M (a loss of translational entropy and changes
rotational and vibrational modes). These changes are
collectively termed configurational entropy changes and will
make a negative contribut'ion to the overall entropy change.
Entropy changes are generally calculated us the
Gibbs-Helmho equation (1.2) once the free energy and
enthalpy changes have been experimentally determined.

Cratic Entropy ru~d the Chelate Effect
From 0 0 equation D.G = -RT ln K ~the magnitude of the
free energy change will depend on the units used to calcul-
ate equilibrium constant K0• outlined by Gurney3~
the free energy change for a reaction can be ssed
terms of a unitary part, which is c ated from a dimen-
sionless equilibrium constant, and a cratic part which is
associated with change in the number of solute species.
important, when comparing free changes (and
entropy changes as D.H0 has no cratic contribution)~to
consider the changes th<:J.t arise from both the unitary and
cratic terms.
Consider two reactions
and
Cu2+ ( aq) + en( aq) ~ Cu( en) ( aq)
The thermodynamic data these reactions are shown in
Tab '1 • '1 • The unitary entropy D.S 1 ( D.S '1 = £1S - D.nRln55. 5
where l1n is the number of moles of products minus
of reactants) is also shown in Table '1.'1.
moles

14
Table 1.1
-1 -1 Reaction ~0: kcal mol L\H kcal mol t::,S cal mo -1 1 -'1 -'1Tr K t::,S cal mol n..
-12.0 -L~.4 '11.6
I -'1 5. 0 -14.6 9-3
Data from A. Bent, J. Phys. Chern., 60, 1 ( 1956)
The chelate effect (the extra stability of a metal ion
complex with a bidentate ligand compared with that complex
containing an equivalent number of monodentate ligands) is
generally attributed as being largely due to the difference
in the entropy terms37. However, the data Table 1.1
indicate that when the cratic terms for reactions II and
are considered the magnitude of the chelate
substantially reduced38 .
Statistical Entropy
ect is
There can be a contribution to the entropy change from
statistical factors. These are be considered by erence
to a specific e. Consider the protonation of ethylene-
diamine. the first stepwise protonation there are two
pos le sites of protonation and only one pos e site of
deprotonation. Thus ~:::,s 1 has a stati ical contribution of
+Rln2. For the second stepwise protonation there is only one
possible site of protonation and two possible po ions of
deprotonation, thus there is a contribution to ~:::,s2 of -Rln2.

15
1.2.4 Crystal Field Stabilisation Energy (CFSE)
The ligand field theory considers only the effects of
the electrostatic field of the ligands upon the partially
filled d orbitals of the metal ion39. In an octahedral field,
the d orbitals of the metal ion are split into an upper eg
group and a lower t 2g group with anenergy difference 60
.
Preservation of the 'centre of gravity' of the set of levels40
requires that the energy of the e set is raised by 3/5 60
and g
the t 2g set is lowered by 2/5 60
,relative to a spherically
symmetrical field. Now the resulting CFSE, which depends on
the distribution of electrons between the levels, is given by
CFSE(octa.) = 6 (-2/5 nt + 3/5 n ) o 2g eg
where n is the number of electrons in the t 2g and eg levels.
For the enthalpies of hydration of the first row
transition metal ions, in the absence of CFSE, 6H0 hyd would
be expected to vary smoothly with increase in the atomic
b d d . d' 41 num er an ecrease ln ra lUS . Experimentally this was not
41 observed . However, when corrections for CFSE were applied
the values did fall on the predicted smooth curve.
When the octahedral field is tetragonally distorted
further splitting in the energy levels occurs (see section
7.1.3 ) which results in an overall lowering of the energy of
the system as predicted by Jahn and Teller42 for certain d
orbital populations, e.g. d9, Cu(II). The CFSE will be
greater than predicted by the expression above for an

16
octahedral field.
1.3 THIS WORK
The aim of thesis was to study the ect of
ketone, amine and oxime functional groups the stability of
the complexes with copper ( ) ions and protons,
solution.
aqueous
The techniques used to calculate the stability constants
of the copper complexes and the basicity constants for each
ligand required the knowledge of hydrogen ion concentrations.
This work incorporated a detailed study on the calibration of
a pH meter as a hydrogen ion concentration probe. The method
and results of this calibration are discussed in Chapter 3.
The enthalpy changes for the formation of the complexes
were determined by direct calorimetric methods.
al titration calorimeter of the othermal jacket
type was designed and constructed and is described
Chapter 2.
The equilibrium constants were calculated from the
p J data by the method of least squares using computer
programs*. These calculations and a comp son of some
results using computer and graphical techniques are discussed
Chapter 4. The enthalpy data were also c culated
computer programs. These calculations are discussed
*The spelling EEogrrun has been used instead of ~~~ when referred to computers.

Chapter 5. Li
Appendix D.
The results
of t computer
discus on are r
ograms us are shown
ed in two sections.
The tonation the is discussed in er 6
copper complexes with the are discussed
Chapter 7.

18
CHAPTER 2
EXPERIMENTAL
2.1 PREPARATION OF THE LIGANDS
2.1.1 4 24i9,9-Tetramethyl-5,8-diazadodecane-2,11-dione
. 1.1 (3))
5,7,7,12,12,14-Hexamethyl-1,4,8,11-tetraazacyclotetra-
cane-4,14-diene nickel(II) perchlorate ( ed by the
method Curtis et •1 ) (25 g) was stirred wi KCN (10 g)
methanol 1 ssolved. Ether (250 ml) was added
to precipitate 104 and K2Ni(CN) 4 and the mixture was
filtered witb. suction. A solution of hydroxylamine hydro
chloride ( 17 g) in a mixture of water (50 ml) and methaiwl
(100 ml) was added to the filtrate and the re ing
solution was buffered to ca. 9 with NaOH (2M). The
solution was set aside in a stoppered flask for f.our days
then evaporated1without heating. The white product was
co ected by vacuum filtration and recryst
benzene by Soxhlet extraction. (Found: C,
s from
.8; H, 10.4;
N, 19.4%. Calculated for c14n30N4o2 : C, 58.7; H, 10.5; N,
19. 6%.)
2.1.2 4 24,9,9-Tetramethyl-5,8-diazadodecane-2,11-dione
Dioxim.e Dihydrochlorid.e (ex. 2HC1)
The isomeric oxime mixture (1 g) was warmed with
isopropanol . 100 ml) and 0.70 ml of cone. HCl (mole

ratio of ligand : acid 1: 2). Ether was carefully added
until a permanent cloudiness appeared. The product
separat on standing, and was recrystallis from iso-
propanol and ether. (Found: C, .2; H, 9.0; N, 15.6.
Calculated for c14H32
N4o2Cl2 C, 46.8; H, 8.9; N, 15.6%).
2.1.3 4,4,9,9-Tetramethyl-5,8-diazadodecane·-2, 11-dione
Dioxime Dihydrobromide
The isomeric mixture (1.5 g) was warmed with iso-
propanol (""50 ml) and 1. of cone. HEr. The solution
was filtered and ether was carefully added until a permanent
cloudiness appeared. The resulting solution was chilled in
an ice-bath. 1I'he product was collected after approximately
one hour. Yield 1.85 g, 79%. (Found: C, 37.30; H, 7.23;
N, 12.28. Calculated for c14H32
N4o2Br2 C, 37.50; H, 7.14;
N, 12. 5%.)
2.1.4 ~SL_2::Tetramethyl-5,8-diazadodecane-2,11-dione
Diexime Dihydroperchlorate (y.2HC10~
isomeric oxime mixture (0.8 g) was dissolved in 20
ml of ethanol and 8 ml of water. After ltering, 60% HC104
(0.60 ml) was added. White needles separated on standin~.
(Found: C, 35.6; H, 6.8; N, 11.5. Calculated for
c 14H32cl2N4o10 C, 34.5; H, 6.6; N, 11.5%.)

20
2.1.5 4,4,9,9-Tetramethyl-5,8-diazadodecane-2~1-dione
Dihydroperchlorate (Fig. 1.1(2)2
5,7,7,12,12,14-Hexamethyl-1,4,8,11-tetracyclotetradecane
4,14 diene-nickel(II) perchlorate (10 g) was stirred with
4 g KCN dry methanol (140 ) until the crystals had
dissolved. KCl04 and K2Ni(CN) 4 were precipitated with ether
(100 ml). The solution was evaporated without he until
the volume was approximately 50 Dilute HCl04 (140 ml
of 1 : 6 cone. acid : water) was added to the solution and the
product, ch formed immediate , was filtered with
suction. The product was washed with aqueous methanol and
ether. (Found: C, ; H, 6.5; N, 6.5. Calculated for
c14H20Cl2010N2 : C, 36.8; H, 6.6; N, 6.1%.) Molecular
we as determined by potentiometric titration with
standard NaOH was 458 ± 2. Calculated for c14H20Cl2o10N2 457.
2.1.6 1,5,8,12-Tetraazadodecane (3,2,3-tet) (Fig. 1.1(5))
1,3-diaminoproprule (67 ml, 0.81 mole) was added to a
cold constant stirred solution of 1, dibromoethane (13 ml,
.15 mole) in ethanol (50 ). After refluxing (1.5 hr)
solid KOH (40 g) was slowly added and the mixture further
refluxed for one hour. The unreacted KOH and KBr were
precipitated by the addition of ether (50 ml) and removed
by filtration. Unreact reag was &stilled from the
1 trate and the oduct was twice fractionally distilled

under N2 and at reduced pressure. The fraction was
0 collected at '124-26 C at ca. 0.3 mmHg. The purity as
2'1
determined from potentiometric titrations with standard NaOH
was 99 . '1 ± 0. 8%.
A sample of ligand.4HBr was prepared from a portion of
the tetraamine. (Found: C, '19.5; H, 5.0; N, '1'1.0.
Calculated for c8 H26N4 Br4
: C, '19.3; H, 5.2; N, '1'1.2%.)
2.'1.7 s'1'1-Diamino-4 4,9,9-Tetramethyl-5~-diazadodecane
~ihydroperchlorate (Fig. '1.'1(4)) (hm-3,b3-tei}
The product was prepared by a sodium in amyl alcohol
reduction of 4,4,9,9-tetramethyl-5,8-diazadodecane-2,'1'1-
dione dioxime and isolated by the addition of HC104 to pH ca.
8.5. The sample used in this study was prepared by M.
4 Burgess . This sample was recrystallised from hot water.
(Found: C, 36.7; H, 8.0; N, '12,2. Calculated for
c14H36
N4 Cl208 : C, 36.6; H, 7.8; N,'12.2%.) Analysis by
potentiometric titration gave a molecular weight of 458 ± 2.
The calculated molecular weight for c14H36
N4 Cl2o8 is 459.
2.'1.8 Materials for Electrode Calibration (Chapter 3)
Ethylenediammonium chloride was recrystallised from
water/propan-2-ol. (Found: C, '18.'17; H, 7.53. Calculated
for C2H10
N2Cl2 : C, '18.25; H, 7.52%.)
AnalaR grade acetic acid and sodium acetate were used
without purification.

2.2 PREPARATION OF SOLUTIONS
All solutions were prepared us freshly boiled
distilled water. The bo ed water,while cooling~was
protected from contamination by atmospheric carbon dioxide
by bubbling N2 through the solution. The pH of the
'degassed' (C02 free) water was generally in the ranp:;e
6. . '1 •
2.2.1 Sodium Hydroxide
Sealed containers of Hopkin and Williams 'AnalaR'
sodilun hydroxide pellets were used the ion of
22
stock solutions. The pell s were washed two or three times
with portions of 'degassed' distill water prior to their
addition to a well stoppered ex flask containing C~free
water. All sodium hydroxide solutions were prepared just
or to use and were replaced regularly. The
solutions were standardised (± 0.1-.2%) by potentiometric
titration against a solution of dried B.D.H. 'AnalaR'
potassium hydrogen phthalate.
2.2.2 Sodiwu Chloride
A stock 1 M solution of sodium chloride was prepared by
dissolving a known weight of B.D.H. 'AnalaR' sodium chloride
in degassed distilled water. The concentration of this
solution was periodically checked by gravimetric analysis of
chloride ion as lver chloride4 3.

2.2.3 Hydrochloric Acid
Stock hydrochloric acid solutions were prepared from
B.D.H. AnalaR concentrated by dilution with degassed
disti ed water. Solutions were standardised (± 0.3-0.4%)
by potentiometric titrations against standard solutions of
recrystallised 'Fluka' Tris-(hydroxymethyl)-aminomethane
(TRAM) or against andard sodium hydroxide.
2.2.4 Copper Chloride
A stock copper chloride solution was prepared using
B.D.H. AnalaR reagent. A sample of this reagent was
dissolved degassed water and filtered into a standard
volumetric fl cont a known amount of HCl. The
concentration of copper was determined by gravimetric
analysis as copper galicylaldoximat or by complexometric
titration with standard EDTA us
. d' t 44
murexide as an
ln :Lea or .
2.2.5 Preparation of t N.B.S. Standard Buffer Solutions
B.D.H. AnalaR chemicals were used eparation of
the standard buffers. With the exception of the carbonate
buffer, all the standard buffers used in this work were
prepared by the methods outlined by Bates45. The carbonate
secondary standard was prepared by the method of Alner et
46 al. .

24
2.3 GLASSWARE
A-grade glassware was used where available. All
pipettes were calibrated from the weight of water discharged
at a b~own temperature using published density data60 . The
tolerances for standard flasks used were those given by
Vogel47.
'Agla' micrometer glass s~ringe
For and calorimetric t ons,the titrant was
added an ' ' Micrometer syringe (Burroughs Wellcome
and Co.). It consists of a cially made and calibrated
all g s .syringe attached by a holder to a micrometer screw
gauge which operates the plunger. total delivery from
the syringe is 0.5 ml m~d the readability of the screw gauge
is .0001 ml.
The calibration was checked by dispensing increments of
~-bromonaphthalene which has a low vapour pressure at room
temperature48 . The delivery was found to be uniform along
the syringe. From the weights of the four 0.10 ml increments
dispensed the average volume was 0.099976 i.e. a
difference from the reading on the micrometer of O.Ocfo. A
second 'Agla' syringe gave a difference of 0.06%.

25
2.4 ~H MEASUREMENTS
2.4.1 E£ Meter and Electrodes
All pH measurements were made using a Beckman 101901
search pH meter of readability 0.0005 pH units (or .05 mv),
coupled with a Beckman E2 glass electrode of type 39004 and
a Beckman calomel erence electrode of type 39071. an
alkaline solution, where the hydrogen ion concentration
low, glass electrodes may respond to any alkali metal ions
:present, thus imparting an error to the :pH measurement4 9.
The Beckman E2 electrode shows minimum deviation due to
sodium alkaline solution5°. The Beclcman reference
electrode has a carborundum junction through which
saturated KCl diffuses. rate of diffusion, which was
determined from flame photome c measurements, was found to
increase the ionic strength of a test solution by ca.
0.003 M/hour. Attempts were made to reduce this flow by
placing a glass sleeve with a c illiary outlet around the
calomel ctrode. A variety of different media were tried
the sleeve: agar-KCl mixtures (containing KCl concentrat-
ions of 0.1 m, 1m or a saturated soLution); (satd, 1 m,
0.1 m); or test solution. However each case either
unstable or oducible EMF resulted.

26
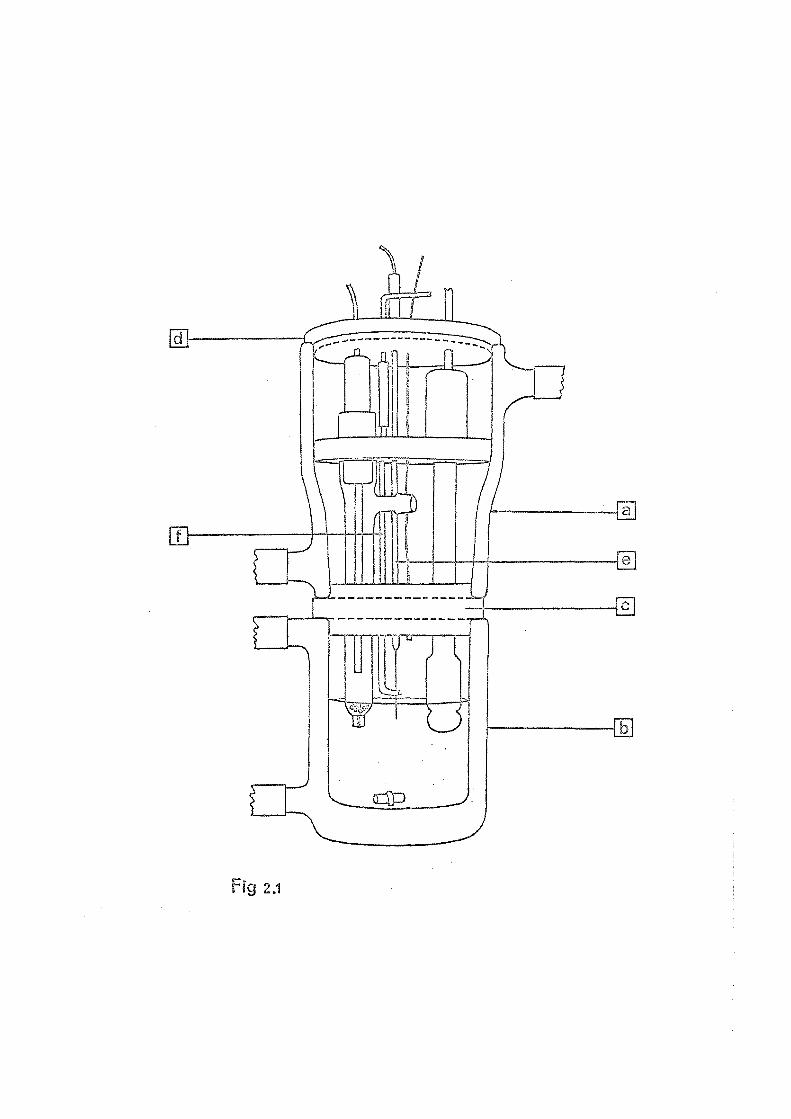
2.4.2 £H Titration Cell
The pH titration cell as shown in Fig. 2.1 is based on
the design described by Perrin51 . The cell consists of two
double walled glass jackets (a and b), through which thermo
statted water is passed. The temperature of this water was
controlled at 25.0 ± 0.10°C by a Tecam Tempunit. The two
jackets were joined by a PVC plug (c) which was rigidly
joined to the upper jacket and which fitted firmly into
jacket b. A metal plate, which was earthed, was fixed
to the underneath face of the PVC plug. The glass and
calomel electrodes were mounted in the upper jacket a_nd
enclosed by the PVC d (d).
The titrant was added from an 'Agla' micrometer glass
syringe (see 2.3 ) through a fine vinyl tube and a stain-
less steel tube ( gauge). vinyl and stainless ste
tubing were permantly fixed to a removable glass tube(e).
When the eel tube was placed with the tip under the
surface of the test solution there was no noticeable
diffusion of the titrant.
Nitrogen could be passed over the surface, or through
the test solution by way of the glass tube (f). The gas was
bubbled through a 6 M solution of NaOH and then saturated
with water vapour at 25°0, before entering the cell.
Stirring of the test solution was ected by a
magnetic stirrer with a small teflon covered magnetic
dJ-----'
r---__:__l a
~---@]
r---___jb
Fig 2.1

27
follower placed in the test solution. The moving magnetic
field had no observab effect on the measurements. The
difference between the pH of a test solution measured with
and without stirring was < 0.002 pH units.
2.4.3 Procedure for pH Measurements
The electrodes and the lower glass jacket were firstly
washed with distilled water then dried with absorbent
tissue. A portion of the test solution~which had been
stored at 25°0~was then added to the cell. measured pH
was found to drift for a short period. The reading became
stable after to ei minutes. For each pH measurement
(after the initial measur ) duri2:1g a pH titration,
equilibration was obtained within two minutes.
Before any set of pH measurements the assembly was
standardised using the 4 : 4 phosphate buffer (pH(S) 6.865 at
25°0). The response of at le one of the other NBS
primary standard buffers, potassium hydrogen phthalate or
the borax buffer,was then checked. After a set of measure-
ments,drifts the standardisation were checked by the
measurement of the 4 : 4 pho standard; the change in
phosphate reading was usually less than .003 pH units
after a set of measurements taking about one hour.
2. l+. 4 Reproducibility of _QH Measurements
For pH measurement of a standard buffer the
reproducibility was always within ±0.002, generally within

28
±0.001. The reproducibility of data obtained from the
buffer regions of titrations was generally ±0.003 pH units.
The effect of slight errors ·volume of titrant added
caused data in the end point regions of a titration curve to
be subjected to a higher uncertainty.
Calibration of the electrod~air
The calibration of the assembly as a hydrogen ion
concentration probe is described Chapter 3.
2. 5 THE DESIGN OF AN ISOTHERMAL JACKET TITRATION CALORIMETER
2. 5.1 General Remarks on Calorimeter Desi.gg
The ionic used in the equilibrium constant
studies was predominantly 0.10 M (NaCl). To maintain this
constant ionic strength in the calorimeter it was necessary
to have a relatively low concentration of the compound
studied. o, one of the compounds studied (oxime) was
only sparingly soluble in aqueous solution above 9. 5. To
obtain a reaso nab number calorimetric points per
titration it was necessary to measure he c s of ca.
10J with a reasonable degree of accuracy. The calorimeter
was designed wi t'i:1 these points in mind.
The calculation of the enthalpy change for a particular
reaction requires firstly a knowledge of the extent to which
the reaction has occurred and secondly a measure of the heat
evolved or absorbed. This heat change causes a change

29
temperature of calorimetric solution, which is measured.
When at is evolved or absorbed heat exchange between the
calorimeter and jacket will occur. the heat exchange due
to convection can be neglected52 ,and if the thermal head
not too large.then the at exchange is given by Newton's
Law of Coo
dT/dt == k(T0
- T) + w deg.min-1
where k(min-1 ) is Newton's cooling coefficient, T0
is the
jacket temperature, T is the temperature of the inner vessel
and contents (considered at a uniform temperature) and w is
combined. heat effect due to stirring and Joule heating.
To keep the heat loss either k, or the thermal heat,
or both are kept small. The ultimate design of an iso-
thermal jacket calorimeter is one INhere k small and
becomes constant within a very short period after the energy
input53. Tests on the final calorimeter design (see 2.5.2)
for a heat input of £§:· 30J k as ca. 6 x 10⁻³ min-1 and
time of 'equilibration' of approximately seven minutes.
The use of a metal calorimeter inner vessel led to a shorter
time of lequilibration1
but a higher k value and thus had no
advantage over the glass vessel. The use of a PVC lid for
the inner vessel gave an increased time of equilibration,
which supports the comment of Tyrrell and ezer54 that a
calorimeter with an indeterminate boundary will show k values

30
which tend only slowly to a constant limiting value.
The effect of heat changes due to evaporation has been
discussed by Johanasson26 . Contributions to the overall heat
changes from this effect were made negligible by having a
small vapour space over the surface of the calorimetric
liquid.
Thermistors have been widely used as sensors for
calorimetry2 5-29. Their use has distinct advantages over
the previously used resistance thermometers and multi-
junction thermocouples; they are small, have a rapid response
to temperature changes and a high sensitivity. A thermistor
was used as a temperature sensor in this work.
The usual and most convenient heat capacity determinat-
ions require the measurement of an electrical energy input
and of the resulting temperature change. The fundamental
quantities in measuring electrical energy are potential
difference, resistance and time; if Vis the potential
difference across a resistance R for a time t then the
energy dissipated in the resistance is Q = v2t/R.
The standard design of heater circuit55 was adopted for
this calorimeter. Several designs of heaters were tried. A
heater coil immersed in silicon oil inside a thin walled glass
tube led to heat losses along the tube to the calorimeter
l . d Th. ff t l b d b J h 26 · l . lS e ec was a so o serve y o ansson uslng a
similar type of heater. A heater coil inside a small metal

thimble at the end of a glass tube did not prove as satis
factory as the final design (see 2.5.2).
2.5.2 DescriQtion of the Calorimetric System
The calorimeter
An outl of calorimeter is shown in Fig. 2.2.
The calorimeter consisted of an outer brass can (1) and lid
(2) and an inner thin walled
brass lid (4). The glass vess
s vessel (3) with a light
was silvered on the outer
wall and covered with a layer of very thin reflecting tin
foil. A threaded brass was sealed with epoxy resin
ue (Araldite AW106 and HIT 953U) to the rim of the glass.
The underneath face of the inner brass lid (4) was coated
with a layer of polyurethane Care was taken to
ensure that the threaded brass ring was also well insulated
from the test solution the calorimeter. The maximum
capacity of inner glass vessel was approximately 110 ml.
The two lids (2) and (4) were permanently joined by a short
nylon shaft through which the ho ow glass stirrer shaft (5)
passed. The outer lid (2) was permanently fastened to a
tufnal disc (6) by way of three connecting tubes; a central
brass tube through which the stirrer shaft passed and two
other tubes (7) and (8) which carried the leads to the
heater (9) and thermistor (10),and the tubes to the cooler
(11). The calorimeter solution was stirred by means of a
ass propeller stirrer (5) which was connected to a

u..

32
synchronous motor (18) (Phillips type AU 5100/22, 250 rev/min)
mounted on the wooden disc (6). The adequacy of the
stirring was checked by obs the flow patterns when a
few crystals of KMn04 were added to water in the inner glass
vessel.
The cooler (11) consisted of a thin walled glass tube
collllected to the inner lid (4) by a small PVC plug, and with
a small bulb at the lower end. bulb contained about
0.2 ml of water. Two vinyl tubes were sealed to the cooler
tube, one of which passed down the centre of the tube to a
depth just above the ace the water. Cooling was
ef cted by passing air (at room temperature) over the surface
of the water by connecting the other tube to a water pump.
The ater (9) consisted of a thin walled glass tube
which was also connected to the inner lid by a small PVC
plug. Cotton-covered manganin was wound around the
out de of the lower half of this tube. The manganin wire
was insulated from the solution by a thin coating of
Araldite. The ends of the manganin wire were soldered to
four copper wire leads which connected the heater to the
ating circuit and to the potentiometer (see . 2.4). The
resistance of the heater was 37.45 ± 0.01Q at 25°0 (see
section on ctrical Calibration below).
Fig. 2.3 shows the probes of the calorimeter in more
detail.


The titrant addition assembly consisted of a glass
tube (12) which was held in position by a spring cl
mounted on the disc (6) and by a ckfit B12 jo (13)
mounted on the lid of the calorimeter (2). glass tube
was joined to a thin walled glass sp (15) of total
33
volume ca. 0.9 ml, which enabled efficient thermostatting of
titrant solution. The three-way tap (14) enabled the
'Agla' micrometer glass syringe (16) (see 2.3) to be
refilled from a titrant reservoir. A short section of
flexible vinyl tubing joined the end of glass titrant
line to a (ca. 25 gauge) J shaped glass tube (17). The
titrant could be readi di d for cl
Temperature Measurement
The temperature of the solution inside calorimeter
was measured using a single NTC thermistor (Phillips type
22 627 11103) which had a re o·
stance of 8950Q at 25 C.
With this type of thermistor, the semiconducting head
sealed into a small glass tube by manufacturer. This
thermistor tube was joined to a short length of glass tubing
which was fixed to the lid (4) by a small PVC plug. Two
thread-like constantan wires connected the thermistor to the
AC bridge.
A linear relationship was found between thermi or
resistance and temperature over a 0.4°C tempreature range
(24.9-25.3°C). The temperature coefficient of resistance
was 368 ± 5 Qj°C.

34
The thermistor was incorporated into an AC transformer
bridge (see Appendix A), the output of which was rectified
and fed to a Honeywell Electronik 194 Lab/Test Recorder, the
chart of which constituted a temperature scale. The AC
bridge was operated a R.M.S. voltage of ca. 0.1-0.2 V.
Electrical Calibration System
The heater circuit for the calibration of the heat
capacity of the calorimeter and its contents is shown in
• 2.4. The current passing through the heater was
de the pot al dif e across a
precision resistor (RS) in series with heater.
resistance of the heater (RH) was c culated from
potential difference across the heater and from potential
difference across the precision resistor (RS). The switch
(S) enabled the cells (C) to be discharged through a dummy
heater (RDH).
The current through the heater could be varied by
altering the total resistance in the circuit by the insertion
of precision resistors (Rv).
All voltage measur s were made using a Cambridge
Slide Wire Potentiometer, type li-4244/3 (readab ty of 0. 001mV),
Muirhed andard cell and a sensitive galvanometer (H.
Tinsley & Co. type SR4/45). The voltages recorded using
s potentiometric set were checked for systematic
errors by measuring a particular voltage using the

~~tentiometer .. :-____j~ R"
J
RoH
to potentiometer ----. Rs T C
Rv
Rs= 10·on (±o·1%)
Fig. 2·4 Calorimetric heater circuit

potentiometer and also using a Marconi Differential D.C.
Voltmeter type TF2606. The agreement between the two
measurements was well within the experimental error.
35
The precision resistors us in the heater circuit were
H.W. Sullivan non-reactive resistances, tolerance i0.1% and
ERG precision wire-wound resistors, tolerance ±0.05%.
The heating .was determined as the time between the
switching on and switching off of a microswitch operated by
a synchronous motor driven cam. During this time the
curr was switched from the dummy heater to the calorimeter
heater. heating time was determined as 63.70 ± 0.03
seconds by using a Levell Universal counter-timer type TM51B.
The time was determined as the mean of a number of measure-
ments made at differ times during a normal working day.
The error is expressed as the
measurement from the mean.
Thermostat Bath
andard deviation of a
The calorimeter was immersed in a water bath containing
approximate 1 of water. The temperature of the water
was controlled to better than ±0.001°C by the controller
described App A. The temperature of the bath was
measured using a mercury in glass thermometer which was
graduated in hundredths of a degree Centigrade. The
thermometer was calibrated using a Pt re stance thermometer
and a Rosemount Eng. Co. Ltd Precision Comparison Bridge
Model VLF 51A.

2.5.3 Procedure for O:Qeration of the Calorimeter
The titrant
at room temp
was filled with the titrant solution
the J tip being filled to such a
position which allowed for the volume expansion of the
36
solution the glass spiral (~~· 0.90 ml) when the calori-
meter was immersed in the thermostat bath; 0.0005 ml for a
change from room temperature (ca. 23°C) to bath temperature.
The calorimetric test solution, which had been stored
25°C a thermostat bath, was added to the s
vess at room temperature using a p ette calibrated at
25°C. The assembled calorimeter was placed into the water
bath and the stirrer started. Additional heating (or
occasionally cooling) was then applied, using the calori
metric heater (or cooler), to bring the temperature of the
calorimetric solution to approximately that of the
thermostat bath. This temperature was previously measured
by placing the thermistor in the thermostat bath. The
assembly was then left to come to thermal equilibrium (ca.
one to two hours).
The recorder trace of a typical calorimetric run is
shown in Fig. 2.5. The AC bridge was in balance when the
recorder was at the position marked (1). The chart
at
paper advanced at 1 division (ca. 2 rnn) in 19 sec. (stop
watch). Before a run the temperature of the calorimeter and
contents was adjusted so that the solution was heating at

Fig. 2·5 (:alorlmetrlc recorder trace

37
ca. 0.03 Q/min. (see . 2.5). At the start of a run the
re stance of decade box was adjusted so that the bridge
was in balance and the capacitance balance was checked. The
resistance was then adjusted so that the bridge was out of
balance and trace was started (2). The recorder chart
was calibrated in lateral divisions/ohm by noting the effect
of a large (ca. 0.60Q) resistance change (3) in one arm of
the bridge (decade box). The working sensitivity was
ca. 12 chart divisions for a 0.1Q change thermistor
resistance. This sensitivity corresponds to ca. 2 x 10⁻⁵ °C/
chart division. The fore :p od trace was followed for
about 5 minutes, which was suff
defined straight line. Heat was
ent time to give a we
applied using the
calorimeter heater (or in the case of a reaction titrant was
added) and this effected a deflection on the chart (4). At
the end of the heat (or reaction) :period the bridge was
adjusted to a :pas near e and the resistance was
recorded. trace, which corresponds to a cool curve,
was then followed for about twenty minutes.
2.5.4 Procedure for a Complete Calorimet~ic Titration
A typical calorimetric titration consi ed of a number
of runs as described. After the end of each individual
run the calorimetric inner vessel and contents were cooled
to a temperature close to that at the start of the previous
run. After about ten minutes the next run was commenced.

38
Heat ity calibrations were normally performed at
b middle the end of a calorimetric
titration. The heat capacity of any po in titration
calibration
the calorimeter.
2.5.5 Calculation of the Resistance Change from Calorimetric
coo curve in F . 2.5 shows a region (5)
trace is quite curved and a second region (6) where
plot is reasonab linear. Experimental determinations
of the Newton's of Cooling co ficient showed that there
is a con vari on in s quantity over region
(5). However, in (6), Newton's law of cooling is
being obeyed to about 2%.
heat input of ca. 9J was thus
t of 'equilibrium'
6-7 es. s
er a
compares favourably th values for calorimeters of
this typ The method us to obtain corrected re e
changes was to take extrapolations along the on
(6) and the trace (2) to a equal to half the time of
the re on period. The r stance readings these
po s were subtracted to find correct resistance
~xactly the same approach was used for heat
calibrations. Thus, as the two experiments were matched
clo in terms of the magnitude the input,
re ts can be directly compared to obtain the heat change
the reaction.

39
2.5.6 Addition of the Titrant
vo of ti was manually, at a constant
e, so that time addi was c se to time of
ating the he capacity determinations, i.e. approx
imately one minute. the increment was added the three
way tap (see 2.5.2) was turned As the titrant line
was not t same temperature, the volume expansion of the
was into thermo portion of the titrant
bath caused a small ional amount to diffuse the J
into calorimeter. T the average room temper-
ature an average increment to 0.30 ml then
the expansion of the titrant solution will cause 0.000~5 ml
to be eject from J tip. This is the of
error disp the (see section 2.3).
2.5.7 Effect of Adding the Titrant Without Stringent
Temperature Control
Calorimeters this e of des usually come
equilibrium, i.e. when heat sses are balan.ced by
to
Joule heating and the at of stirring, a temperature
slightly above that of the thermostat bath. this
calorim er, the e of is too
the equilibrium position was 0.0~0-0.0~5°C above bath
an
temperature. If titrant temperature is as to be as
great as 0.01°C lower than that of calorimeter so on
then the resultant t erature change on addition of

0.30 ml of titrant into 100 ml in the calorimeter can be
calculated.
Let T be the final temperature of the calorimetric
solution and consider both the titrant and calorimeter
solution to be water then,
0.30(T- 25.000) 100.0(25.010- T)
solving for T gives T 25.00997°0, i.e. a temp e
40
change of 3 x 1 5 °C, i.e. approximately one chart division.
Before an actual calorimetric run, the temperature of
contents was adjusted so that the initial trace was heating
(see . 2.5); at the start of a run the actual temperature
difference between the titrant and the calorimetric solution
was considerably less than 0. 0,1 °0. Therefore no corrections
were lied to the c;R measurement,due to temperature
differences between the titrant and calorimetric solution at
the start of a run.
2.5.8 Precision of the Calorimetric Measurements
The precision of the assembly was determined by many
electrical calibrations. Some of the results obtained are
shown in Table 2.1. The mean of the five values for the
calorimetric solution of volume 99.34 ml is 1.198 and the
standard deviation is 0.002. The precision of the instrument,
as judged by the standard deviation, therefore

TABLE 2.1
Calibration constants for the calorimeter at 25.0 .± 0.01°C
Total Volume sl flRc Q/fl Ra
(ml) (J) (ohm) (J ohm- 1)
98.84 7.4826 6.291 1.189
98.84 7.3915 6.212 1.190
98.84 7.0412 5.930 1.187
99.34 8.0748 6.748 1.197
99.34 8.0777 6.745 1.198
99.34 8.0787 6.761 1.195
99.34 9.2143 7.683 1.199
99.34 9.2154 7.683 1.199
a The calibration constant for a given volume.
b Heat :input (in Joules).
c Measured change in thermistor resistance.

41
2.5.9 Accuracz of the Calorimeter
The accuracy the calorimeter was checked by comparing
enthalpy data for two standard reactions with the
erature data for these reactions.
Heat of neutralisation of HCl and NaOH
98.84 ml of 0.034 NaOH was added to calorimeter and
titrant was filled with 0. 5002 ]JI HCl. Experimental
results are Table 2.2, enthalpy values the
last column refer to a state infinite dilution. The
s of dilution of 1, NaOH and NaCl were obtained from
reference 57. The average value the heat ionisation
of er was - .28 ± 0.07 mo , the error being
express by standard deviation. The preci on, as
judged by standard deviation, was adequate, however the
agreement this value of ~H00
was not in cularly good
ement with the current erature values. A survey of
data on the or neutralisation of strong and strong
base at infinite dilution27 shows that an average value
-1 would be ca. -55.8 kJ mol • . A more recent determination by
Grenthe, Ots Ginstrup56 gave a value of -55.84 kJ mol-1 .
The difference between value determined this study
and the of Grenthe is 0.8%~hi is just outside the
total estimat experimental error (0.6%) in s work.

TABLE 2.2
Heat of neutralisation of NaOH by HCl at 25°C
Volume a (ml)
0.280
0.280
0.280
0.280
0.280
0.280
Increment number
1
2
3
4
5
6
1.4089
1.405
1.401
1.3979
1.393
1.389
a Volume of 0.5002M HCl added.
b Calibration constant.
1.192 6.746
1.196 6.727
1.200 6.694
1.204 6.690
1.207 6.675
1.212 6.649
Qreact (J)
8.041
8.045
8.033
8.055
8.057
8.055
c Qcorr
(J)
7.376
7.880
7.868
7.890
7.892
7.890
c dil 1 57 Corrected for ~ HC and corrected to infinite dilution.
56.23
56.26
56.17
56.33
56 .3~·
56.33

42
Enthal£Y_Qf protonation of TRIS with HCl
More recently, the reaction of s(hydroxymethyl)
aminomethane (TRIS) with hydrochloric acid has been used as
a calorimetric standard reaction56 ,58 . Data for this
reaction are shown Table 2.3. The mean and standard
deviation of the determinations of the enthalpy of
protonation was -47.83 ± 0.05 -1 mole • This is the
enthalpy change for the process
The heat c was corrected for the heat of dilution of
HCl using the pub shed data57. No correct were made
for the heat of neutralisation of the hydroxide ion
alkaline TRIS buffer solution. This correction would be
very small as the solution of was £~· 5~/o neutralised,
at the start of the calorimetric titration~with HCl.
Grenthe, Ots and Ginstrup56 determined the enthalpy value
for neutralisation of TRIS as -47.44 kJ mol-1 and
Ojelund and Wads559 recent obtained a value of-1+7.48.:± 0 .. 03
-1 T kJ mol . he difference between the value determined in
s work and these erature values is 0.7%, which is
again just
error of 0.6%.
er than the estimat experimental percentage

TABLE 2.3
Enthalpy of protonation of TRIS at 25°0
Volume a Mmoles QH/flR
(ml)
0.330 0.16507 1.192
0.330 0.16507 1.198
0 .. 330 0.16507 1.201
0.300 0.15006 1.208
0 .. 300 0.15006 1.211
0.300 0.15006 1.216
0.300 0.15006 1.200
0.300 0.15006 1.195
a Volume of 0.5002M HCl added.
LlR
( Q)
6.782
6 .. 730
6.722
6.077
6.062
6.043
6.127
6.136
Qreact (J)
8.o84
8.062
8.073
7.341
7.341
7.348
7.352
7.332
b Qcorr
(J)
7.904
7.882
7.893
7.177
7.177
7.184
7.188
7.168
47.88
47.75
47.82
47.83
47.83
47.87
47.90
47.77
b Corrected for the heat of dilution of HCl. Values in Joules.

43
2.6 SPECTROPHOTOMETRIC INSTRUMENTS
All infrared spectra were recorded as nujol mulls using
a Shimadzu IR 27G or a Perkin Elmer 337 spectrophotometer.
Electronic Absorption spectra were recorded with a
Shimadzu MPS-50L spectrophotometer.
N.M.R. spectra were measured, with TMS as an internal
(or external) reference, using a Vari~ A-60 spectrophoto
meter.
Microanalyses
Carbon, Hydrogen and Nitrogen analyses were determined
in the Microanalytical Laboratory, University of Otago.

44-
CHAPTER 3
CALIBRATIO!'!__QF THE pH METER AS A HYDROGEN ION
CONCENTRATION PROBE
advances in instrumentation over the last few
decades has enabled precise pH measurements to be made using
commercial meters ruld electrodes. However, it is well
known61 that pH is essentially an empirical parameter and
its int ation in terms of hydrogen ion concentrations
([ ]) or activities (a ) involves assumptions associated H+
with liquid junction potentials and e ion activity
coefficients. The cell used in this work was
glass electrode II test solution I KCl( satd.),
Hg2Cl2 (s); (l)
with an emf given by
E o RT E + Eas + ELJ - lf ln a
I
where is the asymmetry potential of the glass electrode,
ELJ is the quid junction potential and E0 is the standard
emf for the c 1, which wi equal the standard emf for the
reference electrode saturated KCl.
Most measurements using a cell of type I are made by
incorporating the Operational Definition of , whereby
the pH of an unknown solution X is related to the pH of some

standard solutionS. From equation 3.1, w~en the unknown
solution X is the test solution cell emf is given by
and for the standard solution S
From equations 3.2 and 3.3
s (ELJ - ELJ) + CEs - EX)
nH' = nH(S) -1:' 1:' 2.303RT/F
3.1 pH(S) OF THE STANDARD SOLUTIONS
The assignment of pH(S) values to a set of standard
solutions was made on the basis of me s in a cell
without ~lid junction using Pt, and Ag, AgCl
electrode The procedure used was to determine the
45
3.4
quantity p(aHY01 ) for the standard buffer solution containing
small concentrations of added chloride ion and then to
evaluate the quantity p(aHY01 ) 0, the limit approached by
p(aHYc1 ) as the concentration of chloride ion approached '
zero, paH was then computed from p(aHY01 ) 0 by using an
extrathermodynamic assumption concerning the value of the
hypothetical e ion activity coefficient for the
chloride ion. The convention used to evaluate log r01 is
knom1 as the Bates-Guggenheim convention64 . The standard
buffer solutions were chosen for the reproducibility,

46
stability, buffer capacity·and ease of preparation6 5. These
standard buffer solutions set up a conventional activity
scale which will closely approach but got equal a true
thermodynamic activity scale.
From equation 3.4 the measured pH of the unknown
solution,
scale
, Wl only approach the conventional activity
term (ELJ- E~J), the residual liquid junction
potential, is small. s residual quid junction potential
will be small if the andard and test solutions match each
other closely in ionic strength, solution composition and
This will seldom be the case. For example, the majority
of equilibrium constant measur s which involve
determination of solution pH have been made on solutions
with I 1.0 or 0.10 with respect to some background
electrolyte5. The ionic strength of the buffers mo
commonly used for cell calibration, potassium hydrogen
phthalate ruld sodium tetraborate have I = 0.053 and 0.02 M
respectively.
3.2 HYDROGEN ION CONCENTRATION
For equilibrium constant measurements the pH of the
so on is often determined to give a measure of the
hydrogen ion concentration [H+]. An additional expression
relating the hypothetical single ion activity coefficient
for the hydrogen ion, y is needed to convert the measured H+
pH·from the operational activity scale to a hydrogen ion

concentration,
pH' p [ J - log r + • H
It is generally assumed that some simple equation (e.g. an
extended Debye-Huckel equation or the Davies66 equation)
accurately defines y for (probably) a mixed electrolyte
solution and allows pre se conversion of pH' top[ ].
These assumptions cone residual liquid junction
potentials and single ion activity coefficients can be
47
avoided by calibration of the cell against solutions of
known [H+] with the same ionic strength and ionic background
as the test solutions.
The calibration of cell I against solutions
known hydrogen ion concentration in the pH range 2 to '10.6
was made us dilute hydrochloric acid solutions,
ethylenediarnine/ethylenediammonium chloride and acetic acid/
sodium acetate buffers all in NaCl medium. 'rhe hydrogen ion
concentrations for the buffer solutions can be readily
calculated from the sob1tion compos:L tion and the concentrat-
ion quotients for the buffer.
3.3 CHOICE OF CONCENTRATION QUOTIENTS
This calibration method requires knowl e of
accurate concentration quotients for the buffer systems.
For acetic acid and ethylenediamine accurate quotients are

48
known at various ionic and temperatures. The
concentration quotients used for acetic acid were determined
by Harned and Hickey67 using an unbuffered c 1 without
liquid junction,
I HAc(M),NaCl(m) IAgCl - Ag - AgCll HCl( 0. 0'1) I
The quotients for ethylenediamine were determined using a
cell with liquid junction however, the experimental technique
us was such that the effect of the unknown residual liquid
junction potential was eliminated, so that reliable
68 quotients were obtained . cell used was
Pt,H2 I HCl(-1) ,en,NaCl I KC1(3.5M) I HC1(2) ,NaCl I ,Pt.
II
The ionic strengths in the two half c s were kept
equal, making the hypothetical single ion activity co ic-
ient r for each half cell solution approximately equal and
similar liquid junction potentials at each liquid
junction. For cell
E RT =y
where E. J
+
the contribution from the liquid junctions.
3.5
The approximate concentration of hydrogen ion in the
buffer was calculated from equation 3.5, assuming Ej 0 and
r +(1) = r +(2). This value was then used to calculate the H H

49
concentration quotient. Values of the concentration
quotient were calculated from emf measuremen·ts at different
fixed ratios of [ ] 1/[ ] 2 and the data were extrapolated
to zero concentration of er. Errors introduced by small
differences in the activity coefficients ru1d in the two
liquid junction pote ials were thus eliminated. Everett
ru1d ent68 determined constants at 0° to 60°, 10°
intervals,and ionic strengths from 0.07 to 0.30 M. The
values for this stud~ interpolat for 25°C and I = 0.04,
0.10, 0.15 and 0.20M, are shown in Table 3.1. The kA s
for acetic acid are also shown in Table 3.1.
3.4 RESULTS AND CALCULATIONS
Internal Consistency of' the N. B.S. Standard Buffers
The linearity and slope of the conventional activity
sc e set up by the N.B.S. buffers was checked by measuring
the response of the primary and secondary andard buffers
with re ect to the 1 : 1 phosphate buffer. The NBS primary
standards are int consistent for cells wit~ and
without junction7° when aPt, electrode is used. However,
small deviations of 0. 005 - 0. 02 pH were found when a
representative selection of glass electrodes were compared
with the electrode in certain buffer solQtions71 •
Using cell I the carbonate, borax, tetroxalate buffers
and the HCl/KCl solution gave pH 1 values agreement with
the pH(S) tabulated by Bates72 to within ±0.003pH. However,

TABLE 3.1
Interpolated k. values for 1,2-diaminoethane and 1
interpolated kA values for acetic acid, each at
0 25 C and I = 0.20, 0.15, 0.10, o.o4 M, NaCl media.
1,2-Diaminoethane a Acetic Acidb
I Log k1 Log k2 kA x 105 (moles. litre -1)
0.20 9-996 .± 0.003 7.189 + 0.003 3.090 ± 0.005 -
0.15 9.970 ± 0.003 7.152 ± 0.003 2.975 ± 0.005
0.10 9.960 + 0.003 7.105 ± 0.003 2.809 + 0.,005
o.o4 9.941 ± 0.005 7.027 + 0.005 2.489 + 0.005
a From reference 68
b From reference 69

50
for the 0.05 M potassium hydrogen phthalate and the saturated
potassium hydro tartrate there were small discrepancies
(phthalate, pH' 4.026, pH(S) 4.008; tartrate, pH' 3.570,
pH(S) 3.557) ·
~Cl[NaOH Titrations
The pH titration technique was de ed in section
2.4. Data from the titrations of NaOH against hydrochloric
acid/sodium chloride solutions at I 0.20 M, 0.10 M and
0.04 M are given in Table 3.2. Values of p[H+] were cal-
culated from the analytical concentrations of acid and
alkali, assuming complete dissociation. Near end point
the titration,readings became progressively less able
and data pH' > 4 were not considered. A plot of pH'
against p[H+] was linear in the range pH' 2 to 3.
However, as the pH' values increasf,d further the plot became
curved; the data tended to 1
approached 3.5 as observed by
Acetic Acid/NaOH Titrations
H' er P l values
p[H McBryde 73
at the pH'
Data from the titrations of standard sodium hydroxide
against acetic acid/sodium chloride solutions at total ionic
strengths of I == 0.20, 0.10 and 0.04 M are shown in Table
3.3. Only data from the most buffered region of the
titration curve (pKA :±: 0.7). were considered. The hydrogen
[H+] ion concentrat at each titration point was calculated
from

TABLE 3.2
pH' and p[H+] values from HCl/NaOH titrations in
NaCl media at I= 0.20, 0.10 and 0.04 M
I = 0.20 M I = o.o4
pH'a p[H+] fjb pH' p[H+] pH' p[H+]
2.083 2.016 .067 2.133 2.061 0.072 2.084 2.016
2.150 2.081 .069 2.187 2.115 0.072 2.151 2.081
2.256 2.185 .071 2.250 2.177 0.073 2.254 2.185
2.321 2.248 .073 2.320 2.247 0 .. 073 2.317 2.248
2.395 2.322 .073 2.393 2.322
2.485 2.410 .075 2.480 2.410
2.597 2.521 .076 2.589 2.521
2.750 2.671 .079 2.741 2.671
2.970 2.899
a pH' = pH (measured)
b
M
1:.
.068
.070
.069
.069
.071
.070
.o68
.070
.071

TABLE 3.3
pH', p[H+] and pH" data from acetic acida-NaOH titrations
in NaCl media at I = 0.20, 0.10 and o.o4 M
I = 0.20 M I = 0.10 M M
pH'b pH"c p[H+] pH' pH" p[H+] pH' pH" p[H+]
3.877 3.855 3.789 3.913 3.887 3.826 3.814 3.792 3.722
4.000 3.979 3.915 4.039 4.020 3.954 3.963 3.942 3 .. 876
4.110 4.090 4.026 4.149 4.129 4.066 4.090 4.070 4.005
4.209 4.189 4.126 4.249 4.229 4.166 4.201 4.181 4.119
4.301 4.283 4.219 4.428 4.413 4.346 4.301 4.282 4.220
4.388 4.371 4.306 4.594 4.577 4.512 4.480 4.462 4.402
4.472 4.454 4.389 4.758 4.743 4.656 4.564 4.548 4.487
4.636 4.619 4.553 4.841 4.826 4.761 4.646 4.629 4.569
4.719 4.702 4.635 4.929 4.915 4.850 4.810 4.794 4.733
4.894 4.880 4.808 5.025 5.010 4.945 4.986 4.970 4.909
a Initial concentration of acetic acid I = 0.20 and 0.10,
9.285 -3 4 X 10 M; I = o.o , 9.236 X 10⁻³ M.
b pH' pH (measured.) =
c pH" pH' + correction for non-linear response to NBS buffers. =

=
[OH3000-] [H+ J
-wH3
000H]
(OS + [H+] - Kw/ [H+]). [H+]
( 0 a - 0 S - [H+ ] + Kw/ [H+ ] )
51
where oa is ial concentration of acetic acid, OS is
the concentration of sodium acetate (added NaOH) and Kw is
the ionic product for water in NaOl solution at a given
ionic strength74 . The term K I ], a correction for the w
hydrolysis of acetate , was approximated to K /antilog w
(-pH') a11d the resultant quadratic equation [H+] from
equation 3.6 was solved to give p[H+] at each po the
titration curve buffer region.
Eth~lenediammonium Ohloride[NaOH Data
Data from the ti trations of NaOH against solutio:ns of
ethylenediammonium chloride/sodium chloride solu.tions at
I 0.20, 0.15, 0.10 and 0.04 M are given in Table 3.4.
Experimental data were us from the most buffered
ions, from 6.7 to 8.0 and from 9.0 to 10.6.
mass balance equations for TB and are
[B] + [BH+] + [BH~+J 3-7
[H+] + [BH+] + 2[B~+J 3.8
where [OH-]' is the concentration of hydroxide ion formed by
hydrolysis of the ethylenediamine (B). Using the protonation

TABLE 3.4
+ pH' and p[H ] values from 1,2-diaminoethane dihydrochloride -
NaOH titrations in NaCl mediaa at
I= 0.20, 0.15, 0.10 and o.o4 M
I = 0.20 I = 0.15
Vol. b pH' p[H+] 6c Vol .. pH' p[H+]
.050 7.016 6.956 .060 .040 6.836 6.774 .062
.060 7.147 7.089 .058 .060 7.108 7.052 .056
.070 7.276 7.217 .059 .080 7.366 7.309 .. 057
.o8o 7.406 7.346 .o6o .090 7.501 7.445 .056
.090 7.541 7.481 .o6o .100 7.651 7.595 .056
.100 7.692 7.632 .o6o .120 8.055 8.ooo .055
.160 9 .. 368 9.327 .041 .160 9-351 8.304 .047
.170 9·535 9.500 .035 .170 9.524 9.478 .046
.180 9.675 9.642 .033 .180 9.667 9.621 .046
.190 9.800 9.767 .033 .190 9.790 9.746 .044
.200 9.912 9.880 .032 .200 9.903 9.861 .042
.210 10.017 9.986 .031 .210 10.008 9.969 .039
.220 10.118 10.087 .031 .230 10.209 10.172 .037
.230 10.215 10.185 .030

Table 3.4 (contd.)
I = 0.10
Vol. pH' p[H+] 1:::. Vol. pH' p[H+] 1:::.
.030 6.634 6.571 .063 .030 6.547 6.483 .o64
.040 6.798 6.740 .058 .040 6.710 6.651 .059
.050 6.942 6.886 .056 .050 6.852 6.796 .056
.060 7.075 7.021 .054 .o6o 6.983 6.929 .054
.070 7.204 7.151 .053 .080 7.237 7.187 .050
.o8o 7.337 7.284 .053 .100 7.525 7.475 .050
.090 7.475 7.424 .051 .120 7.938 7.890 .048
.100 7.633 7.582 .051 .140 8.748 8.704 .044
.150 9.176 9.142 .034 .160 9.326 9.285 .041
.160 9·394 9.355 .039 .180 9.645 9.605 .o4o
.170 9.561 9.521 .o4o .190 9.772 9.733 .039
.180 9o701 9.660 .041 .200 9.887 9 .. 850 .037
.190 9.825 9.785 .o4o .220 10.102 10.068 .034
.200 9.938 9.899 .039 .240 10.310 10.278 .032
.210 10.047 10.008 .039
.220 10.151 10.113 .038
.230 10.253 10.216 .037
.240 10.354 10.317 .037
a Initial volume of 1,2-diaminoethane dihydrochloride/NaCl solution 49.90 ml. Initial concentration of 1,2-diaminoethane dihydrochloride
" 2.977 X 10⁻³M (I= 0.20, 0.15M), 2.961 X 10⁻³M (I= 0.10M) and
-3 ) 2.972 x 10 M (I = o.o4M • b Volume (ml) of NaOH titre, concentration 1.098M (I= 0.20, 0.15 and
o.o4M) and 1.114M (I= 0.10M). c 6 = pH' - p[H+].

constant quotients
_l:§H+]_
[B]. [H+] and
[BH~+] :::
[BH+]. [H+]
and equations 3.7 and 3.8,a cubic equation 3.9 was derived
52
3.9
This equation was solved by the Newton-Rapson method75 us
experime.ntal value, antilog (-pH'),as an approximate
solution for [H+]. An alternative treatment was to form a
quadratic equation 3.10
initially estimated from experimental pH' value. The
quadratic equation was solved for [H+] and an it
procedure used to obtain improved values of [ ]. Both
calculation procedures gave n cal results.
Graphical Plots of~ Against I?.[H+]
For separate systems HCl/NaOH, acetic acid/NaOH and
ethylenediammonium chloride/NaOH the plots pH' against
p[H+] were colinear for each ionic strength, within the
erimental error. Also a plot of pH' against p[ ] gave a

straight line for the hydrochloric acid data rn~d the two
sets of ~thylenediamine/hydrochloric acid data.
The acetic acid data did not 1 on this line.
53
However, the deviation was tent with that for NBS
standard buffers in this same pH region, and correction of
data for the non-linear response to the NBS standards gave
data (pH 11, Table 3. 3) which lay on the straight line.
A ar least squares analysis of the pH data using
an equation of the form pH' Mp[H+] + C gave the following
results.
For 70 data points from the hydrochloric and ethylene
diamine sets
M 0.9953 ± 0.0002, C = 0.086 ± 0.002
and cr, the standard deviation of pH' values from the computed
curve~was 0.005 pH.
For 100 data points containing pH11 acetic acid data
M 0.9951 ± 0.0003, c 0.088 ± 0.002, 0. 005 .
For 100 data points containing the pB' ac c acid data
M = 0.9932 ± 0.0003, C = 0.106 ± 0.002, (} = 0. 011.
Thus,for each ionic strength the experimental data for HCl
and buffer solutions are colinear with approximately unit
slope, pH' = 0.9953 p[ ] + 0.086 , cr(pH') 0.005.

3.5 DISCUSSION
From equation 3.4 any deviation of a pH measurement,
pH',from the conventional activity scale set up by the
standard buffers results from
(ELJ - E~J) 2.303RT/F
term
If it is assumed that the conventional activity scale is
equivalent to a true thermodynamic activity sc e then
pH' p[ (ELJ - E~J)
] - log y 2.303R~ •
54
If log Y ionic strength,
under the conditions used in the titrations, plots of
pH' against p[H+] at different ionic strengths should be
parallel and with a separation
where 6 refers to e in quantity in brackets,
from one ionic strength to another. The results above show
that the plots are parallel and coincident within experiment-
al error. This result implies that the e of change of
the residual liquid junction pote:ntial wi t~1 'ionic strength
is approximately compensat by the rate of change of
log Y with ionic strength.

The observed slope and intercept pH• (slope)p[H+]
+ intercept agree well with the data publi d by McBryde73
for dilute HCl solutions (slope 0.990, 0.994, 0.995 and
intercept 0.088, 0.105, 0.097 at I = 0.05, 0.10 and 0.20 M
re~pectively, NaCl medimn). The non-unit slope implies trrat
the operational activity coefficient, defined by
-log 'Y 1 = pH 1 - p[H+J, must vary with the solution pH, i.e.
H+
varies with solution pH. This implies that 'Y
residual liquid junction potential or both of these
quant s are a function of the so ion pH.
For the pH range 2-3, activity coeffi ents of HCl
in an HOI /NaOl solution at a constant total ionic ength
of 0.10 M varies little with HCl concentration76 . However,
it predicted that the liquid junction pot i for the
junction .solution/KOl( sat.) will vary with solution pH77.
(It also expected to be a function of ionic str and
e of the ions78 .) For solutions of high acidity or
alkalinity, the ions H3o+ OH-~ which have high mobilities
compared with most other ions79,will makes icant
contributions to liqu~d junction potential.
es et a1. 80 compared the paH value for a number of
buffer solutions and solutions of strong and weak acids and

56
bases with the pH obtained from a cell with liquid junction.
results showed that the liquid junction pot
were indeed larger at either ends of the scale. but there
appeared to be no uniformity of sign or magnitude of se
potentials.
Use of the Calibration Curve
For each ionic strength the standard solutions used for
calibration contains a low concentration of the buffer
(0.003 to 0.009 M) compared with the background electro e
( • 04- to 0. 20 M) • the test solution is of a similar
composition then it can be assumed that at the same ionic
strength and pH the standard and test solution will generate
same liquid junction pot ial in the cell.
the same NBS buffer is used to standardise
assembly both for the calibration titrations and for the
te solution measurement t the residual liquid junction
potentials for the two solutions will be cal. so,
for the test solution and calibration solution
y +(standard) ~ y +(te ) for a given ionic strength thus, H H ·
standard and test solutions with the same J2H' have the same
value of J2[H+].
Any set of pH' data from trations were generally
converted to p[H+] values within the various computer
programs (see Appendix D) using the equation
pH' = 0.9953 p[H+] + 0.086.

' data in the e 3 - 5.5 were converted to p[ ]
values using a plotted calibration curve (a plot of
against p[H+]).
Previous Work on Electrode Calibration
57
Strong acid - strong base ti trations have often been
us.ed for ectrode calibration81 '73 ' 82 although their use is
restricted to narrow es. Recently McBryde8 3 has
extended the calibration of the meter as.sembly into the
alkaline on. His results show that the values of (a
quantity relating H -pH . 10 to the true hydrogen lon concen-
tration ]) measured in acidic solution agree we with
that value calculated from measurements in alkaline solution.
Ac c acid/sodium acetate buffer solutions have
previously been used to calibrate c s containing glass and
calomel electrodes84 ,B5 though no experimental details have
b given. Perrin and Ohilds86 treated a quantity F
( p[H+] + log F) as rul adjustable parameter in applying
a least-squares program to the results of titrations for
the determination of acidity constants.
uncertainty associated with liquid junction
potent s can be eliminated by using a Ag, AgOl erence
electrode73, however, the use of such a cell is more
restrictive than a cell of type I (e.g. a ligand bromide salt
could not readily be studied).

58
Earlier Powell and Curtis8 7 used the ethylenediamine/HCl
system for the calibration of a pH assembly. Their plots of
pH' against p[H+] were parallel and colinear for the various
ionic str studi
Use of Single I2_n Activity Coefficientf3
A more commonly used approach for the conversion of the
measured to a concentration value to assume that the
measured pH corresponds to an activity paR and then use an
estimation of the hypothetical s e ion ------co icient to convert paH to p[H+]. For a mixed
ectrolyte tem, the y + value will be dependent on all H
the specific ionic interactions solution as related
th G h . t. 88 e uggen elm equa lOn . This equation seldom used for
mixed electro s as the values of the interaction
coefficients in the mixture are usually not known. Commonly
the empirical Davies equation us
where ~ = 0.30. Using this equation, the mean activity
co ic sofa large number of 1:1 and 1:2 e ctrolytes
agree to within 2% of the experimental values89. Use of
this equation for a cell with
implies rul equality
- log y (Davies) H+
-log y + H
quid junction incorrectly

59
and can give erroneous es of _p[H+J in solution.
po is illustrated Table 3.5 where (_pH' -_p[H+J), the
operational activity coefficient, is compared with
- log y (Davies) for solutions of di erent _pH and ionic H+
strength. Kielland90 estimated values of ion ze
parameters of a large number of inorganic org c ions
from data on mobilities, ionic radii and hydration numbers.
Using his suggested value of 9 R for ion and using
Debye-Huckel expression
2 A zi 1[1
log y. 1. -:r+pi[I
0 p = Ba ,
where A and B are functions of medimn and tem_pera·ture23 and
a 0 is the ion ze parameter, the values for -log y + at H 0.081, 0.20, 0.10 and 0.04 M ionic strength are -log y
H+
s
0.065 and 0.052 respectively. T se results are somewhat
better agreement with operational activity coe icients
Table 3.5.
These empirical calculations serve to illustrate that
assumpt involving single ion activity coefficients of
th~ hydrogen ion for use in converting measured pH values to
hydro ion concentrations can be avo by calibrating the
pH assembly directly using solutions, preferably buffer
solutions, of known hydrogen ion concentrations.
The difference between the effect of the Davies equation
and the pH'/p[ J calibration curve in applying corrections

pH'
9 .. 800
7 .. 276
4.090
9-938
7.337
4.134
9.887
7.237
3.942
TABLE 3.5
Comparison of the operational activity coefficient
YH+ and empirical (Davies equation) activity
coefficient for the cell glass electrode //
solution/ KCl(satd), Hg2
c12
; Hg. (NaCl medium)
I
0.20
0.20
0 .. 20
0.10
0.10
0.10
o.o4
o.o4
o .. o4
.033
.059
.o64
.039
.053
.o68
.037
.050
.066
-logY H+(Davies)
0.124
0.124
0.124
0.105
0.105
0.105
0.077
0.077
0.077

TABLE 3.6
Log k. values for the protonation of 1,5,8,12-tetraazadodecane in NaCl media 1
I(m/1) k1
pH 1 /p[H+]calib~ Davies egtn .. b
log k 2 pH'/p[H+]calib .. Davies egtn.
0.20 o. 15 0.10 o.o4
o.oo
10.62 10.57 10. 10.50
::!: 0.03c ::!: 0.03 ! 0.03 + 0.02
10.46d:t 0.03
10. 10.29 10.33 10.37
:: 0.02 ± 0.02 :!: 0.02 + 0.02
10. 0.03
9.82 ± 9.79 ± 9.77 ± 9.69 :!:
0.02 0 .. 02 0.02 0.02
9 e+ • - 0.02
9.84 ! 9.80 :t 9.76 ! 9.68 +
0.02 0.02 0.02 0.02
9.50e:!: 0.02
I(m/1) k3
pH'/p[H+]calib. Davies egtn.
log k 4 pH'/p[H+]calib. Davies egtn.
a
b
c
d
0.20 0.15 0.10 o.
o.oo
8.41 ! 0.02 8.36 :!: 0.02 8.30 :!: 0.02 8 .. 12 :!: 0.02
8 f+ 7. 1 - 0.,02
8.31 ± 0.02 8. ± 0.02 8.23 ! 0.02 8.08 ± 0.02
f+ 7.79 - 0.02
From the application of the pH'/p[H+] calibration curve.
+ 5.76 - 0.03 5.65 :t 0.02 5·59 ::1; 0.02 5.34 ± 0.03
4.86g± 0.03
From the application of the Davies e ion for single ion activi
5-67 ± 0.03 5.60 ::1; 0.02 5-55 ± 0.02 5-33 ± 0.03
4.90g.± 0.03
coefficients.
All errors estimated as the standard deviation from a number of independent determinations. --~/( *) e From a plot of log k
2 - I 1+I~ vs I.
1 1 - 3I~/(1+I~) vs I.
From a plot of log k1 vs. I. f 1
From a plot of k3
- 2I 1+I~) vs I. g From a plot of log

60
to pH' values appreciated by comparing the protonation
constants for the compound 1,5,8,12-tetraazadodecane (3,2,3-
tet) when the p[ ] values were obtained by the two '
different methods. ( titration data are shown in Table
6.11 ar1d the method of calculation of the constants is
described in Chapter 4). The data in Table 3.6 show that
large differences the protonation constants do occur.
The magnitudes of these differences vary as I varies and,
as expected,these changes correlate with the differences
between the op onal and the Davies activity coefficient
in Table 3.5.
3. 6 SUMMARY AND GENERAL COMMENTS
The important features of this calibration method are
(i) The p[ J values are obtained indep of the set of
andard solutions (NBS, British Standards
to standardise the pH meter.
(ii) No empirical ·expression is required for y H+
. ) used
(iii) The method uses buffer solutions thus,precise pH' data
are readily obtained.
(iv) The method reasonably rapid and once completed for
any one electrode system the calibration need only be
checked by comparing the response of the standard
buffers with that when the calibration was performed.

CHAPTER 4
CALCULATION OF E~UILIBRIUM CONSTANTS FROM
QH TITRATION DATA
61
4.1 CALCULATION OF THE PROTONATION EQUI~IBRIUM CONSTANTS OF
LIGANDS
For each of the ligands used in this study~the (vol. of
NaOH, pH) data were obtained from titrations of a solution of
the ligand, acid background electrolyte (NaCl) using the
procedure outl d in sec on 2.4. The ly
measured was converted to a hydrogen ion concentration
p[H+J as outlined Chapter 3.
4.1.1 Calculation of the Secondar;y Concentration Variable ii
This calculation is described for the base 3,2,3-tet.
The procedure adopted for the other ligands was identical,
although the equations derived were obviously slightly
rent in two cases (oxime and tone).
At each point during a titration there are equilibria
among the
solution:
ecies L,
[H3L] tHJ [H2L]
The charges have been omitted for clarity. The mass balance
equations for TL' the tot concentration of base and TH,
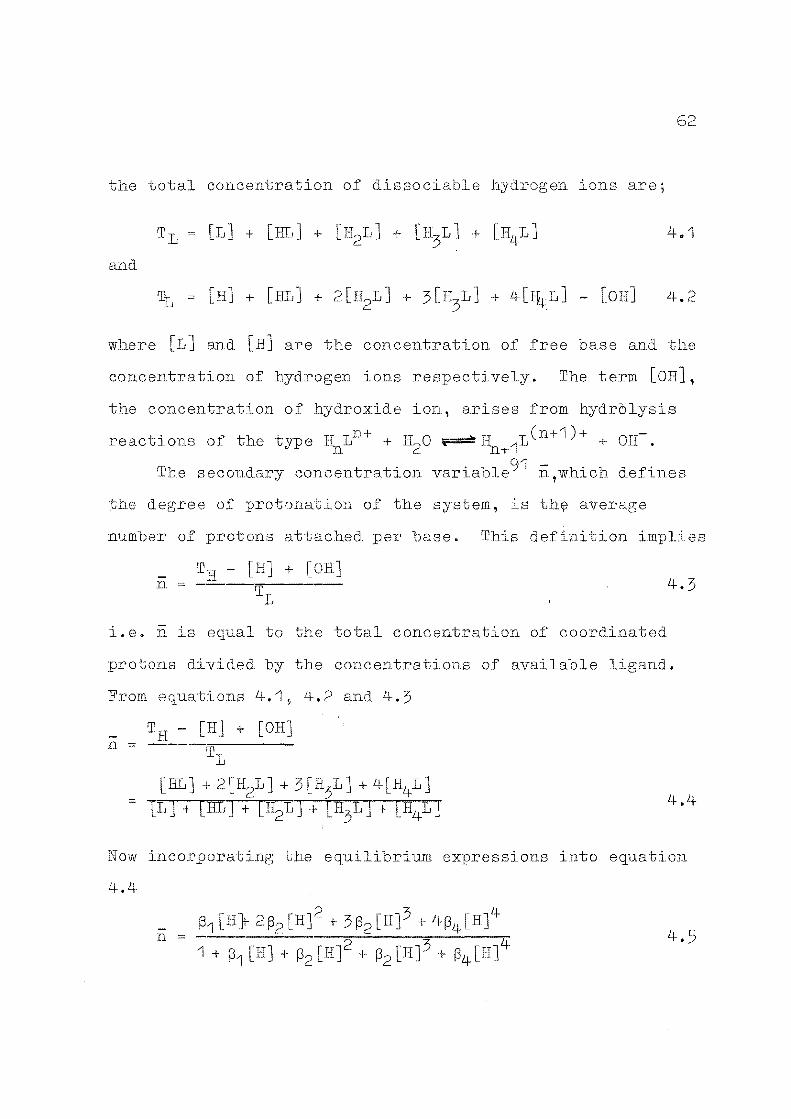
62
the total concentration of dissociable hydrogen ions are;
4.1
and
where [L] and [H] are concentration of free base and the
concentration of hydrogen ions respectively. The term [OH],
the concentration of hydroxide ion, arises from hydrolysis
reactions of the type + H2o ~ Hn+'1L (n+'1) + + OH-.
The secondary concentration variable91 ~,which s
degree of protonation of the system, is th(]:: average
number of protons attached per base. This definition implies
-n 4-.3
i.e. -n is equal to total concentration of coordinated
protons divided by the concentrations of available ligand.
From equations 4-.1, 4-.2 and 4.3
-n ::: TH - [HJ + [OHJ
TL
[HL] + 2 [H2L] + 3 [H3L J + 4-[H4L] = [L J + [HL J + [H2L J + [H3L]+ [H4L] 4.4-
Now incorporating the equilibrium expressions into equation
4.4
-n ~1 [H} 2 ~2 [H]2 + 3 ~2 [H]3 + 4~4 [H]4
1 + ~1 [H] + ~2 [H]2 + ~2 [H]3 + ~4 [H]4

63
where ~i general, equation 4. 5 is expressed as
-n 4.6
where N is the total number of stepwise protonations and
P. 1 . ~'-'o
-The calculation of n using equation 1+.4 is easily,
though laboriously, eved with the aid of a desk calculator.
A short Fortran computer program, FORM (see App D). was
written to the repetitive calculations of n from
titration data.
4. 1 . 2 £.j errum's Half -n Method
This method for the calculation of the equilibrium
constants from the secondary concentration variable n, along
with the conditions for s use, have rec been
discussed by both Sen92 and by Schrdder93. outline of the
method as applied to 3,2,3-tet as follows.
Equation 4,5 can be rearranged to give :an expression
for each in terms of n, [HJ and the other three equilibrium
constants. By assuming that only one equilibrium is
important at an.y n (nan integer, 1 ~ n ~ 4), then
approximate values of the constants are obtained from the
p[H+J value at n = n-~, i.e.

64
The values of p[ J at the particular D. values were inter
polated from the formation curve (a plot of n against p[ J).
rearranged equations for 3,2,3-tet are
4.8 3 + k1[ \
2 3 ) + 3k2k1[HJ + 5k4k3k1[H] I
[H] + 5k3k2 ~H] 2 + [H]3)
kn 4 constants -- >10 phen is
kn+1 ratio of success
accurately ssed by equation 4.7. However, a successive
approximations method must be used for r 4 os less than 10 .
Improved values of k 1 , ,k3
and k 4 are calculated from
equations 4.8. These values are then resubstituted and
further improved ants obtained. The process is
repe ed unt convergence is obtained. Co.nvergenc~ can be
slow if the magnitude of succes constants is similar.
This method for the calculation of ki only uses N s s
of data for the calculation of theN constants, which is not
a recommended approach. The process can also be tedious,
espe ally when convergence is not rapid ~~d N is greater
than two. results of a Bjerrum calculation on a set of

65
data for 3,2,3-tet are given in Table 4.3 (see section 4.1.5).
4.1.3 Gr~phical Me~hods
Before the advent of computers, graphical solution
techniques were widely used for the calculation of concen
tration equilibrium constants1 7,94 . Graphical methods are
preferrable to direct solution using methods similar to
4.1.2 because more data can be considered simultaneously and
the effect of experimental errors is more readily assessed.
Graphical methods were not widely used in this work. A
graphical method described by Rossotti95 was tried on one
set of (n, p[H+J) data for 3,2,3-tet as a comparison with
the widely used approach described in 4.1.4.
Equation 4.5 can be rearranged
n + Cn-1) ~1 [HJ + Cn-2) ~2 [HJ2
+ Cn-3) ~ [HJ3 + Cn-4) ~4 [HJ4 o
.1 k1 +
Cn-1) + k2
Cn-2) [HJ
If the term in brackets is small compared with the other
terms,then a linear plot of _.=(n-1.2.- against n 2 would , . Cn-2) [HJ 1 cn:-2) [HJ
yield k 2 as the intercept and k as the slope.. The 1
values of k 1 and k 2 obtained are given in Table 4.3.
These values were substituted into a rearran.ged form of
equation 4.5 and ~3 and ~4 calculated. Let

66
0 ~ + (~-1)B1[H] + (ii-2) B2 [H]2
then
0 - (~-3) B3 [HJ3 + (~-4) B4 [H]4 0.
Dividing by c
1 + (~-32[H}3
0 • B3 (~-4).llii
+ c . B4 0
thus when B3 o, B4 = -1/((~c42[HJ4 ) and when ~4 o,
B3
= -1/(iQc3)[H]3). The lines joining the points
(0 --=--0-) and ( -C 3
, 0) for any ven (~, [HJ) ' (ii-4) ]4 ( )[H]
should al intersect at a point ( ~3 , B4 ), thus ~3 and ~4 can
be calculated. In practice the lines intersect a region,
which gives an estimate on·the uncertainty in the calculat-
ion of B3 and ~4 . The constants, and uncertainties,
estimated using s graphical method are Table
A graphic method suggest by Scatchard96 was applied
to the same (ii, p
defined
]) data as used above. A function Q is
-Q = n
(4-~)
k 1 + 2k1k 2 [H] + 3k1k2k 3 [H] 2 + 4~k2k3k4 [HJ3
4 + 3k1 [H] + 2k1 [H] 2 + k1k2k 3 [HJ3
k1 Now in the limit, as H ~ 0, Q ..... 4 and in limit as
-From a plot of log Q against n,
from the limits ii ~ 0 and ii - 4, estimates of k 1 and k 4 are
obtained. This approach should only be regarded as

67
-approximate due to the difficulty in taining accurate n
data as n tends to both 4 and 0. Estimates. of these two
parameters are shown in Table 4. 3.
4.~.4 Least §guares Method
In principle.,N simultaneous equations of the type
equation 4.6 are necessary to solve for the N unknowns
~1 •.. ~. However, as the measured variables n and [H+ J are
subject to error a better approach is to obtain m sets of
values (n, [H+J) m > N and use a ast squares analysis.
The algebra of process out lin endix C.
This method for the calculation ability and b city
constants has been extensively us
1 squares method was used
throughout this work.
For the calculation of the basicity constants of the
,equation 4.6 was used. The LHS (termed F ) is 0
readily calculat from the analytical concentrations and
the hydrogen ion concentration and has an uncertainty a, the
standard deviation of the measurement F0
. RHS (termed
F (x y)) is a function c ''
the hydrogen ion concentration and
the unknown parameters k1 , k 2 . • • kN .1• The ast squares
procedure variel3 the unknown. parameters so as to minimise
the error square sum
M(x,y) n 2 L: w. ( (F ) . - (Fc(x,y)l.) i l 0 l

68
the weighting factor wi
A description and a listing of least squares program
ORGLS used in this wo is g Appendix D.
Weighting Procedure
Weighting of data in a least squares analysis
should be incorporated to allow for the variation of ai' the
standard deviation of the observation. there is a
use of
ai throughout a particular set of data then. the
weights (i.e. l t data is considered of
equal weight) is likely to produce a bias in the calculated
parmn.eters. Care in the use of a particular weighting
procedure is alBo needed for an accurate estimation of the
uncertainties of the parameters99. the calculation of
the basicity constants of the and. the least squares
( - - )2 process minimised z nobs - ncalc . An estimation of an.obs
can be calculated from the terms contributing to the
expression for ii,
~, TH - [H] + Kw/[HJ
n =
The uncertainties TH and TL will be constant throughout a
titration. The term [HJ is small compared with TH therefore
the uncertainty in [HJ has a negligible ect on ii and can
thus be disregarded. However, when [H] is small (pH> 10)
the term Kw/[H] makes an important contribution to ii and
under these conditions ii is a non-linear function of [HJ.

69
low pH ~ 10 the contributions from t hydrolysis term are
small and an will be approximately constant. Under these
conditions the n data may be wei ed at unity.
The general equation for the propagation of varirulce,
assuming no correlation between the xi is given by100 , 101
2 - 2 (.QL\2 O'y - ~ ox. ax. ) where
l l l
Applying this equation to the expres
2 o:n 2 aCii1 2
2 = o[HJ (a[H ) + C
-on for n
where C is a term which incorporates the estimated standard
deviations of TH and s term will be approximately
constant throughout a titration. ferentiating n with
respect to [H]
Thus
for
2 on
an
An
each
a number
1 2 (- TL J ( 1
estimat1on of o-n can
alternative approach
titration point, by
of titrations under
be
o 2 + c2 [HJ
obtained from
was to calculate
this
a-n -using experimental n
the same conditions.
4-.9
equation.
ctly
data from
The basicity constants for hm-3,2,3-tet were calculated
using differ weighting procedures. Thirtynine data points -in the range n 3.s - n 0.5 were used the calculations.
A comparison of the results is shown Table 1+.1.

TABLE 4.1
A comparison of the basicity constants for
hm-3,2,3-tet calculated using different
weighting procedures
weighting log k1 log k2 log k3
log k 11
unit weights 11.105 10.060 7.614 4.903
cal.o- directlya n 11.118 10.055 7.614 4.903
using eqn. 4.8b 11.116 10.055 7.614 4.903
using eqn. 4.8c 11.116 10.055 7.614 4.903
a -From the consideration of the n data from a number of
reproducible titrations.
b C was estimated as 0.003 (from a consideration of the
c C was calculated from c :::
where TH. is the initial total acid concentration. J.

These results show that the effect of weighting only
causes small changes in magnitude of the constants.
Other workers98 have also report that weight only
produces changes within the estimated uncertainty, when
nobs-ncalc is minimised in the least squares procedure.
70
Perrin1 also found that when erences in analytical
hydrogen ion concentration were minimised the effect of
weighting was minimal. weighting procedures did not
produce large changes in the errors calculated by the program
ORGLS. (For all the weighting schemes and for unit weights,
the errors in the log values appeared to be underestimated.)
~g____Qf_!he Progra!£._0RGLS
Then, p[H+J data and the basicity constants for
3,3'-diaminodipropylamine have been reported103. The
basicity constants were obtained using Sillen's"~ 04 procedure
applied to se cted data points (ten in number) as indicated
by the authors. their calculation ocedure, the
constants were varied so as to minimise the difference
between calculated ruLd experimental EMF values. The
reported(n, p[H+J)data points were used to calculate the
ee basicity constants using ORGLS. Each n obs ion
was weighted as unity, thus errors calculated by the
program were not meaningful; no errors for the constants
were assessed. A comparison between the constants obtained
and published values is shown in Table 4.2. The

TABLE 4.2
Computation (using ORGLS) of k1 , k2 and k3
for 3,3'
diaminodipropylamine from published data
published constants: 10.65 :t 0.02
from ORGLS:
Residuals from the final refinement cycle of ORGLS
1o3<ii b - n ) 0 s calc
2.657 -0.109
2.487 0.375
2.316 -0.308
1.818 0.303
1.659 -0.713
1.507 0.118
1.224 0.405
0.706 -0.079
0.575 -0.079
0.476 0.016

log
log
log
log
log
log
log
log
a
b
TABLE 4.3
A comparison of basicity constants calculated
using different methods.
Graphical a Least Sguares
Scat chard Rossetti
k1: 10.7 ± 0.15 10.54 + 0.02 10.58 -k2: 9.85 ± 0.02 9.82
k3: 8.35 ± 0.06 8.41
k4: 5.82 + 0.04 6.0 ± 0.1 5.76
Bjerrum b Least
k1: 10.33 '10 .34
k2: 9.77 9.77
k3: 8.25 8.24
k4: 5.53 5.56
Calculations performed on a data set not reported
in this work.
± 0.02
± 0.02
+ 0.02
± 0.02
Sguares
+ 0.02 -+ 0.02 -+ 0.02 -+ 0.02 -
The data used is a different set to that used in a.
b
a

agreement between the sets of values is satisfactory.
4.1.5 !_Qomnarison of the Direct Solution, Graphical and
Least Sguares Methods
The basicity constants calculated using the three
methods are compared in Table 1+.3. All the log ki values
have been rounded to two places of decimals. A comparison
between the Bjerrum results and the least squares results
71
shows favourable agreement. The least squares results would
be co the more accurate due to use of all the
available data. A comparison of the graphical and least
squares results also shows favourable agreement. With the
adopted Rossotti approach,errors the calculations were
accumulative; the f plot gave k1 second
plot gave ~3 ~4 , thus errors the estimation of k 1
and k 2 also contribute to the error in k3
and k 4 . There is
a large uncertainty on k1 determined by the Scatchard
approach
Data to n to the di iculty in the extrapolation to n - o.
3.8 were used in the extrapolation to determine
k4 and as the positive slope of the curve decreased as n __,. 4
the value of k4 could be more accurat
k1.
assessed than could
4. 2 CALCULATION OF THE S'l'ABILITY CONSTANTS FOR
COMPLEXES
COPPER
The competitive complex formation technique involving
hydrogen ions105 was us for the study of the copper-ligand

complexes. The titration. cedure used was to titrate a
solution containing metal ions, ligand and acid with
andard alkali. The approach used to calculate the
stability constants for the copper complexes from the
titration data depended on
formed.
number of complexes spe es
only one metal-lig ecies the ee mass
72
balance for TM (the total metal ion concentration),
TH .and TL contain three unknowns [L}, [M} and the metal ligand
stability constants, city constants for the and
having been previaus determined. For each titration point,
the equations could be solved directly to give the
constant of the complex.
abi ty
For more than one metal-ligand species the equations
for TM,
det
and TH can no longer be solved directly to
unknown constants. The calculation approach
adopted depended on the number and type of complexes present
whether their formation was concurrent. The least
squares approach was used. The detai of the calcul OilS
for the metal ligand stability constants for each ligand
are discussed the appropriate sec ons of Chapter 7.

73
CALCULATION OF ENTiillLPY DATA
The calculation of for a reaction requires a know-
ledge of the extent to which the reaction s occurred and a
measure of the heat change:5 for the reaction and any secondary
reactions that may occur. For a reaction that goes to
completion, of reaction is determined by the
number of moles of the reactant which not in excess.
However, for an equilibrium reaction (for example the
protonation of an amine) a knowl the concentration
quotient valid for the calorimetric conditions,and the
'position' of equilibrium,is required. When a batch calori-
metric technique is used the ent of an equilibrium
reaction is usually termined from the predetermined
concentration quotient for the reaction and from the
measured pH and stoichiometry of the calorimetric solution
at the end Of a run106 H f t't t' l . t owever, or 1 ra 1on ca or1me ry
~ +-it is only possible to measure the p LH J at the end of a
complete titration. A mathematical approach for the calcul-
ation the extent of reaction for each titration point was
adopted in this work.

74
5.1 CALCULNriON OF L'IHi FOR TEE PROTONATION OF hm-3, 2, 3-tet
AND 3,2,2.=te.!z
Solution Composition at Each Titration Point
Equation 3.6 as applied to these tetraamines can be
rearranged to give
n where ~n = II k. , ki being cone on quotient for
1 l
the stepwise otonation reaction LH. /j + H LH. , and where l- I l
~0 1 . equation 5.1 can be rearrang to
a polynomi in [H] of the form
f([H])
where the coefficients a, b, c, d, e and f are readily
calcul ed from the terms ~. , TL, and K • This polynomial l w
{H] was solved using the Newton-Rapson method75 which
initi required an approximate solution for [H].
For each titration point an approximation of n was
calculated assuming that the contributions from [H] and
Kw/[H] were zero, i.e. n
corresponding to this value of n was interpolated from a
previously determined formation curve. This p [H+] value
was then us to calculate an improved value of n,

75
n (TH- [H] + Kw/[H])/TL; the graphical process was then
repeated. The value of [H+] was then used as m1 approximate
solution to the polynomial 5.2. Only a few cycles of the
Newton-Rapson process were required to obtain a convergent
solution to within 0.0005 pH units.
The concentrations of the species at each on
point were calculat using t s hydrogen ion concentration
value from the Newton-Rapson process.
calculated p[H+] for the last titration point
compared favourably (± 0.0"1 pH) with the value calculated
from the measured pH of the calorimetric solution at the end
of a run.
These calculations were performed using a suitable
computer program. A li and sample output for this
program, THER~ is shown in App D.
Calculation of the Changes in the Concentrations of LH. l
between Successive Titration Points
For these tetraamine ligands,the stepwise enthalpy
changes are L + H ~ LH,6H"1; +II ~ LH2 ,~H2 ; LH2 + H;;:: LH3 ,
L"'H3 ; LH3 + H ~ LH4 ,L"'H4 . On the addition of the titrant
acid, overall at change Q, corrected for the secondary
reactions, can be ssed in terms of these stepwise
enthalpy changes

76
where r, s, t and u are respectively the number of mmoles of
the species LH,
increment,and Q
, LH3 and LH4 formed at each titration
the corrected heat change expressed in
Joules. The values of r, s, t and u were calculated as
follows. On the addition of the titrant HCl protonation of >
the ligand cies will occur (n will increase). The number
of mmoles of LH formed (r) was calculated from the difference
between the number of mmo s of L before and after
addition of the titrant increment. Similarly, number of
mmoles of
mmoles of
formed was calculated from the number of
before the incr of (LH). , l
the
value after the increment (LH)f and the number of mmoles of
LH that formed during , i . e .
s = (LH)i + r - (LH)f.
Similar equations were used to calculate t and u,
t ( ). + s - ( l
(The value of u could also be calculated from the difference
between the number of mmoles of LH4 before and after the
titration increment).
se calculations were also performed using the
program TF.lERM. heat changes were also corrected for the
heat of neutral ation of OH- using TF.lERM. Having obtained
the values of r, s, t, u and a corrected Q value, the values

77
of ~Hi were calculated using a 1
Least Squares Calculation of ~Hi
ar least squares method.
The general least squares program ORGLS (see Appendix
D) was adapted for the calculation of the enthalpy changes
for the stepwise protonation reactions. If
5.3
then the ast squares process varied the parameters ~H. so l
as to minimise the error square sum
where is t weighting factor the measurement of
Qobs' the corrected heat change. The values of Qcalc
(calculated us parameters of best fit) for these
tetraamine ligands are shown in the Tables1 6.'12 and 6.13.
Errors in the Enthal~~ Changes
The weighting factor for each experimental Q value was
estimated from the uncertainty in the determination of each
value, the main contributions arising from the measured
re stance change of the thermistor and from the unc
the calorimeter calibration constant (see 2.5.8).
ainty
The errors in enthalpy values were obtained from
diagonal term of the inverted matrix during least
squares analysis us ORGLS (see Appendix D). No correlation
of the errors for the experimental heat change ru1d the errors
arising from the calculation of r,s,t and u was considered.

78
CALCULATION OF THE ~H. FOR THE DIAMINE-DIOXIME PROTON-~------------------=-l . AT ION
The same procedure as outlined above for hm-3,2,3-tet
and 3,2,3-tet was used to calculate the solution composition
at each titration point, the changes
enthalpy change:s for the protonation of
compo tion,and the
diamine-dioxime.
5. 3 CALCULATION OF THE ENTHALPY CHANGES FOR THE FORMATION
OF THE COPPER(IIYDIAMINE-DIOXIME COMPLEXES
Solution Composition at Each Titration Point
:B'or the copper diamine-dioxime complexes the enthalpie s
of complex formation are
Cu2+ +
and
For each point the titration of the complex CuLH+ with
l 9 three equations can be formulated. These are the two
mass balance relationships
TM = [Cu J + [CuLH2 J + [CuLHJ
and
where TM and TL are the total concentrations of metal ion
and ligand present. The third equation is the electro
neutrality relationship,
5.4
5.5

79
where [Cl]init is concentration of chloride ion in the
solution which was added as CuC12 , and [Br-J is the
concentration of bromide ion that was added as
dihydrobromide, [C J is the concentration of the chloride add
of NaOH added the ial pH adjustment. As the
concentration quotients for 1 equilibria are known,
equations 5.4 - 5.6 form a system of three nonlinear
equations in the three unknowns [H], [LH2 ] and [Cu J. These
equations were solved using a successive approximations
method. For a given value of [HJ, [Cu] and [LH~ were
calculated from equations 5.4 and 5.5. Equation 5.6 was then
rearranged to ve a cubic equation [H] which was solved,
the Newton-Rapson method, to give an improved value
for [H]. This improved value of [H] wast used to
calculate improved values for [LH2] and [Cu]. This complete
process was then .repeated until convergent values of [H+J,
[Cu] and J were obtained. The final values for these
unknowns were checked for internal consistency with the
equations 5.4 - 5.6. These values were then used to
calculate the solution composition at each titration po
These calculations were performed using a suitable computer

80
THERMOX ( from CUT , see Appendix D).
Calculation of the Changes in~sition Between Successive
Titration Points
the calorimetric titration initial s
was usted so that was the predominant compl
species. The reaction scheme as HCl was to
the imetric so can be sented?
+ CuLH+ + -+ CuLH2
2+ _,. cu2+ + LH2 _,. + LH
3 -4 c!.l LH2+ + 4 .
For titration , the in the number of
CuLH+ (r) is s the difference between number
of m.mo s of the species before and
inc rem The change for
number of mmoles of the
deco oses (s) will be given by
er the titration
process will be
cies CuLH 2+ 2
er of mmoles b e the t
incr and ( CuLH2 ) f is number of mmoles after
increment. The enthalpy change for
-~H1 • Similarly the er of llmoles
LH42+ (c ) formed wi be given by
corr1 ( ). +s-( l
(The symbols i-and f
above
)f and corr2
same me
s ess will be
+ (corr1)
(
as those used

81
The overall at change on reaction was corrected for
protonation the diamine-dioxime using the determined
enthalpy data (section 6.1). The correction for the second·-
ary hydrolysis reaction was zero for this titration.
These c culations and corrections of the heat change Q
were incorporated into the program THERMOX. The results
from this program are shown Table 7.18.
The enthalpy s liH1 and liH2 were calculat om a
least squares analysis on the Qcorr ( heat change
corrected for the protonations of the and) r and s data
obtained from THERli/IOX. The Q values from the least calc squares s are also r orted in Table 7.18.
5.4 CALCULATIONS IN EXPERIMENTAL DETERIVIINATION OF
~liH1 +liH2 ) FOR THE COPPER/DIAMINE-DIOXIME SYSTEM
For the titration of an alkaline solution (pH rv 10) of
ligand against copper chloride~the overall reaction was
For each titration point,equations 4.4- 4.6 are still
applicable but some simplifications can be made. From 4.4
and 4.5
5·7
Equation 5.6 can be rearranged to

82
+ [ ] + ACIDA.
which on the elimination of TM gives
ACIDA + 2TL- [Na] + Kw/[H] - [H] + [CuLH] [LH2 ](~1 [H] +2~2 [n] 2 )
5.8
where ACIDA is the concentration HCl added the Cue
titrant. it is initially assumed that [Cu] 0 and
[CuLH] Tl\JI then the LHS of equation 5.8 can be readily
calculated, assuming an approximate value for [ , then from
equations 5.8 and 5.7, on the elimination of [LH2 ], the
resulting quadratic equation can be solved for a new value
of [H]. s value is then used to c culate a new value for
[LH2] and also values for [Cu] and [CuLH]. The process is
then repeated until convergence of the [H+] values is
obtained (usually a few cycles). The solution composition
at each point in the titration was then calculated and the
he change was corrected r the protonation of the excess
ligand. From the corrected at change the number of
mmoles CuLH+ formed,the (L:.H1 + ) value was calculated
(see section 7.2).

5.5 CALCULATION OF ENTHALPY CHA.NGES FOR THE FORMATION
OF THE COPPER COMPLEXES OF 3,2,3-tet
Calculation of the Solution Composition at each Titration
Point
For the determination of the enthalpy changes for the
reactions
Cu2+ + L ;p CuL2+ (L':JI1) and Cu2+ + RL + <P CuHL3+ )
83
sol~tions made from the solid complex Cu(3,2,3-tet)(Cl04 ) 2107
were ti trat with HCl. mass balance equations for TM,
TL and TM for this system are
[Cu] + [CuL J + [CuRL J
[L] + [HL] + [H2L] +
[H] + [RL J + 2 [H2L] + 3
- Kw/[H]
These three nonlinear equations
5.9
] + [ H4 L] + [ CuL J + [ CuHL] 5. 1 0
] + 4[H4L] + [CuRL]
the unknowns [H], [L] and
[Cu] were solved by a successive approximations method.
An approximate value for [H] at each calorimetric
titration point was estimated from the titration curve of a
pH titration of NaOH against a portion of the solution at the
end of a calorimetric run. Given this value of [HJ for each
point 9 the quadratic equation in [L] formed on the imination
of [Cu] from equations 5.9 and 5.10 was solved to obtain a

84
value of [L]. This value was then sub tuted into equation
4.9 to calculate a value for [M]. These values of [M] and
[LJ were then sub ed into equation 5.11,which was
sobred by the Newton-Rapson method to obtain an improved
value for [HJ. This value was then used to calculate
improved values for both [L] and [M]. The complete process
was repeated until convergence of the s was obtained.
The final values for [H], [M] and [LJ were then used to
calculate the solution composition for the particular
titration point. These calculations were performed us
the computer program CUTHERM.
Calculation of the Changes in Solution Com:Qosition Between
Successive Titration Points
The reaction scheme as the titrant acid is added to the
CuL complex can be represented
CuL --.. Cu + L -.. Cu + FlL ...... Cu + H2L -.. "'-:.!
CuHL
The calculations of the changes in the number of mmoles
of each species are as follows: The number of mmoles of CuL
that decomposed (r) is simply the difference between
number of mmoles of the species before and ter the
titration increment. The enthalpy change for this process
will be ·-~H1 . For CuHL number of mmoles formed (s) will
be the difference between the and tial values, the

85
enthalpy change for s cess being + The number of
mmoles of formed (corr~) is given by
corr~ r + (L).- (L)f l
where i and f have the meaning as described in section 4.3.
Similarly the number of mmoles of
(corr2, corr3 and corr4 re ctively) are given by the
equations
corr2 ( )i + corr~ - [(HL)f + s]
corr3
corr4
heat of reaction Q was corrected for the heat of
protonation of the ligand species corr1 - corr4
values and the enthalpies of protonation (section 6.2).
~hese calculations were also incorporated o the program
CUTHERl\[.
From the corrected heat changes and the corresponding
rand s values for each titration increment,LlH~ and 6H2 were
calculated usi linear ast squares method. The
results of the calculations using CUTHERM and results from
the least squares analysis are shown Tables ?.6 and 7.7.

5.6 CALCULATIONS OF THE ENTR~LPY CHANGE FOR THE COPPER
(hm-3,2,3-tet) COMPLEX
86
Calculation of the Solution Composition at Each Titration
Point
For the determination the enthalpy change for
a solution of the ligand was titrated with copper chloride.
The s balance equations for , TM and TH are
[L] + [HL] + [ 5.12
[Cu] + [CuL]
] -K /[H] w 5.14
From equations 5.12 and 5.13
5.15
[Cu] is initially set equal to zero,then the resulting
polynomial in [H] formed on the elimination of [L] from
equations 5.14 and 5.15 was solved for [H] using the Newton
Rapson procedure. (An initial p[H] value for each titration
point was estimated from the.value nH). Values of [L] and
[Cu] were then calculated and the process was repe ed until
convergence of the [H] value was obtained. The final values I
of [H], [L] and [Cu] were then used to calculate the solution

87
composition at each int. These calculat were performed
by a suitable adaption of the gram CUTHERlVI.
Calculation of the Changes in Solution Composition
As there was one complex formed,the enthalpy
change bH1 was calculated direc from the corrected
change and from change in the number mmoles of the
species CuL(r), which
number mmoles of CuL
simply
er
difference between the
before the titration
increment. The number mmoles of
copper chloride titrant was added
solution was calculated from
formed (corr1) as the
the ligand plus acid
corr1
Similarly the number mmo s of
formed on addition titrant (termed corr2, corr3
corr4 respectively) were calculated from
corr2 = (HL)i + corr1- (HL)f, corr3 = (
and corr4
the symbols i f the same meaning as described
previously (section 4.3). The of reaction was then
corrected for the heat protonation of ligand spe s
us the values corr1 to corr4 and the corresponding
halpies of protonation. The corre on for the secondary
hydrolysis reaction was so re s of these
calculations are shown in Table 7.2.

88
CHAPTER 6
PROTONATION OF T LIGANDS
6.1 PROTONATION OF THE DIAMINE-DIOXIME LIGAND
This diamine-dioxime ligand (Fig. 1.1) has two
seconclary amine groups for which :protonation thermodynamic
data have been determined. The nitrogen of an oxime function
is found to very weakly basic108 ; no attempt was made to
measure the basicity constant for the oxime functions of
this ligand. addition to this basicity :proton ionisation
from the oxime function is likely. An estimate of the
acidity of s oxime group has been determined.
6.1.1 Oxime Isomerism
The reaction of hydroxylamine with aldehydes ruld un-
symmetric ketones often leads to the formation of two
t . . 109 geome r1c 1somers .
isomeric forms are
§XQ (methyl)
For the ketoxime in this study these
R..--CH2,C/CH3
\\ N
HO__....
(methyl)
Before the advent of NMR the ckman rearrangement was
used for the assignment of oxime configuration109. This

89
assignment was not always unequivocal due to the possible
. t . f . d t d' t. 110 ln erconverslon: o lsomers un er rearrangemen con l lons .
NMR studies have been extensively used for oxime
. . 111-114 A structure elucldatlon . separate resonru1ce has been
observed for the protons on o:: carbons ~ and anti
isomers of a number of ketoximes111 . For a group aOH - in X
isomeric syn and ru1ti ketoximes the resonance separation
111 TCH (syn) - TOH (~nti) can be somewhat solvent dependent . X X
In ketoximes the resonance sep is generally larger for
112 the a-methylene protons than for a-methyl protons . Also
it has been generally accepted for ketoximes that both for
an a-methyl and an a-methylene group the resonance at
higher field strength associated with a trans(OH)
. 111,112 C lOU •
The exact nature of the anisotropic deshielding
associated with the oxime is not known with certainty. From
studies on change in NMR spectra on protonation of the . 113
oxime nitrogen Saito coworkers concluded that the
deshielding effect ses from the lone pair of electrons on
oxime nitrogen. However, there considerable
. 112 114 112 evldence ' to support the proposal that the de eld-
effect arises from a proximity effect involving the oxime OH
group.
For the diamine-dioxime ligand and the dihydro-
chloride and dihydroperchlorate salts, and some NMR data

90
have been reported3. Further NMR data are shown Table
6.1. the ligand in CF3
COOH the splitting of the
resonances for the a-methyl ex-methylene protons indicate
the occurrence of two omeric forms for the oxime function
and furthermore, resonance int shows the
resonance higher field for both ex-methyl and a-methyl-
ene protons is associated with the same oxime configuration.
This was assigned as the anti isomer3. The NMR of LH2 .2HCl
in CF3
COOH showed i c purity and by comparison with the
NMR data for LH2 a syn configuration was assigned (the ~
isomer). Similarly, a comparison of
(termed 1) in 3
cOOH with that for
NMR of LH2 .2HCl04
in the same solvent
indicated the perchlorate salt was in the anti configuration.
The solvent dependence on the resonance splitting,and on the
chemical shift,can be seen from a comparison of NMR data
for D20/CF3
COOH solvent with that obtained in D2o and CF3
COOH
alone. It appears that the isomeric configurations are
'frozen' in CF3coon and isomerisation does occur for each
isomer in aqueous CF3
COOH. This observation is cons
with that of Norris and Sternhell11 5 who reported that the
addition of CF3
COOH to dioxan solutions of some quinone
monoximes slows the rate of syn-~nti interconversion while
aqueous solutions of CF3
COOH increase isomerisation rate.
NMR for the dihydrobromide salt of the ligand in D2 o
shows the existence of two isomeric forms. As for the

TABLE 6.1
NMR data for the diamine-dioxime l at ca 30°C -·
Chemical shiftsx (and resonance integralY ratios)
Compound solvent z b d a c
LH2
CF3
coOH 8. 7.64, 7-54(2:1) 6 .. 88, 6.73(2:1) 6.20
.2HC1 CF3
COOH 8.25 7.47 6.65 6.08
LH2.2HC1 D20/CF3
COOH 8.78, 8.74 8.20, 7.96(1.7:1) 7.52, 7.25(1.7:1) 6.70
LH2
D2
0/CF3
COOH 8.50, 8.47 7-95, 7.68(.75:1) 7.28, 6.97(.75:1) 6.44
LH2 .2HC1 D2
0 8.58 8.08 7-35 6.65
.2HBr D20 8.59 8.08, 8.03(2:1) 7.36, 7.22(2:1) 6.66
LH2.2HC104 CF3
COOH 8.30 7.60 6.85 6.15
LH2.2HC104 50% D20/CF3
COOH 8.50, 8.47 7. 94' 7. 68 (. 8: 1) 7.27, 6.95(.8:1) 6.44
X ~ values in ppm relative to TMS.
y Integral ratios are expressed as the ratio of the high field resonance integral to the low field integral.
z letters a,b,c,d refer to the protons as indicated in • 1. 1 •

91
a-dihydrochloride NMR ctrum was unchanged by the
addition of small amounts of sodium chloride, sodium hydrox
ide or hydrochloric acid. It also appears (see Table 6.1)
that the NMR spectrum of LH2 .
representative of a pure ~ omer then for LH2 .2HBr the
resonance for the a·-methyl and a-methylene protons at
higher fields are associated with a £JQ isomeric form of an
oxime group. This is co11t:r;-ast with as gnment in
CF3COOH and perhaps indicates the importance of solvent
effects for s diamine-dioxime compound.
Rate of Isomerisation of the Oxime Function
le quantitative information on the rate of isomer-
isation of oximes is available. A number of thermal and
photochemical isomerisations of aromatic oximes have been
t d . d116 f t' . . t b s u le , rom a prepara 1ve v1ewpo1n . has een
suggested that acids, bases and some salts catalyse oxime
. . t' 117 1somer1sa 1on .
On a macroscopic scale it appears that for the diamine-
dioxime ligand i s on occurs readily in aqueous
solution. judged from visible absorption spectra,
dissolution of the separate syn (a.2HCl salt) or m1ti
omers with copper ions at the appropriate pH
leads to the .immediate formation of identical copper
complexes (see Chapter 7). Also, the addition of dilute
perchloric acid to a solution of a. water ads to

the immediate formation of r.2HC104 .
However, on the NMR t scale the icat of
two oxime configurations in solvent n2o indicates a slow
rate of isomerisation.
No temperature dependent NMR studies were attempted.
6.1.2 Protonation of the Amine Nitro~~
Results
Data from titrations of bo (a) and
LH2 .2HCl04 (r) ligand solutions against NaOH are given
Tables 6.2 and 6.3. Only one titration from each set of
reproducible titrations has been tabulated. The ligand
92
solutions were prepared just or to the commencement of a
set of titrations, which were normally completed within
about three hours. Within this period there was no
observable hydrolysis of the oxime group (by pH measurement).
For titrations of NaOH against the and LH2 (a+r) dissolved
in HCl the experimental end points for the removal of one
proton from the protonated ligand did not agree particularly
well with the calculated values. This was probably due to
incomplete dissolution of the sparingly water soluble LH2
ligand. These tration data were not used in the calculat-
ions of protonation constants.
The protonation of diamine-dioxime ligand can be
represented by the two stepwise equilibria
LH + 3 and LH 2+
4

TABLE 6.2
Data from titrations of the diamine-dioxime ligand against standard NaOH at I = 0.10M (Na.Cl) an 25°C
Solid isomer: o:.a(syn meth;x:l) Yb(anti meth;x:l)
Volume - p[H+] Volume - p[H+] n n
0.020 1.844 5.644 0.020 1.830 5.680
0.030 1.770 5.842 0.030 1.750 5.881 0.040 1.695 6.003 o.o4o 1.668 6.047
0.050 1.620 6.148 0.050 1.586 6.196 o.o6o 1.545 6.280 o.o6o 1.505 6.338 0.070 1.469 6.411 0.070 1.422 6.478 o.o8o 1.394 6.548 o.o8o 1.340 6.627
0.090 1.318 6.687 0.090 1.258 6.793 0.100 1.243 6.850 0.100 1.176 6.997 0.110 1.168 7.050 0.110 1.094 7.280 0.120 1.092 7.332 0.115 1.054 7.486
0.125 1.055 7.529 0.120 1.013 7.742 0.130 1.018 7.788 0.125 0.974 8.046
0.135 0.982 8.068 0.130 0.936 8.307 0.140 0.947 8.303 0.135 0.899 8.478
0.145 0.913 8.481 0.140 0.862 8.622
0.150 0.879 8.618 0.150 0.790 8.842
0.160 0.812 8.828 0.160 0.720 9.007 0.170 0.747 8.988 0.170 0.651 9.143 0.180 0.683 9.121 0.180 0.586 9.264
0.190 0.621 9.239 0.190 0.523 9.374 0.200 0.562 9.346 0.200 0.463 9.473 0.210 0.505 9.442 0.210 o.4o8 9.569 0.220 0.453 9.537 0.220 0.358 9.659 0.230 o.403 9.623 0.230 0.312 9.744 0.240 0.358 9.706 0.240 0.271 9.823 0.250 0.317 9.785 0.260 0.280 9.858
a Composition of solution: T1 = 4.797 x 10⁻⁴M, TH = 9.593 x 10⁻⁴M, [NaOH] = 0.1813M, initial volume = 49.94 ml.
b Composition of solution: TL = 4.883 x 10⁻⁴M, 6 -4 TH = 9.7 5 x 10 M, [Na.OH] = 0.1720, initial volume = 49.94 ml.

TABLE 6.3
Data a from titrations of the diamine-dioxime ligand
against standard NaOH at 25°C
I = 0.20 M I = 0.15 M I == o.o4 M
a. isomer "( isomer a. isomer
Volume - p[H+] Volume - p[H+] Volume - p[H+] n n n
0.020 1.855 5.714 0.020 1.843 5.701 0.020 1.840 5.477
0.030 1.786 5.903 0.030 1.769 5.892 0.030 1.766 5.690
0.040 1.716 6.056 0.040 1.694 6.052 0.040 1.691 5.858
0.050 1.646 6.192 0.050 1.618 6.199 0.050 1.616 6.004
o.o6o 1.576 6.322 0.060 1.542 6.329 0.060 1.540 6.139
0.070 1.505 6.455 0.070 1.466 6.459 0.070 1.464 6.271
o.o8o 1.435 6.567 o.o8o 1.391 6.597 o.o8o 1.388 6.404
0.090 1.365 6 .. 685 0.100 1.239 6.888 0.090 1.312 6.546
0.100 1.294 6.821 0.110 1.163 7.083 0.100 1.236 6.703
0.110 1.224 6.987 0.120 1.087 7.352 0.110 1.160 6.892
0.120 1.154 7.185 0.125 1.050 7.543 0.120 1.083 7.152
0.130 1.084 7.462 0.130 1.013 7.781 0.130 1.008 7.571
0.135 1.049 7.640 0.135 0.977 8.053 0.135 0.971 7.873
0.140 1.015 7.849 0.140 0.942 8.286 0.140 0.935 8.154
0.145 0.982 8.094 0.150 0.873 8.602 0.150 0.865 8.531

Table 6.3 (contd.)
I = 0 M I = 0.15 M M
a isomer y isomer isomer
Volume -n p[H+] Volume -n p[H+] Volume - p[H+] n
0.150 0.949 8.307 0.160 0.807 8.815 0.160 0.796 8.762
0.160 0.886 8.598 0.170 0.742 8.977 0.170 0.729 8.938
0.170 0.824 8 .. 803 0.180 0.679 9.109 0.180 0.663 9.074
0.180 0.765 8.971 0.190 0.618 9.224 0.190 0.599 9.198
0.190 0.705 9.091 0.200 0.559 9.328 0.200 0.538 9.313
0.200 0.648 9.203 0.210 0 .. 503 9.422 0.210 0.479 9.415
0.210 0.595 9.314 0.220 0.450 9.513 0.220 0.425 9.515
0.220 0.540 9.395 0.230 0.410 9.598 0.230 0.373 9.604
0.230 0.491 9.484 0.240 0.355 9.676 0.240 0.327 9.695
0.240 0.443 9.563 0.250 0.315 9.754 0.250 0.283 9.776
0.250 0.399 9.640 0.260 0.278 9.825
0.260 0.358 9.713
0.270 0.320 9.782
0.280 0.286 9.847
a Composition of solution: I = 0.04M; T1
= 4.508 x 10⁻⁴M,
6 -4 TH = 9.01 x 10 M, [NaOH] = 0.1720,initial volume= 49.94 ml.
I= 0.15M; T1
= 4.524 x 10⁻⁴M, TH = 9.048 x 10⁻⁴M,[Na0H] = 0.1720M
initial volume = 49.94 ml. I = 0.20M; T1 :::: 4.883 X 10⁻⁴M,
-4 TH = 9.765 X 10 M, [NaOH] = 0.1720M, initial volume = 49.94 ml.

93
and
the charges having been omitted for clarity.
These quotients k4 and were calculated from the pH
titration data by least squares method (see Chapter 4)
and the results are given in Table 6.4. The uncertainties
the k values were estimated from a consideration of
the analytical errors involved in a titration and from the
standard deviation in the log k value from a number of
titrations, performed under ical conditions. The
formation curves for the titration data (Table 6.2) at an
ionic strength of 0.10 M for both the . 2HC1( a)
LH2 . 2HCl04 (I) isomers are shown in :B"ig. 6.1. These curves
-are almost erimposab the ion n == 1.8 to n ~ 0.8,
however in the n range 0.8 0.2 a slight difference is
apparent. This difference reflected the difference
between the log k 3 values for a and I data (Table 6.4),
although on consideration of the errors the log k 3 values
this difference of 0.027 is not statistically cant.
Log k 0 values were obtained from the extrapolation of a n
plot of log kn against f(I) to I 0, as described
Chapter 1. The extrapolations are shown in . 6.2 and the
results are recorded in Table 6.4.

/
1'
-
/ \
[f)

9.£' 1'
T
.l..
q.3
0 0.10
I
Fig 6.2

TABLE 6.4
Protonation constants for the diamine-dioxine
ligand at 25°0, NaCl solution
Ionic strength Isomer a log k4 log k3
0.20 6.457 + 0.02° 9.465 ± 0.02
0.15 y 6.402 ± 0.02 9.425 ± 0.02
0.10 6.362 ± 0.02 9.452 + 0.02
0.1'0 y 6.347 + 0.02 9.407 + 0.02
o.o4 6.202 + 0.02 9.370 + 0.02 -o.oob 5.89 + 0.02 9·35 ± 0.02
~ denotes that the constants were derived from titrations using
the a.2HC1 salt; y denotes Y2HC104 was used.
b Constants of I = 0 were obtained using an extrapolation
procedure (see Fig. 6.2).
c Errors estimated as described in the text.

94
Data from the calorimetric titrations of solutions of
diamine-dioxime bromide salt and alkali,against standard
HCl~are given in Table 6.5. The method used to calculate
solution composition at each titration po is outlined in
Chapter 5. The tabulated heat change' ~ is the measured
heat change, correct for the he of dilution of HCl
The stepwise enthalpies of protonation (LH2 + rr+ ~ + LH3
, L1H3; + + H+ ~ LH
42+, L1H4) culated using the least were c
squares procedure out ed Chapter 5- The values of the
calculated heat change (Q 1 ) from the least squares analyses ca c
are also given in Table 6.5. A comp son of each Qcalc
value with the corresponding Qcorr value, the measured heat
change QM corrected for the heat of neutral ation of
hydroxide ion, indicates that the least squares refinement
of the heat data was satisfactory. With the exception of
one difference
of Q corr·
Qcorr - Qcalc values are all ~ss than 1%
The enthalpy changes calculated from the least squares
analysis were corrected to infinite lution (as discussed
Chapter 1). These values, along with the corresponding
free energy ru1d entropy changes, are given Table 6.6.
The uncertainties enthalpy values were obtained from
the least squares analysis (see Chapter 5) using weighted
Qcorr values.

TABLE 6,5
Calorimetric results from the titration of diaminedioxime solutions against HCl, I= 0,10M, 25°C
Vol. a (ml)
ii LH + 3 (mmol)
LH4 2+ A(LH3 )d L\(LH4) (mmol) (mmol) (mmol)
'l'itration 1 0,300 10,001 0.204 0.39903 0,10227 0,00002
0,620 9.399 0.507 0,24733 0,25376 0,00023
0.950 8,709 o.838 0,08295 o.41655 o.oo182
1.270 7.045 1.164 0,00179 0,41559 0.08394
1.590 6.364 1.491 0,00023 0.25467 0.24642
1.930 5.635 1.838 0,00001 0.08094 0.42036
0,15169 0,00020 6,604 5.923 6.007
0,16439 0,00160 6.763 6.582 6.565
0,08115 0,08211 6.616 6.570 6.512
0,00156 0.16248 6.652 6.651 6.598
0,00022 0.17394 6.990 6.990 7.005
0.320 9.712 0.333 0,35937 0.17913 o.oooo8
o.64o 9.187 0.627 0.20155 0.33654 o.ooo49
0.960 8.362 0.927 0,04386 0.48995 0.00477
1.280 6.~65 1.231 0,00117 0.41161 0.12580
1.620 6.253 1.555 0,00017 0.23932 0.29909
1.970 5.452 1.888 0,00001 0.06046 0.47811
Titration 2
0.15782 0,00041 6,606 6.278 6.258
0.15769 0,00428 6.541 6.422 6.408
0,04269 0.12103
0.00101 0,17329 6.981 6.980 7.010
0,00016 0.17902 ?.176 7.176 7.207
a
b Cumulative volume of 0,5128M HCl added at each titration point.
p[H+] values are calculated as described in Chapter 5·
c Values are the number of mmoles of each species at each titration point, d Values tabulated are the changes in the no. of mmoles between successive titration points.
f QM (J) corrected for the neutralisation of OH- ion,
g See text, h Titration 1; T1
Titration 2: T1
5.072 x 10⁻³M, 'l'H =: -0.686 x 10-311, Initial volume = 98.84 ml
5.449 x 10⁻³M, TH = 0,069 x 10-3 M, Initial volume = 98,84 ml.
1
1
1
1
1
1
2
2
2
2
2
2

TABLE 6.6
Thermodynamic data for stepwise protonation of the
diamine-dioxime ligand at 25°C at I = O.OM
Reaction
LH2 + H+ ~ LH3+
LH3
+ + H+ ~ ~ ·• 2+
0 log k
9·35 :.: 0.02
5.89 ! 0.02
0 -1 -!J.G kJmol
.36! 0.1
33.61 ± 0.1
-IJ.H0 kJmol- 1
-55 ± 0.3
39 .. 39 ± 0.3
Thermodynamic data for protonation of ethylenediamine
and ~N'-dimethylethylenediamine at 25°C and I O.OOM
a NH2
CH2CH2
NH2
b MeNHCH2CH2NHMe
0 0 -1 log k -IJ.G kJmol
9.91 56.56
(9.93) (56.69)
7.13 40.69
(6.86) ( .16)
10.,032 57.25
6.795 38.78
!J. 0 -1 - H kJmol
.96
(49.83)
46.15
(46.36)
44.94
39.02
!J.S0 Jmol- 1K- 1
+ .3- 1.3
-19.4! 1.3
IJ.S 0 Jmol-1K- 1
22.2
(23.0)
-18.3
(-24.3)
41.3
-0.8
aData from reference 124. Values in parenthesis from reference 87 and references therein.
bLog k0 data from reference 119. IJ.H data from reference 121 was corrected to infinite
dilution as described in Chapter 1.

95
Discussion
The oxime functional group and the amine group are well
recognised as a hydrogen bonding acid ru1d a hydrogen bonding
base respectively118 . Mo cular models of the diamine-
dioxime ligand show for the y (Qnti) configuration of
the oxime group intramolecular hydrogen bonding between the
oxime OH and the amine nitrogen, - OH ... N,is favourable
while for a(~)isomer no such hydrogen bonding appears
possible. This implies in the phase the f t
protonation constant (log k3
) for a Y isomer might be
slightly smaller than that for an a isomer.
The log k values for the diamine-dioxime ligand proton-
ation at I = 0.10 M (see Table 6.4) obtained using a
Y isomers were found to be equal, within estimated
experiment uncertainty. This suggests either that the
protonation constants for the a and Y isomers in aqueous
solution are very similar,or that the rate of l sation
is rapid (on the pH measurement time scale) and that the
equilibrium isomer ratio of a:Y is rapidly estab shed.
Other evidence supports rapid isomerisation (see section 7.2).
The free energy data Table 6.6 show that there is a
considerable reduction the basicity of the amine nitrogens
in the diamine-dioxime ligand compared with either ethylene
diamine or N,N'-dimethylethylenediamine. This decrease is
perhaps best discussed by separating out the effect due to

(i) the alkyl chains attached to the amine nitrogens,
and ( ) the introduction of two oxime substituents onto
alkyl chain.
Effect of Alkyl Substituents
There are few thermodynamic data available for the
protonation of N-alkyl substituted ethylenediamine
compounds5. N~sanen11 9, 120 determined thermodynamic
protonation construLts for a number of methyl ru1d ethyl
substituted ethylenediamines, however no enthalpy changes
were det d. The enthalpy data for Np'-dimethyl-
96
ethylenediamine protonation at I = 0.50 (KN03) have recently
121 been reported ; these values, correct to infinite
dilution as described Chapter 1 are shown in Table 6.6.
The only other enthalpy data for some N substituted ethylene-
diamines were determined by olo and coworkers122 using a
non-calorimetric method. Their data for N~'-dimethyl-
ethylenediamine is in coiHJiderable disagreement with that
from erence 121.
It we known that for a large number of primary
n-alkyl monoamines the basicity does not uniformly ase
with chain length but shows small fluctuations about a
fixed value123, 124 . is so true for a smaller number
of secondary N-alkyl monoamines124 . An ction of the
enthalpy and entropy changes shows that s approximately
constant basicity arises from the compensation of the

97
nH0 Tn8° terms; as the chain length increases -nH0
increases and n8° decrease. The usual explanation68 , 125 for
According to the ctrostatic theory12~ groups of low
di ctric constant (e.g. a hydrocarbon chain) embedded in a
medium of die ctric constant are repelled from the
neighbourhood of the charge. This results a ened and
extended hydrocarbon chain and a resultant entropy decrease
due to the decrease the number of degrees of edom of
the chain.
For a diamine similar structure to the daimine-
dioxime ligand without the oxime substituents it would be
expected that the free energy changes for protonation would
be similar to those for N,N'-dimethylethylenediamine.
Empirically Calculated Enthalpy Changes
An estimate of the enthalpy changes for such an. amine
(termed ) can be made using empiric formulae.
Christensen and 124 coworkers have reported cal formulae
for the calculation of enthalpy and entropy changes on
protonation of both primary and secondary N-alkyl subetituted
monoamines. A further formula the prediction of the
entha;Lpies of protonation some diamines has also been
1 reported From se formulae and from enthalpy data
for N,N'-dimethylethylenediamine protonation, the ~EP of
protonation of atom N* in the model compound I can be

98
estimated
I
The enthalpy of protonation of dimethylamine is -12.04 kcal
1-1 124 mo , (The calculation has been performed -1 kcal mol
for con stency with references 124 and 127) while 6H1 for
N,N'-dimethylethyl amine is -10.74 kcal mol-1 121 (and
Table 6.6). Therefore,the ect of a OH2NHOH3 substituent
ces the -6lf for protonation of dimethylamine by
+12.04- (+10.74) 1.3 kcal mol-1 = 6(0H2NHOH
3). The
formula proposed by Paoletti and coworkers127 for predicting
the enthalpy changes for diamine protonation is
-6H 6H(NH2 ) + 2:: (~)n-1 .6(0) + (~)n-1 .6(NH2 ) + (~)n-1 6(NH3+) n
where n the position of the atom with respect to the
amino group being protonated (numbered in I above), 6H(NH2 )
is an c value for protonation of an NH2 group,
6(0) 0.66 -1 s the effect of a carbon = kcal mol repres
position 1 on the enthalpy of protonation and 6(NH2 ) and
o(NH3+) have similar interpretations. For the compound I
the formula reduces to
-6H = 6H(NH) + ~ (i)n-1 .6(0) + 6(0H2NHOH3) n
in

99
where o(CH2NHCH3
) is the effect of the CH2NHCH3
group on the
enthalpy of protonation of I. ~H(NH) was orted by
Paoletti as 10.8 kcal mol-1 • The term o(CH2NHCH3
) was
obtained as described above. Therefore, by summing the
effects of the carbon atoms in the alkyl chain
10.8 + (1 +1 +~+i+i)0.66- 1.3 kcal mol-1
-1( -1) -6H = 12.06 kcal mol 50.5 kJ mol
(The formula report hy Chri en124 gives a value of
-50.8 kJ mol-1 using the same 8(CH2NHCH3
) value.)
Similarly, the second stepwise protonation of the
diamine-dioxime ligand without oxime substituents can be
e ed by calculating the enthalpy of protonation of I
with a proton on the nitrogen atom labelled (a). The effect
of substituent CH2N+HcH3
is estimated from the ~H
values for (CH3
)2NH and for the second protonation of
N,N'-dimethylethylenediamine. The difference between se
-1 values is kcal mol . Using Paoletti's formula the
predicted enthalpy of protonation ( the cation of I) is
-1 ( ) -11.0 kcal mol -46 kJ mo . If can be assumed that
the effect of a CH2NHCH3 substituent is not too different
from a CH2NH-C(CH3
) 2cH2CH2cH3
substituent,then the values of
-50.5 and -46.0 kJ mol-1 will be approximately representative
of the enthalpy changes for the protonation of the model
THE LIBRARY ~\V(!RSITY Of CANTERi\JIY
CHRi£TCHURCH. N.Z.

100
ligand These values could be regarded as upper limit
values for the epwise protonation enthalpies of this
compound.
Effect of Oxime Substituents
Little information on the base weakening effect of an
oxime substituent is available. A recent compilation of
128 Taft o* values does not report a value for the C NOH
function. Wang, Bauman and Murmann8 have determined the
a-amine oximes of the form
CH3 I
c -I NR
/ c II NOH
where R is a hydrogen atom or an alkyl group. A comparison
of this data with that for the corresponding amine without
the oxime substituents would enable the base weakening
I
effect of the C NOH group to be estimated. The data for AO
(R == H in ) and MeAO (R == CH3
) and the data for the
corresponding monoamines calculated using the empirical
formula of Christensen et a1. 124 are given in Table 6.7.

'1 01
Table 6.1
log k -~G(kcal mol-1 ) -~H(kcal mol-1 ) ~sc e. u.)
AO 9.09 12.4 12.7 -1
amine 10.74 14.65 14.58 +.3
MeAO 9.24 12.6 10.3 8
amine 11.05 15.07 13.3 5.9
The base weakening effect (the difference in the log k
values) is 1.65 from the AO data ru1d 1.8 from the MeAO data.
Substituent effects diminish with distance from
basic centre; a transmission factor of 0.50 per carbon atom
in the chain has previously been used123. Assuming that the
log k values for N ,N'-dimethylethylenediamine would be
s lar to those for the diamine-dioxime ligand without the
oxime substituents, then using a base weakening effect of
0.8, dieted log k values for the diamine-dioxime
l and at I = 0.00 M would be 9.2 and 6.0 which agree well
with the measured values (see Table 6.4) of 9.35 and 5.89.
]]ntha1J2.;y:_Change_£
For most carbon and nitrogen substituted 1,2-diamino
ethanes -~H1 for the first stepwise protonation of the
diamine is larger than -~H2 , the enthalpy of protonation for
the diaminemonocation5, 124 • From a consideration of the
electrostatics of protonation,this d~fference is not

102
uner_pected129. Naturally enough, these differences between
are dependent on the substituents on the amine.
For exarnple,for ethylenediamine the difference is 2.8 kJ
mol-~ for N,N'-dimethylethylenediamine 5.9kJ mol-1 (Table
6.6) and for N,N,N' ,N'-tetramethylethylenediamine 3.2 kJ
rnol-1 (0.5 M KN03
; ref. 121).
The values calculated for the protonation of the hypo-
the tic diamine-dioxime without the oxime substituents were
-1 A A + 50 and + 46 kJ mol for -uH1 and -uH2 respectively. The
enthalpy data for diamine-dioxime protonation (Table 6.6)
shows that the introduction of the oxime groups caused a
decrease in exothermic enthalpy ch~~ges for both of the
stepwise protonation react relative to those estimated
for the hypothetical diamine compound. Also, for this
diamine-dioxime ligand the values of the stepwise enthalpy
changes for protonation are equal within the estimated
experimental error.
view of the weak basicity of the C =NOH group the
sol vat properties for s group should not be too
dissimilar from those of an OH group. The decrease for -6H2 -1 -1 from +46 kJ mol for the hypothetical amine to 39 kJ mol
for the diamine-dioxime appears reasonable on comparison with
the differences between the enthalpy of protonation of some
~-hydroxyamines59 and the corresponding parent alkyl amines.
-1 However, a difference of 10 kJ mol between -6H1 for the

'103
diamine dioxime ru1d hypothetical amine is slightly larger.
Qualitatively, the low exothermic enthalpy change for
the first stepwise protonation could be interpreted in terms
of an intramolecular hydrogen bonding interaction in the
free ligand between the unprotonated amine nitrogen and the
oxime function. This would have the effect of decreasing
the exothermic enthalpy on protonation, this decrease
depending on the strength of the intramolecular interaction.
Intramolecular hydrogen boncling has often been proposed to
explain anomalies in basicity constants or thermodynamic
prop s 1 30,'131 , although for ligand there are no
apparent anomalies the log k values. Clearly it would be
formation, especi in terms of the definition adopted by
Pimentel and McClellan118 : 11 A hydrogen bond is said to exist
when:
(i) there evidence of a bond, and
(ii) there is evidence that s bond specifically
involves a hydro atom already bonded to another atom. 11
As it is dif cult to accurately assess the hydration
enthalpies of the ions and molecules of the type in these
protonation reactions no attempt was made to obtain ormat-
ion on the gas phase enthalpy changes.

104
scussed Chapter 1 ,the main contribution to the
overall entropy change for protonation amines aqueous
solution arises from the effect of the solvent. For the
reaction L + + ~ LH the entropy change is dependent on the
solvent ordering abilities the species L, H+ and LH+. For
the diamine-dioxime ligand the gem dimethyl groups close
proximity to the amine nitrogens will provide a shielding of
the solvent, to a certain degree, charge on t
prot amine nitrogen. Thus on protonation of the ligand,
liberation of water mo cules from the fie of proton
will contribute a positive entropy change. The contribution
to t entropy change from configurational changes the
ligand are difficult to assess. there was no hydrogen
bonding in the free molecule then on proton:=J.tion a decrease
in entro d t h . t'ff . 68 ld b t d ue o c aln s l enlng wou e expec e .
However, the oxime function was intramolecularly hydrogen
bonded to the then the contribution to the overall
entropy change for the first stepwise protonation might be
expect to be close to zero. entropy changes for the
two epwise protonations are shown in Table 6.6. On
correcting for the statistic term these changes in Table 6.6 I
-1 -1 -1 -1 become 40.5 J mol K and -13.6 J mol K for first
and second epwise protonations respectively. From these
entropy changes it is not possible to obtain insight into

'105
the conformational changes on protonation. For the first
epwise protonation the entropy change is simi to that
for N,N'-dimethylethylenediamine (Table 6.6).
For an ion with two identical charged centres separated
by a distance of > ca. '10A0 the so ordering abilities of
the ion would be approximately twice that of each charged
centre on the ion. However, it can be readily shown that for
an ion with two coincident charged centres the volume of
solvent influenced by this centre wi be 2.8 times as
great as that for a single charged c the
stepwise protonation LH+ + H+ r! LH22+ for N,N'-dimethyl-
ethylenediamine, where the two charge centres in the dication
are separated by only two carbon atoms, the solvent ordering
ability of the dicatio~ will be ater than twice that of
the monocation LH+. The entropy change for this protonation
L1S2° would be expect to be considerably less positive than
that for protonation L +
Table 6.6 shows a difference between L1S1° and L1S 2° for N,N'
dimethylethylenediamine of .9..@:· 42 J mol-1K-1 .
Similarly for the diamine-dioxime protonation reactions
68 ° would be 2 ected to ~e less positive th&~ 681° as the
amine nitrogens are only separated by two carbon atoms.
Also, the predominantly hydrophobic subst s on the
amine nitrogens will undergo a considerable loss of
f . t' l t d t h . t'ff . 68 , 125 h con lgura lona en ropy ue o c aln s l enlng w_en

'1 06
the amine ogens are protonated. Thus, the overall
entropy change ~S2° for the diamine-dioxime ligand would be
expected to be considerably less positive than the ~S'1°
value. The data in Table 6.6 shows that the AS2° fact considerably negative and that the difference
is
0 0 -'1 -'1 between 68'1 and ~82 is ca. 66 J mol K .
6.1.3 Proton Dissociation from an Oxime Group
The proton of an oxime functional group is weakly
acidic,
c N - OH c - + N - 0 + H
To date, most studies of oxime ionisation have been
concerned with the ionisation of vic-dioximes6 '7 or
( 1)
compounds where the oxime 5 '1 attached to an aromatic system '
e.g. in salicylaldoxime. The pK values for the ionisation a
(1) of a few of these oximes are given in Table 6.8. The
values show that the oxime group is very weakly acidic, the
magnitude of the pKa depending on the environment of the
oxime grouping. In the first ionisation of vic-dioximes
there is a possibility of t~ydrogen bonding of the oximato
group with the unionised oxime function, which would increase
the stability of the anion. A similar effect could exist
in salicylaldoxime. Thus it might be ected that the pK
for an olated monoxime group would be larger than the
values found for say, dimethylglyoxime. The pK for acetoxime
has been reported as ca. 12 although no reference to the

Compound
DMG
DMG
DMG
DMG
DNG
Acetoxime
pyridine-2-aldoxime
pyridine-2-aldoxime
salicyladoxime
(a) Reference 134. (b) Reference 6.
TABLE 6.8
The pK for ionisation of a number of oximes a
Method Conditions E!S.1 ---· ... ·····-··-··----
UV spectra 0.1M(aq.NaC1),23°C 10.65
pH water/dioxan-o% dioxan 10.48
pH 50% glyoxan.25°C 12 .. 83
spectra ? 10.57
pH 50%.dioxan 12.84
? ? ..... 12
spectra 0 I = 0 ., 25 C 10.22
pH 0.1(KN03
),24°C 10.02
pH 75% dioxan-water~30°C 11.72
(c) R.G. Charles and H. Freiser, Analyt.Chim.Acta, l2i 101 (1954).
.:2!2 reference
11.9 (a)
- (b)
- (e)
- (d)
- (c)
- (f)
- (g)
- (h)
- (i)
(d) V.M. Sovostina, E.K. Astakhova and V.M. Peshkova, Chem.Abs. 59, 1062a (1963). (e) V.M. Bochkova and V.M. Peshkova, Zhur.Neorg.Khim., 3, 1131 (1958). (f) A.A. Grinberg, A.I. Stetsenko and S.G. Strelin, Russ.J.Inorg.Chem., 13, 569 (1968). (g) Reference 170. --(h) S. Bolton and R.I. Ellin, J.Pharm.Sci., 51, (1962). (i) Reference 132. --

source of this value was given.
Oxime Ionisation in the Diamine-Dioxime Ligru~d
For this ligand there are two possible ionisations
+ and
with equilibrium constants (for protonation) given by
and [LH] lLTIHJ .
Attempts wel..,f'.; made to obtain an approximate e e of
possible ionisation constants for the oxime functions of
this ligand both by pH and U.V. spectral methods.
107
~ethod
In s diarnine-dioxime and the oxime nitrogen atoms
are separated by 10 atoms; thus to a st approximation the
ion is ons would be independent, i.e. k1 ""' k2 . This
approximation t ether with the mf:is.s balance equation for TL
and the e ctroneutrality equation gives three equations in
three unknowns which can be solved to obtain an estimate of
ionisation constant for the oxime function. p[H+] data
in the range 10.5- 12.1 from a titration of a neutral free
ligand ( ) solution with NaOH were analysed in terms of
one constant and no fit to the data could be obtained. A
least squares analysis in terms of the constants k1 and k2 so did not yield to the data.

108
U.V. Spectral Stud;v
The U.V. ctrum of a non-conjugated oxime function is
generally centred the far U.V. below 190 nm, e.g. the
Amax for II - II* transition in cyclohexanone oxime is
equal to 189 nm (e = 7,800) 133. However, the U.V. spectrum
for dimethylglyoxime (conjugated oxime) has an absorption
band at ~230 roo which, on the addition of alkali
rv260 nm1 34 . This shift has been attributed to the
ionisation of one of the oxime groups1 34 .
ts to
:B'or the diamine-dioxime ligand the tail of an intense
sorption band ext to about 240 nm. On the addition
of alkali there was a shift this absorption which caused
the tail to extend to ~270 nm. It was assumed that this
shift was due to an ionisation of the oxime function. In
alkaline solution it was cult to obtain accurate spectra
below rv225 due t~ the intense absorption of the 003 at
218 nm (e rv /10,000) 135.
The measured pH and the absorption spectrum from ca.
220-270 nm for a number of solutions of the free oxime LH2 ,
NaOH and NaCl (I = 0.20 M) were recorded. The results are
shown Table 6.9. To ensure that the absorption due to
the carbonate ion was small, the spectra for a number of
NaOH and NaCl solutions (I = 0.20 M) were also recorded.
Irving Rossotti and Harris136 have reported a method
for the determination of acid dissociation constants from

TABLE 6.9
Data from UV spectra of the diamine-dioxime
I = 0.20M (NaCl) and at 25°C
p[H+]a [NaOH]added Ab -3 -240m 11. 10 A/2.TL
11.603 11.535 0.00674 0.425 2.917 0.865
11.921 11.863 0.01348 0 .. 455 1.371 0.926
12.227 12.175 0.02696 0.518 0.668 1.054
12.524 12.477 0 .. 05393 0.562 0.333 1.144
12.618 12.573 0.06741 0.585 0.267 1.190
12.695 12.652 0,.08089 0.597 0.223 1.215
12.811 12.770 0.10786 0.605 0.1?0 1.231
+ Interpolated from a calibration curve of pH vs. p[H ] me as
which was established using NaOH/NaCl solutions.
b 4 -4 Concentration of diamine-dioxime is 2. 57
x 10 M, cell path
length = 1 em.

I
' x

109
absonbance measurements, without prior knowledge of the
extinction coefficients for the species involved. It is
assumed tl~t in the ligand the two oxime functions are com
pletely indepenclent. Consider a monooxime species HL which
on ionisation gives the species L- and H+; the absorbance
of the solution is given by As= £(s0
[L] + s1[BL] + [H])
where£ the p length and s0
, s1 , sHare the extinction
coefficients of the species L, HL and H re ectively. A
quantity ~ is now defined
where
As - tsn[H] E: = TL £
so + s1 ~1 [H] 1 + ~1 [Hj
~ 1 [HL]/[L][H].
The condition that a2 ~/a(pH) 2 = 0 is that log ~1 = pH136 ,
i.e. the pH is equal to the :pK for the ionisation of HL.
Thus from a plot of ~ against :pH the value of the :pH where
the slope of the curve is greatest equal to the pK for
the ionisation. Such a plot, along with the estimated point
of maximum slope, shown in . 6.3. Although the data is
not particularly accurate, at least a lower limit to the pK
can be estimated. The value of 12.3± .2 is considerably larger
than that for DMG and does compare favourably with the value
reported for acetoxime.

110
The magnitude of this pK for the oxime function also
imp s that under the conditions for study of the copper
complexes the equilibrium (1) is not important (see Chapter
7).
6.2 PROTONATION OF THE TETRAAMINE.S 3,2,3-tet AND hm-3,2,3-tet
6. 2.1 Results
Data from the pH titrations of the amines are shown
Tables 6.10 and 6.11. Only one titration from a set of
reproducible ti trations has been reported. 1J.1he data are
also graphically represented Figs 6.4 and 6.5. The
formation curve for 3,2,3-tet in . 6.4 shows only one
marked po of lexion -n = 3 while that for hm-3,2,
--tet in Fig. 6.5 shows two at n 3 and n = 2. The differ-
ences between the two formation curves indicate different
stepwise basicities for the two ligands.
The protonation of each tetraamine can be represented
by four~epwise equilibria;
LH 2+ + 2
with concentration
k1 = -rOO Hl k2
The quotients k1,
quotients
[LH2 ] [LH][HJ
k 2 , k3
and
+
given by
k3 [LH
3]
k4 = [LH4 ]
[LH2 ] [H J [LH3
] [HJ
k4 were calculated as described

0 .....,
I 0)
,_., 1
-cr: z 0 (_
() cr Q
_ 0
) LJ z l-1
:L ~
cr .
0~ (,C
) 1--
0'> Ld j~
u.. (')
f', N
(')
(t: 0 LL
(0
lf)
0

,._ .l--
0 0
,_, I
'""""' "
0 II ~-~
"' -r
L
_
0 1-i
1-
([ OJ
z 0 1-.
0 er: Q.
LJ z
(fJ 1--1
r ([
CY: ll')
r--Ld
I.CI
!--(Y
)
.21 (',j
u.. (') 2: I cr 0 lL
([)
l0
-~-~=---~------------~-~-,,~_,~ '.]•
"0 0

TABLE 6.10
pH titration dataa from the hm-3,2,3 tet/HCl system
titrated with NaOH at 25°C and 0.,10M (NaCl)
Volume n p[H+] Volume - p[H+] n
0.,010 3.852 4.128 0.110 1.957 8.970
0.,015 3.782 4.338 0.115 1.873 9.265
0.,020 3.699 4.530 0.120 1.793 9.476
0.025 3.610 4.706 0.125 1. 717 9.640
0.030 3.517 4.871 0.130 1 .. 643 9.768
0.035 3.422 5.037 0.135 1.573 9.877
0.040 3.326 5.217 0.140 1.505 9.973
0.045 3.229 5.424 0.150 1.378 10.133
0.050 3.132 5.684 0.160 1.265 10.271
0.055 3.034 6.067 0.170 1.166 10.389
0.060 2.935 6.557 0.180 1.077 10.490
0.065 2.836 6.921 0.190 1.002 10.582
0.070 2.736 7.174 0.200 0.937 10.663
0 .. 075 2.637 7-375 0.210 0.881 10.735
o.o8o 2.538 7.552 0.220 o.833 10.801
0.085 2.439 7.722 0 .. 230 0.778 10.855
0.090 2.340 7.896 0.250 0.687 10.952
o.o9o 2.241 8.090 0.270 o.6o8 11.034
0.100 2.143 8.321 0.290 0.539 11.105
0.105 2.048 8.621
a Solution composition: TL = 9.640 x 10- 4M, TH = 3.979 X 10⁻³M,
Initial volume = 49.94 ml and titrant [NaOH] = 0.9569M.

TABLE 6,11
Representative dataa from the titrations of 1,5,8,12-tetraazadodeoane/HCl
solutions b against NaOH at ionic strengths of 0,20, 0,15, 0;10 and 0,04 M, NaCl media
I = 0,04 I 0,10 I 0.15 I 0.20
NaOH -c p[H+]d NaOH - p[H+] NaOH p[H+] NaOH p(H+] !! !! n !! tiiiiT tiiiiT tiiiiT tiiiiT
.215 3.832 4.689 .160 3.826 4.938 .160 3.827 5.000 .160 3.828 5.057
.220 3.723 4.920 .170 3.632 5.329 .170 3.633 5·399 .170 3.634 5.461
.223 }.656 5.048 ·175 3.534 5.503 .180 3.436 5.750 .180 3.436 5.816
.226 3.588 5.171 .180 3.435 5.679 .190 3.237 6.173 .190 3.238 6.568
.233 3.427 5,1f61 .185 3·336 5.876 .zoo 3.038 6.935 .zoo 3.038 7.033
.240 3.265 5.808 .190 3.237 6.116 .210 2,840 7.681 .210 2.840 7.745
.250 3.033 6.743 .200 3.038 6.925 .220 2.641 8,082 .220 2.642 8.138
.260 2.800 7.552 .210 2.839 7.637 .230 2.444 8.392 .230 2.444 8.445
.270 2.568 7.979 .215 2.740 7.851 .240 2. 21+8 8.685 .240 2.249 8.734
.280 2.336 8.339 .220 2.641 8.026 .250 2.056 8.978 .250 2.058 9.020
.285 2.220 8.524 .230 2.443 8.338 .260 1.870 9.257 .260 1.873 9.291
.290 2,106 8.714 .235 2.345 8.485 .270 1.691 9.493 .270 1.696 9.521
.300 1.882 9.089 .240 2.247 8.636 ,280 1.519 9.688 .280 1.527 9.711
.}10 1.665 9.396 .245 2.150 8.789 .290 1.356 9.854 .290 1.366 9.873
.}15 1.560 9.525 .250 2.054 8.941 .300 1.200 8.994 .300 1.213 10.014
.320 1.457 9.640 .255 1.959 9.088 .310 1.059 10.129 .310 1.072 10. 141
.330 1.259 9.844 .260 1.866 9.227 .320 0.926 10.252 .320 0.945 '10.261
.340 1.072 10,020 .270 1.686 9.468 ·330 0.810 10.364 .330 0.830 10.369 -350 0,902 10.183 .280 1.512 9.667 .340 0,707 10,465 .340 0.729 10.468 .360 0.753 10.333 .290 1,345 9.836 -350 0,622 10.562 ·350 0.645 10.560 .370 0,629 10. ~ 73 .300 1.187 9.984 .360 0.550 10.649 .360 0.573 10.644 .380 0.527 10.597 .310 1,,041 10.120 .370 0.496 10.730 .370 0.514 10.721 .390 0.451 10.709 .320 0.907 10.245 .380 0,446 10.801 .380 0.466 10.791 ,400 0.}88 10,806 .330 0,788 10,361 ,400 0.392 10.911
.340 0,684 10.468 ·350 0,600 10.569 .360 0.528 10.659 .380 0,428 10.817
a The logk values reported in Table 3.6 the average values obtained from a are number of titrations.
b Composition of solutions: I = 0,04; (NaOH] = 1, 268H, TH 6 -3 1.088 x 10⁻³M, 9. 53 x 10 M, TB = initial volume = 49.9 mls, I = 0,10, 0,15, 0,20; [NaOH] 1.269M, TH = 7,752 x 10-3M,
TB = 1,103 x 10-3M, initial volume= 49.9 mls, c n is the degree of formation. d p[H+l values were calculated from the calibration curve.

in Chapter 4. The results (log k. values) and their ' l
estimated uncerta'inties are shown in Table 6.15. For 3,2,
tet thermodynamic constants kn° have also been calculated
(Table 3.6), however the data at I= 0.10 M has been used in
the discussion as thermodynamic data for related ligands are
scarce.
Data from the calorimetric titrations of the amines
with standard HCl are shown in Tables 6.12 and 6.13. Tables
6.12 ru1.d 6.13 show the solution composition data (calculation
procedure Chapter 5) for the titrations of 3,2,3-tet and
bm-3,2,3-tet respectively. Tables 6.1 and 6.13a
at changes and the differences in solution composition
between successive titration points for the titrations of
3, 2, 3-tet and bm-3, 2, 3-tet respectively. these tables ·.~
are the measured heat changes, corrected for of
dilution of HCl, ru1.d Qcorr are the ~ values,corrected for
the secondary reaction H+ + OH- -4 ~O,L\.H0 = -55.84 kJ mol-1
The Qcalc values are the s calculated from the least
squares calculation of the stepwise enthalpy changes (see
page 77 , Chapter 5).
The enthalpy, entropy and e energy changes for the
stepwise protonation reactions at I 0.10 (NaCl) and 25°C
for the ligands 3,2,3-tet and hm-3,2,3-tet are given in
Table 6.15.

o.ooo 0.270 0.530 0,805 1.075 1.325 1.605 1.905 2.235 2.585
0.270d 0.530 0.790 1.070 1.330 1.610 1.920 2.250 2.620
o.oooe 0.290 0.570 0,860 1,160 1.470
TABLE 6.12
Calorimetric data from titrationsa of 3,2,3-tet with HCl at 25°C
10.898 10.626 10.352 10.054 9.735 9.371 8.842 8.248 7.227 5.754
10.626 10.352 10.071 9.741 9.363 8.832 8.217 7.133 5.673
9.817 9.402 8.864 8.276 7.423 5.921
n
0.337 0.536 0.794 1.109 1.439 1.755 2.117 2.510 2.944 3.405
0.536 0.794 1.091 1. 433 1. 762 2.124 2.530 2.964 3.451
1.358 1.732 2.102 2.492 2.896 3.314
0,26006 0.19845 0.13064 0,06819 0.02664 0,00696 0,00065 0,00003 0,00000 0,00000
0.19845 0.13064 0.07113 0,02721 0,00673 0,00062 0.00002 o.ooooo 0,00000
0.03477 0.00786 0,00073 0.00003 0,00000 0,00000
LH (miiiOl)
0.11137 0.15904 0.19701 0,20382 0,16623 0.10028 0.03181 0;00529 0,00008 o.ooooo
0.15904 0,19701 0.20460 0.16730 o.o9883 0,03099 0.00475 0,00005 0,00000
0.17933 0,10563 0,03371 0,00583 0,00020 0,00000
0,00829 0,02215 0,05163 0,10587 0.18025 0.25119 0,26974 0.17584 0,02899 0,00064
0,02215 0,05163 0.10228 0.17875 0.25235 0.26899 0.16949 0,02357 o.oo049
0.16076 0.24673 0.27129 0,18168 0.04393 0,00108
LH3 (mmol)
0.00002 0,00010 o.ooo46 0,00186 o.oo662 0.02132 0.07750 0.19816 0.34276 0.22486
0,00010 0,00046 0,00173 o.oo647 0,02183 0,07910 0.20500 0.34620 0.20768
o.oo488 0,01953 0,07397 0.19181 0.33076 0.25824
LH4 (mmol)
0,00000 o.ooooo 0,00000 0,00000 o.ooooo o.ooooo o.ooooL+ o.ooo44 0,00790 0.15425
0,00000 o.ooooo 0.00000 0,00000 0,00000 0,00005 0,00048 0,00991 0.17157
0,00000 o.ooooo 0.00004 0,00039 0,00486 0.120it2
a Initial solution composition:- Titrations 1 and 2; T = 3.842 x 10⁻³M, T = 0,0• initial volume = 98.84 ml, titrant HCl = 0.5002M, Titration 3; TL = 3.84~ x 1o-3M, TH = 5,108 x 1o-3M, initial volume 98.84 ml, titrant HCl = 0.5128M.
b Cumulative volume of HCl added at each titration point.
c Values for all ligand species are the number of mmoles of each titration point.
d Titration 2,
e Titration 3.

TABLE 6.12a
Changes in composition and the heat changes for 3,2,3-tet/HCl
R(LH)a
0.06161 0.06781 0.06245 0.04155 0.01968 0.00631 0.00062 0.00003 o.ooooo
0.06781 0.05952 0.04391 0.02049 0.00611 o.ooo6o 0.00002 0.,00000
0.02691 0.00713 0.00070 0.,00003 o.ooooo
S(LH2)
0.01394 0.02984 0.05564 0.07914 0.08564 0.07477 0.02715 0.00523 o.oooo8
0.02984 0.05193 0.08121 o.o8896 0.07394 0.02684 0.00472 0.00005
0.10062 0.07904 0.02858 0.00567 0.00020
T(LH3
)
o.oooo8 0.00035 0.00140 0.00476 0.01470 0.05622 0.12105 0.15207 0.02844
0.00035 0.00127 0.00474 0.01537 0.05730 0.12634 0.15064 0.02314
0.01465 0.05448 0.11820 0.14341 0.04305
titrations
U(LH4)
o.ooooo o.ooooo o.ooooo o .. ooooo o.ooooo o.oooo4 0.00039 0.00747 0.14635
o.ooooo o.ooooo o.ooooo o.ooooo 0.00004 o.ooo44 0.00943 0.16165
o.ooooo o.oooo4 0.00036 o.oo446 0.11557
Q b m
7.233 6.857 7.171 7.000 6.353 6.729 6.725 7.045 6.257
6.842 6.792 7.267 6.648 6.771 6.986 6.993 6.463
7 .. 621 6.967 6.688 6.658 5.876
3.914 5.067 6.162 6.463 6.072 6.577 6.678 7·030 6.255
5·052 5.824 6.697 6.356 6.622 6.939 6.979 6.462
7.256 6.805 6.639 6.643 5.874
b Qcalc
3.908 5.064 6.170 6.453 6.089 6.626 6.671 7.082 6.210
5.064 5.820 6.681 6.332 6.619 6.884 7.061 6.501
7.236 6.815 6,.625 6.630 5.799
a Values are the changes in the number of mmoles between
successive titration points (as recorded in Table 6.12;
calculations described Chapter 5).
b Defined in text.

TABLE 6,13
Calorimetric data from t itrationsa of hm-3,2,3-tet with HCl at 25°C
Vol.b p(H+] !1 Lc LH l:!!2 LH3 LH4 Tiiil> (mmol) ( mmol) (mmol) (mmol) (mmol)
0,000 11.220 0.470 0,24997 0,18492 0,01276 o.ooooo 0,00000 0.300 11,037 0,608 0.19916 0.22482 0.02366 0,00001 0,00000 0,580 10.829 0.779 0,14301 0,26040 0,04421 0.00003 0,00000 0,860 10.582 0.994 0,08630 0,27784 0,08341 0,00009 o.ooooo 1.130 10.301 1.237 0,04198 0.25777 0,14759 0,00030 0,00000 1,400 9.965 1.507 0,01447 0,19273 0.23938 0,00107 0,00000 1.675 9.471 1.799 0,00217 0.09037 0.35023 0,00487 0,00000 1.945 8.465 2.099 0,00002 0,00978 0.38381 0.05402 0,00001 2.220 7.761 2.413 o.ooooo 0,00131 0,26043 0.18565 0,00026 2.520 7.133 2·756 0,00000 0,00013 0,11074 0.33481 0,00197
Titration 2 0,000 11.221 0.470 0.24988 0,18456 0,01271 0,00000 0,00000 0.275 11.054 0,594 0,20381 0,22099 0,02234 0,00001 0,00000 0.545 10.858 0.755 0,15031 0.25612 0.04070 0,00002 0,00000 0,820 10,620 0.960 0.09404 0.27697 0,07607 0,00007 0,00000 1.090 10.346 1.199 0,04758 0.26337 0.13595 0.00025 o.ooooo 1.360 10,021 1.466 0.01748 0,20486 0.22394 o.ooo88 0,00000 1.630 9.574 1.751 0,00331 0.10852 0.33168 0.00364 0,00000 1.910 8.602 2.059 o.oooo4 0,01372 0.39301 0,04036 0,00001 2.200 ?.Boo 2.391 o.ooooo 0,00148 0.26968 0,17576 0,00022 2.510 7.131 2.758 0,00000 0,00013 0.11014 0.33490 0,00198 2.869 5.632 3.147 o.ooooo 0,00000 0,00390 0.37367 0,06958 3.210 4,822 3.545 o.ooooo o.ooooo 0,00033 0,20264 0,24418
Titi'ation 3 o·.ooo 11,062 0.588 0.18416 0.19608 0.01947 0,00001 0,00000 0.269 10.856 0.757 0,13380 0,22926 0.03663 0,00002 0,00000 0.540 10,602 0.976 0.08067 0,24792 0.07105 0,00007 o.ooooo 0,810 10.297 1.241 0,03704 0.22961• 0,13275 0,00028 o.ooooo 1.090 9.903 1.552 0,01038 0.15953 0.22862 0,00117 o.ooooo 1.360 9.282 1.873 0,00087 0.05606 0.33557 0.00720 o.ooooo 1.635 8.139 2.219 o.ooooo 0,00366 0.30493 0.09106 0,00005 1.940 7.422 2.610 0,00000 0.00036 0.15600 0.24261 0,00073 2.250 6,220 3.007 o.ooooo 0,00000 0,01481 0,36720 0.01770 2.570 5.047 3.416 o.ooooo 0,00000 0.00063 0.23233 0,16675
Titration 4 o.ooo 8.824 2,002 0.00012 0,02257 0.38772 0,02389 0,00000 0.280 7.908 2.331 0,00000 0,00203 0.28668 0.14546 0,00014 0.570 ?.305 2.673 0,00000 0,00025 0,14262 0.29028 0,00115 0,870 6.115 3.027 0,00000 0,00000 0,01260 0.39734 0,02436 1.210 5.027 3.427 o.ooooo o.ooooo 0,00064 0.24777 0,18589
a Initial solution composition:_ Titration 1, T1 = 4.529 x 10⁻³H, TH =-0.591 X 10⁻³M; Titration 2, TL 4.524 x 10⁻³H, TH =-0,599 x 1Q-3H; Titration 3, TL "' 4,044 x 10-3M, TH = 0,482 x 10-311; Titration 4, TL = 4.394 x 10⁻³}1, TH 8.788 x 10⁻³H, For the foi.tr titrati6ns; titrant [HCl] " 0,5128 and initial volume = 98.84 ml.
b Cumulative volume of HCl added at each titration point. c Values for all ligand species are the number of mmoles at each titration point.

TABLE 6.13a
Changes in composition and the heat changes for hm-3,2,3-tet/HCl titrations
R(LH)a S(LH2) T(LH3
) U(LH4) 9. b b b m 2corr 2calc
(mmol) (mmol) (mmol) (mmol) (J) (J) (J)
0.05081 0.01091 0,00001 0,00000 8.381 3.236 3.181 0.05615 0,02057 0,00002 0,00000 7.663 3.926 3.968 0.05671 0,03926 o.oooo6 o.ooooo 7.620 4.964 4.990 0.04431 0.06438 0,00021 0,00000 7·381 5·731 5.694 0.02751 0,09256 0,00076 o.ooooo 7.529 0,01229 0,11465 0,00380 0,00000 7.476 6.902 6.886 0,00215 0,08274 0.04916 0,00001 6.954 6.709 6.779 0,00002 0,00849 0,13187 0,00024 6.578 6.556 6.576 o.ooooo 0,00118 0.15087 0,00171 7.080 7.076 7.117
o.o46o6 0,00964 0,00001 0,00000 7.643 2.877 2.871 0.05350 0,01837 0,00002 o.ooooo 7.387 3.669 3.715 0.05627 0,03543 0,00005 0,00000 7.459 4.707 4.763 0.04646 0,06006 0,00018 o.ooooo 7.363 5.589 5.573 0.03010 0,08861 0,00063 0,00000 7.369 6.301 6.270 0.01416 0.11050 0,00276 0,00000 7.335 6,719 6.714 0,00327 0,09807 0,03674 0,00001 7.324 7.016 7.072 0,00004 0.01228 0.13561 0,00021 ?.026 6.995 6.950 0,00000 0,00135 0,16090 0.00176 7.589 7.584 7.593 0,00000 0,00013 0,10637 0.06760 6.921 o.ooooo 0,00000 0,00357 0,17460 5.967 5.967 5.972
0.05036 0,01718 0.00001 0,00000 7.463 3.531 3.491 0,05313 0,03447 0,00005 o.ooooo 7.362 4.496 4.552 0.04363 0.06191 0,00020 o.ooooo 7,1105 5·577 5.527 0,02666 0,0967? 0,00090 0,00000 7.679 6.603 6.539 0,00951 0,11298 0.00603 0,00000 7.311 6.?56 6.?58 0,00087 0.05327 0,08391 0,00005 6.876 6.713 6.763 0.00000 0,00331 0.15223 o.ooo68 ?.298 7.288 ?.258 0,00000 0.00036 0,111155 0,01696 6.929 o.ooooo o.ooooo 0,01418 0.14906 5.545 5.545 5.615
0,00012 0.02066 0,12171 0.00014 6.853 6,800 6.752 0,00000 0,00178 0.14583 0,00100 6.968 6.962 6.891 o.ooooo 0,00025 0,13028 0.02321 6.776 6.774 6.827 o.ooooo o.ooooo 0.01196 0,16153 6,003 6,003 5.926
a Tabulated values are the changes in the number of mmoles of each species between successive titr~;~.tion points,
b Defined in text,

112
6.2.2 Discussion
Logk Values
The logk data for stepwise protonation of 3,2,3-tet and
hm-3,2,3-tet (Table 6.15) show that the overall basicities 4
( l: (logk.)) 1 l
.of the two ligands are similar. However, the
data indicates that this similarity in basic is due to a
compensation of the differences between the logki values for
each of the ligands.
The free energy change on protonation of an amine
nitrogen the presence of a charge (or a dipole) elsewhere
in the molecule will decrease as the stance the charge
(or dipole) from the protonation centre increases127. For
the methylenediamines NH2 (cH2 )nNH2 ,both logk1 and logk2
increase as n increases from n "' 2 (ethylenediamine) to n "' 6
(hexamethylenediamine) 127. Similarly, a comparison of the
data for diethylenetriamine (dien) and dipropylenetriamine
(dpt) 106 (Table 6.16) shows that the overall basicity for
dpt, which has a chain of three methylene groups joining
each amine nitrogen is greater than that for dien which has
two methylene groups separating each nitrogen atom. Linear
tetramines have three methylene chains joining the four
amine nitrogen atoms. Thus the predicted basicity sequence 4
( 2: logk.) for the tetraamines with a combination of two and 1 l
three membered methylene chains would be
3,3,3 > 3,3,2 ~ 3,2,3 > 2,2,3 ~ 2,3,2 > 2,2,2

TABLE 6.15
Thermodynamica data for the stepwise protonation of 3,2,3-tet and
hm-3,2,3-tet in aqueous solution, 25°C, I= 0.10M
1,5,8,12-tetraazadodecane (3,2,3-tet.)
Reaction lo~n -taG kJmole-1 -AH kJmol -1
+ 10.53 ± 0.02 60.10 ± 0.1 51.68:!: o. 1. L + H ~ ~
~ LH22+ 9 .. 77 ± 0.02 55.76 :!: 0.1 + 2. + 51.80 - 0.,20 3. LH
22+ + ~ LH
33+ 8 .. 30 :t 0.02 47.37 ± 0.1 +
.18 - o. 4. LH
33+ + H+ ~ LH
44+ + 31*90 ± 0.06
+ 5-59 - 0.01 34.16 - 0.13
34.19 195.13 180.82
2 2 11-diamino-4 2 4 2 9 2 9-tetrameth~l-5 1 8-diazadodecane (hm-3 22 23-tet)
Reaction log k -1 Ali -1 -D.G kJmol - kJmol n + ~ LH+ 11.090 ± 0 .. 03 63.29 ± 0.17 51 .. 22 ± 0.12 1. L + H
2. LH+ + H+ ~ LH2
2+ + + 53.03 ± 0.30 10.059 - 0 .. 02 57.41 - 0.1
3. LH2
2+ + ~ LH3
3+ 7.614 :!: 0.01 43. ± 0.1 46.38 :!: 0.25 4. LH
33+ + H+ ~ LH
44+ 4.903 :!: 0.01 .98 ! o.o6 33.25 .:!: 0 .. 30
33.67 192.13 183.88
a With reference to a standard state of 0~10M NaCl.
AS Jmol- 1K- 1
28.3 :!" 1.2 + 13.3 - 1.0
14.1 ± 0 .. 8
.6 ! 0.6
48.1
l1!. -1 -1 S Jmol K
+ 40.5 - 1.3
14.6! 1..3
-9.8 ! 1.1
-17.7 ± 1.2
.6

TABLE 6,16
Thermodynamic data for the protonation of some polyamines
~ Chain
~ -/P. kJmol- 1 -L':IH kJmole- 1 M Jmol- 1K- 1 Conditions svstem
1 9.78 55.81 46.07 32.7 trien a (2,2,2) 2 9.06 51.71 47.15 15.3 0,1M KCl
3 6.55 37.38 39.87 -8.4 25°C
~ 4 ~ 18.49 28.58 -33.8
1=1(logki) 28.63
b 1 10.61 tripen (3,3,3) 2 9.98 0.1H NaNo
3 3 8.69 20°C 4 7-35
~ (logk1) 36.63
1 10,25 c (2,3,2) 2 9.50 0,5H KCl
3 7.28 25°C 4 6.02
:S (logk1) _23.05
diend 1 9.79 55.86 46.86 30.2 0.10M KCl
(2,2) 2 8.98 51.25 50.00 4.2 25°C 3 4.25 24.27 }0.12 -19.6
1 10.65 60.79 51.42 31.4 dpte (3,3) 2 9.57 54.60 54.35 0,8 0,1H KCl
3 7·72 44.06 43.80 o.B 25°C
a Triethylinetetramine data from reference 138, b Tripropylenetetramine data from reference 14, c N,N-bis(2-aminoethyl)-1,3-propanediamine data from reference 15. d Diethylenetriamine data from reference 106, e Dipropylenetriamine data from reference 106,

where 2,3,2 is the amine NH2 (
The available data for these tetraamines (Tables 6.15 and
6.16) shows that this predicted sequence is found.
The Empirical Prediction of logk Values
From the macroscopic protonation constants alone
possible protonation sites for the tetraamines cannot be
113
predicted. For each cation n+ there will be an equilibrium
between the possible tautomeric forms; for the monocation
there will be two possible structures, for the dication,
four and two for trication. However, by as the
most likely protonation scheme the protonation constants can
be predicted us empirical rules of Clark and Perrin1
These calrrulations for one possible protonation scheme for
1 5 8 12 NH2CH2 CH2CH2NH CH2 CH2NH CH2CH2CH2NH2
1 • Addition of the first :Qroton on atom 1 (or 12)
(i) Typical pK a for a primary amine 10.77
(ii) Effect of a:..r1 NHR group 3 carbons away - .45
( i) Effect of a NHR 50 and 1N away - .05
(iv) Statistic effect + .3
predicted logk 10.57

2. Addition of the second proton on atom 12 (or 1)
(i) + (ii) + (iii) above
Statistical effect
ect of NH + at other end 3
predicted logk
3. Addition of the third QEOton on at~ (or 8)
(v) Typical pKa for a secondary amine
(vi) Effect of RNH 2 carbons distant
(vii) Effect of NH3
+ 3 carbons distant
Statistical effect
(viii) Effect of NH3
+ 5C and 1N away
predicted logk
10.27
- .3
- .01
9.96
11 .15
- . 9
-1 .8
+ .3
- .22
8.53
4. Addition of the fourth proton on atom 8 (or 5)
(v) + (v.li) + ( i)
feet of RNH+ 2 carbons distant -3.6
Statistical effect - .3
predicted logk 5.23
These rules predict the logk values at 20°0*. The
experimental logk values for 3,2,3-tet at 25°0 (Table 6.14)
were corrected to 20°0 using the enthalpy data Table 6.15.
*There was no mention of ionic strength effects in Clark and Perrin's article123.

TABLE 6.14
The predicted log k. for possible protonation l.
sequences for 3,2,3-tet.
1 5 8 12 NH 2CH
2CH2CH
2NHCH
2CH2NHCH2CH2CH2NH2
Protonation sequences Predicted values
1 2 2. 4 log k 1 log k2 log k
3 log k4
1 12 5 8 10.6 10.0 8.5 5.2
1 8 12 5 10.6 9.6 8.9 5.2
8 1 12 5 10.1 10.1 8.9 5.2
8 12 1 5 10.1 8.4 10.1 5.2
1 8 5 12 10.6 9.6 5·7 8.5
Experimental values
8.4

se corrected values and some predicted pK values for
di erent protonation sequences are shown in Table 6.14.
The values predict from the most probable schemes
(first three in Table 6.14) are similar to the experimental
values. Although agreement between the predicted logk1 ,
assuming protonation on a primary nitrogen and the experi'
mental value is good there is evidence to suggest that
protonation on secondary nitrogen also occurs for s
t stepwise protonation (see later discussion). However,
for hm-3,2,3-tet dieted logki values, which will be
identical to those for 3,2,3-tet, do not show very good
agre_ement with the experimental values. The enthalpy and
entropy changes which contribute to the overall logki value
cate that solvation ects are important (see further
discussion below). ew of the theory behind Clark and
Perrin's empiric rules it is not surprising that the
logki values for hm-3,2,3-tet could not be predicted.
Enthalpy Changes
For the protonation of monoamines the free changes
are slightly more negative for secondary amines than for
primary amines but the enthalpy changes are more exothermic
for primary amines124 Also for ethylenediamine the -.6H1
value at I = .10M (KCl) and 25°C is 49.9 kJ mol-1 1 37 and
that for piperazine, which has two secondary amine trogens,
is 42.6 kJ mol-1 "13S The enthalpy data (Table 6.15) for

116
the tetraamines 3,2,3-tet ruld hm-3,2,3-tet, which have two
secondary two primary amine nitrogens, show that L1H1 is
slightly less exothermic than L1H2 (for 3,2,3-tet the
ence is not statistically icant). This sugge s that
in the first stage of protonation there is a slightly larger
proportion of the protons residing on the secondary nitrogens,
than in the second stage. For the monocation of 3,2,3-tet
there are two possible structures which will be in
equilibrium,
and
For dication there are four possible structures
although it is reasonable to assume that the dominant forms
will be
N+H3
( CH2
) 3
NH( C ) 2
NH( CH2
) 3
N+H3
and
These structures can be formed from the monocation structures
by protonation of a amine nit~ogen. Thus, the
proportion of protonation on a secondary nitrogen atom is
smaller for the second stepwise protonation than for the
first then the value of l'.H2 will be more exothermic than t,H1 .

1"17
The only other available enthalpy data for a linear tetra
amine (trien) show that ~H1 is less exothermic than ~H2 (see
Table 6.16). Similarly, for both the triamines dien and dpt
~H2 is more exothermic than ~H1 (see Table 6.16).
For successive protonations of these tetraamines charge
repulsion will lead to a decrease the exothermic heat of
protonation. As the distance between the charges creases
this electrost c interaction will decrease and a more
exothermic enthalpy change will result. The -~H3 and -~H4 values for trien (Table 6.16) are smaller than those for
both 3,2,3-tet and hm-3,2,3-tet.
For the fourth e protonation of 3,2,3-tet proton-
ation of
be dominruLt reaction. As charges of closest
proximity to the protonation site will be of greatest
importance it might be expected that -~H4 for 3,2,3-tet
would lie between the value for dien and value for dpt.
The data in Tables 6.15 and 6.16 show that -~H4 increases in
the order dien < 3,2,3-tet < dpt.
The enthalpy data for 3,2,3-tet and hm-3,2,3-tet
(Table 6.15) show that the differences between the stepwise
enthalpy changes for these tetraamines are slight. The
change for the overall reaction L + 4H+ ~ LH44+
(I: L::,H.) is only 3 kJ mol-1 more exothermic for hm-3,2,3 et . l l
than for 3,2,3-tet. As discussed earlier (chapter 1) any

118
enthalpy change can be separated into a phase term a..nd
hydration enthalpies of the species involved. The inductive
effect of t methyl subSituents on hm-3,2,3-tet will
increase the ectron density on the nitrogen atoms which
would produce more exothermic gas phase enthalpy changes
than that for 3,2,3-tet. However, these methyl substituents
will so shie the solvent from the charge centres which
will lead to a decrease in the hydration enthalpy of the
cations. Thus, as there no marked difference between
the epwise enthalpies for 3,2,3-tet and hm-3,2,3-tet,it
would appear that these two effects are largely compensatory.
This effect has also been observed for somec~-alkyl
substituted ethylenediamines8 7.
The data in Tab 6.15 show that the differences in
logk1 and logk4 for 3,2,3-tet and hm-3,2,3-tet are predom
inantly the result of the entropy differenc~s while those
differences for logk3 and logk2 result from contributions
from both the entropy and enthalpy differences.
Entropy Changes
The entropy change for the protonation of alkyl mono-
amines increases in order RNH2
< R2NH < R3
N; for R
th l . . ( -1 -1) me ~Y there lS an almost constant lncrease ca. 20 Jmol K
. . f . t d t t t• 126 A ln passlng rom prlmary o secon ary o er lary .
similar trend has so been observed for the diamines
ethylenediamine (primary), piperaz (secondary) and

119
thylenediamine (tertiar.y) 139. This change has been
attributed to (i) solvent exclusion from t charge on the
amine as amine hydrogens are successively replaced by alkyl
groups126 or (ii) as a decreased ability of the amine cation
to hydrogen bond to the solvent as the amine hydrogens are 140 replaced by alkyl groups .
Tables 6.15 and .6.16 show that the stepwise
protonation entropy change LlS1 for the trien, en,
dpt and 3,2,3-tet are all of similar magnitude (the values
vary from a est of 28.3 to a large
These values between the LlS1 value for ethyl amine
(2 primary nitrogens) of 23.8 J mol-1K-1 and that for
piperaz (2 secondary
This ests that for these tri and tetrt>amines the
protonation for the first stepwise process occurs neither
exclusively on a primary nor a secondary nitrogen atom.
This evidence supports the conclusions drawn from the
enthalpy data discussed above.
The LlS1 value for hm-3,2,3
higher than that for 3,2,3-tet (Table 6.15). The s methyl
substituents of the former amine are an arrangement (see
Fig~ 1.1) which is likely to result in shielding of the
solvent from any charge on the secondary amines. This will
lead to a larger entropy (LlS1 ) change for hm-3,2,
relative to that for 3,2,3-tet due to the decreased

'120
ctrostriction of the solvent by the charge on the ion.
For subsequent epwise protonations interpretation of the
entropy s difficult because of the large number
cies in tautomeric equilibrium. These entropy changes
will be a summation of contributions from configuration
entropy changes of the molecules and ions and from changes
the solvent ordering ability of these molecules and ions.
The entropy data in Table 6.15 shows that changes
for the third and fourth protonation reactions for hm-3,2,3-
tet are more negative than those for 3,2,3-tet. Relative to
3,2,3-tet the solvent ordering ability of hm-3,2,3-tet wi
be decreased to the elding effect of the s.ix methyl
substituents. This will lead to a more positive entropy
change. However, the hm-3,2,3-tet molecule has a greater
internal entropy than has 3,2, et; a larger number of
configurational degrees of freedom se from the additional
s methyl substituents. Successive protonations for hm-
3,2,3-tet will thus lead to a er conf ational
entropy loss t for 3,2,3-tet. As the third and
fourth entropy changes for hm-3,2,3-tet are more negative
than those for 3,2,3-tet it would appear that the loss of
configurational entropy dominant over decreased
solvent ordering ability.

121
6.3 PROTONATION OF THE DIAMINE-DIKETONE LIGAND
6. 3 .1 Results
This ligand (Fig. 1.1) has two secondary amine functions
ru1d two ketone groups. The constants for amine protonation
were determined, however no attempt was made to measure the
basicity of the very weakly basic ketone fQnctions141 , 142 .
p [H+] data from the titrat of NaOH against
so ions of the diamine-diketone ligand and d are shown
Table 6.17. solutions of ligand decomposed quite
rapidly (s on 6.3.3) the approach used to obtain data
was ightly differ from that previously described. A
solution of the ligand dihydroperchlorate salt water
decomposed owly enough for a stock solution; to be used for
titrations. Data in the pH range 5 to 6.7 were obtained by
the normal titration method. At each titration po
solution pH rapidly attained a constant value, which was
readily reproducible to within the 1.1sual error limits.
However, in the alkal region ( 8-10) the solution pH
decreased at a rate of approximately 0.005 pH/minute. This
drift was associated with a very large increase the rate
of decompos on of the and (see section 6.3.3). For any
one tration only two or three measurements were made in
alkaline region; the pH value at 30-45 seconds after the
addition of the titrant increment was recorded. For the
final point from a titration a plot of pH against time (over

pH titration data from titrationsa of the diamine-diketone
ligand with NaOH at 25°C and I= 0.10M (NaCl)
Vol. - p[H+] - p[H+] n n
o .. o4o 1 .. 772 5.661 0.230 0.738 8.957
o.o6o 1.662 5.892 0.240 0.689 9.060
0 .. 070 1.607 5.996 0.250 0.641 9.157
0.090 1.495 6.190 0.260 0.593 9.240
0.100 1.440 6.293 0.270 0.547 9.326
0.120 1.328 6.499 0.290 0.460 9.479
0.130 1.273 6.625 0.310 0.380 9.623
0.140 1.217 6.756 0.320 0.345 9.695
0.150 1.161 6.918 0.340 0.280 9.826
0.210 0.840 8.712 0.350 0.255 9.894
0.220 0.788 8.841 0.360 0.230 9.953
a Data collected as described in the text. Solution composition:
-3 6 -4 TH = 1.219 x 10 M, TL = .096 x 10 M, initial volume=
49.94 ml and titrant [NaOH] = 0.1702M.

'122
about 5 minutes) was recorded, from which pH at time of
addition was obtained by a short extrapolation. Both of
se methods gave identical pH values, within the experim
ental error. Thus, the titration data in Table 6."17 were
obtained from a number of titrations of samples from one
stock solution. The reproducibility of s data was checked
by comparison with the (n, p[H+]) data obtained us a
different stock solution.
The protonation constants for the ligand, calculated
using the least squares procedure (Chapter 4) are sho~l in
Table 6.18. As the ligand solutions were not stable (w.r.t.
decomposition), for sufficiently long periods, no calori
metric study was attempted.
6.3.2 Discussion of the logk Data
The structure of the diamine-diketone ligand is identical
to that of the diamine-dioxime ligand except for the
erent terminal functional groups. Any difference between
the logki values for the two ligands could attributed to
the change in the functional grouping. There does not
appear to be any thermodynamic data available that will
enable an assessment of the substituent effects of a C =NOH
and a C 0 function aliphatic systems5.
A comp son of the log data for the diamine-
diketone (Table 6."18) with those for the diamine-dioxime
(Table 6.5) shows that the overall basicity is slightly

n
1
2
Reaction
L + H+ ;::=
TABLE 6.18
Protonation constants for the diamine-diketone ligand
at I = 0.10 (NaCl) and 25°C
log_Js -1 11 -1 -!J.G kJmol - H kJmol n
9.41 .:! 0.03 53-70 ± 0.17
l1S Jmol- 1K- 1
HL+ + ...... H L 2+ ....... 2 6 .. 19 ± 0.02 .. 33 ± 0.1
X
TABLE 6.19 NMR data for the ketone ligand in
a b c d (CH
3COCH
2C(CH
3)
2NHCH
2-)
2
chemical shiftsx (~ppm) Buffer salt added a b c d -
7.77 6.95 8. 6.67
7·76 - 8.65 6. phosphate
7-78 - 8.80 7.18 borax
relative to external TMS
Res. Integral a:b:c:d
1.5:0.75:3:1
1.5: - :3:1
1.5: - :3:1

greater for the diamine-dioxime and that this difference
arises from the larger log k4 for the dioxime ligand.
This slight difference is difficult to assess,
especially as the enthalpy changes for protonation of
diamine-diketone are not available.
6.3.3 Decomposition of the Diamine-Diketone Ligand
It has been report that ~-amino-ketones (not to be
123
confused with ~-imino ketones R1 - NH- CR2 == CR3
- C(=O)
show a tendency to decompose to form an amine and an o:,~
unsaturated carbonyl compound143. The pH of a solution of
the tone dihydroperchlorate salt water was stable to
within ±0. 006 over hours, however the ultraviolet
spectrum of a solution of the and (pH 4.5, TL
10-3M) changed with time. There was an increase
).)5 X
intensity
of an absorption band at 244 nm at a rate of 0.36A/hour.
If this change represented the formation of an o:,~
unsaturated compound then the product from this ligand would
be mesityl oxide ((CH3
) 2 C = CH- C(=O)- CH3). Mesityl oxide
has an absorption at 243 nm144 wi an extinction
ff . · t of 10,000144 . Th · th t d •t coe 1c1en us, assum1ng a· a ecompos1 -
ion to form only mesityl oxide does occur then the rate of
decomposition, was ~· 0.5% per hour. rate of increase
in intensity of the absorption 244 nm was very dependent
on pH. In alkaline solution (pH 9) the rate of decomposition
of the ligand was ££· 0.5% decompo tion in 5 minutes.

124-
Enolisation of Nonconjugated Ketones
sation an aliphatic non-conjugated ketone
group is a slow process, which catalysed by acids
bases145. tautomeric eg_uilibrium constant K - tenol] t - ketone]
low for non-conjugat ketones aqueous solution, e.g.
f t K 0.9 X ~o-6 , f 1 t or ace one __ t ca. 1 or eye open anone, ca.
1.3 X 10⁻⁵ 145.
For the diamine-diketone ligand,the a-methylene protons
did undergo deuterium exchange at a rate dependent on the
solution This suggests the sence of the enol
tautomer. The NMR of the ligand in D2o showed a four pand
spectrum (Table 6.19) which became a three band spectrum
after 24- hrs, as the resonance due to protons b slowly
decreased in ty relative to the others. At
pH (pho e borax salts added to D20) the NMR spectra
(Table 6.19) showed three bands which chang time.
The changes indicated that me tyl oxide was formed (by
comparison with a spectrum of mesityl oxide in D2o) although
was not the only product formed.
The NMR data did not sugge that an enol tautomer was
formed in measurable concentration acid solution
the data alkaline solution indicated that appreciable
decomposition occurred.
The chemical ts for the protons c and d (Table 6.19)
for the diamine-diketone dihydroperchlorate salt in D2o

125
compare favourably wi those for diamine-dioxime
dihydrochloride D2o (~8.58 and 6. ppm, Table 6.1).

'126
FORMATION OF COPPER(II) COMPLEXES rrHE LIGANDS
7. '1 FORMATION COPPER COMPLEXES WITH 3,2,3-tet AND
bm-3,2,3-tet
7.'1.'1 Results for bm-3,2,3-tet
the pH titrations~ solution pH at
po prior to the end point (see . 7.1) d
not att a steady value until about ten minutes the
addition of the titrant After end point, equil-
was d almost inst ously. sugge s
that the f ion the metal igand complex must
kinetically contra ed. from the titrations at two
ferent tot ligand concentrations are shown Table 7. 1.
des crib
was obtained from the measured pH as
in Chapter 3. Only one titration from a s
repro ible titrations en tabulated.
The vi spectrophotometric data from . 1 : 1
ligand so ions c aining HCl/NaOH indi ed that as
of
_solution pH was eased approximately 3 to 11 there
was no change the po tion of absorption, ~ax
(534 nm, I= 0.10 M(NaCl)). sible absorption ectrum
for 1:1 metal: solutions in tartrate, phthalate,
phosphate borax buffer solut also showed no change
in A. ( 5 ± 2). max s visible ectrophotometric data

--.!> ~
~
.:(;
,.J 't
0 £
""': i 2 )I
, r-
~
~
0 ...0
..$) II
«-: ~
-* z:
~
'* 'o
x
"" ,......
~
\(') \r
tri 0
h ~
1-!:
().,
« +
-::t:
-f!!_ 0
"' ;2!.
I <'!
«''
::t "'
eN
~ 1
)-<:<'1~
- o-
t <N
E
0
.J:
~ '+
---0
'-1.\l (j,)
0...
2 E
0....
:::f 0 <.J
0 :>
~
Oo
0 '+
(]) -.!>
:::> !.... :s \.)
-=t c: 0
-+= :::$
~ -1
-f.:=
~
llo
cc -.....
'-" o
, 0
')
u.. cj
r::r ;3.
.,... ()0
r-' ...0
\.0 <;{')
:I: a,_

TABLE 7,1
pH titration and stability constant data for the copper(II)
hm-3,2,3-tet complex at 25°C and I = 0,10M (NaCl)
-3 T1=1,205x10 M, - 3 4 46 - 3 TM:1,192x10 M,TH= • 3x10 M 6 -4 T1= ,037x10 M, 48 -3 -4 TH=2, 3x10 M, TM=5·957x10 M
VOLa p[H+] !!. 1022[1] clog K VOLb p[H+] n 1022[L] ~
0,020 3.435 0,226 0,1075 22.434 0,040 3.497 0.196 0.0985 22.392 0,040 3.488 0.297 0,1585 22.426 0.070 3. 51f 3 0.256 0.1388 22.393 0,060 3-535 0.371 0,2182 22.431 0,100 3.583 0.319 0.1831 22.407 o.oBo 3.583 0,445 0,2986 22.429 0,140 3.642 0.403 0,2750 22.390 0.100 3.631 0.520 0.4009 22.431 0,160 3.670 0,446 0.3294 22.388 0,120 3.689 0.594 0.5758 22.405 0,180 3.695 0.490 0.3810 22,402 0,130 3. 711 0.632 0.6382 22.431 0,200 3.730 0.533 0.4805 22.375 0.140 3.750 0.669 0.8204 22.392 0.220 3.759 0.577 0.5671 22.381 0.150 3.775 0,708 0.9128 22.424 0,240. 3.798 0,620 0.7274 22.351 0,160 3.800 0.746 0.9984 22.469 0,260 3.823 0.666 0,8053 22.394 0.170 3.853 0.783 1.389 22.414 0.290 3.892 0.731 1.220 22.347 0.190 3. 91t6 0.858 2.143 22 ,It 52 0.320 3·955 0.798 1.639 22.381 0.210 4.106 0.350 4.053 0,863 2.753 22.358 0.230 4.587 0.380 4.192 0,235 8.297 0,410 1t,512 0,237 9.314 0,420 4.898 0.240 9.752 0,425 7.616 0,245 10,072 0.4275 8.736 0.250 10.260 0.430 9.105 0.260 10.489 0.435 9.461 0.270 10.643 0.440 9.669 0.280 10.754 0.460 10,084 0.290 10.844 0.500 10.441 o.:;;oo 10.916
log K: mean 22.428 0= 0,02 log K: mean = 22.381 0-:: 0.02
a. Volume of 0.9569H NaOH added to 49.94 ml of a solution of Cu2+, ligand and H+,
b Volume of 0,2919M NaOH added to 49.94 ml. 0 Calculation of log K is described in the text,

127
indicates that the coordination environment around the
central metal ion does not change as the solution pH changes.
This suggests that within the pH range 3 - 11 neither a
hydroxy complex (CuL(OH)+) nor a protonated complex (Cu(HL) 3+)
is formed.
Calculations using the p[H+] data
If it is assumed that only one metal-ligand complex,
CuL2 +, is formed then the mass balance equations for TM' TL
and TH are
[Cu] + [CuL]
and the stability constant K for the formation of CuL, is
K=~clTJJ ~u L ·
As the protonation constants for the ligand were previously
determined, at each titration point the concentration of the
free ligand [L] was determined from equation 7.3. This
value of [LJ was then substituted into equations 7.2 and 7.1
and [Cu] and [CuL] were calculated. From these quantities
the stability constant for the complex was determined using
the data at each titration point. The results of these
calculations, which were performed using a suitable computer

128
program, are shown Table 7.1. n, the degree of formation
of complex CuL,was also calculated. For each titration
the logK values do not show a trend but fluctuate about a
mean value. The mean of the logK values and the andard
deviation of an observation from the mean are shown for each
of the titrations. The difference between the two mean logK
values is not statistically cant. These results
indicate that the pH titration data were readily
terms of one metal ligand complex Cu(L) 2+.
erpretable
Calorimetric Results
The· calorimetric data from the titration of a solution
of hm-3,2,3-tet with copper chloride are shown in Table 7.2.
measurements showed , for the calorimetric titration
conditions (an excess of ligand), the rate of formation of
the copp and complex was faster than for titrations
where the ratio of M : L was ca. 1 : 1 (see Table 7.1).
However, a calorimetric run the recorder trace
showed that complex formation was occurring to a small
extent after the comple on of titrant addition. Thus, the
uncertainty the corrected heat
this ligand system than for other comp
7.1.2 Results for 3,2,3-tet
will be higher for
s studied.
Data from the pH titrations of NaOH against solutions
of copper ions, ligand and acid are shown in Table 7.3. For
each of the metal:ligand ratios only one titration from a

TABLE 7$2
Calorimetric data from the titration of hm-3,2,3-tet/HCl solution
with copper chloride at 25°C and I= 0.10M
VoLa p[H+] Lb HL ~2!:. ~~ CuL (mmol) ( ) (mmol) ) (mmol) (mmol)
o.ooo 10.993 0.19631 0.24526 0.02857 0.000012 o.oooooo 0.000000 0.130 10.916 0.14556 0.21668 0.03008 0.000015 o .. oooooo 0.077818 0.260 10.815 0.09767 0.18437 0.03245 0.000020 o.oooooo 0.155636 0.390 10.663 0.05468 0.14576 0.03623 0.000032 o.oooooo 0.233454 0.530 10.363 0.01696 0.09067 0.04518 0.000081 o.oooooo 0.317258
Changes in composition between successive titration points
b.(LH)c tl(LH2 ) b.(LHf) R(ML) d
~3): .1.H (ML) (~) (mmol) (mmolJ (mmo r (mmol) (kJ mol- 1)
f 0.00151 0.000004 0.077818 8.274 8.158 104.84 -0.02707
-0 .. 02992 0.00238 0.000005 0.077818 8. 8.086 103.91 -0.03483 0.00379 0.000012 0.077818 8.277 8.1 104.59 -0.04609 0.00900 0.000050 0.083804 8.826 8.606 102.69
-+ 104.0 - 0.9
a Volume of 0.5986M copper chloride added to 98.84ml of ligand/acid solution; TL=4.757 X 10⁻³M, = 1.449 X 10⁻³M.
b For each species values are the number of mmoles of each titration point. Calculations are described in Chapter 5.
c For each species values are the changes in the number of mmoles between each titration point. d
Corrected for the heat of dilution of copper chloride. (See Appendix • e Values of Q have been corrected for the lysis and li protonation secondary reactions. f A negative change means LH was dissociating to form L.

E;j 0
"' <r ~
llo
~
1:!
'" "'· ~
"' "' ('()
0 ~
"-II
"l 1-.J
<:<
) z
~
~ ~
<><> 0
E
_;
-II
;:; ~
0 ~
~
E
tr"
-2. '-.(:)
~
.... ::n
~
If>
4-0
+ ~
'l)
I
"" 1E
~~
::::! N
.::::;. en-
--;:-. !::-
Q)
0.... 0
-0 ""
'-" I-~
"' Q
.l
? ::s <
J
~
".:! ~
N
....: ...,
C')
LL.
a o
-' r-'
.....0 ~
...f. :c: c,_

TABLE 7.3
p[H+] data from the titrationsc of NaOH against solutions of copper(II)
ions, 3,2,3-tet and acid at 25°C and I = 0.10M
-3 -3 TL=1.103x10 M, TM=1.082x10 M 8 -3 -4 TL=1.09 x10 M, TM=7.721x10 M 8 -3 -3 TL=1.09 x10 M, TM=9.651x10 M
-3 TH = 7.753x10 M TH = 7.768x10⁻³M 8 -3 TH = 7.77 x10 M
Volume a p[H+] Volume
a p[H+] -a Volume p[H+]
0 .. 130 3.541 0.130 3.563 0.130 3.309 0 .. 135 3 .. 578 0.140 3 .. 646 0.140 3.361 0.140 3.612 0.150 3.707 0.150 3.404 0.145 3 .. 642 0.160 3.762 0.160 3.441 0.150 3.668 0.170 3.811 0.170 3 .. 475
. 0.155 3.691 0.180 3 .. 862 0 .. 180 3.506 0.160 3 .. 719 0.190. 3 .. 909 0 .. 190 3-537 0.170 3.760 0.200 3.955 0.200 3.565 0.180 3.801 0.210 4.,014 0.210 3·596 0.190 3.842 0.220 4.079 0.220 3.626 0.200 3.881 0.230 4.161 0.230 3.658 0.210 3.921 0 .. 240 4.287 0.240 3.693 0.220 3.965 0.250 4.681 0.260 3.784 0.230 4.010 0.255 5.263 0.270 3.852 0 .. 240 4 .. 061 0.260 5.919 0.250 4.121 0.265 7.148 0.260 4.195 0.270 8.024 0.270 4.287 0.275 8.578 0.280 4 .. 425 0.280 9.079
a Data are the volume of 1.269M NaOH added to 49.90 ml of the copper/ligand solution.
p[H+] values were interpolated off the calibration curve (see Chapter 3). b
c Only one titration from a reproducible set has been tabulated.

'129
reproducible set has been t ed, For each point during
the titrations equilibrium was rapidly attained. Analysis
of the '1:'1 titration data (Table 7.3) in terms of only one
complex species CuL (as outlined for hm-3,2,3-tet above) was
not sat actory. The data showed that the logK value was
not constant throughout the titration but decreased from
logK . 82 at n = 0.18 to logK = .41 at n = 0.82 •
Vi le spectrophotometric measurements on '1:1 solutions
of copper ions : ligand in aqueous buffers the following
results:
Buffer solution Am ax ----borax 9.2
phosphate 546 6.8
phthalate 568 4.0
tartrate ca. 575 3.5
This change in Amax as the pH the solution creased
sted that a proto ed complex CuHL3+ was form ai::;
lower pH values.
Calculation of Stability Constants from p[H+] Data
Analysis of the 10X excess metal ion data (Table 7.3)
Schwarzenbach146 reported a method for the analysis of
p ] data from the ten-fold excess metal ion ion
curve when protonated complexes were likely. This method as
applied to the copper( )/3,2,3-t system is as follows:

'130
Consider the scheme
H3
L
H2L) L H~..,.. MH
3L __......... ____..... __,.,.
MH~L MHL ML, M2H
3L
I
Apparent acid association constants, neglecting polynuclear
ecies, are defined
[HL] + [MHL] UIJ ( [L j + [ML j )
.IMkL 1MTIL1
Similarly other apparent acid association constants are
( 1 + [M]K:H L) 2
k 1 k I 1 2
1 k I - k k k k ---1--~-4 - 1 2 3 4 ( 1 + [M]~L)
therefore as [M] is approximat equal to TM for the
titration with a ld excess of metal ion an approximate M value of KML can be calculated the apparent acidity

constants ' can be calculated. From mass balance
equations for TL and TH equation 7.5 can be derived
I [H] + 3
4 0 7.5
where
I - k 1 k I k 1
- n · n-'1 • • • '1
For the titration of copper ions, and acid with
alkali the al overall reaction
C 2+ u +
the contributions from two of terms in equation
ected. Equation 7.5 ces to
)k11 [H] + (n-4) '[H]4 0
This equation can be further rearranged to give
'k 1
3 0
whi is the form
'1 k'.x+y. 1k 1
3 = -'1 •
'1
'1 Thus when--- = 0 ~ k41 1 k ' k"j I 2
'1 -'1 T k--' = J(• herefore for e '1
'1 = - y and when k4 'k3 ' ' = o, data point in the titration a
joining graph coordinates /x -'1/y should

ersect in a point (k1 ', practise s
point would be a on as x and y are subject to experimen-
tal uncertainties. Data from the excess metal ion curve
gave k~' = 0.313 x 10⁴ and k 'k 'k' I 4 3 2
Substituting these values o equation 7.4 ffiLd using
[M] = TM gave lo~ K:L = 21.87 ± 0.1.
Similarly an expression for K:HL can be evaluated
data gave log KM MHL 14.80 ± 0.1.
Analysis of the 1 : '1 metal : ligand titration data
Assuming that two copper-ligand complex species CuL2+
and CuLH3+ are formed during the titration of a '1 : 1 metal
ligand solution with alkali then the mass balance equations
[Cu] + [CuLJ + [CuHL]
[H]
From the equations 7.9 and 7.10 and the approximate
complex stabi ty constants calculated from the 10X excess
metal ion titration data, [Cu] was eliminated and a value

133
for [L] calculated. This was substituted into equation 7.8
and a value of [M] was calculated. These values were then
used to obtain improved values for the stability constants
of the complexes CuL2 + (K1) and CuBJ)+ (K2) and the process was
repeated. These calculations were performed for each
titration point us a suitable computer program. The
average log K values and the standard deviations obtained
from 1:1 titration data (Table 7.3) were~
log K1 = 21.68 ± 0.02 and = 14.61 ± 0.02.
Least Squares analysis of the pH titration data
The stability constrults for the complexes CuL and CuHL
were calculated from a least squares analysis of the
titration data
performed us
for a descript
Table 7. 3. T·hese calculations were
computer program ORGLS (see Appendix D
of program). For each titration
point equation 7.10 can be expressed as
i.e. the LHS is a function of the unknowns K1 , K2 , [LJ and
[M]. However, from equations 7.8 and 7.9 [L] and [Cu] can
be expressed in terms of known quantities and the unknowns
K1 and K2 . Thus from the three mass balance equations

134
(The hydrolysis term Kw/[H] was neglected as for each
titration point the solution << 7.) This equation forms
the basis of the least squares process. The LHS was derived
in subrout of ORGLS (see Appendix D) and was
termed YOBs· The RHS which was termed YCALC' was calculated
from given K1 and K2 using subroutine CALC. The least
squares process varied the parameters K1 and K2 so as to
minimise the sum of the squares of the differences between
YOBS and YCALC' Data from the ast squares analysis of the
1:1 ligand:metal titration data (see Table 7.3) are shown
in Table 7.4. The difference between YOBS and YOALC is
generally less than 1% of YOBS" The precision with which
p[H+] can be determined using the calibration curve is
±0.005 pH units. A chruLge in the value of p[H+] by 0.005 pH
for a few data points caused a change in YOALC by .2..§:· 0.5%.
This change was of the same order as the difference between
each YOBS and YOALO'
The results from ast squares es of the titration
data Table 7.3 are shown in Table 7.5. For all the least
squares analyses and for the analysis of the 10:1 metal:
ligand pH titration data using Schwarzenbach's method it was
assumed that only CuL2 + and CuHL3+ metal-ligand complex
species were formed. The agreement between the results for
the different metal:ligand ratios suggests that the data
should be interpreted in terms of two complexes. The

a
b
Data from the least a analysis of the 1:1 squares
ligand:metal p[H+] titration b data (Table 7.3)
p[H+] 2 YOBS(x10 )
2 YCALC(x10 )
3·578 0 .. 4044 0.3998
3 .. 612 0.3937 0.3898
3.642 0.3826 0.3796
3.668 . 0 .. 3712 0.3695
3.691 0.3596 0.3597
3.719 0.3481 0.3467
3.760 0.3244 0.3258
3.801 0.3006 0 .. 3029
3.842 0.2766 0.2789
3.881 0.2525 0.2556
3.921 0.2282 0.2318
3.965 0.2040 0.2064
4.010 0.1797 0.1819
4.061 0.1555 0.1563
4.121 0.1313 0.1297
YOBS and YCALC data are from the final cycle of ORGLS
Each data point was weighted'at unity.
TABLE 7.5
Stability constants for the copper 3,2,3-tet complexes 0 at I = 0.10M and 25 C calculated from the
titration data in Table 7.3
Reaction !L=-1,M !1 > TM !_M>> TL
c 2+ u + L 2+ ~ CuL ;logK1 21.68
7±o.o8 21.678±o.o8 21.72
5±o.o8
Cu2+ + HL+ ~ CuHL3+; logK2 14.690±o.o8 14.685±0.09 14.701!0.10

'135
agreement between the log K~ and log K2 values obtained from
a least squares analysis and from the Schwarzenbach analysis
is satisfactory. The slightly values obtained from
the analysis of the p[H+] data from the ~0:~ metal:ligand
data are not statistically s~0J.~~-~icant.
Distribution Curves
The % distribution of the metal-lig complex sp es
as a function of the solution p[H+J is shown in . 7.3.
The calculations were performed us computer program
DIST (see Appendix D). The values of TL and Tl\II used the
calculations were ~.~03 x ~o-3 and ~.082 x ~o-3 1\II
respect ly. The curves indicate that the concentration of
the prot ed comples CuBL3+ is at a maximum . p [ ]
= 4.0.
Calorimetric Results
The solution composition at each point in the calori
metric titrations is shown in Table 7.6. The calculation
of se data has b~en described in section 5.~. The changes
the solution composition between successive titration
points and corresponding at changes are shown T le
7.7. The experimental exothermic heat changes Q have been
corrected for heat of dilution of HCl. The Qcorr values
are the experimental Q values, correct for the heat o:f
protonation of the ligand ecies LHi. The culation of
this correction has been described in section 5.~.
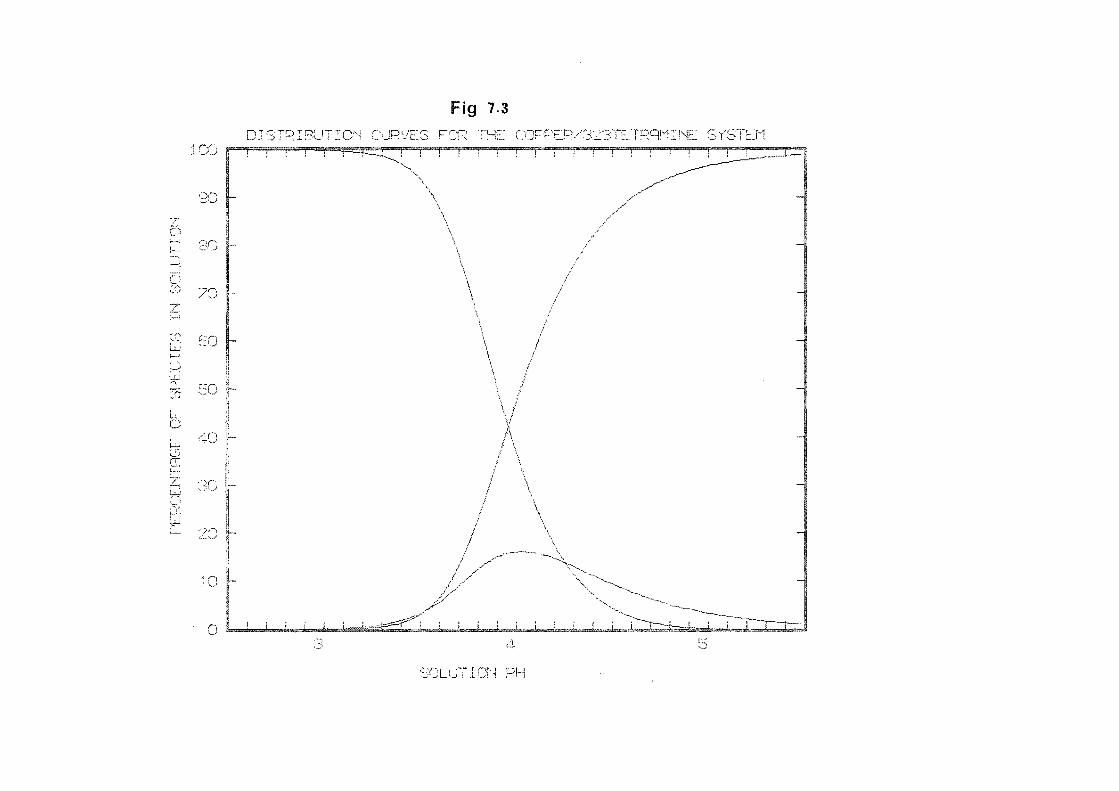
C')
LL
l
0

Vol.
(ml)
0 .. 320 0.650 0 .. 980 1.330 1.680 2.030 2.430
0.330 0.660 1.000 1.330 1.660 2.000 2.330
TABLE 7.6
Calorimetric dataa from the titrations of the copper (3,2,3-tet)
complex with HCl at 25°C and I= 0.10M
p[H+]
4.197 3.979 3.844 3-732 3.631 3.524 3.350
4.196 3.982 3.846 3.743 3.651 3 .. 555 3.443
Lb
(mmol).
o.ooooo 0.00000 0.00000 o.ooooo o.ooooo o.ooooo o.ooooo
o.ooooo o.ooooo 0.00000 o.ooooo 0.00000 o.ooooo 0.00000
HL
(mmol)
o.ooooo o.ooooo o.ooooo o.ooooo o.ooooo o.ooooo o.ooooo
(mmol)
0.,00000 o.ooooo o.ooooo o.ooooo o.ooooo 0.,00000 o.ooooo
Titration 2 o.ooooo o.ooooo o.ooooo o.ooooo o.ooooo o.ooooo o.ooooo o.ooooo o.ooooo o.ooooo 0.00000 o.ooooo 0.00000 0.00000
!!.3!! (mmol)
0.00196 0.00291 0.00350 0 .. 00389 0.00405 0.00395 0.00325
0.00201 0.00296 0.00358 0 .. 00396 0.00415 0.,00413 0.00381
(mmol)
0.,04846 0.11872 0.19519 0.28032 0.36842 0.45935 0.56432
0.04974 0.11979 0.19840 0.27849 0.36122 0.44829 0.53476
ML
(mmol)
0.47687 0.37467 0.29011 0 .. 21223 0.14358 0.08279 0.02497
0.49683 0.39373 0.30580 0.23137 0.16513 0.10457 0.,05286
MHL
(mmol)
0.10329 0.13429 0.1 79 0.-13417 0.11456 0.08449 0.03806
0.10793 0.14002 0.14871 0.14267 0.12598 0.09951 0.06508
Solution composition: Titration 1: [CuL]. ·t· 1 6.380x10⁻³M. Titration 2: [CuL]. ·t· 1 = 1n1 1a 1n1 1a 6.642x10⁻³M. For both titrations the initial volume of complex = 98.84ml and the
a
titrant HCl concentration = 0.9670M. b For each species,values are the number of at each titration point.

TABLE 7.7
Changes in composition and the heat changes between successive titration
points for the titrations of copper(3,2, ) complex with 0 HCl at 25 C and I = 0.10M
A(HL)a A(H2L) 6 (H
3L) ,C,(H
4L) A (CuL) b ,C,(CuHL)c Qcorr
d
(mmol) (mmol) (mmol) (mmol) (mmol) ( mmoU
0.10220 0.07119 0.07119. 0 .. 07025 0.10220 -0.03100 5 .. 973 -8.470 0 .. 08457 0.07706 0.07706 0.07646 0.08457 -0.00751 6.016 -8. 0.07788 0.08550 0.08550 0.08512 0.07788 0 .. 00763 6.410 -8 .. 643 0.06866 0.08826 0.08826 o.o8810 0.06866 0.01961 6.366 -8.574 0.06079 0.09085 0.09085 0.09096 0.06079 0.03007 6.361 .517 0.05782 0.16426 0.10426 0.10496 0.05782 0.04644 7.164 -9.312
0.10310 0.07100 0.07100 0.07005 0.10310 -0.03209 6.024 -8.441 0.08793 0.07925 0.07925 0.07862 0.08793 -0.00869 6.228 -8. 0.07443 0.,08048 0 .. 08048 0.08009 0.07443 o.oo6o4 6.068 -8.1 0.06624 0.08293 o. 0.08274 0.06624 0.01669 6.079 -8.047 0.06056 0.08702 0.08702 0.08704 0.06056 0.02646 6.233 -8.136 0.05171 0.08615 0.08615 0.08647 0.05171 0.03444 6.139 -7.669
a For the HiL species the tabulated values are the number of mmoles of each species formed on the addition of the titration increment.
b These values are the number of mmoles of CuL that dissociate on the addition of titrant acid.
c These values are the number of mmoles of CuHLthat dissociate on the addition of titrant HCL
d See Text.
Qcalc d
-8 .. -8.271 -8 .. 638 -8 .. 520 -8.437 -9.278
-8.471 -8.538 -8.168 -8.064 -8.160 -7.799

136
(Negative Q values imply endothermic heat changes.) The corr
values of Q are those calculated from least squares calc
process (see chapter 5). The differences between Qcorr and
Q values give an indication of the refinement the calc
least squares process.
The thermodynamic data (I 0.10 M) for the formation
of the copper-ligand complexes for 3,2,3-tet and hm-3,2,3-
tet are shown in Table 7.8.
Log Kn° data for the formation of copper-3,2,3-tet
complexes were determined from the concentration quoti
data at I 0.20, 0.15, 0.10 and O.OLt- as describ
Chapter 1. However, only data at I = 0 . 1 0 been used
in the discus on as there are few available thermodynamic
Y. 0 data for related reactions. i-n
results at the other ionic strengths and the Kn°
values are g in Appendix E.
scussion
1~ values for the CuL2 + complexes
T copper complexes of 3,2,3-tet and hm-3,2,3·-tet both
have two six membered and one five membered chelate rings.
It is well known that for labile complexes membered
chelate are less stable than five membered rings35, 148 .
For example, the free energy change for the formation of the
1:1 copper complex with 1,3-diaminopropane is less negative
than that for 1,2-diaminoethane147. For the triamines

1.
2.
a
TABLE 7 .. 8
Thermodyhamica data for the formation of some copper(II) complexes
with 3,2,3-tet and ,2,3-tet at 25°C and I = 0.10M
1 25 28 212-tetraazadodecane(3,2 23-tet)
Reaction logK -.6.G 1 Lill -1 - kJmol n
Cu2+ + L 21.687 :!:" 0.08 1 .. 77 ± 0.46 104.0 ± 0.9 -.-c 2+ ;;: CuHL3+ 14.690 :!: o.o8 83.84 ± o. + u + 70.-c, - 1.2
2,11-diamino-4,4,9,9-tetramethyl-5,8 diazadodecane (hm-3,2,3-tet)
Reaction
Cu2+ + L ;;: CuL 2+
logK1
22.41 ± o.o6
-.6.G kJmol -1
+ 127.89 - 0.3
With reference to a standard state of 0.,10M NaCl.
A -1 -oH kJmol
+ 104.0 - 0 .. 9
.6. S Jmol-1K-1
+ ·3 - 5
45 .. 5 ! 5
As Jmol - 1
80.2 ± 4

Thermodynamic data for the formation of the copper(II) complexes with some polyamines
Amine, Reaction Ring log K -LIG kJmol-1 System -liff kJmol"" 1 As Jmol-1K-1 Conditions
2+ )2+ Cu + 2,3;2-tet - Cu(2,3,2tet 5,6,5 23.9a 136.4 0.5M KCl, 25°C
c Z+ t . u + r1pen ... Cu(tripen) 2+ 6,6,6 17 ·3b 98.73 0 0.1 Na.No
3, 20 C
Cu2+ + trien ... Cu(trien) 2+ 5,5,5 20.08 c
114.64 90.16 81.6 0.1M KCl, 25°C
Cu2+ + dien ... Cu(dien) 2+ 5,5 15.8d 90.16 75·3 50.2 0.1M KCl, 25°C
Cu2+ + dpt ... Cu(dpt) 2+ 6,6 14.2d 81.09 67.32 46.0 0.1M KCl, 25°C
Cu2+ + Zen ) 2+ - Cu(en 2 5 and 5 zo.oe 114. 105.27 29.7 0.1M KCl, 25°C
Cu2+ + Htrien+ ... Cu(Htrien) 2+ 5,5 13.8c 78.66 66.1 41.8 0.1M KCl, 25°C
a Datum from reference 15. b Datum from reference 14. c All the thermodynamic data from reference 16. d From reference 106. e From reference 137.

137
complex of dien is more stable that dpt (see Table
7.9),even though dpt a stronger base. The crystal
structures of the ckel complexes, NiL22 +, with L dien and
dpt have been reported148 , 149. The data show that the metal
secondary nitrogen bonds are 0.16 A0 longer for Ni(dpt) 22+
than for Ni(dien) 22+. It was suggested that the more endo
thermic enthalpy changes, for the formation of the nickel
comp s of dpt, relative to those of dien was due (in part)
to this difference the strength of the metal-secondary
nitrogen bond. For the tetraamines ethylenetetramine
(trien) and tripropyl etramine (tripen) the stability
constant data show that the copper complex with three five
membered chelate rings (trien) is more stable tham: that with
three six member chelate rings (tripen) (see Table 7.9).
It has been reported1 5° that~for coordination of
trien with copper(II) ions a planar configuration,the
chelate s cannot all adopt the favoured gauche form
without very considerable strain (distortion of bond les).
In cobalt(III) complexes trien achieves the favoured
h f b d t . . f' t' 150 gauc e orm y a op 1ng a c1s con 1gura 1on . For tripen,
models show that each chelate ring can be formed the
favoured chair configuration1 51 but there considerable
strain in the metal-secondary nitrogen bonds. However, the
data Tables 7.8 and 7.9 indicate that when the ligand
enables the formation of a mixture of five andmx membered
chelate rings, as in the complexes with 2,3,2-tet and 3,2,3-
tet,
either
complexes formed are more stable that those with
or s
ligands 3,2,3-tet
membered rings alone. From models of the
2,3,2-tet1 5° in square coordination
it is apparent that the five membered can adopt the
favoured gauche form and the member ring can readily
adopt the favoured chair configuration. For both ligands in
a planar coordination these configurations result an
apparent strain-free system. That the copper complex of
2,3,2-tet is more stable than t complex for 3,2,3-tet (see
Tab s 7.8 and 7.9) indicates that five membered che e
rings are more stable than six membered rings.
The log K data Table 7.8 shows that the copper
complex with hm-3,2,3-tet is only slightly more stable than
the complex of 3,2,3-tet (a difference of ca. 0.7 log ts).
Enthal~~anges for the CuL2+ com~lexes
enthalpy changes for coordination reactions are the
quantities most readily related to the changes the number
and strength of bonds. It is convenient to express the free
energy on the coordination of a ligand to a metal ion in
terms of two parts; the free energy change which involves
long range electrostatic interactions (which depend on the
solvent and ch wi be temp:erature dependent) and a term
repres short range covalent forces which be

'139
temperature independent1 52 ,'153, i.e.
where 6Gc is the covalent (temperature independent) term,
6Ge is the electrostatic (temperature dependent) term and
6nRTln55.5 is the quantity which renders the equilibrium
constant dimensionless. 6n is the increase the number of
solute species on coordination and 55.5 is the number of
moles contained in 1000g of water. This term is called the
cratic term as first defined by Gurney3 6 . For purely
electrostatic interactions the free energy will be inversely
proportional to the dielectric constant s, which can be
expressed36,
1/s = a:' T/v e
where a:' is a constant and v is a temperature characteristic
of the so (219°K for water~ Thus
and the entropy change given by
-a(6G)/aT
and
The electrostatic components 6G and 6H can be calculated e e
by equations 7.11 and 7.12

LlG e
T/v -ae = -v(l-.S - ll Rln55.5) n
llH == (T -v) ( LlS - 6 Rln55. 5) e n
The temperature independent part of the enthalpy 6Hc
140
given
by the difference 6Hc 6H- 6.H . e it is assumed that the
major contribution of 6.H c ses from the formation of the
metal-ligand bonds then an approximate value can be
calculated for each bond. The temperature dependent and
temperature independent contributions to the enthalpy data
for the formation of the copper complexes of some amines are
shown in Table 7.10.
Structural features in tion to the formation of a
metal-nitrogen bond make a contribution to the 6H values. c
The more endothermic values for dien and trien compared with
en indicate the increased strain the formation of
additional chelate rings. The value of -6Hc/p for 3,2,3-tet
is very similar to that for ethylenediamine. s evidence
supports the conclusion that the copper complex with 3,2,3-
tet is almost strain free, as discussed earlier.
From the enthalpy data in Tables 7.8 and 7.9,the
enthalpy changes for the reaction
Cu(en) 2 + L ~ Cu(L) + 2en
where Lis trien and 3,2,3-t ,are 15.1 kJ mo · 1.3
I
mol-1 respectively. has been sted16 that the large

TABLE 7 .. 10
Temperature independent enthalpy data for the formation
of some copper(II) amine complexes
-1 Lln -1 -6H -1 a -1 Amine, Reaction -LlH kJmol kJmol kJmol -LlH /p kJmol c c -
Cu + 2en ... Cu(en)2
2+ 105.3b 2 7.6 112.9 28.2
Cu + 323tet - Cu(323tet) 2+ 104 .. od 1 7-9 111.9 28.0
Cu + trien - Cu(trien) 2+ 80.16b 1 7.08 97.2 24.8
Cu + dien ...,. Cu(dien) 2+ 75.3b 1 6.6 81.9 27.3
Cu + dpt .... Cu(dpt) 2+ 67 .. 3b 1 6.27 73.6 24.5
Cu + NH3
- Cu(NH ) 2+ 3
24.68c 1 2.5 27.2 27.2
a p is the number of nitrogens bonded to the central copper ion.
b Data from Table 7.9.
c Data from reference 153.
d Data from Table 7.8.

141
endothermic M1 for reaction I when L = trien is due to both
the increase in internal in the chelate s of CuL
and to the probable lower heat of formation of a metal-
secondary nitrogen bond compared with a metal-primary
nitrogen bond. However, as both and 3,2,3-tet have
two primary and two secondary nitrogen atoms and as the ~H
change for reaction I when L 3,2,3-t
it would appear that the increase in int
-1 is only 1.3 kJ mol
strain in the
chelate the cause of the large ~H value for trien.
The data in Table 7.8 show that the enthalpy changes
for the formation of Cu(3,2,3-tet) 2+ and Cu(hm-3,2,3-tet) 2 +
are identical within the experimental error. noted
earlier, the stability of the latter complex is
greater than for the former, therefore the erence
stability must arise from the entropy erence.
Entropy Changes for the CuL2+ Complexes
The factors which contribute to the entropy change for
the reaction
have been discussed in Chapter 1. The data in Tables 7.8
and 7.9 show that the entropy change for the formation of
the complexes Cu(hm-3,2,3-tet) ru1d Cu(3,2,3-tet) 2+ are
po and the value for Cu(3,2,3-tet) 2+ is smaller ~y
15.3 J mol-'1K-1)than that for Cu(trien) 2+. This difference
-1 -1 of 15.3 J mol K suggests that the expected greater loss

142
ligand configurational entropy for 3,2,3-tet compared
with en, on coordination to copper( ) ions,is not
entirely compensated by the expected decreased solvent
orientation of Cu(3,2,3-tet) complex compared with
Cu(trien)
The b.S value for the formation of Cu(hm-3,2,3-tet) 2+ is
12 J -1 -1 greater than that for Cu(3,2,3-tet) 2+ ca. mol K
The six methyl substituents would be expect to shield
solvent from the influence of the charge an complex ion
Cu(hm-3,2,3-tet) and this will produce a larger entropy
change than for Cu(3,2,3-tet) 2+ formation. Models cate
that 1 when the hm-3,2,3-tet and is coordinated in a planar
configuration,there would be considerable interaction
between the axial members of the ~~-dimethyl groups and
the water molecules weakly coordinated in the tran~-planar
sites. This interaction would result in a weaker binding of
these water molecules to the copper ion. Visible absorption
spectral data (see section below) do suggest that the
tetragonal distortion Cu(hm-3,2,3-tet) 2 + is greater
that for Cu(3,2,3 et) Any such tetragonal distortion
will lead to a ightly larger entropy change for the
formation of the complex.
Visible Electronic Spectra and Bonding
The and field sp diagram for copper( )
shown in Fig. 7.4. When copper in a tetragonal

-----------..-
.... ---
/ /
/ /
/ /
/ /
/ /
/ /
\ \
\ \
\ \
\
\ \
\ \
\ \
\
' ' ' ' ' ' ' ' ' ' '
Fig. 7·4

environment the symmetry approximates to D4h1 54 . The energy
level diagram predicts that there will be three electronic
transitions, however energies of the 2 2 , B2g and A1g
es are ar enough so that a single band obtained
in the observed absorption spectrum1 54 . As the tetragonal
distortion is increas the splitting of energy states
is increas result in a higher ligand field str as
measured by Amax· The vi e ectrophotometric data for
copper complexes of a number of amines are shown
Tab value of A will depend on the donor '"max
of the in-plane donor atoms and on the ee of
tetragonal tortion. thermodynamic quantity
would be expected to relate most closely to Amax is the
temperature independent enthalpy term -M1 . A comparison c
of enthalpy data Table 7.10 with the ~ax data
Table 7.11 shows that both the ligand :field strength and the
-~H increase in the order Cu(dien) < Cu(trien) 2+ < c
Cu(en) 2 ~ Cu(3,2,3-tet) 2+, in fact correlation is
linear as shown Fig. 7.5. The point for hm-3,2,3-tet
does not very close to the line of be through the
other data. However, value of A will be more max sensitive to changes the degree of tetragonal
distortion than will the change in -~Hc,when solvent water
molecules occupy the ttrans-planar sites. Thus the at ion
for hm-3,2,3-tet not sing. No enthalpy data :for

TABLE 7.11
Visible spectrophotometric data for a number of
copper-amine complexes in aqueous solution
Complex ~max.Jl.UL -1 v em .f:.
Cu(3,2,3-tet) 2+ 545 18,350 90
Cu(hm-3,2,3-tet) 2+ 534 18,700 110
) 2+ Cu(en 2 549 a 18,200 63
Cu(trien) 2+ 575 b 17,400 150
Cu(2,3,2-tet) 2+ 524 c 19' 100 66
Cu(dien) 2+ 611 a 16,300 74
Cu(tn)2
2+ 568 a 17,600 111
a Data from reference 164.
b Data from reference 16.
c Data from reference 155.

12D
e (en),. • >.~.3-+•t
110
100
qo
• dieo
go
10
soo 510 5':2:.0 530 54,0 550 560 570 sso bOO 6JO
A max
Fig 7.5

144
the formation of the copper-2,3,2-tet complex are available.
covalent bonding parameters from epr spectra
for Cu( en) 2 ( H2o) 2 2+ Cu(3,2, et)(H2o) 2
2+ and Cu(2,3,2-t ) '
( )22+ imply155 that the caval bonding is nearly the
same in all three complexes but is slightly stronger in the
2,3,2-tet case. This result consistent with the visible
spectral data in Table 7.11. might be expected therefore,
that -6H for Cu(2,3,2-tet) 2 + will be greater than that c
for the formation of Cu(3,2,3-tet) 2+.
Protonated complex CuHL3+
most likely structure of the protonated complex
CuHL3+ for 3,2,3-tet is
where one primary and two secondary nitrogen atoms are
co or ed to the metal ion and the remaining trogen atom
protonated. There will be one five membered and one
membered chelate The formation of a protonated
complex was f d f th l . d t . 16 Th so oun or e 1gan r1en . ermo-
dynamic data for the formation of the protonated complexes
for trien 3,2,3-tet ligands are shown in Tables 7.8 and

The enthalpy data for the formation of Cu(dien) 2+
(Table 7.9) and for Cu(Htrien)3+ show that the L\H of
145
formation for the latter complex less exothermic by ca.
-1 -1 . 9 kJ mol K . Presumably, this dlfference due to the
inductive and electros c ects associated with the
terminal -NH3
+ group. No thermodynamic data the
formation of the copper complex with the ligand 2,3-tri
(NH2 (CH2 )3
NH(CH2 ) 2NH2 )are available. Margerum et al. 1 5
found that the 1: 1 nickel complex with 2, 3 was of closely
s lar stabi ty to that with dien. Thus might be
expected that the rmodynamic data for t formation of
Cu(2,3-tri) 2 + would be similar to that for dien (see Table
7.9). The enthalpy change fort formation of Cu(H 3,2,3-
tet)3+ is ca. 4 kJ mol-1 greater than Cu(H trien)3+.
This consistent with the ater distance between
positively charged centres in the protonated complex
Cu(H 3,2,3-tet)3+.
No protonated complex was observed for the ~~d
tripen ((3,3,3-tet)). This was due to the copper ligand
two
complex be formed in a pH range of 5. 3 - 6. 2'14 . For the
ligands 3,2,3-tet and hm-3,2,3-tet the complexes were formed
in the pH range 3. 5-4.2 and yet no protonated complex for
hm-3,2,3-tet was detected. This implies that for hm-3,2,3-
tet the cies

in the pH range 3. 5-4.2, very readily loses a proton to
form the 1:1 copper ligand complex.
Hydroxy-Complexes
It has been shown1 57 that the degree of formation of
so+uble metal ion hydroxy spe es decreases as the metal-
ligand stability increases and as the number donor
1
groups increases. Hydroxy complexes CuL(OH)+ have been
well charact sed for dien and dpt103. A hydroxy complex
has also been reported for Cu(trien) 2+ 1 57 (pKa for
Cu(trien)(H2o) 22 + is 10.8). However, spectrophotometric
data from solutions of pH 4-11 showed no evidence for the
formation of hydroxy species for either bm-3,2,3-tet or
3,2,3 et.
7.2 FORMATION OF COPPER COMPLEXES WITH THE DIAMINE-DIOXIME
LIGAND
7.2.1 Results
:2...[1[.] titration data
Solutions of copper(II) ions and protonated ligand LH42 +
(both the a. 2HCl and Y. 2HCl04 isomers were used) were

titrated with both standard NaOH and HCl. p[ ] titration
data were obtained for a number of erent metal : and
ratios and at different tota1 metal ion concentrations.
Data from ti trations at TM : TL of .92:· 1 : 3 and '1 : 2 are
shown Table 7.12, data at TM: TL of ca. 1 : '1.5 are shown
Table '7. '13 and data TM : TL of ca. '1 : '1 are shown
Table 7 .1L~. Only one titration from a reproducible set of
trations has been tabulated each case. Representative
titration curves, using the data from Tables 7.12 . '14., are
shown in 7.6. For comparison purposes the titration
data all been plotted on the same t scale. The
1 ; 1 data are anomalous and will be discussed separately.
The ca. '1 '1. 5 metal : ligand data shows that the ti trations
with the a or Y isomers are identic up to pH . 6. The
deviation tc:n: t s point is due to the different TL values
for twos s of data (see Table 7.13). first end
point ('1) for the '1 : 1.5 and 1 : 2 titrations corresponds to
the addition of 3 moles of titrant per mole of metal ion,
while the second end points (2) can be ascribed to the
neutralisation of one proton from excess ligand, LH4
The agreement of the experiment end points with those
calculated from this interpretation is within the experimental
error of ca. 0.5%.

p[H+] data from the titrations of NaOH or HCl against solutions
of copper(!!) ions, diamine-dioxime ligand and acid at 25°C,
I = 0.10M (NaCl)
4 -4 TL= .905x10 M, -4 T~{ 1. 531x10 M 4 -4 TL=7 .. 6 7x10 M, 8 -4 TM=3. 12x10 M
used 'Y. 2HClo4 used "(. 2HC10 4
Vol. a E[H+]b Vol. c Vol. d _E_[H+]b c
o .. ooo 3.404 o.ooo 3.404 o.ooo 3.121 0.,010 3.439 0.005 3.359 0.020 3.149 0.010 3.085 0.,020 3.47~· 0.010 3.322 0.040 3.179 0.020 3.050 0.030 3.516 0.015 3.285 0.060 3.212 0.030 3.015 o.o4o 3.560 0.020 3 .. 253 o.o8o 3.249 o.o4o 2.986 0 .. 050 3.611 0.030 3.192 0.100 3.285 0.060 2. 9.31 0.060 3.667 0.040 3.140 0.120 3.327 o.o8o 2.881 0.070 3.735 0.050 3.094 0.140 3.372 0.100 2.837 o.o8o 3.814 o.o6o 3.052 0.150 397 0.140 2.756 0 .. 090 3.910 0.070 3.012 0.170 3.451 0.180 2.680 0.095 3 .. 968 0.080 2.978 0.180 3.481 0.220 2.615 0.100 4.031 0.100 2.913 0.190 3.514 0.280 2.527 0.105 4.106 0.120 2.855 0.200 3.548 0.110 4.201 0.11+0 2.805 0.210 3.588 0.115 4.312 0.160 2.762 0.220 3.629
0.190 2.698 0.230 3.675 0.220 2.643 0.240 3.730
0.250 3.790 0.260 3.861 0.270 3.942 0.280 4.047 0.290 4.176 0.300 4.361
a Volume of 0.1740M NaOH added to 49.94ml of solution.
b + All p[H ] data were obtained using the calibration curve
(see Chapter 3).
c Volume of o.4979M HCl added to 49.94ml of the titrated solution.
d Volume of 0.1779M NaOH added to 49.94ml of the titrated solution.

p[H+] data from the titrations of NaOH (and HCl) against
solutions of copper( II) ions, diamine-dioxime ligand and
acid at 25°C, I = 0.10M (NaCl)
-4 8 -4 T1=5.939x10 M, TM=3· 12x10 M 8 -4 8 -4 T1=5. 44x10 M, TM=3• 12x10 M
used a..2HC1 used y.2HC104
Vol. b p[H+]a Vol. c p[H+] Vol. d c
o.ooo 3.145 o.ooo 3.146 o.ooo 3 .. 153 o.ooo 3.152 0.020 3.185 0.010 3.109 0.010 3.171 0.020 3.080 0.030 3.205 0.,020 3.075 0.020 3 .. 191 o.o4o 3.015 0.,040 3.229 0.030 3 .. 042 0.030 3.211 0.050 2.985 0.050 3.252 0.040 3.010 o.o4o 3.232 0.060 2.258 0.060 3.276 0.060 2 .. 953 0.050 3.256 o.o8o 2.902 0.070 3.300 o.o8o 2.900 o.o6o 3.277 0.100 2.855 o.o8o 3.328 0.120 2.809 0.070 3.301 0.120 2.810 0.,090 3.356 0.160 2 .. 730 0.080 3.326 0.150 2.753 0.100 3.386 0.200 2.658 0.090 3o353 0.170 2.717 0.110 3.419 0.240 2.595 0.100 3.379 0.200 2.661 0.120 3.452 0.280 2.538 0.110 3.410 0.230 2.612 0.130 3.489 0.120 3.439 0.140 3.530 0.130 3.473 0.150 3·574 0.140 3.510 0.160 3.623 0.150 3.549 0.170 3.680 0.160 3.595 0.180 3.749 0.170 3.642 0.190 3.826 0.180 3.692 0.200 3.920 0.190 3.757 0.210 4.053 0.200 3.830 0.220 4.240 0.210 3.920
0.220 4.040 0.230 4.202 0.240 4.459 0.245 4.666 0.250 4.969
a All p[H+] data was obtained using the calibration curve
(see Chapter 3).
b Volume of 0.2389M NaOH added to 49.94ml of the titrated solution.
c Volume of o.4979M HCl added to 49.94ml of the copper/oxime
solution.
d Volume of 0.2261M NaOH added to 49.94ml.

+ p[H ] data from the titrations of NaOH against solutions
of copper(II) ions, diamine-dioxime ligand and acid at
-4 1.557x10 M -4 TM= 1 .531x10 M
y isomer used
Vol.a p[H+]b
o.ooo 2.952 0.020 2.978 o.o4o 3.003 0.060 3 .. 032 o.o8o 3 .. 063 0.100 3.095 0.120 3.131 0.140 3.167 0.160 3.209 0.180 3.255 0.200 3.303 0.220 3 .. 356 0.240 3.415 0.260 3.484 0.270 3.522 0.280 3 .. 563 0.290 3.610 0.300 3.659 0.310 3·719 0.320 3.780 0.330 3.855 0.340 3.943 0.350 4.050 0.360 4.185 0.370 4.358 0.380 4.610
"( isomer used
Vol.c
o.ooo 0.010 0.020 0.030 o.o4o 0.050 0.060 0.070 o.o8o 0.090 0.100 0.110 0.,120 0.130 0.140 0.150 0.160 0.170 0.180 0.185 0.190 0.195 0.,200 0.205 0.210 0.215 0.220
p[H+]
3.227 3.251 3.274 3.300 3.326 3·353 3.382 3.412 3.447 3.483 3.522 3.562 3.610 3.660 3.716 3.778 3.848 3.925 4.020 4.068 4.124 4.188 4.255 4.331 4.421 4.529 4.653
"( isomer used
o.ooo 3.105 0.020 3.136 o.o4o 3.175 0.060 3.218 0.080 3.264 0.100 3.315 0.120 3.371 0.130 3.401 0.140 3.445 0.150 3.470 0.160 3.510 0.170 3. 1 0.180 3·599 0.190 3.650 0.200 3.707 0.210 3.775 0.220 3.861 0.230 3.946 0.240 4.067 0.250 4.215 0.260 4.419
a. isomer used
o.ooo 3.220 0.020 3.268 0.030 3.294 0.040 3-322 o.o6o 3.382 o.o8o 3.451 0.090 3.490 0.100 3.531 0.110 3.577 0.120 3.626 0.130 3.684 0.140 3.746 0.150 3.820 0.160 3.898 0.170 3.993 0.180 4.101 0.190 4. 248 0.200 4.435
a Volume of 0.1779M NaOH added to 49.94ml of solution.
p[H+] data obtained using the calibration curve (see c Volume of 0.2261M NaOH added to 49.94ml of solution.
b
d Volume of 0.1915M NaOH added to 49.94ml. e Volume of 0.2389M NaOH added to 49.94ml.
Chapter 3).

10
9
8
7
6
5
4
I .....--· ....----·
/.
/ /5.~ /1,?
( ~
~-/ /j / ;} /./·
/1 !/ lr I p ;·
.· l . if 1 I 1:1 tl 1 / /./ f I/. 1
I Ji I f/ J '
0 I ./ /
/./ . /0 -0 /p ---·~· / . ./ ,__..o o.,..-' _ .. ~-·-·-·~.~~ ~·"' .~~-o::::::::=:!-<!:----,-o=-·-·~·~-·~--=---~~ -- • -· -· c:::-----• ::-;--·-~·
• = I'. 2 H 04
o =0..2HCI
3 L.--• ' { "" J ,J -----~-~.1·
·34
n a 7·6 _,. Rep res t curves in--ue = 3· 2x10-4

'148
Calculations from '1:'1.5 and '1:2 p[H+] titration data
end point analysis of the titration curves suggested
that e a proton was removed from the function of
the ligand or that a '1:'1 metal-ligand hydroxy species
CuLH2(0H)+ was formed. Spectroscopic evidence (see section
below) and solid state evidence158 suggested that two
complexes were formed during a p[H+] titration, a '1:'1 metal:
ligand cies CuLH22+ and a '1:'1 deprotonated species CuLH+,
the proton having been removed from one of the oxime functions.
AssLooing that only these two complexes are formed with '
formation constants given by
Cu2+ + LH2 ~ CuLH2 and 2+ -' CuLH2 ,- CuLH+ + H+
K'1 [CuLH2 ]
K2 = lCuLH] [H] = [Cu J [LH2 J [CuLH2 ] '
then the two mass balance equations for TM and TL' valid at
pH< 1'1,are
The electroneutrality equation is

'149
where T01- is the total concentration of anion added as
copper chloride and as ligand dihydrochloride (or dihydro-
perchlorate),and [Na+) is t concentration sodium ions
from titrant NaOH. For titrations against HCl, [Na+] 0
and an additional term [ClADDJ was added to the RHB of
equation 7.16. Uponthe elimination of [cu2+] from
equations 7.14 and 7.15 and by using the protonation
concentration quotients for t l species and the
formation const above,a quadratic equation in LH2 was
formed,
2 ( K1K2) ( K2K1) [LH2 ] .(D) K1 + ~ + [LH2 ] D + K1 + 1H1- - TL
where D = 1 + k3
[H) + k4k 2 [H] 2 • Given values .for K1 and
the free ligan.d concentration [LH2 J was calculated. This
0
value was then subsQtuted o a rearranged electroneutrality
equation
and a least squares procedure was us to calculate values
These were then used to calculate improved
values for [LH2 ] and the process was repeated until
convergence was obtained. Four or .five cycles of the
computer program ORGLS were usually required. The computer

1
output from the final cycle for one of the titrat data
equation sets is shown in Table 7.15. YOBS is the LHS
7.17 and YCALC is the RHS calculated us 'parameters
of best f ' (these are Table 7.16). The data in
Table 7.15 were calculated us the p[H+] data from bo
the titrations with NaOH and HCl. The agreement factor (see
footnote, Table 7.15 and Appendices C and D) shows that the
least squares ref was satisfactory.
The results from least squares analyses on the pH
titration data at various TM: 1I'L ratios are shown in Table
7.16. the analysis for each data s the differences in
YOBS - YCALC were generally in the range 0.1 - 0. The
estimated unc
data of 1:1.5 identical results, within the estimated
unc , were obt for the a and y isomers. The
results for the ca. 1:3 data are slightly different from
those at other ratios.
Calculations from the 1:1 metal:ligand titration data
end point of the titration curve, although not being
well defined, suggest that a proton was being removed
om one of the oxime groups. However, a least squares
analysis of the titration data in terms of the complexes
CuLH2 and CuLH+ did not give sati actory results. For
-4 ( ) the data TM = 3.812 x 10 Table 7.14 , Y isomer, the
parameters obtained were log K1

TABLE 7.15
Data from the least squares analysisa of the 1:2 metal:ligand p[H+]
titration datab (Table 7.12) for the copper/oxime system
p[H+] 2 !oBs(x10 )
2 !cALC(x10 ) p[H+] 2
!oBs(x10 ) 2
!cALC(x10 )
2.527 0.2083 0.2095 3.372 0.1363 0.1363 2.615 0.2039 0.2031 3-397 0.1351 0.1351 2.680 0.1982 0.1976 3.423 0.1339 0.1339 2.756 0.1923 0.1903 3.451 0.1326 0.1327 2.837 0.1827 0.1820 3.481 0.1314 0.1315 2.881 0.1769 0.1774 3.514 0.1303 0.1302 2.931 0.1714 0.1721 3.548 0.1290 0.1291 2.986 0.1656 0.1665 3.588 0.1279 0.1279 3.015 0.1623 0.1636 3.629 0.1267 0.1267 3.050 0.1599 0.1602 3.675 0.1254 0.1255 3.085 0.1569 0.1569 3-730 0.1244 0.1243 3.121 0.1535 0.1537 3-790 0.1232 0.1231 3.149 0.1510 0.1513 3.861 0.1221 0.1218 3.179 0.1485 0.1488 3.942 0.1209 0 .. 1206 3.212 0.1462 0.1463 4.047 0.1197 0.1193 3.249 0.1440 0.1436 4.176 0.1185 0.1179 3.285 0.1413 0.1412 4.361 0.1172 0.1163 3.327 0.1389 0.1387
2 1 5 agreement factor ( zCw.(O-C) )/(NO-NV)) 2 = 0.6 X 10-l.
a Output from the computer program ORGLS.
b Each data point was weighted at unity.

TABLE 7.16
Stability constants for the copper/diamine-dioxime complexes
o a at I = 0.10 and 25 C calculated from the
titration data in Tables 7.12 and 7.13.
Reaction Ratio T·L :TH (isomer used)
ca. 3:1 (y) ~· 2:1 (y) ca.1.5:1(a) ~- 1.5:1 (y)
2+ ~ 2+ Cu + LH2
...- CuLH2
; logK1 13 .. 309 :t 0.06 13.246 ± 0.05 + 13.221 - 0.07 13.194 ± o.o8
CuLH2
2+ + + + 8 ;= CuLH + H ;logK2
-3.119
- 0 .. 0 -3.247 ± 0.07 -3.263 .± 0.08 -3.278
.± o.o8
a Each data point was weighted at unity in the least squares.
b Errors were estimated from a consideration of the differences in the logK.
1
produced from reproducible data and from the uncertainties in analytical concentration -·

151
however the erences between YOBS YCALC were large
data was recollect using a erent
sample. The same results were obtained. (The results were
o independent of which isomer was used, . 7.6.)
T 1:'1 on data TM = 1 . x 10-4M (Tab 1 e 7 . 1 L~)
also c not satisfactorily be erpret terms
two constants K1 K2 . 5 erberg's cal method1
as applied this 1:1 titration data, also did yield a
satisf result the only complexes assumed were
and
Spectrophotometric Results
Vis e and let spectrophot c data obtained
u copper-oxime solutions the trations are
shown in Table 7.17. A few U.V. spe are also shown in
Fig. 7.7. For the le spe the solution ionic
str was 0.10 M (NaCl) for the olet ectra
ionic strength was 0. M (NaCl). The extinct
coefficients were cal ted with re ect to concentrat-
ion of metal ion available for coordination,for even the
1:1 copper: solution there was a slight excess
ligand.
(
ectrophotometric
158 ared by J.W. Fraser )
solvents are also tabulat
of complex.
for the (Cu(LH)) 2Cl2 solid
a number of non-aqueous
in Table 7.17. The extinction

TABLE 7.17
Visible-Ultraviolet spectra for the copper/diamine-dioxime system
Visible
Solution a ca. ratio TM..:_T1 ~ A.(nm) ~
isomer, 8 -4 1:2 9.42 579 219 y TM=3• 12x10 M a isomer, Tw3.812x10-4M 1:1.5 9.7 580 214 y isomer, 'l'w3.812x1o-4M 1:1 5·7 582 189 a isomer, Tw3.812x1o:tM 1:1 10,0 579 192 y isomer, Tw1.531x10
4H 1:1 10.1 578 190
a isomer, Tw3.812x1o- M 1:1 3.3 592 y isomer, T~=3.812x1o-4M 1:1 3·3 593
Ultraviolet
Solution b ratio TM..:_TL ~ A.(nmj Pin ~renthesis) ca.
a isomer, Tw1.906x1o-4M 1:1 3.3 277(-) 4.3 273(-). 325(-)
-4 10 .o 272(4200),330sh(2620)
a isomer, Tw 1. 906x10 M 1:1.5 3.2 277(-)
Tw 1. 906x1o-4M 10.8 271(4600),328
y isomer, 1:1.5 3.2 277(-)
Tr=1.531x1o-4H 10.7 269(4650),330(2800)
y isomer, 1:3 8.7 272(4600),325(2830) y isomer, '\ -4 1:2 5.4 271(4590),325(2810) Tw1.906x10 M
TM=1.531x10⁻⁴M 3.2 277(-)
y isomer, 1:1 10,1 271(4180),330(2610)
Visible-Ultraviolet spectra in non-agueous solvents
a
b
c
Complex Solvent A.(nnq e in Earentheses)
(Cu(LH))2cl
2 C
2H
50H 580(220)' 363(2180),
DHF 590(195), 376(2120),
HCONH2 585(193), 350(2270)' DMsoc 596(234), 373(1800),
MeCNc 622(250), 382(1760),
The spectrophotometric data were obtained using solutions identical in
composition to those used in the pH titrations.
Some·titration solutions wore diluted,
Data from J,\'1, Fraser, M.Sc, Thesis, University of Canterbury 1970.
269(4360)
272(/+560)
272(4280)
270(4300)
280(4150)

2H 2M ll'lt ztt ... Itt au IH
WIMI!ength (nml
Fig, 7·7 UV Spectra for the coppM /dlemlne- dloxlme ayatem TM • 1 ·908 x 1<f"M r•tlo TM :TL 2! 1:1-6

Calorimetric data
Data from the calorimetric titrations of solutions of
copper ions, diamine-dioxime dihydrobromide and NaOH against
standard HCl are shown in Table 7.18. The measured heat
change, which was the difference between the endothermic
heat of dissociation of the complex and exothermic heat
of protonation of the ligand, was exothermic and small.
Only one or two titration po s could be measured for each
run. At the end of some of the runs NaOH was added to the
calorimetric solut us a Gilmont micrometer
This solution was then used for the next calorimetric run.
calculation of data in Table 7.18 was described in
section 5.3. The enthalpy changes for the formation
+ and CuLH were calculated using the least squares
procedure as described previously (see chapter 5). The
results are shown in Table 7.20.
These results (6H1 , 6H2 ) were confirmed by experiment-
ly determining
titrating an alkaline solution of the diamine-dioxime
with copper chloride. The calculations are described in
section 5.4. The result Table 7.19 shows good agreement
with the data Table 7.20. The e energy, enthalpy and
entropy changes for the formation of the complexes CuLH22+
and CuLH+ are shown in Table 7.20.

TABLE 7.18
Calorimetric data from the titrations of the copper oxime complex (CuLH+)
with HCl b at 25°C and I = 0,10M
Vol, p[H+] LH d 2 LH
3 LH4 M(LH2) M(LH) LIM(LH
2) LIM(LH) e Q Qcorr Qcalc
TL·= 3.890 X 10⁻³M TM 2,989 X 10-3M, [NaOH]a = 7,298 X 10-3M, INITIAL VOI,UME = 100.0ml, [HCl]= ' a
o.ooo 3.434 0,00000 0,00012 0,09516 0,11457 0.17917 0.08793 0,13020 5.294 -1.735 -1.737
o.470 2.735 0,00000 0,00005 0.18316 0.15685 0,04897 0,06401 0,02721 2.275 -2.840 -2.865
0.770 2.498 0,00000 0,00004 0,24717 0,12005 0.02176
cTL=3.995x10⁻³t-~, TM=3,020x10-3H, [NaOHla = 9.140x10-\l, INITIAL VOLUHE = 99.0ml 1 [HCl]a = 0,0 a
0.340 3.090 0,00000 0,00007 0.12345 0,15921 0.11281 0,10706 0,08360 4.652 -3.904 -3.891
0.840 2.573 0,00000 0,00004 0.23054 0,13575 0,02921
0,0
TL=3.929x10⁻³M, TH=2.969x10⁻³J.l, [NaOH]a = 10,097x10-3J.l, INITIAL VOLUME = 100,67ml, [HCl]a=8,069x10-3M
0.320 3.113 o.ooooo 0,00007 0,11917 0,15502 0,12127 0,10556 0.08965 4.833 -3.604 -3.665
0.820 2.597 0,00000 0,00004 0.22476 0,13910 0,03163
TL=4,063x10-3M, 'rH=3.020x10⁻³M, [NaOH]a=9.338x10⁻³M, INITIAL VOLUNE = 99.0m1, [HCl]a = 0,0
0.330 3.137 0,00000 0.00008 0.12433 0,15540 0.12243
0.830 2.594 0.00000 0,00004 0,22976 0,14067 0.03176
TL=3.995x10⁻³M, TH=2.969x10⁻³M, [NaOH]a=17,485x10-3H, INITIAL VOLUME= 100,68ml 1 [HCl]a=7.972x10- 3M
0,340 3.184 ·o.ooooo o,oooo8 o.1204o 0,14995 0.13180 0,10357 0.09747 4.897 -3.381 -3.371
o.84o 2.618 o.ooooo o.oooo4 0,22401 0,14385 o.03433
TL=4.233x10⁻³M, TM=3,050x10-3M, [NaOH]a=9;153x10-3M, INITIAL VOLUJ1E = 98.0ml 1 [HCl]a=O,O
0.350 3.049 0,00000 0,00007 0.14440 0.16453 0,10585 0,10699 0.07819 4.506 -4.045 -4.015
0.850 2.549 0,00000 0,00004 0.25142 0.13572 0,02766
TL:4,161x10-3M, TH=2.999x10⁻³H, [Na0H]a=17.286x10-311, INITIAL VOLUME = 99.69ml, [HCl]a=8.245x10- 3M
0.340 3.074 0,00000 0,00008 0,14173 0,16224 0.11079 0,10627 0,08172 4.580
o.84o 2•564 o;ooooo o.oooo4 o.248o4 0,13770 0,02906
a
b
c
d
e
[HCl]a is the concentration of titrant HCl added from the previous run (see p.79),
Titrant HCl concentration was 0,9670M,
These concentration data ar~ for the initial composition, the volume of added titrant was zero.
Data are the number of mmoles of each species at the particular titration point.
These data are the changes in the number of mmoles of the metal complex species between successive titration points,

TABLE 7.19
c Calorimetric data from the titration of the.diamine-dioxime
0 ligand with CuCl
2 at 25 C and I = 0.10M
VOLUMEb p[H+] LH a -2
LH3
LH4
CuLH --2
CuLH
o.ooo0 10.120 0.45682 0.08759 0.00002 o.ooooo o.ooooo
0.271 9.218 0.15171 0.23168 0.00031 o.ooooo 0.16222
0.421 7.307 0.00212 0.26396 0.02865 0.00002 0.25200
Changes in the number of mmoles and the heat changes
~(LH3 ) L\(LH4
) R(CuLH2
) S(CuLH) Q Qcorr 8.H1
+L\H2
0.14289 0.00032 o.ooooo 0.16222 not measured
0.05982 0.02753 0.00002 0.08977 6.410 2.784 31.02
a Values are the number of mmoles for each species of each
titration point.
b Volume of 0.5986M CuC1
2 added.
c 8 -3 Initial solution composition: TL = 5.50 x 10 , TH = Initial volume = 98.84 ml.

1
2
a
TABLE 7.20
Thermodynamic dataa for the formation of copper(II) complexes
with the diamine-dioxime ligand at 25°C and I= 0.10M
Reaction -1 -1 logK. -Li~G kJmol - LH kJmol 1
2+ ___.. 2+ Cu + LH2
...- CuLH2 13.24 .± 0.05 75-56 ± 0.3 54.84 .± 0.3
CuLH2
2+ ,;:::::::= CuLH+ + H+ -3.23 ~ 0.08 -18.43 ~ 0.5 -23 .. 69 .± 0.3
2+ + + Cu + LH2 ~ CuLH + H 10.,00 ± 0.13 57.07 ± o .. 8
+ 31.15- 0.6
With reference to a standard state of 0.10M NaCl
!1S Jmol- 1K- 1
69.5 ~ 2
17.6 ~ 3
87.0 ± 5

7.2.2
7.2.2a
Discussion ------Coordination of the ligand to copper ions
The diamine-dioxime ligand has s pot ial donor
atoms; two amine ni trogens, two oxime ni trogens anc1 two
oxime oxygens. Coordination in a planar configuration to
copper( ) ions could occur in three possible forms:
(i) Through the amine and oxime nitrogen atoms. The
isomeric configuration for each oxime group would
(methyl). Models show that the two six membered chelate
rings can readily adopt favoured pseudo-chair formation
and the five membered ring can adopt the favoured gauche
configuration. s form the distance between two
oxime oxygen atoms lS ca. 2.1X. This distance is shorter
than most hydrogen
crystalline
OH----0 Ni(dmg) 2
bonding distances invo
state118 . The hydrogen
0 '160 are 2.40A .
oxygen atoms
bond lengths
(ii) Coordination through t two amine nitrogens
the two oxime oxygens. The configuration of each oxime
function will be anti. This coordination results in the
formation of two seven membered chelate rings and one five
membered ring. No intramolecular hydrogen bonding is
possible in this form.
(iii) Coordination through two amine nitrogens, one
oxime nitrogen and one oxime oxygen. This results in the
formation of one five, one six and one seven membered chelate

ring, with no obvious strain in the structure. The 0
stance
between the two oxime oxygens is ~· 3A.
Oxygen donors are termed hard161 and do not form
co val eractions with soft acceptor transition
metal ions, e.g. C 2+ u • Nitrogen donors, as amines, are
softer than oxygen donors and form stronger covalent
b d . , . th . 161 Th t. on lng Wl copper lons • ese proper les are lected
in the visible absorption spectrophotometric data for the
copper complexes with a number of N and 0 donors.
~ value for Cu(en)(H2o) 2 max is 660 nm1 while
that for Cu(en) 2 is 550 nm1 The ~ for bis(glycinato) max
copper(II) in aqueous solution is nm 164 and for
b (picolinato) copper( ) ~ is 645 nm165. These data max
show that, while there are slight variations due to the
ferent donor strengths,the ~max values for
coordination of two nitrogens and two oxygens are about
100 nm larger than those for the coordination of four
nitrogen atoms. data Table 7.17 show that the ~max
for the copper lli~ine-dioxime complex is 580 nm.
Comp with the above data suggests that the coordination
of the diamine-dioxime ligand is as described in (i)
above. If coordination was through three nitrogens and
one oxygen ( above) ~ would be ected at ca. 620 nm max
(~max for Cu(dien)(H2o) 2+ 611, Table 7.11) and if the

'155
coordination was through two nitrogens and two oxygens (ii
above) /\max would ca. 640 nm.
7.2.2b Electronic Absor:Qtion S12ectra
Agueous Solution
In the visible region,there is a sl shift in
Amax value to higher as the pH of solution is
increased. At pH ca. 3.3 Amax is 592 nm while at pH> 6
A is 580 nm (Table 7.17). s change is interpret as max
a slight increase in the basicity of oxime nitrogen when
a proton is removed from an oxime function to form the
complex CuLH+, viz. C N - 0. At a pH > 5 (complete
of CuLH+) the position of 1\ and max shape of the
absorption band are identical for each metal: ratio
however the extinction coefficient about 9% lower for the
1:1 data, independent of isomer type or total metal ion
concentration (Tab+e 7.17).
The ultraviolet spectrum for a copper/diamine-dioxime
solution shows a more marked change with pH (Table 7.17 and
• 7.7). As the increases there an increase the
intensity of shoulder at 5-330 nm which reaches a
maximum at ca. 5 formation of CuLH+ from CuLH2
is complete. The molar extinction co of s band
1s large (Table 7.17) and it is assigned to a e transfer
tion between the C = N-0 group and the metal ion. At
complete formation of CuLH+, the shoulder position is

ensitive to the ratio of metal:ligand solution.
However, the extinction coefficient for the 1:1 data is ca.
6.6% lower than for the data at other metal:l ratios
(Table 7 .17).
There is a further band in the U.V. centred at ca. 270
nm. The A.max for this band is slightly ered as the
changes. At = 3.3 (CuLH+ and CuLH2
2+ present) the 'A max value is 277 and at complete formation of CuLH+ the band is
centred at 271 nm. above t "max value is ensitive
to the metal:ligand ratio, however the extinction coefficient
the 1:1 data is .9.§:· 9% lower than for the other metal:
ligruLd ratios (T
s band is characteristic energy and ensity of
the met reduction (L0
- M) charge transfer transition
which has been observed for copper(II)-polyamine complexes
and polyamine-imine complexes107. The oxime complexes also
show the side an intense absorption centred below 200 nm.
This may arise from an intraligand absorption (see section
6.1.3) or possibly from a metal to ligand charge transfer.
Non-agueous Solvents
The data Table 7.17 show that the charge er
transition which was at 330 nm water is variable other
solvents. There is no apparent relationship between the
band energy and the solvent dielectric constant or doncity166 .
However, the data do show that the band energy is higher

157
in the protic in the aprotic solvents; the band energy
order for the protic solvents is H20(330) > HCONH2 (350)
> C2 H5
0H( 363) .
The hydrogen bonding potentials of these solvents are
the order H2o > HCONH2 > c2 H5
0H 167 It is possib that
oximato (C = N-0-)-solvent hydrogen bonding occurs, and this
affects the energy of the charge transfer transition.
7.2.2c Thermodynamic Data
Stability Oonstants 2 log Ki
The agre between the stab ity constants
calculat from the 1:'1.5 and 1:2 data indicates that under
the p cular titration conditions the data was correctly
interpreted terms of two species CuLH22+ and CuLH+.
A visual indication of the least squares fit of the two
parameters K1 ru~d K2 was shown by using the constants to
reproduce titration curve. The difference pHcalc -
pHobs was to within ±.005 pH. For the 1: 3 data the cons·tants
obtained from the least squares were slightly different from
the 1:2 data. This difference may indicate presence of
a small amount of another metal igand species. However,
using the constants from the 1:2 data the '1:3 titration
curve could be reproduced to about 0.01
values Table 7.20 are the mean values culat
data in Table 7.16.
The log K. 1
from the

1
The stability constants for a ligand EnAO,
(CH3
(C=NOH)C(CH3
) 2NH C )2 which is analogous to the
diamine-dioxime this study (EnAO is an ~-amine-oxime),
168 have been reported . The value of log K for
Cu + EnAO ~ CuEnAO was 13.0 at I = 0.
0 .2 C. The for the reaction CuEnAO ~ Cu(EnAO-H) +
was 4.3. These data were determined using spectrophoto-
'metric methods. The o of stability to ligand
basicity is greater EnAO than for the di ·-dioxime
LH2 , in this study (13.0/13.92 for EnAO, 13.24/15.77 for ).
This result is surpris view the apparent ring strain
involved in formation of the CuEnAO complex. No enthalpy
data are available for the copper/EnAO reactions.
The data in Table 7.20 show that the formation of the
complex CuLH22 + is accompa~d by an exothermic enthalpy
change and a large positive entropy change, while the
formation CuLH22+ is accompani by an endothermic
change and a small positive entropy change.
Enthalpy change· for the formation of CuLH22+
It would be useful to be le to compare the enthalpy
data for the formation of the complex CuLH2 with the
formation of the.1:1 complex with a N,N 1 substituted
ethylenediamine, however no accurate data are available. The
data for the formation of the 1:1 complex with en are shown
in T 7.21.

Reaction
Cu2+ +en-.. Cu( en)
+ en+2H -• enH2
TABLE 7.21
-1 lou -6G kJmol -
10.54a 60.13
17.01a
aData from erence 169 bfrom reference 137; assume
cFrom Ref. 137.
159
the amine-dioxime formed a 1:1 complex th only
the trogens coordinat then the ratio of the
enthalpy change to the overall enthalpy change for
protonation reactions would be similar to the rat for
ethylenediamine. From the en data and overall
( -1 for the diamine-dioxime protonation 79.77 kJ mol , see
section 6.1.2.) the enthalpy for the formation of CuLH22 +
-1 would be approximately 43.8 kJ mol . The difference between
this and the observed enthalpy of 54.8 mol -1
(Table 7.20) suggests that the oxime groups are coordinat
to the copper ion. This evidence supports the cone
drawn from a consideration of the sible spectra.
EntroQ~ change for the formation of CuLH22+
ons
For the formation of CuLH2
2+ without the oximes
coordinat the entropy change would be expected to approx
imate that for the formation of Cu(en) 2+. The data in.
Tables 7.20 ru~d 7.21 show that the formation of CuLH22+ is

accompani by a po tive entropy change which is larger
than that for Cu(en) 2+ by ca. 44 kJ mol-1 . This difference
also suggests that the oxime functions are coordinated.
This would result in the liberation of two further water
molecules from the inner coordination sphere of the copper
ion.
The effect of coordination on acid ionisation
Hanania and co-workers17°, 1 71 have shown that the
ionisation of side groups ( NOH,> N+H, -NH3+) in certain
ligands is influenced by the formation of a metal-ligand
'170 171 bond. In general was shown ' that the effect
complex formation was to increase the acid strength (a
reduction the positive ~G of sation) of the groups.
The coordination of pyridine-2-aldoxime to iron(II)
results in the formation of a s complex which undergoes
three acid dissociations from the oxime groups;
+ FeL # FeL + H K 3 3 ' 3.
F + ---' ,-
These ionisations were studied spectrophotometrically by
Hanania17°; pK1 was not measurable, pK2 was 3.4 and pK3
was
7.13 (pK for the ligand 10. ). Enthalpy data were obtained
from the dependence of the pK on temperature. A comparison
of the thermodynamic data for ionisation from complex

with that of the free and showed that the ater acid
170 strength was due to more favourable enthalpy changes .
161
The authors attribute the greater acid strength of the oxime
function on coordination as b due to a greater
stabilisation, through conjugation, of the anionic form.
bis(pyridine-2-aldoxime) copper(II) complex have also been
172 + reported ; CuL2 ~ CuL2 - H + , pK1 2. 77 and
CuL2 - H+ ~ CuL2 - + H+, = 6. 7 (pK for the ligand is
10.04).
Data the proton ionis 2+ on of the CuLH2 complex
are shown in Table. 7.20. Unfortunately no enthalpy data
for the ionisation of the ligand LH2 or related compounds
are available. The pK for the free oxime group was
estimated as 12.3 (section 6.1.~. The extremely large
change in pK when the oxime is coordinated to copper( )
ions is presumably associ ed with the increased stabilisat-
,ion of the oximato group via the metal ion. This suggests
that the ultraviolet absorption occurring at ca. 330 nm
(see above) is associated with a ligand to metal charge
transfer. The formation of an intraligand oxime-oximato
hydrogen bond would also contribute to the stab sation of
+ CuLH . ' The entropy change for ionisation will have a
contribution from a cratic term (an increase the number
of solute particles) and a term associ ed with the changes

eo r-en u..
T
J. 1\l I
I j ('\ .u
I CL
!-1

162
in solvation of the ions.
From the titration data e was no evidence that a
further ionisation to form a neutral CuL spe es occurred
b 10.
Distribution Curves
The stribution of the metal ion cies as a function
of the solution is shown Fig. 7.8. The stability
constants given in Table 7.20 were us
The metal:ligand ratio is 1:2 (cone
the calculation.
ions given
Table 7 .12). The curves show that the e es CuLH2 is at
a maximum concentration at pH = 3.1. (Fras 5S fm_md that
to isolate CuLH2 complexes uncontaminated with Cu(LH)+
cies,it was necessary to acidify the reaction mixture to
a pH of about 3.)
Anomalous 1:1 titration data
Data analysis the 1 :1 titrations suggest that
there must be a further complex ecies addition to CuLH22 +
and CuLH+. The low extinction co cients for the 1:1
vi e and ultraviolet spectra ed_ that perhaps
soluble copper hydroxy e es were formed, e.g. Cu(OH)+ or
Cu2 (0H) 2 Perrin173 has reported a concentration
quotient K1 ' for there on
K' 1 [CuOH+] [H+]
[Cu2+]
of 1 x 10⁻⁸ . Assuming this species Cu(OH)+ is present

163
solution then the electroneutrality equation 7.17 becomes
and, as the titration data lies in the 3-·4 the term
'[H] is very small compared with 2. The introduction of a
cies Cu2 (0H) 2 will have a similar negligible effect.
The solubil product of Cu(OH)2
is ca. 10-1 9 5. Thus
for a [Cu2+] = 1 x 10⁻⁴M the solution pH would have to be
• 6.5 before ecipitation did occur. Thus hydroxide
precipitation in the region of the titration end point wi
be ( the 1:1 titrations there is a sl excess
l pres , Table 7.14).
The work of Martell and coworkers174 suggests that the
formation of hydroxy complexes CuL(OH)n+ in a pH range 3-4
is not ly (see section 7.3.2).
The complex Cu(LH)Br has been shown by X-ray analysi
to cohsist of dimeric (Cu(LH)) 22 + cat The coordinate
environment around each copper is a slightly started tri-
58
gonal bipyramid with an oxime nitrogen and an amine nitrogen
the al positions and the equatorial plane occupied ·by
the other two nitrogens and an oxime oxygen from the other
CuLH+ unit. Oxime bridging, in the solid state,has also
been observed for Cu(dmg)2
1 75 and in a pyridine-2-carbaldehyde
oximato copper(II) trim 76

1
a dimeric species was formed in aqueous solution
is unlikely that s formation would be confined to 1:1 pH
titrations and therefore the postulation of such a ec
is not likely to explain the apparent difference for the 1:1
titration data.
The species that is formed must (i) cause a crease in
e hydrogen ion concentration in solution compar with
that ected only CuLH2
2 + and OuLH+ were formed, ( ) be
composed the sence of excess ligand. A ecies
cu3
(LH) 2 where a copper ion two OuLH+ cations by
coordination through the oximato oxygens ght be formed. A
similar complex [Cu(pyral) ]+,where pyral is pyridine-2-
aldoxime, has been reported177. In this species ion
is bonded to the two o oxygen atoms
+
C)-, N J\l-0 \, / \
Cu Ao / '\ I:J c:v-o
The determination of ability constants of polynuclear
ecies requires a rigorous mathematical analysis
extremely accurate data1 78 and is further complicated when
mixed complexes are also present. No further analysis of the
data was attempt

7. 3 FORMArrTON OF THE COPPER COMPLEX WITH THE DIAMINE
DIKETONE LIGAND
Results
titration data
Solutions of copper( ) ions protonated ligand,
1
(0104 ) 2 , were titrated with standard NaOH. Data obtained
us differ ratios TM:TL are shown T e 7.22.
Only one titration from a reproducible s of titrations has
been tabulated each case. One titration is shown
cally in Fig. 7.9. The end po in the titration
t coordinated and one proton from excess
ligand. ty the blue colour alkaline
solutions of the metal-lig complex decreas with time.
This was presumably due to the decompo tion of the ligand
(see section 6.3.3). Addition of further NaOH to the
titration so ion at 7.5 ultimately resulted in the
formation of Cu(OH) 2 .
Calculations from the~+] data.
The point the titrations suggested the formation
of a 1:1 metal: and complex CuL. suming only one such
ecies,the three mass balance equations for TM' and TH
are
[Cu] + [CuL J

TABLE 7.22
pH titration and stability constant data for the copper(II)
diamine-diketone complex at 25°C and I= 0.10M (NaCl)
6 -4 8 -3 8 -4 TL= .094x10 M, TH=1.21 x10 M, TM=3· 12x10 M 88 - 4 6 -3 6 - 4 TL=7· 2x10 M, TH=1.57 x10 M, TM=7· 29x10 M
VOLa p[H+] - 108[L] c VOLb .E,[H+] - 108[L] log K n log K n
0.060 4.927 0.249 o.o868 8.583 0.060 4.825 0.206 0.0675 8.584 0.080 5-030 0.329 0.1296 8.579 0.070 4.877 0.239 0.0816 8.585 0.090 5.081 0.370 0.1569 8.572 0.080 4.927 0.272 0.0980 8.581 0.100 5.126 0.410 0.1853 8.575 0.090 4.975 0.305 0.1162 8.578 0.110 5.174 0.451 0.2214 8.569 0.100 5.019 0 .. 339 0.1350 8.580 0.120 5.221 0.491 0.2628 8.565 0.110 5.067 0.373 0.1585 8.574 0.130 5.268 0.532 0 .. 3097 8.565 0.120 5.109 0.407 0.1812 8.578 0.140 5.318 0.572 0.3707 8.557 0.130 ;).157 0.441 0.2121 8.570 0.150 5.368 0.612 0.4425 8.553 0.140 5.200 0.475 0.2417 8.573 0.160 5.419 0.652 0.5287 8.550 0.150 5-250 0.609 0.2828 8.564 0.170 5.476 0.692 0.6435 8.542 0.160 5.299 0.543 0.3261 8.562 0.180 5.536 0.730 0.7939 8.533 0.170 5.349 0.577 0 .. 3769 8.559 0.190 5.600 0.768 0.9918 8.525 0.180 5.403 0.612 0.4401 8.554 0.200 5.670 0.805 1.264 8.515 0.190 5.459 0.646 0.5137 8.500
0.200 5.523 o.68o 0.6115 8.541 0.220 5.665 0.749 0.8878 8.527 0.230 5.752 0.784 1.105 8.516
log K: mean = 8.556 a= 0.02 log K: mean = 8563
a = 0.02
a Volume of 0.1702M NaOH added to 49.94 ml of solution. b Volume of 0.2702M NaOH added to 49.94 ml of solution. c Calculation procedure is described in text.

();) "'!
..0
-"'' :;:::
.;)-to
""" ~
"'! ""< o
-a ~ <>l
" -<
'] !-"'
0 :c
or; ... 'o
~
N.
01
o:;
~
"' • -a
~~
~
E
-<!-~
"' <-!
>--\.{
\
<--! rg 0
-~
-+-(V
-s<
D
-'ij I
<'! (l)
s E
<:S'
"" "ij
...., ~
E
(l) a._
-:5;
~
0 ::t:
v 0
L (l
0 ::t
z '+-
A:
(j) ('.{
>
:::1 0
1.. r-
:;; a
u
'-+
~ 0
Q)
~
:::5
~ :!],
"' 0. en
,j-
" q
-~ N
u
. 0.
2 a-:
o::) ,....:
'-.() u
; --d-
J: 0..

T H
[L] + [LHJ + [LH2 ] + [CuL]
+
166
7.20
• 7.21
Using protonation constants of ligand (section 6.3)~
the free ligand concentration [LJ can be calculated~at each
titration point~from equation 7· From equations 7.19
7.20, TM - TL = [Cu] - [L J - [LH]- [LH2 J, thus the
value of [L], [Cu] can be calculated. The value for K1' stability const for the 1:1 copper diamine-diketone
complex~can be calculated
TM·- [Cu J (Cu][L]
and
the
The results of these calcul for the two titrations
are shown Table 7. The mean of the log K1 values and
the standard deviation for each titration are also shown.
The eement between mean values for each titration is
satisfactory. s agre of K values from
titrations at a different TL:TM ratio and also at a differ
TM concentration implies that the formation of polynuclear
species is negligible. However, the log K values Table
7. do not show a random distribution about a mean value.
is a steady decrease from ca. 8.58 at n 0.2 to ca.
8.53 at -n = 0.7. .introduction of a soluble metal
hydroxy spec s Cu(OH)+, for ch a formation constant has
been det d173' 0 equation 7.19 did not er the

167
trend in the log K values (or even the magnitude of the
constant). The total change of 0. 05 in log K is not really
statistically significant and probably arises from a small
systematic error in or::.e of the fixed quanti ties, e.g. TM or
the protonation constant of the ligand, log k .. l
As the ligand decomposed in alkaline solutions (see
section 6.3.3) no enthalpy data for the formation of the
copper-diamine-diketone complex could be obtained.
££ectrophotometric data
In aqueous solution the visible spectrum of the copper
ligand co:tnplex showed a broad absorption band centred at
648 nm (s '163). The ultraviolet spectrum in aqueous solution
showed an absorption at 287 nm (s ca. 4900) and the tail of
an intense band centred below 200 nm. The spectrum was
observed to change with time. Within two hours there was a
distinct shoulder appearing on the high energy side of the
band at 287 nm and a decrease in the intensity of this latter
absorption. After 26 hours there was a well defined
absorption at 245 nm and the absorption at 287 now formed a
shoulder at 285 nm. These changes with time were interpret-
ed as indicating the formation of mesityl oxide from the l
decomposition of the ligand (section 6.3.3).

168
Discussion
Coordination of the ligand
This diamine-diketone has four potential donor atoms,
two secondary amine nitrogens and two weakly basic ketone
functions. of the d-d transition (648 nm) is
similar to that for other copper complexes with two nitrogen
and two oxygen donors coordinated in plane (two solvent
molecules in the trans planar po tions) (see 7.2.2).
view of t weak basicity of the ketone function the
question that does arise is: are the ketone functions
coordinated to the· copper ion aqueous solution?
The stability constant of the 1:1 copper ethylene
diamine complex is 10.54 (Table 7.21) while that for the
copper diamine·-diketone complex is 8. 56 (Table 7. ) . The
basicities (log k1 + log k 2 ) for the two ligands ethylene-
diamine and diamine-diketone are 17.01 (Table 7.21) and
15.60 (Table 6.18) respectively. The ratio of the complex
stab ity to the ligand b city for the ketone (8.56/15.60)
is smaller than that ethylenedi
However, similar observations were found when the
ratios of the stabilities of the copper complexes to the
ligand basicities of a number of N-alkyl substituted
ethylenediamines were compared wi th 1 d . . 179 e .y ene lamlne .

169
A comparison the ratio of the copper complex stability
of N,N'-di-n-propylethylenediamine to the ligand b city
(8.79/17.80, reference 179) with that for diamine-
diketone ligm1d (8.56/15.60) may cate that the copper
complex with the amine diketone is more stable than
expect on the basis of the basicity one,and perhaps
indicates that the ketone functions are coordinated.
Mart l and coworkers174 have shown that the 's for
the proton dissociation of the 1:1 copper lates of a
number of carbon and nitrogen sub ituted ethylenediamines
were in the range 7 .1 - 7. 5. The narrow
obtained suggested that the reaction
of values
was relatively independent of
chelate.
stability of the 1:1
For the copper diamine-diketoneJreaction I would be
important towards the of a pH titration (pH 5. 5 - 6. 5,
see Fig. 7.9) the k one functions were not coordinated.
T s would cause a detectable di erence between the
I
observed end po that calculated assuming coordination
of the ketone groups. No such difference was found; this
indire evidence supports the coordination of the one
funct

.§J2.ectroJ2.hotom~~ris::._Qata
The absorption band in the U.V. spectrum at 287 nm is
assigned as a L0
- M charge transfer associated with the
secondary amine nitrogens. The energy of this absorption is
slightly lower than that for the similarly assigned charge
transfer for the copper-diamine-dioxime complex, CuLH2 , 277
nm (see section 7.2.2b).
The band centred below 200 nm lS possibly associated
with a ligand * t . t . 180 t 1 * n ransl lon '> or a me a _ _.. rc
transition if the ketone groups are coordinated.
COPPER COMPLEXES - A BRIEF SUMMARY
The slightly greater stability of the Cu(hm-3,2,3-tet) 2 +
complex compared with Cu(3,2,3-tet) 2 + is due to a more
favourable entropy change. This greater entropy change for
the formation of Cu(hm,3,2,3-tet) 2+ is associated with
decreased solvation in the trans-planar sites due to the
interaction with the axial methyl groups. The visible
absorption spectrophotometric data support this inter-
pretation.
A comparison of the enthalpy and entropy changes shows
that the difference in stability between Cu(hm-3,2,3-tet) 2 +
and Cu(LH2 ) 2+(diamine-dioxime ligand) is due almost entirely
to the difference in the enthalpy terms; AH is the term most
closely associated with bonding of the ligands.

17 .tNl:>8€.
Tl. !1,(.!0'1
~ l\C!O'j'
I 11114-. __. ] 1501(
T4 ec 10'1
Tc> 13C 10'7 I I ( ~m.
'" :Z.N>l?19
Dl !I'll ql~
D._ tN914
Brid~e
·o¥7p.P
ll<
<,------to
SK
. -Tl "-~'~3l11'1
I I I I I I I
Aeeenohx A.
·~]I , ..
C uloriMe+er- Girw\ T
~~F
lb11w
+15
LaD
1\(
·~
I I
-.lt)'-f'
3'11:
f'YJ_ I Bo.l.C
l7!1' l'x>I.R
I I ~
Po we~
T,..,eco"~t
D,
To lteco
+!}
....,tro_MS: :TI .li'HI tbvw
0 }.,_ ~O!I
T5 I>Cjj
- .t.~ ... 2;1 Z(,l
,.. ... , I -IS

15w lia.~he:c\-eJ-.
Thermis+or z,
I!
i I ~tJ li:~ I I 1 I I I yu
oo
T. .2.N"I>l'll'i P1 S'( 1?...7 -.::.1 z51Jb \OK ®
T,_ f.Cl17 D,_ BY 1:1,.7 Zz.. z~Vb I -!2,
T3 :tl'l >05'3
:tN :lo:5'4 ·<>¥"V<f'
l' 'l:t
I ®
0
~J ~-0¥1 cv-·. ± -II.17W
T. • .Jt..!'--4' ,I(;
-12.
:<N 581 'i T(:, 2N >o?i
D, ill "flit T7 .jct>$i'f'
V\/ater- Bo.th TeiNipe.rcth ... te CD.-Jroller

APPENDIX B
Determination of End Points in Potentiometric Titrations
In a potentiome c titration the end point
reaction will be revealed by an increase in the ~ope of the
plot of (or EMF) against titre; the actual end po being
at a titre value where the slope of the plot is greatest,
i.e. where the derivative of with re ct to titre is a
maximum or where the second derivative is zero. The
accuracy with which the can be found us
derivative methods depends on the magnitude of the change
pH in the on of the end point which, acid-base
neutralisation reactions depends on the strength of the d
and base.
Generally, the derivative method for the determination
of titration end points was folmd to be adequate in this
study. However, some cases (where the magnitude of the
change in pH the end point region was slight), for example
the titration of 3,2,3-tet and excess HCl with standard
alkali, the end po for the neutralisation. of the excess
acid could be more accurately assessed by the use of a Gran
plot181 • The app cation of this technique has been more
recently reviewed by Rossotti182 . An outline of how a Gran
plot used, as cable to the 3,2,3-t tration, is as
follows:

Let v be the volume of alkali required to neutralise the e1
excess acid and v be the volume of alkali required to e2
neutralise the excess acid plus one equivalent of acid from
the tetraprotonated ligand. At any point in the titration
(v, p[H+]) before the first end point:;
=
where TH is the total available excess acid and CNaOH is the
concentration of alkali added. If V is the total initial
volume of solution then 7
V.TH B v.
where B is concentration of base. Now at the equivalence
point VxTH = v xB, thus e1
(v - v)B + e1
[H J = (V + v) .
Now multiplying by the activity coefficient for the hydrogen
ion YH+,
( V + v) [ H+ ] y H+ = ( v e 1
- v) B . y H+
(V+v)10-pH = (v -v)B.YH+. e'1
Thus if YH+ and the liquid junction potential are constant
then a plot of -r1 against v is linear and when extrapolated
to T 0 gives v = v e'1
equilibrium
After the first end point1the

/ .. .,.
I /~
.,_
I ..
I \1)
1:l.
<-1 ("'!
"' ~ :':! 0
, "i
~
..., "!
:r:: 0 tl 'Z
:>.: ('<'> ~
1.1'\ (!)
0
<t Ill f :s
:!i
c: 0 -F
a i <5 -u
g \);
"t +, <
", N
('({'
).
4= .,. "'0 0:: c (S
1--0 0
') ·-u...

<
' ' to be considered. equation
[(v- '1) .BJ H+ lr[V x He _ (v- Ve'1) .BJ
kA = (V + v) [ J I I v + v v + v
is valid if the e concentration is small compar
wi
3,2,3-tet. Re
V.H - (vc
at the second
V.H = (v -c e 2
the rearranged
)B
H is the cone c
equation ('1)
ration of protonat
s
( v - v ) . B • [ ] /k A e'1 .
point
) • B '1
of equation ('1) from (2)
(v -v) = (ve2
multiplying both
't2 = ( v - v ) '1 e'1
e pH is the
potential,
s of this equat YH+ gives
al pH value. the liquid
and kA are then a plot
('1)
(2)
against v will be ar and ,when lated to -,; 0 ,
give the value
Gran plots for
ac titration with
v e2 two equivalence po s in a 3,2,3 et/
andard NaOH are in Fig. '1.

APPENDIX C
The Algebra of Least Squares
Consider a set of n equations which are ar some
n>m
+
+ • • • +
('1)
bn an'1x1 + + ... + anmxm
where b. l
and a .. lJ
se from erimental observations.
These equations ( '1 ) are more readi expressed matrix
at ion
A X= b
As elements b. and . are subject to experimental error, l J
a method is required whereby the 'best' solution of the set
of m parameters found. A vector residuals is d
r=b-AX,
the be solution being that whi minimises the sum of
weighted residuals, i.e. minimising
M
where is transpose of the vector r. minimi
condition aM/oX= 0 gives rise to the expression1

These are called the normal equations183 which can be solved
directly to obtain the required estimates of X by pre
multiplying ATb by (ATA)-1 ,
The equations (1) are linear in the unknown parameters
x.. A non-linear problem can also be solved by a least l
squares procedure by the use of the Taylor expansion.
Consider a set of observable functions fi of m
parameters xj; fi = fi(x1 ,x2 , ... ,xm). The function can be
expanded in a Taylor series about the point (x1° ... xm0 )
and neglecting terms of order higher than one184
~ fi (x1 f, l
or
f, -l
or
0 0 ()f. l
• • • X ) + ax1 m
m of. 0 f, l Rj L: oxj l j=1
m of. l
L: -a- . 1'1x. j=1 xj J
0 af. 0 l (x1-x1 ) + -- (x2-x2 ) + ...
ax2
0 (x.-x. ) J J
(2)
thus the problem has now been reduced to a linear one of the
form b = AX as above. For given approximate values of the
parameters x.,the corrections f'.,x. can be calculated. As the J J
non-linear terms in the Taylor expansion are ignored7it is
necessary to repeat the solution of (2) until convergence of
each x. is obtained. J

Matrix Inversion - The Choleski Process
A symmetric matrix A can be factorised185
A =
The inverse A lS where L is the lower triangular matrix.
(LLT)-1 = (LT)-1 ( ) and (LT)-1 ( -1 )T L ,therefore to
form the se of matrix A the three steps in the process
are
(i) factorise the matrix into its lower triangular
( ) invert the lower triangular matrix
(iii) premultiply this matrix by s transpose.
This process was used in the least squares program ORGLS.
The matrix inversion carried out SUBROUTINE MATINV
(see Appendix D).
Errors in Least Squares Analysis
Errors in the parameters xj are calculated during the
1 t 1 · It b shown186 that t eas squares ana ys1s. can e . ance-
covariance matrix of the parameter estimates is by the
inverse of the normal equations matrix multiplied by an
unbiased estimate of a2 , the varirulce of an obs on of
unit weight, an unbiased estimate of which can be obtained
from the weighted sum squares of re s. In general
the e.s.d. of parameter i is given by
2 (a .. ) ll
(3)
where n is number of observations, m is the number of

:parameters, a .. is an ement from e matrix of ll
normal equations l:w(LI.ri)2 is the sum of weighted s s
residuals. endence of the of each on
weighting s is evident from (3).

APPENDIX D
Computer Programs
The Fortran computer programs ed owwere used on
an IBM em 360/Model 44 computer. Graphs were plott on
an IBM ~620 computer, with a 1627 X-Y p tter achment,
the PLOTA subroutine package187.
Program ORGLS
s program was modified from the program ORGLS of
.R. . H A L 188 J_ng and . . evy . listing below shows the
program adapted to calculate log data for proton-
ation of the ligand hm-3,2,3-tet. (The program ORGLS was
also adapted to enable copper/ligand il constants
enthalpy to be calculated. The appropriate changes to
subrout PRELIM and CALC not been shown).
program consists of five sections; four sub-
routines PRELIM, CALC, and MATINV and the MAIN LINE
program. PRELIM enables pre calculations on
init -data, e.g. calculation of n from pH titration data.
In CALC a value the observed quant YO is calculated
from the parameters P and variable X (hydrogen ion
concentration in the program below). MATINV incorporates
the matrix inversion process (see Appendix C). TEST lS used
to apply checks on the parameters the of each l
squares cycle. The various sect of the program are
described within program b ow.
The programs FORM, THERM ~ DIST and CUTHERM are
scrib within the listings below.

C ORGLS C L AST SQUARES ANALYSIS OF THE HM323T T PH DATA c
SUBROUTINE PRELIM(YO,X,NO,SIGYOI c C Hi ALCULATl r~ A.R /':,f\JD Til STA!\JDMW D IllATION JF BAR c
c c c c c
UIMENSID~ X(2,10 ) ,YO( UJMENSION SIGYOI 00)
INPUT DATA -- SOLUTJDI\l CmAPOSITlON HHA ACID TH, TOTAL ll TITRANT NAOH ALK, IONIC ACTIVITY FUNCTI OF WATER GAM/\ , VOLUME OF TITRANT YO , SOLUTION PH X
AU(5,43l TH,SL,ALK,GAMA 1.1 I=l, 0
F(X(l,II" t;;:,l 8 l GO TO (1,11 (X( ,I) 862l/a99 H =X ( 1 t I I + } ,~ :' ') 3
XI ,II lOo**C X( ,II J H Co>!t>!<(-PHl D H =X ( 1 , I ) -11
o94/(49394+YO(I) I TL S L >:<() ACID= TH':~Q /\U\ YCJIII 1\LI</( YD(I))
C Cf,_ CUU\TE THE S D DEVJtHIDf\l FOR fJ SIGYrJ C T (ACI t\LKA ?/TL
SL
S 0 ( I l = S R T( ( ( 7 E- ll~ I { G MiA* X ( 1 , T Hn:< 2 l ) t,: n l~ l HI T L ) ':' + C U \I S T ":": r \,
2 l
C TORE ~BAR A YO c
(I) (1\CIIl-X(ltll+ :; Ci R H f, T ( ( F: l 3 ) , F l
ETURJ\1 \j[l
SUI'\ OUT E TE T(ISf DI NSI P(l ltSCJS I=l IF( (Ill 3,3,4
STCJP 1 0 TO 8
1+1
,P··.1SQSIG,NP) ( ;~ '
CI NP) 5 AUlGl,)( S ( 2 ) ) A L DG (SQSIG(l))
IF{t\) 11tl I\; -A

c ("
"-'
c
c
1 J (/\aLTo G C1 Hl 8
7 ISTUP=2 i1 C J l'l T I r·~ U
RETURf<l ENLJ
5) GOT 7
RROUT 1"lATI ( i\ H t 1\l t ~'l F /A I L l
:3
Il"lE SI AM(-7 ;;!c{~ ;~~~ * Xt S E G
>:o:n;< F A C T iJ R ~4 1<. l IF( lll ,8,9 .t\M( 1=1 I ~HU GO Cl 2
T OF CH IX INTO L
*>:' ~' L M D F /\ ( L , ~~ ) [)[) 7 t~ Ii"iAX=M ':o~ >:o:< L P L Cl F
L = fvi, i'.J = [} d ::~)
' l
E E
I I 1\1 V THI.l\\1
I 1 1 fv! l A(Ltll*A(M,Il :\o:< ':'
I =KLI+J
!<i\ili+J
I l >:' Aiv1( Ki\'1 I)
C **TERM IL,MI-SU ***** AM ( K l ~su~;1f\
L r4l3,3,:; T fU,!)l ,1,
C * A(M,MI=SQ T(TERMI ***
c 5 6 7
c ,-\... i }.
c
c
NOI'i= StJRT I TE Rf"l) { K l = D f\l Dlllj
fl TCJ 6 FI\[L= K ll TO 3•JJ
.1\ ( L, t'l) T Rfv11 A ( ivl, 1'1) *':<t.d<Y.< AM(K) TERM/0 NOM
K+ 1 "HHW ***** * SEGME 2 OF CH SKI INVERSION **********
*****IN RSION 0 fRIANGUL MATRIX *** ) = 1 " I MH 1 ) 1
** STEP L OF BIL,MI ***** DO l)tt L=2,N I<D f'1= KD 1'1+ N-L + ***** R CIPR ~AL OF DIAGONAL T RM ****
R~·1 = ~:>I A ( KD~~ll (KDi'n TEfUti I =':1 I L AX L-
P M Of BCL,MI ***** r1o 1\13 1\11= 1, r r1AX K=KLI
C ***** UM TERMS ** ** su J DO 02 I fv1 7 I!Vii\X IT f'II+l SU S Uf"ll\ r4 ( 1<. LI H< Mill I I )
l KL KLI +N~

c c c c r L•
c c c
·; (; '~ -
21 29 4 '!· 5 ;;-_)
5 51+
~) B 59
61 c)
'· 63 64
b 67 6 6 7 7 7 7
T~S A S (WITH F L F TR N LEAST S
OIMENSTONS FOR NVIMAX)=l~ , P(MAX)=
y ( l ),SIGYJ(l D D D [) V( ) 1 C(2) ,DV(5 >,DD(21 n u
FfJ i"'A T STATEMENTS
FD T(8X,I21
SClSIG,
FO TI•0•5X,Il,5X,El o4r5 ,F8.4) FUR Tl':l I P LCJG(Pl 'l FCN T(Fl o2,8Xvl21 FORt,iLIT('O IONIC STR NGH-1', 5,2,5X,'TlTRli.TICJ\l NUHC1 R B 1 ,I) FCJRiV!t\T ( l8A4) ~OR T(////lH 1 A41
D TI7L5l T(32HUNUIIIJBFR OF CYC IN THIS JD ISf2/37HONU~1B OF PARAivJET 0 BE VARIED ISI3/51 MBER OF I~ PENDENT VARIA LES PER OBSE
TI Oi'i IS I 2 J AT(31HJDERIVATIVES P M.t!~~lED lW US l
TI57HJNUMERICAL DER TIVES UNLESS ARAMETER INCREMENT IS ZER
HTS TO E SUPPLIED BY U E IGHTS 0 BE SET BY P 0 ERS T RE RFAD AS ~PU FRS T TAKEN FR C
) TA) I;~, 1611 OF PR VIDUS JOB

c
1 (C)-C)/SIG(O) X(l) 1 )
79 FOKMAT(iH 6(El~e3,5X)) Bil r-Dlz.HAT(51H)AGREEf"lENT FACTORS Bl\SEO mi PARM1FTERS i:H·FURE CYCLE !2/
12:::~1lJSUfv1(W*If1-C)>'~>:<?) IS tll 3/35HCISQRTF(SU~H~~':<(D-C)>:o:<2)/(f\!O-f\!V)) IS 2 [11.,4)
81 FCJRMAT(6JHOESTIMATED AGREEMENT FACTORS AASED ON PARAMETERS A~TER C lY:LE 12/20HDSUMIW*(O-CI**21 IS Ello3/35HOSQRTFISUM(W*(0-C)**2}/(NO 2-~\JV)) IS Ello4l
83 FDRMAT(62H MATRIX HAS A ZERO DIAGONAL ELEMENT CORRESPONDING TO PAR 1AMETERI3,16H OF THOSE VARIED)
85 FDRMAT(4JH SINGULARITY RETURN FROM MATRIX INVERTER) Flh FC1RMAT(37HlPl\R/\METtRS AFTER LEAST SQUARES CYCLtLU58H OLD
C H Ml G E f1J E ~~ F R FW R I 1 H l BG FORMAT(lH I3,5X,El0.4,15X,El0 41 R9 FORMAT(lH 13,4(5X,ElUa4ll 9t FDRMAT(66HJSUBROUTINE TEST INDICATES THAT JOB IS TO BE TERMINATED
1FDR EASDI\!12) 91 FJR TC 1 0' ' REASON 2 PARAMETER INCREMENTS SMALL ENOUGH FOR
lADFQUAT~ REFINEMENT 1 ) qz FJRfv\AT(lHLdfWUT D.ATA/tr H I P(l) KI(l) DP(l)/ lH )
93 FORI'v\AT(lH I3,5X,Eli:)"'4,5X,ILt,3Xtfllo3) 94 FDRMATI51H0CORRECTED PARAMETERS NOT TO RF SAVED FOR LATER USE) 9 5 F ll R H 1\ T ( 51 H JC ( 1 R R E C T ED P 1\ R A fv1 E T E R S Hl B E \'i R ITT E N Cl \J P R I VAT E TAP E ) 96 FORMAT(ilH~CDRRECTED PARAMETERS TO Rf WRITTEN FOR CARD OUTPUT) 97 FJR~VIT(l9HJCDRr~ELATIO\J 111\ATRIXl 98 FORMATilHJI3,l:F9a4/(lH 3X,lJF9~4l) 99 FllRI<lt\T( 1 (P 1 R[ASDI\1 1 r~FGATIVF flR Z RCJ I)ARAtV\ETER FJUND 8 )
INTEGER ~DR,PTR,PCH PCH=7 RDR=5 PH:=6
C READ TITLE AND CONTRflL DATA ---- IflNIC STRFNGTH AISTR , C TITRATION NUMBER TN , NDe OF CYCLES IN JOB NC , NOo OF PARAS, TO C RE VARIED NV , NOaOF DETERMlNATIONS OF THE VARIABLE X , C P E R T V A T I V E I ~.J D I C !J, T Cl R I 0 , W E I G 11 T I N D I C .A T D f<. I W , I P ,rc., t\1 U I T /". F< t C CllJT PUT CL!!'H R 0 L PA F~ M4 E T FRS c
r i'l T [ = ~! RE/\D(RDR 1 2 .1l KODE
3: REI\D(RDR,5l)(TITLF(I) 1 I=l 1 lP) WRITE(PTR,~2)(TITLE( II,I=l,lB) READIRDR 9 41) AISTR,TN
RITEIPTR,40) AISTR,TN
2 :~J4
206 207 2()13
21 ' 1
~~ 11 212
2 ~) 1 c c c
AD ( R DfZ, 53) NC , NV, f\l X 1 I 0, I lrJ, 1 P , IT ITE(PTR,541NC,NV,NX
IF(ID)2~~,2G4,206 \i>!RITE(PTR,58) GO Tel 2 J7 \~RITE( PTR,59)
H(ltiiii:21J,208,21 ~JR!Tt(PTR,61) GCJ TU 211 ~iR IT E ( PT R, 6 2 )
IF(IPl212,212,214 ltiRI Tt( PTR,63) GO TU 21 \rHUT!:(PT 64)IP
IF(IT-11216 1 18 7 221 ~JRI T[( PTR,96,) GO TO 3:H I'H~ITECPTR 1 95) GD TO 3 H \~RITE( PTR 1 96)
Rt=AU TRli\L PI\RAivlf:TERS P, A~ID f\JO, OF PARAS
3 l IF(IPI4ul,4 1,501 4 1 REt,D(RDR,66)NP,(P(l) 1 I=l 1 NPl
NP

CO Hl 6 1] 5 () [! 0 5 D 3 J = l , I P 50 r~ NHI NUE 60 WRITE(PTR,67)NP c C READ OASERVATIONS Tn SFNTIN~L c 8Ul
111) l
c 13 [1 1
66i'll 50
1601 16\J? 1611 1612 c c c 62
c
1653
c c
c
l y;)2 c c c
2 . l
c c c
220 c
J= J=.J+l
READIRDR,68) ISENT,YO(J),SIGYO(J),XI ,J) I F ( I S E NT ) B 0 1 1 R :> 1 , 1 l ;1 1
=J~l lTEIPTR 7 69lNO
EAD KEY INTE~ERS AND PARAMETEK INCREMENTS IF SPFCIFIED IF(NC)l6)l,l60l,l301
READIRDR,70)(KI (l),l=l,NP) IF(ID)l501,1611,15Dl
R El\ D ( RDR ,71) ( DP ( I ) , I= 1 , ~J P) GD Til 1621
DD 16=12 I=l,NP Kl(Il=n
DO 1612 1=1 7 1\IP DP(I)=9,}
I~ITIALIZE PROALEM AND ENTCR SUBROUTINE PRELIM If PROVIDED
= ( f\lV>:< ( Nl/+1) l /2 QSIG(l)=laO
CALL PRELIM!YO,X,NO,SIGYO) PUT OUT TRIAL PARM1tTERS, l<FY INTEGEHS, AND PI\Rr\MEH:R I!\JCRI:::Iv1f\lTS
ITE(PTf~ 1 'J2) 1653 I=l 1 i\JP v,:p I TE ( P TR, 9:3) 1, P ( I) , K I ( I), DP ( I l
ST.\RT LOOP TO PERFOkH I~C CYCLES /\f\ID CJ\J:~ r::Il~AL CI\LCUU\TID!\J CJF Y
'J :::: y ::: i'J c + l [lrJ 85'.;1 I C=1 1 ;\JCY
C L[ AR AI\ RAY:, Mm V 1: XC E PT 01\1 L !:\S T CYCU.: lF(IC-f\lCYllH5 t2').J1,2:J\Jl
D ll 1. il 5 2 1 = , [\Jfl\ 1.\1',1(1)= on
DU 19;)2 I=l,NV 1/ ( I ) = a· l'
Ii\1 I T I 1\ Ll Z E F 0 R C Y C L E I C A i'lD P lJ T 0 U T C tl. P TI lJ \! F 0 R L l S T U F Y ( C !1 L C )
SQSIG(ZI=SQSTG!ll SIG=U~·:J \vR IT . ( PT R, 52 ) (TITLE ( I I , I= 1, 18 )
iii]R I T E: ( P T R , Lt •• • ) .A I S T 1\, TN \dfUTEIPTR,72)JC \i~ R I T E ( P T R , 7 3 )
STARf LOOP THROUGH NU OBSERVATIONS
DCl SiUl I=l 1 "HJ
Ei\HER USCRS SUBRCJUTINF TO CfJr'1PUTC Y(CALC) L\1\!D IJCRIVATIVCS
CALL CALC(I,X,YC,P) C OlHAlf\1 ~IC:IGHT Af\JD CALCULATE QU/.\f\JTITIES FRDi~ Y(CJBSI-Y{C/\LC)
If( ItoJl2S:!l,25ll,26J1 25J SQRTW=loD/SIGYU(ll
GO TO 27;)1 26 SIGYU(Il=l-,
SOR Tvl= 1, 270 DY=YO(JI-YC
WOY::: SQR H~>:' DY S I::;== S I GHJl)Y':'WDY

c C P U f IJ U T Y ( C A L C ) A f\l D U T H E R II~ F 0 R tvl/\ T I 0 ~J F 0 R D N E U B S E R VA TI CJf\J c
2 .) 7 lt4 fZ I T t ( P T R , 7 'J I Y 0 ( I ) , Y C , D Y , S I G Y 0 ( I ) , \;/ D Y , X ( 1 , I ) C B Y- P A S S D E R I V A li V F A i\l D ~~ A T R I X S t= T - U P 0 N F I \J A L C i\ L C C1 F Y
I F( I C - ~ l C Y ) J D H , 5 1 Cl , 5 1 1 c C START LOOP TO STORE AN ARRAY OF NV DERIVATIVES c
3.,)C1l
3 (~ c
]3 ) 1
c c
3lt 1
36
Lt- 'J I '1 '+ J.
c c c c c
4 3 ~~
45 '
4-B
c c c c
') t+ [!
56
58' 1 c c
J=l D 0 t, 1 :1 1 K = 1 r r--.1 P
IF(KI(K) J41~1,4lul,32 1 IF(I0)34Jl,33ul,34 1
OBTAIN DERIVATIV~ FRCWI TIHJSE PROGRt:iJJ\~1ED RY USFR DV(J)=SQRTW*DCIKI
GD TCJ L~,);) l OBTAIN DERIVATIVE NUMERICALLY UNLESS PARAMETER
INCREMENT IS ZERO DPK=DP(I<) IF{DPK)3601 1 33 1,360
PSfWE=P ( K) P ( 1<) =PS/WE+DPI<
DV(J) SQRTW*IYD-YCI/DPK P(K)=PS/\VE
J=,J+l CONTINUE END LOOP TO O~lAIN D~RIVATIVES
START LOOP TO STORF MATRIX A~O VECTOR l6Cl'+ OR GLS SHJRII.GE SCHt:fv'tf= IS REVERSE OF 7J~hJ CH< CLS
JK=l DtJ :SJ)l J=l,~N
TU'iP=DV ( J) I F ( T E fl-1 P l 4 ':'> 1 , 4· ,:+ ~ 1 9 4 5 : 1
RY-PASS IF DERIVATIVE IS ZERO J K = J I<+ ~IV+ l- J GO TD 5 )Jl D tJ 4 Fl;~1 1 K = J , tW
AMIJKl=AMIJK)+TFMP*DVIKI JI<.=,JK-tl CUNT I ~lUE
V(Jl=V(J)+TEMP*WDY C 0!\IT I ~'JU F END LOOP TO STORE MATRIX AND VECTOR
CfJNTINUE f: ''I D L 0 Cl P T H R r1 UGH i\l 0 0 B S E R VAT I 0 \J S
COMPUTE AND PUT OUT AGREEMENT FACTORS
SQSIG(l)= SQRTISIG/FLOATINO-NVI I hRITi::(PTR,8:!)IC,SIG,SQSIGill BY-PASS MATRIX INVERSION AND PARAMETER OUTPUT ON FI~AL CYCLE IFIIC-NCY)540l,B7Ul,87J
l I= 1
START LDOP TO TEST FOR ZERO DIAGONAL ELL:f'IIEIH
ISING=t1
I ID=\JV DO ~')8(';1 I =1, NV
IFIAMCIIl 1578 ,56 1 1 57)1 ISP~G=l \AJRITE(PTR,83)I
II=II+IID I ID=I I0-1 CO~Hli\llJE E~D LOOP TO TEST FOR ZERO DIAGONAL ELEMENT
TERMINATE JOR IF ZERO DIAGONAL ELEMENT WAS FOUND

c c c
6 )
c 62
c c c c
63
A 6 1
c c c
c c r ,,
7 6 (l i.
77
81
c c c
c c
112
c c
I F ( I S II',! 3 ) 1 3 t 6 1 , t
ENT R SUBRJUTINE TO REPLACE MATRIX WITH INVERSE
CALL Tif\lV{A}l IF(IS NGI620l,
TER~HI\JATE ~l ~JRITEIPTR,B GO Tll 10 CJ1
'\IV, ISING) tH,6201
IF SINGULAR MATRIX WAS FOUND
S SJG(l}
TART LOOP FOR MATRIX VECTOR MULTIPLI ATION F P !\ R l\t"'i E R C H A G
DO 72 PD Ll I IJD=NV-1 DO 7Dt11 J= ,NV
PDI PDI+AM( LJ) (J) IFIJ 1)67Jl,68 ,69
LJ==IJ+rJD IJD=IJD-1 Gn TO 7 (l
SAV DIAGONAl LEMENTS OF INV RSE MATRIX
DIAG( I) AIV\( IJ I IJ=IJ+l COI\iT I f\lU
P l)=PDI S S I G PO p:'v ( I l C TINUF r: LCJLJP rm lviATRIX V CTOR r~ULTIPLICt~TID\1
R Cfli',1PlJH: l\C, E IV\ i\!T Fi\CTCH\ USING \lfCJDIFIED SIG
TCSIG/FLO -NV)) OUT CAPTI R LIST Of CORRECT
TECPTR 1 52) TITLE(I),J=l,lH) T (PTR 7 8 ) C
START LOOP TO CORRECT AND PUT OUT PARAMETERS J;:;: DO W:J:H I 1 <\JP
I F ( t<I ( I l }7 1 , 7 6 ':' 1 , 7 7 . \"<JRITEIP P 7 88ll,P(I),P(I) GD TU B \il POLD=PCI) P ( I ) = P tJ L D + P D ( J ) SJGP=SURTIIJIAG(Jl I S SIG( l WRJT[(I 1 TR,i19)I 7 POLD, D(J),P( l) 7 SIGP J=J+l
COrn I NUE END LOOP TO CURR CT Ah!D PUT OUT PARl\~1lET RS
PUT OUT tSTIM,I\TED txGREE~H::\IT F TORS \11/RIT IPTR,fH}lC 1 SIG,SC;!SI (l)
ENTER USERS SU ROUTINE TO TEST AND MODIFY PARAMETE S JR Et'-lD ~I B
ISTDP=O CALL T STCISTOP,P,SQSIG,NPJ
WRITE CORRECTED PARAMFTFRS ON AUXILIARY TAPE IF DESIRED
IFCIT-1) 84 3,820 , 2 4 R2 4 NT=7 c 2 5

\tJ R I T E ( P C H , 6 6 ) i',l P , ( P ( I ) , I = , 1\J P C D l iV1· 3 IF(JSTOP) H5'Jl,85(\l,84\ll fl4 l \,fRITEIPTR 1 9:')ISTCJP
IF (I STUP-l} 04l(J,8410,::-l4ll 841 W?ITEIPTR,99)
GO TO 87Jl A4l W~ITE(PTR 1 9l)
r;o H1 87tH i35Cil CUNTTi\llJt
C END LOOP THKOUGH NC CYCLES AND FI~AL CALC OF Y c C RMINATE JOB
A7Jl INCllJ5 1,1 5 1,8Bul c C C 0 1\J V E: R S I 0 N 0 F THE C 0 1\I.S T MH S T [) l 0 G V !\ l U E S c
R8 l WRITE(PTRt291 DD f:l522 I=1 1 NP IHP(l)) 18d8,19
18 ZP(l)=L,~!
19 85:2 2 c
\ :!i.·1
2dl. 3l'tl
::i 1
Gll TO :3522 ZPII)=ALOGlD(PIIJl (,JRITE(PTR,21> I 1 P(l) 7 ZP(Il
CALCULATE AND PUT OUT CORRELATION MATRIX WRITEIPTR,5l) (TITLEIIl,I=l,lSJ I!WITE( PTR,':/7) Dll 9llH I=1 7 1\IV
DIAG(l)=J.,:>;;/SQRT(DIAC( I l) cmnr hJUE
IJ=l DU 1,_;2'~! I=l 7 1\.lV
IW 96;)1 J=l, i'IJV R D ~J ( J ) = IJ .~ ) C Df\IT I f\lUE
D u 1 J ;) I l J = 1 ' ,\j v ROWIJI=AM(IJ)*DIAGIII*DIAGIJI IJ=IJ+l CfJf'H I 1\JUE
WRITE(PTR,98li,(ROW(J),J=l,NV) CONTI 1\JlJt:
Clf\ITI NUt= I'HE,TNTE+l 1 F- ( I NT E-- K ODE ) 3D , 1 :!5 til 7 1 J 5 :~11 S TIJ fJ t= i\1[)

,~
;_,
c c c
)~
~<TO CAL:UUH
FORM ****************** ************ *********** *
TH FORMATION CURV[ FOR TH K TONE Ll ~D * c ********** *********** ******************* *********************
{'
""
MENSIO~ PHI l 1 VI -:::: .. 1 (S,BDl 1)~=
R (5,72) ,~[,ALK,GAMA,AISTR 1 TN,C
., t6,7E'l TA 1TL 1 AL {6,73) AI::,TR,Tl\1 (6,74) (6,75) I l,NO
C 1\PPLY DlWI S CCJRRF::CTlO!\J TO TI!E M ASURt:D PH DATA c
I) CU!~R /( 9 9 +V(I)) ~<Q l)*ALK/( 94+V(I)} >): ;J
7 { PCH) = ~J 7E 1 /IGAMA*HI
Z'\! =( ID-ALK/\+llli<.H lll/ZLIG IF( DE 4t 9
1) \rJ ITE(6 1 76) V(I),Zhlt~AR,PCI-1 I< E 1
AP!JLY CALieRi\TlfJI\J CIHWf' CDR CTIWI HIT 1"1[/l.SUR D PH Dt~ T,",

c
c
DIST *** ******* ********************* ******* ***** *** ****** *** )!;: * >:< OISTRIRUTIIJ:\1 CURVES FfJi:{. COPPER DXIMf: AS A FUNCTION UF THE ,:,
SOLUTION PH * i\LSO PLIJT OUTPUT USP,IG THE If3f'\ PLOTT R '::
* ********** ************** ****************** **** P II ( ?. :.1 ) t H ( 2 (:. I , P t'l ( 2 ,) 3 ) t Z ( ) , 1\J I 2 l , L I \l E ( l Yl(2 OJ,Y?(2 O),Y312 J ILAR Ln1l JU\R L(33) KUU3 L(5~~) r-1UI, ,LH2
1 BLANK,AST,X,PLUS '/,BLANK/' '/ 1 AST/ 1 * 1 / 1 X/'*'/ 1 PLUS/'+'/
5, 79) NI\ODE 5,73) TL 1 TM,TN,AJSTR 1 KDDE 5,721 Z4,Z3,Pl,P2 (6,61) 1\ISTR,TN,lL,Tr~ (6,67) (6,62) Ui·tZ
H:(6,7~5) TE(h 1 76) Pl 1 P2 fE(6,63l T E ( 6 , 6 (J ) D(5,8J) IUH>EL,JU\ L,KU\B[L
Dll 1 J l l!'i (,l) :J fUTf:(6,6
PH ( I l H{!l=l **( PH(III Q:::J. +l (l)+l3*!4,'<H(I)';' J\=D PH- Pl~.<D2/H( I) H D+(T TLl*lPl+P2*P LH2=(- +SQRTIB**2+4D M=TM/( +P *LH +P2*Pl f'1LH =P "' H2 MLH=P2* * *LH2/H(I) P ~1 { I , 1 l == '~ f', I H1 Fi(I,2) ':<l;Oa/Tt1!
11,31 M 1) /TM
) I I )/(Z,.;'<A) /H(IIl
CONVE SION TO FIX U P fNT MUOE
DJ 13 L 1,3 zru rr11(I,LI rl(L)=l(U I F ( ( l ( L l - ~l ( L ) I G E " 5 I (; D T 7 GO TO 13
7 ~\1 ( L) ~\l( L) + 3 C Oi'IT PlUt:
DL112 K=l, 1 1 Lli'JE (K} SL K
[)() 14 J;lt3 IFINIJI0ST 1 l GO TO 15 GD TO lit i'l(JI=99 CJNTI i'HJE LI ~.J E ( N ( U + ) = X L T 'J E ( 1\l ( 2. ) + ) = J\ S T LINt(N(3)+ )=PLUS Lir\lf(ll=D
-PLOT ON LIN OF DATA

c 3
t* c c c
c c
W IT (6,651 PHII),LI~
I (I KODEI 3,tt,t~ I I+ 1 P'HI) PH(I-llh 2 GD TO 1 ~\1 ITE(6,7f1)
PUT OUT PE~CENTAGE CONC NT ATION DATA
E ) ) l PH(I),Y (J),Y (I),Y3(I)
PU H OUTPUT FUR I i',1 6 .'/ 7 PLOTTER USING PLOT!\
,'TITRATIO~ NUMB R IS 1 ., I 1 '· • T Ll\ L H F T i\L C D f\1
,) X' I L I Gl\f'H) p n T D ~.! l\ T r '\! • l
!\ I
PERC ~TAGE OF SPfCI
1
1 7X 1 13) v4X,El3 ,4X:, I )
1
METAL LJGAND FORMATION') t-1 ~~Lil2
I )
HLH I I

c c c c
T~ERWl OMPOSITI OF TH C~ ~IMETER SOLUTION FOR MINE PRO ATION REA ION USING NEWTO~ RAPSON
IUN YO( ) 1 SJGYC1( ),R(5 ),S( ),T(5 },U(5 )
8 J=J+1 K A0(5 1 69) I NT,YOIJ) IGYOCJJ
IFIISENTI 1,801,11 l i'J]=J 1 c C NT R P LIM TO CALCULATE SOLUTION COMPOSITI ~
CALL PREL[M(YO,R,S,T,Ul c C PlJT OUT :::HANGES IN CO~ICEI'H ATION OF SPEC! S
I\ITE=(6,75) ITE(6,76)
r•
u
C PlJf'ICH OUTPUT FCH{ THF l ~,ST SQUAR S PRO RAr11 THER~i( AD.b..PlED DRGLS) c
l ') J I l t N 0 \f.J fTEI7 1 9) YO(IJ,R(I),S(l},T(l),U(I)
.l ~·iRITE(6, 7l R(I),S(ll,T(II,U(I) 7 F 0 RJ•\ I\ T ( I I L~: ( F 9 0 5 ' ::; )( ) )
7 RAT( ~,, CH.I\\!GES IN DMP ITICJf\l BfTVI!E N A!U CFrn TITRATIDN PJ IN DL S)*)
7 l ( I D R ( L I ! ) s ( L H 2 ) T ( ll lH L H I l l:l T(Il F9o3,Fl' 21
·6 T{Fl 3,tt(Fl ,6)1
SU UTIN PR Lir•l(YO, ,S,T,UI
Tll CALCULATE THF CHA\!G S I 1\i TH OLUTION COMPOSITION
4+VDL!l))+.t\CIDA

/ ... ,, c c
c r L r· v
r-· ·-··
7
9
()
lr
E=UETAl*TL*O-KW*BETA2+ -TH*BETAl F:::: I<V<I*Bt:TA TH
CALCULATE AN IMPROVED VALUE FOR H
CA UU\TE Til
(=~ XH H ( I ) T V 0 U' K WI I I
AR=ITH-H+KW/H)/ITL Q) l Tl*Q/lla+BETAl*H+RETA2*H * +BETA *H**3+B T 4*H** )
L ( I ) T V 0 L >:q~ ~II I=TVOL*BETAl*L*H
l(l)=TVOL* TA *L*H** L 3 (I l TVOL Tli. ;{:L~'ii'~ 3 LH4CI) TVOL* TA4*L*H* 4 }"J R I T E ( 6 , tt 7 ) L ( I l , P X H ~~ p, /\ F L ( I ) , l H i I I r L H ( I l , L H ( I ) , L H ( I ) , i~ CDI'!TI '\IUE
C CALCUL~TI OF TH CHANGE IN COM DSITI ~~ IN M~OL Sl C AND AP LY HYDROLY IS CORR CTI TO YO ,~
v
5 5
LHH
GATIVE OR ZERO FOR CYCLE NUMGER 1 ,I
K2 I< K4 I )

r v c c c c c
CALCUL ;23TET.~A
Tl TRA T
ClATHE~VVI ***** ** *********** ********** **********
c ******* ************** ************************************* ****
c c
c c c
c
M1 L 1 K ,K ,K3,K4,MLI LSAV UH3 ),LH {3 ) 1 LH3(3 1 L (3 ), Ll3 I,MI-ll(
NSION VOLI OI,PHI3 J, 13 (3 I 1'>1 S UJ N T I TL ( 1 B I i\lSlD\1 Y0(3 ) (5,741 Nl<DDE =l
R AD Ih!PUT D A. ._,OPPEI~/LIGA S ELH, TITRM~ AC
r·HJ\ULA TI VF:. LU E OBSERVED EA
IGAi\ID PROTONAT I ST P , LIGAND NT l\T ION t>.C ID, fv1 E f\j T V 0 L 1 i\ P P
Y D 1 NUI"1B R 0
(5,71) Kl, 7 K3,i<.4,P 1 P2 [(6,72) Kl, 2,K3,K4 E(6t'l3) Pl 1 P2 (5 1 69) DELHl,D LH ,O LH 1 DELH4,0 LHH
D(5,9:)) DELH5 TEI6 681 DELHl,OELH?,D LH3,D LH4 D(5, 3) (TITL (I),I 1,1R)
ITEI6 1 84) (TIT E{I }1 1=1,181 AD(5,7J) AC O, I ITE(6 1 2) 1\ ID, LI I\ D ( C) f 7 ) ~~
fJ-1 .J l 1 ND
!:>,75) VrJL(Jl,PH(Jl ( 5 , 8 5 ) ( Y D ( I ) , I 1 , f'.J
T1~l=!< Tt\2=K *Kl TIU K K2 !<l
1-\ Tl\ti K *K3 1<.2>!''1< lTE(6, ::J) ITF(6,l9)
11 I=l,~JO OL 9B .. 84+VUL(!)
() 9H B<'r/TVOL I I"' 010 >!< ~' (-PH ( I ) )
:::::.1\CI D>:<VDL (I} /TVUL I'IJLI *0
"" !V\l I >:c (,} .n. E=H
SfJL VC rLJR L M FROM THE GIVEN VALU OF H
C CALCULATE AN IMPROV D VALU. FOR H c

c C TEST FOR CONVERGENCE r'
'"'
c c c
IF ( XH I 9 PPII -AL
Xli=-t~L I~RS ( p
15
F(GoLE,) N+l
GO TO 5
{[·4 GC"' 6 .XH
l GO TO 4
l 5 } 6,15d5
E(6r9ll LSAVE,l n 11
CALCULA T Hi= S D L U T I Cl ~I C U P·1 P 0 S IT I D N F [!fvl R E F1 f\1 ED VAl U S Cl F 11, L A WH~
~~IRITE(6,81) \'J T E{6 7 t)7) U 3 J=l,!\J(v1
C RR 1 S THE liYDROL YS IS CORRECT ION FOR. YO = ( D 1 ( J ) ~ il H ( J + l ) ) ,;, DEL H li J ) -~1 L ( J + l ) (J)-MHL(Jt-1) R+FL(,J) FL(J+l)
=LHIJI+CO Rl-LHIJ+ll+S CURR2+LH (JI-LH (J+ll
::::CORR3+L (J)-UI (J+ll J } = Y D ( J ) C R pr. D E l C lJ R R ~' D E L H 2 - C 0 R :<' 0 E L H 3 C Cl R R it D E L H t;.- H C f l R
YD(J)/K.

r·
c c
X L S/R
PUNCH OUTPUT OR THE Oi\PTED LEAST S RES PROGRAM ORGLS
W~IT 17 1 931 YD(J),R, WUT (6,86) YO(J),HC INTf:=INTE+l
R,CO Rl,CORR ,CORR ,CORR4,R,S,YPL,XPL
IF(INTE LE NKODE) GO TO l STOP
4 FOR 1TIH
h8 FJK DE
69 F P 7 F 7 FO:.Z 7 FOR 7 FOR
T( 1 N CD~·IVERGE!\JCE \AJI HIN• E CCL = 1 rF7e3r 1 VALU ON T ( t t Ht\L PY DF PRf1TO T I H2 DELH3 0 LH4 1 / T(5(f1Cl 2)) T(FlC\;;4 7 Fl;),3) T(6(t:hl,3}) T( 1 1 PK 1 *S FOR THE LIGAND 1\ T( 1 0 STABILITY CONSTANTS F ;4,3X)) T ( I 2 ) T(2(Fl a3} ,21FlJ } I
I2, 1 CYCLES VALUE lJF PH ON P NUL AST CYCLE ' 1 F7~3)
OF 323TETRI\MI\lE '/ 1 DELHl I tt( F5"2' BX))
1 ,4(El1.:.4,3X)) THE TWO METAL COMPL XES ARE •,
2(C 74 FDR 7 '5 FflR 7 ~~DR T( 1 Cl A NEGATIVE lE~~CJ SDLUTlllhl 11'JI\S FUU'J FOR DATA PDII'H 1 ,
J.I 2) 77 f<:JR 7'1 FURP'i
1
T(':)' FS, ,3X,F8vt~,3X,71F8.a6, Xlr3X,l?l LH
FCYCLES 1 )
T(tj VOLUME CAL PH L L~4 ML MHL NO
T ( I ) c. IT I H! IlLEs ) Till!' II nGE Cfl OSITI
/', T I ON PO S ' l
LH2 LH
ACH TITRAl ION PCll'H 1 l MMDLESI PETW EN SUCCESSiVE T
fvJ A T ( 1 J T R A i\l T 1\ C I D C 0 i'JC f\l T R ,L\ T I 0 \l 1 , F 7 ) , 1 I i\1 I T I A L C !\! C l: !\i T R f1
8 '] i 9l
9 9
()r.J OF ::Di•lPLFX= I ,c:l::J ld tJu'\ T ( 18 Atd fv1~\ T (/ // / 1 ~; 1 l/3/Vt )
T(FlC! l T( ':'' F 3,3X,F6o t ,6( 9,61. X)d'2.,>313XtF8 ttl T(//// 1 ,_ YO HY ORR L R (LH) ,OR (LH2) RR(LH4) RIML) S(MHL) YO/R S/R 1 )
TC 1 I 4( 1 (t,5Xll T(F ,.,2)
CDRR(UU)
T ( I f\!0 c 0 >J v R G E ~I c F iJ R L -- ~ L As T v /\. L u E s 0 F l k'l E R I ' ( [ 1 X I )
r= R T( '~'· 1 2 X,E tt) RMATIFl a ,2(F .6})
\J D

APPENDIX E
p[H+] titrationa and log K data for the formation n
of copper/3,2,3-tet complexes
I :::: 0.20M I:::: 0.150M r = o.o4M
Vol. p[H+]b Vol. p[H+] Vol. p[H+]
0 .. 130 0.135 0.140 0 .. 145 0.150 0.155 0.160 0.170 0.180 0.190 0.200 0.210 0.220 0.230 0.240 Oo250 0.260 0.270 0.280
3.593 3.638 3.671 3.705 3.732 3.760 3.782 3.830 3.870 3.909 3.950 3.990 4.034 4.081 4.134 Lh 195 4.269 4.360 4.499
0.100 0.110 0.120 0.130 0.140 0.150 0.155 0.160 0.170 0.180 0.190 0.200 0.210 0.215 0.220 0.230 0.240 0.245 0.250 0.260 0.270 0.280 0.290
3.141 3.300 3.460 3·573 3.648 3.703 3.729 3.753 3.800 3.840 3.880 3.918 3.958 3.981 4.002 4.050 4.100 4.129 4.160 4.232 4.323 4.460 4.723
0.100 0.120 0.130 0.135 0.140 0.145 0.150 0.155 0.160 0.170 0.180 0.190 0.200 0.210 0.220 0.230 0.240 0.250 0.260 0.270 0.275 0.280 0.290
3.120 3.373 3.461 3.495 3.526 3.551 3.579 3.601 3.624 3.665 3.704 3.746 3.785 3 824 3.865 3.912 3.960 4.021 4.093 4.190 4.250 4.326 4.615
a 4 -3 Solution composition: I= 0.20, 0.15, 0.0 M, T1=1.103x10 M,
8 -3 -3 TM=1.0 2x10 M, 7.753x10 M, titrant [NaOH] = 1.269M,
initial volume = 49.90ml. b p[H+] data obtained as described in Chapter 3.
log K1 + 14.80 ± 0.07 0.20 21.81 - 0.05
0.15 21.69! 0.05 14.73 ~ 0.07 o.o4 21.53- 0.05 14.50 - 0.07 o.oo a+ 14.18b± 0.1 21.22 - 0.1
a From a plot of log K1 - 1ifi/( 1+'11) I b vs.
from a plot of log K2 - 2ifi/(1·¥li) vs. I.

APPENDIX F
Heat of dilution c of copper chloride
Vol. a CuC12 b
Q ,1Hdil ca. mole ratio d
(ml) (mmol) (J) (kJmol-1)
o.4oo .23944 1.234 5.15 1:23' 100
o .. 4oo .23944 1.214 5.07 1:23' 100
o .. 48o • 28733 1.445 5.03 1:19,400
0.450 .26937 1.356 5.03 1:20,800 '
0 .. 350 .20951 1.026 4.90 1:27,000
0 .. 350 .20951 1.007 4.81 1:27,000
a Volume of 0.5986M CuC12 added to 0.1M NaCl.
b Number of mmoles of titrant added.
c was .± 2%.
d

REFERENCES
1. N.F. Curtis, Y.M. Curtis and H.K.J. Powell, J. Chem.
Soc. (A), 1015 (1966).
2. J.L. Love and H.K.J. Powell, Chem. Commun., 39 (1968).
3. M.W. Morgan, B.Sc.(Hons) report, University of Canter
bury ( 1968).
4. M. Burgess and H.K.J. Powell, unpublished work,
University of Canterbury.
5. L.G. Sillen and A.E. Martell, "Stability Constants",
Chem. Soc. spec. Publs,No.17 and No.25 (Chemical Society:
London, 1964 and 1971).
6. C.V. Banks and S. Anderson, Inorg. Chem., ~' 112 (1963).
7. C.V. Banks, Record of Chem. Frog., 25, 85 (1964).
8. J.C. Wang, J.E. Bauman, Jr,, and R.K. Murmann, J. Phys.
Chem., 68, 2296 (1964).
9. R.M. Izatt, W.O. Fernelius and B.P. Block, J. Phys.
Chem., 59, 235 (1955).
10. M. Honda and G. Schwarzenbach, Helv. Chim. Acta, 40, 27
(1957).
11. D.F. Martin, G.A. Janusonis and B.B. Martin, J. Amer.
Chem. Soc. 83, 73 (1961).
12. G.W. Everett, J~, and R.H. Holm, Inorg. Chem., 2, 776
( 1968).

13. J. Bjerrum, 11Metal Ammine Formation Aqueous Solution11,
Hasse, Copenhagen (1957).
14. P. Teyssi6, G. Ander and G. Schwarz ach, Bull.
Soc. chim. belges, 11, 177 (1962).
15. D.C. Weatherburn, E.J. llo, J.P. Jones and D.W.
Margerum, . Chem., 2, '1557 (1970).
'16. L. Sacconi, P. Paoletti and M. Ciampolini, J. Chem. Soc.,
51 '15 ( '1961 ) .
'17. F. J. C. ssotti and H. Rossotti, 11 The Determination of
Stability Const 11, McGraw Hill ok Co. Inc. , London,
1961 ' p .1 .
18. R.G. Bates, !!Determination of pH Theory and Practice 11,
John Wil and Sons Inc., New York, 1964, p.7.
'19. R.A. Robinson and R . Stokes, 11 Electrolyte Solutionsrr,
Butterworths Pub. Ltd., 2nd Ed., 1959.
20. G.N. Lewis and M. Randall, J. Amer. Chem. Soc.,
1'140 (1921).
21. G.H. Nanco as, rr eractions in ectrolyte Solutions'1,
Elsevier shing Co., London, 1966, p.74.
Reference 17, p.32.
23. G,G. Manov, R.G. Bates, W.J. and S.F. Acree, J.
Amer. Chem. Soc., 65, 1765 (1943).
Reference 17, p.33.
25. J.J. Christensen, R.M. Iz
Instr., 36, 779 (1965).
and L.D. Hansen, Rev. Sci.

26. S. Johansson, Arkiv Kemi, 24, 189 (1965).
27. P. Gerding, I. Leden and S. Sunner, Acta Chem. Scand.,
17, 2190 (1963) and references therein.
28. I. Wads~, Acta Chem. Scand., 22, 927 (1968).
29. A. Vacca and P. Paoletti, J. Chem. Soc. (A), 2378
(1968).
30. H.J.V. Tyrrell and G.L. Hollis, Trans. Faraday Soc.,
48, 893 (1952).
31. H.S. Harned and B.B. Owen., "The Physical Chemistry of
Electrolytic Solutions", 2nd Ed., Am. Chem. Soc.
Monograph Series, No. 95, Reinhold, New York, 1950,
p.39.
32. J.J. Christensen and R.M. Izatt in "Physical Methods
in Advanced Inorganic Chemistry", (Eds., H.A.O. Hill
and P. Day), Interscience, New York, 1968, p.546.
33. S.J. Ashcroft and C.T. Mortimer, "Thermochemistry of
Transition Metal Complexes", Academic Press, London,
1970, p.9.
34. J. Konicek and I. Wads~, Acta Chem. Scand., 25, 1541
(1971).
35. F.J.C. Rossotti in "Modern Coordination Chemistry",
(Eds., J. Lewis and R.G. Wilkins), Interscience Pub.
Inc., New York, 1960, p.17.
36. R.W. Gurney, "Ionic Processes in Solution", McGraw-Hill,
New York, 1953.

37. A.E. Martell in "Werner Centennial", Advances in Chem
futry, Series 62, Amer. Chem. Soc. Pub., 1967, p.275.
38. A.W.J. Adamson, J. Amer. Chem. Soc., 76, 1578 (1954).
39. Reference 33, p.5.
40. F.A. Cotton and G. Wilkinson, !!Advanced Inorganic
Chemistry 11, 2nd Ed., William Clowes and Sons Ltd,
London, 1966, p.664.
41. Reference 21, p.124.
42. Reference 33, P·7·
43. A.I. Vogel, 11 A Textbook .bf Quantitative Inorganic
Analysis 11 , Longmans, London, 3rd ., '1962.
44. G. Schwarzenbach and H. Flaschka, 11 0ompl
Ti trations 11, 2nd shEd., Methuen and Co. Ltd, p.256.
Reference 18, p.124.
46. D.J. , J.J. Creczek and A.G. Smeeth, J. Chem. Soc.
(A), 1205 (1967).
47. Reference 43, p.200.
48. R.C. Weast ed., 11 Handbook of Chemistry and Physics 11,
48th Ed., Chemical Rubber Co., Cleveland, Ohio, 1967,
p.D--131.
49. Reference 18, p.315.
50. Reference 18, p.316 and 333.
51. D.D. Perrin and I.G. Sayee, Chem. ruld Ind., 661 (1966).
52. J. V. Tyrell and A. E. Beezer, 11 Thermometric Ti trimetry1,1 ,
Franklin Printing House, Hungary, 1968, p.19.

53. S. Sunner and I. Wads8, Acta Chem. Scand., j2, 97
(1959).
54. Reference 52, p.24.
J .M. Sturtevant in 11 Technique of Organic Chemistry11,
Part I, 11 Physical Methodsn, Ed. A. Weissberger, Vol.I,
p.523.
56. I. Grenthe, H. Ots and 0. Ginstrup, Acta Chem. Scand.,
24, 1067 (1970).
57. D.D. Wagman, W.H. Evans, V.B. Parker, I. Halow, S.M.
Bailey and R.H. Schumm, 11 Selected Values of Chemical
Thermodynrunic Prop
Jan. 1968.
esn, NBS Technical Note
L.D. Hansen and E.A. Lewis, J. Chem. Thermo., 3, 35
(1971), and references therein.
59. G. Ojelund and I. Wads8, Acta Chern. Scand., , 2691
(1968).
60. Reference 48, p.F-4.
61. Reference 18, p.33-34.
62. Reference 18, p.31.
63. Reference 18, p.75.
64. R.G. Bates and E.A. Guggenheim, Pure Appl. Chem., 1,
163 ( 1960).
65. Reference 18, p.77.
66. C. W. Davies, 11 Ion As so ation 11, Butterworths, London,
1962, p.41.

67. H.S. Harned and F.C. ckey, J. Amer. Chem. Soc., 29,
'1284 ('1937) references therein.
68. D.H. ett and B.R.W. Pinsent, Proc. Roy. Soc. (Lond.),
A2'15, 4'16 ('1952).
69. erence 3'1, p.523.
70. Reference '18, p.87.
71. W.H. Beck, A.E. Bottom and A.K. Covington, Analyt.
. , ' 50'1 ('1968) .
72. Reference '18, p.76, 88-90.
73. W.A.E. McBryde, Analyst, 94, 3 ('1969).
74. Reference 3'1, p.578 p. 5·
75. N.I. enkin, 11 Succes Approximations 11,
Press, Oxford, '1964.
H.S. , J. Amer. Chem. Soc., 4§, ('1 ) . 77. e '18, p.58.
78. I. Feldman, Analyt. Chem., 28, '1859 ('1956).
79. Reference 19,
80. erence '18, p.60.
8'1. C.W. Childs, Inorg. Chem., 9, ('1970).
82. A. Vacca
( '1967).
D. Arenare, J. . Chem. , .2.1, '1495
83. W.A.E. McBryde, communic ion to H.K.J. Powe
84. G. Schwarzenbach, E. Kampitsch and R. St
Chim. Acta, 28, 828 ('1945).
1971.

85. K.S. Rajan and A.E. Martell, J. Inorg. Nuclear Chern.,
26, 789 (1964).
86. D.D. Perrin and C.W. Chi s, J. Chem. Soc. (A), 1039
(1969).
87. K.J. Powell and N.F. Curtis, J. Chern.
(1966).
c. ) ' 1205
E.A. Guggenheim and J.C. Turgeon,
' 747 (1955).
s. Faraday Soc. ,
89. Reference ' p.40.
90. J. ell , J. Amer. Chern. c. ' '1675 (1937).
91. erence 17, p.40.
92.
93.
94.
B. Sen, Analyt. Chim. Acta, gz, 5 (1 ) . K.H. Schr¢der, Acta Chern. Sc ., , 1401 (1966).
F.J.C. ssotti and S. Rossetti, Acta . Scand., ,2,
1166 (1955).
Reference 17, p.110.
96. Scatchard guot , J.T. Eds , G. Felsenf D.S.
Goodman and F.R.N. Gurd, J. Amer. Ohern. Soc.,
(1954).
' 3054
C.W. Childs, P.S. Hallman and D.D. Perrin, Talanta, 2§,
629 (1969).
98. F.J.C. Rossotti, H.S. Rossetti and R.J. Whewe , J.
Inorg. Nuclear Chern., , 2051 (1971) and references
therein.

99. J.S. Ro et Ed., ''Cornput Methods Crystallography11,
Pergamon ss, 1965.
100. P.C. Jurs, AYJalyt. Chern. , 42, 747 (1970).
101. z.z. Hugus "Advances in the Chemistry of Coordination
Compounds 11, Ed. S. chner, 1961, p.388.
102. D.D. and I.G. Sayee, J. Chern. Soc. (A), 82
( 1967).
103. A. Vacca, D. Arenare and P. Paoletti, Inorg. Chern. 2,
1384 ( 1 966) .
104. L.G. Sillen, Acta Chern. Scand., 1 , 1
1 08 5 ( 1965) .
( 1962); 18'
105. Reference 17, p.58.
106. P. Paol i, F. Nu andA. Vacca, J. Chern. Soc. (A),
1 ( 1966).
107. G.R. J.L. Love and H.K.J. Powell, Austral. J.
Chern., '981 (1970).
108. S. Pat Ed. , n Chemis of the Carbon-Nitrogen
Double Bond 11, erscience, 1970, p.235.
109. Reference 108, p.384.
110. W. Z. Heldt and L. G. Donaruma, Org. Reactions, ..11, 1
(1960).
111. E. Lustig, J. Phys. Chern., 65, 491 (1961).
112. A.C. Huitrig, D.B. Roll and J.R. De Boer, J.
' 1661 (1967).
• Chern.,

113. H. Saito and K. Nukada, J. Mol. Spectroscopy 18, 1
(1965) and references therein.
114. W.F. Trager and A.C. Huitrig, Tetrahedron Letters, 825
( 1966).
115. R.K. Norris and S. Sternhell, Austral. J. Chem., 22,
935 (1969) and erences therein.
116. erence 108, p.390-392.
117. G.W. Wheland., nAdvanced Organic Chemistryn,
J. Wiley, N.Y., 1949, p.344.
. '
118. G.C. Pimentel and A.L. McClellan, nThe Hydrogen Bondn,
Freeman and Co. Lt~, 1960.
119. R. Nasanen, M. Ko , L. Antti land M.L. Korvola,
Suomen Kem., B39, 122 (1966).
120. R. Nasanen and P. Merilainen, Suomen Kam., B37, 1, 54
(1964).
121. P. Paoletti, R. Barbuc , A. Vacca
Chem. Soc. A, 310 (1971).
A. Dei, J.
1 F. Basolo, R.K. Murmann and Y.T. Chen, J. Chem. Soc.,
12, 1478 (1953).
1 J. Clark and D.D. Perrin, Quart. Rev., 18, 295 (1964).
1 J.J. Christensen, R.M. Izatt, D.P. Wrathall and L.D.
Hansen, J. Chem. Soc. (A), 1 2 (1969).
1 M.C. Cox, D.H. Everett, D~A. Landsman and R.J. Munn,
J. Chem. Soc. (B), 1373 (1968).

1 A. G. Evans and S.D. Hamann, Trans. Faraday Soc., 47,
34 (1951) and references therein.
127. R. Barbucci, P. Paoletti and A. Vacca, J. Chem. Soc.
(A), 2202 (1970).
128. C.D. Ritchie and W.F. Sager, 11 gress Physical
1
Organic Chemistryu, Vol. Eds, S. Cohen, A. Streitwiesei
and R.W. Taft, Inters ence, N.Y., 1964.
G. Schwarz ach, n ctrostatic and Non-electrostatic
Contributions to Ion Asso ation in Solution", in
th Plenary Lectures, XII Int onal Conference on
Coordination Chemistry, Sydney, 1969, Butterworths,
London, 1969.
130. E. J. 'Aci ' '
e libria', Pergamon ss, 1965,
p .174.
131. A.K. Covington and P. Jones Ed., nHydrogen-Bonded
Solvent Systems 11, Taylor and s Ltd, 1968, p.5.
K.E. Jabalpurwala, K.A. Venkatachalam M.B. Kabadi,
J. Inorg. Nuclear Chern., , 1 011 ( 1964) •
133. P.J. Orenski W.D. Closson, Tetrahedron Letters, 37,
(1967).
1 C.V. Banks and A.B. Carlson, Analyt. Chirn. Acta , :z, 291 ( 19 ) .
135. H. McCom1ell, J. Chern. Phys., 20, 700 (1952).
1 H. Irving, H.S. ssotti and G. Harris, Analyst, 80,
(1955).

13'7· T. Davies, S.S. Singer and L.A.K. Stavely, J. Chern.
Soc., 2304 (1954).
138. P. Paoletti, M. Ciarnpo
§1, 1065 (1963).
and A. Vacca, J. Phys. Chern.,
1 P. Pao i, J.H. Stern and A. Vacca, J. Phys. Chern.,
69, 3'759 (1965).
140. A.F. Trotman-Di , J. Chern. Soc., 1293 (1949).
141. G. C. Levey, J.D. c oli w. ela, J. Arner. Chern.
c. ' ' 6238 (1 ) .
142. G.A. Olah, M. Cal and D.H. O'Brien, J. Amer. Chern.
Soc., 89, 3586 (1967).
N.H. Crornwe , Chern. Rev., 38, ( 1946).
1L!-4. S. Nagakura, A Moniye and K. Stanfield, J. Amer.
Chern. Soc., .2.2, 1035 (1957).
J. Zabi Ed., 11 The Chemistry the Carb Group 11,
Vol. 2, Interscience, 1970, chapter 3.
146. G. Schwarzenbach, Helv. Chim. Acta, 33, 94'7 (1950).
147. I. Poulsen and J. Bjerrum, Acta Chern. Scand., 9, 1407
(1955)~
148. p. letti, S. Biagini and M. Cannas, Chern. Commun.,
513 (1969).
149. S. Bi
(1970).
and M. Cannas, J. Chern. Soc. (A), 2398
150. B. sni , R.D. Gil , E.D. McKenzie and G.A. Webb,
J. Chern. Soc., (A), 1331 ( 1966).

151. R.D. GiJlard
( 1965).
H.M. , Chem. Rev., 65, 603
1 G. D sher and G.H. Nancollas, J. Chern. Soc. (A), 1125
(1970).
1 G. Anderegg, lv. Chim. Acta, 21, 1 ( 1968).
151+. I .M. cter, B.J. Hathaway and P. Nicho s, J. Chem.
Soc. (A), 1678 (1968).
1 M.D. Alexander, P.C. Harrington and A. Van Heuvelen,
J. Phys. Chem.,72, 33 ( 19Tl).
156. G. Schwarzenbach, Helv. Chim. Acta, 33, 974 (1950).
1 R.C. Courtney, R.L. Gustafson, S. Chaberek, Jr., and
A.E. Martell, J. Amer. Chem. Soc., 81, 519 (1959).
158. J.W. Fraser, M.Sc. Thesis, University of Canterbury,
1970.
159. Reference 17, p.400.
160. D.E. Williams, G. Wohlauer and R.E. Rundle, J. AmPr.
Chem. Soc., §1, 7 ( 1959).
161. S. Ahrland, "Structure ru'ld Bonding 11, Springer-Verlag,
N.Y. , 1968, V o 1 • 5, p . 118.
1 J. Bjerrum and E.J. Nielson, Acta Chem. Scand., ~' 297
( 1948).
163. C.K. Jorgensen, Acta Chem. Scand., 10, 887 (1956).
164. C.K. Jorgensen, Acta Chem. Scand., 2, 1362 (1955).
165. R.D. Gillard .and S.H. Laurie, J. Inorg. Nuclear Chem.,
3 3 , 94 7 ( 19Tl ) .

166.
167.
168.
169.
V. Gutman, Chern. t.' :z, 102 (1971).
R.P. Bell, "The Proton in Chemistry", Cornell University
Press, Ithaca, N.Y., 1959, Chapter 4.
R.K. Murmann, J. Amer. Chern. Soc., 80, 4174 (1958).
R. NEI.sEI.nen and P. Merilainen, Suomen Kern., B36, 97
(1963).
170. G.I.H. Hanania and D.H Irvine, J. Chem. Soc., 2745
(1962).
171. G.I.H. Hanania and D.H. Irvine, J. Chern. Soc., 2750
(1962).
172. C.H. and C.F. Liu,, J. Amer. Chem. Soc. §.2_, 4169
( 1961).
173. D.D. , J. Chern. Soc., 3189 (1960).
174. A.E. Martell, S. Chaberek Jr., R.C. Courtney, S. We
back and H. Hyytiainen , J. Amer. Soc., :z2, 3036 (1957).
175. A. Vaciago and L. Zambonelli, J. Chern. Soc. (A), 218
( 1970).
176. R. Beckett and B.F. Hoskins, J. Chem. Soc. Dalton, 291
( 1972).
177. C.H. and C.F. Liu, J. Amer. Chern. Soc. 83, 4167
( 1961).
178. Reference 17, chapter 17.
179. F. Basolo and R.K. Murmann, J. Arner. Chern. Soc., L:!:,
2373 (1952); L:!:, 5243 (19 ).

180. S. Patai Ed., "The Chemistry of the Carbonyl Group 11,
Vol. I, Interscience, N.Y., 1966, p. ~8.
181. G. Gran, Analyst, 77, 661 (1952).
182. F.J.C. Rossotti and H. Rossotti, J. Chem. Educ., 42,
375 (1965).
183. Reference 99, p.33.
184. W.C. Hamilton, 11 Statistics Physical Sciencen,
Ronald Press Co., N.Y., 1964, p.154.
185. Reference 99, p.20.
186. Reference 184, p.1
187. A. Causer, 11 Plot A subroutines for the 1627 plotter 11,
Memo. Univer ty of Canterbury Computer Centre, 1970.
188. W.R. Busing and H.A. Levy, 11 General Squares
Program'', ORNL-TM-271, Chemistry Division, Oak Ridge
National Laboratory, Oak , Tennessee, 1962.