
Thermodynamic Analysis For Improving Understanding And ...
540
University of Pennsylvania University of Pennsylvania ScholarlyCommons ScholarlyCommons Publicly Accessible Penn Dissertations 2017 Thermodynamic Analysis For Improving Understanding And Thermodynamic Analysis For Improving Understanding And Performance Of Hybrid Power Cycles Using Multiple Heat Sources Performance Of Hybrid Power Cycles Using Multiple Heat Sources Of Different Temperatures Of Different Temperatures Ting Yue University of Pennsylvania, [email protected] Follow this and additional works at: https://repository.upenn.edu/edissertations Part of the Mechanical Engineering Commons, and the Oil, Gas, and Energy Commons Recommended Citation Recommended Citation Yue, Ting, "Thermodynamic Analysis For Improving Understanding And Performance Of Hybrid Power Cycles Using Multiple Heat Sources Of Different Temperatures" (2017). Publicly Accessible Penn Dissertations. 2658. https://repository.upenn.edu/edissertations/2658 This paper is posted at ScholarlyCommons. https://repository.upenn.edu/edissertations/2658 For more information, please contact [email protected].
-
Upload
khangminh22 -
Category
Documents
-
view
1 -
download
0
Transcript of Thermodynamic Analysis For Improving Understanding And ...

University of Pennsylvania University of Pennsylvania
ScholarlyCommons ScholarlyCommons
Publicly Accessible Penn Dissertations
2017
Thermodynamic Analysis For Improving Understanding And Thermodynamic Analysis For Improving Understanding And
Performance Of Hybrid Power Cycles Using Multiple Heat Sources Performance Of Hybrid Power Cycles Using Multiple Heat Sources
Of Different Temperatures Of Different Temperatures
Ting Yue University of Pennsylvania, [email protected]
Follow this and additional works at: https://repository.upenn.edu/edissertations
Part of the Mechanical Engineering Commons, and the Oil, Gas, and Energy Commons
Recommended Citation Recommended Citation Yue, Ting, "Thermodynamic Analysis For Improving Understanding And Performance Of Hybrid Power Cycles Using Multiple Heat Sources Of Different Temperatures" (2017). Publicly Accessible Penn Dissertations. 2658. https://repository.upenn.edu/edissertations/2658
This paper is posted at ScholarlyCommons. https://repository.upenn.edu/edissertations/2658 For more information, please contact [email protected].

Thermodynamic Analysis For Improving Understanding And Performance Of Thermodynamic Analysis For Improving Understanding And Performance Of Hybrid Power Cycles Using Multiple Heat Sources Of Different Temperatures Hybrid Power Cycles Using Multiple Heat Sources Of Different Temperatures
Abstract Abstract Past studies on hybrid power cycles using multiple heat sources of different temperatures focused mainly on case studies and almost no general theory about this type of systems has been developed. This dissertation is a study of their general thermodynamic performance, with comparisons to their corresponding single heat source reference systems. The method used in the dissertation was step-wise: to first analyze the major hybrid power cycles (e.g. Rankine, Brayton, Combined Cycles, and their main variants) thermodynamically, without involving specific operation parameter values, and develop some generalized theory that is at least applicable to each type of system. The second step was to look for commonalities among these theories and develop the sought generalized theory based on these commonalities. A number of simulation case studies were performed to help the understanding and confirm the thermodynamic results. Exergo-economic analysis was also performed to complement the thermodynamic analysis with consideration of externalities, and was compared to the conventional economic analysis method. The generalized expressions for the energy/exergy efficiency differences between the hybrid and the corresponding single heat source systems were developed. The results showed that the energy and exergy efficiencies of the hybrid systems are higher than those of their corresponding single heat source reference systems if and only if the energy/exergy conversion efficiency (defined in the dissertation) of the additional heat source (AHS, can be any heat source that has lower temperature) is larger than that of the original heat source. Sensitivity analysis results showed the relations between the temperature and heat addition rate of the AHS and the energy/exergy efficiency of the hybrid systems. Other big advantages of hybrid systems, i.e. the effects on replacement of fossil fuel by renewable, nuclear and waste energy, lower emissions and depletion of fossil fuel, were revealed in the economic analysis, by considering the cost reduction from fuel saving and carbon tax. Simple criteria were developed to help compare the hybrid and reference systems and determine under which conditions the hybrid systems will have better thermodynamic or economic performance than the reference ones. The results and criteria can be used to help design the hybrid systems to achieve higher energy and/or exergy efficiencies and/or lower levelized electricity cost (LEC) before detailed design or simulation or experiment. So far, 3 archival journal papers and 3 conference papers were published from this dissertation work.
Degree Type Degree Type Dissertation
Degree Name Degree Name Doctor of Philosophy (PhD)
Graduate Group Graduate Group Mechanical Engineering & Applied Mechanics
First Advisor First Advisor Noam Lior
Keywords Keywords Exergo-economic analysis, Multiple heat sources with different temperatures, Power systems simulation, Thermal hybrid power cycles, Thermochemical hybrid power cycles, Thermodynamic analysis

Subject Categories Subject Categories Engineering | Mechanical Engineering | Oil, Gas, and Energy
This dissertation is available at ScholarlyCommons: https://repository.upenn.edu/edissertations/2658

THERMODYNAMIC ANALYSIS FOR IMPROVING UNDERSTANDING AND PERFORMANCE
OF HYBRID POWER CYCLES USING MULTIPLE HEAT SOURCES OF DIFFERENT
TEMPERATURES
Ting Yue
A DISSERTATION
in
Mechanical Engineering and Applied Mechanics
Presented to the Faculties of the University of Pennsylvania
in
Partial Fulfillment of the Requirements for the
Degree of Doctor of Philosophy
2017
Supervisor of Dissertation
_________________________
Dr. Noam Lior
Professor, Department of Mechanical Engineering and Applied Mechanics
Graduate Group Chairperson
_________________________
Dr. Kevin T. Turner, Professor, Mechanical Engineering and Applied Mechanics and Materials
Science and Engineering
Dissertation Committee
Dr. Haim H. Bau, Professor, Committee Chair, Department of Mechanical Engineering and
Applied Mechanics, University of Pennsylvania
Dr. Warren D. Seider, Professor, Department of Chemical and Biomolecular Engineering,
University of Pennsylvania
Dr. Gerard F. Jones, Professor, Department of Mechanical Engineering, Villanova University

THERMODYNAMIC ANALYSIS FOR IMPROVING UNDERSTANDING AND PERFORMANCE
OF HYBRID POWER CYCLES USING MULTIPLE HEAT SOURCES OF DIFFERENT
TEMPERATURES
COPYRIGHT
2017
Ting Yue
This work is licensed under the
Creative Commons Attribution-
NonCommercial-ShareAlike 3.0
License
To view a copy of this license, visit
https://creativecommons.org/licenses/by-nc-sa/3.0/us/

iii
DEDICATION
To my loving parents, especially my Mother
for their support and caring, persistently and endlessly

iv
ACKNOWLEDGMENT
First and foremost, I would like to express my sincere gratitude to my beloved academic
advisor, Professor Noam Lior. It was a great honor to work under the guidance of Dr. Lior,
at one of best universities in the world for the past years. With the help of his decades of
experience in the field of power generation and many other related fields, Dr. Lior helped
me define the topic, objective and scope of this dissertation and provided much guidance
continuously over the years assisting me to overcome the many difficulties that were
encountered during my research, with patience and immense knowledge. Dr. Lior also
helped me improve my English pronunciation and writing skills, as well as my presentation
skills. What’s more, he also taught me about the culture in the US and invited me many
times for leisure trips and holiday dinners, making my research life a little easier. There is
an old saying in my country as “once a teacher, always a father”, and Dr. Lior is like my
father and will always be.
Besides my advisor, I would like to thank the rest of my thesis committee: Professor Haim
Bau, Professor Warren Seider, and Professor Gerard Jones, for their time in reviewing my
proposal and dissertation, and for their insightful comments and encouragement.
I would also like to thank all the professors who taught me courses at the University of
Pennsylvania, including Dr. Lior, Dr. Lukes, Dr. Ayyaswamy, Dr. Carchidi, Dr. Kumar,
Dr. Castañeda, Dr. Kothmann and Dr. Mylovanov.

v
Also, thank all the staff in the MEAM office, especially Maryeileen, Peter and Sue, who
helped me many kinds of things, which are hard to count.
I would like to thank my fellow labmates, especially Yuejun, for the stimulation
discussions, for all the work we have been working together, and for all the fun we had in
the past years. Also, I would like to thank Professor Zhang Na for teaching me how to use
the software and for all other help, such as accompanying my mom when she felt lonely in
the US while I was working on my research and could not spend too much time with her.
What’s more, I would like to thank the University of Pennsylvania, for admitting me as a
PhD student, with the help of Dr. Lior. The university is one of the oldest and best
university in the US. It provides modern and comprehensive facilities that made my
research and life easier. To name a few, there are numerous food trucks all around the
campus, providing cheap and tasty foods from all over the world. It also provides several
modern playgrounds so that I can play soccer in the weekend for fun and to keep healthy.
One of the playgrounds is even covered with an air tent in the winter so that people can
play in there even there is heavy snow outside. Besides the infrastructures, the university
is embedded with its unique culture, influencing all its students. For the past many years, I
not only studied here but also lived here. This was a priceless experience for me and will
surely positively influence my future life. I am really proud of being about to graduate as
a PhD student from Penn and hope that Penn will be proud of me as one of her students in
the future.

vi
Last but not the least, I would like express my earnest appreciations to my parents. This
dissertation is dedicated to them. Without their support, I could not have finished this
dissertation. Their support is unconditional and persistent. I will do my best to pay back
their love after graduation and make them happy.
Ting Yue
Philadelphia, PA

vii
ABSTRACT
THERMODYNAMIC ANALYSIS FOR IMPROVING UNDERSTANDING AND PERFORMANCE
OF HYBRID POWER CYCLES USING MULTIPLE HEAT SOURCES OF DIFFERENT
TEMPERATURES
Ting Yue
Dr. Noam Lior
Past studies on hybrid power cycles using multiple heat sources of different temperatures
focused mainly on case studies and almost no general theory about this type of systems has
been developed. This dissertation is a study of their general thermodynamic performance,
with comparisons to their corresponding single heat source reference systems. The method
used in the dissertation was step-wise: to first analyze the major hybrid power cycles (e.g.
Rankine, Brayton, Combined Cycles, and their main variants) thermodynamically, without
involving specific operation parameter values, and develop some generalized theory that is
at least applicable to each type of system. The second step was to look for commonalities
among these theories and develop the sought generalized theory based on these
commonalities. A number of simulation case studies were performed to help the
understanding and confirm the thermodynamic results. Exergo-economic analysis was also
performed to complement the thermodynamic analysis with consideration of externalities,
and was compared to the conventional economic analysis method. The generalized
expressions for the energy/exergy efficiency differences between the hybrid and the
corresponding single heat source systems were developed. The results showed that the
energy and exergy efficiencies of the hybrid systems are higher than those of their

viii
corresponding single heat source reference systems if and only if the energy/exergy
conversion efficiency (defined in the dissertation) of the additional heat source (AHS, can
be any heat source that has lower temperature) is larger than that of the original heat source.
Sensitivity analysis results showed the relations between the temperature and heat addition
rate of the AHS and the energy/exergy efficiency of the hybrid systems. Other big
advantages of hybrid systems, i.e. the effects on replacement of fossil fuel by renewable,
nuclear and waste energy, lower emissions and depletion of fossil fuel, were revealed in
the economic analysis, by considering the cost reduction from fuel saving and carbon tax.
Simple criteria were developed to help compare the hybrid and reference systems and
determine under which conditions the hybrid systems will have better thermodynamic or
economic performance than the reference ones. The results and criteria can be used to help
design the hybrid systems to achieve higher energy and/or exergy efficiencies and/or lower
levelized electricity cost (LEC) before detailed design or simulation or experiment. So far,
3 archival journal papers and 3 conference papers were published from this dissertation
work.
ix
TABLE OF CONTENTS
DEDICATION ................................................................................................................... iii
ACKNOWLEDGMENT.................................................................................................... iv
ABSTRACT ...................................................................................................................... vii
LIST OF TABLES ........................................................................................................... xxi
LIST OF ILLUSTRATIONS ......................................................................................... xxiv
CHAPTER 1 INTRODUCTION ........................................................................................ 1
CHAPTER 2 ENERGY AND EXERGY PERFORMANCE CRITERIA ......................... 9
2.1. Introduction .............................................................................................................. 9
2.2. Energy analysis ...................................................................................................... 12
2.3. Exergy analysis ...................................................................................................... 15
2.4. Other performance criteria ..................................................................................... 20
CHAPTER 3 THERMAL HYBRID POWER CYCLES BACKGROUND REVIEW ... 25
3.1. Developments and status of thermal hybrid power cycles ..................................... 25
3.1.1. The solar assisted vapor turbine cycles ........................................................... 27
3.1.2. The solar assisted gas turbine cycles ............................................................... 47
3.1.3. The solar assisted combined cycle ................................................................... 58

x
3.1.4. Other types of thermal hybrid power cycles .................................................... 75
3.2. Conclusions of the review of thermal hybrid power cycles ................................. 111
CHAPTER 4 THERMODYNAMIC ANALYSIS OF THERMAL HYBIRD POWER
GENERATION SYSTEMS BASED ON RANKINE CYCLES.................................... 136
4.1. Hybrid power generation systems based on the simple Rankine cycle ................ 136
4.1.1. Introduction of hybrid power generation systems based on the simple Rankine
cycle 137
4.1.2. Thermodynamic analysis of hybrid power generation systems based on the
simple Rankine cycle ............................................................................................... 140
4.1.3. Generalization to other types of heat sources for hybrid power generation
systems based on the simple Rankine cycle ............................................................ 148
4.1.4. Sensitivity analysis of the hybrid power generation systems based on the simple
Rankine cycle, with respect to the AHS .................................................................. 151
Effect of the heat addition rate of the additional heat source, AHSQ , on the
energy efficiency of the hybrid power generation systems based on the simple
Rankine cycle, h . ............................................................................................... 151
Effect of the temperature of the additional heat source, AHST , on the energy
efficiency of the hybrid power generation systems based on the simple Rankine
cycle, h . ............................................................................................................. 154

xi
Effect of the heat addition rate of the additional heat source, AHSQ , on the
exergy efficiency of the hybrid power generation systems based on the simple
Rankine cycle, h . ............................................................................................... 158
4.1.4.3.1. Region in which the specific heat of working fluid at T3 almost remains
constant ............................................................................................................. 161
4.1.4.3.2. Region in which the specific heat of working fluid at T3 increases
rapidly ............................................................................................................... 165
4.1.4.3.3. Phase change region ......................................................................... 166
4.1.4.3.4. Region in which the specific heat of working fluid at T3 is close to the
turbine inlet temperature, TTI ........................................................................... 167
Effect of the temperature of the additional heat source, AHST , on the exergy
efficiency of the hybrid power generation systems based on the simple Rankine
cycle, h . ............................................................................................................. 168
4.1.4.4.1. Region in which the specific heat of working fluid at T3 almost remains
constant ............................................................................................................. 170
4.1.4.4.2. Region in which the specific heat of working fluid at T3 increases
rapidly ............................................................................................................... 172
4.1.4.4.3. Region in which the specific heat of working fluid at T3 is close to the
turbine inlet temperature, TTI ........................................................................... 172

xii
Conclusions of the sensitivity analysis of the hybrid power generation
systems based on the simple Rankine cycle, with respect to the AHS ................ 174
4.1.5. Simulation of hybrid power generation systems based on the simple Rankine
cycle 178
Validation ................................................................................................ 178
Simulation results of the hybrid power generation systems based on the
simple Rankine cycle ........................................................................................... 183
4.1.6. Conclusions about the hybrid power generation systems based on the simple
Rankine cycle .......................................................................................................... 190
4.2. Hybrid power generation systems based on a Rankine cycle with reheat ........... 193
4.2.1. Introduction of hybrid power generation systems based on the Rankine cycle
with reheat ............................................................................................................... 193
4.2.2. Thermodynamic analysis of hybrid power generation systems based on the
Rankine cycle with reheat ........................................................................................ 196
4.2.3. Simulation of hybrid power generation systems based on the Rankine cycle with
reheat 197
4.2.4. Comparison between the hybrid Rankine cycle with and without reheat ..... 198
4.3. Hybrid power generation systems based on the Rankine cycle with heat regeneration
..................................................................................................................................... 203

xiii
4.3.1. Introduction of hybrid power generation systems based on the Rankine cycle
with heat regeneration ............................................................................................. 204
4.3.2. Thermodynamic analysis of hybrid power generation systems based on the
Rankine cycle with heat regeneration ...................................................................... 206
4.4. Conclusions of the thermodynamic analysis of hybrid power generation systems
based on Rankine cycles ............................................................................................. 214
CHAPTER 5 THERMODYNAMIC ANALYSIS OF THERMAL HYBIRD POWER
GENERATION SYSTEMS BASED ON BRAYTON CYCLES .................................. 216
5.1. Hybrid power generation systems based on the simple Brayton cycle ................ 216
5.1.1. Introduction of hybrid power generation systems based on the simple Brayton
cycle 216
5.1.2. Thermodynamic analysis of hybrid power generation systems based on the
simple Brayton cycle ............................................................................................... 218
5.2. Hybrid power generation systems based on the Brayton cycle with intercooling 226
5.2.1. Introduction of hybrid power generation systems based on the Brayton cycle
with intercooling ...................................................................................................... 226
5.2.2. Thermodynamic analysis of hybrid power generation systems based on the
Brayton cycle with intercooling .............................................................................. 228
5.3. Hybrid power generation systems based on the Brayton cycle with reheat ......... 229

xiv
5.3.1. Introduction of hybrid power generation systems based on the Brayton cycle
with reheat ............................................................................................................... 230
5.3.2. Thermodynamic analysis of hybrid power generation systems based on the
Brayton cycle with reheat ........................................................................................ 232
5.4. Hybrid power generation systems based on the Brayton cycle with heat regeneration
..................................................................................................................................... 233
5.4.1. Introduction of hybrid power generation systems based on the Brayton cycle
with heat regeneration ............................................................................................. 234
5.4.2. Thermodynamic analysis of hybrid power generation systems based on the
Brayton cycle with heat regeneration ...................................................................... 236
5.5. Simulation of hybrid power generation systems based on the Brayton cycle with
intercooling, reheat and heat regeneration .................................................................. 237
5.5.1. Introduction of hybrid power generation systems based on the Brayton cycle
with intercooling, reheat and heat regeneration ....................................................... 237
5.5.2. Validation ...................................................................................................... 238
5.5.3. Reference system simulation ......................................................................... 243
5.5.4. Reference system exergy analysis ................................................................. 249
5.5.5. Hybrid system exergy analysis ...................................................................... 253
Limiting case for the AHS heat input ..................................................... 254

xv
5.5.5.1.1. Energy analysis ................................................................................ 254
5.5.5.1.2. Exergy analysis ................................................................................ 257
Sensitivity analysis for the hybrid system .............................................. 262
5.6. Conclusions of the thermodynamic analysis of hybrid power generation systems
based on Brayton cycle ............................................................................................... 265
CHAPTER 6 THERMODYNAMIC ANALYSIS OF THERMAL HYBIRD POWER
GENERATION SYSTEMS BASED ON THE COMBINED CYCLES ....................... 268
6.1. Hybrid power generation systems based on the combined cycle with the AHS added
in the topping (Brayton) cycle ..................................................................................... 271
6.1.1. Introduction of the hybrid power generation systems based on the combined
cycle with the AHS added in the topping (Brayton) cycle ...................................... 271
6.1.2. Thermodynamic analysis of the hybrid power generation systems based on the
combined cycle with the AHS added in the topping (Brayton) cycle ..................... 273
6.2. Hybrid power generation systems based on the combined cycle with the AHS added
in the bottoming (Rankine) cycle ................................................................................ 275
6.2.1. Introduction of the hybrid power generation systems based on the combined
cycle with the AHS added in the bottoming (Rankine) cycle ................................. 276
6.2.2. Thermodynamic analysis of the hybrid power generation systems based on the
combined cycle with the AHS added in the bottoming (Rankine) cycle ................. 280

xvi
6.3. Conclusions of the thermodynamic analysis of hybrid power generation systems
based on the combined cycle ....................................................................................... 285
CHAPTER 7 THERMODYNAMIC ANALYSIS OF THERMOCHEMICAL HYBRID
POWER GENERATION SYSTEMS ............................................................................. 288
7.1. Introduction of thermochemical hybrid power generation systems ..................... 288
7.2. Thermochemical hybrid systems using methane as fuel ...................................... 293
7.2.1. System introduction ....................................................................................... 294
7.2.2. Thermodynamic analysis of SOLRGT .......................................................... 305
7.2.3. Effect of the solar definition on the value of difference between the
produced syngas and the input solar heat ................................................................ 312
7.3. Thermochemical hybrid system using methanol as fuel ...................................... 316
7.4. Thermodynamic background of thermochemical upgrading ............................... 324
7.4.1. Background and generalization of the thermochemical process ................... 324
7.4.2. Thermodynamic interpretation of the of syngas ....................................... 326
7.4.3. Examination of the exergy destruction during the thermochemical process in
SOLRGT .................................................................................................................. 329
Solar temperature defined by using the solar collection equipment or
working fluid ........................................................................................................ 329
Solar temperature defined by using the sun surface temperature ........... 330

xvii
Thermodynamic meaning of the of the syngas .................................. 332
7.5. Advantages of solar thermochemical hybridization ............................................. 332
7.5.1. Significant simplification of the solar energy storage and transportation. .... 333
7.5.2. Reduction of the solar heat temperature needed for power generation plants, and
consequently of the hybrid system cost. .................................................................. 333
7.5.3. Increase of the solar-to-electricity efficiency (se ). ..................................... 333
7.6. Conclusions of thermodynamic analysis of thermochemical hybrid power generation
systems ........................................................................................................................ 337
CHAPTER 8 EXERGO-ECONOMIC ANALYSIS FOR THERMAL HYBIRD POWER
GENERATION SYSTEMS ............................................................................................ 346
8.1. Economic analysis methods for thermal hybrid systems ..................................... 347
8.1.1. The energo-economic analysis method ......................................................... 348
8.1.2. The exergo-economic analysis method ......................................................... 349
8.2. Hybrid power generation systems based on the Rankine cycle ........................... 356
8.2.1. Hybrid power generation systems based on the simple Rankine cycle ......... 356
8.2.2. Hybrid power generation systems based on the Rankine cycle with reheat .. 369
8.2.3. Hybrid power generation systems based on the Rankine cycle with heat
regeneration ............................................................................................................. 370

xviii
8.2.4. Analysis of the LEC differences between the hybrid and the reference power
generation Rankine-based systems .......................................................................... 380
Generalization of the differences between the LEC-s of the Rankine-based
hybrid and the reference power generation systems ............................................ 380
Comparison of the Rankine-based hybrid to the reference power generation
systems ................................................................................................................. 382
Sensitivity analysis of the LEC-s differences between the Rankine-based
hybrid and the reference power generation systems, to the temperature of the
additional heat source .......................................................................................... 385
Calculation example ................................................................................ 387
8.3. Hybrid power generation systems based on the Brayton cycle ............................ 397
8.3.1. Hybrid power generation systems based on the simple Brayton cycle ......... 397
8.3.2. Hybrid power generation systems based on the Brayton cycle with intercooling
402
8.3.3. Hybrid power generation systems based on the Brayton cycle with reheat .. 404
8.3.4. Hybrid power generation systems based on the Brayton cycle with heat
regeneration ............................................................................................................. 407
8.3.5. Analysis of the LEC differences between the hybrid and the reference power
generation Brayton-based systems .......................................................................... 409

xix
8.4. Hybrid power generation systems based on the combined-cycle ........................ 410
8.4.1. Hybrid power generation systems based on the combined cycle with the AHS
added in the topping (Brayton) cycle ...................................................................... 410
8.4.2. Hybrid power generation systems based on the combined cycle with the AHS
added in the bottoming cycle (Rankine) cycle ........................................................ 413
8.4.3. Hybrid power generation systems based on the combined cycle with the AHS
added in both the topping and bottoming cycles ..................................................... 418
8.4.4. Analysis of the LEC differences between the hybrid and the reference power
generation combined cycle-based systems .............................................................. 420
8.5. Comparison between the exergo-economic analysis method and the energo-
economic analysis method .......................................................................................... 421
8.6. Summary and conclusions of the exergo-economic analysis of thermal hybrid power
generation systems ...................................................................................................... 423
8.7. Recommendations and future trends of the exergo-economic analysis of thermal
hybrid power generation systems ................................................................................ 428
CHAPTER 9 EXERGO-ECONOMIC ANALYSIS FOR THERMOCHEMICAL
HYBIRD POWER GENERATION SYSTEMS ............................................................ 434
9.1. Exergo-economic analysis of the SOLRGT system ............................................. 434
9.2. Comparison the LEC of the SOLRGT with the reference single heat source
thermochemical system (IC-CRGT) ........................................................................... 443

xx
9.3. Comparison of the LEC of the SOLRGT with the reference hybrid non-
thermochemical reference system (IC-HSTIG) .......................................................... 453
9.4. Sensitivity analysis of the SOLRGT LEC to fuel price, carbon tax and the solar
collection equipment price .......................................................................................... 459
9.5. Exergo-economic analysis of the SOLRMCC ..................................................... 464
9.6. Conclusions of the exergo-economic analysis of thermochemical hybrid systems
..................................................................................................................................... 480
9.7. Recommendations and future ............................................................................... 483
CHAPTER 10 CONCLUSIONS AND RECOMMENDATIONS ................................. 486
Nomenclature .................................................................................................................. 495

xxi
LIST OF TABLES
Table 3-1. A summary of past studies of solar-assisted vapor power cycles ................... 42
Table 3-2. A summary of past studies of solar-assisted gas power cycles ....................... 55
Table 3-3. A summary of past studies of solar-assisted combined power cycles ............. 70
Table 3-4. A summary of past studies of hybrid power cycles without solar input ....... 104
Table 4-1. Summary results of the sensitivity analysis of the hybrid power generation
systems based on the simple Rankine cycle with respect to the AHS ............................ 174
Table 4-2. Important input parameters for simulation in the reference power generation
systems based on the simple Rankine cycle (Fig. 4-1) ................................................... 179
Table 4-3. Aspen Plus simulation results for each state point in Fig. 4-1 ...................... 180
Table 4-4. Comparison of the results obtained by using Aspen Plus and EES. ............. 182
Table 5-1. Operation parameter summary for the validation reference system [1] ........ 239
Table 5-2. Composition of the fuel used in the validation [1] ........................................ 241
Table 5-3. Comparison results between the reference and simulation for the validation
system ............................................................................................................................. 241
Table 5-4. Operation parameters for the reference power generation systems based on the
Brayton cycle with intercooling, reheat and heat regeneration ....................................... 244
Table 5-5. Physical properties at each design point for the reference power generation
systems based on the Brayton cycle with intercooling, reheat and heat regeneration, with
pressure drops ................................................................................................................. 247

xxii
Table 5-6. Simulation results for the reference power generation systems based on the
Brayton cycle with intercooling, reheat and heat regeneration, with pressure drops ..... 248
Table 5-7. Component exergy breakdown for the reference power generation systems
based on the Brayton cycle with intercooling, reheat and heat regeneration .................. 251
Table 5-8. Physical properties at each design point in Fig. 5-11 for the hybrid power
generation systems based on the Brayton cycle with intercooling, reheat and heat
regeneration in the limiting case ..................................................................................... 254
Table 5-9. Operation data for the hybrid power generation systems based on the Brayton
cycle with intercooling, reheat and heat regeneration in the limiting case ..................... 255
Table 7-1. A summary of past studies of thermochemical hybrid power generation systems
......................................................................................................................................... 289
Table 7-2. Exergy destruction calculation summary for the heat transfer and reforming
process in the T-Q diagrams for the SOLRGT and IC-CRGT ....................................... 301
Table 8-1. Fuel, product and auxiliary equation for each component in the hybrid simple
Rankine cycle system (Fig. 4-2) ..................................................................................... 356
Table 8-2. Summary of the calculation example results ................................................. 394
Table 8-3. Relative difference of the component cost rate between the hybrid and the
reference combined cycle system ................................................................................... 416
Table 9-1. Fuel, product and auxiliary equations for each component in the SOLRGT
system in Fig. 7-1 ............................................................................................................ 435

xxiii
Table 9-2. Assumptions used in the analysis of the SOLRGT system in Fig. 7-1 with
numbers ........................................................................................................................... 451
Table 9-3. Economic analysis assumptions summary for the SOLRGT system in Fig. 7-1
......................................................................................................................................... 460
Table 9-4. Fuel, product and auxiliary equations for each component in the SOLRMCC
system in Fig. 7-6 ............................................................................................................ 465
Table 9-5. Summary table for ia in comparison between SOLRGT and SOLRMCC .. 477
Table 9-6. Main conclusions of the exergo-economic analysis for SOLRGT and
SOLRMCC. .................................................................................................................... 481

xxiv
LIST OF ILLUSTRATIONS
Fig. 3-1 Flow diagram of the SSPRE power/cooling system with design points (redrawn
based on [1]) ..................................................................................................................... 26
Fig. 3-2 Flow diagram of the solar heating, cooling and power generation system [22] . 35
Fig. 3-3 Flow diagram of a hybrid solar gas-turbine power plant [53] ............................. 48
Fig. 3-4 Flow diagrams of hybrid combined cycle (adapted from [74]) .......................... 60
Fig. 3-5 Hybrid option biomass unit simplified scheme, 01HybFF configuration [88] ... 79
Fig. 3-6 Hybrid option biomass unit simplified scheme, 01HybPP configuration [88] ... 79
Fig. 3-7 Flow diagram of a nuclear-assisted combined cycle (Nuclear assisted NGCC) (RO:
reactor outlet, RI: reactor inlet, eff: effectiveness/efficiency, HX: heat exchanger, Comp:
compressor, GT: gas turbine, ST: steam turbine, HRSG: heat recovery steam generator, T:
temperature, P: power) [95] .............................................................................................. 83
Fig. 3-8 Hybrid nuclear renewable system for variable electricity production [76] ......... 85
Fig. 3-9 Compounded IC engine power plant layout of the configuration without LP turbine,
with MP EGR [97] ............................................................................................................ 87
Fig. 3-10 Compounded IC engine power plant layout of the configuration without LP
turbine, with MP EGR [97] ............................................................................................... 87
Fig. 3-11 Compounded IC engine power plant layout of the without LP turbine, with LP
EGR and high temperature Rankine cycle configuration [97] .......................................... 88

xxv
Fig. 3-12 Flow diagram (a) and T-s diagram (b) of a combined diesel-engine gas-turbine
system with intercooling and regeneration [103] (DE: Diesel engine, C: compressor, T:
turbine, CC: combustion chamber, IC: Intercooler, RG: regenerator) ............................. 89
Fig. 3-13 Schematic diagrams of the ORC system (a) without pre-heater and (b) with pre-
heater [99] ......................................................................................................................... 91
Fig. 3-14 Flow diagram of the fuel-cell-topped Rankine power cycle system [78] ......... 94
Fig. 3-15 Flow diagram of trigeneration plant with combined SOFC and organic Rankine
cycle [105] ........................................................................................................................ 95
Fig. 3-16 Flow diagram of the power plant integrating coal gasification, SOFC, CLC and
combined power cycle [106] ............................................................................................. 97
Fig. 3-17 Schematic of TEES LH T-CO2 cycles, charging mode (top) and discharging and
generation mode (bottom) [107] ....................................................................................... 99
Fig. 3-18 Exergy flow diagram of the LOTHECO cycle [108] ...................................... 100
Fig. 3-19 Schematic of proposed D-CCHP configuration [84] ...................................... 101
Fig. 3-20 Block flow diagram of hybrid power plant for CO2 capture [109] ................. 103
Fig. 3-21 Amine unit for CO2 capture [109] .................................................................. 103
Fig. 3-22 Hybrid power plant energy efficiency at design point as a function of the highest
temperature of working fluid in the cycle ....................................................................... 117
Fig. 4-1. Flow diagram of the reference (single heat source) power cycle based on the
simple Rankine cycle without additional heat sources (AHS) (Cond: condenser, CEP:
condensate extraction pump) .......................................................................................... 138

xxvi
Fig. 4-2. Flow diagram of the hybrid power cycle based on the simple Rankine cycle with
one additional heat source (AHS) (Cond: condenser, CEP: condensate extraction pump,
AHSP: additional heat source pump, AHSC: additional heat source collection equipment)
(The heat exchanger may be part of the economizer in the reference system when there is
no AHS) .......................................................................................................................... 138
Fig. 4-3 The T-s diagram for the hybrid power generation systems based on the simple
Rankine cycle in Fig. 4-2 ................................................................................................ 139
Fig. 4-4. The specific heat at constant pressure dependency on the water temperature (at 14
MPa) [1] .......................................................................................................................... 157
Fig. 4-5 The simple Rankine systems results by using EES (equivalent to manual validation)
based on the shown state points ...................................................................................... 182
Fig. 4-6. The relation between the energy efficiency of the hybrid system, h , and the
additional heat source (AHS) heat addition rate, AHSQ , for the hybrid power generation
systems based on the simple Rankine cycle (AHS is the energy conversion efficiency of
the AHS) ......................................................................................................................... 185
Fig. 4-7. The relation between the energy efficiency of the hybrid system, h , and the
temperature of the additional heat source (AHS), AHST , for the hybrid power generation
systems based on the simple Rankine cycle (AHS is the energy conversion efficiency of
the AHS) ......................................................................................................................... 186

xxvii
Fig. 4-8. The relation between the exergy efficiency of the hybrid system, h , and the
additional heat source (AHS) heat addition rate, AHSQ , for the hybrid power generation
systems based on the simple Rankine cycle (AHS is the energy conversion efficiency of
the AHS) ......................................................................................................................... 188
Fig. 4-9. The relation between the exergy efficiency of the hybrid system, h , and the
temperature of the additional heat source (AHS),AHST , for the hybrid power generation
systems based on the simple Rankine cycle (AHS is the energy conversion efficiency of
the AHS) ......................................................................................................................... 189
Fig. 4-10. Flow diagram of the reference (single heat source) power cycle based on a
Rankine cycle with reheat without the additional heat source (AHS) (Cond: condenser,
CEP: condensate extraction pump, HP: high-pressure, LP: low-pressure) .................... 194
Fig. 4-11. Flow diagram of hybrid steam power plant with reheat assisted by an additional
heat source (AHS) (Cond: condenser, CEP: condensate extraction pump, AHSP: additional
heat source pump, HP: high-pressure, LP: low-pressure) (The heat exchanger may be part
of the economizer in the reference system when there is no AHS) ................................ 195
Fig. 4-12. Comparison results between the energy efficiency of the hybrid system, h , and
the additional heat source (AHS) heat addition rate, AHSQ , for the hybrid power generation
systems based on the Rankine cycles with and without reheat ( AHS is the energy
conversion efficiency of the AHS) ................................................................................. 200

xxviii
Fig. 4-13. Comparison results between the energy efficiency of the hybrid system, h , and
the temperature of the additional heat source (AHS), AHST , for the hybrid power generation
systems based on the Rankine cycles with and without reheat ( AHS is the energy
conversion efficiency of the AHS) ................................................................................. 201
Fig. 4-14. Comparison results between the exergy efficiency of the hybrid system, h , and
the additional heat source (AHS) heat addition rate, AHSQ , for the hybrid power generation
systems based on the Rankine cycles with and without reheat ( AHS is the energy
conversion efficiency of the AHS) ................................................................................. 202
Fig. 4-15. Comparison results between the exergy efficiency of the hybrid system, h , and
the temperature of the additional heat source (AHS), AHST , for the hybrid power generation
systems based on the Rankine cycles with and without reheat ( AHS is the energy
conversion efficiency of the AHS) ................................................................................. 203
Fig. 4-16. Flow diagram of the reference steam power plant with regeneration by 2 closed
feedwater heaters and one open feedwater heaters (Cond: condenser, CEP: condensate
extraction pump, BFP: boiler feedwater pump, HP: high-pressure, LP: low-pressure) . 205
Fig. 4-17. Flow diagram of the first examined kind of hybrid regenerative steam power
plant in which the closed high-pressure feedwater heater was replaced by an additional heat
source (AHS) (Cond: condenser, CEP: condensate extraction pump, BFP: boiler feedwater
pump, AHSC: additional heat source collection equipment, AHSP: additional heat source
pump, LP: low-pressure) ................................................................................................. 205

xxix
Fig. 4-18. Flow diagram of the second examined kind of hybrid regenerative steam power
plant in which the closed low-pressure feedwater heater was replaced by an AHS (Cond:
condenser, CEP: condensate extraction pump, BFP: boiler feedwater pump, AHSC:
additional heat source collection equipment, AHSP: additional heat source pump, HP:
high-pressure) ................................................................................................................. 206
Fig. 5-1. Flow diagram of the hybrid gas turbine power plant based on a simple Brayton
cycle with an additional heat source (AHS) (AHSC: additional heat source collection
equipment) ...................................................................................................................... 217
Fig. 5-2. T-s diagram of the hybrid gas turbine power plant based on a simple Brayton
cycle with an additional heat source (AHS) (QLT: heat input from the additional heat source,
QHT: heat input from the fuel in the combustor, ——: isobars, - - - -: real processes) ... 217
The flow and T-s diagrams of hybrid gas turbine power plants with intercooling are shown
in Figs. 5-3 and 5-4, respectively. If there is no intercooling used, the operation cycle would
have been 1-2-3-4-5-1. When the intercooling is used, compressed air from the low-
pressure compressor (LP) at state 11 is cooled to state 12 and then compressed by the high-
pressure (HP) compressor to state 2, at which the additional heat source is added. The
operation cycle for the intercooled Brayton cycle is thus 1-11-12-2-3-4-5-1. Due to the
pressure losses during heat addition from state 2 to state 3 and from state 3 to state 4, the
pressure at the outlet of a component is lower than at its inlet. In addition, there is a pressure
loss in the intercooler and all piping, so the air pressure at the intercooler outlet is lower
than at its inlet. The temperature at outlet of the compressor is decreased from state 21 to

xxx
state 2. So there is more flexibility for choosing the temperature and the type of AHS since
the temperature of the AHS must be higher than the temperature of pressurized air at the
compressor outlet. Also, since the intercooling decreased the temperature at the compressor
outlet, more regeneration can be gained from the gas turbine exhaust gas at state 5. .... 226
Fig. 5-5. Flow diagram of the hybrid gas turbine power plant based on the Brayton cycle
with intercooling with an additional heat source (AHS) (AHSC: additional heat source
collection equipment, LP: low-pressure, HP: high-pressure) ......................................... 227
Fig. 5-6. T-s diagram of hybrid gas turbine power plant based on the Brayton cycle with
intercooling with an additional heat source (AHS)(QLT: heat input from the additional heat
source, QHT: heat input from the fuel in the combustor, ——: isobars, - - - -: real processes)
......................................................................................................................................... 228
Fig. 5-7. Flow diagram of the reheat Brayton-based hybrid gas turbine power plant with an
additional heat source (AHS) used to preheat the pressurized air (AHSC: additional heat
source collection equipment, LP: low-pressure, HP: high-pressure) .............................. 231
Fig. 5-8. Qualitative T-s diagram of the reheat Brayton-based hybrid gas turbine power
plant with an additional heat source (AHS) (QLT: heat input from the additional heat source,
QHT,1: heat input from the fuel in the combustor, QHT,2: heat input from the reheater, ——:
isobars, - - - -: real processes) ......................................................................................... 231
Fig. 5-9. Flow diagram of hybrid gas turbine power plant based on the Brayton cycle with
heat regeneration, with an additional heat source (AHS) (AHSC: additional heat source
collection equipment) ...................................................................................................... 235

xxxi
Fig. 5-10. Qualitative T-s diagram of the regenerative Brayton-based hybrid gas turbine
power plant with an additional heat source (AHS) (QLT: heat input from the additional heat
source, QHT: heat input from the fuel in the combustor, QR: heat duty of the regenerator, —
—: isobars, - - - -: real processes) ................................................................................... 235
Fig. 5-11. Flow diagram of the hybrid gas turbine power plant based on the Brayton cycle
with intercooling, reheat and heat regeneration, with an additional heat source (AHS)
(AHSC: additional heat source collection equipment, LP: low-pressure, HP: high-pressure)
......................................................................................................................................... 237
Fig. 5-12. Flow diagram of the reference gas turbine power plant based on the Brayton
cycle with intercooling, reheat and heat regeneration (LP: low-pressure, HP: high-pressure)
......................................................................................................................................... 238
Fig. 5-13. T-s diagram of the validation system in Fig. 5-12 using the assumptions in Table
5-1 ................................................................................................................................... 243
Fig. 5-14. T-s diagram of the reference power generation systems based on the Brayton
cycle with intercooling, reheat and heat regeneration (×: pressure drops considered, °:
pressure drops not considered)........................................................................................ 246
Fig. 5-15. Component exergy destruction breakdown for the reference power generation
systems based on the Brayton cycle with intercooling, reheat and heat regeneration .... 252
Fig. 5-16 The exergy destruction rate breakdown in each component for the hybrid power
generation systems based on the Brayton cycle with intercooling, reheat and heat

xxxii
regeneration in the limiting case (the AHS temperature is defined as the sun surface
temperature when solar heat is used as the AHS) ........................................................... 259
Fig. 5-17. The exergy destruction rate breakdown in each component for the hybrid power
generation systems based on the Brayton cycle with intercooling, reheat and heat
regeneration in the limiting case (the AHS temperature is defined as 10 K higher than the
AHSC outlet temperature) .............................................................................................. 260
The results also showed that the exergy destruction fraction in the AHSC of the total exergy
destruction of the hybrid system is less than exergy destruction fraction of the combustor
1 of the total exergy destruction in the reference system (the numbers can be easily read
from Figs. 5-18-5-19 and will not be repeated here). This is mainly because the exergy
destruction in the combustor during fuel combustion is higher than that in the AHSC in
which the temperature difference between the heat source (solar heat) and the working fluid
(pressurized air) is small. ................................................................................................ 262
Fig. 5-20. The relation between the energy efficiency of the hybrid system and the AHS
input fraction of total energy input for different energy conversion efficiencies of the AHS
......................................................................................................................................... 264
Fig. 5-21. The relation between the energy efficiency of the hybrid system and the AHS
exergy input rate for different energy conversion efficiencies of the AHS .................... 264
Fig. 5-22. The relation between the energy efficiency of the hybrid system and the
dimensionless parameter 6 5
7
T T
T
in Fig. 5-11 for different energy conversion efficiency
of the AHS ...................................................................................................................... 265

xxxiii
Fig. 6-1. Flow diagrams of hybrid combined cycle with three ways to add the additional
heat source(s) (AHS): added to Brayton cycle as AHS1, added to the Rankine cycle as
AHS2, and added to both cycles (HRSG: heat recovery steam generator, CEP: condensate
extraction pump, AHSC: additional heat source collection equipment) ......................... 269
Fig. 6-2. Qualitative T-s diagram of the hybrid combined cycle plant with two additional
heat sources (AHS) (QLT,1: heat input from the additional heat source at the topping cycle,
QLT,2: heat input from the additional heat source at the bottoming cycle, QHT: heat input
from the fuel in the combustor, QR: heat duty of the heat recovery steam generator, ——:
isobars, - - - -: real processes) ......................................................................................... 270
Fig. 6-3. Flow diagram of the hybrid combined cycle power plant with the additional heat
source (AHS) added in the topping (Brayton) cycle (HRSG: heat recovery steam generator,
CEP: condensate extraction pump, AHSC: additional heat source collection equipment)
......................................................................................................................................... 272
Fig. 6-4. Flow diagram of a hybrid combined cycle power plant with single-pressure HRSG
with the additional heat source (AHS) added in the bottoming cycle (Adapted from [])277
Fig. 6-5. Flow diagram of a hybrid combined cycle power plants with a dual-pressure
HRSG with the additional heat source (AHS) added in the bottoming cycle (Adapted from
[]) (AC: air compressor, CC: combustion chamber; GT: gas turbine, SH: superheater, EVA:
evaporator, ECO: economizer, BFP: boiler feedwater pump, DEA: deaerator, HRSG: heat
recovery steam generator, CEP: condensate extraction pump, COND: condenser, ST:
steam turbine, SHE: solar heat exchanger, OILP: oil pump, COLL: solar collector) .... 278

xxxiv
Fig. 6-6. Flow diagram of the hybrid combined cycle power plant with the additional heat
source (AHS) added in the topping (Brayton) cycle (HRSG: heat recovery steam generator,
CEP: condensate extraction pump, AHSC: additional heat source collection equipment)
......................................................................................................................................... 279
Fig. 7-1. Schematic diagram of the SOLRGT cycle [15] ............................................... 296
Fig. 7-2. Heat recuperation T-Q diagram for the SOLRGT system [15] (REF: reformer,
REP: recuperator, ECO: economizer) ............................................................................. 297
Fig. 7-3. Schematic diagram of the basic CRGT cycle [18] (HRSG: heat recovery steam
generator) ........................................................................................................................ 298
Fig. 7-4. Heat recuperation T-Q diagram for the IC-CRGT system [15] (REF: reformer,
HRSG: heat recovery steam generator) .......................................................................... 299
Fig. 7-5. Indirect upgrading the low/mid-level solar heat (Adapted from [15]) ............. 305
Fig. 7-6. Flow diagram for solar thermal power cycle with solar decomposition of methanol,
SOLRMCC [29] (HRSG: heat recovery steam generator) ............................................. 318
Fig. 7-7. The relationship between the upgraded level of the solar heat and the collector
temperature for reforming of methanol and methane (adapted from [29]) (The ordinate is
the upgraded energy level defined as syn sol sol ............................................ 321
Fig. 7-8. Generalized energy and exergy streams diagram for the thermochemical hybrid
process............................................................................................................................. 325
Fig. 9-1. Flow diagram of the reference non-thermochemical hybrid system IC-HSTIG
(intercooled hybrid steam injection gas turbine power generation system) ................... 455

xxxv
Fig. 9-2. Sensitivity analysis of levelized electricity cost (LEC) from SOLRGT to fuel price,
carbon tax with different solar collection equipment price (100%, 75% and 50% of the base
price for the upper, middle and lower surface, respectively) .......................................... 463

1
CHAPTER 1
INTRODUCTION
Most thermal power generation systems (e.g. fossil fuel, nuclear, solar, geothermal) use a
single source of heat at a single temperature, and also use that heat source directly as heat.
In some cases, the cost of the heat is related to the temperature, such as with solar heat
collection equipment; the temperature of the heat source is limited by operational
considerations, such as in nuclear reactors; the available temperature is well below the
material endurance temperature, such as in geothermal heat sources; it is desired to employ
renewable or other types of energy that reduces global warming gas emissions or/and
reduces use of depletable fuels; waste heat at appropriate temperatures and price is
available, such as in compounded internal combustion engines. It was found in these cases
that gains in efficiency and reduction of emissions and cost could be achieved by power
systems using multiple heat sources of different temperatures, which are called here
“hybrid” systems.
Early work on hybrid power cycles was done by Lior and co-workers [1-5] who have
analyzed and developed hybrid solar-powered/fuel assisted steam cycles and performed
experiments with one of them (22.4 kW output), a concept similar to the one that was later
(in the 1980s) used by the Luz company for the construction and successful operation of 9
solar-thermal power plants (SEGS) generating about 354 MWe (net) in southern California
[6–8], that still operate competitively. The concept is successful because it uses solar

2
energy at the lower temperature level, where it is more economical, and augments it by
smaller amount of heat from fuel combustion to: (1) raise the cycle temperature and thus
efficiency, and (2) allow fuel heat backup when solar energy is not sufficiently available,
without having to increase the number of collectors and thermal storage capacity.
Furthermore, proper configuration of the systems’ heat donors and receivers offers a closer
match between their temperatures (smaller temperature differences between donors and
receivers) and thus lower exergy losses. The energy and global warming crises have
strongly increased the interest in such systems, especially solar-based, and several plants
are in operating, construction or planning.
Another concept, of thermochemical hybridization, is explained in papers by Zhang, Lior
and co-workers [9-12] and recent studies by others [13-15], and is discussed in CHAPTER
7 and CHAPTER 9.
Past studies on hybrid power cycles using multiple heat sources of different temperatures
focused mainly on case studies and almost no general theory about this type of systems has
been developed. This dissertation is a study of their general thermodynamic performance,
with their comparison to their corresponding single temperature heat source reference
system.
The method used in the dissertation is step-wise: to first analyze the major, most commonly
used, hybrid power generation systems thermodynamically, without involving specific
operation parameter values. In this way, some generalized theory that is at least applicable

3
to this type of system can be developed. The second step is to perform such an analysis for
all the major types of power generation systems (e.g. Rankine, Brayton, Combined Cycles,
and their main variants). The third step is to find commonalities between these theories (if
any). The fourth and last step is to develop the sought generalized theory based on these
commonalities.
A number of simulation case studies were performed to help the understanding and confirm
the thermodynamic generalization of the results. Exergo-economic analysis was also
performed to complement the thermodynamic analysis with consideration of the
externalities and carbon tax, and was compared to the conventional economic analysis
method.
The generalized expressions for the energy/exergy efficiency difference between the
hybrid and the corresponding single heat source system were developed. The results
showed that the energy and exergy efficiencies of the hybrid systems are higher than those
of their corresponding single heat source reference systems if and only if the energy/exergy
conversion efficiency (defined in the dissertation) of the additional heat source (AHS, can
be any heat source that has lower temperature) is larger than that of the original heat source.
Sensitivity analysis results showed the relation between the temperature and heat addition
rate of the AHS and the energy/exergy efficiency of the hybrid systems, for different energy
conversion efficiency of the AHS. Simple criteria were also developed to help compare the
hybrid and reference system and determine under which conditions the hybrid systems will
have better thermodynamic or economic performance than the reference ones.

4
The results and criteria found in the dissertation can be used to help design the hybrid
systems to achieve higher energy and/or exergy efficiencies or lower levelized electricity
cost (LEC) before detailed design or simulation or experiment. These are the main
contributions from the author of the dissertation to the state of knowledge. None of this
work has been done by others, to the best of the author’s knowledge.
So far, 3 archival journal papers [16-18] and 3 conference papers were published from this
dissertation work.
In this dissertation, CHAPTER 1 serves as a preparation of the thermodynamic analysis by
defining and discussing the important criteria that could be used to evaluate and compare
the performance of the hybrid systems and reference (single heat source) systems. Energy
efficiency and exergy efficiencies were defined in this chapter, along with some other
system performance criteria. The following chapters (CHAPTERS 3-9), were the main
contributions of the dissertation to the state of knowledge, and are divided into two parts.
The first part, containing CHAPTERS 3-7, is about the thermodynamic performance of the
hybrid systems, and the second part, containing CHAPTERS 8-9, is about the economic
performance of the hybrid systems. CHAPTER 10, the final, summarizes the conclusions
and makes some recommendations about the hybrid power systems.
For the first part, the background review of thermal hybrid systems was made in
CHAPTER 3, followed by the thermodynamic analysis of hybrid power generation systems
based on Rankine cycles (CHAPTER 4), Brayton cycles (CHAPTER 5) and the combined

5
cycle (CHAPTER 6), respectively. CHAPTER 7, beginning with a background review of
the thermochemical hybrid systems, was the thermodynamic analysis of the
thermochemical hybrid systems, focusing on two representative thermochemical hybrid
systems.
For the second part, the economic analysis of the thermal hybrid systems was made in
CHAPTER 8, and of the thermochemical hybrid systems in CHAPTER 9, respectively.
These two parts, especially the first parts that dealt with the thermodynamic analysis,
contributed to the state of knowledge.
References for Chapter 1
[1] Koai K., Lior N., YeH H., Performance analysis of a solar-powered/fuel-assisted
Rankine cycle with a novel 30hp turbine. Sol Energy 1984;(32)6:753-764.
[2] Lior N., Koai K., Solar‑Powered/Fuel‑Assisted Rankine Cycle Power and Cooling
System: Simulation Method and Seasonal Performance. J Sol Energ-T ASME
1984;106:142‑152.
[3] Lior N., Koai K., Solar‑Powered/Fuel‑Assisted Rankine Cycle Power and Cooling
System: Sensitivity Analysis. J Sol Energ-T ASME 1984;106:447‑456.

6
[4] Lior N., Solar energy and the steam Rankine cycle for driving and assisting heat
pumps in heating and cooling modes. Energ Convers 1977;(16)3:111-123.
[5] Sherburne D., Lior N., Evaluation of minimum fuel consumption control strategies in
the solar‑powered fuel‑assisted hybrid Rankine cycle. Proceedings ASES Ann. Meeting
1986:300-303.
[6] Kolb J., Evaluation of Power Production from the Solar Electric Generating Systems
at Kramer Junction: 1988 to 1993. Proceedings of the Solar Engineering 1995; ASME
Press New York: 1:499-504.
[7] Cohen G.H., Kearny O., Improved Parabolic Trough Solar Electric Systems Based on
the Segs Experience. Proceedings of the American Solar Energy Society Conference
1994:147-150.
[8] Jensen C., Price H., Kearney D., The SEGS Power Plants: 1988 Performance. 1989
ASME International Solar Energy Conference San Diego CA.
[9] Hong H., Jin H., Ji J., Wang Z., Cai R., Solar thermal power cycle with integration of
methanol decomposition and middle-temperature solar thermal energy. Sol Energy
2005;78:49-58.

7
[10] Jin H., Hong H., Sui J., Liu Q., Fundamental study of novel mid-and low-
temperature solar thermochemical energy conversion. Sci China Ser E 2009;52(5):1135-
1152.
[11] Zhang N., Lior N., Use of low/mid-temperature solar heat for thermochemical
upgrading of energy, part I: application to a novel chemically-recuperated gas-turbine
power generation (SOLRGT) system. J Eng Gas Turb Power 2012;134(7):072301.
[12] Zhang N., Lior N., Use of Low/Mid-Temperature Solar Heat for Thermochemical
Upgrading of Energy, Part II: A Novel Zero-Emissions Design (ZE-SOLRGT) of the
Solar Chemically-Recuperated Gas-Turbine Power Generation System (SOLRGT)
guided by its Exergy Analysis. J Eng Gas Turb Power 2012;134(7):072302.
[13] Zhang H., Hong H., Gao J., Jin H., Mid-temperature Solar Hybridization CCHP with
DME Fuelled-Chemical Looping Combustion. ECOS 2015: Proceedings of the 28th
International Conference on Efficiency, Cost, Optimization, Simulation, and
Environmental Impact of Energy Systems;2015 Jun 30- Jul 3;Pau, France.
[14] Hao Y., Kong H., A Solar Thermochemical Fuel Production System Integrated with
Fossil Fuels. ECOS 2015: Proceedings of the 28th International Conference on

8
Efficiency, Cost, Optimization, Simulation, and Environmental Impact of Energy
Systems;2015 Jun 30- Jul 3; Pau, France.
[15] Manente G., Lazzaretto A., Solar-aided precombustion CO2 capture in natural gas
combined cycles. ECOS 2015: Proceedings of the 28th International Conference on
Efficiency, Cost, Optimization, Simulation, and Environmental Impact of Energy
Systems;2015 Jun 30- Jul 3;Pau, France.
[16] Yue T., Lior N., Thermodynamic analysis of solar-assisted hybrid power generation
systems integrated with thermochemical fuel conversion. Energy 2017(118):671-683.
[17] Yue T., Lior N., Exergo economic analysis of solar-assisted hybrid power generation
systems integrated with thermochemical fuel conversion. Applied Energy 2017(191):204-
222.
[18] Yue T., Lior N., Exergo-economic Competitiveness Criteria for Hybrid Power
Cycles using Multiple Heat Sources of Different Temperatures. Energy 2017:1-19.
Article in Press.

9
CHAPTER 2
ENERGY AND EXERGY PERFORMANCE CRITERIA
2.1. Introduction
Most thermal power cycles currently in use rely on a single temperature heat source. For
example, in fossil fuel power plants, the high temperature is achieved through burning coal,
fuel oil, or natural gas to generate power. This kind of plant is widely used because of its
many benefits, such as long experience with design, control and maintenance, but it also
has disadvantages, among which are emissions and exergy loss of about 30% in the
combustion process are perhaps the most serious ones, notwithstanding depletion of fossil
fuels, and for many fuel-importing countries the related energy insecurity. Many air
pollutants such as NOX, SOX, and health threatening particulates, are created by burning
fossil fuels, accompanied by carbon emission (CO2 emission is 2,316 kg/ton for coal, 1.87
kg per cubic meter for natural gas, and 2.11 kg per liter for gasoline [1]), and cause the
earth-threatening greenhouse effect pointing to the need for reducing the use of fossil fuels.
They can be replaced by renewable heat sources or ones that produce lower or no emissions
during the plant operation, or are more economical. Also, as will be discussed in the exergy
analysis in Section 2.3, one of the important advantages of thermal hybrid power cycles
compared with conventional fossil-fuel only power cycles is their ability to reduce this
temperature difference and thus the associated exergy destruction by choosing heat sources

10
(such as from solar collectors, waste heat, or geothermal) that have temperatures closer to
that of the working fluid.
For comparison, the highest temperature of the hybrid cycles, which use two or more heat
sources, is kept the same as that of the reference power cycles (use a single heat source but
with similar configuration), which is in practice at the maximal temperature the materials
can tolerate. In this way, the theoretical maximal efficiency (which is the Carnot efficiency)
is the same for both the conventional single heat source system and the hybrid systems
studied here. In this way, the effect of using additional heat sources on the thermodynamic
and economic performance of the conventional single heat source system can be studied
and compared.
To study the thermodynamic performance of the hybrid systems and compare them with
their corresponding single heat source systems, energy efficiency of the hybrid systems
must be analyzed. Energy efficiency, or thermal efficiency that is commonly used in
practice, is the most important thermodynamic performance criterion of power generation
systems in general. It presents how much work can be produced from a certain amount of
energy. It is thus of interest of study whether the hybrid have higher energy efficiency than
the corresponding conventional single heat source systems, by how much, and how it is
influenced by the temperature or the heat input of the additional heat source (AHS) of the
hybrid systems.

11
Although energy efficiency is most widely used thermodynamic performance criterion, it
is not perfect. The energy efficiency does not consider the ability of the heat source for
doing work. Different heat sources may have different potential of doing work (called
exergy) even if they have the same amount of energy. Considering that the hybrid power
generation systems studied in this research use different kinds of heat sources or heat
sources that have different temperatures, it is thus necessary to use the exergy analysis
which complements the energy analysis, to fully study and reveal the advantages of hybrid
power generation systems using multiple heat sources of different temperatures. Details
about exergy analysis are discussed in Section 2.3.
This chapter serves as a preparation of the thermodynamic analysis by defining and
discussing the important criteria that could be used to evaluate and compare the
performance of the hybrid systems and reference (single heat source) systems. Energy
efficiency and exergy efficiencies were defined in this chapter, along with some other
system performance criteria. The following chapters (CHAPTERS 3-9), excluding the
conclusions of the dissertation (CHAPTER 10), were the main contributions of the
dissertation to the state of knowledge, and is divided into two parts. The first part,
containing CHAPTERS 3 to 7, is about the thermodynamic performance of the hybrid
systems, and the second part, containing CHAPTERS 8-9, is about the economic
performance of the hybrid systems.
For the first part, the background review of the thermal hybrid system was made in
CHAPTER 3, followed by the thermodynamic analysis of hybrid power generation systems

12
based on Rankine cycles (CHAPTER 4), Brayton cycles (CHAPTER 5) and the combined
cycle (CHAPTER 6), respectively. CHAPTER 7, beginning with a background review of
the thermochemical hybrid systems, is the thermodynamic analysis of the thermochemical
hybrid systems, focusing on two representative thermochemical hybrid systems.
For the second part, the economic analysis of the thermal hybrid systems was made in
CHAPTER 8, and of the thermochemical hybrid systems was made in CHAPTER 9,
respectively. These two parts, especially the first parts that dealt with the thermodynamic
analysis, contributed to the state of knowledge.
2.2. Energy analysis
The energy efficiency of a power cycle is defined as the ratio between the total net
power output of the system netW and the total heat input rate
inQ
net
in
.W
Q (2.1)
If there are more than one heat sources in the system, Eq. (2.1) becomes
neth ,
i
i
W
Q
(2.2)

13
in which iQ is the heat input rate of the heat source i and
h is the energy efficiency of
the hybrid power cycle.
For example, when fuel or biomass is used as the heat source, the heat input rate of the fuel
or biomass fQ is usually calculated by
f f LHV,Q m (2.3)
in which fm [kg/s] is the mass flow rate of the fuel or biomass used in the system and
LHV [kJ/kg] is the lower heating value of the fuel, which could be found in the tables or
of the biomass, which is treated as known in this research. In Eq. (2.3), LHV is used
instead of HHV which is the higher heating value of the fuel or biomass, because the water
(2H O ) formed during combustion of fuel or biomass usually leaves the system in the form
of vapor and the latent heat contained in the vapor should thus not be included in the
thermal analysis of the system.
It is very noteworthy that the most widely used energy efficiency definition, based on Eqs
(2.2) and (2.3), does not consider the heat input source iQ temperature,
iT , which is a
critically important thermodynamic property and must be included in such analyses,
typically using exergy efficiency, which we do in Section 2.3.
When geothermal or waste heat is used as the heat source, the heat input rate from the heat
source to the system is the heat flow rate of the heat source and is usually easy to find.

14
When solar heat is used as the heat source, the solar radiation rate incident on the solar
collector is
rad s SC,IQ A (2.4)
in which SCA [m2] is the effective radiation absorbing area of the solar collector normal to
the direction of the solar flux sI [kW/m2].
sI may be augmented by a solar concentrator.
Different from radQ ,
solQ is the heat addition rate to the working fluid of the power cycle
(both of which change with time and are defined as transient variables), which is expressed
by
sol receiver optical rad ,Q Q (2.5)
in which receiver is the solar receiver efficiency, which is the ratio between the heat
transferred to the working fluid and the heat received by the solar receiver, and optical is
the optical efficiency of the solar collector, which is the ratio between the heat received by
the solar receiver and the incident solar radiation on the solar collector. The ratio between
solQ and radQ can be called the solar collector efficiency sc and is the multiplication of
the solar collector receiver efficiency and optical efficiency according to Eq. (2.5),
solsc receiver optical
rad
.Q
Q (2.6)
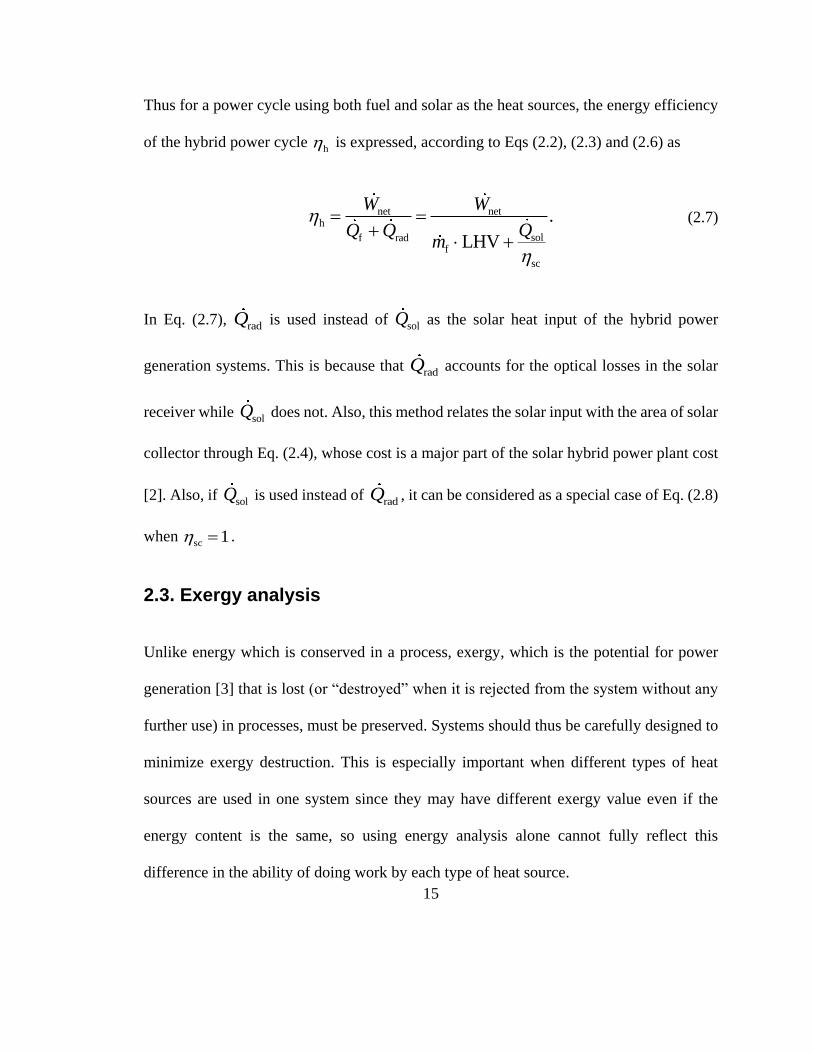
15
Thus for a power cycle using both fuel and solar as the heat sources, the energy efficiency
of the hybrid power cycle h is expressed, according to Eqs (2.2), (2.3) and (2.6) as
net net
solf radf
h
sc
.
LHV
W W
QQ Qm
(2.7)
In Eq. (2.7), radQ is used instead of
solQ as the solar heat input of the hybrid power
generation systems. This is because that radQ accounts for the optical losses in the solar
receiver while solQ does not. Also, this method relates the solar input with the area of solar
collector through Eq. (2.4), whose cost is a major part of the solar hybrid power plant cost
[2]. Also, if solQ is used instead of
radQ , it can be considered as a special case of Eq. (2.8)
when sc 1 .
2.3. Exergy analysis
Unlike energy which is conserved in a process, exergy, which is the potential for power
generation [3] that is lost (or “destroyed” when it is rejected from the system without any
further use) in processes, must be preserved. Systems should thus be carefully designed to
minimize exergy destruction. This is especially important when different types of heat
sources are used in one system since they may have different exergy value even if the
energy content is the same, so using energy analysis alone cannot fully reflect this
difference in the ability of doing work by each type of heat source.

16
For the following thermodynamic analysis, the relation between energy and exergy is
defined here, by the “exergy factor” [4], ,
,B
Q (2.8)
in which B [kJ] is the total exergy content and Q [kJ] is the total energy content of the
mass or heat flow.
Neglecting kinetic, potential, and nuclear exergy, which are often small or zero in
comparison with the chemical exergy, the exergy factor of fuel at environment condition
(ambient temperature and pressure) is
ff ,
LHV
b (2.9)
in which fb [kJ/kg] is the specific exergy of fuel, which can be found in the tables [14] or
calculated based on Eq. (2.9).
The exergy factor of such a heat flow (such as geothermal or waste heat), is, according the
Carnot efficiency equation,
h 0
h
h
h
1 ,T
Q T
B (2.10)

17
in which hB [kJ/kg]and
hQ [kJ/kg] are the exergy and energy content of the heat flow,
respectively, hT [K] and
0T [K] are the temperature of the heat flow and the environment,
respectively.
A commonly accepted definition of the exergy of solar heat does not exist [4-13]. One way
to calculate it is to use the temperature at the sun surface (about 5,800 K) as the temperature
of the solar radiation, and on the other extreme to use the temperature associated with the
working fluid (such as at the solar collector inlet, outlet, the average temperature in the
solar collector, or even 10 K or 20 K above the solar collector inlet, outlet temperature, the
average temperature in the solar collector) heated by the solar radiation. In any solar exergy
definitions, the solar radiation exergy radB can be expressed using the solar exergy factor
rad by
rad rad rad.B Q (2.11)
When the solar exergy is defined based on the working fluid temperature at the outlet of
the solar collector, rad can be expressed, according to Eq. (2.10), by
0
sol
sol
1 ,T
T (2.12)

18
where solT [K] is the temperature at the outlet of the solar collector. When the solar exergy
is defined based on the temperature at the solar surface, the solar exergy factor is expressed
by
0
ss
ss
1 ,T
T (2.13)
in which ssT is the effective temperature at the solar surface, at about 5,800 K. Other solar
exergy definitions obviously result in different values of rad .
Either of the two types solar exergy definitions introduced above were used widely by
researchers worldwide. Each definition has its advantages and drawbacks. The first
definition can be used to compare with other heat sources, such as geothermal or waste
heat, since they have similar temperatures that are related with temperature of the working
fluid. This definition, however, does not consider the exergy loss in the solar collectors,
which is different and based on solar collector efficiency. Also, if the first definition is used,
different solar collector outlet temperatures also influence the calculated solar exergy and
thus the system exergy efficiency, which makes it hard to compare between different
systems, since the solar collector outlet temperatures often varies from case to case. The
second definition, using the sun surface temperature as the solar temperature, does not have
this issue, since it does not depend on the solar collector efficiency or outlet temperature,
which makes it easier to compare between different systems. This definition, however,

19
overestimates the potential of doing work of solar radiation, since no solar collector can
generate heat at the temperature of the sun surface.
I suggest that commercial users or other researchers should use the second definition when
solar heat is used as the heat source in power generation systems, for the following reasons:
1) it makes it easier to compare between the performance of different systems;
2) it leaves room for technology advances when the solar collector may generate heat
that is comparable to the temperature of the sun surface in the future;
3) it provides the opportunities to compare the solar thermal (hybrid) systems with the
space power generation systems using solar radiation outside the atmosphere, and
the photovoltaic power plants which convert the solar radiation directly to the
electricity;
This dissertation, however, will also include the analysis using the first definition of solar
exergy. This is because the dissertation focuses on an inclusive thermodynamic analysis
considering various types of heat sources, including the geothermal and waste heat and the
results using the first definition can also be applied to other types of heat sources, whose
temperatures are easily defined.
The exergy efficiency of a hybrid power cycle using both fuel and solar as the heat sources,
h , is expressed, according to Eqs (2.11) and (2.6) as

20
net ne
rad solf ra
th
df f
sc
.W W
B Bm
Qb
(2.14)
Recognizing that the exergy destruction rate during heat transfer ( dB ) is proportional to
the temperature difference as expressed using [14],
hea
d
t
0
heated0 ing
1 1,
Q
B T QT T
(2.15)
in which Q andQ [kW] are the infinitesimal and total heat transfer rate, respectively;
heatedT and heatingT [K] are the temperature of heated (the cycle working fluid in our case)
and heating (the heat source) during the heat transfer between them, one of the important
advantages of thermal hybrid power cycles compared with conventional fossil-fuel only
power cycles is their ability to reduce this temperature difference and thus the associated
exergy destruction by choosing heat sources (such as from solar collectors, waste heat, or
geothermal) that have temperature closer to the working fluid.
2.4. Other performance criteria
To analyze and compare the performance of the power cycles using single and more heat
sources, other performance criteria are useful besides the energy efficiency and exergy
efficiency introduced before.

21
a) AHS heat input fraction of total energy input
AHSAHS
in
.Q
XQ
(2.16)
Each variable has the same meaning as defined before. It shows the fraction of the heat
input from input relative to the total energy input.
When solar heat is used as the AHS and fuel is used as the original heat source, the solar
share is defined as
rad radsol
in f rad
.LHV
Q QX
Q m Q
(2.17)
b) Fuel savings ratio
f
f
f
,0
1 ,m
Sm
(2.18)
in which f,0m and
fm [kg/s] are the mass flow rates of fuel in the reference (single heat
source) and hybrid (multiple heat sources) power cycles, respectively.
It defines the energy quantity of fuel saved if the AHS is used while producing the same
amount of net power output. It also is proportional to the quantity of emissions that
would have been saved if the added heat source didn’t generate CO2, SOX etc. during
operation such as solar power, since the emission is proportional to the amount of fossil

22
fuel used (the operation of solar or geothermal device etc. doesn’t generate direct
emissions, but does embodied ones).
c) Solar-to-electricity efficiency
net 0
se
rad
f LHV,
W m
Q
(2.19)
in which netW [kW] is the net power output of the hybrid power cycles, 0 is the energy
efficiency of an appropriate chosen reference (single heat source) power cycle using the
same amount of fuel in the hybrid power cycles, and the second term in the numerator
stands for the net power output produced in that reference system.
This parameter shows how much of the solar energy is converted to net power output of
the system. Itis also called the net incremental solar efficiency by some researchers [15].
References for Chapter 2
[1] Carbon Dioxide Emissions Coefficients - Available
at:<http://www.eia.gov/environment/emissions/co2_vol_mass.cfm> [accessed
02.17.2017].

23
[2] Sheu E.J., Mitsos A., Eter A.A., Mokheimer E.M.A., Habib M.A., Al-Qutub A., A
Review of Hybrid Solar-Fossil Fuel Power Generation Systems and Performance
Metrics. J Sol Energ-T ASME 2012;134:041006.
[3] Moran M.J., Shapiro H.N., Fundamentals of Engineering Thermodynamics, 6th ed.
US: John Wiley & Sons;2008.
[4] Petela R., Exergy of Heat Radiation. J Heat Trans-T ASME 1964;86:187-192.
[5] Spanner D.C., Introduction to Thermodynamics, London: Academic Press;1964.
[6] Jeter S.M., Maximum conversion efficiency for the utilization of direct solar
radiation. Sol Energy 1981;26(3):231-236.
[7] Parrott J.E., Theoretical upper limit to the conversion efficiency of solar energy. Sol
Energy 1978;21:227-229.
[8] De Vos A., Pauwels H., Comment on a thermodynamical paradox presented by P.
Wurfel. J Phys C Solid State 1983;16:6897-6909.
[9] Winter C.J., Sizmann R.L., Vant-hull L.L., Solar power plants, New
York:Springer;1991.

24
[10] Landsberg P.T., Tonge G., Thermodynamics of the conversion of diluted radiation. J
Phys A-Math Gen 1979;12:551-562.
[11] Zamfirescu C., Dincer I., How Much Exergy Can One Obtain From Incident Solar
Radiation. J Appl Phys 2009;105:044911.
[12] Baghernejad A., Yaghoubi M., Exergy analysis of an integrated solar combined
cycle system. Renew Energ 2010;35:2157-2164.
[13] Hong H., Jin H., Ji J., Wang Z., Cai R., Solar thermal power cycle with integration
of methanol decomposition and middle-temperature solar thermal energy. Sol Energy
2005;78:49-58.
[14] Szargut J., Exergy Method, WIT, 2005.
[15] Sheu E.J., Mitsos A., Eter A.A., Mokheimer E.M.A., Habib M.A., Al-Qutub A., A
Review of Hybrid Solar-Fossil Fuel Power Generation Systems and Performance
Metrics, J Sol Energ-T ASME 2012;134(4):041006.

25
CHAPTER 3
THERMAL HYBRID POWER CYCLES
BACKGROUND REVIEW
3.1. Developments and status of thermal hybrid power cycles
Perhaps the first studies of such hybrid systems were in the 1970’s when Lior and
coworkers [1-5] proposed, analyzed, constructed and tested a 30 hp prototype of the hybrid
solar-powered/fuel assisted power cycle (SSPRE) under USDOE sponsorship. The same
concept/principle was later used, in the 1980-s, by the Luz Company for the construction
and successful operation of solar-thermal power plants still producing about 380 MWe in
southern California, which are considered to still be the only cost-competitive (albeit with
some tax subsidies) solar thermal power generation system built [6–8]. The concept is
successful because it uses solar energy at the lower temperature level, where it is more
economical, and augments it by smaller amount of heat from fuel combustion to: (1) raise
the cycle temperature and thus efficiency, and (2) allows fuel heat backup when solar
energy is not sufficiently available, without having to increase the number of collectors
and the thermal storage capacity. The flow diagram of SSPRE with operating parameters
at design point is shown in Fig. 3-1 (redrawn based on [1]).

26
Fig. 3-1 Flow diagram of the SSPRE power/cooling system with design points (redrawn
based on [1])
The system used solar heat generated from solar collectors to heat the working fluid (water)
to around 100 °C and then boil it at about atmospheric pressure before the steam was
superheated to 600 °C by burning of natural gas. It incorporated an economizer and
regenerator to recuperate the turbine exhaust energy to heat the working fluid. The results
showed that the efficiency of the basic power cycle was 18.3% at design, more than double
as compared to organic fluid cycles operating at similar solar input temperatures, at the
expense of adding only 20% non-solar energy. It was also shown to offer better
thermodynamic matching with the energy sinks in the power cycle so that less exergy was
destroyed in the process of working fluid heating,

27
Different types of hybrid systems relying on this concept were proposed and investigated
since then, the main general types include solar-fossil fuel, biomass-fossil fuel, nuclear-
fossil fuel, geothermal-fossil fuel, nuclear-gas turbine exhaust gas, diesel fuel-exhaust gas,
geothermal-biomass and solar-gas turbine exhaust gas, solar-biomass, solar-geothermal.
By far, solar thermal power is the most widely studied renewable heat sources in hybrid
power systems due to its wide range of achievable temperature and various existing and
new technologies available in the market [9,10] including many types of solar collectors
[11,12] and thermal storage [13,14]. Some authors [15] has already studied the different
options for solar hybridization but were focusing on concentrating solar thermal power and
from a “source point of view” considering solar thermal power hybridization with coal,
natural gas, geothermal, etc., and not from a thermodynamic point of view, which
categorizes solar hybridization based on the way power is generated as this chapter does.
Solar-assisted hybrid cycles were therefore sorted here in the following three sub categories
based on the way power is generated and considering all types of solar thermal power
generation method (concentrating and non-concentrating): solar assisted vapor cycles,
solar assisted gas cycles, and solar assisted combined cycles. All the other types of thermal
hybrid power generation systems (thermal hybridization option without the use of solar
thermal power) will be sorted in the fourth group.
3.1.1. The solar assisted vapor turbine cycles
In this type of hybrid cycle (e.g. SSPRE [1]), solar heat is usually employed as the lower
temperature heat source, being added between the outlet of the working fluid pump and

28
inlet of the boiler, so that the working fluid (such as water/steam or organic fluid) can be
preheated before heated by the combustion of fossil fuel (usually coal or natural gas) or
biomass. Solar heat, however, could also be used as higher temperature heat source when
integrated with other lower temperature heat sources such as geothermal or nuclear. Table
1 shows a brief description for each system described in the published literature, in the
order of the level of the lower temperature heat source.
As can be seen from Table 3-1, the temperatures of lower and higher temperature heat
sources are different for some cycles but the same for others. We can thus further group
these cycles in two categories: “Partially” hybrid cycles and “fully” hybrid cycles.
a) “Partially” hybrid cycles
In this type of cycles, solar thermal energy is the only heat source at design conditions, and
other heat sources (such as fossil fuel or biomass) are employed only when solar energy
alone cannot meet the design conditions. Strictly speaking, this is not a “hybrid cycle” at
design conditions since only one heat source is then in effect, but since solar is an
intermittent heat source whose power fluctuates with time, the cycle cannot work solely on
solar for 24 hours at design conditions if no heat storage is in use. We may thus consider
this type of cycles as a “partially” hybrid, which become “fully hybrid” only when solar
energy cannot meet the demand (but still may provide some of the input thermal power)
and other heat sources are in use. The systems proposed in Ref. [35-38] belong to this
category. For such systems, the corresponding “Note” column in Table 3-1 says “Designed

29
solar share is 100%”. Also, for this type of hybrid cycles, the temperatures of lower and
higher temperature heat sources are the same at designed conditions, as shown in Table 1.
b) “Fully” hybrid cycles
Unlike “Partially” hybrid cycles, “fully” hybrid cycles use multiple heat sources at different
temperatures even at design conditions. SSPRE [1] and cycles which do not belong to
“Partially” hybrid cycles are all “fully” hybrid cycles.
Table 3-1 shows that so far solar heat was used as the higher temperature heat source only
when the lower temperature heat source was geothermal power. The first solar-geothermal
hybrid power plant used for power generation is claimed to be modeled and analyzed in
2006 [16]; this review confirmed that by finding no earlier papers about solar-geothermal
hybrid system for power generation. In this system, geothermal power was introduced in
addition to the original solar thermal power to increase steam flow used for power
generation. Two alternative configurations were discussed and analyzed on an annual basis
for a 10% increase in steam flow. Due to the lack of specific operating and performance
parameters, however, it was not included in the summary table. In other solar-geothermal
hybrid power generation systems found in the literatures, the temperature of geothermal
heat is 90 °C [17,54] or 150 °C [20,21].
In [17] and [54], two combined heat and power (CHP) systems were analyzed using either
evacuated tube solar collectors (ETC) or ETC as well as direct-steam parabolic trough solar
collectors (PTC) to superheat different types of organic working fluids to 157 °C after

30
geothermal preheating. The results showed that the share of solar input energy is about
70%, but the energy efficiency is only about 9-13%. [20] introduced a hybrid cycle using
geothermal heat at 150 °C as the lower temperature heat source and solar heat at 270 °C
collected by solar parabolic trough concentrating collectors the higher temperature heat
source. For the geothermal only cycle, the cycle efficiency and net power output were 13.60%
and 4,606 kW respectively. After adding a solar field, they became 9.76% and 8,988.8 kW
respectively for operation in Imperial, CA, USA. The net power output of the cycles was
almost doubled but the efficiency decreased by 3.84%, largely due to the low solar
radiation-to-heat efficiency (56.64%). Analysis in other locations (San Diego, CA, USA;
Palermo, Sicily, Italy; Pisa, Tuscany, Italy) showed similar results. At the same geothermal
temperature at 150 °C as the previous system, another hybrid geothermal-solar power plant
was also studied, used especially in hot and arid climates [21]. Unlike the previous one
using R134a as working fluid, this cycle uses Isopentane. The solar concentrating
temperature from solar parabolic trough concentrating collectors also higher at 390 °C. The
results showed that the efficiency rose to 12.36% and the power output became 1,496 kW,
which is 62.7~76.3% higher annually than the stand-alone geothermal plant depending on
the plant location. They both had a solar share of more than 60% at design conditions.
Considering the relatively large capital cost of geothermal and solar thermal power and the
relatively low power generation efficiency of only a dozen percentages, however,
geothermal-solar hybrid systems may not be promising.

31
Except for geothermal hybrid power cycle, almost all solar hybrid vapor cycles use solar
heat as the lower temperature heat source. In this type of system, fuel was often used as
higher temperature heat source, but solar heat at higher temperature could also be used. For
example, [26, 27] introduced a combined solar thermal power plant by adding an additional
solar collector. An auxiliary boiler was also considered in the hybrid solar power plant, in
order to reach the designed power generation capacity when solar irradiation was low due
to technical or environmental reasons. In the new power plant, steam was heated up to
294 °C compared with 265 °C in the original plant. Both solar collectors were parabolic
trough types and used oil as heat transfer fluid (HTF). The new plant also doubled the
power output the plant from 250 kW to 500 kW. A transient study showed a month by
month result of the new power plant. It was found that the energy efficiency ranges from
20% in January to 42% in June and solar share ranges from 16% in January to 62% in June.
The energy efficiency of this new solar thermal power plant with the original one, however,
was not compared. It was thus unknown whether the new hybrid system higher energy
efficiency than the original one.
Although, as introduced above, solar heat at higher temperature could be used as higher
temperature heat source when geothermal or solar heat at lower temperature was used as
lower temperature heat source, most solar assisted hybrid system used solar heat as lower
temperature heat source and fuel as higher temperature heat source. The earliest studied
hybrid system of this type was found to be SSPRE [1] and has been introduced before.
Many others were also studied as well. In this type of hybrid system, different types of fuel

32
could be used and could be further sorted into two groups: renewable fuel, such as biomass
and non-renewable fuel, such as coal and natural gas.
First, using renewable fuel, a solar-biomass hybrid power system was analyzed in [23]. In
the system, the oil heated by a parabolic trough solar field was used to replace the extraction
steam to preheat the feed water (entering a biomass boiler where the feedwater was heated
to 535 °C) and the previous extraction steam thus saved could continue to do work in the
lower stages of turbine. The solar heat added to a 12 MW biomass power plant was 160~
429 kW (1.3~3.6%) based on the solar temperature from 65.5~217.5 °C. The exergy of
biomass was 29,307 kJ/kg and the exergy of solar radiation falling on the solar collectors
was defined as
as cn
s
b, cos 1 ,i
TE I A
T
(3.1)
in which sE was the additional solar exergy added to the biomass plant,
b,nI was the
direct normal insolation (DNI) (W/m2), i was incident angle of collector aperture (°),
cA
was the aperture area of solar field (m2), aT was air temperature (K) and
sT was solar
temperature, which was taken to be 6,000 K. The study showed an increase in exergy
efficiency with solar temperature. A similar analysis was also done with the capacity of the
biomass plant increased to 30 MW and a different set of solar temperatures and found the
same trend. It was thus concluded that the best way to use solar heat was to replace the

33
extraction steam at the highest stage possible. Since most steam power plant used multiple
stages of heat regeneration through extraction steams to increase energy efficiency of the
thermal power plant, the results shown in this reference were widely applicable in giving
guidance on replacing extraction steam with solar heat and are therefore valuable.
Another case using biomass as higher temperature heat source was shown in [35]. The
proposed hybrid solar-biomass plant was a “partially” hybrid system and natural gas could
also be used instead of biomass. Biomass or natural gas was only burned when solar
radiation was not enough. The designed temperature of oil in solar collector was from
292 °C to 392 °C and the turbine inlet temperature was 375 °C. There was not a full
thermodynamic analysis of the plant, and thus there was no information about the
efficiency and solar share of the whole plant. Based on an annual analysis, solar produced
28.6% of the total electricity and the other part of electricity came from biomass (62.4%)
and natural gas (9.0%).
Besides integrating with parabolic trough solar collector, biomass could also be integrated
with a solar tower. In a steam cycle [38] that integrates biomass and a central receiver
system (CRS), atmospheric air was heated by the CRS to 680 °C and is then used to
superheat steam to 480 °C for power generation. This system was a “partially” hybrid
system in which biomass is burned only when solar radiation could not meet the demand
to heat the HTF (atmospheric air) to the designed temperature at 680 °C. 4 different
configurations (4 MW CRS integrated with 4 MW or 10 MW biomass plant without 3
hours thermal storage) and 3 different control strategies (CS) for 4 MW hybrid solar-

34
biomass plant with 3h storage were considered and a 24 hours analysis was done. It was
found that the 4 MW hybrid power plant with CS3 control strategy had a higher efficiency
and capacity factor than a conventional 4 MW CRS power plant. For the 10 MW power
plant, the hybrid system led to a 17% reduction in biomass consumption than a typical
biomass power plant. This result was significant as the price of biomass continues to
increase.
Compared with renewable fuel such as biomass, non-renewable fuel or fossil fuel, such as
coal, oil, and natural gas, was more widely used as higher temperature heat source in solar
hybrid power systems. This is mainly due to its advantages over renewable fuel such as
easier to get, lower price and higher energy density. More importantly, this was because
the configuration of the original power plant doesn’t need much change when lower
temperature solar heat was integrated directly into it, and most existing steam power plant
was fossil fuel powered, rather than biomass powered.
Besides SSPRE, which was introduced in Section 3.1, there were only a few hybrid system
experiments, and Fig. 3-2 shows the flow diagram of one of them [22].

35
Fig. 3-2 Flow diagram of the solar heating, cooling and power generation system [22]
To maintain the designed power generation output at 23.5 kW, natural gas in the assisted
boiler was used when solar heat was insufficient to heat the working fluid to the designed
top temperature at 180 °C. On an annual basis, this was a fully hybrid cycle, since the solar
share at design conditions was not 100% (it was 95.2% in summer and 94.0% in winter).
The experiments showed that the energy efficiency was 27.3% in summer and 63.8% in
winter and the exergy efficiency was 9.9% in summer and 16.9% in winter. The energy
and exergy efficiencies were, however, not defined in normal practice as the ratio of the
electricity output with the total energy or exergy input; instead, the generated cooling and
heating energy/exergy was included as the output besides electricity. Based on the data
given in the reference, however, we calculated the power generation efficiency to be 6.2%

36
in summer and 8.3% in winter. This was relative low, mainly due to the low top temperature
of the system (180 °C).
Unlike the system shown above, most of the hybrid system studies were theoretical,
without experiments. In a 4-E (Energy, Exergy, Environment, and Economic) analysis of
solar thermal aided coal-fired power plants [24], two types of plants were considered: 500
MW subcritical and 600 MW supercritical power plants. A direct (DSG technology) or
indirect (HTF) technology solar aided feed water heater (SAFWH) were added to each of
these reference plants to replace one or all of the feedwater heater(s). The extraction
streams used to preheat in the feedwater heater can thus be saved for power generation.
Each subtype could operate in two different modes: power boosting mode, when fuel input
rate was fixed and more power could be generated; and fuel conservation mode when
power output was fixed but less fuel would be used. The efficiency was calculated based
on fuel consumption and solar input was not considered, so it was not included in the
summary table. Economic analysis showed that LEC for subcritical power plant with
SAFWH ($0.036/kWh) is higher than that without SAFWH ($0.034/kWh) and for
supercritical power plant with SAFWH ($0.037/kWh) is higher than that without SAFWH
($0.035/kWh). This results showed that adding solar aided feed water heater increased the
cost of the original fossil power plants, for both subcritical and supercritical power plants.
Many other analyses also investigated the effect of replacing extraction steams from steam
turbines with the thermal heat from thermal oil heated by a solar parabolic trough
concentrating collector. In [25], 4 schemes for conventional power plants using solar aided

37
power generation (SAPG) technology, including a power boost mode and a fuel saving
mode (introduced in the former case) for each scheme, were investigated. The results
showed an increase in power output but decrease in energy efficiency. It is surprising,
however, that the fuel consumption rate was found to be smaller in power boost mode than
in fuel saving mode. It should have been discussed. Also, the resulting solar share
suggested that using solar energy to replace high pressure extraction steam produced more
work but also with lower energy efficiency, than to replace low pressure one. This result
showed that higher pressure extraction steam should be replaced with solar heat rather than
lower pressure one.
In [28,29], the performance of the hybrid system was analyzed by first replacing only the
last stage of extraction steam using solar flat-plate collectors at 110 °C and then replacing
all of the three extraction streams using solar evacuated tube collectors at 286 °C in a three
stage regenerative Rankine power plant. The results showed the power output increased
2.5% and 30.04%, respectively. It was also found that the thermal efficiencies of solar
energy for both hybrid systems (defined as additional power generated by solar energy
divided by solar heat input) were larger than those of the solar only Rankine cycle using
the same operating parameters (such as solar temperature, condensing temperature).
In [31], three preheating options for solar to be integrated in a traditional fossil fuel power
plant were studied: solar heat replacing low pressure feed water heaters, replacing high
pressure feed water heaters, and replacing high pressure feed water heaters together with
part of the economizer of the boiler. Solar heat was designed to heat the working fluid to

38
159 °C, 249 °C and 319 °C respectively. The net electric efficiency in each arrangement
was found to be 33.05%, 35.39% and 35.69%, respectively, compared with the efficiency
of base case (without solar heat input) of 35.67%. The net power output of the system also
changed with different types of configurations. It was suggested that the best option for
future plants was the third one and for existing plants was the second one considering all
the effects such as efficiency, solar share and modification of existing plants.
In [33], a 330 MW solar-aided coal-fired power generation system (SACPG) with various
solar field areas and thermal energy storage capacity was studied on an annual basis under
different loads, and optimized. There were 3 high-pressure feedwater heaters and 4 low-
pressure feedwater heaters in addition to a deaerator in the system. Solar heat at 283 °C
was used to replace each of the HP extraction steam from relatively lower temperature to
higher one, and to replace all of the HP extraction steams when solar heat was sufficient.
The superheated steam was heated by coal and the steam turbine inlet was set to 537 °C. It
was found that that the overall energy efficiency of SACPG system was 42.41%, 41.59%
and 38.84%, for 100%, 75%, and 50% loads, respectively. The results also showed that (1)
the highest solar-to-electricity efficiency was achieved when all of the HP extraction
steams were replaced by solar heat; (2) the installation of thermal energy storage (TES)
increased the annual solar-to-electricity efficiency compared with the system without TES;
(3) the levelized electricity cost (LEC) of the system with TES decreased first then
increased with solar field sizes increasing, and the minimum LEC was $62.9/MWh for 100%
load, $65.4/MWh for 75% load and $73.0/MWh for 50% load. It was thus concluded that

39
TES was an important sub-system for SACPG to overcome the intermittency of solar
energy as well as to use solar energy in a more efficient way by achieving higher solar-to-
electricity efficiency. The cost of TES, however, was an obstacle and developing low-cost
TES was an important direction to make SACPG more promising in economic viewpoint.
In [32], a modern thermal power station with integration of a solar concentrator field to
reduce fuel consumption was studied in two cases: feed water preheated by solar field from
the condenser outlet to 241 °C and to 328 °C. It was found that the fuel consumption in the
boiler was reduced by 10.7% and 25.6%, respectively.
In [34], a 300 MW lignite fired power plant combined with line-focus parabolic trough
collectors filed was proposed and analyzed. Thermal oil at 390 °C produced by solar
parabolic trough concentrating collector was used to provide heat to high pressure feed
water heater. The blend off steam was thus saved to produce work in the turbine.
Simulation was done for various solar field areas between 90,000 m2 to 120,000 m2. Plant
efficiency was found to be 34.87-36.74% for different solar field areas, which were all
higher than the reference plant with no solar heat (33.3%). The solar share was small at
between 2.15-7.91%.
Unlike the above systems which focused on regenerative steam with extraction steams,
some analysis dealed with simple Rankine cycle integrated with solar heat. For example,
In [36], five types of solar hybrid power plants with thermal energy storage were introduced,
three of which belong to solar assisted vapor cycle and the others belong to solar assisted

40
combined cycle, which was discussed in Section 3.1.3. The configurations of the three solar
assisted vapor cycles were roughly the same, and the main difference between them was
heat transfer fluid (HTF) and the types of solar collectors suitable to the HTF. For molten
salt and pressurized CO2, solar tower was used since higher temperature was needed
(565 °C and 600 °C, respectively), and thermal oil was used in solar parabolic trough
concentrating collector, since the temperature was not very high (393 °C). It was found that
the efficiencies were 37.2%, 42.5% and 43.0%, respectively, when no thermal storage was
used.
Besides that, a novel hybrid receiver-combustor system (HRC) using a combined solar
receiver-combustor module compared with a traditional one (SGH) was introduced in [39].
The module was designed to heat the working fluid to 540 °C/180 bar. Two types of hybrid
systems (novel and traditional) with 4 subtypes were analyzed: SGH with 13 hours storage
(SGH13), SGH with 1 hour storage (SGH1), HRC with 0.5 hour storage (HRC0.5) and
HRC with 13 hours storage (HRC13) to compare with the two base systems: solar power
tower system (SPT) and gas-fired boiler plant (GB). The efficiency of SPT was inferred as
17.8% and of GB is 35.5% but the efficiencies for the hybrid systems were not calculated.
Sometimes, solar energy could be used without a heat exchanger to transfer solar heat to
the working fluid. In [30], direct steam generation (DSG) collector was used in the study
of performance of a hybrid power generation system (solar-gas) at three different sites
assumed to in Australia (Alice Springs, Darwin and Dubbo). DSG collector is a type of
parabolic trough collector, which consists of a water and steam mixture (two phase flow)

41
in a very long horizontal or segmented inclined pipe heated by solar radiation directly
without the use of additional heat. Three arrangements of hybrid power plant were studied:
Boiling process (solar heat is 310 °C and collector was paralleled with gas-fired boiler),
Preheating process (solar heat is 209 °C and collector was paralleled with feed water
heaters), and Preheating-boiling process (solar heat was 310 °C and collector was
paralleled with the boiler and feed water heaters). The top temperatures (boiler outlet steam
temperatures) of the three arrangements were all 510 °C. It was found that with a horizontal,
N-S tracking axis of DSG collector and boiling process arrangement, the solar energy
contribution for plants located in Alice Springs or Darwin was 37% and for Dubbo was 33%
due to low incident radiation during the winter in Dubbo.
Besides the above one, a “partially” solar hybrid system using DSG solar collector was
introduced in [37]. With the help of solar radiation and an auxiliary heater, steam was
heated up to 410 °C to generate power. Fuel back up in each of the 12 months in a year in
4 different locations was discussed and it was found that the highest backup fraction was
82% and lowest was 43%.The authors, however, did not show the energy efficiency of the
system.
All of the systems introduced above were based on Rankine cycle, which is widely used in
power generation industry. Kalina cycles, however, could also be used. Kalina cycles are
thermodynamic cycles using a solution of 2 fluids with different boiling points for its
working fluid and have been used by some researchers in hybrid power generation systems.
Since the most widely used working fluid is the mixture of steam and ammonia and there

42
hasn’t been much research for hybrid Kalina cycle, it was included in the category of solar
assisted steam cycle. For example, a new thermodynamic cycle for combined power and
cooling was proposed and analyzed using low and mid temperature solar collectors to
preheat the ammonia and water mixture to 127 °C before the mixture was heated to 137 °C
by a superheater [19]. The cycle used low cost flat-plate collectors or medium temperature
concentrators (or other lower temperature heat source, such as geothermal resources or
waste heat from existing power plants) to preheat the mixture, which has a low boiling
point. The electricity generation efficiency was found to be 17.39% under the designed
conditions with a solar share of as much as 92.6%. This analysis, however, did not consider
the efficiency of the solar collection and superheater, so the efficiency was just cycle
efficiency, not system efficiency.
Table 3-1. A summary of past studies of solar-assisted vapor power cycles
Descriptive name
of system and
reference
Lower temperature
heat source
Higher
temperature
heat source S/E*
Power,
kW
Claimed
power
generation
efficiency**
Efficiency
improvement
over single
temperature
system
Solar
fraction of
the total
energy
input***
Note****
T,°C type T,°C type
Micro CHP system
fueled by low-
temperature
geothermal and
solar energy
[17,18]
90 Geothermal
157
Solar
evacuated
tube S
38.86 9.1%
-
74%
Single pressure;
R134a
36.38 9.78% 73.5%
Single pressure;
R236fa
39.96 13% 76.4%
Single pressure;
R245fa
- 33.58 6.9% 75.3%
Dual pressure;
R134a

43
Solar
parabolic
trough
32.46 7.4% 75.1%
Dual pressure;
R236fa
36.04 10.0% 78.7%
Dual pressure;
R134a
Solar-powered
/fuel-assisted
Rankine cycle [1]
100
Solar flat-
plate collector
600 Gas S&E 22.37 18.3% 9.5% (solar) 20% First model
New
Thermodynamic
Cycle for
Combined Power
and Cooling
Using Low and
Mid Temperature
Solar Collectors
[19]
127
Solar flat plate
or medium
temperature
concentrator
137
Fossil
fuel
S
73.3
(kJ/kg)
17.39%
(elec.)
23.54%
(nominal)
-
92.6%
Working
fluid is ammonia-
water mixture
A solar-geothermal
hybrid plant based
on
an Organic Rankine
Cycle [20]
150 Geothermal 270
Solar
parabolic
trough
S
8,989 9.76% -3.84% 63% Working fluid in
ORC is R134a;
HTF is synthetic
oil; LEC is $0.19-
0.36/kWh (2011)
9,188 10.36% -3.24% 62%
7,788 10.04% -3.56% 56%
7,660 9.68% -3.92% 57%
Hybrid solar-
geothermal power
plant in hot and
arid climates [21]
150 Geothermal 390
Solar
parabolic
trough
S 1496 12.36% - 67.5%
Organic
working fluid
(Isopentane)
LEC is $0.17/kWh
(2013), 23% less
than stand-alone
enhanced
geothermal system
Novel hybrid solar
heating, cooling
<180 180
Natural
gas
E
23.5
6.2%
-
95.2%
Summer

44
and power
generation system
[22]
Solar
parabolic
trough
8.3% 94.0% Winter
Solar aided biomass
power generation
systems with
parabolic trough
field [23]
65.5
Solar
parabolic
trough
535 Biomass S
12,160 35.22% -1.48%
~4%
Eff. is exergy
efficiency; LEC is
$0.08/kWh (2011)
108 12,266 35.52% -1.18%
148 12,356 35.78% -0.92%
186.5 12,396 35.90% -0.80%
217.5 12,429 35.99% -0.71%
Solar thermal aided
coal-fired power
plants [24]
253.5
Solar
parabolic
trough
1786.7
Coal S
575,800
- - -
Power boosting
mode
500,000
Fuel conservation
mode
253.2 1775.8
806,000
Power boosting
mode
600,000
Fuel conservation
mode
Conventional
power plant using
solar aided power
generation (SAPG)
technology (power
boost mode) [25]
260
Solar
parabolic
trough
530 Coal S
219,720 44.19% -0.41% 8.04% Scheme 1
215 205.020 44.52% -0.08% 3.17% Scheme 2
160 207,880 44.58% -0.01% 4.33% Scheme 3
90 202,400 44.58% -0.02% 1.11% Scheme 4
Shiraz solar thermal
power plant (STPP)
integrated with a
new collector and
an auxiliary boiler
[26,27]
265
Solar
parabolic
trough
294
Solar
parabolic
trough
E&S 500
42% (June)-
20% (Jan.)
-
62% (June)-
16% (Jan.)
Both HTFs are oil
Solar aided three-
stage regenerative
110
Solar flat-
plate collector
538
Brown
coal
S
1111.96
(kJ/kg)
46.98% -2.53% 7.4%
No low-pressure
extraction steam
from turbine

45
Rankine system
[28,29] 286
Solar
evacuated-
tube collector
1410.86
(kJ/kg)
43.52% -5.99% 32.4%
No extraction
steam from turbine
Solar thermal
electric
generation systems
using parabolic
trough [30]
310
Solar
parabolic
trough
510
Natural
gas
S 22,800 - -
37% Alice Springs
37% Darwin
33% Dubbo
Solar thermal
repowering of fossil
fuel fired power
plants [31]
159
Linear Fresnel
collector
540
Heavy
fuel oil
S
104,352 33.05% -2.62% 12.5%
Different amount of
CO2 avoided
annually
249 116,418 35.39% -0.28% 10.3%
319 116,912 35.69% 0.02% 20.7%
Thermal power
station integrated
with solar energy
[32]
241 Solar
parabolic
trough
577 Coal S 210,000
45.2% -5.8% 20.8%
Fossil fuel
reduction is 10.7%
328 42.5% -8.5% 37.9%
Fossil fuel
reduction is 25.6%
Solar-aided coal-
fired
power generation
system (SACPG)
[33]
283
Solar
parabolic
trough
537 Coal S
330,203 42.41%
- -
100% load; LEC
$62.9/MWh (2015)
247,649 41.59%
75% load; LEC
$65.4/MWh (2015)
165,124 39.84%
50% load; LEC
$73.0/MWh (2015)
Solar aided power
generation of a
lignite fired power
plant
combined with line-
focus parabolic
trough collectors
field [34]
390
Solar
parabolic
trough
540 Lignite S
285,000 34.87% 1.57% 2.15%
Solar field area is
30,000 m2
290,000 35.21% 1.91% 4.00%
Solar field area is
60,000 m2
296,000 35.96% 2.66% 6.13%
Solar field area is
90,000 m2
302,000 36.74% 3.44% 7.91%
Solar field area is
120,000 m2; LEC is
$0.100/kWh

46
Hybrid solar-
biomass plants for
power generation
[35]
392
Solar
parabolic
trough
392
Biomass
and
natural
gas
S 10,000
30.6%
(Rankine
cycle)
- -
Designed solar
share is 100%;
LEC is $0.2/kWh
(2011)
Parabolic Trough
with thermal
storage [36]
393
Solar
parabolic
trough
393
Fossil
Fuel
S 30,000 37.2% - 100%
Designed solar
share is 100%
Hybrid -solar-
fossil- parabolic
trough power plant
[37]
410
Solar
parabolic
trough
410
Fossil
fuel
S 100,000 - - 18%~57% Designed solar
share is 100%
Salt-Tower with
thermal storage
[36]
565 Solar tower 565
Fossil
Fuel
S 30,000 42.5% - 100%
Designed solar
share is 100%
CO2-Tower with
thermal storage
[36]
600 Solar tower 600
Fossil
Fuel
S 30,000 43% - 100%
Designed solar
share is 100%
Volumetric
air CRS and
integration of a
biomass waste
direct burning
boiler
on steam cycle [38]
680 Solar tower 680 Biomass S
4,000
18% (no
storage)
8% (solar)
-8% (bio)
31%
Designed solar
share is 100%; All
columns show
annual values; LEC
is $0.100-0.149
/kWh (2012)
17% (CS1)
6% (solar)
-1% (bio)
39%
15% (CS2)
4% (solar)
-3% (bio)
24%
16% (CS3)
5% (solar)
-2% (bio)
34%
10,000
24% (no
storage)
14 (solar)
-4% (bio)
14%
23% (3h
storage)
12% (solar)
-1% (bio)
20%
A novel fuel-saver
hybrid combining a
- Solar tower -
Natural
gas
S 100,000 - -
82%
(SGH13)
LEC is
$0.077/kWh

47
solar receiver with
a combustor for a
solar power tower
[39]
34%
(SGH1)
LEC is
$0.0648/kWh
34.1%
(HRC0.5)
LEC is
$0.059/kWh
87.5%
(HRC13)
LEC is
$0.0728/kWh
* E: Experiment, S: Simulation.
** Efficiency is defined as net power output divided by total energy input (Eq. (2.2)), unless indicated otherwise.
*** Solar fraction is defined as solar energy input divided by total energy input (Eq. (2.17)).
**** LEC (levelized electricity cost) was converted to dollar value, based on the currency of the first day in the year published.
3.1.2. The solar assisted gas turbine cycles
In this type of hybrid cycle, solar heat is added between the outlet of the compressor and
inlet to the combustor so that working fluid (air) can be preheated before being heated by
the combustion of fossil fuel (usually natural gas) in the combustor. A summary of this
type of hybrid cycles is in Table 3-2, in the order of temperature of the lower temperature
heat source.
A typical flow diagram of a simulation is shown in Fig. 3-3. In the optimal design for
hybrid solar gas turbine power plant (HSGTPP) [53], a solar air receiver was used to heat
the compressed air from the compressor to 934 °C before being heated by natural gas in
the combustor at 1,220 °C. The efficiency was found to be 35.3% and the solar share 65.1%
at the design point (annual solar share 42.3%).

48
Fig. 3-3 Flow diagram of a hybrid solar gas-turbine power plant [53]
Other analyses was also done for configurations similar to Fig. 3-3. For a generic solar-
fossil hybrid Brayton cycle [46], three types of solar collectors (parabolic trough, solar
tower and Fresnel linear) were considered, each coupled with several kinds of heat transfer
fluid (thermal oil, water/steam (DSG), molten salts, air (atmospheric), air (compressed),
water/saturated steam, water/superheated steam, CO2 and particles). Each combination had
specific practical solar temperature ranges from 250 °C to 1,000 °C. The efficiencies for
each configuration were calculated for turbine inlet temperatures of 827 °C to 1,427 °C, in
steps of 100 °C. A simple analysis of a combined cycle with solar assistance in the top
cycle concluded that such solar hybrid combined cycles had lower LEC than the solar
hybrid Brayton cycle.
In another case, a hybrid solar gas turbine power plant (HSGTPP) was optimized to
minimize the levelized electricity cost (LEC, $/MWh) [53]. After a series of case studies,

49
a solar tower was optimized to heat the compressed air to 934 °C and the combustor outlet
temperature was optimized to 1,220 °C. The resulting efficiency was 35.3% with solar
share being 65.1% at optimal point (annual solar share 24.9%). The “optimal” HSGTPP
was then compared to two existing solar-assisted gas turbine systems and it was confirmed
that it had the lowest LEC.
Hourly modeling was used to study the effects of the ambient temperature on the
performance of a solar hybrid gas turbine systems [56]. The results showed that at the
highest ambient temperature (about 29 °C in summer), the gas turbine outputs with and
without solarization were 28.5 MW and 33.1 MW respectively, leading to a loss of 4.6
MW. It could be seen that using solar hybridization reduced power output. Also, the
corresponding efficiency reduced from 37.8% to 36.6%. As assumed in the reference, with
the highest temperature in winter is 15 °C in winter, the power outputs with and without
solarization were 34.3 MW and 37.6 MW and corresponding efficiencies were 38.3% and
39.0%, respectively. The paper thus suggested that with solar energy input, the
combination of pressure drops and airflow regulation would result in a lower electric power
and efficiency, which agrees with the performance data provided by SOLGATE [47],
although some fuel was saved during solar hybridization.
Apart from the configuration showed in Fig. 3-3, solar-assisted gas turbine cycles can have
other configurations. In [52], three configurations for small-scale hybrid solar power plants
were proposed: open-cycle design which is the same as Fig. 3-3, internally-fired
recuperated design which added a heat exchange to use the exhaust gas to heat the

50
compressed air before heated by solar receiver, and externally-fired design which used
solar heat and combustion heat to reheat the exhaust gas. Each design had a corresponding
solar heat input (at 800 °C, 800 °C and 700 °C), turbine inlet temperatures (900 °C, 900 °C
and 780 °C) and different compressor pressure ratios. A tradeoff between solar share and
conversion efficiency for each design was found. The peak efficiency of each design at
different pressure ratios was found to be 19.4%, 30.4% and 22.5%, respectively, with the
respective annual solar share was 32.2%, 27% and 37.4%.
[54] introduced a novel air-based bottoming-cycle for water-free hybrid solar gas-turbine
power plants (AB-HSGT). The top cycle part is the same as Fig. 3-3, but an air-based
bottoming-cycle is added. The bottoming part consisted of an intercooled compressors and
a turbine and utilizes the exhaust heat from the top cycle as the heat source. The solar
temperature from the solar tower was 950 °C and the top temperature of the cycle was
1,400 °C. The exhaust gas temperature of the top gas turbine was 553 °C. The power output
of the optimal design was 57.9 MW having an overall exergy efficiency of 29.9% (annual
exergy efficiency was 38.5%) with solar share of 39.2% (annual solar share was 20.0%).
It wasn’t shown how the exergy was calculated. It was stated that the land use of the system,
measured as the surface of land required per unit of electricity produced over the lifetime
of the plant, was considerably lower than other renewable energy technologies, e.g. 1/7-
1/5 of that of solar thermal power [40], because of the low solar share.
To attain a deeper understanding of solar-assisted power generation systems, the European
Union (EU) funded a project to assess the performance of three prototype plants and

51
advanced software was used to optimize and predict their performance [49]. Two of them
were about the solarized gas turbine cycle: Solar Mercury 50 (recuperated single shaft gas
turbine) which used two pressurized air receivers to preheat the pressurized air to 630 °C
and 800 °C, having a capacity of 4.2 MW, and Solar Heron H1 (intercooled recuperated
two-shaft engine with reheat) which preheated the pressurized air and reheated the
combustion gas to 800 °C, having a capacity of 1.4 MW. The third prototype plant was
PGT10 which was a solarized combined cycle, which will be discussed in the next category.
Each type of prototypes plants was assumed to be located in two places: Seville, Spain
(annual DNI was 2,015 kWh/m2) and Daggett, CA. USA (annual DNI was 2,790 kWh/m2).
The calculated annual efficiency for Mercury 50 was 35.9% with solar share at design point
38% for both locations, and for Heron was 40.4% in Seville and 38.4% in Daggett with
solar share at design point 75% for both locations.
The European Commission (EC) also funded a project called ECOSTARS, which involved
solar hybridization with gas turbine. In [51], a conceptual solar hybrid gas turbine power
plant assumed to be in France (PEGASE) was introduced and analyzed. A solar Central
Receiver System (CRS) was used to heat the compressed air to 850 °C, after which the fuel
was burned with the air in the combustor to 1,000 °C. The outlet electric power was 1,414
kW and the electrical efficiency was 35.1% for the original gas turbine. Solar thermal
power of 2,463 kW was added to the turbine for a total of 4.9 MW incident solar thermal
power on the field and provided 62% of the needed thermal power to the turbine. The

52
electricity efficiency for PEGASE was calculated to be 22.1%, which is 13% less than the
original gas turbine.
Just as for some solar-assisted vapor cycle systems, solar-assisted gas turbine system can
also be used to provide heating/cooling besides power generation. [48] introduced a solar-
assisted small solar tower trigeneration system (solarized TURBEC T100) using a solar-
hybrid microturbine to provide electricity and cooling and/or heating, which was suggested
to be used for tourism installation (e.g. large hotel complexes). In this system, a small solar
tower was used to preheat the pressurized air to 780 °C before the air and fuel were burned
at 950 °C in the combustor. The system was stated to have an electric efficiency of 28%,
which is 2% lower than the original microturbine without solar integration. Also, with the
absorption chiller for cogeneration, the total efficiency increased by over 20%. Solar share
at design point was calculated as 84% and the annual solar share was 29% with the most
economical absorption chiller in the configuration.
Instead of using a solar air receiver or solar tower which utilizes solar heat at higher
temperature (usually over 600 °C) as in the previous system, solar parabolic trough
concentrating collector which utilizes mid-temperature (200 ~ 600 °C) can also be
integrated in hybrid solar gas turbine. For example, a solar hybrid steam injection gas
turbine (STIG) cycle was proposed in [44]. The system used solar heat at 240.4 °C to
preheat the water injected to the combustor. The fuel was then mixed with the preheated
steam and burned to get a turbine inlet temperature (TIT) at 1,200 °C. The solar STIG was

53
found to have an efficiency of 41.4% compared with 49.8% with a conventional STIG, but
has 2,086 kW of net power output compared with just 513.9 kW for a conventional one.
The big advantage of solar STIG compared with conventional one was thus the ability to
preheat more injected water and produce more work.
Some solar hybrid gas cycles were reported to have the ability of carbon capture. [41-43]
introduced a CO2-capturing hybrid power-generation system, which used solar heat
collected by parabolic trough to superheat the steam to be injected to the combustor with
fuel and air to 223 °C. Turbine inlet temperature was set to 1,150 °C. Based on actual
conditions in Osaka, Japan, the predicted maximum net generated power was 1.55 MW
with total net exergy efficiency 20.9% (it was not show how it was calculated) and net
energy efficiency on fuel energy base (net power divided by fuel input) 63.7%. The CO2
generated during combustion was recovered by cooling the exhaust gas, and the CO2
capture capability was said to be near 100%. There was, however, no information on the
cost of the additional equipment for CO2 capture, nor the consequent effect on system
performance.
Another system with the ability to capture carbon emission was introduced in [45]. The
novel hybrid oxy-fuel power cycle utilized solar thermal energy at 252.8 °C to produce
saturated steam. The fuel (methane) and oxygen were mixed with the saturated steam and
burned to generate combustion gas at 1,300 °C to produce power in two power turbines in
series. The energy efficiency was found to be 38.51% with solar share of 59.85% at design
point. An exergy analysis was performed, for which the exergy efficiency was defined as

54
netex
0fuel sol,th
s
,
120
W
TQ Q
T
(3.2)
where netW was the cycle net output work,
fuelQ and sol,thQ were fuel energy and solar
thermal energy to the cycle, respectively, 0T was the atmosphere temperature, 15 °C and
sT was the temperature of saturated steam, 252.8 °C. The temperature of the solar heat
source was defined as 20 °C higher than sT , so s 20T was the temperature of the solar
heat. The exergy for AHPS was found to be 55.88% and the biggest exergy losses happened
in the combustor (15.27%) and in the solar heat addition (9.52%). Using the zero emission
Graz cycle, the carbon emission of the system was near zero. There was, however, also no
information on the cost of the additional equipment for CO2 capture, nor the consequent
effect on system performance.
Most of the analyses were by simulation as the ones shown above. Still, there are some
experiments done in this field and were shown below.
To prove the technical feasibility and verify the electricity cost reduction potential of solar-
hybrid power system, the European Union conducted the SOLGATE (solar hybrid gas
turbine electric power system) project [47]. One of a prototype plants was called Mercury
50. Two stages of solar preheating were used at 600 °C and 760 °C before the combustion
of fuel at 1,090.49 °C. The efficiency was found to be 37.2% and the solar share 39.04%,
at the design point.

55
Also as part of the SOLGATE project, an experiment was done on a solar-assisted gas
turbine [50]. Compressed air in solar receivers was heated up to 810 °C and the solarized
gas turbine produced a net electricity of 227 kW with a net efficiency of 18.2%, with no
combustor casing or combustor inlet insulation, and a solar share of 60%. Also, a prototype
solar powered gas turbine system installed in Spain was tested [55]. A pressurized solar
receiver cluster of three modules was used to convert solar thermal power to heat, and a
modified helicopter engine was used as the gas turbine. In test phase 1 when the solar
receiver air outlet temperature was 800 °C, the electrical output was > 230 kW with
efficiency of about 20%. The solar share was close to 60%. In test phase 2, solar
temperature at 960 °C was achieved without turbine damage (unknown if blade cooling
was used) and the solar share increased to 70%. Due to reduced turbine speed (95% of the
nominal speed) and high ambient temperature, however, the electrical power production
was just 165 kW, which was considerably lower than possible and the efficiency was only
about 15%.
Table 3-2. A summary of past studies of solar-assisted gas power cycles
Descriptive name of
system and reference
Lower temperature
heat source
Higher
temperature
heat source E/S*
Power,
kW
Claimed
power
generation
efficiency**
Efficiency
improvement
over single
temperature
system
Solar
fraction of
the total
energy
input***
Note****
T,°C type T,°C type

56
A CO2-capturing
hybrid power-
generation system
[41, 42,43]
223
trough-type
solar
collector
1,150
Natural
gas
S 1,550
20.9%
(exergy
efficiency)
- -
Nearly 100%
carbon capture
ability
Solar hybrid Steam
Injected Gas Turbine
cycle (STIG) [44]
240.4
Solar
parabolic
trough
1,200
Natural
gas
S 2,086.0 41.4% -8.4% 43.4%
SAR=1.2 kg
steam/kg air
A novel hybrid oxy-
fuel power cycle
utilizing solar thermal
energy (AHPS) [45]
252.8 Solar 1,300
Natural
gas
S
1,543.14
(kJ/kg)
38.51% - 59.85%
Exergy
efficiency is
55.88%
Hybridized Brayton
cycles with current
solar technologies
[46]
550
Solar
parabolic
trough
1,227
Natural
gas
S -
31.60%
-
18%
HTF is molten
salts
565 Solar tower 31.35% 22%
HTF is molten
salts
500
Fresnel
linear
31.39% 13%
HTF is
superheated
steam
Solar Hybrid Gas
Turbine Electric
Power System
(Mercury 50) [47]
600 (1st)
760
(2nd)
Pressurized
air receiver
1,090.46
Natural
gas
E&S 3,943 37.2% -3.1% 39.04%
Save 0.07 kg
CO2/kWh
(annual solar
share 10%)
Solar-Assisted Small
Solar Tower
Trigeneration System
(solarized TURBEC
T100) [48]
780 Solar tower 950
Natural
gas
S 100 28% -2% 84%
Cooling or
heating at the
same time

57
Solarized gas turbine
prototype plant:
Mercury50 unit [49]
630 (1st)
800
(2nd)
Pressurized
air receiver
1,150
Natural
gas
S 4,200
35.9%
(Annually)
-4.4% 38%
LEC is $0.12/
kWh (2006)
Solarized gas turbine
prototype plant:
Heron H1 unit [49]
800
(preheat
and
reheat)
Pressurized
air receiver
860
(preheat)
865
(Reheat)
Natural
gas
S 1,400
40.4%
(Seville)
-2.5%
75%
LEC is $0.227/
kWh (2006)
38.4%
(Daggett)
-4.5%
LEC is $0.236/
kWh (2006)
Gas Turbine
‘‘Solarization’’-
Modifications for
Solar/Fuel Hybrid
Operation [50]
810
Pressurized
air receiver
1,080
Natural
gas
E 227 18.2% - 60%
Hybrid Solar Gas
Turbine Project using
Central Receiver
System (PEGASE)
[51]
850
Central
Receiver
System
1,000
Natural
gas
S 1,414 22.1% -13.0% 62%
Small-scale hybrid
solar power plants
using micro gas-
turbine [52]
800
Solar tower
900
Natural
gas
S 100
19.4%
-
32.2%
(annually)
open-cycle
design
800 900 30.4%
27%
(annually)
internally-fired
recuperated
design
700 780 22.5%
37.4%
(annually)
externally-fired
design
Hybrid solar gas-
turbine power plant
(HSGTPP) [53]
934 Solar tower 1,220
Natural
gas
S 15,000 35.3% - 65.1%
LEC is $0.104
/kWhe (2012);
Specific CO2
emission is 0.4
kg/kWh

58
Air-Based
Bottoming-Cycles for
Water-Free Hybrid
Solar Gas-Turbine
Power Plants (AB-
HSGT) [54]
950 Solar tower 1,400
Natural
gas
S 57,900
29.9%
(exergy
efficiency)
- 39.2%
LEC is
$0.109/kWh
(2013); Specific
CO2 emission is
0.350 kg/kWh
Solar powered gas
turbine system [55]
800 Solar air
receiver
- Fuel E
230 20%
-
60%
960 165 15% 70%
A solar hybrid gas
turbine [56]
1,015
Solar tower
1,230
Natural
gas
S
28,500
36.6%
-1.2%
70%
Summer
(ambient
temperature at
29°C
800 1,236 34,300 38.3% -0.7% 40%
Winter
(ambient
temperature at
15°C)
* E: Experiment, S: Simulation.
** Efficiency is defined as net power output divided by total energy input (Eq. (2.2)), unless indicated otherwise.
*** Solar fraction is defined as solar energy input divided by total energy input (Eq. (2.17)).
**** LEC (levelized electricity cost) was converted to dollar value, based on the currency of the first day in the year published.
3.1.3. The solar assisted combined cycle
In this type of hybrid cycle, solar heat is either added in the steam cycle (bottoming part)
or the gas cycle (topping part), or in both parts, but I found no publication of the latter,
possibly because of complexity of design or control of the system. If solar heat is added to
the steam cycle without changing the top cycle, the steam turbine power output (thus total
and net) will increase; if it is added to the gas cycle without changing the bottom cycle,

59
less fuel will be needed (thus resulting in lower emissions). The first approach is also called
the “power-booster” mode, and the second the “fuel-saver” mode. The sketch for solar
assisted combined cycles is shown in Fig. 3-4 [74]. Option (I) is a “power-booster” mode
and uses gas turbine exhaust gas as the higher temperature heat source (in the bottom part,
not the combined cycle); while option (II) is the “fuel-saver” mode and uses natural gas as
the higher temperature heat source. A summary of the features of this type of hybrid cycles
is shown in Table 3, in the order of temperature of lower temperature heat source. Note
that option (I) contains two higher temperature heat sources. The higher temperature heat
source for the hybrid combined cycle is natural gas, but gas turbine exhaust gas can also
be regarded as heat source if we only consider the bottom part and that is why it is also
included in the table.
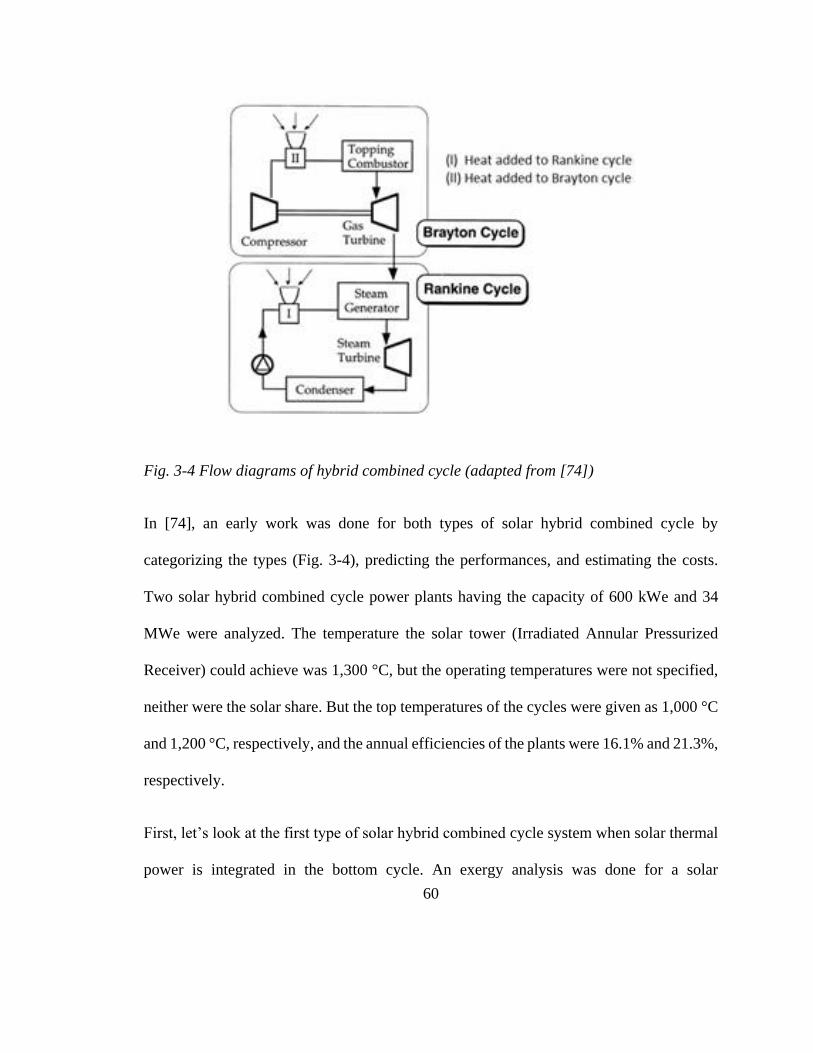
60
Fig. 3-4 Flow diagrams of hybrid combined cycle (adapted from [74])
In [74], an early work was done for both types of solar hybrid combined cycle by
categorizing the types (Fig. 3-4), predicting the performances, and estimating the costs.
Two solar hybrid combined cycle power plants having the capacity of 600 kWe and 34
MWe were analyzed. The temperature the solar tower (Irradiated Annular Pressurized
Receiver) could achieve was 1,300 °C, but the operating temperatures were not specified,
neither were the solar share. But the top temperatures of the cycles were given as 1,000 °C
and 1,200 °C, respectively, and the annual efficiencies of the plants were 16.1% and 21.3%,
respectively.
First, let’s look at the first type of solar hybrid combined cycle system when solar thermal
power is integrated in the bottom cycle. An exergy analysis was done for a solar

61
concentrator-aided natural gas fired combined cycle power plant [58]. The concentrator
was a linear Fresnel reflecting (LFRSC) type. The solar exergy was calculated assuming
solar temperature at 5,800 K. The insolation on the concentrator heated a heat transfer fluid
(Therminol VP-1) from 260 °C to 311 °C, and was then used to preheat the feed water. The
results showed that the power output increased from 293.59 MW to 325.29 MW due to the
additional heat input from solar, but the energy efficiency was decreased from 54.47% to
41.69% due to the low solar collector efficiency. The exergy efficiency also decreased from
53.93% to 49.69%, thus by a smaller amount. Another finding is that exergy efficiency was
higher than energy efficiency for the hybrid system, unlike the conventional system.
Apart from the previous one, another full cycle exergy analysis on an ISCCS was done in
[64], but using a solar parabolic trough concentrating collector rather than Fresnel collector.
The oil at the outlet of the collector had a maximal temperature of 393 °C, to heat the water
to saturated vapor at 310.6 °C. The solar and fuel energy input were 114.96 MW and 736.04
MW, respectively, and the net power output was 392.93 MW, so the energy efficiency was
46.2% with solar energy share of 13.5%. With solar input exergy calculated using solar
temperature, the exergy efficiency of solar collector was only 27%, which was the least
efficient component in the plant. It was also argued that the energy and exergy efficiencies
of ISCCS were higher than that of simple combined cycle without solar contribution and
also Rankine cycle power plants using parabolic trough solar collectors, but no efficiency
of those plants had been given or calculated in the paper.

62
For the same ISCCS as the previous described, other researchers [65] did a technical and
economical assessment but with three integration schemes considered: 1) Integrated Solar
Combined Cycle System with solar field that could produce heat at 33 MW (ISCC-33); 2)
ISCCS with solar field that could produce heat at 67 MW (ISCC-67) and 3) ISCCS with
solar field that could produce heat at 33 MW and Auxiliary Firing system (ISCC67-AF).
Also, they were compared with three reference systems: Gas Turbine power plant (GT),
Combined Cycle power plant (CC) and Solar Electric Generating System (SEGS). It was
found that ISCC-67 was the best of all, with the highest generation capacity at 444 MW,
highest annual net efficiency at 51.6% and lowest LEC of 2.035 ¢/kWh (2005).
For a proposed advanced Zero Emissions Power (AZEP) cycle, four different integration
schemes using a parabolic trough were analyzed [59]: vaporization of high-pressure stream,
heating of intermediate-pressure turbine inlet stream, heating of low-pressure turbine inlet
stream, and preheating of high-pressure stream, and compared with a non-solar AZEP
cycle. The solar heat source temperature varied with time and the highest one (369 °C) was
included in the summary table, as was the net power output for each configuration. In all
cases, the maximum solar share in a year was set to 30%. The authors focused on the power
output of each configuration but didn’t calculate the energy efficiency of any configuration,
which should be done in comparing these configurations. It was found that the
configuration with vaporization of high-pressure stream had the highest power output. The
conclusion was similar as for solar hybrid vapor cycle.

63
A comprehensive study was done on investigating the performance of general Integrated
Solar Combined Cycle System (ISCCS) with and without thermal energy storage (TES) in
different operation modes [60]. For comparison, two locations (Barstow, California with
high solar radiation and Tabernas, Spain with somewhat lower solar radiation) were
considered, in comparison with solar-integrated not-combined Rankine cycle systems with
the same nominal electricity output. It was found that the energy efficiency of ISCCS at
design point with 100% storage (annual solar share was 9.4% in California and 6.4% in
Spain) was 37.44%, and with no storage (annual solar share was 5.6% in California and
3.4% in Spain) was 36.72%, compared with a reference combined cycle plant having an
efficiency of 36.19%. We could see that the energy efficiency for hybrid power plant was
about 1% higher than fossil fuel only power plant and using thermal energy storage could
further increase the efficiency by having higher solar share. Also, the economic analysis
showed that the hybrid plant will have lower solar LEC than solar-only plants at the same
sites and the same operation scheme.
Four years earlier, an analysis on ISCCS like the one described before was done but with
different operation points [61]. The maximal temperature of heat transfer fluid (the type
was not specified) in parabolic trough is 390 °C and the exhaust gas from gas turbine at
540 °C. The relation between steam cycle efficiency (defined as steam turbine power
output divided by energy input from (solar + HRSG) and solar share for three different
configurations, and also the influence of solar collector size on the levelized cost of
electricity of the plants, were studied. It was found that the plant LEC was dependent on

64
the size of the solar field with a lower LEC for lower collector. According to the reference,
the LEC of ISCCS with 15 to 24% of annual solar share was about 20% to 30% higher than
similar size combined cycle plant.
An economic analysis on ISCCS using line-focus parabolic trough collectors to generate
steam at 390 °C to either augment the power of the low-pressure steam turbine in the
bottom cycle (power boost mode) or help save fuel in the top cycle (fuel saving mode) [62].
There was not much information about the thermodynamic performance of the hybrid
system except for some operating parameters such as solar temperature, gas turbine inlet
temperature (1,200 °C), gas turbine exhaust gas temperature (573.4 °C). The economic
analysis was done for a one year period with hourly time steps considering different size
of solar field from 30,000 m2 to 180,000 m2. It was shown that the LEC of ISCCS with
different size of solar field ranges from 0.060-0.076 $/kWh (2013). It could be seen that
when the size of solar field becomes 6 times larger, the cost of ISCCS was 26.7% higher.
[70,71] introduced an Integrated Solar Combined Cycle (ISCC) using Direct Steam
Generation (DSG) which was coupled to the high-pressure level in the two-pressure levels
Heat Recovery Steam Generation (HRSG) generating steam at 545 °C, and compared it to
a conventional Combined Cycle Gas Turbine (CCGT). The annual simulation showed
Annual global efficiencies ISCC power plant were 52.18% in Almería (ambient
temperature at 25 °C) and 51.90% in Las Vegas (ambient temperature at 35 °C) which were
both lower than that of the reference CCGT 53.2%. Solar share was calculated from the

65
data given in the reference. It was found that solar share is 3.0% in Almeria and 4.6% in
Las Vegas, which had a higher ambient temperature.
To compare the effect of direct steam generation (DSG) technology with traditional heat
transfer method using heat transfer fluid (HTF) in a parabolic trough concentrating solar
collector, the performance of ISCCS for different technologies were studied in [63]. For
DSG, water is heated directly by solar radiation, so that a heat exchanger or HTF are not
required. That reduced the capital investment and eliminate the heat exchanger thermal and
pressure losses, and thus raise the system efficiency and power output. It was proved by
finding that annual efficiency and power output of ISCCS with DSG was 0.6% and 1.5%
higher than ISCCS with HTF, respectively. Also, the LEC of ISCCS with DSG was also
found to be lower than ISCCS with HTF by about 2.4%.
An analysis was done during the construction of the first ISCCS in Algeria before the plant
broke ground in Oct. 2007 [66]. The hybrid power plant is now in operation since July
2011 according to NREL [57], and can work in three modes: Integrated solar combined
cycle mode at solar hours (even with one gas turbine), conventional combined cycle mode
at non-solar hours and gas turbine mode when the steam turbine is not functioning. The
simulation results showed that the power plant could provide about 134 MW with
efficiency of 57.5% at night with no solar input, and could reach 157 MW and 67% with
solar input at daytime.

66
Like the previous one, an analysis was made based on an existing plant (Colon Solar project,
Spain) [68]. Due to the liberalization of the electricity generation market, the project
needed to be modified to an all-new combined cycle with solar energy integrated into a
heat recovery boiler. A central receiver system was used in the plant. The total net power
output of the plant was 70.4 MW with an efficiency of 51.5% compared with the efficiency
of 54.0% when there was no solar radiation. The designed solar input was 21.8 MW, so the
solar share was 16%.
Two types of solar hybrid combined cycles were analyzed in [67]. The first one used solar
heat at 395 °C generated by parabolic trough concentrating collectors (oil as HTF) to
supplement the energy required by the steam cycle; while the second one used solar heat
at 450 °C generated by parabolic trough (molten salt as HTF) and two storage tanks at the
outlet of the solar field to supplement the energy required by steam cycle. Both cycles had
a predicted capacity of 137.8 MW and efficiencies of 46.4% and 48.3%, respectively.
Correspondingly, the solar share was 57% and 64%, respectively.
An economic analysis was done for an ISCCS assumed to be in Egypt [69]. Two
technologies were considered: solar parabolic trough concentrating collector field (HTF-
trough) and air receiver tower with a heliostat field (air-tower). In HTF-trough type
collector, the HTF (synthetic oil) was heated to 390 °C to boil a fraction of the feed water
together with gas turbine exhaust gas. In the air-tower type, hot air heated by solar air
receiver at 680 °C is mixed with gas turbine exhaust gas at 525 °C before HRSG. When
the solar energy was insufficient, a duct burner was used. The authors did almost no

67
thermodynamic performance analysis, but investigated comprehensively in economic
performance. The results showed that LEC for HTF-trough types was 3.076 ¢/kWh, which
was 0.3% higher than that of air-tower types, 3.066 ¢/kWh, and both types were about 26%
higher than the corresponding reference combined cycle systems.
As part of the SOLGATE project [47] introduced above, the performance of two prototype
solarized combined cycle plants were analyzed [49]. One of them used two pressurized air
solar receivers to preheat the compressed air to 610 °C and 800 °C, while the other one
used three solar receivers to preheat at 600 °C, 800 °C and 1,000 °C, consecutively. The
top temperatures were both 1,080 °C and the net power outputs were both 16.1 MW. The
first prototype plant was assumed to be located in both the city of Seville, Spain and
Daggett, USA while the second one in Daggett only. It was found that the annual efficiency
was 44.9% and 43.4% for the first type in Seville and Daggett, respectively, and was 43.9%
for the second type. The solar share for the second type (88%) was much higher than for
the first type (57% and 58%, respectively).
After the review of solar hybridization in the bottom cycle, let’s now look at the cases when
solar thermal power is integrated in the top cycle of the combined cycle.
In [72], a solar-hybrid gas turbine-based power Tower system (REFOS) was built and
tested in which a solar receiver was used to preheat compressed air to 800 °C. The turbine
inlet temperature is 1,300 °C and the system was scaled to have a capacity of 30 MW. The
analysis was based on two modes: daytime operation and full-time operation. The

68
efficiencies were almost the same (43.0% and 43.1%, respectively) but the solar shares
were very different (28.6% and 15.0, respectively). The reason why solar share in daytime
operation was higher than that in full-time operation was that more fuel was used in full-
time operation due to lack of solar radiation in night time.
In [36], two types of solar hybrid combined cycle were analyzed, named Solar-Hybrid
Combined Cycle (SHCC) system and Particle-Tower (PT) system, both of which used
thermal energy storage. For each system, pressurized air was heated up to 850 °C and
995 °C, respectively. In the Particle-Tower, air was heated by solid media particles, which
acted as the heat transfer fluid (HTF) through a heat exchanger. Both cycles could achieve
a gross efficiency of about 45% and power output of about 30 MW. The influence of
thermal storage capacity on solar share, specific CO2 emissions and levelized electricity
cost, was then studied. For SHCC, with solar share at 60.1%, the specific CO2 emissions
with thermal storage at 0 hour, 7.5 hours and 15 hours was 0.396 kg/kWh, 0.334 kg/kWh
and 0.273 kg/kWh, respectively. For PT, with solar share at 79.7%, the specific CO2
emissions with thermal storage at 0 hour, 7.5 hours and 15 hours was 0.379 kg/kWh, 0.297
kg/kWh and 0.219 kg/kWh, respectively. For SHCC, the LEC with thermal storage at 0
hour, 7.5 hours and 15 hours was $0.098/kWh, $0.112/kWh and $0.128/kWh, respectively.
For PT system, the LEC with thermal storage at 0 hour, 7.5 hours and 15 hours was
$0.098/kWh, $0.113/kWh and $0.129/kWh, respectively. It could be seen that compared
with no thermal storage, adding 7.5 hours thermal storage decreased the carbon emissions
by 16% for SHCC and 22% for PT, and 15 hours by 31% for SHCC and 42% for PT.

69
Adding 7.5 hours thermal storage increased LEC by 14% and 15 hours by 31% for both
SHCC and PT. That was because adding thermal storage to the solar hybrid systems could
reduce the usage of fuel, which was needed when there was not enough solar heat input
(which is intermittent and influenced by the weather conditions) to make the system run at
the design point. The more thermal storage was used, the less fuel was needed, and thus
the less emission was generated by the systems.
In [73], the influence of the type of gas turbine and its arrangements on the performance of
solar hybrid combined cycle was studied. A solar tower was simulated and used to preheat
compressed air to 950 °C. Three different types of gas turbines were chosen: Siemens SGT-
800, a modern heavy-duty machine with relatively high cycle efficiency and a single shaft
configuration, Siemens SGT-750, a new advanced heavy duty unit with a two-shaft
configuration consisting of a compressor turbine (used to drive the compressor) and a
power turbine (used to produce power output), and GE LM6000PF, a high performance
aeroderivative model presenting a higher sensitivity to inlet air temperature variation and
a two-spool configuration. Each solarized combined cycles was also compared with the
corresponding reference combined cycles without solar input using the same gas turbine.
For each GT type, the system efficiency was about 50% with solar share of 34%, 36% and
31%, respectively, and the efficiency was about 0.7% lower than the corresponding fossil-
fuel-only combined cycle power plant using the same gas turbine.
More detailed information about the above-reviewed solar assisted combined cycle is in
Table 3-3.

70
Table 3-3. A summary of past studies of solar-assisted combined power cycles
Descriptive
name of system
and reference
Lower temperature
heat source
Higher temperature
heat source
E/S*
Power,
kW
Claimed
power
generation
efficiency**
Efficiency
improvement
over single
temperature
system
Solar
fraction of
the total
energy
input***
Note****
T,°C type T,°C type
Solar
concentrator
aided natural
gas fired
combined
cycle power
plant [58]
311
Solar Linear
Fresnel
reflecting
concentrator
551
Gas
turbine
exhaust
gas S 325,290 41.69% -12.78% 10.7%
Exergy
efficiency is
49.69%, which
is 4.24% less
than fossil fuel
only plant 1,072
Natural
gas
Solar
hybridized
advanced Zero
Emissions
Power (AZEP)
cycle
[59]
369
Solar
parabolic
trough
465
Gas
turbine
exhaust
gas S
465
- - 30%
Vaporization
475
Heating of
intermediate-
pressure stream
1,200
Natural
gas
470
Heating of low-
pressure stream
431 Preheating
Integrated solar
combined cycle
system
(ISCCS) [60]
380
Solar
parabolic
trough
565
Gas
turbine
exhaust
gas
S 310,000
36.72% 0.53%
5.6% in
California;
3.4% in
Spain
Without
thermal storage
-
Natural
gas
37.44% 1.25%
9.4% in
California;
6.4% in
Spain
With 100%
thermal storage
Advanced
Solar-Fossil
390 540
Gas
turbine
S 125,000 61.0% - 24.3%
Collector size is
0.61 km2; LEC

71
Combined
Power Plants
(ISCCS) [61] Solar
parabolic
trough
exhaust
gas
is $0.054/kWh
(2000)
-
Natural
gas
100,000 55.0% 14.5%
Collector size is
0.28 km2; LEC
is $0.055/kWh
(2000)
Integrated solar
combined cycle
power plant in
Greece using
line-focus
parabolic
trough
collectors [62]
390
Solar
parabolic
trough
573.4
Gas
turbine
exhaust
gas
S 50,000 - - -
LEC is $0.060-
0.076/kWh for
different size of
collector area
1,200
Natural
gas
Integrated
solar combined
cycle system
with DSG
technology
compared with
HTF
technology
[63]
390
Solar
parabolic
trough
690
Gas
turbine
exhaust
gas
S
451,460
~52.4%
(Annual) ~17%
(compared
with solar only
system)
14.8%
ISCCS-DSG;
LEC is
$0.7459/kWh
(2010)
1,247
Natural
gas
444,800
~51.8%
(Annual)
15.1%
ISCCS-HTF;
LEC is
$0.7645/kWh
(2010)
Integrated solar
combined cycle
system
(ISCCS) [64]
393
Solar
parabolic
trough
548.38
Gas
turbine
exhaust
gas S 392,920 46.2% - 13.5%
Exergy
efficiency is
45.6%; solar
exergy share is
12.4% 1,131.65
Natural
gas
Integrated solar
combined cycle
393 548.38
Gas
turbine
S 407,000
50.9%
(Annual)
1.6% -
33 MWe solar
field

72
system
(ISCCS) [65]
Solar
parabolic
trough
exhaust
gas
444,000
51.6%
(Annual)
2.3%
67 MWe solar
field
1131.65
Natural
gas
444,000
50.9%
(Annual)
1.6%
67 MW e solar
field and
auxiliary
firing system
First Integrated
Solar
Combined
Cycle System
in Algeria [66]
393
Solar
parabolic
trough
-
Gas
turbine
exhaust
gas S 147,000 67% 9.5% -
Hybrid mode
only at daytime
-
Natural
gas
Co-located gas
turbine/solar
thermal hybrid
for power
production [67]
395
Solar
parabolic
trough
450
Gas
turbine
exhaust
gas
S 137,800
46.4%
-
57%
HTF is oil;
without thermal
energy storage;
LEC is
$0.136/kWh
(2014)
450 -
Natural
gas
48.3% 64%
HTF is molten
salts; with
thermal energy
storage (3h);
LEC is
$0.154/kWh
(2014)
The Colon
solar project
[68]
510
Central
Receiver
System
-
Gas
turbine
exhaust
gas E&S 70,400 51.5% -2.5% 16%
IRR is 8.36%,
assuming a 12%
discount rate
(1999)
-
Natural
gas

73
Integrated solar
combined cycle
power
plants using
different types
of solar field
[69]
380
Solar
parabolic
trough
525
Gas
turbine
exhaust
gas S 124.13 - - -
LEC is
$0.03076/kWh
(2004)
680
Solar
volumetric air
receiver
-
Natural
gas
LEC is
$0.03066/kWh
(2004)
Integrated
Solar
Combined
Cycle using
Direct
Steam
Generation [70,
71]
545
Solar
parabolic
trough
555
Gas
turbine
exhaust
gas
S 220,000
52.18%
(Annually)
-1.02% 3.0%
Almería; LEC
is $0.108/kWh
(2011)
1,177
Natural
gas
51.90%
(Annually)
-1.3% 4.6%
Las Vegas;
LEC is
$0.109/kWh
(2011)
Solarized gas
turbine
prototype
plant: PGT10
unit, 800 °C
[49]
610
(1st)
800
(2nd)
Pressurized
air receiver
1,080
Natural
gas
S 16,100
44.9%
(Annually)
0.3% 57%
Seville; LEC is
$0.0747/kWh
(2006)
43.4%
(Annually)
-1.2% 58%
Daggett; LEC is
$0.0750/kWh
(2006)
Solar-Hybrid
Gas Turbine-
based
Power Tower
Systems
(REFOS) [72]
800
REFOS
Receiver
module
1,300
Natural
gas
E&S 30,000
43.0%
-1.9%
28.6%
Daytime
operation; LEC
is $0.0695/
kWh (2002)
43.1% 15.0%
Full-time
operation; LEC
is $0.0508/
kWh (2002)
850 Solar tower 1,100 S 30,200 45.9% - 60.1% No storage;

74
Solar-Hybrid
Combined
Cycle (SHCC)
with thermal
energy storage
[36]
Natural
gas
LEC is
$0.098/kWh
29,500 44.8%
7.5h storage;
LEC is
$0.112/kWh
28,800 43.7%
15h storage;
LEC is
$0.128/kWh
Solar Hybrid
Combined
Cycle with
different Gas
Turbine Model
and Spool
Arrangements
[73]
950 Solar tower
1,285
Natural
gas
S
55,380 50.7% -0.7% 34.2%
GT type is
Siemens SGT-
800
1,210 36,800 49.3% -0.7% 36.3%
GT type is
Siemens SGT-
750
1,280 41,260 50.7% -0.6% 30.8%
GT type is
GE LM6000PF
Particle- tower
with thermal
energy storage
[36]
995 Solar tower 1,100
Natural
gas
S 30,300
45.6%
- 79.7%
No storage;
LEC is
$0.098/kWh
45.2%
7.5h storage;
LEC is
$0.113/kWh
44.9%
15h storage;
LEC is
$0.129/kWh
Solarized gas
turbine
prototype
plant: PGT10
unit,
1,000 °C [49]
600
(1st)
800
(2nd)
1,000
(3rd)
Pressurized
air receiver
1,080
Natural
gas
S 16,100 43.9% -0.7% 88%
Daggett;
LEC is
$0.082/kWh
(2006)

75
Solar-driven
combined cycle
power plant
[74]
-
Irradiated
Annular
Pressurized
Receiver
1,000
Natural
gas
S
600
16.1%
(Annually)
- -
Lowest LEC is
about
$0.10/kWh
(1997)
1,200 34,000
21.3%
(Annually)
LEC is $0.06-
0.07/kWh
(1997)
* E: Experiment, S: Simulation.
** Efficiency is defined as net power output divided by total energy input (Eq. (2.2)), unless indicated otherwise.
*** Solar fraction is defined as solar energy input divided by total energy input (Eq. (2.17)).
**** LEC (levelized electricity cost) was converted to dollar value, based on the currency of the first day in the year published.
3.1.4. Other types of thermal hybrid power cycles
Apart from solar assisted types of hybrid power cycles, other types of heat sources, such
as biomass, nuclear, and geothermal, as well as waste heat from internal combustion
engines (mostly diesel), can also be used in hybrid power cycles. A summary of these types
of hybrid cycle is given in Table 3-4, grouped by the types of heat sources.
1) Geothermal with coal
As in solar assisted power cycles, conventional (hydro-thermal) geothermal heat sources
usually has the lowest temperature in a hybrid system. In a geothermal-fossil hybrid power
plant, geothermal heat at 103 °C and 147 °C at two different locations was used to produce
hot water. The hot water was then used to preheat the feed water in steam power plant
before superheated in the boiler [85,86]. The condition of the superheated steam at the

76
turbine inlet is 250 bar/540 °C. Reheat was also used at 560 °C to improve the efficiency
of the power plant. To compare the performance of power plants under different
geothermal temperature, two plants at different locations were considered. The one at
Neustadt-Glewe, Germany, used geothermal water at 98 °C and the one at Soultz-sous-
Forets, France, at 142 °C. The pinch temperatures in the geothermal heat exchanger were
both 5 °C. A combined heat and power plant (CHP) in condensing mode (i.e., pure
electricity generation) having an efficiency of 40.9% was used for comparison. Since the
superheated steam conditions were different from that of the hybrid system, however, it
cannot be used as a reference plant for comparison with the hybrid power plant. Also, the
authors focused on geothermal energy conversion efficiency (electricity produced by
geothermal heat divided by geothermal heat) didn’t do a full cycle analysis, so full cycle
efficiency was not known. It was found that the geothermal to electricity conversion
efficiency was 8.06% and 13.34%, respectively, for the two locations.
2) Geothermal with biomass
Besides fossil fuel as in the previous analysis, biomass could also be combined with
geothermal power in a hybrid power plant. In [87], two types of geothermal-biomass hybrid
cycles were proposed and analyzed: Dual-fluid-hybrid cycle (DFH) using two different
working fluids, which was actually a geothermal powered organic Rankine cycle topped
by a biomass powered steam Rankine cycle, and Single-fluid hybrid cycle (HYB) using
geothermal heat to preheat and biomass to superheat the working fluid (could be organic
or steam). Four kinds of organic fluids and steam were studied as working fluid,

77
respectively, and a sensitivity analysis of energy efficiency, power output and efficiency
of utilization of geothermal heat on geothermal water temperature from 80 °C to 100 °C
(the pinch point in the geothermal heat exchanger was set to 5 °C). When the geothermal
temperature was 100 °C, although not given directly, the geothermal energy supply share
could be calculated by the given data as 9.7~45.7 % for different organic fluids used in the
system. The organic Rankine cycle powered only by geothermal heat was used as the
reference cycle. It was found that HYB using cyclohexane as working fluid had the highest
energy efficiency (28%) and power output (9.7 MW). For comparison, a geothermal-only
ORC using R236fa as working fluid was just 11% and 0.4 MW, respectively. This
represented a 127% and 2,325% increase, respectively, in energy efficiency and power
output.
3) Biomass with natural gas
In [88], several integration methods of a biomass boiler burning wet forest and agricultural
residue (FAR) with two types of gas turbines in a combined cycle gas turbine (CCGT)
plants were proposed and analyzed. The flow diagrams of the two integration methods
could be seen in Fig. 3-5 and Fig. 3-6. One type of CCGT (01Ref) consists of 2 parallel
gas turbines (GT) (2 GT was chosen to be compared with the case when only 1 GT was
used), heat recovery steam generator (HRSG) and 1 steam turbine (ST), and the other one
(02Ref) consists of 1 GT, HRSG and 1 ST with reheat and intercooling in GT. In the
integrated power plant, a fraction of flue gases from a CCGT is extracted between GT and
HRSG (primary flue gas), led to the boiler and used as combustion air and fluidization

78
medium (fully-fired configuration) or for preheating air and economizing in the steam
cycle (parallel-powered configuration). Flue gas from the end of the HRSG (secondary flue
gas) was used to dry the biomass fuel. A gasification option was also provided, which
utilized turbine exhaust gas to drive biomass gasification in a gasifier. The results were that
the efficiency of the hybrid cycle was higher than the corresponding stand-alone biomass
power plant but lower than the corresponding conventional CCGT. For example, for the
first type of CCGT, the energy efficiency of the fully-fired configuration shown in Fig.
3-5was 41.0%, which was 5.5% higher than biomass only power plant, but 16.1% lower
than the corresponding CCGT power plant. For parallel-powered configuration shown in
Fig. 3-6, the efficiency was 37.9%, which was 2.4% higher than biomass only power plant,
but 19.2% lower than the corresponding CCGT power plant. More details could be found
in Table 3-4.

79
Fig. 3-5 Hybrid option biomass unit simplified scheme, 01HybFF configuration [88]
Fig. 3-6 Hybrid option biomass unit simplified scheme, 01HybPP configuration [88]

80
4) Nuclear with fuel
A number of studies and implementations were made of nuclear thermal hybrid power
systems. Lior [89] made an energy, exergy and thermoeconomic analysis of a nuclear
power plant superheated by fossil fuel. This plant was built and operated earlier at Indian
Point, New York, was a pressurized water reactor generating core steam at 269 °C to
produce steam at 234 °C at the outlet of the steam generator, which was superheated by an
oil-fueled superheater to 540 °C, that was fed to the steam turbine. A total of 275 kW
electricity was produced with 112 kW of that provided by the added fuel. The energy
efficiency of the plant was 34.1% compared with 28.4% for the original plant that did not
incorporate fossil fuel superheat. A sensitivity analysis of plant efficiency to the superheat
temperature shown that the efficiency increased at a rate of about 7.7%/(100 °C superheat).
An optimization on extraction steam from the turbine was also done in the paper, together
with an economic evaluation.
An energetic and exergetic analysis on a hybrid combined nuclear power plant using a
pressurized water reactor (PWR) was made [90,91]. In the system, nuclear heat at 273.4 °C
was used to preheat the working fluid in the HRSG of the bottom cycle. Turbine exhaust
gas at 343.4°C and 505.6 °C was used before and after nuclear preheating, respectively.
The energy efficiency was found to be about 44% with a net power output of 1.84 GW.
In a comprehensive exergetic and economic comparison of a Pressurized Water Reactor
(PWR) power plant and hybrid fossil fuel-PWR power plant [92], the nuclear-only system

81
was compared with the hybrid system using the same nuclear power plant but with
additional natural gas or coal as higher temperature heat source. The nuclear only system,
with top temperature of working fluid at 326.1 °C, was reported to have an exergy
efficiency (power generation cost) of 38.5% (3.06% cent/kWh) for highest exergy
efficiency and 37.6% (3.005% cent/kWh) when power generation cost when optimized for
lowest power generation cost. The respective result for natural gas assisted (superheat to
480 °C) and coal assisted (superheat to 490 °C) hybrid power plant was reported to be
46.24% (3.431% cent/kWh) and 39.72% (3.495% cent/kWh), respectively, when exergy
efficiency was optimized, and 44.16% (3.369% cent/kWh) and 38.46% (3.411%
cent/kWh), respectively, when power generation cost was optimized.
Unlike the previously-described nuclear hybrid plants, which used nuclear power to
preheat the working fluid in the steam cycle, [94] introduced a mobile hybrid gas turbine
cogeneration power plant concept, which used a high temperature reactor (HTR) to preheat
the compressed air for the gas turbine. The mobile system used a reactor outlet temperature
at 800 °C to preheat the pressurized air to 700 °C and could further heat it to 1,000 °C using
fuel oil. Hot exhaust gas from the gas turbine could also provide heat for hot water or
desalination. A thermodynamic analysis when both heat sources were used was not
performed, but instead the performance of the system when only nuclear or fuel was used
were calculated. In the nuclear mode when only nuclear heat was used, the electrical
generation efficiency was 32% and the power output 5 MW, while in the fuel mode when

82
only fuel was used, it was 40% and 5-6 MW, respectively. Both modes can provide heat
output rate of 8 MW.
Besides integration with steam cycle and gas turbine as in the previous cases, nuclear could
also be integrated with the combined cycle. [95] introduced a nuclear-assisted combined
cycle (Nuclear assisted NGCC) in which nuclear power was used to preheat the compressed
air in the gas turbine (top cycle). A gas cooled nuclear reactor was used to provide hot
water at 900 °C to preheat the compressed air to 874 °C by a heat exchanger as shown in
the flow diagram of the system Fig. 3-7. Usually nuclear power plant cannot provide such
high temperature, however, certain types, such as high-temperature gas-cooled reactor
could have an outlet temperature of 900 to 1,000 °C [75]. The inlet temperature for gas
turbine is 1,400 °C and for the steam turbine 545 °C. The nuclear-assisted NGCC provided
total power of 382 MW with the nuclear heat providing 46.3% of the total input thermal
power. A sensitivity analysis found that the nuclear contribution increases with reactor
outlet temperature for a fixed turbine inlet temperature. The energy efficiency for the whole
plant is 59.1%, which is lower than for NGCC without nuclear (59.9%), but is higher than
a conventional nuclear power plant (45%).

83
Fig. 3-7 Flow diagram of a nuclear-assisted combined cycle (Nuclear assisted NGCC)
(RO: reactor outlet, RI: reactor inlet, eff: effectiveness/efficiency, HX: heat exchanger,
Comp: compressor, GT: gas turbine, ST: steam turbine, HRSG: heat recovery steam
generator, T: temperature, P: power) [95]
Also in [93], a Nuclear Air-Brayton Combined Cycle (NACC) was proposed, using a
Fluroride-salt-cooled High-temperature Reactor (FHR). It could be operated in two modes:

84
base-load mode when only nuclear was used as heat source to heat the air to 670 °C, and
peak electricity mode when natural gas (near-term), stored heat in thermal storage or
hydrogen, were used to further heat the air to 1,065 °C. In the nuclear-only mode, the
efficiency was reported to be 42% with power generation capacity of 100 MW; while in
the hybrid mode, it could provide additional capacity of 142 MW. The efficiency of the
hybrid system was not shown.
5) Nuclear with renewables
Apart from fuel, nuclear could also be integrated with renewable heat sources such as solar,
geothermal or wind. Being able to take advantage of the differences between nuclear (base-
load heat source) and renewables (variable electricity output), a novel hybrid nuclear
renewable system for variable electricity production was introduced [76] and is shown in
Fig. 3-8. In this system, the nuclear plant operated at full capacity with different mass flow
rate of steam to turbines to match the electricity demand with production (renewables and
nuclear). Excess steam at times of low electricity prices and electricity demand went to
hybrid fuel production and storage systems. For example, the excess steam from the nuclear
plant could be used to heat rock a kilometer underground to create an artificial geothermal
heat source, which could also be used to produce electricity. The nuclear power plant used
in the study was a pressurized water reactor, which had a maximal temperature of 273 °C.
It was predicted that with relatively good match between nuclear production and electricity
demand, this plant would have a competitive economic advantage relative to wind or solar
energy power plants for a low-carbon world because of lower investments in energy storage

85
systems to meet variable electricity demand. Quantitative analysis to prove that was not
performed.
Fig. 3-8 Hybrid nuclear renewable system for variable electricity production [76]
6) Internal combustion engine compound systems
Internal combustion engine, or ICE, is an engine that produces work through internal fuel
combustion. The waste heat from the engine combustion chamber and other parts of the
engine, which is 60-70% of the fuel heat input into the ICE [77], whose temperature ranges
from below 100 °C to over 500 °C, can serve as the heat source and be used produce
additional power in addition to the power output from the ICE. Internal combustion engine
(ICE) compound systems are also hybrid power cycles using multiple heat sources with
different temperatures and much work have been done in this field.
In [96], the performances of 3 kinds of IC engine-organic Rankine cycle (ORC) combined
cycles with different amounts of waste heats recovered at different temperatures was

86
studied. The first configuration utilized all of the five waste heat sources at different
temperature (85 °C, 127 °C, 172 °C, 330 °C and 506 °C, from cooling water, intercooler,
aftercooler, engine exhaust gas and Exhaust Gas Recirculation (EGR) cooler, respectively.
The second configuration used the EGR gases and part of engine exhaust gas to drive a top
Rankine cycle, and used other waste heat having relatively lower temperatures to drive a
bottom Rankine cycle at the same time. The third configuration used only waste heat from
the aftercooler, engine exhaust gas and EGR cooler to drive a Rankine cycle. The flow
diagram of each configuration could be found in [96] and will not be introduced here. It
was found the first configuration has the lowest power output (342 kW) and efficiency
(41.3%) of the whole system and the second one has the highest power output (370 kW)
and efficiency (44.69%).
Following the previous work, 3 kinds of innovative compound engine systems were
configured [97], with flow diagrams shown in Fig. 3-9, Fig. 3-10 and Fig. 3-11,
respectively:: (1) configurations without LP (low pressure) turbine, one with MP (medium
pressure) EGR (exhaust gas recirculation); (2) configuration without LP turbine, with LP
EGR, and (3) configuration without LP turbine, with LP EGR and high temperature
Rankine cycle. The resulting efficiencies and power outputs showed no improvement over
the 3 systems studied previously in [96]. It was concluded that the best configuration should
be the third system since it had a relatively high efficiency and power output, but with a
less complex configuration compared with the second system, which had a higher
efficiency and power output.

87
Fig. 3-9 Compounded IC engine power plant layout of the configuration without LP
turbine, with MP EGR [97]
Fig. 3-10 Compounded IC engine power plant layout of the configuration without LP
turbine, with MP EGR [97]

88
Fig. 3-11 Compounded IC engine power plant layout of the without LP turbine, with LP
EGR and high temperature Rankine cycle configuration [97]
Another example is a combined diesel engine gas turbine system for distributed power
generation [103]. The flow and T-s diagrams are shown in Fig. 3-12. In the system, part of
the compressed air from low pressure compressor was used for the diesel engine
combustion, and the other part was for further compression and used in gas turbine. The
fuel for diesel engine acted as higher temperature heat source (point 5) and the fuel (natural
gas) for the gas turbine acted as lower temperature heat source (point 12). This hybrid
system used the thermal energy of the exhaust gas from diesel engine to generate additional
power in a gas turbine. The optimization on the pressure ratios of three compressors with

89
the compression ratio (𝐶𝑅) of diesel engine fixed showed the cycle can had a maximal
efficiency of 74.7% when 𝐶𝑅 = 20, and 77.3% when 𝐶𝑅 = 30.
Fig. 3-12 Flow diagram (a) and T-s diagram (b) of a combined diesel-engine gas-turbine
system with intercooling and regeneration [103] (DE: Diesel engine, C: compressor, T:
turbine, CC: combustion chamber, IC: Intercooler, RG: regenerator)
The above-described analyses [96,97] considered the engine and the waste heat recovery
system as a whole, by including the engine power output in the total power output and
considered engine fuel input. Many studies, however, focused only on recovering the waste
heat from the engine for augmenting power generation, and the engine exhaust gas is used
as heat source in the waste heat recovery (WHR) system, without considering the engine
output and fuel input. For those systems, only the efficiency of the WHR system (defined
as the ratio between net power output and available energy in the exhaust gas of engine) is
shown in Table 3-4, with “excluding engine” in the parentheses.

90
A review of organic Rankine cycles (ORC) driven by recovered internal combustion engine
(ICE) exhaust waste heat [77], it was found that ORC was the most widely used waste heat
recovery system in harvesting engine exhaust and engine coolant heat from ICE. It was
also found that no single working fluid was best for all ORC’s, since operating conditions,
environmental impacts and concerns, and economic factors must be considered.
Furthermore, a recent study of an organic Rankine cycle system utilizing exhaust gas of a
marine diesel engine showed that there was still no best choice of working fluid considering
both power output and efficiency, even for one type of ICE exhaust gas driven ORC
systems [99]. The authors optimized the system with and without pre-heater for 4 types of
working fluid: R123ze, R245fa, R600 and R600a. The flow diagram is shown in Fig. 3-13.
The results showed that the system using R245 as working fluid had the best performance
in terms of the ratio between power output and total cost of system, which was 3% higher
than the system using R1234ze. The system using R1234ze, however, had the best
thermodynamic performance, with the maximum energy efficiency 2.2% higher than that
for R600. Also, compared with conventional diesel oil feeding, the proposed ORC system
could reduce 76% CO2 emissions per kWh.

91
Fig. 3-13 Schematic diagrams of the ORC system (a) without pre-heater and (b) with pre-
heater [99]
[98] introduced a combined thermodynamic cycle used for waste heat recovery of ICE.
The system consisted of two cycles: organic Rankine cycle (ORC), for recovering the waste
heat of lubricant at 175 °C and high-temperature exhaust gas at 500 °C, and a Kalina cycle,
for recovering the waste heat of low-temperature cooling water at 135 °C. The performance
of several types of working fluids in the higher temperature ORC was also analyzed. It was
found that cyclopentane had a better performance than R113, since the efficiency was 20.83%
when using cyclopentane as working fluid, higher than 16.51% when R113 was used, and
the power output (347.8 kJ/kg) was also higher (261.52 KJ/kg).

92
The performance of a medium temperature organic Rankine cycle (ORC) recovering waste
heat from heavy duty diesel engine (258 kW rated power) exhaust gas was analyzed in
[101]. The organic fluid was chosen to be R123. The effect of temperature and mass flow
rate of exhaust gas on the power output and efficiency of ORC was studied and it was
found that an efficiency of up to 10-15% could be achieved. The ORC system, however,
had no waste heat recovery effect when exhaust temperature was below 300 °C.
An organic Rankine cycle bottomed ICE was also analyzed, but using natural gas as fuel
[102]. The engine without the ORC system generated 2,928 kW of electricity with turbine
exhaust gas at 470 °C. Three configurations were analyzed to integrate with the engine: (1)
ORC simple cycle powered by engine exhaust gases, (2) ORC simple cycle powered by
engine exhaust gases and engine refrigerant water, and (3) ORC regenerated cycle powered
by engine exhaust gases. The authors also considered the effect of the type of the working
fluid and compared the performances of Benzene, R11 and R134a. Since only Benzene
was used in all three investigated systems, the system performances with Benzene as
organic fluid were included in Table 3-4. It was found that all three configurations are
about 5% more efficient than the stand-alone engine and the third one is the best one among
them with the highest power output and efficiency (47.1%).
Hydrogen can also be used as fuel for ICE. [104] introduced the hydrogen internal
combustion engine (HICE) combined with open steam Rankine cycle to recover water and
waste heat. Unlike diesel engines, HICE produce H2O vapor as the main combustion
product, besides the waste heat. The water produced by the HICE was used as the working
93
fluid in an open steam Rankine cycle, with the HICE exhaust gas as the heat source for the
cycle. Two options for the cycle were also provided: without condenser (RS-1) and with
condenser (RS-2). Water could be recycled if a condenser is used, but more work was
needed to drive the air cooling fan. The energy efficiency for the recovery system was
found to be higher for RS-2, but the overall efficiency for the combined system was almost
the same, 2.9-3.7% higher than that of a conventional HICE without any recovery system,
in the engine speed range of 1,500 rpm to 4,500 rpm. A sensitivity analysis was done on
the turbine inlet temperature (TIT) and showed that the overall energy efficiency increased
with TIT.
7) SOFC hybrid systems
Solid oxide fuel cells (SOFC) can also be used in hybrid power cycles. Early works were
done by topping fuel cells on a Rankine cycle [78,79 ]. The flow diagram is shown in Fig.
3-14. In this system, hydrogen (stream 1) and ambient air (stream 2) were preheated by the
preheaters to the needed reaction temperature (1020 °C) before entering the fuel-cell
system, where the fuel was partially oxidized by the oxygen in the air. The high temperature
fuel-cell exhaust gas (1170 °C for stream 6 and 1319 °C for stream 7) was then combusted
in the combustion chamber so that the exhaust gas from the combustion chamber (at
1448 °C) was used to drive a power cycle. It was predicted that the exergy efficiency of
the hybrid system ranged from 42.4-26.4%, depending on the current of the fuel-cell unit
(maximized at 1.1 A), which was 0.9-4.9% higher than the conventional system without
the fuel-cell unit at 41.5%.

94
Fig. 3-14 Flow diagram of the fuel-cell-topped Rankine power cycle system [78]
[105] introduced a trigeneration plant based on a solid oxide fuel cell with an organic
Rankine cycle. The flow diagram of the system is shown in Fig. 3-15. The cycle used the
waste heat from a SOFC to drive an organic Rankine cycle using n-octane as working fluid
for power generation, heating and cooling at the same time. The inlet flows of air, CH4 and
water to the SOFC were heated via a heat exchanger using the heat from a wood-burning
boiler. The effects of inlet flow temperature and current density of the SOFC and inlet
pressure of the turbine on the performances of the trigeneration system were studied. Under
the design conditions, in which the inlet flow temperature of the SOFC was 757 °C, current
density 0.8 A/cm2 and turbine inlet pressure of 1,600 kPa, the electricity generation

95
efficiency was 30% and the trigeneration system efficiency (nominal efficiency) was 71%.
The system could produce a total power of 520 kW, with SOFC contributing 460 kW.
Fig. 3-15 Flow diagram of trigeneration plant with combined SOFC and organic
Rankine cycle [105]
Another hybrid system involving SOFC was introduced in [106]. The flow diagram is
shown in Fig. 3-16. It was a novel combined cycle integrating coal gasification, solid oxide
fuel cell (SOFC), and chemical looping combustion (CLC), and it was the first analysis of
hybrid system combining coal gasification, SOFC and CLC. Due to the integration of CLC,

96
CO2 was inherently separated in the process of fuel conversion, so the proposed system
had the ability to achieve almost 100% carbon capture performance. It was found that by
using NiO as oxygen carrier in the CLC unit, at the baseline case with SOFC temperature
of 900 °C, SOFC pressure of 15 bar, fuel utilization factor 0.85, fuel reactor temperature
900 °C and air reactor temperature 950 °C, the plant net power efficiency was predicted to
reach 49.8% (based on coal LHV), including the energy penalties for coal gasification,
oxygen production, and CO2 compression. Also, a thorough exergy analysis of the system
showed the largest exergy loss portion was the in the gasification process, followed by CO2
compression and SOFC.

97
Fig. 3-16 Flow diagram of the power plant integrating coal gasification, SOFC, CLC and
combined power cycle [106]
Besides the two SOFC hybrid systems introduced above, a recent and thorough review of
hybrid SOFC-gas turbine (SOFC/GT) systems was done in [80]. The layout of SOFC/GT
plant, according to the authors, depends on several design parameters, such as (1) operating
temperature and pressure of the SOFC stack; (2) type of fuel and peculiarities of the fuel
processing subsystem (steam reforming: internal/external, direct/indirect; partial oxidation,
autothermal reforming, etc.); (3) production of steam required for the reforming process:

98
anode recirculation or heat recovery steam generator; (4) type of Brayton cycle: basic,
intercooled and/or reheated. Other review papers on hybrid SOFC systems are also
available, such as [81-83].
8) Unspecified heat source
There are also hybrid cycles that don’t specify the type of heat sources. Y.M. Kim et al.
[107] proposed and analyzed a novel power cycle using transcritical (or supercritical) CO2
as the working fluid. The cycle used hot and cold tanks to store and release lower
temperature heat. Heat was stored in the hot tank in the day and released from the hot tank
to the cold tank at night, so the cycle could produce more work when the heat from higher
temperature heat source is fixed. The higher temperature heat source could be nuclear,
concentrated solar or fuel combustion. Also, a thermo-electric energy storage (TEES)
system could be added by charging and discharging to improve the performance of the
cycle. The flow diagrams Fig. 3-17 showed how it worked. The paper used nuclear power
as the higher temperature heat source and hot/cold water tank as the lower temperature heat
source as an example. The results showed that the efficiency was 40.3% without TEES and
40.9% with TEES, both of which were higher than two separate cycles working
independently for the same heat source temperatures.

99
Fig. 3-17 Schematic of TEES LH T-CO2 cycles, charging mode (top) and discharging
and generation mode (bottom) [107]

100
Also with unspecified heat source, [108] introduced a combined cycle power plant with
integrated low temperature heat (LOTHECO) which utilized low temperature waste heat
or solar heat to vaporize the water droplets in compressed air of gas turbine. The flow
diagram showing the exergy flow of each stream is shown in Fig. 3-18. In an example,
waste heat from a natural gas compressor station at 250 °C was used to vaporize the humid
air steam to saturated steam at 169 °C. The designed power output of LOTHECO was 46.6
MW and efficiency of 57.6%, which was higher than CCGT (51.1%). The paper also
compared it with simple gas turbine, steam injection gas turbine and humid air turbine, but
didn’t specify if they used the same operating parameters, such as turbine inlet temperature.
Fig. 3-18 Exergy flow diagram of the LOTHECO cycle [108]
[84] introduced a combined cooling, heating and power system with dual power generation
units (D-CCHP) shown in Fig. 3-19. There were two power generation units (PGU) in this

101
system, one of which worked at base load while the other worked following the electric
load. The waste heat generated by the two PGUs was used for cooling and heating in the
building. Any supplemental thermal or electrical energy needs in the building were met by
a boiler or purchased from the grid. The system was compared with a separate heating and
power (SHP) configuration in nine geographic locations. It was found that the system was
able to reduce the operation cost except for two locations, primary energy consumptions
except for one location, and carbon dioxide emissions for two locations. It was thus
concluded that the system had a potential to save money, energy and emissions.
Fig. 3-19 Schematic of proposed D-CCHP configuration [84]

102
[109] introduced a hybrid power generation plant with the ability of CO2 capture. The flow
diagram is shown in Fig. 3-20. In the hybrid system, exhaust gas from gas turbine was used
to capture CO2 generated from pulverized coal (PC) power plant so that the extraction
steam in the PC power plant could be saved for power generation. The details for carbon
capture can be seen from Fig. 3-21. Three cases were studied for the system: (1)
aeroderivative GT with HRSG+PC units with post-combustion CO2 capture, (2) E-class
GT with HRSG+PC units with post-combustion CO2 capture and (3) F-class GT with
HRSG and BP STG+PC units with post-combustion CO2 capture and an additional back-
pressure (BP) steam turbine generator (STG). The results showed that the efficiencies are
lower than the reference PC power plant without CO2 capture (the reason was not
mentioned, but possibly because of additional pressure loss due to more complex
configuration), but have higher power output and CO2 capture ability. The third case was
found to have the highest efficiency (36.6%, in terms of HHV) and power output (1.65 GW)
of all three cases and was then compared with natural gas fired combined cycle (NGCC)
system. It was found that while it captured 64.1% of the CO2 produced from PC, the
efficiency of hybrid system is much lower than that of NGCC (36.0% and 50.4%,
respectively).

103
Fig. 3-20 Block flow diagram of hybrid power plant for CO2 capture [109]
Fig. 3-21 Amine unit for CO2 capture [109]

104
Table 3-4. A summary of past studies of hybrid power cycles without solar input
Descriptive
name of system
and reference
Low temperature
heat source
Higher temperature
heat source
E/S* Power, kW
Claimed
power
generation
efficiency**
Efficiency
improvement
over single
temperature
system
Note***
T,°C type T,°C type
Geothermal
feedwater
preheating in
conventional
power plants
[85,86]
103
Geothermal
560
(Reheat)
Hard coal S 520,000
8.06%
(geothermal
to electricity)
-
Neustad; LEC is
$0.146/kWh (2002)
147
13.34%
(geothermal
to electricity)
Soultz; LEC is
$0.075/kWh (2002)
Dual-fluid-
hybrid power
plant co-
powered by
low-temperature
geothermal
water [87]
105 Geothermal 230 Biomass S
9,700 28% - HYB cyclohexane
- 23% - HYB water
5,100 25% 14% DFH R365mfc-water
4,900 25% 14% DFH R245mfc-water
3,200 23% 12% DFH R236mfc-water
Boiler
integrated with
02Ref CCGT
hybrid power
plant [88]
575
(1st)121
(2nd)
Gas turbine
Exhaust gas
510 Biomass S 524,900
40.0%
4.5%
(Biomass)
-17.0%
(CCGT)
Fully-fired; LEC is
$0.191/
kWh (2010)
1210 Natural gas 38.0%
3.5%
(Biomass)
-19.0%
(CCGT)
Parallel-powered;
LEC is $0.195/
kWh (2010)
Boiler
integrated with
01Ref CCGT
575
(1st)121
(2nd)
Gas turbine
exhaust gas
510 Biomass S 861,600 41.0%
5.5%
(Biomass)
-16.1%
(CCGT)
Fully-fired; LEC is
$0.135/
kWh (2010)

105
hybrid power
plant [88]
1267 Natural gas 37.9%
2.4%
(Biomass)
-19.2%
(CCGT)
Parallel-powered;
LEC is $0.140/
kWh (2010)
Nuclear power
plant with
fossil-fuel
superheat [89]
269 Nuclear 540 oil E&S 275 34.1%
5.7%
(compared
with nuclear
only)
LEC is $0.026/
kWh (i=6.5%) and
$0.030/
kWh (i=8.5%) (1997)
Novel
hybrid
Combined-
Nuclear Power
Plant (HCNPP)
[90,91]
273.4 Nuclear
505.6
(1st)
343.4
(2nd)
Gas turbine
exhaust gas
S 1,840,000 44%
11%
(compared
with nuclear
only)
Total exergy
destruction is 2281
MW
1,087.0 Natural gas
Hybrid fossil-
PWR
(Pressurized
Water Reactor)
plants [92]
321 Nuclear
480 Natural gas
S 1,000,000
46.24% 7.74%
Exergetic
maximized; LEC
$34.31/MWh (2010)
44.16% 6.56%
LEC minimized;
LEC $34.31/MWh
(2010)
490 Coal
39.72% 1.22%
Exergetic optimized;
LEC $34.95/MWh
(2010)
38.46% 0.86%
Exergetic minimized;
LEC $33.69/MWh
(2010)
Nuclear Air-
Brayton
Combined
Cycle (NACC)
[93]
670 Nuclear 1,065 Natural gas S 242,000 - -
Hydrogen or stored
heat could also be
used instead of
natural gas

106
Mobile hybrid
(nuclear/oil-
fired) gas
turbine
cogeneration
power plant
[94]
800 Nuclear 1,000 Fuel oil S
5,000-
6,000
32% (nuclear
mode)-40%
(fuel mode)
82-87%
(nominal)
-
Also provide heat at
8 MW
Nuclear-assisted
NGCC (natural-
gas combined-
cycle) [95]
900 Nuclear 1,400 Natural gas S 382,000 59.1%
14.1%
(compared
with nuclear
only)
LEC is
$0.0644±0.0093/kWh
(2007); CO2 emission
reduced by 46.3%
compared with
NGCC
-0.8%
(compared
with NGCC)
Heavy Duty
(HD) Diesel
engine equipped
with a
bottoming
Rankine cycle
as a waste heat
recovery system
(classical) [96]
85 Cooling water
- Diesel E&S
342 41.30% 3.74%
All the waste heat
sources
127 Intercooler
370 44.69% 7.13%
Relatively high (low)
temperature heat
sources for top
(bottom) Rankine
cycle
172 Aftercooler
330
Engine
Exhaust gas
357 43.12% 5.56%
Waste heats from
cooling water and
intercooling not used 509
Exhaust Gas
Recirculation
(EGR) cooler
Heavy Duty
(HD) Diesel
engine equipped
with a
bottoming
85 Cooling water
- Diesel E&S
331 39.98% 2.42%
Without LP turbine
with MP EGR
127 Intercooler
335 40.46% 2.90%
Without LP turbine,
with LP EGR 172 Aftercooler

107
Rankine cycle
as a waste heat
recovery system
(innovative)
[97]
330
Engine
Exhaust gas
290 35.02% -2.54%
Without LP turbine,
with LP EGR and
high
temperature 509
Exhaust Gas
Recirculation
(EGR) cooler
Combined
thermodynamic
cycle used for
waste heat
recovery of
internal
combustion
engine [98]
135 Cooling water
500
Vehicle
engine
exhaust gas
S
347.8
(kJ/kg)
20.83%
(excluding
engine)
-
Working fluid is
cyclopentane
175 lubricant
261.52
(kJ/kg)
16.51%
(excluding
engine)
Working fluid is
R113
Organic
Rankine cycle
system utilizing
exhaust gas
of a marine
diesel engine
without pre-
heater [99]
180
Diesel engine
exhaust gases
- Diesel S
81.79
9.61%
(excluding
engine)
-
R1234ze
81.68
6.46%
(excluding
engine)
R245fa
81.26
9.5%
(excluding
engine)
R600
78.95
6.42%
(excluding
engine)
R600a
Organic
Rankine cycle
system utilizing
exhaust gas
of a marine
diesel engine
180
Diesel engine
exhaust gases
- Diesel S
89.72
10.51%
(excluding
engine)
-
R1234ze
87.05
10.08%
(excluding
engine)
R245fa

108
with pre-heater
[99] 87.32
10.21%
(excluding
engine)
R600
88.76
10.37%
(excluding
engine)
R600a
A natural gas
expansion plant
integrated
with an IC
engine and an
organic Rankine
cycle [100]
405
Exhaust gas
from engine
-
Pressurized
natural gas
S 4,482 52.57% 2.97
Exhaust gas from
ICE is used to drive
ORC and two gas
expanders to generate
power; System CO2
emission is 0.2559
kg/kWh
A medium-
temperature
waste-heat
recovery system
based on the
organic Rankine
cycle (ORC)
[101]
470
Diesel engine
exhaust gases
- Diesel S 273
15%
(excluding
engine)
-
Working fluid is
R123
Internal
Combustion
Engine
bottoming with
Organic
Rankine Cycles
[102]
470
Diesel engine
exhaust gases
- Natural gas S
3277.3 46.6% 4.8% Simple cycle
3314.0 47.1% 5.3%
Simple cycle with
reheat
3320.6 47.1% 5.3% Regenerated cycle
827 Natural gas - Diesel S
1,333.9
(kJ/kg)
74.7% -
Diesel engine 𝐶𝑅 =
20

109
A Combined
Diesel-Engine
Gas-Turbine
System for
Distributed
Power
Generation
[103]
1,553.9
(kJ/kg)
77.3%
Diesel engine 𝐶𝑅 =
30
Hydrogen
internal
combustion
engine
combined with
open steam
Rankine cycle
recovering
water and waste
heat [104]
616
HICE exhaust
gas
- Hydrogen S
6.6 27.2% 2.9%
Engine speed is
1,500 rpm
769 22.1 33.6% 3.7%
Engine speed is
4,500 rpm
Fuel-cell-topped
Rankine power
cycle system
[78,79]
1020 Fuel 1448 Fuel S 361,100
42.4%-
46.4%
(exergy
efficiency)
0.9%-4.9%
Exergy efficiency
maximized at fuel-
cell current 1.1 A
Trigeneration
plant based on
solid oxide
fuel cell and
organic Rankine
cycle [105]
727 Wood - Natural gas S 520
30%
(electricity)
71%
(nominal)
-6%
Current density from
SOFC is 0.8 A/cm2
Novel
combined
900 Coal 900 Anode gas S 13,346 49.8% >0
Nearly 100% carbon
capture

110
cycle
integrating coal
gasification,
solid oxide fuel
cell, and
chemical
looping
combustion
[106]
950
Oxygen
depleted air
Transcritical
CO2 cycles
using both low-
and high-
temperature
heat sources
[107]
122.2
Lower
temperature
thermal
storage
600
Higher
temperature
heat source
S
150.4
(kJ/kg)
40.3% 5.2%
HTF is transcritical
CO
122
186.8
(kJ/kg)
40.9% 6.9%
With thermo-electric
energy storage
(TEES)
Combined cycle
power plant
with integrated
low temperature
heat
(LOTHECO)
[108]
250
Waste heat
from
industrial
processes
- Natural gas S 46,600 57.6% 6.5%
LEC is $0.06-
0.22/kWh depended
on full load operation
hours
Hybrid Power
Generation
Plant
for CO2 Capture
[109]
-
Gas turbine
exhaust gas
580 Coal
S
1,489,300 36.4% -1.1% Aeroderivative GT
1,494,200 35.7% -1.8% E-class GT
- Natural gas 1,646,700 36.6% -0.9%
F-class GT with
Steam turbine
* E: Experiment, S: Simulation.
** Efficiency is defined as net power output divided by total energy input (Eq. (2.2)), unless indicated otherwise.
*** LEC (levelized electricity cost) was converted to dollar value, based on the currency of the first day in the year published.

111
3.2. Conclusions of the review of thermal hybrid power cycles
As can be easily seen from the tables, solar heat was used in thermal hybrid power
generation systems for a wide range of temperatures (100-680 °C). In the lowest part of the
range (100-157 °C), solar flat-plate and evacuated tube collector were used; in the mid-
range temperature (180-550 °C), solar parabolic trough concentrating collector is most
widely used, but Fresnel concentrating collectors are also usable; in the high-temperature
range (>565 °C), solar towers were used. Although point-focus concentrators could also
produce thermal temperature at 1,371 °C with the same principle as for solar tower [110]
and can be used to drive Stirling engine or gas turbine system, it was not found in the past
publications about hybrid power generation systems.
Most of the hybrid multi-temperature systems are reported to have a higher efficiency than
those using only one heat source (lower temperature heat source). This is mostly because
the use of fossil fuel combustion as a heat source raises the top temperature of the original
cycle, and enables cascading use of input heats to reduce exergy losses. For example, in
the ‘SSPRE’ cycle, the top temperature has been raised from 100 °C to 600 °C by burning
fossil fuel, resulting in an efficiency increase of 80%. In solar hybrid gas turbine system,
however, the efficiency was found to usually slightly decrease, by several percentage
points due to pressure loss in additional equipment, in comparison with non-hybrid gas
turbine systems. This small loss should be contrasted with the ability of such hybrid cycles
to use solar energy, with the associated benefits.
112
The relation between the system energy efficiency at design point and the top temperature
of the cycle for all the investigated system discussed in this section is shown in Fig. 3-22.
This figure doesn’t contain the system when energy efficiency at design point or top
temperature of the cycle is unknown. The efficiencies of the same systems but with
different parameters (such as geographic locations, working fluids, ambient temperatures)
will be averaged and regarded as one system. It is clear shown in the figure that energy
efficiency generally increases with the top temperature of cycle. The result confirmed the
fact that hybrid cycles with additional higher temperature heat sources will generally have
a higher energy efficiency than the corresponding single heat source cycles without it, due
to higher top temperature of the hybrid system.
For the three solar-hybrid power system categories (vapor, gas and combined), the
combined cycle has the highest efficiency (43-52%). The efficiencies of most of hybrid
steam cycles are 10-40%, and of hybrid gas cycles are 20-40%. So the solar hybrid
combined cycle is the most efficiency category.
The most efficient configuration among vapor cycle is Solar-aided three-stage regenerative
Rankine system with solar heat replacing the low-pressure feed water heater [28], which
was reported to have an efficiency of 46.98%. The second most efficient is ‘Thermal power
stations with solar energy’ [32] that was reported to have an efficiency of 45.2% The
‘Novel hybrid solar heating, cooling and power generation system’ [22] was reported to
have a nominal efficiency of 58.0%, but this definition of this efficiency includes the

113
produced heating, cooling and hot water energy as the “useful” power output, while the
others use only power generation as the “useful” power output.
The most efficient configurations among hybrid gas cycles are ‘Solar hybrid Steam
Injected Gas Turbine cycle (STIG) [44] which was reported to have an efficiency of 41.4%,
and ‘Solarized gas turbine prototype plant: Heron H1 unit located in Seville’ [49] which
was reported to have an efficiency of 40.4%. These are the only two hybrid gas cycles that
were reported to have efficiency above 40%.
The most efficient configuration of hybrid combined gas cycles is the ‘Integrated solar
combined cycle system (ISCCS)’ [60] which was reported to have an energy efficiency of
68.6% without thermal storage and 68.1% with thermal storage. According to the reference,
the reason why the efficiency with thermal storage was lower than that without it is that
adding storage required larger solar field to charge the storage, which led to higher parasitic
power. Although adding thermal storage reduced energy efficiency, it, however, led to
higher solar share. The second most efficient one is “First Integrated Solar Combined Cycle
System in Algeria” [66] which was reported to have an efficiency of 67%.
The most efficient configuration of non-solar hybrid cycles reviewed here is the ‘Nuclear-
assisted NGCC (natural-gas combined-cycle)’ [95] which was reported to have an
efficiency of 59.1%. Some systems ([94,103,105]) were reported to have nominal
efficiencies of over 70%, but their energy efficiency definition includes both power and
heat as useful outputs, not electricity generation efficiency.

114
The best system for solar-aided hybrid system considering all aspects including efficiency,
solar share and cost appears to be the ‘‘Integrated solar combined cycle system (ISCCS)’
[60], with an overall efficiency of over 68% and solar share of about 17%. The levelized
cost of electricity was stated to be $0.049-0.053/kWh (in year 2004 dollars), one of the
lowest ones.
The best system for non-solar-aided hybrid system considering all aspects including
efficiency of the system, power output, efficiency improvement over single heat source
system and cost seems to be the ‘Nuclear-assisted NGCC’ (natural-gas combined-cycle)
[95], with an efficiency of 59.1%, high capacity (382 MW), large efficiency improvement
due to the hybridization (14.1%) over the nuclear-power-only plant, and a low cost of
electricity ($0.0644±0.0093/kWh in year 2007 dollars). The second promising one is
‘Combined cycle power plant with integrated low temperature heat (LOTHECO)’ [108]
having an efficiency of 57.6%.
Hybrid power cycles have the ability of preserving fuel usage and saving carbon emissions.
For example, a solar hybrid gas turbine electric power system (Mercury 50) [47] was
reported to have the ability to save about 70 kg CO2/MWh with an annual solar share of
10%, and a Nuclear-assisted NGCC (natural-gas combined-cycle) [95] was reported to
have the ability to reduce 46.3% of CO2 emissions compared with a fuel-only NGCC, with
59.1% of total energy input supplied by nuclear. Also, some hybrid systems were able to
capture nearly all carbon emissions, such as the novel combined cycle integrating coal

115
gasification, solid oxide fuel cell, and chemical looping combustion [106] and a CO2-
capturing hybrid power-generation system [41-43].
Therefore, beyond the efficiency, it is noteworthy that use of solar, nuclear and geothermal
in the hybrid system has the important advantage of lower emissions and preservation of
depletable energy resources.
According to EIA [111], the levelized electricity cost (LEC) of all of the power generation
methods using fossil fuel is between $72.6/MWh for advanced combined cycle burning
natural gas and $144.4/MWh for advanced coal power plant with carbon capture and
storage (CCS). The economic analyses for hybrid power generation systems have shown
that the LEC of some of them are not very high relative to conventional and some may
even be competitive already. For example, for solar aided biomass power generation
systems with parabolic trough field [23], the predicted LEC was $80/MWh, and for a
hybrid solar gas-turbine power plant (HSGTPP) [53], the LEC was predicted to be
$104/MWh. The LEC of most solar hybrid systems, however, is still found to be high at
least two times higher than that of advanced combined cycle, so there is still much room
for cost reduction as the cost of solar collector goes down with technology advance
suggested in [112].
Most of the studies done in this area are restricted to simulations and not experiments, and
thus the results may not adequately reflect reality.

116
There are also some types of hybrid systems that could be used for water desalination,
hydrogen production or heating/cooling alongside with power.
Despite the listed advantages of hybrid power systems, a decision to use them must also
take into account a number of important issues in which hybrid systems will also have
disadvantages, the main ones including more complex controls, higher embodied energy,
and life-cycle issues, such as the disposal of additional equipment. Moreover, hybrid power
systems that use renewable energy of intermittent and unsteady nature may require energy
storage and typically conventionally fueled backup systems or power, and tend to lower
the performance and increase the price in any case. All of these issues are
thermodynamically sensible and must be considered carefully in the analysis and practical
feasibility assessment of hybrid power plants, which generally are predicted to deliver
significant improvements in efficiency at a reasonable cost and show good promise.

117
Fig. 3-22 Hybrid power plant energy efficiency at design point as a function of the
highest temperature of working fluid in the cycle
References for Chapter 3
[1] Koai K., Lior N., Yeh H., Performance analysis of a solar-powered/fuel-assisted
Rankine cycle with a novel 30hp turbine. Sol Energy 1984;(32)6:753-764.
0
10
20
30
40
50
60
70
0 500 1000 1500
Ther
mal
eff
icie
ncy
at
des
ign p
oin
t [%
]
Highest temperature in the cycle [°C]
Solar hybrid vapor cycle
Solar hybrid gas cycle
Solar hybrid combined cycle
Non-solar hybrid cycle

118
[2] Lior N., Koai K., Solar‑Powered/Fuel‑Assisted Rankine Cycle Power and Cooling
System: Simulation Method and Seasonal Performance. J Sol Energ-T ASME
1984;106:142‑152.
[3] Lior N., Koai K., Solar‑Powered/Fuel‑Assisted Rankine Cycle Power and Cooling
System: Sensitivity Analysis. J Sol Energ-T ASME 1984;106:447‑456.
[4] Lior N., Solar energy and the steam Rankine cycle for driving and assisting heat
pumps in heating and cooling modes. Energ Convers 1977;(16)3:111-123.
[5] Sherburne D., Lior N., Evaluation of minimum fuel consumption control strategies in
the solar‑powered fuel‑assisted hybrid Rankine cycle. Proceedings ASES Ann. Meeting
1986:300-303.
[6] Kolb J., Evaluation of Power Production from the Solar Electric Generating Systems
at Kramer Junction:1988 to 1993. Proceedings of the Solar Engineering 1995; ASME
Press New York:1:499-504.
[7] Cohen G.H., Kearny O., Improved Parabolic Trough Solar Electric Systems Based on
the Segs Experience. Proceedings of the American Solar Energy Society Conference
1994:147-150.

119
[8] Jensen C., Price H., Kearney D., The SEGS Power Plants:1988 Performance. 1989
ASME International Solar Energy Conference San Diego CA.
[9] Mills D., Advances in solar thermal electricity technology, Sol Energy 2004;76:19-
31.
[10] Tian Y., Zhao C.Y., A review of solar collectors and thermal energy storage in solar
thermal applications, Appl Energ 2013;104:538-553.
[11] Kalogirou S.A., Solar thermal collectors and applications, Prog Energ Combust
2004;30:231-295.
[12] Avila-Marin A.L., Fernandez-Reche J., Tellez F.M., Evaluation of the potential of
central receiver solar power plants: Configuration, optimization and trends, Appl Energ
2013;112:274-288.
[13] Fernandez-Garcıa A., Zarza E., Valenzuela L., Perez M., Parabolic-trough solar
collectors and their applications, Renew Sust Energ Rev 2010;14:1695-1721.
[14] Kuravi S., Trahan J., Goswami D.Y., Rahman M.M., Stefanakos E.K., Thermal
energy storage technologies and systems for concentrating solar power plants, Prog Energ
Combust 2013;39:285-319.

120
[15] Peterseim J.H., White S., Tadros A., Hellwig U., Concentrating solar power hybrid
plants-Enabling cost effective synergies, Renew Energ 2014;67:178-185.
[16] Lentz A., Almanza R., Solar-geothermal hybrid system, Appl Therm Eng
2006;26:1537-1544.
[17] Tempesti D., Manfrida G., Fiaschi D., Thermodynamic analysis of two micro CHP
systems operating with geothermal and solar energy, Appl Energ 2012;97:609-617.
[18] Ruzzenenti F., Bravi M., Tempesti D., Salvatici E., Manfrida G., Basosi R.,
Evaluation of the environmental sustainability of a micro CHP system fueled by low-
temperature geothermal and solar energy, Energ Convers Manage 2014;78:611-616.
[19] Goswami D.Y., Xu F., Analysis of a New Thermodynamic Cycle for Combined
Power and Cooling Using Low and Mid Temperature Solar Collectors, J Sol Energ-T
ASME 1999;121:91-97.
[20] Astolfi M., Xodo L., Romano M., Macchi E., Technical and economical analysis of
a solar-geothermal hybrid plant based on an Organic Rankine Cycle. Geothermics
2011;40:58-68.

121
[21] Zhou C., Doroodchi E., Moghtaderi B., An in-depth assessment of hybrid solar-
geothermal power generation, Energ Convers Manage 2013;74:88-101.
[22] Zhai H., Dai Y.J., Wu J.Y., Wang R.Z., Energy and exergy analyses on a novel
hybrid solar heating, cooling and power generation system for remote areas. Appl Energ
2009;86:1395-1404.
[23] Hou H., Yang, Y., Hu E., Song J., Dong C., Mao J., Evaluation of solar aided
biomass power generation systems with parabolic trough field. Sci China Technol Sc
2011;54(6):1455-1461.
[24] Suresh M.V.J.J., Reddy K.S., Kolar A.K., 4-E (Energy, Exergy, Environment, and
Economic) analysis of solar thermal aided coal-fired power plants, Energy Sustain Dev
2010;14:267-279.
[25] Yang Y., Yan Q., Zhai R., Kouzani A., Hu E., An efficient way to use medium-or-
low temperature solar heat for power generation-integration into conventional power
plant, Appl Therm Eng 2011;31:157-162.
[26] Nikni I., Yaghoubi M., Transient simulation for developing a combined solar
thermal power plant, Appl Therm Eng 2012;37:196-207.

122
[27] Nikni I., Yaghoubi M., Transient analysis of integrated Shiraz hybrid solar thermal
power plant, Renew Energ 2013;49:216-221.
[28] Ying Y., Hu E.J., Thermodynamic advantages of using solar energy in the
regenerative Rankine power plant, Appl Therm Eng 1999;19:1173-1180.
[29] Hu E., Yang Y., Nishimura A., Yilmaz F., Kouzani A., Solar thermal aided power
generation, Appl Energ 2010;87:2881-2885.
[30] Odeh S., Behnia M., Morrison G., Performance evaluation of solar thermal electric
generation systems. Energ Convers Manage 2003;44(15):2425-2443.
[31] Popov D., An option for solar thermal repowering of fossil fuel fired power plants.
Sol Energy 2011;85:344-349.
[32] Pai B.R., Augmentation of thermal power stations with solar energy, Sadhana,
1991;16(1):59-74.
[33] Wu J., Hou H., Yang Y., Hu E., Annual performance of a solar aided coal-fired
power generation system (SACPG) with various solar field areas and thermal energy
storage capacity, Appl Energ 2015;157:123-133.

123
[34] Bakos G.C., Tsechelidou Ch., Solar aided power generation of a 300 MW lignite
fired power plant combined with line-focus parabolic trough collectors field, Renew
Energ 2013;60:540-547.
[35] Servert J., San Miguel G., Lopez D., Hybrid solar - Biomass plants for power
generation; technical and economic assessment. Global Nest J 2011;13(3):266-276.
[36] Giuliano S., Buck R., Eguiguren S., Analysis of Solar-Thermal Power Plants With
Thermal Energy Storage and Solar-Hybrid Operation Strategy. J Sol Energy
2011;133:031007.
[37] Larraın T., Escobar R., Vergara J., Performance model to assist solar thermal power
plant siting in northern Chile based on backup fuel consumption. Renew Energ
2010;35:1632-1643.
[38] Coelho B., Schwarzbozl P., Oliveira A. Mendes A., Biomass and central receiver
system (CRS) hybridization: Volumetric air CRS and integration of a biomass waste
direct burning boiler on steam cycle. Sol Energy 2012;86:2912-2922.
[39]Nathan G.J., Battye D.L., Ashman P.J., Economic evaluation of a novel fuel-saver
hybrid combining a solar receiver with a combustor for a solar power tower, Appl Energ
2014;113:1235-1243.

124
[40] Müller S., Brown A., Ölz S., Renewable Energy-Policy Considerations for
Deploying Renewables, IEA Publications, Paris, 2011.
[41] Pak P. S., A CO2-capturing hybrid power-generation system with highly efficient
use of solar thermal energy. Energy 1997;22(2/3):295-299.
[42] Pak P. S., Hatikawa T., Suzuki Y., A hybrid power generation system utilizing solar
thermal energy with CO2 recovery based on oxygen combustion method. Energ Convers
Manage 1995;36(6-9):823-826.
[43] Pak P. S., Hatikawa T., Suzuki Y., Characteristics and Economic Evaluation of a
CO2-Capturing Solar Thermal Hybrid Power Generation System with Heat Storage,
Electr Eng JPN, 1999;126(4):21-29.
[44] Livshits M., Kribus A., Solar hybrid steam injection gas turbine (STIG) cycle. Sol
Energy 2012;86:190-199.
[45] Gou C.H., Cai R.X., Hong H., A novel hybrid oxy-fuel power cycle utilizing solar
thermal energy. Energy 2007;32:1707-1714.

125
[46] Bernardos E., López I., Rodríguez J., Abánades A., Assessing the potential of hybrid
fossil-solar thermal plants for energy policy making: Brayton cycles, Energ Policy,
2013;62:99-106.
[47] European Communities, Solar hybrid gas turbine electric power system (Final
Publishable Report). 2005;31.
[48] Buck R., Friedmann S., Solar-Assisted Small Solar Tower Trigeneration Systems. J
Sol Energy 2007;129:349-354.
[49] Schwarzbozl P., Buck R., Sugarmen C., Ring A., Crespo M., Altwegg P., Enrile J.,
Solar gas turbine systems: Design, cost and perspectives. Sol Energy 2006;80:1231-1240.
[50] Fisher U., Sugarmen C., Ring A., Sinai J., Gas Turbine ‘‘Solarization’’-
Modifications for Solar/Fuel Hybrid Operation. J Sol Energ-T ASME 2004;126(3):872-
878.
[51] Garcia P., Ferriere A., Flamant G., Costerg P., Soler R., Gagnepain B., Solar Field
Efficiency and Electricity Generation Estimations for a Hybrid Solar Gas Turbine Project
in France. J Sol Energ 2008;130:014502.

126
[52] Aichmayer L., Spelling J., Laumert B., Fransson T., Micro Gas-Turbine Design for
Small-Scale Hybrid Solar Power Plants. J Eng Gas Turb Power 2013;135:113001.
[53] Spelling J., Laumert B., Fransson T., Optimal Gas-Turbine Design for Hybrid Solar
Power Plant. J Eng Gas Turb Power 2012;134:092301.
[54] Sandoz R., Spelling J., Laumert B., Fransson T., Air-Based Bottoming-Cycles for
Water-Free Hybrid Solar Gas-Turbine Power Plants. J Eng Gas Turb Power
2013;135:101701.
[55] Heller P., Pfander M., Denk T., Tellez F., Valverde A., Fernandez J., Ring A., Test
and evaluation of a solar powered gas turbine system. Sol Energy 2006;80:1225-1230.
[56] Barigozzi G., Bonetti G., Franchini G., Perdichizzi A., Ravelli S., Thermal
performance prediction of a solar hybrid gas turbine. Sol Energy 2012;86:2116-2127.
[57] ISCC Hassi R'mel, NREL.
http://www.nrel.gov/csp/solarpaces/project_detail.cfm/projectID=44 <Nov. 1, 2015>
[58] Reddy V.S., Kaushik S.C., Tyagi S.K., Exergetic analysis of solar concentrator aided
natural gas fired combined cycle power plant. Renew Energ 2012;39:114-125.

127
[59] Gunasekaran S, Mancini N.D., El-Khaja R., Sheu E.J., Mitsos A., Solar-thermal
hybridization of advanced zero emissions power cycle. Energy 2014;65:152-165.
[60] Dersch J., Geyer M., Herrmann U., Jones S., Kelly B., Kistner R., Ortmanns W.,
Pitz-Paal R., Price H., Trough integration into power plants—a study on the performance
and economy of integrated solar combined cycle systems. Energy 2004;29:947-959.
[61] Kane M., Favrat D., Ziegler K., Allani Y., Thermoeconomic Analysis of Advanced
Solar-Fossil Combined Power Plants. Int J Appl Therm 2000;3(4):191-198.
[62] Bakos G.C., Parsa D., Technoeconomic assessment of an integrated solar combined
cycle power plant in Greece using line-focus parabolic trough collectors. Renew Energ
2013;60:598-603.
[63] Nezammahalleh H., Farhadi F., Tanhaemami M., Conceptual design and techno-
economic assessment of integrated solar combined cycle system with DSG technology.
Sol Energy 2010;84:1696-1705.
[64] Baghernejad A., Yaghoubi M., Exergy analysis of an integrated solar combined
cycle system. Renew Energ 2010;35:2157-2164.

128
[65] Hosseini R., Soltani M., Valizadeh G., Technical and economic assessment of the
integrated solar combined cycle power plants in Iran. Renew Energ 2005;30:1541-1555.
[66] Behar O., Kellaf A., Mohamedi K., Belhamel M., Instantaneous performance of the
first Integrated Solar Combined Cycle System in Algeria. Energ Proced 2011;6:185-193.
[67] Turchi C.S., Ma Z., Co-located gas turbine/solar thermal hybrid designs for power
production. Renew Energ 2014;64:172-179.
[68] Silva M., Blanco M., Ruiz V., Integration of solar thermal energy in a conventional
power plant: The Colon solar project, J Phys IV France 1999;9(Pr3)189-194.
[69] Horn M., Fuhring H., Rheinlander J., Economic analysis of integrated solar
combined cycle power plants A sample case: The economic feasibility of an ISCCS
power plant in Egypt. Energy 2004:29:935-945.
[70] Montes M.J., Rovira A., Muñoz M., Martínez-Val J.M., Performance analysis of an
Integrated Solar Combined Cycle using Direct Steam Generation in parabolic trough
collectors. Appl Energ 2011;88:3228-3238.

129
[71] Montes M.J., Rovira A., Muñoz M., Martínez-Val J.M., Proposal of an integrated
solar combined cycle system using direct steam generation technology. In: Proc of 15th
int solar PACES symp on sol therm conc technol, Berlin, Germany; 2009.
[72] Buck R., Brauning T., Denk T., Pfander M., Schwarzbozl P., Tellez F., Solar-Hybrid
Gas Turbine-based Power Tower Systems (REFOS). J Sol Energ 2002;124:2-9.
[73] Barigozzi G., Bonetti G., Franchini G., Perdichizzi A., Ravelli S., Solar Hybrid
Combined Cycle Performance Prediction Influence of Gas Turbine Model and Spool
Arrangements. J Eng Gas Turb Power 2012;134:121701.
[74] Kribus A., Zaibel R., Carey.D., Segal.A., Karni.J., A solar-driven combined cycle
power plant. Sol Energy 1998;62(2):121-129.
[75] High Temperature Gas Cooled Reactor Fuels and Materials, INTERNATIONAL
ATOMIC ENERGY AGENCY VIENNA, 2010, http://www-
pub.iaea.org/MTCD/publications/PDF/TE_1645_CD/PDF/TECDOC_1645.pdf
[76] Forsberg C., Hybrid systems to address seasonal mismatches between electricity
production and demand in nuclear renewable electrical grids. Energ Policy 2013;62:333-
341.

130
[77] Sprouse C. III, Depcik C., Review of organic Rankine cycles for internal combustion
engine exhaust waste heat recovery. Appl Therm Eng 2013;51:711-722.
[78] Dunbar W. R., Lior N., Gaggioli R., Combining fuel cells with fuel-fired power
plants for improved exergy efficiency. Energy 1991;16(10)1259-1274.
[79] Dunbar W. R., Lior N., Gaggioli R., The effect of the fuel-cell unit size on the
efficiency of a fuel-cell-topped Rankine Cycle. J Energ Resour-ASME 1993;115:105-
107.
[80] Buonomano A., Calise F., d’Accadia M.D., Palombo A., Vicidomini M., Hybrid
solid oxide fuel cells-gas turbine systems for combined heat and power: A review. Appl
Energ 2015;156:32-85.
[81] Zabihian F., Fung A., A review on modeling of hybrid solid oxide fuel cell systems.
Int J Eng 2009;3:85-119.
[82] McPhail S.J., Aarva A., Devianto H., Bove R., Moreno A., SOFC and MCFC:
commonalities and opportunities for integrated research. Int J Hydrogen Energ
2011;36(16):10337-10345.

131
[83] Zhang X., Chan S.H., Li G., Ho H.K., Li J., Feng Z., A review of integration
strategies for solid oxide fuel cells. J Power Sources 2010;195:685-702.
[84] Knizley A.A., Mago P.J., Smith A.D., Evaluation of the performance of combined
cooling, heating, and power systems with dual power generation units. Energ Policy
2014;66:654-665.
[85] Bruhn M., Hybrid geothermal-fossil electricity generation from low enthalpy
geothermal resources: geothermal feedwater preheating in conventional power plants.
Energy 2002;27:329-346.
[86] Bruhn M., Erbas K., Huenges E., Efficient geothermal-fossil hybrid electricity
generation: geothermal feedwater preheating in conventional power plants. Bulletin
d’Hydrogdoiogie 1999;17:403-413.
[87] Borsukiewicz-Gozdur A., Dual-fluid-hybrid power plant co-powered by low-
temperature geothermal water. Geothermics 2010;39:170-176.
[88] Pihl E., Heyne S., Thunman H., Johnsson F., Highly efficient electricity generation
from biomass by integration and hybridization with combined cycle gas turbine (CCGT)
plants for natural gas. Energy 2010;35:4042-4052.

132
[89] Lior N., Energy, exergy and thermoeconomic analysis of the effects of fossil-fuel
superheating in nuclear power plants. ENERG CONVERS MANAGE 1997;38(15-
17):1585-1593.
[90] Alsairafi A., Energetic and exergetic analysis of a hybrid combined nuclear power
plant. Int J Energy Res 2012;36:891-901.
[91] Alsairafi A.A., Effects of ambient conditions on the thermodynamic performance of
hybrid nuclear-combined cycle power plant. Int J Energy Res 2013;37:211-227.
[92] Sayyaadi H., Sabzaligol T., Comprehensive exergetic and economic comparison of
PWR and hybrid fossil fuel-PWR power plants. Energy 2010;35:2953-2964.
[93] Forsberg C., Strategies for a Low-Carbon Electricity Grid With Full Use of Nuclear,
Wind and Solar Capacity to Minimize Total Costs. MIT-ANP-TR-162, August 2015, For
Public Distribution. http://energy.mit.edu/wp-content/uploads/2015/08/MIT-ANP-TR-
162.pdf
[94] McDonald C.F., Mobile hybrid (nuclear oil fired) gas turbine cogeneration power
plant concept. Appl Therm Eng 1998;18(6):353-368.

133
[95] Jeong Y.H., Kazimi M.S., The synergetic effects of nuclear-assisted gas turbine
power cycles. Nucl Technol 2007;160(2):233-243.
[96] Dolz V., Novella R., García A., Sánchez J., HD Diesel engine equipped with a
bottoming Rankine cycle as a waste heat recovery system. Part 1: Study and analysis of
the waste heat energy. Appl Therm Eng 2012;36:269-278.
[97] Serrano J.R., Dolz V., Novella R., Garcia A., HD Diesel engine equipped with a
bottoming Rankine cycle as a waste heat recovery system. Part 2: Evaluation of
alternative solutions. Appl Therm Eng 2012;36:279-287.
[98] He M., Zhang X., Zeng K., Gao K., A combined thermodynamic cycle used for
waste heat recovery of internal combustion engine. Energy 2011;36:6821-6829.
[99] Yang M., Yeh R., Thermodynamic and economic performances optimization of an
organic Rankine cycle system utilizing exhaust gas of a large marine diesel engine. Appl
Energ 2015;149:1-12.
[100] Kostowski W.J., Usón S., Comparative evaluation of a natural gas expansion plant
integrated with an IC engine and an organic Rankine cycle, Energ Convers Manage
2013;75:509-516.

134
[101] Wei M., Fang J., Ma C., Danish S.N., Waste heat recovery from heavy-duty diesel
engine exhaust gases by medium temperature ORC system. Sci China Technol Sc
2011;54(10):2746-2753.
[102] Vaja I., Gambarotta A., Internal Combustion Engine (ICE) bottoming with Organic
Rankine Cycles (ORCs). Energy 2010;35:1084-1093.
[103] El-Awad M., Siraj A., A Combined Diesel-Engine Gas-Turbine System for
Distributed Power Generation. In: International Conference on Chemical, Biological and
Medical Sciences (ICCBMS'2012) August 25-26, 2012 Kuala Lumpur (Malaysia).
[104] Yamada N., Mohamad M., Efficiency of hydrogen internal combustion engine
combined with open steam Rankine cycle recovering water and waste heat. Int J
Hydrogen Energ 2010;35:1430-1442.
[105] Al-Sulaiman F.A., Dincer I., Hamdullahpur F., Energy analysis of a trigeneration
plant based on solid oxide fuel cell and organic Rankine cycle. Int J Hydrogen Energ
2010;35:5104-5113.
[106] Chen S, Lior N., Xiang W., Coal gasification integration with solid oxide fuel cell
and chemical looping combustion for high-efficiency power generation with inherent
CO2 capture. Appl Energ 2015;146(15):298-312.

135
[107] Kim Y.M., Kim C.G., Favrat D., Transcritical or supercritical CO2 cycles using
both low- and high-temperature heat sources. Energy 2012;43:402-415.
[108] Kakaras E., Doukelis A., Leithner R., Aronis N., Combined cycle power plant with
integrated low temperature heat (LOTHECO). Appl Therm Eng 2004;24:1677-1686.
[109] Deng S., Hynes R., Drover B., Hybrid Power Generation Plant for CO2 Capture. J
Eng Gas Turb Power 2014;136:052001.
[110] Concentrating Point Focus Solar Thermal Power Generation,
http://www.gesyw.com/pdf/CPF%20Solar%20Thermal%20Power.pdf
[111 ] Levelized Cost and Levelized Avoided Cost of New Generation Resources in the
Annual Energy Outlook 2015, EIA, June 2015,
http://www.eia.gov/forecasts/aeo/pdf/electricity_generation.pdf
[112] Renewables 2015 Global Status Report, EIA, 2015, http://www.ren21.net/wp-
content/uploads/2015/07/REN12-GSR2015_Onlinebook_low1.pdf

136
CHAPTER 4
THERMODYNAMIC ANALYSIS OF THERMAL HYBIRD
POWER GENERATION SYSTEMS BASED ON RANKINE
CYCLES
4.1. Hybrid power generation systems based on the simple
Rankine cycle
Many types of hybrid power plants have been developed and analyzed, type by type (e.g.
[1]), and some were built for testing and commercial operation [2]. Little work, however,
was done to develop the generalized theory, which can be applicable to all (or many) types
of hybrid power plants, or at least one type of power plants but without involving specific
operation parameters. The main objective of this dissertation is therefore to develop some
generalized quantitative theories to fill this gap and to help design various hybrid power
plants.
The method we used here is step-wise: to first analyze the major, most commonly used,
hybrid power generation systems thermodynamically, without involving specific operation
parameter values. In this way, some generalized theory that is at least applicable to this
type of system can be developed. The second step is to perform such an analysis for all the
major types of power generation systems (e.g. Rankine, Brayton, Combined Cycles, and
their main variants) The third step is to find commonalities between these theories (if any).

137
The fourth and last step is to develop the sought generalized theory based on these
commonalities. As shown below 4.2.4, this approach indeed worked and led to the
discovery of such a theory.
Based on the major types of power generation methods, the hybrid power generation
systems based on the Rankine cycles, Brayton cycles and the combined cycle will be
analyzed in sequence. The first, presented here, is for the hybrid systems based on Rankine
cycles, mainly used in steam and organic and other working fluid power plants.
4.1.1. Introduction of hybrid power generation systems based on the
simple Rankine cycle
The Rankine cycle is the most widely used type of power generation cycle in power plants,
especially in steam power plants. Fig. 4-1 and Fig. 4-2 show, respectively, the flow
diagrams of a very basic Rankine cycle and a correspondingly very basic hybrid Rankine
cycle, which has one additional heat source (AHS). The T-s diagram of the hybrid Rankine
cycle is shown in Fig. 4-3. Note that the “heat exchanger” in Fig. 4-2 may be part of the
economizer of the boiler in Fig. 4-1 when there is no AHS. The economizer is part of a
boiler in a steam power plant, which is used to preheat the working fluid using the
combustion gas from the boiler. In essence, an economizer is also a heat exchanger.

138
Fig. 4-1. Flow diagram of the reference (single heat source) power cycle based on the
simple Rankine cycle without additional heat sources (AHS) (Cond: condenser, CEP:
condensate extraction pump)
Fig. 4-2. Flow diagram of the hybrid power cycle based on the simple Rankine cycle with
one additional heat source (AHS) (Cond: condenser, CEP: condensate extraction pump,
AHSP: additional heat source pump, AHSC: additional heat source collection
equipment) (The heat exchanger may be part of the economizer in the reference system
when there is no AHS)

139
Fig. 4-3 The T-s diagram for the hybrid power generation systems based on the simple
Rankine cycle in Fig. 4-2
The working fluid in the power cycles can either be water as normally used in the steam
power plants, or other working fluids (most often organic) of different temperature and
pressure boiling points. Water is used in this analysis, but the general method also applies
to the other fluids.

140
In the Rankine cycle that has an AHS temperature lower than that of the boiler heat source,
the water flow from the outlet of the main pump (CEP: condensate extraction pump) is
heated by the AHS before being heated by the boiler.
A “heat exchanger” (Fig. 4-2) is not always needed, e. g. when solar heat is used as the
AHS, it can be directly added to the working fluid. We call the basic Rankine cycle as the
“main cycle”, and the one containing the AHS, such as solar collector as the “AHS cycle”.
Since the 2-heat sources flow diagram (Fig. 4-2) obviously becomes the same as the
reference case (Fig. 4-1) if there is no AHS input, it is sufficient to analyze the 2-heat
sources case.
4.1.2. Thermodynamic analysis of hybrid power generation systems
based on the simple Rankine cycle
The thermodynamic analysis uses the following assumptions:
The kinetic and potential energy of the fluids are ignored in such power cycle analyses due
to their small magnitude and impact on the system performance relative to the heat-caused
enthalpy changes in the fluids. This will be demonstrated in the simulation following the
thermodynamic analysis.
Since the composition of the working fluid almost doesn’t change, the enthalpy of the
working fluid can be assumed to be that of pure water and its chemical exergy can be
neglected.

141
The enthalpy difference between the outlet and inlet working fluid flows is thus equal to
the heat input or work output.
The pressure drops in the pump, heat exchangers and all pipes are not taken into account
but the pressure at each state point in the hybrid system is assumed to be the same as in the
reference system, respectively. In practice, the pressure of the working fluid decreases
during heat addition due to friction. Since the pressure drops in heat exchangers are only a
few percent of the inlet pressure, they can be assumed to be zero in this first-step
thermodynamic analysis. Furthermore, the following analysis shows that the results of the
sensitivity analysis is valid even if the pressure drop is accounted for.
Each component, including the heat exchangers, is adiabatic with respect to its
surroundings, (i.e., there is no heat loss to the environment). Since the heat loss is generally
easily reducible and usually only a small fraction of the heat duty of the heat exchangers,
most early-stage design processes ignore these heat losses.
The mechanical efficiencies of the pump and the steam turbine are 100%.
The isentropic efficiencies (which are different from mechanical efficiencies) of the pump
and the steam turbine are constant and do not change with the heat addition rate or
temperature of the AHS.
To facilitate the future thermodynamic analysis process, the energy conversion efficiency
of the heat source (HS), or just called the “HS energy efficiency”, is defined as

142
ADDHS
HS
,Q
Q (4.1)
where HSQ [kW] is the energy input rate of the heat source to the system (for example,
AHSQ for the AHS) and ADDQ [kW] is the heat addition rate absorbed by the working fluid
from the heat source (for example, 3 2H H in Fig. 4-2).
HS is the fraction of the heat
from the heat source that is received by the working fluid.
The next step is to find the energy efficiency and exergy efficiency of the hybrid system
and the reference system, respectively. Based on the enthalpy balance of the boiler and the
heat exchanger (Fig. 4-2), the enthalpy increase of the working fluid during the heat
addition process is, respectively,
ADD w 4,f 3 ,mQ h h (4.2)
ADD,AH w 3S 2 ,mQ h h (4.3)
in which wm [kg/s] is the mass flow rate of the working fluid (water).
When solar energy is used as the AHS, ADD,AHS solQ Q and HS is
sc defined in Eq.
(2.6).
Using the assumptions listed at the beginning of Section 4.1.2 and based on Eqs (2.2) and
(4.1)-(4.3), the energy efficiency of the hybrid system, h , is

143
w 4 5 2 1 4 5 2 1
h4 3 3 2f ADD AHS
B AHS
,LHV /
m h h h h h h h h
h h h hm Q
(4.4)
in which w 4 3
B
f LHV
m h h
m
is the boiler efficiency and
AHS is the energy conversion
efficiency of the AHS, both of which were defined in Eq. (4.1). Note that in practice the
isentropic efficiencies of the pump and the steam turbine are used to calculate the outlet
specific enthalpies of the pump and the steam turbine, 5h and
2h , respectively. These
isentropic efficiency terms thus are not explicitly shown in Eq. (4.4).
Assuming the ambient temperature is 0T and the AHS temperature is
AHST , the exergy
efficiency of the hybrid system, h , based on Eq. (2.8), is
w 4 5 2 1 4 5 2 1
h4 3 3 2f f AHS AHS
f AHS
B AHS
.m h h h h h h h h
h h h hm b Q
(4.5)
If there is no AHS input in Fig. 4-2, 3 2h h , we will arrive at the general form of energy
efficiency of the simple Rankine cycle system showed in Fig. 4-1 as
4 5 2 1
04 2
B
,h h h h
h h
(4.6)

144
and the exergy efficiency will be
4 5 2 1
04 2
f
B
.h h h h
h h
(4.7)
The next step is to compare the energy and exergy efficiencies of the hybrid system and
the reference system. To compare the hybrid and reference system, the top temperature of
each system is kept the same, i.e. 4T in Fig. 4-2 is the same as
3T in Fig. 4-1. Considering
the assumption that there is no pressure drop in the system (the pressure drop was
considered in the simulation, though, and the simulation results confirmed that the
assumption could be made in the equations’ derivation here) and the fact that the specific
enthalpy of the working fluid is the function of only temperature and pressure, i.e.
,h h T p , the specific enthalpy at each state point in the reference system will be the
same as in the hybrid system. It further indicates that the specific enthalpy at each state
point in the hybrid system (1h ,
2h , 4h and
5h ) will remain constant even if 3h changes.
Based on Eqs (4.4) and (4.6), the difference between the energy efficiency of the hybrid
system and the reference system is thus
3 2 AHS B
h 0 4 5 2 1
4 3 3 2B AHS 4 2
B AHS
.h h
h h h hh h h h
h h
(4.8)

145
It can thus be concluded that
h 0 AHS B for , (4.9)
h 0 AHS B for , (4.10)
h 0 AHS B for . (4.11)
This indicates that for the same enthalpy states 1h to
5h in the hybrid and reference
systems, the energy efficiency of the hybrid system is higher than that of the reference
single heat source system if and only if the energy conversion efficiency of the AHS is
larger than that of the boiler. Considering that the efficiency of the boiler, B , was
increased over centuries, leaving little room for further improvement, Eq. (4.11) suggests
that the system efficiency can be increased by adding an addition heat source that has a
higher energy conversion efficiency. It is worth noting that, even if AHS f , the hybrid
systems still permit addition of lower temperature AHS, thus making good use of
renewable and other heat sources, with all associated advantages, but without a prohibitive
efficiency penalty, especially from the perspective of exergy usage as will be shown below.
Based on Eqs (4.5) and (4.7), the difference between the exergy efficiency of the hybrid
system and the reference system is

146
f AHS3 2
B AHS
h 0 4 5 2 1
4 3 3 2f AHS 4 2
B AHS
.
h h
h h h hh h h h
h h
(4.12)
Define the exergy conversion efficiency of the boiler and the AHS, respectively, as
B
B
f
,
(4.13)
AHS
AHS
AHS
.
(4.14)
Equations (4.5) and (4.7) can thus be written, respectively, as
4 5 2 1
h4 3 3 2
B AHS
,h h h h
h h h h
(4.15)
4 5 2 1
04 2
B
,h h h h
h h
(4.16)
which have the similar form as Eqs (4.4) and (4.6), except that the energy conversion
efficiencies are replaced by the corresponding exergy conversion efficiencies defined in
Eqs (4.13) and (4.14).

147
Equation (4.12) will also have the similar form as Eq. (4.8) as
3 2 AHS B
h 0 4 5 2 1
4 3 3 2B AHS 4 2
B AHS
.h h
h h h hh h h h
h h
(4.17)
It can thus be concluded that
h 0 AHS B for , (4.18)
h 0 AHS B for , (4.19)
h 0 AHS B for . (4.20)
This indicates that for the same enthalpy states 1h to
5h in the hybrid and reference
systems, the exergy efficiency of the hybrid system is higher than that of the reference
single heat source system if and only if the exergy conversion efficiency of the AHS is
larger than that of the boiler. It could also be seen that while the energy efficiency has
nothing to do with the temperature of the heat source HST , the exergy efficiency is
influenced by HST if the exergy factor changes with the temperature of the heat source,
such as for a heat flow. For a given boiler, fb and LHV of the fuel and the boiler efficiency
B are all constant. The ambient temperature 0T is also relatively steady. So we can see
from Eq. (4.5) that the exergy efficiency of hybrid system decreases with AHS . This

148
suggests that we can increase the exergy efficiency by decreasing AHS . For example, the
temperature of the AHS when heat is used as the AHS should be as low as possible, given
that other operation parameters, such as the top temperatures of the cycles, are fixed.
In conclusion, for the power generation systems based on the simple Rankine cycle and for
the same enthalpy states 1h to
5h in the hybrid and reference systems, the energy (exergy)
efficiency of the hybrid system is higher than that of the reference single heat source system
if and only if the energy (exergy) conversion efficiency of the AHS is larger than that of
the boiler. Also, increasing the AHS energy conversion efficiency will increase both the
energy and exergy efficiency of the hybrid system, while decreasing the exergy factor of
the AHS (temperature when the AHS is heat) will only increase the exergy efficiency but
not the energy efficiency of the hybrid system.
4.1.3. Generalization to other types of heat sources for hybrid power
generation systems based on the simple Rankine cycle
The above analysis is for the hybrid simple Rankine cycle system shown in Fig. 4-2 in
which the heat source of reference system is fuel in the boiler and the additional heat source
is in the form of heat, such as solar heat, waste heat or geothermal heat. It, however, could
be generalized, considering that the additional heat source (AHS) can come from either
fuel combustion or other sources, and the higher temperature heat source (HTHS) which is
fuel used in the boiler in the studied hybrid simple Rankine cycle system doesn’t need to

149
be fuel, but could be in the form of heat, such as solar heat collected at higher temperature
(higher than that of the AHS).
When the heat source (whether it is the AHS or the HTHS) is in the form of heat, the exergy
conversion efficiency of the heat source (HS) that is at temperature THS, HS , is
HSHS
0
HS
,
1T
T
(4.21)
based on Eqs (4.14) and (2.10). 0T is the dead state temperature.
When the heat source (whether it is the AHS or the HTHTS) is in the form of fuel, the
exergy conversion efficiency of the heat source (HS),HS , is
HS
HSf
,
LHV
b
(4.22)
based on Eqs (4.13) and (2.9).
For either type of heat source, the energy conversion efficiency of the heat source HS is
determined by Eq. (4.1).
Therefore, follow the same procedure as section 4.1.2, it can be easily concluded that
h 0 AHS HTHS for , (4.23)

150
h 0 AHS HTHS for , (4.24)
h 0 AHS HTHS for , (4.25)
and
h 0 AHS HTHS for , (4.26)
h 0 AHS HTHS for , (4.27)
h 0 AHS HTHS for , (4.28)
in which the energy and exergy conversion efficiency of the AHS and HTHS should be
calculated, respectively, by
AH
AS
HS
AHS
,Q
H
(4.29)
HTHS
HTHS
HTHS
,Q
H
(4.30)
AHS AHS
AH
AHS
HSS A
,H
B
(4.31)
HTHS HTHS
HTHS
HTHS HTHS
,B
H
(4.32)

151
in which AHSH and
HTHSH are the enthalpy increase of the working fluid heated by
the AHS and HTHS, respectively; AHSQ and
HTHSQ are the energy input from the AHS
and HTHS to the power generation system, respectively; AHSB and
HTHSB are the exergy
input from the AHS and HTHS, respectively to the power generation system.
4.1.4. Sensitivity analysis of the hybrid power generation systems
based on the simple Rankine cycle, with respect to the AHS
In this section we study the effects of the AHS on the efficiencies of the hybrid systems
(Eqs (4.23)-(4.28)). In this analysis it is assumed that the turbine inlet temperature (TIT,
4T in Fig. 4-2) and turbine outlet pressure (5p ), as well as the condensing temperature
(1T ), condensing pressure (
1p ) and pump pressure (2p ), are kept constant when AHSQ or
AHST changes.
Effect of the heat addition rate of the additional heat source, AHSQ , on the
energy efficiency of the hybrid power generation systems based on the simple
Rankine cycle, h .
To study the effect of the heat addition rate of the additional heat source, AHSQ , on the
energy efficiency of the hybrid power generation systems based on the simple Rankine
cycle, h , we examine the partial derivative of the energy efficiency of the hybrid system,
h , with respect to the heat addition rate of the AHS, AHSQ . By examining the first and
second order partial derivatives (the shapes of the curves), the results can be used to study

152
the hybrid system behavior and give guidance on system designing. For example, when the
curve is upward and concave, it can be inferred that the objective function increases more
strongly with the variable and will have a larger influence on the objective function when
it is small. When the curve is downward and concave, it can be inferred that the variable
has less influence on the objective function when it is small, and can be treated as a less
important factor than other variables that has larger impact on the objective function. When
there is a local maximum point on the curve, the system should be designed around that
point to maximize the objective function, such as energy efficiency of the hybrid system.
From Eq. (4.4), the partial derivative of the energy efficiency of the hybrid system, h ,
with respect to the heat addition rate of the AHS, AHSQ , is thus
h h 3 h AHS h AHS
AHS 3 AHS in AHS
2
B w n t Be
1 11 ,
h
Q h Q q m W
(4.33)
in which inin
w
=Q
qm
[kJ/kg] is the specific total heat input to the system.
Equation (4.33) shows that h increases with AHSQ when
BAHS , and decreases with
increasing AHSQ when BAHS .
While the first-order partial derivative shows whether the objective function (h ) increases
or decreases with the variable (AHSQ ), it does not show whether the curve (
h AHS-Q ) is

153
concave1 or convex2 or straight3. Mathematically, when the first-order partial derivative is
0, there will be a local maximum point when the curve is concave and a local minimum
point when the curve is convex. Also, when the slope of the curve is negative, a concave
curve means that the objective function will decrease less with the variable at the beginning
than later while a convex curve means that the objective function will decrease more with
the variable at the beginning than later, and v.v. when the slope of the curve is positive.
The second-order partial derivative is thus needed to show more information about the
relation between the variable and the objective function and therefore help us design the
hybrid systems.
The second-order partial derivative of the energy efficiency of the hybrid system with
respect to the heat addition rate of the AHS is
22
h h AHS
2
AHS net
3
2
B
21 0.
Q W
(4.34)
Equation (4.34) shows that the h AHS-Q curve is convex unless BAHS , in which case
h doesn't change with AHSQ .
1 The curve is concave when the second partial derivative is negative, indicating there might be a maximum point.
2 The curve is convex when the second partial derivative is positive, indicating there might be a minimum point.
3 The curve is straight when the second partial derivative is 0, indicating the curve is straight.

154
Effect of the temperature of the additional heat source, AHST , on the energy
efficiency of the hybrid power generation systems based on the simple Rankine
cycle, h .
To study the effect of the temperature of the additional heat source, AHST , on the energy
efficiency of the hybrid power generation systems based on the simple Rankine cycle, h ,
we examine the partial derivate of the energy efficiency of the hybrid system, h , with
respect to the temperature of the AHS, AHST .
From Eq. (4.4), the partial derivative of the energy efficiency of the hybrid system, h ,
with respect to the temperature of the AHS, AHST , is
h h 3 h 3 h 3
AHS 3 AHS in AHS AHS net AHS AHS
2
B B
1 1 1 1.
h h h
T h T q T w T
(4.35)
AHST in this equation can be expressed by AHS 3 HET T T , with
HET defined as the
temperature difference at the cold side of the heat exchanger in Fig. 4-2. In practice, HET
is designed so that it is neither too large nor too small considering both the efficiency and
the cost of the heat exchanger. It could thus be assumed that HET is constant and doesn’t
change with AHST .
Therefore,

155
3
3 3 3,
AHS HE3 3
,p TT
h h hc
T T T
(4.36)
in which 3,p Tc [kJ/kg-K] is the specific heat at constant pressure of the working fluid (a
function of temperature as shown in Fig. 4-4) at temperature 3T , when
3T is not the boiling
temperature (b3T T ). When
b3T T , however, 3
3
h
T
cannot be defined since
3T doesn’t
change in the phase change region when 3h increases.
Equation (4.35) thus becomes
3
h h,
AHS net B AHS
2 1 1,p Tc
T w
(4.37)
when b3T T .
Since the specific heat at constant pressure is always positive, Eq. (4.37) shows that h
increases with AHST when
BAHS , and decreases with increasing AHST when
BAHS .
From Eq. (4.37), the second-order partial derivative of the energy efficiency of the hybrid
system, h , with respect to the temperature of the AHS,
AHST , is

156
3
3
3 3
2 3 2,2h h h
,2 2
AHS B AHS net B AHS net 3
22h , ,h
B AHS net B AHS net 3
1 1 2 1 1
21 1 1 1,
p T
p T
p T p T
cc
T w w T
c c
w w T
(4.38)
when b3T T . Equation (4.38) shows that the
h AHS-T curve is convex (
2
h
AH
2
S
0T
)
when BAHS and 3,
3
0p Tc
T
, or when
BAHS and 3,
3
0p Tc
T
.
To further analyze Eq. (4.38), 3,p Tc must be examined. According to the thermodynamic
properties of water, the -pc T diagram of water at 14 MPa (boiling pressure of the system
described by Fig. 4-2) is shown in Fig. 4-4 [1]. As can be seen in Fig. 4-4, 3,p Tc first
increases slowly with 3T , and then increases faster until it reaches the boiling point,
bT ,
after which 3,p Tc will decrease fast and then slowly with
3T .

157
Fig. 4-4. The specific heat at constant pressure dependency on the water temperature (at
14 MPa) [1]
From Eq. (4.38), it can thus be seen that when BAHS and
b3T T ,
2
h
2
AHS
0,T
(4.39)
since 3,p Tc increases with
3T when b3T T from Fig. 4-4.
When BAHS and
b3T T , Eq. (4.39) is also valid, since 3,p Tc decrease with
3T
when b3T T from Fig. 4-4.
The salient results from these subsections are summarized at the end in Section 4.1.4.5.

158
Effect of the heat addition rate of the additional heat source, AHSQ , on the
exergy efficiency of the hybrid power generation systems based on the simple
Rankine cycle, h .
To study the effect of the heat addition rate of the additional heat source, AHSQ , on the
exergy efficiency of the hybrid power generation systems based on the simple Rankine
cycle, h , we examine the partial derivative of the exergy efficiency of the hybrid system,
h , with respect to the heat addition rate of the AHS, AHSQ .
From Eq. (4.15), the partial derivative of the exergy efficiency of the hybrid system, h ,
with respect to the heat additional rate of the AHS, AHSQ , is
4 3 3 2HTHS AHS
h h 3 h AHS
AHS 3 AHS in 3 3 w
h HTH
HTHS AHS
S 4 3 HTHS AHS 3 2 AHSA
2
H
HS
net 3 AHSTHS HTH AHS S 3
.
h h h h
h
Q h Q b h h m
h h h h
W h h
(4.40)
Unlike the energy efficiency analysis, different types of heat sources may result in different
exergy efficiencies of the system. In this study, as in most types of thermal hybrid systems
studied before, it is assumed that the additional heat source (AHS) is from heat and the

159
higher temperature heat source (HTHS) is from burning fuel, the exergy conversion
efficiencies of which are defined in Eqs (4.21) and (4.22), respectively.
Using Eqs (4.21) and (4.22), Eq. (4.40) becomes
3 2 04 3 f
AHSh h 3 hAHS
AHS 3 AHS net 3 3
h f 0 3 2 0 AHSAHS
net AHS AHS AHS AHS 3
2
h AHS
AHSB
2
n
2
B
2
Bet
1LHV
LHV
1 11
h h Th h
Th
Q h Q W h h
T h h T T
W T T h
b
b
W
f 0 0 AHS3 2
AH
2
S AHS 3
1 ,LHV
T T Th h
T h
b
T
(4.41)
in which
3
HE3AHS 3
3 3 3 ,
1,
p T
TTT T
h h h c
(4.42)
when 3T is not the boiling temperature (
b3T T ), and
AHS
3
0,T
h
(4.43)

160
when 3T is the boiling temperature (
b3T T ).
Equation (4.41) thus becomes
3
h h AHS f 0 03 2
AHS net AHS ,
2
S
2
B AHLHV1 ,
p T
T Th h
Q W T c
b
T
(4.44)
when b3T T , and
h h AHS f 0
2
BAHS net AHSLHV1 ,
T
Q
b
W T
(4.45)
when b3T T .
The second-order partial derivative of the exergy efficiency of the hybrid system, h , with
respect to the heat additional rate of the AHS, AHSQ , is
3
3
3 3 3
22
h h AHS f 0 03 22
AHS net AHS , AHS
,h 0 0 A
3
2 2
B
2
2 3
HS AHS3 2 2
net , AHS , AHS , 3 w
2
V
22 ,
LH1
p T
p T
p T p T p T
T Th h
Q W T c T
cT T Th h
W
b
c T c T c T m
(4.46)
when b3T T , and

161
22
h h AHS f 0
2
AHS net AHS
3
2
B
21 ,
LHV
b T
Q W T
(4.47)
when b3T T .
To further analyze Eqs (4.44) and (4.46), different scenarios must be analyzed as 3T is
raised.
4.1.4.3.1. Region in which the specific heat of working fluid at T3 almost remains constant
According to Fig. 4-4, for 3T up to about 200 °C,
3,p Tc can be assumed to be constant, i.e.
3,
3
0.p Tc
T
(4.48)
In this case,
2 3 3
3 3 3
, , 3 2 , 3 23 2 AHS HE 2 HE 2
, AHS , AHS , AHS AHS AHS
1 .p T T p T
p T p T p T
c T T c T Th h T T T T T
c T c T c T T T
(4.49)
Equation (4.44) thus becomes
2
B
h h AHS f 0 HE 2 0
AHS net AHS AHS AHS
0 HE 2h AHS f
net AH
2
B S
2
LHV
1V
1 1
LH.
T T T T
Q W T T T
W
b T T T
T
b
(4.50)

162
From Eq. (4.50), it is known that h
AHS
0Q
when
HE
2
2 0AHS f
AHSB
1 0LHV
Tb T T
T
(4.51)
or
HE
2
2 0AHS f
HSB A
1LHV
TTb T
T
(4.52)
or
HEB
2
HE
2 0
AHSf AHS
2 0 2 0
f AH
HEBB2
S AHS
2
1
LHV
1 1 .
T
b
T T
T
T T T T
T T
T T
(4.53)
When
B
AHS f 1,LHV
b
(4.54)
Eq. (4.51) is always satisfied, but when
B
AHS f 1,LHV
b
(4.55)

163
Eq. (4.51) can be rewritten as
1
2
HE
B
2 0
AHSAHS f
.
L V1
H
T T TT
b
(4.56)
From Eq. (4.78), it is also known that h
AHS
0Q
when
HE
2
2 0AHS f
AHSB
1 0LHV
Tb T T
T
(4.57)
or
HE
2
2 0AHS f
HSB A
1LHV
TTb T
T
(4.58)
or
HEB
2
HE
2 0
AHSf AHS
2 0 2 0
f AH
HEBB2
S AHS
2
1
LHV
1 1 .
T
b
T T
T
T T T T
T T
T T
(4.59)
When

164
B
AHS f 1,LHV
b
(4.60)
Eq. (4.57) can be rewritten as
1
2
HE
B
2 0
AHSAHS f
.
L V1
H
T T TT
b
(4.61)
The second-order partial derivative of the exergy efficiency of the hybrid system, h , with
respect to AHSQ is
3
3
22
2 0 2 0h h AHS f h AHS
2
AHS net AHS net
3 2HE HE
2 2 3
AHS ,
2
2 0 2 0h
B
AHS f net AHS
2
net AHS h AH
3HE HE
2
S
3
B ,
21 2
21
2
LHV
LHV
p T
p T
T T T T
Q W T W T C
T T T TW
W T
T Tb
T Tb
T C
3
3
3 2
HE
22
h , AHS 2 0 AHS 2 0AHS f net
2
net AHS h , A
E
S
H
2 3
HB
1LH
.V
p T
p T
c T TT T TW
w T C T
Tb
(4.62)
From Eqs (4.62), it is known that

165
2
h
AHS
20,
Q
(4.63)
when
HE
2
2 0AHS f
AHSB
01LHV
Tb T T
T
(4.64)
or
h
AHS
0Q
(4.65)
from Eq. (4.50). This means that there might be a local maximum point on the h AHS- Q
curve.
What’s more, as can be seen from Eq. (4.64), the temperature of the AHS AHST at the local
maximal point (if exists) increases with the energy conversion efficiency of the AHS AHS .
4.1.4.3.2. Region in which the specific heat of working fluid at T3 increases rapidly
When 3T continues to increase,
3,p Tc cannot be assumed to be constant. Rewrite Eq. (4.44)
as
3
h h AHS f 0 3 2
AHS net AHS , AHS
2
B
1 .1LHV p T
T h h
Q W T c T
b
(4.66)

166
Since
3
23 2 , d ,
T
p TT
h c Th (4.67)
it can be found from Fig. 4-4 that
3 3 3, AHS , 3 ,
3 2 3 2 3 2
3
AHS AHS 3
0,p T p T p T
h h h
c T c
h h h
T c T
T T T
(4.68)
meaning that
3,
3
S
2
AHp T
h
T
h
c
will decrease with increasing
AHST . Using Eq. (4.44) and
comparing with Eq. (4.49), we can see that the value of h
AHSQ
is higher than when
3,p Tc
is assumed to be constant. This further suggests that the h AHS- Q curve is above the
h AHS- Q curve in which 3,p Tc were assumed to be constant.
4.1.4.3.3. Phase change region
When 3T reaches the boiling point, i.e.
b3T T , from Eq. (4.47),
2
h
AHS
20,
Q
(4.69)
meaning that the h AHS-Q curve is convex during the phase change region (
b3T T ).

167
4.1.4.3.4. Region in which the specific heat of working fluid at T3 is close to the turbine
inlet temperature, TTI
When 3T is close to the turbine inlet temperature,
TIT , it can be assumed that
AH3 n2 S i .h h q (4.70)
Using Eq. (4.70), Eq. (4.44) becomes
h h AHS f 0 03 2
AHS in AHS ,3 AHS
0
AHS h f AHS in 0
in AHS ,3
2
B
2
B AHS
LHV
L
1
V
1
H
1
.
p
p
T Th h
Q B T c T
T
T q T
B c
b
T
b
(4.71)
Considering
0
f AHS in 0
AHS ,3 AHS
f 0 in 0 f 0 in
AH
2
S ,3 AHS AHS ,3 AH
B
B S
2
B
1
LHV
LHV LH
1
1 11 1 1
V
p
p p
T
T q T
c T
T q T T q
T c T T c T
b
b b
(4.72)
and in normal practice

168
B
f
LHV
11,
b
(4.73)
in ,3 AHS,pq c T (4.74)
it is known that when 3 TIT T ,
h
AHS
0,Q
(4.75)
meaning that h will decrease with increasing AHSQ when
3T is large enough. This
further indicates that there is a local maximum h when
b 3 TIT T T .
Effect of the temperature of the additional heat source, AHST , on the exergy
efficiency of the hybrid power generation systems based on the simple Rankine
cycle, h .
To study the effect of the temperature of the additional heat source, AHST , on the exergy
efficiency of the hybrid power generation systems based on the simple Rankine cycle, h ,
we examine the partial derivatives of the exergy efficiency of the hybrid system, h , with
respect to the temperature of the AHS, AHST .
When b3T T , from Eq. (4.5), the partial derivative of the exergy efficiency of the hybrid
system, h , with respect to the temperature of the AHS,
AHST , is

169
3
3
3 3
h h 3 h f 0 3 2 0,
AHS 3 AHS in AHS AHS AHS , AHS
h f 0 3 2 0, ,
net AH
2
B
2
2
S AHS AHSB AHS
LHV
1 1
.LH
1
1 11
V
p T
p T
p T p T
h T h h Tc
T h T b T c T
T h h Tc c
T T
b
w
b
(4.76)
Whenb3T T ,
h
AHST
cannot be defined since
3,p Tc is not continuous at this point as can
be seen from Fig. 4-4 and 3
3,
AHS
p T
hc
T
thus doesn’t have meaning.
Whenb3T T , the second-order partial derivative of the exergy efficiency of the hybrid
system, h , with respect to the temperature of the AHS,
AHST , is
3 3
3
3
3 3
22
h h f 0 3 2 0, ,2
AHS net AHS AHS AHS AHS
,f 0,
AHS AHS AHSh
, ,net 0 0 3 2 0
AHS AHS AHS AHS AHS AHS A
3
2 2
B
22B
HS
2 3
LHV
LHV
2 1 11
1 1
11 2
p T p T
p T
p T
p T p T
T h h Tc c
T w T T
c Tc
T T
c cw T T h h T
T T T
b
b
T
3 3
3 3
2
B
2 3
B
2
h f 0 3 2 0, ,2
in AHS AHS AHS AHS
, ,h f 0 0 3 2 0
in AHS AHS AHS AHS AHS AHS AHS
LHV
L
2 1 11
1 11 2 2
HV,
p T p T
p T p T
T h h Tc c
b T T
c cT T h h T
b T T T T
b
b
(4.77)

170
Whenb3T T ,
2
A
2
h
HST
cannot be defined, since
h
AHST
cannot be defined as previously
mentioned.
To further analyze Eqs (4.76) and (4.77), different scenarios must be analyzed respectively
as 3T rises.
4.1.4.4.1. Region in which the specific heat of working fluid at T3 almost remains constant
According to Fig. 4-4, for 3T up to about 200 °C and using Eq. (4.49), Eq. (4.76) can be
written as
3
3
3
3
2
2
B
2HE
, 3 2h h f 0 0,
AHS net AHS AHS AHS , AHS
,AHS 2 0h AHS f 0
net AHS AHS AHS
2 0h AHS f
net AH
2
B
2HE
2
B S
LHV
LHV
L
1 11
1
1HV
p T
p T
p T
p T
c T TT Tc
T w T c T
cT T TT
w T T
cT T
w
b
Tb
Tb
T
3,
AHS
.p T
(4.78)
The second-order partial derivative of the exergy efficiency of the hybrid system h with
respect to the temperature of the AHS AHST is

171
3
3
3 3
3HE
2
B
22
H
2
22 0h AHS f,22
net AHSh
AHS 2 0h,
net AHS
2
22 0 2 0h AHS f net, ,2
net A
E
3
3HE HE
HS h AHS
2 3
B
LHV
21
2
LH
21
V
p T
p T
p T p T
T Tc
w T
T T Tc
w T
T T T Twc c
w T
Tb
T
b
T
T T
3
3
3
HE HE
2
22
h , 2 0 2 0AHS f net
2
net AHS h , A
3
SB HLHV
21 .
p T
p T
c TT T T Tw
w T c T
Tb
(4.79)
From Eqs (4.79) and (4.78), it is known that
2
h
AHS
20,
T
(4.80)
when
h
AHS
0.T
(4.81)
This means that there might be a maximum point on the h AHS-T curve.
What’s more, as can be seen from Eqs (4.78) and (4.81), the temperature of the AHS, AHST ,
at the maximum point (if exists) increases with the energy conversion efficiency of the
AHS AHS .

172
4.1.4.4.2. Region in which the specific heat of working fluid at T3 increases rapidly
When 3T continues to increase so that
3,p Tc cannot be assumed to be constant, using Eqs
(4.76) and (4.68), and comparing with Eq. (4.78), we can see that the value of h
AHST
is
higher than when 3,p Tc is assumed to be constant. This further suggests that the
h AHS-T
curve is above the h AHS-T curve when
3,p Tc were assumed to be constant.
4.1.4.4.3. Region in which the specific heat of working fluid at T3 is close to the turbine
inlet temperature, TTI
When 3 TIT T , substituting Eq. (4.70) into Eq. (4.76), we have
3
3
h h f 0 0in ,
AHS in AHS AHS
2
B , AHS
1 11 .
LHVp T
p T
T Tq c
T b T c T
b
(4.82)
According to Eqs (4.72)-(4.74), it is known that when 3 TIT T ,
h
AHS
0,T
(4.83)
meaning that h will decrease with increasing
AHST when 3T is large enough. This further
indicates that there is a local maximum h when
b 3 TIT T T .
In fact, when b3T T , since

173
3,h h AHS h
AHS AHS AHS AHS AHS
,p TCQ
T Q T Q
(4.84)
we can see that h
AHST
and
h
AHSQ
have the same sign, meaning that the
h AHS-T curve
will rise when the h AHS-Q curve rises and the
h AHS-T curve will fall down when the
h AHS-Q curve falls down. When
h
AHS
0,Q
(4.85)
there is
h
AHS
0.T
(4.86)
Also, since
3
3 3
,h2
2 2, ,AHS AHSh h h
2 2
AHS AHS AHS AHS AHS AHS AHS
1
p T
p T p T
C
C CQ
T T Q Q T
(4.87)
and
2
h
2
AHS
0Q
when
h
AHS
0Q
from previous results (Eqs (4.63)-(4.65)), we can see
that

174
2
h
2
AHS
0,T
(4.88)
when
h h
AHS AHS
0,T Q
(4.89)
meaning that there might be local maximum point on the h AHS-T curve.
Conclusions of the sensitivity analysis of the hybrid power generation
systems based on the simple Rankine cycle, with respect to the AHS
The results in Sections 4.1.4.1-4.1.4.4 are summarized in Table 4-1.
Table 4-1. Summary results of the sensitivity analysis of the hybrid power generation
systems based on the simple Rankine cycle with respect to the AHS
Conditions Results Comments
BAHS
2
h
AH
2
S
0Q
The h AHS-Q curve is
convex
BAHS
2
h
AHS
2=0
Q
The h AHS-Q is a straight
line

175
BAHS and b3T T
2
h
2
AHS
0T
The h AHS-T curve is
convex
BAHS and b3T T
2
h
2
AHS
0T
The h AHS-T curve is
convex
3,
3
0p Tc
T
and
1
2
HE
B
2 0
AHSAHS f
LH1
V
T
b
T TT
h
AHS
0Q
The h AHS-Q curve is
convex
3,
3
0p Tc
T
and
1
2
HE
B
2 0
AHSAHS f
LH1
V
T
b
T TT
h
AHS
0Q
The h AHS-Q curve is
concave

176
3,
3
0p Tc
T
and
h
AHS
0Q
2
h
AH
2
S
0Q
and
2
h
AH
2
S
0T
There might be a local
maximum h when
b3T T
3,
3
0p Tc
T
The value of h
AHSQ
(
h
AHST
) is higher
than the value of
h
AHSQ
( h
AHST
)
when 3,p Tc is assumed
to be constant
The h AHS- Q (
h AHS- T )
curve is above the
h AHS- Q (h AHS- T ) curve
in which 3,p Tc were
assumed to be constant
when b3T T
b3T T
2
h
AH
2
S
0Q
Phase change region
3 TIT T
h
AHS
0Q
and
h
AHS
0T
There is a local maximum
h when b 3 TIT T T

177
Table 4-1 can be used to give guidance for hybrid systems design in the following ways:
1) When the curve is convex, it means that adding the same amount of AHS (AHSQ )
or increasing the same amount of AHS temperature ( AHST ) to the already
hybridized system will have higher energy efficiency ( h ) and exergy efficiency
( h ) than to a non-hybridized reference system.
2) When the curve is concave, it means that it is better to add AHSQ or increase AHST
for the non-hybridized system. It also indicates that the energy and exergy
efficiency of the system may decline when adding too much AHSQ or increasing
AHST too much (the extent to which “how much” is determined based on the
operation parameters of the system and cannot be determined using thermodynamic
analysis alone. As an example, the actual values of AHSQ and AHST that decrease
the systems efficiencies are shown in the simulation results in Section 4.1.5). This
finding lets designers have the idea that increasing AHSQ or AHST may not keep
systems efficiencies increasing, even if it does at the beginning.
3) When there is a maximal point on a curve, it means that there is local point, at which
the energy or exergy efficiency is maximized, at least locally for a certain range
(may also be gloabally maximum in the whole range of the variable). The location
of the maximum varies depending on the operation parameter of the system, but the
designers will know the existence of this point, from the thermodynamic results

178
summarized in Table 4-1 (can be found in the “comments” column when “local
maximum” is mentioned), before detailed calculation, and are thereby encouraged
to find this point.
To demonstrate and help understanding of the thermodynamic results summarized in Table
4-1, a series of simulation studies was performed. It is shown in Section 4.1.5.2 how the
energy and exergy efficiencies change with AHSQ and AHST . The designers will then have
confidence on the thermodynamic results and are able to use the graphs shown in the
simulation to determine which AHSQ and AHST to choose for attaining higher energy or
exergy efficiency.
4.1.5. Simulation of hybrid power generation systems based on the
simple Rankine cycle
To confirm the previous thermodynamic analysis results and show explicitly the relation
between h or
h and AHSQ or AHST , the following simulation examples are made using
Aspen Plus® [1].
Validation
Before using the simulation model to analyze the hybrid power generation systems based
on the simple Rankine cycle, the model and its results are validated. To do that, the
simulation model was first run using the operation parameters given in the reference paper
from an outside source used for the validation comparison. The results from the simulation

179
were then compared with the results given by the outside reference. The simulation model
is said to be validated when the relative errors are small (e.g. less than 1%). The reference
Rankine cycle is configured based on Fig. 4-1, whose operation parameters are mainly
based on a real steam power plant analysis [2] and shown in Table 4-2. The measures often
designed to increase the efficiency or net power output of the plant such as reheat,
regeneration, and multi-stage steam turbine etc. in the real power plant are not included in
the plant and its simulation. The analysis was performed for a water mass flow rate of 1
kg/s, and the mass flow rate of CH4 and air are adjusted by the software (trial and error) so
that the turbine inlet temperature reaches the design value of 540 °C. The simulation results
for each state point in Fig. 4-1 are shown in Table 4-3.
Table 4-2. Important input parameters for simulation in the reference power generation
systems based on the simple Rankine cycle (Fig. 4-1)
Name Value
Mass flow rate of water wm 1 kg/s
Mass flow rate of CH4 fm 0.06843 kg/s
Mass flow rate of air am 1.413 kg/s (20% excess air)
Mass flow rate of cooling water cwm 36 kg/s

180
Air and CH4 inlet temperatures a f, T T 17 °C
Air and CH4 inlet pressures a f, p p 100 kPa
Turbine inlet temperature 3T 540 °C
Condenser outlet pressure 4p 6.667 kPa
Pump outlet pressure 1p 14.3965 MPa
Condensate extraction pump efficiency CEP 0.98
Turbine isentropic efficiency T 0.85
Table 4-3. Aspen Plus simulation results for each state point in Fig. 4-1
State m [kg/s] T [C] p [kPa] h [kJ/kg] s [kJ/kg-K]
1 1 38.1 6.667 159.6 0.5469
2 1 38.6 14,396.5 174.4 0.5479915
3 1 540.0 14,396.5 3,429.8 6.514969

181
4 1 38.1 6.667 2,229.0 7.195786
CH4 0.06843 17 100 11,306.7 4.34376
Air 1.413 17 100 15,962.3 9.547446
Flue gas 1.48143 120 100 13,549.8 9.736563
6 36 24.5 3,102 105.6 0.359419
7 36 37.8 5,471 163.1 0.540556
To validate the simulation results generated by Aspen Plus, we repeat the calculation
processes described in the thermodynamic analysis by using the Engineering Equation
Solver (EES [ 3 ]) that also contains steam and air properties. The state points and
calculation results are shown in Fig. 4-5, in which numbers written in the squares are the
input values and the others are the calculated output values (the calculation results).
Comparison of some important results given by these two methods are given in Table 4-4.
It can be seen that the results are quite close to each other, with differences probably caused
by different property methods used and calculation approximation errors, etc. Such small
differences are within the error band of the analysis. The simulation made by Aspen was
thereby validated, and Aspen Plus will be used alone to simulate the remaining types of
systems in this chapter.

182
Fig. 4-5 The simple Rankine systems results by using EES (equivalent to manual
validation) based on the shown state points
Table 4-4. Comparison of the results obtained by using Aspen Plus and EES.
Results Aspen EES
Energy input rate inQ (kW) 3,431.42 3,431.00
Exergy input rate inB (kW) 3,577.65 3,578.00
Turbine power output TW (kW) 1,200.77 1,200.00

183
Pump power input CEPW (kW) 14.79 14.74
Energy efficiency 0 (%) 34.56 34.55
Exergy efficiency 0 (%) 33.15 33.13
Simulation results of the hybrid power generation systems based on the
simple Rankine cycle
The simulation is done by Aspen Plus and its PR-BM thermodynamic model4 was
selected to calculate the thermodynamic properties. The main assumptions for the
simulation are listed in Table 4-2. To consider the effect of pressure loss in reality, the
pressure losses for all heat exchange processes are, as often assumed in such systems, 2%
of the inlet pressure.
The power system energy efficiency, h , was computed for energy conversion
efficiencies of the AHS, AHS , of 40%, 60%, 80%, 95.2% and 100%.
AHS = 95.2% is
the energy conversion efficiency of the fuel, i.e. the boiler efficiency, based on the
assumptions in Table 4-2. AHS 100% represents the ideal case in which all of the
AHS heat input is absorbed by the working fluid and used to increase its enthalpy.
Fig. 4-3 showed the computed T-s diagram for the hybrid power generation systems
based on the simple Rankine cycle. It can be seen that heat from the additional heat
4 PR-BM is an enhanced model relative to PR which is widely used by researcher in simulation involving carbohydrate
(methane).

184
source (AHSQ ) is used to heat the working liquid from state point 2 to 3, and the heat
from burning the fuel (fQ ) is used to further heat the working fluid from state point 3
(liquid phase) to 4 (superheated steam).
The relation between the energy efficiency of the hybrid system, h , and the additional
heat source (AHS) heat addition rate, AHSQ , (based on the chosen value of
AHS ) for the
hybrid power generation systems based on the simple Rankine cycle was shown in Fig.
4-6. The results show that for the same enthalpy states 1h to
5h in the hybrid and
reference systems, the energy efficiency of the hybrid system is higher than that of the
reference system (in which AHS 0Q ) if and only if the energy conversion efficiency of
the AHS is higher than that of the original heat source (fuel). This result demonstrates
and confirms Eqs (4.9)-(4.11). Fig. 4-6 also shows that the energy efficiency of the
hybrid increases with AHSQ when Eq. (4.9) is satisfied and decreases with increasing
AHSQ when Eq. (4.11) is satisfied. This result demonstrates and confirms Eq. (4.33).
When BAHS , the convexity of the curves in Fig. 4-6 demonstrates and confirms Eq.
(4.34).
Considering that the simulation includes the effects of the pressure loss in the heat
transfer process and the equation derivations mostly do not, the correspondence of the
simulation results and equation derivations shows that the effects of the pressure loss can
indeed be ignored in the thermodynamic analysis.

185
Fig. 4-6. The relation between the energy efficiency of the hybrid system, h , and the
additional heat source (AHS) heat addition rate, AHSQ , for the hybrid power generation
systems based on the simple Rankine cycle (AHS is the energy conversion efficiency of
the AHS)
Fig. 4-7 shows the relation between the energy efficiency of the hybrid system, h , and
the temperature of the additional heat source (AHS), AHST , for the hybrid power generation
systems based on the simple Rankine cycle. The results showed that h changes with
AHST
in almost the same way as with AHSQ in Fig. 4-6, except that there is a sharp change of h
at AHS 358T °C, which is the vaporization temperature of the working fluid at the
pressure at about 14 MPa, because this is the phase change region in which the temperature
does not change even though the enthalpy of the working fluid rises. For BAHS and

186
the AHS is used to vaporize the working fluid, the heat addition rate of the AHS, AHSQ ,
affects the hybrid system energy efficiency, h , based on Eq. (4.33), while the temperature
of the AHS AHST does not change, thus resulting in a sharp change in
h with AHST in Fig.
4-7. Based on Eqs (4.9) and (4.11), the step is up when AHS B100% 95.3% and
is down when AHS B 95.3% . When the phase change pressure is higher than the
critical pressure of the working fluid (22.06 MPa for water), there is no sharp change of
h if AHST is changed.
Fig. 4-7. The relation between the energy efficiency of the hybrid system, h , and the
temperature of the additional heat source (AHS), AHST , for the hybrid power generation
systems based on the simple Rankine cycle (AHS is the energy conversion efficiency of
the AHS)

187
Fig. 4-8 showed the relation between the exergy efficiency of the hybrid system, h , and
the additional heat source (AHS) heat addition rate, AHSQ , for the hybrid power generation
systems based on the simple Rankine cycle. It can be seen that there might be a local
maximum when AHSQ is small. WhenAHS 40% , there is a maximum point. When
AHS 60% , there is also a maximum point, (though hard to see in the figure) at
AHS 1,202T °C. These results demonstrate and confirm Eqs (4.63)-(4.65). When
AHS 60% , there is no maximum point when the AHS is not used to vaporize the
working fluid (i.e. when AHSQ is lower than 1,600 kW). When the AHS is used to vaporize
the working fluid (i.e. when AHSQ is between 1,600 to 2,700 kW), the curves are convex,
confirming Eq. (4.69). When the AHS is also used to superheat the working fluid (i.e. when
AHSQ is higher than 2,700 kW), there is a maximum point when the AHS is high enough,
confirming Eq. (4.75).

188
Fig. 4-8. The relation between the exergy efficiency of the hybrid system, h , and the
additional heat source (AHS) heat addition rate, AHSQ , for the hybrid power generation
systems based on the simple Rankine cycle (AHS is the energy conversion efficiency of
the AHS)
Fig. 4-9 showed the relation between the exergy efficiency of the hybrid system, h , and
the temperature of the additional heat source (AHS),AHST , for a hybrid power generation
systems based on the simple Rankine cycle. The shapes of the curves are almost the same
as ones in Fig. 4-8, except that there is a step-jump in the phase change region and the
slopes are slightly different based on Eq. (4.84). Based on Eq. (4.45), the step is up when
AHS f 0
AHSB
1LHV
b T
T
and down when AHS f 0
AHSB
1LHV
b T
T
.

189
Fig. 4-9. The relation between the exergy efficiency of the hybrid system, h , and the
temperature of the additional heat source (AHS),AHST , for the hybrid power generation
systems based on the simple Rankine cycle (AHS is the energy conversion efficiency of
the AHS)
Designers can use Fig. 4-8 and Fig. 4-9 to help design the hybrid system shown in Fig. 4-
2. When the energy conversion efficiency of the AHS, AHS , is not too low (such as larger
than 40% in the simulation here), the designers will know that adding a small amount of
AHS to the reference system will increase the exergy efficiency, meaning that the hybrid
system will have a higher exergy efficiency than the reference system shown in Fig. 4-1.
When the AHS is not large enough, say 40-60%, there will be a local maximum point, in
the preheating region (when the working fluid is in the form of liquid). Designers should
try to find this point if they want to achieve the highest system exergy efficiency. On the

190
other hand, in the phase change region, the designers will know that the exergy efficiency
changes monotonically with the AHSQ , and there is no need to waste time in calculating
the exergy efficiency of the system in this region. When the working fluid is superheated,
there is always a local maximum point, since the curve is always downwarding. Designers
can thereby focus more on the beginning of the superheated phase, and no need to worry
about the remaining region. These understandings and strategies save designers lots of time
and effort in finding the maximum point and therefore help them design the hybrid system.
4.1.6. Conclusions about the hybrid power generation systems based
on the simple Rankine cycle
The results from the thermodynamic analysis and simulation of hybrid power generation
systems based on the simple Rankine showed that
o for the same enthalpy states in the hybrid and reference systems, the energy
efficiency of the hybrid system is higher than that of the reference single heat source
system if and only if the energy conversion efficiency (defined in Eq. (4.1)) of the
AHS is larger than that of the heat source used in the reference single heat source
system, i.e. h 0 for AHS HTHS , h 0 for AHS HTHS and
h 0 for AHS HTHS ;
o for the same enthalpy states in the hybrid and reference systems, the exergy
efficiency of the hybrid system is higher than that of the reference single heat source

191
system if and only if the exergy conversion efficiency (defined in Eqs (4.21) and
(4.22)) of the AHS is larger than that of the heat source used in the reference single
heat source system, i.e. h 0 for AHS HTHS , h 0 for AHS HTHS
and h 0 for AHS HTHS ;
o the h AHS-Q curve is convex unless BAHS , in which case
h doesn't change
with AHSQ ;
o when b3T T and
BAHS , h will increase with
AHST , the h AHS-T curve is
convex and the convexity increases with AHST ;
o when b3T T and
BAHS , h will decrease with increasing
AHST , the
h AHS-T curve is convex and the convexity increases with AHST ;
o when b3T T , there might be a local maximum point on the h AHS-Q curve and
AHST at the local maximum point (if exists) increases with AHS ;
o when b3T T , the h AHS-Q curve is above the h AHS-Q curve in which
3,p Tc
were assumed to be constant;
o When b3T T (in the phase change region), the
h AHS-Q curve is convex;
o when 3 bT T , there is a local maximum point in the
h AHS-Q curve;
o when b3T T , there might be a local maximum point on the
h AHS-T curve and
AHST at the local maximum point (if exists) increases with AHS ;

192
o when b3T T , the
h AHS-T curve is above the h AHS-T curve in which
3,p Tc
were assumed to be constant;
o when 3 bT T , there is a local maximum point in the
h AHS-T curve.
The results suggest that
o an effort that should be made to increase the energy conversion efficiency of the
AHS, AHS , is emphasized, since it is critical for improving the hybrid system
energy/exergy efficiency relative to a non-hybrid reference system at the same AHS
temperature or heat addition rate as shown in Fig. 4-6-Fig. 4-9;
o when AHS is low, such as 40% (only for the simulated cases and may be different
for other cases), the temperature of the AHS AHST should be designed around the
maximum point of the h AHS- T curve in which case the AHS is used to preheat
the working fluid (b3T T ): higher
AHST will result in higher energy efficiency but
lower exergy efficiency, and lower AHST will result in both lower energy and
exergy efficiencies, as shown in Fig. 4-7 and Fig. 4-9;
o when AHS is higher, such as 60% or 80% (only for the simulated cases and may
be different for other cases), AHST should either be designed around the local
maximum point in the region 3 bT T , or designed so that the AHS is used to just
vaporize the working fluid but not superheat it, since using the AHS to superheat

193
the working fluid will result in both lower energy and exergy efficiencies, as shown
in Fig. 4-7 and Fig. 4-9;
o when AHS is even higher and comparable to
B , such as 95.2% and 100% in the
ideal case (only for the simulated cases and may be different for other cases), the
AHS should be used not only to vaporize but also superheat the working fluid and
AHST should be designed around the local maximum point in the region 3 bT T ,
as shown in Fig. 4-7 and Fig. 4-9.
Other systems with the same configuration as Fig. 4-2 but with different operation
parameters may follow similar characteristics as shown in Fig. 4-6 -Fig. 4-9 and the
conclusions may be generalized to those systems, since the systems must follow the same
thermodynamic equations that are derived in Section 4.1.2, such as Eq. (4.37).
4.2. Hybrid power generation systems based on a Rankine cycle
with reheat
4.2.1. Introduction of hybrid power generation systems based on the
Rankine cycle with reheat
Reheat is usually used in modern steam power plants to avoid excess moisture at the end
of steam expansion process to protect the turbine, and to raise the system power generation
rate without necessarily increasing the efficiency. In cases where the mean temperature of
the cycle is also increased by reheating, the energy efficiency also increases. The flow

194
diagram of a Rankine cycle with reheat (reference system) is shown in Fig. 4-10. Note that
the power output is from both the high-pressure (HP) and low-pressure (LP) turbines,
HPT LPT w 4 15 16 5= +m hW W h h h , in which wm is the mass flow rate of the
working fluid.
Fig. 4-10. Flow diagram of the reference (single heat source) power cycle based on a
Rankine cycle with reheat without the additional heat source (AHS) (Cond: condenser,
CEP: condensate extraction pump, HP: high-pressure, LP: low-pressure)
Based on the reference system, a hybrid power generation system with reheat can be
created by adding an additional heat source (AHS) to the reference system, as shown in
Fig. 4-11.

195
Theoretically, the AHS can be added between the HP and LP turbines so that the heat from
the AHS is used to reheat the working fluid at the outlet of the HP turbine. This method,
however, is not common since some of the AHS, such as geothermal and waste heat, are
typically not available at that high temperature (over 500 °C), and the cost to attain that
high temperature is also higher than using lower temperature, such as with solar heat. The
AHS should thus be added in the place as in Fig. 4-11, instead of between stream 15 and
16 to reheat the working fluid.
Fig. 4-11. Flow diagram of hybrid steam power plant with reheat assisted by an
additional heat source (AHS) (Cond: condenser, CEP: condensate extraction pump,

196
AHSP: additional heat source pump, HP: high-pressure, LP: low-pressure) (The heat
exchanger may be part of the economizer in the reference system when there is no AHS)
4.2.2. Thermodynamic analysis of hybrid power generation systems
based on the Rankine cycle with reheat
Using the same method as for the simple Rankine cycle, shown in detail in Section 4.1, the
energy and exergy efficiencies for the hybrid system are expressed, respectively, as
w 4 15 16 5 2 1
h
f ADD AHS
4 15 16 5 2 1
4 3 16 15 3 2
B AHS
+
LHV /
+,
+
m h h h h h h
m Q
h h h h h h
h h h h h h
(4.90)
w 4 15 16 5 2 1
h
f f AHS AHS
4 15 16 5 2 1
4 3 16 15 3 2f AHS
B AHS
+
+,
+
m h h h h h h
m b Q
h h h h h h
h h h h h h
(4.91)
and for the reference system are expressed, respectively, as
4 15 16 5 2 1
0
4 3 16 15
B
+,
+
h h h h h h
h h h h
(4.92)

197
4 15 16 5 2 1
0
4 3 16 15
f
B
+.
+
h h h h h h
h h h h
(4.93)
Comparing Eqs (4.90) - (4.93) for the systems with reheat with Eqs (4.4)-(4.7) for the
systems without reheat, it can be seen that they are have similar forms except that the
specific power output is 4 15 16 5+h h h h instead of 4 5h h and the specific
enthalpy increase of the working fluid corresponding to the original heat source (fuel) is
4 3 16 15+h h h h instead of 4 3h h for the hybrid system and
4 2 16 15+h h h h instead of 4 2h h for the reference system. Using the same
method as in Section 4.1, it is easy to realize that the results for the systems with reheat
also apply to the ones without reheat, since 15h and 16h can assumed to be constant when
AHSQ or AHST changes.
4.2.3. Simulation of hybrid power generation systems based on the
Rankine cycle with reheat
Besides the basic assumptions listed in Table 4-2, two additional assumptions are made for
the reheat system:
As commonly done (but not mandatory), the reheat temperature is the same as the top
temperature of the cycle, i.e. 16 4T T ;

198
the reheat pressure 15p is 3.8 MPa, which is the square root of the turbine inlet pressure,
i.e. 15 4p p (the energy efficiency is maximized if reheat pressure is the square root of
the turbine inlet pressure [3]);
the pressure loss during reheat is 2%, 16 150.98p p .
It was found that the results for the hybrid power generation systems based on the Rankine
cycle is similar to the results for the hybrid power generation systems based on the simple
Rankine cycle as in Fig. 4-6-Fig. 4-9. The comparison results between the hybrid systems
with and without reheat are, however, shown below.
4.2.4. Comparison between the hybrid Rankine cycle with and without
reheat
Although the shapes of the efficiency curves for the hybrid cycle with and without reheat
are similar, they are quantitatively different, as can be better seen when they are shown in
the same figure (Fig. 4-12-Fig. 4-15). For clearer view, only two cases are chosen for these
two types of hybrid systems: AHS 100% and AHS 60% .
As can be seen from Fig. 4-12 and Fig. 4-13, the energy efficiency of the reheated hybrid
power generation system is higher by approximately 2 percentage points than that of the
system without reheat, for the same AHS heat addition rate, AHSQ , or temperature, AHST ,
since reheat increases the mean heat addition temperature of the power cycle in this

199
simulation from 208 °C to 223 °C. That difference (for the same AHS ) almost does not
change as a function of AHSQ and AHST .
The trends of exergy efficiency are more complicated than those of the energy efficiency,
when AHS is large (=100%), as can be seen from Fig. 4-14 and Fig. 4-15. This is because
that in the system with reheat, the working fluid is reheated by the fuel and the exergy
destruction rate in the reheat process is unchanged as AHSQ and AHST increases. Since h
increases with AHSQ when AHS is large as shown in Fig. 4-8 and Fig. 4-14, the exergy
efficiency change as more AHS is used will be smaller in the system with reheat than in
the system without reheat. Thus, when AHS is large enough, the h AHS- Q curves may,
as seen, intersect for the system with and without reheat

200
Fig. 4-12. Comparison results between the energy efficiency of the hybrid system, h ,
and the additional heat source (AHS) heat addition rate, AHSQ , for the hybrid power
generation systems based on the Rankine cycles with and without reheat ( AHS is the
energy conversion efficiency of the AHS)

201
Fig. 4-13. Comparison results between the energy efficiency of the hybrid system, h ,
and the temperature of the additional heat source (AHS), AHST , for the hybrid power
generation systems based on the Rankine cycles with and without reheat ( AHS is the
energy conversion efficiency of the AHS)

202
Fig. 4-14. Comparison results between the exergy efficiency of the hybrid system, h ,
and the additional heat source (AHS) heat addition rate, AHSQ , for the hybrid power
generation systems based on the Rankine cycles with and without reheat ( AHS is the
energy conversion efficiency of the AHS)

203
Fig. 4-15. Comparison results between the exergy efficiency of the hybrid system, h ,
and the temperature of the additional heat source (AHS), AHST , for the hybrid power
generation systems based on the Rankine cycles with and without reheat ( AHS is the
energy conversion efficiency of the AHS)
4.3. Hybrid power generation systems based on the Rankine cycle
with heat regeneration
Besides “reheat”, “regeneration”, shown in Fig. 4-16, is another typical configuration used
in steam power plants [4]. Steam is extracted from the turbine at one or more points of
different temperatures to preheat the boiler feedwater mainly three reasons: to raise the
energy efficiency of the power plant, reduce thermal shock in the boiler and eliminate

204
hazardous chemicals in boiler feedwater. Regeneration is realized by closed or open (direct
contact) feedwater heaters. The feedwater heater may be low-pressure (LP) if it is located
upstream of the boiler feed pump, or high-pressure (HP) if it is downstream.
4.3.1. Introduction of hybrid power generation systems based on the
Rankine cycle with heat regeneration
The flow diagrams of the two hybrid systems with the AHS replacing the HP and LP
feedwater heater, respectively, are shown in Fig. 4-17 and Fig. 4-18. In the first system,
called here the hybrid system 1, the HP feedwater heater is replaced by an AHS to heat the
working fluid from state 2 to 3, and in the second system, called here the hybrid system 2,
the LP feedwater heater is replaced by an AHS to heat the working fluid from state 10 to
11. In both cases, the saved extraction stream continues to expand in the turbine to produce
extra work.

205
Fig. 4-16. Flow diagram of the reference steam power plant with regeneration by 2
closed feedwater heaters and one open feedwater heaters (Cond: condenser, CEP:
condensate extraction pump, BFP: boiler feedwater pump, HP: high-pressure, LP: low-
pressure)
Fig. 4-17. Flow diagram of the first examined kind of hybrid regenerative steam power
plant in which the closed high-pressure feedwater heater was replaced by an additional
heat source (AHS) (Cond: condenser, CEP: condensate extraction pump, BFP: boiler
feedwater pump, AHSC: additional heat source collection equipment, AHSP: additional
heat source pump, LP: low-pressure)

206
Fig. 4-18. Flow diagram of the second examined kind of hybrid regenerative steam
power plant in which the closed low-pressure feedwater heater was replaced by an AHS
(Cond: condenser, CEP: condensate extraction pump, BFP: boiler feedwater pump,
AHSC: additional heat source collection equipment, AHSP: additional heat source pump,
HP: high-pressure)
4.3.2. Thermodynamic analysis of hybrid power generation systems
based on the Rankine cycle with heat regeneration
For the reference system shown in Fig. 4-16, the mass flow rate for each extraction stream
from the steam turbine could be defined, respectively, as
5 w ,m y m (4.94)

207
6 w ,m y m (4.95)
7 w ,m y m (4.96)
in which w 4m m [kg/s] is mass flow rate of working fluid entering the turbine and
, ,y y y is the extraction fraction of each extraction stream from the turbine.
Application of mass and energy balances to the control volume enclosing each feedwater
heater gives, respectively,
3 2
5 12
,h h
yh h
(4.97)
6 11 12 10 1 ,y h y y h y h h (4.98)
11 10
7 13
1,
y y h hy
h h
(4.99)
in which Eq. (4.98) could be written as
1 11 12 11
6 11
.h h y h h
yh h
(4.100)
The specific power output from the steam turbine of the reference system is

208
net,0 4 8 5 8 6 8 7 8
2 1 10 91 .
w h h y h h y h h y h h
h h y y h h
(4.101)
The energy efficiency of the reference system is
net,0 net,0
0
4 3f
B
.W w
h hQ
(4.102)
The exergy efficiency of the reference system is
net,0 net,0
0
4 3f f
B
.
LHV
W w
h hB b
(4.103)
For the hybrid system 1, i.e. when the HP feedwater heater is replaced by an AHS, as shown
in Fig. 4-17, application of mass and energy balance to the control volume enclosing the
AHS heat exchanger and each feedwater heater give, respectively,
AHS AHS w 3 2,1 ,1 ADD,1 ,Q Q m h h (4.104)
1 6 1 11 10 1 ,y h y h h (4.105)
1 11 10
1
7 13
1,
y h hy
h h
(4.106)

209
in which the subscript 1 stands for the case when HP feedwater is replaced by an AHS and
Eq. (4.105) becomes
1 11
1
6 11
.h h
yh h
(4.107)
The specific power output from the steam turbine of the hybrid system 1 is
net,1 net,0 net,1
4 8 5 8 6 8 7 8
2 1 10 9 7 8
4 8 5 8 6 8 2 1 10 9
1
1 .
w w w
h h y h h y h h y h h
h h y y h h y h h
h h y h h y h h h h y y h h
(4.108)
The energy efficiency of the hybrid system 1 is
net,1 net,1
h,1
4 3 11 10f AHS,1
B AHS,1
.1
W w
h h y y h hQ Q
(4.109)
The exergy efficiency of the hybrid system 1 is
net,1 net,1
h,1
f AHS,1 4 3 11 10f 0
B AHS,1 AHS,1
.1
1
W w
B B h h y y h hb T
LHV T
(4.110)

210
For the hybrid system 2, i.e. when the LP feedwater heater is replaced by an AHS, as shown
in Fig. 4-18, application of mass and energy balance to the control volume enclosing the
AHS heat exchanger and each feedwater heater give, respectively,
3 2
2
5 12
,h h
yh h
(4.111)
2 6 2 2 11 2 12 10 1 ,y h y y h y h h (4.112)
,2 ,2 ADD,AHS AHS w 1 12 1 02 2 ,1Q Q y ym h h (4.113)
in which the subscript 2 stands for the case when the LP feedwater is replaced by AHS and
Eq. (4.112) could be written as
1 11 2 12 11
2
6 11
.h h y h h
yh h
(4.114)
The specific power output from the steam turbine of the hybrid system 2 is
net,2 net,0 net,2
4 8 5 8 7 8 7 8
2 1 10 9 5 8 10 9
4 8 5 8 7 8 2 1 10 9
1
1 .
w w w
h h y h h y h h y h h
h h y y h h y h h h h
h h y h h y h h h h y h h
(4.115)
The energy efficiency of the hybrid system 2 is
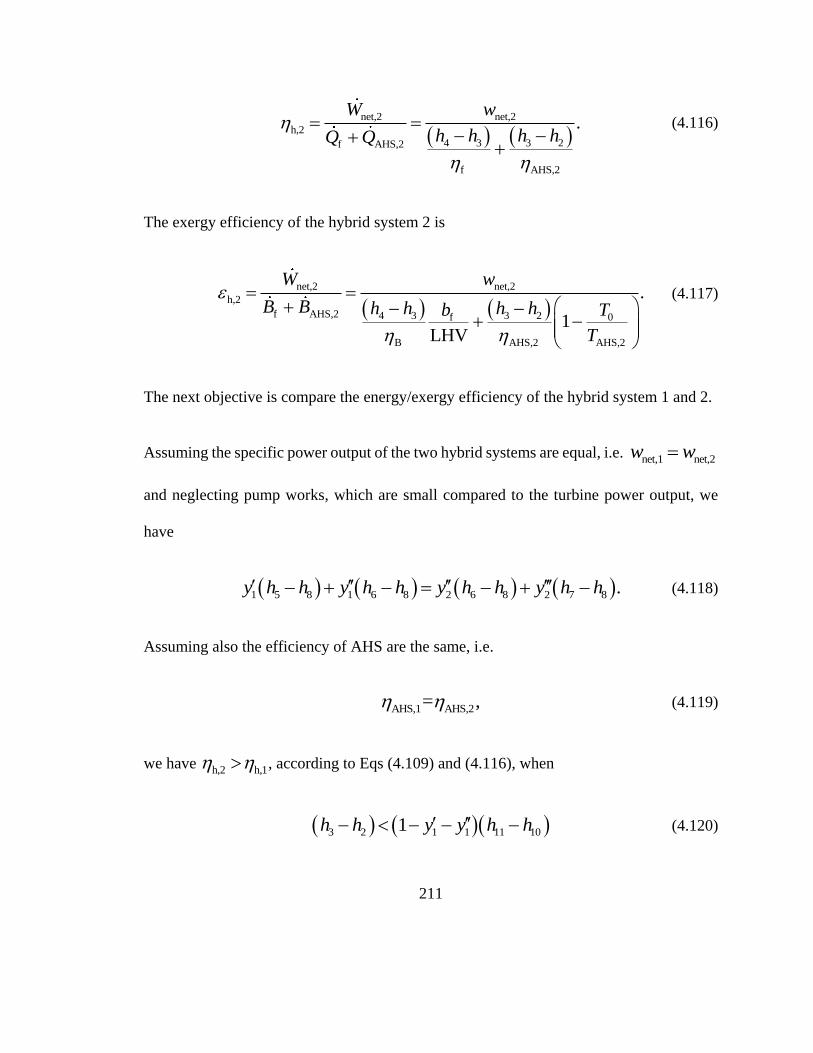
211
net,2 net,2
h,2
4 3 3 2f AHS,2
f AHS,2
.W w
h h h hQ Q
(4.116)
The exergy efficiency of the hybrid system 2 is
net,2 net,2
h,2
f AHS,2 4 3 3 2f 0
B AHS,2 AHS,2
.
1LHV
W w
B B h h h hb T
T
(4.117)
The next objective is compare the energy/exergy efficiency of the hybrid system 1 and 2.
Assuming the specific power output of the two hybrid systems are equal, i.e. net,1 net,2w w
and neglecting pump works, which are small compared to the turbine power output, we
have
1 5 8 1 6 8 2 6 8 2 7 8 .y h h y h h y h h y h h (4.118)
Assuming also the efficiency of AHS are the same, i.e.
AHS,1 AHS,2= , (4.119)
we have h,2 h,1 , according to Eqs (4.109) and (4.116), when
3 2 1 1 11 101h h y y h h (4.120)

212
or
6 1 3 2 6 12 11 10
6 11 5 12 6 11 3 2
1h h h h h h h h
h h h h h h h h
(4.121)
or
3 2 7 13 5 8 11 10
5 12 11 10 7 8 3 2
1h h h h h h h h
h h h h h h h h
(4.122)
or
7 5 5 8
5 12 7 8
1.h h h h
h h h h
(4.123)
Similarly to the analysis for the previous analysis, we have
5 8 7 8
5 12 7 5
.h h h h
h h h h
(4.124)
So similar to the analysis in the previous study, we have the same conclusion that
h,2 h,1, (4.125)
when net,2 net,1w w .

213
This means that replacing higher pressure extracted steam will achieve higher system
energy efficiency than replacing lower pressure extracted steam, when both extracted
steam, if replaced, increases the same amount of net power output.
Similarly, for the exergy efficiency, we can conclude that when net,2 net,1w w ,
h,2 h,1, (4.126)
when
AHS,2 07 5 5 8
5 12 7 8 AHS,1 0
1,T Th h h h
h h h h T T
(4.127)
which isn’t always satisfied. If, however, solar temperature at the sun surface is used as the
heat source temperature for solar, AHS,1 AHS,2 ss 5760 KT T T , we have
63 31 61 7 ss 0
61 51 63 7 ss 0
1,h h h h T T
h h h h T T
(4.128)
which is always satisfied as in the energy analysis section. This means
h,2 h,1, (4.129)
when net,2 net,1w w .

214
This means that when solar heat is used as the AHS and the temperature of solar heat is
defined as the sun surface temperature, replacing higher pressure extracted steam will
achieve higher system exergy efficiency than replacing lower pressure extracted steam,
when both extracted steams, if replaced, increase the same amount of net power output.
4.4. Conclusions of the thermodynamic analysis of hybrid power
generation systems based on Rankine cycles
This chapter mainly examines the thermodynamic features and performance of hybrid
power generation systems based on Rankine cycles. The main conclusions for the hybrid
power generation systems based on the simple Rankine cycle were summarized in Section
4.1.6 and are not repeated here. For the hybrid power generation systems based on the
Rankine cycle with reheat, the thermodynamic analysis showed that they have similar
characteristics with the hybrid power generation systems based on the simple Rankine
cycle, in terms of the relation between the temperature of the AHS, AHST , the heat addition
rate of the AHS, AHSQ , and the energy/exergy efficiency of the hybrid system, for different
energy conversion efficiency of the AHS, AHS .
For the hybrid power generation systems based on the Rankine cycle with heat regeneration,
it was found in the thermodynamic analysis that replacing higher pressure extracted steam
will achieve higher system energy efficiency than replacing lower pressure extracted steam,
when both extracted steams, if replaced, increase the same amount of net power output.

215
When solar heat is used as the AHS and the temperature of the solar heat is defined as the
sun surface, this result also applies to the exergy efficiency of the hybrid system. The
results suggested that it is better to replace the higher pressure extracted steams with the
AHS than the lower pressure ones in terms of energy efficiency. From the exergy point of
view, however, it is not always the case and a simple criterion to decide which extracted
steam to replace is Eq. (4.127).
References for Chapter 4
[1] ASPN PLUS: V9, Aspen Technology, Inc.,
http://www.aspentech.com/products/engineering/aspen-plus/.
[2] Ameri M., Ahmadi P., Hamidi A., Energy, exergy and exergoeconomic analysis of a
steam power plant: A case study. Int J Energ Res 2009;33:499-512.
[3] EES: Engineering Equation Solver, Academic commercial V10.091,
http://www.fchart.com/ees/.
[4] Woodruff E.B., Lammers H.B., Lammers T.F., Steam power plant operation, 8th
edition, New York US: McGraw-Hill; 2005.

216
CHAPTER 5
THERMODYNAMIC ANALYSIS OF THERMAL HYBIRD
POWER GENERATION SYSTEMS BASED ON BRAYTON
CYCLES
5.1. Hybrid power generation systems based on the simple
Brayton cycle
5.1.1. Introduction of hybrid power generation systems based on the
simple Brayton cycle
The flow and T-s diagrams of the considered hybrid gas turbine system based on simple
Brayton cycle is shown in Fig. 5-1 and Fig. 5-2, respectively. For simplicity, additional
heat source equipment is shown collectively as AHSC in Fig. 5-1 and “Fuel” stands for
natural gas, methane, or other gas or liquid fuel that could be burned in gas turbines
combustor.
In this system, air is pressurized in the compressor before heated by AHS and fuel. The
high temperature high pressure combustion gas from the combustor outlet is then used to
drive the turbine. The compressor and the turbine usually attach to one shaft and the net
power output of the system is the turbine shaft work minus compressor work. The flue gas
could be used to preheat the pressurized air as well and will be dealt with in the next section.

217
When there is no AHS input, the hybrid simple Brayton cycle reduces to the reference
system, which is the simple Brayton cycle.
Fig. 5-1. Flow diagram of the hybrid gas turbine power plant based on a simple Brayton
cycle with an additional heat source (AHS) (AHSC: additional heat source collection
equipment)
Fig. 5-2. T-s diagram of the hybrid gas turbine power plant based on a simple Brayton
cycle with an additional heat source (AHS) (QLT: heat input from the additional heat
source, QHT: heat input from the fuel in the combustor, ——: isobars, - - - -: real
processes)

218
5.1.2. Thermodynamic analysis of hybrid power generation systems
based on the simple Brayton cycle
In reality, introducing the AHS for the simple Brayton cycle may change the isentropic
efficiency of the compressor and will thus change the specific enthalpy at the outlet of the
compressor, 2h . What’s more, introducing the AHS will also change the mass flow rate of
the needed fuel in the combustion process, fm , and will thus change the composition of
the flue gas (stream 4 in Fig. 5-1) after the combustion process. Introducing the AHS will
also change the pressure drop in the heat addition process (from the compressor outlet to
the turbine inlet) and may thus result in different pressures in the turbine inlet, 4p .
Determination of all the operation parameters of a system, such as the temperature and
pressure, at each state points in the power cycles requires experiments or even information
that a company may make available only to its customers.
Considering that this research is a preliminary thermodynamic analysis and is intended to
serve only as a guideline for designing hybrid power cycles before detailed simulation or
experiments, there is no need to provide exact values or expressions to calculate the
operation parameters for each state point in the power cycles at this stage and certain
assumptions can be made to help with the thermodynamic analysis instead. It is assumed
that the addition of the AHSC will not change:
1) the isentropic efficiency of the compressor,

219
2) the pressure drop during the heat addition process (from the compressor outlet to
the turbine inlet), or the pressure at the turbine inlet, 4p ,
3) and the composition of the flue gas after combustion, considering that the mass
flow rate of fuel is small compared to that of air in gas turbine (fuel-air ratio about
2%).
Considering that the compressor inlet air (stream 1) conditions are the same for the
reference system and the hybrid system and the top temperature of the cycles are kept the
same, it can be further concluded from the above assumptions that the specific enthalpies
at each state point in the power cycles remains constant.
Besides the above assumptions, the thermodynamic analysis uses the following
assumptions similar to those in Section 4.1.2:
o The kinetic and potential energy of the fluids are ignored in such power cycle
analyses due to their small magnitude and impact on the system performance
relative to the heat-caused enthalpy changes in the fluids.
o Each component in the power cycles is adiabatic with respect to its surroundings,
(i.e., there is no heat loss to the environment). Since the heat loss is generally easily
reducible and usually only a small fraction of the heat duty of the heat exchangers,
most early-stage design processes ignore these heat losses.
o The mechanical efficiencies of the compressor and the turbine are 100%.

220
The following analyses are based on these assumptions. The objective, same as before for
the analysis of the Rankine cycles, is to compare the energy/exergy efficiency of the hybrid
and the reference system.
According to the mass and energy balance in the control volume enclosing the combustor
for the hybrid system in Fig. 5-1,
CC f f 7 a 3 a f 4LHV ,m m h m h m m h (5.1)
in which CC is the energy efficiency of the combustor defined as the ratio between fuel
energy input and enthalpy increase of working fluid, am [kg/s] and fm [kg/s] are the mass
flow rate of combustor inlet air and fuel, respectively, LHV [kJ/kg] is the lower heating
value of the combustor inlet fuel.
Based on the enthalpy balance of the AHSC and the combustor (Fig. 5-1), the enthalpy
increase of the working fluid during the heat addition process is, respectively,
ADD,f a f 4 f 7 a 3 ADCC CCD f LHV,Q m m h m h m h Q m (5.2)
a 3 2ADD,AHS AHS AHS.Q m h h Q (5.3)
When solar energy is used as the AHS, ADD,AHS solQ Q and HS is sc defined in Eq.
(2.6).

221
For later use, define the fuel-air ratio, f , as the ratio of mass flow rate of air and that of
fuel in a combustion process, or
f
a
.m
mf (5.4)
Using Eq. (5.2), the fuel-air ratio for the hybrid system is thus
4 3f
a CC 4 7
.LHV
h hf
h h
m
m
(5.5)
Using the assumptions listed at the beginning of Section 5.1.2 and based on Eqs (2.2) and
(4.1)-(4.3), the energy efficiency of the hybrid system, h , is
4 5 2 1 4 5 2 1
h3 2a 3 2
a f a
fAHSAHS
1
LHLHV
,
V
h h h h h h h h
h hm h h
m m m f
fm
(5.6)
in which the fuel-air ratio for the hybrid system, f , is determined using Eq. (5.5).
Assuming the dead state temperature is 0T and the AHS temperature is AHST , the exergy
efficiency of the hybrid system, h , based on Eq. (2.8), is
a f a
0 0
AHS
4 5 2 1 4 5 2 1
h
a 3 2 3 2f f f
AHS A AHHS S
1
1
.
1
m m m f
T Tf
T T
h h h h h h h h
m h h h hm b b
(5.7)

222
If there is no AHS input in Fig. 5-1, 3 2h h , the general form of energy efficiency of the
simple Brayton cycle system is
0 4 5 2
0
0
11
LHV,
h h h
f
hf
(5.8)
and the exergy efficiency is
0
0
4 5 2 1
0
f
,1 h hf h
f
h
b
(5.9)
in which the fuel-air ratio for the reference system, 0f , is
f,0 4 20
CC 4 7a
.LHV
h hm
mf
h h
(5.10)
The next step is to compare the energy efficiencies of the hybrid system and the reference
system.
Based on Eqs (5.6) and (5.8), the ratio between the energy efficiency of the hybrid system
and the reference system is
4 5 2 1h
3 20 4
0
0 5 2 1
AHS
1 LHV
1L V
=
H
.h h h h
h hh h h
f f
f hf
(5.11)
Using the assumption that the fuel-air ratio is only about 2% in practice, or

223
0 0.02 1.f f (5.12)
Eq. (5.11) becomes
h
3 2 3 20
AHS
4 2
CC 4 70
4 3
CC 4 7 AHS
LHVLHVLHV
LHV LHVLHV
,
h h
h hf
h hf
h h
h h h h
(5.13)
which is = 1 when
4 7HS CA C ,
LHV
h h
(5.14)
and > 1 when
4 7HS CA C ,
LHV
h h
(5.15)
and < 1 when
4 7HS CA C .
LHV
h h
(5.16)
In practice, the energy efficiency of the combustor is close to 1 (99%), since the heat loss
from the combustor is small compared to the heat duty of the combustion process, i.e.
CC 1. (5.17)

224
As will be shown in the simulation,
4 7 1.LHV
h h (5.18)
Thus,
4 7CC CC 1,
LHV
h h
(5.19)
and can be concluded that h 0 , since 4 7CCAHS
LHV
h h
in most cases.
The next step is to compare the exergy efficiencies of the hybrid system and the reference
system.
Based on Eqs (5.7) and (5.9), the ratio between the energy efficiency of the hybrid system
and the reference system is
4 5 2 1h f
0 4 5 2 1 3 2f
AHS
0
0 0
AHS
1
11
= ,f f
f Tf
h h h h b
h h h hb
T
h h
(5.20)
which is 1 when
4 7
CCHS
f
A ,h h
b
(5.21)

225
and ≥ 1 when
4 7
CCHS
f
A ,h h
b
(5.22)
and ≤ 1 when
4 7
CCHS
f
A ,h h
b
(5.23)
in which AHS and CC are the exergy conversion efficiencies of the AHS and the
combustor, defined before respectively in Eqs (4.21) and (4.22).
Considering that f LHVb for fuel, it can thus be seen that
4 7
CC CC CC
f
1.h h
b
(5.24)
This means that h 0 when AHS 1 , or
0
AHS
AHS
1 .T
T (5.25)

226
For example, when 0 300 KT and AHS 1,200 KT , AHS has to be larger than 0.75
for h 0 .
5.2. Hybrid power generation systems based on the Brayton cycle
with intercooling
5.2.1. Introduction of hybrid power generation systems based on the
Brayton cycle with intercooling
Intercooling is widely used in Brayton power systems since it reduces the power
consumption of the compressor by lowering the temperature of the compressed air, and
thus increases the net power output of the gas turbine. Lowering the temperature of the
pressurized air outlet from the compressor leaves more room for utilizing the AHS at lower
temperatures, such as when using solar parabolic trough concentrating collectors instead
of higher concentration (and hence more expensive) solar systems such as dish or tower.
The flow and T-s diagrams of hybrid gas turbine power plants with intercooling are shown
in Figs. 5-3 and 5-4, respectively. If there is no intercooling used, the operation cycle would
have been 1-2-3-4-5-1. When the intercooling is used, compressed air from the low-
pressure compressor (LP) at state 11 is cooled to state 12 and then compressed by the high-
pressure (HP) compressor to state 2, at which the additional heat source is added. The
operation cycle for the intercooled Brayton cycle is thus 1-11-12-2-3-4-5-1. Due to the
pressure losses during heat addition from state 2 to state 3 and from state 3 to state 4, the

227
pressure at the outlet of a component is lower than at its inlet. In addition, there is a pressure
loss in the intercooler and all piping, so the air pressure at the intercooler outlet is lower
than at its inlet. The temperature at outlet of the compressor is decreased from state 21 to
state 2. So there is more flexibility for choosing the temperature and the type of AHS since
the temperature of the AHS must be higher than the temperature of pressurized air at the
compressor outlet. Also, since the intercooling decreased the temperature at the compressor
outlet, more regeneration can be gained from the gas turbine exhaust gas at state 5.
Fig. 5-5. Flow diagram of the hybrid gas turbine power plant based on the Brayton cycle
with intercooling with an additional heat source (AHS) (AHSC: additional heat source
collection equipment, LP: low-pressure, HP: high-pressure)

228
Fig. 5-6. T-s diagram of hybrid gas turbine power plant based on the Brayton cycle with
intercooling with an additional heat source (AHS)(QLT: heat input from the additional
heat source, QHT: heat input from the fuel in the combustor, ——: isobars, - - - -: real
processes)
5.2.2. Thermodynamic analysis of hybrid power generation systems
based on the Brayton cycle with intercooling
Using the same assumptions and method in Section 5.1.2, the energy and exergy efficiency
for the hybrid Brayton cycle with intercooling are, respectively,

229
4 5 11 1 2 12
h3 2
AHS
1
LH
,
V
h h h h h h
h
f
fh
(5.26)
4 5 11 1 2 12
h
3 2f
AHS
0
AHS
1
1
,f
Tf
h h h h h h
h h
Tb
(5.27)
and for the reference system are, respectively,
4 5 11 1 20 12
0
0
1
LHV,
f h h h
f
h h h
(5.28)
4 5 11 10
0
1
0
f
2 21.
h h h h hf
b
h
f
(5.29)
Using the same method in Section 5.1.2, we have the same results as for the simple Brayton
cycle, i.e. h 0 in most cases ( 4 7
CCAHSLHV
h h
) and
h 0 when
0AHS
AHS
1T
T .
5.3. Hybrid power generation systems based on the Brayton cycle
with reheat

230
5.3.1. Introduction of hybrid power generation systems based on the
Brayton cycle with reheat
Reheat is also widely used in Brayton cycles since it increases the power output and the
turbine exhaust gas temperature, which can be used in heat regeneration or a bottom cycle.
The flow diagram and the qualitative T-s diagram of the hybrid Brayton cycle with reheat
with the additional heat source (QLT in Fig. 5-8) are shown in Fig. 5-7 and Fig. 5-8,
respectively. In this system, three heat sources QLT, QHT,1 and QHT,2 are used to heat the
working fluid. As can be seen from the diagram, the HP Turbine exhaust gas at state 5 is
reheated by heat source QHT,2 to state 42, from which it is expanded in the LP Turbine to
state 5. The reheat-system turbine exit temperature T5 is higher than the turbine exit
temperature if no reheat was applied, T50, and thus offers higher potential for heat
regeneration or for use in combined cycle systems that will be discussed in CHAPTER 6.
The reason why the AHSC is not added in the upstream of combustor 2 is that this
hybridization method raises the temperature needed for the AHS as can be seen from Fig.
5-8 (T41>T2). This increases the cost of the AHSC (the cost of solar collectors generally
increases with the temperature it can achieve) and will thus not be considered here.

231
Fig. 5-7. Flow diagram of the reheat Brayton-based hybrid gas turbine power plant with
an additional heat source (AHS) used to preheat the pressurized air (AHSC: additional
heat source collection equipment, LP: low-pressure, HP: high-pressure)
Fig. 5-8. Qualitative T-s diagram of the reheat Brayton-based hybrid gas turbine power
plant with an additional heat source (AHS) (QLT: heat input from the additional heat
source, QHT,1: heat input from the fuel in the combustor, QHT,2: heat input from the
reheater, ——: isobars, - - - -: real processes)

232
5.3.2. Thermodynamic analysis of hybrid power generation systems
based on the Brayton cycle with reheat
According to the mass and energy balance in the control volume enclosing the combustor
2 for the hybrid system in Fig. 5-7,
CC f,2 f,2 8 a f,1 41 a f,1 f,2 42LHV .m m h m m h m m m h (5.30)
Thus
f,2 42 412
a f,1 CC 42 8
.LHV
m h hf
m m h h
(5.31)
For the reference system, similarly,
f,0,2 42 410,2 2
a 0,f,1 CC 42 8
.LHV
m h hf f
m m h h
(5.32)
Using the same assumptions and method in Section 5.1.2, the energy and exergy efficiency
for the hybrid Brayton cycle with intercooling are, respectively,
4 41 42 2 1
h3 2
AHS
1 1 2 5
1 2 1 2
1 1 1
LHV
,h h h h hf f f
f f f
h
h hf
(5.33)

233
1 1 2 5
01 2 1 2
AH
4 41 42 2 1
h
3 2f
AHS S
1 1 1
1
,f f f
Tf f
h h h h h
f fT
h
h hb
(5.34)
and for the reference system are, respectively,
4 41 420 0 2 5 2 1
0
0 2 0 2
1 1 1
LHV,
h h h h hf f f
f f f f
h
(5.35)
4 41 42 2 10 0 2 5
0 2 0 2
h
f
1 1 1.
h h h h h hf f f
f f f f b
(5.36)
Using the same method in Section 5.1.2, we obtain the same results as for the simple
Brayton cycle, i.e. h 0 when 4 7CCAHS
LHV
h h
and h 0 when
0AHS
AHS
1T
T .
5.4. Hybrid power generation systems based on the Brayton cycle
with heat regeneration

234
5.4.1. Introduction of hybrid power generation systems based on the
Brayton cycle with heat regeneration
Heat regeneration, or just regeneration, is widely used in Brayton cycle power plants,
where the turbine exhaust gas is used to preheat the pressurized air at the compressor outlet
by a regenerator. The efficiency of an ideal cycle will typically be improved thereby since
less heat input is needed while the work output remains the same. In real systems, the
regenerator causes a pressure drop that will lower the turbine inlet pressure, which can be
restored by additional compressor work investment. The efficiency of the regenerative
Brayton cycle is nevertheless still likely to increase because the effect of the typical
pressure loss on the system efficiency is much more than compensated by the effect of the
regenerative heat input.
If regeneration is coupled with intercooling and/or reheat, as often done in Brayton power
systems in practice, the efficiency can be improved further due to lower pressurized air
temperature at the outlet of the compressor and/or higher turbine exhaust gas temperature
[1]. The flow and T-s diagrams of the hybrid Brayton cycle with heat regeneration with the
additional heat source is shown in Fig. 5-9 and Fig. 5-10, respectively. The reason why the
AHS is used downstream of the regenerator rather than upstream is to increase the energy
use of the turbine exhaust gas: to enable such heat transfer, the temperature of flue gas must
be higher than the temperature of the pressurized air at the inlet of the regenerator (T51 must
be higher than T2, Fig. 5-10), so if AHS is added upstream of the regenerator, the

235
temperature of the pressurized air at the inlet of the regenerator will be higher and
consequently also the temperature of flue gas, allowing less heat regeneration.
Fig. 5-9. Flow diagram of hybrid gas turbine power plant based on the Brayton cycle
with heat regeneration, with an additional heat source (AHS) (AHSC: additional heat
source collection equipment)
Fig. 5-10. Qualitative T-s diagram of the regenerative Brayton-based hybrid gas turbine
power plant with an additional heat source (AHS) (QLT: heat input from the additional
heat source, QHT: heat input from the fuel in the combustor, QR: heat duty of the
regenerator, ——: isobars, - - - -: real processes)

236
5.4.2. Thermodynamic analysis of hybrid power generation systems
based on the Brayton cycle with heat regeneration
Using the same assumptions and method as in Section 5.1.2, the energy and exergy
efficiency for the hybrid Brayton cycle with intercooling are, respectively,
4 5 2 1
h3 21
AHS
L
,1
HV
f
f
h h h h
h h
(5.37)
4 5 2 1
h
3 21
A S AHS
f0
H
1
1
,f h h h h
h h Tf
Tb
(5.38)
and for the reference system are, respectively,
0 4 5 2
0
0
11
LHV,
h h h
f
hf
(5.39)
0
0
4 5 2 1
0
f
.1 h hf h
f b
h
(5.40)

237
Using the same method as in Section 5.1.2, we have the same results as for the simple
Brayton cycle, i.e. h 0 in most cases ( 4 7CCAHS
LHV
h h
) and h 0 when
0AHS
AHS
1T
T .
5.5. Simulation of hybrid power generation systems based on the
Brayton cycle with intercooling, reheat and heat regeneration
5.5.1. Introduction of hybrid power generation systems based on the
Brayton cycle with intercooling, reheat and heat regeneration
The flow diagram of the hybrid power generation system based on the Brayton cycle with
intercooling, reheat and heat regeneration is shown in Fig. 5-11. The studied system uses
3 heat sources and has intercooling, reheat and regeneration process in addition to the
simple Brayton cycle.
Fig. 5-11. Flow diagram of the hybrid gas turbine power plant based on the Brayton
cycle with intercooling, reheat and heat regeneration, with an additional heat source

238
(AHS) (AHSC: additional heat source collection equipment, LP: low-pressure, HP: high-
pressure)
The flow diagram of the reference power generation system based on the Brayton cycle
with intercooling, reheat and heat regeneration is shown in Fig. 5-12. The only difference
from the hybrid system is that there is no AHS and the state point 5 and 6 in the hybrid
system are the same point in the reference system.
Fig. 5-12. Flow diagram of the reference gas turbine power plant based on the Brayton
cycle with intercooling, reheat and heat regeneration (LP: low-pressure, HP: high-
pressure)
5.5.2. Validation
Before using the Aspen simulation model to analyze the hybrid power generation systems
based on the studied system, the model and its results need to be validated. To do that, the
simulation model was first run using the operation parameters given in the outside
reference used for the validation comparison. The results from the simulation were then

239
compared with the results given by the outside reference. The simulation model is
considered to be validated when the relative errors are acceptably small (e.g. less than 1%).
A similar example is given in Moran [1], with the same configuration as Fig. 5-11 with
operation parameters and assumptions, but with no AHS. The assumptions made in the
example are listed here:
1) Each component is analyzed as a control volume at steady state;
2) There are no pressure drops for flow through heat exchangers;
3) The compressor and turbine are adiabatic;
4) Kinetic and potential energy effects are negligible;
5) The working fluid is air modeled as an ideal gas.
Of these assumptions, the last one cannot be fulfilled by the simulation model, since when
fuel is added and combusted, the mass flow rate and composition of working fluid will
change; while the working fluid remains the same throughout the process in the book
example. This will thus induce some difference in the results.
The operation parameters specified by the reference are summarized in Table 5-1.
Table 5-1. Operation parameter summary for the validation reference system [1]
Operation parameter Value Unit
Mass flow rate of inlet air 5.807 kg/s
Temperature of inlet air 300 K

240
Pressure of inlet air 100 kPa
Intercooler operation pressure 300 kPa
Reheater operation pressure 300 kPa
Turbine inlet temperatures 1,400 K
High pressure compressor inlet temperature 300 K
Pressure ratio across the two-stage compressor 10
Pressure ratio across the two-stage turbine 10
Isentropic efficiency of each compressor and turbine stage 80%
Regenerator effectiveness 80%
In the simulation, the mass flow of fuel is determined by the enthalpy balance in the
combustor to ensure the temperature of combustion gas at the outlet of combustor is 1,400
K as given in the reference. The composition of natural gas is chosen as in an example in
Moran’s book [1] and is shown in Table 5-2. The lower heating value (LHV) of this fuel
is the weighted total of the LHV of each component with respect to their composition and
is calculated as 41,809 kJ/kg.

241
Table 5-2. Composition of the fuel used in the validation [1]
Component Percentage
CH4 80.62%
C2H6 5.41%
C3H8 1.87%
C4H10 1.6%
N2 10.5%
The comparison results between the reference and simulation are shown in Table 5-3. The
relative difference is only a few percent. Considering the mass flow rate change of working
fluid (mass flow rate of fuel is 1.6% of mass flow rate of inlet air, given by simulation) as
discussed before, the simulation model was validated.
Table 5-3. Comparison results between the reference and simulation for the validation
system
Performance criteria Reference [1] Simulation Relative difference
Mass flow rate of fuel [kg/s] 0 0.095 -

242
Compressor power input [kW] 1,704 1,705 0.06%
Turbine power output [kW] 3,750 3,851 2.6%
Net power output [kW] 2,046 2,146 4.7%
Total energy input rate [kW] 4,622 4,750 2.7%
Energy efficiency 0.443 0.452 2.0%
As an illustration, the T-s diagram of the validated reference system (Fig. 5-12) is shown
in Fig. 5-13. When the AHS is introduced, point 6 will move upward along the line from
point 5, as far as point 7 in which case combustor 1 is not needed, depending on how much
AHS is used in the hybrid system.
Note that in the validation process, no pressure drop is considered, which is not the case in
reality. Pressure drops in heat exchangers can have negative influence on system
performance. The next step is study the exergy destruction in each component of the system
to determine the potential of improvement, while considering pressure drops.

243
Fig. 5-13. T-s diagram of the validation system in Fig. 5-12 using the assumptions in
Table 5-1
5.5.3. Reference system simulation
Before doing component exergy analysis for the system, we need to construct the system
using practical operation parameters. We will first simulate the reference system in which
no AHS is used and then study the effect after the introduction of the AHS.
The operation parameters for the reference system are summarized in Table 5-4.

244
Table 5-4. Operation parameters for the reference power generation systems based on
the Brayton cycle with intercooling, reheat and heat regeneration
Operation parameter Value Unit
Mass flow rate of inlet air (normalized) 1 kg/s
Temperature of inlet air 288 K
Pressure of inlet air 101.3 kPa
Turbine inlet temperatures 1,623 K
High pressure compressor inlet temperature 288 K
Pressure ratio across the two-stage compressor 17
Pressure ratio across the two-stage turbine 17
Isentropic efficiency of each compressor stage 88%
Isentropic efficiency of each turbine stage 90%
Combustor energy efficiency 98%
Compressor mechanical efficiency 98%
Turbine mechanical efficiency 98%

245
Air intake system pressure drop* 2%
Exhaust system pressure drop* 3%
LPC compression ratio 4
HPC expansion ratio 4
Intercooler hot side pressure drop* 5%
Regenerator cold side pressure drop* 2.5%
Combustor 1 pressure drop* 5%
Combustor 2 pressure drop* 5%
Regenerator hot side pressure drop* 2.5%
Regenerator pinch point temperature 10 K
* Pressure drop is defined as the difference of the outlet and inlet pressure of a component
relative to the inlet pressure of that component.
The calculated energy efficiency is 55.8%, which is smaller than 58.9% when no pressure
drop is considered. We can see that there is an absolute 3.1% change for energy efficiency
when considering the effect of pressure drops on system performance.

246
The T-s diagrams showing both the reference system with and with pressure drop are
shown in Fig. 5-14. The symbol (×) indicates the points calculated with pressure drops;
while the round symbol (°) indicates the points calculated without pressure drops. For the
same design point, the point calculated with pressure drop (× symbol) is placed to the right
side to the point without pressure drop (°symbol), since the pressure drop introduces
entropy increases during the heat transfer process.
Fig. 5-14. T-s diagram of the reference power generation systems based on the Brayton
cycle with intercooling, reheat and heat regeneration (×: pressure drops considered, °:
pressure drops not considered)

247
The physical properties at each design point calculated with pressure drops are summarized
in Table 5-5. Other main operation data are summarized in Table 5-6.
Table 5-5. Physical properties at each design point for the reference power generation
systems based on the Brayton cycle with intercooling, reheat and heat regeneration, with
pressure drops
Design
point
Mass flow rate
[kg/s]
Temperature
[K]
Pressure
[kPa]
Specific
enthalpy
[kJ/kg]
Specific
entropy
[kJ/kg-K]
0 1.0000 288 101.3 288.3 6.82
1 1.0000 288 99.3 288.3 6.83
2 1.0000 446 397.1 448.1 6.87
3 1.0000 300 377.2 299.6 6.49
4 1.0000 481 1,687.7 482.9 6.53
5 1.0000 1,246 1,645.5 1,334.2 7.59
6 1.0000 1,246 1,645.5 1,334.2 7.59
7 1.0122 1,623 1,603.3 1,882.1 7.91
8 1.0122 1,219 400.8 1,380.5 7.95

248
9 1.0259 1,623 380.8 1,983.6 8.29
10 1.0259 1,256 107.1 1,514.1 8.33
11 1.0259 551 104.4 684.1 7.38
12 1.0259 551 101.3 684.1 7.39
Table 5-6. Simulation results for the reference power generation systems based on the
Brayton cycle with intercooling, reheat and heat regeneration, with pressure drops
Value Unit
Mass flow rate of fuel for Combustor 1 0.012 kg/s
Mass flow rate of fuel for Combustor 2 0.014 kg/s
Total compressor power input 350 kW
Total turbine power output 960 kW
Net power output 611 kW
Heat addition rate for Combustor 1 512 kW
Heat addition rate for Combustor 2 582 kW
Total heat addition rate 1,094 kW

249
Energy efficiency 55.81 %
5.5.4. Reference system exergy analysis
Before making exergy analysis for reference system, we need to find the chemical exergy
of fuel. The chemical exergy equation for mixture is widely known [1] as
ch ,ch 0
1 1
lnj j
ii i i
i i
b y b RT y y
(5.41)
in which ,chib [kJ/kmol] and iy is the standard chemical exergy and mole fraction of
species i , R [kJ/kmol-K] is universal gas constant and 0T [K] is dead state temperature.
Based on the composition of the fuel used in the simulation (given in Table 5-2) and
standard chemical exergy of its component given in [1], the chemical exergy of the fuel
used in the simulation is
ch ,ch 0
1 1
ln 0.8062 831,650 0.0541 1,495,840
0.0187 2,154,000 0.016 2,805,800 0.105 720
0.8062ln 0.8062 0.0541ln 0.05418.314 288
0.0187ln 0.0187 0.016ln 0.016 0.105ln 0.105
834,952 kJ/
j j
ii i i
i i
b y b RT y y
kmol
(5.42)

250
The specific chemical exergy of the fuel is thus
ch 52,045 kJ/kgb (5.43)
The chemical exergy flow from the fuel, chB [kW], can thus be found using
ch f chB m b (5.44)
in which fm [kg/s] is the mass flow rate of fuel, which is calculated from the simulation.
Since the fuel is simulated to be injected at environmental temperature and pressure, the
physical exergy of fuel is 0. Neglecting kinetic exergy and potential exergy, which is small
compared with chemical exergy, the total exergy of the injected fuel can thus be regarded
as its chemical exergy.
Inlet air is assumed to be at environmental temperature, pressure and composition, so its
physical and chemical exergy are both 0. Since our interest is in the exergy destruction in
each component and the velocity and height of fluid cannot be determined by the
simulation, the kinetic exergy and potential exergy will be neglected. The total exergy flow
of the air into the system is thus 0.
The exergy destruction in component is defined by the difference between the total inlet
exergy flow rate and total outlet exergy flow rate. The results, together with exergy
destruction breakdown, are summarized in Table 5-7 and Fig. 5-15.

251
Table 5-7. Component exergy breakdown for the reference power generation systems
based on the Brayton cycle with intercooling, reheat and heat regeneration
Component
Exergy destruction
rate [kW]
Exergy destruction
fraction
Compressor inlet 1.7 0.4%
Low-pressure compressor 16.3 3.4%
Intercooler 33.7 7.1%
High-pressure compressor 17.5 3.7%
Regenerator 23.2 4.9%
Combustor 1 147.4 31.2%
High-pressure turbine 24.6 5.2%
Combustor 2 174.7 36.9%
Low-pressure turbine 31.3 6.6%
Turbine outlet 2.7 0.6%
TOTAL 473.2 100.0%

252
Fig. 5-15. Component exergy destruction breakdown for the reference power generation
systems based on the Brayton cycle with intercooling, reheat and heat regeneration
We can see that the two combustors have the most exergy destruction fractions of the total
exergy destruction of the system, with each combustor accounts for about 1/3 of the total
exergy destruction. This is largely due to the irreversible chemical reactions and large
temperature difference during heat transfer in the combustors, when we use the combustors
to heat the working fluid by burning fuel. This suggests that we should try to minimize the
exergy destruction in the combustors. One way to achieve that is perhaps to use a lower
Compressor inlet, 0.4%
Low-pressure compressor, 3.4%
Intercooler, 7.1%
High-pressure compressor, 3.7%
Regenerator, 4.9%
Combustor 1, 31.2%
High-pressure turbine, 5.2%
Combustor 2, 36.9%
Low-pressure turbine, 6.6%
Turbine outlet, 0.6%

253
temperature heat source to partially preheat the working fluid before heated by burning
fuel. This may reduce the fuel usage and thus the exergy destruction in the combustion
process. As will be shown in the next section, it indeed reduces the exergy destruction in
the combustors.
5.5.5. Hybrid system exergy analysis
As we can see from Fig. 5-11, when an additional heat source (AHS) is added between the
regenerator and combustor 1, less fuel will be needed in combustor 1 to heat the working
fluid to the designed maximum temperature of the system. If there is enough AHS input,
no fuel for combustor 1 is needed and this is the maximal amount of possible added AHS.
We will first determine this maximum value.
In the reference system, we have assumed that the pressure drop of combustor 1 is 5% of
the pressure at the outlet of the high-pressure compressor. In the hybrid system, we may
assume that the pressure at the outlet of combustor 1 remains the same for the hybrid and
the reference system.
The pressure drop of the AHSC may vary depending on the type of AHSC, directly or
indirectly using a heat exchanger. Based on the previous available date about pressure
drops for the intercooler and regenerator, which is 5% and 2.5%, respectively, for
pressurized air side, we may assume the pressure drop of the AHSC for pressurized air side
as 3%.

254
Limiting case for the AHS heat input
When the AHS is solely used to preheat the working fluid to HPT designed inlet
temperature and no fuel is needed in combustor 1, the amount of the AHS needed reaches
its maximum amount, and this case will be regarded as the limiting case. For comparison,
we have assumed that the energy conversion efficiency of LTHS is the same as that for
combustor 1 (98%), while it could be lower in practice, which will be discussed in the next
section.
5.5.5.1.1. Energy analysis
The physical properties at each design point calculated with pressure drops are summarized
in Table 5-8. Other main results are summarized in Table 5-9.
Table 5-8. Physical properties at each design point in Fig. 5-11 for the hybrid power
generation systems based on the Brayton cycle with intercooling, reheat and heat
regeneration in the limiting case
Design
point
Mass flow
rate [kg/s]
Temperatu
re [K]
Pressure
[kPa]
Specific
enthalpy [kJ/kg]
Specific entropy
[kJ/kg-K]
0 1.000000 288 101.3 1.2258 288.31
1 1.000000 288 99.3 1.2013 288.31
2 1.000000 446 397.1 3.0967 448.10

255
3 1.000000 300 377.2 4.3851 299.76
4 1.000000 481 1,687.7 12.1550 482.96
5 1.000000 1,255 1,645.5 4.5475 1344.20
6 1.000000 1,623 1,594.8 3.4111 1787.70
7 1.000000 1,623 1,510.5 3.2311 1787.70
8 1.000000 1,211 377.6 1.0851 1291.50
9 1.013334 1,623 358.7 0.7633 1889.60
10 1.013334 1,265 107.1 0.2926 1443.70
11 1.013334 523 104.4 0.6896 593.54
12 1.013334 523 101.3 0.6689 593.54
Table 5-9. Operation data for the hybrid power generation systems based on the Brayton
cycle with intercooling, reheat and heat regeneration in the limiting case
Value Unit
Mass flow rate of fuel for combustor 1 0 kg/s
Mass flow rate of fuel for combustor 2 0.013 kg/s

256
Total compressor power input 350 kW
Total turbine power output 929 kW
Net power output 579 kW
Heat addition rate from the AHS 452 kW
Heat addition rate for combustor 1 0 kW
Heat addition rate for combustor 2 569 kW
Total heat addition rate 1,021 kW
Energy efficiency 56.69 %
We can see that, compared to the reference system,
1) Compressor power inputs remained the same, since air inlet condition and compressor
configurations remained the same;
2) Turbine power output decreased by 31 kW (3%), due to the decrease in the mass flow
rate of the working fluid in the turbine (without the addition of fuel added in
combustor 1);
3) Net power output decreased by 32 kW (5%), due to the decrease in turbine power
output;
4) AHS (combustor 1) heat addition rate decreased by 69 kW (13%), since higher
energy conversion efficiency for the AHSC (100%) compared with combustor 1

257
(98%), and higher regenerated temperature (1,265 K for hybrid system and 1256 K
for the reference system);
5) Combustor 2 heat addition rate decreased by 13 kW (2%), due to lower mass flow
rate of working fluid in the high-pressure turbine;
6) Total heat addition rate decreased by 73 kW (7%), due to decrease in heat additional
rates for the AHSC (combustor 1) and combustor 2;
7) Energy efficiency increased from 55.81% to 56.69%, since decrease in heat additional
rate (7%) is larger than decrease in net power output (5%), but such small difference
is within the error band of the analysis.
The energy-related results indicate that replacingcombustor 1 with the AHSC whose
energy conversion efficiency is 100% and higher than that of the combustors (98%)
reduces the mass flow rate of working fluid (since less fuel is injected into the
combustor) and thus the net power output (since the turbine power output is proportional
to the mass flow rate of the working fluid), but increases the energy efficiency of the
system (from Eq. (5.15)). There is also little room to improve the energy efficiency of the
hybrid system since the energy conversion efficiency of the AHSC has already been
maximized to 100% in this analysis. The efficiency of the combustor also has little room
to improve since it is already very high (98%) after having been developed for so many
decades. The feasible ways to improve the energy efficiency of the hybrid system is to
increase the top temperature of the system or the turbine inlet temperature (TIT) and
increase the isentropic efficiencies of the compressor and turbine by doing experiments or
detailed simulation within the compressor and turbine. All of these methods are beyond
the scope of the dissertation and my ability.
5.5.5.1.2. Exergy analysis
The calculation method of exergy destruction rate for every component is the same as in
reference system exergy analysis in Section 5.5.4, except for the AHSC.

258
From the energy analysis, we have known the heat input rate for the AHSC. The exergy
input rate, however, does not solely depend on the heat input rate, but also an “effective
temperature effT ” of the heat source. Using Carnot efficiency, the exergy input rate for the
AHSC can be calculated by
0 0AHS 14 AHS 14
eff eff
1 1T T
B B Q QT T
(5.45)
in which 0 288 KT is the dead state temperature.
Thus, the exergy destruction rate in the AHSC can be calculated by
D,AHSC 5 14 6B B B B (5.46)
For the solar heat source, the effective temperature can be regarded as the temperature at
sun surface, which is about 5,800 K. For hot fluid as heat source, such as pressurized air in
the solar tower, the effective temperature is the temperature of the fluid. For complete
discussion, we will consider two scenarios:
1) The sun surface temperature is defined as the AHS temperature when solar heat is used
as the AHS, i.e. eff ss 5,800 KT T ;
2) The temperature of the hot fluid is defined as the AHS temperature and is 10 K higher
than the temperature at the AHSC outlet, i.e. eff 6 10 1633 KT T .

259
The exergy destruction rate breakdown in each component in the hybrid system are shown
in Fig. 5-16 and Fig. 5-17, respectively, for the above two scenarios, with emphasis on the
AHSC.
Fig. 5-16 The exergy destruction rate breakdown in each component for the hybrid power
generation systems based on the Brayton cycle with intercooling, reheat and heat
regeneration in the limiting case (the AHS temperature is defined as the sun surface
temperature when solar heat is used as the AHS)
Compressor inlet1%
Low-pressure compressor
5%
Intercooler10%
High-pressure compressor
5%
Regenerator3%
AHSC7%
Combustor 11%
High-pressure turbine
7%
Combustor 256%
Low-pressure turbine
4%
Turbine outlet1%

260
Fig. 5-17. The exergy destruction rate breakdown in each component for the hybrid
power generation systems based on the Brayton cycle with intercooling, reheat and heat
regeneration in the limiting case (the AHS temperature is defined as 10 K higher than the
AHSC outlet temperature)
It can be seen that when the AHS temperature is defined as the sun surface temperature,
the exergy destruction rate in the AHSC is “larger” than if defined based on the outlet
temperature of the AHSC (10 K higher in the case study but could be other values in
Compressor inlet, 0.4%
Low-pressure compressor, 4.1%
Intercooler, 8.5%
High-pressure compressor, 4.4%
Regenerator, 2.4%
AHSC, 20.5%
Combustor 1, 1.2%
High-pressure turbine, 6.0%
Combustor 2, 48.1%
Low-pressure turbine, 3.8%
Turbine outlet, 0.7%

261
practice). It should be noted that this is only a matter of definition of the AHS temperature.
While it is not practical to use solar heat at the sun surface temperature (about 5,800 K),
the AHSC-based AHS temperature also has its drawback since it does not consider the full
potential of doing work from solar energy. For example, the heat from the AHSC that
generates higher temperature can do more work than the same amount of heat from the
AHSC that generates lower temperature. It will thus make it hard to compare the
performance of two solar-assisted power generation systems using solar heat at different
temperatures. Both methods have been used by researchers and there is no agreement on
which method to use in the future. This study shows the difference between the results
from different definition of the AHS temperature.
Although some results (such as the exergy destruction rate in the AHSC and the system
exergy efficiency) are different based on different solar exergy definitions, it does not mean
that the performance of the system will change based on different solar exergy definitions.
The solar exergy definition is only used in determining the exergy destruction rate in the
AHSC and will not affect other equipment analysis results (such as the exergy destruction
rate in the combustors).
Different system exergy efficiencies are not comparable to each other unless they use the
same solar exergy definition. This, however, does not invalidate the results from the
previous thermodynamic analysis. The thermodynamic analysis has already included the
effect of solar exergy definition in the determination of the exergy conversion efficiency

262
of the AHS, AHS . The comparisons of the hybrid system and the reference system and the
sensitivity analysis of the hybrid system were all based on different AHS .
The results also showed that the exergy destruction fraction in the AHSC of the total exergy
destruction of the hybrid system is less than exergy destruction fraction of the combustor
1 of the total exergy destruction in the reference system (the numbers can be easily read
from Figs. 5-18-5-19 and will not be repeated here). This is mainly because the exergy
destruction in the combustor during fuel combustion is higher than that in the AHSC in
which the temperature difference between the heat source (solar heat) and the working fluid
(pressurized air) is small.
Sensitivity analysis for the hybrid system
After considering the limiting case when the amount of low temperature heat source
reaches its maximum value, we now study the influence of the AHS on the energy
efficiency of the hybrid system, h , by doing sensitivity analysis of the energy efficiency
of the hybrid system with respect to the
1) AHS input fraction of the total energy input, AHSX , (defined in Eq. (2.17));
2) AHS exergy input rate, AHSB , (defined in Eq. (5.45) and the temperature of the
AHS is assumed to be 10 K higher than the outlet temperature of the AHSC);
3) AHS temperature (expressed by a dimensionless parameter as 6 5
7
T T
T
in Fig.
5-11);

263
4) AHS energy conversion efficiency, AHS .
Fig. 5-20 shows the relation between the energy efficiency of the hybrid Brayton system,
h , and the AHS input fraction of total energy input, AHSX , for different energy
conversion efficiency of the AHS, AHS . It can be seen that when AHS is 40%, 60% and
80%, adding the AHS will lower h . When AHS 100% , adding the AHS will increase
h . This was shown in the results from the thermodynamic analysis before in Eqs (5.15)
and (5.16).
It can also be seen from Fig. 5-20 that for a contain AHSX , higher AHS will increase h .
This suggests that it is worthwhile to increase AHS from the thermodynamic perspective.
For example, when AHS 29%X , doubling AHS from 40% to 80% will increase h by
an absolute value of 7%, from 47% to 54%.
Fig. 5-21 shows the relation between the energy efficiency of the hybrid Brayton system,
h , and the exergy input rate from the AHS, AHSB , for different energy conversion
efficiency of the AHS, AHS . Fig. 5-22 shows the relation between the energy efficiency
of the hybrid Brayton system, h , and the dimensionless parameter as 6 5
7
T T
T
in Fig. 5-11,
for different energy conversion efficiency of the AHS, AHS . These three figures show that
the overall performance of the hybrid cycles decreases except for unrealistically high AHS
efficiencies.

264
Fig. 5-20. The relation between the energy efficiency of the hybrid system and the AHS
input fraction of total energy input for different energy conversion efficiencies of the AHS
Fig. 5-21. The relation between the energy efficiency of the hybrid system and the AHS
exergy input rate for different energy conversion efficiencies of the AHS
30%
35%
40%
45%
50%
55%
60%
0% 20% 40% 60% 80%
Ene
rgy
effi
cie
ncy
of
the
hyb
rid
sy
stem
AHS input fraction of the total energy input
Energy conversionefficiency of the AHS =100%
Energy conversionefficiency of the AHS =80%
Energy conversionefficiency of the AHS =60%
Energy conversionefficiency of the AHS =40%
30%
35%
40%
45%
50%
55%
60%
0 500 1000
Ene
rgy
effi
cie
ncy
of
the
hyb
rid
sy
stem
Exergy input rate from the AHS [kW]
Energy conversionefficiency of the AHS= 100%
Energy conversionefficiency of the AHS= 80%
Energy conversionefficiency of the AHS= 60%
Energy conversionefficiency of the AHS= 40%

265
Fig. 5-22. The relation between the energy efficiency of the hybrid system and the
dimensionless parameter 6 5
7
T T
T
in Fig. 5-11 for different energy conversion efficiency
of the AHS
5.6. Conclusions of the thermodynamic analysis of hybrid power
generation systems based on Brayton cycle
This chapter mainly examines the thermodynamic features and performance of hybrid
power generation systems based on Brayton cycles. The thermodynamic analysis for the
hybrid power generation systems based on the simple Brayton cycle, Brayton cycle with
intercooling, Brayton cycle with reheat and Brayton cycle with heat regeneration was done,
respectively.
30%
35%
40%
45%
50%
55%
60%
0 0.1 0.2 0.3
Ene
rgy
effi
cie
ncy
of
the
hyb
rid
sy
stem
(T6-T5)/T7
Energy conversionefficiency of the AHS =100%
Energy conversionefficiency of the AHS =80%
Energy conversionefficiency of the AHS =60%
Energy conversionefficiency of the AHS =40%

266
The results showed that the energy efficiency of the hybrid system is lower that of the
single heat source reference system when 4 7CCAHS
LHV
h h
. Considering that
4 7CC
LHV
h h
is close to 1 and AHS 1 , adding the AHS to the single heat source
Brayton cycles will lower the energy efficiency of the reference system as Table 3-2
showed in the background review. The exergy efficiency, however, is not the case, and
h 0 when 4 7
CCH
f
A S
h h
b
or roughly
0AHS
AHS
1T
T . For example, when
AHS 800 CT and 0 15 CT , h 0 when AHS 0.73 .
Following the validation, a detailed simulation for the hybrid power generation systems
based on the Brayton cycle with intercooling, reheat and heat regeneration was done in the
dissertation. The results were compared for with and without the consideration of pressure
drops in the system and showed that the energy efficiency dropped 3.1% if pressure drops
were considered in the system. The results from the exergy analysis for each major
component of the single heat source reference system showed that the majority (68.1%) of
the exergy destructions happened in the combustors, in which fuel was burned. Considering
that, using the AHS to help heat the working fluid may decrease the exergy destruction in
the combustors and raise the exergy efficiency of the system. Another simulation was thus
done to test the performance of the hybrid system. The results showed that the total exergy
destruction of the system decreased by 16% (when the temperature of the solar heat is

267
defined as the sun surface temperature), or 28% (when the temperature the AHS is 10 K
higher than the temperature of the working fluid at the outlet of the AHSC). The sensitivity
analysis of the energy efficiency of the hybrid system with respect to the AHS input
fraction of the total energy input, exergy input rate from the AHS and the dimensionless
parameter 6 5
7
T T
T
in Fig. 5-11, for different energy conversion efficiency of the AHS was
also done. The results can be used to help researcher study the performance of the hybrid
power generation systems based on the Brayton cycles and suggested that effort should be
made in increasing AHS .
References for Chapter 5
[1] Moran M.J., Shapiro H.N., Boettner D.D., Bailey M.B., Fundamentals of Engineering
Thermodynamics, 8th ed. Wiley, 2014.

268
CHAPTER 6
THERMODYNAMIC ANALYSIS OF THERMAL HYBIRD
POWER GENERATION SYSTEMS BASED ON THE
COMBINED CYCLES
In combined-cycle power plants, the high temperature (typ. > ~500 °C) gas turbine exhaust
gas is used as the heat source for the Rankine cycle that could generate additional power
besides the gas turbine. The energy efficiency of commercial combined cycle power plants
is as high as about 60%, which is much higher than efficiencies of individual Rankine or
Brayton cycle. Combined cycle power plants are therefore used increasingly.
Hybrid combined cycles could be configured in ways shown in Fig. 6-1, by adding heat
sources in the topping cycle (Brayton), or the bottoming cycle (Rankine), or in both. The
T-s diagram of a hybrid combined cycle with AHS added in both the topping cycle and the
bottoming cycle is shown in Fig. 6-2. When the additional heat source (AHS) is added in
the topping cycle and fix the bottoming cycle, less fuel is needed while the net power output
of the system remains roughly the same. In this case, the hybrid combined cycle power
plant is often said to be in fuel-saving mode. When the AHS is added in the bottoming
cycle and fix the topping cycle, the fuel use in the top cycle remains the same, but the
power generation from the bottom cycle increases due to the higher energy input. In this
case, the hybrid combined cycle power plant is in the power-boost mode. In fact, it is easy

269
to know that when the net power outputs are fixed for all cycles, both modes reduce the
fuel usage. This research, however, does not fix the net power output, since the objective
here is to compare the energy and exergy efficiencies of the power cycles, which are the
more important criteria in assessing the performance of power cycles than the net power
output.
Fig. 6-1. Flow diagrams of hybrid combined cycle with three ways to add the additional
heat source(s) (AHS): added to Brayton cycle as AHS1, added to the Rankine cycle as
AHS2, and added to both cycles (HRSG: heat recovery steam generator, CEP:
condensate extraction pump, AHSC: additional heat source collection equipment)

270
Fig. 6-2. Qualitative T-s diagram of the hybrid combined cycle plant with two additional
heat sources (AHS) (QLT,1: heat input from the additional heat source at the topping
cycle, QLT,2: heat input from the additional heat source at the bottoming cycle, QHT: heat
input from the fuel in the combustor, QR: heat duty of the heat recovery steam generator,
——: isobars, - - - -: real processes)

271
6.1. Hybrid power generation systems based on the combined
cycle with the AHS added in the topping (Brayton) cycle
6.1.1. Introduction of the hybrid power generation systems based on
the combined cycle with the AHS added in the topping (Brayton) cycle
The flow diagram of the hybrid power generation systems based on the combined cycle
with the AHS added in the topping cycle (Brayton) is shown in Fig. 6-3. It could be seen
that the topping cycle of the combined cycle is the hybrid simple gas turbine cycle system
which was analyzed in CHAPTER 5. HRSG stands for “heat recovery steam generator”
composed of several heat exchangers and a steam generator (drum), and is used to heat the
working fluid in the bottoming cycle from state 7 to state 8 using the energy contained in
the exhaust gas from the gas turbine in the topping cycle. In the reference system
(conventional combined cycle power plant without the AHS), the only heat source is the
fuel added in the gas turbine in the topping cycle. The heat source for the bottoming cycle
is the heat from the gas turbine exhaust gas and no additional fuel is needed to drive it.

272
Fig. 6-3. Flow diagram of the hybrid combined cycle power plant with the additional
heat source (AHS) added in the topping (Brayton) cycle (HRSG: heat recovery steam
generator, CEP: condensate extraction pump, AHSC: additional heat source collection
equipment)

273
6.1.2. Thermodynamic analysis of the hybrid power generation
systems based on the combined cycle with the AHS added in the
topping (Brayton) cycle
According the energy balance for the control volume enclosing HRSG in Fig. 6-3, for the
hybrid and the reference system (Fig. 6-3 but without the AHSC), respectively,
a f 4 5 bc 8 7 ,m m h h m h h (6.1)
a f,0 4 5 bc,0 8 7 ,m m h h m h h (6.2)
in which bc 8m m [kg/s] is the mass flow rate of the working fluid in the bottoming cycle.
Thus we have
bc,04 5 bc
8 7 a f a f,0
mh h m
h h m m m m
(6.3)
or
abc a f 0
bc,0 a f,0 a 0 0
11 ,
1 1
m fm m m f f
m m m m f f
(6.4)
in which f and 0f are defined before, respectively, as the fuel-air ratio for the hybrid and
the reference system in Eqs (5.5) and (5.10).

274
Using Eq. (6.4), we have
bc 0
bc,0 0
1 1.1
m f f
m f
(6.5)
Therefore, the net power output from the bottoming cycle is
bc 8 9 7 6net,bc ST CEP
net,bc,0 ST,0 CEP,0 bc,0 8 9 7 6
= 1,m h h h hW W W
W W W m h h h h
(6.6)
in which the subscript bc stands for the bottoming cycle of the combined cycle, STW [kW]
and CEPW [kW] are the power output of the steam turbine and the power input to the CEP,
respectively.
Using the same assumptions and method in Section 5.1.2, the energy and exergy efficiency
for the hybrid combined cycle with the AHS added in the topping (Brayton) cycle are,
respectively,
3 4 2 1
h21
bc8 9
2
A
7
a
HS
61
LH
+
,
V
mf h h h hh h h h
hf
h
m
(6.7)

275
bc8 9 7 6
a
0
AH
3 4 2 1
h
21 2f
AHS S
1 +
1
,
mf h h h hh h h h
h Thf
Tb
m
(6.8)
and for the reference system are, respectively,
bc,0
0 8 9 71
a
4
0
6
0
3 2 +1
LHV,
mf h h h h
mh h h h
f
(6.9)
bc,0
0 8 9 73 4 2 1
f
0
6
a
0
+
.
1m
f h h h hm
h h
f
h
b
h
(6.10)
Using the same method in Section 5.1.2 and Eq. (6.6) we have the same results as for the
simple Brayton cycle, i.e. h 0 when 4 7CCAHS
LHV
h h
and h 0 when
0AHS
AHS
1T
T .
6.2. Hybrid power generation systems based on the combined
cycle with the AHS added in the bottoming (Rankine) cycle

276
6.2.1. Introduction of the hybrid power generation systems based on
the combined cycle with the AHS added in the bottoming (Rankine)
cycle
Besides integration into the topping cycle, the additional heat source (AHS) can also be
integrated into the bottoming cycle in a combined cycle power plant. AHS is usually
integrated into the heat recovery steam generator (HRSG) to preheat or vaporize some of
the HRSG feedwater. HRSG can be single-pressure type as shown in Fig. 6-4 or multi-
pressure type as shown in Fig. 6-5. Increasing the number of these pressure levels increases
the combined cycle efficiency at the expense of system complexity and cost. Small
combined cycle power plants have only one pressure level while large ones often use dual-
pressure or even triple-pressure HRSG. Sometimes a duct burner as shown in Fig. 6-4 is
used to maintain a steady power output when the AHS, such as solar power, input is not
sufficient to maintain a steady power output. When no back-up fuel is used, the power
output is variable because of solar input fluctuation.

277
Fig. 6-4. Flow diagram of a hybrid combined cycle power plant with single-pressure
HRSG with the additional heat source (AHS) added in the bottoming cycle (Adapted from
[1])

278
Fig. 6-5. Flow diagram of a hybrid combined cycle power plants with a dual-pressure
HRSG with the additional heat source (AHS) added in the bottoming cycle (Adapted from
[2]) (AC: air compressor, CC: combustion chamber; GT: gas turbine, SH: superheater,
EVA: evaporator, ECO: economizer, BFP: boiler feedwater pump, DEA: deaerator,
HRSG: heat recovery steam generator, CEP: condensate extraction pump, COND:
condenser, ST: steam turbine, SHE: solar heat exchanger, OILP: oil pump, COLL: solar
collector)
The heat from the additional heat source is added to the working fluid in the bottoming
cycle together with the heat from the gas turbine exhaust gas, regardless of the HRSG
configuration. As can be seen from Fig. 6-4 and Fig. 6-5, the AHSC can be added in various

279
locations in the HRSG and may thus have different temperature requirement. When the
AHS is used to heat the working fluid at lower temperature, the temperature requirement
of the AHS is also lower, and vice versa. For generality, the flow diagram of the combined
cycle power plant with the AHSC added in the HRSG is simplified as Fig. 6-6, in which
the HRSG and the AHSC are shown together in the “HRSG+AHSC” block.
Fig. 6-6. Flow diagram of the hybrid combined cycle power plant with the additional
heat source (AHS) added in the topping (Brayton) cycle (HRSG: heat recovery steam
generator, CEP: condensate extraction pump, AHSC: additional heat source collection
equipment)

280
6.2.2. Thermodynamic analysis of the hybrid power generation
systems based on the combined cycle with the AHS added in the
bottoming (Rankine) cycle
Using the same assumptions and method in Section 5.1.2, the energy and exergy efficiency
for the hybrid combined cycle with the AHS added in the bottoming (Rankine) cycle are,
respectively,
3 4 2bc
0 8 9 7 6
a
AD
1
D0
A
h
HS
1
LH
+
,
V
mf h h h h
m
Q
h
f
h h h
(6.11)
3 4 2 1bc
0 8 9 7 6
a
ADD 00
AHS A
h
f
HS
1
1
+
.
mf h h h hh h h h
m
Q Tf
Tb
(6.12)
According the energy balance for the control volume enclosing HRSG+AHS in Fig. 6-4,
for the hybrid and the reference system, respectively,
ST CEPfg 4 5 ADD bc 8 7 8 7 7 6
8 9 6 9
,W W
m h h Q m h h h h h hh h h h
(6.13)

281
ST,0 CEP,0
fg 4 5 bc,0 8 7 8 7 7 6
8 9 6 9
,W W
m h h m h h h h h hh h h h
(6.14)
in which fg 5 0 a1m m f m [kg/s] is the mass flow rate of system flue gas and is the
same for the hybrid and the reference system since the topping cycle is the same for both
systems.
Combining Eqs (6.13) and (6.14),
ADD bc bc,0 8 7 ,Q m m h h (15)
8 9
ST ST.0 ADD
8 7
,h h
W W Qh h
(16)
7 6
CEP CEP.0 ADD
8 7
.h h
W W Qh h
(17)
Thus the difference between the energy efficiency of the hybrid system and the reference
system is

282
GT C ST,0 CEP,0GT C ST CEPh 0
f AHS f
f ST CEP ST,0 CEP,0 AHS GT C ST,0 CEP,0
f AHS f
8 9 7 6
f AHS AHS AHS 0 f
8 7
f AHS f
AHS
W W W WW W W W
Q Q Q
Q W W W W Q W W W W
Q Q Q
h h h hQ Q Q Q
h h
Q Q Q
Q
8 9 7 6
AHS 0
f AHS 8 7
AHS bc AHS 0 ,
h h h h
Q Q h h
X
(6.18)
in which AHSX is the AHS input fraction of total energy input and was defined in Eq.
(2.16), and bc is the energy efficiency of the bottom cycle defined as
8 9 7 6
bc
8 7
.h h h h
h h
(6.19)
Since in practice the energy efficiency of the combined cycle is always larger than that of
its bottoming cycle, or
0 bc , (6.20)
and considering

283
AHS 1, (6.21)
we have
0 bc bc AHS. (6.22)
So from Eq. (6.18),
h 0 , (6.23)
and h increases with
AHS but decreases with AHSX .
Also, Eq. (6.18) can be written as
h AHS 0 AHS bc AHS1 ,X X (6.24)
meaning that the energy efficiency of the hybrid combined cycle system, h , is the
weighted total of the energy efficiency of the conventional combined cycle system, 0 ,
and that of the bottoming (Rankine) cycle system whose heat source is the AHS, and the
weighting factors are the heat input fractions of the total energy input, respectively, of the
hybrid system.
From Eqs (6.12) and (6.10), the difference between the exergy efficiency of the hybrid
system and the reference system is

284
GT C ST,0 CEP,0GT C ST CEPh 0
f AHS f
f ST CEP ST,0 CEP,0 AHS GT C ST,0 CEP,0
f AHS f
8 9 7 6
f AHS AHS AHS 0 f
8 7
f AHS f
AHS
W W W WW W W W
B B B
B W W W W B W W W W
B B B
h h h hB B B B
h h
B B B
B
8 9 7 6
AHS 0
f AHS 8 7
AHS bc AHS 0 ,
h h h h
B B h h
X
(6.25)
in which AHS is the exergy conversion efficiency of the AHS defined in Eq. (4.14) and
AHSAHS
f AHS
BX
B B
(6.26)
is the AHS exergy input fraction of the total exergy input.
Therefore, h 0 when
bc AHS 0 0 (6.27)
or

285
AHS 0
bc
AHS f
0
(6.28)
or
0
AHS 0 AHS 0AHS
f bc f bc
1T
T
(6.29)
or
0AHS
f bcAHS
0
.
1
TT
(6.30)
6.3. Conclusions of the thermodynamic analysis of hybrid power
generation systems based on the combined cycle
There are two ways to add the AHS in the power generation systems based on the combined
cycle.
When the AHS is added in the topping cycle (Brayton cycle) of the combined cycle (the
fuel-saving mode), the analysis and results are similar to those in CHAPTER 5 for the
hybrid power generations based on Brayton cycles. The energy efficiency of the hybrid
system is larger than that of the conventional single heat source system when

286
4 7CCAHS
LHV
h h
, and the exergy efficiency of the hybrid system is larger than that
of the conventional single heat source system when 0
AHS
AHS
1T
T . The results can be
used as easy criteria to determine whether the energy or exergy efficiency of the hybrid
system is larger than that of the conventional single heat source combined cycle system,
without the necessity of detailed calculation/simulation/experiment for the hybrid system.
When the AHS is added in the bottoming cycle (Rankine cycle) of the combined cycle
(power-boost mode), the energy efficiency of the hybrid system is smaller than that of the
conventional single heat source system. It increases with the AHS but decreases with
increasing addition heat source share, AHSX . The exergy efficiency of the hybrid system,
however, is larger than that of the conventional single heat source system when
0AHS
f bcAHS
0
1
TT
. This result suggests that the temperature of the AHS, AHST ,
should be designed so that it is smaller than 0
f bcAHS
0
1
T
, from the perspective of
exergy efficiency of the system. This guide thus saves much design effort before the detail
design of the hybrid power generation systems based on the combined cycle when the AHS
is added in the bottoming cycle. For example, when AHS 0.8 , f 1.04 , bc 0.4 ,
0 0.55 and 0 15 CT , the maximum AHS temperature is 456 °C for h 0 .

287
References for Chapter 6
[1] Dersch J., Geyer M., Herrmann U., Jones S.A., Kelly B., Kistner R., Ortmanns W.,
Pitz-Paal R., Price H., Trough integration into power plants—a study on the performance
and economy of integrated solar combined cycle systems. Energy 2004;29:947-959.
[2] Baghernejadand A., Yaghoubi M., Multi-objective exergoeconomic optimization of
an Integrated Solar Combined Cycle System using evolutionary algorithms. Int J Energ
Res 2011;35:601-615.

288
CHAPTER 7
THERMODYNAMIC ANALYSIS OF THERMOCHEMICAL
HYBRID POWER GENERATION SYSTEMS
7.1. Introduction of thermochemical hybrid power generation
systems
Different from the typical thermal hybrid systems that may involve chemical reactions in
the heat addition process only, if fuel combustion is used, thermochemical hybrid systems
are designed to include chemical reactions, typically to convert some hydrocarbon to
readily-usable fuel, altogether to result in a more efficient and less polluting power
generation system. In this type of system, lower temperature heat, such as solar, geothermal,
or waste, is converted by such chemical reactions to the chemical exergy of the ultimately-
combusted fuel (such as syngas).
Compared with thermal hybridization, thermochemical hybridization can have also the
advantage that it can allow conversion of the exergy of intermittent heat sources (such as
solar) to much higher fuel chemical exergy that is therefore much easier to store and
transport than the energy/exergy of such input heat sources. Furthermore, low/mid
temperature solar heat (~200 °C) is high enough to be used by a syngas-producing
reforming process, thus potentially reducing the total cost relative to conventional solar

289
thermal power plants that necessarily use more expensive solar collection equipment due
to their higher solar temperature.
Comprehensive work has been done on the hybrid power generation systems integrated
with thermochemical fuel conversion. Methane is the most widely used fuel in such hybrid
systems due to its high heating value, large reserve, low price and easiness to transport.
The reforming temperature that is required to reform methane to the syngas, however, is
over 600 °C, indicating high solar collector cost, since the cost of the solar collectors
usually increases with the solar temperature of the solar collectors. To reduce the cost of
the solar collectors, fuels that require lower reforming temperatures than methane were
studied and methanol is the most widely studied among them. This is because methanol
can be mass produced from coal gasification or chemical synthesis of syngas and easy to
transport due to its liquid form in environmental conditions. Other type of fuel can also be
used in the reforming process such as petroleum coke (petcoke) [1], coal [2] and biomass
[3] and heat sources other than solar can also be used, such as waste heat [4]. Table 7-1
summarized the thermochemical hybrid systems studied in the past (modified based on
[14]).
Table 7-1. A summary of past studies of thermochemical hybrid power generation
systems
System Chemical Additional Heat source Turbine inlet CO2 Performance

290
description reaction
Type
Tempera-
ture (°C)
Role
temperature
(°C)
capture
Gas turbine
cycle with
methane re-
forming [5]
CH4 +
2H2O →
CO2 +
4H2
Solar 800-1,000
Chemical
reaction
process heat
- None Fossil fuel saving:
25-40%
Combined
cycle with
methane
reforming [6]
CH4 +
2H2O →
CO2 +
4H2
Solar 600-900
Chemical
reaction
process heat
1,327 None
Annual thermal
efficiency: 47.6%
Solar share: 9.6%
Steam injected
gas
turbine cycle
with
nature gas
reforming [7]
CH4 +
2H2O →
CO2 +
4H2
Solar 600
Chemical
reaction
process heat
1,288 None Natural gas
saving: <20%
Combined
cycle with
solar methanol
decomposition
[29]
CH3OH
→ CO +
2H2
Solar 200-400
Chemical
reaction
process heat
1,300 None
Solar to electricity
efficiency: 18-
35% Exergy
efficiency: 50-
60%
CO2 emission:
310 g/kW h
HAT cycle with
Methanol
decomposition
[8]
CH3OH
→ CO +
2H2
Solar 175-210
Chemical
reaction
process heat
1,200 None
Solar to electricity
efficiency: 25-
39% Exergy
efficiency: 59.2%
Thermal

291
efficiency: 53.6%
Chemically
recuperated gas
turbine cycle
with solar
methane
reforming
[15,9]
CH4 +
2H2O →
CO2 +
4H2
Solar ~220
Latent heat
of reactant
H2O
evaporation
1,300 None
Thermal
efficiency: 51.2-
53.6%
Solar to electricity
efficiency:25-38%
Fossil fuel saving:
20%
Combined
cycle with
solar methane
membrane
reforming [10]
CH4 +
2H2O →
CO2 +
4H2
Solar ~550
Chemical
reaction
process heat
1,300
Membrane
reaction/separation
CO2 emission: 25
g/kW h
Exergy efficiency:
58%
Thermal
efficiency: 51.6%
Fossil fuel saving:
31.2%
Solar share: 28.2%
Solar to electricity
efficiency: 36.4%
Zero-emission
oxy-fuel
combustion
hybrid
cycle [17,11]
CH4 +
2H2O →
CO2 +
4H2
Solar 200-400
Latent heat
of reactant
H2O
evaporation
1,308
Oxy-fuel
combustion
Thermal
efficiency: 50.7%
CO2 capture ratio:
~100%
Hybrid
methanol-
(1)
CH3OH
Solar 150-500
Chemical
reaction
1,327
Chemical looping
combustion
Exergy efficiency:
58.4%
Solar to electricity

292
fueled
chemical
looping
combustion
[12,13]
+ MxOy
→ M +
CO2 +
H2O
(2) M +
O2 →
MxOy
process heat efficiency: 22.3%
CO2 emission: 130
g/kW h
Combined
cycle with
solar methanol
decomposition
[14]
CH3OH
→ CO +
2H2
Solar 200-250
Chemical
reaction
process heat
1,308 Pre-combustion
CO2 emission:
33.8 g/kW h
Exergy efficiency:
53.8%
Thermal
efficiency: 51.1%
Fossil fuel saving:
27.3%
Solar thermal
share: 17.6%
Solar to electricity
efficiency: 49.2%
Combined
cycle with
solar methanol
reforming [14]
CH3OH
+H2O →
CO2 +
3H2
Solar 200-250
Chemical
reaction
process heat
1,308 Pre-combustion
CO2 emission:
33.4 g/kW h
Exergy efficiency:
55.1%
Thermal
efficiency: 50.9%
Fossil fuel saving:
30.5%
Solar thermal
share: 21.5%
Solar to electricity

293
efficiency: 45%
Solar thermal
gasification of
coal for hybrid
solar-fossil
power and fuel
production [2]
CHxOy +
(1 − y)
H2O =
(x/2 +1 –
y) H2 +
CO
Solar 1,077
Chemical
reaction
process heat
- None
CO2 emission:
0.96 kg/kW h
Exergy efficiency:
33%
Thermal
efficiency: 35%
Polygeneration
system for
methanol
production and
power
generation with
solar-biomass
thermal
gasification [3]
- Solar 900
Chemical
reaction
process heat
- None Exergy efficiency:
50.69%
Chemically
Recuperated
Gas Turbine [4]
CH4 +
2H2O →
CO2 +
4H2
Waste
heat
596
Chemical
reaction
process heat
1,308 None
Thermal
efficiency: 47.3%
7.2. Thermochemical hybrid systems using methane as fuel

294
Unlike the thermal hybrid systems whose configurations can be classified into several
categories for further analysis, thermochemical hybrid systems have various configurations
that are harder to be grouped together. In this research, two case studies are introduced
about how this type of systems works and what advantages they have. “Solar
thermochemical upgrading” is explained and discussed, followed by more general
thermodynamic analysis of thermochemical hybrid systems. The first case analyzed in this
chapter focuses on a novel Chemically-Recuperated Gas-Turbine Power Generation
(SOLRGT) System proposed and described in [15-17].
7.2.1. System introduction
The flow diagram of SOLRGT is shown in Fig. 7-1, and all used operating parameters,
such as temperature, pressure and chemical parameters, are from [15]. It can be seen from
the flow diagram that solar heat collected by a parabolic concentrating solar collection
equipment at 200-250 °C is used to generate the steam needed for the following reforming
reaction, thereby converting the solar heat to that of the steam internal energy (stream 6 in
Fig. 7-1), which is then converted to the chemical exergy of the syngas generated in the
reformer, by using that steam, methane, and exhaust heat from the system gas turbine. The
fuel conversion process is by the reactions:
4 2 2CH +H O CO+3H H=206.11 kJ/mol (7.1)
2 2 2CO+H O CO +H H= 41.17 kJ/mol (7.2)

295
Reaction (7.1) is the methane reforming process, which is endothermic, with that heat
provided by the gas turbine exhaust gas (stream 16 in Fig. 7-1), at about 600 °C. At this
temperature, 20-50% conversion of methane (stream 10) is realizable and higher
conversion is achieved with more steam (stream 6), higher temperature and lower pressure
in the reformer. Reaction (7.2) is a shift reaction, which is exothermic and heat released
from it partially provides the heat needed for the methane reforming process of Eq. (7.1),
in addition to the heat from gas turbine exhaust heat.

296
Fig. 7-1. Schematic diagram of the SOLRGT cycle [15]
The produced hydrogen-rich syngas (about 19% H2, 8% CH4, 68% H2O, 4% CO2 and < 1%
CO when the steam/methane mole ratio is 6.1) from the reformer is then burned in the
combustor with the compressed air recuperated by the reformer exhaust gas. As Eqs (7.1)
and (7.2) show, both reactions are bi-directional, and the reactants composition shows that
they are not complete (not all of the methane is converted). The high temperature and
pressure (1,308 °C, 14.55 bar) produced syngas is then burned to generate power by the
turbine that drives an electricity generator.
To increase the efficiency of the system, internal heat recovery is incorporated, in cascade,
as shown in Fig. 7-2. The high temperature gas turbine exhaust gas (stream 16 in Fig. 7-1)
is first used to provide the heat needed in the reformer for the methane reforming reaction.
The exhaust heat from the reformer (stream 17) is then used to preheat the pressurized air
(stream 4) from the compressor. At last, the heat from the gas turbine exhaust heat is used
to preheat the pressurized water in the economizer (stream 7). The temperature of the
exhaust gas leaving the system is about 163 °C.

297
Fig. 7-2. Heat recuperation T-Q diagram for the SOLRGT system [15] (REF: reformer,
REP: recuperator, ECO: economizer)
A non-hybrid equivalent of the SOLRGT thermochemical system, which uses only one
type of heat source (methane) without the additional heat source is introduced for
comparative analysis. It is the chemically-recuperated gas turbine (CRGT) system [18]
shown in Fig. 7-3 with compressor intercooling (not shown in the figure), called IC-CRGT.

298
Fig. 7-3. Schematic diagram of the basic CRGT cycle [18] (HRSG: heat recovery steam
generator)
Fig. 7-3 shows that the CRGT flow diagram is roughly the same as SOLRGT, except that
the incoming water (stream 3 in Fig. 7-3) needed for the reforming is preheated and
vaporized by the gas turbine exhaust gas (stream 12), instead of by solar heat as in
SOLRGT. Compared with SOLRGT, this characteristic introduced more exergy

299
destruction in the heating of the incoming water because of the higher temperature
differences between the heating and heated streams than those in the SOLRGT, as can be
seen by comparing the T-Q diagrams in Fig. 7-4 (for CRGT) and 2 (for SOLRGT).
Fig. 7-4. Heat recuperation T-Q diagram for the IC-CRGT system [15] (REF: reformer,
HRSG: heat recovery steam generator)
In the IC-CRGT system, the exhaust heat from the hot side of the reformer (states 11 to 13
in Fig. 7-4) is used to preheat and vaporize the pressurized incoming water (stream 3 in

300
Fig. 7-3, states 4 to 9 in Fig. 7-4) in the HRSG. Since the temperature of water doesn’t
change during vaporization while the temperature of the heating gas does, the temperature,
difference between the heating and heated fluid is relatively large, as shown in Fig. 7-4, or
it can be said that the temperature match during the heat transfer process is worse. Since
the exergy destruction during heat transfer increases with the temperature difference
between the heating and heated fluid, there is a relatively larger exergy destruction when
using combustion gas to vaporize the incoming water. As seen from Fig. 3, the temperature
match in the SOLRGT, is better than in the IC-CRGT, but in addition to the temperature
differences the exergy destruction rate requires the knowledge of the specific temperatures
and the temperature-dependent heat capacities of the heating and heated fluids, as well as
the varying mass flow rate of the heated fluid during the process. Also, this method cannot
be used to calculate the exergy destruction in the reforming process. The total exergy
destruction shown in the processes described in Figs. 2 and 4 is therefore calculated as the
difference between the exergy decrease of heating fluid (turbine exhaust gas) and the
exergy increase of the heated fluid (water and steam-fuel mixture).
Our calculations (summarized in Table 1) show that the exergy destruction rate in the heat
transfer and reforming processes shown in Fig. 7-2 is 44.8 kW, which is 18% smaller than
in the processes shown in Fig. 7-4 (54.6 kW). Using the state points given in the references,
the exergy decrease of gas turbine exhaust gas is 16 19 332.0 kWB B for the
SORLGT and 16 19 334.6 kWB B for the IC-CRGT. For the SOLRGT, the exergy
increase of the incoming water in the economizer is 8 7 44.4 kWB B , the fuel-steam

301
mixture exergy increase in the recuperator is 13 12 54.4 kWB B , the pressurized air
exergy increase in the recuperator is 5 4 133.0 kWB B . For the exergy increase in the
cold side of reformer, chemical exergy is considered since the composition of the working
fluid changes in the reforming process. It was calculated that the physical exergy increase
is 14.2 kW and the chemical exergy increase is 41.2 kW. Thus the total exergy increase of
the cold side of the heated fluid is 44.4+54.4+133.0+14.2+41.2=287.2 kW. So the exergy
destruction shown in Fig. 7-2 is 332.0-287.2=44.8 kW. For the IC-CRGT, the exergy
increase of the heated fluid (water/steam) in the HRSG is 8 7 157.9 kWB B . In the
reformer, the physical exergy increase of the heated fluid is 71.2 kW and the chemical
exergy increase of the heated fluid is 50.9 kW. Thus the total exergy increase of the cold
side of the heated fluid is 157.9+71.2+50.9=280.0 kW. So the exergy destruction shown in
Fig. 7-4 is 334.6-280.0=54.6 kW.
Table 7-2. Exergy destruction calculation summary for the heat transfer and reforming
process in the T-Q diagrams for the SOLRGT and IC-CRGT
Total exergy decrease of
heating fluid (turbine exhaust
gas)
Exergy increase of the
heated fluid(s)
Exergy
destruction
SOLRGT 16 19 332.0 kWB B Incoming water in the
economizer
44.8 kW

302
8 7 44.4 kWB B
Fuel-steam mixture in the
Recuperator
13 12 54.4 kWB B
Pressurized air in the
Recuperator
5 4 133.0 kWB B
Physical exergy increase in
the reformer: 14.2 kW
Chemical exergy increase
in the reformer: 41.2 kW
IC-
CRGT 11 13 334.6 kWB B
Incoming water in the
HRSG
8 7 157.9 kWB B 54.6 kW
Physical exergy increase in
the reformer: 71.2 kW

303
Chemical exergy increase
in the reformer: 50.9 kW
SOLRGT has another advantage over the IC-CRGT: in the IC-CRGT system, the heat from
the gas turbine exhaust gas (stream 11 in Fig. 7-3) is used to both reform the methane and
vaporize the incoming water (stream 3). In the SOLRGT system, however, an additional
heat source (solar heat) is used to vaporize the incoming water, and some of the gas turbine
exhaust heat can be used to preheat the pressurized air. This will increase the temperature
of the pressurized air at the combustor inlet and reduce the fuel demand in the combustion
process, resulting higher system efficiency.
Yet another advantage of SOLRGT over the IC-CRGT, is the ability to produce larger
power output. In both systems, the power output of the turbine increases with the mass
flow rate of working fluid through the turbine, so the power output of the turbine increases
with higher steam-methane ratio for the same mass flow rate of the fuel. In the IC-CRGT,
the heat to vaporize the incoming water is provided by the turbine exhaust gas; while in the
SOLRGT, it is provided by an additional heat source. This means that the SOLRGT can
vaporize more incoming water than the IC-CRGT and thus have a higher steam-methane
ratio, resulting in a higher power output from the turbine.
Summarizing, the main features of the SOLRGT are:

304
(1) Solar heat at only 200-250 °C can be used for the methane reforming process, much
lower than heat at above 800 °C needed if methane is reformed directly. Since the
cost of the solar collection equipment rises with the generated temperature, this
results in a lower cost of required solar collection equipment. Also, compared with
fossil-fuel-only power plants, SOLRGT reduces carbon emissions when the
additional heat source does not generate carbon emissions, such as when using solar,
geothermal or waste heat.
(2) SOLRGT has a better temperature match (smaller temperature difference between
heating and heated fluid) in its heat exchangers as can seen from Fig. 7-2 and thus
lower exergy destruction during heat transfer process from Eq. (2.15), when
compared with the IC-CRGT.
(3) Compared with CRGT, which has only one heat source (methane), SOLRGT uses
an additional heat source (solar heat) to vaporize the incoming water. This leaves
more energy from the gas turbine exhaust gas to heat the pressurized air at the outlet
of the compressor, leading to smaller energy requirement for raising the
temperature of the combustion gas to the designed turbine inlet temperature
(1,300 °C), and consequently reducing the fuel consumption and increasing the
system efficiency.
(4) In IC-CRGT, the steam-methane ratio cannot be very high, since there may not be
enough energy in the gas turbine exhaust gas to vaporize the water in addition to
preheating the pressurized air and reforming the fuel. Due to the use of the

305
additional heat source (solar heat) in vaporizing the water, however, higher steam-
methane ratio can be achieved simultaneously in the SOLRGT. Since higher steam-
methane ratio usually results in higher power output, the SOLRGT has a potential
to produce more power than the IC-CRGT system.
7.2.2. Thermodynamic analysis of SOLRGT
One of the advantages of thermochemical hybrid systems was interpreted as the ability to
“upgrade” the energy quality of the additional heat, such as solar [15]. The indirect
upgrading process is shown in Fig. 7-5. There are two steps in the upgrading process: first
from solar heat to steam internal heat and then from steam internal heat to syngas chemical
exergy.
Fig. 7-5. Indirect upgrading the low/mid-level solar heat (Adapted from [15])

306
For control volumeⅠshown in Fig. 7-5, the energy balance and exergy balance equations
could be written, respectively, as
w sol s ,H Q H (7.3)
w sol s d,1.B B B B (7.4)
Similarly, for control volume Ⅱ, the energy balance and exergy balance equations could
be written, respectively, as
f s rec syn ,H H Q H (7.5)
f s rec syn d,2,B B B B B (7.6)
in which d,1B and
d,2B are the exergy destruction in the steam generation and reforming
processes, respectively. The enthalpy change relative to a reference condition, H ,
contains changes in both chemical and thermal energy, and the exergy change relative to a
reference condition, B , contains both chemical and thermal exergy changes.
Following [19], we use the “energy level” concept, , defined as the ratio of the changes
of the exergy and the enthalpy in a process,
,B
H
(7.7)

307
where B and H are the changes of exergy and enthalpy in a process, respectively. The
concept of is useful in exergy analysis because it represents the exergy change relative
to the corresponding energy change in thermal processes, and thus directly gives the
relation between them. When the reference state (environmental condition) is defined as
the same for all process, the symbol could be omitted in Eq. (7.7) and B and H stand
for the exergy and enthalpy of the stream, respectively.
For the transferred heat, the energy level tr could be determined by the Carnot equation
as
0
tr
tr
1 ,T
T (7.8)
in which 0T and
trT are the temperatures of environment and the transferred heat,
respectively.
For solar heat, sol could be expressed using Eq. (7.8) as
0
sol
sol
1 ,T
T (7.9)
in which solT is the solar temperature, or the temperature of the solar heat.
According to the definition of , sol can also be expressed by

308
sol
Solar exergy,
Solar energy (7.10)
which will be used in later analysis.
The of the fuel, such as methane, shown in Eq. (7.11), is the ratio of its specific chemical
exergy (fb ) and its lower heating value ( LHV ), both of which can be found in the
references, e.g. [20].
ff .
LHV
b (7.11)
Using the concept of , Eqs (7.3)-(7.6) could thus be simplified to find the difference
between the solar heat input and the produced syngas. It is shown in the following analysis
that the of the solar heat input is increased to that of syngas by the indirect
thermochemical upgrading process shown in Fig. 7-5.
According to the definition of ,
w w wB H (7.12)
sol sol solB Q (7.13)
s s sB H (7.14)
f f fB H (7.15)

309
rec rec recB Q (7.16)
syn syn synB H (7.17)
According to [21], the exergy destruction during heat transfer is caused by the difference
between the energy donor (the heat source that releases energy) and the energy acceptor
(the heat sink that absorbs energy), that could be expressed by
d ea ed ea ,B H (7.18)
in which eaH is the enthalpy change of energy acceptor, and
ed and ea are the of
the energy donor and energy acceptor, respectively.
In the steam generation process, exergy is destroyed when solar radiation is used to
generate steam. The energy donor is the solar radiation incident on the solar collection
equipment, and the energy acceptor is the steam that is generated. Thus, the exergy
destruction rate in this process is
d,1 sol sol sg ,B Q (7.19)
in which sg and sol are the of the steam generation heat and the solar heat,
respectively.

310
In the reforming process, exergy is destroyed due to the chemical reactions and the
temperature differences during the heat transfer. The energy donor is the gas turbine
exhaust gas that provides part of the heat needed for the endothermic reaction and the
energy acceptor is the chemical reaction. Thus the exergy destruction in reforming is,
d,2 rec ex rec ,B Q (7.20)
in which ex and
rec are the of the external heat input to the reformer and the reaction
heat, respectively.
Using Eqs (7.3) to (7.20), the total difference between the solar heat input and the
produced syngas is,
f rec wsyn sol f syn syn rec s w sol sg
s s sol
.H Q H
H H Q
(7.21)
Based on the assumptions and justifications in [15], we can quantify this difference for this
case from knowing that:
1) the fuel enthalpy input fH is approximately equal to its lower heating value (802.3
kJ/mol), which is much higher than the reforming heat recQ ( 98.8 kJ per mol of methane

311
used for the system) and the water enthalpy wH (89.0 kJ per mol of methane used for the
system);
2) the of methane,f 1.05 ;
3) the average of the reaction heat, rec 0.6 as driven through the turbine exhaust
heat at 500 °C (which is also the average temperature inside the reformer);
4) the of the syngas, syn 0.83 to 0.9 , depending on the syngas composition;
5) the of the solar heat, sol 0.4 using Eq. (7.8), when the temperature of the solar
heat is defined as the temperature at the outlet of the solar collection equipment and is
assumed to be 220 °C; In fact, the temperature of the solar heat may be defined in other
ways and the detail is discussed in Section 7.2.3;
6) s w 0.003 and sol sg 0.04 are small compared with
f syn 0.4 and syn rec 0.4 , because of the small temperature difference
between saturated steam and water, and between the solar heat (defined using the collector
outlet temperature at 220 °C) and the steam generation process absorbed heat.
7) s 295.9H kJ/(mol methane used for the system), so
f
s
2.7H
H and
rec
s
0.33Q
H ;

312
8) sol 206.9Q kJ/mol methane used for the system), so
w
sol
0.43H
Q .
The first term on the right side of Eq. (7.21) is thus much larger than the other terms there,
so syn sol 0 . This demonstrates that, the of the solar heat input is indeed
upgraded by this thermochemical process to the higher of the produced syngas. When
the solar heat temperature is used at 220 °C as in SOLRGT, the relative upgrade is
syn sol sol 1.2 .
7.2.3. Effect of the solar definition on the value of difference
between the produced syngas and the input solar heat
As shown in Section 7.2.2, the equations for calculating the difference between the
produced syngas and the input solar heat include one that is used to calculate the of the
solar heat, sol such as Eq. (7.8) used in [15], in which
tr was chosen as the temperature
of the steam generated by the solar heat, i.e. 220 °C. The solar is often called the “solar
exergy factor” [22] since it is also defined as the ratio between the solar exergy and its
energy. The solar energy that is absorbed by the system (equal to the enthalpy increase of
the working fluid heated by solar collectors) is easy to determine but not the solar exergy,
with the discussion about the appropriate way to calculate it having started decades ago
still remaining unresolved. For example, some publications, e.g. [23], recommend that the
of the solar heat (i.e. this solar exergy factor) is to be determined by using the

313
temperature at the sun surface, i.e. about 5,500 °C, in Eq. (7.8). Other expressions for the
solar exergy factor were also proposed [22-26]. Different forms of the solar expressions
and different choices of the solar temperature will obviously result in different values of
the solar (sol ), so the of the produced syngas in SOLRGT may not always be
higher than that of the solar calculated in ref. [15]. Consequently, a conclusion in [15]
that SOLRGT increases the of the input solar heat to that of the produced syngas, while
true for the way that the input solar heat was defined there, will be different for other solar
definitions.
According to the definition of exergy, using the temperature at the sun surface gives the
theoretical maximum work that can be obtained by using solar radiation While use of such
high temperatures in the definition may be currently impractical for heat-driven energy
devices, it could be employed when using methods that do not use solar energy as heat,
such as photovoltaic (PV) cells, which convert solar radiation directly to pure exergy
(electricity).
A practical way to define solar exergy is to use in Eq. (7.8) the top temperature of the solar-
heated material (e.g., the system working fluid), here the solar-generated steam in
SOLRGT. While this is not the absolute maximum of thermodynamic solar exergy, not
even the maximum among different type of the solar thermal collectors that could be used
for the same purpose, it is the maximal solar exergy for the considered system, and this
definition is used by many.

314
An alternative option is to choose the highest temperature that the working fluid can attain
in practice as the temperature of the solar heat to determine the solar radiation . This
choice averts the above-discussed problem associated with choosing the sun surface
temperature, since it is achievable in practice. It also averts the problem associated with
using the solar collection equipment outlet temperature since this temperature would be the
same for all thermal power cycles using solar heat. It still leaves, however, a problem: that
temperature is not fixed and will change as technology advances. No one used this method
in their research yet.
Considering the advantages and disadvantages of these methods, we suggest that using the
sun surface temperature as the solar temperature would be the best. It is the same for all
solar thermal power plants, and allows comparison of the solar thermal power plants with
solar PV power plants though they have no working fluid. It is currently also a most widely
used method to calculate solar exergy and the results are thus easy to compare with other
works.
For comparison, let us call the solar energy level used in section 7.2.2, in which the solar
temperature is assumed to be the solar collector outlet temperature, i.e. 220 °C, as the solar
heat energy level sol . Let us then call the solar energy level that uses the sun surface
temperature, i.e. 5,500 °C, as the solar surface energy level ss .
We now examine the indirect thermochemical upgrading process again, but replacing the
solar heat (that is nowsol ) with the solar surface (that is now
ss ). The derivations

315
are the same except that ss sg cannot be neglected becausess 0.95 when using
the sun surface temperature as the solar temperature in Eq. (7.9). Since syn is 0.83 to 0.9
[15], depending on syngas composition.
syn ss , (7.22)
i.e. the of the solar surface heat is not “upgraded”
It can thus be concluded that collector outlet temperature defined “solar heat” (as well as
other heat sources such as waste or geothermal heat) is upgraded by the thermochemical
process, but not the solar surface temperature based “solar surface heat”.
An interesting question is the temperature at which the additional heat input (such as the
solar in SOLRGT) is not upgraded to the of the produced syngas. This temperature can
be found by setting the of the syngas equal to the of the additional heat input.
According to the results from the SOLRGT, the average of the of the syngas is 0.865.
The temperature of the additional heat input (here Th) can thus be found using
0
h syn
h
1 0.865.T
T (7.23)
If the ambient temperature is h 298.15 KT , the temperature of the additional heat input
is calculated from Eq. (7.23) to be h 2208.5 K, or 1935 CT , which, incidentally, is

316
higher than the temperature of geothermal heat, waste heat, or at the solar collection
equipment outlet in most, if not all, cases.
7.3. Thermochemical hybrid system using methanol as fuel
Apart from methane (CH4) that is commonly used as fuel in power plants, including
thermochemical ones such as SOLRGT [27] discussed in Section 7.2, where it is reformed
to syngas and allows the effective use of soar heat as a secondary emissions-free input,
other fuels could also be used, such as methanol (CH3OH), which is often made from coal
as an easy to transport and use intermediate fuel and can then be thermochemically
reformed to syngas that can then be burned in power generation systems. Compared with
methane, one of the advantages to use methanol for reforming is that it has a lower
reforming temperature: methane reforming generally requires a temperature of around 700
- 1,000 °C with Nickel-based catalyst and is impossible below 327 °C [18], while methanol
could be decomposed easily (with a catalyst) at temperatures of 200 - 300 °C [28] as
introduced in Section 7.2.
Methane can be reformed directly by using solar heat at the needed high temperatures (700
- 1,000 °C), but SOLRGT requires the additional solar heat that thus reduces the cost of
the solar heat collection. At the same time, this type of indirect reforming process makes
the systems more complex and requires the use of the heat from gas turbine exhaust gas
and thus makes less of this heat available for internal heat recovery or for use in a bottoming
cycle, such as the heat source for Rankine cycle as in a combined cycle. The system

317
described and analyzed in this chapter resolves these two issues by using methanol, instead
of methane, as the reformed reactant, and by consequently adding a bottoming cycle that
uses the gas turbine exhaust gas as its heat source. This system allows the use of the solar
heat at about 200 °C to convert the methanol to syngas, and the gas turbine exhaust gas
that was used in SOLRGT to provide energy needed for the methane reforming reaction is
thus saved to be the heat source for making the bottoming cycle, and thus the combined
cycle, more efficient.
The studied system [ 29 ] is a methanol-fueled solar-assisted chemically-recuperated
combined cycle that we will call here SOLRMCC (called in [5] “solar thermal power cycle
with solar decomposition of methanol”) for short. Other cycles of this type (but with
different configurations) are described in [30,31]. Its flow diagram is shown in Fig. 7-6.
Compared with Fig. 7-8 showing the general thermochemical process, SOLRMCC has
only two inlet streams, fuel (methanol) and solar heat collected by the solar collection
equipment.

318
Fig. 7-6. Flow diagram for solar thermal power cycle with solar decomposition of
methanol, SOLRMCC [29] (HRSG: heat recovery steam generator)
Features of the hybrid solar thermal power cycle with solar decomposition of methanol:
(1) Upgrade of energy level ( ) from solar heat to chemical energy.
The energy level is defined by Eq. (7.11) and for liquid methanol LHV (the lower heating
value) = 19,920 kJ/kg and the standard molar chemical exergy (fb ) at 298 K and 1.0 atm
= 718,000 kJ/kmol (from [8]), so the liquid methanol energy level is

319
f
718,0001.125.
19,920 32.04
(7.24)
The difference between the energy level of the produced syngas and of the solar energy
input [29] is
syn sol f syn sol rec
sol
LHV,
Q (7.25)
in which syn ,
sol , f and
rec are the energy levels of the syngas, solar heat, fuel and
methanol decomposition reaction, respectively, and solQ is the solar heat absorbed by the
methanol decomposition reaction.
When the average temperature of the solar heat (collector outlet) is close to the temperature
of the reaction heat at 200-300 °C, the value of sol rec in Eq. (7.25) is relatively
small to f syn 1.125 0.88 0.245 , and since
sol
LHV4.6
Q [29], this
equation yields
syn sol . (7.26)
This means that the energy level of the solar input heat is upgraded to that of the syngas. It
was stated in [29] that the energy level of the syngas is 120% higher (2.2-fold) than that
of the solar input heat for the conditions and solar exergy definition used in [29]. In other

320
words, the thermochemical reaction upgraded the “quality” of the solar thermal input
energy 2.2-fold.
This relative magnitude of “thermochemical upgrading”, defined as syn sol sol ,
however, may be different for different chosen temperatures of the solar heat (or the solar
collection equipment average temperature), as could be seen from Fig. 7-7, in which the
“upgraded energy level” is defined as syn sol sol . It can be seen that the highest
“upgraded energy level” happens when the temperature of the solar heat is 200-300 °C and
is lower when outside this temperature range. This is caused by the relatively large exergy
destruction in thermochemical process due to relatively large temperature difference
between solar heat and methanol decomposition reaction.

321
Fig. 7-7. The relationship between the upgraded level of the solar heat and the collector
temperature for reforming of methanol and methane (adapted from [29]) (The ordinate is
the upgraded energy level defined as syn sol sol
Note that similarly to the result for SOLRGT, the energy level of the solar heat is upgraded
to the of the syngas only when the magnitude of the solar temperature is defined as the
temperature associated with the solar collection equipment. For example, reference [29]
used the “collector average temperature” as the temperature for the solar heat. When the
solar temperature is defined as the sun surface temperature, the of the solar heat will be

322
0.95, which will be roughly the same as that of the syngas. Thus using this definition, the
of the solar energy is not upgraded.
(2) Potential for reducing chemical exergy loss in combustion
In the studied system [29], methanol is utilized by an indirect process: methanol
decomposition to syngas and subsequent combustion of this produced syngas combustion.
It was calculated in [29] that at the temperature of 1,300 °C, when methanol is directly
burned, the exergy loss is 202.54 kJ/mol-CH3OH. This loss is ~14.5% of the chemical
exergy of the methanol. When methanol is used indirectly as in the SOLRMCC and burned
at the same temperature in the combustor, however, the exergy loss is lowered to 167.91
kJ/mol-CH3OH (including 13.26 kJ/mol-CH3OH in the process of methanol decomposition
and 154.61 kJ/mol-CH3OH in the process of syngas combustion). There is thus a 17%
reduction in the exergy loss using indirect combustion method as in the SOLRMCC,
compared with the exergy loss using direct combustion method.
(3) Significant improvement in middle-temperature solar heat use for electricity
generation
A useful performance criterion for evaluating the relative effect of using a solar-assisted
hybrid system relative to a conventional one that also not use solar assistance amount of
electricity generated from solar energy, i.e. net solar-to-electric efficiency is
h refse
rad
,W W
Q
(7.27)

323
in which hW and
refW are the power outputs of the studied hybrid system and of a
reference system (conventional gas turbine combined cycle with the same input of
methanol fuel as the hybrid system), respectively and radQ is the energy input rate from
the solar radiation [15-17].
The predicted net solar-to-electric efficiency of the hybrid system. se , is higher than 30%
when the solar collection equipment temperature is about 220-300 °C, and maybe as high
as 35% when the turbine inlet temperature is 1,300 °C and the solar collection equipment
temperature is 220 °C. This is attributed to the conversion of low-level solar energy into
high-level chemical exergy, which is then used in the high efficiency gas turbine process.
In this system, solar heat collected by the solar collection equipment (parabolic trough) at
220 °C was used to provide the heat needed for producing syngas. One part of the heat was
used to preheat, vaporize and superheat liquid methanol before the produced methanol
vapor entered the receiver-reactor. The other part of heat was then used to drive the
endothermic reaction:
3 2CH OH CO 2H H=62 kJ/mol (7.28)
at a temperature of 220 °C and at a pressure of 17 bar.
The energy level of the syngas produced by the SOLRMCC is 0.95, which is higher than
in the SOLRGT (0.83~0.9). Substituting syn 0.95 into Eq. (7.23), the temperature of

324
the additional heat input is calculated to be h 5,963 K (5,690 C)T , which,
incidentally, is higher than the temperature of geothermal heat, waste heat, or at the solar
collection equipment outlet in most, if not all, cases.
7.4. Thermodynamic background of thermochemical upgrading
7.4.1. Background and generalization of the thermochemical process
It was shown in Section 7.2 that the energy level ( ) of input heat sources can be
“upgraded” to that of the syngas, with specific attention to solar heat in the solar
thermochemical hybrid systems. This is clearly useful since thus the same amount solar
heat (energy) acquires a higher exergy due to the reforming process in the solar
thermochemical hybrid power systems, and thus has higher potential for generating work.
It was also shown that although it is true for heat sources whose energy level temperature
is uniquely defined, such as geothermal or waste heat, it isn’t necessarily true for solar heat
whose temperature is not. In this section we generalize the thermodynamic background of
the thermochemical process used in the above-introduced SOLRGT and SOLRMCC power
systems, and explains the dependency of on the heat source temperature definition. The
explanation starts by expressing the of syngas in terms of the thermodynamic properties
of each inlet stream.
The thermochemical process used in SOLRGT (Fig. 7-5) and in SOLRMCC (Fig. 7-6) can
be generalized as described by the control volume in Fig. 7-8, in which the steam

325
generation and reforming processes are lumped together. In Fig. 7-8, the fuel is not
constrained to methane as used in SOLRGT, the heat input (used to vaporize the incoming
water) is not constrained to solar, and heat sources like waste or geothermal heat could also
be used, and the higher temperature heat (used for the reforming reaction) is not constrained
to gas turbine exhaust has heat. The product of the thermochemical process is syngas,
typically containing H2, CO and possibly some unconverted fuel, H2O and CO2. The
enthalpy H and exergy E of each stream brought into the control volume are also shown.
Fig. 7-8. Generalized energy and exergy streams diagram for the thermochemical hybrid
process

326
7.4.2. Thermodynamic interpretation of the of syngas
To further generalize the system described by Fig. 7-8, the solar heat and auxiliary heat
shown in it can be replaced by any lower temperature heat (LT) and higher temperature
heat (HT). Based on which temperature is used to define it, the solar heat can be either LT
or HT compared to other heat sources, as further discussed below.
Based on the enthalpy and exergy balance of the control volume shown in Fig. 7-8,
respectively,
w f LT HT syn ,H H Q Q H (7.29)
w f LT HT d syn.B B B B B B (7.30)
Based on the definition Eq. (7.7),
w w wB H (7.31)
f f fB H (7.32)
LT LT LTB Q (7.33)
HT HT HTB Q (7.34)
syn syn syn.B H (7.35)

327
Substitution of Eq. (7.31)-(7.35) to Eq. (7.30) gives
w w f f LT LT HT HT d syn syn.H H Q Q B H (7.36)
The energy input fraction for each input stream to the control volume is defined here as
w f LT HT syn
,i ii
H H
H H Q Q H
(7.37)
in which the subscript i could stand for the steam of water, fuel, the additional heat or
higher temperature heat. Since
syni
i
H H (7.38)
or
1,i
i
(7.39)
then
0 1.i (7.40)
Substitution of Eq. (7.37) into Eq. (7.36) then gives
w w f f LT LT HT HT d syn syn.B H (7.41)

328
Considering that real processes always incur some exergy destruction, dE , where
d 0,B (7.42)
Eq. (7.42) becomes
w w f f LT LT HT HT syn. (7.43)
Since the first and second law of thermodynamics expressed in Eqs (7.29) and (7.30),
respectively, are used here, without any other assumptions, Eq. (7.43) must always be
satisfied. This means that there is a thermodynamic upper bound of the of the syngas
syn,max , which is
syn,max w w f f LT LT HT HT , (7.44)
according to (7.43).
If the thermochemical process is ideal, i.e. not accompanied by exergy destruction,
d 0E , Eq. (7.41) is reduced to
w w f f LT LT HT HT syn. (7.45)
The of the syngas, syn , can be expressed using the enthalpy fraction i and the
i
of each input stream of thermochemical process.
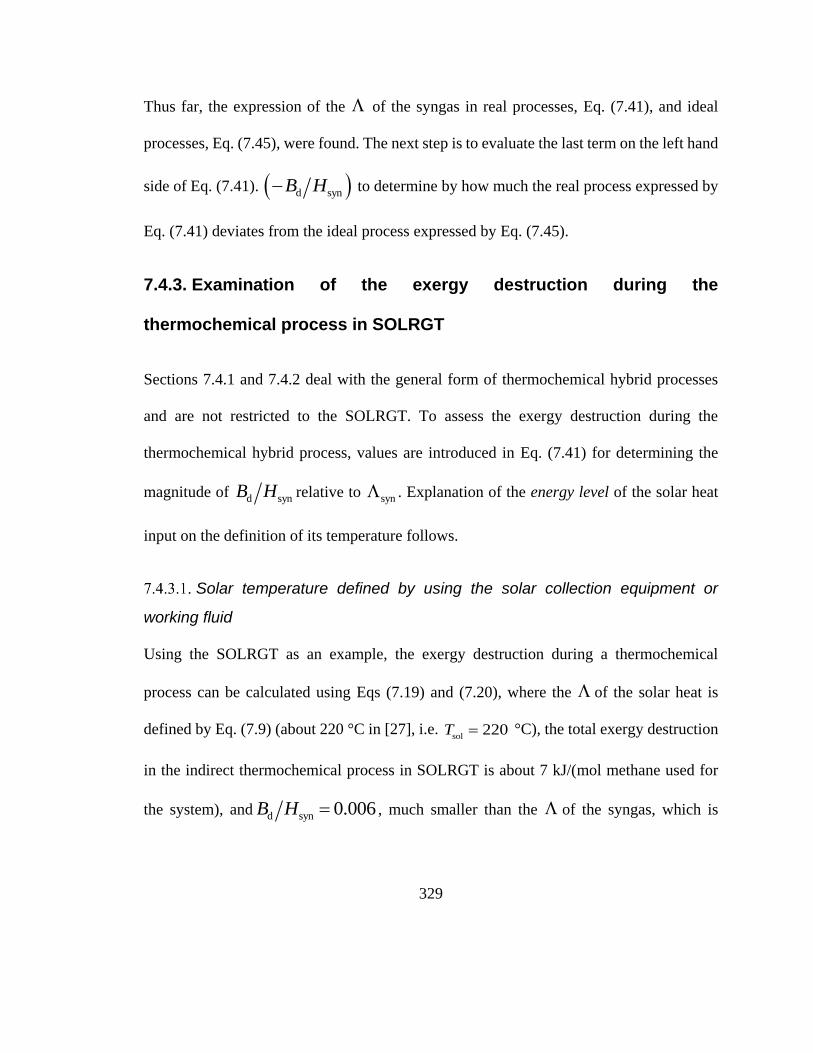
329
Thus far, the expression of the of the syngas in real processes, Eq. (7.41), and ideal
processes, Eq. (7.45), were found. The next step is to evaluate the last term on the left hand
side of Eq. (7.41). d synB H to determine by how much the real process expressed by
Eq. (7.41) deviates from the ideal process expressed by Eq. (7.45).
7.4.3. Examination of the exergy destruction during the
thermochemical process in SOLRGT
Sections 7.4.1 and 7.4.2 deal with the general form of thermochemical hybrid processes
and are not restricted to the SOLRGT. To assess the exergy destruction during the
thermochemical hybrid process, values are introduced in Eq. (7.41) for determining the
magnitude of d synB H relative to syn . Explanation of the energy level of the solar heat
input on the definition of its temperature follows.
Solar temperature defined by using the solar collection equipment or
working fluid
Using the SOLRGT as an example, the exergy destruction during a thermochemical
process can be calculated using Eqs (7.19) and (7.20), where the of the solar heat is
defined by Eq. (7.9) (about 220 °C in [27], i.e. sol
202T °C), the total exergy destruction
in the indirect thermochemical process in SOLRGT is about 7 kJ/(mol methane used for
the system), and d syn 0.006B H , much smaller than the of the syngas, which is

330
between 0.83 to 0.9. d synB H could thus be neglected in Eqs (7.41) and (7.45) can then
be used to estimate the of the syngas syn .
Solar temperature defined by using the sun surface temperature
Since there are different definitions of solar exergy, the amount of exergy destruction in
the solar heat addition process is different based on the chosen definition. This is because
the temperatures (or the ) of the working fluid at the outlet of the solar collection
equipment are the same regardless of the value of solar temperature but the value of solar
exergy input varies with the definitions of solar temperature. For the ease of analysis, the
total exergy destruction can thus be divided into two categories: one associated with the
solar heat addition process d,solB and one associated with other processes
d,otherB , such as
the reforming process. Eq. (7.41) can thus be rewritten as
w w f f LT LT d,sol syn HT HT d,other syn syn ,E H B H
(7.46)
in which d,sol d,other dB B B and the third term in the left hand side of Eq. (7.46)
represents the contribution to the of the syngas syn from the solar input.
Since all the other terms except LT LT d,sol synB H don’t vary with the definition of
solar temperature, LT LT d,sol synB H is also fixed for all definitions of solar exergy.

331
Using the results from section 3.1.1, LT LT d,sol syn d,other synB H B H is thus
roughly the same with the value of LT LT which is calculated using the solar collector
(or working fluid) temperature as the solar temperature. It can thus be concluded that Eq.
(7.45) can be used to estimate the of the syngas, as long as the solar , LT , is
calculated using the solar collector (or working fluid) temperature as the solar temperature.
The fact that LT LT d,sol synB H doesn’t change with the value of solar exergy level
(or solar exergy definition) also explains thermodynamically why the of the syngas
syn is not always higher than the of the solar energy sol (
LT ). Since the solar
energy input is well defined and doesn’t change with the definition of solar exergy,
LT LT d,sol synB H remaining unchanged indicates that the exergy destruction in the
solar heat addition process d,solB increases with the of the solar input
LT . The value
of LT is thus independent of syn and can be either higher or lower than syn ,
depending on the definition of solar exergy, or LT .
Generally, higher temperature differences between the heating and heated fluids lead to
smaller heat exchangers and thus to lower capital costs, but they raise the heat transfer
exergy losses and consequently reduce the system exergy efficiency and energy cost. When
reduction of energy use is the dominant objective, the temperature differences are designed
to be small in the thermochemical hybrid process. Equation (7.45) can then be used in a

332
process to determine the of the syngas and should thus apply to other thermochemical
hybrid processes as well.
Thermodynamic meaning of the of the syngas
Since the enthalpy and energy level of the inlet streams in Fig. 7-8 are independent of each
other, the energy level of the syngas syn could be regarded as the weighted average of the
energy levels of each of the input streams, i , and the weighting factors for each input
stream are the energy input fraction of each input stream i , defined by Eq. (7.37), which
is positive and the sum of the energy input fractions is 1 according to Eq. (7.39), i.e.
syn ,i i
i
(7.47)
1.i
i
(7.48)
Without further information, it can thus be concluded that the weighted average, which is
the of the syngas syn in Eq. (7.47), must be between the lowest ,mini and highest
,maxi of all input streams, i.e.
,min syn ,max.i i (7.49)
7.5. Advantages of solar thermochemical hybridization

333
7.5.1. Significant simplification of the solar energy storage and
transportation.
Conversion of the intermittent and varying solar energy to the high specific energy/exergy
synfuel by solar thermochemical systems allows compact and lower cost energy storage of
the fuel, optimally controlled rate of use of the fuel, and easy transportation of the energy.
7.5.2. Reduction of the solar heat temperature needed for power
generation plants, and consequently of the hybrid system cost.
Using solar energy for even a fraction of the energy needed for power generation plants
reduces emissions, including those of greenhouse gases, and conserves depletable fuels.
Direct use of solar heat in such plants needs it at turbine inlet temperatures between say
500 and 1,300 °C for steam and gas systems, respectively, and is thus expensive. Solar
thermochemical hybrid systems, such as the SOLRGT and SOLRMCC, allow lower
temperatures (down to about 200 °C) and thus cost, efficient use of solar energy in such
systems.
7.5.3. Increase of the solar-to-electricity efficiency (se ).
The solar-to-electricity efficiency of a thermochemical hybrid system using both fuel and
solar as heat sources, is defined by Eq. (7.27). In a solar-only power plant where solar heat
is the only heat source, the solar-to-electricity efficiency is the same as the power
generation efficiency of the power plant,

334
sol-only
sol-only
rad
.W
Q (7.50)
in which sol-onlyW [kW] is the power output of the solar-only power plant and radQ [kW]
is the heat input rate from the solar radiation.
Using Eqs (7.27) and (7.50), the difference between the solar-to-electricity efficiency of
the hybrid system and the solar only system, or the increase of the solar-to-electricity
efficiency through solar thermochemical hybridization, can be calculated by
sol-onlyh refse sol-only
rad rad
h f rad 0 f sol-only rad
rad
f h 0 rad h sol-only
rad
fh 0 h sol-only
rad
LHV+ LHV
LHV
LHV,
WW W
Q Q
m Q m Q
Q
m Q
Q
m
Q
(7.51)
in which f radLHVm Q is the ratio of the fuel heat input to the solar heat input into the
hybrid system. Generally, the solar share of a solar hybrid power plant, a widely used
performance criterion for solar hybrid systems, is defined as

335
radsol
ff rad
rad
1,
LHVLHV+1
QX
mm Q
Q
(7.52)
which is 0 for the fuel only power plants, 1 for the solar only power plants and between 0
and 1 for the solar hybrid power plants. In Eq. (7.52), f radLHVm Q can be expressed by
the solar share expression, solX , as
f sol
rad sol
LHV 1,
m X
Q X
(7.53)
whose theoretical range is from zero to infinity. For a practical range of solX , say between
0.2 and 0.8
f
rad
LHV0.25 4.
m
Q (7.54)
Using Eq. (7.53), Eq. (7.51) can be written as
solse sol-only h 0 h sol-only
sol
1.
X
X
(7.55)
Equation (7.55) shows that whether the solar-to-electricity efficiency increases through the
solar thermochemical hybridization depends on the relative magnitude of three terms, solX ,
h 0 and h sol-only .

336
For comparison, assume that the highest temperature in the solar thermochemical hybrid
system is the same as that of the reference fuel-only system (conventional gas turbine
power plant) and they use the same amount of fuel. Since the fuel only system and the
hybrid system use the same type of power generation cycle (Brayton) in the considered
SOLRGT and SOLRMCC and have the same highest cycle temperature, their energy
efficiencies should approximately be the same. In fact, according to [15], the energy
efficiency of the SOLRGT is 45.9%, while for the fuel only reference system (IC-CRGT)
it is 46.7%.
Also for comparison, assume that the temperatures of solar heat generated by the solar
collectors are the same for both the hybrid system and the solar only power generation
system (solar power plants). Since the temperature that can be achieved by burning the
syngas, say over 1,200 °C, is much higher than the temperature of the solar heat produced
by the solar collectors, say 220 °C, the energy efficiency of the hybrid system is higher
than that of the solar only power plant whose only heat source is solar heat produced at
220 °C. Thus there is
0 h sol-only. (7.56)
It can thus be concluded that 0 h( ) is small compared to h sol-only( ) . Considering
Eq. (7.54), the magnitude of the first term on the right hand side of Eq. (7.55) is small

337
compared with the second term. This means that se sol-only( ) has the same sign as
h sol-only( ) . Considering Eq. (7.56), it is known that
se sol-only , (7.57)
meaning that the solar-to-electricity efficiency of the solar thermochemical hybrid systems
is higher than that of the solar-only power generation systems when the temperature of the
solar heat input is the same for both systems. This suggests that solar heat input should be
used together with the fuel in the thermochemical hybrid systems rather than used alone.
In the SOLRGT, the solar-to-electricity efficiency was calculated in [15] to be 29.1%,
while it is 20.5% if the same solar collector (same collector outlet temperature, collector
efficiency and heat transfer efficiency) were used (calculated based on [32]). The solar-to-
electricity thus increases 42% relatively (8.6 percentage points) if solar heat at 220 °C was
used in the SOLRGT, compared to the solar-only power plant.
7.6. Conclusions of thermodynamic analysis of thermochemical
hybrid power generation systems
This chapter examines the thermodynamic features and performance of thermochemical
hybridization of power generation systems, and demonstrates it for two previously
proposed and analyzed specific solar-hybridized systems, SOLRGT that incorporates
reforming of methane, and SOLRMCC that incorporates reforming of methanol, both of

338
which using use low temperature solar heat (at ~220 °C) to help reform or decompose the
fuel to syngas, which is then used for power generation.
The main conclusions are:
• The energy level ( ) of the produced syngas from the reforming process (ratio of the
exergy and enthalpy of the syngas) is approximately equal to the weighted average of the
energy levels of all heat source input streams (Fig. 7-8, e.g., fuel, solar, gas turbine exhaust
gas). The weighting factors are the enthalpy ratio of each input stream relative to the total
heat input (or the enthalpy of the syngas) (Eq. (7.45)).
• The magnitude of the exergy destruction in the thermochemical process can be neglected
compared to the magnitude of the exergy of the syngas, as long as the of solar input is
defined using the solar collector equipment or working fluid as the solar temperature.
• This finding thus also suggests that increasing the solar share (solar input relative to the
total input) lowers the of the syngas, which is undesirable. There is thus a tradeoff
between the solar share and the energy/exergy efficiency of the solar thermochemical
hybrid system.
• Solar thermochemical hybrid systems designed for using higher temperature solar heat
are thus good for increasing the energy level ( ) of the syngas.
• Since the cost of solar collection equipment generally increases with the temperature it
provides, there is also a tradeoff between the thermodynamic performance of the system
and the cost of the system.

339
• Solar thermochemical hybrid systems have the potential to increase the “solar-to-
electricity” efficiency, which is an important criterion assessing how much power could be
produced using solar heat. Eq. (7.55) provides an easy way to determine whether the solar-
to-electricity efficiency increased or not through the thermochemical hybridization
process.
• The thermodynamic analysis in this chapter has shown that the solar-to-electricity
efficiency of the solar thermochemical hybrid systems is generally larger than that of the
solar-only power plants when the temperature of the solar heat input is the same in both
types of systems. For example, the solar-to-electricity efficiency increases by 42%
relatively if solar heat at 220 °C was used in the SOLRGT, compared to the solar-only
power plant. This suggests that in terms of solar-to-electricity efficiency, solar heat at a
given temperature should be used for power generation together with the fuel through the
reforming process rather than used alone.
• The extent of “upgrading” of the energy level of the solar heat input in such hybrid
systems depends on the solar exergy definition. It was demonstrated that the of the solar
heat input, in which its temperature is defined as the average of the solar collector or the
solar-heated working fluid temperature, can be considered to be upgraded by the indirect
thermochemical process to that of the produced syngas, but that such “thermochemical
upgrading” doesn’t take place if of the solar heat input is defined by the sun surface
temperature of 5,500 °C, or for any other heat input source above 1,935 °C when the energy

340
level of the syngas is 0.865 such as in the SOLRGT, or above 2,211 °C when the energy
level of the syngas is 0.88 such as in the SOLRMCC.
References for Chapter 7
[1] Trommer D., Noembrini F., Fasciana M., Rodringuez D., Morales A., Romero M.,
Steinfeld A., Hydrogen production by steam-gasification of petroleum coke using
concentrated solar power—I. Thermodynamic and kinetic analyses. Int J Hydrogen Energ
2005;30(6):605-618.
[2] Ng Y.C., Lipiński W., Thermodynamic analyses of solar thermal gasification of coal
for hybrid solar-fossil power and fuel production. Energy 2012;4(1):720-731.
[3] Bai Z., Liu Q., Li H., Jin H., Performance Analysis of a Polygeneration System for
Methanol Production and Power Generation with Solar-biomass Thermal Gasification.
Enrgy Proced 2014;61:1561-1564.
[4] Kesser F.K., Hoffman A.M., Baughn W.J., Analysis of a basic chemically recuperated
gas turbine power plant. J Eng Gas Turb Power 1994;116(2):277-284.
[5] Tamme R., Buck R., Epstein M., Fisher U., Sugarmen C., Solar upgrading of fuels for
generation of electricity. J Sol Energ Eng 2001;123(2):160-163.

341
[6] Sheu E.J., Mitsos A., Optimization of a hybrid solar-fossil fuel plant: Solar steam
reforming of methane in a combined cycle. Energy 2013;51:193-202.
[7] Bianchini A., Pellegrini M., Saccani C., Solar steam reforming of natural gas
integrated with a gas turbine power plant. Sol Energy 2013;96:46-55.
[8] Zhao H., Yue P., Performance analysis of humid air turbine cycle with solar energy
for methanol decomposition. Energy 2011;36:2372-80.
[9] Li Y., Zhang N., Lior N., Cai R., Yang Y., Performance analysis of a near zero CO2
emission solar hybrid power generation system. Appl Energ 2013;112:727-736.
[10] Li Y., Zhang N., Cai R., Low CO2-emissions hybrid solar combined-cycle power
system with methane membrane reforming. Energy 2013;58:36-44.
[11] Luo C., Zhang N., Zero CO2 emission SOLRGT power system. Energy
2012;45:312-23.
[12] Hong H., Jin H., Liu B., A novel solar-hybrid gas turbine combined cycle with
inherent CO2 separation using chemical-looping combustion by solar heat source. J Sol
Energy Eng 2006;128(3):275-84.

342
[13] Hong H., Han T., Jin H., A low temperature solar thermochemical power plant with
CO2 recovery using methanol-fueled chemical looping combustion. J Sol Energy Eng
2010;132(3):031002.
[14] Li Y., Zhang N., Lior N., Performance comparison of two low-CO2 emission
solar/methanol hybrid combined cycle power systems. Appl Energ 2015:155:740-752.
[15] Zhang N., Lior N., Use of Low/Mid-Temperature Solar Heat for Thermochemical
Upgrading of Energy, Part I: Application to a Novel Chemically-Recuperated Gas-
Turbine Power Generation (SOLRGT) System, J Eng Gas Turb Power 2012;134:072301.
[16] Zhang N., Lior N., Use of Low/Mid-Temperature Solar Heat for Thermochemical
Upgrading of Energy, With Application to a Novel Chemically-Recuperated Gas-Turbine
Power Generation (SOLRGT) System. Proceedings of the ASME 2009 International
Mechanical Engineering Congress and Exposition, November 13-19, Lake Buena Vista,
FL, Paper No. IMECE2009-13037.
[17] Zhang N., Lior N., Use of Low/Mid-Temperature Solar Heat for Thermochemical
Upgrading of Energy, Part II: A Novel Zero-Emissions Design (ZE-SOLRGT) of the
Solar Chemically-Recuperated Gas-Turbine Power Generation System (SOLRGT)
guided by its Exergy Analysis,” ASME J Eng Gas Turb Power 2012;134:072302.

343
[18] Abdallah H., Harvey S., Thermodynamic Analysis of Chemically Recuperated Gas
Turbines. Int J Therm Sci 2001;40:372-384.
[19] Ishida M., Thermodynamics Made Comprehensible, Nova Science. New York,
2002.
[20] Szargut J., Exergy Method: Technical and Ecological Applications. WIT Press,
2005. ISBN 1-85312-753-1.
[21] Ishida M., Process system synthesis and available information. Proceeding of
TAIES'97, Beijing, 1997, 370-376.
[22] Petela R., Exergy of Heat Radiation. J Heat Transfer 1964;86:187-192.
[23]Reddy V. S., Kaushik S.C., Tyagi S.K., Exergetic analysis of solar concentrator aided
natural gas fired combined cycle power plant. Renew Energ 2012;(39):114-125.
[24] Parrott J. E., Theoretical upper limit to the conversion efficiency of solar energy. Sol
Energy 1978;21:227-229.
[25] Winter C. J., Sizmann R.L., Vant-hull L.L., Solar power plants. New York:
Springer; 1991.

344
[26] Zamfirescu C., Dincer I., How Much Exergy Can One Obtain From Incident Solar
Radiation. J Appl Phys 2009;105:044911.
[27] Zhang N., Lior N., Use of Low/Mid-Temperature Solar Heat for Thermochemical
Upgrading of Energy, Part I: Application to a Novel Chemically-Recuperated Gas-
Turbine Power Generation (SOLRGT) System. J Eng Gas Turb Power 2012;134:072301.
[28] Nakagaki T., Ogawa T., Murata K., Nakata Y., Development of methanol steam
reformer for chemical recuperation. ASME J Eng Gas Turb Power 2001;123:727-733.
[29] Hong H., Jin H., Ji J., Wang Z., Cai R., Solar thermal power cycle with integration
of methanol decomposition and middle-temperature solar thermal energy. Sol Energy
2005;78:49-58.
[30] Li Y., Zhang N., Cai R., Performance Comparison of Two Low CO2 Emission
Solar/Methanol Hybrid Power Systems, Proceedings of International Conference on
Sustainable Energy and Environmental Protection (SEEP 2012), Dublin, Ireland, June 5-
8, 2012.
[31] Hong H., Han T., Jin H., A Low Temperature Solar Thermochemical Power Plant
With CO2 Recovery Using Methanol-Fueled Chemical Looping Combustion. J Sol
Energy-T ASME, 2010;132:031002.

345
[32] Glatzmaier G., Summary Report for Concentrating Solar Power Thermal Storage
Workshop, Technical Report, NREL/TP- 5500-52134, August
2011;http://www.nrel.gov/docs/fy11osti/52134.pdf

346
CHAPTER 8
EXERGO-ECONOMIC ANALYSIS FOR THERMAL
HYBIRD POWER GENERATION SYSTEMS
While thermal hybrid power cycles may have thermodynamic performance advantages
over conventional single heat source power generation systems, it is of course important to
assess also their economic viability. Usually there is a trade-off between the performance
and cost of equipment in a system, e.g., in heat exchangers exergy destruction decreases
with the reduction of the temperature difference between the cold and hot streams, but the
latter requires larger heat exchange area and heat transfer coefficient and thus incurs higher
cost.
Another important economic consideration is the potential for saving depletable fuel and
reducing emissions (including of greenhouse gases) by hybrid power systems using
renewable heat sources or other heat sources that generate no emissions, both features
having important economic impact when considering the rise of fuel price and carbon tax
(or other monetary penalty for CO2 emissions).
Past studies focused only on the exergo-economic analysis of specific thermal hybrid
systems but no general theory about the performance of this class of hybrid systems was
developed. This chapter developed the general theory and equations for exergo-economic
evaluation of such hybrid power generation systems (based on thermodynamics and the

347
SPECO method), discusses the results, and draws conclusions about their possible
improvements. Major types of power generation cycles were studied, including hybrid
Rankine cycles (with and without reheat and regeneration), hybrid Brayton cycles (with
and without intercooling, reheat and regeneration) and hybrid combined cycles. Positive
and negative prices of externalities were included. The study found that for all the types of
hybrid power cycles studied, the difference between the levelized electricity costs (LEC-s)
of the hybrid system and the corresponding single heat source reference system could be
generalized by two equations: one for the fuel-saving mode when the additional heat
sources (AHS, beyond one) are used to save fuel, and the other for power-boost mode when
the AHS is added to generate more power. These equations can be, and were, used to find
the fuel price and the values of the price-beneficial externalities at which the LEC of the
hybrid system becomes lower than that of the reference system. Considering that the price
of the non-renewable fuel will increase in the long run, that the cost of AHS equipment
will decrease as technologies improve, and that the cost of undesirable externalities will be
increased, the LEC of the hybrid systems will become lower. The results also show that
higher carbon and other environmental taxes/penalties will boost the economic
competitiveness of the hybrid systems and provide guidance for government in determining
their magnitudes.
8.1. Economic analysis methods for thermal hybrid systems

348
8.1.1. The energo-economic analysis method
Energo-economic economic analysis that is historically and currently the most widely used
by researchers and in practice to determine the economic feasibility of power generation
and other energy-considering systems, is called by us and some others ‘energo-economic’
analysis (instead of the historically popular but thermodynamically incorrect
“thermoeconomic” analysis name). In this method applied to power generation system as
is the case in this study, the levelized electricity cost (LEC), from a power generation
system is usually defined as
Annual levelized cost of system ($)
LEC ,Annual generation of electricity (kWh)
(8.1)
Inv O&M fP
net gen
,C CC
cH W
(8.2)
in which Pc [$/kJ] is the LEC of the system,
InvC [$] is the total investment cost of the
system, O&MC [$] and
fC [$] are, respectively, the annual operation and maintenance
(O&M) cost and annual fuel cost of the system, H [h] is the total operation time of the
system in a year, netW [kW] is the net power output of the system. is the capital
recovery factor, which depends on the interest rate as well as system expected lifetime and
is determined by

349
1,
1 1
n
n
i i
i
(8.3)
in which i is the interest rate (for example, 0.08i when the interest rate is 8%) and n
is the lifetime of the system in years. The capital recovery factor is widely used in economic
analysis. The meaning of this term is to annualize the initial capital investment, with
consideration of the time value of money, as if the investment were invested every year,
and with the same amount, throughout the lifetime of the system.
gen is the electricity generator efficiency defined as the ratio of work input and electricity
output of the generator, which in this chapter is assumed to be = 1 (0.95 to 0.99 in practice).
Equation (8.2) thus becomes
O&M f
P
e
Inv
n t
.C
cW
C C
H
(8.4)
The energo-economic analysis method of calculating the LEC serves as the method to be
compared with the exergo-economic analysis method.
8.1.2. The exergo-economic analysis method
Although the energo-economic analysis method is widely used, it doesn’t relate the
thermodynamic aspects of a system fully to the economic ones and thus gives no suggestion
on how to improve the economic performance of the system by changing the operation

350
parameters, such as the temperature of the heat sources. The “exergo-economic” analysis
method, which a cost analysis method that is based on exergy, rather than energy, costs,
embeds in it the thermodynamic parameters, such as working fluid temperature, pressure
and concentrations that distinguish exergy from energy. It thus allows direct examination
of the effects of changing these thermodynamic parameters on the costs.
Exergo-economic analysis, which we use here, assigns exergy-related costs to economic
analysis. It is often performed by using the Specific Exergy Costing (SPECO) methodology
[1] which is therefore selected for this study. The basics of the SPECO method are
described in [1], and other details are available in [2]. The SPECO analysis proceeds in
two steps:
Step 1: identification of each component and the corresponding fuel and product
The words product and the fuel are defined here by considering the desired result produced
by the component and the resources expended to generate this result [1]. Examples of
components are pumps, turbines and heat exchangers. The product is defined to be equal
to all the exergy
i. streams’ values to be considered at the outlet (including the exergy of energy
streams generated in the component), plus
ii. increases between each component’s inlet and outlet (i.e. the exergy additions to
the respective material streams) that are in accord with the purpose of the
component,

351
and the fuel is defined to be equal to all the exergy
i. values to be considered at the inlet (including the exergy of energy streams supplied
to the component), plus
ii. decreases between inlet and outlet (i.e. the exergy removals from the respective
material streams), minus
iii. increases (between inlet and outlet) that are not in accord with the purpose of the
component.
Step 2: Construction of cost equations
Defining cost rate as the time-rate at which money is invested and earned due to exergy
inflows and outflows, and due to the investment in equipment and to operating (excluding
fuel, which is already included in the exergy flows) and maintenance (O&M) expenses
during the system life, cost balance equations of each component are constructed. These
are based on the fact that the total of cost rates associated with all existing exergy streams
is equal to the sum of cost rates associated with all entering exergy streams plus the
appropriate charges due to capital investment and operation and maintenance expenses
(including labor cost) [1].
There are two types of cost equations used in the SPECO method. One is the cost balance
equation of component k , written according to the exergy streams entering or existing the

352
component, including the material exergy streams, work exergy streams and heat exergy
streams,
w, q, q, ,e e k k k k i i kk ke i
c c W c c ZB B B (8.5)
in which eB [kW] and iB [kW] are the associated rates of exergy transfer (exergy streams)
with exiting and entering streams of matter (calculated based on state points in real
processes with consideration of possible pressure drops), W [kW] and qB [kW] are the
exergy transfer rates associated with power output and entering heat transfer, respectively.
, ,e i wc c c and qc denote average costs per unit of exergy [$/kJ] for the corresponding
exergy stream. kZ [$/s] is the cost rate associated with the possessing, operating and
maintaining the component and calculated by
1+
,k
k
ZZ
H
(8.6)
in which is the capital recovery factor defined in Eq. (8.3), H [s] is the total operation
time per year and is the maintenance factor defined as the ratio of operation and
maintenance (O&M) cost O&MC and total investment cost
InvC , i.e.
O&M
Inv
.C
C (8.7)

353
The numerator of Eq. (8.6) stands of the levelized annual cost of component k including
both the capital cost and the O&M cost and the denominator is the operation time of power
plants. So the ratio between them stands for the cost rate associated with the component.
kZ (or sometimes written as kI ) are usually called the “cost functions”, whose variables
are component operation parameters such as isentropic efficiency and inlet temperature.
For common components, these cost functions can be found in various publications such
as [2], [3] and [4]. When a cost functionkZ is not available,
kZ can also be calculated
using the purchased cost of the component by assuming the total cost of each component
is proportional to its purchased equipment cost,P kZ [5] as
,Inv O&M
,
,3600
P k
k
P kk
ZC CZ
H Z
(8.8)
in which the purchased equipment cost ,P kZ [$] of component k can be found in [2].
In essence, the Z term used in the SPECO method is the sum of the cost of annualized
purchasing cost and O&M cost of the component. The values can be found by conventional
economic analysis, with consideration of the time value of money, as well (through the
capital recovery factor ).
Besides Eq. (8.5), the cost balance equation can also be written using the concepts of fuel
and product defined in Step 1 for each component as

354
P P F F
P F
,kk kc cB ZB (8.9)
in which Fc [$/kJ] and
Pc [$/kJ] are called the average unit cost of fuel and product,
respectively, and FB [kW] and
PB [kW] are exergy transfer rates associated with fuel and
product streams (including material streams and energy streams) of the component,
respectively.
Eqs. (8.5) and (8.9) are both valid, although having different forms representing different
physical meaning. Equation (8.5) distinguishes the form of energy flow and groups the
energy flows into material flow, work flow and heat flow. Equation (8.9), however, does
not distinguish whether an energy flow is material or work or heat, but groups the energy
flow based on the direction of the flow alone. In Eq. (8.9), when the flow flows into a
component, it is regarded as “Fuel (F)”, and when the flow flows out of a component, it is
regarded as “Product (P)”. In practice, a heat flow can either flow into or out of a
component. When it flows into the studied component, it is treated as a positive value in
Eq. (8.5) but as a “Fuel” in Eq. (8.9). When it flows out of the studied component, it is
treated as a negative value in Eq. (8.5) but as a “Product” in Eq. (8.9). A work flow can
also either flow into or out of a component. When it flows into the studied component, it
is treated as a negative value in Eq. (8.5) but as a “Fuel” in Eq. (8.9). When it flows out of
the studied component, it is treated as a positive value in Eq. (8.5) but as a “Product” in Eq.
(8.9).

355
Defining the cost rate associated with exergy stream as
i i i i i iC c c mB b (8.10)
e e e e e eC c c m bB (8.11)
w wC c W (8.12)
q q qC c B (8.13)
F F FC c B (8.14)
P P P ,C Bc (8.15)
so there is one cost balance equation for each component. As assumed by the SPECO
method, the average cost per unit exergy of fuel and kZ are known for component k , but
none of the average costs per unit exergy of product is known, requiring as many equations
as unknowns to solve for all average cost per unit exergy of product. These equations are
called auxiliary equations and are constructed by F rule and P rule, the details of which
could be found in [2] and will not be shown here.
With the help of the auxiliary equations, the problem having the same number of unknown
and equations is closed. Case studies indicating how this method can be used have been
demonstrated in several archival papers such as [6] and [7]. In this chapter, the SPECO

356
method will be used in this study to calculate and compare the cost of electricity of hybrid
system, P,hc , and that of the fuel-only reference system,
P,0c .
8.2. Hybrid power generation systems based on the Rankine cycle
8.2.1. Hybrid power generation systems based on the simple Rankine
cycle
The goal is to find the LEC difference between the hybrid and the reference system
(without AHS) using the exergo-economic analysis method. To achieve that, the LEC
expression for both systems needs to be developed using the SPECO method introduced in
the previous section. The fuel, product and auxiliary equation for each component is first
determined. The cost function can then be built for each component. Manipulation of those
cost balance equations will arrive at the LEC equation for each system. Further analysis
could then be made based on it and conclusions could be drawn. The fuel, product and
necessary auxiliary equations for each component for applying the SPECO method are
summarized in Table 8-1. The cost balance equations can be constructed using Eq. (8.9)
and are shown below the table.
Table 8-1. Fuel, product and auxiliary equation for each component in the hybrid simple
Rankine cycle system (Fig. 4-2)
Component Fuel Product
Auxiliary
equation
No. of
streams
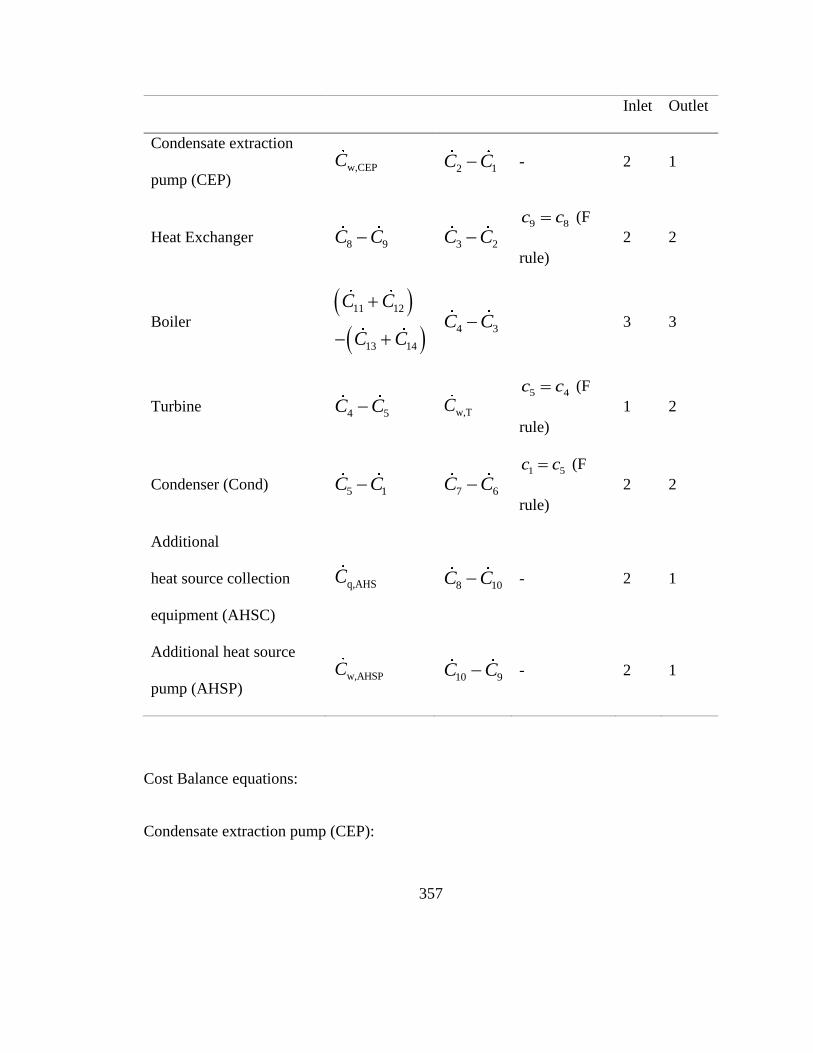
357
Inlet Outlet
Condensate extraction
pump (CEP) w,CEPC
2 1C C - 2 1
Heat Exchanger 8 9C C
3 2C C 9 8c c (F
rule)
2 2
Boiler
11 12
13 14
C C
C C
4 3C C 3 3
Turbine 4 5C C w,TC
5 4c c (F
rule)
1 2
Condenser (Cond) 5 1C C 7 6C C
1 5c c (F
rule)
2 2
Additional
heat source collection
equipment (AHSC)
q,AHSC 8 10C C - 2 1
Additional heat source
pump (AHSP) w,AHSPC
10 9C C - 2 1
Cost Balance equations:
Condensate extraction pump (CEP):

358
2 1 w,CEP CEPC C C Z (8.16)
Heat exchanger:
3 2 8 9 HEC C C C Z (8.17)
Boiler:
4 3 11 12 13 14 BC C C C C C Z (8.18)
Turbine:
w,T 4 5 TC C C Z (8.19)
Condenser (Cond):
7 6 5 1 CONDC C C C Z (8.20)
Additional heat source collection equipment (AHSC):
8 10 q,AHS AHSCC C C Z (8.21)
Additional heat source pump (AHSP):
10 9 w,AHSP AHSPC C C Z (8.22)

359
Adding Eqs (8.16)-(8.22) together results in cancelation of some of their unknowns as
shown in Eq. (8.23):
w,T w,CEP w,AHSP 11 12 13 14 q,AHS 7 6
CEP HE B T COND AHSC AHSP.
C C C C C C C C C C
Z Z Z Z Z Z Z
(8.23)
The boiler inlet combustion air is generally free and thus its cost is zero,
1a 2 0.c c (8.24)
The higher temperature heat source (fuel) usually generates flue gas (stream 13 in Fig. 4-2)
after burning in the boiler. When flue gas is not utilized in further process and is ultimately
emitted to the atmosphere as in normal practice, the cost associated with the flue gas could
be regarded as 0,
13fg 0.c c (8.25)
If, however, the flue gas is utilized in other processes, such as providing heat, the cost rate
of flue gas will reduce the cost of the electricity generated by the hybrid system since it
could be regarded as a gainful product of the system additional to the generated electricity.
Conversely, if the flue gas is taxed or penalized in some way, its cost will raise the cost of
the electricity.

360
The other product from the boiler is ash (stream 14 in Fig. 4-2) when coal is used as the
fuel in the boiler. Since it usually has no sale value, the cost associated with ash could be
regarded as 0, i.e.
4ash 1 0c c (8.26)
The flue gas and/or ash are, however, undesirable externalities (interactions with the
environment that industry is not obliged to pay), and this analysis method is an opportunity
to quantify here the externalities relative to the electricity cost, using Eq. (8.23).
In practice, the mass flow rate of air is usually proportional to the mass flow rate of fuel in
the boiler. The mass flow rate of the combustion gas should thus be proportional to that of
the fuel, so
fg fg fg fg fg
f f f f f
fg
fg
f
11 ,
c m cC b bc
C b b fc m c
(8.27)
in which f 11c c [$/kJ] is the cost of fuel (fuel price),
fm [kg/s] and fb [kJ/kg] are,
respectively, the mass flow rate and specific exergy of fuel, fgm [$/s] and fgb [kJ/kg] are,
respectively, the mass flow rate and specific exergy of flue gas, f is the fuel-air ratio.
Since the mass flow rate of ash (if any) from the boiler is also proportional to the mass flow
rate of fuel,

361
ash ash
f f f
ash ashash
f
,C bc m
c mc
C b (8.28)
in which ashm [kg/s] and
ashb [kJ/kg] are, respectively, the mass flow rate and specific
exergy of ash.
Sometimes carbon tax could be imposed on power generation plants that emit CO2, which
is proportional to the amount of CO2 emitted to the atmosphere, i.e.
2 2ct CO CO ,C c m (8.29)
in which ctC [$/s] is the carbon tax imposed on the system,
2COc [$/kg] is the specific cost
for carbon emission, and 2COm [kg/s] is the carbon emission rate to the environment.
Since the mass flow rate of carbon dioxide is proportional to that of the fuel,
2 2CO CO
f
ctct
f f f
.c m
c m
Cc
C b (8.30)
As suggested in [2], the average unit cost of electricity consumption could be assumed to
be the same as that of electricity generation and all equal to the levelized electricity cost,
i.e.
w,CEP w,AHSP w,T P.c c c c (8.31)

362
Using Eq. (8.27), (8.28), (8.30) and (8.31), Eq. (8.23) could be simplified to
P net f f f q,AHS AHS cw C
HE
EP
B T COND AHSC AHSP ,
c W c m c C Z
Z Z Z Z
b
Z
B
Z
(8.32)
in which fc [kg/kJ] is the specific cost associated with fuel including the fuel price and
externalities (cost of flue gas and ash) and carbon tax
f f fg ash ct1 ,c c c c c (8.33)
net T CEP AHSPW W W W [kW] is the net power output of the hybrid system,
cw 7 6C C C [$/s] is the increase of cost rate associated with the cooling water due to
heat reception in the condenser, in which the cost rate associated with the outlet flow
(stream 7), 7C , could be regarded as 0 when the cooling water is not used afterwards,
q,AHSc [$/kJ] is the specific cost of the additional heat source (AHS), which is 0 when solar,
geothermal energy or other “free” heat source is used as AHS (the cost of equipment to
harvest the energy is included in AHSCZ ), and AHSB [kJ/s] is the exergy flow rate of the
AHS into the system.
Once the LEC of the hybrid system was calculated, the LEC of the reference system when
there is only one heat source and no AHS (such as in conventional steam power plants)
could be found using the same method by

363
net,0 f f,0 f cw,0 CEP,0 B,0 T,0 COND 0P,0 , ,W c m b C Z Z Zc Z (8.34)
in which the superscript 0 stands for reference system and net,0 T CEPW W W [kW] is the
net power output of the reference system.
The LEC increase of the hybrid system relative to the reference system (may be either
positive or negative), P P,0c c , can thus be calculated based on Eqs (8.32) and (8.34).
In the hybrid and reference system, the boiler efficiency (or the temperature of the flue gas)
is kept constant, so the energy balance equations of the boiler for the hybrid and reference
system are, respectively,
B f w 4 3LHV ,m m h h (8.35)
B f,0 w 4 2LHV ,m m h h (8.36)
in which B is the boiler efficiency defined as the ratio between the enthalpy increase of
the working fluid and the energy input from the fuel.
From Eqs (8.35) and (8.36), the mass flow rate of the fuel for the reference system could
be expressed by
4 2
f,0 f
4 3
.h h
m mh h
(8.37)

364
In the hybrid system, the additional heat source heat exchanger is used to replace part of
the economizer in the reference system (an economizer is often part of a boiler). In the
reference system, the economizer is designed to preheat the boiler feed water from 2T to a
fixed temperature, say ECOT ; while in the hybrid system, the preheating process is
accomplished by two heat exchangers: the additional heat source heat exchanger and part
of the reference system economizer. Thus,
ECO,0 ADD ECO w ECO 2 ,Q Q Q m h h (8.38)
in which ECOh [kJ/kg] is the specific enthalpy of working fluid at
ECOT , ECOQ and ECO,0Q
[kW] are the heat transfer rates in the economizer in the hybrid and the reference systems,
respectively.
Following [3] (Appendix 9.3), the cost of a heat exchanger is proportional to the HEn order
of the heat transfer rate in the heat exchanger, in which HEn is a constant for a specific
type of heat exchanger whose value could be found in [3]. Thus, according to Eq. (8.38),
HE
HE HEHE HE HE
HE HE
ECO,0 ADD ADD ECO,0ECO HE ECO,0 ECO ADD ECO,0
ECO,0 ECO,0 ECO,0
,
nn nn n n
n n
Q Q Q QZ Z Z Q Q Q
Z Q Q
(8.39)

365
which is positive when HE 1n as is for usual type of heat exchanger for economizers,
such as shell and tube.
The other part of the boiler is the same for both hybrid and reference systems, so for the
boiler
HE
HE HE
HE
B B,0 ECO HE ECO,0
ECO,0
ECO,0 ADD ADD ECO,0
ECO,0
HE
.n
n n
n
Z Z Z Z Z Z
ZQ Q Q Q
Q
(8.40)
Using Eqs (8.37) and (8.40), the difference between the LEC between the hybrid and
reference system is thus
HEHE HE
HE
HEH
HE
P net P,0 net,0 f f f f,0 q,AHS AHS AHSC AHSP
ECO,0
ECO,0 ADD ADD ECO,0
ECO,0
3 2f f f q,AHS AHS
4 3
ECO,0
AHS ECO,0 ADD ADD
ECO,0
nn n
n
nn
n
B
c W c W c b m m c E Z Z
ZQ Q Q Q
Q
h hc b m c
h h
ZZ Q Q Q
Q
E HE
ECO,0 ,nQ
(8.41)
in which AHS AHSC AHSPZ Z Z is the cost rate of equipment associated with the AHS.
The energy balance equation for the heat exchanger in Fig. 4-2
AHS AHS ADD w 3 2 ,m hQ hQ (8.42)

366
in which AHS is called here the energy conversion efficiency of the AHS or just the
efficiency of the AHS, defined as the ratio between the enthalpy increase of the working
fluid and of the AHS energy input, i.e.
ADDAHS
AHS
,Q
Q (8.43)
in which AHSQ [kW] is the external heat input rate to the additional heat source collection
equipment (AHSC), and ADDQ [kW] is the enthalpy increase of working fluid based on
energy conservation for the heat exchanger in Fig. 4-2 as shown in Eq. (8.42). Typical
values of AHS are about 0.5 for solar heat [8] and can be close to 1 for waste heat (since
the heat loss mostly occurs in the heat exchanger).
Considering Eq. (8.35), there is
B f
w
4 3 3 2
AHS AHSLHV Qm
mh h h h
(8.44)
or
f
AHS
AHS 4 3f f AHS
B 3 2
,bh h
mh h
B
(8.45)
in which f and
AHS are, respectively, the exergy factors of the fuel and of the AHS,
defined as

367
ff
LHV
b (8.46)
for the fuel, and
AHA
SHS
AHS
B
Q (8.47)
for the AHS, which is expressed by the Carnot efficiency 0
AHS
1T
T
when heat such as
waste or geothermal is used as the AHS.
Substitution of Eqs (8.45) and (8.47) into Eq. (8.41) gives
HE
HE HE
HE
AHSP net P,0 net,0 f q,AHS AHS AHS
B
ECO,0
AHS ECO,0 ADD ADD ECO,0
ECO,0
f
.n
n n
n
c W c W c c Q
ZZ Q Q Q Q
Q
(8.48)
Considering that the pump work is negligible compared with turbine output work in a steam
power plant (1-2%), i.e.
CEP AHSP T, ,W W W (8.49)

368
the net power output of the reference and hybrid system is then the same, i.e.
net,0 net.W W (8.50)
Using Eqs (8.43) and (8.50), Eq. (8.48) could thus be simplified as
HE
HE HE
HE
AHSf q,AHS ADD AHS
B AHS
ECO,0
ECO,0 ADD ADD
f
ne
ECO,0
ECO,0
P P P,
t
0
,0
Δ .
nn n
n
c c Q Z
ZQ Q Q Q
Qc c c
W
(8.51)
It could therefore be concluded that for a given reference system, the difference between
the LEC-s of the hybrid and the reference system, PΔc , increases with the cost rate of the
AHS, q,AHSc , and the cost rate associated with the equipment of the AHS, AHSZ , but
decreases with the cost associated with fuel, fc (defined in Eq. (8.33) and includes fuel
cost, carbon emission cost and the cost/benefit from flue gas and/or ash), the energy
conversion efficiency of the AHS, AHS , and the exergy factor of the AHS,
AHS
(calculated using Eq. (8.46) when AHS is fuel, or Eq. (8.47) when AHS is heat).
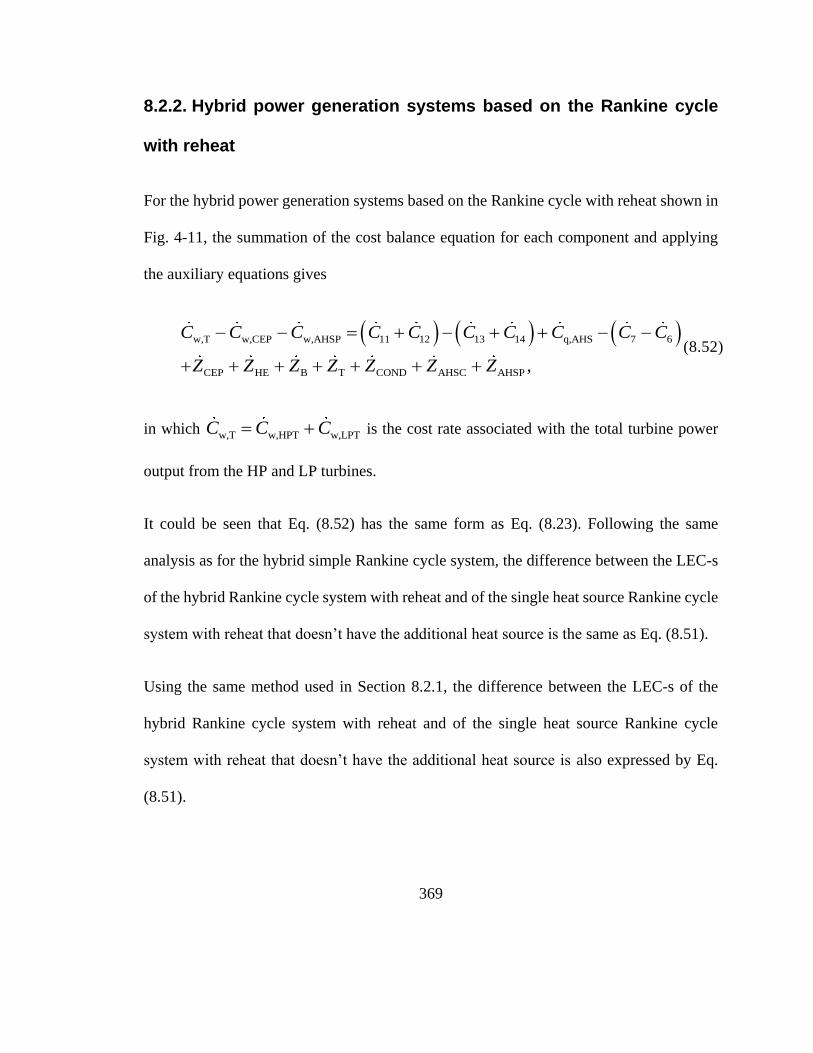
369
8.2.2. Hybrid power generation systems based on the Rankine cycle
with reheat
For the hybrid power generation systems based on the Rankine cycle with reheat shown in
Fig. 4-11, the summation of the cost balance equation for each component and applying
the auxiliary equations gives
w,T w,CEP w,AHSP 11 12 13 14 q,AHS 7 6
CEP HE B T COND AHSC AHSP ,
C C C C C C C C C C
Z Z Z Z Z Z Z
(8.52)
in which w,T w,HPT w,LPTC C C is the cost rate associated with the total turbine power
output from the HP and LP turbines.
It could be seen that Eq. (8.52) has the same form as Eq. (8.23). Following the same
analysis as for the hybrid simple Rankine cycle system, the difference between the LEC-s
of the hybrid Rankine cycle system with reheat and of the single heat source Rankine cycle
system with reheat that doesn’t have the additional heat source is the same as Eq. (8.51).
Using the same method used in Section 8.2.1, the difference between the LEC-s of the
hybrid Rankine cycle system with reheat and of the single heat source Rankine cycle
system with reheat that doesn’t have the additional heat source is also expressed by Eq.
(8.51).

370
8.2.3. Hybrid power generation systems based on the Rankine cycle
with heat regeneration
For the hybrid power generation systems based on the Rankine cycle with heat regeneration
shown in Fig. 4-17 and Fig. 4-18. The summation of the cost balance equation for each
component and applying the auxiliary equations gives
w,T w,BFP w,CEP f 15 14 BFP
HPF B T COND CEP LPFH D.
C C C C C C Z
Z Z Z Z Z Z Z
(8.53)
Using the assumptions made in section 8.2, Eq. (8.53) could be rewritten as
P,0 net,0 f f f cw
CEP HE B T C AHS
fg ash
C AHSP
ct1
,
c W c m C
Z Z
b c c c
Z Z Z Z Z
(8.54)
in which net,0 T BFP CEPW W W W is the net power output of the reference system.
Similarly, the equation for the first hybrid system when HP feedwater heater is replaced by
AHS is
P,1 f f,1 AHS cw,1 AHSC,1 AHSP,1
BFP,1 LPF,1 B,1 T,1 COND,1 CEP,1
net,1 f
D,1
,1+
,
c c m C Z Z
Z Z
W b
Z
C
Z Z Z Z
(8.55)

371
in which the subscript 1 stands for the hybrid system when HP feedwater heater is replaced
by AHS and T,1 BFP,1 CEPn ,1 AHSP,1et,1W W W W W is the net power output of the first
hybrid system.
Also, the equation for the second hybrid system when LP feedwater heater is replaced by
AHS is
P,2 f f,2 f cw,2 AHSC,2 AHSP,2
BFP,2 HPF,2 B,2 T,2 COND,2
net,2 AH
CEP,2 D,2
S,2+
,
c c m C Z Z
Z Z Z Z Z
W C
Z Z
b
(8.56)
in which the subscript 2 stands for the hybrid system when LP feedwater heater is replaced
by AHS and T,2 BFP,2 CEPn ,2 AHSP,2et,2W W W W W is the net power output of the
second hybrid system.
Since the working fluid conditions at boiler inlet and outlet is kept the same for all of the
three systems,
f f,1 f,2,m m m (8.57)
B B,1 B,2.Z Z Z (8.58)
According to [3], the cost of turbine varies with mass flow rate, temperature of inlet flow,
pressures of inlet and outlet flow and turbine efficiency, so in all three system, the turbine
cost are the same, i.e.

372
T T,1 T,2,Z Z Z (8.59)
the cost of feed water pump is
1.05
p0.55 0.55
FWP
p
32 0.000435 Δ1
,Z M P
(8.60)
in which M [kg/s] is the mass flow rate of pump feedwater, ΔP [kPa] is the pressure
increases of the flow and p is the adiabatic efficiency of the pump.
Since the pump cost is small compared with turbine cost and the change in pump cost also
small compared with turbine cost, it could be assumed that
BFP BFP,1 BFP,2Z Z Z (8.61)
CEP CEP,1 CEP,2Z Z Z (8.62)
net,1 net,0 T,1 T,0W W W W (8.63)
net,2 net,0 T,2 T,0.W W W W (8.64)
For the deaerator, according to [9], the cost of deaerator is proportional to the mass flow
rate of feed water of the deaerator. For all of three systems, the mass flow rate of feed water

373
of the deaerator is the same as the total mass flow rate of working fluid wm entering the
boiler, which is kept constant, so
D,1 D,2 D.Z Z Z (8.65)
The difference between Eq. (8.54) and (8.55) is thus
P,1 P,0 net,0 AHS AHS,1
cw,1 cw COND,1 COND HE,1 H
net,1 ,
PF
1
,
c c W Z
C C Z Z Z
W
Z
C
(8.66)
in which AHS,1 AHSC,1 AHSP,1Z Z Z is the cost rate of equipment associated with the AHS
for the hybrid system when HP feedwater heater is replaced by the AHS.
Similarly, The difference between Eq. (8.54) and (8.55) is thus
P,2 P,0 net,0 AHS AHS,2
cw,2 cw COND,2 COND HE,2 L
net,2 ,
PF
2
,
c c W Z
C C Z Z Z
W
Z
C
(8.67)
in which AHS,2 AHSC,2 AHSP,2Z Z Z is the cost rate of equipment associated with the
AHS for the hybrid system when LP feedwater heater is replaced by the AHS.
Since the price of cooling water is the same for all systems and the inlet and outlet
conditions of cooling water is also kept the same, the cost of cooling water is proportional
to the heat duty of the condenser CONDQ , i.e.

374
cw cw 14 15cw
COND COND
constant,Q
c m b bC
Q
(8.68)
in which cwc [$/kJ] is the price of cooling water,
cwm [kg/s] is the mass flow rate of
cooling water, 14b [kJ/kg] and
15b [kJ/kg] is the specific exergy of inlet and outlet cooling
water, respectively. Thus,
cw,1 cw COND,1 COND
cw CONDSS
,C C
C
Q Q
Q
(8.69)
cw,2 cw COND,2 COND
cw COND
,Q
Q
C QC
C
(8.70)
in which the heat transfer rate in condenser in each system is, respectively,
COND w 8 9 w 13 9
w 8 9 8 13
1
1 ,
Q m y y y h h m y h h
m y y h h y h h
(8.71)
COND,1 w 1 1 8 9 w 1 13 9
w 1 8 9 1 8 13
1
1 ,
Q m y y h h m y h h
m y h h y h h
(8.72)
COND,2 w 2 2 8 91 ,Q m y y h h (8.73)
and

375
w 1 8 9 1 8 13
3 2 6 12 8 13w 8 9 11 10
5 12 6 11 7 13
6 12 8 13w 8
COND,1 C
9 11 10
6 11 7 13
w
D
8 9
ON
,
m y y y h h y y h h
h h h h h hm h h h h
h h h h h h
h h h hm y h h h h
h h h h
m y h h
Q Q
(8.74)
COND,2 COND 2 2 8 9 8 13
8 13 8 9
w
w w .
Q Q y y y y h h y h h
y h h m y h
m
m h
(8.75)
According to [23], the cost rate of condenser CZ is proportional to the mass flow rate of
working fluid through the hot side of the condenser, so
COND,1 COND
COND
9,1 9 1 6 12
9 6 11
1 1,
1
Z Z m m y y y h hy
Z m y y h h
(8.76)
COND,2 COND
COND
9,2 9 2 2
9
1 10.
1
Z Z m m y y y y
Z m y y
(8.77)
Feedwater heater and the heat exchanger used to preheat the working fluid by AHS could
be assumed to be of the same type, e.g. shell and tube type heat exchanger. Since the mass
flow rate of working fluid on the cold side is the same before and after replacing the
feedwater heater with AHS, the cost of feedwater heater could be assumed to be equal to

376
that of the heat exchanger after the replacement, if the inlet and outlet condition of the hot
side of the heat exchanger is designed to be the same as before the replacement. Thus,
HE,1 HPF,Z Z (8.78)
HE,2 LPF.Z Z (8.79)
Substitution of Eq. (8.76)-(8.79) into Eq. (8.66) and (8.67) gives
6 12net,1 AHS,
cwP,1 P,0 net,0 AHS,1 COND,1 COND COND1
6 1C 1
,C h h
W C Q Qc Zh h
c W Z yQ
(8.80)
cwP,2 P,0 net,0 AHS,2 COND,2 Cnet,2 AHS OND
CO
,2
ND
.C
c c W ZW C Q QQ
(8.81)
In fact, it could be seen from Eq. (8.74) and (8.75) that
COND,1 CON wD 8 9 ,m y hQ Q h (8.82)
COND,2 COND 8w 9 .Q Q ym h h (8.83)
Using Eq. (8.71) together with Eq. (8.82) and (8.83) and considering that the extraction
fractions is usually small (about 5% [10]) compared to 1, it could be assumed that the cost
of condenser is the same for all three systems, i.e.

377
COND COND,1 COND,2.Q Q Q (8.84)
The third term in Eq. (8.80) and (8.81) can thus be neglected.
Next for the power output. Since extraction stream is saved from preheating working fluid,
more work could be done in the turbine when the extraction stream flows through the
turbine after replacing the feedwater heater by the AHS. The additional work done by the
extraction stream in the turbine is expressed by
w 5 8 1 6 8 1 7 8
12 11 11 10 6 12
net,1 net,1 net
w 5 8 6 8 7 8
6 11 7 13 1
0
1
,
6
,
m y h h y y h h y y h h
h h h h h hm y h h h h h h
h h h h h h
W W W
(8.85)
net,2 net,2 net
w 2 5 8 2 6 8 7 8
w 7 8
,0
.
m y y h h y y h h y h h
m y h
W W W
h
(8.86)
Using Eq. (4.104) and (4.113), change of net power output is related to the heat addition
rate from the AHS to the working fluid, as

378
ADD,1 12 11 11 10 6 125 8 6 8 7 8
6 11 7 13 6 11
ADD,1 12
net,1
3 2
11 11 10 6 125 8 6 8 7 8
5 6 11 7 13 6 1112
,
Q h h h h h hy h h h h h h
h h h h h h
Q h h h h h hh h h h h h
h h h h h
Wh h
h hh
(8.87)
net,2
11 1
ADD,2 ADD,2
7 8 7 8
2 2 7 130
.1
Wh
Q Qy h h h h
y y hh h
(8.88)
Subtract P,0 net,1c W on both sides of Eq. (8.80),
P,1 P,0
cwAHS AHS,1 COND,1 COND COND P,0
CO
6 12,1 net,1
6 11
net,1
ND .
h hC Q Q y Z W
Q
c
ch
W
c
h
CZ
(8.89)
Subtract P,0 net,2c W on both sides of Eq. (8.81),
cwAHS AHS,2 COND,2 COND P,0
COND
,2 net,2
net,2
P,2 P,0 ,
CZ c
c c
C Q Q WQ
W
(8.90)
in which net,1W and net,2W is shown in Eq. (8.87) and (8.88), respectively.

379
From Eq. (8.89) and (8.90), it could be seen that P, P,0ic c for 1,2i , if and only if
cwAHS AHS, COND,i COND COND P
6 12, net,
6 11
,0
COND
i i i
h hC Q Q i y Z
CW
Q h hZ c
(8.91)
or
cwAHS AHS, COND,i CO
6ND
12,
6 11
ne
C
t
OND
CONDP
,
,0.i i
i
h hC Q Q i y Z
Q hZ
h
C
cW
(8.92)
The numerator of the left hand side of (8.92) stands for the increase of the cost of the system
by replacing the feedwater heater with the AHS. The inequality (8.92) thus means that the
LEC of the such a hybrid system is lower than that of the single heat source reference
system if and only if the ratio between the additional cost for replacing the feedwater heater
(either HP or LP feedwater heater) by an AHS, and the additional net power output, is
smaller than the LEC of the reference system. For example, when the cost rate increase due
to replacing the feedwater heater with AHS is 5 $/s, the additional power output is 100
MW, and the LEC of the reference system is 0.02 $/kWh, or 0.056 $/MJ, the LEC of the
hybrid system will be lower that of the reference system, or the hybrid system is better than
the reference system in terms of LEC, since 5/100 = 0.05 < 0.056.

380
8.2.4. Analysis of the LEC differences between the hybrid and the
reference power generation Rankine-based systems
The above-derived formulations of the differences between the LEC-s of the Rankine-
based hybrid and the reference power generation systems allow the drawing of additional
generalized useful conclusions about these systems.
Generalization of the differences between the LEC-s of the Rankine-based
hybrid and the reference power generation systems
It can be seen that Eqs (8.51), (8.89) and (8.90) have similar form. When fuel is saved by
adding an additional heat source in the above shown system configurations like Fig. 4-2
and Fig. 4-11, they can be generalized as
AHSf q,AHS ADD AHS 0
B AHS
P
f
net,
P
0
P,0Δ .
c c Q Z Z
c c cW
(8.93)
When the power output increases by adding a heat source, such as when the additional heat
source is used to replace feedwater heaters in the above shown system configurations like
Fig. 4-17 and Fig. 4-18, the equations can be generalized as
AHSq,AHS ADD AHS net
net
0 P,0
AHSP P P,0
,0
Δ .
c Q Z Z c W
c c cW
(8.94)

381
In Eqs (8.93) and (8.94), AHSZ represents the cost rate associated with the components
used to collect the additional heat source (such as solar collectors if there is a solar input)
and their accessories (such as the associated circulation pump). The termAHS
q,AHS ADD
AHS
c Q
represents the cost of the additional heat source itself, such as the cost to buy waste heat
from other plants, but is zero if the heat source itself is free, such as for solar power or
geothermal power. These two terms are present in both equations and their sum represents
the total cost of using the additional heat source, including the cost of the source and the
cost of the hardware. 0Z is the change of cost of the components that both the hybrid and
the reference system have and represents the effect of introducing an additional heat source
on the cost change of the original component. As previously analyzed for each system, it
is small (if not zero) compared to the cost of the components in the reference system which
uses only one heat source and maybe neglected. The term f ADD
B
fc Q
exists only in Eq.
(8.93) and represents the cost reduction due to using less fuel in the hybrid system,
including the cost to buy fuel, the externality associated with the flue gas and ash (if any)
that results from burning the fuel, and the carbon tax that is imposed on the carbon dioxide
emission from burning the fuel, as shown in Eq. (8.33).
neP,0 tc W exists only in Eq. (8.94) and represents the saving of cost by generating more
power when introducing the additional heat source.

382
Comparison of the Rankine-based hybrid to the reference power
generation systems
When fuel is saved by the hybridization (introducing the additional heat source), Eq. (8.93)
shows that the LEC of the hybrid system is smaller than that of the reference system, if and
only if5
AHSf q,AHS ADD AHS 0
B AHS
f 0c c Q Z Z
(8.95)
or
B AHSf q,AHS ADD AHS 0
AHSf
.c c Q Z Z
(8.96)
This result provides the quantitative expression of the fact that once the type of the fuel
and the reference system have been chosen, the hybrid system will have economic
advantage over the reference system, if and only if the cost associated with fuel is larger
than the increase of system cost incurred by adding the additional heat source. It could be
achieved when fuel price, fc , or carbon tax/penalty imposed on carbon emission of the
power plant, ctc , are high enough. This corresponds the fact that the hybrid systems may
have economic competitiveness over conventional single heat source system because of
5 Under the constrains of Eqs (8.49) and (8.50), and applies to all other such statements.

383
the potential for saving depletable fuel and reducing emissions (including of greenhouse
gases) by hybrid power systems using renewable heat sources or other heat sources that
generate no emissions, both features having important economic impact when considering
the rise of fuel price and carbon tax (or other monetary penalty for CO2 emissions).
Although the values or range of fgc or
ashc cannot be estimated without the actual
operation parameters of the power generation system, typical values of fgc have been
calculated by some researchers (not for the Rankine cycle analyzed in this chapter). For
example, fgc is 17.84 €/GJ, or 22.06 $/GJ, for a novel zero-emission process generating
hydrogen and electric power [11] and is 17.23 $/GJ for a trigeneration system [12].
Equation (8.96) shows that hybrid system’s economic advantage over the conventional
single heat source (non-hybrid) power generation system rises with the fuel price fc and/or
the carbon tax/penalty ctc , and/or the drop of the cost of buying the heat source, q,AHSc , to
collect the additional heat source AHSZ , and the cost change of the components in the
reference system 0Z .
According to Eq. (8.94), when additional power is generated by the saving of the extraction
streams in the regenerative Rankine cycle system by introducing the additional heat source,
the LEC of the hybrid system is smaller than that of the reference system, if and only if

384
AHS
q,AHS ADD AHS 0 P,0
AHS
net 0c Q Z Z c W
(8.97)
or
AHSq,AHS ADD AHS 0
AHSP,A
net
HS P,0,
c Q Z Z
c cW
(8.98)
where P,AHSc is “the incremental power generation cost”. The numerator of the term at the
left hand of inequality (8.98) stands for the increase of system cost by adding the AHS, and
the denominator stands for the increase of power output by adding the AHS.
Inequality (8.98) thus means that the LEC of the hybrid system is lower than that of the
reference system, if and only if P,AHSc is smaller than the LEC of the reference system
P,0c .
As a special case when solar power is used as the additional heat source, the cost of the
heat source itself is 0, i.e. q,AHS 0c . If the additional heat source is added directly to the
reference system, 0Z can also be regarded as 0, since the component cost are the same
for the hybrid and the reference system. In this situation, inequality (8.98) is in fact the
“solar LEC” [13] which is a widely used parameter in assessing the performance of solar
or solar hybrid power plants, defined as the incremental cost divided by incremental power
output. This means that the LEC of the solar hybrid system is lower than that of the
reference system, if and only if the “solar LEC” is smaller than the LEC of the reference

385
system. This provides an easy way to compare the LEC of solar hybrid system with the
reference system without calculating the actual LEC of the solar hybrid system.
The effect of carbon tax/penalty and externalities on the comparison of the LEC of the
hybrid and the reference system is shown implicitly in the term P,0c as higher carbon
tax/penalty and externalities will make it larger.
Sensitivity analysis of the LEC-s differences between the Rankine-based
hybrid and the reference power generation systems, to the temperature of the
additional heat source
Since the cost of the additional heat source often increases with its delivery temperature,
the difference between the LEC of the Rankine-based hybrid and the reference power
generation systems changes with the temperature of the additional heat source.
If the temperature of the additional heat source is higher by HET [K] than the temperature
of the working fluid heated by it, where the subscript HE refers to the heat exchanger that
is used to transfer the heat from the additional heat source to the working fluid. HET is
typically about several dozen K. When a heat source is used to heat the working fluid
directly, without the use of a heat exchanger, HET = 0. According to Fig. 4-2,
3 H HS8 AE ,T T T T (8.99)
in which the temperature of the additional heat source AHST is assumed to be the
temperature of stream 8.

386
Using the definition of specific heat capacity at constant pressure
,p
P
hc
T
(8.100)
and expressing ADDQ by
ADD w 3 2 ,Q m h h (8.101)
The partial derivative of the heat addition rate to the working fluid from the additional heat
source with respect to the temperature of the additional heat source is
AHS
AHS AHS
w 3 2ADD 3 3 HEw w ,3
3 3 AHS
,p
m h hQ T h T Tm m c
T T T T T
(8.102)
in which wm [kg/s] is the mass flow rate of working heated by the additional heat source
and ,3pc [kJ/kg-K] is the specific heat capacity at constant pressure of the working fluid at
3T .
The partial derivative of the difference between the LEC-s between the Rankine-based
hybrid and reference power generation systems with respect to the temperature of the
additional heat source is, based on Eqs (8.93) and (8.94),

387
q,AHS AHS 0fw ,3
net
f
P B AHS AHS AHS
AHS ,0
Δ,
pm cT
C Z
c
WT
Zc
T T
(8.103)
net
ne
q,AHS AHS 0P,0
P AHS AHS AHS AHS
AH 0S t,
Δ.
T T T T
T
CW Z Zc
c
W
(8.104)
Typically, the cost of the AHS and the device for collecting the heat increases with the heat
temperature, so
q,AHS
AHS
0,C
T
(8.105)
AHS
AHS
0.T
Z
(8.106)
As stated before in Section 8.2.4.2, if the additional heat source is added directly to the
reference system, 0Z can be regarded as 0, since the component cost are the same for the
hybrid and the reference system. The last term in the numerator of Eq. (8.104) can thus be
dropped in this situation.
Calculation example
The previous sections deal with the thermodynamic analysis of hybrid power generation
systems based on the Rankine cycle. In this section, the results from the thermodynamic

388
analysis are tested with numbers, using hybrid power generation systems based on the
simple Rankine cycle as an example.
The assumptions are listed below:
1) The fuel used in the system is methane. The exergy factor of methane is f 1.04
and the specific exergy of methane is f 51.975 MJ/kgb [14];
2) The specific cost of fuel (fuel cost) is -6
f 2.416 10 $/kJ-energyc (New York,
7/13/2016) [15];
3) No ash is in the system since the fuel is methane, rather than solid fuel, such as coal;
4) The specific cost of flue gas is 0, i.e. fg 0c , as suggested in [2] when the flue gas is
emitted directly to the environment without further use;
5) The boiler efficiency is B 0.855 when the temperature of the flue gas is assumed
to be 120 °C [16];
6) The mass flow rate of fuel of the reference system is f,0 16.77 kg/sm and the power
output is net,0 315 MWW [17];
7) The power output of the hybrid system is the same as the reference one, i.e.
net net,0 315 MWW W ;
8) The total cost rate of the components of the reference system is 0 6.101 $/sZ [18];

389
9) The cost rate of equipment collecting the additional heat source (solar) without thermal
storage is 2.29 $/s with temperature at the outlet of solar collector at 666.5 °C and a
capacity of ADD 51 MWQ [19];
10) 3 hours of thermal storage is used, resulting in 19.2% more than the AHS equipment
cost without thermal storage [20];
11) The specific cost of the AHS (solar) is q,AHS 0c and the cost to collector it is
included in AHSZ ;
12) The change of the cost rate of common components of the reference and the hybrid
system is 0 0Z ;
13) The carbon tax rate imposed on carbon emissions is 2CO 0c .
The mass flow rate of fuel of the hybrid system is calculated using Eq. (8.37) as
f
511 15.576
16.77 51.975 /1.04 0.816.77
55 kg/s.m
(8.107)
Using the exergo-economic analysis method, the difference between the LEC of the hybrid
and the reference system is, according to Eqs (8.51) and (8.33),

390
ff fg ash ct
ne
AHSq,AHS ADD AHS 0
B AHS
P
AHS
t,0
6
AHS
1
2.416 10 1.041 0 0 0 0 51,000 2.29 1 0.192 0 $/s
1.04 0.855
315 MW
0.144 2.73 0 $/s0.030
1
Δ
3 5 MW
c Q Z
c
c c
W
c Zc
$/kWh.
(8.108)
The first number in the numerator of Eq. (8.108), 0.144 $/s, represents the cost reduction
from saving fuel by introducing the AHS, and the second number, 2.73 $/s, represents the
cost of the additional equipment by introducing the AHS. The number 0 in Eq. (8.108)
means the change of cost rate of the components that both the hybrid and the reference
system have in common, as assumed previously. It can be seen from Eq. (8.108) that the
cost saved from using less fuel is small (about 5%) compared to the addition equipment
cost from the AHS.
Comparatively, using the energo-economic analysis method as in Eq. (8.4), the difference
between the LEC of the hybrid and the reference system is

391
-
6
P
6
-
51,9752.416 10 15.576 2.29 1 0.192 6.101 0 $/s
1.04
315 MW
51,9752.416 10 16.77 6.101
Δ
$/s1.04
0.030 $/kWh.315 MW
c
(8.109)
It can be seen that the results from Eqs (8.108) and (8.109) are the same, meaning that the
two economic methods give the same results and the exergo-economic analysis method
was thus validated.
Using the above assumptions, it can be seen that the LEC of the hybrid system is higher
that of the reference one, since PΔ 0c , under the used assumptions, and it is of interest
to determine the assumptions/conditions values under which the LEC of the hybrid system
becomes lower than that of the reference system P(Δ 0).c As seen from Eq. (8.51),
some obvious conditions for that are an increase of the price of fuel. From Eq. (8.108),
f AHSq,AHS ADD AHS 0
B AHS
P
AHS
AHS
f fg ash ct
net,0
f
f
1
1.041 0 0 0 0 51,000 2.29 1 0.192 0 $/s
1.04 0.855
315 MW
59,649 2.73 0 $/s0,
315 M
Δ
W
c Qc c c Z
c
Zc
c
cW
(8.110)

392
when -5
f 4.58 10 $/kJ-energyc , meaning thatPΔ 0c when the price of fuel is
higher than -54.58 10 $/kJ-energy , which is 19-fold of the current level. Price that low
is unlikely, at least in the near future, so other methods have to be done to make the hybrid
systems economically competitive.
The previous calculations do not consider the effect of carbon tax rate, ctc , on
PΔc , by
assuming ct 0c in Eq. (8.33). Another way to make the hybrid systems have economic
advantage over the reference ones (i.e. PΔ 0c ) is imposing carbon tax (
ct 0c ). Higher
ctc (thus higher ctc based on Eq. (8.30)) will make the term f fg ash ct1c c c c in
Eq. (8.108) larger and thus resulting in a smaller PΔc , which is desired for the hybrid
system. From Eq. (8.108) but without assuming ct 0c ,
AHSq,AHS ADD AHS 0
B AHS
P
AH
ff fg ash ct
net,0
6
cS
AHS
t
ct
1
2.416 10 1.041 0 0 0 51,000 2.29 1 0.192 0 $/s
1.04 0.855
315 MW
0.144 1 2.73 0 $/s
Δ
c c Q Z Z
cW
c c c
c
c
0,315 MW
(8.111)
when ct 17.96c .

393
For methane, 2CO
f
442.75
16
m
m . Using Eq. (8.30), it can thus be found that
PΔ 0c
when
2 2 2ctct
CO CO CO
f f f
6
f
2.75 18.96,2.416
51,910
751.04
Cc
C
c m c
c bm
(8.112)
or 2ct CO0.79 $/kgc . This value is also too high to be feasible. For example, British
Columbia is imposing a carbon tax rate of 2CO0.03 $/kg in 2012, which increases
2CO0.005 $/kg annually since 2008 [21], and this means that carbon tax rate has to
increase 26-fold to the current value.
Reducing the AHS cost will also make the hybrid systems economic advantageous over
the reference ones. From Eq. (8.108),
ff fg ash ct
net,0
6
AHSq,AHS ADD AHS 0
B AHS
P
AHSAHS
AHS
AHS
1
2.416 10 1.041 0 0 0 0 51,000 0 $/s
1.04 0.855
315 MW
0.144 0 $/s0,
315 MW
Δ
c Q Z Z
cW
Z
c c c c
Z
(8.113)
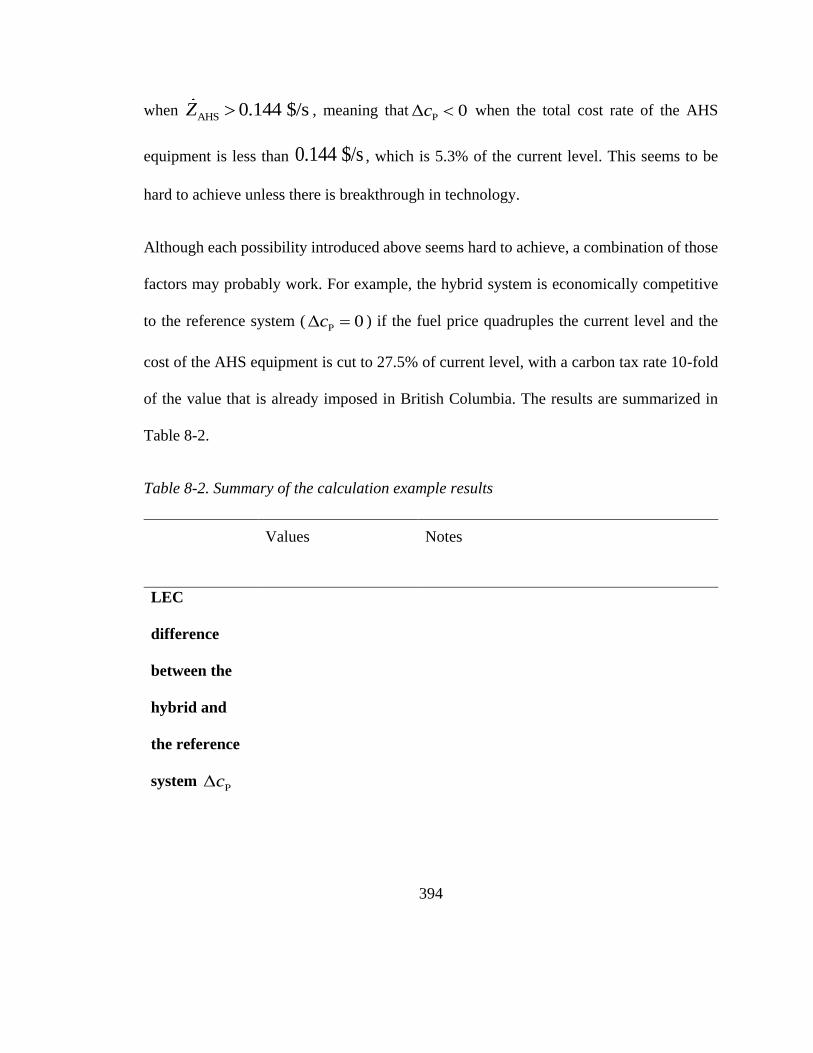
394
when AHS 0.144 $/sZ , meaning that
PΔ 0c when the total cost rate of the AHS
equipment is less than 0.144 $/s , which is 5.3% of the current level. This seems to be
hard to achieve unless there is breakthrough in technology.
Although each possibility introduced above seems hard to achieve, a combination of those
factors may probably work. For example, the hybrid system is economically competitive
to the reference system (PΔ 0c ) if the fuel price quadruples the current level and the
cost of the AHS equipment is cut to 27.5% of current level, with a carbon tax rate 10-fold
of the value that is already imposed in British Columbia. The results are summarized in
Table 8-2.
Table 8-2. Summary of the calculation example results
Values Notes
LEC
difference
between the
hybrid and
the reference
system PΔc

395
0.030 $/kWh
Exergo-economic analysis method using Eq.
(8.37)
0.030 $/kWh
Energo-economic analysis method using Eq.
(8.4)
Conditions
under which
PΔ 0c
-5
f 4.58 10
$/kJ-energy
c
Fuel price, at least 19-fold higher than the
current level
2ct CO0.79 $/kgc
Carbon tax rate, at least 26-fold of the
current level in British Columbia
AHS 0.144 $/sZ
Cost of the AHS equipment, at least 5.3% of
the assumed value

396
One feasible way to have
PΔ 0c
2
-6
f
ct CO
AHS
9.664 10 $/kJ-energy
(Quadruple of the current level)
0.3 $/kg
(10-fold of the current value in British Columbia)
0.37 $/s
(27.5% of the assumed value)
c
c
Z
In theory, the PΔc calculated based on the assumptions used above can be larger in other
circumstance, such as with lower net power output of the system net,0W , as can be seen
from Eq. (8.51). The reason why a smaller power output is not chosen is because there
wasn’t a system studied in the publications that uses natural gas as fuel in steam power
plant with lower power output. Another way to increase PΔc is to increase the heat input
from the AHS ADDQ (the cost of the AHS equipment AHSZ will also increase). Since the
relation between ADDQ and AHSZ cannot be determined, however, existing data from
previous publications by other researchers have to be used rather arbitrarily assumed. In
summary, P 0.030 $Δ /kWhc is the maximum value of
PΔc from the known data in
the literature. It can be higher theoretically, such as with a lower output net,0W or higher
AHS heat input ADDQ (and higher cost of the AHS equipment AHSZ ). Also, as can be seen
from Eq. (8.51), the difficulty to get a negative PΔc doesn't depend on the power output,

397
since the power output only appear in the denominator of Eq. (8.51) and doesn't affect the
sign of PΔc . It may not be difficult to get a negative
PΔc using other assumptions from
the publications, such as when the cost rate of equipment collecting the additional heat
source (solar) without thermal storage is 0.15 $/s with temperature at the outlet of solar
collector at 130.42 °C and a capacity of ADD 57 MWQ [22], resulting a
PΔc at nearly
0.
8.3. Hybrid power generation systems based on the Brayton cycle
Economics of hybridization of Brayton cycle systems is analyzed below, starting with their
simplest configuration, and followed by more advanced ones.
8.3.1. Hybrid power generation systems based on the simple Brayton
cycle
The flow diagram of the considered hybrid gas turbine system based on simple Brayton
cycle is shown in Fig. 5-1.
The summation of the cost balance equation for each component and applying the auxiliary
equations gives
COMP f AHS AHw,T w, 1 q, 5 COMP C TS C .C C C C C C Z Z Z Z (8.114)
Again, assuming the cost of electricity generated and consumed are the same, i.e.

398
COMPw, w,T P,c c c (8.115)
and since the cost of inlet air is zero, i.e.
1 0,C (8.116)
Eq. (8.114) could be rewritten as
P f q,AHS 5 COMP CC Tnet AHS Z ,c C C Z Z ZW C (8.117)
in which T Mnet CO PW WW is the net power output of the hybrid system.
Similarly, for the reference gas turbine system without AHS,
P,0 f ,0 5,0 COMP,0 CC,0 T,net,0 0,c C C Z ZW Z (8.118)
in which the subscript 0 stands for conventional gas turbine system without AHS and
T,0n COM ,0,0 PetW W W is the net power output of the reference system.
Since gas turbine is usually built as a whole from the factory and its component
(compressor, combustor and turbine) is highly integrated with each other, it could be
assumed that the gas turbine used in the hybrid and reference system is the same, i.e.
COMP CC T COMP,0 CC,0 T,0.Z ZZ Z Z Z (8.119)
Subtraction of Eq. (8.118) from Eq. (8.117) gives

399
P P,0 f f ,net net, 0 5 5,0 q, HS AHA0 SC C C C C Z .c W c W (8.120)
The second term on the right hand side of Eq. (8.120) is the change of externality of the
system when the flue gas (stream 5 in Fig. 5-1) is not used in other place
5 5 5 5,0 5,0 f,0 a 5 5 5,fg fg,0 5 0 f 0, 05 0 ,1 1 .c m b c m b m c b f cC C bC fC
(8.121)
The first term on the right hand side of Eq. (8.120) is
f f f f f,0 f f ff f ,0 f f,0C = = ,C c m b c m b c b m m (8.122)
in which fc is the specific cost associated with fuel including fuel price and carbon tax but
excluding externalities
f f ct1 ,c c c (8.123)
in which ctc is defined in Eq. (8.30).
According to mass and energy balance in the control volume enclosing the combustor for
the hybrid and the reference system, respectively,
CC f f 7 a 3 a f 4LHV+ + ,m m h m h m m h (8.124)
CC f,0 f,0 7 a 2 a f,0 4LHV+ + ,m m h m h m m h (8.125)

400
in which CC is the energy efficiency of the combustor defined as the ratio between fuel
energy input and enthalpy increase of working fluid.
From Eq. (8.124) and (8.125),
a 4 3 a 3 2a 4 2
f f,0
CC f TI CC f TI CC f TI
,LHV+ LHV+ LHV+
m h h m h hm h hm m
h h h h h h
(8.126)
in which f 7h h [kJ/kg] is the specific enthalpy of fuel at combustor inlet and
TI 4h h
[kJ/kg] is the specific enthalpy of combustor gas at turbine inlet.
Also, according to mass and energy balance in the control volume enclosing AHS
component in Fig. 5-1,
AHS AHS ADD a 3 2 .Q Q m h h (8.127)
Substitution of Eq. (8.127) into Eq. (8.126) gives
ADDf f,0
CC f TI
.LHV+
Qm m
h h
(8.128)
Substitution of Eq. (8.128) into Eq. (8.122) gives
ADDf f
CC f
0
TI
f f ,C C = .LHV+
Qc b
h h
(8.129)

401
Since the mass flow rate of fuel is small compared to that of air in gas turbine (fuel-air ratio
about 2%), the change of turbine power output due to change of mass flow rate of fuel is
small compared to the turbine power output of the reference system. Considering that the
compressor power input is roughly the same in the hybrid and reference systems because
they operate with the same working parameters (inlet air flow rate, temperature, pressure,
pressure ratio and isentropic efficiency), it could be assumed that their net power output is
also the same, i.e.
net net,0.W W (8.130)
Substitution of Eqs (8.43), (8.46), (8.47), (8.129) and (8.130) gives
q,AHADD
f f AHS
CC f TI
net,0
AHSf q,AHS ADD AHS
CC TI f AHS
f f
net,0
S fg fg,0
P P P,0
fg fg,0
eLHV+
=
1
.
Qc
h h
W
c
C Z C C
c c c
Z Cc Q
b
Ch h
W
(8.131)
The term TI f
f
h h
b
represents the fact that the fuel is mixed with the air in Brayton cycle
system, while is not in Rankine cycle system. The term fg fg,0C C accounts for the fact

402
that flue gas is emitted at the end of the system so the cost of each component of the system
have an impact on the cost of the flue gas, while in Rankine cycle system the flue gas only
flows through the boiler and is proportional to the cost rate of fuel as shown in Eq. (8.27).
Considering the fact that TI f
f
1h h
b
(about 2%) and fg fg,0 0C C if externality is
not included in the calculation of cost of electricity and the flue gas is not used elsewhere,
Eq. (8.132) has a similar form as Eq. (8.51) for hybrid simple Rankine cycle.
8.3.2. Hybrid power generation systems based on the Brayton cycle
with intercooling
The flow diagram of the hybrid gas turbine power plants with intercooling is shown in Fig.
5-5. The summation of the cost balance equation for each component and applying the
auxiliary equations gives
f AHS
COMP AHS cw1
w,T w,LC w,HC 1 q, 5
C cC 2T w ,
C C C C C C C
Z Z Z Z C C
(8.133)
in which COMP LC IC HCZ Z Z Z is the total cost rate of LP compressor, intercooler
and HP compressor.
Again, assuming the cost of electricity generated and consumed are the same and
considering the cost of inlet air is zero, Eq. (8.133) could be rewritten as

403
net COMP AHS cw1 cw2P f q,AHS 5 CC TZ .c C C C Z Z ZW C C (8.134)
The term of Eq. (8.134) is the cost rate increase of cooling water used in the intercooler
and is calculated by
cw1 cw2 cw cw cw1 cw2 ,c m b bC C (8.135)
in which cw cw1 cw2c c c [$/kJ], according to the F rule, is the specific cost of cooling
water, cw cw1 cw2m m m [kg/s] is the mass flow rate of cooling water,
cw1b and cw2b
[kJ/kg] are, respectively, the specific exergy of inlet and outlet cooling water.
Similarly, for the reference gas turbine system without AHS,
net,0 COMP,0P,0 f ,0 5,0 CC,0 T,0 cw1,0 cw2,0 .Wc C C Z Z Z C C (8.136)
Since the inlet condition of air (stream 1 in Fig. 5-5) and the operation parameters of
compressor (pressure ratio and isentropic efficiency) is the same for the hybrid and the
reference system, it could be assumed that the cost rate of cooling water is the same for
both systems, i.e.
cw1 cw2 cw1,0 cw2,0.C C C C (8.137)
Subtracting Eq. (8.136) from Eq. (8.134) and considering Eq. (8.137), (8.119) and (8.130),
the difference between the LEC-s between the hybrid and the reference Brayton cycle
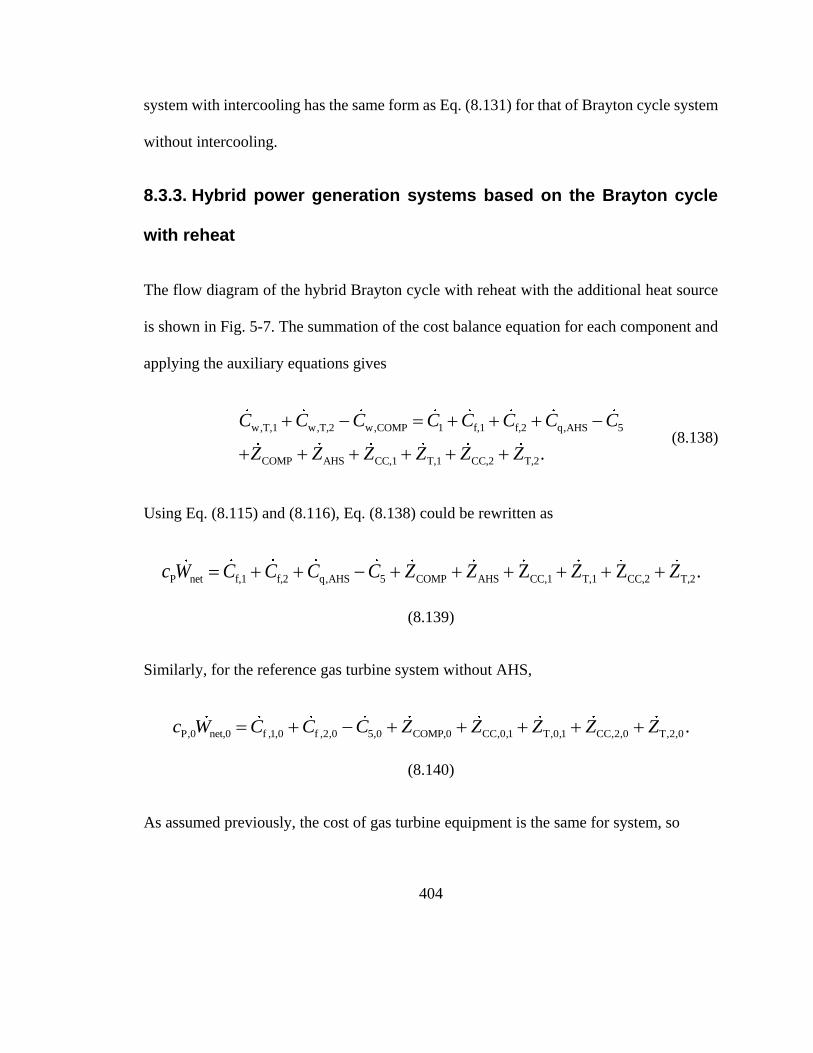
404
system with intercooling has the same form as Eq. (8.131) for that of Brayton cycle system
without intercooling.
8.3.3. Hybrid power generation systems based on the Brayton cycle
with reheat
The flow diagram of the hybrid Brayton cycle with reheat with the additional heat source
is shown in Fig. 5-7. The summation of the cost balance equation for each component and
applying the auxiliary equations gives
w,T,1 w,T,2 w, 1 q,AHCOMP f,1 f, S 5
AHS CC,1 T,1 CC,2 T,
2
COMP 2.
C C C C C C C C
Z Z Z Z Z Z
(8.138)
Using Eq. (8.115) and (8.116), Eq. (8.138) could be rewritten as
net COP f,1 f,2 q,AHS 5 MP AHS CC,1 T,1 CC,2 T,2Z Z .c C C C C Z Z Z ZW
(8.139)
Similarly, for the reference gas turbine system without AHS,
net,0 COMP,0 f ,1,0 f ,2,0 5,0 ,0 CC,0,1 T,0,1 CC,2,0 T,2,0P .c C C C Z Z Z ZW Z
(8.140)
As assumed previously, the cost of gas turbine equipment is the same for system, so

405
COMP COMPCC,1 T,1 CC,2 T,2 ,0 CC,0,1 T,0,1 CC,2,0 T,2,0.Z ZZ Z Z Z Z Z Z Z
(8.141)
According to mass and energy balance in the control volume enclosing the combustor 2 for
the hybrid and the reference system, respectively,
CC f,2 f,2 8 a f,1 41 a f,1 f,2 42LHV ,m m h m m h m m m h (8.142)
CC f,2,0 f,2,0 8 a f,1,0 41 a f,1,0 f,2,0 42LHV + .m m h m m h m m m h (8.143)
From Eq. (8.142) and (8.143),
f,2 f,2,0
a f,1 42 41 a f,1,0 42 41 f,1 f,1,0 42 41
CC f,2 TI CC f,2 TI CC f,2 TI
,LHV+ LHV+ LHV+
m m
m m h h m m h h m m h h
h h h h h h
(8.144)
in which f,2 8h h [kJ/kg] is the specific enthalpy of fuel at inlet of combustor 2 and
TI,2 42h h [kJ/kg] is the specific enthalpy of combustor gas at LP turbine inlet.
Thus, adding Eq. (8.144) and (8.128),

406
ADD 42 41f,1 f,1,0 f,2 f,2,0
CC f,1 TI,1 CC f,2 TI,2
1 .LHV+ LHV+
Q h hm m m m
h h h h
(8.145)
Using Eq. (8.130), the difference between the LEC-s of the hybrid and reference system
based on Brayton cycle with reheat is
ADD 42 41f f
CC f,1 TI,1 CC f,2 TI,2
net,0
42 41
CC f,2 TI,2 AHSf q,AH
P P P,0
5 5,0 q,AHS AHS
S ADDCC TI f AHS
f f
5 5,0 AHS
C C C1LHV+ L
Z
C C Z
HV+=
1LHV+
Q h hc b
h h h h
W
h h
h hc c
h
c c c
Qh
b
net,0
.W
(8.146)
The term 42 41
CC f,2 TI,2LHV+
h h
h h
shows the effect of adding an additional combustor and
using additional fuel. According to Eq. (8.142),
f,242 41 42 41
CC f,2 TI,2 CC 8 42 a f,2
1,LHV+ LHV+
mh h h h
h h h h m m
(8.147)

407
since the mass flow rate of fuel f,2m is small compared with that of the air
am .
Using Eq. (8.147), Eq. (8.146) has the same form as Eq. (8.131).
8.3.4. Hybrid power generation systems based on the Brayton cycle
with heat regeneration
The flow diagram of the hybrid Brayton cycle with heat regeneration with the additional
heat source is shown in Fig. 5-9. The summation of the cost balance equation for each
component and applying the auxiliary equations gives
w,T w,C 1 q,AHS 51 AHS CCf CO TMP R .C C C C C C Z Z Z Z Z
(8.148)
Again, assuming the cost of electricity generated and consumed are the same, i.e.
COMPw, w,T P,c c c (8.149)
and since the cost of inlet air is zero, i.e.
1 0.C (8.150)
Using Eqs (8.115) and (8.116), Eq. (8.150) could be rewritten as
P q,AHS 51net f COMP AHS CCR T.c C C C Z Z Z ZW Z (8.151)

408
Similarly, for the reference gas turbine system without AHS,
P,0 51,0 ,0 CC,0net,0 f,0 COM TP ,R,0 0.c C C Z Z Z ZW (8.152)
According to mass and energy balance in the control volume enclosing the combustor for
the hybrid and the reference system, respectively,
CC f f 7 a 3 a f 4LHV+ + ,m m h m h m m h (8.153)
CC f,0 f,0 7 a 21 a f,0 4LHV+ + .m m h m h m m h (8.154)
From Eqs (8.153) and (8.154),
a 4 3 a 3 21a 4 21
f f,0
CC f TI CC f TI CC f TI
.LHV+ LHV+ LHV+
m h h m h hm h hm m
h h h h h h
(8.155)
Also, according to mass and energy balance in the control volume enclosing AHS
component in Fig. 5-7,
AHS AHS ADD a 3 21 .Q Q m h h (8.156)
Substitution of Eq. (8.156) into Eq. (8.155) gives Eq. (8.128) as in hybrid simple Brayton
cycle analysis in section 3.1. Using Eqs (8.129) and (8.130), the difference between the

409
LEC-s of the hybrid and reference system based on Brayton cycle with heat regeneration
is
AHSf q,AH fg fg,0
P P
S ADD AHSCC TI f AHS
f f
net 0
P,0
,
1
,
c c Qh
Z C C
c c
h
b
Wc
(8.157)
whose form is similar to Eq. (8.131) except that the cost rate difference of flue gas (the last
term in the numerator) is calculated at the outlet of the regenerator instead of the gas turbine.
8.3.5. Analysis of the LEC differences between the hybrid and the
reference power generation Brayton-based systems
Similar as in the analysis for Rankine cycle in section 8.2.4, the difference between the
LEC-s of the hybrid and the reference power generation systems based on Brayton cycle
shown in Eqs (8.131), (8.146) and (8.157) could also be generalized to Eq. (8.93). The
analysis is thus the same as shown in section 8.2.4.
While we made similar calculation examples for the hybrid power generation systems
based on the Brayton and combined cycles, they are lengthy and not presented here because
the above-detailed method for the Rankine-based hybrids is the same, and because the

410
detailed example is adequate for demonstrating how the resulting equations can be used in
practice for these cycles too.
8.4. Hybrid power generation systems based on the combined-
cycle
8.4.1. Hybrid power generation systems based on the combined cycle
with the AHS added in the topping (Brayton) cycle
The flow diagram of the hybrid power generation systems based on the combined cycle
with the AHS added in the topping cycle (Brayton) is shown in Fig. 6-3. The summation
of the cost balance equation for each component and applying the auxiliary equations gives
w,GT w, w,ST w,CEP 1 q,AHS 5 cw2COMP f
COMP AH
cw1
CC GTS HRSG S COND C PT E .
C C C C C C C C C C
Z Z Z Z Z Z Z Z
(8.158)
Again, assuming the cost of electricity generated and consumed are the same and the cost
of inlet air is zero, Eq. (8.158) could be rewritten as
P q,AHS 5 cw2 cw1
CC GT CO
net f
COM ND CEPP AHS HRSG ST ,
c C C C C C
Z Z Z Z Z Z Z Z
W
(8.159)

411
in which net COMPw,GT w, w,ST w,CEPW C C C C is the net power output of the hybrid
system.
Similarly, for the reference gas turbine system without AHS,
P,0 5,0 cw2,0 cw1,0net,0 f,0
COMP, CC,0 GT,0 COND,0 CEP,00 HRSG,0 ST,0 ,
c C C C C
Z Z Z Z Z Z Z
W
(8.160)
in which net,0 COMw,GT,0 w, w,ST,0 w,CEP,0 0P ,W C C C C is the net power output of the
reference system.
According the energy balance for the control volume enclosing HRSG in Fig. 6-3, for the
hybrid and the reference system, respectively,
a f 4 5 bc 8 7 ,m m h h m h h (8.161)
a f,0 4 5 bc,0 8 7 ,m m h h m h h (8.162)
in which bc 8m m [kg/s] is the mass flow rate of working fluid in the bottoming cycle.
From Eqs (8.161) and (8.162),
bc,04 5 bc
8 7 a f a f,0
mh h m
h h m m m m
(8.163)

412
or
abc a f 0
bc,0 a f,0 a 0 0
11 .
1 1
m fm m m f f
m m m m f f
(8.164)
Since the fuel air ratio for a conventional gas turbine is small (about 2%), so 0 1f f
and thus
bc 0
bc,0 0
1 1.1
m f f
m f
(8.165)
Therefore, the power output from the steam turbine
bc 8 9ST
ST,0 bc,0 8 9
1,m h hW
W m h h
(8.166)
and the component cost at bottoming cycle
HRSG ST HRSGC CEP COND,0 CEP,ST 0 0,0 , ,Z Z Z Z Z Z Z Z (8.167)
since the operation parameter (temperature and pressure) for each component at bottoming
cycle is the same.
Considering Eq. (8.130), the net power output of the hybrid and the reference combined
cycle power plant is roughly the same. Thus, subtracting Eqs (8.160) from (8.159) and

413
considering Eqs (8.119), (8.167), (8.43) and (8.129), the difference between the LEC-s of
the hybrid and reference system based on the combined cycle is
AHSf q,AH fg fg,0
P P
S ADD AHSCC TI f AHS
f f
net 0
P,0
,
1
,
c c Qh
Z C C
c c
h
b
Wc
(8.168)
in which fg 5C C and fg,0 5,0C C [$/s] is the cost rate of system flue gas for the hybrid
and the reference system, respectively. It could be seen that Eq. (8.168) is the same as Eq.
(8.131) for the hybrid simple Brayton cycle system.
8.4.2. Hybrid power generation systems based on the combined cycle
with the AHS added in the bottoming cycle (Rankine) cycle
The flow diagram of the combined cycle power plant with the AHS added in the HRSG is
shown in Fig. 6-6. The summation of the cost balance equation for each component and
applying the auxiliary equations gives
COMP f
COMP HRS
w,GT w, w,ST w,CEP 1 q,AHS 5 cw
AHS CC GT G COND CEPST ,
C C C C C C C C C
Z Z Z Z Z Z Z Z
(8.169)
in which cw cw2 cw1C C C is the cost rate increase of cooling water.

414
Again, assuming the cost of electricity generated and consumed are the same and the cost
of inlet air is zero, Eq. (8.169) could be rewritten as
P q,AHS 5 cw
A
net f
COMP HRSG SHS CC GT COND CET P.
c C C C C
Z Z Z
W
Z Z Z Z Z
(8.170)
Similarly, for the reference gas turbine system without AHS,
P,0 5,0 cw,0
CC,0 GT,
net,0 f,0
0 CONDCOMP,0 HRSG, ,0 CEP,00 ST,0 .
c C C C
Z Z Z Z
W
Z Z Z
(8.171)
Subtracting Eq. (8.171) from Eq. (8.170),
net net,0
HRSG HRSG,
P P
0
,0 q,AHS AHS cw cw,0
COND CEP CEP,0ST ST,0 COND,0 ,
c c C Z C CW W
Z Z Z Z Z Z Z Z
(8.172)
in which the cost of the topping cycle for the hybrid and the reference system cancels out.
According the energy balance for the control volume enclosing HRSG+AHS in Fig. 6-4,
for the hybrid and the reference system, respectively,
ST CEPfg 4 5 LT bc 8 7 8 7 7 6
8 9 6 9
,W W
m h h Q m h h h h h hh h h h
(8.173)

415
ST,0 CEP,0
fg 4 5 bc,0 8 7 8 7 7 6
8 9 6 9
,W W
m h h m h h h h h hh h h h
(8.174)
in which fg 5m m [kg/s] is the mass flow rate of system flue gas and is the same for the
hybrid and the reference system since the topping cycle is the same for both systems.
Combining Eqs (8.173) and (8.174),
ADD bc bc,0 8 7 ,Q m m h h (8.175)
8 9
ST ST.0 ADD
8 7
,h h
W W Qh h
(8.176)
7 6
CEP CEP.0 ADD
8 7
.h h
W W Qh h
(8.177)
Using Eqs (16) and (17), Eq. (8.172) becomes
q,AHS AHS cw cw,0
COND CEP C
HRSG HRSG,0
ST ST,0 COND,0 net
net
EP,0 P,0
P P P,0 ,
C Z C C Z Z
Z Z Z Z Z Z cc c
W
Wc
(8.178)

416
in which netW [kW] is the difference of net power output of the hybrid and the reference
system
8 9 7 6
net net net,0 ADD
8 7
.h h h h
W W W Qh h
(8.179)
According to the cost functions given in [23], the cost the of steam turbine is proportional
to the 0.7th power of the turbine power output, the cost of pump is proportional to the
0.71th power of the pump work, and the cost of condenser is proportional to the mass flow
rate of working fluid. Since the steam turbine power output is proportional to the mass flow
rate of the working fluid through the turbine, the pump work is proportional to the mass
flow rate of the working fluid through the pump and the mass flow rate of the working fluid
through the steam turbine and through the pump is the same, using Eqs (15)-(17), the
relative difference of cost rate of the steam turbine, the condensate extraction pump and
the condenser between the hybrid and the reference system are summarized in Table 8-3
below.
Table 8-3. Relative difference of the component cost rate between the hybrid and the
reference combined cycle system
Component
k
Relative difference of cost rate of component k , ,0
,0
k k
k
Z Z
Z
,
between the hybrid and the reference system
Equation
number

417
Steam
turbine
(ST)
0.7 0.70.7 0.7
bc bc,0 bc ADD
0.7
bc,0 bc,0 bc,0 8 7
1 1 1m m m Q
m m m h h
(8.180)
Condensate
extraction
pump
(CEP)
0.71 0.710.71 0.71
bc bc,0 bc ADD
0.7
bc,0 bc,0 bc,0 8 7
1 1 1m m m Q
m m m h h
(8.181)
Condenser
(COND) bc bc,0 ADD
bc,0 bc,0 8 7
m m Q
m m h h
(8.182)
Also according to the cost function for HRSG [23],
ADDHRSG HRSG,0 HRSG bc bc,0 HRSG
8 7
,Q
c m m cZ Zh h
(8.183)
in which HRSGc [$/kg] is a constant.
For the cost of cooling water, since the mass flow rate of cooling water is proportional to
the mass flow rate of the working fluid in the condenser,
bc bc,0cw ADD
bc,0 bc
cw,
,0
0
cw 8 7
.m m Q
m m h h
C C
C
(8.184)

418
Substitution of Eqs (8.179)-(8.184) into Eq. (8.178) gives
HRSG C,0 b
P P P,0
cw c,0 8 9 7 6AHSq,AHS ADD
AHS ex
0.7 0.71
ADD ADDST,0 CEP,0 AHS
ex ex
net
,0 P,0+
1 1 1 1
,
c m h
c c c
Z C h h hc Q
Q
Q Q
Q
c
ZQ
W
Z Z
(8.185)
in which ex bc,0 8 7Q m h h is the heat addition rate to the bottoming cycle from gas
turbine exhaust gas.
8.4.3. Hybrid power generation systems based on the combined cycle
with the AHS added in both the topping and bottoming cycles
When the AHS are added in both the topping and bottoming cycles of the combined cycle
power plants as shown in Fig. 6-1, the summation of the cost balance equation for each
component and applying the auxiliary equations gives
w,GT w, w,ST w,CEP 1 q,AHS,1 AHS,2 5 cw2COMP f
COMP HR
cw1
AHS,1 AHS,2 CC SGT COND CEPG ST .
C C C C C C C Z C C C
Z Z Z Z Z Z Z Z Z
(8.186)

419
Again, assuming the cost of electricity generated and consumed are the same and the cost
of inlet air is zero, Eq. (8.158) could be rewritten as
net f
COMP
P q,AHS,1 q,AHS,2 5 cw2 cw1
AHS,1 AHS,2 CC GT COND CEPHRSG ST ,
c C C C C C C
Z Z Z Z
W
Z Z Z Z Z
(8.187)
in which net COMPw,GT w, w,ST w,CEPW C C C C is the net power output of the hybrid
system.
Similarly, for the reference gas turbine system without AHS,
P,0 5,0 cw2,0 cw1,0net,0 f,0
COMP, CC,0 GT,0 COND,0 CEP,00 HRSG,0 ST,0 ,
c C C C C
Z Z Z Z Z Z Z
W
(8.188)
in which net,0 COMw,GT,0 w, w,ST,0 w,CEP,0 0P ,W C C C C is the net power output of the
reference system.
Subtracting Eq. (8.188) from Eq. (8.187) and using Eqs (8.119), (8.43) and (8.129),
AHS,1
net net,0 f q,AHS,1 ADD,1 AHSCC TI f AHS,1
f f
AHS
P P,0 q, ,2
,1 ,2 fg fg,0AHS HRSG HRSG,0
ST ST,0 COND
cw cw,0
COND CEP CEP,0,0
1
.
c c C
Z Z C C C
W W c c Qh h
C Z Z
Z Z Z Z Z Z
b
(8.189)

420
Using Eqs (8.180)-(8.184), Eq. (8.189) could be written as
AHS,1
f q,AHS,1 ADD,1 AHSCC TI f AHS,1
f f
AHS,2 HRSG C,0
q,AHS,2 ADD,2 net
A
P P P,0
,1 fg fg,
HS,2 ex
0.7
ADD
0
cw,0
,2
T
e
P
S
x
1
+
1 1
c c c
Z C C
Z Cc
c c Qh h
b
cc Q W
Q
Q
QZ
0.71
ADD,2
,0 CEP,0
ex
net,
A S
0
H ,21 1
,
Q
Q
W
Z Z
(8.190)
in which netW is the net power output differences of the hybrid and the reference system
and is shown in Eq. (8.180).
8.4.4. Analysis of the LEC differences between the hybrid and the
reference power generation combined cycle-based systems
Similar to the analysis for Rankine cycle in section 8.2.4, the difference between the LEC-
s of the combined-cycle-based hybrid and reference power generation systems expressed
by Eqs (8.168) and (8.185) could also be generalized to Eqs (8.93) and (8.94), respectively
in the fuel-saving mode and power-boost mode. The analysis is thus the same as shown in
section 8.2.4, and so are the results. It, however, cannot be used in the power generation

421
systems studied in section 8.4.3, because unlike other studied systems in this chapter which
have only one additional heat source, there are 2 in the system studied in section 8.4.3. One
of the additional heat source (AHS1) is used to save fuel, while the other additional heat
source (AHS2) is used to increase the power output of the system. This means that the
system operates in both the fuel-saving mode and the power-boost mode.
As discussed in section 8.2.4, the terms associated with the fuel (fuel price, carbon tax, cost
associated with cooling water and externalities of flue gas and ash) are included explicitly
in the expression of Pc in the fuel-saving mode, but are included implicitly in the power-
boost mode (affect the LEC of the system). As could be seen from Eq. (8.190), however,
the terms associated with the fuel (fuel price, carbon tax, cost associated with cooling water
and externalities of flue gas and ash) exist both explicitly and implicitly.
8.5. Comparison between the exergo-economic analysis method
and the energo-economic analysis method
Using the energo-economic analysis method as Eq. (8.4), the difference between the LEC
of the hybrid and the reference power generation systems is expressed by
O&M,0 f,0O&M f
net
Inv,0
ne
InvP P P,0
t,0
,CC
H W H W
C CC Cc c c
(8.191)
in which the subscript 0 stands for the corresponding term in the reference single heat
source system (i.e. without the additional hybridizing heat source).

422
Using Eq. (8.6), Eq. (8.191) could be rewritten as
AHS f f,0
net n
TOT q,AHS
e
TO
t,0
T,0
P P P,0 ,Z Z C C Z C
c c cW W
(8.192)
in which TOT,0Z [$/s] is the total cost rate of the reference system, and TOTZ [$/s] is the
total cost rate of the hybrid system without the component cost associated with the
additional heat source, AHSZ . As defined in section 8.2.4.1,
TOT TOT,0 0.Z Z Z (8.193)
Comparing the results from the exergo-economic analysis method and the energo-
economic analysis method, it could be seen that the exergo-economic analysis method is
able to show:
1) the expressions for calculating the mass flow rate change of fuel, f f,0m m , such
as Eq. (8.37), which the energo-economic analysis cannot show since it doesn’t
consider the thermodynamic aspect of the power generation systems, such as the
flow enthalpy and temperature, and doesn’t have the corresponding terms to
determine it;
2) the expressions for calculating the change of the net power output from the hybrid
and the single heat source reference system, net net,0W W , such as Eq. (8.180);

423
3) the expressions for calculating the cost change of the components that both the
hybrid and the single heat source reference system have, 0Z , such as Eq. (8.40);
4) the effect of the heat transfer rate from the additional heat source to the working
fluid ADDQ on the change of LEC between the hybrid and the reference system
Pc , such as Eqs (8.51), (8.131), (8.146), (8.157), (8.168) and (8.185);
5) the conditions under which the LEC of the hybrid system is competitive with the
reference system, such as Eqs (8.96) and (8.98);
6) the effects of the temperature of the heat source on the LEC difference between the
hybrid and the reference system, Pc , such as by Eqs (8.103) and (8.104);
7) the expressions for calculating the externalities, such as flue gas, using system
operating parameters, in Eq. (8.27), ash in Eq. (8.29) and cooling water.
Having these advantages, the exergo-economic analysis method is clearly a better tool in
comparing the economic performance of hybrid system using multiple heat sources of
different temperatures and the conventional single heat source system, by giving more
insights of the system, compared with the energo-economic analysis method.
8.6. Summary and conclusions of the exergo-economic analysis
of thermal hybrid power generation systems
Exergo-economic analysis is used to compare the levelized cost of electricity (LEC) of
hybrid power generation systems using multiple heat sources of different temperature with

424
the corresponding conventional single heat source systems. It is shown that for the three
major types of power generation cycles, i.e. Rankine cycle, Brayton cycle and combined
cycle, and their variants, such as reheat and heat regeneration, the difference between the
LEC-s of the hybrid and the corresponding single heat source reference system could be
generalized into two equations: when the additional heat source is used to save fuel (fuel-
saving mode),
f ADD q,AHS ADD 0
BP P P
f AHSAHS
AH
t,
,0S
ne 0
Δ ,
c Q c Q Z Z
c c cW
(8.194)
and when the additional heat source is used to generate more power (power-boost mode),
AHSnetP,0 q A, ADD AHS 0
P P P,0
HS
AHS
net
Δ .
c W c Q Z Z
c c cW
(8.195)
The first term in the numerator of Eq. (8.194) stands for the saving from fuel (becomes
zero when no fuel is saved, the power-boost mode), while the first term in Eq. (8.195)
stands for the savings from generation of additional power from adding the AHS and is
zero when no additional power is generated therefrom (fuel-saving mode) The second term
for both equations stands for the cost of the additional heat source, the third term for both
equations stands for the cost of the components for collecting or using the heat source, and
the last term in both equations stands for the additional cost of the equipment component
of the reference system (zero if the component of the reference system doesn’t change).

425
Note that Eqs (8.194) and (8.195) are derived using the assumptions that the pump work is
neglected (justifiably here) and the net power outputs for both the hybrid and the reference
system are the same, i.e. Eqs (8.49) and (8.50).
In the fuel-saving mode, according to Eq. (8.96) the LEC of the hybrid system is lower
than that of the reference system, if and only if
2 2CO COfg fg
f
f f f f f f f f
Bq,AHS A
ash ash as
D
hf
AHSD AHS
f AHS
0
11 1
,
b bc
c mc c mc
c c m cb m
c Q Z Z
f b b
(8.196)
in which fc (cost per unit exergy of fuel) is the price of fuel, fgc (cost per unit exergy of
flue gas) is the specific cost of flue gas of the system calculated using the SPECO method,
ashc (cost per unit exergy of ash) is the specific cost of ash of the system calculated using
the SPECO method and 2COc (cost per unit weight of carbon dioxide emissions) is the
carbon tax or penalty on the carbon emissions of the power generation systems. Equation
(8.196) shows that increases of any of these specific costs will make the hybrid system
more competitive with the reference system, in terms of LEC. Among these specific costs,
fc and 2COc are determined by the market and policy, respectively, while fgc and
ashc
are calculated using the SPECO method. The cost of externalities is determined by the
markets or policy.

426
In the power-boost mode, the specific costs of fuel, flue gas, ash and carbon penalty are
not explicitly shown in the final expression of PΔc as can be seen from Eq. (8.195). They,
however, implicitly affects the PΔc in the term P,0c as higher specific cost of fuel, flue
gas, ash and carbon will increase the LEC of the reference system.
While flue gas and ash are often treated as externalities that have additional or zero cost
for the power generation system, they can also be regarded as its gainful products of the
power generation system. For the latter, for example, warm flue gas can be sold for
providing heat for chemical plants, and ash can be sold for making cement or road asphalt.
Analysis of Eq. (8.194) shows that the LEC of the hybrid system is lower than that of the
reference system if the price fuel and/or carbon tax is high enough. It was also shown in
Eq. (8.194) that there is an inverse relation between the fuel price, fc , and the LEC
difference of the hybrid and the reference systems, PΔc . This means that PΔc decrease
when fc increases, and vice versa. It further suggests that higher fuel price in the future
will make the hybrid system more economically advantageous than the corresponding
reference system.
It is noteworthy that the above analysis was based on the current fuel price. In fact, it also
holds in future scenarios when the fuel price changes. Eqs. (8.194) and (8.195) continue to
be valid. If the fuel price rises in the future, the LEC difference between the hybrid and the
reference systems ( PΔc ) will decrease when compared with the “initial” LEC difference
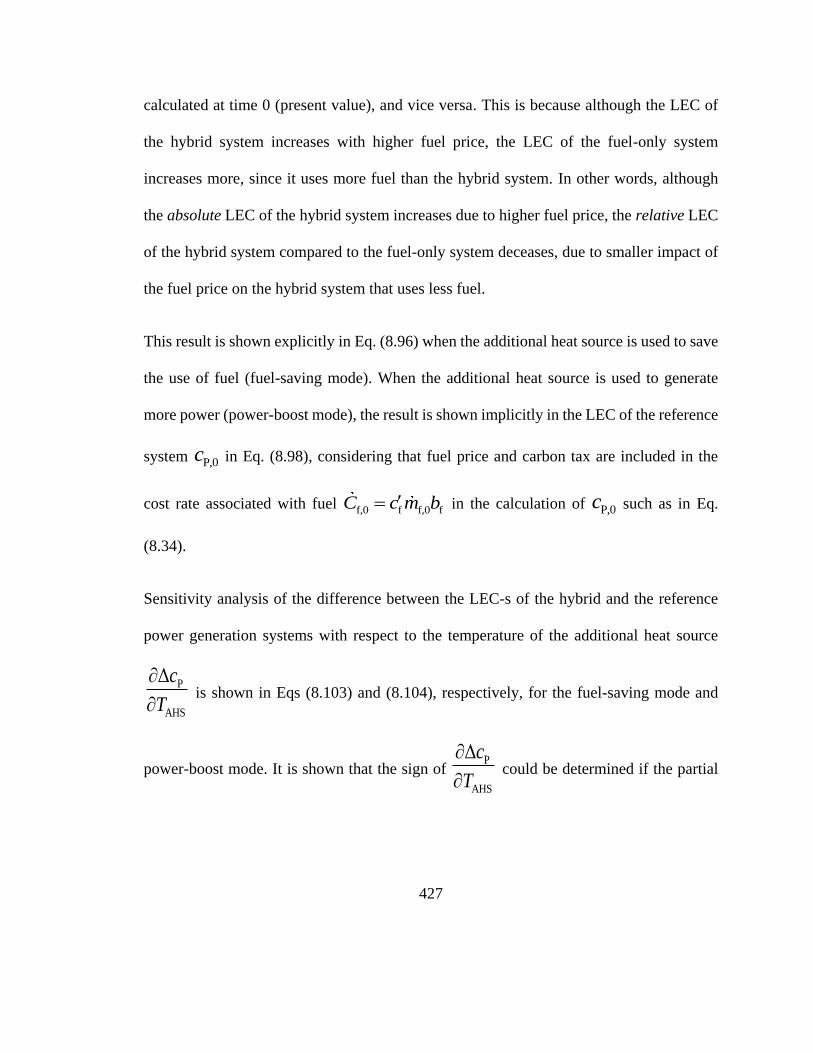
427
calculated at time 0 (present value), and vice versa. This is because although the LEC of
the hybrid system increases with higher fuel price, the LEC of the fuel-only system
increases more, since it uses more fuel than the hybrid system. In other words, although
the absolute LEC of the hybrid system increases due to higher fuel price, the relative LEC
of the hybrid system compared to the fuel-only system deceases, due to smaller impact of
the fuel price on the hybrid system that uses less fuel.
This result is shown explicitly in Eq. (8.96) when the additional heat source is used to save
the use of fuel (fuel-saving mode). When the additional heat source is used to generate
more power (power-boost mode), the result is shown implicitly in the LEC of the reference
system P,0c in Eq. (8.98), considering that fuel price and carbon tax are included in the
cost rate associated with fuel f,0 f f,0 fC c m b in the calculation of P,0c such as in Eq.
(8.34).
Sensitivity analysis of the difference between the LEC-s of the hybrid and the reference
power generation systems with respect to the temperature of the additional heat source
AHS
PΔc
T
is shown in Eqs (8.103) and (8.104), respectively, for the fuel-saving mode and
power-boost mode. It is shown that the sign of
AHS
PΔc
T
could be determined if the partial

428
derivative of the components related with the additional heat source with respect to the
temperature of the additional heat source AHS
AHS
Z
T
is known.
8.7. Recommendations and future trends of the exergo-economic
analysis of thermal hybrid power generation systems
In addition to the equations developed in this study for allowing the calculation of the
exergo-economic condition that make hybrid power systems competitive with
conventional (non-hybrid) ones, the results show that making hybrid systems that use
multiple heat sources of different temperatures economically competitive with the
corresponding fuel-only conventional power generation system, the fuel price has to be
high enough. Considering the fact that the current fuel prices do not in most cases include
even a small fraction of the cost of fuel externalities (such as, but not limited to, carbon
tax), inclusion of these would help protect the environment and make hybrid systems more
economically competitive. Some governments are already imposing carbon taxes, which
will also cause systems that use less fossil fuel to become more economically competitive.
Noting that the calculation example shown in Table 8-2 is representative of only a single
hybrid system case and states chosen for ease of demonstration, the conditions for the LEC
of this hybrid system to be equal to that of the reference single-heat-source system are that
the fuel price has to rise 19-fold, or the cost of the AHS equipment has to be reduced to

429
5.3% of the current value, or the carbon tax rate has to increase to 26-fold of the value that
is currently imposed in British Columbia, any of which is hard to reach.
More generally, while fuel price is largely determined by the market and accounting
policies for externalities such as greenhouse gas emissions, the analysis shows that a
rewarding effort is to decrease the cost associated with the components that collect and use
the additional heat source, such as solar collectors when solar heat is used as the additional
heat source, or heat collection grid systems when waste heat is used. As technology
advances, there is still much room to decrease the cost of using the additional heat source
(AHS), compared with the conventional fuel-only systems that have been developed for
centuries and may have less room for reducing theirs.
Forecasting rising fuel price in the long term, higher taxing of externalities, and decreasing
cost for implementing additional heat sources, hybrid systems using multiple heat source
of different temperatures will thus increasingly become more economically competitive
when compared with the conventional systems, especially for the hybrid systems that use
heat sources that reduce generation of greenhouse gases and other undesirable emissions.
References for Chapter 8

430
[1] Lazzaretto A., Tsatsaronis G., SPECO: A systematic and general methodology for
calculating efficiencies and costs in thermal systems. Energy 2006;31:1257-1289.
[2] Bejan A, Tsatsaronis G, Moran M., Thermal design and optimization. New York, US:
John Wiley and Sons, Inc.; 1996.
[3] El-Sayed Y.M., The Thermoeconomics of Energy Conversions. Oxford, UK: Elsevier
Ltd; 2003.
[4] Roosen P., Uhlenbruck S., Lucas K., Pareto optimization of a combined cycle power
system as a decision support tool for trading off investment vs. operating costs. Int J
Therm Sci 2003;42:553-560.
[5] Yildirim U., Gungor A., An application of exergoeconomic analysis for a CHP
system. Int J Elec Power 2012;42250-256.
[6] Ahmadi P., Dincer I., Thermodynamic and exergoenvironmental analyses, and multi-
objective optimization of a gas turbine power plant. Appl Therm Eng 2011;31:2529-
2540.
[7] Yang Y., Wang L., Dong H., Xu G., Morosuk T., Tsatsaronis G., Comprehensive
exergy-based evaluation and parametric study of a coal-fired ultra-supercritical power
plant. Appl Energ 2013;112:1087-1099.

431
[8] Kalogirou A.S., Solar thermal collectors and applications. Prog Energy Combust
2004(30):231-295.
[9] Boehm R.F., Design analysis of thermal systems (Appendix D: Preliminary cost
estimation data). New York US: John Wiley & Sons;1987.
[10] Dincer I., Zamfirescu C., Advanced Power Generation Systems. New York US:
Elsevier;2014.
[11] Tsatsaronis G., Kapanke K., Marigorta M.B.A., Exergoeconomic estimates for a
novel zero-emission process generating hydrogen and electric power. Energy
2008(33):321-330.
[12] Temir G., Bilge D., Thermoeconomic analysis of a trigeneration system. Appl
Therm Eng 2004(24):2689-2699.
[13] Dersch J., Geyer M., Herrmann U., Jones S.A., Kelly B., Kistner R., Ortmanns W.,
Pitz-Paal R., Price, H., Trough integration into power plants—a study on the performance
and economy of integrated solar combined cycle systems. Energy 2004;29:947-959.
[14] Szargut, J., Exergy Method: Technical and Ecological Applications. WIT Press,
2005.

432
[15] U.S. Energy Information Administration, 2016, “Natural Gas Weekly Update”,
<http://www.eia.gov/naturalgas/weekly/#tabs-prices-2>.
[16] Cleaver-Brooks Inc., Boiler efficiency guide, 2010-Available at:< www.cleaver-
brooks.com/reference-center/insights/boiler-efficiency-guide.aspx > [accessed 1.7.2016].
[17] Khoshgoftar Manesh M.H., Navid P., Baghestani M., Khamis Abadi S., Rosen M.A.,
Blanco, A.M., Amidpour M., Exergoeconomic and exergoenvironmental evaluation of
the coupling of a gas fired steam power plant with a total site utility system. Energ
Convers Manage 2014;77:469-483.
[18] U.S. Energy Information Administration, 2016, “Updated Capital Cost Estimates for
Utility Scale Electricity Generating Plants”,
<http://www.eia.gov/outlooks/capitalcost/pdf/updated_capcost.pdf>.
[19] Baghernejadand A., Yaghoubi M., Exergoeconomic analysis and optimization of an
Integrated Solar Combined Cycle System (ISCCS) using genetic algorithm. Energ
Convers Manage 2011;52:2193-2203.
[20] Zhang N., Lior N., Use of Low/Mid-Temperature Solar Heat for Thermochemical
Upgrading of Energy, Part I: Application to a Novel Chemically-Recuperated Gas-
Turbine Power Generation (SOLRGT) System. J Eng Gas Turb Power 2012;134:072301.

433
[21] Carbon Tax Center (British Columbia) - Available
at:<http://www.carbontax.org/where-carbon-is-taxed/british-columbia/> [accessed
28.2.2016].
[22] Martin J.R., Rodriguez E.B., Paniagua I.L., Fernandez C.G., Thermoeconomic
Evaluation of Integrated Solar Combined Cycle Systems (ISCCS). Entropy
2014;16:4246-4259.
[23] Baghernejadand A., Yaghoubi M., Exergoeconomic analysis and optimization of an
Integrated Solar Combined Cycle System (ISCCS) using genetic algorithm. Energ
Convers Manage 2011;52:2193-2203.

434
CHAPTER 9
EXERGO-ECONOMIC ANALYSIS FOR
THERMOCHEMICAL HYBIRD POWER GENERATION
SYSTEMS
This chapter examines economic performance of two previously proposed and analyzed
thermochemical hybridized power generation systems: SOLRGT that incorporates
reforming of methane, and SOLRMCC that incorporates methanol decomposition, both of
which using use low temperature solar heat (at ~220 °C) to help convert the methane or
methanol input to syngas, which is then burned for power generation. The solar heat is used
“indirectly” in the methane reforming process, to vaporize the needed water for it, while it
is used directly in the methanol decomposition process since methanol decomposition
requires lower temperatures than methane reforming. This analysis resulted in an equation
for each power system for determining the conditions under which the hybrid system will
have a lower levelized electricity cost, and how it will change as a function of the fuel
price, carbon tax rate, and the cost of the collection equipment needed for the additional
heat source.
9.1. Exergo-economic analysis of the SOLRGT system
The goal is to find the LEC difference between that for the hybrid system (SOLRGT) and
its corresponding reference systems (IC-CRGT and IC-HSTIG) using the operational

435
parameters of the systems. This is done by using the previously described SPECO method
in Section 8.1.2. The fuel, product and auxiliary equation for each component are first
determined and then the cost function can be built for each component. Manipulation of
those cost balance equations will arrive at the LEC equation for each system. Further
analysis could then be made based on it, and needed conclusions could be drawn.
The fuel, product and necessary auxiliary equations for each component for applying the
SPECO method are summarized in Table 9-1. The cost balance equations are constructed
using Eq. (8.9) and are shown below the table. The “additional heat source” stands for solar
heat in SOLRGT but can be generalized to other heat sources, such as waste or geothermal
heat, so the term “additional heat source” (AHS for short) is used below.
Table 9-1. Fuel, product and auxiliary equations for each component in the SOLRGT
system in Fig. 7-1
Component Fuel Product
Auxiliary
equation
No. of
streams
Inlet Outlet
LP-
Compressor w,LPCC
2 1C C - 2 1
Intercooler cw,in cw,outC C 3 2C C cw,in cw,outc c 2 2

436
(F rule)
HP-
Compressor w,HPCC
4 3C C - 2 1
Recuperator 17 18C C
5 4
13 12
C C
C C
18 17c c (F rule) 3 3
Combustor 5C 1415C C - 2 1
Turbine 15 16C C w,TC
16 15c c (F rule) 1 2
Reformer 16 17C C 14 13C C 17 16c c (F rule) 2 2
Pump w,PC 7 6C C - 2 1
Economizer 18 19C C 8 7C C 19 18c c (F rule) 2 2
Additional
Heat Source q,AHSC
9 8C C - 2 1
Fuel
Compressor w,FCC
11 10C C - 2 1

437
Mixer 9 11C C 12C - 2 1
Cost balance equations:
LP-Compressor:
2 1 w,LPC LPCC C ZC (9.1)
Intercooler:
cw,in cw,out3 2 ICC C C C Z (9.2)
HP-Compressor:
4 3 w,HPC HPCC C ZC (9.3)
Recuperator:
5 4 13 12 17 18 RECC C C C C C Z (9.4)
Combustor:
1415 5 CCC C C Z (9.5)
Turbine:

438
w,T 15 16 TC C C Z (9.6)
Reformer:
14 13 16 17 REFC C C ZC (9.7)
Pump:
7 6 w,P PC C ZC (9.8)
Economizer:
8 7 18 19 EC ZC C C (9.9)
Additional heat source:
9 8 q,AHS AHSC C ZC (9.10)
Fuel compressor:
11 10 w,FC FCZC C C (9.11)
Mixer:
9 112 1C C C (9.12)

439
Adding Eqs (9.1)-(9.12) together results in cancelation of some of their unknowns as
shown in Eq. (9.13):
10
w,T w,LPC w,HPC w,P w
1 6 cw,out cw,in 19
,F
T T
C
O ,
C C C C C
C C C C C C Z
(9.13)
in which TOTZ is the total cost rate of SOLRGT including all components:
TOT k.k
Z Z (9.14)
Before further treatment of Eq. (9.13), we make two assumptions that are typical for power
systems and to simplify the equations:
(1) 1C , the cost rate associated with the inlet air of gas turbine, could be regarded as 0 since
it is usually free to get from the ambient air;
(2) cw,out cw,inC C is the cost rate associated with the cooling water and is considered
small compared with the cost rate associated with the fuel fC . For example, in the case
study in ref. [1], cw,out cw,inC C is (11.9-5.0) =6.9 $/h; while fC is 785.2 $/h;
The higher temperature heat source (fuel) usually generates flue gas (stream 13 in Fig. 7-1)
after burning in the boiler. When the flue gas is not utilized in any further process and is
ultimately emitted to the atmosphere as in normal practice, there are two ways to assessing

440
the cost associated with the flue gas. One ways is to calculate fgc based on the cost balance
equations. A simpler way is to set the specific cost of the flue gas to 0, i.e.
13fg 0.c c (9.15)
This way of determining fgc , however, is not recommended since it doesn’t allow an
estimation of the cost consequences of rejecting the flue gas to the surroundings and it also
violates the F rule [1]. Either way is acceptable and the results apply to the final results of
the analysis, although resulting in different values of calculated Pc . This also means that
the Pc calculated from the exergo-economic method is not necessarily the same as from the
energo-economic analysis method.
When not utilized in other processes, the flue gas is an undesirable externality (interaction
with the environment that the power utility is not obliged to pay), and this analysis method
is an opportunity to quantify here the “cost” of externalities and this is an advantage of
using the exergo-economic analysis than the conventional energo-economic analysis
method.
Sometimes carbon tax could be imposed on power generation plants that emit CO2, which
is proportional to the amount of CO2 emitted to the atmosphere, i.e.
2 2ct CO CO ,C c m (9.16)

441
in which ctC [$/s] is the carbon tax imposed on the system,
2COc [$/kg] is the specific cost
for carbon emission, and 2COm [kg/s] is the carbon emission rate to the atmosphere.
According to the combustion equation for methane
4 2 2 2 2CH 2 1 0.2 O CO 2H O 0.4O , (9.17)
when methane is used as fuel and burned completely to carbon dioxide and steam
(requiring excess air of at least 20% to ensure complete combustion), and no carbon capture
method is used, the mass rate of CO2 emission will be proportional to the fuel used in the
system:
2
4
CO
CH
442.75.
16
m
m (9.18)
So
2 2 2 4 2ct CO CO CO CH CO a2.75 2.75 ,C c m c m c m f (9.19)
in which am [kg/s] is the mass flow rate of inlet air (stream 1 in Fig. 7-1) and f is the
fuel-air ratio.
As shown in [2], the average unit cost of electricity consumption could be assumed to be
the same as that of electricity generation, and all to be equal to the levelized electricity cost,
i.e.

442
w,CEP w,AHSP w,T p.c c c c (9.20)
Equation (9.13) can thus be rewritten as
q,Af w fg TOT ct
p,h
ne
S
t
H + +,
C C C CZc
C
W
(9.21)
in which f 10C C is the cost rate of the fuel, w 6C C is the cost rate of incoming water
and fg 13C C is the cost rate of flue gas of the system. For SOLRGT, q,AHSC can be
regarded as 0 since solar radiation does not need to be paid, and the components for
utilizing solar radiation, such as the solar collection equipment, have been taken into
account in AHSZ and
TOTZ .
Although the final expression for the LEC of the system, Eq. (9.21), using the exergo-
economic analysis method, contain only the external terms but not the internal ones that
are inside the system, the internal terms inside the system which are listed in Table 9-1 are
still needed, since that explains how Eq. (9.21) is derived. Without the help of the internal
terms listed in Table 9-1, Eq. (9.21) cannot be written directly, even though it is similar to
Eq. (8.4) of the energo-economic analysis method.
Without using the exergo-economic analysis method, one may write a similar equation to
Eq. (9.21) based on Eq. (8.4), but people have no confidence if it is correct or not. No
443
researchers have ever expressed the LEC of a power generation system like Eq. (9.21) if
the exergo-economic analysis method were not used.
What’s more, without the use of the exergo-economic analysis method, the cost associated
with the externalities, such as the flue gas, fgC cannot be estimated appropriately. One of
the internal cost balance equations, Eq. (9.4), shows how fgC is estimated, if it is not set to
0 as the energo-economic analysis does. Different assumptions for fgC will result in
different results for the LEC of the system, which may be different from the result given
by the energo-economic analysis.
9.2. Comparison the LEC of the SOLRGT with the reference single
heat source thermochemical system (IC-CRGT)
It is of interest to compare the LEC for the SOLRGT with that for the system that does not
use solar heat or does not include a thermochemical process. As introduced in section 7.2.1,
the first reference system that is without solar heat is IC-CRGT shown in Fig. 7-3, and the
second reference system is the non-thermochemical one (IC-HSTIG) which will be
discussed in the next section. As a basis for comparison, the turbine inlet temperature and
mass flow rate of the compressor inlet air are kept the same for all systems.
In the fuel-only reference system, solar heat is not used to vaporize the water, so more fuel
is needed to maintain the turbine inlet temperature. Since water is vaporized by the gas

444
turbine exhaust gas in the reference system, less steam will be generated by the turbine
exhaust gas heat in the SOLRGT system since it does not have as much thermal energy to
vaporize both the needed water and heat the pressurized air. For the same reason, the
methane conversion rate in the reference system will be lower because the turbine exhaust
gas cannot provide as much heat as the SOLRGT system to the reforming process.
Reference [15] specifically showed that, compared with SOLRGT, in the reference system
the fuel flow rate increased from 0.02 kg/s to 0.026 kg/s, the water-to-methane mole ratio
decreased from 6.1 to 5.02, and the methane conversion rate decreased from 0.378 to 0.340.
Using the same SPECO method as for SOLRGT, the resulting electricity cost expression
for the reference system IC-CRGT is
f,0 w,0 fg,0 TOT,0 ct,0
p,0
net,0
,C C C Z
W
Cc
(9.22)
in which the subscript 0 stands for the reference system.
From the results given in [15], the net power output of the reference system is 601.9 kJ/(kg
air used in the system), which is about 1.6% more than that for SOLRGT, mainly because
of the higher mass flow rate of working fluid by the turbine due to the increased fuel flow
rate.
Since the mass flow rate of the fuel is small compared with the mass flow rate of the
working fluid (fuel/air mass flow rate ratio is about 2%), it can be assumed that the cost

445
rate difference of each component between the reference system and SOLRGT is small
compared to the total cost rate of SOLRGT.
The total cost rate of the reference system could thus be expressed by
TOT,0 TOT AHS.Z Z Z (9.23)
Next, for the difference of the cost rate of the fuel,
f f ,0 f f f f,0 f f a 0 ,C C c b m m c b m f f (9.24)
in which fc [$/kJ],
fb [kJ/kg] and fm [kg/s] are the specific cost of the fuel, specific
chemical exergy of the fuel and mass flow rate of the fuel, respectively, f is the fuel/air
ratio. a 1m m [kg/s] is the mass flow rate of air and is kept the same for both systems in
this analysis.
The mass flow rate of the flue gas is the sum of the air, fuel and water mass flow rates, i.e.
fg a f w a a sm f
sm a1 ,
fm m m m m m
f
m
Rf
R
m
(9.25)
fg,0 a f,0 w,0 a a sm,0 f,0
s
0
,0 m 00 a1 ,
m m m m m mf R m
Rf mf
(9.26)

446
in which w
sm
f
mR
m and w,0
sm,0
f,0
mR
m are the steam-methane mass ratios for the
SOLRGT and the reference system, respectively.
Strictly speaking, the specific exergy of the flue gas is different for the reference and
SOLRGT systems due to their different thermodynamic condition (temperature, pressure,
and composition). Since the difference between the mass flow rate of the fuel in the
reference and SOLRGT systems is small relative to the working fluid flow rate (0.6%) and
the turbine inlet condition is fixed, it is assumed here that their exergies are the same. Thus
the cost rate difference of the flue gas is, from Eqs (9.25) and (9.26),
fg fg,0 fg fg fg fg,0
fg fg a 0 sm 0 sm,0 .
C C c b m m
c b m f f fR f R
(9.27)
The cost rate associated with the additional heat source is
q,AHS q,AHS AHS,BC c (9.28)
in which Sq,AHc [$/kJ] is the specific cost of the additional heat source (AHS), which is 0
when the source energy itself, neglecting the cost of the needed systems for their collection
or extraction, is free, such as in cases when solar or geothermal energy is used as AHS, and
AHSB [kW] is the exergy flow rate from the AHS into the system.

447
The cost rate of water (stream 6 in Fig. 7-1), according to the definition, is
w w w w f sw w w am w sm= .C c m mb c b R c b fRm (9.29)
Thus the cost rate difference of water between the SOLRGT and the reference systems is
w w,0 w a w aw sm w 0 sm,0
w sm 0 smw ,a 0 .
c fR c f R
c
C C b m b
b f
m
m fR R
(9.30)
The cost rate of carbon tax is expressed by Eq. (9.19), so the difference between the carbon
tax rate for the SOLRGT and for the reference system is
2ct ct,0 CO 0a2.75 ,C C c m f f (9.31)
T T T ,W m h (9.32)
in which Tm is the total mass flow rate of the working fluid (combustion gas) and
Th is
the specific enthalpy change of the working fluid through the turbine. Since the mass flow
rate of water is independent of the mass flow rate of the fuel, there is no fixed relation
between the turbine power output and thus the net power output of the SOLRGT and the
reference system IC-CRGT.
Since the turbine power output is proportional to the mass flow rate of the working fluid
and considering that the mass flow rate of air is kept the same for both systems, the power
output ratio between the reference and SOLRGT system is

448
T,0 a w,0 sm,0
T a
f,0
w f s
0 0
m
1.
+ 1
W m m m R
W m m m R
f f
f f
(9.33)
Note that although the turbine power output ratio of the reference and the SOLRGT system
can be explicitly written as Eq. (9.33), the ratio of the net power output of the system cannot,
and we therefore define the ratio of the net power output of IC-CRGT and SOLRGT as ,
i.e.
net,0
net,h
,W
W (9.34)
for further analysis. The results from [15] show that the net power output of IC-CRGT is
about 1.6% higher than that of SOLRGT, or 1.016 .
Using Eq. (9.34), the electricity cost difference between the hybrid system SOLRGT and
the reference fuel-only system IC-CRGT is thus

449
f w fg AHS TOT
p p,h p,0
net
f,0 w,0 fg,0 TOT,0
net,0
f f,0 w w,0 fg fg,0
AHS AHS
n
q, ct
ct,0
q, ct ct,0
f f a 0 w
et,0
w sm 0a
fg fg
sm,0
+C C C C C
C C C C
C C C C C C
Zc c c
W
Z
W
Z
W
c fR f R
C C C
c b m f f b m
c b
2
2
0
AHS 0
net,0
w 0 AHS
a 0 sm sm,0
q,AHS CO a
a f f fg fg CO 0
a w fg fg sm AHS AHS
ne
sm,0 q,
t,0
2.75
2.75
.m
m f f fR R
C c m
m c b c
f
Z f f
W
c f B Z
b c f f
b c b fR R c
W
(9.35)
For SOLRGT to be competitive with the reference fuel-only system economically, Pc
must be ⩾ 0, i.e.
2
w 0
AHS AHS AH
a f f fg fg CO 0
a w fg fg sm,0 sm
q S,
2.75
.
m c b c b c f f
m b cc fb f
Z
R R
c B
(9.36)

450
Based on the case in ref. [15], the values of the terms in Eq. (6.79) are 1.016
0 0.026f , 0.02f ,sm,0 5.02R and
sm 6.1R , so 0 0.0057f f and
sm,0 s0 m 0.0066R fRf . Considering that 1 , or 0 0f f f f , it
could be assumed that
00 0 sm,0 sm .f f f f R ff R (9.37)
Also, since the temperature of the incoming water is close to the ambient, the water
specific exergy is small compared with that of the fuel, i.e. fwb b . Since the water
price is also small compared with that of the fuel, i.e. w fc c , we can neglect the water
cost rate term in Eq. (9.36) because
w f fw .c b c b (9.38)
Using (9.37) and (9.38), Eq. (9.36) can be simplified to
2
AHS AHS AHSf f fg fg CO a 0 q,2.75 .c b c b c m f B Zf c (9.39)
This means that for SOLRGT to be economically competitive with its reference system,
the cost saving from fuel reduction (saving fuel usage, reduce carbon tax and selling flue
gas as by-product) by using the AHS must not be smaller than the total cost of the AHS
and the SOLRGT components that were added to the reference system. As Eq. (9.36)

451
shows, this can be achieved by increasing the carbon tax rate 2
COc and/or decreasing the
AHS component cost AHSZ , or if the fuel price fc rises to the level of
2
AHS AHS AHq,C
Sf O fg fg
0 a f
2.75c
c c c bf f m b
B Z
(9.40)
Using this equation as a test example specific to the SOLRGT case [15], the use of Eq.
(9.40) is demonstrated using the assumption shown in Table 9-2.
Table 9-2. Assumptions used in the analysis of the SOLRGT system in Fig. 7-1 with
numbers
Variables Values
Specific cost of the AHS (solar) q,AHS solar 0cc
Carbon tax rate 2
CO 0c
Specific cost of the flue gas fg 0c
Difference between the fuel-air ratio of IC-
CRGT and SOLRGT 0 0.026 0.02 0.006f f [15]
Mass flow rate of compressor inlet air a 610 kg/sm [15]

452
Specific chemical exergy of fuel (methane) f 831.6 kJ/mol 51.975 MJ/kgb
[2]
Using Eq. [15], the annual average investment cost of SOLRGT inv,anC is 25.5 M$, and
that the solar block (consisting of the solar collection equipment field, thermal storage
system which could provide heat for SOLRGT for 3 hours of operation when there is no
solar heat input, and the solar evaporator) accounts for 54.0% of the total cost
( SB 0.54 ). So the cost rate of the solar block is
6inv,an
AHS SB
$25.5 100.54 0.437 $/s.
365 24 3600 s
CZ
H
(9.41)
Substituting the assumptions used in Table 9-2 and Eq. (9.41) into Eq. (9.40), shows that
for SOLRGT to be economically competitive with the reference fuel-only system, fc must
be larger than 2.3×10⁻⁶ $/kJ.
The average natural gas price in the US (on 11/23/2015) was 2.546 $/(million BTU) or
2.7×10⁻⁶ $/kJ, and was lowest at 1.7×10⁻⁶ $/kJ in the US mid-Atlantic region [51]. This
average fuel cost is already high enough for SOLRGT to be economic competitive,
although not high enough in some regions. It is noteworthy that the price of gas in the US

453
(Henry Hub) is one of the lowest in the world, up to about 5-fold, it is obvious that
SOLRGT under these conditions would be very competitive in most of the world.
If the fuel price is, however, 2.3×10⁻⁶ $/kJ, one way to make SOLRGT economically
advantageous is by imposing a carbon tax of
22
AHS AHS Aq,CO f f
a
HSCO
0
40.0113 $/kg .
11
cc c b
m f f
B Z
(9.42)
This is a practical tax value and some country/region has already imposed higher carbon
tax. For example, British Columbia in Canada has imposed a carbon tax at 0.022 $/kgCO2
since July 2012 [3], which almost doubles the value given in Eq. (9.42).
Another way to make SOLRGT economically competitive is to decrease the cost of the
solar block. Without carbon tax, and using the lowest fuel cost at1.7×10-6 $/kJ, the cost of
the solar block AHSZ must be
2
f f CO a 0 qAHS H,AHS A S2.75 0.323 $/s,c b c m Bf f cZ (9.43)
which is only 26% lower than its above cited value, and is thus not unrealistic and is
feasible as technology advances.
9.3. Comparison of the LEC of the SOLRGT with the reference
hybrid non-thermochemical reference system (IC-HSTIG)

454
Besides the single heat source thermochemical reference system introduced before, it is of
interest to compare the thermochemical system with the non-thermochemical hybrid
system (that can be called the “thermal hybrid system”), i.e. using two heat sources but
with no thermochemical process. Both the thermochemical hybrid systems introduced are
based on a Brayton cycle, so the reference non-thermochemical hybrid system can be
configured based on the steam-injected gas turbine power generation system (STIG). In the
STIG, steam is injected into the combustor to increase the mass flow rate of the working
fluid and thus increase the power output of the turbine. The AHS can be added in the STIG
to preheat the water for the injected steam generation. The flow diagram of the reference
non-thermochemical hybrid system, here called the intercooled hybrid steam injected gas
turbine (IC-HSTIG), is shown in Fig. 9-1. As the figure shows, the pressurized incoming
water (stream 7) is vaporized by the additional heat source before being superheated by the
gas turbine exhaust gas. The superheated steam (stream 9) is then mixed with the fuel and
air in the combustor. To compare with the performance of the SOLRGT, the turbine inlet
temperature and the temperature of the AHS are the same as in the SOLRGT, respectively.

455
Fig. 9-1. Flow diagram of the reference non-thermochemical hybrid system IC-HSTIG
(intercooled hybrid steam injection gas turbine power generation system)
When comparing the LEC for the SOLRGT with the non-thermochemical reference system
IC-HSTIG shown in Fig. 9-1, the LEC for the latter is determined by using the same
SPECO method as for SOLRGT, the LEC is expressed by
qf,0 w,0 fg,0 TOT,0 ct,0,AHS,0
p,0net,0
,C C C C
cCZ
W
(9.44)

456
in which the subscript 0 stands for the reference system and the superscript prime stands
for the reference system IC-HSTIG.
According to Fig. 7-1, the total energy addition rate to the SOLRGT, inQ , is the sum of
the enthalpy of water, fuel and the heat from regenerated from the turbine exhaust gas
(ignoring heat losses in each equipment since they are small compared to the heat duty of
the equipment), i.e.
in w w P ADD f f f FC fg ex fg fgLHV+ + ,Q m h W Q m h m W m h m h
(9.45)
in which PW and FCW are the power input of the pump and the fuel compressor,
respectively, ADDQ is the heat addition rate from the AHS to the system, w 6m m is the
mass flow rate of the incoming water, f 10m m is the mass flow rate of the fuel,
fg 16m m is the mass flow rate of the flue gas, exh and fgh are the specific enthalpies
of the turbine exhaust gas and the flue gas, respectively.
Similarly, according to Fig. 9-1, the total energy addition rate to the IC-HSTIG, in,0Q , can
be expressed by
in,0 w,0 w,0 P,0 ADD,0
f,0 f,0 f,0 FC,0 fg,0 ex,0 fg,0 fg,0LHV .
Q m h W Q
m h m W m h m h
(9.46)

457
For comparison, the mass flow rate of compressor inlet air and turbine inlet temperature is
the same for both systems. By comparing Eqs (9.45) and (9.46), it can be concluded that
each corresponding term in the two equations should be the same, i.e.
in,0 inQ Q (9.47)
w,0 wm m (9.48)
w,0 wh h (9.49)
P,0 PW W (9.50)
ADD,0 ADDQ Q (9.51)
f,0 fm m (9.52)
f,0 fh h (9.53)
FC,0 FCW W (9.54)
fg,0 fgm m (9.55)
ex,0 exh h (9.56)

458
fg,0 fgh h (9.57)
It is thus easy to know that
f,0 fC C (9.58)
w,0 wC C (9.59)
q,AHS,0 q,AHSC C (9.60)
fg,0 fgC C (9.61)
ct,0 ctC C (9.62)
net,0 netW W (9.63)
The cost rate of the corresponding equipment in the SOLRGT and IC-HSTIG are thus also
the same. So the cost rate difference between the two systems is
TOT TOT TOT,0 REC REF ECO HR ,Z Z Z Z Z Z Z (9.64)
in which RECZ, REFZ
and ECOZ are the cost rates of the recuperator, reformer and
economizer of the SOLRGT system and HRZ is the cost rate of the heat regenerator of
the IC-HSTIG system.

459
Comparing Eqs (9.21) and (9.44), the LEC difference of the SOLRGT and IC-HSTIG is
TOT
p p,h p,0net
.Z
c c cW
(9.65)
It can thus be concluded from Eq. (9.65) that the LEC for the thermochemical hybrid
system (SOLRGT) is lower than that for the non-thermochemical hybrid system (IC-
HSTIG) if TOT 0Z , or REC REF ECO HRZ Z Z Z according to Eq. (9.64). It can
also be seen that Pc doesn’t change with the fuel price, carbon tax rate or the AHS
equipment cost.
9.4. Sensitivity analysis of the SOLRGT LEC to fuel price, carbon
tax and the solar collection equipment price
From Eq. (9.21), the LEC for the SOLRGT p,hc increases with the cost of the fuel fC
and carbon tax ctC , as well as the cost of the additional heat source (AHS) components
AHSZ (part of the cost of all components in SOLRGT TOTZ ). To illustrate this
characteristics, sensitivity analysis of the LEC for the SOLRGT to fuel price, carbon tax
and cost of AHS component will be done. For SOLRGT, solar radiation is used as the AHS,
so the AHS components include the solar collection equipment. Thermal storage may also
be used and should strictly be included, but the majority of the AHS cost comes from the
solar collection equipment (70% of total LHTS cost [15]). This analysis therefore focuses

460
only on the change of the solar collection equipment price rather than the total cost of all
AHS components.
The assumption used are mostly from [15] and are summarized in Table 9-3.
Table 9-3. Economic analysis assumptions summary for the SOLRGT system in Fig. 7-1
Values Notes
Price of the
methane
2.0 $/MMBtu [4]
Plant operation
life
30 years
[15]
Interest rate 8% [15]
Price of the land 2.8 $/m2 [15]
Annual O&M
(cost of operation
and maintenance)
4% of the investment capital cost of the system [15]
Construction
period
2 years [15]

461
Finance 50% of the total investment cost is an interest-bearing
loan and the other 50% is equity, and a loan interest
rate of 8%, and the loan period (years) which is
assumed to be equal to the system operation life,
which means there is no loan payment during the
construction period
[15]
Solar collection
equipment cost
100.6 M$ [15]
Price of the
methane variation
80-120% of the base price (0.144 $/Nm3) Assumed
solar collection
equipment cost
variation
100%, 75% or 50% of base cost (100.6 M$) Assumed
Carbon tax rate
variation
0 to 0.04$/kgCO2 Assumed
based on
[3]
The results are shown in Fig. 9-2. The two variables are fuel price relative to the current
price at $2.0/MMBtu (assumed price/$2.0/MMBtu) and carbon tax rate, respectively. The

462
objective function is the levelized electricity cost (LEC) from the system calculated using
Eq. (9.21). The upper, middle and lower surface in the figure were calculated when the
solar collection equipment price is 100%, 75% and 50% of the base price (288.4 $/m2 [15]),
respectively. Using Eq. (9.21) and the data in Table 9-3, the LECs of the SOLRGT are
2CO cf360.6
LEC(1
$/kWh)5.1
1052
4,
i c ra (9.66)
in which 1 56.25a when the solar collection equipment price is 100% of the base price,
2 50.92a when the solar collection equipment price is 75% of the base price,
3 45.59a when the solar collection equipment price is 50% of the base price, 2
COc [$/kg]
is the specific cost for carbon emission and cfr is the ratio between the assumed fuel price
and the current fuel price.
Fuel price fluctuates, often with large amplitude and frequency. Equation (9.66) thus
provides a good estimate of how the LEC of the hybrid cycle changes with the fuel price.
For example, it can be seen from Eq. (9.66) that the LEC will increase by about 35% when
the fuel price doubles from the current level, and will decrease by about 10% when the fuel
price is half of the current level.

463
Fig. 9-2. Sensitivity analysis of levelized electricity cost (LEC) from SOLRGT to fuel price,
carbon tax with different solar collection equipment price (100%, 75% and 50% of the
base price for the upper, middle and lower surface, respectively)

464
It can be seen from Fig. 9-2 that for all the solar collection equipment prices considered in
this study, the LEC for SOLRGT increases with both fuel price and carbon tax rate. For
example, when there is no carbon tax and the solar collection equipment price is the same
as the base price, the LEC for the system will decrease by about 4% (from 0.049 $/MWh
to 0.047 $/MWh), if the fuel price decreases by 20% from the current price. When both
fuel and solar collection equipment prices remain at their base price, the LEC for the system
will increase by about 28% (from 0.049 $/MWh to 0.062 $/MWh) if the carbon tax rate is
increased from 0 to 0.04$/kgCO2.
Besides fuel price and carbon tax rate, it is obvious (and shown in Fig. 9-2) that higher
solar collection equipment price would raise the LEC. For example, when the fuel price is
at its base value and the carbon tax rate is that in British Columbia in Canada, i.e. 0.022
$/kgCO2, reducing the solar collection equipment price to half of its base price, causes the
COE of the system to decrease by about 12% (from 0.056 $/MWh to 0.050 $/MWh).
9.5. Exergo-economic analysis of the SOLRMCC
The exergo-economic analysis is now performed for the SOLRMCC system, in the same
way as it was done for SOLRGT (in Section 9.1). The fuel, product and necessary auxiliary
equations for each component for applying the SPECO method are summarized in Table
9-4. The cost balance equations can be constructed using Eq. (8.9) and are shown below
the table.

465
Table 9-4. Fuel, product and auxiliary equations for each component in the SOLRMCC
system in Fig. 7-6
Component Fuel Product Auxiliary equation
No. of streams
Inlet Outlet
Heater Aq, ,1HSC 2 1C C - 2 1
Reactor Aq, ,2HSC 3 2C C - 2 1
Compressor w,CC 4 0C C - 2 1
Combustor 3C 45C C - 2 1
Gas Turbine 5 6C C w,GTC 6 5c c (F rule) 1 2
HRSG 6 7C C 8 12C C 7 6c c (F rule) 2 2
Steam Turbine 8 9C C w,STC 9 8c c 1 2
Condenser cw,in cw,out-C C 11 10C C cw,in cw,outc c
(F rule)
2 2

466
Pump w,PC 12 11C C - 2 1
Cost balance equations:
Heater:
2 1 q,AHS,1 HC C ZC (9.67)
Reactor:
3 2 q,AHS R,2C C ZC (9.68)
Compressor:
4 0 w,C CC C ZC (9.69)
Combustor:
4 35 CCC C ZC (9.70)
Gas Turbine:
w,GT 5 6 GTC C C Z (9.71)
HRSG:

467
8 12 6 7 HRSGC C C ZC (9.72)
Steam Turbine:
w,ST 8 9 STC C C Z (9.73)
Condenser:
cw,in11 cw,10 O Do C NutC C C C Z (9.74)
Pump:
12 11 w,P PC C ZC (9.75)
Adding Eqs (9.67)-(9.75) together results in cancelation of some of their unknowns as
shown in Eq. (9.76):
1 0
w,G T w,ST w,C w,P
q,7 cw,in cw,out TAH OS T ,
C C C C
C C C C C C Z
(9.76)
in which TOTZ is the total cost rate of the system including all components and
considering time value of money and finance. q,AHSC is the cost rate of the additional
heat source and is the sum of q,AHS,1C and q,AHS,2C .

468
Before further treatment of Eq. (9.13), we make two assumptions that are typical for power
systems and to simplify the equations as in the SOLRGT.
When methanol is used as fuel and no carbon capture method is used, the amount of carbon
emission will be proportional to the fuel used in the system, or specifically,
2
3OH
CO
CH
441.375
32
m
m (9.77)
So
2 2 2 3 2ct CO CO CO CH OH CO f1.375 1.375 .C c m c m c m (9.78)
Since all the carbon dioxide generated during the operation of the studied system comes
from the usage of the fuel, carbon tax could also be regarded as the additional cost of the
fuel in addition to the purchasing cost of the fuel fc . So when carbon tax is considered,
the cost rate of the fuel fC can be expressed by
2 2
ctf f f f CO ff COf f f1.375 1.375 .C C C c b m c m c b c m (9.79)
Using Eq. (8.31), the LEC for the hybrid system with consideration of the carbon tax is
q,AHf fg TOT
p,hne
S ct
t
.Z
cW
C C C C (9.80)

469
It is of interest to compare the LEC for the hybrid with that from the system without solar
heat input. The system without solar heat is the conventional gas turbine combined cycle
system with methanol as fuel (this is assumed just for this analysis; Methanol is not
commonly used as fuel for gas turbines, but was discussed, such as in [5]), with the same
flow diagram as Fig. 7-6, without the solar heat source and its related components including
the solar collection equipment, heater and reactor. The operating parameters are the same
as in the hybrid system, including fuel and air inlet temperatures and pressures, mass flow
rate of compressor inlet air, gas turbine and steam turbine inlet temperatures, compression
ratio of gas turbine, isentropic efficiency of compressor, gas turbine, steam turbine and
pump, flue gas temperature, cooling water inlet temperature and pressure, temperature of
working fluid at condenser outlet and pump pressure ratio.
Using the same method as in the hybrid system, the resulting LEC expression for the
reference system is
f,0 fg,0 TOT,0
p,0net,0
ct,0+,
C C CZc
W
(9.81)
in which the subscript 0 stands for the reference system.
Comparison of the LEC for the hybrid and reference system can be done by comparing
each term in Eqs (9.80) and (9.81). In the following comparison, the turbine inlet
temperature would be kept the same for both.

470
Methanol is the only fuel used in this hybrid and in its reference systems. In the hybrid
system, the methanol is decomposed to CO and H2 that are then burned; while in the
reference system, the methanol is directly burned. According to species conservation, for
both systems, the mole ratio of carbon dioxide and steam in the combustion gas is 1:2,
since the mole ratio of carbon to hydrogen atoms is 1:4 in the methanol (CH3OH) molecule
and each carbon dioxide molecule (CO2) has 1 carbon atom and each steam molecule (H2O)
has 2 hydrogen atoms. Besides methanol, gas turbine inlet air also contains some carbon
and hydrogen. The mole ratio of CO2 in the atmospheric dry air (without vapor) is typically
only 0.03% [1]. Continuous operation of the gas turbine compressor requires removal of
the moisture from the compressor inlet air, so the CO2 and H2O in the air can be neglected
relative to their content in the methanol fuel.
To approach complete combustion of the fuel, the gas turbine inlet air flow is assumed to
be 20% higher than needed for stoichiometric combustion. Since the gas temperature and
pressure at the turbine inlet are assumed to be the same for the hybrid and reference system,
so is thus the enthalpy. The energy balances of the combustor for the reference and hybrid
systems, respectively, are thus
a,0 4 f,0 a,0 f,0 5+ LHV + ,m h m m m h (9.82)
and
a 4 f sol a f 5+ LHV + ,m h m Q m m h (9.83)

471
in which 4h [kJ/kg] and 5h [kJ/kg] are the specific enthalpy of pressurized air and
combustion gas relative to the reference state, respectively. f,0m [kg/s] and fm [kg/s] are
the mass flow rate of the methanol fuel in the reference and hybrid system, respectively.
LHV [kJ/kg] is the lower heating value of methanol. solQ [kW] is the solar heat input rate
from the collector and
sol sc rad ,Q Q (9.84)
in which radQ [kW] is the total solar radiation input rate on solar collection equipment and
sc is the solar collection equipment efficiency.
Comparison of the reference and hybrid system on the same basis is based on assuming
that the mass flow rate of air was kept the same for both systems, i.e. a a,0m m , so
f,0 f solLHV LHVm m Q (9.85)
Using the data from [29], the LHV of methanol = 676.29 kJ/mol, the solar radiation on the
solar collectors was 147.88 kJ/mol-CH3OH, and the solar collection equipment efficiency
was 0.62. Substituting these numbers in Eq. (9.85) yields
f,0
f
1.14m
m (9.86)

472
Knowing the ratio of mass flow rate of the fuel for the hybrid and the reference system (Eq.
(9.86)), the ratio of the cost rate of the fuel is
f f f,0f,
f f f f
01.14,
c b m
c
C
C b m (9.87)
since the cost rate of the fuel fC [$/s] is defined as
f ff f ,c b mC (9.88)
in which fc [$/kJ] is the specific cost of the fuel (methanol) and fb [kJ/kg] is the specific
chemical exergy of the fuel (methanol) which are both the same for the hybrid and the
reference system.
For the flue gas of the system, the temperature and pressure of the flue gas could be
assumed to be the same for both systems. Considering the composition of the flue gas is
roughly the same as that of the combustion gas, the specific exergy and specific cost of flue
gas should also be the same, or
fg,0 fgb b (9.89)
fg,0 fgc c (9.90)
Since the mass flow rate of flue gas is the same as that of the combustion gas when no
leakage is considered,

473
fg,0 f,0
fg f
1.14m m
m m (9.91)
Therefore,
fg,0 fg fg fg
fg fg fg ,0fg
1.14c b m
c
C
C b m (9.92)
In this comparison, the turbine inlet temperature is fixed, but not the work output. So based
on Eq. (9.86),
net,0 f,0
net f
366.440.94,
446.20
W m
W m (9.93)
in which the mass flow rate of fuel in the hybrid and the reference system are found in [29].
Next, the cost rate of each component of the system is compared. According to [1], most
of the component cost is proportional to the mass flow rate of working fluid when the
operation parameters, such as temperature and pressure, are the same. Remembering that
it has been assumed that the excess air is the same for both systems (for example, 20%
more than stoichiometric air), the ratio between each component cost for hybrid system
and reference system will be the same as the ratio between the mass flow rates of the fuel,
so

474
TOT,0 f,0
TOT AHS f
1.14Z m
Z Z m
(9.94)
Defining the cost rate ratio between the additional heat source component (e.g. solar
collection equipment) and the hybrid system as AHS , or
AHSAHS
TOT
,Z
Z (9.95)
results in
TOT,0 TOT,0
TOT AHS AHS TOT
1.141
Z Z
Z Z Z
(9.96)
Substituting Eqs (9.87), (9.92), (9.93) and (9.96) into Eq. (9.80) and (9.81), the ratio
between the electricity cost of the reference and the hybrid system is
p,0 f,0 fg,0 TOT,0 net,0 f,0 fg,0 TOT,0net
p,h f fg AHS TOT net net,0 f fg AHS TOT
f fg AHS T
q, q,
q,
OT f
f fg AHS TOT
)
)
1.14 +1.14 10.94 1.07
(
(
1.14
C C C C
C C C C C C
C C C C
C C
c Z W ZW
c Z W W Z
ZC
Z
fg AHS TOT
f fg q,AHS TOT
1.
Z
C C ZC
(9.97)
475
Using Eq. (9.79), the difference between the numerator and denominator of Eq. (9.97) is
2
f f fg ACO qHS TOT HS,A0.07 1.375 1.07 0.07C Zc m C C
(9.98)
and
P,h P,0, if 0c c (9.99)
P,h P,0, if 0c c (9.100)
According to Eq. (9.99), P,hc , the LEC for the hybrid system tends to become lower than
P,0c , that for the reference system, when
1) 2
COf f fg1.375C c m C (the fuel price, carbon tax rates and externality cost)
increases; and/or
2) AHS (the cost rate fraction of the additional heat source) decreases; and/or
3) TOTZ . (the total cost rate of the hybrid system) decreases; and/or
4) HSq,AC (the price of the additional heat source device) decreases.
Since AHS0 1 ,

476
AHS AHS1.07 0.07 . (9.101)
Using Eq. (9.95), p,h p,0c c , if
2
COf f fg AHS AHSq,0.07 1.375 ,C c m C CZ (9.102)
or written as
2
f AHS AHq, C fOS fg
11.375 .
0.07C C c m CZ (9.103)
Thus we have found the condition under which the LEC for the hybrid system is lower than
that for the reference system. In fact, Eq. (9.103) has a similar form as for SOLRGT.
Using Eqs (9.88), (9.78) and (9.28), Eq. (9.103) can be rewritten as
2
AHS AHS AHSq,COf fg fg
f f
11.375
0.07
cc c c b
m
B
b
Z
(9.104)
It can be seen that Eq. (9.104) and Eq. (9.40) have similar forms as
2
AHS AHS AHSf 2 3 fg fg
1 f
qC
f
,O ,
cc c
Z Ba a c b
m ba
(9.105)

477
in which 1,2,3ia i are different for SOLRGT and SOLRMCC and are summarized
in Table 9-5.
Table 9-5. Summary table for ia in comparison between SOLRGT and SOLRMCC
SOLRGT SOLRMCC
1a 0 0.07
2a 2.75 1.375
3a 1 1
Not all thermochemical hybrid systems are studied here, but it can be reasonably deduced
that Eq. (9.105) may apply for most, if not all, of the thermochemical hybrid systems. Since
there are too many different current and potential configurations of thermochemical hybrid
system it is, however, unlikely that a universal equation for this purpose can be established.
Since Eqs (9.104) and (9.40) have similar forms, the sensitivity analysis of the LEC for
SOLRMCC to fuel price, carbon tax and the solar collection equipment price is similar to
that from SOLRGT as discussed in Section 9.4. Also, Eqs (9.80) and (9.21) have the same
form except that Eq. (9.80) doesn’t have the term wC that stands for the cost rate

478
associated with the water needed in reforming methane in SOLRGT, which is not required
in the methanol decomposition process.
Equation (9.105) can be rewritten using the carbon tax rate 2
COc as
2
AHS AHS AHS3 fg fg f
2 1
q,CO
f f
1,
cc c
Z Ba
ab c
a m b
(9.106)
indicating that the LEC for the hybrid system is lower than that for the reference when the
carbon tax rate 2
COc is higher than a certain value and provides an easy way to determine
it.
Equation (9.106) gives guidance for determining the carbon tax rate. It indicates that the
LEC for the hybrid system is lower than that for the reference system when the carbon tax
rate is higher than a certain value that can be easily calculated. Considering the fact that
imposing a carbon tax rate that is too small won’t help the thermochemical hybrid system
compete with the reference system economically too much and imposing a much larger
carbon tax rate may not be needed, Eq. (9.106) provides an easy way in helping determine
the appropriate carbon tax value.
The equations derived for the dependence of the thermochemical hybrid systems’
electricity costs are functions of the systems’ governing parameters and can thus be easily
used for price sensitivity analysis. For example, Eqs (9.80) and (9.21) can be differentiated

479
to determine the sensitivity of the LEC for both hybrid systems, P,hc , to the fuel price, fc ,
which is functionally expressed by
p,h f
f ff net f net
1 1,
Ccm
c W c Wb
(9.107)
since the other terms in the numerator of Eqs (9.80) and (9.21) don’t change with the fuel
price.
Similarly, it can be found that
2
p,h ctCO
ct net ct net
1 1Ccm
c W c W
(9.108)
p,h
AHS net
1c
Z W
(9.109)
Since fc , ctc and AHSZ have different units and are independent of each other,
evaluation of the relative impact of these factors on the LEC for the hybrid system, P,hc ,
can only be determined by finding and using their values in Eqs (139) and (140). According
to Eq. (9.77), fm is proportional to 2
COm . Equation (9.107) and (9.108) thus showed that
the partial derivative of the fuel price fc and the carbon tax rate ctc both increase with
the mass flow rate of the fuel, fm . As more AHS is added, less fuel is needed in the power

480
systems when the total heat input remains the same. This means that the impact of fc and
ctc become smaller as more AHS is added in the hybrid system. The impact of the cost
rate of the AHS equipment, AHSZ , on the P,hc however, doesn’t change with fm ,
meaning that more focus should be put on reducing AHSZ when the mass flow rate of fuel
become smaller.
9.6. Conclusions of the exergo-economic analysis of
thermochemical hybrid systems
Exergo-economic analysis is used in this study to derive expressions for calculating the
levelized costs of electricity (LEC) from two thermochemical hybrid power generation
systems and for comparing them with the corresponding conventional single heat source
systems and a reference non-thermochemical hybrid system.
o While it is obvious that when the fuel price and carbon tax is high enough and/or
the cost associated with the additional heat source is low enough, the LEC for the
hybrid system will be lower than that for the reference system, this study, however,
developed the equations that can be used to determine under which conditions the
thermochemical hybrid systems becomes economically competitive with the
corresponding reference; in the considered specific example based on current prices
of fuel, carbon tax and equipment costs, it is found that the LEC for the hybrid
system is smaller than the reference one when fuel price is higher than 2.3×10⁻⁶

481
$/kJ, or carbon tax is higher than 0.0113 $/kgCO2, or the cost rate of AHS equipment
is less than 0.323$/s.
o A sensitivity analysis of the LEC for the SOLRGT and SOLRMCC to fuel price,
carbon tax and the solar collection equipment price, respectively, was performed.
The partial derivative of the LEC ($/kWh) from the SOLRGT with respect to the
fuel price is 1.73 $/(kJ-exergy) and to the carbon tax rate is 0.093 $/(tonne CO2).
The partial derivative of the LEC ($/kWh) from the SOLRMCC with respect to the
fuel price is 1.52 $/(kJ-exergy) and to the carbon tax rate is 0.072 $/(tonne CO2).
o A summary of the equation numbers derived for determining the conditions under
which the LEC for the thermochemical hybrid system will be lower than that for
the chosen reference systems along with the results for the sensitivity analysis, are
given in Table 9-6.
o It was found that the conditions under which the LEC for the thermochemical
hybrid system will be lower than that for the chosen reference systems for both the
SOLRGT and SOLRMCC are similar, suggesting that other thermochemical hybrid
systems also may lead to similar results.
Table 9-6. Main conclusions of the exergo-economic analysis for SOLRGT and
SOLRMCC.

482
Condition under which the LEC for the
hybrid system is lower than that for the
reference system
Partial derivative of LEC for
the hybrid system with respect
to
Fuel
price
Carbon
tax
Cost of
AHS
SOLRGT Eqs (9.40) and (9.65) Eq.
(9.107)
Eq.
(9.108)
Eq.
(9.109) SOLRMCC Eq. (9.104)
o A comparison between the energo-economic analysis method and the exergo-
economic analysis method was made to show the differences between them, which
demonstrated some of the advantages of the latter for comparing the LEC for the
thermochemical hybrid system with that for the reference ones (single heat source
system or non-thermochemical hybrid system) without thorough knowledge of the
cost of each equipment item, but with help of only a few thermodynamic
parameters, and the ability to calculate the externalities of power systems.
o The effect of the cost penalty or profit of the flue gas on the economic performance
of the power generation systems was included in the analysis.

483
9.7. Recommendations and future
In addition to the equations developed in this study for facilitating the calculation of the
exergo-economic condition that make hybrid power systems competitive with
conventional (non-hybrid) ones, the results from this study for the two types of
thermochemical hybrid systems show that to make thermochemical hybrid systems
economically competitive with the corresponding fuel-only conventional power generation
system, the fuel price has to be high enough. Our study showed that the thermochemical
hybrid system becomes economically competitive with the assumed fuel-only reference
system when the fuel price rises by 17%, which is not hard to achieve.
Considering the fact that the current fuel prices do not in most cases include even a small
fraction of the cost of the fuel externalities (such as, but not limited to, carbon tax),
inclusion of these would help not only make hybrid systems more economically
competitive but also clean the environment. Our study showed that even imposing half of
the carbon tax rate of British Columbia [21], the thermochemical hybrid systems will
become economically competitive with the fuel-only ones. While fuel price is largely
determined by the market and carbon tax by policy, more effort should also be made for
decreasing the cost associated with the components that collect and use the additional heat
source, such as solar collection equipment when solar heat is used as the additional heat
source. For example, the LEC for the hybrid system becomes lower than that for the
reference single-heat-source system when the cost rate of the AHS equipment is 26% lower

484
than its assumed current value shown in Table 9-3. As technology advances, there is still
much room to decrease the cost of using the additional heat source (AHS), compared with
the fuel-only thermochemical systems, which have been developed for decades and may
have less room for reducing theirs.
Predicting rising fuel price in the long term, higher carbon tax, and decreasing cost for
implementing additional heat sources, thermochemical hybrid systems using additional
heat sources will, therefore, become more economically competitive compared with the
conventional systems, especially for the hybrid systems that use AHS, which don’t
generate CO2 and other undesirable emissions.
References for Chapter 9
[1] El-Sayed Y.M., The Thermoeconomics of Energy Conversions. Oxford, UK: Elsevier
Ltd;2003.
[2] Szargut J., Exergy Method. WIT:2005.
[3] Carbon Tax Center (British Columbia) - Available
at:<http://www.carbontax.org/where-carbon-is-taxed/british-columbia/> [accessed
28.2.2016]

485
[4] U.S. Energy Information Administration 2015 “Natural Gas Weekly Update,”
http://www.eia.gov/naturalgas/weekly/ 2015.12.14.
[5] Kliemke H, Johnke T. Gas Turbine Modernization - Fuel Conversion and Special
Fuel Applications for the Asian Market POWER-GEN Asia 2012 Bangkok Thailand
October 03-05 2012 http://www.energy.siemens.com/us/pool/hq/energy-
topics/pdfs/en/techninal%20paper/Siemens-Technical%20Paper-Gas-Turbine-
Modernization.pdf

486
CHAPTER 10
CONCLUSIONS AND RECOMMENDATIONS
Past studies on hybrid power cycles using multiple heat sources of different temperatures
focused mainly on case studies and almost no general theory about this type of systems has
been developed. This dissertation mainly examined the thermodynamic and economic
performance of hybrid power generation systems simultaneously using multiple heat
sources of different temperatures. Two types of hybrid systems were examined: thermal
hybrid systems that involve chemical reactions only in the fuel combustion process, and
thermochemical hybrid systems that involves chemical reactions other than the fuel
combustion process.
For the first type of hybrid systems, thermal hybrid power generation systems, the method
used in the dissertation is step-wise: to first analyze the major, most commonly used, hybrid
power generation systems thermodynamically, without involving specific operation
parameter values. In this way, some generalized theory that is at least applicable to this
type of system can be developed. The second step is to perform such an analysis for all the
major types of power generation systems (e.g. Rankine, Brayton, Combined Cycles, and
their main variants). The third step is to find commonalities between these theories (if any).
The fourth and last step is to develop the sought generalized theory based on these
commonalities. As shown in this dissertation, this approach indeed worked and led to the
discovery of such a theory.

487
Based on the major types of power generation methods, the hybrid power generation
systems based on Rankine cycles, Brayton cycles and combined cycle were analyzed in
sequence.
For the hybrid power generation systems based on the simple Rankine cycle, it was found
that for the same enthalpy states in the hybrid and reference systems, the energy efficiency
of the hybrid system is higher than that of the reference single heat source system if and
only if the energy conversion efficiency (defined in Eq. (4.1)) of the AHS is larger than
that of the heat source used in the reference single heat source system, i.e. h 0 for
AHS HTHS , h 0 for AHS HTHS and h 0 for AHS HTHS ; and for the
same enthalpy states in the hybrid and reference systems, the exergy efficiency of the
hybrid system is higher than that of the reference single heat source system if and only if
the exergy conversion efficiency (defined in Eqs (4.21) and (4.22)) of the AHS is larger
than that of the heat source used in the reference single heat source system, i.e. h 0
for AHS HTHS , h 0 for AHS HTHS and h 0 for AHS HTHS . The
results from the sensitivity analysis (derived from the thermodynamic analysis and
confirmed by the simulation results) showed the relations between the temperature, AHST ,
and heat addition rate of the AHS, AHSQ , and the energy/exergy efficiency of the hybrid
system, based on different AHS . These relations can be used to help design the hybrid
systems to achieve higher energy and/or exergy efficiencies before detailed design or
simulation or experiment.

488
The thermodynamic analysis and simulation for the hybrid power generation systems based
on the Rankine cycle with reheat showed similar characteristics with the hybrid systems
based on the simple Rankine cycle.
The thermodynamic analysis for the hybrid power generation systems based on the
Rankine cycle with heat regeneration showed that replacing higher pressure extracted
steam will achieve higher system energy efficiency than replacing lower pressure extracted
steam, when both extracted steams, if replaced, increase the same amount of net power
output. When solar heat is used as the AHS and the temperature of the solar heat is defined
as the sun surface, this result also applies to the exergy efficiency of the hybrid system.
The results suggested that it is better to replace the higher pressure extracted steams with
the AHS than the lower pressure ones in terms of energy efficiency. From the exergy point
of view, however, it is not always the case and a simple criterion to decide which extracted
steam to replace is Eq. (4.127).
The thermodynamic analysis for the hybrid power generation systems based on the simple
Brayton cycle, Brayton cycle with intercooling, Brayton cycle with reheat and Brayton
cycle with heat regeneration was done, respectively. The results showed that the energy
efficiency of the hybrid system is lower that of the single heat source reference system
when 4 7CCAHS
LHV
h h
. Considering that 4 7
CCLHV
h h
is close to 1 and AHS 1 ,
adding the AHS to the single heat source Brayton cycles will lower the energy efficiency
of the reference system as Table 3-2 showed in the background review. The exergy

489
efficiency, however, is not the case, and h 0 when 4 7
CCH
f
A S
h h
b
or roughly
0AHS
AHS
1T
T . For example, when AHS 800 CT and 0 15 CT , h 0 when
AHS 0.73 .
Following the validation, a detailed simulation for the hybrid power generation systems
based on the Brayton cycle with intercooling, reheat and heat regeneration was done in the
dissertation. The results were compared for with and without the consideration of pressure
drops in the system and showed that the energy efficiency dropped 3.1% if pressure drops
were considered in the system. The results from the exergy analysis for each major
component of the single heat source reference system showed that the majority (68.1%) of
the exergy destructions happened in the combustors, in which fuel was burned. Considering
that, using the AHS to help heat the working fluid may decrease the exergy destruction in
the combustors and raise the exergy efficiency of the system. Another simulation was thus
done to test the performance of the hybrid system. The results showed that the total exergy
destruction of the system decreased by 16% (when the temperature of the solar heat is
defined as the sun surface temperature), or 28% (when the temperature the AHS is 10 K
higher than the temperature of the working fluid at the outlet of the AHSC). The sensitivity
analysis of the energy efficiency of the hybrid system with respect to the AHS input
fraction of the total energy input, exergy input rate from the AHS and the dimensionless

490
parameter 6 5
7
T T
T
in Fig. 5-11, for different energy conversion efficiency of the AHS was
also done. The results can be used to help researcher study the performance of the hybrid
power generation systems based on the Brayton cycles and suggested that effort should be
made in increasing AHS .
The thermodynamic analysis for the hybrid power generation systems based on the
combined cycle suggested that its performance characteristics are similar to the hybrid
power generation based on the Brayton cycles, when the AHS is added in the topping cycle
(the fuel-saving mode). When the AHS is added in the bottoming cycle (power-boost
mode), the results showed that h 0 and
h increases with AHS but decreases with the
AHS input fraction of total energy input, AHSX (defined in Eq. (2.16)). From the exergy
point of view, however, the exergy efficiency of the hybrid system is larger than that of the
conventional single heat source system, h 0 , when 0
AHSf bc
AHS
0
1
TT
. This
result suggests that the temperature of the AHS, AHST , should be designed so that it is
smaller than 0
f bcAHS
0
1
T
, from the perspective of exergy efficiency of the system.
This result thus saves lots of work before detail design of the hybrid power generation
systems based on the combined cycle when the AHS is added in the bottoming cycle. For

491
example, when AHS 0.8 , f 1.04 , bc 0.4 , 0 0.55 and 0 15 CT , the
maximum AHS temperature is 456 °C for h 0 .
For the second type of hybrid power generation systems using multiple heat sources of
different temperatures, the thermochemical hybrid power generation systems, two
representative systems were chosen for analysis. One (SOLRGT) using methane as fuel
and the other (SOLRMCC) using methanol as fuel, which are the two most widely used
types of fuel in thermochemical hybrid power generation systems by researchers. Both of
the systems use low temperature solar heat (at ~220 °C) to help reform or decompose the
fuel to syngas, which is then used for power generation. The main conclusions were
summarized in Section 7.6 and are not repeated here.
Besides thermodynamic analysis of the hybrid power generation systems, the exergo-
economic analysis was also done to complement the analysis, since there is usually a
tradeoff between the thermodynamic performance and the economic performance of the
power generation systems. Using the SPECO method that is widely accepted and used by
researchers for exergo-economic analysis, it was found that the difference between the
levelized electricity cost (LEC) of the thermal hybrid system and the corresponding single
heat source reference system can be grouped into two equations based on whether the AHS
is used to save fuel (fuel-saving mode, Eq. (8.194)) or to increase the power output (power-
boost mode, Eq. (8.195)). The results also showed the simple criteria to determine whether
the LEC of the hybrid system is lower than that of the reference system (Eqs (8.196) and

492
(9.105)). The exergo-economic analysis method was compared with the conventional
energo-economic analysis method. The externalities and carbon tax (or other monetary
penalty for CO2 emissions) were also considered in the exergo-economic analysis. Details
are available in Sections 8.6 and 9.6 are not repeated here.
The conclusions summarized here are the main contributions from the author of the
dissertation to the state of knowledge. None of this work has been done by others, to the
best of the author’s knowledge.
The results found in the dissertation give the following recommendations:
1) Effort should be made on increasing the energy conversion efficiency of the AHS,
AHS , since higher AHS increases the energy efficiencies of the hybrid systems.
Using the definition of AHS (Eq. (4.1)), it means that the heat loss from the AHS
to the working fluid of the power cycle should be minimized, which can be done
by increasing the AHSC efficiency (such as solar collector efficiency when solar
heat is used as the AHS), adding insulation to the pipes, reducing the length of pipes
and minimizing the use of heat exchangers that transfer heat from the AHS to the
working fluid in the power cycle.
2) Effort should be made on increasing the exergy conversion efficiency of the AHS,
AHS , since higher AHS increases the exergy efficiencies the hybrid systems.
Using the definition of AHS (defined in Eqs (4.21) and (4.22)), it means that the

493
energy conversion efficiency AHS should be maximized, and the exergy factor of
fuel, f (defined in Eq. (2.9)), and the temperature of the AHS, AHST , should be
minimized. This suggests that besides the measures mentioned above to increase
AHS , fuels that have lower f , such as biomass, instead of fossil fuel, should be
used, and additional effort should be made on reducing AHST , such as reducing the
pinch point temperature in the heat exchanger that transfer heat from the AHS to
the working fluid in the power cycle or even heating the working fluid directly
without the use of the heat exchangers.
3) When the AHS is used to replace the feedwater heater in the Rankine cycles with
heat regeneration, the results suggest that it is better to replace the higher pressure
extracted steams with the AHS than the lower pressure ones in terms of energy
efficiency. From the exergy point of view, however, it is not always the case and a
simple criterion to decide which extracted steam to replace is Eq. (4.127).
4) When adding the AHS to the bottoming cycle (Rankine cycle) of the combined
cycle, the temperature of the AHS should be lower than 0
f bcAHS
0
1
T
, so that
the exergy efficiency of the hybrid system is higher that of the original combined
cycle system.
5) It is necessary to distinguish between different solar exergy or solar heat
temperature definitions before comparing results from different sources. The results

494
are different even for the same system with different solar exergy definitions. There
is no “solar thermal upgrading” for solar thermochemical hybrid systems if solar
exergy is defined using sun surface temperature.
6) Forecasting rising fuel price in the long term, higher taxing of externalities, and
decreasing cost for implementing additional heat sources, hybrid systems using
multiple heat source of different temperatures will increasingly become more
economically competitive when compared with the conventional systems,
especially for the hybrid systems that use heat sources that reduce generation of
greenhouse gases and other undesirable emissions.

495
Nomenclature
A Area, m2
AHS Additional heat source
AHSC Addition heat source collection equipment
AHSP Addition heat source pump
b Specific exergy, kJ/kg
fb Specific exergy of fuel, kJ/kg
B Exergy, kJ
B Exergy flow rate, kW
c Specific cost, $/kJ
ashc Ratio between cost of ash and fuel price
ctc Ratio between cost of carbon tax and fuel price
fc Specific cost associated with fuel, $/kJ (Eq. (8.33))
fgc Ratio between cost of flue gas and fuel price
pc Specific heat capacity, kJ/kg-K
pc Levelized electricity cost (LEC), $/kJ
fC Annual fuel cost, $

496
fC Fuel cost rate, $/s
pC Heat capacity, kJ/kg
invC Total investment cost, $
O&MC Annual operation and maintenance (O&M) cost, $
g Gravitational acceleration, m/s2
f Fuel-air ratio
h Specific enthalpy, kJ/kg
H Operation time, h; Flow enthalpy, kJ
HHV Higher heating value, kJ/kg
HS Heat source
HTHS Higher temperature heat source
i Interest rate
sI Energy density of solar radiation, kW/m2
LHV Fuel Lower heating value, kJ/kg
m Mass flow rate, kg/s
HEn Exponent relating the heat transfer rate and the cost of heat exchangers
p Pressure, kPa

497
Q Heat transfer, kJ
Q Heat transfer rate, kW
ADDQ Heat transfer rate to the working fluid from the heat source, kW
cfr Ratio between the assumed fuel price and the current fuel price
smR Ratio between steam and methane mass flow rates
s specific entropy, kJ/kg-K
fS Fuel savings ratio (Eq. (2.18))
T Temperature, K
0T Dead state temperature, K
X Fraction; Height above the lowest level prevailing near the considered device, m
AHSX AHS heat input fraction of total heat input (Eq. (2.16))
solX Solar share (Eq. (2.17))
AHSX AHS exergy input fraction of total exergy input (Eq. (6.26))
y Extraction fraction of the extracted steams
W Power, kW
Z Cost of component, $
Z Cost rate of component, $/s

498
0Z Change of cost rate of the equipment that both the hybrid and the reference system
have, $/s
Greek symbols
Energy efficiency
Exergy efficiency
Exergy factor (Eqs (8.46) and (8.47))
Difference
Maintenance factor (Eq. (8.7))
Capital recovery factor (Eq. (8.3))
AHS Capital cost fraction of the AHS relative to the total capital cost of the
system (Eq. (9.95))
Energy level (Eq. (7.7))
Subscripts and superscripts
0 Reference (non-hybrid, single heat source) system
a Air
AHS Additional heat source
AHSC Additional heat source collection equipment
AHSP Additional heat source pump
ash Ash

499
bc Bottoming cycle
B Boiler
BFP Boiler feedwater pump
CC Combustor
CEP Condensate extraction pump
ch Chemical
COMP Compressor
COND Condenser
ct Carbon tax
cw Cooling water
d Destruction
ea Energy acceptor
ed Energy donor
eff Effective
ex Turbine exhaust gas
E Economizer
f Fuel (material)
F Fuel of a component
FC Fuel compressor

500
fg Flue gas
gen Generator
GT Gas turbine
h Hybrid system; heat
H Heater
HE Heat exchanger
HP High-pressure
HPC High-pressure compressor
HPF High-pressure feedwater heater
HR Heat Recuperator
HRSG Heat recovery steam generator
HS Heat source
HT Higher temperature
HTHS Higher temperature heat source
IC Intercooler
i Inlet
in input
net Net
LP Low-pressure

501
LPC Low-pressure compressor
LPF Low-pressure feedwater heater
LT Lower temperature
LTHS Lower temperature heat source
nu Nuclear
net Net
o Outlet
O&M Operation and Maintenance
P Pump, Product of a component
R Reactor; Regenerator
rad Solar radiation
REC Recuperator
REF Reformer
ph Physical
rad Solar radiation
s Steam
sc Solar collector
se Solar-to-electricity
sol Solar

502
ss Solar surface
ST Steam turbine
syn Syngas
T Turbine
TI Turbine inlet
TOT Total
w Working fluid, water
' Non-thermochemical hybrid system