Thermodynamic and hydrodynamic characterization of the ...
191
HAL Id: tel-01342521 https://tel.archives-ouvertes.fr/tel-01342521 Submitted on 6 Jul 2016 HAL is a multi-disciplinary open access archive for the deposit and dissemination of sci- entific research documents, whether they are pub- lished or not. The documents may come from teaching and research institutions in France or abroad, or from public or private research centers. L’archive ouverte pluridisciplinaire HAL, est destinée au dépôt et à la diffusion de documents scientifiques de niveau recherche, publiés ou non, émanant des établissements d’enseignement et de recherche français ou étrangers, des laboratoires publics ou privés. Thermodynamic and hydrodynamic characterization of the vacuum evaporation process during concentration of dairy products in a falling film evaporator Arlan Caldas Pereira Silveira To cite this version: Arlan Caldas Pereira Silveira. Thermodynamic and hydrodynamic characterization of the vacuum evaporation process during concentration of dairy products in a falling film evaporator. Food and Nutrition. Agrocampus Ouest, 2015. English. NNT : 2015NSARB269. tel-01342521
-
Upload
khangminh22 -
Category
Documents
-
view
2 -
download
0
Transcript of Thermodynamic and hydrodynamic characterization of the ...

HAL Id: tel-01342521https://tel.archives-ouvertes.fr/tel-01342521
Submitted on 6 Jul 2016
HAL is a multi-disciplinary open accessarchive for the deposit and dissemination of sci-entific research documents, whether they are pub-lished or not. The documents may come fromteaching and research institutions in France orabroad, or from public or private research centers.
L’archive ouverte pluridisciplinaire HAL, estdestinée au dépôt et à la diffusion de documentsscientifiques de niveau recherche, publiés ou non,émanant des établissements d’enseignement et derecherche français ou étrangers, des laboratoirespublics ou privés.
Thermodynamic and hydrodynamic characterization ofthe vacuum evaporation process during concentration of
dairy products in a falling film evaporatorArlan Caldas Pereira Silveira
To cite this version:Arlan Caldas Pereira Silveira. Thermodynamic and hydrodynamic characterization of the vacuumevaporation process during concentration of dairy products in a falling film evaporator. Food andNutrition. Agrocampus Ouest, 2015. English. �NNT : 2015NSARB269�. �tel-01342521�

THESE / AGROCAMPUS OUEST
Sous le label de l’Université Européenne de Bretagne
pour obtenir le diplôme de :
DOCTEUR DE L'INSTITUT SUPERIEUR DES SCIENCES AGRONOMIQUES, AGRO-ALIMENTAIRES, HORTICOLES ET DU PAYSAGE
Spécialité : Food Science
Ecole Doctorale : VAS (Vie-Agro-Santé)
présentée par :
Arlan CALDAS PEREIRA SILVEIRA
THERMODYNAMIC AND HYDRODYNAMIC CHARACTERIZATION OF THE VACUUM EVAPORATION PROCESS DURING CONCENTRATION OF DAIRY
PRODUCTS IN A FALLING FILM EVAPORATOR
soutenue le 12 octobre de 201η devant la commission d’Examen Composition du jury :
Martine Esteban-Decloux, Professor, AgroParisTech, France Reviewer Joël Scher, Professor, Université de Lorraine, France Reviewer Guillaume Delaplace, Research director, CNRS/INRA, France Member Bernard Cuq, Professor, SupAgro, Montpellier, France Member Antônio Fernandes de Carvalho, Professor, UFV, Brazil PhD Supervisor Romain Jeantet, Professor, Agrocampus Ouest, France PhD Co-Supervisor Bernard Rémond, R&D Manager, GEA Process Engineering, France Guest
N° ordre : 2015-16
N° Série : B-269

REMERCIMENTS
A l'issue de mon doctorat, je suis convaincu que la thèse est loin d'être un travail solitaire. En
effet, je n'aurais jamais pu réaliser ce travail doctoral sans le soutien d'un grand nombre de
personnes dont la générosité, la bonne humeur et l'intérêt manifestés à l'égard de ma recherche
m'ont permis de progresser dans cette phase délicate de « l'apprenti-chercheur ».
J’exprime toute ma reconnaissance à Jöelle Léonil et à Sylvie Lortal pour m’avoir accueilli au
sein du STLτ et permis de mener bien ce projet dans d’excellentes conditions humaines et
professionnelles.
Je voudrais remercier mon jury de thèse, Dr. Martine Decloux, Dr. Joël Scher, Dr. Guillaume
Delaplace, Dr. Bernard Cuq, Dr. Antônio Fernandes de Carvalho, Dr. Romain Jeantet, et Dr.
Bernard Rémond. Votre présence le jour de ma soutenance ainsi que le temps dédié à
l’appréciation de mon manuscrit de thèse ont été un grand honneur pour moi.
Je remercie mon encadrant et chef, Pierre Schuck, que je considère plutôt comme un ami. Pour
moi Pierre est un exemple de professionnalisme et de gentillesse. Il était gratifiant de travailler
en sachant qu'en cas de doute ou de problème, Pierre me conseillerait avec le sourire. Merci
Pierre pour ta patience, tes conseils, tes enseignements, pour ton exemple d’engagement
sérieux, et pour ta façon positive de voir les problèmes. Merci beaucoup papa Schuck.
S'il y a une personne qui m'a toujours soutenu, cru en moi et aidé avec tout ce dont j'avais
besoin, c'est sans doute le Professor Antônio Fernandes de Carvalho. Merci pour
l’encouragement, la confiance et le soutien qui n’ont jamais cessé dès lors que nous avons
commencé à travailler ensemble.
Merci à Romain Jeantet de m'avoir encadré et d’avoir joué le rôle de relecteur final de mes
travaux scientifiques. Romain tu es un exemple pour moi d’un excellent ingénieur et scientifique.
Un grand merci à toi pour toute la rigueur scientifique que tu m’as apprise.

Je suis heureux d'avoir eu la chance de travailler et d'être officieusement encadré par Gaëlle
Tanguy. Merci pour ta relecture enrichissante de toutes mes publications, pour la relecture
scrupuleuse de mon manuscrit de thèse et tes suggestions toujours avisées. Tu m’as permis
Gaëlle de clarifier mes pensées parfois embrouillées. Tes remarques très pertinentes ont fait
avancer ma réflexion d'un point de vue scientifique.
Je tiens à remercier deux messieurs sans qui les résultats de mes travaux scientifiques ne
seraient jamais arrivés à la moitié d'où ils en sont aujourd'hui. Merci Serge Méjean et Laurent
Fromont, j’ai appris beaucoup, beaucoup avec vous. Vous m’avez aidé non seulement avec la
partie technique de mon sujet de doctorat, mais aussi appris à ne jamais laisser tomber, à
persévérer, à toujours trouver une solution aux problèmes insolubles. Merci Laurent d'avoir
partagé tes connaissances de 15 ans de marine et d'avoir toujours été disponible pour me
dépanner quand j’avais besoin. Merci Serge pour le partage de tes connaissances sans fin dans
le domaine de la concentration et du séchage. Merci d’être toujours prêt à m'aider et souriant.
Merci à tous les gens qui travaillent sur la plateforme Lait. Merci de m’avoir supporté pendant
ces années de travail à vos côtés. Merci pour la superbe ambiance et pour toute l’aide et la
compréhension dont vous avez fait preuve avec moi. Merci à vous Nadine, Gilles et Bénédicte.
Merci Benoit (Benolé) pour l’amitié et les moments drôles partagés pendant ces années.
Merci Rachel Boutrou, d’avoir aidé tous les jeunes chercheurs du STLτ avec ton merveilleux
travail. Merci d’avoir élargi le champ de ma vision scientifique. Merci de t'être préoccupée et de
m'avoir aidé avec la vulgarisation scientifique.
Pendant mes quatre ans au sein du STLτ j’ai aussi eu la chance de partager le bureau avec
des personnes que je respecte et admire profondément. Merci à Gwenollé Gernigion pour la
compagnie, les discussions scientifiques, l'aide pour les premières démarches scientifiques au
sein du STLτ et pour l’apprentissage de la culture bretonne. Merci à Peng Zhu pour ton amitié

et pour être un exemple de professionnalisme pour moi. Je dois maintenant remercier ma
maman française, qui mérite un paragraphe entier.
Merci à toi Anne Dolivet, pour toute la compagnie, les partages, les discussions, les
renseignements, les bonnes idées, les sourires, le soutien et pleins d’autres choses que tu m’as
offertes pendant nos trois ans de partage de bureau. Tu es quelqu’un de très important pour moi,
et l’amitié que j'ai pour toi et pour toute la famille Dolivet durera toute la vie. Merci de m’avoir
pris comme ton fils adoptif ici en France. Tu fais partie de ma vie.
Merci à Paulette Amet, Jéssica Musseaut, et Michel Ravailler pour le chaleureux « Bonjour » et
le sourire quotidien. Merci Paulette d’avoir organisé les pauses de 1θh et de t'être toujours
préoccupée des nouveaux arrivants.
Merci à ma chère amie Lélia Lacou, tu es une amie que je garderai toujours.
Merci à ma sœur Chinoise, Lina.
Merci a mon chouchou, Gérardine (Gérard). Merci pour ta bonne humeur Gérard. J’espère que
tu viendras me visiter au Brésil.
Merci à mes amis bichonas, Naaman Nogueira, Federico Casanova et Xavier Thomas. Vous
trois mes potes sont des cadeaux que j’ai eu la chance d’avoir. J'en profite également pour
remercier la famille Thomas, qui a été à plusieurs reprises comme ma famille française.
Merci à l’équipe Carinhosos. Je tiens à vous vraiment très très fort. Marilia, Samira et Gui, les
soirées, voyages et le temps passé avec vous sont inoubliables et épiques. Merci Samira pour
les câlins, le respect et les conseils. Merci Marilia d’être toujours sympa et réceptive, tu donnes
envie de rester à tes côtés, avec toute ton énergie très captivante. Merci à Gui d’être présent
dans ma vie depuis si longtemps et d’être mon compagnon de trajet scientifique.
Heureusement que mes parents et mes frères sont là pour me changer les idées. Ils ont tous cru
en moi et ouf ! Maintenant j’y suis ! Alors merci à mon papa Hélcio Caldas Silveira et à ma

maman Maristela Pereira Silveira, malgré toutes les difficultés rencontrées vous m’avez laissé
rêver grand et avez fait tout le possible et même l’impossible pour que je réussisse. Merci à mes
frères Arcanjo Caldas Pereira Silveira et Artur Caldas Pereira Silveira et à ma petite sœur Ana
Carolina Varoto Pereira.
Je remercie toutes les personnes avec qui j’ai partagé mes études et notamment ces années de
thèse : Marta Rezende, Bruno Nunes, Daniel, Jeferson Geis, José, Raquel, Gustavo, Bia
Oliveira, Natalia, Lize Desmaricaux, Estelle, Michele Pinto, Renam Moreira, Flavia figueira,
Wendiao Shao, Bruno Gamba, Rosangela Faria, Andreza, Léticia Carmargos, Odeir Filho, João
Carneiro, Marciano, Laura Sanchez, Marina, Natalia, Luiza Las, Mariana, Elise Schong, Song,
Linda, Matheus, Guillaume, André, Clarisse Lebel, Carlos, Aude, Maude, Gaëtan, Perrine,
Andreas, Andreza, Xavier, Adèle, Juliana, Rachid, Rigoberto, Rozenn, Livia etc., et pleins
d’autres bons amis qui ne font malheureusement plus partie de ma vie mais qui ont participé à
faire de moi ce que je suis aujourd'hui.
J’en oublie certainement encore et je m’en excuse.
Encore un grand merci à tous pour m’avoir conduit à ce jour mémorable.
« Une personne est en mesure de
réaliser quoi que ce soit si son
enthousiasme n'a pas de limites »
Charles Schwab

i Thesis outputs
THESIS OUTPUTS
Publications
Silveira, A.C.P., Carvalho, A.F., Perrone, Í.T., Fromont, L., Méjean, S., Tanguy, G., Jeantet, R., Schuck, P.,
2013. Pilot-scale investigation of effectiveness of evaporation of skim milk compared to water. Dairy Sci.
Technol. 93, 537–549. doi:10.1007/s13594-013-0138-1
Silveira, A.C.P., Tanguy, G., Perrone, Í.T., Jeantet, R., Ducept, F., de Carvalho, A.F., Schuck, P., 2015.
Flow regime assessment in falling film evaporators using residence time distribution functions. J. Food
Eng. 160, 65–76. doi:10.1016/j.jfoodeng.2015.03.016
Silveira, A.C.P., Tanguy, G., Perrone, Í.T., Jeantet, R., Laurent, F., Floch-Fouéré, C., de Carvalho, A.F.,
Schuck, P., 2015. Application of residence time distribution functions at different dairy products to indicate
fouling during concentration in a falling film evaporator. To submitted in October 2015 at Journal of Dairy
Science.
Oral presentations
Inauguration de la plateforme lait - STLO, Rennes (France), 2013. Caractérisation du procédé
d'évaporation sous vide: démarche et intérêts.
2° Simpósio de Leites Concentrados e Desidratados, Juiz de Fora (Brazil), 2014. Concentração por
evaporação à vácuo. Balanço de massa, de energia e tempo de retenção: importância da instrumentação.
Journée technique séchage, Surgères (France), 2014. Caractérisation du procédé de concentration par
évaporation sous vide. Bilan énergétique, massique et temps de séjour.
EMChIE-2015, the 7th European Meeting on Chemical Industry and Environment, Terragona (Spain).
Flow regime assessment in falling film evaporators using residence time distribution (presented by Gaëlle
Tanguy).
ICEF12, 12th International Congress on Engineering and Food, Québec (Canada). Residence time
distribution functions applied to skim milk concentration in falling film evaporators.
Poster
5th International Symposium on Spray Dried Dairy Products, St Malo (France), 2012. Characterization of a
vacuum evaporator pilot plant in relation to mass and energy balance.

ii Table of contents
TABLE OF CONTENTS
Thesis outputs ............................................................................................................................ i
List of abreviations and nomenclature ................................................................................... iii
General introduction ................................................................................................................. 1
Part 1 Economic and scientific contexts ................................................................................. 4
Chapter 1. Trade development of dried dairy products and researches trends ................... 3
1.1. Key dairy market statistics .................................................................................................... 6
1.1.1. Milk Production .............................................................................................................. 6
1.1.2. World market for dairy powders ..................................................................................... 8
1.1.3. French and Brazilian dried dairy product markets ........................................................ 10
1.1.4. Developments and investments involving concentrated and dried dairy products ........ 11
1.2. Worldwide research involving “falling film vacuum evaporators” ......................................... 14
Chapter 2. Literature review ................................................................................................... 16
2.1. Transformation of milk to concentrated dairy products ........................................................ 19
2.1.1. Classification, composition and structure of milk .......................................................... 19
2.1.2. Cracking of milk ........................................................................................................... 22
2.2. Vacuum evaporation ........................................................................................................... 27
2.2.1. Evaporators ................................................................................................................ 28
2.2.1.1. Rising film evaporators .............................................................................................. 30
2.2.1.2. Forced circulation evaporator .................................................................................... 31
2.2.1.3. Falling film evaporators ............................................................................................. 32
2.2.2. Energy efficiency ......................................................................................................... 34
2.2.2.1. Heat transfer coefficient ............................................................................................ 36
2.3. Thermo-physical properties of dairy concentrates ............................................................... 39
2.3.1. Viscosity of dairy concentrates ..................................................................................... 39
2.3.2. Thermal properties of dairy concentrates ..................................................................... 40
2.4. Flow in falling film evaporators ............................................................................................ 42
2.4.1. Residence time distribution functions ........................................................................... 44
2.4.2. Residence time distribution models .......................................................................... 46
2.4.2.1. Axial dispersion ..................................................................................................... 46
2.4.2.2. Extended tanks in series ........................................................................................ 47
2.5. Fouling in falling film evaporators ....................................................................................... 48
Chapter 3. Aims and strategy of the PhD project .................................................................. 51

ii Table of contents
3.1. Context of the PhD project .................................................................................................. 54
3.2. Aims, objectives and strategy ............................................................................................. 56
3.3. Originality of the research project ....................................................................................... 57
Part 2. Materials and methods, results and discussion .......................................................... 4
Chapter 4. Materials and methods ......................................................................................... 58
4.1. Pilot vacuum evaporator ..................................................................................................... 61
4.2. Pilot instrumentation ........................................................................................................... 64
4.2.1. Acquisition ................................................................................................................... 64
4.2.2. Additional instrumentation ............................................................................................ 67
4.3. Calibration of the vacuum evaporator sensors .................................................................... 69
4.3. Experimental runs ............................................................................................................... 69
4.4. Physicochemical analyses .................................................................................................. 71
4.4.1. Total solids ................................................................................................................... 71
4.4.2. Viscosity measurement ................................................................................................ 71
4.4.3. Density measurements ................................................................................................ 72
4.4.4. Conductivity ................................................................................................................. 72
4.4.5. Protein composition...................................................................................................... 72
4.4.6. Ash content .................................................................................................................. 73
4.4.7. Calcium concentration .................................................................................................. 73
4.5. Mass and enthalpy balance ................................................................................................ 73
4.6. Overall heat transfer coefficient .......................................................................................... 76
4.7. Assessment of process efficiency ....................................................................................... 77
4.8. Characterization of the flow ................................................................................................ 77
4.9. Residence time distribution functions.................................................................................. 78
4.9.1. Measurement of residence time distribution ................................................................. 78
4.9.2. Model of the residence time distribution functions ........................................................ 81
Chapter 5. Pilot scale investigation of effectiveness of evaporation of skim milk, whole milk and water ......................................................................................................................... 84
5.1. Introduction ......................................................................................................................... 89
5.2. Materials and methods ....................................................................................................... 90
5.2.1. Pilot vacuum evaporator and experiments ................................................................... 90
5.2.2. Experimental runs ........................................................................................................ 90
5.2.3. Physicochemical analyses ........................................................................................... 91
5.2.4. Enthalpy characterization ............................................................................................. 92
5.2.5. Statistical analysis ........................................................................................................ 92
ii Table of contents
5.3. Results and discussion ....................................................................................................... 92
5.3.1. Mass balance ............................................................................................................... 92
5.3.2. Enthalpy balance ......................................................................................................... 93
5.3.3. Overall heat transfer coefficient .................................................................................... 95
5.4. Additional information ......................................................................................................... 97
5.4.1. Distributor system ........................................................................................................ 98
5.4.2. Water level sensor of the heating tubes ....................................................................... 99
5.4.3. Investigation of the effectiveness of evaporation after improvement of the pilot vacuum evaporator ........................................................................................................................... 101
5.5. Conclusion........................................................................................................................ 105
Chapter 6. Flow regime assessment in falling film evaporators using residence time distribution functions ............................................................................................................ 107
6.1. Introduction ....................................................................................................................... 110
6.2. Materials and Methods ..................................................................................................... 112
6.2.1. Pilot vacuum evaporator ............................................................................................ 112
6.2.2. Experimental runs ...................................................................................................... 113
6.2.3. Physicochemical analyses ......................................................................................... 115
6.2.4. Characterization of the flow ........................................................................................ 115
6.2.5. Measurement of residence time distribution ............................................................... 115
6.3. Results and Discussion .................................................................................................... 115
6.3.1. Product and flow characterization .............................................................................. 115
6.3.2. RTD characterization ................................................................................................. 119
6.4. Additional information ....................................................................................................... 127
6.5. Conclusion........................................................................................................................ 129
Chapter 7. Application of residence time distribution functions to different dairy products to indicate fouling during concentration in a falling film evaporator ................................ 131
7.1. Introduction ....................................................................................................................... 134
7.2. Materials and Methods ..................................................................................................... 135
7.2.1. Pilot vacuum evaporator ............................................................................................ 135
7.2.2. Experimental runs ...................................................................................................... 136
7.2.3. Chemical composition ................................................................................................ 136
7.2.4. Enthalpy characterization ........................................................................................... 136
7.2.5. Measurement of residence time distribution ............................................................... 137
7.3. Results and Discussion .................................................................................................... 137
7.4. Additional information ....................................................................................................... 144
7.5. Conclusions ...................................................................................................................... 149

ii Table of contents
General conclusion ............................................................................................................... 151
Future outlook ....................................................................................................................... 155
References ............................................................................................................................. 159
Table of figures ...................................................................................................................... 168
Table of tables ....................................................................................................................... 171
Abstract.................................................................................................................................. 173
Résumé .................................................................................................................................. 174
Resumo .................................................................................................................................. 175

iii List of abbreviations and nomenclature
LIST OF ABREVIATIONS AND NOMENCLATURE
Abreviations
1R: first run
2R: second run
3R: third run
α –lg: α-lactoglobumin
β-lg: β-lactoglobulin
CC: consumption costs
CCP: Colloidal calcium phosphate
FFE: Falling film evaporator
IC: Investments costs
LAW: Lactic acid whey
Pc: Condenseur pressure
Pev: Evaporation pressure
R: Roughness
RTD: Residence time distribution
SC: Staff costs
SM: Skim milk
SW: Sweet whey
T1: evaporation tube 1
T2: evaporation tube 2
T3: evaporation tube 3
TC: Total costs
WM: Whole milk
Nomenclatures
A: heating surface (m2)
A: fraction of feed flow rate going into the reactor set A (-)
iii List of abbreviations and nomenclature
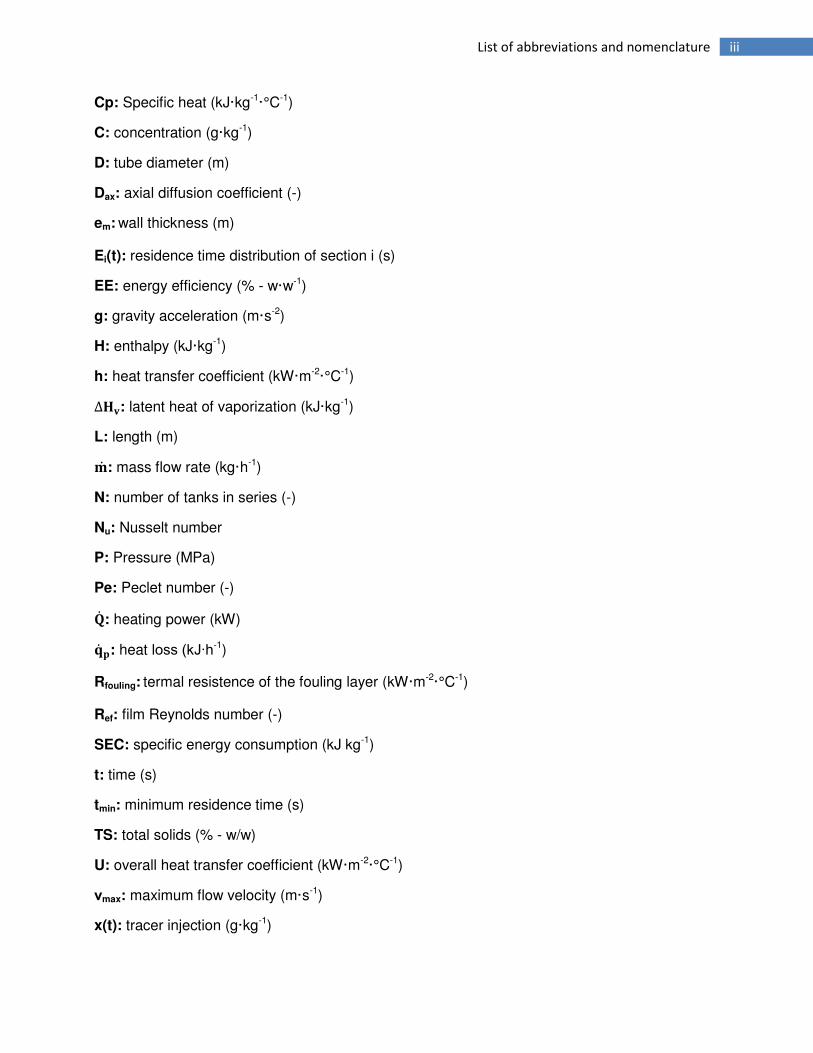
Cp: Specific heat (kJ·kg-1·°C-1)
C: concentration (g·kg-1)
D: tube diameter (m)
Dax: axial diffusion coefficient (-)
em: wall thickness (m)
Ei(t): residence time distribution of section i (s)
EE: energy efficiency (% - w·w-1)
g: gravity acceleration (m·s-2)
H: enthalpy (kJ·kg-1)
h: heat transfer coefficient (kW·m-2·°C-1) ∆��: latent heat of vaporization (kJ·kg-1)
L: length (m) �: mass flow rate (kg·h-1)
N: number of tanks in series (-)
Nu: Nusselt number
P: Pressure (MPa)
Pe: Peclet number (-) �: heating power (kW) ��: heat loss (kJ∙h-1)
Rfouling: termal resistence of the fouling layer (kW·m-2·°C-1)
Ref: film Reynolds number (-)
SEC: specific energy consumption (kJ kg-1)
t: time (s)
tmin: minimum residence time (s)
TS: total solids (% - w/w)
U: overall heat transfer coefficient (kW·m-2·°C-1)
νmax: maximum flow velocity (m·s-1)
x(t): tracer injection (g·kg-1)

iii List of abbreviations and nomenclature
yTi(t): tracer concentration at the bottom of Ti (g·kg-1)
Greek symbols
: viscosity (Pa∙s-1)
: temperature (°C)
λm: thermal conductivity of the wall (kW·m-1·°C-1)
ν: velocity (m·s-1)
ρ: density (kg·m-3)
σ: surface tension (N·m-1)
Γ: mass flow rate per unit circumference (kg·s-1·m-1)
τ: mean residence time (s)
Τ: shear stress (Pa)
Ф: heat flux (kW·m-2) �: velocity gradient (s-1)
Subscript
abs: absolute
cc: product concentrate
cd: product condensate
cwin: inlet cooling water
cwout: outlet cooling water
ev: evaporation
pin: inlet product
p: product
v-1: steam
v1: steam condensate

General introduction
GEσERAL IσTRτDUCTIτσ
τverall cow’s milk production and consumption grew by approximately 15% from 2005 to
2014. With the uneven distribution of milk production at the global level, the expected growth in
the world population and the rise in standards of living (in particular in developing countries), the
dairy market will be confronted with even more massive changes in the next decade. The world
market for dairy powders is expanding considerably. The investment in new vacuum evaporators
and spray driers is therefore being reported throughout the world to secure outlets. The vacuum
evaporation process is mainly used in the dairy industry prior to drying. Moreover the quality of
the concentrates influences the final powder quality.
This context clearly drives researches in order to improve the efficiency and control of the
vacuum evaporation process. However, few research groups are interested in this topic. The
dairy industry has acquired empirical expertise in the vacuum evaporation process, and the
research centers in dairy powder are interested, until then, in drying technology (spray dryer).
Study of vacuum concentration of dairy products is therefore a challenging for research in food
processing engineering.
The goal of this PhD project was to characterize experimentally a falling film evaporator
during the concentration of dairy products, by means of thermodynamic and hydrodynamic
approaches, in order to study the interactions between the products properties and the operating
parameters. A prototype pilot-scale, single-stage falling film evaporator was therefore used to
tackle these issues. This equipment was designed to describe the same process as the
industrial scale from a hydrodynamic point of view.

General introduction
This work was therefore divided into three research parts: one on the instrumentation
and characterization of a pilot-scale falling film evaporator, another part on the hydrodynamic
profile of the vacuum evaporation process, and a third part on the application of the approaches
previously developed to other dairy products.
To state the scientific and economic context of the project, a chapter about the trade
development of dairy powders and vacuum evaporation research trends (Chapter 1), and a
literature review on vacuum evaporation process during concentration of dairy products (Chapter
2) are presented. These chapters are followed by the description of the experimental strategy of
the PhD project (Chapter 3). The second part of the thesis presented materials and methods,
results and discussion regarding the process of vacuum evaporation of different dairy products.
This includes the description of the pilot-scale single stage falling film evaporator used in this
study (Chapter 4), the thermodynamic and hydrodynamic characterization of this equipment
(Chapter 5, and 6, respectively) and the application of these approaches to other dairy products
(Chapter 7). Finally, the main contributions and potential research opportunities are drawn
together in the conclusion and in the outlook sections.

PART 1
ECONOMIC AND SCIENTIFIC CONTEXTS

Economic and scientific contexts – Chapter 1: Trade development
Chapter 1
TRADE DEVELOPMENT OF DRIED DAIRY PRODUCTS AND
RESEARCH TRENDS
This chapter introduces the economic background of dairy products, from milk production
to powder manufacture. In addition, it provides key statistics concerning dairy powder markets
and certain socioeconomic criteria needed to understand the current context. This information is
used to draw conclusions regarding the future trends of dairy powders. These include the
evolution of the dairy product trade and the socio-economic context. Faced with all these
challenges, dairy industries are developing and innovating in order to increase the added value
of milk products and to be competitive in the future.
The main aims of this chapter are to:
- provide key statistics on the dairy market (Brazilian, French and global)
- situate dairy powders in the current socio-economic context
- provide highlights of research trends in vacuum evaporation processes

Economic and scientific contexts – Chapter 1: Trade development
Capítulo 1 DESENVOLVIMENTO DO MERCADO DE PRODUTOS LÁCTEOS DESIDRATADOS E
TENDÊNCIAS DE PESQUISAS
Este capítulo apresenta o contexto econômico dos produtos lácteos, desde a produção
do leite à fabricação dos pós. Além disso, ele fornece estatísticas importantes relativas ao
mercado de lácteos desidratados e certos critérios socioeconômicos necessários para
compreender o atual contexto. Estas informações são usadas para prever futuras tendências da
evolução do mercado de produtos lácteos e do contexto sócio-econômico deste. Diante de
todos esses desafios, a indústria de laticínios está se inovando e desenvolvendo a fim de
aumentar o valor agregado de seus produtos visando se tornar mais competitiva no futuro.
Os principais objetivos deste capítulo são:
- fornecer importantes estatísticas sobre o mercado dos produtos lácteos (brasileiro, francês e global)
- situar os produtos lácteos desidratados no atual contexto sócio-econômico
- destacar as tendências de pesquisa dos processos de evaporação a vácuo

Economic and scientific contexts – Chapter 1: Trade development
Table of contents
1.1. Key dairy market statistics ................................................................................................ 6
1.1.1. Milk Production .......................................................................................................... 6
1.1.2. World market for dairy powders ................................................................................. 8
1.1.3. French and Brazilian markets for dried dairy products ............................................. 10
1.1.4. Developments and investments involving concentrated and dried dairy products .... 11
1.2. Worldwide research involving “falling film vacuum evaporators” ..................................... 14

Economic and scientific contexts – Chapter 1: Trade development
1.1. Key dairy market statistics
1.1.1. Milk Production
The worldwide production of milk is forecast to grow by as much as 2% in 2015, a rate
similar to previous years, and should reach 805 million tons. Asia is expected to account for
most of the increase, but production is projected to rise in all regions (FAO, 2015). The main milk
producers are Europe, India, The United States of America, China and Brazil, which have had
high production rates over the last 5 years (Fig. 1.1).
Figure 1.1. Main milk producers (USDA NASS, 2015).
Note: 2015: forecast.
The worldwide production of milk should continue to grow in coming years, reaching a
level of 880 million tons in 2020 (Fig. 1.2) (OECD-FAO, 2015).
0
20
40
60
80
100
120
140
160
180
EU India US China Brazil
vo
lum
e o
f m
ilk
pro
du
ced
(m
illi
on
to
ns)
2013
2014
2015

Economic and scientific contexts – Chapter 1: Trade development
Figure 1.2. Evolution of worldwide production of milk from 2013 to 2020. (2015 to 2020:
forecast) (OECD/FAO, 2015).
France is the second highest producer of milk in Europe and the seventh in the world,
with 25.3 million tons of milk per year. In France, about 40% of the milk produced is processed
and exported (CNIEL, 2015), product manufacture representing a turnover of 27.2 billion euros
and generating about 250,000 jobs (CNIEL, 2015). Dairy products to the value of 6.9 billion
euros were exported in 2013, with a trade surplus of 3.6 billion euros, an increase of 71% in 10
years.
Brazil is among the five largest producers of milk in the world and has achieved a
significant role in the global dairy market. Brazil came from production of 7.3 million tons of milk
in the 70s to 35 million tons in 2014 (IBGE, 2015). This year the country is expected to reach the
third place as worldwide producer of milk, surpassing Chinese production (FAO, 2015).
700
720
740
760
780
800
820
840
860
880
900
Milk world production
mil
lio
n t
on
s
2013 2014 2015 2016 2017 2018 2019 2020

Economic and scientific contexts – Chapter 1: Trade development
1.1.2. World market for dairy powders
The popularity and increasing range of dairy products and the westernization of diets
continue to be key factors driving the worldwide dairy market. Among dairy products, the global
milk powder market is expanding considerably (Fig. 1.3), e.g. in France around 19% of
processed milk volume is transformed into different dairy powders (CNIEL, 2015). This is due to
an increasing demand for milk products from countries with milk shortages, in particular
emerging countries.
Figure 1.3. Forecasts for worldwide skim milk and whole milk powder production. 2013
and 2014 (estimate), 2015 to 2020 (forecasts) (OECD-FAO, 2015).
Legend: SMP = skim milk powder; WMP = whole milk powder
With a large domestic market and high levels of milk production, Brazil has a different
dairy market behavior to that in France. Traditionally, Brazil has always been a major importer of
3500
4000
4500
5000
5500
6000
2013 2014 2015 2016 2017 2018 2019 2020 2021
To
nn
es
SMP
WMP

Economic and scientific contexts – Chapter 1: Trade development
dairy products, with a negative balance of nearly 0.3 million tons in the 90s. From 2004 to 2008,
it was an exporter of dairy products (Fig. 1.4). However, with a growing consumption of dairy
products, large world supply and depreciation of the dollar, since 2008 Brazil has again become
an importer of dairy products.
Figure 1.4. Trade balance of Brazilian dairy products from 2001 to 2014 (in milk
equivalent) (EMBRAPA, 2010; Milkpoint, 2014).
Due to the country's economic issues and lower GDP growth rate, the consumption of
dairy products in Brazil was slowing in 2014. However, in 2014 Brazil increased its turnover of
dairy exports by 254.3% compared to 2013 (MDCI, 2014) (Table 1.1). The Brazilian export of
dairy products had a favorable scenario in this year.
-1200
-1000
-800
-600
-400
-200
0
200
400
600
800
2001 2002 2003 2004 2005 2006 2007 2008 2009 2010 2011 2012 2013 2014
Mil
lio
n l
ite
rs o
f m
ilk

Economic and scientific contexts – Chapter 1: Trade development
Table 1.1. Dairy export by Brazil, 2010 to 2014 (MDCI, 2014).
Year Value
(US$ FOB)
Net weight
(kg)
2010 131,645,920 53,569,283
2011 97,309,124 37,551,518
2012 92,257,425 38,370,224
2013 93,832,529 38,383,693
2014 332,430,800 83,667,142
With changes in agricultural policy (such as the implementation of a quota system and
the dissolution of the price support system), the dairy industry has improved the use of surplus
milk production and by-products resulting from cheese and butter production (whey, buttermilk).
The development of filtration technology (microfiltration, ultrafiltration, nanofiltration and reverse
osmosis) has allowed the production of valuable milk protein fractions (Schuck et al., 2013).
Used either as nutritional or functional ingredients, most of these proteins are marketed in
dehydrated form. In the last ten years, the nature of dairy powders has changed to more specific
intermediate dried products, and powders have been developed as techno-functional ingredients
according to their expected functional properties such as gelation, foaming and emulsification.
Many new uses of these constituents have appeared with the manufacture of formula products,
substitutes and adapted raw material. Dairy powders are therefore used in the development of a
wide range of products.
1.1.3. French and Brazilian dried dairy product markets
About 56% of dairy powders produced in France are exported, mainly to the European
Union, Asia and the Middle East. The French production of milk powders accounts for
approximately 10% of the total world production (IDF, 2013) (Table 1.2).

Economic and scientific contexts – Chapter 1: Trade development
Table 1.2. French production of dried dairy products (CNIEL, 2015).
Million Euros 2000 2012 2013 2014
Dried Milk 808,767 1,331,673 1,441,526 1,681,190
Skim milk powder 191,095 511,162 475,474 717,389
Whole Milk powder 490,021 235,107 279,457 313,530
Infant Formulae 113,947 539,753 638,743 600,517
Whey powders 212,816 408,028 471,732 447,200
Lactose 10,069 33,040 31,503 26,923
Dairy powders for animal feed 145,323 111,670 106,169 105,670
Dairy dried products are highly significant in the Brazilian dairy market. The domestic
demand for dairy products (mainly milk powders) is expanding, as well as global demand. Dairy
powders corresponded to 69.6% of Brazilian dairy imports in 2013, 49.4% being skim and whole
milk powders, 19.6% whey powder and 0.6% infant formulae (MDCI, 2014).
1.1.4. Developments and investments involving concentrated and dried dairy
products
Investment in new spray driers and vacuum evaporators are being reported throughout
the world to secure outlets. Indeed, investments of more than 2.5 billion euros are currently
predicted for dried dairy products, involving 46 companies, 53 projects and 28 countries (CNIEL,
2012). Over the last two years, 400 million euros of investment were announced or implemented
on French territory to produce milk or whey powders (CNIEL, 2015). Fig. 1.5 shows investments
of more than 100 million US$ announced and/or finalized in Europe and in America.

Economic and scientific contexts – Chapter 1: Trade development
Denmark: Arla Foods lactose factory 150 million US$ Arla Foods Group investments 325 million US$
Germany: Milei whey factory 100 million US$
France: Sodiall Synutra infant formula factory 130 million US$ Laïta 2-year plan 130 million US$ Bongrain World industrial investiments 190 million US$
Ireland: Glambia milk powder factory 230 million US$ Dairygold milk powder factory 165 million US$ Kerry R&D centre 100 million US$
A

Economic and scientific contexts – Chapter 1: Trade development
Figure 1.5. Investments of more than 100 million US$ announced and/or finalized in
Europe (A) and America (B) (CNIEL, 2015; IDF, 2013).
A combination of newly developing markets for dairy products, particularly in South-East
Asia, and the emergence of new entrant countries with rapidly expanding milk production are
changing the dynamics of the world dairy industry. With a projected increase in world milk
production, it is to be expected that dairy powders will continue to play an important role in
facilitating trade of milk solids on an international scale. Vacuum evaporation and spray drying
along with existing and novel techniques will continue to be important contributors to ingredient
innovation. Increasing intellectual property protection covering novel dried ingredients and
processes will be adopted by companies both for defense purposes, and also to exploit
commercial opportunities on international markets (Kelly, 2006).
Chile: Nestlé milk powder factory140 million US$
Argentina: SanCor – Mead Johnson (US) Infant formula factory245 million US$
Brazil: Vigor milk powder factory230 million US$
Uruguay: Estancias del Lago milk powder factory 225 million US$
United States: Agropur whey factory 200 million US$ Southwest Cheese whey factory 100 million USD
B

Economic and scientific contexts – Chapter 1: Trade development
1.2. Worldwide research involving “falling film vacuum evaporators”
Evaporation is the most often used technique in the food industry for concentrating
solutions or crystallizing solids from solutions. Of all the existing technology for evaporation of a
solution in dairy industries, the falling film evaporator is currently the most frequently used,
mainly due to its ability to treat heat-sensitive products.
Considering the economic importance of vacuum evaporation in the production of
concentrated / dehydrated dairy products, research aiming to improve the efficiency of the
process is necessary. However, few research groups are interested in this topic (Fig. 1.6). The
dairy industry has acquired empirical expertise in the vacuum evaporation process, and the
research centers in dairy powder are interested, until then, in drying technology (spray dryer).
Study of vacuum concentration in dairy products is therefore a challenging and a fertile area for
research in food processing engineering.

Economic and scientific contexts – Chapter 1: Trade development
Figure 1.6. Overview of main research teams focusing on vacuum evaporation of dairy
products, since 2010.
Brazil: University Federal of Viçosa Residence time; heat transfer;
fouling
Argentine: PLAPIQUI
Heat transfer
Australia: Dairy Australia
Heat transfer
France: INRA, AgroCampusOuest AgroParisTech Polytech'Lille Université de Toulouse Residence time; heat transfer; fouling; design
New Zeland: University of Canterbury
Dispersion system; Wetting tubes
China: Soochow University Heat transfer; design
Netherlands: NIZO food research Heat transfer; design; flow
Ireland: Teagasc
Heat transfer

Economic and scientific contexts – Chapter 2: Literature review
Chapter 2
LITERATURE REVIEW
This chapter aims to provide a literature background on the use of falling film evaporators
in the dairy industry, and the characteristics of this process (energy consumption, product flow,
fouling etc.). Many factors contribute to the dynamics of the vacuum evaporation process. In
general this process involves heat and mass transfer. Other factors are related to the design of
the evaporator (falling film, rising film, plate evaporators, etc.) and to product characteristics
(viscosity, composition, surface tension, etc.). The physicochemical characteristics of milk and
different designs of evaporators used in the dairy industry are described. The characteristics of
dairy concentrates (viscosity, specific heat, enthalpy, etc.) and their flow during concentration in
a falling film evaporator are also reported. Finally, the factors influencing fouling during vacuum
evaporation are described.
The main aims of this chapter are to:
- summarize the main characteristics of milk and dairy concentrates
- introduce falling film evaporator equipment
- describe the factors that contribute to the dynamics of the operation of FFE

Economic and scientific contexts – Chapter 2: Literature review
Capítulo 2 REVISÃO DE LITERATURA
Este capítulo tem como objetivo proporcionar o contexto literário sobre o uso de
evaporadores de película descendente na indústria de laticínios e as características deste
processo (consumo de energia, vazão de produto, fouling, etc.). Em geral, este processo
envolve a transferência de calor e massa. Muitos fatores contribuem para a dinâmica do
processo de evaporação a vácuo, sendo estes relacionados ao design do evaporador (filme
descendente, filme ascendente, evaporadores de placas, etc.) e as características do produto
(viscosidade, tensão superficial, composição, etc.). As características físico-químicas do leite e
de diferentes designs de evaporadores utilizados na indústria de laticínios são descritos. As
características dos concentrados lácteos (viscosidade, calor específico, entalpia, etc.) e seu
regime de escoamento durante a concentração em um evaporador de película descendente são
também relatados. Finalmente, os fatores que influenciam o fouling durante a evaporação a
vácuo são descritos.
Os principais objetivos deste capítulo são:
- resumir as principais características do leite e dos produtos lácteos concentrados
- descrever os evaporadores de película descendente
- descrever os fatores que contribuem para a dinâmica do funcionamento dos evaporadores de película descendente

Economic and scientific contexts – Chapter 2: Literature review
Table of contents
2.1. Transformation from milk to concentrated dairy products .................................................... 19
2.1.1. Classification, composition and structure of milk .......................................................... 19
2.1.2. Cracking of milk ........................................................................................................... 22
2.2. Vacuum evaporation ........................................................................................................... 27
2.2.1. Evaporators ................................................................................................................. 28
2.2.1.1. Rising film evaporators .............................................................................................. 30
2.2.1.2. Forced circulation evaporator .................................................................................... 31
2.2.1.3. Falling film evaporators ............................................................................................. 32
2.2.2. Energy efficiency .......................................................................................................... 34
2.2.2.1. Heat transfer coefficient ............................................................................................ 36
2.3. Thermo-physical properties of the dairy concentrates ......................................................... 39
2.3.1. Viscosity of dairy concentrates ..................................................................................... 39
2.3.2. Thermal properties of dairy concentrates ..................................................................... 40
2.4. Flow in falling film evaporators ............................................................................................ 42
2.4.1. Residence time distribution functions ........................................................................... 44
2.4.2. Residence time distribution models .......................................................................... 46
2.4.2.1. Axial dispersion ..................................................................................................... 46
2.4.2.2. Extended tanks in series ........................................................................................ 47
2.5. Fouling in falling film evaporators ....................................................................................... 48

Economic and scientific contexts – Chapter 2: Literature review
2.1. Transformation of milk to concentrated dairy products
2.1.1. Classification, composition and structure of milk
Milk is a fluid secreted by mammalian females in order to satisfy the nutritional
requirements of their neonates. It constitutes, therefore, a source of energy provided by lipids,
lactose, amino acids, vitamins, minerals and water. It also has an important physiological role as
it contains enzymes, hormones, antibacterial compounds, proteins and peptides (Fox and
McSweeney, 2003). A wide range of factors can intervene in the composition of milk such as
race, stage of lactation, health of the animal, season, animal feeding, etc. (Mahaut et al., 2000).
Table 2.1 shows the average composition of bovine milk.
Table 2.1. Average composition of bovine milk (Walstra et al., 1999).
Component Average concentration (g·kg-1)
Water 871.0
Fat 40.0
Proteins 32.5
Caseins 26.0
Whey proteins 6.0
Lactose 46.0
Minerals 7.0
Organic acids 1.7
Others 1.5
The average pH value of bovine milk at 20°C is about 6.6 - 6.8. The substances
dissolved in milk provide an average water activity of 0.995. Milk density (around 1029 kg·m³ at
20 °C) varies mainly due to the fat content. Although its viscosity is twice that of water, it
behaves as a Newtonian fluid (Walstra et al., 2006).

Economic and scientific contexts – Chapter 2: Literature review
The nitrogen content of milk is about 34.0 g·kg-1, divided into three groups: caseins, whey
proteins and non-protein nitrogen. Casein and whey proteins differ according to their solubility at
pH 4.6 (Croguennec et al., 2008).
Casein represents 80% of the total milk proteins (Cayot and Lorient, 1998; Fox and
Brodkorb, 2008; Horne, 2003). Casein in milk exists as large colloidal particles called “casein
micelles” (Fox and Brodkorb, 2008). Casein micelles have a relatively wide size distribution, from
less than 50 nm to more than 500 nm, with an average diameter of approximately 200 nm
(Horne, 2003). In their native state, casein micelles are hydrated particles containing several
thousand αS1-, αS2-, β- and -casein molecules as well as minerals, mainly colloidal calcium
phosphate (CCP) (de Kruif, 1999; Panouillé et al., 2005). In milk at pH 6.7, casein micelles are
electronegative, with an isoelectric point (pI) of 4.7. Caseins in the micelle structure are held
together by hydrophobic interactions and by the presence of CCP. In physiological conditions, a
“hairy layer” of the hydrophilic parts of -casein (about 10 nm thick and located at the surface of
casein micelles) is responsible for steric and electro-repulsive stabilization of casein micelles,
thus producing a balanced colloidal system (Panouillé et al., 2005).
In contrast to caseins, whey proteins are soluble at pH 4.6 in their native form. These
proteins are heat-sensitive. The major whey protein constituents are β-lactoglobulin (β-lg) and α-
lactoglobulin (α -lg). β-lg is a globular protein with a molecular mass of 18.3 kDa that has a very
compact structure due to the presence of many β sheets. In milk at pH 6.7, β-lg is in the form of
a dimer held together by non-covalent interactions. This protein has a free sulfhydryl group that
is not accessible in the native form of the protein. α-la is a compact globular protein with a
molecular weight of 14.2 kDa. This protein has an excellent amino acid profile, being rich in
lysine, leucine, threonine, tryptophan and cystine (Kinsella and Whitehead, 1989). Other minor
whey proteins are also present in the soluble phase of milk, in particular bovine serum albumin,
immunoglobulins and lactoferrin.

Economic and scientific contexts – Chapter 2: Literature review
Table 2.2. Composition and properties of milk proteins (Cayot and Lorient, 1998; Walstra
et al., 2006).
Concentration in milk (g·kg-1)
Molecular weight
(kg·mol-1)
Number of cystein residues (including free sulfhydryl)
(per mol)
Isoeletric point (pI)
Casein (~29 g·kg-1)
αS1-Casein 11.1 23.6 0 4.5
β-Casein 10.4 24 0 4.8
-Casein 3.7 19 2 (0) 5.6
αS2-Casein 2.9 25.2 2 (0) 5
Whey protein (~5 g·kg-1)
β-lactoglobulin 2.5 - 4.5 18.3 5 (1) 5.2
α-lactoglobulin 1.2 - 1.7 14.2 8 (0) ~ 4.3
Whatever the origin, milk consists of three phases: lipid phase; protein and mineral
fraction in the colloidal state and a dispersing aqueous phase containing lactose, soluble
proteins, minerals and vitamins (Croguennec et al., 2008). Fig. 2.1 (a) shows a transmission
electron microscopy image of raw milk at room temperature in which these three phases can be
identified: the lipid phase bounded by a membrane (milk fat globule membrane), casein micelles
in suspension and the aqueous phase. The diameter of milk fat globules is between 0.1 µm and
10 µm. The average diameter of the fat globules (about 7 µm) is much larger than that of casein
micelles (~ 120 nm) as shown in Fig. 2.1. Fig. 2.1 (b) shows the casein micelles (dark grey) and
aqueous phase (light grey).

Economic and scientific contexts – Chapter 2: Literature review
Figure 2.1. Raw milk at ambient temperature observed by transmission electron
microscopy, (a) where fat is present and (b) in the absence of fat (Tamine et al., 2007).
The ability of milk to be processed into a variety of products is mainly due to the
physicochemical characteristics of its proteins that confer various tecnofunctional properties
(gelling, foaming, emulsifying, etc.) (Croguennec et al., 2008). Finally, milk is a system under
dynamic equilibrium and several changes may occur on modifying its composition and structure.
These changes may be physical (foaming), chemical (oxidation, lipolysis, proteolysis) and
microbial (production of acid lactic).
2.1.2. Cracking of milk
Milk is a constituent of many food products. If the milk components are available
separately a wider range of functionalities properties such as foaming, emulsifying, etc., can be
used for new applications. Fractionated milk components provide a more constant quality of
consumer products and the development of new products, such as bio-active peptides. Milk
fractionation therefore leads to a more efficient and diverse use of milk. Furthermore, working
with concentrated streams may reduce the cost of transport significantly and also have
environmental advantages. Membrane separation technology seems a logical choice for the
fractionation of milk, because many milk components can be separated on size (Fig. 2.2).

Economic and scientific contexts – Chapter 2: Literature review
Membranes are already well established for the processing of whey and are gaining popularity in
other dairy applications (Daufin et al., 2001). These processes lead to the fractionation of dairy
components, i.e. the “cracking” of milk (Fig. 2.3) and whey (Fig. 2.4). Progress is still being made
on the extent of fractionation of milk and whey using more specific combinations of membrane
filtration and other separation techniques (electrodialysis, ion exchange, and chromatography)
and/or chemical treatments (such as acidification or hydrolysis).
Figure 2.2. Components in milk: size indication and membrane processes. MF=
microfiltration, UF = ultrafiltration, NF = nanofiltration, RO = reverse osmosis (Brans et al., 2004).

Economic and scientific contexts – Chapter 2: Literature review
Figure 2.3. “Cracking” of milk featuring the vacuum evaporation and spray drying
processes (Schuck, 2002).
MANTEIGA
VE
NF, ED, IE UF
Spray
drying
VE
WPC
[WPC]
WPC / I
POWDER
ULTRAFILTRATE
[ULTRAFILTRATE]
ULTRAFILTRATE
POWDER
VE
Spray
drying
DEMINERALIZED
WHEY / MFat
[DEMINERALIZED
WHEY / MFat
]
DEMIRALIZED
WHEY/MFat
POWDER
+ Alkalis
Coagulation
CASEINATE
CASEINATE
POWDER
CASEIN
Spray
drying
VE
[MILK]
MILK
POWDER
VE
WHEY/MICROFILTRATE
[WHEY]/[MFat
]
WHEY/ MFAT
POWDER
Spray
drying
VE
+ Fat (option) MF/DF
MCC / I
POWDER
[MCC]
VE
UF/DF
MPC
MPC / I
POWDER
Spray
drying
[MPC]
VE
Spray
drying
BUTTERMILK
[BUTTERMILK]
BUTTERMILK
POWDER
STANDARDIZED MILK WHOLE MILK SKIM MILK
Standardization
Cream separation CREAM
MCC

Economic and scientific contexts – Chapter 2: Literature review
Figure 2.4. Whey cracking. Modified from Lortal and Boudier (2011).
Once the component of interest has been extracted, the solution is very often
concentrated and spray dried. The vacuum evaporation process is widely applied in the food
industry for the concentration of solutions (Fig. 2.5). Although more energy expensive than
membrane concentration processes (Table 2.3), this process yields more viscous products,
which is not possible with membrane techniques.
SPRAY DRYING
Protein slightly soluble
concentrate
Protein concentrate without lipids
Purified proteins
Peptides WPI/WPC Whey without minerals &
lactose
β-lactoglobulin α-lactalbumin lactoferrin Lactoperoxydase Lysozyme
WHEY
Thermic and acid (pH 4.6)
precipitation
Albumins and globulins
Clarification
Ultrafiltration
Phospholip oproteins
Albumins and globulins
Diafiltration
Ultrafiltration
Whey proteins
Chromato Hydrolysis Diafiltration
Electrodialysis ion exchange nanofiltration
Mineral
Demineralized whey
Crystallization lactose
VACUUM EVAPORATION

Economic and scientific contexts – Chapter 2: Literature review
Table 2.3. Energy consumption for various water removal processes.
Processes Energy Consumption (kWh·t-1 removed water or permeate)
Membrane processes Ultrafiltration 3 to 4 Nanofiltration 5 to 7 Reverse osmosis 9 to 10 Vacuum evaporation* 100 to 300 Spray drying 1,000 to 2,000 Freeze drying 5,000 to 10,000
* Vacuum evaporator without mechanical vapor re-compression
The vacuum evaporation process is currently used before drying for production of dairy
products (Gray, 1981) (Fig.2.5). According to Jebson and Iyer (1991), the cost of the energy
required for the evaporation of milk is a major factor determining the production cost of milk
powder.
Figure 2.5. Flow diagram of the production of skim milk powder.
Skim milk
Heat treatment
Vacuum evaporation
Drying

Economic and scientific contexts – Chapter 2: Literature review
2.2. Vacuum evaporation
Evaporation is a process used to remove a liquid from a solution, suspension, or
emulsion by boiling off some of the liquid. It is thus a thermal separation or thermal concentration
process. The evaporation process is defined as one that starts with a liquid product and ends up
with a more concentrated, but still liquid and still pumped concentrate as the main product from
the process (Kessler, 1981). There are in fact a few instances where the evaporated, volatile
component, is the main product, but these are not discussed in this work. In the food domain
evaporation is used for product concentration, volume reduction, water / solvent recovery and
crystallization (Bimbenet et al., 2007).
In the field of thermal separation / concentration technology, evaporation plants are
widely used for concentration of liquids in the form of solutions, suspensions, and emulsions.
The major requirement in the field of evaporation technology is to maintain the quality of the
liquid during evaporation and to avoid damage to the product. This may require the liquid to be
exposed to the lowest possible boiling temperature for the shortest period of time. In the food
industry evaporation is performed at absolute pressures in the order of 0.02 MPa to 0.09 MPa
(pressures below atmospheric pressure). The term "vacuum" is therefore used to classify this
process.
In the dairy industry, vacuum evaporation is a process used for the production of final
(sweetened condensed milk, evaporated milk, etc.) (Gänzle et al., 2008), and intermediate
products before any further operations such as crystallization, precipitation, coagulation or drying
(infant formulae, whey and milk powders, etc.) (Bimbenet et al., 2007; Schuck, 2002; Zhu et al.,
2011).

Economic and scientific contexts – Chapter 2: Literature review
2.2.1. Evaporators
An evaporator is the device or set of devices used to achieve evaporation. The
destination of the vapor emitted is essential in the study of an evaporator. Even if there is no
potential use, it is necessary to condense such vapor. The vapor to be condensed is generally
used to heat the incoming products. This preheating serves to improve the energy use, and the
functional operation of the evaporator, since the liquid enters the evaporator at a temperature
close to its boiling temperature (Jeantet et al., 2011).
For vacuum evaporators, the vapor emitted is aspirated into the condenser by a
condenser pressure (Pc) lower than the evaporation pressure (Pev). Pc is controlled by the liquid-
vapor equilibrium that exists within the condenser. This means that the lowest pressure that can
be obtained in an evaporator is imposed by the temperature of the condensation of the product
vapor in the condenser. The vacuum pump connected to the condenser is only responsible for
evacuating the air out of the plant and for removing the incondensable gases. The amount of
gases to be evacuated depends on the amount of gas dissolved in the product and especially of
the quality of the vacuum tightness of the system (including pipes, pump seals, etc.) (Bimbenet
et al., 2007).
There are two main types of condenser (Fig. 2.6): mixture condensers (the vapor emitted
is cooled by mixing with cold water) and wall exchange condensers (tubular heat exchanger)
(Kessler, 1981). The vapor can also be condensed by mechanical refrigeration (as in
lyophilization) but this very expensive technology is justified only in special cases, i.e. flavor
recovery in coffee (Bimbenet et al., 2007).

Economic and scientific contexts – Chapter 2: Literature review
Figure 2.6. Diagram of: (A) mixture condensers, and (B) wall exchange condenser.
While the design criteria for evaporators are the same regardless of the industry involved,
two questions always exist: is this equipment best suited for the purpose and is the equipment
arranged in the most efficient and economical way? As a result, many types of evaporator and
many variations in processing techniques have been developed to take into account different
product characteristics and operating parameters. The most common types of evaporators used
currently are:
Rising film evaporators
Forced circulation evaporators
Plate evaporators
Falling film evaporators
Other types of evaporator, include the inclined tube evaporator, forced-circulation
evaporator, wiped film evaporator, etc. (Leleu, 1992).
Incondensable gases
Condensates
Cooling water
A B
Inlet water
Outlet water
Vapeur
Condensates
Vacuum pump

Economic and scientific contexts – Chapter 2: Literature review
2.2.1.1. Rising film evaporators
These evaporators operate on a "thermo-siphon" principle. Feed enters at the bottom of
the heating tubes and as it heats, vapor begins to form (Fig. 2.7). The ascending force of this
vapor produced during boiling causes liquid to flow upwards. At the same time vapor production
increases and the product is pressed as a thin film on the walls of the tubes (Smith and Hui,
2008).
Figure 2.7. Rising Film Evaporator (www.niroinc.com).
This co-current upward movement has the beneficial effect of creating a high degree of
turbulence in the liquid. This is advantageous during evaporation of highly viscous products. A
large temperature difference is need between the heating and boiling sides of this type of
evaporator, otherwise the energy of the vapor flow is not sufficient to convey the liquid and to
produce the rising film. The length of the boiling tubes will typically not exceed 7 meters. This
type of evaporator is often used with product recirculation, where some of the concentrate
A: Product
B: Vapor
C: Concentrate
D: Heating Steam
E: Condensate

Economic and scientific contexts – Chapter 2: Literature review
formed is reintroduced back to the feed inlet in order to produce sufficient liquid loading inside
the boiling tubes.
2.2.1.2. Forced circulation evaporator
Forced circulation evaporators (Fig. 2.8) are used if boiling of the product on the heating
surfaces is to be avoided due to fouling or crystallization. The flow velocity in the tubes must be
high, and high-capacity pumps are required. The circulating liquid is heated when it flows
through the heat exchanger and then partially evaporated when the pressure is reduced in the
separator, cooling the liquid to the boiling temperature (Smith and Hui, 2008).
Figure 2.8. Forced circulation evaporator (www.niroinc.com).
The liquid is typically only heated a few degrees for each pass through the heat
exchanger, which means the recirculation flow rate has to be high. This type of evaporator is
also used for crystallizing applications because no evaporation and concentration take place on
the heat transfer surface. Evaporation occurs as the liquid is flash evaporated in the separator /
flash vessel. In crystallizing applications this is then where the crystals form, and special
A: Product
B: Vapor
C: Concentrate
D: Heating
E: Condensate
1: Calandria
2: Separator (Flash Cooler)
3: Circulation Pump
4: Concentrate Pump

Economic and scientific contexts – Chapter 2: Literature review
separator designs are used to separate crystals from the recirculated crystal slurry. The heat
exchanger can be arranged either horizontally or vertically depending on the specific
requirements in each case.
2.2.1.3. Falling film evaporators
The need, for an evaporator capable of functioning with a very small temperature
difference between heat steam and product, imposed by shorter process times and operating
economy led to the application of the falling film evaporation principle (Gray, 1981). With this
arrangement the product is made to flow downwards in a film over the heating surface. The
principal driving force is gravity. In contrast to the climbing film evaporators, high heat fluxes and
temperature differences are not required to establish the desired flow conditions. The heat
transfer surface may be in the form of either tubes or plates, but capacity limitations of the falling
film plate evaporator have led to the tubular version being much more widely applied (Gray,
1981). The falling film tubular evaporator is currently the standard type used in the dairy industry.
In falling film evaporators (FFE) (Fig. 2.9), liquid and vapors flow downwards in parallel.
The liquid to be concentrated is preheated to boiling temperature. An even thin film enters the
heating tubes via a distributor system in the head of the evaporator, flows downward at boiling
temperature, and is partially evaporated. This gravity-induced downward movement is
increasingly augmented by the co-current vapor flow.

Economic and scientific contexts – Chapter 2: Literature review
Figure 2.9. Falling film evaporator. Addapted from Jeantet et al. (2011).
However, falling film evaporators must be designed very carefully for each operating
condition; sufficient wetting of the heating surface by liquid is extremely important for trouble-free
operation of the plant (Morison et al., 2006). Due the low liquid holding volume in this type of unit,
the falling film evaporator can be started up quickly and changed to cleaning mode or another
product easily. The fact that falling film evaporators can be operated with small temperature
differences makes it possible to use them in multiple effect configurations with very low energy
consumption.
Evaporation tubes
Cooling water
Incondensible gases
Condenser
Steam
Condensates
Concentrate
Separator
Secondary vapor Condensates
Vacuum pump
Product

Economic and scientific contexts – Chapter 2: Literature review
2.2.2. Energy efficiency
To become even more energy efficient the vapor produced in one falling film evaporator
can be used to heat another evaporator operating at a lower pressure and temperature. The first
evaporator thus acts as a "boiler" for the second. Similarly, the second serves as a condenser
for the first (Fig. 2.10). This way of recycling the water vapor continuously in series is often
termed multi-effect evaporation. With n evaporators added in series to recycle the water vapor
for use in the next evaporator, the energy usage can be decreased by approximately 1/neffects.
Figure 2.10. Multi-effect evaporator (Jeantet et al., 2011).
The economic optimization of the number of effects is chosen for a minimum total cost of
the evaporation process. The main elements of the total cost (TC) are the investment costs (IC);
the consumption costs (CC) of heating steam, water, electricity, etc.; and the staff cost (SC).
These various costs vary with the number of effects n (Fig. 2.11).
Inlet steam
Condensates Liquid
Cooling water
Concentrate
1st Effect 2nd Effect 4th Effect 3rd Effect
Condensate
Incondens
Vacuum pump

Economic and scientific contexts – Chapter 2: Literature review
Figure 2.11. Diagram of the cost components of an evaporator as a function of the
numbers of effects. IC = investment cost; CC = cost of consumption; SC = staff costs and TC =
total cost = IC + CC + SC (Jeantet et al., 2011).
The curve of the total cost (Fig. 2.11) passes through a minimum for a given n value.
This number rounded to the nearest whole number, is the optimum number of technical and
economic effects.
In order to reduce the energy consumption and environmental impact, it is important that
evaporators operate at their maximum capacity, which is highly dependent on the overall heat
transfer coefficient. This parameter cannot be considered as an intrinsic characteristic of the
evaporator, since it also depends on the nature of the product and on their flow conditions
(Mafart, 1991). The factors that control heat transfer in the evaporator tubes are important for
close monitoring of the evaporation process and for the calculation of the evaporators
dimensions (Bouman et al., 1993; Jebson and Iyer, 1991).
Number of effects
Cost
SC
CC
IC
TC
1 2 3 4 5 6

Economic and scientific contexts – Chapter 2: Literature review
2.2.2.1. Heat transfer coefficient
Knowing the heat transfer coefficient is essential to monitor the evaporation process
closely. In most dairy factories the total energy usage is known, but often information on the
quantities of energy used for individual processes is lacking (Jebson and Chen, 1997).
For all types of evaporator, the evaporation rate depends on the heating power (Q),
which depends on the overall heat transfer coefficient (U), the heat exchange area (A), and the
temperature difference between the heating steam and the boiling liquid, Δ , Eq. 2.1:
Q = � · A · ∆ Eq. 2.1
The design, optimization and investment costs of the unit are thus strongly dependent on
the predicted value of this variable (Prost et al., 2006).
The inverse overall heat transfer coefficient (1/U) for a given effect is resistance resulting
from four resistances in series: the resistance of the heating steam side (1/hv), the resistance of
conduction through the wall (em/ m), the resistance of an eventual fouling layer (Rfouling) and the
resistance of the product (1/hp) (Fig. 2.12, Eq. 2.2).

Economic and scientific contexts – Chapter 2: Literature review
Figure 2.12. Temperature profile between the heating steam ( s) and the boiling product
( p) at a steady regime in a falling film evaporator (Adib, 2008).
Legend: Ѵv: vapor velocity and Δ : temperature difference between steam and product
= − + λ + R + Eq. 2.2
where hv-1 is the steam heat transfer coefficient (kW·m-2·°C-1), m the thermal conductivity
of the wall (kW·m-1·°C-1), em the wall thickness (m), Rfouling the thermal resistance of the fouling
layer (kW·m-2·°C-1) and hp the product heat transfer coefficient (kW·m-2·°C-1)
The heating steam condenses to form a film condensate along the external wall of the
evaporator tube. The steam heat transfer coefficient is in the order of 5,000 W·m-2·°C-1 to 15,000
W·m-2·°C-1. hV-1 can be calculated by equations based on the Nusselt number (Eq. 2.3) (Adib et
al., 2009), eventually adjusted to take into account of the shape and arrangement of the heating
surfaces, the speed of the heat steam, the presence of non-condensable gas, the surface
condition of the wall, etc. (Bouman et al., 1993).
Ѵv
p
Wall
Fouling
Vapor emitted
Trickling condensate film
Trickling liquid film
Δ
s
Steam

Economic and scientific contexts – Chapter 2: Literature review
N = .6 ∙ R − Eq. 2.3
where
N = −λ η ∙ Eq. 2.4
where hv is the heat transfer coefficient of the condensing steam (kW·m-2·°C-1), Re the
Reynolds number (-), the viscosity of the condensate steam (Pa∙s), ρ the density of the
condensate steam (kg·m-3), and g the gravity acceleration (m·s-2)
The heat transfer coefficient through the wall, (λ
), is easier to calculate, because the
thermal conductivity coefficients of the materials constituting the exchange surfaces are known,
as well the wall thickness. These coefficients are generally high, in the order of 10 kW·m-2·°C-1 to
20 kW·m-2·°C-1, which corresponds to a low thermal resistance, that can often be disregarded.
The potential fouling layer must be taken into account in the calculation of the overall
heat transfer coefficient. Fouling of heat transfer surfaces is one of greater problems in heat
transfer equipment.
Generally the product heat transfer coefficient, hp, is the most difficult to predict, and
often it is the limiting factor for the heat transfer, especially for viscous concentrates. The heat
transfer coefficient for pure water evaporated at Δ = 10°C is in the order of 6 kW·m-2·°C-1 to 15
kW·m-2·°C-1. According to many authors (Bimbenet et al., 2007; Miranda and Simpson, 2005;
etc.), hp depends on several factors such as physical properties of the treated product (viscosity
p, surface tension p, density ρp, etc.); process conditions (heat flux, temperature difference Δ ,
boiling temperature p); and nature and geometry of the heating surface, (roughness R, etc.).
These factors are summarized in Eq. 2.5.
h = f ρ , σ , , C … ∆ , R, etc. Eq. 2.5

Economic and scientific contexts – Chapter 2: Literature review
where p is the product surface tension (N·m-1) and Cpp the product specific heat
(kJ·kg-1·°C-1)In this work, only the overall heat transfer coefficient U (kW·m-2·C-1) (Eq. 2.1) is
discussed. For falling film evaporators this coefficient are in order of 1 kW·m-2·°C-1 to 8 kW·m-
2·°C-1 (Bimbenet et al., 2007).
2.3. Thermo-physical properties of dairy concentrates
Estimation of U in all chemical engineering formulas currently available in the literature is
connected to thermo-physical properties of products. These thermo-physical properties ( p, ρp,
p ...) generally vary with the concentration and temperature of the product, and possibly also as
a function of shear rate in the case of a non-Newtonian fluid.
2.3.1. Viscosity of dairy concentrates
The rheological behavior of dairy concentrates changes during the evaporation process
due the changes in the product concentration and temperature. It can be modified by the shear
rate, expressed by the velocity gradient, γ (s-1):
γ = Eq. 2.6
Therefore the apparent viscosity, a, is used to represent and classify the flow profile of
dairy concentrates. This defined as:
= Τγ Eq. 2.7
where Τ is the shear stress (Pa)
According to the relationship between the shear stress and the shear rate presented in
Eq. 2.7, two types of rheological behavior can be distinguished (Fig. 2.13).

Economic and scientific contexts – Chapter 2: Literature review
Figure 2.13. Newtonian and non-Newtonian fluids.
For Newtonian fluid the viscosity only depends on the temperature and concentration. On
the other hand for the Non-Newtonian fluids the viscosity depends on the shear rate in addition
to the temperature and concentration.
2.3.2. Thermal properties of dairy concentrates
Some thermal properties of dairy concentrates can be used for the estimation of heat
transfer coefficients and enthalpy balances for an evaporator. These properties are:
• Specific heat Cp (kJ·kg-1·°C-1)
At temperature , Cp is the amount of heat (in kJ) to be supplied to 1 kg of product, to
raise its temperature by 1°C.
• Specific enthalpy: (kJ·kg-1)
Shear thinning
Newtonian
Dilatants
Non-Newtonian
Τ (Pa)

Economic and scientific contexts – Chapter 2: Literature review
The specific enthalpy of a solution depends on its temperature and composition. For a
solution composed of sugars, salts, proteins and lipids, such as dairy concentrates, the specific
enthalpy can be calculated according to Rahman, 2009:
H = C ∙ Eq. 2.9
The specific enthalpy of the water vapor emitted at temperature p of the concentrate is
given by the following equation:
H − = . ∙ + ∆H Eq. 2.10
• Enthalpy of vaporization: ΔHv (kJ·kg-1)
The enthalpy of vaporization, also known as the latent heat of vaporization or heat of
evaporation, is the energy required to transform a given quantity of a substance from a liquid into
a gas at a given pressure. For example the ΔHV for pure water at 100°C = 2258 kJ·kg-1.
For a food product, the binding of water on the solute will result in a boiling point
elevation, i.e. a saccharose solution at 700 g·kg-1 of total solids has a boiling point elevation
around 2.7°C when concentrated at 80°C (Bimbenet et al., 2007).
• Thermal conductivity (W·m-1·°C-1):
Thermal conductivity is the property of a material to conduct heat. It can be defined as
the quantity of heat transmitted through a unit thickness of a material - in a direction normal to a
surface of unit area - due to a unit temperature gradient under steady state conditions. The skim
and whole milk thermal conductivity is around 0.563·10-3 kW·m-1·°C-1 and 0.537·10-3 kW·m-1·°C-1,
respectively.

Economic and scientific contexts – Chapter 2: Literature review
2.4. Flow in falling film evaporators
In FFE a complete film should be maintained inside the tubes over the process time. This
requires that the liquid is first distributed to all the tubes to provide sufficient flow. The film must
then be maintained down the tubes. Film breakdown (Fig. 2.14) will decrease the efficiency of
the process and may cause excessive fouling (Paramalingam et al., 2000).
Figure 2.14. Film breakdown (Hartley and Murgatroyd, 1964; Morison et al., 2006).
In an industrial evaporator a distributor system is installed above the top tube sheet. A
falling-film distributor (Fig. 2.15) is a critical component in the evaporator, which makes the liquid
flow evenly inside the tube and affects the production capacity and service life of the evaporator.
Unfortunately, industrial liquid film distributors have certain shortcomings, such as structural
complexity, large area, high requirement for production and processing precision, poor uniformity
and wettability of falling film (Anurjew et al., 2011; Luo et al., 2011).

Economic and scientific contexts – Chapter 2: Literature review
Figure 2.15. Plan of a typical distributor system for a falling film evaporator tube
(www.gea.com).
The flow in falling film evaporators is often characterized by using dimensionless
numbers. The most important parameter is the film Reynolds number (Ref), which measures the
extent of the inertia relative to viscous effects.
Re = Γη Eq. 2.11
where Γ is the mass flow rate per unit circumference of the tube (kg·m-1·s-1) and the
apparent viscosity of the product (Pa·s).
Γ is measured according to equation 2.12:
Γ = Eq. 2.12
where m is the concentrate mass flow rate (kg·s-1) and D the inner diameter of the tube
(m).

Economic and scientific contexts – Chapter 2: Literature review
There are many different classifications of falling film flows in the literature. Grossman
and Heath (1984) divided the flow into three regimes, smooth laminar, transition region and fully
turbulent flow, where the transition region can in turn be divided into different regions. Numrich
(1992) divided the flow into only two regions, the laminar and the turbulent. Bird et al. (1960)
established the flow profiles in three regions: laminar, laminar with waves and turbulent. What
varies between these different classifications is how the transition from laminar to turbulent flow
is handled.
2.4.1. Residence time distribution functions
The residence time distribution (RTD) of fluids passing through a food processing plant
can be important for public safety and product quality reasons. It is often assumed for design
purposes that either a laminar or plug flow regime exists and that the residence times can be
calculated from volume and flow rate (Janssen, 1994). Moreover, in falling film evaporators the
product flows in a thin layer in the evaporations tubes, thus making it difficult, to determine plant
volume accurately. For such situations, it is necessary to measure the plant RTD directly.
The mathematics and techniques for RTD determination were developed in the field of
chemical engineering (Danckwerts, 1953). The most common technique is injecting an inert
tracer into the feed stream and measuring the concentration in the product stream over time (Fig.
2.16).
Figure 2.16. Diagram of measurement of tracer for calculation of residence time distribution.
Tracer injection
Evaporator
Tracer measured (Inlet)
Tracer measured (Outlet)

Economic and scientific contexts – Chapter 2: Literature review
Each element of fluid takes a different route and time through the processing unit. The
distribution of these times at the outlet of the unit is called the E-curve or age distribution
function, E(t), which characterizes the residence time distribution (RTD) of the process. The
simplest way to obtain the E(t) is by the pulse experiment, where a small amount of a non-
reactive tracer is injected simultaneously at the unit inlet and its concentration is continuously
recorded at the outlet C(t) (Fig. 2.16). The E-curve is then obtained from Eq. (2.13), where C0 is
the total tracer concentration (Levenspiel, 1999).
E t = −∫ − ∞ Eq. 2.13
∫ E t dt =∞ Eq. 2.14
Since the pioneering work of Danckwerts (1953), the RTD theory has been widely
developed and is nowadays used in a more general context in order to determine a population
balance model (Villermaux, 1982), where the basis of this model is that the number of entities
with certain properties in a system is a balanceable quantity. Such properties include size, mass,
and age. RTD theory is also used to optimize the process in terms of capital and operation costs
(Malcata, 1991). The latter represent an essential step in managing and controlling the quality of
food products. Burton et al., (1959) applied the concept of RTD to food engineering in order to
calculate the sterilizing effectiveness of a UHT apparatus for milk processing. Baloh (1979)
showed that the loss of sugar in pasteurization and evaporation processes of various processing
schemes in the sugar industry could be significantly lowered by reducing the mean residence
time of sweet juice. Thor and Loncin (1978) established the mechanisms of rinsing (e.g. mass
flow rate and shear stress) of a plate heat exchanger by the measurement of RTD, and thereby
laid down the basis for optimizing the rinsing of equipment in food engineering. Jeantet et al.
(2008) calculated and modeled the RTD for different sections of a spray-dryer tower for skim
milk, and described the heat treatment that the product was subjected in this process.

Economic and scientific contexts – Chapter 2: Literature review
For tube flow, the RTD is associated with the velocity profile and the dispersion flow of
the product. Determination of the product RTD is an overall and experimental approach which
provides valuable information about the product flow profile in the evaporator, according to the
operating conditions. It does not provide a good physical understanding of the operation as
computational fluid dynamics does but it integrates the product and process complexity fully.
2.4.2. Residence time distribution models
Ideal flow models such as plug flow, and perfectly mixed tank and laminar flow rarely
reflect a real system with enough accuracy. Non-ideal models are usually derived from ideal
models to account for deviations implicit in real systems (Torres and Oliveira, 1998). Models with
one parameter, such as the well-known dispersion model, are usually more appropriate to
represent tubular systems (Levenspiel and Bischoff, 1963). In this section, two single parameter
models are presented which have mainly been used to fit the experimental RTD data for food
reactors. The dimensionless E-curves of these models are illustrated in Fig. 2.16 and 2.17,
where the effects of the model parameter can be observed.
2.4.2.1. Axial dispersion
The axial dispersion model can be used to represent small deviations from plug flow, as
well as other non-ideal flow patterns in tubular systems. It has been widely applied to describe
the flow in tubes and is the most frequent choice to model flow in holding tubes in aseptic
processing (Torres and Oliveira, 1998). The model parameter is the Peclet number, which is
defined for tube flow as:
P = L ∙ νa Eq. 2.15
where L is the tube length (m), ν the mean velocity (m·s-1) and Dax the axial diffusion
coefficient (-)

Economic and scientific contexts – Chapter 2: Literature review
This dimensionless number represents the relation between advection (flow) and
diffusion. When Pe approaches infinity, negligible dispersion is observed (ideal plug flow). When
Pe approaches zero, wide dispersion is observed (perfectly mixed tank) (Fig. 2.17).
Figure 2.17. Dimensionless E-curves for the axial residence time distribution model
(Villermaux, 1993).
The axial dispersion model can be calculated as:
E t = √P +4∙ ∙ exp − P + ∙ −4∙ Eq. 2.16
2.4.2.2. Extended tanks in series
The extended tanks in series model are based on a series of perfectly mixed tanks and
can be used to represent deviations from plug flow and to represent real stirred tanks. The E
function for this model is presented in Eq. 2.17, where the parameter being modeled is the
number of tanks, N.
E t = N∙ N∙ N−N− ! exp −N ∙ t Eq. 2.12

Economic and scientific contexts – Chapter 2: Literature review
Figure 2.18. Dimensionless E-curves for the tanks in series residence time distribution
model (Villermaux, 1993).
2.5. Fouling in falling film evaporators
Fouling is defined as the formation of deposits from the product on heat exchange
surfaces which impede the heat transfer. In FFE a fouling layer accumulates on the inner wall of
the evaporator tubes during processing (Jeurnink et al., 1996) leading to a decrease in the heat
transfer coefficient, increased pressure drop, and the formation of a biofilm, thus impeding the
optimal functioning of the evaporator equipment (Langeveld et al., 1990; Visser and Jeurnink,
1997).
Due to fouling that decreases the heat transfer coefficient, most evaporators do not have
a constant production capacity. In petrochemical industries, pipe cleaning is carried out once a
year, whereas in food-processing industries, it has to be done at least once a day (Ozden and

Economic and scientific contexts – Chapter 2: Literature review
Puri, 2010). The high frequency of cleaning periods results in a shorter production time and
higher consumption of water and cleaning agents, leading to high economic costs and ecological
problems (Jimenez et al., 2013).
Milk fouling can be classified in two categories (Burton et al., 1959; Changani et al., 1997;
Visser and Jeurnink, 1997): Type A (protein) where fouling takes place at temperatures between
75°C and 110°C, and the deposits are white, soft, and spongy (milk film); and type B (mineral)
where fouling takes place at temperatures above 110°C. Type B deposits are hard, compact,
granular in structure, and gray in color (milk stone) (Table 2.4).
Table 2.4. Composition of the two milk fouling categories (modified from Bansal and
Chen, 2005).
Composition Milk fouling category
Type A Type B
Proteins (g·kg-1) 500 to 700 150 to 200 Minerals (g·kg-1) 300 to 400 700 to 800
Fat (g·kg-1) 40 to 80 40 to 80
Vacuum evaporators can be considered as heat exchangers in a first approach, where
the main mechanism factors likely to generate fouling during the heat treatment of milk are: the
formation and subsequent deposition of activated whey protein molecules; the precipitation of
minerals as a result of the decreasing solubility of calcium phosphates with increasing
temperature; and the temperature difference between the heating surface and the liquid to be
heated (Lalande and Tissier, 1985; Paterson, 1988).
During heat treatment, fouling is particularly problematic with concentrated products.
Schraml and Kessler (1994), found that fouling during pasteurization of whey products increased
to a maximum concentration of 250 g·kg-1 of total solids (TS), after which deposition decreased.

Economic and scientific contexts – Chapter 2: Literature review
The decrease was thought to result from two competing mechanisms: aggregation of whey
proteins and crystallization of salts (Fryer et al., 2011).
In general, the ability to transfer heat efficiently remains a central feature in the
production of dairy products. Much attention has therefore been paid to improving the
understanding of heat transfer mechanisms and the development of suitable correlations and
techniques that may be applied to the design of vacuum evaporation. On the other hand,
relatively little consideration has been given to the problem of surface fouling in FFE. Most of
studies of the fouling and cleaning in the food engineering domain have focused on
pasteurization and sterilization processes, where the temperatures are higher than 70°C. Chen
and Bala (1998) showed that surface temperatures need to be above 70°C for significant
surface fouling of milk to occur, but most milk evaporators parts operate below this temperature
(Morison, 2015). Therefore, most of the fouling occurring in milk evaporators should not be
assumed to be the same as that occurring in sterilizers and pasteurizers.

Economic and scientific contexts – Chapter 3: Aims and strategy
Chapter 3
AIMS AND STRATEGY OF THE PHD PROJECT
This chapter describes the aims and the strategy of this PhD project. Based on the
progress in dairy powder technology, and the importance of the vacuum evaporation process in
terms of energy consumption and final powder quality, this part sets out the research area and
outlines the research questions of the project. This study focused mainly on the performance of
falling film evaporators during concentration of different dairy products, including skim milk,
whole milk, sweet whey and lactic acid whey, at different concentrations. The innovative aspect
of this project is the use of a pilot-scale, single-stage falling film evaporator that describes the
same process as that of an industrial scale from a hydrodynamic point of view, and the
development of a methodology for the calculation and modeling of the residence time distribution
functions. The effectiveness of evaporation, the heat transfer coefficient, the extent of fouling
formation, the flow behavior and the dispersion of the residence time could thus be identified
over the processing time. This PhD project has benefited from close collaboration with GEA
(Process Engineering - France), AgroParisTech (Massy – France), Federal University of Viçosa
(Brazil) and INRA STLO (Science and Technology of Milk and Eggs) Research laboratory.
The main aims of this chapter are to:
- define the PhD research area and outline the research questions
- introduce the innovative hydrodynamic characterization methodology
- highlight the multidisciplinary aspects of this research

Economic and scientific contexts – Chapter 3: Aims and strategy
Capítulo 3 OBJETIVOS E ESTRATÉGIA DO PROJETO DE DOUTORADO
Este capítulo descreve os objetivos e a estratégia adotada para a realização deste
projeto de doutorado. Com base no progresso das tecnologias para a produção de lácteos
desidratados, bem como na importância do processo de evaporação a vácuo em termos de
consumo de energia e na qualidade final do pó obtido, esta seção define a área de pesquisa e
descreve as questões de pesquisa a serem abordadas pelo seguinte trabalho. Este estudo
centrou-se principalmente no desempenho de evaporadores de película descendente durante a
concentração de vários produtos lácteos, incluindo leite desnatado, leite integral, soro de leite
doce e soro de leite ácido, ambos a diferentes concentrações. O aspecto inovador deste projeto
é o uso de um evaporador a vácuo piloto de película descendente que descreve o mesmo
processo usado nas indústrias de um ponto de vista hidrodinâmico, e o desenvolvimento de
uma metodologia para o cálculo e modelagem das funções de distribuição dos tempos de
residência. A capacidade evaporativa, o coeficiente de transferência de calor, a extensão da
formação do fouling, o perfil de escoamento e a dispersão dos tempos de residência podem ser
portanto identificados ao longo do tempo de processamento. Este projeto de doutorado
beneficiou-se da parceria com GEA (Process Engineering - France), AgroParisTech (Massy -
França), Universidade Federal de Viçosa (Brasil) e INRA STLO (Ciência e Tecnologia do Leite e
ovos - França).
Os principais objetivos deste capítulo são:
- definir a área de pesquisa do doutorado e descrever as questões de pesquisa
- introduzir uma metodologia inovadora para a caracterização hidrodinâmica do processo de evaporação a vácuo
- destacar os aspectos multidisciplinares da pesquisa

Economic and scientific contexts – Chapter 3: Aims and strategy
Table of contents 3.1. Context of the PhD project .................................................................................................. 54
3.2. Aims, objectives and strategy ............................................................................................. 54
3.3. Originality of the research project ....................................................................................... 57

Economic and scientific contexts – Chapter 3: Aims and strategy
3.1. Context of the PhD project
The vacuum evaporation process has an important role in the economic aspects of the
world market for dairy powders, which has been considerably expanding as previously stated
(Fig. 1.3). Indeed, this process is quasi systematically applied in the dairy industry for the
concentration of solutions prior to the drying step: dairy products must be concentrated to a
maximum total solids content around 500 g·kg-1 to 550 g·kg-1, 550 g·kg-1 to 600 g·kg-1, and 200
g·kg-1 to 250 g·kg-1 for skim milk, whey and whey protein isolates, respectively, as below this
value the concentrated product cannot be atomized in the spray-dryer (Schuck, 2002). Besides,
the energy used in multi stage evaporators is about 10 times less than that used in a spray-dryer,
and evaporation is therefore used to remove the maximum amount of water from the product,
while maintaining the physicochemical and microbiological quality of the liquid.
The evaporation process has a major influence on the final powder quality, e.g. an
increase in the concentrate viscosity will lead to a decrease in the powder bulk density, and an
increase in powder solubility, porosity and wettability, etc. (Fergusson, 1989). However the
increase of the concentrate viscosity leads to an increase in the powder bulk density according
to Minton (1986). The milk powders properties is also affected by the thermal heat treatment
during the evaporation process, as in the spray dryer the thermal effects on the product can be
disregarded due to the very low residence time and temperature. The evaporation process can
also cause issues with microbiological powder quality, since thermoduric bacteria tend to grow
during the vacuum evaporation process (Crossley and Campling, 1957; Murphy et al., 1999).
The control of vacuum evaporators operation is still a challenge due to the complexity of
their closed geometry and process - product interactions (e.g. fouling of tubes). The dairy
industry already knows the key operating parameters which must be controlled to obtain a
concentrate with a specific composition and how to identify irregularities in the production line
(e.g. fouling in the evaporation tubes). However, this knowledge is usually obtained empirically,

Economic and scientific contexts – Chapter 3: Aims and strategy
and therefore there is a lack of information regarding the energy consumption of the vacuum
evaporation process, the product flow profile during concentration, the optimal effectiveness of
evaporation and which operating parameters need to be monitored to obtain final products of
controlled composition. This is why a better understanding of the thermodynamic and
hydrodynamic phenomena is needed to determine which operating parameters need to be
monitored to improve the performance of evaporators and to control the final properties of the
concentrates. Finally, it appears necessary to improve understanding of the effects of the
interaction of the product and operating parameters on the performance of falling film
evaporators.
It is of note that, there are few scientific papers related to the vacuum evaporation
process despite its wide use in the dairy industry. The few available papers focused mainly on
calculation of the heat transfer coefficient of different solutions (Ali Adib and Vasseur, 2008;
Chun and Seban, 1971; Monnier et al., 2012; Prost et al., 2006), on evaporation process was
carried out with industrial equipment, and therefore the initial composition of the product and the
operating parameters were not fully controlled (due to large-scale production) (Bouman et al.,
1993; Jebson and Iyer, 1991; Jebson and Chen, 1997). Others used laboratory-scale falling film
evaporators, where the hydrodynamic profile of the fluids is not the same as that found on an
industrial scale (Adib et al., 2009; Luo et al., 2011; Monnier et al., 2012; Park et al., 2004;
Pehlivan and Ozdemir, 2012).
An equipment representative of the same process as the industrial scale was therefore
needed to study the vacuum evaporation process and to improve understanding of the effects of
the operating parameters on the process performance and product quality. These issues are the
basis for this PhD framework.

Economic and scientific contexts – Chapter 3: Aims and strategy
3.2. Aims, objectives and strategy
The main aim of the PhD project was to provide some answers regarding the
performance of evaporators during the concentration of dairy products, by means of
thermodynamic and hydrodynamic approaches relating the interactions between products
properties and operating parameters.
A prototype of a pilot-scale, single-stage falling film evaporator was therefore used to
tackle these issues. This equipment was designed according to specifications established by
INRA STLO (Science and Technology of Milk and Eggs) Research laboratory, to describe the
same process as the industrial scale from a hydrodynamic point of view. As it is possible to
perform evaporation at a constant temperature with this pilot evaporator (whereas in industrial
scale evaporators temperature evolves over time), the time / temperature / concentration triplet
was simplified to a binomial time / concentration approach.
The first stage of this PhD project was therefore to characterize the pilot vacuum
evaporator, with instrumentation of the pilot (choice and positioning of the different sensors) and
setting of the thermodynamic balances. This information allowed the determination of the
operating process range for maximum effectiveness of evaporation of pure water, skim and
whole milk (Chapter 5).
After the thermodynamic characterization of the evaporator, hydrodynamic
characterization was undertaken (second stage of this PhD project). The hydrodynamic profile of
water and skim milk were determined using Reynolds number and residence time distribution
(RTD) functions. In addition to provide important information relating to the product flow profile in
the evaporator, RTD functions also provided the time that the product spent in the evaporator.
As the product temperature in this equipment may be kept constant, the profile

Economic and scientific contexts – Chapter 3: Aims and strategy
time / temperature can be accessed. These RTD functions were modeled and a physical
interpretation of the model was obtained (Chapter 6).
The thermodynamic and hydrodynamic characterization of the evaporation process was
performed with other dairy products such as sweet and acid lactic whey. These approaches
indicated the fouling formation during concentration in a falling film evaporator (Chapter 7).
3.3. Originality of the research project
The PhD project has had to combine fundamental and experimental information on the
“concentration phenomenon” and aspects related to the flow profile during concentration of
different dairy products in a falling film evaporator. The project consisted of an experimental
study, where the results of which could be used to improve process performance, control and
quality in the dairy industry. A prototype pilot vacuum evaporator was characterized and
instrumented, which are essential steps for further studies of the interactions between product
and process, and process performance as regards the processing time and cleaning efficiency.
Methodology was developed for the measurement of residence time distribution functions
of real products in a falling film evaporator. To date this approach has been used in cases where
the product composition remained constant before and after the process (e.g. pasteurizers) or
with model solutions, which do not represent the complexity of a real solution, such as skim milk.
The difficulty for calculation the RTD in the vacuum evaporator equipment is the changes
occurring in the product throughout the process, due to increase in the concentration. The
product properties and their interactions with the evaporator equipment therefore change over
the process time. An approach was also proposed for modeling these RTD functions. Due to
thorough understanding of the process, a physical interpretation of the RTD is proposed, which
provides important information related to the flow of different dairy products, such as skim milk,
sweet whet and lactic acid whey during its concentration in a falling film evaporator.

PART 2
MATERIALS AND METHODS, RESULTS
AND DISCUSSION

M&M, results and discussion – Chapter 4: Materials and methods
Chapter 4 MATERIALS AND METHODS
The aim of this chapter is to describe the working of the pilot scale, single stage falling
film evaporator, used for carrying out this PhD thesis, and the methodologies used to
characterize this process. The initial configuration of the pilot and the improvements made are
presented. Different types of sensors to measure temperature, conductivity, flow rate, pressure
and heating power were used to characterize and monitor the vacuum evaporation process.
Water, skim milk, whole milk, sweet whey and lactic acid whey were used as solutions to be
concentrated. The methods for the physicochemical analysis of these products are presented.
Enthalpy balances as well as the methodology used to calculate and model the residence time
distribution functions are also described.
The main aims of this chapter are to:
- Describe the pilot-scale vacuum evaporator used
- Describe how the experimental runs were carried out
- Describe the physicochemical analyses applied to the concentrated products
- Describe the calculations and model of the residence time distribution functions

M&M, results and discussion – Chapter 4: Materials and methods
Capítulo 4 MATERIAIS E MÉTODOS
O objetivo deste capítulo é descrever o funcionamento do evaporador piloto, único efeito,
de película descendente utilizado para a realização deste trabalho de doutorado, e as
metodologias utilizadas para a caracterização deste processo. A configuração inicial do piloto e
as melhorias realizadas posteriormente neste equipamento são apresentadas. Diferentes tipos
de sensores para medida de temperatura, condutividade, vazão, pressão e potência de
aquecimento foram usados para caracterizar e monitorar o processo de evaporação a vácuo.
Água, leite desnatado, leite integral, soro de leite doce e ácido foram usados como soluções a
serem concentradas. Os métodos para as análises físico-químicas destes produtos são
apresentados. Balanços entálpicos, bem como a metodologia utilizada para o cálculo e
modelagem das funções de distribuição dos tempos de residência são também descritos.
Os principais objetivos deste capítulo são:
- descrever o piloto de evaporação a vácuo utilizado
- descrever como os ensaios experimentais foram realizados
- descrever as análises físico-químicas
- descrever os cálculos e modelagem das funções de distribuição dos tempos de residência

M&M, results and discussion – Chapter 4: Materials and methods
Table of contents
4.1. Pilot vacuum evaporator ................................................................................................ 61
4.2. Pilot instrumentation ...................................................................................................... 64
4.2.1. Acquisition .............................................................................................................. 64
4.2.2. Additional instrumentation ....................................................................................... 67
4.3. Calibration of the vacuum evaporator sensors ............................................................... 69
4.3. Experimental runs .......................................................................................................... 69
4.4. Physicochemical analyses ............................................................................................. 71
4.4.1. Total solids ............................................................................................................. 71
4.4.2. Viscosity measurement ........................................................................................... 71
4.4.3. Density measurements ........................................................................................... 72
4.4.4. Conductivity ............................................................................................................ 72
4.4.5. Protein composition ................................................................................................ 72
4.4.6. Ash content ............................................................................................................. 73
4.4.7. Calcium concentration ............................................................................................ 73
4.5. Mass and enthalpy balance ........................................................................................... 73
4.6. Overall heat transfer coefficient ..................................................................................... 76
4.7. Assessment of process efficiency .................................................................................. 77
4.8. Characterization of the flow ............................................................................................ 77
4.9. Residence time distribution functions ............................................................................. 78
4.9.1. Measurement of residence time distribution ............................................................ 78
4.9.2. Model of the residence time distribution functions ................................................... 81

M&M, results and discussion – Chapter 4: Materials and methods
4.1. Pilot vacuum evaporator
A pilot scale, single stage falling-film evaporator (GEA Process Engineering, St Quentin-
en-Yvelines, France; Fig. 4.1) was used for the characterization of the vacuum evaporation
process. From the hydrodynamic point of view, the working of this equipment is close to that
used in the dairy industry, i.e. the product falls in a trickling film along the inner wall of the
evaporator tube, with indirect counter-flow contact with primary steam. The equipment consists
of three evaporation tubes connected in series (Fig. 4.1), whose the dimensions are shown in
Table 4.1.
Figure 4.1. Flowsheet of the evaporator.
VP: Vacuum pump
SEP: Separator and indirect condenser
CP: Centrifugal pumps
Condensates
Liquid
Vapor
Steam
Non condensable gas
VP
T1 T2 T3
CP
CP CP CP
CP
SEP

M&M, results and discussion – Chapter 4: Materials and methods
Table 4.1. Dimensions of the inner side of the three tubes (T1, T2 and T3) in the falling-
film evaporator. Wall thickness of each tube is 1 mm.
Tube D (m) h (m) A (m2)
T1 0.036 4.0 0.452
T2 0.023 4.0 0.289
T3 0.023 4.0 0.289
Total
1.030
Legend: D= diameter; h= height; A= heating surface
The inlet product, concentrate and condensate are circulated by means of five circulation
pumps (Fig. 4.1 - CP) (Pompes AB, Maurepas, France) with the same characteristics
(centrifugal type, 0.7 kW).
Each evaporation tube is thermally insulated and has an independent electrical heating
system (Fig. 4.2) that provides the vaporization energy. As the vapor emitted by the product
(secondary vapor) is not used for heating the product in the next tube, this pilot is a single stage
evaporator. A level sensor (Fig. 4.2) is used to inject water at maximum temperature of 20°C into
the heating systems when the level of water is below the sensor. The aim of this sensor is to
ensure that the electric resistances are always immersed in water. The production of steam in
this equipment is therefore discontinuous, because from the moment that water is inserted the
temperature of the steam side decrease and therefore steam production ceases. The steam
production is reestablished when water is heated to steam vaporization temperature. Water can
be inserted manually or automatically through a water injection electro valve (Burkert, Triembach

M&M, results and discussion – Chapter 4: Materials and methods
au Val, France). When automatically injection was set the time of water injection is around 30
min of the process time, against around 60 min of process time for manually injection.
Concentration of the solutions was performed at a total heating power of 25.20 ± 0.05 kW
(8.40 ± 0.02 kW for each tube), corresponding to the maximum heating power of the equipment.
Figure 4.2. Evaporation tube with independent electrical heating system.
The secondary vapor of the three evaporation tubes are separated in a separator with an
integrated indirect condenser (coil-type heat exchanger) (Fig. 4.3). As the secondary vapor
(product vapor) is condensed in the condenser, the pressure in the system is reduced (Ptotal <
0.1 MPa), which leads to a decrease of the evaporation temperature. The experiments were
performed at an absolute pressure (Pabs) of 0.02 MPa and thus the evaporation temperature ( ev)
Steam side
Product side
Inlet steam
Electrical resistance
Condensate Steam
Non-condensable gas and Excess of steam
(diameter of the section 4mm)
Water Sensor level

M&M, results and discussion – Chapter 4: Materials and methods
was maintained at 60°C throughout the three tubes. This temperature was the most commonly
used for concentration of milk in the first stage of industrial vacuum evaporators. The
temperature is controlled by the mass flow rate of the cooling water (ranging between 300 kg·h-1
to 800 kg·h-1) at a maximum temperature of 20°C. A vacuum pump (Fig. 4.3) (liquid ring type,
1.1 kW power consumption) connected to the condenser is required for the starting phase and to
extract the non-condensable gases, which would otherwise accumulate in the condenser.
Figure 4.3. Separator integrated with indirect condenser.
4.2. Pilot instrumentation
4.2.1. Acquisition
The initial configuration of the pilot had fifteen temperature probes, one pressure sensor
and three flowmeters, as well as one data acquisition system (Endress Hauser, Huningue,
France). Fig. 4.4 shows the position of these sensors.
Inlet cooling water
Outlet cooling water
Product vapor
Condensate
Non-Condensable gas
VP: vacuum pump
VP Non-condensable steam

M&M, results and discussion – Chapter 4: Materials and methods
Temperature probes: Three
Figure 4.4. Initial configuration of the evaporator.
Temperature probes (Endress Hauser, Huningue, France) were used to record the
temperatures of the product at the bottom of each tube, inlet and outlet steam, condensate
steam, and inlet and outlet cooling water. The flow rate of the inlet product, concentrate and
cooling water were measured with an electromagnetic flowmeter (Krohne, Romans Sur Isere,
TP1
TSout1
TCWin
TCWout
F0
F3
P
F0, F3 and FCW: Flowmeters of inlet product, outlet concentrate and cooling water
TS01, TS02 and TS03 Inlet steam temperature probes
TSCd1, TSCd2 and TSCd3: Steam condensate temperature probes
TP1, TP2 and TP3: Product temperature probes
TSout1, TSout2 and TSout3: Outlet steam temperature probes
TCWIn, TCWOut: Inlet and outlet cooling water temperature probes
P: Pressure sensor
TS01
TSCd1
FCW
TS02 TS03
TSCd2 TSCd3
TP2 TP3
TSout2 TSout3

M&M, results and discussion – Chapter 4: Materials and methods
France). The pressure was measured with a pressure sensor (Endress Hauser, Huningue,
France) in the condenser, which has the same pressure inside the evaporator tubes.
The product enters at the top of the evaporator tubes and it is dispersed by a plate
distributor (Fig. 4.5). The aim of this piece is to ensure that a complete film, with thickness
around 1.0 mm to 1.5 mm, is maintained inside the tubes throughout the process time.
Figure 4.5. Plate distributor.
Inlet product (5 mm)
Plate distributor 10 mm
55 mm
90 mm
130 mm
34 mm
DTube
90 mm

M&M, results and discussion – Chapter 4: Materials and methods
4.2.2. Additional instrumentation
Some modifications were made on the pilot to improve its instrumentation and to obtain
more data about the working of the equipment. Two flowmeters (electromagnetic type - Krohne,
Romans Sur Isere, France) and three conductivity probes (Endress Hauser, Huningue, France)
were added. A cone-shaped concave distributor system (Fig. 4.6) was also built (to ensure that a
complete film was maintained inside the tubes at all times), and a heat exchanger was added in
the product inlet line. Fig. 4.7 shows the first evaporator tube with all installed sensors. Aside
from the preheater, the other two tubes have the same sensors in similar positions.
Figure 4.6. Cone-shaped concave distributor.
Inlet product (5 mm)
Concave distributor
130 mm
34 mm
55 mm
90 mm
15 mm
DTube
90 mm

M&M, results and discussion – Chapter 4: Materials and methods
Figure 4.7. Instrumentation of the first evaporator tube.
Pre
heat
er
Fin: Product inlet flowmeter
FoutT1: Product outlet flowmeter
TSinT1: Inlet steam temperature probe
TSCdT1: Steam condensate temperature probe
TSoutT1: Outlet steam temperature probe
TPT1: Product temperature probe
SPT1: Product conductivity probe
Fin
FoutT1
TSinT1
TSCdT1
TSoutT1
TPT1 SPT1

M&M, results and discussion – Chapter 4: Materials and methods
4.3. Calibration of the vacuum evaporator sensors
Temperatures, conductivity probes and flowmeters were calibrated when these sensors
were installed. The temperature probes were calibrated at two temperatures, 0°C and 80°C. The
difference between the reference and the acquisition temperatures was always less than 0.5°C.
For calibration of the flowmeters, the volume flow rate of water measured by the control panel
system was compared with the mass flow rate measured with a graduated test tube and a
chronometer. As the conductivity of the solutions studied was in the order of 0.01 mS·cm-1 to
100 mS·cm-1, the conductivity probes were calibrated with a standard solution (Hanna
Instruments, Inc., Tanneries, France) with conductivity between 0.05 and 200 mS·cm-1. The
correlation coefficient (R2) between the measured and the calculated flow rate and conductivity
was greater than 0.99.
4.3. Experimental runs
Experimental runs were carried out with water, skim milk, sweet whey and lactic acid
whey.
Skim milk was reconstituted from low heat skim milk powder (Lactalis ingredients,
Bourgbarré, France). Fresh concentrated sweet whey and lactic acid whey were obtained from
an industrial cheese manufacturer in Brittany (France). Before entering the evaporator the
products were preheated to the evaporation temperature in a jacketed tank, at the initial
evaporator configuration, and in a tubular indirect preheater (Fig. 4.7) after the additional
instrumentation. When desired, after passing of the entire product through the three evaporation
tubes (Fig. 4.1) (first run – 1R), the entire volume of the product obtained at the end of the first
run (still at the evaporation temperature) was reintroduced into the equipment and re-
concentrated a second time, again passing through the three evaporation tubes (second run –
2R). This operation could be performed once more (third run – 3R).

M&M, results and discussion – Chapter 4: Materials and methods
The vacuum evaporator was divided in four different sections (Fig. 4.8). corresponds
to the section from the feed to the bottom of the first tube; the section from the bottom of the
first tube to the bottom of the second tube; the section from the bottom of the second tube to
the bottom of the third tube; and the section from the feed to the evaporator outlet.
Figure 4.8. Sampling points for determination of local and overall RTD. :
measurement from inlet to outlet of tube 1; : measurement from outlet of tube 1 to outlet of
tube 2; measurement from outlet of tube 2 to outlet of tube 3; : overall RTD measurement
from inlet to outlet of the falling film evaporator.
T1
Feed
T2 T3
Outlet 11.08 m 12.24 m 12.96 m
36.28 m

M&M, results and discussion – Chapter 4: Materials and methods
4.4. Physicochemical analyses
4.4.1. Total solids
The feed and final total solids content (TS) were calculated according to weight loss after
drying 5 g of each sample with sand in a forced air oven at 105 °C for 7 h.
Due the low pressure of the process, it was not possible take a sample of the product at
the bottom of the first and second tube without affecting the process parameters (decrease in
the pressure process, product flow rate, temperature, etc.). Therefore the TS were calculated at
these two points (mass balance) as:
TS = i i· i i i Eq. 4.1
where m i is the inlet mass flow rate of the product in tube i, TS i corresponding to the
total solids of the inlet product at the bottom of tube i, and m i corresponding to the outlet
mass flow rate of the product in tube i.
4.4.2. Viscosity measurement
Viscosity measurements were obtained at the evaporation temperature with a Physica
MCR 301 rheometer (Anton Paar, Graz, Austria) using a coaxial aluminum cylinder (inner radius
23.05 mm; outer radius 25 mm; height of rotor 30 mm; gap 5 mm). Shear rates between 10·s-1
and 1000·s-1 at the evaporation temperature were used for rheological determinations. As the
solutions studied behave as a non-Newtonian fluid at high concentrations, apparent viscosity at
a shear rate of 100·s-1 ( 100) was used to make comparisons between the different products.
This shear rate value was chosen because it is representative of the value reached in agitation,
flow in tubes and other industrial operations (Steffe, 1996). As it was not possible to take
samples at the bottom of T1 and T2, calibration curves of apparent viscosity were obtained ( 100)
as a function of product total solids (Fig. 4.9).

M&M, results and discussion – Chapter 4: Materials and methods
Figure 4.9. Skim milk apparent viscosity ( 100) measured at 60°C in function of total
solids contents.
4.4.3. Density measurements
A Mettler-Toledo densimeter DE40 (Mettler-Toledo, Columbus, USA) was used to
determine the density of the products at 60°C. The product density was used to convert the
liquid flow rate (measured by the flowmeters) to mass flow rate.
4.4.4. Conductivity
The conductivity of the product was measured and recorded every second at the bottom
of the three tubes (Fig. 4.7 (SP)) by conductivity-meter (Endress Hauser SAS, Huningue, France).
4.4.5. Protein composition
Non-casein nitrogen (NCN) and non-protein nitrogen (NPN) fractions were determined by
the Kjeldhal method (IDF, 1993). Nitrogen content was converted into equivalent protein content
using 6.38 as converting factor for NCN and NPN content, respectively. Whey protein content
(WPC) was calculated as WPC = NCN·6.38 − NPN·6.38.
y = 0,0002e0,0104x
R² = 0,9387
0
0,01
0,02
0,03
0,04
0,05
0,06
0,07
0,08
-50 50 150 250 350 450 550
Ap
pa
ren
t vi
sco
sity
(P
a·s
)
TS (g·kg-1)

M&M, results and discussion – Chapter 4: Materials and methods
4.4.6. Ash content
Ash content was determined by incinerating 5 g of the product in a muffle furnace at
550°C for 5 hours (IDF, 1964).
4.4.7. Calcium concentration
Calcium concentration was determined by atomic absorption spectrometer (Varian
220FS SpectrAA, Les Ulis, France) (Le Graët and Brulé, 1993).
4.5. Mass and enthalpy balance
Fig. 4.10 provides a diagram representing the mass flow rate and the physical
characteristics of the fluids in the evaporator. Each fluid is characterized by its mass flow rate (m
in kg·h-1), temperature ( in °C), pressure (P in MPa) and enthalpy (H in kJ·kg-1).

M&M, results and discussion – Chapter 4: Materials and methods
Figure 4.10. Thermodynamic diagram of a single stage vacuum evaporator.
As seen in Fig. 4.10, the overall mass balance was calculated as:
m − + m i + m i = mP + m + m + m Eq. 4.2
In this pilot equipment steam is produced in excess. A part of steam is therefore not used
for energy exchanges. This excess of steam goes to the condenser where it is condensed and
exits the equipment by the condensates line. The mass of water inserted in the heating systems,
therefore used to steam production, may be measured. After working during a given process
time without adding water in the heating systems, the mass of remaining water was calculated.
The difference between the mass of water inserted and remaining in the heating system is
therefore the mass of steam produced in excess. This part of steam is not used to the energy
m − H − Steam
m C
Cooling water
out mP C P P
Product
concentrate m C
Product
condensate
m i C i i Product
m C
Steam
condensate
m i C i
Cooling water In
Secondary vapor
Legend:
Cp = sensitive heat (kJ·kg-1·°C-1)
H = enthalpy of evaporation (kJ·kg-1)
= temperature (°C) � = mass flow rate (kg·h-1)

M&M, results and discussion – Chapter 4: Materials and methods
exchange, and it is therefore not taken into account in the mass and energy balances. Thus the
mass of the excess steam is not reported in this thesis. The non-condensable gases from the
steam (Fig. 4.1) were transferred to the condenser where they were removed from the system.
The mass flow rate of non-condensable gas was considered to be negligible, and therefore it
was not taken into account in the calculation of mass and energy balances.
At the outlet of the evaporator, the inlet mass flow rate of the product was a combination
of the mass flow rate of product concentrate and the mass flow rate of secondary vapor that was
finally converted in product condensate (Fig. 4.10).
m i = mP + m [4.3]
As the condenser was an indirect heat-exchanger, there was no mixing of the
condensate and cooling water. Therefore:
m i = m [4.4]
As the steam entering the evaporator tubes was saturated, it is supposed that its
condensation was complete and that all the steam was transformed into the condensate at
saturation temperature. Therefore:
m − = m [4.5]
Thus, only the latent heat of vaporization was exchanged:
∆H = H − − H [4.6]
where H − and H are the enthalpy of evaporation (kJ·kg-1) of steam and its
condensate, respectively.

M&M, results and discussion – Chapter 4: Materials and methods
The heating power Q (kW) applied to the three tubes was used to the production of
saturated steam according to:
Q = m − ∙ ∆H [4.7]
Equation [4.7] thus makes it possible to calculate the mass flow rate of the steam, whose
pressure and temperature are known, as well as the heating power generated by the boilers.
Expressing heat loss as q , the enthalpy balance can be written:
m − ∙ H − + m i ∙ H i + m i ∙ H i = mP ∙ HP + m ∙ H + m ∙ H + m ∙ H + q [4.8]
Where q comprises the rate of energy losses and error of measurements and
calculation.
By substituting Equations [4.4], [4.5] and [4.6] in Equation [4.8]:
m − ∙ ∆H = mP ∙ HP + m ∙ H − m i ∙ H i )
+m ∙ (H − H ��) + q [4.9]
The left term of equation 4.9 corresponds to the heating power Q provided by the steam,
i.e. the energy provided by the heating system of the evaporator.
4.6. Overall heat transfer coefficient
The overall heat transfer coefficient for each tube was calculated as:
Q = � · A · ∆ Ф = Q A⁄ = � ∙ ∆ � = Ф ∆⁄ Eq. 4.10

M&M, results and discussion – Chapter 4: Materials and methods
where U is the overall heat transfer coefficient, kW·m-2∙°C-1; Q the heating power, kW; A
the heating surface, m2; ∆ the mean temperature difference between steam and product
concentrate, °C; and Ф the heat flux, kW·m-2.
The inlet steam temperature and the product temperature (Fig. 4.7 (TS0, TP)) were used
to the measurement of the Δ .
4.7. Assessment of process efficiency
The energy consumption for evaporation is a key parameter used to assess the
efficiency of a plant. As in drying, it can be evaluated from the Specific Energy Consumption
(SEC; kJ∙kg-1 of water evaporated) (Bimbenet et al., 2007), and from the energy efficiency (EE; %
- w·w-1), that is the ratio between the amount of water evaporated and the amount of steam,
expressed as a percentage. EE can also be represented as the ratio between the latent heat
vaporization of the steam and of the product. Due to the gradient of temperature between the
steam and the product the ratio will not be equal to 1. In an adiabatic process without energy
losses EE value is of the order of 99%. SEC and EE are defined by the following equations:
SEC = − ∙ ∆H Eq. 4.11
and
EE = − Eq. 4.12
4.8. Characterization of the flow

M&M, results and discussion – Chapter 4: Materials and methods
Flow was characterized using an experimental Reynolds number of the film (§ 2.4), and
the classification defined by Bird et al. (1960) that established the flow profiles for the falling film
in three regions was used:
Ref < 25: laminar flow;
25 < Ref < 1000: laminar flow with waves (wavy-laminar);
Ref > 1000: turbulent flow.
As Ref was always measured at the bottom of the evaporation tubes, the
characterization of the flow behavior in sections and was always the same, as both were
measured at the bottom of T3.
The maximum flow velocity, corresponding to the velocity of the first fluid elements that
arrived at the bottom of the evaporation tube, was calculated according to equation 4.13.
ν = i i Eq. 4.13
where ν is the maximum flow velocity and t the time that the first particles of
tracer take to cross a section of the evaporator equipment (Fig. 4.8).
4.9. Residence time distribution functions
4.9.1. Measurement of residence time distribution
RTD were determined experimentally by injecting an inert chemical, molecule or atom,
called a tracer, into a reactor at some time, t = 0, and then measuring the tracer concentration in
the effluent stream as a function of time. In this study, RTD characterization was based on the
follow-up of the concentration of sodium chloride added to the product. The product with 10 g·kg-
1 of sodium chloride was injected into the evaporator for 30 seconds (Fig. 4.11). The NaCl
remains soluble at the concentration used in this study (maximum concentration of 20 g·kg-1)

M&M, results and discussion – Chapter 4: Materials and methods
and its concentration did not affect the product viscosity (Huppertz and Fox, 2006), which is the
main parameter related to the product flow behavior (Ali Adib and Vasseur, 2008; Monnier et al.,
2012; Park et al., 2004). The time that the sodium chloride molecules and the product fluid
elements took in the evaporator equipment was therefore considered to be the same.
Figure 4.11. Tracer injection x(t) and output signal at bottom of T1 (y1(t)), T2 (y2(t)) and
T3 (y3(t)).
As the pilot operates as a continuous process, the products with and without the tracer
were put in two different tanks connected to the feed line with a three-way valve, which allowed
rapid change in the nature of the feed product. Using this technique the shape of the injection
signal could be considered to be a square.
The outlet sodium chloride concentration, measured indirectly by conductivity, was
calculated at the bottom of the three evaporation tubes. Calibration curves of product
conductivity in relation to product concentration were performed (Fig. 4.12). This was done for all
0
2
4
6
8
10
12
0 100 200 300 400
Na
Cl
(g·k
g-1
)
Time (s)
x(t) y1(t)
y2(t)
y3(t)

M&M, results and discussion – Chapter 4: Materials and methods
products in all concentrations obtained in this study. It was then possible to plot the sodium
chloride concentrations in the effluent stream as a function of time, (yi(t)) (Fig. 4.11).
Figure 4.12. Sodium chloride concentration as a function of conductivity: A: Skim milk at
200 g·kg-1 of total solids, B: Sweet whey at 363 g·kg-1 of total solids and C: lactic acid whey at
364 g·kg-1 of total solids.
The RTD signal (Ei(t)) was determined in the four different sections of the vacuum
evaporator (Fig. 3.8) by numerical deconvolution of the outlet signal (i.e. outlet concentration of
NaCl) by the injection signal (i.e. inlet concentration of NaCl). Due to the complexity of the
y = 0,0964x - 0,647
R² = 0,9993
0
0,2
0,4
0,6
0,8
1
1,2
1,4
1,6
5 10 15 20 25Na
Cl c
on
cen
tra
tio
n (
g·1
00
g-1
)
Conductivity (mScm-1)
A
y = 0,1427x - 2,2132
R² = 0,9983
0
0,2
0,4
0,6
0,8
1
1,2
1,4
1,6
13 18 23 28N
aC
l co
nce
ntr
ati
on
(g
·10
0 g
-1)
Conductivity (mS·cm-1)
B
y = 0,1627x - 2,901
R² = 0,9977
0
0,2
0,4
0,6
0,8
1
1,2
1,4
1,6
17 19 21 23 25 27Na
Cl c
on
cen
tra
tio
n (
g·1
00
g-1
)
Conductivity (mS·cm-1)
C

M&M, results and discussion – Chapter 4: Materials and methods
calculations performed, the MATLAB and Statistics Toolbox Release software (2014b, The
MathWorks, Inc., Natick, Massachusetts, United States) was used.
E (t) was calculated by numerical deconvolution of y1(t) with the injection signal (x(t)).
The sodium chloride concentration measured at the bottom of T1 (y1(t)) was the injection signal
for calculating E (t). E (t) was therefore calculated by numerical deconvolution of y2(t) with
y1(t). For E (t) the injection signal was y2(t), and thus E (t) was calculated by numerical
deconvolution of y2(t) with y3(t). (Eq. 4.14, 4.15 and 4.16). The overall RTD from the inlet to the
outlet of the evaporator (E (t)) was calculated by numerical deconvolution of yT3(t) by the
injection signal (x(t)) (Eq 4.17).
yT1(t) = x t ⊗ E (t) Eq. 4.14
yT2(t) = yT1(t) ⊗ E (t) Eq. 4.15
yT3(t) = yT2(t) ⊗ E (t) Eq. 4.16
yT3(t) = x(t) ⊗ E (t) Eq. 4.17
Having determined Ei(t) for the different sections of the vacuum evaporator, it was then
possible to determine both the residence time of each fluid element and the time at which a
certain fraction of the material entering at t = 0 was no longer present in the equipment. The
mean residence time, τ, corresponded to the time when 50% of the material entering at t = 0
passed through the equipment. In other words this parameter corresponded to the time for
recorded 50% of the inlet sodium chloride molecules at the outlet of the equipment.
4.9.2. Model of the residence time distribution functions
Different models were tested to model the RTD functions for the four different sections of
the falling film evaporator. Due to the changes in product composition during the vacuum

M&M, results and discussion – Chapter 4: Materials and methods
evaporation (i.e. increase in product viscosity and changes in the flow profile), the dispersion of
the particles in the equipment was more pronounced than in plug flow systems. Therefore the
RTD functions were modeled by a set of perfectly mixed reactor tanks in series in order to take
into account the flow profile in the evaporator. Each reactor set includes Ni reactor tanks in
series, and can be characterized by a mean residence time ( i). Its own RTD function is defined
by:
E t = Niτi Ni · iNi− · Ni· i τi⁄Ni− ! Eq. 4.18
The number of tanks in series, Ni, provides information about the dispersion of the fluid
elements: a high N value indicates low dispersion of the particles in the reactor (Gutierrez et al.,
2010).
Different arrangements of perfectly mixed reactor tanks in series were studied. For this
study the model of two reactor sets in parallel (Fig. 3.13) was the most effective to model the
experimental RTD functions. The product therefore was considered to pass through two reactor
sets, A and B, characterized by two RTD functions Ea(t) and Eb(t). Reactor set C was a
combination of these two reactor sets (Fig. 4.13). It was characterized by the function Ec(t),
which describes the experimental RTD of the falling film evaporator (Eq. 4.19).
E t = − a ∙ E t + a ∙ E � Eq. 4.19
where a refers to the fraction of feed flow rate going into reactor set A. The three
parameters of each reactor set (ai, τi and Ni) were adjusted step by step in order to fit the
modeled curve to the experimental curve.

M&M, results and discussion – Chapter 4: Materials and methods
Figure 4.13. Reactor tank sets in series used to model the RTD of FFE for the four
sections studied.
Model accuracy was evaluated by calculation of the standard deviation between the
model and experimental RTD curves.
Outlet Feed
Reactor set A
1 1
1 – a
a
Reactor set B
Reactor set C

M&M, results and discussion – Chapter 5: Investigation of effectiveness of evaporation
Chapter η PILOT SCALE INVESTIGATION OF EFFECTIVENESS OF
EVAPORATION OF SKIM MILK, WHOLE MILK AND WATER
The aim of the work reported in this chapter was to compare the effectiveness of a pilot
scale single stage falling film evaporator in the evaporation of water, skim and whole milk. Using
the acquisition instrumentation of the pilot and an inlet mass flow rate of 50 kg·h-1, initially no
significant variation (p < 0.05) in the evaporation rate or in the energy efficiency for two runs with
skim milk were found, but the values were higher than those obtained with the experiments with
water. The heat transfer coefficient did not differ according to the product and this result does
not explain why the evaporation of SM was more effective than that of water. The results of this
Chapter were published in Dairy Science and Technology1.
After additional instrumentation of the pilot, some problems were identified with the water
level sensor of the heating systems and the distributor system of the evaporator tubes. After
solving these problems and using the same operating conditions, the difference between the
effectiveness of evaporation of water, skim and whole milk was studied. No significant variations
were found (p < 0.05) in the evaporation rate or in the energy efficiency for the experiments with
water, skim milk (two runs – 83.0 g·kg-1 to 471.0 g·kg-1 of total solids), and during the first run of
whole milk (114 g·kg-1 to 265 g·kg-1 of total solids), but the values were lower in the second run
of the whole milk experiments (265 g·kg-1 to 545 g·kg-1 of total solids), where a poor wetting rate
was identified in the evaporator tubes. The experiments were then performed at an inlet mass
flow rate of 70 kg·h-1. No significant variations were then found (p < 0.05) in the evaporation rate
or in the energy efficiency for all runs and products.

M&M, results and discussion – Chapter 5: Investigation of effectiveness of evaporation
The appropriate instrumentation of the vacuum evaporation process allowed
identification and correction of the process problems and was necessary to keep an efficient
working of evaporators.
1 Accepted as: Silveira, A.C.P., Carvalho, A.F., Perrone, Í.T., Fromont, L., Méjean, S., Tanguy,
G., Jeantet, R., Schuck, P., 2013. Pilot-scale investigation of effectiveness of evaporation of
skim milk compared to water. Dairy Sci. Technol. 93, 537–549. doi:10.1007/s13594-013-0138-1
The main aims of this chapter are to:
- demonstrate how the process parameters could be used to characterize the evaporation process
- study the effectiveness of evaporation of water, skim and whole milk
- describe the enthalpy balance of the vacuum evaporation process

M&M, results and discussion – Chapter 5: Investigation of effectiveness of evaporation
Capítulo 5 INVESTIGAÇÃO EM ESCALA PILOTO DA CAPACIDADE DE EVAPORAÇÃO DE
LEITE DESNATADO, LEITE INTEGRAL E ÁGUA
O objetivo do trabalho descrito neste capítulo foi o de comparar a capacidade
evaporativa da água pura, leite desnatado e leite integral durante a concentração em um
evaporador piloto, único efeito, de película descendente. Utilizando a instrumentação da
aquisição do piloto e uma vazão mássica de alimentação de 50 kg·h-1, nenhuma diferença
significativa (p < 0,05) na capacidade evaporativa ou na eficiência energética para as duas
passagens de leite desnatado foram identificadas. No entanto esses valores foram superiores
aos obtidos pelos experimentos realizados com água pura. O coeficiente de transferência de
calor apresentou o mesmo valor para todos os produtos estudados, sendo que este resultado
não explica por que a capacidade evaporativa do leite desnatado foi superior ao da água pura.
Os resultados apresentados neste capítulo foram publicados na revista Dairy Science and
Technology1.
Após a instrumentação adicional do piloto foram identificados problemas com o sensor
de nível de água dos sistemas de aquecimento e com o sistema de distribuição de produto no
topo dos tubos de evaporação. Após a reparação destes problemas e utilizando os mesmos
parâmetros operacionais, a diferença entre a capacidade evaporativa da água pura, leite
desnatado e integral foi novamente estudada. Não houve diferenças significativas (p < 0,05)
entre a capacidade evaporativa e entre a eficiência energética para os experimentos realizados
com água, leite desnatado (duas passagens - 83,0 g·kg-1 a 471,0 g·kg-1 de sólidos totais), e
durante a primeira passagem do leite integral (114 g·kg-1 a 265 g·kg-1 de sólidos totais), mas
esses valores foram inferiores na segunda passagem dos experimentos realizados com leite
integral (265 g·kg-1 a 545 g·kg-1 de sólidos totais), onde uma molhagem ineficiente dos tubos de

M&M, results and discussion – Chapter 5: Investigation of effectiveness of evaporation
evaporação foi identificada. Os experimentos foram então realizadas a uma vazão mássica de
alimentação de 70 kg·h-1. Nenhuma diferença significativa foi encontrada (p < 0,05) na
capacidade de evaporativa ou na eficiência energética para todas as passagens e para ambos
produtos utilizados nesse estudo.
A adequada instrumentação do processo de evaporação a vácuo permitiu a identificação
e correção de problemas no processo de evapoção e foi necessária para manter um
funcionamento eficaz do evaporador.
Os principais objetivos deste capítulo são:
- demonstrar como os parâmetros operacionais do processo podem ser utilizados para caracterizar o processo de evaporação a vácuo
- estudar a capacidade evaporativa da água, leite desnatado e leite integral
- descrever os balanços entálpicos do processo de evaporação a vácuo

M&M, results and discussion – Chapter 5: Investigation of effectiveness of evaporation
Table of contents
5.1. Introduction ......................................................................................................................... 89
5.2. Materials and methods ....................................................................................................... 90
5.2.1. Pilot vacuum evaporator and experiments ................................................................... 90
5.2.2. Experimental runs ........................................................................................................ 90
5.2.3. Physicochemical analyses ........................................................................................... 91
5.2.4. Enthalpy characterization ............................................................................................. 92
5.2.5. Statistical analysis ........................................................................................................ 92
5.3. Results and discussion ....................................................................................................... 92
5.3.1. Mass balance ............................................................................................................... 92
5.3.2. Enthalpy balance ......................................................................................................... 93
5.3.3. Overall heat transfer coefficient .................................................................................... 95
5.4. Additional information ......................................................................................................... 97
5.4.1. Distributor system ........................................................................................................ 98
5.4.2. Water level sensor of the heating tubes ....................................................................... 99
5.4.3. Investigation of the effectiveness of evaporation after improvement of the pilot vacuum evaporator ........................................................................................................................... 101
5.5. Conclusion........................................................................................................................ 105

M&M, results and discussion – Chapter 5: Investigation of effectiveness of evaporation
5.1. Introduction
Evaporation is a process through which a liquid is brought to its boiling point by external
heating, transforming the solvent into vapor that escapes from the surface of the liquid. Such
thermal concentration is commonly used for liquid foods (i.e. milk, fruit juice and sugar solutions)
to manufacture products such as sweet condensed milk (Gänzle et al., 2008), “dulce de leche”
(Hentges et al., 2010), beet or cane sugar, fruit juice (Tonelli et al., 1990) and tomato sauce
concentrates (Runyon et al., 1991). Above all, it is an intermediate process in the production of
milk, buttermilk and whey powders (Schuck, 2002), infant formula (Zhu et al., 2011), protein
isolates (Onwulata et al., 2006), etc.
In order to reduce energy consumption and environmental impact, it is important that
evaporators operate at their maximum capacity, which is strongly dependent on the overall heat
transfer coefficient. This parameter cannot be considered as an intrinsic characteristic of the
evaporator, since it also depends on the nature of the product and on their flow conditions
(Mafart, 1991). The factors that control heat transfer in the evaporator tubes are important for
close monitoring of the evaporation process and for calculating the dimensions of evaporators
(Bouman et al., 1993; Jebson and Iyer, 1991).
As boiling and concentration take place inside the falling-film evaporator, the study of the
mechanisms is complex, because both occur simultaneously (Li et al., 2011; Pehlivan and
Ozdemir, 2012). Some studies of the evaporation process reported in the literature were carried
out on industrial evaporators. In this case, operating conditions such as the configuration of the
equipment and the quality of the raw materials were not controlled (Jebson and Iyer, 1991;
Jebson and Chen, 1997). In contrast, other studies on laboratory and pilot scales were carried
out using model solutions (water, sucrose solutions, etc.) (Luo et al., 2011; Prost et al., 2006)
and evaporation systems whose design had been modified from industrial evaporators in order
to separate phenomena and facilitate their understanding (Adib et al., 2009; Bouman et al.,

M&M, results and discussion – Chapter 5: Investigation of effectiveness of evaporation
1993). There is, therefore, only limited information on evaporator performance, i.e. the
performance of real evaporators working with real products over real concentration steps.
The aim of this study was to compare heat and mass balance using a pilot scale, single
stage vacuum falling film evaporator composed of three tubes in series, for the evaporation of
skim milk and water. This equipment was designed to study both phenomena (boiling and
concentration) occurring during the evaporation of dairy products. The experimental
effectiveness of evaporation were compared to theoretical effectiveness with no energy loss.
The investigation also involved calculation of the energy used by the evaporator, the overall heat
transfer coefficient for each run, and study of the factors influencing the evaporation rate of skim
milk compared to water.
5.2. Materials and methods
5.2.1. Pilot vacuum evaporator and experiments
The experiments were performed with the pilot scale, single stage falling-film evaporator
equipped with the acquisition sensors (described in Chapter 4.1).
All experiments were performed at the product inlet temperature of 60 °C, an absolute
pressure (Pabs) of 0.02 MPa, and thus the evaporation temperature ( ev) was maintained at 60 °C
throughout the three tubes. These experiments were taken in triplicate at ambient temperature.
5.2.2. Experimental runs
Experimental runs were carried out with water (maximum hardness of 80 mg CaCO3·kg-1)
and skim milk at two different initial concentrations. All experiments were performed at an inlet
mass flow rate of 50.0 ± 0.7 kg·h-1 and the results analyzed after 30 min of process time. This
short process time was chosen to evite fouling formation. The value of inlet flow rate was

M&M, results and discussion – Chapter 5: Investigation of effectiveness of evaporation
provided by the evaporator manufacturer as a good flow rate for milk concentration. It was
therefore used to characterize thermodynamically the evaporation process.
Skim milk was prepared at 100.0 g·kg-1 of total solids (TS) from dairy powder (Societé
Mayenne, Mayenne, France). It was heated to 60 °C before evaporation. The total process time
was around 60 min to avoid fouling formation from 200 kg of product. After the first run (1R)
through the evaporator, skim milk was concentrated from 100.0 g·kg-1 TS to 240.0 g·kg-1 TS.
This product, still at 60 °C, was reintroduced into the evaporator where it was re-concentrated
(second run (2R)) from 240.0 g·kg-1 TS to 520.0 g·kg-1 TS (Table 5.1).
Table 5.1. Evaporation rates for skim milk and water, showing inlet and outlet total solids
content and viscosities. Average (n=3) ± standard deviation.
Product Inlet / Outlet TS (g·kg-1)
Inlet / Outlet 100 (mPa·s)
Evaporation rate a (kg·h-1)
Error of mass balance b
(%)
Water - 0.47 / 0.47 23.5 ± 0.7 1.4
Skim milk first run 100.0 ± 0.5 / 240.0 ± 0.5 1.08 / 2.83 30.0 ± 0.7 1.6
Skim milk second run 240.0 ± 0.5 / 520.0 ± 1.5 2.83/ 23.81 30.0 ± 0.9 4.6
a: (m i − m )
b: [(m i − m + m · )] m i⁄
Legend: TS: total solids; 100: apparent viscosity
5.2.3. Physicochemical analyses
Viscosity and total solids were measured as described in chapter 4.4.1 and 4.4.2,
respectively.
Inlet mass flow rate = 50 kg·h-1 Heating power= 25.2 kW

M&M, results and discussion – Chapter 5: Investigation of effectiveness of evaporation
5.2.4. Enthalpy characterization
Mass and enthalpy balance, overall heat transfer coefficient and assessment of process
efficiency were calculated as described in chapter 4.5, 4.6 and 4.7, respectively.
5.2.5. Statistical analysis
Data were analyzed by regression analysis of variance using SAS (2008) software, at the
0.05 level of significance.
5.3. Results and discussion
5.3.1. Mass balance
The initial and final product concentrations before and after the run in the evaporator are
presented in Table 5.1. The viscosity of these solutions was also measured (Table 5.1). The
viscosity of water remained constant during evaporation, whereas the viscosity of skim milk
increased from 1.0κ mPa∙s to 2.κ3 mPa∙s during the 1R, and its behavior was Newtonian, i.e. its
viscosity remained constant whatever the shear rate. In the 2R run the viscosity increased from
2.κ3 mPa∙s at 240.0 g·kg-1 of TS to 23.κ1 mPa∙s at η20.0 g·kg-1 of TS. At this concentration, the
product had a shear thinning behavior, i.e. its viscosity decreased with increasing shear rate.
This behavior can be explained as a consequence of increasing the shear rate which induces
the asymmetric dispersed molecules to align themselves within the shear planes, causing the
frictional resistance to diminish (Tung, 1978; Velez Ruiz and Barbosa Canovas, 1997). The
mass balance of the process was effective for all experiments, with a maximum error of 4.6 %,
representing the difference between the inlet and outlet mass flow rates (Eq. 4.2). The
evaporation rate was calculated by subtracting the inlet flow rate of the product and the outlet
flow rate of the product concentrate. This parameter reflects the amount of water evaporated
from the product. There was no significant variation (p < 0.05) in the evaporation rate for the two
runs carried out with skim milk, and it was higher than that obtained for the experiments carried
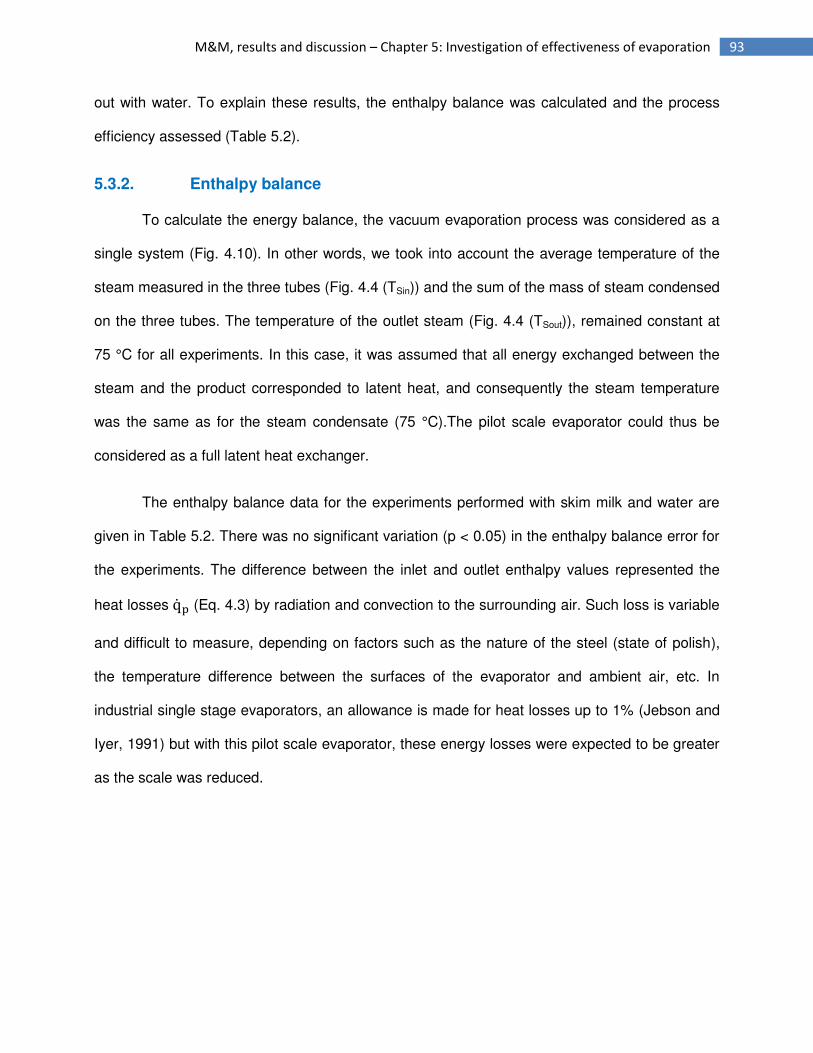
M&M, results and discussion – Chapter 5: Investigation of effectiveness of evaporation
out with water. To explain these results, the enthalpy balance was calculated and the process
efficiency assessed (Table 5.2).
5.3.2. Enthalpy balance
To calculate the energy balance, the vacuum evaporation process was considered as a
single system (Fig. 4.10). In other words, we took into account the average temperature of the
steam measured in the three tubes (Fig. 4.4 (TSin)) and the sum of the mass of steam condensed
on the three tubes. The temperature of the outlet steam (Fig. 4.4 (TSout)), remained constant at
75 °C for all experiments. In this case, it was assumed that all energy exchanged between the
steam and the product corresponded to latent heat, and consequently the steam temperature
was the same as for the steam condensate (75 °C).The pilot scale evaporator could thus be
considered as a full latent heat exchanger.
The enthalpy balance data for the experiments performed with skim milk and water are
given in Table 5.2. There was no significant variation (p < 0.05) in the enthalpy balance error for
the experiments. The difference between the inlet and outlet enthalpy values represented the
heat losses q (Eq. 4.3) by radiation and convection to the surrounding air. Such loss is variable
and difficult to measure, depending on factors such as the nature of the steel (state of polish),
the temperature difference between the surfaces of the evaporator and ambient air, etc. In
industrial single stage evaporators, an allowance is made for heat losses up to 1% (Jebson and
Iyer, 1991) but with this pilot scale evaporator, these energy losses were expected to be greater
as the scale was reduced.

M&M, results and discussion – Chapter 5: Investigation of effectiveness of evaporation
Table 5.2. Data of enthalpy balance for water and skim milk experiments performed at a
total heating power of 25.20 ± 0.05 kW. Average (n=3) ± standard deviation.
Run Q1
a (kW)
Qcwb
(kW) Energy Losses
c (%)
SECd (kJ·kg-1 of water) EEe (%)
Water 0.05 ± 0.00 23.64 ± 0.29 6% 3243 ± 102 70%
Milk first run 0.03 ± 0.00 23.40 ± 0.35 7% 3024 ± 93 79%
Milk second run 0.05 ± 0.00 23.64 ± 0.11 6% 2889 ± 97 81%
a: Q = m ∙ H + m ∙ H − m i ∙ H i
b: Q = m ∙ (H − H i )
c: Calculated according to Eq. 4.9
d: Calculated according to Eq. 4.11
e: Calculated according to Eq. 4.12
Legend: SEC: specific energy consumption; EE: energy efficiency.
As previously explained, SEC (Eq. 4.11) is a parameter used to evaluate the economic
aspects of concentration: the higher the SEC, the greater the cost of the operation. With a single
stage evaporator operating at the evaporating temperature used in this study, an optimal value
of SEC of about 23ηκ kJ∙kg-1 would be expected without energy loss. For the experiments with
skim milk, there was no significant variation (p < 0.05) in the SEC and this value was lower than
the values obtained with water (Table 5.2), in agreement with the evaporation rate (Table 5.1).
Energy efficiency was calculated to provide a better evaluation of the process yield (Eq. 4.12).
This parameter can be interpreted as the percentage of energy gained from the steam which is
used for evaporating 1 kg of product. As expected from the SEC results, there was no significant
variation (p < 0.05) in the energy efficiency (EE) for the experiments with skim milk, and it was
higher than the values obtained for the experiments with water. The average values of the EE
Inlet mass flow rate = 50 kg·h-1

M&M, results and discussion – Chapter 5: Investigation of effectiveness of evaporation
were close to 80 % for experiments with skim milk and 70 % for experiments with water (Table
5.2), the difference from 100% (in a theoretical one stage vacuum evaporator) corresponding to
the environmental heat lost, product elevation boiling point, wall thermal resistance, etc..
Experiments conducted with water at other heat fluxes showed similar energy efficiency values,
demonstrating that the energy from the steam is always produced in excess in this pilot
evaporator, thus leading to a lower energy yield.
5.3.3. Overall heat transfer coefficient
To complement and confirm the results obtained, the overall heat transfer coefficient for
each tube and for all three products was calculated. The results are shown in Table 5.3.
Table 5.3. Calculated values of heat transfer coefficient and operating parameters for
each tube of the vacuum evaporator. Average (n=3) ± standard deviation.
Product Tube N° Ф (kW·m-2)a ∆ (°C)b U [kW·m-2·°C-1]c
Water
1 18.6 15.1 ± 0.4 1.23 ± 0.04
2 29.1 15.3 ± 0.4 1.90 ± 0.03
3 29.1 15.7 ± 0.4 1.85 ± 0.04
Skim milk – 1st run
1 18.6 15.0 ± 0.4 1.24 ± 0.03
2 29.1 15.0 ± 0.3 1.94 ± 0.02
3 29.1 15.1 ± 0.3 1.93 ± 0.03
Skim milk – 2nd run
1 18.6 14.9 ± 0.3 1.25 ± 0.02
2 29.1 14.8 ± 0.3 1.96 ± 0.02
3 29.1 14.6 ± 0.3 2.00 ± 0.02
a and c: Calculated according to Eq. 4.10
b: − −
Legend: Ф: heat flux; ∆ : temperature difference; U: overall heat transfer coefficient.
Inlet mass flow rate = 50 kg·h-1 Heating power= 25.2 kW

M&M, results and discussion – Chapter 5: Investigation of effectiveness of evaporation
The heating power used in this process was 8.40 ± 0.02 kW for each tube. The diameter
of the first tube was greater than the other two (36 mm versus 23 mm). The heat flux in the first
tube, calculated according to Eq. 4.10, was therefore lower than in the other tubes. The
temperature difference between the steam and the product was the same for all the products (p
< 0.05). This temperature gap was greater than that applied industrially, which is generally less
than 10 °C (Adib et al., 2009).
The overall heat transfer coefficient (U), calculated according to Eq. 4.10, was the same
(p < 0.05) in the first tube for all products (Table 5.3), i.e. an average value of 1.24 kW·m-2·°C-1,
whereas it was close to 1.96 kW·m-2·°C-1 in the other two tubes. Jebson and Chen (1997)
obtained values of U between 0.8 kW·m-2·°C-1 and 3.08 kW·m-2·°C-1 for whole milk measured
from several milk powder factories; Jebson and Iyer (1991) found values of U between 2.00
kW·m-2·°C-1 and 3.50 kW·m-2·°C-1 for skim milk concentrated in five-effect evaporators; Prost et
al. (2006) reported values of U between 2.08 kW·m-2·°C-1 and 2.40 kW·m-2·°C-1 for water
evaporated in the first effect of a third-effect evaporator.
In these experiments, the heat transfer coefficient was the same for the same operating
conditions (Φ, ∆ , Pabs) whatever the product. This result does not explain why the evaporation
rate of skim milk was greater than that of water (Table 5.1). It is emphasized that the inverse of
U is overall resistance resulting from the addition of four resistance levels in a series, where the
limiting resistance is generally the value on the product side between the wall and the
evaporated liquid, especially at high concentrations (Jebson and Iyer, 1991; Jebson and Chen,
1997). This value depends on several factors:
Physical properties of the product treated (viscosity, p, density, ρp, surface
tension, p, etc.),

M&M, results and discussion – Chapter 5: Investigation of effectiveness of evaporation
Process conditions (heat flux, Ф, temperature difference, ∆ , boiling temperature,
p...)
Nature and geometry of the heating surface, (roughness R, etc.).
These three types of parameter influence the values of the heat transfer coefficient of the
product side and therefore the values of U.
Thus the behavior of a product and the efficiency of the evaporation process (SEC,
evaporation rate, etc.) cannot be predicted with only its overall heat transfer coefficient.
It should be remembered that the evaporation rate is related to the operation conditions
(e.g., distribution system, heat flux, etc.) (Morison et al., 2006) and product characteristics, such
as viscosity and surface tension (Morison et al., 2006; Paramalingam et al., 2000; Pehlivan and
Ozdemir, 2012). Moreover, product viscosity has an impact on the thickness and the residence
time distribution of the thin falling film. The flow behavior of the product throughout the
evaporator is modified according to its viscosity: a thicker and slower thin film should be formed
at the end of the skim milk concentration process compared to water. Therefore the higher level
of viscosity might result in a longer residence time of the product in the evaporator and thus a
longer time when the product would receive the evaporation energy, thereby increasing the
evaporation rate.
5.4. Additional information
An additional instrumentation of the evaporation pilot was performed to improve
characterization and understanding of the evaporation process (§ 4.2.2.). The pilot equipment
could thus be divided into four different sections (Fig. 4.8), where the evaporation rate of each
tube could be assessed (since the inlet and outlet product flow rate of each tube could be
measured). With the new information some problems were identified in performing the

M&M, results and discussion – Chapter 5: Investigation of effectiveness of evaporation
experiments, such as a lower wetting rate of the tubes and poor regulation of the water level
sensor of the heating system.
5.4.1. Distributor system
The plate distributor system (Fig. 4.5), located at the top of the evaporator tubes, did not
disperse the water homogeneously (Fig. 5.1 (A)), and therefore a film breakdown (Fig. 2.14)
occurred. Since product film formation did not take place uniformly throughout the evaporator
tube, the efficiency of the process decreased. The poor wetting rate of the tubes led to the
formation of dry patches in the tubes (Fig. 2.14), and this phenomenon thus contributed to loss
in the heat transfer surface. The plate distributor system was then changed to a cone-shaped
concave distributor (Fig. 4.6). The water dispersion was more effective with the new distributor
system (Fig. 5.1 (B)). Dispersion of skim milk with the plate distributor was better than water
dispersion (Fig. 5.1 (C)), possibly related to differences in product properties, especially surface
tension and viscosity.

M&M, results and discussion – Chapter 5: Investigation of effectiveness of evaporation
Figure 5.1. Dispersion of water and skim milk with the two distributor systems. (A) plate
distributor with water, (B) plate distributor with skim milk at 120 g·kg-1 total solids and (C) cone-
shaped concave distributor with water.
5.4.2. Water level sensor of the heating tubes
The water level sensor of the three heating systems (Fig. 5.2) was poorly regulated. A
delay of a few seconds in closing the water injection electro valve occurred when fills the heating
A
C
B

M&M, results and discussion – Chapter 5: Investigation of effectiveness of evaporation
systems and an excess of water was therefore injected into the heating system. This excess
flowed to the steam side of the evaporator tubes, thus decreasing the heat transfer surface (Fig.
5.2). This problem occurred mainly in the first evaporator tube.
Figure 5.2. Evaporator tube showing the water sensor level and the loss of heat transfer
surface due the excess water injected into the heating system.
The experiments with skim milk and water were always performed on the same day, in
order to retain the same ambient conditions (same room temperature) and always with water
prior to milk. The heating systems were filled with water at the beginning of the experiments and,
due to the problem with the water level sensor, a loss of heat transfer surface occurred (Fig. 5.2).
Maximum heat transfer surface
Water level sensor
Loss of heat transfer surface
Excess of inlet water

M&M, results and discussion – Chapter 5: Investigation of effectiveness of evaporation
As steam is always produced in excess in this pilot equipment, a part of the steam goes
to the condenser (Fig. 4.1). This mass was calculated experimentally as 1.77 kg·h-1 of excess
steam produced by each heating system, i.e. not used to exchange energy. This steam mass
was not used in the calculation of the energy balance. The steam produced in excess was thus
condensed in the condenser and extracted by the condensate evacuation pump (Fig. 4.1). A
decrease in the water level in the heating system and an increase in the used heat transfer
surface therefore occurred over time. The evaporation rate thus increased in relation to the
process time, and the heat transfer surface for skim milk experiments was greater than for water
experiments (since the experiments with milk were always carried out after water experiments).
These two factors, i.e. poor distribution of water in the evaporator tubes and higher heat
transfer surface for skim milk experiments, together explain the lower evaporation rate of water
compared to skim milk.
5.4.3. Investigation of the effectiveness of evaporation after improvement of
the pilot vacuum evaporator
After regulation of the water level sensor, change in the distributor system and use of
manual injection of water into the heating systems, a new characterization of the evaporator
process was undertaken. Solutions of water, fresh skim milk and whole milk (26 g·kg-1 fat
content) were studied to validate the difference in the effectiveness of evaporation. The effects
of the inlet mass flow rate of the product at 50 kg·h-1 and 70 kg·h-1 were also studied. All other
operating parameters of the evaporation process were kept constant.
The initial and final product concentrations before and after the runs in the evaporator are
presented in Table 5.4.

M&M, results and discussion – Chapter 5: Investigation of effectiveness of evaporation
Table 5.4. Evaporation rates for skim milk, whole milk and water at two different inlet
mass flow rates. Total heating power of 25.20 ± 0.05 kW.
Mass flow rate Product Inlet / Outlet TS (g·kg-1)
Evaporation rate a
(kg·h-1)
50 kg·h-1
Water - 26.9 ± 1.5
Skim milk first run 83 / 210 27.7 ± 1.7
Skim milk second run 210 / 471 26.6 ± 2.3
Whole milk first run 114 / 265 27.9 ± 1.4
Whole milk second run 265 / 545 25.4 ± 1.5
70 kg·h-1
Water - 27.4 ± 1.7
Skim milk first run 90 / 152 27.9 ± 1.5
Skim milk second run 152 / 256 28.3 ± 1.4
Skim milk third run 256 / 428 27.7 ± 2.3
Whole milk first run 113 / 188 27.2 ±1.6
Whole milk second run 188 / 312 27.1 ± 1.2
Whole milk third run 312 / 513 27.2 ± 1.3
a: calculated as: (m i − m )
TS = total solids
For the experiments performed at an inlet mass flow rate of 50 kg·h-1, skim milk (SM) and
whole milk (WM) were concentrated in two runs in the evaporator, reaching final concentrations
of 471 g·kg-1 and 545 g·kg-1 of TS, respectively.
There was no significant difference (p < 0.05) in the evaporation rates between the first
and second runs of skim milk, the first run of whole milk, and water experiments. Nonetheless
the second run of whole milk presented a lower evaporation rate (p < 0.05) compared to the
other solutions and runs studied.
The water evaporation rate calculated before and after the additional instrumentation of
the pilot evaporator increased from 23.5 ± 0.7 kg·h-1 to 26.9 ± 1.5 kg·h-1 (at the inlet mass flow
rate of 50 kg·h-1), reaching similar values to those of the skim milk experiments (27.2 ± 1.5 kg·h-1)

M&M, results and discussion – Chapter 5: Investigation of effectiveness of evaporation
under the same operating conditions. These results demonstrated that the difference in the
evaporation rate between water and skim milk, calculated before the additional instrumentation
and configuration of the equipment, was due to the problems with the water sensor level and the
distributor system.
There was no significant variation (p < 0.05) in the enthalpy balance error (Table 4.5) for
the experiments performed with water, the two runs of skim milk and the first run of whole milk,
although the value was higher in the second run of whole milk experiments. The lower
evaporation rate of the second run of whole milk might be explained by the poor wetting rate of
the tubes, which might cause a film breakdown (Fig. 2.14) and increase in energy loss.
Table 5.5. Data of enthalpy balance for water, skim milk and whole milk experiments
performed at a total heating power of 25.20 ± 0.05 kW, and two different inlet product mass flow
rates.
Inlet Mass Flow Rate Run Q1
a (kW)
Qcwb
(kW)
Energy Lossesc
(%)
SECd (kJ·kg-1)
EEe (%)
50 kg·h-1
Water 0.00 ± 0.00 19.7 ± 1.0 10.6 ± 0.6 2826 ± 48 83 ± 1
Skim milk first run -0.01 ± 0.00 20.1 ± 0.9 10.7 ± 2.0 2811 ± 63 83 ± 1
Skim milk second run - 0.01 ± 0.00 19.5 ± 0.8 11.7 ± 1.3 2965 ± 56 79 ± 2
Whole milk first run 0.01 ± 0.00 19.5 ± 1.1 11.1 ± 0.9 2735 ± 58 86 ± 2
Whole milk second run 0.03 ± 0.01 19.2 ± 1.3 13.8 ± 2.4 3011 ± 62 78 ± 2
70 kg·h-1
Water -0.01 ± 0.01 20.0 ± 0.9 10.2 ± 1.5 2815 ± 48 83 ± 1
Skim milk first run 0.00 ± 0.01 20.3 ± 0.8 9.0 ± 0.6 2770 ± 41 85 ± 1
Skim milk second run 0.01 ± 0.01 20.9 ± 0.9 8.8 ± 1.1 2784 ± 46 84 ± 1
Skim milk third run 0.03 ± 0.01 20.9 ± 0.7 7.3 ± 1.4 2749 ± 47 85 ± 2
Whole milk first run 0.00 ± 0.01 20.2 ± 0.9 8.1 ± 0.7 2784 ± 48 84 ± 1
Whole milk second run 0.01 ± 0.01 20.3 ± 0.9 9.4 ± 0.7 2828 ± 66 83 ± 2
Whole milk third run 0.04 ± 0.01 20.7 ± 0.8 8.0 ± 1.2 2838 ± 37 82 ± 1
a: Q = m ∙ H + m ∙ H − m i ∙ H i

M&M, results and discussion – Chapter 5: Investigation of effectiveness of evaporation
b: Q = m ∙ (H − H i )
SEC = specific energy consumption; EE = energy efficiency.
An increase in the inlet steam temperature was observed in the second run of whole milk
experiments (Fig. 5.3). A poor wetting rate of the inner surface of the tubes, and therefore dry
patches and fouling formation (§ 2.4) might be related to the temperature increase. The inlet
mass flow rate of 50 kg·h-1 was thus not sufficient to ensure a minimum wetting rate for the
surface of the tubes when the solution to be concentrated had a high viscosity/total solids values.
Figure 5.3. Inlet steam temperature in function of the process time for the experiments
with whole milk at inlet mass flow rate of 50 kg·h-1.
To ensure a minimum wetting rate of the three evaporation tubes the experiments were
performed at an inlet mass flow rate of 70 kg·h-1, where the solutions of skim and whole milk
were concentrated in three runs in the evaporator. As the heating power was constant for the
two inlet mass flow rates studied (25.20 ± 0.05 kW), the evaporation rate for all solutions and
60
62
64
66
68
70
72
74
76
78
0 20 40 60 80 100 120
Inle
t st
ea
m T
em
pe
ratu
re (
°C)
Process time (min)
1st
2nd
3rd
T1
T2
T3

M&M, results and discussion – Chapter 5: Investigation of effectiveness of evaporation
runs at 70 kg·h-1 was the same (p < 0.05) (27.4 ± 0.5 kg·h-1) as that of skim milk in the two runs,
whole milk in the first run and water at 50 kg·h-1.
Since there was no difference in the evaporation rate of any of the solutions studied at
the inlet mass flow rate of 70 kg·h-1, the increase in the inlet mass flow rate (50 kg·h-1 to 70 kg·h-
1) was effective to ensure a good wetting rate of the evaporator tubes.
The energy loss, SEC and EE were constan, (8.5 ± 1.2 %, 2795 ± 32 kJ·kg-1 and 89 ±
1 %, respectively), for all solutions and runs conducted at 70 kg·h-1.
5.5. Conclusion
The effectiveness of a pilot scale single stage falling-film evaporator for the evaporation
of water and skim milk was studied, for which a wide range of information was required, i.e.
information related to the operating conditions as well as information related to the product.
It was first demonstrated that the evaporation rate of skim milk was greater than that of
water in the same operating conditions. Certain conclusions were drawn to explain this
phenomenon, such as influence of product viscosity, product dispersion in the tubes, residence
time etc.
Some modifications were performed on the pilot evaporator to improve the understanding
of its working. These modifications revealed that there was no difference in evaporation rate
between the first and second runs of skim milk, water and first run of whole milk. The second run
of whole milk showed a lower evaporation rate, where a problem in the wetting rate of the tubes
was identified.
At the mass flow rate of 70 kg·h-1 there was no difference in the evaporation rate, energy
loss, SEC and EE for any of the solutions studied. This inlet mass flow rate showed sufficient
efficiency to ensure a good wetting rate of the evaporator tubes.

M&M, results and discussion – Chapter 5: Investigation of effectiveness of evaporation
Improve understanding of the process combined with suitable instrumentation of the
vacuum evaporator equipment proved to be effective in identifying and solving problems in this
process. Further studies of the evaporation process are needed to investigate the influence of
the product residence time distribution and the flow profile in order to improve the working and
understanding of evaporators.

M&M, results and discussion – Chapter 6: Flow regime assessment
Chapter θ
FLOW REGIME ASSESSMENT IN FALLING FILM EVAPORATORS
USING RESIDENCE TIME DISTRIBUTION FUNCTIONS
The aim of this chapter is to describe the flow regime, and characterize and model the
residence time distribution (RTD) functions of a falling film evaporator (FFE). Experimental runs
were carried out with skim milk at 60 kg·h-1, 70 kg·h-1 and 80 kg·h-1 and water at 70 kg·h-1 of
feed mass flow rates. Flow was characterized using experimental Reynolds number (Ref). The
RTD function in the FFE was measured in four sections of the vacuum evaporator equipment.
These RTD functions were modeled by a combination of perfectly mixed reactor tanks in series.
In this study, the turbulent and wavy-laminar flow regime had the same mean residence time,
otherwise when the flow regime changed from wavy-laminar to laminar, the mean residence time
increased. The flow was analyzed as a main and a minor retarded flow, where two layers of
product flowed through the evaporator tubes. The future of this work consists of extending the
RTD approach to other products and operating conditions in the evaporator device. The results
of this chapter were published in Journal of Food Engineering1.
1Silveira, A.C.P., Tanguy, G., Perrone, Í.T., Jeantet, R., Ducept, F., de Carvalho, A.F., Schuck, P., 2015. Flow regime assessment in falling film evaporators using residence time distribution functions. J. Food Eng. 160, 65–76. doi:10.1016/j.jfoodeng.2015.03.016
The main aims of this chapter were to:
- determine experimentally the RTD functions of a pilot-scale falling film evaporator
- model these RTD functions
- identify the flow regime of the process

M&M, results and discussion – Chapter 6: Flow regime assessment
Capítulo 6 DETERMINAÇÃO DO REGIME DE ESCOAMENTO EM EVAPORADORES DE
PELÍCULA DESCENDENTE UTILIZANDO FUNÇÕES DE DISTRIBUIÇÃO DOS
TEMPOS DE RESIDÊNCIA
O objetivo deste capítulo é descrever o regime de escoamento e de caracterizar e
modelar as funções de distribuição dos tempos de residência (DTR) de um evaporador de
película descendente (EPD). Ensaios experimentais foram realizados com leite desnatado a
vazão mássica de alimentação de 60 kg·h-1, 70 kg·h-1 e 80 kg·h-1 e com água a 70 kg·h-1. O
escoamento foi caracterizado usando o número de Reynolds experimental (Ref). A função DTR
foi medida em quatro diferentes seções do equipamento de evaporação a vácuo. Estas funções
foram modelizadas através de uma combinação de reatores em tanques perfeitamente agitados
em série. Neste estudo, o regime de escoamento turbulento e laminar-ondulado tiveram o
mesmo tempo de residência médio, no entanto quando o regime de escoamento alterou-se de
laminar-ondulado para laminar o tempo de residência médio aumentou. O escoamento foi
analisado como sendo duas camadas de produto fluindo uma sobre a outra através dos tubos
de evaporação. As perspectivas deste trabalho consistem em estender a abordagem de DTR
para outros produtos e condições operacionais do equipamento de evaporação. Os resultados
deste capítulo foram publicados na revista Journal of Food Engineering1.
Os principais objetivos deste capítulo são:
- determinar experimentalmente as funções de DTR de um evaporador de película descendente
- modelar as funções de DTR
- identificar o regime de escoamaento durante o processo de evaporação a vácuo

M&M, results and discussion – Chapter 6: Flow regime assessment
Table of contents 6.1 Introduction........................................................................................................................ 110
6.2. Materials and Methods ..................................................................................................... 112
6.2.1. Pilot vacuum evaporator ............................................................................................ 112
6.2.2. Experimental runs ...................................................................................................... 113
6.2.3. Physicochemical analyses ......................................................................................... 115
6.2.4. Characterization of the flow ........................................................................................ 115
6.2.5. Measurement of residence time distribution ............................................................... 115
6.3. Results and Discussion .................................................................................................... 115
6.3.1. Product and flow characterization .............................................................................. 115
6.3.2. RTD characterization ................................................................................................. 119
6.4. Additional information ....................................................................................................... 127
6.5. Conclusion........................................................................................................................ 129

M&M, results and discussion – Chapter 6: Flow regime assessment
6.1. Introduction
Concentration by vacuum evaporation is used to decrease the volume and weight of the
product, which subsequently reduces the cost of packaging, storage and transport and facilitates
the conservation of the concentrate by lowering the water activity ( Bouman et al., 1993; Prost et
al., 2006; Bimbenet et al., 2007). This process is used for the production of final (sweetened
condensed milk, evaporated milk, etc.) (Gänzle et al., 2008), and intermediate products before
any further operations such as crystallization, precipitation, coagulation or drying (infant formulae,
whey and milk powders, etc.) (Schuck, 2002; Bimbenet et al., 2007; Zhu et al., 2011).
Falling film evaporators (FFE) are widely used in the chemical and food industries for
their ability to process heat-sensitive products. The evaporator device is called "falling film"
because the liquid falls in a trickling film along the inner wall of the tube. This type of device
allows higher heat transfer coefficients, therefore lower residence times can be achieved in
comparison with other designs of evaporator (Bimbenet et al., 2007). However, industrial control
of this process often relies on an empirical understanding of the phenomena involved, which
then results in a time and cost consuming development phase to establish optimal operating
conditions when the final product quality must be changed or a new type of product processed.
As boiling and concentration occur simultaneously inside the FFE, the study of the
mechanisms is complex (Li et al., 2011; Pehlivan and Ozdemir, 2012); indeed, the rates of
enzymatic and chemical changes depend on solute concentration, product temperature and time,
and it is therefore necessary take into account these three parameters in order to control thermal
damage of constituents and process-dependent properties (product physicochemical properties
and product end-properties).
Moreover, the few scientific papers available on the topic of vacuum evaporation in food
and chemical domains mainly focus on the calculation and optimization of the heat transfer

M&M, results and discussion – Chapter 6: Flow regime assessment
coefficient (Chun and Seban, 1971; Mafart, 1991; Jebson and Iyer, 1991; Bouman et al., 1993;
Chun and Park, 1995; Jebson and Chen, 1997; Silveira et al., 2013), and there is a lack of
research and information concerning the characterization of the flow regime and of the residence
time distribution (RTD) functions of the product, E(t), during concentration in FFE. Moreover,
RTD is a powerful approach to characterizing the mixing phenomena and flow regime in
chemical reactor systems, which allows comparison with ideal reactors.
Determination of the product RTD is an overall and experimental approach which
provides valuable information about the product flow regime in the evaporator, according to the
operational conditions. It does not provide a good physical understanding of the operation as
computational fluid dynamics does but, on the other hand, it integrates the product and process
complexity fully.
Computational fluid dynamics (CFD) allow study of the consequences of modifications in
operating conditions (temperature, flow rate) and process configuration with regard to particle
characteristics (temperature, water content) and trajectories in the dryer (Ducept et al., 2002;
Verdurmen et al., 2002). Nevertheless a numerical simulation of a real evaporator process is not
accessible in practice: complex geometry (evaporation tubes, pipelines, pumps, etc.), presence
of water and vapor, pressure alterations, etc. The experimental CFD is too complex, and hardly
representative of the evaporation process. The experimental RTD allows, in a relatively simple
way, to have valuable information about the product and process complexity fully.
Since the pioneering work of Danckwerts (1953), the RTD theory has been widely
developed, and is nowadays used in a more general context in order to determine a population
balance model (Villermaux, 1982), where the basis of this model is that the number of entities
with certain properties in a system is a balanceable quantity. Such properties include, size, mass,
and age. RTD theory is also used to optimize the process in terms of capital and operation costs
(Malcata, 1991). The latter represent an essential step to managing and controlling the quality of

M&M, results and discussion – Chapter 6: Flow regime assessment
food products. Burton et al., (1959) applied the concept of RTD to food engineering in order to
calculate the sterilizing effectiveness of an UHT apparatus for milk processing. Baloh (1979),
showed that the loss of sugar in pasteurization and evaporation processes of various processing
schemes in the sugar industry could be significantly lowered by reducing the mean residence
time of sweet juice. Thor and Loncin (1978), established the mechanisms of rinsing (e.g. mass
flow rate and shear stress) of a plate heat exchanger by the measurement of RTD, and thereby
laid down the basis for optimizing rinsing equipment in food engineering. Jeantet et al. (2008),
calculated and modelled the RTD for different sections of a spray-dryer tower for skim milk, and
described the intensity of the heat treatment that the product was subjected to during this
process.
No studies have been published on the characterization and modeling of RTD in falling
film evaporators for concentration of food products. Understanding both RTD and kinetics of
product temperature along its flow in the equipment should pave the way for further prediction of
chemical changes (e.g. protein denaturation) that occur during this processing step. The aim of
this study was first to characterize RTD functions of a pilot falling film evaporator experimentally,
and then to model these RTD functions and identify the flow regime of the process.
6.2. Materials and Methods
6.2.1. Pilot vacuum evaporator
The experiments were performed with the pilot scale, single stage falling film evaporator
with the additional instrumentation (described in Chapter 4.2.2) without the preheater. The
product was heated at the evaporation temperature in a jacketed tank before entering the
equipment.
All experiments were performed at an absolute pressure (Pabs) of 0.02 MPa, and thus the
saturation temperature of evaporation was maintained at 60 °C throughout the three tubes.

M&M, results and discussion – Chapter 6: Flow regime assessment
6.2.2. Experimental runs
Experimental runs were carried out with skim milk at three different feed mass flow rates
(60 kg·h-1, 70 kg·h-1and 80 kg·h-1).
Skim milk was recombined at 100 g·kg-1 of total solids (TS) from skim milk powder
(Lactalis ingredients, Bourgbarré, France). It was concentrated in three runs in the evaporator
equipment. The inlet and outlet TS of skim milk concentrates at the bottom of the three
evaporations tubes for the three feed mass flow rates and runs studied are shown in Table 6.1.
The total process time was around 60 min to avoid fouling formation from 200 kg of product.
The conductivity of skim milk concentrates exceeding 520 g·kg-1 of TS could not be
measured reliably due to their high viscosity. Therefore, for the feed mass flow rate of 60 kg·h-1,
the TS of the product exiting the second run at 389 g·kg-1 (Table 6.1) were diluted to 283 g·kg-1
of TS and re-introduced into the evaporator for the third run. This dilution was undertaken to limit
the concentration to 520 g·kg-1 of TS at the end of the third run.
In total, 27 experiments were performed, at three feed mass flow rates and in three runs.
The experimental conditions are summarized in Table 6.1.

M&M, results and discussion – Chapter 6: Flow regime assessment
Table 6.1. Operational and skim milk properties at the bottom of each evaporation tube for the three feed mass flow rates and
runs studied. T1: Evaporation tube 1, T2: Evaporation tube 2, T3: Evaporation tube 3, 1R: first run, 2R: second run, 3R: third run.
Heating power of 25.20 ± 0.05 kW.
Feed mass flow rate 80 kg·h-1 70 kg·h-1 60 kg·h-1
Evaporation tubes T1 T2 T3 T1 T2 T3 T1 T2 T3
1R
Γ (kg·s-1·m-1) 0.170 ± 0.000 0.235 ± 0.000 0.199 ± 0.001 0.147 ± 0.001 0.192 ± 0.001 0.159 ± 0.000 0.125 ± 0.000 0.162 ± 0.001 0,127 ± 0.001
TS (g·kg-1) 108 ± 1 123 ± 4 145 ± 2 114 ± 2 133 ± 4 161 ± 2 123 ± 2 149 ± 5 195 ± 3
ρ (kg·m-3) 1024 ± 0.5 1031 ± 0.6 1040 ± 0.7 1027 ± 1.0 1035 ± 1.1 1047 ± 0.5 1031 ± 0.8 1042 ± 2.2 1062 ± 1.5
100 (10-3 Pa·s) 0.7 ± 0.1 1.0 ± 0.1 1.0 ± 0.1 0.7 ± 0.1 1.0 ± 0.1 1.1 ± 0.1 0.9 ± 0.0 1.0 ± 0.0 1.6 ± 0.1
Ref 971 940 796 891 844 643 555 648 317
2R
Γ (kg·s-1·m-1) 0.171 ± 0.000 0.238 ± 0.001 0.199 ± 0.001 0.148 ± 0.001 0.193 ± 0.000 0.159 ± 0.001 0.127 ± 0.000 0.163 ± 0.001 0.130 ± 0.000
TS (g·kg-1) 165 ± 3 187 ± 4 240 ± 3 188 ± 4 221 ± 5 264 ± 1 234 ± 4 290 ± 1 389 ± 5
ρ (kg·m-3) 1049 ± 0.8 1058 ± 1.7 1081 ± 0.5 1059 ± 1.8 1073 ± 2.1 1091 ± 0.9 1078 ± 1.5 1103 ± 1.4 1145 ± 2.1
100 (10-3 Pa·s) 1.2 ± 0.0 1.5 ± 0.0 2.6 ± 0.1 1.5 ± 0.0 2.1 ± 0.0 3.4 ± 0.1 2.5 ± 0.0 4.4 ± 0.0 12.3 ± 0.1
Ref 570 635 306 421 406 213 203 148 42
3R
Γ (kg·s-1·m-1) 0.177 ± 0.001 0.240 ± 0.000 0.206 ± 0.000 0.149 ± 0.000 0.197 ± 0.000 0.161 ± 0.001 0.128 ± 0.001 0.165 ± 0.000 0.138 ± 0.001
TS (g·kg-1) 254 ± 2 298 ± 3 350 ± 1 305 ± 4 365 ± 5 434 ± 6 331 ± 1 417 ± 2 516 ± 4
ρ (kg·m-3) 1087 ±0.9 1106 ± 1.5 1128 ± 2.3 1109 ± 1.1 1135 ± 0.9 1164 ± 1.6 1120 ± 1.8 1157 ± 1.6 1200 ± 0.7
100 (10-3 Pa·s) 3.0 ± 0.1 4.8 ± 0.0 5.9 ± 0.1 5.2 ± 0.1 9.6 ± 0.0 33.0 ± 0.1 6.7 ± 0.1 16.5 ± 0.0 68.3 ± 0.1
Ref 236 200 139 125 91 23 76 40 8
Γ = mass flow rate per unit circumference; TS = total solids; ρ = density; 100 = apparent viscosity at 100 s-1; Ref =
Reynolds number of the film.

M&M, results and discussion – Chapter 6: Flow regime assessment
6.2.3. Physicochemical analyses
Viscosity, total solids, density and conductivity were measured as described in chapter
4.4.1, 4.4.2, 4.4.3 and 4.4.4, respectively.
6.2.4. Characterization of the flow
Flow was characterized as described in chapter 4.8.
6.2.5. Measurement of residence time distribution
Residence time distributions functions were calculated and modeled as described in 4.9.
6.3. Results and Discussion
6.3.1. Product and flow characterization
Although the mass flow rate of product was higher in T1 compared to the other two tubes,
the value of Γ at the bottom of T1 was always lower than those at the bottom of T2 and T3 for
the same feed flow rate because of a higher inner diameter (0.036 m for T1 instead of 0.023 m
for T2 and T3 (Table 4.1)). As tubes T2 and T3 had the same diameter, Γ at these points
depended only on the mass flow rate of the product (Eq. 3.12). Due to evaporation, the mass
flow rate of the product at the bottom of T2 was always higher than that at the bottom of T3: ΓT2 >
ΓT3. For the experiments conducted at 80 kg·h-1, the Γ increased from 0.170 kg·s-1·m-1 to 0.177
kg·s-1·m-1 at the bottom of T1 / 1R and T1 / 3R, respectively (Table 6.1), evidencing a decrease
in the evaporation rate when the concentration of the inlet product increased from 108 g·kg-1 to
254 g·kg-1 of TS. Compared to other tubes and runs, the increase in the product concentration
caused an increase in the Γ, and therefore a decrease in the evaporation rate, as the
concentrate mass flow rate increased. These results are in agreement with those of (Morison
and Broome, 2014).

M&M, results and discussion – Chapter 6: Flow regime assessment
The concentration of the product at the bottom of the three evaporation tubes for the
three feed mass flow rates and runs studied is shown in Table 6.1. At 80 kg·h-1 the skim milk
concentration at the end of the third run of the evaporation process was 350 g·kg-1 compared to
434 g·kg-1 and 516 g·kg·g-1 at feed mass flow rates of 70 kg·h-1 and 60 kg·h-1, respectively. As
the evaporation parameters, and in particular the heating power, were kept constant (except for
the feed mass flow rate) the energy transferred to the product was the same, and therefore the
concentration of the product at the bottom of the evaporator tubes increased according to the
decrease in feed mass flow rate.
Density increased proportionately with TS of the skim milk concentrates, whereas
viscosity increased exponentially from approximately 365 g·kg-1 of TS, which is consistent with
the results of (Chong et al., 2009). The apparent viscosity, 100, of skim milk concentrate at 516
g·kg-1 of TS was 68.3·10-3 Pa·s. This value, that was higher than that found by (Silveira et al.,
2013), might be explained by the time that the product remained at 60°C before measurements.
Indeed at higher concentration, the viscosity of the milk concentrate increased with time, a
phenomenon known as age thickening (Westergaard, 2004). Thus the residence time of the
product during concentration in the FFE may affect the viscosity of the concentrate (Baldwin et
al., 1980). Viscosity is an important parameter to be monitored for optimal atomization in a
spray-dryer (Schuck, 2002; Westergaard, 2004).
The values of Ref are shown in Table 6.1. Ref varied between 971 and 8, points
corresponding to the maximum and minimum flow rates and product concentration at 80 kg·h-1
at bottom of T1 / R1 and at 60 kg·h-1 at the bottom of T3 / 3R. In this study, Ref decreased as the
product passed through the evaporation tubes, decreasing its flow rate and increasing its
viscosity. These two factors thus led to a lower Ref at the bottom of the third tube compared to
the first and second tubes for the same feed mass flow rate.

M&M, results and discussion – Chapter 6: Flow regime assessment
The flow regimes at the bottom of the evaporation tubes are presented in Table 6.2.
Almost all products presented a wavy laminar profile, except T3 / 3R at 70 kg·h-1 and 60 kg·h-1
for which a laminar flow was deduced from Ref.

M&M, results and discussion – Chapter 6: Flow regime assessment
Table 6.2. Flow behavior, average and minimum residence time of particles of skim milk in falling film evaporators. Measurements
performed at three inlet mass flow rates and three runs for each. 1R = first run, 2R = second run, 3R = third run. Heating power of
25.20 ± 0.05 kW.
Feed mass flow rate 80 kg·h-1 70 kg·h-1 60 kg·h-1
Section (Figure 2)
1R
tmin (s) 33 ± 1 44 ± 2 57 ± 1 134 ± 1 36 ± 1 52 ± 2 59 ± 2 146 ± 2 41 ± 2 51 ± 1 74 ± 2 171 ± 2
νmax (m·s-1) 0.33 ± 0.01 0.29 ± 0.01 0.23 ± 0.01 0.27 ± 0.02 0.31 ± 0.00 0.23 ± 0.00 0.22 ± 0.01 0.25 ± 0.02 0.27 ± 0.02 0.24 ± 0.01 0.17 ± 0.02 0.21 ± 0.02
(s) 54 ± 2 56 ± 2 72 ± 2 178 ± 2 55 ± 1 62 ± 2 73 ± 1 186 ± 1 67 ± 2 74 ± 2 95 ± 2 229 ± 2
Flow behaviour
W.L. W.L. W.L. W.L. W.L. W.L. W.L. W.L. W.L. W.L. W.L. W.L.
2R
tmin (s) 33 ± 1 43 ± 1 57 ± 2 133 ± 2 36 ± 2 52 ± 1 59 ± 1 145 ± 1 42 ± 1 50 ± 1 75 ± 1 175 ± 2
νmax (m·s-1) 0.33 ± 0.01 0.28 ± 0.01 0.23 ± 0.01 0.27 ± 0.02 0.31 ± 0.00 0.23 ± 0.00 0.22 ± 0.01 0.25 ± 0.02 0.26 ± 0.01 0.24 ± 0.02 0.17 ± 0.02 0.21 ± 0.02
(s) 53 ± 2 57 ± 2 72 ± 1 179 ± 1 54 ± 1 61 ± 1 73 ± 1 186 ± 1 68 ± 2 72 ± 2 94 ± 2 231 ± 2
Flow behaviour W.L. W.L. W.L. W.L. W.L. W.L. W.L. W.L. W.L. W.L. W.L. W.L.
3R
tmin (s) 32 ± 2 43 ± 1 58 ± 1 135 ± 2 36 ± 1 52 ± 1 60 ± 2 147 ± 2 42 ± 2 51 ± 1 76 ± 2 172 ± 2
νmax (m·s-1) 0.35 ± 0.01 0.28 ± 0.01 0.22 ± 0.01 0.27 ± 0.02 0.31 ± 0.00 0.23 ± 0.00 0.22 ± 0.01 0.25 ± 0.02 0.26 ± 0.01 0.24 ± 0.01 0.17 ± 0.02 0.21 ± 0.02
(s) 51 ± 2 58 ± 1 71 ± 2 179 ± 1 55 ± 1 63 ± 2 77 ± 1 196 ± 2 69 ± 2 75 ± 2 106 ± 1 246 ± 2
Flow behaviour W.L. W.L. W.L. W.L. W.L. W.L. L. L. W.L. W.L. L. L.
tmin = minimum time ; νmax = maximum velocity; = mean residence time; L. = Laminar; W.L. = Wavy-laminar.

M&M, results and discussion – Chapter 6: Flow regime assessment
6.3.2. RTD characterization
To improve understanding of the path of the skim milk fluid elements in the evaporator,
and thereby improve the characterization of the flow in the FFE, the residence time distribution
(RTD) function was maintained. The RTD curves in the third run at a feed mass flow rate of 70
kg·h-1 are presented in Fig. 6.1. All curves had the same surface area. The experimental RTD
curves at 80 kg·h-1 and 60 kg·h-1 presented similar shapes. For all feed mass flow rates and runs
studied, a more highly concentrated product led to a lower peak on the curves and greater
dispersion of the fluid elements.
Figure 6.1. Residence time distribution curves of skim milk in FFE at feed mass flow rate
of 70 kg·h-1 and 3R. : measurement from inlet to outlet of tube 1; : measurement from
outlet of tube 1 to outlet of tube 2; measurement from outlet of tube 2 to outlet of tube 3; :
overall RTD measurement from inlet to outlet of the falling film evaporator.
0 50 100 150 200 250 300 350 4000
0.005
0.01
0.015
0.02
0.025
0.03
0.035
time (s)
E(t
)

M&M, results and discussion – Chapter 6: Flow regime assessment
The times that the first fluid elements took to arrive at the bottom of the evaporation
tubes (tmin) after tracer injection are shown in Table 6.2 for the different sections studied. tmin was
the same for each section and feed mass flow rate, wherever the run. Only the feed flow rate
and the distance covered by the product in the evaporator influenced this parameter. The
distance covered by the product of section was greater than section , which in turn was
greater than section . Section represented the sum of the other three (Figure 4.7). The
product flow velocity was lower in section , as the product flow decreases due the evaporation.
The maximum flow velocity, νmax, defined as the ratio of the length of a section over tmin
for the product cover the section and calculated at the bottom of the tubes, is shown in Table 6.2.
νmax was 0.33 ± 0.01 m·s-1, 0.31 ± 0.00 m·s-1 and 0.26 ± 0.01 m·s-1, for T1 in the experiments
conducted at 80 kg·h-1, 70 kg·h-1 and 60 kg·h-1, respectively. νmax was 0.31 ± 0.00 m·s-1, 0.23 ±
0.00 m·s-1, 0.22 ± 0.00 m·s-1 at 70 kg·h-1 for T1, T2 and T3, respectively, and νmax of section
represented approximately the mean maximum velocity (0.25 m·s-1) of the three sections. In this
study, νmax decreased as the product passed through the evaporation tubes. This was mainly
due to the reduction in the mass flow rate due to product evaporation.
The mean residence time, τ, for a given section was the same for experiments conducted
at a feed mass flow rate of 80 kg·h-1. At 70 kg·h-1and 60 kg·h-1, τ was higher in R3 for sections
and . The increase in τ was assumed to be associated with a higher viscosity of the
product, which in turn, is a key parameter for determining the flow regime. Higher liquid film
dispersion contributed to a higher mean residence time of the product. When the flow regime
changed from wavy-laminar to laminar flow, τ was increased. For the experiments conducted in
this study, the laminar flow regime has a mean residence time above that of wavy-laminar flow,
hence the lower mean velocity.

M&M, results and discussion – Chapter 6: Flow regime assessment
The evaporation rate decreases due the increase in the energy losses, possibly due to
an increase in the product concentration, a decrease in the heat transfer coefficient, a change in
flow regime, a boiling delay phenomenon (i.e. product having a high boiling point due to greater
concentration of solutes), etc. When the evaporation rate decreased, the mass flow rate of the
product concentrate decreased less compared to high evaporation rate, which also increased
the flow velocity and therefore decreased the residence time of the product. Measurement of the
mean residence time was not sensitive to detect a decrease in the mean residence time when
the evaporation rate decreased very slightly.
It is of note that, one dimensionless number, Ref was used for determining the flow
regime. In this work Ref described not only the flow regime, but also the mean residence time of
the product in the FFE. Where Ref < 25, in sections and , in 3R at 70 kg·h-1 and 60 kg·h-1,
the flow behaviour changed from wavy-laminar to laminar flow and the mean residence time of
the product increased from 73 s to 77 s, 186 s to 196 s, 94 s to 106 s and 231 s to 246 s,
compared with 2R in the same section, where Ref > 25. In these experiments, to minimize heat
treatment (time/temperature), which is an important factor in controlling final product quality, the
flow regime of skim milk in FFE should be in the wavy-laminar region, Ref > 25. This can be
achieved by changing the operational parameters, i.e. mass flow rate, heating power, etc. In a
recently work Gourdon et al. (2015) showed that the flow behavior of whole and skim milk in FFE,
was affected by total solids contents, flow rates and driving temperature differences.
All experimental RTD curves for section presented shoulder areas at the end of
passage through the FFE. These shoulders were also observed from section in the 2R at a
feed mass flow rate of 80 kg·h-1 and 70 kg·h-1, and from section in the 2R, at a feed mass
flow rate of 60 kg·h-1.

M&M, results and discussion – Chapter 6: Flow regime assessment
Fig. 6.2 shows the models and experimental curves for the 3R of experiments conducted
at a feed mass flow rate of 60 kg·h-1. For modelling the results of RTD, two reactor sets were
used in parallel. This model represents two different flows, where a main and minor flow was
represented by the reactor set A and B, respectively. The parameters used for modelling each
reactor set and the standard deviation between model and experimental RTD for all sections,
runs and feed mass flow rates are presented in Table 6.3.
Figure 6.2. Experimental (full line) and model (dotted line) curves of residence time
distribution of skim milk in FFE, at 3R for experiments performed at inlet mass flow rate of 60
kg·h-1. : measurement from inlet to outlet of tube 1; : measurement from outlet of tube 1 to
0 50 100 150 200 250 300 350 4000
0.005
0.01
0.015
0.02
0.025
0.03
0.035
time (s)
E(t
)
0 50 100 150 200 250 300 350 4000
0.005
0.01
0.015
0.02
0.025
0.03
0.035
time (s)
E(t
)
0 50 100 150 200 250 300 350 4000
0.005
0.01
0.015
0.02
0.025
0.03
0.035
time (s)
E(t
)
0 50 100 150 200 250 300 350 4000
0.005
0.01
0.015
0.02
0.025
0.03
0.035
time (s)
E(t
)

M&M, results and discussion – Chapter 6: Flow regime assessment
outlet of tube 2; measurement from outlet of tube 2 to outlet of tube 3; : overall RTD
measurement from inlet to outlet of the falling film evaporator. Experimental curves calculated
according Eq. 4.8, 4.9, 4.10 and 4.11. Model calculated according Eq. 4.12.

M&M, results and discussion – Chapter 6: Flow regime assessment
Table 6.3. Model parameters and standard deviation of the model compared with the experimental curves of RTD for skim
milk experiments. 1R: first run, 2R: second run, 3R: third run. : measurement from inlet to outlet of tube 1; : measurement from
outlet of tube 1 to outlet of tube 2; measurement from outlet of tube 2 to outlet of tube 3; : overall RTD measurement from inlet
to outlet of the falling film evaporator.
Feed mass flow rate
80 kg·h-1 70 kg·h-1 60 kg·h-1
Section (Figure 2)
1R
a 0.999 0.999 0.999 0.960 0.999 0.999 0.999 0.945 0.999 0.999 0.999 0.930
a 50 47 58 60 51 53 59 60 57 65 79 91
b 50 47 58 120 51 53 59 145 57 65 79 199
Na 14 14 11 10 14 13 11 5 11 11 10 8
Nb 14 14 11 80 14 13 11 80 11 11 10 60 Standard deviation 0.002 0.006 0.008 0.014 0.004 0.005 0.006 0.012 0.003 0.003 0.006 0.009
2R
a 0.999 0.991 0.990 0.955 0.999 0.950 0.980 0.940 0.975 0.975 0.975 0.927
a 49 50 59 75 50 53 59 63 61 63 77 92 b 49 50 104 175 50 98 100 181 123 113 137 208
Na 13 11 10 9 13 11 10 5 10 8 9 7
Nb 13 90 60 110 13 85 60 40 110 80 100 115 Standard deviation 0.002 0.004 0.006 0.010 0.003 0.003 0.005 0.009 0.002 0.003 0.005 0.008
3R
a 0.980 0.980 0.960 0.950 0.980 0.960 0.955 0.937 0.975 0.960 0.950 0.925
a 51 51 57 69 51 61 61 71 66 65 89 111
b 97 97 109 159 101 101 116 169 113 115 199 214 Na 12 11 10 8 11 10 7 5 9 7 6 6
Nb 100 100 100 40 110 30 80 100 80 50 117 70
Standard deviation 0.002 0.004 0.006 0.012 0.002 0.003 0.004 0.010 0.002 0.005 0.003 0.008
A = fraction of flow rate going into the Ea(t); τa = mean residence time of Ea(t); τb = mean residence time of Eb(t); Na = number of
tanks in series of Ea(t); Nb = number of tanks in series of Eb(t).

M&M, results and discussion – Chapter 6: Flow regime assessment
The accuracy and reproducibility of the model was satisfactory, considering the very low
standard deviations obtained (Table 6.3).
In this model, Ea(t) describes the path of between 94.0 % and 99.9 % of product fluid
elements. Na could therefore be used to describe the dispersion in the residence time of the
skim milk in FFE. A more highly concentrated product required a smaller number of tanks in
series, corresponding to greater dispersion of the product. Among the 27 skim milk
concentrations studied, the product with the lowest concentration, located at the bottom of T1 /
1R at 80 kg·h-1, had a value of Na = 14. This value decreased when the product was
concentrated. The value of the product with greater concentration at the bottom of T3 / 3R at 60
kg·h-1, was Na = 6. Function Eb(t), described a small fraction of the fluid elements and served to
explain the shoulder curves in the experimental RTD functions (Figures 6.2 and 6.3).
When the shoulders in the RTD curves did not occur, 99.9% of the product fluid elements
passed through reactor set A, and the values of τi and Ni were the same for both reactor sets.
From the moment that the shoulders were observed, the product fluid elements going to reactor
set A decreased and Nb and τb increased, showing an increase in the fluid elements that passed
through reactor set B. These fluid elements represented 0.9 % to 7 % of total skim milk fluid
elements that entered the evaporator. At a feed mass flow rate of 80 kg·h-1, the fluid elements
that passed through reactor set A decreased from 99.1 % to 96.0 % at T1 / R2 and T3 / R3,
respectively. For section at T3 / R3, 4.0 %, 4.5 % and 5.0 % of fluid elements passed through
reactor set B for the feed mass flow rates of 80 kg·h-1, 70 kg·h-1 and 60 kg·h-1, respectively.

M&M, results and discussion – Chapter 6: Flow regime assessment
Figure 6.3. Residence time distribution (RTD) model of skim milk in FFE at section
and 2R, at feed mass flow rate of 80 kg·h-1. A: Experimental (full line) and model (dotted line)
curves of residence time distribution. B: Tanks in series reactor sets used for modelling the RTD
of FFE, showing the fraction of the product fluid elements that passed through reactor sets A
and B.
In section the shoulders were always present in the RTD curves, even if they were
not present in the RTD curves of previously sections. It may be due to sensitivity of the model to
detecting a small quantity of the fluid elements passing through reactor set B. The quantity of
product passing through reactor set A decreased from 96 % to 92.5 % for section , at T3 / R3
B
0 50 100 150 200 250 300 350 4000
0.005
0.01
0.015
0.02
0.025
0.03
0.035
time (s)
E(t
)
A
4.5 %
100%
100%
95.5 % Reactor set
A
Reactor set
B

M&M, results and discussion – Chapter 6: Flow regime assessment
at feed mass flow rates of 80 kg·h-1 and 60 kg·h-1, respectively. Comparison of different sections
showed that the fluid elements going to reactor set A decreased when the product concentration
increased, and thus an increase in the shoulders at the end of RTD curves was observed.
As mentioned before, the model used in this study takes into account a main and a minor
flow. For the experiments when the shoulders in the RTD curves were noted, the minor flow
should be considerate as a retarded flow (Fig. 6.3), due to the high mean residence time
presented. These two different flows possibly flow in two layers:
• One representing a small proportion of the fluid elements, demonstrated by
reactor set B, where the layer of product flows in contact with the walls of the evaporation tubes;
and
• One layer flowing over the first, in the center of the evaporation tubes,
representing a greater proportion of the product fluid elements, demonstrated by reactor set A.
Increased viscosity in the FFE results in increased film thickness (Gray, 1981), that could
be caused by an increase in the flowing fluid elements in contact with the surface of the
evaporation tubes. This layer would be decelerated by friction forces, surface tension, viscosity,
etc. and thus present a longer residence time. On the other hand, the majority of the product
may flow in a superimposed layer, where the above deceleration forces have a minor influence,
thus contributing to a higher flow velocity and shorter residence time.
6.4. Additional information
The RTD functions of water during the process of vacuum evaporation in FFE were also
measured.
The tmin and vmax (Table 6.4) of the experiments conducted with water had similar values
(37 s, 52 s, 60 s and 149 s, for sections , , and , respectively) to those obtained in the

M&M, results and discussion – Chapter 6: Flow regime assessment
experiments conducted with skim milk in the same operating conditions (inlet mass flow rate of
70 kg·h-1), demonstrating that the viscosity did not influence these parameters.
The experiments with water had a higher value of Ref in comparison with skim milk
experiments (Table 6.1 and 6.4). This increase in the values of Ref may have been due to the
low viscosity of water (0.46·10-3 Pa·s – Table 5.1), since the evaporation rate and therefore the
flow rate at the bottom of the tubes remains constant for the experiments with water and milk (§
5.4.3). The flow profile for water experiments was therefore characterized as turbulent (Ref >
1000 – § 4.8).
The mean residence time of the water particles in the evaporator equipment had the
same values as that of skim milk experiments when compared to the same section in the 1R and
2R. This parameter only changed when the flow profile changed from wavy-laminar to laminar
flow. Therefore only the laminar flow profile affected the mean residence time of the particles
during concentration in the FFE.
Table 6.4. Flow behavior, average and minimum residence time of particles of water in
falling film evaporators. Measurements performed at the inlet mass of 70 kg·h-1 and heating
power of 25.20 ± 0.05 kW.
Section (Fig. 3.14)
tmin (s) 37 ± 2 52 ± 3 60 ± 2 149 ± 3
νmax (m·s-1) 0.30 ± 0.00 0.24 ± 0.02 0.22 ± 0.01 0.24 ± 0.02
τ (s) 55 ± 1 63 ± 2 73 ± 1 184 ± 2
Ref 1257 1671 1371 1371
Flow behavior T. T. T. T.
T = Turbulent

M&M, results and discussion – Chapter 6: Flow regime assessment
6.5. Conclusion
The Ref provided information about the mean residence time of the skim milk flow in the
FFE. The mean residence time of the product was higher when the flow regime was
characterized as laminar flow. The flow behavior of water experiments was characterized as
turbulent flow. The flow velocity in wavy-laminar and turbulent conditions was the same, but this
parameter was higher than in the laminar conditions. For the same operating parameters, water
experiments in turbulent flow had the same mean residence time that skim milk flowing in wavy-
laminar conditions
The RTD approach provided greater understanding of the flow in FFE. The concentration
affected the dispersion of flow in the FFE but not the time required for the first particles to exit
from the evaporator: the more concentrated the product, the greater the dispersion of its
particles. The change in tmin was affected by the mass flow rate and section (distance covered by
the product).
Some RTD curves exhibited shoulders at the ends. This phenomenon characterized a
part of the product that followed another path in the FFE. The flow is comprised of two different
flows. The minor flow represented by reactor set B, was in contact with the inner surface of the
tube and had a longer mean residence time. The second flow, demonstrated by reactor set A
and representing the main fraction of product, flowed over the first layer, and had a shorter mean
residence time compared to the first layer.
The model with two reactor sets in parallel was effective in modelling the RTD curves.
This model allowed calculation of the amount of product that took different paths in the FFE, and
helped to improve understanding of the flow of skim milk in FFE.
The future of this work involves combining the RTD approach with different products and
operating conditions in the evaporator. These parameters can be accessed either by modelling

M&M, results and discussion – Chapter 6: Flow regime assessment
or by measurement, and will make it possible to describe the time/temperature history of the
product, and to establish further correlations with changes in constituents and operating
parameters.

M&M, results and discussion – Chapter 7: Application of the RTD approach to different dairy products
Chapter 7
APPLICATION OF RESIDENCE TIME DISTRIBUTION APPROACH
TO DIFFERENT DAIRY PRODUCTS TO INDICATE FOULING DURING
CONCENTRATION IN A FALLING FILM EVAPORATOR
The aim of this chapter is to use the residence time distribution approach to indicate
fouling caused by the concentration of dairy products in a falling film evaporator (FFE), such as
skim milk (SM), sweet whey (SW) and lactic acid whey (LAW). The extent of fouling was
determined by measuring the heat transfer coefficient (U), energy efficiency, outlet mass flow
rate and mean residence time of the concentrates. The heat transfer coefficient and the mean
residence time of the SM concentrate did not change during the 420 min experiment. However,
these two parameters gradually decreased with time for the experiments with SW and LAW.
When fouling occurred, both the heat transfer coefficient and the mean residence time
decreased, due to a decrease in the evaporation rate. No significant loss of SM components was
identified after evaporation. However, a decrease in mineral content was observed for SW
experiments over the processing time. This chapter demonstrates how to apply RTD on different
dairy products and relate several operating parameters, such as steam and product temperature,
product flow and conductivity, etc., to indicate fouling formation in a falling film evaporators. The
results of this Chapter will be submitted at Journal of Dairy Science1.
1 To be Submitted in October 2015 in the Journal of Dairy Science: Silveira, A.C.P., Tanguy, G., Perrone, Í.T., Jeantet, R., Fromont, L., Le Floch-Fouéré, C., de Carvalho, A.F., Schuck, P., Residence time distribution functions - application at different dairy products to indicate fouling during concentration in a falling film evaporator.
The main aims of this chapter are to:
- Use the RTD approach to indicate fouling in falling film evaporators
- Relate the operating parameters to dairy fouling

M&M, results and discussion – Chapter 7: Application of the RTD approach to different dairy products
Capítulo 7 APLICAÇÃO DA METODOLOGIA DE DISTRIBUIÇÃO DOS TEMPOS DE
RESIDÊNCIA NO MONITORAMENTO DO FOULING DURANTE A CONCENTRAÇÃO
DE DIFERENTES PRODUTOS LÁCTEOS EM UM EVAPORADOR DE PELÍCULA
DESCENDENTE
O objetivo deste capítulo é usar a metodologia do cálculo da distribuição dos tempos de
residência para monitorar a formação de fouling causados pela concentração de produtos
lácteos em um evaporador de película descendente (EPD), tais como leite desnatado, soro de
leite doce e soro de leite ácido. A extensão da formação do fouling foi determinada através do
cálculo do coeficiente de transferência de calor, eficiência energética, vazão mássica e tempo
de residência médio dos concentrados no evaporador a vácuo. O coeficiente de transferência
de calor e o tempo de residência médio do leite desnatado não se alteraram durante todo o
tempo de processamento (420 min). No entanto, estes dois parâmetros diminuiram
gradualmente em função do tempo para os experimentos realizados com soro de leite doce e
ácido. Quando ocorre a formação de fouling, tanto o coeficiente de transferência de calor
quanto o tempo de residência médio diminuem, devido a uma diminuição na capacidade de
evaporação. Não foram identificadas perdas significativa dos componentes do leite desnatado
antes e após a evaporação. No entanto, uma diminuição na composição mineral do soro de leite
ácido foi observado. Este capítulo demonstra como aplicar DTR a diferentes produtos lácteos e
como relacionar vários parâmetros operacionais, como temperatura do vapor primário e do
produto, vazões mássicas e condutividade dos produtos, etc., para indicar a formação de fouling
em evaporadores de película descendente. Os resultados do presente capítulo será enviado em
outubro de 2015 para publicação no Journal of Dairy Science1.
Os principais objetivos deste capítulo são:
- usar a metodologia de DTR para indicar a formação de fouling em evaporadores de pelicula descendente
- relacionar diferentes parâmetros operacionais ao fouling de produtos lácteos

M&M, results and discussion – Chapter 7: Application of the RTD approach to different dairy products
Table of contents
7.1. Introduction ....................................................................................................................... 134
7.2. Materials and Methods ..................................................................................................... 135
7.2.1. Pilot vacuum evaporator ............................................................................................ 135
7.2.2. Experimental runs ...................................................................................................... 136
7.2.3. Chemical composition ................................................................................................ 136
7.2.4. Enthalpy characterization ........................................................................................... 136
7.2.5. Measurement of residence time distribution ............................................................... 137
7.3. Results and Discussion .................................................................................................... 137
7.4. Additional information ....................................................................................................... 144
7.5. Conclusions ...................................................................................................................... 149

M&M, results and discussion – Chapter 7: Application of the RTD approach to different dairy products
7.1. Introduction
Falling film evaporators (FFE) are widely used in the chemical, refrigeration, petroleum
refining, desalination and food industries (Kouhikamali et al., 2014). Their appeal is mainly due
to the high heat transfer coefficient, low evaporation temperature and small temperature
differences between the product and the steam (Silveira et al., 2015). FFE is a commonly used
method in the dairy industry for the production of final (sweetened condensed milk, evaporated
milk, etc.; Gänzle et al., 2008) and intermediate products before any further operations such as
crystallization, precipitation, coagulation and drying (infant formulae, whey and milk powders,
etc.) (Bimbenet et al., 2007; Schuck, 2002; Zhu et al., 2011). Unfortunately a fouling layer
accumulates on the inner wall of the evaporator tubes during processing, impairing optimal
functioning of the equipment (Jeurnink et al., 1996), and resulting in a decrease in the heat
transfer coefficient, an increased pressure drop and the formation of a biofilm (Langeveld et al.,
1990; Visser and Jeurnink, 1997).
Because of the decrease in the heat transfer coefficient that results from fouling, most
evaporators do not have a constant production capacity. In petrochemical industries, pipe
cleaning is carried out once a year, whereas in food-processing industries, it has to be done at
least once a day (Ozden and Puri, 2010). The high frequency of cleaning periods results in
shorter production times and higher consumption of water and cleaning agents, increasing
economic costs and need to address ecological issues (Jimenez et al., 2013).
Vacuum evaporators are heat exchangers, in which the major factors likely to generate
fouling during the heat treatment of milk are the formation and the subsequent deposition of
denatured whey protein molecules, the precipitation of minerals as a result of the decreasing
solubility of calcium phosphates with increasing temperature, and the temperature difference
between the heating surface and the liquid to be heated (Lalande and Tissier, 1985; W. R.
Paterson, 1988).

M&M, results and discussion – Chapter 7: Application of the RTD approach to different dairy products
Fouling during heat treatment is particularly problematic with concentrated products.
Schraml and Kessler (1994) reported that during pasteurization of whey products, fouling
increased to a maximum concentration of 250 g·kg-1 of total solids (TS), after which deposition
decreased. The reason for the decrease was thought to result from two competing mechanisms:
aggregation of whey proteins, which is a second order reaction and crystallization of salts, manly
calcium phosphate (Fryer et al., 2011).
Most studies on fouling and cleaning in the area of food engineering relate to
pasteurization and sterilization processes, where temperatures are greater than 70°C. Chen and
Bala (1998) showed that surface temperatures need to be above 70°C for significant surface
fouling of milk to occur, but most milk evaporator parts operate below this temperature (Morison,
2015). Most of the fouling in milk evaporators should therefore not be assumed to be the same
as the fouling reported in the case of sterilizers and pasteurizers.
The progress made towards the reduction of fouling in FFE has been largely empirical.
The aim of this study was therefore to demonstrate how to monitor the formation and extent of
fouling in FFE using operating process data and how the formation of fouling contributes to
modification of the process parameters and product quality.
7.2. Materials and Methods
7.2.1. Pilot vacuum evaporator
The experiments were performed with the pilot scale, single stage falling film evaporator
with the additional instrumentation (described in Chapter 4.2.2).
All experiments were performed at an absolute pressure (Pabs) of 0.02 MPa, and thus the
saturation temperature of evaporation was maintained at 60 °C throughout the three tubes.
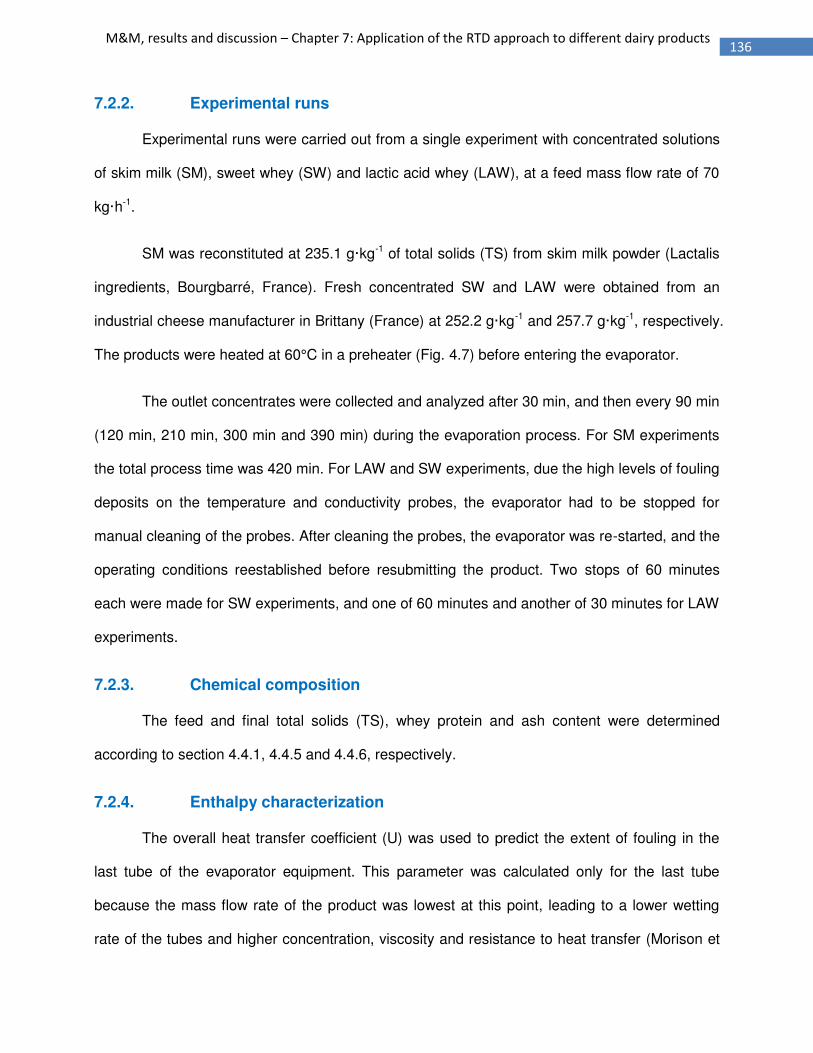
M&M, results and discussion – Chapter 7: Application of the RTD approach to different dairy products
7.2.2. Experimental runs
Experimental runs were carried out from a single experiment with concentrated solutions
of skim milk (SM), sweet whey (SW) and lactic acid whey (LAW), at a feed mass flow rate of 70
kg·h-1.
SM was reconstituted at 235.1 g·kg-1 of total solids (TS) from skim milk powder (Lactalis
ingredients, Bourgbarré, France). Fresh concentrated SW and LAW were obtained from an
industrial cheese manufacturer in Brittany (France) at 252.2 g·kg-1 and 257.7 g·kg-1, respectively.
The products were heated at 60°C in a preheater (Fig. 4.7) before entering the evaporator.
The outlet concentrates were collected and analyzed after 30 min, and then every 90 min
(120 min, 210 min, 300 min and 390 min) during the evaporation process. For SM experiments
the total process time was 420 min. For LAW and SW experiments, due the high levels of fouling
deposits on the temperature and conductivity probes, the evaporator had to be stopped for
manual cleaning of the probes. After cleaning the probes, the evaporator was re-started, and the
operating conditions reestablished before resubmitting the product. Two stops of 60 minutes
each were made for SW experiments, and one of 60 minutes and another of 30 minutes for LAW
experiments.
7.2.3. Chemical composition
The feed and final total solids (TS), whey protein and ash content were determined
according to section 4.4.1, 4.4.5 and 4.4.6, respectively.
7.2.4. Enthalpy characterization
The overall heat transfer coefficient (U) was used to predict the extent of fouling in the
last tube of the evaporator equipment. This parameter was calculated only for the last tube
because the mass flow rate of the product was lowest at this point, leading to a lower wetting
rate of the tubes and higher concentration, viscosity and resistance to heat transfer (Morison et

M&M, results and discussion – Chapter 7: Application of the RTD approach to different dairy products
al., 2006). It could therefore be expected that the formation of fouling should be greater than in
the other two tubes.
Mass and enthalpy balance, overall heat transfer coefficient and assessment of process
efficiency were calculated as described in chapter 4.5, 4.6 and 4.7, respectively.
7.2.5. Measurement of residence time distribution
Residence time distributions functions were calculated and modeled for the inlet to the
outlet of the evaporator equipment (section ) as described in 4.9.
7.3. Results and Discussion
The total heat transfer coefficient was used to estimate the extent of fouling in the FFE,
as described in Bermingham et al. (1999). Fig. 7.1 shows the evolution of U as a function of time
for the three concentrated solutions studied. The blanks in the values of U for SW and LAW
experiments corresponded to stops during the evaporation process to clean the conductivity and
temperature probes (Fig. 4.7) and restarting of the evaporator.

M&M, results and discussion – Chapter 7: Application of the RTD approach to different dairy products
Fig. 7.1. Heat transfer coefficient (A) and inlet steam temperature (B) of skim milk ( ),
sweet whey ( ) and lactic acid whey ( ) as a function of time. Blank spaces between U values
correspond to stops of the evaporator to clean probes. U values measured in the third
evaporator tube. Product inlet mass flow rate at 70 kg·h-1 and Heating power of 25.20 ± 0.05 kW.
At the beginning of the process (time = 0) the evaporator was clean and therefore the U
values corresponded to the heat transfer coefficient for a clean surface. The values of U,
calculated according to Eq. 4.4, were: 2.33 kW·m-2∙°C-1, 2.52 kW·m-2∙°C-1, and 2.11 kW·m-2∙°C-1,
65
70
75
80
85
90
95
100
0 100 200 300 400
Inle
t S
tea
m t
em
pe
ratu
re (
°C)
Time (min)
B
0
1
2
3
4
5
6
7
0 50 100 150 200 250 300 350 400
U (
kW
·m-2
·°C
-1)
Time (min)
A

M&M, results and discussion – Chapter 7: Application of the RTD approach to different dairy products
for SM, SW and LAW, respectively. Jebson and Chen (1997) obtained values for U between 0.8
kW·m-2·°C-1 and 3.08 kW·m-2·°C-1 for whole milk measured in several milk powder factories;
Jebson and Iyer (1991) found values for U between 2.00 kW·m-2·°C-1 and 3.50 kW·m-2·°C-1 for
skim milk concentrated in five-effect evaporators. The small difference between the values of U
for the three solutions studied at t = 0 may therefore be considered negligible on the scale of the
experimental reproducibility. Moreover, the U values at the beginning of the process were similar
whatever the dairy product to the mean value of 2.00 kW·m-2·°C-1 reported by Silveira et al.
(2013) for the same equipment.
The value of U for the SM experiments remained constant during the 420 min of the
evaporation process, which indicated that no fouling was present. Reconstituted milk results in
less fouling than fresh milk, possibly explained by the fact that the materials which are
responsible for forming the deposits on the heat exchanger surface has been partially removed
during powder manufacture or are less active (e.g. denatured proteins already aggregated, or
calcium phosphates already precipitated) after this step. For example, calcium concentration and
ion activity is reduced by 9% and 11%, respectively (Jeurnink et al., 1996). Each of these factors
may have contributed to the absence of fouling in SM experiments.
For SW and LAW experiments, U gradually decreased over time, indicating the
progressive formation of fouling. This decrease was more pronounced in LAW experiments. SW
resulted in more fouling than SM due to the absence of casein micelles. Indeed, caseins hinder
the transport of whey protein aggregates to the surface, and affect the association of whey
proteins with calcium ions, thus resulting in aggregates less prone to fouling (Jeurnink et al.,
1996; Jeurnink, 1995; Varunsatian et al., 1983). LAW showed the highest fouling formation over
time. As the pH of this concentrated solution is closer to the isoelectric point of whey proteins,
leading to less electrostatic repulsion, the increased fouling formation could be due to greater

M&M, results and discussion – Chapter 7: Application of the RTD approach to different dairy products
probability of adsorption of whey proteins to the protein layer deposited and thus complexation of
minerals for the protein layer.
Table 7.1 shows the enthalpy balance values for the three dairy products studied. The
EE decreased when fouling was identified. The EE was constant (77 ± 3 %) for SM experiments,
since there was no fouling. The EE decreased from 73 % to 62 % and from 75 % to 62 %, for
SW and LAW experiments, respectively. This decrease was due to the increase in the heat
transfer resistance between the steam and the product due to the fouling layer on the evaporator
walls. However, the energy losses, q , calculated according Eq. 4.3, remained constant and
equal to a similar value (7 ± 1 %) to that found by Silveira et al. (2013) whatever the product. As q corresponds to the energy dissipated toward the evaporator environment, its value was not
affected by fouling.
Table 7.1. Enthalpy balance of the vacuum evaporation process at different times for
skim milk, sweet whey and lactic acid whey experiments. Product inlet mass flow rate at 70 kg·h-
1 and Heating power of 25.20 ± 0.05 kW.
Process time Skim Milk Sweet whey Lactic acid
whey
30 min Energy Loss (%) 7% 8% 7%
EE (%) 75% 73% 75%
120 min Energy Loss (%) 6% 8% 7%
EE (%) 80% 70% 69%
210 min Energy Loss (%) 6% 7% 8%
EE (%) 76% 70% 62%
300 min Energy Loss (%) 6% 8% -
EE (%) 74% 62% -
390 min Energy Loss (%) 5% - -
EE (%) 79% - -

M&M, results and discussion – Chapter 7: Application of the RTD approach to different dairy products
EE = Efficiency energy (Eq. 4.12)
The effects of fouling on the operating parameters of the vacuum evaporation process
are presented in Table 7.2. The outlet mass flow rate of SM concentrate was constant
throughout the process time (43.7 ± 0.6 kg·h-1). As no fouling was identified for this product, the
evaporation rate (26.5 ± 0.5 kg·h-1) and the TS content (379. ± 11.7 g·kg-1) of the outlet
concentrate remained constant.
Table 7.2. Operational parameters of the vacuum evaporator process and physical-
chemical properties of skim milk, sweet whey and lactic acid whey at different process times.
Product inlet mass flow rate at 70 kg·h-1 and Heating power of 25.20 ± 0.05 kW.
TS = Total solids
The evaporation rate decreased from 26.6 kg·h-1 to 18.7 kg·h-1 for the LAW experiments.
However, the evaporation rate was constant for the SW experiments (25.3 ± 0.4 kg·h-1),
Process time Product Skim milk Sweet whey Lactic acid whey
30 min
Mass flow rate (kg·h-1) 44.0 ± 1.5 44.3 ± 3.9 43.4 ± 3.6
Evaporation rate (kg·h-1) 26.0 25.7 26.6
TS (g·kg-1) 374.0 398.5 414.2
120 min
Mass flow rate (kg·h-1) 44.4 ± 1.4 44.7 ± 4.2 47.0 ± 3.8
Evaporation rate (kg·h-1) 26.6 25.3 23.3
TS (g·kg-1) 398.0 394.8 383.4
210 min
Mass flow rate (kg·h-1) 43.1 ± 1.4 44.5 ± 4.1 51.3 ± 4.2
Evaporation rate (kg·h-1) 26.9 25.5 18.7
TS (g·kg-1) 381.8 396.3 351.2
300 min
Mass flow rate (kg·h-1) 44.1 ± 1.9 45.3 ± 4.4 -
Evaporation rate (kg·h-1) 25.9 24.7 -
TS (g·kg-1) 373.2 389.7 -
390 min
Mass flow rate (kg·h-1) 43.0 ± 1.7 - -
Evaporation rate (kg·h-1) 27.0 - -
TS (g·kg-1) 368.2 - -

M&M, results and discussion – Chapter 7: Application of the RTD approach to different dairy products
although U of the third tube decreased throughout the processing time. The small decrease in U
during SW experiments was not sufficient to affect the evaporation rate.
As discussed above, the formation of a fouling layer on the evaporator wall decreased
the heat flow from the steam for the product, resulting in a decrease in the evaporation rate.
Fouling thus caused a decrease in the concentration of the outlet product, from 398.5 g·kg-1 to
389.7 g·kg-1 and from 414.2 g·kg-1 to 351.2 g·kg-1 for the SW and LAW experiments, respectively.
This decrease is more important to LAW due to a higher fouling formation presented by this
product.
Table 7.3 shows the mean residence time, τ, of the three dairy products studied,
calculated at different process times. As the operating parameters did not change for SM
experiments, its τ was the same, 298 ± 1 s, throughout the process. However, τ decreased
throughout the process for SW and LAW experiments. It decreased from 298 s at t = 30 min to
264 s at 210 min (Table 7.3) for LAW experiments. An increase in the outlet concentrate flow
rate, and therefore in the flow speed of the product in FFE, was observed with fouling formation,
in accordance with the decrease in the mean residence time determined here. The mean
residence time thus decreased with fouling formation. However, the outlet mass flow rate of SW
concentrates did not alter until 210 min, but nevertheless τ decreased. This shows that τ is not
only influenced by the mass flow rate, but by other factors such a product concentration, flow
profile and product interactions with the wall of the evaporator, etc. (Silveira et al., 2015). These
findings indicate that τ expresses the extent of fouling in a more accurate way than the mass
flow rate of concentrate.

M&M, results and discussion – Chapter 7: Application of the RTD approach to different dairy products
Table 7.3. Mean residence times in the vacuum evaporator equipment calculated at
different process times for skim milk, sweet whey and lactic acid whey. Product inlet mass flow
rate at 70 kg·h-1 and Heating power of 25.20 ± 0.05 kW.
Mean residence time (s)
Process Time Skim Milk Sweet Whey Lactic acid whey
30 min 296 ± 2 294 ± 1 298 ± 2
120 min 298 ± 3 287 ± 1 294 ± 1
210 min 298 ± 2 280 ± 1 264 ± 1
300 min 297 ± 3 276 ± 1 -
390 min 299 ± 2 - -
The composition (%) of the products before and after evaporation are shown in Table 7.4.
The composition of the SM product remained constant before and after evaporation, as fouling
was not evidenced for this experiment. For the SW experiments, a decrease in minerals was
identified at 210 min: ash content values decreased from 6.1 % to 5.3 % between t = 120 min
and t = 210 min, respectively. This may have been due to mineral precipitation contributing to
the formation of mineral deposits on the wall of the evaporator tubes. A high fouling rate was
identified for the LAW experiments (Fig. 7.1), although the composition of the product before and
after evaporation remained constant. This phenomenon contradicts the loss of product
components due to deposit formation. This may be explained by the high concentration of
minerals in the LAW products (14.6 % in dry matter), especially calcium and phosphate. Even
with a loss of minerals in the deposit (fouling formation), this loss (mass deposited on the wall of
the evaporator tube) was much lower than the mineral content in the product, and was therefore
not identified. The SW product presented a smaller quantity of minerals than LAW, and thus a
small loss of mineral content caused a decrease in the mineral content in the final product, which
could then be identified.

M&M, results and discussion – Chapter 7: Application of the RTD approach to different dairy products
Table 7.4. Physical-chemical properties of skim milk, lactic acid whey and sweet whey
before and after evaporation at different process time. Product inlet mass flow rate at 70 kg·h-1
and heating power of 25.20 ± 0.05 kW.
Skim milk Sweet whey Lactic acid whey
Before evaporation
TS (g·kg-1) 235.1 ± 1.2 252.2 ± 0.4 257.4 ± 0.8
Whey protein (% TS) 4.9 ± 0.2 4.7 ± 0.3 3.5 ± 0.0
Ash (% TS) 8.3 ± 0.1 6.0 ± 0.0 15.0 ± 0.1
Ca (% TS) 1.5 ± 0.0 0.9 ± 0.0 3.2 ± 0.0
Process time Concentrate
30 min
Whey protein (% TS) 5.0 ± 0.1 4.9 ± 0.1 3.5 ± 0.0 Ash (% TS) 8.3 ± 0.1 6.7 ± 0.1 14.5 ± 0.0 Ca (% TS) 1.4 ± 0.0 0.9 ± 0.0 3.0 ± 0.0
120 min
Whey protein (% TS) 4.9 ± 0.1 4.7 ± 0.1 3.5 ± 0.0 Ash (% TS) 8.3 ± 0.0 6.1 ± 0.1 14.5 ± 0.0 Ca (% TS) 1.5 ± 0.0 0.7 ± 0.0 3.0 ± 0.0
210 min
Whey protein (% TS) 5.0 ± 0.1 4.6 ± 0.1 3.3 ± 0.1
Ash (% TS) 8.3 ± 0.1 5.3 ± 0.1 14.5 ± 0.1
Ca (% TS) 1.4 ± 0.0 0.7 ± 0.0 3.0 ± 0.0
7.4. Additional information
The study of the extent of fouling formation presented above was related to the third
evaporator tube (T3). However, this study was also performed for the first and second
evaporation tubes (T1 and T2, respectively). Fig. 7.2 shows the evolution of U as a function of
time for the three concentrated solutions studied in T1 and T2. As explained above, the blanks in
the values of U for SW and LAW experiments corresponded to stops during the evaporation
process to clean the conductivity and temperature probes and restart the evaporator. Fig. 7.3
shows the fouling found in the conductivity probes just after stopping the process.

M&M, results and discussion – Chapter 7: Application of the RTD approach to different dairy products
Figure 7.2. Heat transfer coefficient and inlet steam temperature of skim milk ( ), sweet
whey ( ) and lactic acid whey ( ) as a function of time. Blank spaces between U values
correspond to evaporator stops to clean probes. T1: first evaporator tube and T2: second
evaporator tube. Product inlet mass flow rate at 70 kg·h-1 and Heating power of 25.20 ± 0.05 kW.
0
1
2
3
4
5
6
7
0 100 200 300 400
U (
kW·m
-2·°
C-1
)
Time (min)
T1
0
1
2
3
4
5
6
7
0 100 200 300 400
U (
kW·m
-2·°
C-1
)
Time (min)
T2
62
65
68
71
74
77
80
0 100 200 300 400
Inle
t St
ea
m t
em
pe
ratu
re (
°C)
Time (min)
T1
62
65
68
71
74
77
80
0 100 200 300 400
Inle
t st
ea
m t
em
pe
ratu
re (
°C)
Time (min)
T2

M&M, results and discussion – Chapter 7: Application of the RTD approach to different dairy products
Figure 7.3. Conductivity probe of the third evaporator tube after the first process stop.
The U values for SM and SW measured in T1 were constant over all process times (3.2
kW·m-2·°C-1 and 2.5 kW·m-2·°C-1, respectively), indicating that no fouling formation occurred
during the evaporation process. However, U values decreased over time for LAW experiments
(Fig. 7.2 - A), thus indicating progressive fouling formation in T1. The U values for the three
concentrated solutions studied remained constant over the process time in T2 (2.5 kW·m-2·°C-1,
2.7 kW·m-2·°C-1 and 2.2 kW·m-2·°C-1 for SM, SW and LAW, respectively), therefore no fouling
formation was detected in these tubes during the process.
For SW experiments, fouling was identified only in T3 (Fig. 7.1), where the higher
concentration and the lower flow rate of the product (end of the evaporation process) may have
been the cause. For LAW experiments, fouling was identified in T1 and T3 (decrease in U over
time) (Fig. 7.1 and 7.2 – B). Even with a higher concentration and lower product flow rate in T2
than in T1, fouling was not identified in this tube. This result shows that the LAW particles in the
concentration range studied, which were more susceptible to the formation of fouling, attached
to the wall of the evaporator tube more rapidly when submitted to a temperature difference
(between heat steam and product evaporation temperature), thus producing a fouling layer on
the wall of this tube. The fouling identified in T3 must be due at a higher concentration and a

M&M, results and discussion – Chapter 7: Application of the RTD approach to different dairy products
lower mass flow rate of the product at this point, leading to a lower wetting rate of the tube and a
higher heat transfer resistance in T3 than in the other evaporator tubes.
Table 7.5 shows the operating parameters of the vacuum evaporator process and the
physical-chemical properties of the three products studied at different process times for T1 and
T2. As no fouling formation was identified in T1 and T2 for SM and SW experiments, the
evaporation rate in these tubes remained constant. The evaporation rate was 8.5 ± 0.3 kg·h-1
and 9.2 ± 0.3 kg·h-1 for T1 and T2, respectively.
Table 7.5. Operational parameters of the vacuum evaporator process and physical-
chemical properties of skim milk, sweet whey and lactic acid whey at different process times for
sections and . Product inlet mass flow rate at 70 kg·h-1 and Heating power of 25.20 ± 0.05
kW.
Fouling was identified in T1 and T3 for lactic acid whey experiments, therefore the
evaporation rate decreased in these two tubes over the evaporation process time. At the
beginning of the process (time = 30 min), and when compared to the same evaporator tube, the
evaporation rate was the same regardless of the product. This result was similar to those found
Skim Milk Sweet whey Acid whey
Process time Section
30 min Evaporation rate (kg·h-1) 8.7 9.2 8.2 9.0 8.3 9.4
TS (g·kg-1) 268.5 315.9 285.5 335.2 292 344
120 min Evaporation rate (kg·h-1) 8.5 9.0 8.1 9.0 5.7 9.5
TS (g·kg-1) 267.7 313.5 285 333.3 280.2 328.8
210 min Evaporation rate (kg·h-1) 8.5 9.9 9.0 8.9 2.7 9.2
TS (g·kg-1) 267.8 319.4 289.2 338.6 267.9 310.7
300 min Evaporation rate (kg·h-1) 8.8 9.9 8.7 8.9 - -
TS (g·kg-1) 265.3 314.0 288 337.1 - -
390 min Evaporation rate (kg·h-1) 8.2 9.2 - - - -
TS (g·kg-1) 266.3 312.6 - - - -

M&M, results and discussion – Chapter 7: Application of the RTD approach to different dairy products
and discussed in Chapter 5, where the evaporation rate between different products (in process
conditions without fouling) had the same values.
For the experiments performed with lactic acid whey, the evaporation rate in T1
decreased over the process time (8.3 kg·h-1, 5.7 kg·h-1 and 2.7 kg·h-1 at 30 min, 120 min and
210 min, respectively). This decrease in the evaporation rate was due to the high fouling
formation in the evaporator tube and in the preheater (installed at the equipment inlet (Fig. 4.7)),
which increased the resistance of heat exchange between the hot fluid and the product. The
lactic acid whey thus entered the equipment at a temperature below the evaporation
temperature. As consequence part of heat exchanged by the steam in T1 was used to heat the
product until its evaporation temperature (60°C) and not to evaporate it. This phenomenon,
combined with the fouling formation in T1, contributed to a low evaporation rate in the first tube
for lactic acid whey experiments.
The values presented above (Table 7.3) correspond to the mean residence time of
section (inlet to the outlet of the evaporator equipment). Table 7.6 shows the mean residence
times for SM, SW and LAW in the vacuum evaporator equipment calculated at different process
times and sections , and . The mean residence time, measured in the same section,
was constant for the SM experiments during all processing times. The mean residence time for
SW experiments only changed in section and after t = 120 min. This result was similar to that
found in section (Table 7.3), indicating that the formation of fouling in the SW experiment
occurred only in the last evaporator tube (T3).
The mean residence time for LAW experiments decreased over the evaporation process
for section . Therefore in section at t = 30 min this value was the same as that of the SM
and SW experiments. This result also shows that at t = 30 min, the formation of fouling in T1 was
not sufficient to decrease the evaporation rate of the LAW experiments. The mean residence

M&M, results and discussion – Chapter 7: Application of the RTD approach to different dairy products
time in section for LAW experiments was constant until t = 120 min (56 s), decreasing at t =
210 min (52 s), although no fouling was detected and the evaporation rate was constant in this
section (9.3 kg·h-1). This result was due to a lower evaporation rate in the previous evaporation
tube (2.7 kg·h-1 – Table 7.5), thus causing an increase in product flow rate in sections and
(T2 and T3). The increase in the product flow rate led to a decrease in the mean product
residence time.
Table 7.6. Mean residence times in the vacuum evaporator equipment calculated at
different process times and sections (Fig. 3.7) for skim milk, sweet whey and lactic acid whey.
Product inlet mass flow rate at 70 kg·h-1 and Heating power of 25.20 ± 0.05 kW.
Skim Milk Sweet Whey Acid whey
Section Process Time Mean residence time (s)
30 min 140 ± 1 139 ± 2 140 ± 1
120 min 140 ± 1 140 ± 1 137 ± 2
210 min 141 ± 1 139 ± 1 132 ± 2
300 min 138 ± 2 138 ± 2 -
390 min 138 ± 2 - -
30 min 57 ± 4 55 ± 1 58 ± 2
120 min 58 ± 2 56 ± 1 55 ± 2
210 min 59 ± 2 57 ± 1 52 ± 3
300 min 57 ± 1 56 ± 2 -
390 min 56 ± 2 - -
30 min 89 ± 3 93 ± 1 89 ± 1
120 min 87 ± 3 92 ± 1 80 ± 2
210 min 88 ± 2 84 ± 1 71 ± 1
300 min 88 ± 3 72 ± 2 -
390 min 88 ± 2 - -
7.5. Conclusions

M&M, results and discussion – Chapter 7: Application of the RTD approach to different dairy products
The residence time distribution approach was used to indicate fouling in a falling film
evaporator during concentration of skim milk, sweet whey and lactic acid whey. Fouling was
monitored by the calculation of the overall heat transfer coefficient, the energy efficiency, the
evaporation rate and the mean residence time. During the concentration of sweet and lactic acid
whey a decrease in the overall heat transfer coefficient, evaporation rate and energy efficiency
occurred over the processing time. These phenomena were related to the formation of fouling
deposits on the walls of evaporator tubes. The mean residence times of the products in the
falling film evaporator were calculated. A decrease in this parameter was observed as a function
of time. This phenomenon was related to the increase in the flow rate, due the fouling formation
and therefore an increase of the product flow velocity, which in turn contributed to a low mean
residence time. This parameter was more sensitive to identify fouling than the other operating
parameters used in this study.
The composition of the three concentrated dairy products was measured before and after
concentration in the equipment. No significant loss of skim milk components was identified after
evaporation. A decrease in mineral content was observed in the sweet whey experiment.
Despite the high fouling rate identified in the lactic acid whey experiment, the composition of this
product remained constant before and after evaporation. This phenomenon was related to the
higher concentration of minerals in the lactic acid whey. The loss of this component in the
deposits formed was much lower than the mass of minerals present in the product, which was
therefore not identified.
As these results were obtained from a single experiment, they need to be confirmed by
further experiments. The work will be then submitted in the Journal of Dairy Science.

General conclusion
GEσERAL CτσCLUSIτσ
In the current context of intensification of global exchange, concentration and drying
techniques are crucial for the dairy industry and this warrants investment in new types of
concentration and drying research. Despite the fact that falling film evaporation is a widely used
technique prior to the drying process, some essential aspects of the process such as product
flow regime, residence time distribution, or key factors controlling product properties, etc., are
not yet fully understood, thus resulting in variability of concentrate quality and process
performance. As the concentrate properties contributes to the powder properties, the
understanding of the vacuum evaporation process, especially with regards to modifications of
the product by the process operating parameters, needs to be improved in order to predict the
final product techno-functional properties.
This thesis reviewed experimental thermodynamic and hydrodynamic studies based on
the falling film evaporation of various dairy products. The study focused first on the evaporation
of water, as a model solution (Newtonian behavior), then on skim milk, whole milk, sweet whey
and lactic acid whey, which are involved in the elaboration of several dried dairy products, such
as infant formulas and fitness products (e.g. Whey protein isolates). The first part of this PhD
project aimed to instrument and characterize a pilot scale, falling film evaporator (FFE) that
would, from a hydrodynamic point of view, describe the same process as the industrial
equipment. The choice and position of the sensors used for the instrumentation of this pilot
equipment, as well as the calculation of energy consumption and process performance, can be
applied to industrial scale evaporators.
Several operating data such as temperature, pressure, flow rate, conductivity, etc. were
measured and recorded for the characterization of the vacuum evaporation process. The

General conclusion
sensors used for these measurements were positioned at different points in the equipment, in
order to achieve thermodynamic balances and to monitor product dry matter during its
concentration. The thermodynamic balances of the process made it possible to identify some
limitations of the original equipment, such as poor distribution of certain products at the top of
the evaporator tubes, barely regulation of the water sensor valves of the heating systems and
lower wettability rate of the evaporator tubes for the products with higher total solids content,
which resulted in a decrease in the evaporation rate. A cone-shaped concave distributor system
was designed, the heating regulation was improved and the inlet flow rate of the product was
adjusted in order to overcome this limitations and to provide a sufficient wettability rate of the
evaporator tubes for products with higher concentrations.
Only the operating parameter (heating power, inlet product flow rate, etc.) modified the
evaporation rate. Indeed, the evaporation rate calculated for given operating parameters values
was constant, regardless of the product. It is of note that the heat transfer surface of this pilot
(1.03 m2) is much lower than industrial scale evaporators considering the scale reduction applied.
The results of the effectiveness of evaporation showed that suitable instrumentation (choice and
siting of the sensors in the vacuum evaporation equipment) can result in good thermodynamic
balance and identification of possible problems, thus improving the process performance.
The second stage of this PhD project involved a hydrodynamic characterization of the
vacuum evaporation process. Residence time distribution functions were used to characterize
the flow profile of skim milk at three different total inlet solids and feed mass flow rates during its
concentration in the three different sections of the FFE, and for the entire FFE (from the inlet to
the outlet of the equipment). Methodology for the calculation of the experimental RTD curves, as
well a model and the physical interpretation of this were also developed. A combination of two
perfectly mixed reactor tanks in series (reactor sets A and B) was developed to model the
experimental RTD functions. Flow was characterized using experimental film Reynolds numbers

General conclusion
(Ref). The results showed that the mean residence time of the product increased when the flow
behavior changed from wavy-laminar to laminar flow. Increasing the concentration of skim milk
and the distance covered by the product resulted in an increase in the dispersion of the particles.
The model with two reactor sets in parallel was effective to model the RTD curves, in
view of the very low standard deviations obtained. From the model interpretations, a main and a
minor flow, consisting in two layers of product flowing through the evaporator tubes, were
proposed. The minor flow would flow in contact with the inner surface of the tube and had a
longer mean residence time. The main flow, which represented most of the product particles,
would flow over the first layer, and had a shorter mean residence time.
The last part of this PhD thesis consisted in the application of the thermodynamic and
hydrodynamic approaches used to characterize the vacuum evaporation process. A study on the
fouling during the concentration of skim milk, sweet and lactic acid whey during concentration in
a FFE was performed. The results confirmed that lactic acid whey presented the greatest degree
of fouling formation, followed by sweet whey. No fouling formation was identified for the skim
milk experiment over the processing time of 420 min. However, this time may not have been
sufficient for formation of skim milk fouling.
The formation of fouling deposits on the walls of the evaporation tubes contributed to a
decrease in the overall heat transfer coefficient, due to a greater resistance to be crossed by the
heat flow. Therefore, an increase in the concentrated flow rate was observed with the increase in
fouling formation due to a decrease of the evaporation rate. The evolution of these operating
parameters thus caused a change in mean residence time, i.e. a decrease in the heat transfer
coefficient (U) leading to a decrease in the product mean residence time (τ). However and
despite the decrease of mean residence time, U and product mass flow rate remained almost
constant whatever the processing time and the fouling deposit. This means that τ is not only

General conclusion
influenced by the mass flow rate, but by other factors such as product concentration, flow profile
and product interactions with the wall of the evaporator. These findings also indicate that τ
variation due to fouling is more sensitive than the heat transfer coefficient and evaporation rate
changes, it is another tool to fouling detection.
Besides, no significant loss of skim milk components was identified after evaporation.
However, a decrease in mineral content was observed over the processing time in the sweet
whey experiment. Despite the high fouling rate identified in the lactic acid whey experiment
related to the higher concentration of minerals in the lactic acid whey, the composition of lactic
acid whey remained constant before and after evaporation. Even with a loss of minerals in the
deposit (fouling formation), this loss was minor compared to the mineral content of the product,
and could not therefore be identified. The sweet whey product presented a smaller quantity of
minerals than lactic acid whey, and thus a small loss of mineral content caused a decrease in
the mineral content in the final product, which could then be identified. Several operating
parameters, such as steam and product temperature, product flow, conductivity and mean
residence time were used to indicate the fouling formation of different dairy products in a FFE.
Finally, the main innovative result of the PhD project was to highlight the impact of
appropriate instrumentation combined with the understanding provided by process engineering
that resulted in good characterization of the falling film evaporation process, which is an
important operation in the dryer dairy industry in terms of energy consumption and final powder
quality. This study emphasized the crucial role of process characterization to improve the
performance of FFE and product quality. Characterization of the evaporator process thus
represents a potential way to tune process performance and thus achieve the anticipated
functional properties of a concentrate.
Future outlook
FUTURE τUTLττK
The initial framework of this PhD project comprised a study of the vacuum evaporation
process performed in a falling film evaporator. Despite being an important operation used to
concentrate solutions in the food industry, there are few scientific papers concerning the
concentration of dairy products in falling film evaporators. The industry has achieved expertise in
this domain in an empirical way. This study presents approaches to thermodynamic and
hydrodynamic characterization of the falling film vacuum evaporation process, which is an
essential step for studies of the interactions between product and process. The main focus of the
future outlook is therefore modifications of the product during its concentration in a falling film
evaporator. Considerable effort will be required in order to integrate understanding of the
vacuum evaporation process into concentrate quality control and process performance. Specific
development of new products will depend on the final application of the concentrate and
therefore on its physicochemical and microbiological properties (protein denaturation, flavor,
color reactions, nutritional aspects, etc.).
Overall, this PhD project is an investigative study which demonstrated that good
characterization of the process can provide valuable information on the optimal performance of
the process and on final concentrate properties. From this starting point, various investigations
can be proposed, in order both to consolidate any hypothesis developed in the PhD project and
to extend understanding of modifications of product properties during vacuum evaporation and
their likely influence on the performance of the process. Three key points emerged: i.e. control of
product quality during the vacuum evaporation process, fouling formation and cleaning
procedures.

Future outlook
Control of product quality during the vacuum evaporation process using residence time
distribution functions
As it is possible to calculate the residence time distribution function (RTD), and therefore
the exact time that a given proportion of product particles takes to pass through the evaporator,
the temperature profile of the product can be calculated during concentration in the vacuum
evaporation process, because the evaporation temperature in such pilot equipment can be kept
constant.
The residence time distribution of a product in the vacuum evaporator equipment
depends, among other things, on the operating parameters, such as the flow rate, evaporation
temperature, heating power, etc. Study of the influence of the operating parameters on the RTD
of different products will therefore provide elements to create models for prediction of changes in
the minimum, mean and maximum product residence times. This information, combined with the
temperature profile of the product, can thus be used to monitor some characteristics of the
product during its concentration such as the rate of protein denaturation, destruction and / or
growth of microorganisms, destruction of vitamins, Maillard reaction rate, etc. This information
will make it possible to produce products with specific nutritional and techno-functional qualities,
such as gelling properties and water binding capacity, and to optimize sensory properties (aroma,
taste, and mouth-feel). Another application of the RTD function is in the study of fouling
formation and cleaning procedures of the falling film evaporator.
Fouling formation
The extent of fouling formation of different dairy products during concentration was
studied in a falling film evaporator. It was shown that fouling formation throughout the process
time in the same operating conditions depends on the composition of the product. The mass of
the deposit formed for different products and operating parameters should therefore be

Future outlook
measured and its composition determined. This requires methodology that ensures the complete
removal of the deposit formed on the inner walls of the evaporator tubes.
A device for collecting the deposit formed was developed (Fig. 1). This device is inserted
at the bottom of the evaporator tubes and it is then removed from the top. It thus scrapes the
inner wall of the evaporation tube, allowing collection of the deposits (Fig. 1 – B). However, this
device collects deposits throughout the tube, i.e. in a qualitative way. It is therefore not possible
to collect the deposit from a given section of the evaporation tube (e.g. only the deposits formed
at the bottom or at the top of the tube). As the product properties change during passage
through the tubes, the composition of the deposits must also change. Study of the composition
of the deposits formed in different sections of the evaporator tube is therefore necessary. This
information will provide the responses to questions such as how does the nature of the product
influence fouling formation, what is the nature of product components deposited on the wall of
the tube, and what is the best cleaning procedure to remove these deposits?
Figure 1. (A) Scraper device to collect deposits formed in the evaporation tubes and (B)
Scraper device showing the deposits collected.
A B

Future outlook
Vacuum evaporator cleaning procedures
Evaporator cleaning procedures in the dairy industry are not standardized. Each industry
has its own way of conducting the evaporator cleaning process, i.e. process time before cleaning,
circulation time, order and concentration of the cleaning agents, etc. In other words, there are as
many evaporator cleaning procedures as products to be concentrated. By optimizing the
cleaning procedures, a reduction in energy costs and use of cleaning agents by 50% and 25%,
respectively, can be achieved (Jeurnink and Brinkman, 1994). The cleaning procedures of the
falling film evaporator should be studied on the basis of measurement of product RTD in the
vacuum evaporator and therefore the possibility of calculation of the time that different solutions
take to pass through the equipment. The aim of such study is to optimize the cleaning and
rinsing times, and the concentration of chemical cleaning agents used (nitric acid and sodium
hydroxide). Moreover, a choice of a tracer or a solution property, such as conductivity,
concentration, etc., should be established for calculation of the RTD functions of the cleaning
solutions. This should decrease the time, and therefore the cost, of rinsing and cleaning
operations, which should also contribute to decreasing the costs of the vacuum evaporation
operation and improvement of the sustainability of the process. Another stage in the study of
cleaning procedures is the development of different strategies for cleaning the evaporator, such
as determination of the best order of use of cleaning solutions (alkaline + acid or acid +alkaline)
and their concentrations. The previous study of the nature of the deposits should therefore be
useful to improve cleaning procedures.

References
REFERENCES
Adib, T.A., 2008. Estimation et lois de variation du coefficient de transfert de chaleur surface/
liquide en ébullition pour un liquide alimentaire dans un évaporateur à flot tombant. AgroParis
ech, Paris.
Adib, T.A., Heyd, B., Vasseur, J., 2009. Experimental results and modeling of boiling heat
transfer coefficients in falling film evaporator usable for evaporator design. Chem. Eng. Process.
Process Intensif. 48, 961–968. doi:10.1016/j.cep.2009.01.004
Adib, T., Vasseur, J., 2008. Bibliographic analysis of predicting heat transfer coefficients in
boiling for applications in designing liquid food evaporators. J. Food Eng. 87, 149–161.
doi:10.1016/j.jfoodeng.2007.12.013
Anurjew, E., Hansjosten, E., Maikowske, S., Schygulla, U., Brandner, J.J., 2011. Microstructure
devices for water evaporation. Appl. Therm. Eng., MNF 2009 Special Issue 31, 602–609.
doi:10.1016/j.applthermaleng.2010.05.009
Baldwin, A., Baucke, A., Sanderson, W., 1980. The Effect of Concentrate Viscosity on the
Properties of Spray-Dried Skim Milk Powder. N. Z. J. Dairy Sci. Technol. 15, 289–297.
Baloh, A., 1979. Energy in Evaporation and Drying Operations. Zuckerindustrie 104, 943–944.
Bansal, B., Chen, X.D., 2005. Fouling of heat exchangers by dairy fluids - a review. Presented at
the Proceedings of 6th International Conference on Heat Exchanger Fouling and Cleaning -
Challenges and Opportunities, Hans Müller-Steinhagen, M. Reza Malayeri, and A. Paul
Watkinson, Germany.
Bimbenet, J.-J., Duquenoy, A., Trystram, G., 2007. Génie des procédés alimentaires, 2 édition.
ed, Technique et Ingénierie. Dunod.
Bird, R.B., Stewart, W.E., Lightfoot, E.N., 1960. Transport Phenomena. New York.
Bouman, S., Waalewijn, R., Dejong, P., Vanderlinden, H., 1993. Design of Falling-Film
Evaporators in the Dairy-Industry. J. Soc. Dairy Technol. 46, 100–106.
Brans, G., Schroën, C.G.P.H., van der Sman, R.G.M., Boom, R.M., 2004. Membrane
fractionation of milk: state of the art and challenges. J. Membr. Sci. 243, 263–272.
doi:10.1016/j.memsci.2004.06.029
Burton, H., Franklin, J.G., Williams, D.J., Chapman, H.R., Jean, A., Harrison, W., Clegg, L.F.L.,
1959. An analysis of the performance of an ultra-high-temperature milk sterilizing plant: IV.

References
Comparison of experimental and calculated sporicidal effects for a strain of Bacillus
stearothermophilus. J. Dairy Res. 26, 221–226. doi:10.1017/S002202990000995X
Cayot, P., Lorient, D., 1998. Structures et technofonctions des protéines du lait. Arilait-
Recherches, Tec et Doc Lavoisier, Paris, 1998 ISBN 2-7430-0229-8
Changani, S.D., BelmarBeiny, M.T., Fryer, P.J., 1997. Engineering and chemical factors
associated with fouling and cleaning in milk processing. Exp. Therm. Fluid Sci. 14, 392–406.
doi:10.1016/S0894-1777(96)00141-0
Chen, X.D., Bala, P., 1998. Investigation of the influences of surface and bulk temperatures
upon fouling of milk components onto a stainless steel probe. Proc. Fouling Clean. Food
Process. 25–32.
Chong, L.X.Q., Lin, S.X.Q., Chen, X.D., 2009. Concentration Dependent Viscosity in Milk
Evaporation Process, In Engineering Our Future: Are We up to the Challenge?, Burswood
Entertainment Complex, Barton, ACT: Engineers Australia, 1149–1158.
Chun, K.R., Seban, R.A., 1971. Heat Transfer to Evaporating Liquid Films. J. Heat Transf. 93,
391-396. doi:10.1115/1.3449836
Chun, M., Park, S., 1995. Effects of Turbulence Model and Interfacial Shear on Heat-Transfer in
Turbulent Falling Liquid-Films. Int. Commun. Heat Mass Transf. 22, 1–12. doi:10.1016/0735-
1933(94)00047-O
CNIEL, 2015. L’économie laitière en chiffres – édition 2015. URL
http://www.calameo.com/read/002230051347964ef558f (accessed 27 august 2015).
CNIEL, 2012. Market for dried dairy products - Trade development and investments.
Croguennec, T., Jeantet, R., Brulé, G., 2008. Fondements physicochimiques de la technologie
laitière. Tec & Doc Lavoisier, Paris.
Crossley, E.L., Campling, M., 1957. The Influence of Certain Manufacturing Processes on the
Staphylococcus Aureus Content of Spray-Dried Milk. J. Appl. Bacteriol. 20, 65 – 70.
doi:10.1111/j.1365-2672.1957.tb04518.x
Danckwerts, P.V., 1953. Continuous flow systems. Distribution of residence times. Chem. Eng.
Sci., Frontiers of Chemical Engineering Science 2, 1–13. doi:10.1016/0009-2509(96)81810-0

References
Daufin, G., Escudier, J.P., Carrere, H., Berot, S., Fillaudeau, L., Decloux, M., 2001. Recent and
emerging applications of membrane processes in the food and dairy industry. Food Bioprod.
Process. 79, 89–102. doi:10.1205/096030801750286131
De Kruif, C.G., 1999. Casein micelle interactions. Int. Dairy J. 9, 183–188. doi:10.1016/S0958-
6946(99)00058-8
Ducept, F., Sionneau, M., Vasseur, J., 2002. Superheated steam dryer: simulations and
experiments on product drying. Chem. Eng. J. 86, 75–83. doi:10.1016/S1385-8947(01)00275-3
EMBRAPA, 2010. O mercado lacteo brasileiro no contexo mundial.
FAO, 2015. Food Outlook - Biannual report on global food markets.
Fergusson, P., 1989. Developments in the Evaporation and Drying of Dairy-Products. J. Soc.
Dairy Technol. 42, 94–101.
Fox, P.F., Brodkorb, A., 2008. The casein micelle: Historical aspects, current concepts and
significance. Int. Dairy J., Milestone achievements in dairy science research and their current
and future industrial applications, 677–684. doi:10.1016/j.idairyj.2008.03.002
Fox, P.F., McSweeney, P.L.H., 2003. Advanced Dairy Chemistry: Volume 1: Proteins, Parts A&B:
Protein v. 1, 3rd ed. 2003 edition. ed. Springer, New York.
Fryer, P.J., Robbins, P.T., Asteriadou, K., 2011. Current knowledge in hygienic design: can we
minimize fouling and speed cleaning? Procedia Food Sci., 11th International Congress on
Engineering and Food (ICEF11) 1, 1753–1760. doi:10.1016/j.profoo.2011.09.258
Gänzle, M.G., Haase, G., Jelen, P., 2008. Lactose: Crystallization, hydrolysis and value-added
derivatives. Int. Dairy J. 18, 685–694. doi:10.1016/j.idairyj.2008.03.003
Gourdon, M., Innings, F., Jongsma, A., Vamling, L., 2015. Qualitative investigation of the flow
behaviour during falling film evaporation of a dairy product. Exp. Therm. Fluid Sci. 60, 9–19.
doi:10.1016/j.expthermflusci.2014.07.017
Gray, R.M., 1λκ1. Subject: “Skim milk” Technology of skimmed milk evaporation. Int. J. Dairy
Technol. 34, 53–57. doi:10.1111/j.1471-0307.1981.tb01499.x
Grossman, G., Heath, M.T., 1984. Simultaneous heat and mass transfer in absorption of gases
in turbulent liquid films. Int. J. Heat Mass Transf. 27, 2365–2376. doi:10.1016/0017-
9310(84)90095-4

References
Gutierrez, C.G.C.C., Dias, E.F.T.S., Gut, J.A.W., 2010. Residence time distribution in holding
tubes using generalized convection model and numerical convolution for non-ideal tracer
detection. J. Food Eng. 98, 248–256. doi:10.1016/j.jfoodeng.2010.01.004
Hartley, D.E., Murgatroyd, W., 1964. Criteria for the break-up of thin liquid layers flowing
isothermally over solid surfaces. Int. J. Heat Mass Transf. 7, 1003–1015. doi:10.1016/0017-
9310(64)90042-0
Hentges, D., da Silva, D.T., Dias, P.A., Santos da Conceicao, R. de C. dos, Zonta, M.N., Timm,
C.D., 2010. Pathogenic microorganism survival in dulce de leche. Food Control 21, 1291–1293.
doi:10.1016/j.foodcont.2010.02.014
Horne, D.S., 2003. Casein micelles as hard spheres: limitations of the model in acidified gel
formation. Colloids Surf. Physicochem. Eng. Asp. 213, 255–263. doi:10.1016/S0927-
7757(02)00518-6
Huppertz, T., Fox, P.F., 2006. Effect of NaCl on some physico-chemical properties of
concentrated bovine milk. Int. Dairy J. 16, 1142–1148. doi:10.1016/j.idairyj.2005.09.011
IBGE, 2015. Indicadores IBGE - Estatistica da produção pecuaria.
IDF, 2014. The world dairy situation 2013.
IDF, 1993. Détermination de la teneur en azote. 4. Détermination de la teneur en azote non
protéique. Lait - Int. Dairy Fed.
IDF, 1964. International Standard FIL-IDF 27. Int. Dairy Fed.
Janssen, P.W.M., 1994. Measurement of residence time distribution of processing plant using a
cross correlation technique. J. Food Eng. 21, 215–223. doi:10.1016/0260-8774(94)90187-2
Jeantet, R., Ducept, F., Dolivet, A., Méjean, S., Schuck, P., 2008. Residence time distribution: a
tool to improve spray-drying control. Dairy Sci. Technol. 88, 31–43. doi:10.1051/dst:2007006
Jeantet, R., Gérard, B., Guillaume, D., 2011. Génie des procédés appliqué à l’industrie laitière,
2e édition. ed. Lavoisier.
Jebson, R., Iyer, M., 1991. Performances of Falling Film Evaporators. J. Dairy Res. 58, 29–38.
Jebson, R.S., Chen, H., 1997. Performances of falling film evaporators on whole milk and a
comparison with performance on skim milk. J. Dairy Res. 64, 57–67.
doi:10.1017/S0022029996001963

References
Jeurnink, T.J.M., 1995. Fouling of heat exchangers in relation to the serum protein concentration
in milk. Milchwiss. Ger.
Jeurnink, T.J.M., Brinkman, D.C., 1994. The cleaning of heat exchangers and evaporators after
processing milk or whey. Int. Dairy J. 4, 347–68. doi:doi:10.1016/0958-6946(94)90031-0
Jeurnink, T., Verheul, M., Stuart, M.C., de Kruif, C.G., 1996. Deposition of heated whey proteins
on a chromium oxide surface. Colloids Surf. B Biointerfaces 6, 291–307. doi:10.1016/0927-
7765(95)01262-1
Jimenez, M., Delaplace, G., Nuns, N., Bellayer, S., Deresmes, D., Ronse, G., Alogaili, G.,
Collinet-Fressancourt, M., Traisnel, M., 2013. Toward the understanding of the interfacial dairy
fouling deposition and growth mechanisms at a stainless steel surface: A multiscale approach. J.
Colloid Interface Sci. 404, 192–200. doi:10.1016/j.jcis.2013.04.021
Kelly, P.M., 2006. Innovation in milk powder technology. Int. J. Dairy Technol. 59, 70–75.
doi:10.1111/j.1471-0307.2006.00251.x
Kessler, H.-G., 1981. Food engineering and dairy technology. Verlag A. Kessler.
Kinsella, J.E., Whitehead, D.M., 1989. Proteins in whey: chemical, physical, and functional
properties 343–437.
Kouhikamali, R., Noori Rahim Abadi, S.M.A., Hassani, M., 2014. Numerical investigation of
falling film evaporation of multi-effect desalination plant. Appl. Therm. Eng. 70, 477–485.
doi:10.1016/j.applthermaleng.2014.05.039
Lalande, M., Tissier, J.P., 1985. Fouling of Heat Transfer Surfaces Related to beta-Lactoglobulin
Denaturation During Heat Processing of Milk. Biotechnol. Prog. 1, 131–139.
doi:10.1002/btpr.5420010210
Langeveld, L.P.M., Klijn, W., Waals, C.B., 1990. Bacterial growth in evaporators for milk and
whey. Voedingsmiddelentechnologie 23, 13–17.
Le Graët, Y., Brulé, G., 1993. Effects of pH and ionic strength on distribution of mineral salts in
milk. Lait 73: 51–60.
Leleu, R., 1992. Evaporation. In: Techniques de l'Ingénieur, Traité Génie et Procédés Chimiques
J 2320, 1–12.
Levenspiel, O., 1999. Chemical reaction engineering, 3rd ed. ed. Wiley, New York.

References
Levenspiel, O., Bischoff, K.B., 1963. Patterns of flow in chemical process vessels. Adv. Chem.
Eng. 4: 95–198.
Li, W., Wu, X.-Y., Luo, Z., Webb, R.L., 2011. Falling water film evaporation on newly-designed
enhanced tube bundles. Int. J. Heat Mass Transf. 54, 2990–2997.
doi:10.1016/j.ijheatmasstransfer.2011.02.052
Lortal, S., Boudier, J.F., 2011. La valorisation de la matière première lait, évolution passée et
perspectives. Innov. Agron. 1–12.
Luo, C., Ma, W., Gong, Y., 2011. Design of single vertical tube falling-film evaporation basing on
experiment. J. Loss Prev. Process Ind. 24, 695–698. doi:10.1016/j.jlp.2011.06.013
Mafart, P., 1991. Génie industriel alimentaire. Lavoisier, Paris, France.
Mahaut, M., Jeantet, R., Brule, G., 2000. Initiation à la technologie fromagère. Tec & Doc
Lavoisier, London ; σew York.
Malcata, F., 1991. Modeling of a Series of Continuously Stirred Tank Reactors for Thermal-
Processing of Liquid Foods. Int. J. Food Sci. Technol. 26, 535–546.
MDCI, 2014. Ministério do Desenvolvimento, Indústria e Comércio Exterior. URL
http://www.mdic.gov.br/sitio/ (accessed 8.27.15).
Milkpoint, 2014. Balança Comercial de Lácteos: Brasil dobra exportações em 2014, mas déficit
continua - Leite & Mercado - Giro Lácteo - MilkPoint URL http://www.milkpoint.com.br/cadeia-do-
leite/giro-lacteo/balanca-comercial-de-lacteos-brasil-dobra-exportacoes-em-2014-mas-deficit-
continua-92840n.aspx (accessed 27 august 2015).
Minton, P.E., 1986. Handbook of Evaporation Technology. Noyes Publications.
Miranda, V., Simpson, R., 2005. Modelling and simulation of an industrial multiple effect
evaporator: tomato concentrate. J. Food Eng. 66, 203–210. doi:10.1016/j.jfoodeng.2004.03.007
Monnier, H., Portha, J.-F., Kane, A., Falk, L., 2012. Intensification of heat transfer during
evaporation of a falling liquid film in vertical microchannels-Experimental investigations. Chem.
Eng. Sci. 75, 152–166. doi:10.1016/j.ces.2012.03.008
Morison, K.R., 2015. Reduction of fouling in falling-film evaporators by design. Food Bioprod.
Process. 93, 211–216. doi:10.1016/j.fbp.2014.10.009
Morison, K.R., Broome, S.R., 2014. Upward vapour flows in falling film evaporators and
implications for distributor design. Chem. Eng. Sci. 114, 1–8. doi:10.1016/j.ces.2014.04.015

References
Morison, K.R., Worth, Q.A.G., τ’dea, N.P., 2006. Minimum Wetting and Distribution Rates in
Falling Film Evaporators. Food Bioprod. Process. 84, 302–310. doi:10.1205/fbp06031
Murphy, P.M., Lynch, D., Kelly, P.M., 1999. Growth of thermophilic spore forming bacilli in milk
during the manufacture of low heat powders. Int. J. Dairy Technol. 52, 45–50.
doi:10.1111/j.1471-0307.1999.tb02069.x
Numrich, R., 1992. Wäirmeübergang bei der Fallfilmverdampfung 331–335.
OECD-FAO, 2015. Agricultural outlook 2015-2024.
Onwulata, C.I., Isobe, S., Tomasula, P.M., Cooke, P.H., 2006. Properties of whey protein
isolates extruded under acidic and alkaline conditions. J. Dairy Sci. 89, 71–81.
Ozden, H.O., Puri, V.M., 2010. Computational analysis of fouling by low energy surfaces. J.
Food Eng. 99, 250–256. doi:10.1016/j.jfoodeng.2010.02.013
Panouillé, M., Durand, D., Nicolai, T., Larquet, E., Boisset, N., 2005. Aggregation and gelation of
micellar casein particles. J. Colloid Interface Sci. 287, 85–93. doi:10.1016/j.jcis.2005.02.008
Paramalingam, S., Winchester, J., Marsh, C., 2000. On the Fouling of Falling Film Evaporators
Due to Film Break-Up. Food Bioprod. Process. 78, 79–84. doi:10.1205/096030800532770
Park, C.D., Nosoko, T., Gima, S., Ro, S.T., 2004. Wave-augmented mass transfer in a liquid film
falling inside a vertical tube. Int. J. Heat Mass Transf. 47, 2587–2598.
doi:10.1016/j.ijheatmasstransfer.2003.12.017
Paterson, P.J.F., 1988. A reaction engineering approach to the analysis of fouling. Chem. Eng. Sci. - CHEM ENG SCI 43, 1714–1717. doi:10.1016/0009-2509(88)85166-2
Pehlivan, H., Ozdemir, M., 2012. Experimental and theoretical investigations of falling film
evaporation. Heat Mass Transf. 48, 1071–1079. doi:10.1007/s00231-011-0962-x
Prost, J.S., González, M.T., Urbicain, M.J., 2006. Determination and correlation of heat transfer
coefficients in a falling film evaporator. J. Food Eng. 73, 320–326.
doi:10.1016/j.jfoodeng.2005.01.032
Rahman, M.S., 2009. Food Properties Handbook, Second Edition. CRC Press.
Runyon, C.H., Rumsey, T.R., McCarthy, K.L., 1991. Dynamic simulation of a nonlinear model of
a double effect evaporator. J. Food Eng. 14, 185–201. doi:10.1016/0260-8774(91)90007-F
Schraml, J.E., Kessler, H.G., 1994. Effects of concentration on fouling at hot surfaces. Fouling
and cleaning in food processing 1694, 18–25.

References
Schuck, P., 2002. Spray drying of dairy products: state of the art. Lait 82, 375–382.
doi:10.1051/lait:2002017
Schuck, P., le Floch-Fouere, C., Jeantet, R., 2013. Changes in Functional Properties of Milk
Protein Powders: Effects of Vacuum Concentration and Drying. Dry. Technol. 31, 1578–1591.
doi:10.1080/07373937.2013.816316
Silveira, A.C.P., Carvalho, A.F., Perrone, Í.T., Fromont, L., Méjean, S., Tanguy, G., Jeantet, R.,
Schuck, P., 2013. Pilot-scale investigation of effectiveness of evaporation of skim milk compared
to water. Dairy Sci. Technol. 93, 537–549. doi:10.1007/s13594-013-0138-1
Silveira, A.C.P., Tanguy, G., Perrone, Í.T., Jeantet, R., Ducept, F., de Carvalho, A.F., Schuck, P.,
2015. Flow regime assessment in falling film evaporators using residence time distribution
functions. J. Food Eng. 160, 65–76. doi:10.1016/j.jfoodeng.2015.03.016
Smith, J.S., Hui, Y.H., 2008. Food Processing: Principles and Applications. John Wiley & Sons.
Steffe, J.F., 1996. Rheological Methods in Food Process Engineering, Second Edition. ed.
Freeman Press, East Lansing, USA.
Tamine, A.., Robinson, R.K., Michel, M., 2007. Structure of Dairy Products. ed. Oxford :
Blackwell publishing, UK.
Thor, W., Loncin, M., 1978. Optimisation du rinçage final après nettoyage et désinfection. I.A.A.,
Industrie alimentaire agricole 95, 1095–1100.
Tonelli, S.M., Romagnoli, J.A., Porras, J.A., 1990. Computer package for transient analysis of
industrial multiple-effect evaporators. J. Food Eng. 12, 267–281. doi:10.1016/0260-
8774(90)90002-P
Torres, A.P., Oliveira, F.A.R., 1998. Residence time distribution studies in continuous thermal
processing of liquid foods: a review. J. Food Eng. 36, 1–30. doi:10.1016/S0260-8774(98)00037-
5
Tung, M.A., 1978. Rheology of Protein Dispersions. J. Texture Stud. 9, 3–31.
doi:10.1111/j.1745-4603.1978.tb01292.x
USDA NASS, 2015. NASS - National Agricultural Statistics Service. URL
http://www.nass.usda.gov/ (accessed 27 august 2015).

References
Varunsatian, S., Watanabe, K., Hayakawa, S., Nakamura, R., 1983. Effects of Ca++, Mg++ and
Na+ on Heat Aggregation of Whey-Protein Concentrates. J. Food Sci. 48, 42–&.
doi:10.1111/j.1365-2621.1983.tb14785.x
Velez Ruiz, J.F., Barbosa Canovas, G.V., 1997. Effects of concentration and temperature on the
rheology of concentrated milk. Trans. ASAE 40, 1113–1118.
Verdurmen, R.E.M., Straatsma, H., Verschueren, M., van Haren, J.J., Smit, E., Bargeman, G.,
de Jong, P., 2002. Modelling spray drying processes for dairy products. Lait 82, 453–463.
doi:10.1051/lait:2002023
Villermaux, J., 1993. Génie de la réaction chimique: conception et fonctionnement des réacteurs,
2. éd. rev. et augm. ed, Génie des procédés de l’École de σancy. TEC-&-DOC-Lavoisier, Paris.
Villermaux, J., 1982. Chemical Reactors. Recherche 13, 868–879.
Visser, J., Jeurnink, T.J.M., 1997. Fouling of heat exchangers in the dairy industry. Exp. Therm.
Fluid Sci. 14, 407–424. doi:10.1016/S0894-1777(96)00142-2
Walstra, P., Geurts, T.J., Noomen, A., Jellema, A., Boekel, M.A.J.., 1999. Dairy Technology:
Principles of Milk Properties and Processes. CRC Press, New York.
Walstra, P., Wouters, P., Geurts, T.J., 2006. Dairy Science and Technology, Second Edition, 2e
edition. ed. Taylor & Francis, USA.
Westergaard, V., 2004. Milk Powder Technology Evaporation and Spray Drying. Niro A/S,
Copenhagen, Denmark.
Zhu, P., Mejean, S., Blanchard, E., Jeantet, R., Schuck, P., 2011. Prediction of dry mass glass
transition temperature and the spray drying behaviour of a concentrate using a desorption
method. J. Food Eng. 105, 460–467. doi:10.1016/j.jfoodeng.2011.03.003

Table of figures
TABLE OF FIGURES
Figure 1.1. Main milk producers. Source: USDA/NASS. ...................................................................... 6
Figure 1.2. Evolution of worldwide production of milk from 2013 to 2020. (2015 to 2020:
forecast).Source: OECD/FAO, 2015. ................................................................................................... 7
Figure 1.3. Forecasts for worldwide skim milk and whole milk powder production. 2013 and 2014
(estimate), 2015 to 2020 (forecasts). Source: OECD/FAO. .................................................................. 8
Figure 1.4. Trade balance of Brazilian dairy products from 2001 to 2014 (in milk equivalent). ............. 9
Figure 1.5. Investments of more than 100 million US$ announced and/or finalized in Europe (A)
and America (B). Source: CNIEL, Company Reports, IDF 2013. ........................................................ 13
Figure 1.6. Overview of main research teams focusing on vacuum evaporation of dairy products,
since 2010. ........................................................................................................................................ 15
Figure 2.1. Raw milk at ambient temperature observed by transmission electron microscopy, (a)
where fat is present and (b) in the absence of fat (Tamine et al., 2007). ........................................... 22
Figure 2.2. Components in milk: size indication and membrane processes. MF= microfiltration, UF
= ultrafiltration, NF = nanofiltration, RO = reverse osmosis (Brans et al., 2004). ................................ 23
Figure 2.3. “Cracking” of milk featuring the vacuum evaporation and spray drying processes
(Schuck, 2002). .................................................................................................................................. 24
Figure 2.4. Whey cracking. Modified from Lortal & Boudier (2011). ................................................... 25
Figure 2.5. Flow diagram of the production of skim milk powder. ...................................................... 26
Figure 2.6. Diagram of: (A) mixture condensers, and (B) wall exchange condenser. ......................... 29
Figure 2.7. Rising Film Evaporator (www.niroinc.com). ..................................................................... 30
Figure 2.8. Forced circulation evaporator (www.niroinc.com). ........................................................... 31
Figure 2.9. Falling film evaporator (Jeantet et al., 2011). ................................................................... 33
Figure 2.10. Multi-effect evaporator (Jeantet et al., 2011). ................................................................ 34
Figure 2.11. Diagram of the cost components of an evaporator as a function of the numbers of
effects. IC = investment cost; CC = cost of consumption; SC = staff costs and TC = total cost = IC +
CC + SC. ........................................................................................................................................... 35
Figure 2.12. Temperature profile between the heating steam ( s) and the boiling product ( p) at a
steady regime in a falling film evaporator. .......................................................................................... 37
Figure 2.13. Newtonian and non-Newtonian fluids. ........................................................................... 40
Figure 2.14. Film breakdown (Hartley and Murgatroyd, 1964; Morison et al., 2006). ......................... 42
Figure 2.15. Plan and elevation views of a typical distribution system (Morison et al., 2006). ............ 43
Figure 2.16. Diagram of measurement of tracer for calculation of residence time distribution............ 44

Table of figures
Figure 2.17. Dimensionless E-curves for the axial residence time distribution model. ....................... 47
Figure 2.18. Dimensionless E-curves for the tanks in series residence time distribution model. ........ 48
Figure 4.1. Flowsheet of the evaporator. ........................................................................................... 61
Figure 4.2. Evaporation tube with independent electrical heating system. ......................................... 63
Figure 4.3. Separator integrated with indirect condenser. .................................................................. 64
Figure 4.4. Initial configuration of the evaporator. .............................................................................. 65
Figure 4.5. Plate distributor. .............................................................................................................. 66
Figure 4.6. Cone-shaped concave distributor. ................................................................................... 67
Figure 4.7. Instrumentation of the first evaporator tube. .................................................................... 68
Figure 4.8. Sampling points for determination of local and overall RTD. : measurement from inlet
to outlet of tube 1; : measurement from outlet of tube 1 to outlet of tube 2; measurement from
outlet of tube 2 to outlet of tube 3; : overall RTD measurement from inlet to outlet of the falling
film evaporator. .................................................................................................................................. 70
Figure 4.9. Skim milk apparent viscosity ( 100) measured at 60°C in function of total solids contents.72
Figure 4.10. Diagram of thermodynamics of a single stage vacuum evaporator. ............................... 74
Figure 4.11. Tracer injection x(t) and output signal at bottom of T1 (y1(t)), T2 (y2(t)) and T3 (y3(t)). ... 79
Figure 4.12. Sodium chloride concentration as a function of conductivity: A: Skim milk at 200 g·kg-1
of total solids, B: Sweet whey at 363 g·kg-1 of total solids and C: lactic acid whey at 364 g·kg-1 of
total solids. ......................................................................................................................................... 80
Figure 4.13. Reactor tank sets in series used to model the RTD of FFE for the four sections studied.
.......................................................................................................................................................... 83
Figure 5.1. Dispersion of water and skim milk with the two distributor systems. (A) plate distributor
with water, (B) plate distributor with skim milk at 120 g·kg-1 total solids and (C) cone-shaped
concave distributor with water. ........................................................................................................... 99
Figure 5.2. Evaporator tube showing the water sensor level and the loss of heat transfer surface
due the excess water injected into the heating system. .................................................................... 100
Figure 5.3. Inlet steam temperature for the experiments with whole milk at 50 kg·h-1. ..................... 104
Figure 6.1. Residence time distribution curves of skim milk in FFE at feed mass flow rate of 70
kg·h-1 and 3R. : measurement from inlet to outlet of tube 1; : measurement from outlet of tube
1 to outlet of tube 2; measurement from outlet of tube 2 to outlet of tube 3; : overall RTD
measurement from inlet to outlet of the falling film evaporator.......................................................... 119
Figure 6.2. Experimental (full line) and model (dotted line) curves of residence time distribution of
skim milk in FFE, at 3R for experiments performed at inlet mass flow rate of 60 kg·h-1. :
measurement from inlet to outlet of tube 1; : measurement from outlet of tube 1 to outlet of tube

Table of figures
2; measurement from outlet of tube 2 to outlet of tube 3; : overall RTD measurement from
inlet to outlet of the falling film evaporator. Experimental curves calculated according Eq. 4.8, 4.9,
4.10 and 4.11. Model calculated according Eq. 4.12. ....................................................................... 122
Figure 6.3. Residence time distribution (RTD) model of skim milk in FFE at section and 2R, at
feed mass flow rate of 80 kg·h-1. A: Experimental (full line) and model (dotted line) curves of
residence time distribution. B: Tanks in series reactor sets used for modelling the RTD of FFE,
showing the fraction of the product fluid elements that passed through reactor sets A and B. .......... 126
Fig. 7.1. Heat transfer coefficient of skim milk ( ), sweet whey ( ) and lactic acid whey ( ) as a
function of time. Blank spaces between U values correspond to stops of the evaporator to clean
probes. ............................................................................................................................................. 138
Figure 7.2. Heat transfer coefficient of skim milk ( ), sweet whey ( ) and lactic acid whey ( ) as a
function of time. Blank spaces between U values correspond to evaporator stops to clean probes. A:
first evaporator tube and B: second evaporator tube. ....................................................................... 145
Figure 7.3. Conductivity probe of the third evaporator tube after the first process stop. ................... 146
Figure 1. (A) Scraper device to collect deposits formed in the evaporation tubes and (B) Scraper
device showing the deposits collected. ............................................................................................ 157

Table of tables
TABLE OF TABLES
Table 1.1. Dairy export by Brazil, 2010 to 2014. ................................................................................ 10
Table 1.2. French production of dried dairy products (CNIEL, 2015).................................................. 11
Table 2.1. Average composition of bovine milk (Walstra et al., 1999). ............................................... 19
Table 2.2. Composition and properties of milk proteins (Cayot and Lorient, 1998; Walstra et al.,
2006). ................................................................................................................................................ 21
Table 2.3. Energy consumption for various water removal processes. ............................................... 26
Table 2.4. Composition of the two milk fouling categories (modified from Bansal and Chen, 2005). .. 49
Table 4.1. Dimensions of the three tubes (T1, T2 and T3) in the falling-film evaporator. Wall
thickness of each tube is 1 mm. ......................................................................................................... 62
Table 5.1. Evaporation rates for skim milk and water, showing inlet and outlet total solids content
and viscosities. Average (n=3) ± standard deviation. ......................................................................... 91
Table 5.2. Data of enthalpy balance for water and skim milk experiments performed at a total
heating power of 25.20 ± 0.05 kW. Average (n=3) ± standard deviation. ............................................ 94
Table 5.3. Calculated values of heat transfer coefficient and operating parameters for each tube of
the vacuum evaporator. Average (n=3) ± standard deviation. ............................................................ 95
Table 5.4. Evaporation rates for skim milk, whole milk and water at two different inlet mass flow
rates. ................................................................................................................................................ 102
Table 5.5. Data of enthalpy balance for water, skim milk and whole milk experiments performed at
a total heating power of 25.20 ± 0.05 kW, and two different inlet product mass flow rates. .............. 103
Table 6.1. Operational and product properties at the bottom of each evaporation tube for the three
feed mass flow rates and runs studied. T1: Evaporation tube 1, T2: Evaporation tube 2, T3:
Evaporation tube 3, 1R: first run, 2R: second run, 3R: third run. ...................................................... 114
Table 6.2. Flow behaviour, average and minimum residence time of particles of skim milk in falling
film evaporators. Measurements performed at three inlet mass flow rates and three runs for each.
1R = first run, 2R = second run, 3R = third run. ................................................................................ 118
Table 6.3. Model parameters and standard deviation of the model compared with the experimental
curves. 1R: first run, 2R: second run, 3R: third run. : measurement from inlet to outlet of tube 1;
: measurement from outlet of tube 1 to outlet of tube 2; measurement from outlet of tube 2 to
outlet of tube 3; : overall RTD measurement from inlet to outlet of the falling film evaporator. ..... 124
Table 6.4. Flow behavior, average and minimum residence time of particles of water in falling film
evaporators. Measurements performed at the inlet mass of 70 kg·h-1. ............................................. 128

Table of tables
Table 7.1. Enthalpy balance of the vacuum evaporation process at different times for skim milk,
sweet whey and lactic acid whey experiments. ................................................................................ 140
Table 7.2. Operational parameters of the vacuum evaporator process and physical-chemical
properties of skim milk, sweet whey and lactic acid whey at different process times. ....................... 141
Table 7.3. Mean residence times in the vacuum evaporator equipment calculated at different
process times for skim milk, sweet whey and lactic acid whey. ........................................................ 143
Table 7.4. Physical-chemical properties of skim milk, lactic acid whey and sweet whey before and
after evaporation at different process time. ...................................................................................... 144
Table 7.5. Operational parameters of the vacuum evaporator process and physical-chemical
properties of skim milk, sweet whey and lactic acid whey at different process times for sections
and . ............................................................................................................................................ 147
Table 7.6. Mean residence times in the vacuum evaporator equipment calculated at different
process times and sections (Fig. 3.7) for skim milk, sweet whey and lactic acid whey. .................... 149

Table of tables
Thermodynamic and hydrodynamic characterization of the vacuum evaporation process
during concentration of dairy products in a falling film evaporator
Abstract
Falling film evaporators (FFE) are widely used in the chemical, refrigeration, petroleum
refining, desalination and food industries. In the dairy industry FFE is applied for the
concentration of solutions prior to the drying step. Despite the economic importance of the
vacuum evaporation process in the manufacture of dairy dried products, the knowledge about
the process is mostly empirical. Research aiming to improve the efficiency of the process is
therefore necessary. The objective of this PhD project was to characterize experimentally a FFE
during the concentration of dairy products by means of thermodynamic and hydrodynamic
approaches, in order to study the interactions between the products properties and the operating
parameters. A pilot-scale, single-stage falling film evaporator that describes the same process
as that of an industrial scale from a hydrodynamic point of view was instrumented and used to
establish the mass and energy balances. The evaporation rate and the overall heat transfer
coefficient were calculated from the experimental data to follow up the process. A methodology
for the determination of the experimental residence time distribution (RTD) functions was
developed. RTD functions provide global information about the flow of the products during
concentration in a FFE. Increasing of the concentration of skim milk, mass flow rate and the
distance covered by the product resulted in an increase in the dispersion of the products
particles. The experimental RTD functions were modelled by a combination of two perfectly
mixed reactor tanks in series. From the interpretation of this model, two different flows, a main
and a minor flow, were identified. The RTD methodology developed on skim milk was applied to
sweet whey and lactic acid whey and the study was extended to the formation of fouling during a
5-hour concentration. The mean residence time was more sensitive to identify fouling than the
overall heat transfer coefficient and the evaporation rate. This study emphasized the crucial role
of process characterization to improve the performance of FFE and product quality.
Keywords: vacuum evaporation, falling film evaporators, dairy products, residence time
distribution, fouling

Table of tables
Caractérisation thermodynamique et hydrodynamique du procédé de concentration par
évaporation sous vide de produits laitiers
Résumé Les évaporateurs à flot tombant (EFT) sont largement utilisés dans les industries
chimiques, de la réfrigération, du raffinage du pétrole, et alimentaires. Dans l'industrie laitière,
les EFT sont appliqués pour la concentration de solutions avant l'étape de séchage. Malgré
l'importance économique du procédé d'évaporation sous vide dans la fabrication de produits
laitiers déshydratés, la connaissance du procédé est essentiellement empirique. Des recherches
visant à améliorer l'efficacité du procédé sont donc nécessaires. L'objectif de ce projet de
doctorat est de caractériser expérimentalement un EFT lors de la concentration de produits
laitiers, par des approches thermo et hydro-dynamiques, afin d'étudier les interactions entre les
propriétés des produits et les paramètres opérationnels. Un évaporateur à flot tombant, simple
effet, à l’échelle pilote, qui décrit le même processus que celui à l'échelle industrielle, d'un point
de vue hydrodynamique, a été instrumenté et utilisé pour établir les bilans massiques et
énergétiques. La capacité évaporatoire et le coefficient global de transfert de chaleur ont été
calculés à partir des données expérimentales. Une méthodologie pour la détermination
expérimentale des fonctions distribution des temps de séjour (DTS) a été développée. En effet,
les fonctions de DTS fournissent des informations essentielles sur l'écoulement des produits lors
de la concentration dans un EFT. L'augmentation de la concentration, du débit massique et de
la distance parcourue par le produit entraîne une augmentation de la dispersion des particules
dans le flux. Ces fonctions ont été modélisées par une combinaison de réacteurs en cascade,
parfaitement agités. D’après l'interprétation de ce modèle, deux flux, un principal et un
secondaire, correspondant à deux couches superposées de produit circulant à travers des tubes
d'évaporateur, a été proposé. La méthodologie développée pour le calcul des fonctions de DTS
a été appliqué pour la concentration de produits laitiers (lait écrémé, lactosérum doux et acide).
Par la suite, l'étude a été étendue à la formation de l'encrassement pendant la concentration par
évaporation sous vide. Il a été montré que le temps de séjour moyen était plus sensible pour
identifier l'encrassement que le coefficient global de transfert de chaleur et la capacité
évaporatoire. Ainsi, cette étude a souligné le rôle crucial de l’importance de la caractérisation
des EFT sous vide afin d’en améliorer leurs performances et la qualité des produits qui en sont
issu.
Mots-clés: évaporation sous vide, évaporateur à flot tombant, produits laitiers, distribution du
temps de séjour, encrassement

Table of tables
Caracterização termodinâmica e hidrodinâmica do processo de evaporação a vácuo
durante a concentração de produtos lácteos em um evaporador de película descendente
Resumo Os evaporadores de película descendente (EPD) são amplamente utilizados nas indústrias
químicas, de refrigeração, de refino de petróleo e de alimentos. Nas indústrias de laticínios, os
EPD são mais comumente utilizados para a concentração de soluções antes do processo de
secagem por spray-dryer. Apesar da importância econômica do processo de evaporação a
vácuo na produção de produtos lácteos desidratados, o conhecimento do processo é
essencialmente empírico. Estudos visando a otimização do processo são portanto necessários.
O objetivo deste projeto de doutorado é o de caracterizar experimentalmente um EPD durante a
concentração de produtos lácteos, utilizando de abordagens termodinâmicas e hidrodinâmicas
afim de se estudar as interações entre as propriedades dos produtos e os paramêtros
operacionais. Um evaporador de película descendente, simples efeito, em escala piloto, que
descreve o mesmo processo em escala industrial de um ponto de vista hidrodinâmico, foi
instrumentado e utilizado para a determinação dos balanços de massa e de energia. A
capacidade evaporativa e o coeficiente global de transferência de calor foram calculados a partir
dos dados experimentais. Uma metodologia para a determinação experimental da função de
distribuição dos tempos de residência (DTR) foi desenvolvida. As funções DTR fornecem
informações essenciais sobre o escoamento dos produtos durante a concentração em EPD. O
aumento da concentração, da vazão mássica e da distância percorrida pelo produto, provocam
um aumento na dispersão das partículas do fluxo. Estas funções foram modelados por uma
combinação de reatores em cascada, perfeitamente agitados. De acordo com a interpretação
deste modelo, dois fluxos, um primário e um secundário, correspondendo a duas camadas de
produto que fluem sobrepostas através dos tubos de evaporação, foram propostos. A
metodologia para o cálculo das funções DTR foi aplicada a diferentes produtos lácteos (leite
desnatado, soro de leite doce e ácido), e o estudo foi estendido para a formação de fouling
durante a concentração por evaporação a vácuo. O tempo de residência médio real foi mais
sensível para identificar a formação de fouling que o coeficiente global de transferência de calor
e do que a capacidade evaporativa. Este estudo enfatizou o papel crucial da caracterização do
processo de evaporação a vácuo para a otmização de EPD e da qualidade dos produtos
oriundos dessa tecnologia.
Palavras-chaves : evaporação a vácuo, evaporador de película descendente, produtos lácteos,
distribuição dos tempos de resiência, fouling