Thermodynamic considerations in renal separation processes
22
RESEARCH Open Access Thermodynamic considerations in renal separation processes Robert H. Louw 1* , David M. Rubin 2 , David Glasser 1 , Robyn F. R. Letts 2 and Diane Hildebrandt 1 * Correspondence: [email protected] 1 Materials and Process Synthesis (MaPS) Research Unit, University of South Africa, Pioneer Avenue, Roodepoort 1709, South Africa Full list of author information is available at the end of the article Abstract Background: Urine production in the kidney is generally thought to be an energy- intensive process requiring large amounts of metabolic activity to power active transport mechanisms. This study uses a thermodynamic analysis to evaluate the minimum work requirements for urine production in the human kidney and provide a new perspective on the energy costs of urine production. In this study, black-box models are used to compare the Gibbs energy inflow and outflow of the overall kidney and physiologically-based subsections in the kidney, to calculate the work of separation for urine production. Results: The results describe the work done during urine production broadly and for specific scenarios. Firstly, it shows glomerular filtration in both kidneys requires work to be done at a rate of 5 mW under typical conditions in the kidney. Thereafter, less than 54 mW is sufficient to concentrate the filtrate into urine, even in the extreme cases considered. We have also related separation work in the kidney with the excretion rates of individual substances, including sodium, potassium, urea and water. Lastly, the thermodynamic calculations indicate that plasma dilution significantly reduces the energy cost of separating urine from blood. Conclusions: A comparison of these thermodynamic results with physiological reference points, elucidates how various factors affect the energy cost of the process. Surprisingly little energy is required to produce human urine, seeing that double the amount of work can theoretically be done with all the energy provided through pressure drop of blood flow through the kidneys, while the metabolic energy consumption of the kidneys could possibly drive almost one hundred times more separation work. Nonetheless, the model’ s outputs, which are summarised graphically, show the separation work’s nuances, which can be further analysed in the context of more empirical evidence. Keywords: Human kidney, Urine production, Separation work, Gibbs energy, Energy balance, Sensitivity analysis Background Human kidneys consume a large amount of oxygen representing substantial metabolic energy: approximately 21.3 W/kg, which is equal to that of the heart and more than the brain [36]. In addition to the energy from metabolic processes, the kidneys receive energy in the form of pressurised blood, by taking 20% of the cardiac output [34]. While the energy consumption of the organs has been established and while multiple mechanisms have been studied [15], what has not been established clearly is the mini- mum work required for the kidneys to produce urine. © The Author(s). 2017 Open Access This article is distributed under the terms of the Creative Commons Attribution 4.0 International License (http://creativecommons.org/licenses/by/4.0/), which permits unrestricted use, distribution, and reproduction in any medium, provided you give appropriate credit to the original author(s) and the source, provide a link to the Creative Commons license, and indicate if changes were made. The Creative Commons Public Domain Dedication waiver (http://creativecommons.org/ publicdomain/zero/1.0/) applies to the data made available in this article, unless otherwise stated. Louw et al. Theoretical Biology and Medical Modelling (2017) 14:2 DOI 10.1186/s12976-017-0048-7
-
Upload
khangminh22 -
Category
Documents
-
view
0 -
download
0
Transcript of Thermodynamic considerations in renal separation processes

RESEARCH Open Access
Thermodynamic considerations in renalseparation processesRobert H. Louw1*, David M. Rubin2, David Glasser1, Robyn F. R. Letts2 and Diane Hildebrandt1
* Correspondence:[email protected] and Process Synthesis(MaPS) Research Unit, University ofSouth Africa, Pioneer Avenue,Roodepoort 1709, South AfricaFull list of author information isavailable at the end of the article
Abstract
Background: Urine production in the kidney is generally thought to be an energy-intensive process requiring large amounts of metabolic activity to power activetransport mechanisms. This study uses a thermodynamic analysis to evaluate theminimum work requirements for urine production in the human kidney and providea new perspective on the energy costs of urine production. In this study, black-boxmodels are used to compare the Gibbs energy inflow and outflow of the overallkidney and physiologically-based subsections in the kidney, to calculate the work ofseparation for urine production.
Results: The results describe the work done during urine production broadly and forspecific scenarios. Firstly, it shows glomerular filtration in both kidneys requires work tobe done at a rate of 5 mW under typical conditions in the kidney. Thereafter, less than54 mW is sufficient to concentrate the filtrate into urine, even in the extreme casesconsidered. We have also related separation work in the kidney with the excretion ratesof individual substances, including sodium, potassium, urea and water. Lastly, thethermodynamic calculations indicate that plasma dilution significantly reduces theenergy cost of separating urine from blood.
Conclusions: A comparison of these thermodynamic results with physiological referencepoints, elucidates how various factors affect the energy cost of the process. Surprisinglylittle energy is required to produce human urine, seeing that double the amount of workcan theoretically be done with all the energy provided through pressure drop of bloodflow through the kidneys, while the metabolic energy consumption of the kidneys couldpossibly drive almost one hundred times more separation work. Nonetheless, the model’soutputs, which are summarised graphically, show the separation work’s nuances, whichcan be further analysed in the context of more empirical evidence.
Keywords: Human kidney, Urine production, Separation work, Gibbs energy, Energybalance, Sensitivity analysis
BackgroundHuman kidneys consume a large amount of oxygen representing substantial metabolic
energy: approximately 21.3 W/kg, which is equal to that of the heart and more than
the brain [36]. In addition to the energy from metabolic processes, the kidneys receive
energy in the form of pressurised blood, by taking 20% of the cardiac output [34].
While the energy consumption of the organs has been established and while multiple
mechanisms have been studied [15], what has not been established clearly is the mini-
mum work required for the kidneys to produce urine.
© The Author(s). 2017 Open Access This article is distributed under the terms of the Creative Commons Attribution 4.0 InternationalLicense (http://creativecommons.org/licenses/by/4.0/), which permits unrestricted use, distribution, and reproduction in any medium,provided you give appropriate credit to the original author(s) and the source, provide a link to the Creative Commons license, andindicate if changes were made. The Creative Commons Public Domain Dedication waiver (http://creativecommons.org/publicdomain/zero/1.0/) applies to the data made available in this article, unless otherwise stated.
Louw et al. Theoretical Biology and Medical Modelling (2017) 14:2 DOI 10.1186/s12976-017-0048-7

This paper is aimed at providing an alternative perspective to urine production, as
opposed to studying specific mechanisms and metabolic energy consumption. It focuses
on the work done in the broader urine production processes and outlines the relation-
ship between excretion rates and minimum work requirements, which may be charac-
teristic of the system.
A number of studies have investigated the work required of the human kidneys. New-
burgh [22] built on a study from 1905 by Ladislaus van Rhorer, which aimed to deter-
mine the osmotic work of the kidneys for different amounts of water and urea
excretion. Newburgh’s study was nonetheless limited, as additional analysis could have
provided a more comprehensive understanding of the relationship between water and
urea excretion, and could also have considered the effect of other solutes. Later, Wein-
stein [38] created a more advanced model using the concept of Gibbs energy (G) and
chose to focus his study on a rudimentary representation of the counter-current multi-
plication system of the kidney within the renal medulla. Other studies [33, 35], similarly
limited to the medulla, have investigated renal energy requirements, albeit with more
sophisticated models. This paper builds on this research to determine the energy re-
quirements for urine production by the overall system under a wide variety of condi-
tions, without considering specific mechanisms.
Background to the operation of the kidney
The model used in this study is based only on the specifications of the inlet and outlet
streams and we consider only the work required to achieve the separation of the urine
from the blood. At such a high-level, the particular mechanism of separation is not im-
portant, but it is possible to determine the lowest possible work cost of separating urine
from blood. We will thus use an abstract representation of the renal system. Nonethe-
less, we will mention some of the current uncertainties in the field, such that they may
be taken into account when evaluating the results.
The kidney is a separation system designed to maintain homeostasis: blood circulating
through the body is kept at near constant solute concentrations, through the removal of
waste and excess substances by the kidney [29]. On average, one pair of human kidneys pro-
cesses approximately 900 litres of blood plasma to produce 2 litres of urine per day. In the
process the liquid, which starts with a concentration of 290 mOsm/l, is concentrated up to
1200 mOsm/l [9]. Urea is the primary waste product excreted by mammalian kidneys and
its concentration in urine is two orders of magnitude higher than in blood. (More data are
presented and referenced in the section titled Input data). Urea excretion counterbalances
the nitrogen released during the breakdown of proteins, such that the body can maintain a
nitrogen balance. Other substances, such as water, sodium and potassium, need to be ex-
creted when they are in excess and retained when they are below optimal concentration [9].
In their review of the nephrology literature, Sands and Layton [29] show that the col-
lective understanding of the mechanism of renal urine production remains incomplete,
particularly in the inner medulla. The kidney is generally thought to produce urine
through a system of active and passive mass transfer mechanisms, where the active mech-
anisms utilize metabolic energy to drive mass transfer and the passive mechanisms utilize
mass transfer driven by convection or diffusion [29]. With both types of mechanisms,
there are uncertainties. For example, Layton and Layton [14] have criticised the counter-
Louw et al. Theoretical Biology and Medical Modelling (2017) 14:2 Page 2 of 22
current multiplication paradigm, first proposed by Kuhn and Ryffel [13]. The objection is
that a new model is required to take into account recent discoveries pertaining to the
renal membrane structures and to mitigate inaccuracies in how the cortico-medullary
concentration gradient is created. Other researchers are also investigating mechanisms by
which the kidney can apply metabolic energy, for example, through physical contractions
of the pelvic wall [31] or through inner medullary lactate production [10].
MethodsThe methodology described below is similar to practises commonly used in the study
of industrial chemical processes. Our approach uses limited renal mass flow and con-
centration data from the literature to determine the mass flow rates and concentrations
of all the streams of the model, through mass balance calculations. Once the mass flow
has been calculated, one can then determine the minimum work required for separat-
ing urine from blood, using thermodynamic principles to quantify the Gibbs energy (G)
associated with the streams.
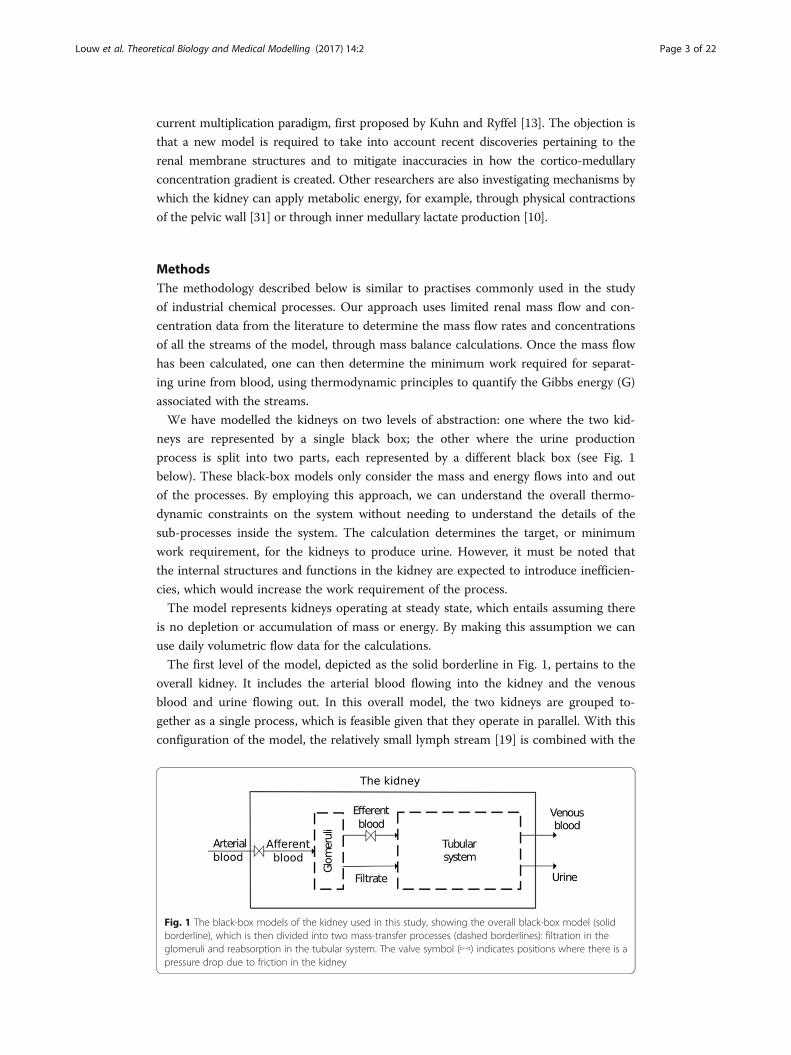
We have modelled the kidneys on two levels of abstraction: one where the two kid-
neys are represented by a single black box; the other where the urine production
process is split into two parts, each represented by a different black box (see Fig. 1
below). These black-box models only consider the mass and energy flows into and out
of the processes. By employing this approach, we can understand the overall thermo-
dynamic constraints on the system without needing to understand the details of the
sub-processes inside the system. The calculation determines the target, or minimum
work requirement, for the kidneys to produce urine. However, it must be noted that
the internal structures and functions in the kidney are expected to introduce inefficien-
cies, which would increase the work requirement of the process.
The model represents kidneys operating at steady state, which entails assuming there
is no depletion or accumulation of mass or energy. By making this assumption we can
use daily volumetric flow data for the calculations.
The first level of the model, depicted as the solid borderline in Fig. 1, pertains to the
overall kidney. It includes the arterial blood flowing into the kidney and the venous
blood and urine flowing out. In this overall model, the two kidneys are grouped to-
gether as a single process, which is feasible given that they operate in parallel. With this
configuration of the model, the relatively small lymph stream [19] is combined with the
Fig. 1 The black-box models of the kidney used in this study, showing the overall black-box model (solidborderline), which is then divided into two mass-transfer processes (dashed borderlines): filtration in theglomeruli and reabsorption in the tubular system. The valve symbol (▻◅) indicates positions where there is apressure drop due to friction in the kidney
Louw et al. Theoretical Biology and Medical Modelling (2017) 14:2 Page 3 of 22
outflow of venous blood. More research outside the scope of this study is required to
collect data relating lymph concentrations and urine concentration.
The second level of the model, outlined with the dashed borderlines in Fig. 1, shows
how the overall process is split into two processes in series. The first step of urine pro-
duction is filtration by the glomeruli, as indicated in the first sub-process in Fig. 1. In
the glomeruli, blood is split into protein-rich efferent blood, and protein-free glomeru-
lar filtrate. The second sub-process is reabsorption. Here the glomerular filtrate is par-
tially reabsorbed to leave behind concentrated urine. Any secretion that occurs in the
second sub-process is included in the net mass transfer, since the black-box model
chosen for this study only considers the total difference between inflowing and outflow-
ing streams. Moreover, substances secreted into the filtrate (for example, hydrogen
ions, organic acids and bases) have not been included and the energy associated with
these substances is assumed to be negligible, regardless of their increase in con-
centration levels, because of their low concentrations in the inlet and outlet streams
(see [20]). We will refer to the structure performing this second function, the recovery
of filtrate, as the “tubular system.” It includes the kidney’s renal tubules, the renal inter-
stitium, and capillaries.
In summary, the first level of the model contains no information regarding the in-
ternal processes in the kidney, while only the most basic process steps are included in
the second level of the model. In addition, the valve symbols in Fig. 1 indicate regions
in the kidney that are known to have large pressure drops due to friction. The pressure
energy lost to friction is not available for separation work and its inclusion in the model
will be discussed.
Input data
There are sufficient published data describing flow rates and concentrations in the hu-
man renal system to perform the theoretical calculations. This data, together with the
assumptions made, will be discussed next. The reader may consult the Appendix for a
summarised list of assumptions.
Concentration data
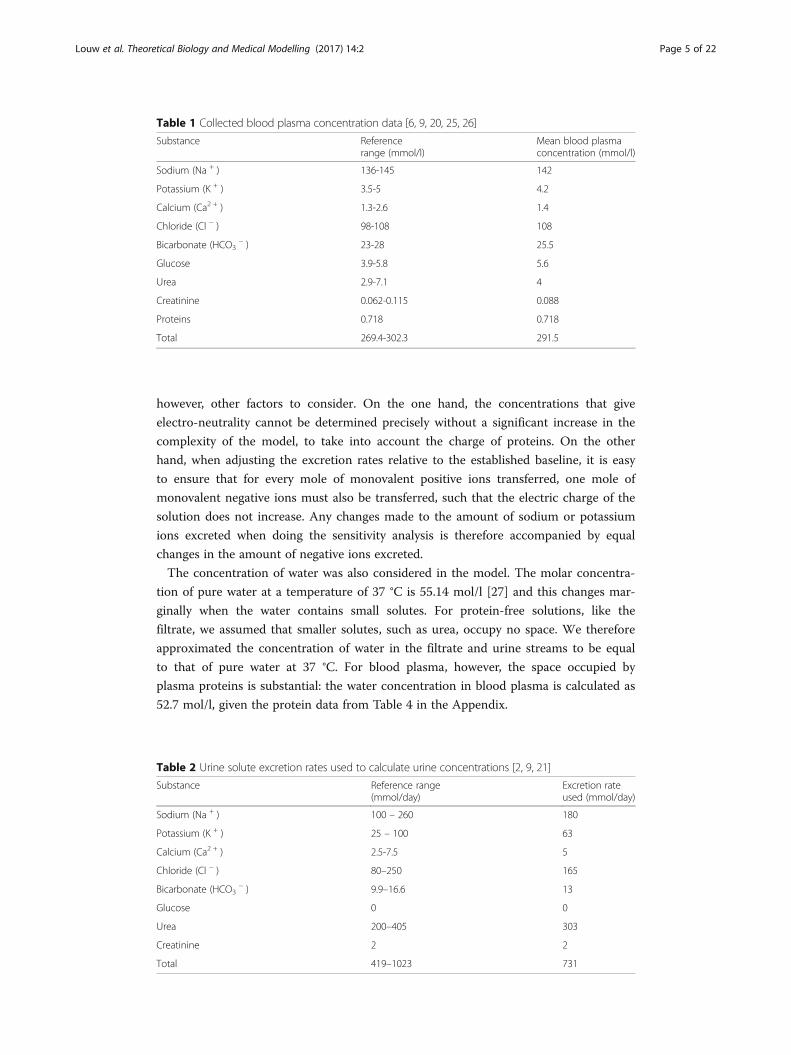
The main components of blood plasma and their concentrations are listed in Table 1.
Although red blood cells and other similarly large structures constitute a significant
fraction of the total volume or mass of blood, these components are so large that they
do not have significant molar concentrations. Consequently, they do not contribute sig-
nificantly to the mixing or entropy in the mixture, and therefore, are assumed negli-
gible in the calculations.
The solute excretion rates used in the model are shown in Table 2. This data can be
used to calculate urine concentrations, given the 24-h urine production volume. When
interpreting the results of the model, it is important to remember the maximum con-
centration of human urine expected from empirical studies is 1.2 Osm/kg water [29].
The issue of electro-neutrality deserves some attention. The authors decided to use
mean solute concentrations for urine, rather than an arbitrary combination of other
concentrations that would be closer to electrolytic neutrality. Adjusting the rates of so-
dium and chloride excretion in the model (using the link in at the end of the paper) to
achieve electro-neutrality could affect the results by as little as 1 mW. There are,
Louw et al. Theoretical Biology and Medical Modelling (2017) 14:2 Page 4 of 22
however, other factors to consider. On the one hand, the concentrations that give
electro-neutrality cannot be determined precisely without a significant increase in the
complexity of the model, to take into account the charge of proteins. On the other
hand, when adjusting the excretion rates relative to the established baseline, it is easy
to ensure that for every mole of monovalent positive ions transferred, one mole of
monovalent negative ions must also be transferred, such that the electric charge of the
solution does not increase. Any changes made to the amount of sodium or potassium
ions excreted when doing the sensitivity analysis is therefore accompanied by equal
changes in the amount of negative ions excreted.
The concentration of water was also considered in the model. The molar concentra-
tion of pure water at a temperature of 37 °C is 55.14 mol/l [27] and this changes mar-
ginally when the water contains small solutes. For protein-free solutions, like the
filtrate, we assumed that smaller solutes, such as urea, occupy no space. We therefore
approximated the concentration of water in the filtrate and urine streams to be equal
to that of pure water at 37 °C. For blood plasma, however, the space occupied by
plasma proteins is substantial: the water concentration in blood plasma is calculated as
52.7 mol/l, given the protein data from Table 4 in the Appendix.
Table 1 Collected blood plasma concentration data [6, 9, 20, 25, 26]
Substance Referencerange (mmol/l)
Mean blood plasmaconcentration (mmol/l)
Sodium (Na + ) 136-145 142
Potassium (K + ) 3.5-5 4.2
Calcium (Ca2 + ) 1.3-2.6 1.4
Chloride (Cl − ) 98-108 108
Bicarbonate (HCO3− ) 23-28 25.5
Glucose 3.9-5.8 5.6
Urea 2.9-7.1 4
Creatinine 0.062-0.115 0.088
Proteins 0.718 0.718
Total 269.4-302.3 291.5
Table 2 Urine solute excretion rates used to calculate urine concentrations [2, 9, 21]
Substance Reference range(mmol/day)
Excretion rateused (mmol/day)
Sodium (Na + ) 100 – 260 180
Potassium (K + ) 25 – 100 63
Calcium (Ca2 + ) 2.5-7.5 5
Chloride (Cl − ) 80–250 165
Bicarbonate (HCO3− ) 9.9–16.6 13
Glucose 0 0
Urea 200–405 303
Creatinine 2 2
Total 419–1023 731
Louw et al. Theoretical Biology and Medical Modelling (2017) 14:2 Page 5 of 22

Pressure data
The pressure in the kidney varies throughout the day: the kidney controls the pressure
drop through vasoconstriction at various points and thereby manipulates flow rates [9].
For the purposes of this study, the pressure drops are assumed constant, as in Table 3.
As blood flows through the kidney, its hydrostatic pressure drops, which can either
be used to overcome friction as the fluid flows along a tube or for separation work,
such as filtration. It is unclear what fraction of the energy associated with pressure drop
is used to drive flow and what is used to concentrate urine. Pressure measurements
have been reported at various points in the kidney in the literature and when looking at
the structure of the kidney, some of these measured pressure drops must be mainly
due to friction losses as there is thought to be no separation occurring over these sec-
tions of the kidney. For this reason we assumed in the model that the energy associated
with these pressure losses cannot perform work for filtration or for the recovery of
filtrate. These losses are marked by the valve symbol in Fig. 1. In the model, the pres-
sure drop due to stream splits and friction before the glomeruli is taken as 40 mm Hg
[9, 23]. Inside the glomeruli, the pressure drop on the blood side (in the glomerular ca-
pillaries) is taken as 1 mm Hg [9, 38], and the hydrostatic pressure gradient between
the blood and filtrate in the glomeruli is set at 32 mm Hg [9]. Pressure losses along the
efferent arteriole, before the peritubular capillaries and the vasa recta are approximated
as 17 mm Hg [23]. Further data are provided in Table 3.
Filtration data
The last input component required by the model is the filtration fraction of the glom-
erulus. The available data show that approximately 900 l/day of plasma is processed to
produce 180 l/day of filtrate [23, 34]. This translates into a filtration fraction of 20%
and we kept this fraction constant in all our calculations. We further assumed that all
solute concentrations in the filtrate and the efferent blood are the same, immediately
after the glomeruli, while no plasma proteins pass into the filtrate [9].
Calculations
The model used in this study, with calculation steps described below, can be downloaded
using the link given in at the end of the paper. Also, for the reader’s convenience, all of
the assumptions made while using the equations below are listed in the Appendix.
Mass flow calculations
The above data are sufficient to compute the mass flows of the black-box models, as shown
here. For the overall black-box model, we set a number of parameters: the excretion rates of
Table 3 Human pressure data used [4, 9, 23, 34]
Point Pressure (mm Hg)
Arterial blood 100
Afferent blood 60
Efferent blood (before pressure losses) 59
Efferent blood (after pressure losses) 42
Filtrate 18
Venous blood 8
Urine 8
Louw et al. Theoretical Biology and Medical Modelling (2017) 14:2 Page 6 of 22

solutes as per the median values in Table 2; the venous blood concentration of the plasma
as per Table 1; and the flow rate of the arterial blood as 900 l/day [23, 34]. In addition, we
chose the amount of water excreted to be the variable parameter, resulting in the concentra-
tion of solutes in the urine being variable. Once these variables have been allocated values,
the flow rates of the various substances in the blood leaving the kidney can be determined
as the difference between the arterial blood flow rate and the flow rate of urine.
A complete model of the flow rates in the two sub-processes, represented by two black-
box models inside of the kidney, requires two more quantities. Firstly, we assumed the
concentrations of the filtrate and efferent blood plasma are equal to that of the arterial
blood, with the exception of the efferent plasma containing all the proteins and the filtrate
containing none. Secondly, the mass flow rates are set by the filtration fraction of 20%, as
discussed above. This completes the mass flow data for all the streams considered in this
study, from which we derived the concentrations, volumes and mole fractions, as required
for the thermodynamic calculations.
Gibbs energy flow calculations
Once the mass flow in the system can be described in terms of molecular flow rates and
mole fractions, we can calculate the Gibbs energy (G). By definition, G includes all energy
available for useful work and can include work done by pressure gradients, concentration
gradients and chemical reactions [28]. At this stage, we exclude chemical reactions, and by
extension exclude the metabolic energy consumed in the kidney from the model. This term
can be added to the model if required, although with the data available at this stage, the
metabolic energy can only be estimated to an order of magnitude and the sensitivities to
variations in urine concentrations are unclear.
G can be calculated as [28]:
G ¼Xnj¼1
μjN j ð1Þ
Where:
� G = Gibbs energy flow (W);
� μj = chemical potential (also known as partial molar free energy) of component j (J/
mol); and
� N =molar flow rate of component j (mol/s).
In addition, the extent by which pressure affects chemical potential can be quantified as
follows [28]:
μj T 1; ; P2; ; xj� � ¼ μj T 1; ; P1; ; xj
� �þZ P2
P1
V J dP
By assuming the liquids are incompressible, the equation becomes:
μj T 1; ; P2; ; xj� � ¼ μj T 1; ; P1; ; xj
� �þ V jΔP
Where:
� P1 = reference pressure, chosen as ambient pressure (Pa);
� P2 = system pressure (Pa);
Louw et al. Theoretical Biology and Medical Modelling (2017) 14:2 Page 7 of 22

� T1 = reference temperature, chosen as the body’s temperature, 310 K; and
� V J = partial-molar volume of component j (m3/mol).
Furthermore, the effect of mixing in a mixture can be expressed as [28]:
μj T 1; ; P1; ; xj� � ¼ μ0j T1; ;P1ð Þ þ RT ln γ jxj
� �
Where:
� xj =molar fraction of component j in the total mixture (dimensionless);
� μj0 = chemical potential of a pure component (J/mol);
� γj = activity coefficient of component j (dimensionless); and
� R = the ideal gas constant (8.3144621 J/mol.K).
These calculations were simplified by taking activity coefficients as unity, based on a
review of available data [18, 24, 37]. Better approximations for the activity coefficients
are required to obtain results that are more accurate. In addition, partial-molar volume
V j� �
was approximated as pure component volumes (Vj).
Putting the above equations together, we obtain:
G ¼Xnj¼1
Nj μ0j T1; ; P1ð Þ þ V jΔP þ RT 1 lnxj� �
Next we set a reference point at which pure chemical compounds have a stand-
ard chemical potential of zero, at a temperature of 310 K and a pressure of 1 bar.
Assuming that there is no reaction inside the fluids, the system temperature is
310 K and all pressure measurements are in gauge pressure, such that P2-P1 = Pg,
we obtain Eq. 2, below.
G ¼Xnj¼1
NjV jPg þ RTXnj¼1
Nj lnxj ð2Þ
The first term on the right hand side of Eq. 2 is the Gibbs energy associated
with the pressure of the liquid flowing through the kidney while the second term
on the right hand side of Eq. 2 is the Gibbs energy associated with concentration,
which is associated with mixing and separation. In the context of this study, Eq. 2
will be applied to study the energy differences between the streams entering and
leaving the black-box models.
ΔGtotal ¼ Gleaving−Gentering
Here, the total change in Gibbs energy (ΔGtotal) is equal to the combined work asso-
ciated with changes in pressure and changes in the extent of separation:
ΔGtotal ¼ Wpres þWsep
Where:
Wpres ¼Xnj¼1
NjV jΔPgj ð3Þ
Louw et al. Theoretical Biology and Medical Modelling (2017) 14:2 Page 8 of 22

Wsep ¼ RTXnj¼1
Nj lnΔxj ð4Þ
By using the calculated mass flow parameters and the available pressure data in these
equations, we calculated the G associated with each stream. This served as a basis for
analysing the total change in G (ΔGtotal), the work associated with pressure change
(Wpres) and the work associated with separation (Wsep). A sample calculation is avail-
able through the link in at the end of the paper.
Finding thermodynamic limits and optima
The G equation, Eq. 2, can be used to examine the work associated with points within
the empirically measured stream property ranges from the input data. Firstly, in order
for the process to be thermodynamically feasible, there must be available capacity for
work. This implies the energy level associated with the streams leaving the system must
be lower than that entering the system, which means ΔGtotal < 0. We refer to the
thermodynamic limit, accordingly, as ΔGtotal = 0, which is the point where there is just
sufficient G flowing into the system to produce the specified outlet concentrations.
We can furthermore determine the thermodynamic optimum by finding where the
work requirement is minimised. The optimum is regarded as the point where ΔGtotal is
the most negative and excess or lost work is maximised.
Sensitivity analysis
In order for this study to present conclusive results and for future studies to build on
it, it must consider a vast range of scenarios. Hence the sensitivity analysis calculates
the dependency of separation work requirements on the excretion rate of the major
substances in urine, namely sodium, potassium, urea and water. The sensitivity of the
model under various conditions may be examined further by downloading the model
using the link in at the end of the paper.
ResultsResults obtained from the overall black-box model
The first analysis of the overall black-box model shown in Fig. 1, involved varying the
amount of water excreted while keeping the amounts of solutes excreted constant, such
that the urine concentrations are effectively varied. We chose to report the G flow in
mW, which can be converted to units of kJ/day if need be. Fig. 2 depicts the corre-
sponding change in ΔGtotal. The daily urine volume ranges on the graph where ΔGtotal
< 0 are ranges where the work supplied by the pressure drop across the system is more
than the work of separation.
On the above graph, the line labelled ΔGtotal indicates that for the overall black-box
model the total change in G is negative for urine volumes ranging from less than 1 ml/
day up to 18 l/day. Over this range the pressure supplied to the kidneys by the heart
theoretically supplies sufficient work for the urine production process to be spontan-
eous. If the energy from chemical reactions, associated with metabolic processes in the
kidneys were added into the model, the total overall change in G would have been sig-
nificantly more negative.
The line marked Wsep on Fig. 2 shows the work required to achieve the relevant
urine concentrations used as the model input parameters. This work requirement is
equal to the minimum energy required by a mechanism that operates at 100%
Louw et al. Theoretical Biology and Medical Modelling (2017) 14:2 Page 9 of 22

efficiency. Less efficient mechanisms may be present in the human kidneys and thus
the kidney may require more work in order to produce urine.
Even though the results indicate that the potential work that can be done from the
total change in G (ΔGtotal) is sufficient to produce a range of urine volumes up to 18 l/
day, there may be additional energy costs for the real system. For example, it is known
that there are pressure drops due to friction in the afferent and efferent blood streams,
before and after the glomeruli, as discussed in the pressure data section. In these sec-
tions (marked as “valves” in Fig. 1), no separation work is done and the energy is lost
to friction (an irreversible processes), which implies it cannot be used to power separ-
ation later. Consequently, additional results are included on Fig. 2, using the variables
below, to differentiate between pressure work that can be applied to drive separation
and that which is lost to friction:
Wpres ¼ Wpres; afferent þWpres; glom þWpres; efferent þ Wpres; tubulesW
fric ¼ Wpres; afferent þWpres; efferent
ð5Þ
When these known pressure losses are taken into account, the lines ΔGtotal and
Wpres, are displaced upwards by 74 mW, while the work requirement to change con-
centrations, Wsep remains unaffected. With this energy loss accounted for, the range of
flow rates of urine where ΔGtotal, <0 decreases to between 0.31 l/day and 8.1 l/day, as
shown in Fig. 2. However, regardless of the pressure lost to friction or other inefficien-
cies, the work requirement for urine production will be a minimum at a urine produc-
tion rate of 2.39 l/day for a solute excretion rate of 0.731 mol/day, as shown in Fig. 2.
Results for the two-compartment black-box model
With the two-compartment black-box model, it is possible to differentiate between the
work of glomerular filtration and the work of filtrate recovery. Again, these calculations
Fig. 2 The Gibbs energy flow in or out of the process streams for different urine volume production rates, at aconstant solute excretion of 731 mmol/day, as in Table 2. Variables depicted on the graph include total changein Gibbs energy (ΔGtotal), pressure work (Wpres), separation work (Wsep) and friction losses (Wfric); these variablesare described in Eqs. 2, 3, 4 and 5 respectively. Negative values for ΔGtotal indicate that there is excess or lostwork, which implies the stream parameters are achievable without additional work applied to the system
Louw et al. Theoretical Biology and Medical Modelling (2017) 14:2 Page 10 of 22

show the required or the available work rate, calculated as the change in the flow in G
across the glomerular compartment and the tubular system, namely ΔGglom and ΔGtub
respectively.
The calculation results for the glomeruli are given in Fig. 3 and we again consid-
ered both the pressure and mixing terms as well as the total for each box. We
made the assumption of a constant 20% filtration fraction in the glomerulus, which
is the reason any change in urine production volume does not affect the G terms
in the glomeruli. We find that Wglom,sep = 5 mW while Wglom,pres = -13 mW mean-
ing that ΔGglom = -8 mW. Thus, the model is in accord with conventional under-
standing of how the glomeruli work: sufficient power is available from the pressure
drop across the glomeruli to produce the filtrate.
In the tubular system, Wsep does depend on the urine production rate, as
can be deduced from the process schematic in Fig. 1 and can be seen in the
results shown in Fig. 4. Wsep reaches a minimum at 23 mW, when 2.39 l/day
of urine is produced. Because Wpres for the tubular system is constantly at
-41 mW, ΔGtub, total is -17 mW at the minimum. In this theoretical system,
there is excess capacity for work when ΔGtub, total is negative, when urine pro-
duction is between 0.5 l/day to 6.5 l/day. Despite availability of this energy,
the complexity of renal tubules requires the consideration of multiple other
factors to determine to what extent, if at all, this energy from pressure is
available for further urine formation. This is explored further in the discussion.
Sensitivity analysis: The effect of varying solute excretion
The overall black-box model is dependent on more factors than those considered in
Figs. 2, 3 and 4 above, such as variations in the excretion rate of specific solutes or the
concentration of the blood plasma fed into the system. In this sub-section, we first
Fig. 3 The Gibbs energy flow in or out of the process streams during glomerular filtration for different urinevolume production rates, at a constant solute excretion of 731 mmol/day, as in Table 2. The blue line is theseparation work across the glomeruli; the orange line is the pressure work and the black line is the sum ofthese two. Negative values for G indicate excess potential to do work
Louw et al. Theoretical Biology and Medical Modelling (2017) 14:2 Page 11 of 22

consider the effect of varying solute excretion, followed in the next sub-section by the
variation of plasma concentration. For these results, we analysed separation work
(Wsep) in the overall system and its dependency on the rate at which different sub-
stances are excreted. The results are depicted as contours of Wsep in a two-dimensional
plain. These contours in the graphs are the boundaries of the attainable region for dif-
ferent amounts of energy applied. For example, Wsep for the overall system is less than
45 mW within the “+45 mW” contour. We have not included Wpres in the contours
such that we can have clarity that the quantity of work required to separate the sub-
stances is independent of which mechanism carries out the work.
Figure 5 depicts the effect of varying the amount of sodium and chloride ions ex-
creted on the urine volume produced, while urea excretion is varied in Fig. 6 and potas-
sium chloride excretion is varied in Fig. 7. The figures also include reference ranges for
typical human excretion rates, as given in Table 2, which serve to place the results into
perspective.
In the above graphs, the water excretion rate associated with minimum work shifts
dramatically: from 8.4 l/day in Fig. 5 to 1.4 l/day in Fig. 6 to 2.1 l/day in Fig. 7. These
volumes are the optima predicted by the model and whether the kidneys do function
accordingly remains to be established by clinical research. We further observe that
within the ranges of normal human excretion, and within the reference ranges, the
optimum lies between 2 and 3 l/day in all of the above graphs.
The optimum point is lowest on Fig. 6. At this point, the work requirement is only
4 mW, which indicates there would be no need to do work on the system to produce
the specified urine concentrations. Here the urea concentration in the urine is close to
that of the blood: in the urine, urea concentration is 4.2 mmol/l, while it is
4 mmol/l in the blood.
Beyond the results depicted graphically, there are additional numerical results that
are of interest. The calculations depicted in Fig. 5 also show that if 45 mW were
Fig. 4 The Gibbs energy flow in or out of the process streams during tubular reabsorption and itscomponents for different urine volume production rates, at a constant solute excretion of 731 mmol/day, asin Table 2. As in the previous graph, the blue curve corresponds to separation work, the orange line topressure work and the black curve to the total. Negative values for G indicate excess potential to do work
Louw et al. Theoretical Biology and Medical Modelling (2017) 14:2 Page 12 of 22

Fig. 6 A Gibbs energy contour map, depicting the effect of varying the amount of water and urea excreted onseparation work (Wsep) in the overall kidney, with the dashed lines indicating the typical reference range ofexcretion rates in humans. The concentrations of all other solutes and the reference range concentration are asin Table 2
Fig. 5 A Gibbs energy contour map, depicting the variation of separation work (Wsep) in the overall kidney, as sodiumchloride and water excretion is varied, with the dashed lines indicating the typical reference range of excretion rates inhumans. The concentrations of all other solutes and the reference range concentration are as in Table 2
Louw et al. Theoretical Biology and Medical Modelling (2017) 14:2 Page 13 of 22

applied doing separation work, it is theoretically possible to excrete approximately 21%
of the water filtered out of the blood by the glomeruli: that is 37.8 l/day of 180 l/day. In
contrast, the same quantitative amount of work is sufficient to excrete 62% of the fil-
tered amount for urea. For potassium and sodium ions the maximum excretion rates
are about 40% and 43% of the amount in the original filtrate, respectively.
At one point on the +45 mW contour, the concentration of sodium is 2.8 times higher in
the urine than in the blood. What is more, elsewhere on the same +45 mW contour the
sodium concentration in the urine goes down to one twentieth of the concentration in the
blood. For urea this ratio of concentrations ranges from 432 to 0.03 times that in blood.
This means that the boundary lines for the thermodynamically attainable region in the
graphs are not always determined by the concentration gradient between the blood and the
urine. At some point other substances’ concentration differences between the blood and fil-
trate would limit urine production.
Sensitivity analysis: Varying blood plasma concentration
The model offers an opportunity to build on the work of Newburgh [22], who first indicated
a possible thermodynamic feedback that changes the work requirements for urine excretion,
as the blood concentration is affected by the excretion of urine. To explore this impact, we
carried out another analysis to determine the effect of plasma dilution on urine production
work requirements.
Figures 8 and 9 show the results obtained from two different perspectives. In Fig. 8, the
plasma solute concentrations were varied by the addition or removal of water. In order to
Fig. 7 A Gibbs energy contour map, depicting the effect of varying the amount of water and potassiumchloride excreted on separation work (Wsep) in the overall system, with the dashed lines indicating thetypical reference range of excretion rates in humans. The concentrations of all other solutes and thereference range concentration are as in Table 2
Louw et al. Theoretical Biology and Medical Modelling (2017) 14:2 Page 14 of 22

arrive at Fig. 9, we first assumed that the standard plasma volume is 3 litres [9], and then
we calculated the standard amount of solutes in the body. This can be done from the con-
centrations listed in Table 1. Finally, we varied the plasma volume while keeping the blood
solutes in the body constant, to construct the work requirement contour lines on the graph.
The results depicted in Fig. 9 show that if the plasma volume increases by 100 ml from
3 litres to 3.1 litres, then the maximum feasible urine volume increases by 190 ml, if
Fig. 8 The required amount of separation work (Wsep) required in the overall kidneys to produce a volumeof urine, relative of plasma solute concentrations for the blood entering the kidneys
Fig. 9 The separation work requirement (Wsep) for different urine production volumes in the humankidneys, when a person’s blood plasma volume is varied while the amount of blood solutes is keptconstant. In this graph, a person who would otherwise contain 3 litres of blood plasma and 291 mmol/l ofsolutes, as in Table 1, has his blood diluted or concentrated through the addition or removal of water. Inother words, this graph effectively depicts changes in the blood plasma concentration fed into the systemversus the work requirement associated with urine production volumes
Louw et al. Theoretical Biology and Medical Modelling (2017) 14:2 Page 15 of 22

45 mW is applied constantly doing separation work. Alternatively, if the plasma volume
were decreased from 3 litres by 100 ml, then the maximum feasible urine volume produ-
cible with 45 mW of work would decrease by 190 ml. With 35 mW applied, the max-
imum feasible urine volume changes only by 120 ml per 100 ml extra plasma.
DiscussionThe overall model
The model correlates well with other studies. According to Fig. 2, where the solute ex-
cretion rate is 731 mmol/day, the work requirements are minimum at a urine produc-
tion rate of 2.39 l/day, at a chemical work requirement of 28 mW. This corresponds to
the optima calculated by Newburgh [22]: the optimum urine production rate was calcu-
lated as 2.36 l/day and the chemical work requirement as 38 mW, at a solute excretion
rate of 780 mmol/day (which comprised of 400 mmol/day urea and 190 mmol/day of
both sodium and chloride ions).
These theoretical calculation results from simplified models of the kidney do corres-
pond to empirically measured results. Indeed, the urine volume that minimises work
requirements is approximately equal to the water intake requirement for a person. A
review of empirical studies shows that a water intake of 2.5 l/day is needed by the aver-
age inactive man to maintain constant levels of hydration over several days [30]. This
study also indicates water intake requirement can increase to 3.7 l/day for men who are
more physically active, which may be attributed to increased perspiration [30].
Actual energy consumption in the kidneys is two orders of magnitude larger than the
theoretical amount of energy needed to do the work associated with separating a urine
stream from blood. The kidneys use about 7% of the oxygen consumed by the body
[32], and the average basal metabolic rate for a person is about 80 W [9]. Hence, the
average metabolic rate of the kidney can be estimated as 6 W.1 At least 60% of this
amount is thought to be used to drive mass transfer for urine production [32]. In con-
trast, as shown in Fig. 2 and as corroborated in the sensitivity analysis results, the ef-
fective amount of work done through changing concentrations, that is in separating the
streams, is in the order of 54 mW or less. Moreover, the calculations from Fig. 2 show
that the heart supplies 128 mW to the kidney via blood pressure.
The results obtained from the first overall model of the kidneys, Fig. 2, show that
there is sufficient capacity for work to produce urine – without any additional energy
from metabolism or chemical reactions. The total G change over the entire process is
quantitatively sufficient for urine production to be spontaneous for volumetric rates be-
tween 0.31 l/day and 8.1 l/day. Thus, there is a possibility that some real system could
perform the same work as the kidneys, with the same feed and exit streams, without
needing any of the 6 W of energy available from metabolic processes. It is not known
from these calculations, however, what mechanisms would make up a system that uti-
lises available pressure work (Wpres) to drive separation (Wsep).
The two-compartment model
By splitting the model into two compartments, as in Fig. 1, the model becomes more rep-
resentative of the human kidneys: it simulates the creation of a protein-free filtrate, just
like the kidneys, and it accounts for the pressure lost in order to control the afferent and
Louw et al. Theoretical Biology and Medical Modelling (2017) 14:2 Page 16 of 22

efferent blood pressures. With this model we can differentiate between the work done in
the glomeruli and the work done while recovering the filtrate in the tubular system. More
importantly, we can determine where energy is lost and where it is available.
Filtration takes place in the first compartment, which represent the glomeruli. Fig-
ure 3 shows that separation work takes place at a rate of +5 mW, while work is being
done through pressure drop at a rate of -13 mW. This implies sufficient G for a stand-
ard filtration process, wherein a spontaneous decrease in pressure drives the non-
spontaneous process of creating a concentrate.
Now that the concentration gradient created by glomerular filtration has been quanti-
fied as a 5 mW work investment, we know the maximum quantity of work that can be
done with the concentration gradient is 5 mW. The concentration gradient between
the efferent blood and the filtrate could thus possibly be used to drive the recovery of
filtrate later in the system, as discussed by Letts et al. [16].
The work requirements for the second compartment, the tubular system, reaches a
minimum point at 2.39 l/day similar to the results of the overall system, as shown in
Fig. 4 and Fig. 2 respectively. Since the separation work goes down to +23 mW, while
the pressure work is constant at -41 mW, it seems there is sufficient change in G over
the tubular system for it to concentrate the filtrate without the application of additional
work. However, there is no obvious mechanism to utilise the pressure drop for driving
mass transfer, given that the pressure gradient at the start of the tubular black box is
such that flow would be driven from the efferent blood to the filtrate.
Solute excretion limits
The sensitivity analysis of the solutes excreted further showed the incongruity between
the 6 W of metabolic energy consumption of the kidneys and the amount of separation
work done. Separation work done in the overall process only amounts to 45 mW when
extreme amounts of a particular solute are excreted. In addition, the results show that
when sodium, potassium and urea excretion are at the maximum of their reference
ranges, while urine volume is low at 1 l/day, the separation work requirement is only
54 mW. Other researchers have similarly concluded that the overall kidneys’ separation
work is between 19 and 44 mW [1, 22]. With this study, we thus gain further confi-
dence in the conclusion that the separation work requirement is relatively small.
By correlating extreme excretion rates, which have been measured empirically in med-
ical cases, with specific model results, it is possible to further assess the maximum work
capacity of the kidneys. There have been reports of urine production volumes of up to
20 l/day in humans [9] and the model’s results show at least two ways in which such a
high urine production rate could be achieved. Figure 5 shows that an average human can
produce 20 l/day of urine, with less than 35 mW allocated to the recovery of filtrate in the
tubular system, if about 3 mol/day of sodium chloride were available for excretion. Alter-
natively, solute excretion rates could remain normal if the plasma concentration is diluted
to at least 0.09 mol/l, as shown in Fig. 8, while 45 mW is applied in the tubular system.
The latter case may relate to a clinical condition known as hypotonic hyponatremia, dur-
ing which diluted plasma is associated with excessive urine production [12].
Other extreme cases are the known minimum water excretion rate and the maximum
urine concentration. The lower daily urine volume limit is known as the “obligatory
Louw et al. Theoretical Biology and Medical Modelling (2017) 14:2 Page 17 of 22
urine” production rate. It is roughly 0.5 l/day for the average adult [9]. Such a low volu-
metric flow rate can be achieved with less than 45 mW of separation work, when solute
excretion for each substance is at the mean value of the reference ranges, such that the
total solute excretion is 731 mmol/day, as in Fig. 2. Figures 5, 6 and 7 also show scenar-
ios in which 0.5 l/day of urine is produce with 45 mW of separation work or less.
This amount of work is also sufficient to reach the maximum urine concentration
achievable by humans, which is 1.2 mol/l [29] as mentioned earlier. As shown in Fig. 2,
45 mW of work is sufficient to produce a concentration of 1.462 mol/l, with the solute
excretion set at 0.731 mol/day.
Note that it is possible to produce a smaller daily volume of urine, with the same rate
of doing work, by reducing the amount of potassium chloride or urea excreted. De-
creasing urea excretion to the bottom of the reference range will drop the minimum
urine flow rate to 0.2 l/day, while implementing the same change on potassium chlor-
ide excretion brings the lower limit down to 0.4 l/day. This is clear from the 45 mW
contours in Figs. 6 and 7.
Lastly, we will mention one more medical condition that can be used to quantify
the exact limitation of the kidneys to do separation work. It can be seen in Figs. 5,
6 and 7 that the energy demands for solute excretion increase more for increased
urea or potassium chloride excretion, than for sodium chloride excretion. Abnor-
mally high excretion rates do occur during a pathological condition called rhabdo-
myolysis: muscle damage elevates the need for urea and potassium excretion. In
extreme cases of rhabdomyolysis a patient can go into acute renal failure [11]. On
the one hand, the removal of urea and potassium through hemodialysis or continu-
ous hemofiltration has been shown to be an effective treatment for renal failure in
such cases [11]. On the other hand, according to our model, in extreme cases of
rhabdomyolysis there would be a greater than normal energy requirement. Thus,
data collected from patients who suffer acute renal failure owing to rhabdomyolysis
could provide an opportunity for future researchers to investigate the exact separ-
ation limitations of the kidneys.
Feedback from plasma dilution
Newburgh [22] first suggested from his calculations that in a scenario where higher
solute excretion rates are required, the accumulation of solutes in the body could
reduce the energy requirements for renal excretion. This is in agreement with the
results from this study. Figure 8, in particular, shows how the changes in blood
concentration can affect the optimal and feasible urine volumes. This figure shows
that decreases in blood concentration would cause increased urine volumes, while
increases in blood concentration decrease the urine volume. The implication is
this: if the kidney excretes too much water from the body and the blood plasma is
consequently concentrated, then there is an automatic thermodynamic feedback
that limits the urine volume. Conversely, if its ability to excrete is impaired, an ac-
cumulation of substances will reduce the energy requirement for excretion and
thus facilitate excretion.
As a thought experiment that illustrates this point, one can imagine a perfectly hy-
drated person, with 3 litres of blood plasma, who rapidly drinks 1 litre of water. If one
Louw et al. Theoretical Biology and Medical Modelling (2017) 14:2 Page 18 of 22

assumes that the total volume of water is absorbed into the blood, without entering
other compartments of the body, the model shows that diluting the blood to this extent
will increase the water excretion rate possible with 45 mW of separation work by 1.9 l/
day. Hence, the system response to increased water ingestion is to excrete the extra vol-
ume ingested automatically, unless a smaller amount of energy is applied to do separ-
ation work. Figure 9 shows this relation is linear and decreases in blood concentration
plasma similarly decrease urine volume.
There are many more factors to consider in a system as complex as human
physiology. From a physiological perspective, for example, not all the additional
water may be taken up in the blood. From a thermodynamic perspective, the ex-
tent of this feedback would be dependent on a person’s initial plasma volume.
More measurements from empirical experiments are required for a conclusive ana-
lysis on the relation between water ingestion and renal workload. Nonetheless, as
our first approximation has demonstrated, such thermodynamic feedback might be
utilised by the body.
Additional considerations
There are factors that will make the energy required in the kidney more than the effective
amount of separation work done, but the possibility also exists that the work requirement
in the tubular system may be less than estimated. Factors that could increase the energy
requirement include inefficiencies such as the diffusion of ions back into the filtrate [5], as
well as pressure losses due to friction. On the other hand, non-ideal behaviour of plasma
proteins could potentially increase the energy storage in the glomeruli: a non-linear in-
crease in the blood’s osmolality would increase the concentration gradient and decrease
the energy requirement for filtrate recovery in the tubular system.
The model’s results show that in the glomeruli 13 mW of power is spent via pressure
drop, while creation of a protein-free filtrate makes 5 mW available in the form of a
concentration gradient. Thus, 38% of the pressure drop in the glomeruli is invested in
the creation of a protein-free filtrate. However, the non-ideal behaviour of proteins,
particularly serum albumin, has not been taken into account and it may significantly
affect the efficiency of energy storage. Consider, for example, Cameron et al. [3] pro-
posal that serum albumin’s dynamic behaviour could provide the driving force for the
movement of water into and out of cells. While Weinstein [39] has studied the effect of
this protein on renal processes, little attention has been given to its dynamic behaviour.
There are more phenomena related to the functions of proteins in the kidney that have
yet to be studied [7, 17]. Ultimately, all of these effects can be accounted for by the ac-
tivity coefficient (γ) in the G, as shown in Equation 2. It is recommended that future
models include this complexity.
ConclusionsThis study has produced results in agreement with previous theoretical and empirical
studies, and then proceeded further to analyse a vast array of scenarios for urine con-
centrations. In particular, large amounts of data have been generated describing the
variation of separation work requirements caused by changes in sodium, potassium and
urea excretion. Although these numerical results may provide more insights when
Louw et al. Theoretical Biology and Medical Modelling (2017) 14:2 Page 19 of 22

combined with additional empirical evidence, this paper builds arguments for two main
conclusions: the first relates to the amount of energy required, while the second relates
to the sensitivities of the system.
We conclude that the separation work requirement (around 20 to 54 mW) is two or-
ders of magnitude smaller than the metabolic energy consumed by the kidneys (6 W),
and less than half of the total work available from pressure (128 mW). The black-box
models used in this study do not indicate how this energy might be utilised or whether
the human kidneys could utilise this energy. However, it is theoretically possible for a
system to exist that applies only the pressure from afferent blood to produce the same
urine and purified blood that the kidneys produce.
An investigation into the model’s sensitivity to other parameters showed unexpected
thermodynamic characteristics of the system. The results indicated that more dilute
plasma fed into the kidney results in lower energy costs for larger urine volumes. This
effect is such that for each additional 100 ml of water by which the plasma is diluted,
the feasible urine volume increases by 190 ml, if the quantity of work associated with
separation is kept constant at 45 mW. More data from empirical experiments are re-
quired to determine whether this renal control mechanism is actually used by human
kidneys.
Further progress may be made with the line of investigation used in this study,
through more detailed modelling, specifically by relating plasma concentration to urine
production or incorporating the dynamic behaviour of plasma proteins. Indeed, we can-
not claim to have a complete understanding of the glomerular energy storage mechan-
ism, which entails the creation of a protein concentration gradient, without considering
data on the non-ideal behaviour of human serum albumin.
Endnotes1The energy consumption of the kidneys is measured as 21.3 W/kg [8, 36]. When this
figure is multiplied by the weight of two average kidneys, which is 0.3 kg combined [9],
the total energy consumption is 6 W.
AppendixSummary of assumptions
List of assumptions:
� The model is based on the physical functions of a healthy human being.
� The components not included in the model do not significantly affect the
thermodynamics of the system.
� There is no accumulation or depletion of substances inside the kidney, over the
time period in consideration.
� Concentrations of sodium, potassium, calcium, chloride ions, bicarbonate ions,
urea, creatinine and glucose are the same in the glomerular filtrate and the
efferent blood, immediately after the glomeruli.
� The pressure losses due to friction are constant.
� The energy calculations have a reference point of compounds at 310 K.
� The pressure values are gauge pressure, and the ambient pressure is 1 bar.
� The urine pressure is equal to that of the renal veins.
Louw et al. Theoretical Biology and Medical Modelling (2017) 14:2 Page 20 of 22
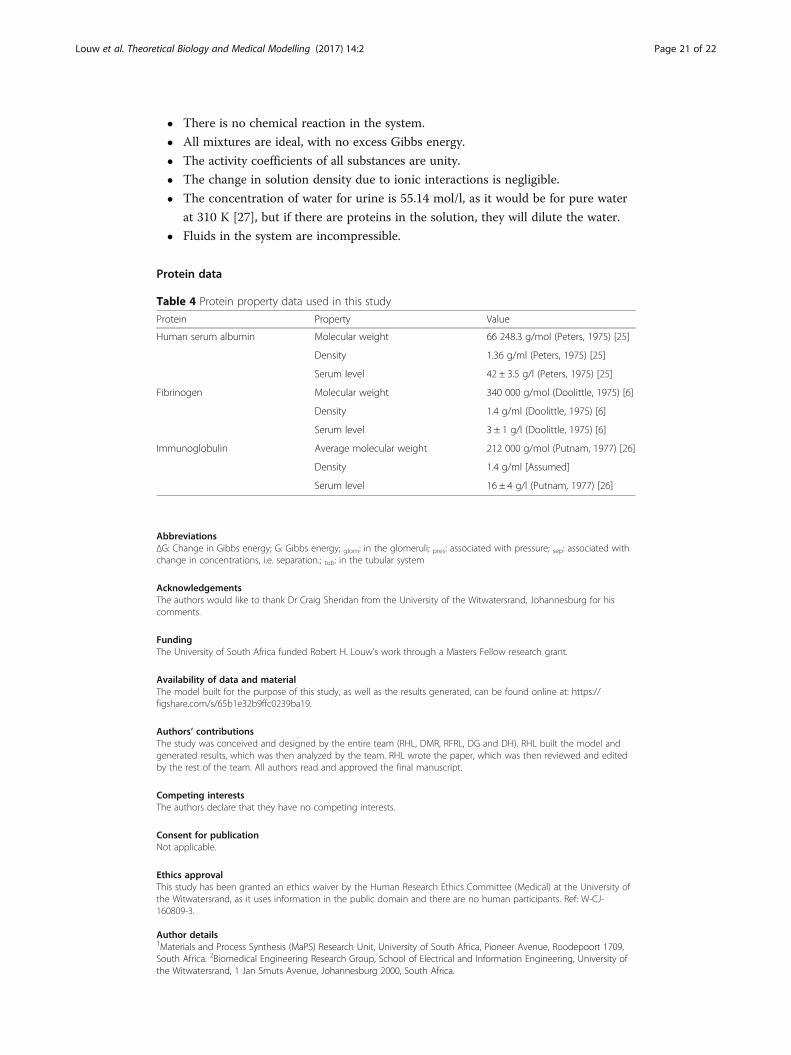
� There is no chemical reaction in the system.
� All mixtures are ideal, with no excess Gibbs energy.
� The activity coefficients of all substances are unity.
� The change in solution density due to ionic interactions is negligible.
� The concentration of water for urine is 55.14 mol/l, as it would be for pure water
at 310 K [27], but if there are proteins in the solution, they will dilute the water.
� Fluids in the system are incompressible.
Protein data
AbbreviationsΔG: Change in Gibbs energy; G: Gibbs energy; glom: in the glomeruli; pres: associated with pressure; sep: associated withchange in concentrations, i.e. separation.; tub: in the tubular system
AcknowledgementsThe authors would like to thank Dr Craig Sheridan from the University of the Witwatersrand, Johannesburg for hiscomments.
FundingThe University of South Africa funded Robert H. Louw’s work through a Masters Fellow research grant.
Availability of data and materialThe model built for the purpose of this study, as well as the results generated, can be found online at: https://figshare.com/s/65b1e32b9ffc0239ba19.
Authors’ contributionsThe study was conceived and designed by the entire team (RHL, DMR, RFRL, DG and DH). RHL built the model andgenerated results, which was then analyzed by the team. RHL wrote the paper, which was then reviewed and editedby the rest of the team. All authors read and approved the final manuscript.
Competing interestsThe authors declare that they have no competing interests.
Consent for publicationNot applicable.
Ethics approvalThis study has been granted an ethics waiver by the Human Research Ethics Committee (Medical) at the University ofthe Witwatersrand, as it uses information in the public domain and there are no human participants. Ref: W-CJ-160809-3.
Author details1Materials and Process Synthesis (MaPS) Research Unit, University of South Africa, Pioneer Avenue, Roodepoort 1709,South Africa. 2Biomedical Engineering Research Group, School of Electrical and Information Engineering, University ofthe Witwatersrand, 1 Jan Smuts Avenue, Johannesburg 2000, South Africa.
Table 4 Protein property data used in this study
Protein Property Value
Human serum albumin Molecular weight 66 248.3 g/mol (Peters, 1975) [25]
Density 1.36 g/ml (Peters, 1975) [25]
Serum level 42 ± 3.5 g/l (Peters, 1975) [25]
Fibrinogen Molecular weight 340 000 g/mol (Doolittle, 1975) [6]
Density 1.4 g/ml (Doolittle, 1975) [6]
Serum level 3 ± 1 g/l (Doolittle, 1975) [6]
Immunoglobulin Average molecular weight 212 000 g/mol (Putnam, 1977) [26]
Density 1.4 g/ml [Assumed]
Serum level 16 ± 4 g/l (Putnam, 1977) [26]
Louw et al. Theoretical Biology and Medical Modelling (2017) 14:2 Page 21 of 22

Received: 30 August 2016 Accepted: 11 January 2017
References1. Borsook H, Winegarden HM. The Work of the Kidney in the Production of Urine., 17(1), 3. Proc Natl Acad Sci U S
A. 1931;17(1):3–12.2. Burtis CA, Ashwood ER, Bruns DE. Tiez Textbook of Clinical Chemistry and Molecular Diagnostics. St. Louis: Elsevier
Health Sciences; 2012.3. Cameron IL, Kanal KM, Fullerton GD. Role of protein conformation and aggregation in pumping water in and out
of a cell. Cell Biol Int. 2006;30(1):78–85.4. Casellas D, Navar LG. In vitro perfusion of juxtamedullary nephrons in rats. Am J Physiol. 1984;246(3):F349–58.5. Clausen C, Layton AT, Moore LC, Nieves-González A. Transport efficiency and workload distribution in a
mathematical model of the thick ascending limb. Am J Physiol Ren Physiol. 2013;304(6):F653–64.6. Doolittle RF. Fibrinogen and Fibrin. In: Putnam FW. The Plasma Proteins. New York: Academic Press; 1975. p. 115.7. Edelmann L. Doubts about the sodium-potassium pump are not permissible in modern bioscience. Cell Mol Biol.
2005;51(8):725–9.8. Elia M. Organ and tissue contribution to metabolic rate. Ener Metabolism. 1992;1992:19–60.9. Guyton AC, Hall JE. Textbook of Medical Physiology. Philadelphia: Elsevier Saunders; 2006.10. Hervy S, Thomas SR. Inner medullary lactate production and urine-concentrating mechanism: a flat medullary
model. Am J Physiol Ren Physiol. 2003;284(1):F65–81.11. Huerta-Alardı́n AL, Varon J, Marik PE. Bench to bedside review: Rhabdomyolysis. An overview for clinitians. Crit
Care. 2005;9(2):158–69.12. Kraft MD, Btaiche IF, Sacks GS, Kudsk KA. Treatment of electrolyte disorders in adult patients in the intensive case
unit. Am J of Health-Syst Pharm. 2005;62:1663–82.13. Kuhn W, Ryffel K. Herstellung konzentrierter Lösungen aus verdünnten durch bloße Membran Wirkung. Ein
Modellversuch zur Funktion der Niere. Hoppe-Seyler’s Zeitschrift für Physiologische Chemie. 1942;246(4):145–78.14. Layton AT, Layton HE. Countercurrent multiplication may not explain the axial osmolality gradient in the outer
medulla of the rat kidney. Am J Physiol Renal Physiol. 2011;301(5):F1047–56.15. Layton AT, Layton HE, Dantzlet WH, Pannabecker TL. The mammalian urine concentrating mechanism: hypotheses
and uncertainties. Physiology. 2009;24(4):250–6.16. Letts RFR, Rubin DM, Louw RH, Hildebrandt D. Glomerular protein separation as a mechanism for powering renal
concentrating processes. Med Hypothesis. 2015;85(2):120–3.17. Lo Nostro P, Ninham BW. Hofmeister phenomena: an update on ion specificity in biology. Chem Rev. 2012;
112(4):2286–322.18. McBride DW, Rodgers VG. Predicting the Activity Coefficients of Free-Solvent for Concentrated Globular Protein
Solutions Using Independently Determined Physical Parameters. PLoS One. 2013;8(12):e81933.19. McIntosh GH, Morris B. The lymphatics of the kidney and the formation of renal lymph. J Physiol. 1971;214(3):365–76.20. Merck Sharp & Dohme Corp., 2014. Blood tests: Normal Values. [Online] Available at: http://www.merckmanuals.
com/professional/appendixes/normal_laboratory_values/blood_tests_normal_values.html [Accessed 11 July 2014].21. Merck Sharp & Dohme Corp, 2014. Urine Tests: Normal Values. [Online] Available at: http://www.merckmanuals.
com/professional/appendixes/normal_laboratory_values/urine_tests_normal_values.html [Accessed 11 July 2014].22. Newburgh JD. The changes which alter renal osmotic work. J Clin Investig. 1943;22(3):439–66.23. Oken D. An analysis of glomerular dynamics in rat, dog, and man. Kidney Int. 1982;22(2):136–45.24. Ornelas DN, Ozaki NU, McBride DW, Rodgers VGJ. Osmotic pressure of bovine serum albumin in the presence of
calcium chloride with low ionic strength. Univ Calif Riverside Undergraduate Res J. 2013;7:62–92.25. Peters T. Serum Albumim. In: Putnam F.W. The Plasma Proteins. New York: Academic Press; 1975.26. Putnam FW. Immunoglobulins Structure. In: Putnam FW. The Plasma Proteins. New York: Academic Press; 1977.27. Rogers GFC, Mayhew YR. Thermodynamic and Transport Properties of Fluids. Oxford: Wiley-Blackwell; 1995.28. Sandler SI. Chemical, Biochemical, and Engineering Thermodynamics. Hoboken: John Wiley & Sons; 2006.29. Sands JM, Layton HE. The Urine Concentrating Mechanism and Urea transporters. In: Alpern RJ, Moe OW, Caplan
M, eds. Seldin and Giebisch’s The Kidney. Fifth Edition. London: Academic Press; 2013.30. Sawka MN, Cheuvront SN, Carter R. Human water needs. Nutr Rev. 2005;63(1):30–9.31. Schmidt-Nielsen B. The renal concentrating mechanism in insects and mammals: a new hypothesis involving
hydrostatic pressures. Am J Physiol Regul Integr Comp Physiol. 1995;268(5):1087–100.32. Sekine T, Endou H. Solute Transport, Energy Consumption, and Production in the Kidney. In: Alpern RJ, Moe OW,
Caplan M eds. Seldin and Giebisch’s The Kidney. London: Academic Press; 2013.33. Stephenson JL, Tewarson RP, Mejia R. Quantitative analysis of mass and energy balance in non-ideal models of
the renal counterflow system. Proc Nat Acad Sci. 1974;71(5):1618–22.34. Thomson SC, Blantz RC. Biophysical Basis of Glomerular Filtration. In: Alpern R.J, Moe OW, Caplan M, eds. Seldin
and Giebisch’s The Kidney. London: Academic Press; 2013.35. Vilbig RL, Sarkar A, Zischkau J, Knepper MA, Pisitkun T. An online tool for calculation of free-energy balance for the
renal inner medulla. Am J Physiol Renal Physiol. 2012;303(3):F366–72.36. Wang Z, Ying Z, Bosy-Westphal A, Zhang J, Schautz B, Later W, Heymsfield SB, Müller MJ. Specific metabolic rates
of major organs and tissues across adulthood: evaluation by mechanistic model of resting energy expenditure.Am J Clin Nutr. 2010;92(6):1369–77.
37. Wang X, Wexler AS, Marsh DJ. The effect of solution non-ideality on membrane transport in three-dimensionalmodels of the renal concentrating mechanism. Bull Math Biol. 1994;56(3):515–46.
38. Weinstein AM. Thermodynamics relations in a system of parallel flow tubes. Math Biosci. 1977;36(1):1–14.39. Weinstein AM. Sodium and Chloride Transport: Proximal Nephron. In: Alpern RJ, Moe OW, Caplan M, eds. Seldin
and Giebisch’s the Kidney. Academic Press; 2013.
Louw et al. Theoretical Biology and Medical Modelling (2017) 14:2 Page 22 of 22