Reforming public expenditure in industrialised countries
46
WORKING PAPER SERIES NO. 435 / FEBRUARY 2005 REFORMING PUBLIC EXPENDITURE IN INDUSTRIALISED COUNTRIES ARE THERE TRADE-OFFS? by Ludger Schuknecht and Vito Tanzi
-
Upload
khangminh22 -
Category
Documents
-
view
3 -
download
0
Transcript of Reforming public expenditure in industrialised countries

WORKING PAPER SER IESNO. 435 / FEBRUARY 2005
REFORMING PUBLIC EXPENDITURE IN INDUSTRIALISEDCOUNTRIES
ARE THERE TRADE-OFFS?
by Ludger Schuknecht and Vito Tanzi

In 2005 all ECB publications will feature
a motif taken from the
€50 banknote.
WORK ING PAPER S ER I E SNO. 435 / F EBRUARY 2005
This paper can be downloaded without charge from http://www.ecb.int or from the Social Science Research Network
electronic library at http://ssrn.com/abstract_id=647947.
REFORMING PUBLIC EXPENDITURE
IN INDUSTRIALISED COUNTRIES
ARE THERE TRADE-OFFS? 1
by Ludger Schuknecht 2
and Vito Tanzi 3
1 The authors are grateful for comments from Lars Jonung, Peter Wiertz, members of the ECB’s Fiscal Policy Division and participants ofthe workshop on “Fiscal Policy in EMU: New Issues and Challenges” organised by the European Commission’s Directorate General for
Economic and Financial Affairs, Brussels, 12 November 2004. The authors are also grateful to Anna Foden and Gerhard Schwab forinvaluable assistance.The views expressed in the paper are the authors’ and do not necessarily reflect those of their respective
institutions.2 European Central Bank, Kaiserstrasse 29, D-60311 Frankfurt am Main, Germany; e-mail: [email protected]
3 Inter-American Development Bank, 1300 New York Avenue, NW Washington, DC 20577, USA.

© European Central Bank, 2005
AddressKaiserstrasse 2960311 Frankfurt am Main, Germany
Postal addressPostfach 16 03 1960066 Frankfurt am Main, Germany
Telephone+49 69 1344 0
Internethttp://www.ecb.int
Fax+49 69 1344 6000
Telex411 144 ecb d
All rights reserved.
Reproduction for educational and non-commercial purposes is permitted providedthat the source is acknowledged.
The views expressed in this paper do notnecessarily reflect those of the EuropeanCentral Bank.
The statement of purpose for the ECBWorking Paper Series is available fromthe ECB website, http://www.ecb.int.
ISSN 1561-0810 (print)ISSN 1725-2806 (online)

3ECB
Working Paper Series No. 435February 2005
CONTENTSAbstract 4
Non-technical summary 5
1. Introduction 7
2. Developments in public expenditure in thepast two decades 10
3. Public expenditure reform andsocio-economic indicators 22
4. Conclusion 40
Bibliography 41
Annex table – variables and series 42
European Central Bank working paper series 43
Abstract In this paper, we show that, contrary to common beliefs, over the past two decades several countries were able to reduce public spending by remarkable amounts. These countries did not seem to have suffered from these large reductions either in a macroeconomic sense, or in terms of lower values for socio-economic indicators. On the contrary, ambitious expenditure reform coincides with improvements in fiscal, economic, human development and institutional indicators. Positive developments associated with expenditure reform, in some instances, have taken a while to materialize and early and persistent reformers have, hence, already seen more of them. Unfavourable effects on income distribution within countries are small and they are mitigated in absolute terms by faster growth in the medium run and by the possibilities of better targeting of public spending. Moreover, there is significant divergence across countries that suggests that country circumstances and reform design matter.
Keywords: public expenditure, expenditure reform, economic growth, socio economic indicators JEL classification: H5, H6, O57
4
ECBWorking Paper Series No. 435February 2005

Non-technical summary
The period up to the early 1980s witnessed a remarkable growth in public spending in most
industrialized countries, and particularly on their “welfare states”. Since the late 1960s
skepticism as to the benefits from an ever-increasing role of the state started to be
expressed and theoretical and empirical evidence started to accumulate that suggested that
a much smaller level of public spending would be able to promote basic social objectives.
In this paper, we show that over the past two decades several countries were able to reduce
public spending by remarkable amounts. Average public spending that had peaked at
almost 52% of GDP over the past 20 years, in a sample of 22 industrialized countries, fell
by almost 7% of GDP and is now slightly below the 1982 ratio. However, this average
masks large differences across countries: 5 countries reduced primary spending (i.e. total
spending excluding interest) by 8 or more percent of GDP. Three countries did not
experience expenditure reducing reforms and reported their peaks in primary spending for
2002, at the end of the sample period.
Reforms took place in two main waves in mostly difficult economic times: the early to
mid-1980s and the early to mid-1990s. There is no evidence that expenditure reductions
strongly hurt spending on public education and investment, the supposedly most
productive categories. Most reductions concerned transfers and subsidies and interest
spending.
The study finds that countries undertaking ambitious expenditure reform did not seem to
have suffered from these large reductions either in a macroeconomic sense, or in terms of
lower values for socio-economic indicators. On the contrary, ambitious expenditure
reform was generally accompanied by improvements in fiscal indicators. They made
possible significant deficit and debt reductions while providing some room for tax cuts.
5ECB
Working Paper Series No. 435February 2005

While expenditure reform in most instances was not accompanied by significant short-run
output losses, it was accompanied by a significant recovery in trend growth and
employment, especially in countries that undertook ambitious reforms. Moreover,
expenditure reform was correlated with improvements in indicators of institutional quality
and did not coincide with less favourable developments of human development indicators.
In some instances, positive developments associated with expenditure reform took a while
to materialize. But early and persistent reformers have already benefited most from them.
Unfavourable effects from expenditure reform on income distribution were small and were
mitigated, in absolute terms, by faster growth and by better targeting of public spending.
However, there is significant divergence across countries that suggests that country
circumstances and reform design matter.
6
ECBWorking Paper Series No. 435February 2005

I. Introduction
In an earlier study, the authors of this paper traced the growth of public spending in
industrialized countries for the period between 1870 and the middle of the 1990s. They
showed that public spending as a share of gross domestic product (GDP) grew at a fast
pace especially in the period since World War One. The pace of growth in the majority of
countries was particularly pronounced in the period after 1960 when many established
what came to be called a welfare state. That study also attempted to assess the productivity
of that growth in spending by looking at its impact on a variety of socio-economic
indicators. It did this by dividing the sample of countries into three groups, depending on
the level reached in the most recent years by the ratio of public spending to GDP. These
three groups were labeled small, medium and large government countries.
The matching of each of these groups with the values of many of the socio-economic
indicators failed to support the conclusion that larger levels of public spending produced
better indicators. On the contrary, for a majority of these indicators, lower public spending
seemed to be associated with better or more desirable results. The authors speculated that a
level of public spending somewhere between 30 and 35 percent of GDP was likely to
provide the government of a country with resources sufficient to support all the activities
that genuinely merit public support. They concluded that in future years the policymakers
of the industrialized countries would come to share this conclusion and would initiate
programmes that, over a period of time (perhaps a generation), would bring public
spending down to that range in spite of pressures that would come from fiscally unfriendly
demographic changes.1
When the welfare states were created, pushing the level of public spending to high
percentages of GDP, the industrialized countries were part of a world economy that was
1 This section draws from Tanzi (2004)
7ECB
Working Paper Series No. 435February 2005

not well integrated and had markets that suffered from many inefficiencies. In that period
(largely the 1950s and first half of the 1960s) economists developed economic concepts –
public goods, externalities, cost-benefit analysis, merit goods – that gave governments
justifications for intervention. The view that markets were inefficient and needed to be
significantly supplemented by public intervention became popular and gave politicians the
incentive and the excuse to expand the role of the state. At that time public choice had not
yet developed as a serious field of study. In some countries the expansion of the public
sector was considerable. In others it was more limited. But all countries saw public
spending go up as a share of GDP. In a number of countries this share exceeded 50 per
cent, especially when the programmes created universal entitlements for the countries’
citizens.
Now, half a century later, the situation has changed. First of all markets have
become more sophisticated than they were in the 1950s. Second, countries are much less
autarkic than they used to be. Therefore goods and services that cannot be provided
efficiently by the domestic market can be bought from other countries more easily than in
the past. . Policymakers have become more sensitized to the fact that high levels of public
spending create inefficiencies on the tax side – because they require higher tax rates – and
on the expenditure side – because they require large bureaucracies, and because, from the
individual citizen’s point of view, government services often have a zero (or at least a very
low) price thus stimulating greater demand for them. Finally, high public spending may
lead to macroeconomic difficulties when it is partly financed by fiscal deficits.
It is now generally accepted that the state must correct shortcomings of the market
and not replace the market. Therefore, a more developed market should require less
government spending. It has also become more obvious that when the government enters a
market by establishing, de facto, a government monopoly in a particular activity, it
8
ECBWorking Paper Series No. 435February 2005

prevents or makes it more difficult for the market to develop fully in that activity. This has
happened in many countries in areas such as pensions, education, health, infrastructures,
energy, transportation and some other services. In many of these areas, experiments in
various countries have indicated that, given the opportunity (and with some efficient
regulatory guidance by the public sector) the private market can provide the necessary
services more efficiently than the government. When this happens, the government has the
option of providing targeted assistance to those who may be too poor to buy from the
private sector services such as health and education. Available evidence indicates that
countries that have lower levels of public expenditure as shares of GDP do a better job at
targeting public transfers toward those at the bottom of the income distribution.2
In conclusion, governments can be much leaner and yet equally effective in
attaining their basic objectives if they focus on providing a functioning administration that
protects property rights and the rules of law, and on supporting the provision of essential
public goods (including infrastructure and basic schooling) and basic social safety nets.
And there are forces at work—domestic and global economic and political developments
and pressures, for greater knowledge and transparency—that will help set this process into
motion.
In the rest of this paper we will show that the trend that we had predicted, toward
lower levels of public spending, may actually be happening. We shall show that over the
past two decades several countries were able to reduce public spending from its highest
level by remarkable amounts. Furthermore, these countries did not seem to have suffered
from these large reductions either in a macroeconomic sense, or in terms of lower values
for socio-economic indicators.
2 See OECD, Income Distribution in OECD Countries (Paris: 1995).
9
ECBWorking Paper Series No. 435
February 2005

It is necessary to stress that this is a broad-brush paper that attempts to identify
trends that have been largely missed by economists. Obviously much more work would be
necessary to give full backing to its conclusions. We hope that such work will follow.
II. Developments in Public Expenditure in the Past Two Decades
In this section we shall consider developments in the share of public spending into
GDP for 22 industrialized countries over the past two decades. We shall argue that these
developments contain lessons that have not been extracted so far. They are, broadly, in the
direction predicted in a book published a few years ago. See Tanzi and Schuknecht (2000).
However, within the sample considered, there are still great differences in trends among
groups of countries.
We shall start our story in 1982. In that year total public spending, as a share of
GDP, averaged 46.5 percent for the whole sample of 22 countries, and 47.2 percent for the
countries of the euro zone. The level had grown significantly since 1960 in practically all
industrialized countries. There were, however, great differences around this average, with
Japan and Switzerland spending less than 33 percent of GDP while Belgium and Sweden
spent more than 60 percent of GDP. Other countries spending less than 40 percent of GDP
were Australia, Greece, Spain and the United States. Other countries spending more than
55 percent of GDP comprised Denmark, the Netherlands and New Zealand. See Table 1.
10
ECBWorking Paper Series No. 435February 2005

Total expenditure: 1982, year of maximum spending ratio, 2002Percent of GDP
1982 Maximum public 2002 Changeor nearest expenditure ratio or nearest Maximum-2002
(1) (2) (3) (5)Australia 38.1 40.2 (1985) 35.6 -4.6Austria 49.0 57.3 (1995) 51.3 -5.9Belgium 60.8 61.0 (1983) 50.5 -10.5Canada 46.5 52.8 (1992) 41.4 -11.4Denmark 57.8 60.7 (1994) 55.8 -4.9Finland 41.3 60.4 (1993) 50.1 -10.3France 49.8 55.5 (1996) 53.6 -1.9Germany 48.1 50.3 (1996) 48.5 -1.8Greece 35.4 51.0 (1995) 46.8 -4.2Ireland 49.8 49.8 (1982) 33.5 -16.4Italy 48.3 57.1 (1993) 48.0 -9.1Japan 32.9 40.0 (1998) 39.8 -0.2Luxembourg 49.5 49.5 (1982) 44.3 -5.2Netherlands 58.6 58.7 (1983) 47.5 -11.2New Zealand 56.5 56.5 (1985) 41.6 -14.9Norway 45.6 54.1 (1994) 47.5 -6.6Portugal 40.0 46.3 (2001) 46.0 -0.3Spain 35.9 47.6 (1993) 39.9 -7.7Sweden 64.3 68.0 (1993) 58.3 -9.7Switzerland 32.8 35.7 (1998) 34.3 -1.4United Kingdom 44.8 45.4 (1984) 41.1 -4.3United States 36.2 37.2 (1992) 34.1 -3.1
Average 46.5 51.6 45.0 -6.6Euro zone 47.2 53.7 46.7 -7.0
Ambitous reformers, early 56.4 56.5 43.3 -13.2Ambitious reformers, late 47.1 56.7 48.1 -8.6Timid reformers, early 44.1 45.0 40.3 -4.7Timid reformers, late 45.5 49.4 45.7 -3.7Non reformers 36.1 45.8 44.2 -1.6Standard deviation 9.2 8.4 7.1Source: EU Commission, AMECO
If we consider the latest years for which data are available – 2002 - or the closest
year to 2002 – we notice that the average level of public spending fell marginally, from
46.5 percent of GDP in 1982 to 45.0 percent of GDP in 2002, for all the countries, and
from 47.2 percent of GDP to 46.7 percent of GDP, for the countries of the euro area. This
11
ECBWorking Paper Series No. 435
February 2005
small reduction gives the impression that little happened over the two decades. This,
however, is a wrong impression because, as we shall show, major changes occurred within
these two decades. We shall highlight some of the important changes.
The first change worth highlighting is the significant reduction in the dispersion of
the public expenditure ratios around the average. The countries are becoming more similar
in this aspect. All the countries that had high levels of public spending in 1982 reduced
their spending over the next 20 years. Belgium, Ireland, the Netherlands, New Zealand and
Sweden reduced public spending by substantial amounts. These had been the leaders in
public spending in 1982. Over the same period, several of the previously low spenders,
such as Greece, Japan, Portugal and Spain, increased their spending levels. Between 1982
and 2002, the standard deviation of the ratios of public spending to GDP for the 22
industrialized countries fell from 9.2 to 7.1.
The second and more important change is not obvious when the 2002 data are
compared with the 1982 data. The trend in the behaviour of public spending over these two
decades has not been the same as it had been in the preceding two decades that ended in
1982. During that earlier period public spending as a share of GDP had increased
continually and consistently in practically all the countries in the sample. For many of
these countries the year when the highest level of public spending, as a share of GDP, was
reached some time between 1982 and 2002. In other words, for many countries, public
spending kept rising after 1982 and reached a peak after 1982 but before 2002. This peak
was in most countries reached by 1996. By this later year public spending had started
falling in most countries, reversing the trend of previous decades.
To identify the breaks in the past trends, it is necessary to identify the specific years
when public spending reached a maximum for each country. We can then compare these
maxima with the values reached in 2002 to verify whether a change in trend has actually
12
ECBWorking Paper Series No. 435February 2005

occurred. Column (2) in Table 1 shows the highest ratios reached by public spending in the
countries in the sample. It also shows the year when those maxima were reached. It is
evident that, in the 1982-2002 period, public spending followed an inverted U-shaped
curve. In the majority of countries, it first rose and then fell. However, the year in which
the maximum was reached varied from country to country.
Comparing these maxima with the 2002 data, a change in the behaviour of public
spending is evident. For many countries, the 2002 figures were considerably lower than the
maximum levels reached in previous years. For the whole group of countries, the 2002
average level of public spending was a remarkable 6.6 percent of GDP lower than the
maximum reached in earlier years. It is necessary to repeat that the maximum level was not
reached in all countries at the same time. For the euro zone the average fall in public
spending was even larger, about 7 percent of GDP. In these countries public spending that,
for the years when a maximum had been achieved, had averaged 53.7 percent of GDP, fell
to 46.7 percent of GDP. This sharp fall suggests that a significant change in the trend of
public spending in industrialized countries may have started. Obviously only time will tell
whether this is a permanent trend.
In our discussion we shall ignore the initial year, 1982, and focus instead on the
changes that have occurred since peak levels were reached. Six countries reduced public
spending (G) by more than 10 percent of GDP. Classifying them in the order of the size of
the reduction, the countries are the following ones:
Country Change in (G)/GDP Year Peak Level Reached Ireland -16.4 1982 New Zealand -14.9 1985 Canada -11.4 1992 Netherlands -11.2 1983 Belgium -10.5 1983 Finland -10.3 1993
13
ECBWorking Paper Series No. 435
February 2005

The remarkable achievement of these countries is not only the size of the reduction
from the peak levels but the fact that their 2002 public spending levels were in all cases
below, and in some cases well below, the 1982 levels. In some of these countries the role
of the state, as measured by the share of public spending into GDP, was changing in a
major way moving toward the level predicted by Tanzi and Schuknecht (2000).
Six other countries cut their public spending by between 5 and 10 percent of GDP
from the peak level. In their order of reduction they were:
Country Change in (G)/GDP Year Peak Level Reached Sweden -9.7 1993 Italy -9.1 1993 Spain -7.7 1993 Norway -6.6 1994 Austria -5.9 1995 Luxembourg -5.2 1982
While the achievements of this group could also be considered significant, it was
less so than in the previous group and not only because of the size of the reduction. With
the exception of Sweden and Luxembourg, which not only reduced the spending from the
peak level but also from the 1982 level, the other countries had, in 2002, expenditure levels
that were either equal to or higher than in 1982. Sweden’s 2002 spending level was 6.0
percent of GDP lower than its 1982 level, while Luxembourg’s 2001 spending level was
5.2 percent of GDP lower than 1982. On the other hand Spain’s level was 4.1 percent
higher than in 1982 while in Italy it was approximately the same. In Italy the combination
of a high public debt with a high rate of inflation had pushed the expenditure level sharply
upward in 1993. Thus the fall in inflation, after Italy joined EMU, significantly reduced its
nominal interest payments and thus the level of public spending. However, primary
spending was affected much less.
14
ECBWorking Paper Series No. 435February 2005

Categorisation of countries by reform effort and timing
We define expenditure reductions (and more specifically primary expenditure
reductions) that follow the year of maximum spending as expenditure reform.3 As to the
timing of reforms, it is possible to distinguish two groups of countries. The first group is
constituted by countries that reached the maximum spending level by the early to mid-
1980s so that they started the process of expenditure reduction at that time. This group
includes Ireland, New Zealand, the Netherlands, Belgium and Luxembourg, and we could
add Australia and United Kingdom. We shall refer to this group as “early reformers”. The
second group includes countries that reached the maximum expenditure level in the early
to mid-1990s and that succeeded, by 2002, in reducing the share of public spending into
GDP. This group includes Canada, Finland and Sweden. In addition, Austria, Norway,
Spain, Denmark, France, Germany, Italy, Switerland and the United States also
experienced their maximum spending ratio in that period. We shall refer to them as “late
reformers”.
Among the early and late reformers another distinction reflecting the intensity of
the reform efforts might be useful. A number of countries sharply reduced the level of
public spending. Others reduced that level by much less. A dividing line of five percent of
GDP reduction could be used for classifying the countries. Those which exceeded five
percent of GDP reduction could be called ambitious reformers while the others could be
called timid reformers. However, this distinction suffers from two shortcomings. First, it
may be more difficult for a country that starts with a low expenditure level to cut five
percent of GDP from public spending than for a country that starts with a high level. This
3 If we were interested primarily in short term discretionary reform efforts, it would be appropriate to look at cyclically adjusted expenditure ratios. However, when looking at medium to long term trends (as is intended here) this distinction is less relevant. Moreover, such data is of rather low quality and is subject to considerable measurement problems and errors.
15
ECBWorking Paper Series No. 435
February 2005

is the case for Australia, Switzerland and the United States. These countries did not have
high levels of public spending so there was less to reduce. Second, a country that starts
with a high ratio of public debt to GDP and with a high rate of inflation may be able to
reduce public spending significantly simply if its inflation rate falls thus pushing down
nominal interest rates and interest payments. This was surely the case for Italy and Greece
and to a lesser extent for some other countries.
Keeping in mind the two caveats mentioned above and choosing a reduction in
primary spending by 5 percent as the threshold between timid and ambitious reforms, early
and ambitious reformers could include Belgium, Ireland, the Netherlands and New Zealand
(see the categorization table below). These four countries reduced their public spending by
a remarkable 13.2 percent of GDP from the peak level to the 2002 level. Late and
ambitious reformers could include Austria, Canada, Finland, Norway, Spain and Sweden.
These six countries reduced their average public spending from a maximum of 56.7
percent of GDP to 48.0 of GDP in 2002, or by 8.7 percent of GDP. Especially large were
the reductions in Canada, Finland and Sweden, which averaged 10.5 percent of GDP. All
these ambitious reformers provide support to the view that there is life after public
spending reductions. These countries have been among the best economic performers in
recent years. The fear, that cuts in spending bring economic showdown, has not
materialized and we will come back to this issue in more detail below.
Categories Countries
Ambitious and early reformers Belgium, Ireland, Netherlands, New Zealand
Ambitious and late reformers Austria, Canada, Finland, Norway, Spain, Sweden
“Timid” and early reformers Australia, Luxembourg, United Kingdom
“Timid” and late reformers Denmark, France, Germany, Italy, Switzerland, United States
Non reformers Greece, Japan, Portugal
16
ECBWorking Paper Series No. 435February 2005

The countries that were not part of this group of ambitious reformers include some
that were genuinely “timid” (France, Germany, Italy, Denmark and to a lesser extent
Luxembourg) and some that, having low levels of public spending to start with, had less
need to cut spending (Australia, Switzerland and the United States).4 Australia was in
many ways a major reformer but its reforms did not have as great an impact on public
spending because public spending had never been too high. The United States could
actually be in a category of its own because, for the whole period, it remained a relatively
low spending country and, over the period, reduction in defense spending was a major
factor in compensating for increases in other areas. Switzerland reported continued low
public spending but could nevertheless be called a timid reformer. Finally, the United
Kingdom reformed in many areas but early progress with public expenditure reduction was
to a significant extent reversed in later years. Nevertheless, for simplicity we refer to all
these countries as “timid” (in the strict numeric sense of the term) and distinguish “late”
and “early” timid reformers.
Finally, there was a small group of countries where primary expenditure peaked in
2002. This group is referred to as non-reformers and include the rather diverse countries of
Greece, Portugal and Japan. It should be noted that in earlier years Greece and Japan had
been low spenders.
Stylised facts
A number of interesting findings emerge from the stylized facts for these country
groups. First, most countries that reduced public spending started their reform programs in
a downturn. Average growth in the period of maximum spending averaged less than one
percent per year and, in the first year of spending reduction, it remained slightly below
4 All ambitious reformers also report primary spending ratio reductions above 5 percent of GDP, all “timid” reformers reduced primary expenditure ratios by less than 5 percent of GDP.
17
ECBWorking Paper Series No. 435
February 2005

trend on average.5 This contrasts with the frequently held view by academic economists
that the “optimal” timing of reform is in a boom when reforms associated with spending
reductions do not exert a pro-cyclical effect. The problem with this view is that policy
makers do not see the need for reform during good times.
Second, expenditure declines between the peak year and 2002 were large in many
cases (Table 1). This contradicts the pessimistic view that political economy constraints
render ambitious reforms virtually impossible. This view, which seems to be influenced
considerably by the experience of the largest countries of the euro zone, is sharply
challenged by the experience of the ambitious reformers.
Third, in several cases reform efforts often reversed earlier government expansion.
Public spending in the groups of late reformers in 2002, for example, was little changed
from 20 years earlier (despite the recent reform efforts) and it was much higher than in the
countries that reformed early. Only one country, Ireland, was able to reduce public
spending to around 35 percent of GDP thus joining the small group of countries with low
expenditure levels, a group that included Australia, Switzerland and the United States. But
Canada and New Zealand also moved significantly toward joining this group with
expenditure levels close to 40 percent of GDP and not far from the level that the authors of
this paper had considered feasible and desirable in a previous work. See Tanzi and
Schuknecht (1997, 2000).
Composition of Public Spending Reductions
Let us now pay some attention to the composition of public spending to see if it is
possible to identify, broadly, the categories that contributed most to total expenditure
5 The combination of below trend growth and declining spending ratios suggests even stronger declines in spending in cyclically adjusted terms. This is indeed confirmed by cyclically adjusted expenditure ratios. The cyclically adjusted expenditure levels decline significantly after the expenditure peak and they decline by a similar amount as nominal expenditure levels especially over extended time spans.
18
ECBWorking Paper Series No. 435February 2005

reduction. In view of the large number of countries, our discussion cannot be detailed. We
can only provide broad impressions. Table 2 will help in identifying some patterns.
Table 2: Composition of expenditure changes: max spending ratio-2002Percent of GDP
Change Thereof: Change Transfers Governmenttotal interest primary & subsidies 1/ consumption Investmentexpenditure spending
Australia -4.6 -3.1 -1.5 1.5 -2.0 -1.0Austria -5.9 -0.8 -5.1 -1.5 -1.8 -1.8Belgium -10.5 -3.0 -7.5 -4.0 -1.2 -2.3Canada -11.4 1.5 -12.9 -7.0 -5.5 -0.5Denmark -4.9 -3.7 -1.2 -1.5 0.4 0.0Finland -10.3 -2.3 -8.0 -5.4 -2.6 0.0France -1.9 -0.8 -1.2 -0.7 -0.3 -0.2Germany -1.8 -0.6 -1.2 0.1 -0.8 -0.5Greece -4.2 -6.5 2.3 1.4 0.3 0.6Ireland -16.4 -6.8 -9.5 -3.1 -5.8 -0.7Italy -9.1 -6.1 -3.0 -1.3 -1.0 -0.7Japan -0.2 -0.4 0.2 -1.1 2.4 -1.1Luxembourg -5.2 -1.1 -4.0 -2.6 -1.5 0.0Netherlands -11.2 -2.5 -8.7 -7.7 -1.0 0.0New Zealand -14.9 -6.4 -8.5 -8.0 -0.6 0.1Norway -6.6 -1.2 -5.4 -5.0 -0.1 -0.4Portugal -0.3 -0.2 -0.1 0.2 0.3 -0.6Spain -7.7 -2.2 -5.5 -3.7 -1.0 -0.8Sweden -9.7 -2.6 -7.0 -5.2 -1.3 -0.5Switzerland -1.4 -0.2 -1.2 -1.2 0.3 -0.3United Kingdom -4.3 -2.8 -1.4 1.2 -1.6 -1.1United States -3.1 -1.9 -1.1 0.2 -1.5 0.1
Average -6.6 -2.4 -4.2 -2.5 -1.2 -0.5Euro zone -7.0 -2.7 -4.3 -2.3 -1.4 -0.6
Ambitous reformers, early -13.2 -4.7 -8.6 -5.7 -2.1 -0.7Ambitious reformers, late -8.6 -1.3 -7.3 -4.6 -2.0 -0.7Timid reformers, early -4.7 -2.4 -2.3 0.1 -1.7 -0.7Timid reformers, late -3.7 -2.2 -1.5 -0.7 -0.5 -0.3Non reformers -1.6 -2.4 0.8 0.2 1.0 -0.4Source: EU Commission, AMECO1/ Calculated as residual of primary spending minus investment and consumption.
19
ECBWorking Paper Series No. 435
February 2005

About a third of the total average expenditure reduction (between the maximum
spending year and 2002) was due to the fall in interest payments. Interest spending
declined by 2.4 percent of GDP for the whole group and by 2.7 percent of GDP for the
euro zone. The fall in inflationary expectations was particularly important for some
countries (Italy and Greece). This fall reduced nominal interest rates and consequently
interest payments. However, for some ambitious reformers (mainly Ireland and New
Zealand), the fall in the share of public debt to GDP, and not the fall in inflation, was the
main determinant.
It is primary spending that better reflects fiscal reform. This spending fell by a little
more than four percent of GDP for all countries. However, there were major differences
across countries. The reduction from the peak level was a remarkable 12.9 percent of GDP
in Canada, 9.5 percent of GDP in Ireland, and 8 percent or more in the Netherlands (8.7
percent), in New Zealand (8.5 percent), and in Finland (8 percent). The experience of these
countries deserves to be studied in detail to see how they achieved these reductions and
what impact these reductions had on socio-economic indicators. The reductions were also
large in Sweden (7 percent) and Belgium (7.5 percent) and significant in Austria, Norway,
Spain (more than 5 percent) and a few other countries. This is the category where the
differences between ambitious performers and timid performers are most noticeable. See
Table 2. As mentioned above, countries that never had a high level of primary spending
(Australia, Japan, Switzerland and the United States) had fewer possibilities of or reasons
for reduction.
Let us now consider the composition of primary spending. Reduction in “transfers
and subsidies” explain half of the total decline of primary spending. This is the category of
spending that had grown the most in the 1960-1982 period. Again differences across
countries are noteworthy: ambitious reformers reduced transfer and subsidies by about 6
20
ECBWorking Paper Series No. 435February 2005

percent of GDP (and much more in individual cases) while spending on this category
changed little for the other country groups. Once again, New Zealand, the Netherlands,
Canada and Finland led the way in reductions in this category. Large reductions were also
witnessed by Sweden and Norway. Government consumption declined by about two
percent of GDP in the groups of early and/or ambitious reformers and little amongst
late/timid and non-reformers. Reduction in Ireland and Canada in this category was well
above that in other countries. Public investment fell in all country groups by 0.3 to 0.7
percent of GDP. However, these are reductions from peak levels. In Belgium and Austria
public investment fell most, by about two percent of GDP.
In conclusion, the major distinguishing feature in the composition of reform,
between ambitious and timid (or non-) reformers is the curtailment of transfers and
subsidies. This is the category that had grown the most in earlier years. Putting it the other
way round, a country that wants to reduce its public expenditure ratio by a significant size
has to tackle welfare programmes. Other expenditure categories offer fewer opportunities
for reduction. Over the long run a reduction in public debt can also make a major
contribution to the reduction in public spending when the initial debt level is high.
Table 3 does not support the belief that ambitious reformers have cut primarily
productive spending. Education and health spending developed only slightly less
favourably across ambitious reformers than across timid ones. On the other hand, pension
spending was contained much better in the group of ambitious reformers.
21
ECBWorking Paper Series No. 435
February 2005
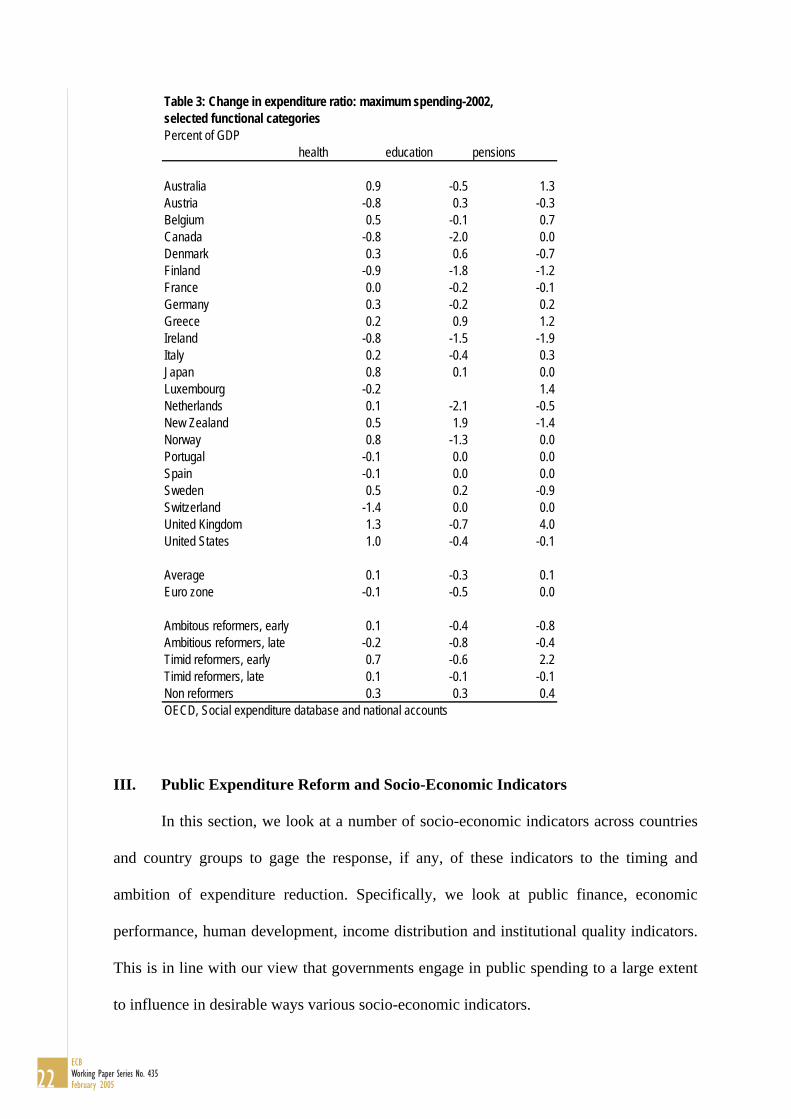
Table 3: Change in expenditure ratio: maximum spending-2002,selected functional categoriesPercent of GDP
health education pensions
Australia 0.9 -0.5 1.3Austria -0.8 0.3 -0.3Belgium 0.5 -0.1 0.7Canada -0.8 -2.0 0.0Denmark 0.3 0.6 -0.7Finland -0.9 -1.8 -1.2France 0.0 -0.2 -0.1Germany 0.3 -0.2 0.2Greece 0.2 0.9 1.2Ireland -0.8 -1.5 -1.9Italy 0.2 -0.4 0.3Japan 0.8 0.1 0.0Luxembourg -0.2 1.4Netherlands 0.1 -2.1 -0.5New Zealand 0.5 1.9 -1.4Norway 0.8 -1.3 0.0Portugal -0.1 0.0 0.0Spain -0.1 0.0 0.0Sweden 0.5 0.2 -0.9Switzerland -1.4 0.0 0.0United Kingdom 1.3 -0.7 4.0United States 1.0 -0.4 -0.1
Average 0.1 -0.3 0.1Euro zone -0.1 -0.5 0.0
Ambitous reformers, early 0.1 -0.4 -0.8Ambitious reformers, late -0.2 -0.8 -0.4Timid reformers, early 0.7 -0.6 2.2Timid reformers, late 0.1 -0.1 -0.1Non reformers 0.3 0.3 0.4OECD, Social expenditure database and national accounts
III. Public Expenditure Reform and Socio-Economic Indicators
In this section, we look at a number of socio-economic indicators across countries
and country groups to gage the response, if any, of these indicators to the timing and
ambition of expenditure reduction. Specifically, we look at public finance, economic
performance, human development, income distribution and institutional quality indicators.
This is in line with our view that governments engage in public spending to a large extent
to influence in desirable ways various socio-economic indicators.
22
ECBWorking Paper Series No. 435February 2005

a. Framework for assessing the impact of expenditure reform
In assessing the impact of expenditure reduction, we focus primarily on medium
and long-term influences and on different degrees of reform ambition. We have to deal
with a number of data shortcomings: there are only 22 countries with at most one turning-
point (start of reform) per country. Some data on socio-economic indicators are not
available on an annual basis but only at 5-year or even 10-year intervals. Therefore we will
not endeavour to force the data into a superficially sophisticated econometric analysis.
Rather we shall try to extract some stylized facts and patterns about the relationships. We
employ three approaches.
For the medium-term analysis, we set the year of maximum expenditure at t0 and
label subsequent and earlier years accordingly. This makes it possible to compare countries
with ambitious versus those with less ambitious reforms as well as the impact of timing.
We shall report the results for these country groups where appropriate. However, because
several countries started reducing their public spending only in the early- to mid-1990s this
analysis has its limits because the number of observations shrinks rapidly after a few years,
say after t7. Moreover, this approach is not useful for variables with less than annual data.
This analysis might give progressively stronger results, the more years become available
beyond 2002.
For the medium to long-term analysis, and for those variables with infrequent data,
we look at 5 year averages/intervals and at changes over these averages/intervals. We shall
pay particular attention to different degrees of reform ambition resulting in expenditure
cuts and to the question when the impact of reform appears to set in. Finally, we shall
estimate simple cross-section correlations of levels and changes to complement the other
methods and to add some robustness to the results.
23
ECBWorking Paper Series No. 435
February 2005

b. Soundness of public finances
One of the objectives of public expenditure reduction is to enhance the
sustainability of public finances. This, in turn, is conducive to macroeconomic stability,
more favourable financing conditions and (for example, via promoting the stability of the
tax system) a more friendly environment to work, invest and innovate (European
Commission, 2004). The two most common variables measuring the soundness of public
finances are the fiscal deficit and the ratio of public debt to GDP.
The average fiscal deficit across all countries declined significantly over the past 20
years and in particular after several countries started reforming their expenditure. Fiscal
consolidation was more successful in the countries with ambitious reforms. In these
countries fiscal balances improved by about 8 percent of GDP on average within six years
from the peak expenditure level (Chart 1). Timid reformers reported an average
improvement of about half that amount. However, several of them had lower initial fiscal
deficits.
Chart 1: Reform ambition and fiscal balances
-9.0-8.0-7.0-6.0-5.0-4.0-3.0-2.0-1.00.01.0
-2 -1 t0 1 2 3 4 5 6
Time line (t0=year with max expenditure)
fisca
l bal
ance
(% o
f GD
P)
All amb. Refs
All timid refs
24
ECBWorking Paper Series No. 435February 2005

Medium to long-term trends in fiscal balances confirm that ambitious reformers
achieved significant and more lasting consolidation than timid reformers while non
reformers showed the least fiscal deficit improvements.
Table 4a shows average deficits for 5-year periods between the late 1970s and the
turn of the century. Reforming countries as a group were in surplus or had only limited
deficits for the most recent 5-year period while non-reformers had still significant average
deficits. The last column shows the improvement in the deficit since expenditure started to
decline, again pointing to a deficit reduction more than twice as high for ambitious
reformers. However, as already stated, they started with larger deficits than timid
reformers. Moreover, expenditure reduction by ambitious reformers financed significant
reductions in the tax burdens. This can be measured by comparing the last column of Table
1 with that of 4a. Tax cuts averaged over 5 percent of GDP for ambitious and early
reformers. By comparison revenue reductions by timid reformers were limited to 1-2
percent of GDP and the tax burden increased significantly in non-reforming countries.
25
ECBWorking Paper Series No. 435
February 2005

Table 4: Fiscal variables and expenditure reform
a. Fiscal balances, 5-year averages
First reform wave Second reform wave Change1983-87 1988-92 1993-97 1998-2002 since reform
Average, all countries -3.8 -2.9 -3.3 0.2Euro area -4.9 -3.9 -4.1 -0.5
Ambitous reformers, early -7.0 -4.2 -1.5 0.6 7.6Ambitious reformers, late -1.5 -1.6 -3.6 2.5 6.1Timid reformers, early -1.1 -0.7 -1.9 1.8 2.9Timid reformers, late -4.5 -3.5 -3.7 -0.8 2.9Non reformers -6.1 -4.9 -5.9 -4.8
b. Gross public debt, 5-year averages
First reform wave Second reform wave Change1983-87 1988-92 1993-97 1998-2002 since reform
Average, all countries 55.9 58.2 68.5 62.1Euro area 56.1 62.2 72.8 65.5
Ambitous reformers, early 91.1 91.8 81.9 61.1 -30.0Ambitious reformers, late 47.3 50.1 68.8 60.8 -8.0Timid reformers, early 28.8 22.6 29.4 21.1 -7.6Timid reformers, late 52.5 56.6 70.1 66.1 -4.0Non reformers 60.4 68.3 86.0 99.4
Source: EU Commission, AMECO
Given that a significant share of expenditure reforms was used for fiscal
consolidation, it comes as no surprise that expenditure reduction is strongly correlated with
progress in debt reduction. However, the figures also show that debt reduction is a
“marathon” and requires time and political tenacity. Table 4b reports debt ratios for the
country groups for the same 5-year periods as Table 4a. It is noteworthy that the debt ratio
among early and ambitious reformers was initially very high (they include e.g. Belgium
and Ireland which had the highest debt ratios amongst OECD countries). Since then, it has
come down by an average of 30 percent of GDP since the late 1980s when debt for the
group peaked on average. The early and timid reformers started with a low debt ratio
which declined further. Amongst late and ambitious reformers, progress with gross debt
reduction has, so far, been less spectacular. But the figures hide the fact that the Nordic
26
ECBWorking Paper Series No. 435February 2005

countries, which are part of this group (Finland, Norway, Sweden), have been
accumulating significant public assets during recent years so that the net worth of the
public sector has improved by more than shown by the table.
Timid and late reformers, in recent years, have managed to halt and slightly reverse
the trend of increasing debt ratios experienced in the previous years. However, because
some deficits remained and, as we see below, trend growth has not accelerated, progress in
this area has been limited. Note again the significant increase in the debt ratio of non-
reformers which reflects Japan’s strong fiscal deterioration but also the continued upward
creep in Portuguese and Greek public debt.
In summary, expenditure reforms can show quick results in improving deficit
figures, but they must be ambitious and durable in order to reverse adverse debt dynamics
and significantly reduce public debt ratios.6
c. Economic and employment performance
Another favourable effect of public expenditure reduction should be the
improvement of supply side conditions via better tax-benefit systems, more efficient
government bureaucracy, and less distortionary taxes (see for surveys, Afonso et al, 2004;
European Commission 2004). We look at two variables to proxy the relationship between
expenditure reform and economic performance: economic growth and the employment
ratio.
Considering real GDP growth after the expenditure reforms, it is noteworthy that,
on average, expenditure reductions, even ambitious ones, were not accompanied by
declines in economic growth. On the contrary, in most cases growth started to improve
6 See also Alesina and others (e.g. Alesina and Perotti, 1995; Briotti, 2004 for a survey) who argue that expenditure reform is key for longer-lasting public finance consolidation, sustained debt reduction and favourable growth effects.
27
ECBWorking Paper Series No. 435
February 2005
slowly immediately after the onset of reform. These facts do not support the fear expressed
by many policy makers and some observers that public expenditure reduction hurts growth.
However, because we are more interested in the medium to the long term
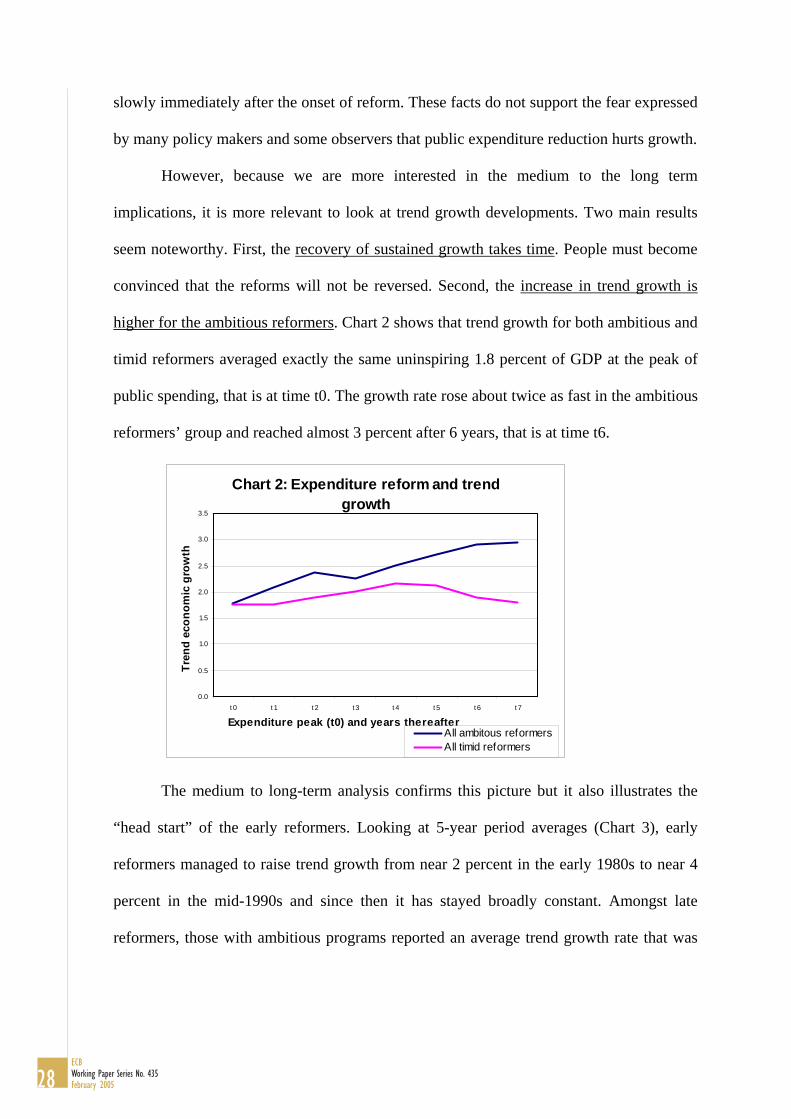
implications, it is more relevant to look at trend growth developments. Two main results
seem noteworthy. First, the recovery of sustained growth takes time. People must become
convinced that the reforms will not be reversed. Second, the increase in trend growth is
higher for the ambitious reformers. Chart 2 shows that trend growth for both ambitious and
timid reformers averaged exactly the same uninspiring 1.8 percent of GDP at the peak of
public spending, that is at time t0. The growth rate rose about twice as fast in the ambitious
reformers’ group and reached almost 3 percent after 6 years, that is at time t6.
Chart 2: Expenditure reform and trend growth
0.0
0.5
1.0
1.5
2.0
2.5
3.0
3.5
t 0 t 1 t 2 t 3 t 4 t 5 t 6 t 7
Expenditure peak (t0) and years thereafter
Tren
d ec
onom
ic g
row
th
All ambitous reformersAll timid reformers
The medium to long-term analysis confirms this picture but it also illustrates the
“head start” of the early reformers. Looking at 5-year period averages (Chart 3), early
reformers managed to raise trend growth from near 2 percent in the early 1980s to near 4
percent in the mid-1990s and since then it has stayed broadly constant. Amongst late
reformers, those with ambitious programs reported an average trend growth rate that was
28
ECBWorking Paper Series No. 435February 2005

boosted from 2 percent until the mid-1990s to 3 percent per annum since then. Trend
growth of timid reformers has so far remained little changed.7
Chart 3: Trend growth and reform timing and ambition
0.00.5
1.01.5
2.0
2.53.03.5
4.0
4.5
78-82 83-87 88-92 93-97 98-02
Tren
d ec
onom
ic g
row
th (%
)
Ambitous reformers, earlyAmbitious reformers, lateTimid reformers, earlyTimid reformers, late
Of course, the above analysis is based on stylised facts and there are some caveats.
For example, non-fiscal structural reforms may have been more important to boost trend
growth than public expenditure reductions. This may have been the case for countries that
had low public expenditure ratios in the whole period such as Australia and the United
States. Additional robustness checks would clearly be desirable. Moreover, trend growth is
to some extent correlated with the cycle so that part of the initial trend growth increase
may reflect the fact that reforms started during a downturn. But the findings are consistent
with those of Tanzi and Schuknecht (2003) and Afonso et al (2004) that look at the
relationship between public expenditure and growth trends. Tanzi and Schuknecht, for
example, reported the stylised fact that a 10 percent increase in the spending ratio had
reduced long term growth by about 1.5 percent over the 1960 to 2000 period.
7 The growth performance of non-reformers is rather diverse. Trend growth in Portugal slowed down over the past 20 years. While such data is not available for Japan, nominal growth and rolling averages also suggest such a pattern for this country. Greece has seen an upward revision in trend growth in recent years although some concerns about the influence of temporary and extraordinary factors (euro area entry, Olympic games) have also been voiced.
29
ECBWorking Paper Series No. 435
February 2005

Employment developments parallel the picture for trend growth (Table 5). The
employment ratio was relatively similar across country groups in the late 1970s, apart for
the early, ambitious reformers where it was much lower. By the mid 1980s it had fallen in
all groups. However, the picture started changing thereafter. Early ambitious reformers
experienced a limited increase in the employment ratio in the following ten years, that was
not much larger than for the other early but timid reformers (although it is the only group
with a rising ratio in the early 1990s). Perhaps there was a significant labor shake out early
in the reform process, especially in connection with the privatization of public enterprises;
perhaps confidence took time to build; perhaps the focus of these reforms was not on
employment incentives so that initial aggregate changes were limited. However, in the late
1990s, the employment ratio for the ambitious early reformers rose rapidly, so that the
overall gain in the employment ratio since the onset of reform exceeded 8 percent (last
column of Table 5).
Table 5: Employment ratio and expenditure reform First reform wave Second reform wave Change 1983-87 1988-92 1993-97 1998-2002 since reform Average, all countries 65.4 67.1 66.0 69.3 Euro area 60.2 61.8 60.6 64.7 Ambitous reformers, early 56.0 57.0 58.4 64.4 8.3 Ambitious reformers, late 69.7 70.7 66.7 70.2 3.5 Timid reformers, early 65.6 68.2 67.5 70.0 4.4 Timid reformers, late 67.7 70.4 69.8 72.2 2.4 Non reformers 64.9 65.7 65.4 67.4 Source: EU Commission, AMECO
The late and ambitious adjusters reported an employment ratio in the mid-1990s
that was well below the late 1970s. But it increased strongly together with expenditure
30
ECBWorking Paper Series No. 435February 2005

reform in recent years. Non-reformers now show an employment ratio that is lower than it
was 25 years ago.
The correlation between employment ratios and social expenditure reform is
particularly noteworthy. Chart 4 represents the change in the social expenditure ratio and
in the employment ratio since the expenditure peak was reached. There is a rather
significant correlation between the two with a 1 percentage point decline in the social
spending-to-GDP-ratio being correlated with a 1.3 percentage point increase in the
employment ratio.
Chart 4: Social expenditure and employment ratio
y = -1.3021x + 2.1955R2 = 0.6051
-5.0
0.0
5.0
10.0
15.0
20.0
25.0
-10.0 -8.0 -6.0 -4.0 -2.0 0.0 2.0 4.0
Change in social spending (% of GDP), post reform
Cha
nge
in e
mpl
oym
ent r
atio
, po
st re
form
d. Income distribution and human development
Many critics of public expenditure reform point to potential adverse implications
for income distribution and human development. As shown in Table 2, expenditure reform
has led to cuts in social transfers and spending that presumably disproportionately
benefited the less well off. However, this latter hypothesis has received limited empirical
backing. Some studies have pointed to underlying reasons why social spending is poorly
targeted; public investment is not always productive; and government consumption does
not necessarily mean more education or more security but at times more waste and red
31
ECBWorking Paper Series No. 435
February 2005

tape. Higher taxes and less innovation and productivity gains may ultimately translate into
less employment and wage gains for lower income individuals. Gross social spending, as
used in some analytical studies, may not appropriately reflect the role of the state because
the effect of the tax system, especially tax expenditure, and of private social support is not
taken into account.8
Here, we consider the possible correlation between expenditure reform and income
distribution by looking at three types of indicators available from the OECD for most
industrialised countries. Unfortunately these indicators are not available annually. It is
nevertheless fortunate that the OECD provides observations for the mid 1980s and mid
1990s (which coincide broadly with the two main “waves” of expenditure reform) and for
2000 so that we have at least an impression of levels and changes in the past 15 years.
The picture that arises from these data and their correlation with public expenditure
developments is rather complex.
First, income distribution in industrialized countries has become less equal since
the mid-1980s (Table 6a-c, first line). The share of the population that lives on less than
half the median income has increased by about 1 percent, rising to about 10 percent of the
total population; the Gini coefficient has risen from an average of 0.28 to 0.294; and the
income share of the poorest 20 percent of households has fallen from 8.6 to 8.2 percent.
8 See, for example, Tanzi and Schuknecht (2000), Tanzi (2004), Adema (2004) on net social spending, and various other OECD studies on the targeting of social spending, income distribution indicators etc. [to be completed].
32
ECBWorking Paper Series No. 435February 2005

Table 6: Income distribution and expenditure reform
a. Share of total population below 50% of median incomeMid-1980s Mid-1990s 2000 mid-1980s-2000
Average, all countries 9.0% 9.6% 10.1% 1.1%Euro area 9.3% 10.1% 10.5% 1.2%
Ambitous reformers, early 6.5% 8.4% 10.6% 4.1%Ambitious reformers, late 6.4% 6.7% 7.5% 1.1%Timid reformers, early 6.9% 10.9% 11.4% 4.5%Timid reformers, late 9.6% 10.3% 10.3% 0.6%Non reformers 14.8% 14.2% 13.6% -1.2%
b. Gini coefficientMid-1980s Mid-1990s 2000 mid-1980s-2000
Average, all countries 28.0 29.0 29.4 1.3Euro area 28.7 29.5 29.6 0.9
Ambitous reformers, early 27.8 30.3 29.7 1.9Ambitious reformers, late 23.6 24.4 26.3 2.7Timid reformers, early 29.9 30.8 31.5 1.6Timid reformers, late 28.3 29.3 29.2 0.9Non reformers 34.5 34.7 35.0 0.5
c. Income share of poorest quitile of householdsMid-1980s Mid-1990s 2000 mid-1980s-2000
Average, all countries 8.6% 8.4% 8.2% -0.4%Euro area 9.0% 8.7% 8.5% -0.4%
Ambitous reformers, early 9.4% 8.9% 8.9% -0.5%Ambitious reformers, late 9.9% 10.0% 9.4% -0.5%Timid reformers, early 8.3% 8.0% 7.8% -0.5%Timid reformers, late 8.3% 8.1% 7.9% -0.4%Non reformers 7.9% 7.6% 7.6% -0.3%
d. Per-capita GDP poorest quintile, 1995 prices, PPP US$Mid-1980s Mid-1990s 2000 mid-1980s-2000
% changeAverage, all countries 7374 8677 9893 34.2Euro area 6917 8128 9458 36.7
Ambitous reformers, early 7273 8456 10400 43.0Ambitious reformers, late 9213 10532 11813 28.2Timid reformers, early 6936 8141 9036 30.3Timid reformers, late 7735 9047 9860 27.5Non reformers 4299 4984 5819 35.4Source: OECD
Second, and as expected, there is indeed a positive correlation between total public
spending and the income distribution indicators, but there is much less correlation between
changes in public spending and changes in these indicators. Since it is the changes that are
33
ECBWorking Paper Series No. 435
February 2005

important in assessing the impact of fiscal reform, this points to a rather limited trade-off
from expenditure reform in terms of income distribution. Consider Table 7. The correlation
coefficient between total expenditure and the relevant indicators of income distribution for
the year 2000 is 0.43 to 0.62.9 But that for changes in public spending and income
distribution since expenditure reform started is only 0.23 for the income share of the
poorest 20 percent and 0.37 for the Gini coefficient. Only for the share of households
below 50 percent of median income, the correlation is statistically significant. For all these
variables, the correlation with public spending is even weaker (rather than stronger) when
looking at levels and changes in social spending.
Table 7: Correlation coefficients, income distribution / human development- total expenditure
Total expenditure, 2000
Change in expenditure, post reform-2000
Share below 1/2 median income, 2000 -0.62 Change, post reform-2000 -0.59 Gini coefficient, 2000 -0.50 Change, post reform-2000 -0.37 Income share, bottom quintile, 2000 0.43 Change, post reform-2000 0.23 Human development index, 2000 0.02 Change, post reform-2000 -0.36 Source: OECD, UNDP
This finding of a modest relation between expenditure and income distribution
changes is consistent with the literature that looks at the “targeting” and distributional
implications of social spending. Arjona, Ladaique and Pearson (2001), for example, found
that the distributional effects of government spending, net of “churning”, was very small in
9 The correlation coefficient for net spending and income distribution in 1997 is 0.57 (on the basis of data by Adema, 2001).
34
ECBWorking Paper Series No. 435February 2005

some “big” government countries such as Germany, France and Italy and hardly exceeded
that of the United States. Moreover, the targeting of social spending has improved in a
number of countries that have undertaken significant expenditure reform. In fact these
reforms seem to force governments to better target their social spending.
Third, expenditure reform has resulted in an “equalization” of income distribution
patterns across country groups. This can be seen in Table 6. Ambitious reformers, for
example, reported more equal than average income distribution in the mid-1980s. By
2000, indicators had worsened but they still show a relatively favourable situation for the
poor in this group relative to the average for all countries. If expenditure reform had a
significantly adverse impact on income distribution, timid reformers should report more
favourable changes than ambitious reformers. But this is not the case and changes are
rather similar across these country groups. Non-reformers report unfavourable income
distribution indicators that also have not improved much relative to the other groups. This
supports the above finding that changes in spending and income distribution are only
weakly correlated.
So far we looked at income distribution in relative terms. One can also compare
absolute income levels of the poorest quintile by countries. Stronger growth has on average
moderated and in some cases over-compensated the changes in the income share of the
poorest quintile for ambitious reformers. For example, since 1990, the absolute position of
the poorest quintile has improved most among ambitious and early reformers (from 5
percent below average to 5 percent above). At the same time, the position of the poor in
timid and late reformers may not have deteriorated much within the country but it has
relative to those that grew faster. Living standards amongst the poorest quintile are still
highest in the group of late and ambitious reformers (15 percent above the average for all
sample countries). (See Table 6d.)
35
ECBWorking Paper Series No. 435
February 2005

Finally, we examine indicators for the “quality of life”. Many indicators could be
looked at, including living standards, health and education standards, infrastructure quality,
crime, and environment. We limit ourselves in this study to the UN Human Development
Index (HDI) which combines indicators of longevity, educational attainment and
enrollment ratios and living standards (per-capita GDP, PPP US$) (UNDP, 2003). We find
no correlation between the level of total spending and the HDI (Table 7).
d. Quality of institutions
The past 20 years have witnessed a renaissance of classical economists’ thinking as
to the role of government in setting the rules of the game for itself and for markets. A
sound institutional framework can promote growth and economic dynamism in the
neoclassical sense of facilitating factor accumulation and productivity. This is because
good institutions create an environment in which property rights are protected and
contracts are enforced and where people are free to make contracts at a level playing field.
As a consequence, incentives to save, invest, work and innovate are boosted.10
The fiscal role of the state is indirectly linked with the quality of institutions as it is
hard to conceive a functioning market economy without well-trained and well paid
policymakers, administrators, judges and policemen (Tanzi and Schuknecht, 2000; van
Rijckeghem and Weder, 2002). In as much as higher spending aims to achieve this
purpose, it should improve the institutional environment of an economy. However, if
higher spending means more bureaucratic red tape, more rent seeking opportunities (which
in turn breed corruption) and a large informal economy (because of the higher tax rates that
10 See economists and political philosophers from David Hume and Adam Smith to the Austrian School of Economics, public choice and institutional economics with proponents such as Hayek, Buchanan or Douglas North.
36
ECBWorking Paper Series No. 435February 2005

high spending requires), that does not benefit from protective institutions, then a reduction
in public expenditure could well imply an improved institutional environment.11
We look at four indicators to measure institutional quality. The first three on
corruption, red tape and quality of the judiciary are surveys based and published in the
World Competitiveness Report since about 1990. The fourth is a composite indicator,
measuring the quality of the legal structure and the security of property rights. It is
available as a sub-indicator of the Fraser Institute’s Economic Freedom measure since the
mid-1970s.
As regards the overall level of these indicators, industrialized countries on average
report very high levels (Table 8a and b). This suggests that the institutional infrastructure
operates well. While red tape and corruption seem to have worsened, the legal structure
and security of property rights have improved in the past 10-15 years. Southern European
countries and Japan fare relatively poorly. Scandinavian countries report significant
improvements in these indicators while the picture for Anglo-Saxon countries and other
continental European countries is more mixed.
11 While we limit ourselves to analyzing aggregates, a more detailed analysis of spending composition would be warranted in this context.
37
ECBWorking Paper Series No. 435
February 2005

Table 8: Institutional indicators and expendtiure
a. Corruption, red tape, quality of judiciary
Corruption Change Red tape Change Quality of the judiciary Change1990 2001 1990s 1990 2001 1990s 1990 2001 1990s
Australia 6.6 8.2 1.6 4.1 4.9 0.8 7.8 8.5 0.7Austria 5.2 6.9 1.7 4.9 4.1 -0.7 7.3 9.0 1.7Belgium 5.5 5.2 -0.3 3.8 2.8 -1.0 6.2 5.7 -0.5Canada 7.5 7.8 0.3 4.6 4.6 0.0 8.4 8.5 0.1Denmark 9.2 9.0 -0.1 4.7 5.0 0.3 8.4 8.6 0.2Finland 7.8 9.5 1.7 5.5 6.4 0.9 8.4 8.7 0.3France 6.0 4.2 -1.8 4.1 1.8 -2.3 6.2 5.9 -0.4Germany 7.6 6.9 -0.7 4.8 3.9 -0.9 8.2 8.2 0.1Greece 2.8 3.0 0.2 1.9 2.3 0.4 5.0 6.2 1.2Ireland 7.0 5.5 -1.4 5.3 5.6 0.3 8.1 7.6 -0.5Italy 2.6 3.5 1.0 2.8 2.0 -0.8 3.2 3.6 0.4Japan 5.5 4.3 -1.2 5.3 2.6 -2.7 7.8 6.3 -1.5Luxembourg 5.5 7.4 1.9 3.8 4.1 0.3 6.2 7.5 1.3Netherlands 8.1 8.0 -0.2 5.4 4.7 -0.7 8.1 8.3 0.1New Zealand 8.4 8.8 0.3 6.3 4.3 -1.9 7.9 8.3 0.4Norway 7.4 8.1 0.7 4.0 3.0 -1.0 8.2 8.3 0.1Portugal 4.5 3.9 -0.6 3.3 2.2 -1.1 8.0 2.7 -5.3Spain 3.8 5.6 1.8 3.2 4.0 0.8 2.9 4.4 1.5Sweden 7.6 8.6 1.0 4.6 5.6 1.0 7.1 8.5 1.5Switzerland 7.9 7.2 -0.7 6.1 5.4 -0.7 8.7 8.0 -0.7United Kingdom 8.0 6.8 -1.2 6.0 3.1 -2.8 7.5 7.4 -0.1United States 6.5 6.6 0.0 5.3 3.7 -1.6 7.6 7.1 -0.5
Average 6.4 6.6 0.2 4.5 3.9 -0.6 7.1 7.1 0.0Euro zone 5.5 5.8 0.3 4.1 3.7 -0.4 6.5 6.5 0.0
Ambitous reformers, early 7.3 6.9 -0.4 5.2 4.4 -0.8 7.6 7.5 -0.1Ambitious reformers, late 6.5 7.7 1.2 4.5 4.6 0.2 7.1 7.9 0.9Timid reformers, early 6.7 7.5 0.8 4.6 4.1 -0.6 7.2 7.8 0.6Timid reformers, late 6.6 6.2 -0.4 4.6 3.6 -1.0 7.0 6.9 -0.2Non reformers 4.3 3.7 -0.5 3.5 2.4 -1.1 6.9 5.0 -1.9
Source: World Competitiveness Report and AMECO
38
ECBWorking Paper Series No. 435February 2005

Table 8: Institutional indicators and expendtiure continued
b. Economic freedom (Chapter 2, legal structure and security of property rights)
ChangeCountries 1980 1985 1990 1995 2000 post-reform
Australia 7.3 7.9 7.9 8.8 9.5 1.6Austria 8.0 7.9 8.3 8.6 9.3 0.8Belgium 7.8 7.9 8.3 7.3 8.3 0.4Canada 7.2 7.9 8.3 8.9 9.3 0.3Denmark 7.2 7.9 8.3 8.9 9.5 0.6Finland 6.8 7.9 8.3 9.1 9.5 0.4France 6.8 7.2 7.7 7.4 8.1 0.7Germany 7.7 7.5 8.3 9.0 9.1 0.2Greece 5.6 5.6 6.8 6.6 5.7Ireland 7.1 6.7 7.7 8.9 9.0 2.3Italy 5.7 6.8 7.7 5.7 7.7 1.9Japan 7.9 7.2 7.7 7.8 8.2Luxembourg 7.8 8.3 8.3 8.9 8.3 0.0Netherlands 7.5 8.3 8.3 8.9 9.6 1.3New Zealand 8.0 7.9 8.3 9.0 9.1 1.2Norway 7.0 8.1 8.3 9.0 8.8 -0.1Portugal 8.0 6.1 7.7 7.6 7.6Spain 6.3 6.4 7.2 7.4 7.5 0.2Sweden 6.6 7.4 8.3 8.6 9.0 0.5Switzerland 8.1 8.3 8.3 8.9 9.3 0.3United Kingdom 7.0 6.7 7.7 8.9 9.3 2.6United States 8.3 8.3 8.3 8.6 9.2 0.6
Average 7.3 7.5 8.0 8.3 8.7 0.8Euro zone 7.1 7.2 7.9 7.9 8.3 0.8
Ambitous reformers, early 7.6 7.7 8.2 8.5 9.0 1.3Ambitious reformers, late 7.0 7.6 8.1 8.6 8.9 0.3Timid reformers, early 7.4 7.6 8.0 8.9 9.0 1.4Timid reformers, late 7.3 7.7 8.1 8.1 8.8 0.7Non reformers 6.8 5.8 7.2 7.1 6.7
Source: Gwartney et. al, Fraser Institute
On the whole, there is no clear correlation for the industrialized countries between
the size of government and institutional quality. But there is a modest to strong correlation
between changes in public spending since the onset of reform and changes in institutional
quality which implies that a reduction in public spending raises institutional quality. The
correlation (coefficient of -0.58) between, for example, changes in public expenditure
ratios and property rights/economic freedom is illustrated by Chart 5.
39
ECBWorking Paper Series No. 435
February 2005

Chart 5: Expenditure reform and economic freedom
y = -0.0793x - 0.056R2 = 0.3453
-0.5
0.0
0.5
1.0
1.5
2.0
2.5
-20.0 -15.0 -10.0 -5.0 0.0
Change expenditure ratio, post reform
Cha
nge
free
dom
in
dica
tor,
pos
t ref
orm
Conclusion
Overall, we find that ambitious expenditure reform is correlated with improvement in
fiscal, economic, human development and institutional indicators. Positive developments
associated with expenditure reform, in some instances, have taken a while to materialize
and early and persistent reformers have, hence, benefited more from them. Unfavourable
effects on income distribution within countries are small and are mitigated in absolute
terms by faster growth and by the possibilities of better targeting of public spending.
Moreover, there is significant divergence across countries that suggest that country
circumstances and reform design matter.
40
ECBWorking Paper Series No. 435February 2005
IV.

Bibliography:
Adema, Willem (2001) Net Social Expenditure, 2nd edition, OECD Labour Market and Social Policy Occasional Paper No. 52, Paris: OECD.
Afonso, Antonio, Ludger Schuknecht and Vito Tanzi (2004/5 forthcoming) Public Sector Efficiency: an International Comparison, European Central Bank Working Paper 242 and forthcoming in Public Choice.
Afonso, Antio, Werner Ebert, Michael Thoene and Ludger Schuknecht (2004) The Quality of Public Finances and Economic Growth, Frankfurt: forthcoming ECB Working Paper.
Alesina, A and R. Perotti (1995) Fiscal expansions and adjustments in OECD countries, Economic Policy, No. 21
Arjona, Roman, Maxime Ladaique and Mark Pearson (2001) Growth, Inequality and Social Protection, OECD Labour Market and Social Policy Occasional Papers No 51, Paris: OECD.
Briotti, Maria Gabriella (2004) Fiscal adjustment between 1991 and 2002: Stylised facts and policy implications, European Central Bank Occasional Paper Series
European Commission (2004) Public Finance Report, Brussels. Gwartney, J.; Lawson, R.; Park, W.; Wagh, S.; Edwards, C. and de Rugy, V. (2002).
Economic Freedom of the World: 2002 Annual Report. Vancouver, the Fraser Institute.
International Institute for Management Development (2001). The World Competitiveness Yearbook 2001.
st
th Century: A Global
European Countries, in Oestereichische Nationalbank (ed.) Fostering Economic Growth in Europe, Vienna.
United Nations Development Programme (2003) Human Development Report 2003, New York: Oxford University Press.
Van Rijckeghem, Caroline and Beatrice Weder (2002) Bureaucratic Corruption and the Rate of Temptation: Do Wages in the Civil Service Affect Corruption and by How Much? In G. Abed and S. Gupta (eds) Governance, Corruption and Economic Performance, IMF: Washington DC, 59-88.
41
ECBWorking Paper Series No. 435
February 2005
Tanzi, Vito and Ludger Schuknecht (1997) Reconsidering the Fiscal Role of Government:
OECD, Labour Market Statistics, Paris.
The International Perspective, The American Economic Review Volume 87, No. 2
Tanzi, Vito and Ludger Schuknecht (2003) Public Finances and Economic Growth in Perspective, Cambridge: Cambridge University Press.
Century, paper published by Politeia, London.
OECD (2001) Social Expenditure Database and National Accounts, Paris.
Tanzi, Vito (2004) A Lower Tax Future: the Economic Role of the State in the 21
OECD (1995) Income Distribution in OECD Countries, Paris.
Tanzi. Vito and Ludger Schuknecht (2000). Public Spending in the 20

Annex Table – Variables and series
Variable Sources All fiscal variables (except functional expenditure)
European Commission, Ameco
Output, employment and income variables
European Commission, Ameco (trend growth and employment ratio); OECD (per-capita GDP, PPP US$)
Income distribution
OECD(share of population below 50 percent of median income, Gini coefficient, income share of poorest quintile of households)
Corruption World Economic Forum: The World Competitiveness Report 1990, item "10.22 Corruption (for 1990)
World Economic Forum, The World Competitiveness Yearbook 2001, item 2.3.16 Bribing and corruption (for 2001).
Red tape World Economic Forum: The World Competitiveness Report 1990, item "6.21 Regulatory environment (for 1990)
World Economic Forum, The World Competitiveness Yearbook 2001, "Bureaucracy" (for 2001).
Efficient judiciary World Economic Forum: The World Competitiveness Report 1990, item "10.04 Confidence in administration o justice" (for 1990)
World Economic Forum, The World Competitiveness Yearbook 2001, "Justice" (for 2001).
Economic freedom Gwartney et. al, Fraser Institute (various issues) Freedom in the World, Vancouver.
Public education
OECD, Social expenditure database and national accounts
Public health OECD, Social Expenditure database and national accounts
Public pension OECD, Social Expenditure database.
42
ECBWorking Paper Series No. 435February 2005

43ECB
Working Paper Series No. 435February 2005
European Central Bank working paper series
For a complete list of Working Papers published by the ECB, please visit the ECB’s website(http://www.ecb.int)
402 “Forecasting euro area inflation using dynamic factor measures of underlying inflation”by G. Camba-Méndez and G. Kapetanios, November 2004.
403 “Financial market integration and loan competition: when is entry deregulation socially beneficial?”by L. Kaas, November 2004.
404 “An analysis of systemic risk in alternative securities settlement architectures” by G. Iori,November 2004.
405 “A joint econometric model of macroeconomic and term structure dynamics” by P. Hördahl,O. Tristani and D. Vestin, November 2004.
406 “Labour market reform and the sustainability of exchange rate pegs” by O. Castrén, T. Takalo andG. Wood, November 2004.
407 “Banking consolidation and small business lending” by E. Takáts, November 2004.
408 “The great inflation, limited asset markets participation and aggregate demand: FED policy was betterthan you think” by F. O. Bilbiie, November 2004.
409 “Currency mismatch, uncertainty and debt maturity structure” by M. Bussière, M. Fratzscherand W. Koeniger, November 2004.
410 “Do options-implied RND functions on G3 currencies move around the times of interventionson the JPY/USD exchange rate? by O. Castrén, November 2004.
411 “Fiscal discipline and the cost of public debt service: some estimates for OECD countries”by S. Ardagna, F. Caselli and T. Lane, November 2004.
412 “The real effects of money growth in dynamic general equilibrium” by L. Graham andD. J. Snower, November 2004.
413 “An empirical analysis of price setting behaviour in the Netherlands in the period1998-2003 using micro data” by N. Jonker, C. Folkertsma and H. Blijenberg, November 2004.
414 “Inflation persistence in the European Union, the euro area, and the United States”by G. Gadzinski and F. Orlandi, November 2004.
415 “How persistent is disaggregate inflation? An analysis across EU15 countries andHICP sub-indices” by P. Lünnemann and T. Y. Mathä, November 2004.
416 “Price setting behaviour in Spain: stylised facts using consumer price micro data”by L. J. Álvarez and I. Hernando, November 2004.
417 “Staggered price contracts and inflation persistence: some general results”by K. Whelan, November 2004.
418 “Identifying the influences of nominal and real rigidities in aggregate price-setting behavior”by G. Coenen and A. T. Levin, November 2004.
419 “The design of fiscal rules and forms of governance in European Union countries”by M. Hallerberg, R. Strauch and J. von Hagen, December 2004.
420 “On prosperity and posterity: the need for fiscal discipline in a monetary union” by C. Detken, V. Gasparand B. Winkler, December 2004.

44ECBWorking Paper Series No. 435February 2005
421 “EU fiscal rules: issues and lessons from political economy” by L. Schuknecht, December 2004.
422 “What determines fiscal balances? An empirical investigation in determinants of changes in OECDbudget balances” by M. Tujula and G. Wolswijk, December 2004.
423 “Price setting in France: new evidence from survey data” by C. Loupias and R. Ricart,December 2004.
424 “An empirical study of liquidity and information effects of order flow on exchange rates”by F. Breedon and P. Vitale, December 2004.
425 “Geographic versus industry diversification: constraints matter” by P. Ehling and S. B. Ramos,January 2005.
426 “Security fungibility and the cost of capital: evidence from global bonds” by D. P. Millerand J. J. Puthenpurackal, January 2005.
427 “Interlinking securities settlement systems: a strategic commitment?” by K. Kauko, January 2005.
428 “Who benefits from IPO underpricing? Evidence form hybrid bookbuilding offerings”by V. Pons-Sanz, January 2005.
429 “Cross-border diversification in bank asset portfolios” by C. M. Buch, J. C. Driscolland C. Ostergaard, January 2005.
430 “Public policy and the creation of active venture capital markets” by M. Da Rin,G. Nicodano and A. Sembenelli, January 2005.
431 “Regulation of multinational banks: a theoretical inquiry” by G. Calzolari and G. Loranth, January 2005.
432 “Trading european sovereign bonds: the microstructure of the MTS trading platforms”by Y. C. Cheung, F. de Jong and B. Rindi, January 2005.
433 “Implementing the stability and growth pact: enforcement and procedural flexibility”
434
435 “Reforming public expenditure in industrialised countries: are there trade-offs?”by L. Schuknecht and V. Tanzi, February 2005.
by R. M. W. J. Beetsma and X. Debrun, January 2005.
“Interest rates and output in the long-run” by Y. Aksoy and M. A. León-Ledesma, January 2005.