File (Final).pmd - DEPARTMENT OF Expenditure
36
PREFACE The Pay Research Unit of the Department of Expenditure, Ministry of Finance brings out a “Brochure on Pay and Allowances of Central Government Civilian Employees” on an annual basis. As in the past, the Brochure for 2006-07 provides statistical information on expenditure incurred by different Ministries/Departments of the Central Government on Pay and Allowances including Dearness Allowance, House Rent Allowance, City Compensatory Allowance, Overtime Allowance, etc. in respect of its regular employees. The Brochure also contains information on the group-wise number of sanctioned posts and of incumbents in position in various Ministries/Departments. 2. The data in the Brochure has been compiled on the basis of quarterly returns on expenditure on pay and allowances and annual returns on the strength of Central Government civilian employees furnished by the Central Government establishments to the Pay Research Unit of this Department. 3. The Brochure may be of use for personnel planning and for preparation of reliable estimates of financial implications of various proposals concerning pay and allowances of Central Government employees. While all efforts have been made to present the data in a meaningful manner, suggestions for further improvement would be welcome. 4. Ministry of Finance would like to thank all the Central Government Ministries/ Departments/Organisations for their cooperation in furnishing the data, without which this compilation would not have been possible. This Ministry would also like to acknowledge the contribution of the National Informatics Centre and Budget Press (North Block). (Madhulika P. Sukul) November, 2008 Joint Secretary New Delhi. Ministry of Finance Department of Expenditure
-
Upload
khangminh22 -
Category
Documents
-
view
7 -
download
0
Transcript of File (Final).pmd - DEPARTMENT OF Expenditure

PREFACE
The Pay Research Unit of the Department of Expenditure, Ministry of Finance brings
out a “Brochure on Pay and Allowances of Central Government Civilian Employees”on an annual basis. As in the past, the Brochure for 2006-07 provides statistical information
on expenditure incurred by different Ministries/Departments of the Central Government on
Pay and Allowances including Dearness Allowance, House Rent Allowance, City
Compensatory Allowance, Overtime Allowance, etc. in respect of its regular employees.
The Brochure also contains information on the group-wise number of sanctioned posts and
of incumbents in position in various Ministries/Departments.
2. The data in the Brochure has been compiled on the basis of quarterly returns on
expenditure on pay and allowances and annual returns on the strength of Central Government
civilian employees furnished by the Central Government establishments to the Pay Research
Unit of this Department.
3. The Brochure may be of use for personnel planning and for preparation of reliable
estimates of financial implications of various proposals concerning pay and allowances of
Central Government employees. While all efforts have been made to present the data in a
meaningful manner, suggestions for further improvement would be welcome.
4. Ministry of Finance would like to thank all the Central Government Ministries/
Departments/Organisations for their cooperation in furnishing the data, without which this
compilation would not have been possible. This Ministry would also like to acknowledge the
contribution of the National Informatics Centre and Budget Press (North Block).
(Madhulika P. Sukul)November, 2008 Joint SecretaryNew Delhi. Ministry of Finance
Department of Expenditure

PROJECT STAFF
Name Designation
Shri A. K. Tiwari Director (Pay)
Shri N.K. Srivastava Senior Research Officer
Sh. H.K. Bhatt Research Assistant
Shri A.K. Puri Research Assistant
Smt. Pushp Lata Jr. Research Assistant
Smt. Simmi Takkar Computor
Shri Kuldeep Singh Computor
Shri Chander Prakash U.D.C.
1. SALIENT FEATURES
2. SHARE OF MAJOR COMPONENTS IN TOTAL EXPENDITURE OF CENTRAL GOVERNMENT
CIVILIAN EMPLOYEES INCLUDING EMPLOYEES OF UTs
3. SHARE OF MAJOR DEPARTMENTS IN TOTAL EXPENDITURE
4. EXPENDITURE ON PAY AND ALLOWANCES OF THE CENTRAL GOVERNMENT CIVILIAN
EMPLOYEES
5. EXPENDITURE ON PAY AND ALLOWANCES OF THE CENTRAL GOVERNMENT CIVILIAN
EMPLOYEES INCLUDING EMPLOYEES OF UTs
6. EXPENDITURE ON PAY AND ALLOWANCES OF MAJOR MINISTRIES/DEPARTMENTS
7. COMPONENT-WISE BREAK UP OF EXPENDITURE ON PAY AND ALLOWANCES OF THE
CENTRAL GOVERNMENT CIVILIAN EMPLOYEES
8. COMPONENT-WISE BREAK UP OF EXPENDITURE ON PAY AND ALLOWANCES OF THE
CENTRAL GOVERNMENT CIVILIAN EMPLOYEES INCLUDING EMPLOYEES OF UTs
9. COMPONENT-WISE BREAK UP OF EXPENDITURE ON PAY AND ALLOWANCES OF THE
EMPLOYEES OF OTHER DEPARTMENTS EXCLUDING EMPLOYEES OF UTs, MINISTRIES/
DEPARTMENTS OF RAILWAYS, DEFENCE, POSTS, HOME AFFAIRS AND MISSIONS
10. EXPENDITURE ON PAY AND ALLOWANCES OF THE MINISTRY OF RAILWAYS
11. EXPENDITURE ON PAY AND ALLOWANCES OF THE MINISTRY OF DEFENCE
12. EXPENDITURE ON PAY AND ALLOWANCES OF THE DEPARTMENT OF POSTS
13. EXPENDITURE ON PAY AND ALLOWANCES OF THE MINISTRY OF HOME AFFAIRS
14. EXPENDITURE ON PAY AND ALLOWANCES OF UT ADMINISTRATIONS
15. EXPENDITURE ON PAY AND ALLOWANCES OF THE INDIAN MISSIONS ABROAD
16. EXPENDITURE ON HOUSE RENT ALLOWANCE INCLUDING EMPLOYEES OF UTs
CONTENTS
1-2
3
4
5
6
7
8-9
10-11
12-13
14
14
15
15
16
16
17

17
18
18
18
19-21
22
23-25
26
27
28
28
29
30
31-32
17. RATES OF HOUSE RENT ALLOWANCE
18. EXPENDITURE ON COMPENSATORY (CITY) ALLOWANCE INCLUDING EMPLOYEES OF UTs
19. RATES OF COMPENSATORY (CITY) ALLOWANCE
20. RATES OF TRANSPORT ALLOWANCE
21. MINISTRY/DEPARTMENT-WISE EXPENDITURE ON PAY AND ALLOWANCES
22. EXPENDITURE ON PAY AND ALLOWANCES VIS A VIS REVENUE RECEIPTS AND REVENUE
EXPENDITURE
23. GROUP-WISE AND STATUS-WISE ESTIMATED NUMBER OF CENTRAL GOVERNMENT CIVILIAN
EMPLOYEES
24. GROUP-WISE AND STATUS-WISE ESTIMATED NUMBER OF CENTRAL GOVERNMENT CIVILIAN
EMPLOYEES IN MAJOR MINISTRIES
25. GROUP-WISE ESTIMATED NUMBER OF SANCTIONED POSTS AND THEIR VACANCY POSITION
26. GROUP-WISE DISTRIBUTION OF CENTRAL GOVERNMENT CIVILIAN EMPLOYEES AND UT
ADMINISTRATIONS
27. STRENGTH OF CENTRAL POLICE FORCES
28. ALL INDIA CONSUMER PRICE INDEX NUMBER FOR INDUSTRIAL WORKERS
29. TOTAL EMOLUMENTS AT THE MINIMUM AND MAXIMUM OF SCALES OF PAY IN CENTRAL
GOVERNMENT
30. DISPARITY RATIO IN EMOLUMENTS UNDER DIFFERENT STATE GOVERNMENTS

SALIENT FEATURES
1. The total expenditure on Pay and Allowances (excluding Productivity Linked Bonus/
Ad-hoc Bonus, Honorarium, Encashment of Earned Leave and Travelling Allowance) forRegular Central Government Civilian employees including employees of the Union Territories
was Rs. 42926.03 crore in 2006-2007 as compared to Rs. 40417.98 crore over the previous
year. Thus, there is an increase in expenditure by Rs. 2508.05 crore over previous year
which in relative terms works out to 6.21 %.
2. Out of the total expenditure of Rs. 42926.03 crore, the percentage expenditure on
Pay (including DP) is 66.35%, on Dearness Allowance 18.77%, on House Rent Allowance(HRA) and Compensatory (City) Allowance (CCA) 7.31% and on other allowances 7.57 %.
3. The expenditure on Pay and DA has increased by 1.72% and 33.98% respectively,
compared to the corresponding expenditure of the previous year.
4. The total expenditure on Pay and Allowances as a percentage of Revenue Receipts
and Revenue Expenditure of the Central Government during the period was 8.17% and6.52%, respectively.
5. Of the total expenditure on Pay and Allowances, the Ministry of Railways continues
to have the largest share at 39.93 per cent, marginally increased from 39.82 percent in
2005-2006. Similarly, the shares of Ministry of Defence, Department of Posts and Other
Departments have come marginally down from previous year i.e. 14.78% to 14.43%, 9.10%
to 8.91% and 20.45% to 20.16%. The Ministry of Home Affairs is slightly increased i.e.15.85% to 16.57%.
6. The disparity ratio at the minimum of the scale of lowest and maximum of the scale
of highest paid Central Government employees (Pay + Dearness Pay + Dearness
Allowance) as on 1.1.2007 is 1:11.76 which is same as that on 1.1.2006.
7. In State Governments as on 1.1.2007, the disparity ratio [ratio of lowest and highest
paid State Government Employee] was lowest in Assam and highest in Delhi and were1:6.94 and 1: 11.76, respectively.
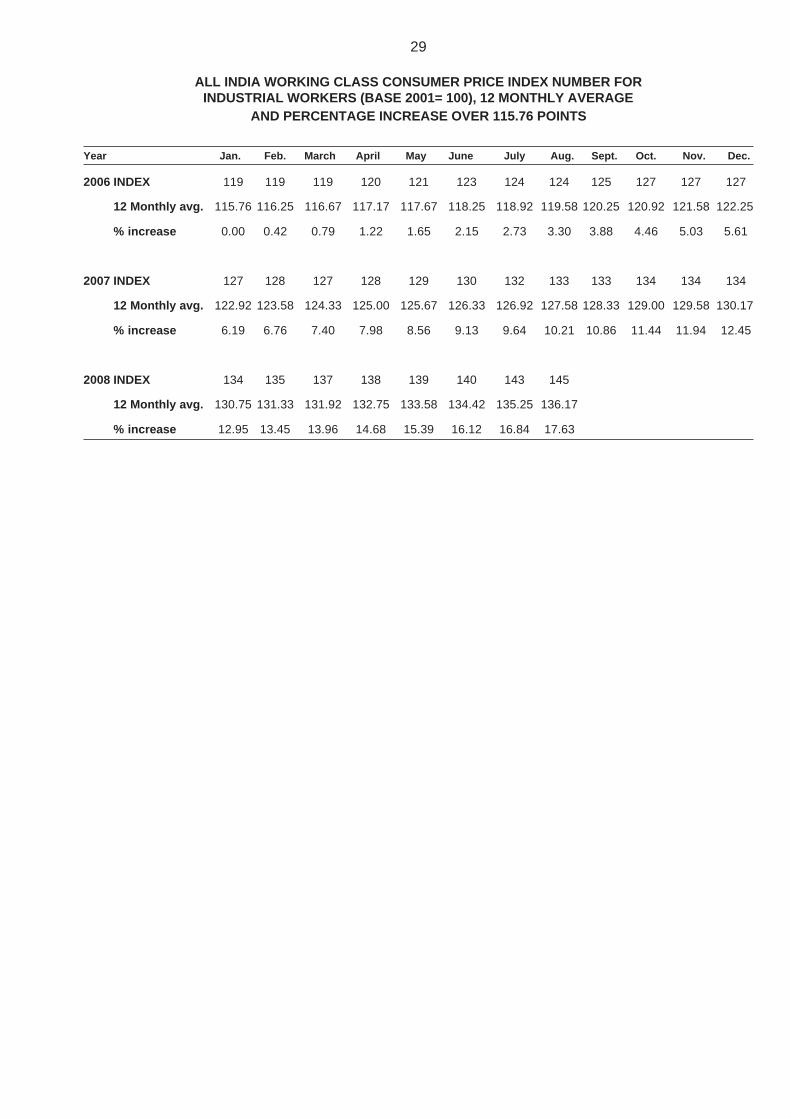
8. The new series of Consumer Price Index Number (CPI) for Industrial Worker
(Base 2001=100) has registered an increase of 16.12 percent over 115.76 points, up to
June 2008.

9. The total number of Regular Central Government (Civilian) Employees in position
was 31.09 lakh as against the sanctioned strength of 35.47 lakh as on 1.3.2007.
10. The sanctioned strength of Central Police Forces was 7.40 lakh against 6.75 lakhin position as on 1.3.2007.
11. Of the total strength of 31.09 lakh, the percentage share of the Railways is 45.23%,
Home Affairs 22.57%, Defence (Civilian) 11.73%, Posts 7.08% and all other Ministries/
Departments 13.39%.
12. Of the total number of 35.47 lakh sanctioned posts approximately 12 percent of the
posts were vacant as on 1.3.2007.
*****
2

SHARE OF MAJOR COMPONENTS IN TOTAL EXPENDITURE OF CENTRALGOVERNMENT CIVILIAN EMPLOYEES INCLUDING EMPLOYEES OF
UNION TERRITORIES DURING THE LAST THREE YEARS
(Expressed as percentage to total)
Year Pay DA HRA+CCA Other TotalAllowances
2004-05 70.14 14.16 8.00 7.70 100.00
2005-06 69.28 14.88 8.10 7.74 100.00
2006-07 66.35 18.77 7.31 7.57 100.00
0
10
20
30
40
50
60
70
80
Pay DA HRA+CCA Other Allowances
Per
cent
age
Shar
e
2004-052005-062006-07
3

SHARE OF MAJOR DEPARTMENTS IN TOTALEXPENDITURE DURING LAST THREE YEARS
(Expressed as percentage to total)
Year Railways Defence Home Posts Other Departments Total(Civilian) Affairs including
Union Territories
2004-05 39.94 15.67 14.25 10.46 19.68 100.00
2005-06 39.82 14.78 15.85 9.10 20.45 100.00
2006-07 39.93 14.43 16.57 8.91 20.16 100.00
Share of Major Departments in Total Expenditure
0
5
10
15
20
25
30
35
40
45
Railways Defence (Civilian) Home Affairs Posts Other Departmentsincluding Union
Territories
Perc
enta
ge S
hare
2004-05 2005-06 2006-07
Share of Major Departments in Total Expenditure
4

5
EXPENDITURE ON PAY AND ALLOWANCES OF THE CENTRALGOVERNMENT CIVILIAN EMPLOYEES
(Rs. in crore)
Year Pay DA Other Allowances Total
2004-05 26639.23 5389.81 5950.33 37979.37
2005-06 27518.07 5911.64 6282.92 39712.63
2006-07 27957.08 7911.52 6259.38 42127.98
Note: (i) This does not include the expenditure incurred on Productivity Linked Bonus/Ad hoc Bonus,Honorarium and Encashment of Earned Leave.
(ii) This does not include the expenditure incurred on employees of UTs but includes theexpenditure on the employees of Missions/Embassies.
(iii) Other Allowances includes HRA, CCA, OTA, TA, Special Pay and Deput. (Duty) Allowance,CEA, Reimburshment of Tution Fee, Reimburshment of Medical Charges, Leave TravelConcession and Other Compensatory Allowances.
Expenditure on Pay and Allowances
0
5000
10000
15000
20000
25000
30000
2004-05 2005-06 2006-07
Year
Rs.
in c
rore
PayDA
Other Allowances
6
Note : (i) This does not include the expenditure incurred on Productivity Linked Bonus/Ad hoc Bonus,Honorarium and Encashment of Earned Leave.
(ii) Other Allowances includes HRA, CCA, OTA, TA, Special Pay and Deput. (Duty) Allowance,CEA, Reimburshment of Tution Fee, Reimburshment to Medical Charges, Leave TravelConcession and Other Compensatory Allowances.
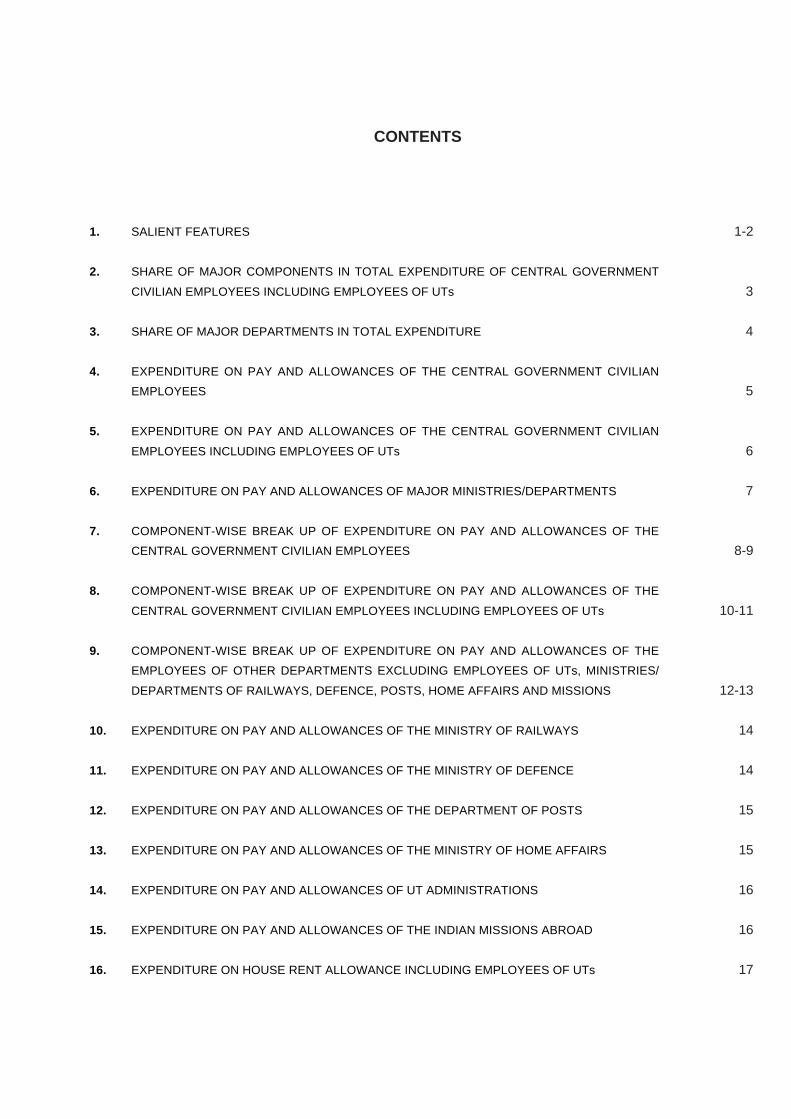
EXPENDITURE ON PAY AND ALLOWANCES OF THE CENTRAL GOVERNMENTCIVILIAN EMPLOYEE INCLUDING EMPLOYEES OF UNION TERRITORIES
(Rs. in crore)
Year Pay DA Other Allowances Total
2004-05 27111.79 5471.46 6069.56 38652.81
2005-06 28000.94 6013.01 6404.03 40417.98
2006-07 28481.27 8056.17 6388.59 42926.03
Expenditure on Pay and Allowances including Union Territories
0
5000
10000
15000
20000
25000
30000
2004-05 2005-06 2006-07Year
Rs.
in c
rore
PayDAOther Allowances
Year

7
EXPENDITURE ON PAY AND ALLOWANCES OF MAJORMINISTRIES/DEPARTMENTS DURING THE LAST THREE YEARS
(Rs. in crore)
Year All India Railways Defence Posts Home Affairs(Civilian)
2004-05 38652.81 15436.80 6056.48 4042.78 5506.57
2005-06 40417.98 16094.70 5973.86 3679.84 6407.81
2006-07 42926.03 17142.79 6193.22 3824.58 7111.51
Note : Expenditure figure do not include Travelling Allowance, Productivity Linked Bonus/Ad hoc Bonus,Honorarium and Encashment of Earned Leave.
Expenditure on Pay and Allowances of Major Ministries/Departments
0
5000
10000
15000
20000
25000
30000
35000
40000
45000
50000
2004-05 2005-06 2006-07
Year
Rs.
in c
rore
All IndiaRailwaysDefence (Civilian)PostsHome Affairs

8
COMPONENT-WISE BREAK UP OF EXPENDITURE ON PAY ANDALLOWANCES OF THE CENTRAL GOVERNMENT CIVILIAN
EMPLOYESS DURING THE LAST THREE YEARS
(Rs. in crore)
S.No. Pay/Allowances 2004-05 2005-06 2006-07
1 2 3 4 5
1 Pay of Gazetted Officers 2581.90 2827.25 3274.79
2 Pay of Non-Gazetted Staff 24057.33 24690.82 24682.29
3 Dearness Allowance 5389.81 5911.64 7911.52
Sub-Total (i) 32029.04 33429.71 35868.60
1 House Rent Allowance 2626.62 2785.27 2678.03
2 Compensatory (City) Allowance 404.54 424.87 417.92
3 Overtime Allowance 839.34 928.19 796.90
4 Transport Allowance 296.70 276.13 286.71
5 Spl. Pay & Deput. (Duty) Allowance 32.02 34.22 35.14
6 Composite Hill Compen. Allowance 17.50 13.22 14.45
7 Children Education Allowance 78.93 80.07 80.59
8 Reimbursement of Tuition Fee 21.48 20.74 23.15
9 Reimbursement of Medical Charges 315.22 339.46 391.79
10 Leave Travel Concession 153.92 203.93 187.41
11 Other Compensatory Allowances 1164.06 1176.82 1347.29
Sub-Total (ii) 5950.33 6282.92 6259.38
Grand Total (i) + (ii) 37979.37 39712.63 42127.98
Travelling Allowance 1162.93 1247.60 1476.45
Note : (i) This does not include the expenditure incurred on Productivity Linked Bonus/Ad hoc Bonus,Honorarium and Encashment of Earned Leave.
(ii) This does not include the expenditure incurred on employees of UTs but includes theexpenditure on the employees of Missions/Embassies.

9
Pie chart showing percentage expenditure incurred on differentcomponents of pay and allowances during 2006-07
8%
59%
19%
6%
1%
2%
1%
1%
3%
Pay of Gazetted Officers Pay of Non‐Gazetted StaffDearness Allowance House Rent Allowance
Compensatory (City) Allowance Overtime AllowanceTransport Allowance Reimbursement of Medical Charges
Other Compensatory Allowances

10
COMPONENT-WISE BREAK UP OF EXPENDITURE ON PAY AND ALLOWANCESOF THE CENTRAL GOVERNMENT CIVILIAN EMPLOYESS INCLUDING EMPLOYEES
OF UNION TERRITORIES DURING THE LAST THREE YEARS
(Rs. in crore)
S.No. Pay/Allowances 2004-05 2005-06 2006-07
1 2 3 4 5
1 Pay of Gazetted Officers 2658.86 2903.97 3367.76
2 Pay of Non-Gazetted Staff 24452.93 25096.97 25113.51
3 Dearness Allowance 5471.46 6013.01 8056.17
Sub-Total (i) 32583.25 34013.95 36537.44
1 House Rent Allowance 2685.72 2844.70 2717.21
2 Compensatory (City) Allowance 409.03 429.42 422.59
3 Overtime Allowance 849.84 939.55 810.16
4 Transport Allowance 297.92 279.25 290.01
5 Spl. Pay & Deput. (Duty) Allowance 35.08 35.91 35.95
6 Composite Hill Compen. Allowance 17.50 13.22 14.45
7 Children Education Allowance 78.95 80.07 80.60
8 Reimbursement of Tuition Fee 21.52 20.80 23.20
9 Reimbursement of Medical Charges 321.96 346.07 398.24
10 Leave Travel Concession 154.55 204.57 188.25
11 Other Compensatory Allowances 1197.49 1210.47 1407.93
Sub-Total (ii) 6069.56 6404.03 6388.59
Grand Total (i) + (ii) 38652.81 40417.98 42926.03
Travelling Allowance 1174.28 1261.93 1491.66
Note : This does not include the expenditure incurred on Productivity Linked Bonus/Ad hoc Bonus,Honorarium and Encashment of Earned Leave.

11
Pie chart showing percentage expenditure incurred on differentcomponents of pay and allowances including employees
of Union Territories during 2006-07
8%
59%
19%
6%
1%
2%
1%
1%
3%
Pay of Gazetted Officers Pay of Non‐Gazetted StaffDearness Allowance House Rent Allowance
Compensatory (City) Allowance Overtime AllowanceTransport Allowance Reimbursement of Medical Charges
Other Compensatory Allowances

12
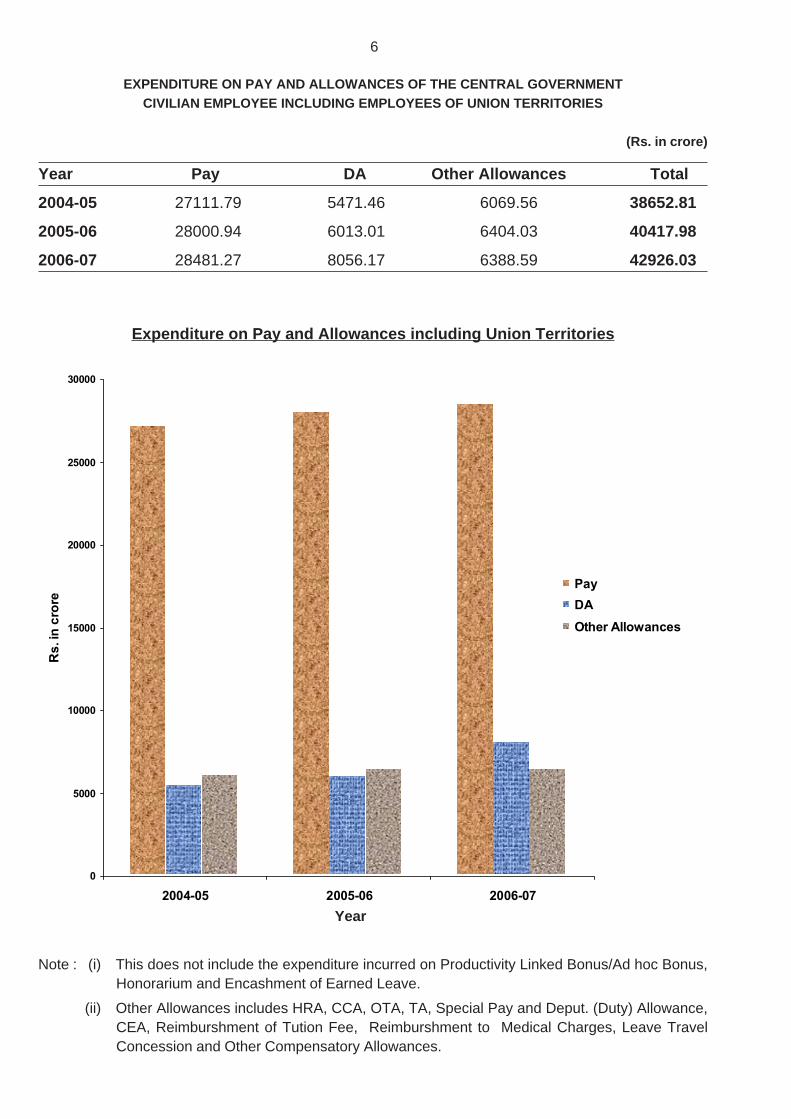
COMPONENT-WISE BREAK UP OF EXPENDITURE ON PAY AND ALLOWANCESOF THE EMPLOYEES OF OTHER DEPARTMENTS EXCLUDING EMPLOYEES
OF UTs, MINISTRIES/DEPARTMENTS OF RAILWAYS, DEFENCE, POSTS,HOME AFFAIRS AND MISSIONS
(Rs. in Crore)
Sl. No. Pay/Allowances 2004-2005 2005-2006 2006-2007
1 2 3 4 5
1 Pay of Gazetted Officers 1371.27 1504.88 1853.47
2 Pay of Non-Gazetted Staff 3225.58 3358.77 3032.48
3 Dearness Allowance 743.41 973.90 1316.32
Sub-Total (i) 5340.26 5837.55 6202.27
1 House Rent Allowance 586.02 599.38 622.90
2 Compensatory (City) Allowance 82.78 86.37 88.26
3 Overtime Allowance 89.39 116.18 57.80
4 Transport Allowance 74.31 75.21 80.77
5 Spl. Pay & Deput. (Duty) Allowance 10.32 10.09 11.86
6 Composite Hill Compen. Allowance 3.62 3.47 3.29
7 Children Education Allowance 0.76 1.67 1.44
8 Reimbursement of Tuition Fee 4.24 3.99 4.03
9 Reimbursement of Medical Charges 107.40 118.22 149.69
10 Leave Travel Concession 40.73 70.04 73.54
11 Other Compensatory Allowances 115.98 161.23 108.68
Sub-Total (ii) 1115.55 1245.85 1202.26
Grand Total (i) + (ii) 6455.81 7083.40 7404.53
Travelling Allowance 245.85 310.57 375.05
13
Pie chart showing percentage expenditure incurred on different componentsof pay and allowances excluding UTs, Railways, Defence, Posts,
Home Affairs and Missions during 2006-07
25%
42%
18%
8%
1%
1%
1%
2%
1%
1%
Pay of Gazetted Officers Pay of Non-Gazetted StaffDearness Allowance House Rent AllowanceCompensatory (City) Allowance Overtime AllowanceTransport Allowance Reimbursement of Medical ChargesLeave Travel Concession Other Compensatory Allowances

14
EXPENDITURE ON PAY AND ALLOWANCES OF THE EMPLOYEES OF M/O RAILWAYS
(Rs. in Crore)
Sl. No. Pay/Allowances 2004-2005 2005-2006 2006-2007
1 2 3 4 5
1 Pay of Gazetted Officers 295.63 362.46 389.292 Pay of Non-Gazetted Staff 10476.09 11028.33 10984.233 Dearness Allowance 2367.34 2392.07 3189.49
Sub-Total (i) 13139.06 13782.86 14563.011 House Rent Allowance 1167.66 1260.96 1184.822 Compensatory (City) Allowance 166.72 177.70 168.773 Overtime Allowance 232.52 279.07 304.884 Transport Allowance 132.21 121.88 115.505 Special Pay and Deput.(Duty) Allowance 4.23 5.24 7.966 Composite Hill Compensatory Allowance 0.20 0.44 0.697 Children Education Allowance 0.20 0.16 0.178 Reimbursement of Tuition Fee 9.74 10.25 13.869 Reimbursement of Medical Charges 10.55 21.64 24.13
10 Leave Travel Concession * 2.06 0.07 0.7411 Other Compensatory Allowances 571.65 434.43 758.26
Sub - Total (ii) 2297.74 2311.84 2579.78Grand Total (i) + (ii) 15436.80 16094.70 17142.79Travelling Allowance 373.71 369.33 385.63
* The Employees of Railways get free passes.
EXPENDITURE ON PAY AND ALLOWANCES OF THECIVILIAN EMPLOYEES OF M/O DEFENCE
(Rs. in Crore)
Sl. No. Pay/Allowances 2004-2005 2005-2006 2006-2007
1 2 3 4 5
1 Pay of Gazetted Officers 587.40 567.16 623.392 Pay of Non-Gazetted Staff 3498.36 3360.66 3379.343 Dearness Allowance 675.95 743.37 1033.21
Sub-Total (i) 4761.71 4671.19 5035.941 House Rent Allowance 472.09 470.69 442.502 Compensatory (City) Allowance 73.80 73.82 70.383 Overtime Allowance 483.61 495.86 398.154 Transport Allowance 46.03 42.96 58.335 Special Pay and Deput.(Duty) Allowance 7.13 8.62 4.496 Composite Hill Compensatory Allowance 7.69 3.64 4.377 Children Education Allowance 0.53 0.63 0.588 Reimbursement of Tuition Fee 3.84 3.22 2.579 Reimbursement of Medical Charges 85.98 85.58 99.55
10 Leave Travel Concession 17.76 22.10 23.0211 Other Compensatory Allowances 96.31 95.55 53.34
Sub - Total (ii) 1294.77 1302.67 1157.28Grand Total (i) + (ii) 6056.48 5973.86 6193.22Travelling Allowance 91.93 108.57 168.60
15
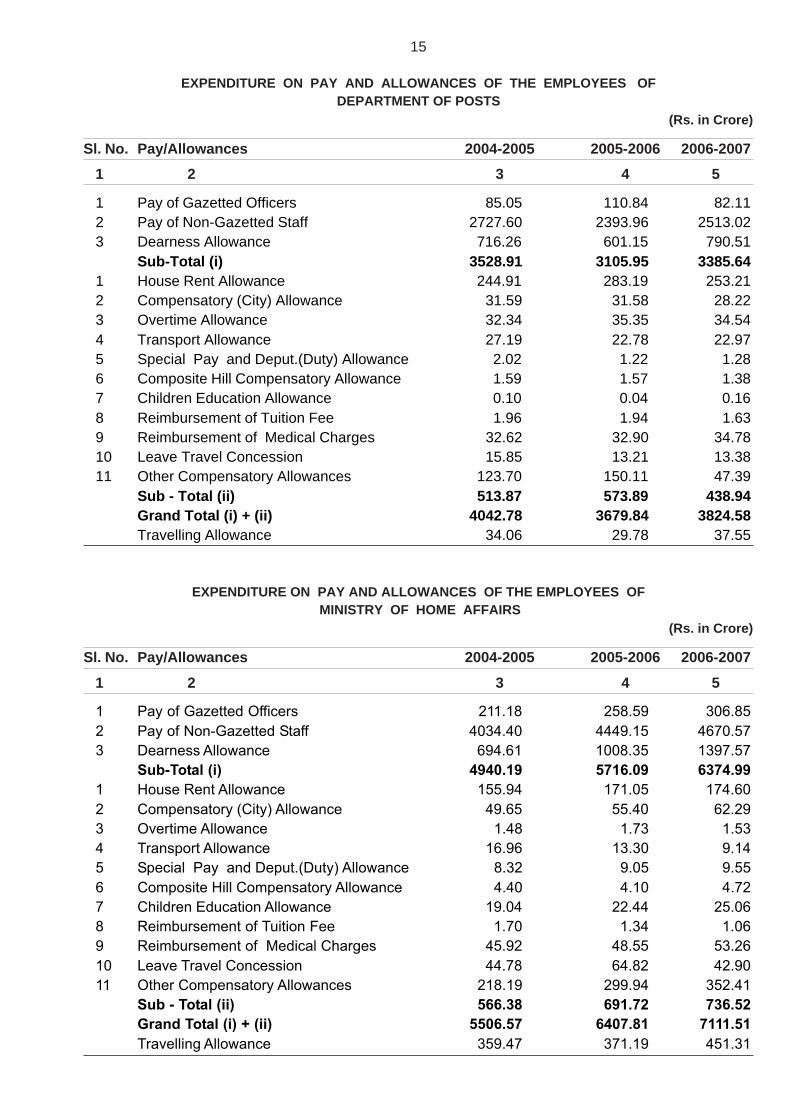
EXPENDITURE ON PAY AND ALLOWANCES OF THE EMPLOYEES OFDEPARTMENT OF POSTS
(Rs. in Crore)
Sl. No. Pay/Allowances 2004-2005 2005-2006 2006-2007
1 2 3 4 5
1 Pay of Gazetted Officers 85.05 110.84 82.112 Pay of Non-Gazetted Staff 2727.60 2393.96 2513.023 Dearness Allowance 716.26 601.15 790.51
Sub-Total (i) 3528.91 3105.95 3385.641 House Rent Allowance 244.91 283.19 253.212 Compensatory (City) Allowance 31.59 31.58 28.223 Overtime Allowance 32.34 35.35 34.544 Transport Allowance 27.19 22.78 22.975 Special Pay and Deput.(Duty) Allowance 2.02 1.22 1.286 Composite Hill Compensatory Allowance 1.59 1.57 1.387 Children Education Allowance 0.10 0.04 0.168 Reimbursement of Tuition Fee 1.96 1.94 1.639 Reimbursement of Medical Charges 32.62 32.90 34.7810 Leave Travel Concession 15.85 13.21 13.3811 Other Compensatory Allowances 123.70 150.11 47.39
Sub - Total (ii) 513.87 573.89 438.94Grand Total (i) + (ii) 4042.78 3679.84 3824.58Travelling Allowance 34.06 29.78 37.55
EXPENDITURE ON PAY AND ALLOWANCES OF THE EMPLOYEES OF MINISTRY OF HOME AFFAIRS
(Rs. in Crore)
Sl. No. Pay/Allowances 2004-2005 2005-2006 2006-2007
1 2 3 4 5
1 Pay of Gazetted Officers 211.18 258.59 306.852 Pay of Non-Gazetted Staff 4034.40 4449.15 4670.573 Dearness Allowance 694.61 1008.35 1397.57
Sub-Total (i) 4940.19 5716.09 6374.991 House Rent Allowance 155.94 171.05 174.602 Compensatory (City) Allowance 49.65 55.40 62.293 Overtime Allowance 1.48 1.73 1.534 Transport Allowance 16.96 13.30 9.145 Special Pay and Deput.(Duty) Allowance 8.32 9.05 9.556 Composite Hill Compensatory Allowance 4.40 4.10 4.727 Children Education Allowance 19.04 22.44 25.068 Reimbursement of Tuition Fee 1.70 1.34 1.069 Reimbursement of Medical Charges 45.92 48.55 53.2610 Leave Travel Concession 44.78 64.82 42.9011 Other Compensatory Allowances 218.19 299.94 352.41
Sub - Total (ii) 566.38 691.72 736.52Grand Total (i) + (ii) 5506.57 6407.81 7111.51Travelling Allowance 359.47 371.19 451.31

16
EXPENDITURE ON PAY AND ALLOWANCES OF THE EMPLOYEESOF UNION TERRITORY ADMINISTRATIONS
(Rs. in Crore)
Sl. No. Pay/Allowances 2004-2005 2005-2006 2006-2007
1 2 3 4 5
1 Pay of Gazetted Officers 76.96 76.72 92.972 Pay of Non-Gazetted Staff 395.60 406.15 431.223 Dearness Allowance 81.65 101.37 144.65
Sub-Total (i) 554.21 584.24 668.841 House Rent Allowance 59.10 59.43 39.182 Compensatory(City) Allowance 4.49 4.55 4.673 Overtime Allowance 10.50 11.36 13.264 Transport Allowance 1.22 3.12 3.305 Special Pay and Deput. (Duty) Allow. 3.06 1.69 0.816 Children Education Allowance 0.02 0.00 0.017 Reimbursement of Tuition Fee 0.04 0.06 0.058 Reimbursement of Medical Charges 6.74 6.61 6.459 Leave Travel Concession 0.63 0.64 0.8410 Other Compensatory Allowances 33.43 33.65 60.64
Sub-Total (ii) 119.23 121.11 129.21Grand Total (i) + (ii) 673.44 705.35 798.05Travelling Allowance 11.35 14.33 15.21
EXPENDITURE ON PAY AND ALLOWANCES OF REGULAR EMPLOYEES AND LOCAL RECRUITS IN INDIAN MISSIONS ABROAD
(Rs. in Crore)
Sl. No. Pay/Allowances 2004-2005 2005-2006 2006-2007
1 2 3 4 5
INDIA BASED
1 Pay of Officers 31.37 23.32 19.682 Pay of Establishment 16.91 17.93 20.61
Sub-total (i) 48.28 41.25 40.291 Foreign Allowance 192.24 192.80 184.422 Children Education Allowance 58.30 55.13 53.183 Home Leave Fares 32.74 33.69 33.834 Reimbursement of Medical Charges 32.75 32.57 30.385 Other Compensatory Allowances 13.94 12.46 8.616 Representational Grant 15.14 14.50 11.93
Sub- Total (ii) 345.11 341.15 322.35
LOCAL RECRUITS
1 Pay 78.39 82.02 82.042 Allowances 9.15 8.60 6.67
Sub-Total (iii) 87.54 90.62 88.71Grand Total (i)+(ii)+(iii) 480.93 473.02 451.35*Travelling Allowance 93.20 104.08 110.60
* Pr. CCA consolidated figures.

17
EXPENDITURE ON HOUSE RENT ALLOWANCE OF CENTRALGOVERNMENT CIVILIAN EMPLOYEES INCLUDING EMPLOYEES
OF UNION TERRITORIES BY CLASS OF CITIES
(Rs. in Crore)
Expenditure on House Rent Allowance
Class of City 2004-2005 2005-2006 2006-2007
A+A1 1589.62 1741.06 1666.28
(59.19) (61.20) (61.32)
B-1 383.75 321.15 310.99
(14.29) (11.29) (11.44)
B-2 301.61 321.08 300.22
(11.23) (11.29) (11.05)
C 286.83 255.96 253.38
(10.68) (9.00) (9.33)
Unclassified 123.91 205.45 186.34
(4.61) (7.22) (6.86)
Total 2685.72 2844.70 2717.21
(100.00) (100.00) (100.00)
N.B.: Figures in parentheses are the percentages to the total expenditure on House Rent Allowance.
RATES OF HOUSE RENT ALLOWANCE
Classification of Cities/Towns Rates of HRA
A-1 30 Percent of the (Basic Pay + Dearness Pay)
A, B-1 & B-2 15 Percent of the (Basic Pay + Dearness Pay)
C 7.5 Percent of the (Basic Pay + Dearness Pay)
Unclassified 5 Percent of the (Basic Pay + Dearness Pay)

18
EXPENDITURE ON COMPENSATORY (CITY) ALLOWANCE OF CENTRALGOVERNMENT CIVILIAN EMPLOYEES INCLUDING EMPLOYEES
OF UNION TERRITORIES BY CLASS OF CITIES
(Rs. in Crore)
Expenditure on Compensatory (City) Allowance
Class of City 2004-2005 2005-2006 2006-2007
A+A1 250.74 245.70 269.39
(61.30) (57.22) (63.75)
B-1 51.32 51.77 54.39
(12.55) (12.06) (12.87)
B-2 52.53 79.19 43.74
(12.84) (18.44) (10.35)
C* 31.89 27.58 31.30
(7.80) (6.42) (7.40)
Unclassified* 22.54 25.18 23.78
(5.51) (5.86) (5.63)
Total 409.02 429.42 422.60(100.00) (100.00) (100.00)
N.B.: Figures in parentheses are the percentages to the total expenditure on Compensatory (City) Allowance.
*Compensatory (City) Allowance is also admissible in certain C-Class and Unclassified cities.
RATES OF COMPENSATORY (CITY) ALLOWANCE
Pay Range** Amount of CCA in Class of Cities (Rs. p.m.)
A-1 A B-1 B-2Below Rs. 3000/- 90 65 45 25
Rs. 3000-4499/- 125 95 65 35
Rs. 4500-5999/- 200 150 100 65
Rs. 6000 and above 300 240 180 120
** Pay includes DP also.
RATES OF TRANSPORT ALLOWANCE
Pay scales of Employees Rates of Transport Allowance per month in (Rs.)
A-1/A Class City Other Places
Employees drawing pay in the scale of pay ofRs. 8000-13500 and above 800 400
Employees drawing pay in the scale of pay of Rs. 6500-6900or above but below the scale of Rs. 8000-13500 400 200
Employees drawing pay below the scale of Rs. 6500 - 6900 100 75

19
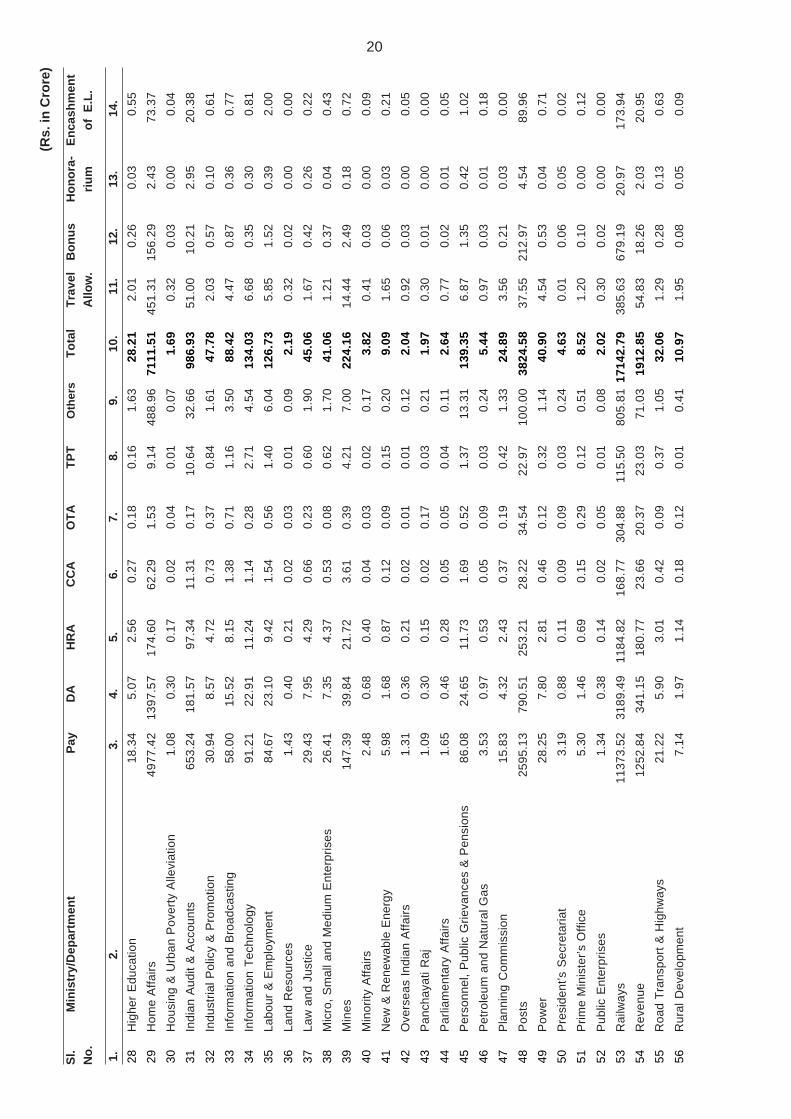
EX
PE
ND
ITU
RE
INC
UR
RE
D O
N P
AY
AN
D A
LLO
WA
NC
ES
BY
TH
E C
EN
TRA
L M
INIS
TRIE
S/D
EP
AR
TME
NTS
ON
CIV
ILIA
N E
MP
LOY
EE
S D
UR
ING
200
6-20
07
(R
s. in
Cro
re)
Sl.
Min
istr
y/D
epar
tmen
t P
ayD
AH
RA
CC
AO
TATP
TO
ther
sTo
tal
Trav
elB
onus
Hon
ora-
Enc
ashm
ent
No.
Allo
w.
rium
of E
.L.
1.
2.3.
4.5.
6.7.
8.
9.10
. 1
1.
12.
13.
14.
1A
gric
ultu
ral R
esea
rch
& E
duca
tion
0.67
0.18
0.08
0.01
0.01
0.02
0.02
0.99
0.13
0.01
0.00
0.05
2A
gric
ultu
re a
nd C
oope
ratio
n58
.90
17.1
08.
171.
280.
431.
113.
9690
.95
5.16
0.99
0.29
1.72
3A
nim
al H
usba
ndry
and
Dai
ryin
g37
.02
10.1
54.
640.
900.
560.
453.
2556
.97
1.31
0.98
0.11
2.60
4A
tom
ic E
nerg
y45
7.30
120.
8439
.69
6.85
15.5
52.
5854
.88
697.
6936
.02
9.36
0.33
15.6
1
5A
YU
SH
3.23
0.89
0.55
0.05
0.01
0.03
0.26
5.02
0.52
0.03
0.00
0.10
6B
io-T
echn
olog
y2.
900.
800.
460.
040.
040.
030.
164.
431.
150.
030.
030.
00
7C
hem
ical
s an
d P
etro
chem
ical
s4.
171.
150.
700.
090.
090.
100.
266.
561.
230.
040.
100.
16
8C
ivil
Avi
atio
n13
.89
3.82
1.28
0.22
0.19
0.13
0.93
20.4
61.
840.
210.
030.
18
9C
oal
4.24
1.17
0.68
0.10
0.05
0.08
0.28
6.60
0.77
0.06
0.00
0.13
10C
omm
erce
90.4
725
.15
15.1
12.
241.
491.
614.
7214
0.79
16.1
21.
850.
341.
99
11C
onsu
mer
Affa
irs13
.73
3.83
2.78
0.31
0.10
0.37
0.79
21.9
11.
160.
210.
110.
23
12C
orpo
rate
Affa
irs21
.88
6.04
1.94
0.32
0.11
0.20
1.43
31.9
21.
340.
360.
110.
55
13C
ultu
re74
.53
20.8
59.
371.
350.
820.
926.
7111
4.55
5.26
2.25
0.17
2.06
14D
efen
ce (
Civ
ilian
)40
02.7
310
33.2
144
2.50
70.3
839
8.15
58.3
318
7.92
6193
.22
168.
6097
.73
1.41
89.1
9
15D
evel
opm
ent o
f NE
Reg
ion
3.00
0.83
0.45
0.04
0.07
0.03
0.21
4.63
0.65
0.04
0.01
0.10
16D
isin
vest
men
t0.
890.
240.
120.
020.
010.
020.
011.
310.
020.
030.
000.
03
17D
rinki
ng W
ater
Sup
ply
0.73
0.20
0.11
0.01
0.01
0.01
0.05
1.12
0.42
0.01
0.00
0.00
18E
arth
Sci
ence
s72
.17
20.8
010
.24
1.70
2.71
1.17
5.06
113.
853.
661.
110.
140.
99
19E
cono
mic
Affa
irs29
.77
8.39
4.81
0.62
0.47
0.60
2.46
47.1
23.
750.
510.
240.
41
20E
nviro
nmen
t & F
ores
ts39
.70
11.0
25.
300.
781.
170.
533.
1161
.61
6.90
0.90
0.06
0.81
21E
xpen
ditu
re10
.17
2.79
1.44
0.25
0.22
0.21
0.66
15.7
40.
840.
150.
070.
33
22E
xter
nal A
ffairs
**38
.95
10.6
56.
990.
960.
290.
762.
1060
.70
24.4
30.
680.
031.
89
23F
ertil
izer
s3.
911.
010.
600.
100.
090.
090.
256.
050.
450.
050.
110.
20
24F
ood
& P
ublic
Dis
trib
utio
n15
.97
4.45
2.12
0.34
0.30
0.31
1.05
24.5
41.
440.
280.
090.
55
25F
ood
Pro
cess
ing
Indu
strie
s2.
770.
770.
400.
060.
050.
070.
194.
310.
580.
030.
020.
25
26H
ealth
& F
amily
Wel
fare
331.
1191
.43
33.1
14.
901.
052.
9829
.68
494.
2610
.50
4.30
0.40
9.93
27H
eavy
Ind
ustr
y2.
870.
810.
460.
070.
070.
080.
274.
630.
670.
050.
040.
07
20
28H
ighe
r E
duca
tion
18.3
45.
072.
560.
270.
180.
161.
6328
.21
2.01
0.26
0.03
0.55
29H
ome
Affa
irs49
77.4
213
97.5
717
4.60
62.2
91.
539.
1448
8.96
7111
.51
451.
3115
6.29
2.43
73.3
7
30H
ousi
ng &
Urb
an P
over
ty A
llevi
atio
n1.
080.
300.
170.
020.
040.
010.
071.
690.
320.
030.
000.
04
31In
dian
Aud
it &
Acc
ount
s65
3.24
181.
5797
.34
11.3
10.
1710
.64
32.6
698
6.93
51.0
010
.21
2.95
20.3
8
32In
dust
rial P
olic
y &
Pro
mot
ion
30.9
48.
574.
720.
730.
370.
841.
6147
.78
2.03
0.57
0.10
0.61
33In
form
atio
n an
d B
road
cast
ing
58.0
015
.52
8.15
1.38
0.71
1.16
3.50
88.4
24.
470.
870.
360.
77
34In
form
atio
n T
echn
olog
y91
.21
22.9
111
.24
1.14
0.28
2.71
4.54
134.
036.
680.
350.
300.
81
35La
bour
& E
mpl
oym
ent
84.6
723
.10
9.42
1.54
0.56
1.40
6.04
126.
735.
851.
520.
392.
00
36La
nd R
esou
rces
1.43
0.40
0.21
0.02
0.03
0.01
0.09
2.19
0.32
0.02
0.00
0.00
37La
w a
nd J
ustic
e29
.43
7.95
4.29
0.66
0.23
0.60
1.90
45.0
61.
670.
420.
260.
22
38M
icro
, Sm
all a
nd M
ediu
m E
nter
pris
es26
.41
7.35
4.37
0.53
0.08
0.62
1.70
41.0
61.
210.
370.
040.
43
39M
ines
147.
3939
.84
21.7
23.
610.
394.
217.
0022
4.16
14.4
42.
490.
180.
72
40M
inor
ity A
ffairs
2.48
0.68
0.40
0.04
0.03
0.02
0.17
3.82
0.41
0.03
0.00
0.09
41N
ew &
Ren
ewab
le E
nerg
y5.
981.
680.
870.
120.
090.
150.
209.
091.
650.
060.
030.
21
42O
vers
eas
Indi
an A
ffairs
1.31
0.36
0.21
0.02
0.01
0.01
0.12
2.04
0.92
0.03
0.00
0.05
43P
anch
ayat
i Raj
1.09
0.30
0.15
0.02
0.17
0.03
0.21
1.97
0.30
0.01
0.00
0.00
44P
arlia
men
tary
Affa
irs1.
650.
460.
280.
050.
050.
040.
112.
640.
770.
020.
010.
05
45P
erso
nnel
, Pub
lic G
rieva
nces
& P
ensi
ons
86.0
824
.65
11.7
31.
690.
521.
3713
.31
139.
356.
871.
350.
421.
02
46P
etro
leum
and
Nat
ural
Gas
3.53
0.97
0.53
0.05
0.09
0.03
0.24
5.44
0.97
0.03
0.01
0.18
47P
lann
ing
Com
mis
sion
15.8
34.
322.
430.
370.
190.
421.
3324
.89
3.56
0.21
0.03
0.00
48P
osts
2595
.13
790.
5125
3.21
28.2
234
.54
22.9
710
0.00
3824
.58
37.5
521
2.97
4.54
89.9
6
49P
ower
28.2
57.
802.
810.
460.
120.
321.
1440
.90
4.54
0.53
0.04
0.71
50P
resi
dent
’s S
ecre
taria
t3.
190.
880.
110.
090.
090.
030.
244.
630.
010.
060.
050.
02
51P
rime
Min
iste
r’s O
ffice
5.30
1.46
0.69
0.15
0.29
0.12
0.51
8.52
1.20
0.10
0.00
0.12
52P
ublic
Ent
erpr
ises
1.34
0.38
0.14
0.02
0.05
0.01
0.08
2.02
0.30
0.02
0.00
0.00
53R
ailw
ays
1137
3.52
3189
.49
1184
.82
168.
7730
4.88
115.
5080
5.81
1714
2.79
385.
6367
9.19
20.9
717
3.94
54R
even
ue12
52.8
434
1.15
180.
7723
.66
20.3
723
.03
71.0
319
12.8
554
.83
18.2
62.
0320
.95
55R
oad
Tra
nspo
rt &
Hig
hway
s21
.22
5.90
3.01
0.42
0.09
0.37
1.05
32.0
61.
290.
280.
130.
63
56R
ural
Dev
elop
men
t7.
141.
971.
140.
180.
120.
010.
4110
.97
1.95
0.08
0.05
0.09
(R
s. in
Cro
re)
Sl.
Min
istr
y/D
epar
tmen
t P
ayD
AH
RA
CC
AO
TATP
TO
ther
sTo
tal
Trav
elB
onus
Hon
ora-
Enc
ashm
ent
No.
Allo
w.
rium
of E
.L.
1.
2.3.
4.5.
6.7.
8.
9.10
. 1
1.
12.
13.
14.

21
57S
choo
l Edu
catio
n an
d Li
tera
cy2.
440.
670.
390.
040.
040.
020.
293.
890.
830.
040.
000.
07
58S
cien
ce &
Tec
hnol
ogy
95.6
126
.67
9.72
1.52
0.30
1.24
7.65
142.
717.
692.
000.
310.
56
59S
hipp
ing
21.7
05.
651.
950.
290.
080.
243.
1733
.08
2.86
0.36
0.07
0.49
60S
ocia
l Jus
tice
& E
mpo
wer
men
t8.
592.
370.
760.
130.
130.
080.
6212
.68
1.64
0.12
0.01
0.25
61S
pace
238.
6559
.65
20.7
03.
031.
262.
8334
.81
360.
9327
.62
1.57
0.07
11.7
8
62S
tatis
tics
& P
rogr
amm
e Im
plem
enta
tion
67.5
818
.33
10.3
51.
210.
091.
333.
7610
2.65
6.24
0.82
0.09
1.90
63S
teel
5.01
1.38
1.02
0.13
0.08
0.12
0.49
8.23
0.59
0.07
0.10
0.54
64T
elec
omm
unic
atio
ns30
.76
10.4
64.
670.
590.
290.
641.
7549
.16
2.86
0.36
0.04
0.00
65T
extil
es52
.29
14.4
37.
130.
870.
900.
602.
6678
.88
4.42
0.54
0.21
1.31
66T
ouris
m5.
311.
480.
940.
130.
070.
110.
368.
401.
120.
080.
060.
10
67T
ribal
Affa
irs2.
690.
860.
500.
050.
050.
030.
224.
400.
590.
040.
010.
10
68U
nion
Pub
lic S
ervi
ce C
omm
issi
on19
.27
5.36
3.44
0.56
0.12
0.48
1.68
30.9
11.
440.
340.
760.
70
69U
rban
Dev
elop
men
t28
1.17
59.5
621
.11
4.65
2.55
7.63
9.58
386.
258.
052.
820.
542.
05
70V
ice
Pre
side
nt’s
Sec
reta
riat
0.46
0.13
0.04
0.01
0.05
0.01
0.03
0.73
0.04
0.01
0.00
0.00
71W
ater
Res
ourc
es12
8.86
35.2
917
.24
2.41
0.30
2.40
11.0
119
7.51
11.1
91.
930.
274.
44
72W
omen
& C
hild
Dev
elop
men
t6.
961.
961.
260.
420.
050.
160.
3111
.12
0.96
0.12
0.04
0.47
73Y
outh
Affa
irs a
nd S
port
s4.
221.
170.
610.
070.
100.
060.
316.
541.
020.
080.
010.
02
Tota
l27
834.
6877
27.1
026
78.0
241
7.93
796.
8428
6.73
1935
.03
4167
6.33
1418
.14
1220
.18
42.1
854
2.83
** E
xclu
ding
Mis
sion
s A
broa
d.
(R
s. in
Cro
re)
Sl.
Min
istr
y/D
epar
tmen
t P
ayD
AH
RA
CC
AO
TATP
TO
ther
sTo
tal
Trav
elB
onus
Hon
ora-
Enc
ashm
ent
No.
Allo
w.
rium
of E
.L.
1.
2.3.
4.5.
6.7.
8.
9.10
. 1
1.
12.
13.
14.

22
EXPENDITURE ON PAY AND ALLOWANCES OF CENTRAL GOVERNMENT CIVILIANEMPLOYEES INCLUDING EMPLOYEES OF THE UNION TERRITORIES ASPERCENTAGE OF REVENUE RECEIPTS AND REVENUE EXPENDITURE
(Rs. in Crore)
Year Expenditure on Pay Revenue Receipts Revenue Expenditure on pay and Allowancesand Allowances of of the Central Expenditure as percentage of
Civilian Employees of Government of the Central Revenue RevenueCentral Government & Government Receipts Expenditure
Union Territories
2004-05 38653 376871 455571 10.26 8.48
2005-06 40418 430940 540637 9.38 7.48
2006-07 42926 525393 658240 8.17 6.52
Note : The above figures of the revenue receipts & expenditure have been taken from Annual Financial Statementof the Central Government as laid before the Parliament. The figures of receipts & expenditure includesRailways also.
Expenditure on Pay and Allowances vis a vis Revenue Receipt & Revenue Expenditure
0
100000
200000
300000
400000
500000
600000
700000
2004-05 2005-06 2006-07
Rs. i
n cr
ore
Expenditure on Pay and Allowancesof Civilian Employees of CentralGovernment & Union Territories
Revenue Receipits of the CentralGovernment
Revenue Expenditure of the CentralGovernment
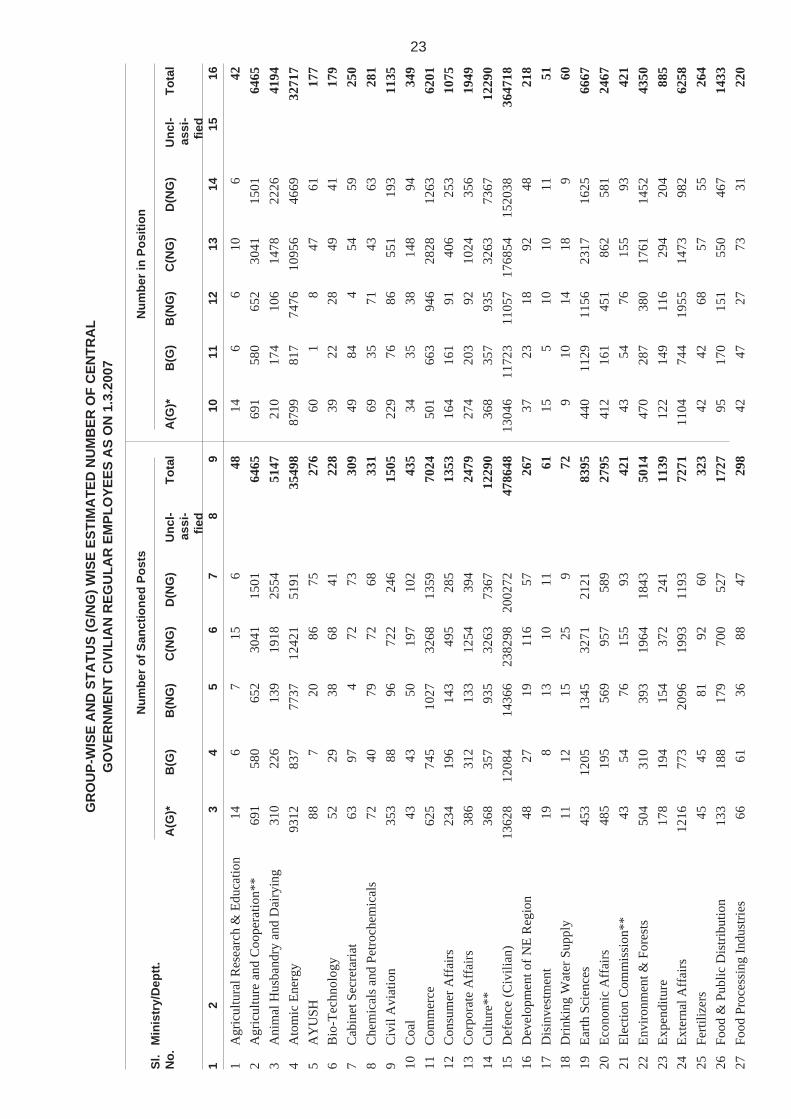
23
GR
OU
P-W
ISE
AN
D S
TATU
S (G
/NG
) WIS
E E
STI
MA
TED
NU
MB
ER
OF
CE
NTR
AL
GO
VE
RN
ME
NT
CIV
ILIA
N R
EG
ULA
R E
MP
LOY
EE
S A
S O
N 1
.3.2
007
Num
ber
of S
anct
ione
d P
osts
Num
ber
in P
ositi
onS
l.M
inis
try/
Dep
tt.
No.
A(G
)*B
(G)
B(N
G)
C(N
G)
D(N
G)
Unc
l-To
tal
A(G
)*B
(G)
B(N
G)
C(N
G)
D(N
G)
Unc
l-To
tal
assi
-as
si-
fied
fied
1
2
3
4
5
6
7 8
9
10
11
12
13
14
15 1
6
1A
gric
ultu
ral R
esea
rch
& E
duca
tion
146
715
648
146
610
642
2A
gric
ultu
re a
nd C
oope
ratio
n**
691
580
652
3041
1501
6465
691
580
652
3041
1501
6465
3A
nim
al H
usba
ndry
and
Dai
ryin
g31
022
613
919
1825
5451
4721
017
410
614
7822
2641
944
Ato
mic
Ene
rgy
9312
837
7737
1242
151
9135
498
8799
817
7476
1095
646
6932
717
5A
YU
SH88
720
8675
276
601
847
6117
76
Bio
-Tec
hnol
ogy
5229
3868
4122
839
2228
4941
179
7C
abin
et S
ecre
tari
at63
974
7273
309
4984
454
5925
08
Che
mic
als
and
Petr
oche
mic
als
7240
7972
6833
169
3571
4363
281
9C
ivil
Avi
atio
n35
388
9672
224
615
0522
976
8655
119
311
3510
Coa
l43
4350
197
102
435
3435
3814
894
349
11C
omm
erce
625
745
1027
3268
1359
7024
501
663
946
2828
1263
6201
12C
onsu
mer
Aff
airs
234
196
143
495
285
1353
164
161
9140
625
310
7513
Cor
pora
te A
ffai
rs38
631
213
312
5439
424
7927
420
392
1024
356
1949
14C
ultu
re**
368
357
935
3263
7367
1229
036
835
793
532
6373
6712
290
15D
efen
ce (
Civ
ilian
)13
628
1208
414
366
2382
9820
0272
4786
4813
046
1172
311
057
1768
5415
2038
3647
1816
Dev
elop
men
t of
NE
Reg
ion
4827
1911
657
267
3723
1892
4821
817
Dis
inve
stm
ent
198
1310
1161
155
1010
1151
18D
rink
ing
Wat
er S
uppl
y11
1215
259
729
1014
189
6019
Ear
th S
cien
ces
453
1205
1345
3271
2121
8395
440
1129
1156
2317
1625
6667
20E
cono
mic
Aff
airs
485
195
569
957
589
2795
412
161
451
862
581
2467
21E
lect
ion
Com
mis
sion
**43
5476
155
9342
143
5476
155
9342
122
Env
iron
men
t & F
ores
ts50
431
039
319
6418
4350
1447
028
738
017
6114
5243
5023
Exp
endi
ture
178
194
154
372
241
1139
122
149
116
294
204
885
24E
xter
nal A
ffai
rs12
1677
320
9619
9311
9372
7111
0474
419
5514
7398
262
5825
Fert
ilize
rs45
4581
9260
323
4242
6857
5526
426
Food
& P
ublic
Dis
trib
utio
n13
318
817
970
052
717
2795
170
151
550
467
1433
27Fo
od P
roce
ssin
g In
dust
ries
6661
3688
4729
842
4727
7331
220

Num
ber
of S
anct
ione
d P
osts
Num
ber
in P
ositi
onS
l.M
inis
try/
Dep
tt.
No.
A(G
)*B
(G)
B(N
G)
C(N
G)
D(N
G)
Unc
l-To
tal
A(G
)*B
(G)
B(N
G)
C(N
G)
D(N
G)
Unc
l-To
tal
assi
-as
si-
fied
fied
1
2
3
4
5
6
7 8
9
10
11
12
13
14
15 1
6
24
28H
ealth
& F
amily
Wel
fare
**29
4580
312
9511
323
1052
626
892
2945
803
1295
1132
310
526
2689
229
Hea
vy I
ndus
try
3736
4083
5725
334
3536
6257
224
30H
ighe
r E
duca
tion
172
195
433
526
312
1638
172
161
389
479
293
1494
31H
ome
Aff
airs
1489
827
8818
969
6838
8853
863
7744
0611
457
2302
1382
162
7655
4658
170
1816
32H
ousi
ng &
Urb
an P
over
ty A
llevi
atio
n17
845
5316
139
165
4442
711
433
Indi
an A
udit
& A
ccou
nts
695
1373
125
9038
713
6398
6212
759
811
461
3883
2941
856
1650
976
34In
dust
rial
Pol
icy
& P
rom
otio
n**
450
262
263
1098
821
2894
450
262
263
1098
821
2894
35In
form
atio
n an
d B
road
cast
ing
422
848
423
3270
1707
6670
290
593
315
2625
1451
5274
36In
form
atio
n T
echn
olog
y**
2950
886
310
629
413
5188
2950
886
310
629
413
5188
37L
abou
r &
Em
ploy
men
t12
3694
466
741
7524
5394
7583
080
149
535
5620
8977
7138
Lan
d R
esou
rces
2819
2631
1912
323
1817
2719
104
39L
aw a
nd J
ustic
e33
030
127
290
841
222
2326
123
721
378
239
118
8440
Mic
ro, S
mal
l and
Med
ium
Ent
erpr
ises
419
498
9615
1462
831
5525
039
072
1126
547
2385
41M
ines
3147
737
1255
8724
4167
1803
017
6656
285
855
2231
0011
808
42M
inor
ity A
ffai
rs44
2231
8656
239
4319
2955
4719
343
New
& R
enew
able
Ene
rgy*
*10
635
5213
861
392
106
3552
138
6139
244
Ove
rsea
s In
dian
Aff
airs
3023
3863
4119
529
2224
4238
155
45Pa
ncha
yati
Raj
2219
1923
1810
114
1415
129
6446
Parl
iam
enta
ry A
ffai
rs17
2230
5233
154
1622
3051
3315
247
Pers
onne
l, Pu
blic
Gri
evan
ces
&
Pens
ions
1184
566
560
6351
1142
9803
815
485
455
5124
1063
7942
48Pe
trol
eum
and
Nat
ural
Gas
5062
6385
7033
048
5253
7558
286
49Pl
anni
ng C
omm
issi
on34
211
620
336
232
213
4525
860
190
319
309
1136
50Po
sts*
*73
737
5932
8417
3112
3918
922
0081
737
3759
3284
1731
1239
189
2200
8151
Pow
er62
724
115
674
227
120
3754
624
013
956
725
117
4352
Pres
iden
t’s
Secr
etar
iat
2836
6197
9731
925
3661
9173
286
53Pr
ime
Min
iste
r’s
Off
ice
4917
212
150
169
552
4314
97
131
138
468
54Pu
blic
Ent
erpr
ises
249
2042
3312
819
1111
3226
99
25
*In
clud
es s
ome
non-
gaze
tted
post
s al
so.
**S
anct
ione
d st
reng
ths
are
prov
isio
nal.
Num
ber
of S
anct
ione
d P
osts
Num
ber
in P
ositi
onS
l.M
inis
try/
Dep
tt.
No.
A(G
)*B
(G)
B(N
G)
C(N
G)
D(N
G)
Unc
l-To
tal
A(G
)*B
(G)
B(N
G)
C(N
G)
D(N
G)
Unc
l-To
tal
assi
-as
si-
fied
fied
1
2
3
4
5
6
7 8
9
10
11
12
13
14
15 1
6
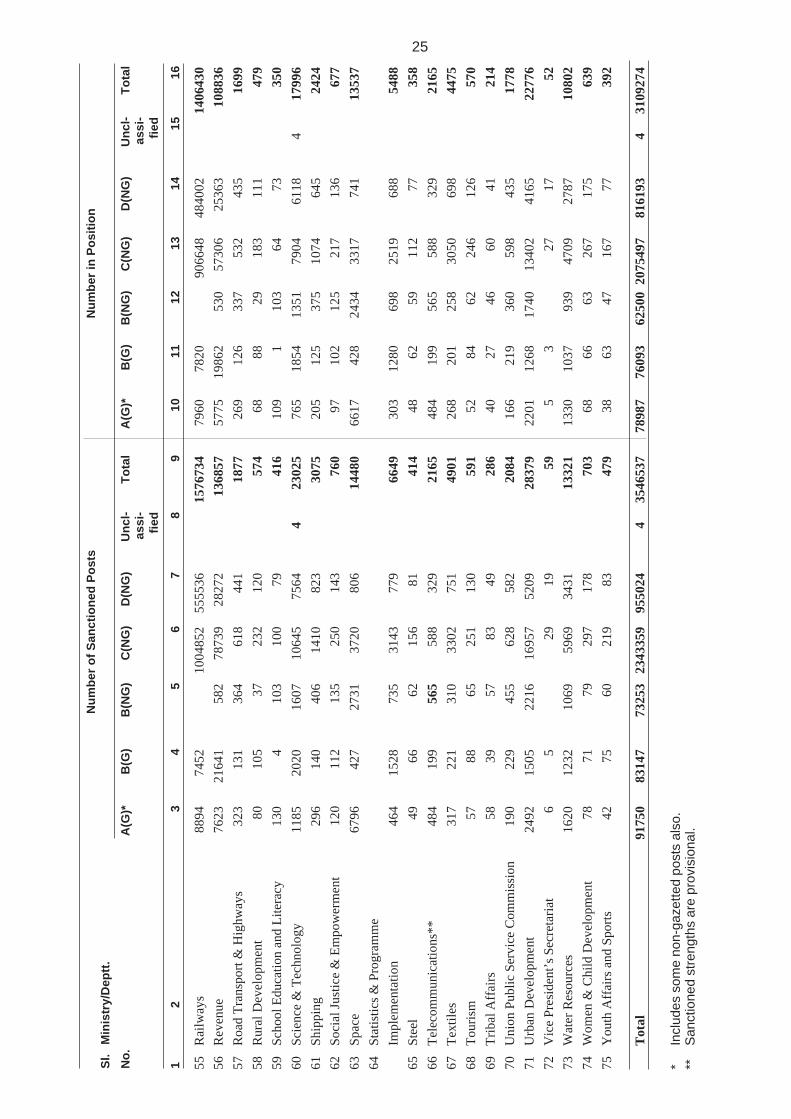
55R
ailw
ays
8894
7452
1004
852
5555
3615
7673
479
6078
2090
6648
4840
0214
0643
056
Rev
enue
7623
2164
158
278
739
2827
213
6857
5775
1986
253
057
306
2536
310
8836
57R
oad
Tra
nspo
rt &
Hig
hway
s32
313
136
461
844
118
7726
912
633
753
243
516
9958
Rur
al D
evel
opm
ent
8010
537
232
120
574
6888
2918
311
147
959
Scho
ol E
duca
tion
and
Lite
racy
130
410
310
079
416
109
110
364
7335
060
Scie
nce
& T
echn
olog
y11
8520
2016
0710
645
7564
423
025
765
1854
1351
7904
6118
417
996
61Sh
ippi
ng29
614
040
614
1082
330
7520
512
537
510
7464
524
2462
Soci
al J
ustic
e &
Em
pow
erm
ent
120
112
135
250
143
760
9710
212
521
713
667
763
Spac
e67
9642
727
3137
2080
614
480
6617
428
2434
3317
741
1353
764
Stat
istic
s &
Pro
gram
me
Impl
emen
tatio
n46
415
2873
531
4377
966
4930
312
8069
825
1968
854
8865
Stee
l49
6662
156
8141
448
6259
112
7735
866
Tel
ecom
mun
icat
ions
**48
419
956
558
832
921
6548
419
956
558
832
921
6567
Tex
tiles
317
221
310
3302
751
4901
268
201
258
3050
698
4475
68T
ouri
sm57
8865
251
130
591
5284
6224
612
657
069
Tri
bal A
ffai
rs58
3957
8349
286
4027
4660
4121
470
Uni
on P
ublic
Ser
vice
Com
mis
sion
190
229
455
628
582
2084
166
219
360
598
435
1778
71U
rban
Dev
elop
men
t24
9215
0522
1616
957
5209
2837
922
0112
6817
4013
402
4165
2277
672
Vic
e Pr
esid
ent’
s Se
cret
aria
t6
529
1959
53
2717
5273
Wat
er R
esou
rces
1620
1232
1069
5969
3431
1332
113
3010
3793
947
0927
8710
802
74W
omen
& C
hild
Dev
elop
men
t78
7179
297
178
703
6866
6326
717
563
975
You
th A
ffai
rs a
nd S
port
s42
7560
219
8347
938
6347
167
7739
2
Tot
al91
750
8314
773
253
2343
359
9550
244
3546
537
7898
776
093
6250
020
7549
781
6193
431
0927
4

26
Railways 8894 7452 0 1004852 555536 1576734 7960 7820 906648 484002 1406430(9.69) (8.96) (42.88) (58.17) (44.46) (10.08) (10.28) (43.68) (59.30) (45.23)
Home Affairs 14898 2788 18969 683888 53863 774406 11457 2302 13821 627655 46581 701816(16.24) (3.35) (25.90) (29.18) (5.64) (21.83) (14.50) (3.02) (22.11) (30.24) (5.71) (22.57)
Defence(Civilian) 13628 12084 14366 238298 200272 478648 13046 10408 12372 176854 152038 364718(14.86) (14.53) (19.61) (10.17) (20.97) (13.50) (16.52) (13.68) (19.80) (8.53) (18.63) (11.73)
Posts 737 3759 3284 173112 39189 220081 737 3759 3284 173112 39189 220081(0.80) (4.52) (4.48) (7.39) (4.10) (6.21) (0.93) (4.94) (5.25) (8.34) (‘4.80) (7.08)
Revenue 7623 21641 582 78739 28272 136857 5775 19862 530 57306 25363 108836(8.31) (26.03) (0.79) (3.36) (2.96) (3.86) (7.31) (26.10) (0.85) (2.76) (3.10) (3.50)
Others 45970 35423 36052 164470 77892 4 359811 40012 31942 32493 133922 69020 4 307393(50.10) (42.61) (49.22) (7.02) (8.16) (100.00) (10.14) (50.66) (41.98) (51.99) (6.45) (8.46) (100.00) (9.89)
Total 91750 83147 73253 2343359 955024 4 3546537 78987 76093 62500 2075497 816193 4 3109274
GROUP-WISE & STATUS-WISE ESTIMATED NUMBER OFCENTRAL GOVT. CIVILIAN REGULAR EMPLOYEES AS ON 1.3.2007
IN MAJOR MINISTRIES/DEPARTMENTS (EXCLUDING UTs)
Ministry/ Number of Sanctioned Posts Number in PositionDepartment
A* B(G) B(NG) C(NG) D(NG) Uncl- Total A* B(G) B(NG) C(NG) D(NG) Uncl- Totalassi- assi-fied fied
1 2 3 4 5 6 7 8 9 10 11 12 13 14 15
* Includes some Non-Gazetted posts also.
N.B (i) Figures in parentheses are the percentages to total.
(ii) Home Affairs figures does not include Delhi Police.
Number of Employees in Position as on March, 2007 inMajor Ministries/Departments
12%
7%
3%
10%
45%
23%
Railways Home Affairs Defence(Civilian) Posts Revenue Others

27
GROUP-WISE NUMBER OF SANCTIONED POSTS & INCUMBENTSIN POSITION, VACANCIES AND THEIR PERCENTAGES TO
TOTAL SANCTIONED POSTS AS ON 1.03.2007
Group Number of Number of Number of Percentage of vacantsanctioned incumbents vacant posts to total sanctioned
posts in position posts posts in the group
1 2 3 4 5
A* 91750 78987 12763 13.91
B (G) 83147 76093 7054 8.48
B(NG) 73253 62500 10753 14.68
C(NG) 2343359 2075497 267862 11.43
D(NG) 955024 816193 138831 14.54
Unclassified 4 4 0 0
Total 3546537 3109274 437263 12.33
* Includes some Non-Gazetted posts also.
Number of sanctioned Posts and in Position in different groups
0
500000
1000000
1500000
2000000
2500000
A* B (G) B(NG) C(NG) D(NG)
Number of Sanctioned posts Number of incumbents in position

28
DISTRIBUTION OF REGULAR CIVILIAN EMPLOYEES INCENTRAL GOVERNMENT AND UNION TERRITORY ADMINISTRATIONS
BY GROUP OF POSTS AS ON 01.03.2007
Sl. Central Govt./Union Territory Group of postsNo. Administrations A B C D Total
1 2 3 4 5 6 7
1 CENTRAL GOVERNMENT 78987 138593 2075497 816197 3109274(2.54) (4.46) (66.75) (26.25) (100.00)
2 UNION TERRITORY ADMINISTRATIONS 1389 2972 39551 14991 58903(2.36) (5.05) (67.14) (25.45) (100.00)
TOTAL 80376 141565 2115048 831188 3168177(2.54) (4.47) (66.76) (26.23) (100.00)
STRENGTHS (NUMBER OF SANCTIONED POSTS/ NUMBER IN POSITION)OF CENTRAL POLICE FORCES
Sl. Name of the Central Police Force Number of Sanctioned posts Number in PositionNo. (as on 1st March) (as on 1st March)
2005 2006 2007 2005 2006 2007
1 2 3 4 5 6 7
1 Border Security Force (BSF) 208937 208920 209361 204166 205662 203414
2 Central Reserve Police Force (CRPF) 248690 248689 260873 222971 226578 244858
3 Central Industrial Security Force (CISF) 94162 95963 96503 87703 87425 89546
4 Indo Tibetan Border Police(ITBP) 36324 36297 42726 34957 34003 34019
5 Assam Rifles 63782 67443 67443 61244 65341 65341
6 Special Service Bureau(SSB) 55588 55750 55476 28276 37912 30906
7 National Security Guard(NSG) 7357 7357 7334 6870 6816 6980
TOTAL 714840 720419 739716 646187 663737 675064
29
ALL INDIA WORKING CLASS CONSUMER PRICE INDEX NUMBER FORINDUSTRIAL WORKERS (BASE 2001= 100), 12 MONTHLY AVERAGE
AND PERCENTAGE INCREASE OVER 115.76 POINTS
Year Jan. Feb. March April May June July Aug. Sept. Oct. Nov. Dec.
2006 INDEX 119 119 119 120 121 123 124 124 125 127 127 127
12 Monthly avg. 115.76 116.25 116.67 117.17 117.67 118.25 118.92 119.58 120.25 120.92 121.58 122.25
% increase 0.00 0.42 0.79 1.22 1.65 2.15 2.73 3.30 3.88 4.46 5.03 5.61
2007 INDEX 127 128 127 128 129 130 132 133 133 134 134 134
12 Monthly avg. 122.92 123.58 124.33 125.00 125.67 126.33 126.92 127.58 128.33 129.00 129.58 130.17
% increase 6.19 6.76 7.40 7.98 8.56 9.13 9.64 10.21 10.86 11.44 11.94 12.45
2008 INDEX 134 135 137 138 139 140 143 145
12 Monthly avg. 130.75 131.33 131.92 132.75 133.58 134.42 135.25 136.17
% increase 12.95 13.45 13.96 14.68 15.39 16.12 16.84 17.63

TOTAL EMOLUMENTS (PAY+DA) AT THE MINIMUM AND MAXIMUMOF SCALES OF PAY IN RESPECT OF SOME SELECTED
POSTS UNDER THE CENTRAL GOVERNMENT
(In Rupees)
Sl. Designation Minimum Total Emoluments (Pay+DA) as onNo. and
Maximum ofPay Scales 1.1.01 1.1.02 1.1.03 1.1.04 1.1.05* 1.1.06* 1.1.07*
1 2 3 4 5 6 7 8 9 10
1 Peon Min. 2550 3647 3800 3953 4106 4475 4743 5164Max. 3200 4576 4768 4960 5152 5616 5952 6480
2 Postman/Police Constable Min. 3050 4362 4545 4728 4911 5353 5673 6176Max. 4590 6564 6839 7115 7390 8055 8537 9295
3 Lower Division Clerk Min. 3050 4362 4545 4728 4911 5353 5673 6176Max. 4590 6564 6839 7115 7390 8055 8537 9295
4 Upper Division Clerk Min. 4000 5720 5960 6200 6440 7020 7440 8100Max. 6000 8580 8940 9300 9660 10530 11160 12150
5 Jr. Res. Asstt./Stat. Asstt. Min. 5000 7150 7450 7750 8050 8775 9300 10125Max. 8000 11440 11920 12400 12880 14040 14880 16200
6 Asstt. Min. 5500 7865 8195 8525 8855 9653 10230 11138Max. 9000 12870 13410 13950 14490 15795 16740 18225
7 Asstt. Accounts Officer/ Min. 6500 9295 9685 10075 10465 11408 12090 13163Res. Asstt. Max. 10500 15015 15645 16275 16905 18428 19530 21263
8 Section Officer Min. 6500 9295 9685 10075 10465 11408 12090 13163Max. 10500 15015 15645 16275 16905 18428 19530 21263
9 Asstt. Dir./Res. Officer Min. 8000 11440 11920 12400 12880 14040 14880 16200Max. 13500 19305 20115 20925 21735 23693 25110 27338
10 US/Sr.Res.Officer Min. 10000 14300 14900 15500 16100 17550 18600 20250Max. 15200 21736 22648 23560 24472 26676 28272 30780
11 Dy. Secretary/Jt. Director Min. 12000 17160 17880 18600 19320 21060 22320 24300Max. 16500 23595 24585 25575 26565 28958 30690 33413
12 Director Min. 14300 20449 21307 22165 23023 25097 26598 28958Max. 18300 26169 27267 28365 29463 32117 34038 37058
13 Joint Secretary Min. 18400 26312 27416 28520 29624 32292 34224 37260Max. 22400 32032 33376 34720 36064 39312 41664 45360
14 Additional Secretary Min. 22400 32032 33376 34720 36064 39312 41664 45360Max. 24500 35035 36505 37975 39445 42998 45570 49613
15 Secretary Fixed 26000 37180 38740 40300 41860 45630 48360 52650
16 Cabinet Secretary Fixed 30000 42900 44700 46500 48300 52650 55800 60750
* Emoluments includes (Pay+DP+DA)
30

31
1 Andhra Secy/Addl.Secy.to Govt./Pradesh Engineer in Chief/
Director of Health Max. 30675 2312 32987 7.97 1.7.2003 YesAttender,Sweeper etc. Min. 3850 290 4140
2 Arunachal Secretary Max 33600 5712 39312 8.78 1.1.96 YesPradesh Peon Min. 3825 650 4475
3 Assam Commissioner & Spl.Secy. (PWD/Irrigation) Max. 25500 8925 34425 6.94 1.1.96 YesPeon (Class IV Services) Min. 3675 1286 4961
4 Bihar Eng. in Chief Max 33600 15792 49392 8.78 1.1.96 YesPeon Min 3825 1798 5623
5 Delhi Chief Justice,Delhi High Court Max. 45000 15750 60750 11.76 1.1.96 YesPeon Min. 3825 1339 5164
6 Goa Dean of Medical College Max. 42700 14945 57645 11.16 1.1.96 YesPeon Min. 3825 1339 5164
7 Gujarat Principal ChiefInd. Advisor Max. 39000 13650 52650 10.20 1.1.96 YesPeon, Watchman etc. Min. 3825 1339 5164
8 Haryana Dir.Gen.ofHealth Services Max. 39250 13737 52987 10.26 1.1.96 YesPeon Min. 3825 1339 5164
9 Himachal Engineer in Chief/Pradesh Director Health Services Max. 38500 13475 51975 9.80 1.1.96 Yes
Peon etc. Min. 3930 1375 5305
10 Jammu & DG State ForestKashmir Protection Force Max. 36750 8820 45570 9.61 1.1.96 Yes
Peon Min. 3825 918 4743
11 Jharkhand Director in Chief (Health)Engineer in Chief cumSpecial Secretray Max 33600 11760 45360 8.78 1.1.96 YesPeon Min. 3825 1339 5164
12 Karnataka Secretray to Govt.PWD/Irrigation Max. 39900 4888 44788 8.31 1.7.2005 YesGroup D Posts Min. 4800 588 5388
13 Kerala Director of Health Services Max. 35070 8775 43845 7.72 1.7.2004 YesPeon/Class IV Min. 4510 1173 5683
DISPARITY RATIO IN EMOLUMENTS UNDER DIFFERENT STATE GOVERNMENTS AS ON 1.1.2007 AND DATE OF EFFECT OF CURRENT PAY SCALES
S.No. State Designation $ Pay DA Total* Disparity Date of Central(Rs.) (Rs.) Emoluments Ratio effect of D.A.
(Pay+D.A.) current formula(Rs.) pay scales followed
1 2 3 4 5 6 7 8 9

32
14 Maharashtra Joint Secretary Max. 27450 9608 37058 7.18 1.1.96 YesPeon Min. 3825 1339 5164
15 Madhya Pradesh NOT AVAILABLE
16 Manipur Chief Engineer Max. 18300 13542 31842 7.18 1.1.96 YesPeon Min. 2550 1887 4437
17 Meghalaya Secretary (State Cadre) Max. 25500 9180 34680 6.97 1.1.96 YesGroup D Min. 3660 1318 4978
18 Mizoram Engineer in Chief Max. 34100 9744 43844 8.55 1.1.96 YesPeon, Group D Min. 3975 1153 5128
19 Nagaland Secretary/Eng. in Chief Max. 31350 7524 38874 8.20 1.4.2000 YesPeon Min. 3825 918 4743
20 Orissa Engr.-in-Chief cum Secy.(Works Deptt.) Max. 20450 15133 35583 8.02 1.1.96 YesPeon, sweeper etc. Min. 2550 1887 4437
21 Punjab Head of Deptt. Max. 35400 8496 43896 9.01 1.1.96 YesGrade D Employees Min. 3930 943 4873
22 Rajasthan Distt.&Session Judge(S.Scale) Max. 37275 8946 46221 9.75 1.9.96 YesClass IV Employee Min. 3825 918 4743
23 Sikkim Principal Director cumSecretary Max. 31875 9244 41119 7.46 1.1.96 YesPeon Min. 4275 1240 5515
24 Tamil Nadu Non-I.A.S.(Secretary) Max. 32850 11498 44348 8.59 1.1.96 YesOffice Assistant Min. 3825 1339 5164
25 Tripura Tripura Judicial Service Max. 37275 8946 46221 11.18 1.1.96 YesPeon etc. Min. 2600 1534 4134
26 Uttar Pradesh Higher Judicial Service Max. 37275 13046 50321 9.74 1.1.96 YesPeon Min. 3825 1339 5164
27 West Bengal Director Health Services Max. 26000 18460 44460 10.00 1.1.96 YesPeon Min. 2600 1846 4446
28 Uttaranchal DG. Health & F.W Max. 24900 15340 40240 9.93 1.1.96 YesPeon Min. 2550 1504 4054
29 Chhattisgarh Highest Grade Max. 22400 16576 38976 8.78 1.1.98 NoGrade IV Min. 2550 1887 4437
$ Excluding posts in All India Services i.e. IAS, IPS, IFS.
* Pre-Tax
S.No. State Designation $ Pay DA Total* Disparity Date of Central(Rs.) (Rs.) Emoluments Ratio effect of D.A.
(Pay+D.A.) current formula(Rs.) pay scales followed
1 2 3 4 5 6 7 8 9


![Akademika64[03].pmd - akademika64[01]](https://static.fdokumen.com/doc/165x107/6318ef2077252cbc1a0e76df/akademika6403pmd-akademika6401.jpg)


