bangladesh SOCIAL PROTECTION PUBLIC EXPENDITURE ...
144
bangladesh SOCIAL PROTECTION PUBLIC EXPENDITURE REVIEW August 2021 Public Disclosure Authorized Public Disclosure Authorized Public Disclosure Authorized Public Disclosure Authorized
-
Upload
khangminh22 -
Category
Documents
-
view
0 -
download
0
Transcript of bangladesh SOCIAL PROTECTION PUBLIC EXPENDITURE ...

bangladesh SOCIAL PROTECTION PUBLIC EXPENDITURE REVIEW
August 2021P
ublic
Dis
clos
ure
Aut
horiz
edP
ublic
Dis
clos
ure
Aut
horiz
edP
ublic
Dis
clos
ure
Aut
horiz
edP
ublic
Dis
clos
ure
Aut
horiz
ed

© 2021 International Bank for Reconstruction and Development / The World Bank
The World Bank1818 H Street, NW Washington, DC 20433USATel: 1-202-473-1000Fax: 1-207-477-6391www.worldbank.org
This work is a product of the staff of International Bank for Reconstruction and Development / The World Bank with external contributions. The findings, interpretations, and conclusions expressed in this work do not necessarily reflect the views of The World Bank, its Board of Executive Directors, or the governments they represent. The World Bank does not guarantee the accuracy, completeness, or currency of the data included in this work and does not assume responsibility for any errors, omissions, or discrepancies in the information. The boundaries, colors, denominations, and other information shown on any map in this work do not imply any judgment on the part of The World Bank concerning the legal status of any territory or the endorsement or acceptance of such boundaries.
Nothing herein shall constitute or be construed or considered to be a limitation upon or waiver of the privileges and immunities of The World Bank, all of which are specifically reserved.
Rights and PermissionsThe material in this work is subject to copyright. Because the World Bank encourages dissemination of its knowledge, this work may be reproduced, in whole or in part, for noncommercial purposes as long as full attribution to this work is given.
AttributionPlease cite the work as follows: World Bank. 2021. Bangladesh Social Protection Public Expenditure Review (PER). Dhaka and Washington, DC: World Bank Group.
Third-party contentThe World Bank does not necessarily own each component of the content contained within the work. The World Bank therefore does not warrant that the use of any third-party-owned individual component or part contained in the work will not infringe on the rights of those third parties. The risk of claims resulting from such infringement rests solely with you. If you wish to reuse a component of this work, it is your responsibility to determine whether permission is needed for that reuse and to obtain permission from the copyright owner. Examples of components can include, but not are limited to tables, figures, or images.
All queries on rights and licenses, including subsidiary rights, should be addressed to World Bank Publications, The World Bank Group, 1818 H Street NW, Washington, DC 20433, USA; fax: 1-202-522-2625; e-mail: [email protected].
Graphic design and Illustration by M. Inamul Shahriar
World Bank Office DhakaPlot- E-32, Agargaon, Sher-e-Bangla Nagar, Dhaka-1207BangladeshTel: 880-2-5566-7777Fax: 880-2-5566-7778www.worldbank.org/bangladesh


CONTENTSCONTENTS
C H A P T E R 1viiix
Xiv
108
30
140
108
31
36
38
39
117
125
136
138
ACKNOWLEDGEMENTS
ACRONYMS
EXECUTIVE SUMMARY
ANNEX
Annex 1: Details of major social assistance programs
Annex 2: Comprehensive list of programs, by life-cycle
Annex 3: Comprehensive list of programs, by function.
Annex 4: List of all agencies engaged in social protection
Annex 5: The Fund Flow Analysis Undertaken for this study
BIBLIOGRAPHY
SOCIAL PROTECTION IN BANGLADESH: CONTEXT, POLICY AND OVERALL SPENDING
1.1 Despite significant progress on macro and social outcomes, vulnerabilities persist
1.2 Demographic change, urbanization and frequent shocks will shape the future of social protection
1.3 Bangladesh’s policy framework reflects the long tradition of social protection
1.4 Bangladesh allocates significant resources to social protection, in line with its peers

C H A P T E R 2
42
43
48
52
56
ALLOCATIVE EFFICIENCY: POLICY ALIGNMENT OF EXPENDITURES IN SOCIAL PROTECTION
2.1 The importance of aligning the categorization of programs with policy
2.2 There is significant scope for greater alignment between demography and expenditures
2.3 Some of the functions identified in the NSSS are not currently fully met
Recommendations emerging from Chapter 2
C H A P T E R 3
58
60
62
70
76
PERFORMANCE OF PROGRAMS IN REACHING CORRECT BENEFICIARIES WITH ADEQUATE BENEFITS
3.1 Program coverage for social assistance has increased significantly
3.2 Improved geographic and socio-economic targeting could boost impacts
3.3 Greater adequacy of programs – in terms of benefits, incentives for behavior changes, and combination of interventions – would improve their impacts
Recommendations emerging from Chapter 3
C H A P T E R 5
94
95
99
100
107
EFFICIENCY IN THE DELIVERY OF BENEFITS AND SERVICES TO BENEFICIARIES
5.1 Local administrative and political implementers of social protection
5.2 Processes of identification and enrolment of beneficiaries
5.3 Provision of transfers and services
Recommendations emerging from Chapter 5
C H A P T E R 4
EFFICIENCY IN THE PROGRAMMING AND FINANCING OF SOCIAL PROTECTION
4.1 Multiple agencies implement numerous interventions, affecting coordination and efficiency
4.2 A fragmented budgeting process should strengthen its links to policy
4.3 Budget utilization and monitoring
Recommendations emerging from Chapter 4
78
79
85
89
92

LIST OF FIGURESFigure 0-1: Distribution of social protection expenditure (FY2013-14 to FY2017-18) across life-cycle xvii
Figure 1-1: Trends in Poverty 33
Figure 1-2: Rural vs. Urban Poverty 33
Figure 1-3 : Trends in fertility and mortality rates 36
Figure 1-4: Trends in Age structure 36
Figure 1-5: Growth in urban population as % of total population 37
Figure 1-6: Frequency of shocks 37
Figure 1-7: Evolution of social protection in Bangladesh 38
Figure 1-8: Social Protection allocation as percentage of GDP in Bangladesh 39
Figure 1-9: Expenditure on Social Expenditure as % of GDP 39
Figure 2-1: Distribution of social protection expenditure (FY2013-14 to FY2017-18) across life-cycle 48
Figure 2-2: Growing social protection expenditures on the older citizens 49
Figure 2-3: Expenditures by broad categories of social protection 53
Figure 2-4: Share of expenditure by category 53
Figure 2-5: Social protection expenditure by category 54
Figure 2-6: Composition of expenditures on social assistance 55
Figure 2-7: Expenditure on Labor Market Programs 56
Figure 3-1: Essential contributors to impact 59
Figure 3-2: Number of beneficiaries of key programs over time. 60
Figure 3-3:Coverage of key programs in rural and urban areas, 2019 62
Figure 3-4: Social Protection expenditures on rural vs. urban safety nets 63
Figure 3-5: Expenditure in urban areas, by nature of social protection programs 63
Figure 3-6: Social protection coverage in urban (left-hand panel) and rural (right-hand panel) areas 64
Figure 3-7:Coverage of main social assistance programs and poverty, by region 65
Figure 3-8: Share of benefits from 7 major programs accruing by consumption deciles, rural vs. urban 65
Figure 3-9a: Share of programs received by each wealth decile, rural areas 66
Figure 3-9b: Share of programs received by each wealth decile, urban areas 66
Figure 3-10: Share of beneficiaries who meet different eligibility criteria of OAA (left) and EGPP (right) 67
Figure 3-11: Types of programs using social registries to identify their beneficiaries 68
Figure 3-12: NHD can harmonize beneficiary identification for social protection programs 69
Figure 3-13: Increasing trend in benefit amounts in real terms 70
Figure 3-14: Poverty estimates among beneficiaries, pre and post transfers (rural areas) 72
Figure 3-15: Impact of reallocating all transfers from top 80% to beneficiaries in bottom 20% 72
Figure 3-16: Share of total social protection expenditure, by nature of benefit 73
Figure 4-1: Growth of Social Protection in Bangladesh 80
Figure 4-2: National Budgeting Process in Bangladesh 86
Figure 4-3: Development project approval process affecting development budget preparation 87

Figure 4-4: Social Protection Budget Utilization 90
Figure 4-5: Budgets and expenditures (in billion BDT) of Pension for Retired Government Employees 91
Figure 4-6: Budget utilization by eleven agencies with largest social protection budgets 91
Figure 5-1: Administrative hierarchy of Bangladesh and budget allocation (excluding social protection payments) 96
Figure 5-2: Budget allocations (excluding social protection payments) across administrative levels 96
Figure 5-3: Use of time by USWs (DSS) 97
Figure 5-4: Allocation of budgets on social protection benefits and management in FY2018-19 98
Figure 5-5: Process mapping for OAA payments under conventional banking system 101
Figure 5-6: OAA Quarterly payment processing time (FY2018-19) 102
Figure 5-7: Tracking of OAA expenditures (Quarter 2, FY2018-19, select unions) 103
Figure 5-8: Beneficiary and community awareness about DDM’S major social protection programs 106
LIST OF TABLESTable 1-1: Fiscal Indicators (% of GDP) 31
Table 2-1: Proposed categorization of Social Protection in Bangladesh by Lifecycle 45
Table 2-2: Proposed categorization of Social Protection in Bangladesh by Nature of Intervention 47
Table 2-3: Budget (FY2019-20) of programs providing cash or food to the elderly 49
Table 2-4: Expenditure on Education Intervention for selected years 51
Table 2-5: Social protection for households affected by shocks (BDT billion) 51
Table 2-6: Largest 10 programs (FY2019-20 budget) 54
Table 2-7: Largest labor market programs (with more than BDT 2 billion) 55
Table 3-1: Large programs by broad categories 61
Table 3-2: Coverage of key programs, 2016 62
Table 3-3: NHD variables used to estimate the PMT 69
Table 3-4: Transfer size for selected programs 71
Table 3-5: Mean transfer (proxied by unit cost from budget), as share of average income (rural areas) 72
Table 3-6: Rules around combining programs, as per operational manuals 75
Table 4-1: Development expenditures in Social Protection in Bangladesh 80
Table 4-2: Actual expenditures by largest thirty social protection programs (FY2013-14 to FY2017-18) 81
Table 4-3: Social protection programs/projects with contributions from development partners 83
Table 4-4: Ministries responsible for social protection in key policy documents 84
Table 4-5: Agencies with largest social protection expenditures (FY2013-14 to FY2017-18) 84
Table 4-6: Social protection programs in the purview of the Coordination Committee on Safety Nets 89
Table 5-1: Program Eligibility Criteria 99
Table 5-2: Loss to the treasury due to time lag in cash transfer of select programs 102
Table 5-3: G2P Progress (BDT million) 104
Table 5-4: PFDS channels (actual distribution in thousand metric tons) 105

ACKNOWLEDGEMENTS
viii

This Social Protection Public Expenditure Review (PER) has been prepared by a team led by Aline Coudouel (Lead Economist, HSASP) and Rubaba Anwar (Social Protection Specialist, HSASP). Mostafa Amir Sabbih (Social Protection Specialist, HSASP), Binayak Sen (Consultant, HSASP), ARM Nazmus Sakib (Consultant, HSASP), Ali Hashim (Consultant, HSASP), Bushra Ferdous Khan (Consultant, HSASP), Faizuddin Ahmed (Consultant, ESAPV), Munjir Ahmed (Consultant, HSASP) and Shahadat Hossain Chowdhury (Program Assistant, SACBD) have been core team members. The report has also drawn inputs from a Fundflow Analysis on three social protection programs, conducted by Ernst & Young LLP, India.
This PER has greatly benefited from thoughtful comments and inputs from the following World Bank staff and consultants: Aneeka Rahman (Senior Social Protection Economist, HSASP), Syud Amer Ahmed (Senior Economist, HSASP), Suleiman Namara (Senior Operations Officer, SACBD), Kenichi Nishikawa Chavez (Senior Social Protection Economist, HSASP), Ashiq Aziz (Senior Social Protection Specialist, HSASP), Moritz Piatti (Senior Economist, HAFH1) and Zahid Hussain (Consultant, ESAMU). Data collection on the Maternal Health Voucher Scheme was facilitated by Patrick Mullen (Lead Health Specialist, HSAHP).
This PER would not have been possible without the leadership and inputs kindly provided by Abdur Rouf Talukdar, (Secretary) and Md. Azizul Alam (Additional Secretary, Finance Division (FD), Ministry of Finance (MoF)). In addition, the report benefited from discussions and information shared by officials across an array of ministries and departments: Habibur Rahman (Additional Secretary); Nazma Mobarek (Joint Secretary), Sirajun Noor Chowdhury (Joint Secretary); Muhammad Abul Kasem (Deputy Secretary) from FD, MoF; Zuena Aziz (Sustainable Development Goals (SDG) Coordinator, Prime Minister’s Officer (former Senior Secretary, Ministry of Social Welfare (MoSW)); Md. Nasir Uddin (former Additional Secretary, MoSW); Farid Ahmed Mollah (Deputy Director, Department of Social Services, MoSW); Faizul Islam (Joint Chief); Rahnuma Nahid (Deputy Chief, General Economics Division, Planning Commission); Md. Ashfaqul Amin Mukut (Deputy Secretary, Cabinet Division); Satyendra Kumar Sarkar (Additional Secretary) (Project Director, Safety Net Systems for the Poorest Project), Suman Kar, Consultant, Department of Disaster Management, Ministry of Disaster Management and Relief (MoDMR). Other officials from MoDMR as well as from the Ministries of Women and Children Affairs, Education, Primary and Mass Education, Food as well as the Line Directorate, Health Services, also participated in discussions.
The PER has also benefited significantly from information and feedback shared by Hasina Begum and Md. Azizur Rahman (Social Policy Specialists, UNICEF Bangladesh), Meriem El Harouchi (Programme Manager, European Union), Manfred Fernholz (Team Leader Food & Nutrition Security & Sustainable Development, European Union), Andrew Kettlewell, (Consultant, European Union), Aminul Arifeen (National Program Manager, UNDP), Bazlul Haque Khondker (Director, Policy Research Institute) and Hossain Zillur Rahman (Executive Director, Power and Participation Research Center).
This work has been prepared under the direction and guidance of Stefano Paternostro (Practice Manager, HSASP), Lynne D. Sherburne-Benz (Regional Director, HSASP), Mercy Miyang Tembon (Country Director for Bangladesh and Bhutan) and Dandan Chen (Manager, Operations, SACBD).
ixBANGLADESH SOCIAL PROTECTION PUBLIC EXPENDITURE REVIEW

ADB Asian Development BankADP Annual Development ProgrammeA2i Access-to-informationAoB Allocation of BusinessASPIRE The Atlas of Social Protection Indicators of Resilience and EquityATM Automated Teller MachineAULM Urban Low-income Lactating Mothers AllowancesBACS Budget and Accounting Classification SystemBBS Bangladesh Bureau of StatisticsBC Budget CircularBDHS Bangladesh Demographic Health SurveyBDT Bangladesh TakaBMC Budget Management CommitteeBMRC Budget Management Reform CommitteeBMW Budget Management WingBPO Bangladesh Post OfficeBWG Budget Working GroupCAO Chief Accounts OfficerCBHC Community Based Health CareCC Cabinet CommitteeCGA Comptroller General of AccountsCIDA Canadian International Development AgencyCLP Char Livelihoods ProgramCOVID-19 Corona Virus Disease 2019CTM Cash Transfer Modernization ProjectDA Allowances for the Financially Insolvent DisabledDANIDA Danish International Development AgencyDD Deputy DirectorDDM Department of Disaster ManagementDfID UK - Department for International DevelopmentDPP Development Project Pro-formaDRRO District Relief and Rehabilitation OfficerDSS Department of Social ServicesDSSd Disabled Students StipendDSSO District Social Services OfficerDSF-MHVS Demand Side Financing - Maternal Health Voucher SchemeDWA Department of Women’s AffairsECNEC Executive Committee of the National Economic CouncilEU European UnionEGPP Employment Generation Program for the PoorestERD Economic Relations DivisionFACHT Food Assistance in Chittagong Hill Tracts
ACRONYMS
x

FAPAD Foreign-aided Project Audit DirectorateFD Finance DivisionFID Financial Institutions DivisionFFE Food for EducationFFP Food Friendly ProgrammeFFW Food for WorkFY Fiscal YearFYP Five Year Plan GDP Gross Domestic ProductGED General Economics DivisionGoB Government of BangladeshG2P Government-to-PersonGR Gratuitous ReliefGRM Grievance Redress MechanismsHIFF Honorarium for Insolvent Freedom FightersHIES Household Income & Expenditure SurveyiBAS Integrated Budget and Accounting SystemIFPRI International Food Policy Research InstituteILO International Labor OrganizationIMLMA Improved Maternity and Lactating Mothers’
AllowanceIMF International Monetary FundIMR Infant Mortality RateISAS Turkey’s Integrated Social Assistance SystemISPP Income Support Program for the PoorestLGD Local Government DivisionMAPP Maternity Allowance ProgrammeMBF Ministry Budget FrameworkMCRAH Maternal, Child, Reproductive and Adolescent HealthMFSP Modern Food Storage Facilities ProjectMFS Mobile Financial ServicesMICS Multiple Indicator Cluster Survey MIS Management Information systemMNCAH Maternal, Neonatal, Child and Adolescent HealthMoCHTA Ministry of Chittagong Hill Tracts AffairsMoDMR Ministry of Disaster Management & ReliefMoE Ministry of EducationMoEF Ministry of Environment, Forest and Climate changeMoF Ministry of FinanceMoFd Ministry of FoodMoHFW Ministry of Health and Family WelfareMoLJPA Ministry of Law, Justice and Parliamentary AffairsMoLWA Ministry of Liberation War AffairsMoPME Ministry of Primary and Mass EducationMoSW Ministry of Social WelfareMTBF Medium-term Budgetary FrameworkMTMF Medium-term Macroeconomic FrameworkMoWCA Ministry of Women and Children AffairsMoYS Ministry of Youth and SportsMSME Micro, small, and medium enterprisesNGO Non-Government OrganizationNHD National Household DatabaseNID National Identification DocumentNSER National Socio-Economic Register (Pakistan)NSS National Savings Scheme
NSSS National Social Security StrategyOAA Ola Age AllowanceOCAG Office of the Comptroller & Auditor GeneralOMS Open Market SalesPC Planning CommissionPEM Public Expenditure ManagementPESP Primary Education Stipend ProgramPFM Public Financial ManagementPFDS Public Food Distribution SystemPKSF Palli Karma Shahayak FoundationPMO Prime Minister’s OfficePMT Proxy-means TestPPP Purchasing Power ParityPSP Payment Service ProviderPWD Persons with DisabilitiesRADP Revised Annual Development ProgrammeRDCD Rural Development and Co-operative DivisionRMG Ready-made-garmentsROSC Reaching Out of School ChildrenRSS Rural Social ServicesSDF Social Development FoundationSEDP Secondary Education Development ProgrammeSEIP Skills for Employment Investment ProgramSEQAEP Secondary Education Quality and Access
Enhancement ProjectSESIP Secondary Education Sector Investment ProgramSESP Secondary Education Stipend ProgramSFYP Seventh Five Year PlanSISBEN System of Identification for Social Subsidies
Beneficiaries (Colombia)SPBMU Social Protection Budget Management UnitSSPS Social Security Policy Support ProgrammeUSW Union Social WorkerSWAPNO Strengthening Women’s Ability for Productive New
OpportunitiesTPP Technical Assistance Project Pro-formaTR Test ReliefTVET Technical and Vocational Education and TrainingUAO Upazila Accounts OfficerUDB Unified Data Base (Indonesia)UDC Union Digital CenterUNFPA United Nations Population FundUNICEF United Nations Children’s Emergency FundUNO Upazila Executive OfficerUrSW Urban Social WorkerUS$ United States DollarsUSSO Upazila Social Services OfficerVGF Vulnerable Group FeedingVGD Vulnerable Group DevelopmentVWB Vulnerable Women’s BenefitWA Allowances for Widow Deserted and Destitute
WomenWASH Water, Sanitation and HygieneWFM Work for MoneyWFP World Food Program
xiBANGLADESH SOCIAL PROTECTION PUBLIC EXPENDITURE REVIEW

xii

EXECUTIVE SUMMARY
xiiiBANGLADESH SOCIAL PROTECTION PUBLIC EXPENDITURE REVIEW

1.1. DESPITE SIGNIFICANT PROGRESS ON MACRO AND SOCIAL OUTCOMES, VULNERABILITIES PERSIST
1. Bangladesh’s economy is growing at a healthy pace and macro conditions are strong. Bangladesh has maintained 6.5 percent plus Gross Domestic Product (GDP) growth in recent fiscal years (FYs), though the COVID-19 pandemic affected the trend. The overall size of the government expenditure is small relative to the economy. At 12.7-15.4 percent of GDP (between FY2009-10 to FY2018-19), and despite consistent increases, Bangladesh’s share of public expenditures remains among the lowest in the world and is consistent with a very low revenue-to-GDP ratio.
2. Progress in social outcomes in Bangladesh is inspiring other countries, but deep challenges persist as the pace of poverty reduction slows down. Bangladesh is also experiencing rising inequality, and important geographic and socio-economic disparities persist. While poverty remains higher in rural areas, poverty reduction has been slower in urban areas. Similarly, despite important improvements, child nutrition and mortality remain a challenge, with 31 percent of stunting among children under 5 in 2018. Education outcomes also exhibit progress and persistent challenges around low learning outcomes and significant drop out in secondary education among girls.
3. Bangladesh labor market is dominated by low-productivity and informality. An estimated 85.1 percent of workers were informal in 2016, and labor productivity growth remains far below growth experienced by countries such as India and Vietnam. Labor force participation has increased, but remains too low for Bangladesh to reap the full benefit of its demographic transition. Currently, 40 percent of the working-age population remains out of the labor force, largely driven by very low female labor force participation (about 37 percent in 2016, compared with almost 90 percent for men. Youth are also disproportionately vulnerable in the labor market, with low participation and earnings.
1.2 DEMOGRAPHIC CHANGE, URBANIZATION AND FREQUENT SHOCKS WILL SHAPE THE FUTURE OF SOCIAL PROTECTION
4. Demographic change opens a window but also challenges. The shift in the age structure of the population, characterized by an increase in the working age population and a decline in the dependency ratio, creates a window of opportunity for economic growth known as the “demographic dividend”. The window of opportunity is however limited in time, and reaping its benefits depends
Chapter 1
SOCIAL PROTECTION IN BANGLADESH: CONTEXT, POLICY AND OVERALL SPENDING
EXECUTIVE SUMMARY
xiv

on whether the working age population is actually working and productive, itself a function of skills development among the young and productivity enhancements among the working age.
5. Urbanization also has important consequences for social protection spending and design. Bangladesh is urbanizing faster than the southern Asia and all Asia regional averages. Poverty could be exacerbated by unplanned urbanization, with almost 1 in 5 of the urban population living in poverty, and 1 in 2 households at the risk of falling into poverty. The multi-dimensional urban poverty and vulnerability calls for greater support and adaptation of the existing programs to the urban context and/or developing new interventions.
6. Bangladesh is ranked as the most vulnerable country in the world to climate related shocks. Climate shocks have a disproportionate impact on the poor, because they generally live in higher-risk areas and have limited coping mechanisms. They revert to depletive coping strategies – selling assets, migrating, pulling children from school, foregoing health care, early marriage, etc. – which put in peril their human and productive capital, thereby having long terms impacts. As disasters become more frequent and intense, the social protection system needs to develop its ability to adjust dynamically and respond in a timely manner to prevent irreversible losses for those affected.
1.3 BANGLADESH’S POLICY FRAMEWORK REFLECTS THE LONG TRADITION OF SOCIAL PROTECTION
7. Social protection in Bangladesh has been evolving since the 1970s, through innovation and experimentation. At its inception in the 1970s in a war-torn and natural disaster-stricken country, social protection initially focused on addressing food shortages following the war and cyclones and flood. During the 1980s, concern for incorporating “ladders” or the concept of graduation emerged resulting in programs that supported life skills, microcredit and income generating activities. Since the 1990s, conditional transfers for behavioral change began through food for education (FFE) programs, and subsequently, a life cycle-oriented social protection approach began to take shape. Bangladesh has kept innovating, and key successful innovations have been scaled up with significant impacts. The evolution is reflected in the current policy framework. Five Year Plans (FYP) have continuously emphasized social protection, leading up to the adoption of the country’s first National Social Security Strategy (NSSS) in 2015.
1.4 BANGLADESH ALLOCATES SIGNIFICANT RESOURCES TO SOCIAL PROTECTION, IN LINE WITH ITS PEERS
8. Bangladesh spent about BDT 1,500 billion (US$ 18.7 billion) on social protection during FY2013-14 to FY2017-18, and its expenditure are aligned to those of others in the region. Consistent increases in allocations to social protection over the past decade are credited with part of the successes in poverty reduction. Comparing expenditures on social assistance (excluding social insurance and labor market programs) in the Asia and Pacific region, Bangladesh spends more than Bhutan, Pakistan, Sri Lanka, Cambodia, Malaysia, Indonesia, the Philippines, and China and others in terms of share of GDP, but less than India, Nepal, Maldives and Vietnam.
9. The core issue in Bangladesh, more than the overall resources devoted to social protection, seems to be around how well these resources are deployed. This public expenditure review proposes to review four aspects of quality of spending, which together point to elements that could be reformed to increase the overall impact of the resources devoted to this sector. The first key question is whether these important resources are allocated in a manner that focuses on the issues they are meant to address (discussed in Chapter 2). The second set of questions relate to whether the program themselves are designed to be impactful, that whether they are reaching the intended beneficiaries in a manner that’s adequate or commensurate with their needs (discussed in Chapter 3). A third set of issues relate to whether the processes used to prioritize, budget and finance these programs are efficient (discussed in chapter 4). Finally, the last elements essential to the overall effectiveness of the social protection expenditure is the efficiency in the delivery of the programs to their beneficiaries, from the central to the local level (discussed in chapter 5).
xvBANGLADESH SOCIAL PROTECTION PUBLIC EXPENDITURE REVIEW

Chapter 2
ALLOCATIVE EFFICIENCY: POLICY ALIGNMENT OF EXPENDITURES IN SOCIAL PROTECTION
2.1 THE IMPORTANCE OF ALIGNING THE CATEGORIZATION OF PROGRAMS WITH POLICY
10. Policy making requires categorizations, which are commensurate with strategic directions. Social protection is a term, which can be used to describe a broad range of programs. The NSSS has a rather broad scope, covering what many define as safety nets or social assistance, as well as insurance against some risks (old-age for instance), programs addressing shocks, and interventions focused on employment or productivity. While there is no right or wrong categorization, we propose two typologies which would help policy makers implement the policies laid out in the NSSS. These typologies can also help clarify the boundaries of what policy makers consider when planning social protection interventions (potentially including programs not currently considered or excluding others). Considering the importance they play in the NSSS, we propose two typologies: a first in terms of program’s beneficiaries (to follow the life-cycle approach) and a second in terms of the program’s function (to reflect the distinctions between assistance, pension, employment, social services, shock-response functions, among others).
11. Categorization of programs by beneficiaries – life-cycle approach. As per the NSSS, different life-cycle groups face different risks – for instance, while health shocks exist across the life-cycle, there are particular risks associated with pregnancy and early childhood (for instance birth, malnutrition, or cognitive development) which can affect children’s long term development. Of course, while some programs are directed at particular individuals, they will likely benefit other individuals as well, within their households and beyond – sharing benefits within the household, alleviating care responsibilities, increasing household earnings, reducing the need for private transfers from others. We propose a classification into eight categories (demographic, socio-economic, and institution), depending on program beneficiaries:
[1] Pregnant or lactating women and very young children[2] School-age children, such as stipends, food programs and social services[3] Working age, with programs focused on productivity and earnings [4] The elderly[5] Individuals who live with some disabilities, cutting across age-groups[6] Households who are in situation of chronic poverty [7] Households in situation of transient poverty as a result of a shock [8] Overall system, through technical assistance to a central agency or to a sectoral ministry
12. Classification of programs by functions – Insurance, assistance, labor, services, community development, subsidies, technical assistance. There are multiple ways to distinguish between different functions. Many countries, scholars, and institutions distinguish only between insurance, assistance, and labor market support. The boundaries between these categories can sometimes be fuzzy, and some programs might contain multiple elements. We propose 7 categories, to reflect the policy discussions and the place different types of intervention have:
[1] Social insurance: Old-age pension, linked to beneficiaries’ employment and earnings.[2] Social assistance: Programs which support the poor and vulnerable, by transferring cash (allowances, public works,
one-off), food, stipends, or a mix of benefits (emergency support). [3] Labor market interventions: Program focused on promoting earnings and productivity, promoting technical/
vocational skills development, economic inclusion or “graduation”, or entrepreneurship. [4] Social care services: These include a broad range of services – from care for vulnerable children, the elderly or the
disabled to various support services for vulnerable groups.
EXECUTIVE SUMMARY
xvi

[5] Community development: Community level programs for infrastructure development and restoration. [6] General subsidies: including targeted food and energy subsidies. [7] Technical assistance: Focus on delivery systems (policy, planning, budgeting, digitization, targeting, enrolment,
payments, etc.).
2.2 THERE IS SIGNIFICANT SCOPE FOR GREATER ALIGNMENT BETWEEN DEMOGRAPHY AND EXPENDITURES
13. Contrasting the distribution of the population with that of social protection expenditure reveals over-spending on programs for the elderly. While children under 5 represent 9 percent of the population (and as much as 13 percent among the poor), they only receive 2 percent of age-specific spending. On the other hand, the elderly represent 8 percent of the total population and receive 72 percent of the expenditure. Within the old age category, nearly 90 percent of social protection for old-age goes to about 14 percent of old-age beneficiaries (retired Government employees and Freedom Fighters). Overall, 36 percent of total social protection spending serves 0.45 percent of the country’s population through pensions. As Bangladesh is slowly aging, the long-term sustainability of social protection hinges on the fiscal sustainability of programs for the elderly.
14. While they account for almost one in every eight poor persons in Bangladesh, only 1.6 percent of social protection expenditures are directed at young children. For the very young, this is particularly worrisome, especially as pregnancy and the first few years of life are so critical to cognitive development and later productivity. The importance of investments in this age group has been underlined in the NSSS, and is the object of concerted efforts to develop and adopt uniform principles of design for a comprehensive Child Benefit Program, which would be applied to existing mother and child benefit programs. For children of school age, programming has reached higher coverage and effectively promoted significant changes. Challenges remain around the transition to secondary school, especially for girls, as well as around the quality of learning. To foster progress for students from poor or vulnerable households, it will be essential to target the more costly secondary-level interventions.
Total population
9%
28%
56%
8%
Poor households
13%
35%
45%
7%
Expenditure by age-group (inc pensions)
2%
13%
13%
72%
Expenditure by age-group (Exc. pensions)
3%
28%
28%
41%
Figure 0-1: Distribution of social protection expenditure (FY2013-14 to FY2017-18) across life-cycleSources: United Nations, 2019, for share in population; authors’ estimates for share in poor (based on HIES 2016); and authors’ analysis for expenditure, based on program/project expenditure data from Integrated Budget and Accounting System (iBAS), Comptroller General of Accounts (CGA). Note: Shares of expenditures by age-group excludes allocations to households and persons with disabilities.
xviiBANGLADESH SOCIAL PROTECTION PUBLIC EXPENDITURE REVIEW

15. Weak support for working age and youth could limit Bangladesh’ demographic dividend. The working age represent 56 percent of the total population, but only 13 percent of age-specific programs. Though increasing, this remains limited, despite increased emphasis on the “ladder approach”. For Bangladesh to take advantage of the demographic dividend, it is essential for working age adults to be productively engaged and invest in their human, financial and physical capital.
16. Programs focused on households affected by shocks occupy a central part in Bangladesh’s system, but investments remain limited. Actual expenditure on such social protection programs have increased, but they represent only 3 percent of total. Also, most programs have a rural focus, and are not prepared for shocks which impact urban households, such as the COVID-19 pandemic.
2.3 SOME OF THE FUNCTIONS IDENTIFIED IN THE NSSS ARE NOT CURRENTLY FULLY MET
17. Social insurance occupies the lion’s share and has been increasing significantly in absolute terms. As discussed in chapter 4, the increase and fluctuation are partly linked to recent reforms. When considering the number of beneficiaries, though, around 715,000 in FY2018-19, social insurance is the function that is most costly per beneficiary.
18. Social assistance is largely in place, with a relative increase in cash transfers. The total resources devoted to social assistance increased by 18.5 percent every year between FY2013-14 and FY2017-18, reaching amounts at par with those dedicated to social insurance. Its share in total spending, however, has decreased over time. Looking at the different types of social assistance programs – cash, food, stipends and mix – shows an evolution towards cash transfer programs, including public works (more than 60 percent by FY2018-19). Stipends have also expanded. Conversely, the share of food-based programs decreased to 20 percent by FY2018-19, consistent with the NSSS. Looking at actuals versus budgeted, actual expenditure on social assistance are systematically lower than initial budgets – by 21 to 22 percent – more than the average discrepancy for the sector.
19. Despite recent increases, labor market interventions that provide “ladders” remain very limited to date. While they have increased in absolute terms over the years (doubling from BDT 23 billion (US$ 292 million) in 2013-14 to BDT 46 billion (US$ 559 million) in FY2017-18), these programs only represent between 8 and 13 percent of total social protection expenditure. Programs tend to be rather small – only 7 programs have budgets over BDT 2 billion (about US$ 24 million) in FY2019-20. Few programs focus on vocational or technical skills development, mostly in urban areas. Economic inclusion programs are more numerous and dominate this category (65-80 percent of the total) but are mostly very small and short-lived. Both economic inclusion and entrepreneurship/startup programs tend to be more focused on rural areas.
RECOMMENDATIONS EMERGING FROM CHAPTER 2
• Revise the list and strengthen the categorization of social protection programs to better inform policies, resource allocation, reporting and monitoring. It would be instrumental to revise and adopt the list and systematically classify all programs and projects (building on the list produced by Finance Division (FD)) along policy-relevant typologies. These could be organized by lifecycle risks and functions of programs. In order to inform policies and budgeting, it is essential to use the selected typologies in the Budget and Accounting Classification System (BACS) and iBAS++ and other management information systems.
• Better align demography and expenditures. Allocate in line with the number of poor in different categories, or the role of the program in breaking the intergenerational transfer of poverty: (i) investment on pregnant mothers and early childhood in order to make good use of the window of opportunity of early years, to address the stunting and to build the work force of the future by improving nutrition and cognitive
EXECUTIVE SUMMARY
xviii

Chapter 3
PERFORMANCE OF PROGRAMS IN REACHING CORRECT BENEFICIARIES WITH ADEQUATE BENEFITS
20. Chapter 3 focuses on the performance of existing programs around three elements essential to improved impacts of social protection, namely the extent to which they: (1) have the “right” coverage; (2) reach the “right” beneficiaries; and (3) provide them with the “right” benefits.
3.1 PROGRAM COVERAGE FOR SOCIAL ASSISTANCE HAS INCREASED SIGNIFICANTLY
21. Coverage expansion has been a priority over the past decades, and social assistance programs reach about 3 in 10 households in Bangladesh, mostly through a few large programs. In light of fiscal constraints, regular increases in social protection budget have almost always prioritized increase in coverage (over increases in benefit size or amounts). The share of households benefiting from social assistance programs more than doubled from 12 percent in 2005 to 25 percent in 2010, before going at a slower pace to reach nearly 28 percent of households by 2016. A few large programs, including allowances or cash-based programs (allowances for old-age and widows and TR) as well as food-based programs (Vulnerable Group Feeding (VGF), Gratuitous Relief (GR) and school feeding program (SFP)), and stipends drive the patterns. In fact, if these were perfectly targeted to the poor, some would cover all the poor (e.g. Vulnerable Group Development (VGD) or Primary Education Stipend Program (PESP)) and a few would reach 2/3 of the poor (VGF and GR). Beyond these few programs, coverage is typically very small and variable. While some of the smallest programs are in a “piloting” phase, which is essential to test new approaches and methodologies, many are simply operated on a very small scale, contributing to fragmentation.
development; (ii) enhance behavioral interventions to prevent secondary school drop-out for girls; (iii) increase programming for working age adults to promote graduation from poverty; and (iv) within old-age, put greater emphasis on social pensions for the poor/vulnerable and develop a sustainable financing strategy.
• Set up mechanisms and financing for shock-responsive programs. Ensuring regular programs are flexible or responsive to shocks or scaling-up shock-specific programs in times of crisis is essential. A balanced financing strategy can help ensure timeliness in responding to shocks, like COVID-19 pandemic, in an efficient and cost-effective manner. Financing for disaster-response on the basis of weather forecasts and simulations can increase predictability in post-disaster spending, reduce the cost of financing by combining different instruments (mixing budget, insurance, contingency financing, lines of credit, etc.), and minimize inefficiencies due to underutilization of allocations.
• Increase the scale and scope of labor market interventions, including economic inclusion (or “ladder”) programs. Deploy a streamlined model that can be scaled-up to capitalize on the demographic dividend, both in rural and urban areas, with a focus on youth and women.
xixBANGLADESH SOCIAL PROTECTION PUBLIC EXPENDITURE REVIEW

3.2 IMPROVED GEOGRAPHIC AND SOCIO-ECONOMIC TARGETING COULD BOOST IMPACTS
22. The social protection system remains focused on rural areas. Almost half of the total expenditure are focused on rural areas, and most of the rest has nation-wide coverage. This leaves the country ill-equipped to face increased urbanization. In particular, labor market programs are only beginning to emerge in urban areas. While a rural focus partly reflects higher poverty in rural areas, urbanization calls for increased focus on urban programming and adaptations to the urban context. Coverage reflects past focus on rural areas, with 35.7 percent of rural households benefitting from at least one social assistance program, versus 10.9 percent of urban households (coverage is higher than poverty rates in rural areas, the opposite is true in urban contexts). A greater focus on urban areas also calls for different or adjusted programs to account for the features of urban poverty, significantly different from those of rural poverty.
23. An equitable system would also orient more resources towards poorer areas, to ensure equal coverage of the poorest. Ideally, coverage should follow poverty rates, with areas with higher poverty benefiting from a stronger coverage. In practice, in 2016 some regions were “undercovered” while other experienced “overcoverage”. Allocating funds partly as a function of poverty prevalence would help improve the efficiency and equity of programs (Employment Generation Program for the Poorest - EGPP already does this), and the existing detailed poverty maps can inform allocation to regions, districts, or even upazilas.
24. On average, social assistance programs are progressive – they benefit the poor more than the rich – but there is scope for improvement. On average, 13 percent of core social assistance benefits accrue to the bottom decile in rural areas, and a cumulative 36 percent to the bottom 30 percent. At the other end of the distribution, the 10 percent richest only receive 6.4 percent of benefits. Some programs outperform others in their ability to reach the poor and vulnerable. Food support and allowances appear to be the best performer, followed by maternity allowances. Pensions are regressive, reaching households in higher deciles of wealth on average. Both inclusion and exclusion errors need to be addressed to improve social protection’s impact on poverty. Estimations using Multiple Indicator Cluster Survey (MICS) data for 2019 suggest inclusion errors of 51 (49) percent for allowances, 54 (45) percent for food support programs, and 62 (65) percent for maternity allowances in rural (urban) areas.
25. Improving on targeting could yield important impacts, including revising inclusion criteria. In rural areas, assuming no increase in the budget allocated to programs, allocating all benefits which currently go to non-poor households to poor ones would close about 24 percent of the gap for allowances, but would more than close the gap for food support and maternity allowances. Similar shift of benefits from non-poor to poor households in urban areas would also close the gaps for the aforesaid three programs but less than that of rural areas, reflecting the stronger actual targeting accuracy observed in urban areas. For some programs, improving eligibility criteria would help better target those most in need of support.
26. The National Household Database (NHD), Bangladesh’s social registry, provides a unique opportunity to improve performance and impact. While each program defines its own criteria and thresholds, they tend to use relatively similar indicators. Around the world, social registries have been used by many types of programs in the process of identification of their beneficiaries – from cash transfers to legal service, health insurance benefits, education and training, housing, emergency assistance, social services, and employment services. Typically, social registries support one of the steps followed to identify beneficiaries, and can be combined with other elements, such as community-based elements, as well as caseworker assessments, statistical profiling, medical assessments, or disability assessments. The NHD compiles information for all households in the country (approximately 35 million), and is planned to be used by Ministry of Disaster Management and Relief (MoDMR) as part of the process of beneficiary identification for EGPP in FY2021-22. Other large social protection agencies, such as the Department of Social Services (DSS) and Local Government Division (LGD) are also expected to use the NHD as one of the inputs for their cash transfer programs.
EXECUTIVE SUMMARY
xx

3.3 GREATER ADEQUACY OF PROGRAMS – IN TERMS OF BENEFITS, INCENTIVES FOR BEHAVIOR CHANGES, AND COMBINATION OF INTERVENTIONS – WOULD IMPROVE THEIR IMPACTS
27. Relatively small benefits limit the impacts of many programs. With a focus on increasing coverage, the benefits provided by many programs have stagnated or remain very low – most benefits represent 1 to 3 percent of total household income for the poor or extreme poor (with the exception of Test Relief (TR), Old Age Allowance (OAA) and Widow Allowance (WA), which represent 9, 7 and 7 percent of the poor’s average income respectively). Low benefits limit the impact of many programs on poverty: in 2016, among beneficiaries of any of seven core programs, programs are responsible for a decrease in the extreme poverty headcount from 22.2 percent to 19.8 percent (from 36.1 percent to 34.1 percent for the poverty headcount). However, reallocate all transfers that went to beneficiaries in the top 80 percent to current beneficiaries in the bottom 20 percent (first quintile), amounts received by bottom quintile beneficiaries would be multiplied by 4 and extreme poverty among current beneficiaries would decrease from 22 percent to 4 percent.
28. Turning to the nature of the benefit, many programs still provide benefits in kind (mostly food). The share of expenditures going to food transfers declined; but absolute amounts are more constant. This slow conversion has important consequences for beneficiaries, who overwhelmingly prefer to receive their wages in cash rather than food, because of the fungibility of cash, as well as the poor resale value of food (and uncertainty on quality). In addition, food-based programs can be more expensive, because of costs associated with storage, transportation, and delivery; which reduces their cost-effectiveness (administrative costs of food transfer programs typically are almost 2.5 times higher than those of cash transfer programs).
29. Harnessing social protection programs’ outreach to promote behavioral changes would boost impacts. Most programs only provide cash, missing an opportunity to provide their beneficiaries with interventions that further awareness and knowledge or encourage improved practices. Increasingly, policymakers around the world are applying insights from behavioral science to enrich their programs with activities that promote lasting behavioral changes in order to better address challenges such as healthy eating, educational attainment, financial inclusion, or climate-smart investments. Bangladesh has pioneered comprehensive programs to promote economic inclusion; and behavior change components have demonstrated their impact on early childhood. Many programs have interactions with households, either through group activities (information session, public work sites, counseling, training, etc.), and these provide an opportunity to communicate directly with the target population (as already done by the Maternity Allowance or Income Support Program for the Poorest-JAWTNO).
30. Overall, putting in place a “system’s approach” allows households to combine interventions for maximum impact over their life cycle. Currently, many programs in Bangladesh explicitly (or in practice) rule out those who already benefit from other programs. As a result only 1 and 3 percent of EGPP and Demand Side Financing- Maternal Health Voucher Scheme (DSF-MHVS) beneficiaries also received support from an NGO. Estimates from MICS show that 84 percent of all beneficiary households in rural areas only receive one benefit (88 percent in urban areas). While limiting combination might be reasonable for some programs (which have similar design/function), it might be counterproductive in other cases. For instance, programs that address specific event (e.g. a disaster/seasonal shocks) typically have a limited duration, and are complementary to longer-term support. Systematically excluding those who benefit from any other program can have negative impacts on their ability to cope with a shock, such as the one resulting from COVID-19. More generally, global evidence shows how some interventions are complementary, and together can boost impacts.
31. A systems approach calls for exit strategies for some programs – something most lack to date. Most programs only experience change in their rosters of beneficiaries when these die or age out. For programs, such as the OAA or disability programs, there might not be a need to exit beneficiaries. Others should include an exit strategy to reflect changes in their beneficiaries’ conditions. Regular recertification processes can build upon the (regularly updated) NHD. Ultimately, once programs cover the different life-cycle risks and functions adequately, individuals and households would “navigate” the social protection system – enrolling (and leaving) in different programs over their lifetime, depending on their vulnerabilities and evolving situations. They would leave programs when conditions improved, confident that they can re-join should the situation worsens.
xxiBANGLADESH SOCIAL PROTECTION PUBLIC EXPENDITURE REVIEW

RECOMMENDATIONS EMERGING FROM CHAPTER 3
• To increase impact on poverty, reform key programs by focusing on the size of benefits or on expansion, depending on the program. For some programs, it is critical to revisit the amounts transferred to ensure they can have a meaningful impact on poverty (slowing the expansion of their coverage) and take into account the evolution of prices. For others, expanding coverage is the priority, especially for labor market programs where large gaps are observed. Finally, for programs to yield lasting behavioral changes, they can use insights from behavioral science to enrich their interventions with accompanying measures and better address core development challenges – around economic inclusion as well as child development, for instance.
• Rebalance geographic allocations between rural and urban areas, with programs tailored to urban poverty. Bangladesh Bureau of Statistics’ (BBS) poverty maps can be used to allocate resources by region, districts, or even upazilas. This is already the case for EGPP, and for the OAA/WA expansion to the 112 poorest upazilas, as part of the Government’s COVID-19 response. Other large programs should consider using this tool. Since poverty patterns, vulnerabilities, and constraints are likely different, there is also a need to adapt existing programs (or tailor urban modalities), then scale up interventions to support growing poor urban population.
• Revise eligibility criteria to boost programs impacts and ensure greater focus on the poor. Many programs would benefit from revising their eligibility criteria, in particular economic eligibility criteria, to reflect changes in poverty patterns and overall increases in incomes and living costs. This could be done using some income or poverty proxy calculated on the basis of multiple variables in the NHD, or by adding indicators that reflect different facets of poverty, to reflect the heterogeneity of the poor and vulnerable (e.g. while land ownership or remittances are relevant in rural contexts, other assets such as a computer/connection might be useful in urban contexts). It is also critical to define criteria that can help identify households who are not poor in normal times, but are vulnerable to shocks, such as the COVID-19 crisis (e.g. self-employed or informal wage worker; or those with income just above the national poverty line). This would allow for their quick identification and support in times of shocks. More generally, each program should anchor its choice of criteria in the analysis of the objective and groups it aims to support.
• Use a social registry, such as the National Household Database (NHD), to improve targeting at a reduced cost. By merging the data collection process for multiple programs, a registry can reduce costs, both for programs and for households. Meanwhile, each program can draw from the registry’s information using its own criteria, as part of their beneficiary selection process. Also, as information on beneficiaries is digitalized, low-cost procedures can be put in place to cross-check registries with other administrative databases (e.g. verification of age and proof of life with the civil registration databases). For NHD to contribute to gains in efficiency and impact, it has to be used regularly by key programs, which requires an ‘easy to use’ operational data sharing protocol as well as the regular updating of the information in the database.
• Move towards a system’s approach, where households can combine programs according to their needs. This can help maximize impacts, as it tailors support to specific situation. It can build on the NHD as a coordination mechanism (to avoid duplication, and seek synergies). The NHD, if regularly updated and audited, can also help regularly reassess beneficiaries’ needs and conditions (this is commonly known as recertification). A system’s approach also calls for some programs to have clear exit strategies to maximize the reach and performance of such programs, with households “navigating” between programs throughout their life cycle.
EXECUTIVE SUMMARY
xxii

4.1 MULTIPLE AGENCIES IMPLEMENT NUMEROUS INTERVENTIONS, AFFECTING COORDINATION AND EFFICIENCY
32. Social protection in Bangladesh is characterized by a large number of programs, though expenditures are concentrated among few large interventions. A large portfolio demonstrates the Government’s commitment in social protection and small projects provide opportunities to pilot innovative approaches. However, the plethora of interventions also represents significant challenges in coordination and efficiency. Slow progress toward consolidations, despite the NSSS, partly reflects a combination of desire by ministries to retain large programs, as well as a lack of practical operational guidance. However, the largest thirty-one programs account for more than 90 percent of actual expenditure, and the top 10 account for 70 percent of the total. Because of their relative size, focusing reforms to improve efficiency and effectiveness on these large programs is most effective, as currently the case for digitalization and payment modernization efforts.
33. Multiple agencies implement social protection, resulting in coordination challenges. The General Economics Division (GED) monitors, documents and evaluates the activities and progress on the NSSS. Based on GED’s findings, Cabinet Division (CD) tries to coordinate programs and agencies. On the other hand, FD allocates resources, prepares the annual list of social protection programs, and implements the Government-to-Person (G2P) payment scheme. Greater integration between the NSSS and the process of resource allocation could contribute towards improved implementation of the NSSS. The Government also needs to play a stronger role in coordinating programs implemented by NGOs. The NHD would also be an essential tool for coordination (in addition to its role in promoting enhanced targeting, as discussed in chapter 3).
4.2 A FRAGMENTED BUDGETING PROCESS SHOULD STRENGTHEN ITS LINKS TO POLICY
34. The budget process has numerous steps, starting from the top, with the updating of the Medium-Term Macroeconomic Framework (MTMF) and the estimation of the overall resource envelop; followed by the inter-sectoral allocation of resources (indicative budget ceilings for line ministries). Within social protection agencies, budget preparation draws from inputs from departments, but ceilings largely determine allocations (bottom-up budgeting would result in unrealistically large demands). This is followed by tri-partite meetings organized between FD, Planning Commission (PC) and line ministries and the meeting of the Cabinet Committee on Safety Nets.
35. Despite the move towards integrated budgeting, a dual system still prevails, with separate processes for operating and development budgets. Though very carefully led by the FD, the dual budgeting approach entails different preparation processes and timelines and separate responsible agencies. A few elements complicate the process: The Annual Development Programme (ADP) is developed on an annual basis, and projects can be added outside the budget cycle, while the Medium-term Budgetary Framework (MTBF) has three-year cycles. The multiplicity of processes also puts heavy demands on the line ministries. Multiple requirements can sometimes result in inconsistencies and weaken the link between budgets and policies.
36. The budgeting process weakens strategic alignment. The first time a line ministry is able to present and justify its demands for resources is at the tri-partite meeting with the FD and PC. While some adjustments in ceilings may emerge in favor of the line ministries from the tri-partite meetings, for major safety nets, the final, binding resource allocation decisions materialize from the Cabinet Committee on the Overall Supervision of Social Protection formed in 2014. The Committee is mandated to review the annual performance and make decisions on the budget allocation
Chapter 4
EFFICIENCY IN THE PROGRAMMING AND FINANCING OF SOCIAL PROTECTION
xxiiiBANGLADESH SOCIAL PROTECTION PUBLIC EXPENDITURE REVIEW

of 15 programs (including only 7 of the largest, and overall covering 40 percent of the total revised budget in FY2018-19 excluding Government pensions). Other large, important programs are not included in the Committee’s purview. Because of its potential central role in aligning spending with policy priorities, the committee could both broaden its coverage and deepen its consideration of data on impacts, coverage and adequacy to make evidence-based budget allocation. The Committee can also consider meeting earlier in the financial year, to make more effective contributions to the budgeting process of social protection.
4.3 BUDGET UTILIZATION AND MONITORING
37. Budget utilization rate for social protection (excluding Government pensions) has been improving in recent years, but remains below 80 percent of the revised budget. There is some heterogeneity, with larger programs having on average higher utilization rates (almost 100 percent every year), due to their regularity. However, there is scope for improvements in financial reporting, reconciliation at the local level, and local level capacity. Other programs have more variable budget utilization, particularly those focused on disaster response and food transfers, and require a dedicated financing strategy. Budget for disaster-response should be done on the basis of weather forecasts and simulations, to increase predictability in post-disaster spending, and minimize inefficiencies due to underutilization of allocations.
38. Other systemic factors negatively affect utilization rates, particularly for projects funded by the development budget. The development budget has historically been overprogrammed: As projects are approved throughout the year irrespective of resources available, allocations to older projects may be reduced and reallocated to newly approved projects that take time to get started. Delays often result from challenges in the formulation of project costs as part of the Technical-assistance Project Pro-forma (TPP)/ Development Project Pro-forma (DPP), and rigidity comes from the complexity of the process of subsequently adjusting TPP/DPPs. Finally, low utilization rates can also reflect difficulties in managing large projects/programs in iBAS.
39. Use of iBAS at local level for budgeting and reporting remains limited, which explains part of the utilization rates. While central units use iBAS++ for budgeting and reporting, local-level officials of the various departments are yet to start to use the system. For major programs, iBAS only records the first step or steps in a longer chain of transfers. These practices may help explain high budget utilization rates. The lack of reconciliation also means that agencies are not able to monitor and adjust their programs.
40. Finally, the audit of social protection programs is limited, which curtails opportunities for improvements. The scope of audits focuses mostly on entity level transactions and do not delve into program expenditures and processes. Projects receiving international development assistance are audited by the Foreign-aided Project Audit Directorate (FAPAD), but their limited scale constrains the application of the Directorate’s good practices. Deeper audits would help enhance fiduciary management, as well as efficiency of processes, resulting in greater impacts.
RECOMMENDATIONS EMERGING FROM CHAPTER 4
• While improving the design of large programs for maximum impact, progressively consolidate or terminate small projects to reduce fragmentation. In addition to improving large programs that can have systemic and sustainable impacts (see recommendations in chapter 3), the government could consolidate some programs, potentially around their functions or target population. For instance, consolidation efforts could merge programs for vulnerable women, or programs focused on early childhood support, or public works programs. In terms of development projects, the government should only finance those that test new approaches (e.g. labor market projects). Such pilots are essential to foster adoption of successful innovations, and need to be rigorously evaluated before deciding on potential scale-up. All other small development projects, which don’t contribute to the innovation agenda, should be progressively terminated. To operationalize this recommendation, rules and guidance will be needed on: (1) how to amalgamate various processes; (2) how to redistribute responsibilities for consolidated programs; and (3) how to consolidate programs financed from development and operating budgets.
EXECUTIVE SUMMARY
xxiv

• Strengthen social protection coordination mechanisms and the link between policy and resources allocation. The Cabinet Committee on Social Protection should play a more important role in linking allocations to policy priorities – both by broadening its coverage and by deepening its consideration of data on impacts, coverage and adequacy to make evidence-based budget allocation. To broaden its coverage, the Committee should review all core programs, financed from both operating and development budgets, analyze programs’ alignment with core policies and objectives using core policy-relevant typologies, and anchor its analysis in evidence on impacts and cost-effectiveness. The Committee can also consider meeting earlier in the financial year, to make more effective contributions to the budgeting process of social protection. The Government could also revisit the number of agencies engaged in social protection, based on key policy documents such as the Allocation of Business (AoB), FYP and NSSS.
• Simplify and harmonize the budget process. This could involve bringing the development and operating budget processes more in line, rationalization of the reporting requirements by central level ministries (e.g. FD, CD, PC), and reducing the number of back and forth on budget preparation. Simplifying and flexibilizing the TPP/DPP preparation and revision processes would boost implementation of development budget-funded projects.
• Strengthen financial reporting and auditing to improve implementation and program management. At the local level, capacity needs to be developed to use central reporting systems (including iBAS) and effectively report actual expenses (using bank reconciliation statements). This would also allow for more informed program management at the local level. Financial audit of social protection programs can help increase transparency of expenditures and processes and contribute to efficiency. Office of the Comptroller & Auditor General (OCAG)’s Directorate of Social Safety Net Audit covers seven ministries (including MoSW, MoCWA, MoDMR, MoFd, MoLE, MoLWA, and MoYS). The Directorate is carrying out the first financial audit of the MoSW’s cash transfer programs, and this practice should be emulated for other agencies’ programs. In addition, performance audit by the Directorate can bring a holistic view of program performance.
Chapter 5
EFFICIENCY IN THE DELIVERY OF BENEFITS AND SERVICES TO BENEFICIARIES
5.1 Local administrative and political implementers of social protection
41. Local administrative actors play important roles in service delivery despite constraints in resources and capacity. Departments implementing social protection programs have in most cases offices down to the upazila level – the second last tier of administrative hierarchy in rural Bangladesh. This centralized approach is reflected in the allocation of resources. Only the Ministry of Social Welfare (MoSW) dedicates significant resources to lower levels of government, as it deploys staff at the union level. Union Social Workers (USWs) facilitate beneficiary interactions for all DSS programs and often have additional responsibilities from other departments, but their workload is very large (an average of 2 unions and 1,943 to 18,000 beneficiaries).
42. Administrative tasks dominate the SWs’ day, leaving little time for substantive interactions with beneficiaries. These are essential for sustained behavioral changes. Small simplifications of processes could free significant time for SWs to focus on their core technical activities (small changes in payment receipts format can save up to 39 percent of the time on this task). SWs currently receive very limited training, which could hamper the modernization of key processes, which requires digital skills. Also, there are currently no dynamic system to manage human resources; which would allow for timely decisions regarding workforce planning, training, support and budgeting; as well as mobilization during emergencies, such as the COVID-19 pandemic.
xxvBANGLADESH SOCIAL PROTECTION PUBLIC EXPENDITURE REVIEW

43. More generally, most social protection agencies do not invest enough in core processes of budgeting, management, enrolment, delivery and accountability. They allocated very limited resources to program management (MoSW spent 9 percent on management, while MoDMR spent less than 2.5 percent, and MoLWA only 1 percent). With such resources, it is likely that program staff can only provide basic supervision of enrolment and payment processes, with little space for meaningful engagement with beneficiaries.
44. Elected political bodies operate down to the ward level, complementing the limited administrative structure, but resources are limited. The Union Council leads the selection of beneficiaries at the union level (while there are subsequent layers of approval, the Union Council’s decision typically hardly changes). They often also supplement capacity-constrained administrative staff: they contribute to monitoring of public works and to the dissemination of information about program eligibility and enrolment. As was the case within ministries, resources allocated to the local governments are not commensurate with the scale of responsibilities they are assigned. Resources remain fairly centralized in Bangladesh, with only 7 percent of total government spending at the local level.
45. The combination of administrative and political bodies results in complex accountability structures. As the gateway for social protection in rural areas, Union Councils can play an important coordination function across programs and help harmonize delivery processes (For instance consolidating selection processes for different programs). For the functions they play in program implementation, government officials and staff working at the local level have key reporting lines to relevant departments at the central level. However, while working locally, there is also an element of reporting to local authorities, such as the Union Council. This dual reporting can create ambiguity or even contradiction, affecting service delivery.
5.2 PROCESSES OF IDENTIFICATION AND ENROLMENT OF BENEFICIARIES
46. Beneficiary identification follows largely similar across the main programs, but most lack objective metrics and data which gives discretionary powers to individuals/committees. Most core programs use varying criteria related to demographic composition, consumption, earnings, work, and asset ownership. However, many of these are not easily verifiable objectively or loosely defined. The combination of discretionary powers and lack of clear metrics can result in patronage and nepotism. Indeed, a small percentage of beneficiaries report having had to pay to be considered or enrolled in some programs. Reported payments were higher for the OAA, which provides benefits over a long period (till death) and with no conditionalities, while no enrolment commissions were reported for the DSF-MHVS which provides smaller and time-bound benefits.
47. Performance-based allocations to Union Councils, greater social accountability and improved grievance mechanisms could reduce discretional powers. Allocations to the local government could take into account some elements of performance, to incentivize Union Councils in applying more transparent and objective processes. For instance, grants could be allocated on the basis of independent verifications of the extent to which identified beneficiaries are indeed poor (this could consist, among others, in verifying that beneficiaries are below a certain threshold for certain indicators within the NHD). Together with such incentive mechanisms, greater social scrutiny by the community could also contribute to reduced scope of enrolment commissions. At the same time, promoting and activating the various existing grievance mechanisms in the country can enhance citizen engagement and improve transparency.
5.3 PROVISION OF TRANSFERS AND SERVICES
48. On average, it takes at least two months to transfer funds from the treasury to beneficiaries, in part because of multiplicity of steps, and delays can impact implementation. Breaking down the payment process highlights specific steps which cause delays. For OAA, the most time-consuming step is the transfer from the child account at the upazila level to the beneficiaries, partly because payment lists are still maintained manually. Similarly, for EGPP, a combination of complex processes and limited local-level capacity led to delays in transfers from upazila-level accounts to beneficiary accounts. For Food For Work (FFW) and TR, central allocations were released relatively fast, but delays of up to 100 days were noted between receipt of funds, project approval, implementation, and payments.
EXECUTIVE SUMMARY
xxvi

49. Delays can represent substantial costs for both the Government and beneficiaries. Funds which remain idle, between treasury transfers and receipt by beneficiaries have substantial costs for the Government: lost interest could represent up to 2 percent of the total program budget. In addition, delays, uncertain timing, and long intervals between payments can have deep impacts on beneficiaries, affecting their consumption, investments, and capacity to manage their debts. For instance, while MoDMR’s programs operate in phases expected to coincide with the agricultural lean season, delayed payments can miss the hardest period of the year for the poorest. Similarly, while payments are meant to be quarterly, more than a third of OAA beneficiaries report receiving payments semi-annually or annually.
50. In addition to delays, there seem to be a lack of clarity at the upazila level. An expenditure tracking showed instances of discrepancy between amounts allotted and amounts transferred, resulting in benefits per beneficiary either above or below the official amount. In contrast, payments which went through the G2P platform were consistent with the official amount. Discrepancies and delays in enrolment of beneficiaries (for which funds have been released by treasury) also complicated accounting and reconciliation of upazila-level accounts (because of delay in enrolment of beneficiaries for which benefits have been released by treasury)
51. The G2P scheme can cut processing time to 10 days, but needs to be scaled-up. G2P eliminates administrative layers while facilitating authenticated and secure payments. To date, the management information systems of at least 13 programs in seven-line ministries have been linked to the Social Protection Budget Management Unit (SPBMU) system to roll out G2P payments. Together, these programs represent 68 percent of all cash transfers in FY2019-20. However, the pace of implementation varies, and overall, only about 8 percent of their budget had actually transitioned by the end of FY2018-19. The pace of scaling-up G2P nationally depends on digitization of existing data as well as the readiness of systems and human resources.
52. Expanding the network of payment service providers will help reduce costs for beneficiaries to access their transfers. Transport to upazila-level branches might be too costly for some beneficiaries, and some have reported costs associated with opening bank accounts, both these costs can reduce significantly the benefits from a program, especially in early stages of participation. In the worst cases, taken together, these can amount up to 2-5 percent of benefits over time. From 2016, the MoSW began piloting digitized payments through the Bangladesh Post Office and agent banking, and in 2020 through mobile financial services (MFS). A pilot for OAA and WA revealed that agent banking was the preferred source of payment, because of proximity and shorter queue/waiting time.
53. Constraints in the delivery of food-based transfers affect their cost-effectiveness. The need to manage food stocks puts pressure on social protection programs to continue using food, resulting in losses for beneficiaries. Despite progress, the conversion of food programs to cash has been slow, partly because they represent over 80 percent of rice distribution by the Public Food Distribution System (PFDS). Despite improved stock monitoring and planning, losses in transit, storage and packaging are still substantial, and deterioration of grains calls for frequent rotation of stocks. However, because social protection programs purchase food from the PFDS using an economic price (reflecting the average procurement price and administrative and handling costs, typically higher than the prevailing market price), programs de facto receive lower allocations than officially set.
54. In addition to a progressive switch, developing modern storage facilities, revising minimum food security stocks, and ensuring pricing is market-based can reduce pressure on social protection programs. The Government is developing modern storage facilities, which would reduce the pressure on social protection programs to absorb aging stocks. In the early 2000s, national stock levels were also reduced following downsizing of the FFW and discontinuation of the Food for Education (FoE) scheme. Further rationalization could be considered to enhance the efficiency of social protection programs by increasing the share of cash transfers. If food-based programs continue to prevail, to act as channels to regularly roll-over stocks, processes might need to be revised to better reflect prevailing prices, limit inefficiencies, and improve monitoring and book-keeping.
55. Greater citizen engagement is needed to boost accountability and quality of service delivery. While program guidelines emphasize the importance of communication, there is still room for improvement. Overall, knowledge about major programs is low: Knowledge of benefits amounts is generally higher than that of eligibility criteria, which oscillates between 40 and 60 percent. Multiple efforts to promote engagement, transparency and accountability could improve the quality of public services, in addition to ongoing efforts to develop central grievance mechanisms.
xxviiBANGLADESH SOCIAL PROTECTION PUBLIC EXPENDITURE REVIEW

RECOMMENDATIONS EMERGING FROM CHAPTER 5
• Allocate resources for program management across different administrative levels, more in line with the level of effort required at each level. This would help with program implementation at the local level, commensurate with their magnitude of responsibilities. Increased allocations for staffing, capacity building training including digital literacy, motivation and equipment can facilitate enhanced implementation of programs and contribute to improved impact. For political bodies, social protection performance-based incentives can be considered to help improve local level efficiency and transparency.
• Harmonize or mainstream similar processes at local level. This can be led by the Union Council and local administration to enhance efficiency and minimize redundancy in processes. This can eliminate the repetition of the same process for every different program, and potentially free up political bodies’ and administrators’ times for improved community engagement, implementation and supervision of programs respectively. The NHD can help alleviate local agents, by providing up-to-date information on households, which can be used to identify potential beneficiaries for key programs, using their respective criteria.
• Transition to G2P to reduce redundancies, improve efficiency and realize savings, by reducing the time value of funds lying outside the treasury. The government has committed to reach 100 percent of G2P transfers by 2023.The pace of transition to G2P can be enhanced through investments in field-level training, in alternative mechanisms to expedite digitization of beneficiary data, and in management information systems (MISs) which are compatible and integrated This transition also requires sustainable cash-out mechanisms, and building a network of financial service providers, particularly at the union level, can facilitate convenient cash-out by beneficiaries.
• Develop modern storage facilities and revise the minimum food security stocks and the market pricing of transfers. This can help reduce pressure on social protection programs. This can also help expedite the conversion of food transfers to cash, and contribute to efficiency and impact.
• Promote greater citizen engagement to increase efficiency and transparency through improved access to information and robust grievance management systems. Communities that are informed will feel empowered to access the services they need and contribute towards improving service quality by strengthening accountability.
xxviii

29BANGLADESH SOCIAL PROTECTION PUBLIC EXPENDITURE REVIEW

SOCIAL PROTECTION IN BANGLADESH: CONTEXT, POLICY AND OVERALL SPENDING
Chapter 1
30

1.1 DESPITE SIGNIFICANT PROGRESS ON MACRO AND SOCIAL OUTCOMES, VULNERABILITIES PERSIST
1. Bangladesh’s economy is growing at a healthy pace and macro conditions are strong. Bangladesh has maintained 6.5 percent plus GDP growth in recent years. Exports and remittances have been buoyant, agriculture had bumper harvests, and the economy showed remarkable resilience in the face of successive shocks in 2007/2009. The ready-made garment, leather, light engineering manufacturing and similar other labor-intensive sectors promise robust growth in the coming years. Remittance earnings, while affected by global slowdowns, recovered relatively quickly. A key challenge is to increase the private investment rate, which is hampered by policy uncertainties, regulatory complexities, infrastructure deficiencies and weak governance conditions. Apart from FY2018-19, budget deficit remained below the 5 percent of GDP target in most of the fiscal years and fiscal discipline has been maintained despite pressures on public resources from unanticipated shocks such as the influx of Displaced Rohingya population. The country has maintained a sustainable fiscal deficit, contained spending, stabilized the debt burden, and undertaken reforms to improve its public
SOCIAL PROTECTION IN BANGLADESH: CONTEXT, POLICY AND OVERALL SPENDING
Gene
ral
gove
rnm
ent
reve
nue
Gene
ral
gove
rnm
ent
expe
nditu
re
Ove
rall
budg
et d
efic
it
Prim
ary
defic
it
Gene
ral
gove
rnm
ent
debt
FY2009-10 9.5 12.7 3.2 0.8 35.2FY2010-11 10.2 14.0 3.9 1.9 35.0FY2011-12 10.9 14.4 3.6 1.1 35.1FY2012-13 10.7 14.5 3.8 1.4 34.8FY2013-14 10.4 13.8 3.3 1.0 35.0FY2014-15 9.6 13.8 4.1 1.9 33.2FY2015-16 10.0 13.9 3.9 1.5 31.3FY2016-17 10.2 13.6 3.4 1.8 31.0FY2017-18 9.6 14.3 4.7 2.8 31.9FY2018-19 10.0 15.4 5.5 3.5 33.2South Asia 2019 19.5 24.9 5.5 -2.8 63.2
Source: Ministry of Finance, IMF and World Bank.
Table 1-1: Fiscal Indicators (% of GDP)
31BANGLADESH SOCIAL PROTECTION PUBLIC EXPENDITURE REVIEW
financial management. Low revenue collection continues to be a major challenge, and the burden arising from state-owned enterprises constitute a significant fiscal risk. Strengthening domestic revenue mobilization through better tax policy and administration and reduced barriers to investment, together with improving expenditure management to enhance service delivery should be at the core of the medium-term budget strategy.
2. The overall size of the government budget is small relative to the economy. At 12.7-15.4 percent of GDP (between FY2009-10 to FY2018-19), and despite consistent increases, Bangladesh’s share of public expenditures remains among the lowest in the world and is consistent with a very low revenue-to-GDP ratio (Table 1-1). Bangladesh’s public sector, however, extends far beyond the central government, comprising a large state-owned enterprise sector and a dominant public financial sector. State-owned enterprises operating in traditional utilities, infrastructure and the manufacturing sector account for more than 20 percent of public sector employment and exerts a drain on public resources. Because of low revenue generation capacity, fiscal adjustments are driven mainly by adjustments in public development spending. Structural rigidities continue to hamper the implementation of the development budget (investment program). Recurrent expenditures as a share of GDP have increased significantly, while capital spending has declined. These vulnerabilities – low revenue mobilization, increased subsidies, interest payments, low development expenditures and rising contingent liabilities – are threatening Bangladesh’s prospects for maintaining positive macro and fiscal outcomes that have underpinned Bangladesh’s growth resilience.
3. Bangladesh’s development vision gives high priority to social services. The Seventh Five-Year Plan (SFYP) puts strong emphasis on fostering an economic environment where everyone can benefit from the growth process through employment generation, infrastructure development, health and education services. Historically, spending in social sectors has been sustained, financing for rural development and infrastructure has increased and support for targeted poverty reduction programs, including social safety nets for the poor, has continued. Recently, the emphasis of public spending is shifting from agriculture and industries to the development of human resources and the rural economy. Recent budgetary allocations have supported these priorities, contributing to progress on social outcomes for which Bangladesh is well-known. By spending an average of one-quarter of its budget on education, health and social protection, Bangladesh compares favorably to other countries with similar income levels. However, government spending in these sectors as a share of national income remains small because of the low overall level of public spending/revenue.
4. Bangladesh’s Constitution provides a strong basis for local governments, but the government remains highly centralized. Despite the Constitutional emphasis, most subnational government entities play a limited role in raising revenues and delivering public services. Intergovernmental transfers account for a small share of total government expenditures, and for the most part, are allocated through ad hoc annual negotiations rather than formulas. With most transfers being earmarked and restricted to own-revenue sources, discretion at the subnational level to allocate resources to address local needs is limited. Effective devolution of state power is limited, with resistance to substantive jurisdictional and fiscal concessions to local governments.
5. Progress in social outcomes in Bangladesh is inspiring other countries, but deep challenges persist as the pace of reduction slows down. Between 2000 and 2016, poverty has been reduced by 24.6 percentage points which ranks Bangladesh 2nd in the South Asia region in terms of poverty reduction (Figures 1-1 and 1-2)1. Largely, this reduction was driven by sustained economic growth and improvement in the labor incomes of the poor. However, almost 1 in 6 Bangladeshis still live in extreme poverty (international poverty line $1.90/day, PPP 2011) and are not able to afford a basic food consumption basket. Consumption growth for the poorest 40 percent decreased from 1.8 percent to 1.2 percent between 2010 and 2016. Any climate-related or macro-economic shock can push a large number of people back into poverty and put the recent gains in human capital and productivity in peril. COVID-19 has exacerbated these trends, disrupting job creation and pushing millions of Bangladeshis back into poverty as real GDP growth slowed to an estimated 2.4 percent in FY2019-20 (see details in Box 1-1).
1 Data in this paragraph are from World Bank, 2019a.
SOCIAL PROTECTION IN BANGLADESH: CONTEXT, POLICY AND OVERALL SPENDING
32

6. Bangladesh is also experiencing rising inequality, and important geographic and socio-economic disparities persist. During 2000-2010, the poorest 40 percent of the population experienced increases in per capita consumption in real terms, and growth was slightly higher than that of households in the higher quintiles, but this trend reversed during 2010-2016. There are also important inequalities between socio-economic groups and regions . While poverty remains higher in rural areas, poverty reduction has been slower in urban areas. Rural areas drove poverty reduction between 2010 and 2016, accounting for 90 percent of the decrease. The progress of poverty reduction in the country also varied across the east and the west. Eastern divisions performed better than western divisions, and the reemerging divergence has occurred in rural areas (not in urban areas). At the same time, poverty has been predominantly high in the northern and southern parts of the country. Rangpur has seen a marginal increase in poverty in the recent years despite development efforts focused on the northern region.
7. Similarly, despite important improvements, child nutrition and mortality remain a challenge. While Bangladesh has attained food self-sufficiency at the aggregate level, 1 in 4 people are food insecure, and many are vulnerable to food insecurity in the face of shocks.3 Stunting among children under 5 has declined from 51 percent in 2004 to 31 percent in 2018, but Bangladesh still accounts for 4 percent of the global burden with nearly 5.5 million stunted children.4 There are large disparities according to maternal education and wealth levels—18 percent of children whose mothers have secondary education are stunted, while the rate rises to 47 percent for mothers with no formal education.5 There are also regional disparities, through prevalence among both rural children (38 percent) and urban children (31 percent) remains high6. Infant mortality is below the South Asian average, with rates falling from 36 per thousand live births in 2010 to 24 in 2017. These reductions can be associated with improved coverage of effective interventions i.e. Vitamin A supplementation, breast feeding practices etc.7 Infant mortality is also inversely related to mother’s level of education and household’s wealth status.8 Children in the poorest households are nearly twice as likely to die before the age of 5 as those from the richest. Bangladesh has one of the highest out-of-pocket expenditure to total health expenditure ratios in the world, which further exacerbates inequities.9
2 World Bank 2019c.3 Osmani et al., 2016. 4 The prevalence of wasting fell to 22 percent and of underweight 8 percent. NIPORT and ICF, 2019. 5 NIPORT et al. 2017.6 Save the Children, 2015.7 Bangladesh Bureau of Statistics, 2017a. 8 UNDP, 2012. 9 Out-of-pocket payments account for 72 percent of total expenditure, affecting particularly the poorest (World Bank, 2016). In 2010, these payments pushed 6.8 million of Bangladeshis into extreme poverty (World Bank, 2019a).
Figure 1-1: Trends in PovertySource: World Bank, 2019a.
60%
50%
40%
30%
20%
10%
0%
National Poverty Rate Poverty rate at $1.90/day
2000 2005 2010 2016
Figure 1-2: Rural vs. Urban PovertySource: World Bank, 2019a.
60%
50%
40%
30%
20%
10%
0%2000
Rural Urban
2005 2010 2016
33BANGLADESH SOCIAL PROTECTION PUBLIC EXPENDITURE REVIEW

8. Access to water, sanitation and hygiene facilities is a key factor behind health outcomes. Despite a dramatic improvement nation-wide, the poor consistently fare worse than the well-off and are at greater risk of having worse health outcomes i.e. diarrheal disease and stunting as they rely on water from unimproved sources, share sanitation facilities, and lack basic hygiene. Household wealth alone explains 70 to 75 percent of whether a child will have access to improved water or improved sanitation infrastructure.10 General disparities in access level also exist between geographical regions, particularly the Chittagong Hill Tracts, hard-to-reach coastal areas and urban pockets.
9. Education outcomes also exhibit progress and persistent challenges. Literacy rate has increased by 16 percentage points to nearly 75 percent during 2011 to 2019 (for people aged 15 and above). This was partly because of longer term investment in primary and secondary education through the national primary and secondary education stipend programs which resulted in increased access to primary education (over 97 percent enrollment rate), achievement of gender parity in primary and secondary education. However, learning outcomes remain low: about 36 percent remain non-literate or semi-literate even after completing five-years cycle of primary education.11 Also, net enrollment in secondary education is only 67 percent while 88 percent of students complete the full cycle of secondary education. The net secondary education enrollment rate is 73.5 percent among girls and 62 percent among boys, with high dropout rates of 12 and 15 percent respectively associated with work for boys and marriage for girls.12
10. Bangladesh labor market is dominated by low-productivity sectors and informality. Despite the ongoing structural transformation and rapid urbanization, agriculture remains the largest source of employment, accounting for 42 percent of all jobs in 2016. While the ready-made garment sector has been a driver of structural transformation (accounting 15 percent of jobs)13, a general slowdown in domestic job creation and demographic pressure resulted in a large number of Bangladeshis migrating (on average 544,000 a year) abroad. Bangladesh’s labor market also displays high informality (increased from 75 percent in 1999–2000 to 85.1 percent in 2016).14 These patterns make the economy highly vulnerable to shocks (Box 1-1). The labor productivity growth of 1.8 percent in 2010 (mostly driven by the service sector) remains far below growth experienced by countries such as India and Vietnam, with 3.8 percent and 2.8 percent, respectively. Low productivity is linked to a labor force with inadequate skills. Inadequate investment in human capital, particularly for low income groups and women, continue to hamper productivity and access to jobs. Only 31 percent of Bangladeshi workers have a secondary educational qualification; 6.1 percent have a tertiary education degree; around 1 percent have a technical and vocational education and training certificate, while 34 percent have no education or training at all.15
11. Labor force participation has increased, but remains too low for Bangladesh to reap the full benefit of its demographic transition. Currently, 40 percent of the working-age population remains out of the labor force, suggesting a significant underutilization of human resources in the country. This situation is largely driven by very low female labor force participation (about 37 percent in 2016, compared with almost 90 percent for men, and well below the average of 39 percent in lower-middle income countries or 48 percent in middle income countries).16 This low level of female participation in the labor force is likely to be associated with early marriage, household responsibilities, and mobility constraints, in the context of social and cultural norms. Overall, participation is higher among rural women, due to the availability of agriculture and unpaid work in rural areas.
10 World Bank, 2018a. 11 Ahmed, Nath and Ahmed, 2003.12 UNICEF, 2018a. 13 Farole et al., 2017. 14 Bangladesh Bureau of Statistics, 2018a. 15 Bangladesh Bureau of Statistics, 2018b.16 World Development Indicators, https://databank.worldbank.org/source/world-development-indicators and Farole et al. 2017.
SOCIAL PROTECTION IN BANGLADESH: CONTEXT, POLICY AND OVERALL SPENDING
34

17 BIGD and PPRC, 2020.18 World Bank, 2020a.19 World Bank, 2020b. 20 Business Pulse Survey: Impact of COVID-19 on MSMEs in Bangladesh.
IMPACTS OF COVID-19 PANDEMIC AND GOVERNMENT RESPONSES
Albeit significant reduction in poverty in Bangladesh, more than half the population continues to be vulnerable and can fall into poverty if affected by an income shock. Several factors contribute to this vulnerability. Firstly, the dependence on a limited number of sources of income (i.e. remittances from international migrants and export earnings from the readymade garments (RMG) industry) makes the economy vulnerable to shocks such as the Coronavirus Disease (COVID-19). Secondly, poverty reduction in the country has been largely driven by labor income which constitutes 82 percent of the household incomes of the poorest 40 percent. As a result, any income shock can jeopardize households’ financial stability. Thirdly, urban areas have been slower than rural areas in reducing poverty primarily because of the limited creation of quality jobs. As a result, the informal sector employs 85 percent of the working population of the country, with no formal assurance of social protection in case of a shock.
Given these vulnerabilities, COVID19 has significantly affected the low-income population in Bangladesh. In March 2020, the GoB imposed social distancing and restrictions on mobility, closing all government and private offices from March 26 to May 31. Millions of workers left major cities, public transportation was suspended, and construction activities slowed down. Hundreds of factories closed as a result of cancelled orders and mobility restrictions, impacting several million jobs in the RMG sector. The national shutdown had a particularly severe impact on the service sector, which employs millions in formal and informal activities. Moreover, estimates suggest up to 250,000 international migrant workers returned home between January-May 2020 due to job losses abroad. In June 2020, urban and rural poor reported income losses of 75 percent and 62 percent, respectively.17 In June/July 2020, about 23 percent of the poor in Dhaka and Chittagong reported having stopped working after the national shutdown in March 25, and 80 percent of wage workers and 94 percent of own-account workers reported decreases in earnings.18 A later survey in September-October 2020 reveals signs of recovery in employment and earnings, but a micro-simulation estimates that, on average, per capita household consumption could decline by 13 percent, which would push as many as 21 million people below the poverty line19. In July 2020, 94 percent of micro, small, and medium enterprises (MSMEs) had experienced sharp drops in sales, 83 percent of firms have made losses, and 33 percent of firms have not been able to pay installments on existing loans.20
In response to the COVID-19 crisis, the GoB announced economic response programs (23 stimulus packages) focused on protecting jobs, firms, and the poor with an estimated value of US$14.6 billion as of February 2020. Programs’ objectives include retention of workers in the export-oriented manufacturing sector, restoration of demand and supply, sustaining private sector firms, medical insurance and incentives to doctors, and the provision of food and basic income for the poor, day laborers, informal sector workers, low earning professionals and small businesses. While more than three-quarters of the total stimulus comes from extension of bank credit, the estimated direct fiscal cost remains significant – more than 1 percent of GDP. To protect workers and the poor and vulnerable, the government has expanded social protection coverage. In terms of food, GR was activated and provided assistance in the form of food and cash to 75 million people; the Special OMS program provided subsidized rice to the vulnerable and jobless (maximum of 20 kg per month) during the lockdown; and the Food Friendly Programme (FFP) was extended to give additional support to 5 million families. The government also decided the horizontal expansion of the OAA, WA and DA programs (to cover all the eligible individuals in 112 poorest sub-districts), as well as unconditional cash transfers to informal workers who lost their jobs (BDT 2,500 to 5 million households) and cash assistance for laid-off workers in the export-oriented sectors (BDT 3,000 to 1 million workers for up to 3 months).
Box 1-1.
35BANGLADESH SOCIAL PROTECTION PUBLIC EXPENDITURE REVIEW

12. Youth aged 15 to 29 are disproportionately vulnerable in the labor market. Youth labor market participation and employment rates are low and stagnating. Their participation is around 47.6 percent – considerably lower than the corresponding rate of 64 percent for adults.21 Similarly, the gap between the youth and adult employment rate is 22.9 percentage points. Despite rising educational attainments, youth unemployment remains high (unemployment rate of 8.7 percent, more than three times that of adults). School-to-work transitions for youth continue to be a challenge, as better educated youth, with probably a higher reservation wage, enter a labor market where quality jobs are scarce.22 Moreover, there are few programs targeted to youth to promote their employability and productivity, and to boost entrepreneurship or match youth with jobs.
1.2 DEMOGRAPHIC, URBANIZATION AND FREQUENT SHOCKS WILL SHAPE THE FUTURE OF SOCIAL PROTECTION
13. Demographic change opens a window but also challenges. According to the classic demographic transition model, Bangladesh is currently in the third phase of the transition with declining fertility and mortality rate.23 Over the last four decades (1970-2011), the total fertility rate in Bangladesh declined dramatically from 6.8 in 1975 to 2.1 in 2017 (Figure 1-3). During the same period, mortality also declined significantly. This resulted in a significant shift in the age structure of the population, characterized by a decline in the share of the young age group (0-14 years), an increase in the working age population (15-64 years) and a decline in the dependency ratio (the number of workers per dependent increased, Figure 1-4). This age-structural transition, with more of the population in the working ages than in the dependent ages, creates a window of opportunity for economic growth known as the “demographic dividend”.
14. The window of opportunity is however limited in time, and reaping its benefits is not guaranteed or automatic. It depends on whether the working age population is actually working and productive. This in turns depends on how much the country invests in key areas like human capital development, especially for the poor and vulnerable, as well as quality job creation and infrastructure, and whether the environment is conducive for all members of the bulging working age population to participate in the country’s socio-economic growth. In Bangladesh, the demographic window is expected to close by 2050.24 Following this period, the number of people aged over 60 years is projected to gradually triple, from 12.62
21 Ibid.22 Farole et al. 2017. 23 UNFPA, 2015. 24 Ibid.
Figure 1-3: Trends in fertility and mortality rates Source: World Development Indicators, https://databank.worldbank.org/source/world-development-indicators.
2000Mat
erna
l & In
fant
mor
talit
y rat
io
Tota
l fer
tility
rate
2005 2010 2015 2016 2017
500450400350300250200150100
500
3.5
3
2.5
2
1.5
1
0.5
0
TFR MMR IMR
Figure 1-4: Trends in Age structure Source: World Development Indicators, https://databank.worldbank.org/source/world-development-indicators.
1998 2002 2006 2010 2014 2018
0-14 15-64 65+
8070605040302010
0
SOCIAL PROTECTION IN BANGLADESH: CONTEXT, POLICY AND OVERALL SPENDING
36

million (7.77 percent of the total population) in 2019 to 42.1 million (21.9 percent) in 2050.25 That means by 2050, one out of five people will be over the age of 60. The increasing share of these ageing population will generate new needs for the social protection policy and programs. In the meantime, however, the main challenge is to ensure that all working age adults can productively engage in the economy and invest in the human capital of its household members.
15. Urbanization also has important consequences for social protection spending and design. The urban dwellers grew from 9 percent of the population in 1974 to 28 percent by 2011, and is expected to reach 50 percent by 203026 (Figure 1-5). Bangladesh is urbanizing faster than the southern Asia and all Asia regional averages. While in 1995, 21.7 percent of Bangladeshis lived in urban areas compared to 26.6 percent of Indians; the urbanization rate of Bangladesh had surpassed India in 2015 by almost 3 percentage points.27 Poverty could be exacerbated by unplanned urbanization, with almost 1 in 5 of the urban population living in poverty (in South Asia, only Afghanistan has a higher urban poverty rate).28 Vulnerability to poverty, defined as the population living close to the poverty line, is also high in urban Bangladesh with 1 in 2 households at the risk of falling into poverty. Urban areas are deprived in other dimensions as well— a third of the household heads have no education, low school attainment rate among children and high prevalence of malnutrition among others. Also, as rural people migrate into the urban areas, they often lose their social capital. The multi-dimensional urban poverty and vulnerability calls for greater support and adaptation of the existing programs to the urban context and/or developing new interventions. From the service delivery aspect—urban areas pose complex problems, because of the continuous influx of people into the cities and frequent movements within cities.
16. Bangladesh is ranked as the most vulnerable country in the world to climate related shocks (Figure 1-6). Climatic shocks are expected to affect more than 70 million people in Bangladesh.29 Historically, flooding, droughts and cyclones are the most common disaster events in Bangladesh – 5 of the 10 deadliest tropical cyclones in the world since 1900 occurred in Bangladesh.30 Climate shocks have a disproportionate impact on the poor, because they generally live in higher-risk areas and have limited coping mechanisms. They revert to depletive coping strategies – selling assets, migrating, pulling children from school, foregoing health care, early marriage, etc. – which put in peril their human and productive capital, thereby having long terms impacts. As disasters become more frequent and intense, the social protection system needs to develop its ability to adjust dynamically and respond in a timely manner to prevent irreversible losses for those affected.
25 UN, 2019. 26 UNFPA, 2016. 27 Farole et al., 201728 Hill and Rahman, 2019.29UNDP, 2008.30Ozaki, 2016.
Figure 1-6: Frequency of shocks Source: Hossain and Miah, 2011 and ACAPS, 2018.
1981-1990
1970-1980
Num
ber o
f maj
or d
isast
ers
1991-2000
2001-2010
2011-2020
6
5
4
3
2
1
0
CyclonesFloods
Figure 1-5: Growth in urban population as % of total population in BangladeshSource: UNFPA, 2018.
1974 1981 1991 2001 2011
Urban population30
25
20
15
10
5
0
37BANGLADESH SOCIAL PROTECTION PUBLIC EXPENDITURE REVIEW

1.3 BANGLADESH’S POLICY FRAMEWORK REFLECTS THE LONG TRADITION OF SOCIAL PROTECTION
17. Social protection in Bangladesh has been evolving since the 1970s, through innovation and experimentation (Figure 1-7). At its inception in the 1970s in a war-torn and natural disaster-stricken country, social protection initially focused on addressing food shortages following the war and cyclones and flood. During the 1980s, concern for incorporating “ladders” or the concept of graduation emerged resulting in programs that supported life skills, microcredit and income generating activities. Since the 1990s, conditional transfers for behavioral change began through food for education programs, and subsequently, a life cycle-oriented social protection approach began to take shape.
18. Bangladesh has kept innovating, and key successful innovations have been scaled up with significant impacts. Many programs that have evolved through experimentation have led to important outcomes: Increased access to cash has facilitated contributions to food and nonfood consumption; increased savings and reduced outstanding loans; reduction in coping mechanisms during lean seasons including school dropout, loans, reduced food intake; temporary employment for women with lesser options to migrate during lean season; enhanced self-esteem of vulnerable groups like the elderly, women, persons with disabilities etc. because of access to monetary support from the Government; and enhanced connectivity, market linkage and protection from natural disasters from public works; and overall impacts in local economy from transfers in cash.
19. The evolution is reflected in the current policy framework. The Constitution of Bangladesh emphasizes social protection in case of unemployment, illness, disability, old age as well as vulnerable groups like widows and orphans. The First FYP adopted in 1973 underscored the need for a policy on social protection to support vulnerable groups: BDT 200 million (about US$ 2.5 million) were allocated to programs targeting various groups affected by the post-war circumstance: orphans, youth, persons with disabilities, elderly. Subsequent FYPs and planning instruments adopted by the country during 2002 - 2010 continued to emphasize social protection, leading up to the country’s first NSSS.31
Public works and food aid
in the post war, flood affected country facing food shortage
Transition from relief to
development-oriented safety
nets
Introduction of conditional
transfers i.e. food for education (as a more effective use of food aid), female student
stipend etc.
Graduation goals: shift from protection
to protection & promotion by
building resilience; and geographic
targeting
Employment guarantee, and
continuation of conditional transfers and graduation-
oriented programs
1970s 1980s 1990s 2000s 2010s
FFW VGD PESP EGPP EGPP
Figure 1-7: Evolution of social protection in BangladeshSource: Adapted from Planning Commission, 2015.
31 Planning Commission, 2005 and 2015.
SOCIAL PROTECTION IN BANGLADESH: CONTEXT, POLICY AND OVERALL SPENDING
38

20. Approved in 2015, the NSSS lays out a comprehensive roadmap for social protection in Bangladesh. It was reflected into the 7th FYP and also informed the preparation of the 8th FYP. The NSSS establishes priorities in terms of coverage, type of programs and delivery mechanisms. For coverage, the NSSS seeks to improve coverage of the hard-core poor and most vulnerable, including in urban areas, with a transition to a targeted universal approach. In terms of types of program, the strategy proposes scaling up the “graduation” programs, ensuring vulnerable women’s income security, fostering social insurance, converting food transfers to cash, and strengthening resilience and effective disaster response. Finally, in terms of delivery systems, the NSSS highlights the importance of improved targeting using the NHD, management information systems to improve transparency and efficiency, modernized payment mechanisms, increased awareness about existing programs, consolidation of small programs, and deployment of skilled professional staff.
1.4 BANGLADESH ALLOCATES SIGNIFICANT RESOURCES TO SOCIAL PROTECTION, IN LINE WITH ITS PEERS
21. Bangladesh spent about BDT 1,500 billion (US$ 18.7 billion) on social protection during FY2013-14 to FY2017-1832, and its expenditure are aligned to those of others in the region. Consistent increases in allocations to social protection over the past decade are credited with part of the successes in poverty reduction.33 The allocation represents nearly one tenth of total Government budget, and amount to 2.58 percent of GDP in FY2019-20 (Figure 1-8). The average annual growth of social protection expenditure was more than 25 percent during FY2013-14 to FY2017-18 (partly driven by reforms to the Pensions for Retired Government Employees and their Families). The annual increase however tapered to 16 percent by FY2017-18. Comparing expenditures on social assistance (excluding social insurance and labor market programs) in the Asia and Pacific region, Bangladesh spends more than Bhutan, Pakistan, Sri Lanka, Cambodia, Malaysia, Indonesia, the Philippines, China and others in terms of share of GDP in 2016. While India, Nepal, Maldives and Vietnam among others spend more than Bangladesh does in social protection, as percentage of GDP (Figure 1-9).
32 The analysis uses available budget, revised budget data (from FD) and expenditure data (from CGA) for FY2008-09 to FY2019-20. Because of their excep-tional nature (COVID crisis), FY2019-20 (revised budget) and FY2020-21 (budget) data are excluded.33 World Bank, 2010.
Figure 1-9: Expenditure on Social Expenditure as % of GDPSource: The Atlas of Social Protection (ASPIRE). (http://datatopics.worldbank.org/aspire), World Bank.
VietnamThailandSri Lanka
PhilippinesPakistan
NepalMaldivesMalaysia
IndonesiaIndia
BhutanBangladesh
0.00 0.50 1.00 1.50 2.00 2.50Figure 1-8: Social Protection allocation as percentage of GDP in BangladeshSource: National Budget, FD, MoF. Note: *Budget project. FY2009-10 to FY2018-19 are revised budget figures.
FY20
09-1
0
FY20
10-1
1
FY20
11-1
2
FY20
12-1
3
FY20
13-1
4
FY20
14-1
5
FY20
15-1
6
FY20
16-1
7
FY20
17-1
8
FY20
18-1
9
FY20
19-2
0*
3.002.902.802.702.602.502.402.302.202.102.00
39BANGLADESH SOCIAL PROTECTION PUBLIC EXPENDITURE REVIEW

22. The core issue in Bangladesh, more than the overall resources devoted to social protection, seems to be around how well these resources are deployed. This public expenditure review proposes to review four aspects of quality of spending, which together point to elements that could be reformed to increase the overall impact of the resources devoted to this sector. The first key question is whether these important resources are allocated in a manner that focuses on the issues they are meant to address (discussed in Chapter 2). The second set of questions relate to whether the programs themselves are designed to be impactful, that whether they are reaching the intended beneficiaries in a manner that’s adequate or commensurate with their needs (discussed in Chapter 3). A third set of issues relate to whether the processes used to prioritize, budget and finance these programs are efficient (discussed in chapter 4). Finally, the last elements essential to the overall effectiveness of the social protection expenditure is the efficiency in the delivery of the programs to their beneficiaries, from the central to the local level (discussed in chapter 5).
40

41BANGLADESH SOCIAL PROTECTION PUBLIC EXPENDITURE REVIEW

ALLOCATIVE EFFICIENCY: POLICY ALIGNMENT OF EXPENDITURES IN SOCIAL PROTECTION
Chapter 2
42

23. The National Social Security Strategy prioritizes a series of reforms, to make progress towards more inclusive social security. One of the key proposals of the NSSS is to focus on life-cycle risks, and prioritize the poorest and the most vulnerable. Consolidation of small schemes, food transfers and special programs around life-cycle risks was also identified as a priority to improve efficiency. Another key principle is to ensure all functions are played – including support to the poor and vulnerable both in rural and urban areas, scaling-up of “graduation” programs, and deployment of a social insurance system that encourages voluntary contributions. Within this first area of support to the poor and vulnerable, the NSSS focuses strongly on ensuring coverage of vulnerable women and on strengthening disaster response and resilience to covariate shocks. Among other planned measures included health insurance and the continuation of human development.
24. This chapter reviews the extent to which programming effectively reflects the proposed focus on life-cycle risks and the different functions of the system. It starts by proposing two typologies which could help assess progress and inform policies (Section 2.1). The rest of the chapter then turns to analyzing the existing portfolio of programs along two particular dimensions which are central to the NSSS: the life-cycle risks (Section 2.2) and the function programs perform (Section 2.3).
2.1 THE IMPORTANCE OF ALIGNING THE CATEGORIZATION OF PROGRAMS WITH POLICY
Policy making requires categorizations, which are commensurate with strategic directions
25. Social protection is a term, which can be used to describe a broad range of programs. In some countries, it is used interchangeably with social safety nets or social security, though in many other countries these are very different concepts. Various institutions have proposed definitions for key terms – social insurance, social security, social protection, labor market interventions, economic inclusion programs, human capital investments, social safety nets, social assistance, etc.34 The NSSS has a rather broad scope,
ALLOCATIVE EFFICIENCY: POLICY ALIGNMENT OF EXPENDITURES IN SOCIAL PROTECTION
34 See https://www.ilo.org/global/topics/social-security/lang--en/index.htm, ADB, Policies and Strate-gies, Social Protection or https://www.worldbank.org/en/topic/safetynets for example.
43BANGLADESH SOCIAL PROTECTION PUBLIC EXPENDITURE REVIEW

covering what many define as safety nets or social assistance, as well as insurance against some risks (old-age for instance), programs addressing shocks, and interventions focused on employment or productivity (it does not cover health insurance, included in some other countries’ strategies). Over the past decade, the Finance Division (FD) has prepared a list of social protection programs financed by the national budget.35 So far, this list organizes programs into cash transfers, food security, micro-credit, development sector programs, and miscellaneous funds (and for many into sub-categories of social protection and social empowerment). While the list has already become an important tool for planning, both its scope and its categorization could be more aligned with the orientations laid out in the NSSS, to increase its impact on policy making. In addition, there are several programs which are included in the list but have non-SP attributes and also programs which have SP attributes but are not included in the FD list. Therefore, getting the list right is critically important.
26. While there is no right or wrong categorization, we propose two typologies which would help policy makers implement the policies laid out in the NSSS. These typologies can also help clarify the boundaries of what policy makers consider when planning social protection interventions (potentially including programs not currently considered or excluding others). These typologies could be used in the Budget and Accounting Classification System (BACS), thereby enabling the iBAS++ to identify and group programs for budget planning, accounting, control and reporting purposes.36 Considering the importance they play in the NSSS, we propose two typologies: a first in terms of program’s beneficiaries (to follow the life-cycle approach) and a second in terms of the program’s function (to reflect the distinctions between assistance, pension, employment, social services, shock-response functions, among others). Other program characteristics, such as the nature of benefits (cash, food, services, etc.), the geographic focus, or the funding source are also information which each program should provide. Analyzing the current portfolio from any of these angles is essential to inform policy choices and planning, analyze trade-offs, and measure progress towards specific policy choices. Furthermore, the categorization and typologies proposed in this analysis could inform the future updating of the NSSS.
Categorization of programs by beneficiaries – life-cycle approach
27. The NSSS identifies a series of life-cycle risks, as well as a range of risks which affect households more generally. Different life-cycle groups face different risks – for instance, while health shocks are exist across the life-cycle, there are particular risks associated with pregnancy and early childhood (for instance birth, malnutrition, or cognitive development) which can affect children’s long term earning capacity. Education and skills development for children and youth bear important implications on the country’s ability to tap into the window of demographic dividend. With longer life expectancy and lower fertility, the share of elderly people is increasing, with its associated health and income risks. In addition to these demographic-related risks, broader risks can push households into poverty or prevent them from investing in their human or productive capital. Some of these shocks are covariate and affect multiple households simultaneously – such as natural disasters, economic recessions, epidemics or pandemics like the ongoing COVID-19. Finally, some households face structural vulnerabilities and poverty, which can inhibit their livelihood and income options (including highly vulnerable groups such as destitute women, persons with disabilities, or members of ethnic and socially-excluded minorities).
28. Of course, while some programs are directed at particular individuals, they will likely benefit other individuals as well, within their households and beyond. First, there can be some redistribution within a household – a beneficiary can share some of the benefits (sharing a food ration or some of the cash received) or invest in goods which benefit the entire household (lighting, flooring, heating, etc.). There can also be less direct spillovers within a household or across households, when improvements in a beneficiary’s condition has a positive impact on others. For instance, if an elderly or disabled member receives care services, this can alleviate the charge of other individuals who contributed to their care. When a working age member can develop skills and improve their productivity, they will increase household income.
35 https://mof.portal.gov.bd/site/page/32220b73-846f-4a33-b4c0-a6650c918e25/Safety-Net. 36 Ministry of Finance, 2014.
ALLOCATIVE EFFICIENCY: POLICY ALIGNMENT OF EXPENDITURES IN SOCIAL PROTECTION
44

Also, when a program improves an individual or household’s situation, others might reduce the transfers they use to make to them (and thereby increase their own welfare). Or beneficiaries whose welfare improved might support other, poorer, individuals (for instance, in some contexts, grants for the elderly have been linked to increased investments in their grand-children’s school expenses).
29. Accordingly, to reflect the NSSS, we propose a classification into eight categories. Table 2-1 presents examples of programs along this classification (see Annex 2 for a list of all programs). The first category includes programs that are targeted at pregnant or lactating women and very young children. The second category comprises programs targeting school-age children, and include stipends, food programs and social services. The next age-category of the working age encompasses programs that offer skills development, economic inclusion programs, and entrepreneurship support. The elderly is the last demographic group. Three other groups are defined by their socio-economic or physical conditions. Some programs focus on individuals who live with some disabilities, cutting across age-groups. Programs are also focused on households (rather than specific members) who are either in situation of chronic poverty or in situation of transient poverty as a result of a shock. In the first group, programs include cash or food assistance, public works, social care services, as well as subsidies. In the latter group, programs which focus on addressing the needs of households affected by shocks tend to offer cash, food or in-kind assistance (as well as community development. Finally, programs focused on institutional support to the overall social protection system close the list of categories. They typically provide technical assistance to a central agency or to a sectoral ministry).
Name of Category Selected programs, for illustration
1. Pregnant women, young children and their mothers
Allowances for Urban Lactating Mothers (MoWCA)Maternal Health Voucher Scheme (MoHFW)Income Support Program for the Poorest – JAWTNO (LGD)
2. School-age children
Primary School Stipend (MoPME)Reaching Out of School Children Program (MoPME)Secondary Education Development Program (MoE)School Feeding Program (MoPME)Grants for residents in Government Orphanages or Other Institutions (MoSW)
3. Working age Skills and Training Enhancement Project (MoE)Vulnerable Group Development Program (MoWCA)My House My Farm Program (RDCD) Micro-credit program (PKSF)
4. Elderly Pensions for Retired Government Officials and their Families (FD)Old Age Allowance (MoSW)
5. Persons with disability
Allowances for the Financially Insolvent Disabled (MoSW)
6. Households living in poverty
Vulnerable Group Feeding (MoDMR)Employment Generation Program for the Poorest (MoDMR)Development of the Living Standard of the Marginal People of Bangladesh Program (MoSW) Food Friendly Program (MoFd)Open Market Sales (MoFd)
7. Households affected by shocks
Gratuitous Relief (MoDRM)Infrastructure and livelihood Development in Haor Area program (LGD)
8. Overall system Strengthening Public Financial Management for Social Protection (FD)Social Security Policy Support Program (PC) Cash Transfer Modernization Project (MoSW)
Note: Implementing agencies in parenthesis.
Table 2-1: Proposed categorization of Social Protection in Bangladesh by Life-cycle
45BANGLADESH SOCIAL PROTECTION PUBLIC EXPENDITURE REVIEW

Classification of programs by functions – Insurance, assistance, labor, services, community development, subsidies, technical assistance
30. In addition to the focus on life-cycle risks, the NSSS highlighted the need to focus on some functions or roles played by programs, such as providing the poorest with “ladders” and providing support following shocks or crises. There are multiple ways to distinguish between different functions. Many countries, scholars, and institutions distinguish only between insurance, assistance, and labor market support. Others classify social care services separately from social assistance. In Bangladesh, because of the place they occupy in the policy discussions, policy makers might need to be able to further distinguish community development and subsidies, as well as technical assistance to social protection institutions. The boundaries between these categories can sometimes be fuzzy, and some programs might contain multiple elements (and some categories might overlap to a certain degree with those under the life-cycle typology – for instance, labor market programs serving working age adults). And, of course, any analysis can decide to regroup some of these, depending on the issue at hand. To allow for an analysis of the main issues highlighted in the NSSS, we propose a focus on 7 categories (Table 2-2 presents examples of programs along this classification, while Annex 3 includes the list of all programs):
• Social insurance: In many countries, social insurance programs include all those which require a contribution or are related to employment – Insurance against old age (pension), disability, or death, as well as sickness cash benefits and health insurance. Bangladesh only has pensions in this category, which are linked to beneficiaries’ employment and earnings.
• Social assistance: These provide support to the poor and vulnerable, and may require participation in activities, but no financial contribution (e.g. working in public works, attending school, or participating in information session). To inform NSSS policies, we further distinguish between those transferring cash (regular cash allowances, public works, one-off transfers), food (food distribution or food-for-work), stipends, or a mix of benefits (often emergency support).37
• Labor market interventions: They vary greatly in terms of content and target population, but all focus on promoting earnings and productivity. To inform current policies, we propose to distinguish between technical/vocational skills development programs which serve young people (typically with certain prior education), economic inclusion or “graduation” programs providing more comprehensive packages to the poor and vulnerable, and programs that support entrepreneurs.
• Social care services: These include a broad range of services – from care for vulnerable children, the elderly or the disabled to various support services for vulnerable groups.
• Community development: Programs include community-level programs focused on infrastructure development and restoration; including investments in water, sanitation, emergency shelter, marketplace, rural roads, and culverts.
• General subsidies: While subsidies can be provided across a number of sectors, social protection typically considers mostly targeted food and energy subsidies. These include OMS and FFP that sell food below market price.
• Technical assistance: This category includes programs which focus on systems for the delivery of social protection (policy, planning, budgeting, digitization, targeting, enrolment, payments, etc.). Strong systems are critical for efficiency and transparency, but also to support rapid scale-up during emergencies, such as the ongoing COVID-19 pandemic.
37 Pensions for Retired Government Officials and their Families are classified as social insurance, while programs not linked to specific employment fall under social assistance (e.g. OAA). This does not imply that pensioners are wealthy, as some have low pensions (about 90 percent of the current 715,000 pensioners belong to Classes 3 and 4).
ALLOCATIVE EFFICIENCY: POLICY ALIGNMENT OF EXPENDITURES IN SOCIAL PROTECTION
46

2.2 THERE IS SIGNIFICANT SCOPE FOR GREATER ALIGNMENT BETWEEN DEMOGRAPHY AND EXPENDITURES 31. Contrasting the distribution of the population with that of social protection expenditure reveals over-spending on programs for the elderly. Contrasting age distribution with that of spending directed at specific age groups shows uneven patterns. While children under 5 represent 9 percent of the population (and as much as 13 percent
Name of Category Selected programs, for illustration
1. Social insurance Allowances for Urban Lactating Mothers (MoWCA)Maternal Health Voucher Scheme (MoHFW)Income Support Program for the Poorest – JAWTNO (LGD)
2. Social assistance
2.1 Social assistance – cash Old Age Allowance (MoSW)Allowances for the Widowed, Deserted and Destitute Women (MoSW)Test Relief Program (public workfare, MoDMR)
2.2 Social assistance – food School Feeding (MoPME)Food Assistance Program (MoCHTA)
2.3 Social assistance – stipends Primary School Stipend (MoPME)Secondary Education Development Program (MoE)
2.4 Social assistance – kind and/or food Block Allocation for Disaster Management (MoDMR)General Relief Activities (MoDMR)
3. Labor market programs
3.1 Labor – Technical/vocational skills development
Skills and Employment Program (MoE)Skills for Employment Investment Program (FD)
3.2 Labor – Economic inclusion VGD (MoWCA)Livelihood Development Programme For Bede and Underprivileged Community (MoSW)
3.3 Labor – Entrepreneurship support / Startup incentives
Micro-Credit program (FID)Special Fund for Assistance to Women Development & Entrepreneurs (FD)
4. Social care services Early Learning for Child Development
5. Community Development Infrastructure and livelihood Development in Haor Area (LGD)Gucchagram (Climate Victims Rehabilitation Project) (LGD)
6. General subsidies Open Market Sales (MoFd)Food Friendly Program (MoFd)Non-Bengali Rehabilitation (MoDMR)
7. Technical assistance Strengthening Public Financial Management for Social Protection (FD)Social Security Policy Support Program (PC) Cash Transfer Modernization Project (MoSW)
Note: Implementing agencies in parenthesis.
Table 2-2: Proposed categorization of Social Protection in Bangladesh by Nature of Intervention
47BANGLADESH SOCIAL PROTECTION PUBLIC EXPENDITURE REVIEW
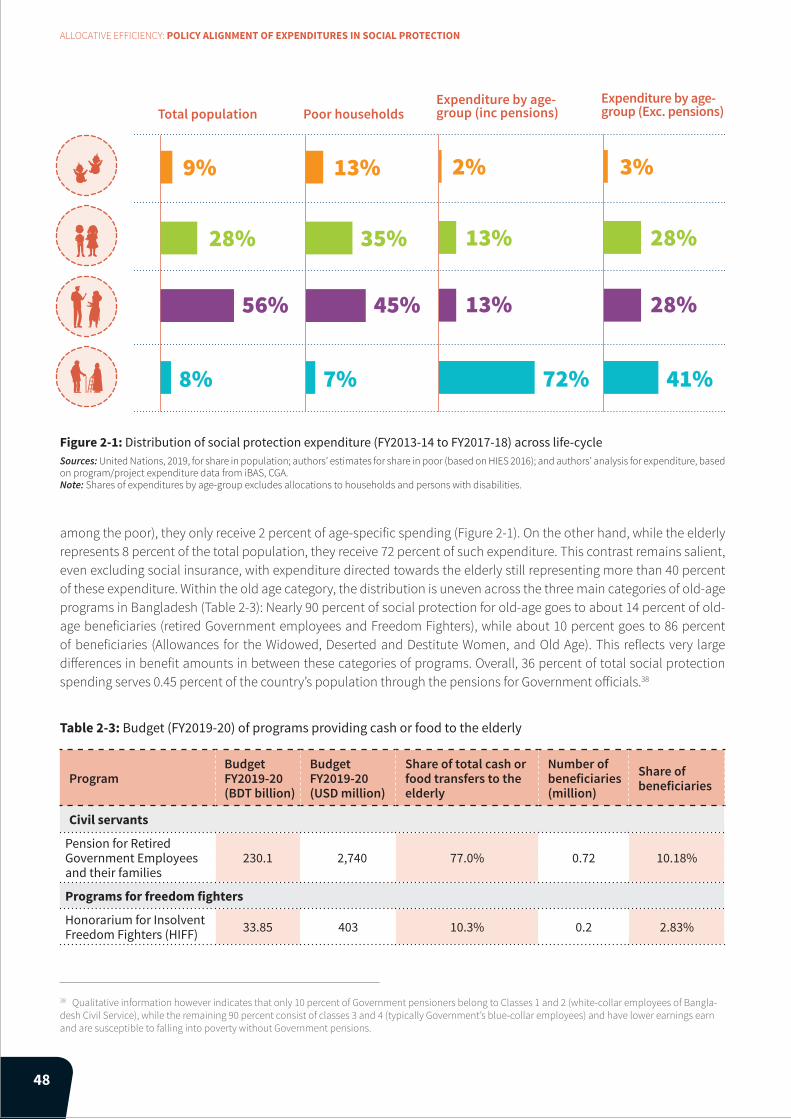
ProgramBudget FY2019-20 (BDT billion)
Budget FY2019-20 (USD million)
Share of total cash or food transfers to the elderly
Number of beneficiaries (million)
Share of beneficiaries
Civil servants
Pension for Retired Government Employees and their families
230.1 2,740 77.0% 0.72 10.18%
Programs for freedom fighters
Honorarium for Insolvent Freedom Fighters (HIFF) 33.85 403 10.3% 0.2 2.83%
among the poor), they only receive 2 percent of age-specific spending (Figure 2-1). On the other hand, while the elderly represents 8 percent of the total population, they receive 72 percent of such expenditure. This contrast remains salient, even excluding social insurance, with expenditure directed towards the elderly still representing more than 40 percent of these expenditure. Within the old age category, the distribution is uneven across the three main categories of old-age programs in Bangladesh (Table 2-3): Nearly 90 percent of social protection for old-age goes to about 14 percent of old-age beneficiaries (retired Government employees and Freedom Fighters), while about 10 percent goes to 86 percent of beneficiaries (Allowances for the Widowed, Deserted and Destitute Women, and Old Age). This reflects very large differences in benefit amounts in between these categories of programs. Overall, 36 percent of total social protection spending serves 0.45 percent of the country’s population through the pensions for Government officials.38
38 Qualitative information however indicates that only 10 percent of Government pensioners belong to Classes 1 and 2 (white-collar employees of Bangla-desh Civil Service), while the remaining 90 percent consist of classes 3 and 4 (typically Government’s blue-collar employees) and have lower earnings earn and are susceptible to falling into poverty without Government pensions.
Total population
9%
28%
56%
8%
Poor households
13%
35%
45%
7%
Expenditure by age-group (inc pensions)
2%
13%
13%
72%
Expenditure by age-group (Exc. pensions)
3%
28%
28%
41%
Figure 2-1: Distribution of social protection expenditure (FY2013-14 to FY2017-18) across life-cycle Sources: United Nations, 2019, for share in population; authors’ estimates for share in poor (based on HIES 2016); and authors’ analysis for expenditure, based on program/project expenditure data from iBAS, CGA. Note: Shares of expenditures by age-group excludes allocations to households and persons with disabilities.
Table 2-3: Budget (FY2019-20) of programs providing cash or food to the elderly
ALLOCATIVE EFFICIENCY: POLICY ALIGNMENT OF EXPENDITURES IN SOCIAL PROTECTION
48

32. As Bangladesh is slowly aging, the long-term sustainability of social protection hinges on the fiscal sustainability of programs for the elderly (Figure 2-2). Trends suggest a need for more sustainable options. The gradually ageing population, combined with changing social norms and household structure, call for a sound and sustainable system to address old-age poverty and vulnerability. Older women can be particularly vulnerable, because of unequal access to assets following traditional laws, prevailing gender roles, and social stigma towards widows. However, it is also essential that old-age support does not jeopardize investments in the working age and younger generations, who are essential to increased wealth and increased revenues (that in turn can finance public programs).
33. While they account for almost one in every eight poor persons in Bangladesh, only 1.6 percent of social protection expenditures are directed at young children. For the very young, this is particularly worrisome, especially as pregnancy and the first few years of life are so critical to cognitive development and later productivity.39 Also, despite improvements, stunting and malnutrition remains high among children and adolescents girls, resulting in inter-generational transmission of poverty, despite the demonstrated effectiveness of programs in this respect.40 This groups mostly benefit from MoWCA’s
Figure 2-2: Growing social protection expenditures on the older citizens Source: Authors’ estimates based on revised budget published by Finance Division, Ministry of Finance.Note: *Budget projection.
300
200
100
-2013-14 2014-15 2015-16 2016-17 2017-18 2018-19 2019-20*
Honorarium for Injured Freedom Fighters Construction of Probin Nibas in Five Division
Head Quarter & One Zila Ration for Shaheed Family and Injured
Freedom Fighters Allowances for the Widowed, Deserted and
Destitute Women Old Age Allowance Honorarium for Insolvent Freedom Fighters Pension for Retired Government Employees
and their Families
ProgramBudget FY2019-20 (BDT billion)
Budget FY2019-20 (USD million)
Share of total cash or food transfers to the elderly
Number of beneficiaries (million)
Share of beneficiaries
Ration for Shaheed Family and Injured Freedom Fighters
0.51 6 0.1% 0.03 0.42%
Honorarium for Injured Freedom Fighters 4.8 57 1.4% 0.02 0.28%
Social pensions for poor and vulnerable
OAA 26.4 314 8.2% 4.4 62.23%
WA 10.2 121 2.9% 1.7 24.05%
Total 305.86 3,642 100% 7.07 100%
Source: Authors’ estimates based on revised budget published by Finance Division (FD), Ministry of Finance (MoF). Number of beneficiaries from Finance Division and line ministries.
39 Returns to early childhood investments are amongst the largest for social programs: an additional dollar invested yields a return between 6 dollars and 17 dollars (see www.worldbank.org/en/topic/earlychildhooddevelopment). 40 World Bank, 2019b.
49BANGLADESH SOCIAL PROTECTION PUBLIC EXPENDITURE REVIEW

Allowances for Urban Lactating Mother (AULM) and Maternity Allowance Program for the Poor (MAPP), LGD’s Income Support Program for the Poorest (ISPP) – JAWTNO, and MoSW’s Child Protection and Child Welfare program. MAPP began in FY2007-08 and has expanded rapidly to become a large national program, focused on rural areas. MAPP is directed to women who are below a certain poverty level. AULM began in FY2010-11, focuses on urban areas. In addition to the criteria of the MAPP, AULM focuses on working women. JAWTNO began in FY2014-15 and is implemented across 43 Upazilas in Rangpur and Mymensingh Divisions. Its beneficiaries are pregnant women and mothers with children below the age of 5 years from the poorest households (see details of these major early child benefit programs in Annex 1-VII, VIII). While these programs are relatively large, their coverage remains limited, as discussed in Chapter 3. The importance of investments in this age group has been underlined in the NSSS, and is the object of concerted efforts to develop and adopt uniform principles of design for a comprehensive Child Benefit Program, which would be applied to existing mother and child benefit programs.
34. For children of school age, programming has reached higher coverage and effectively promoted significant changes. However, resources dedicated to education interventions as a share of total social protection expenditure declined to only 4 percent (BDT 25.27 billion) in FY2019-20 from more than 7 percent (BDT 12.19 billion) in FY2009-10 (Table 2-4). The challenge of primary school enrolment has been largely addressed in Bangladesh, with a combination of supply-side investments, quality enhancements, and programs to promote enrolment. The Government provides stipends to students at the primary (introduced in the early 1990s to improve school enrolment, especially for girls), secondary and tertiary levels. MoPME’s Primary School Stipend (which requires beneficiary children to attend 85 percent of classes and obtain 33 percent marks) is credited with some of the progress in recently years. Challenges remain around the transition to secondary school, as well as around the quality of learning. Stipends for secondary students, particularly those targeting students from poor or vulnerable households, could help increase enrolment among those which currently lag behind. However, retaining girls in secondary schools is particularly challenging in light of the prevalence of child marriage and the roles adolescent girls are expected to play at home, so programs tend to require stronger incentives. It will be therefore important to increasingly focus on the poor and vulnerable and avoid benefitting richer households, who least need the incentive (regressive distribution).
FY2009-10 FY2014-15 FY2019-20
Primary school level (as a share of total) 48% 58% 47%Primary Education Stipend Program (PESP) 5.75 9.40 7.22School Feeding Programme 0.07 3.96 4.75Secondary, higher secondary level, and youth (as a share of total) 39% 31% 38%Stipend and Access Increase for Secondary and Higher Secondary Level Students (including Proposed Secondary Education Stipend Project) 4.79 - -
Secondary Education Quality and Access Enhancement Project (SEQAEP) - 1.83 - Secondary Education Stipend - 2.18 1.05Higher Secondary Stipend - 1.48 0.03Female Stipend for Degree (Pass) and Equivalent Level Project - 0.04 - Secondary Education Sector Investment Program - 1.54 8.50Other children (as a share of total) 13% 11% 15%Stipend for Disabled Students 0.08 0.26 0.96Reaching Out of School Children - 1.46 1.56Stipend for Dropout Students 1.10 - - Capitation Grants for Orphan Students in Non-Government Orphanages 0.40 0.75 1.20Total 12.19 22.90 25.27
Source: Authors’ estimates based on budget and revised budget data, Finance Division; and expenditure data, CGA.
Table 2-4: Social protection expenditure on education interventions for selected years(All figures in BDT billion, except where share of total)
ALLOCATIVE EFFICIENCY: POLICY ALIGNMENT OF EXPENDITURES IN SOCIAL PROTECTION
50

35. Weak support for working age and youth could limit Bangladesh’ demographic dividend. Though increasing, the focus on the working age population remains limited, despite the NSSS call for greater emphasis on the “ladder approach”, which combines support and incentives to working age individuals to boost their capacity and climb out of their conditions of poverty or vulnerability. The working age (defined here as 20-59 years old) represent 56 percent of the total population, but only receive 13 percent of age-specific programs. For Bangladesh to take advantage of the demographic dividend during the period of reduced dependency ratio, it is essential for working age adults to be productively engaged and invest in their human, financial and physical capital.
36. Limited social protection expenditures dedicated to persons with disabilities (PWDs) can erode broader development gains at the household level. The country’s cost of disability is estimated at 1.74 percent of GDP41 while the share of the social protection expenditures dedicated to PWDs is only about 2 percent in FY2018-19 (up from less than 1 percent in FY2009-10). The largest intervention focused on PWDs, representing about 80 percent of all expenditure on PWDs, is the Allowance for the Financially Insolvent Disabled (DA) which is implemented by DSS, which has expanded rapidly since FY2014-15, reaching more than 1.5 million beneficiaries by FY2019-20. The remaining 20 percent of social protection expenditure are channeled through eleven smaller programs and projects, providing mostly care services and limited labor market interventions. More generally, programs can help households sustain gains, by cushioning increased responsibilities/expenses related to care for PWD.
37. Programs focused on households affected by shocks occupy a central part in Bangladesh’s system, but investments remain limited and mostly rural. Social protection is a key sector in addressing the impacts of disasters, representing about 39 percent of allocations in FY2019-20 as per Bangladesh Climate Change Strategy and Action Plan thematic categorization.42 However, actual expenditure on such social protection programs (13 in total as per the categorization of this paper) have increased, but they represent only 3 percent of total expenditure (Table 2-5).43 Data on allocations give a marginally different perspective, with a share between 3 and 4 percent of total budget). As a result, these programs register notable downward adjustments between initial budgets and actual expenditure (expenditure represented only 47-77 percent of budget between FY2013-14 and FY2017-18, see chapter 4 on financing for disasters). Programs focus on relief support (provide cash, food or in-kind transfers through programs such as Gratuitous Relief (GR), typically from the operating budget) or on reconstruction (e.g. the Infrastructure and livelihood Development or Flood Management, mostly from the development budget). Most programs have a rural focus, and are not prepared for shocks which impact urban households, such as the COVID-19 pandemic.
FY2013-14 FY2017-18 FY2018-19 FY2019-20
Budget Actual Budget Actual Budget Budget
Operating budget Fund for Assistance to the Small Farmer and Poultry Farms Social assistance 1.00 - 1.00 - 1.00 1.00
Gratuitous Relief (GR) (Food) Social assistance 2.65 1.70 4.89 3.71 5.41 5.44 General Relief Activities Social assistance 0.89 0.06 2.00 2.11 4.70 3.70 Block Allocation for Disaster Management Social assistance 1.00 - 2.16 - 2.91 2.43
Variety of Relief Work Social assistance - - - - - 0.81 Development budget Agriculture Rehabilitation Social assistance 0.62 0.62 1.00 0.98 1.20 1.20
Table 2-5: Social protection for households affected by shocks (BDT billion)
41 Ali, 2014. 42 Ministry of Finance, 2019. 43 The share of budget or expenditure for shock-responsive programs would almost double/triple if recovery supports such as EGPP, FFW or TR were includ-ed (They have been classified as addressing household poverty in this analysis, see Annex 1).
51BANGLADESH SOCIAL PROTECTION PUBLIC EXPENDITURE REVIEW

2.3 SOME OF THE FUNCTIONS IDENTIFIED IN THE NSSS ARE NOT CURRENTLY FULLY MET 38. Overall social protection expenditure has increased in recent years, fueled in part by social insurance. Labor market programs, social care services, and community development have remained low with little variation from year to year (Figure 2-3). Within their overall increasing trend, subsidies have fluctuated. As discussed, when covering old-age, social insurance occupies the lion’s share and has been increasing in absolute terms by over 35 percent each year between FY2013-14 and FY2015-16, before decreasing slightly in FY2017-18 and increasing significantly since then. In relative terms, the share of pensions increased from 30 percent up to 43 percent in FY2016-17, before decreasing to 37 percent in the budget of FY2019-20 (Figure 2-4). Social insurance actual expenditure are relatively close to budgets, compared to social assistance (Figure 2-5). As discussed in chapter 4, the increase and fluctuation are partly linked to recent reforms. When considering the number of beneficiaries, though, around 715,000 in FY2018-19, social insurance is the function that is most costly per beneficiary.
39. Social assistance is largely in place, with a relative increase in cash transfer programs. The total resources devote to social assistance increased by 18.5 percent every year between FY2013-14 and FY2017-18, reaching amounts at par with those dedicated to social insurance. Its share in total spending, however, has decreased over time (Figure 2-4). Within social assistance, the largest 10 programs in terms of their FY2019-20 budget include four cash transfer programs, two public works cash programs, two food-based programs, and two stipend programs (Table 2-6). OAA and WA are two major cash transfer programs aimed at providing support to the poor and vulnerable elderly and widowed women respectively, to improve their socio-economic wellbeing. DA is directed at persons with disabilities. These three programs are unconditional and administered by DSS under the MoSW (see details in Annex 1). EGPP, TR (cash based) and FFW (food based) are three major public workfare programs while VGF is a food support program, all administered by DDM under MoDMR. EGPP was introduced in response to the food, fuel, and financial crisis of 2007-08, and aims to create employment for the able-bodied, unemployed poor for 80 days per year during the seasonal lean period, to reduce poverty and enhance disaster resilience (see Annex 1). FFW, TR and VGF are among the oldest social assistance
FY2013-14 FY2017-18 FY2018-19 FY2019-20
Budget Actual Budget Actual Budget Budget
Housing Support Social Care Service 0.14 - 0.24 - 0.25 0.25 Infrastructure and livelihood Development in Haor Area
Community development - - 2.10 - 1.50 8.68
Flood Management and Livelihood Improvement Project in Haor Area
Community development - - - 1.60 4.10 5.52
Gucchagram (Climate Victims Rehabilitation Project)
Community development 0.60 - 2.32 4.18 1.52 1.65
Emergency 2007 Cyclone Recovery and Restoration
Community development - 2.84 3.39 0.01 - -
Reconstruction of Houses of SIDR affected landless people
Community development - - - - - -
Rehabilitation of AILA Affected Rural Infrastructure
Community development 0.35 0.35 - - - -
Total 7.25 5.57 19.1 12.59 22.59 30.68as share of total expenditure 2.86% 3.09% 3.52% 2.88% 3.52% 4.13%
Source: Authors’ estimates based on budget and revised budget data, Finance Division; and expenditure data, CGA.
ALLOCATIVE EFFICIENCY: POLICY ALIGNMENT OF EXPENDITURES IN SOCIAL PROTECTION
52

programs of Bangladesh. They began primarily as a response to the famine of 1974 with the objective of providing food to the severely food insecure poor. VGF provides food transfers during religious festivals. As cash payments became more prominent than food transfers, FFW has been complemented by Work for Money (WFM) since FY2013-14 (see details in Annex 1).
40. Actual expenditure on social assistance are systematically lower than initial budgets, and the share of cash-based programs is increasing. Actual expenditure are between 21 percent (in FY2017-18) and 33 percent (in FY2014-15) below initial budgets – more than the average discrepancy for the sector (Figure 2-5). Looking at the different types of social assistance programs – cash, food, stipends and mix – shows an evolution towards cash transfer programs, including public works which pay wages in cash. Cash represented less than half of total social assistance in FY2015-16 and increased to more than 60 percent by FY2018-19 (Figure 2-6). Stipends also expanded and represented 15 percent of total social assistance in FY2018-19 (up from 7 percent in FY2013-14). Conversely, the share of food-based programs decreased to 20 percent by FY2018-19, in ilne with the NSSS.
41. Despite recent increases, labor market interventions promoted in the NSSS to provide “ladders” remain very limited to date. Labor market interventions in Bangladesh exclusively involve active labor market programs (other countries also include labor market services and intermediation)44. Overall, while they have increased in absolute terms
700
600
500
400
300
200
100
0
FY14
Expe
nditu
re
BDT
billi
on
Expe
nditu
re
Expe
nditu
re
Expe
nditu
re
Expe
nditu
re
Revi
sed
Budg
et
FY15 FY16 FY17 FY18 FY19 FY20
Social insurance Social assistance Labor market program Social care service
Community development General subsidies Technical assistance
FY14
Expe
nditu
re
Shar
e to
tal e
xpen
ditu
res o
n so
cial
pro
tect
ion
Expe
nditu
re
Expe
nditu
re
Expe
nditu
re
Expe
nditu
re
Revi
sed
Budg
et
FY15 FY16 FY17 FY18 FY19 FY20
Social insurance Social assistance Labor market program Social care service
Community development General subsidies Technical assistance
Figure 2-3: Expenditures by broad categories of social protection Source: Authors’ estimates based on budget and revised budget data, Finance Division; and expenditure data, CGA.Note: Data using the 167 programs in Annex 3 that are not listed as marginal social protection.
Figure 2-4: Share of expenditure by categorySource: Authors’ estimates based on budget and revised budget data, Finance Division; and expenditure data, CGA.Note: Data using the 167 programs in Annex 3 that are not listed as marginal social protection.
30
42
13
38
42
11
38
40
8
43
34
9
36
35
11
41
39
10
37
39
11
12 6 12 10 10 5 8
44 In some countries, workfare programs are counted as labor market interventions, particularly when they provide training or learning on-the-job. Here, income support is the core objective, so they were part of social assistance.
53BANGLADESH SOCIAL PROTECTION PUBLIC EXPENDITURE REVIEW

over the years (doubling from BDT 23 billion (US$ 292 million) in 2013-14 to BDT 46 billion (US$ 559 million) in FY2017-18), these programs only represent between 8 and 13 percent of total social protection expenditure, depending on the year (Figure 2-4). And programs tend to be rather small – only 7 programs have budgets over BDT 2 billion (about US$ 24 million) in FY2019-20 (Table 2-7). Among the various types of labor market interventions, few programs focus on vocational or technical skills development, mostly in urban areas (Figure 2-7). Economic inclusion programs, that include income generating activity, training, in-kind support or, market linkage, are more numerous and dominate this category (65-80 percent of the total). However, apart from two large programs (including VGD which provides combination of food support and skills training, but has suffered challenges in terms of the livelihood component 45), these programs tend to be very small and short-lived (many financed from the development budget). Both economic inclusion and entrepreneurship/startup programs also tend to be more focused on rural areas. Building on the most
Figure 2-5: Social protection expenditure by categorySource: Authors’ estimates based on budget data, Finance Division; and expenditure data, CGA.Note: Data using the 167 programs in Annex 3 that are not listed as marginal social protection.
Program Nature Budget FY2019-20 (BDT Billion)
Budget FY2019-20 (USD million)
HIFF Regular cash transfer 33.85 399OAA Regular cash transfer 26.40 311DA Regular cash transfer 13.91 164WA Regular cash transfer 10.20 120EGPP Public works (cash) 16.50 195TR, Cash Public works (cash) 15.30 180VGF Food -based program 19.57 231FFW Public works (food) 12.04 142SEDP Stipend 10.00 118SESIP Stipend 8.50 100
Source: Safety Nets List, Finance Division, Ministry of Finance, FY2019-20.
Table 2-6: Largest 10 programs (FY2019-20 budget)
Social insurance Social Assistance Labor market program
FY16FY16FY16 FY15FY15FY15 FY14FY14FY14 FY17FY17FY17 FY18FY18FY18
Initial budgets Actual
expenditure
250
200
150
100
50
0
ALLOCATIVE EFFICIENCY: POLICY ALIGNMENT OF EXPENDITURES IN SOCIAL PROTECTION
45 Training only represented 2.7 percent of total costs of the program in FY2015-16.
54

Figure 2-6: Composition of expenditures on social assistance Source: Authors’ estimates based on budget and revised budget data, Finance Division; and expenditure data, CGA.
Revised budget
FY2018-19 (BDT billion)
Revised budget
FY2018-19 (USD million)
Budget FY2019-20
(BDT Billion)
BudgetFY2019-20
(USD million)
Technical/vocational skills development
National Service Ministry of Youth and Sports (MoYS) 6.70 79.77 6.82 80.4
Skills for Employment Investment Program (SEIP) FD 4.82 57.39 4.33 51.1
Skills and Employment Program MoE 0.48 5.72 3.72 43.9
Economic inclusionVGD MoWCA 16.85 200.6 16.99 200.4My House My Farm RDCD 10.51 125.1 11.44 134.9Entrepreneurship support / Startup incentivesMicro-Credit through PKSF FID 2.32 27.62 7.85 92.6Social Development Foundation (SDF) FID 4.25 50.6 2.35 27.7
Source: Authors’ categorization based on Safety Nets List, Finance Division, Ministry of Finance, FY2019-20.
Table 2-7: Largest labor market programs (with more than BDT 2 billion)
CashStipend
Public workfare (cash)Kind and / or food
Cash (one-off) FoodPublic workfare (food)
Expenditure
FY2013-14
Expenditure
FY2014-15
Expenditure
FY2015-16
Expenditure
FY2016-17
Expenditure
FY2017-18
Revised Budget
FY2018-19
Budget
FY2019-20
100%
90%
80%
70%
60%
50%
40%
30%
20%
10%
0%
55BANGLADESH SOCIAL PROTECTION PUBLIC EXPENDITURE REVIEW

RECOMMENDATIONS EMERGING FROM CHAPTER 2• Strengthen the categorization of social protection programs to better inform policies, resource allocation, reporting and
monitoring. It would be instrumental to revise and adopt the list and systematically classify all programs and projects (building on the list produced by FD) along policy-relevant typologies. These could be organized by life-cycle risks and functions of programs. In order to inform policies and budgeting, it is essential to use the selected typologies in the BACS and iBAS++ and other management information systems.
• Better align demography and expenditures. Allocate in line with the number of poor in different categories, or the role of the program in breaking the intergenerational transmission of poverty. Along the life cycle, (i) increase investments on pregnant mothers and early childhood to make good use of the window of opportunity of early years; (ii) enhance interventions to prevent secondary school drop-out for girls; (iii) increase programming for working age adults to promote graduation from poverty; and (iv) within old-age, put greater emphasis on social pensions for the poor/vulnerable.
• Set up mechanisms and financing for shock-responsive programs. Ensuring regular programs are flexible or responsive to shocks or scaling-up shock-specific programs in times of crisis is essential. A balanced financing strategy can help ensure timeliness in responding to shocks, like COVID-19 pandemic, in an efficient and cost-effective manner. Financing for disaster-response on the basis of weather forecasts and simulations can increase predictability in post-disaster spending, reduce the cost of financing by combining different instruments (mixing budget, insurance, contingency financing, lines of credit, etc.), and minimize inefficiencies due to underutilization of allocations.
• Increase the scale and scope of labor market interventions, including economic inclusion (or “ladder”) programs. Deploy a streamlined model that can be scaled-up to capitalize on the demographic dividend, both in rural and urban areas, with a focus on youth and women.
successful innovations which have been piloted in recent years, it seems timely to develop a national economic inclusion program with broad coverage – both in urban and rural areas – which can provide “ladders” to the poor and vulnerable on a large scale, as per the NSSS.
42. The focus on nets, rather than “ladders”, is also observed when focusing on the FD list of programs and associated classification. When programs are allocated into two categories: social protection and social empowerment (these categories have some subcategories namely: cash and food under social protection; and micro-credit under social empowerment), spending on “social protection” has been about five times as much as expenditure on “social empowerment”. However, in recent years, expenditures on the “social empowerment” function have been increasing, essentially through development projects.
Figure 2-7: Expenditure on Labor Market ProgramsSource: Authors’ categorization and estimates based on expenditure data, CGA.
2013-14 2014-15 2015-16 2016-17 2017-18
45
40
35
30
25
20
15
10
5
0
Technical/vocational skills development
Enterpreneurship support/startup incentivesEconomic inclusion
ALLOCATIVE EFFICIENCY: POLICY ALIGNMENT OF EXPENDITURES IN SOCIAL PROTECTION
56

57BANGLADESH SOCIAL PROTECTION PUBLIC EXPENDITURE REVIEW

PERFORMANCE OF PROGRAMS IN REACHING CORRECT BENEFICIARIES WITH ADEQUATE BENEFITS
Chapter 3
58
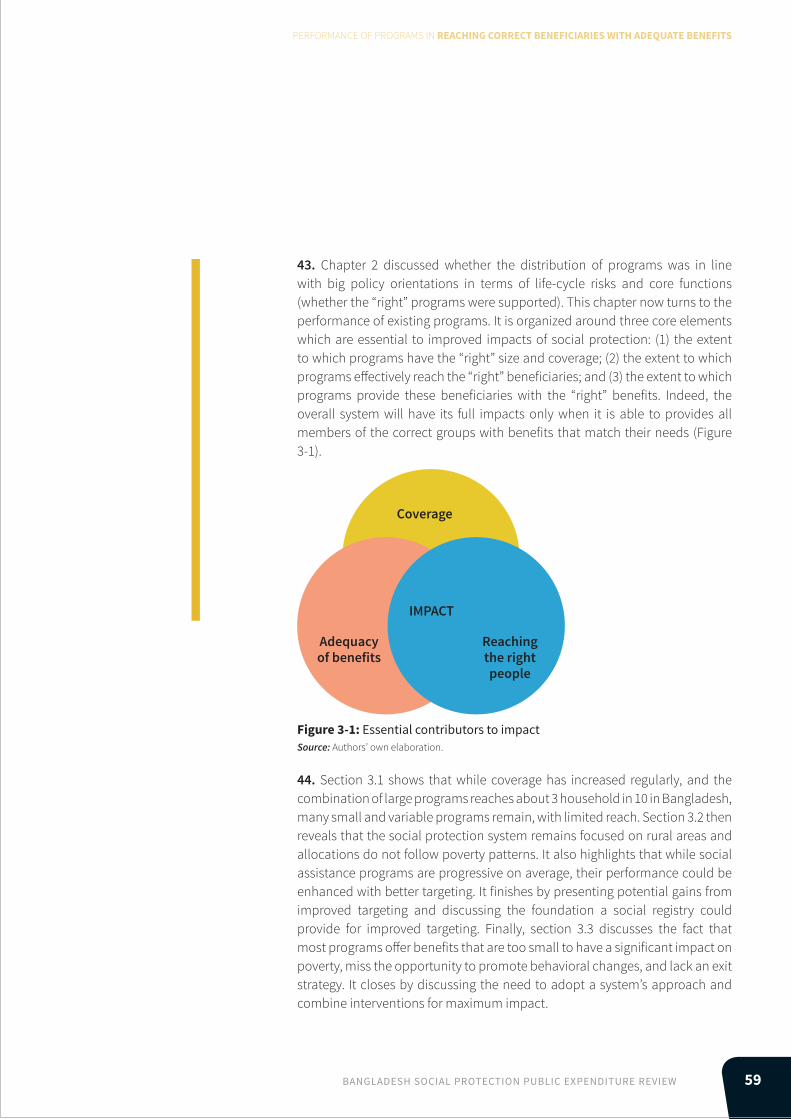
43. Chapter 2 discussed whether the distribution of programs was in line with big policy orientations in terms of life-cycle risks and core functions (whether the “right” programs were supported). This chapter now turns to the performance of existing programs. It is organized around three core elements which are essential to improved impacts of social protection: (1) the extent to which programs have the “right” size and coverage; (2) the extent to which programs effectively reach the “right” beneficiaries; and (3) the extent to which programs provide these beneficiaries with the “right” benefits. Indeed, the overall system will have its full impacts only when it is able to provides all members of the correct groups with benefits that match their needs (Figure 3-1).
PERFORMANCE OF PROGRAMS IN REACHING CORRECT BENEFICIARIES WITH ADEQUATE BENEFITS
44. Section 3.1 shows that while coverage has increased regularly, and the combination of large programs reaches about 3 household in 10 in Bangladesh, many small and variable programs remain, with limited reach. Section 3.2 then reveals that the social protection system remains focused on rural areas and allocations do not follow poverty patterns. It also highlights that while social assistance programs are progressive on average, their performance could be enhanced with better targeting. It finishes by presenting potential gains from improved targeting and discussing the foundation a social registry could provide for improved targeting. Finally, section 3.3 discusses the fact that most programs offer benefits that are too small to have a significant impact on poverty, miss the opportunity to promote behavioral changes, and lack an exit strategy. It closes by discussing the need to adopt a system’s approach and combine interventions for maximum impact.
Figure 3-1: Essential contributors to impactSource: Authors’ own elaboration.
Coverage
Adequacy of benefits
Reaching the right people
IMPACT
59BANGLADESH SOCIAL PROTECTION PUBLIC EXPENDITURE REVIEW

3.1 PROGRAM COVERAGE FOR SOCIAL ASSISTANCE HAS INCREASED SIGNIFICANTLY 45. Coverage expansion has been a priority over the past decades, with regular increases in the number of beneficiaries for key programs. In light of fiscal constraints, regular increases in social protection budget have almost always prioritized increase in coverage (over increases in benefit size or amounts). Over the past eight years, for instance, the OAA and WA increased its number of beneficiaries six times; while the number of beneficiaries from EGPP increased by 1.5 times (Figure 3-2). Only around 25 programs have 100,000 beneficiaries or more (see Table 3-1). These include pensions for government employees, MoLWA’s programs for freedom fighters, MoSW’s allowance programs, school feeding, key stipends, as well as MoDMR’s VGF and EGPP. Among these, the number of beneficiaries of a few programs might have already reached the size of their target population. For instance, EGPP and DA.
46. Programs reach about 3 in 10 households in Bangladesh, mostly through a few large programs. The share of households benefiting from a social assistance program more than doubled from 13 percent in 2005 to 25 percent in 2010. The trend thereafter continued, albeit at a slower pace, and by 2016 nearly 28 percent of households benefited46. Data for 2019, although not fully comparable, suggests around 34.6 percent of households benefit from some social protection program in rural areas, and 15.5 percent in urban areas.47 Program coverage data confirm the importance of a few large programs, including allowances or cash-based programs (OAA, WA and TR) as well as food-based programs (VGF, GR and SFP), and stipends.48 Estimates for 2016 suggest these programs each cover between 3 and 37 percent of the population (assuming one beneficiary per household, see Table 3-2). If these were perfectly targeted to the poor, many would cover all the poor (e.g VGD or PESP) and a few would reach 2/3 of the poor (VGF and GR). Others would still fall short of reaching all the poor. Estimates for 2019, presented by group of programs, show similarly that some of the
2.48
0.92 1.01 1.11 1.271.70
1.55
0.750.400.29
FY2012-13
Mill
ions
FY2011-12 FY2013-14 FY2014-15 FY2015-16 FY2016-17 FY2017-18 FY2018-19 FY2019-20
0.970.63
2.48 2.72
3.50 4.40
Allowance for Widow, Destitute and Deserted womenOld Age AllowanceAllowance for Financially Insolvent DisabledEmployment Generation Program for the Poorest
5.04.54.03.53.02.52.01.51.00.50.0
Figure 3-2: Number of beneficiaries of key programs over time. Source: Bangladesh national budget archives (budget speeches) and administrative data from MoSW and MoDMR.
46 B47 Sen, 2020, estimated from MICS. 48 Note that the HIES does not include all social protection programs (for instance, pensions for Government employees, programs for freedom fighters, public works, or subsidies are not included in the questionnaire).
PERFORMANCE OF PROGRAMS IN REACHING CORRECT BENEFICIARIES WITH ADEQUATE BENEFITS
60

programs would reach significant coverage of the poor if they were perfectly targeted, while others would still need to increase in terms of numbers of beneficiaries to do so (Note that the data are not comparable, as definitions differ, Figure 3-3).
47. Beyond these few programs, coverage is typically very small and variable. Low coverage and volatility are particularly a feature among labor market programs that focus on economic inclusion of the poor and vulnerable. While some of the smallest programs are in a “piloting” phase, which is essential to test new approaches and methodologies,
Program Agency Number of
beneficiaries (million)
Budget FY2019-20
(BDT billion)
Budget FY2019-20
(USD million)
Social insurancePension for Retired Government Employees and Their Families FD 0.72 230.10 2,713.76
Social assistance – cash 10.27 124.80 1,471.89 OAA MoSW 4.4 26.40 311.36 WA MoSW 1.7 13.91 163.99 DA MoSW 1.55 10.20 120.30 Honorarium for Injured Freedom Fighters MoLWA 0.02 7.78 91.77 HIFF MoLWA 0.20 7.63 90.02 AULM MoWCA 0.28 4.80 56.63 MAPP MoWCA 0.77 2.73 32.21 ISPP – JAWTNO LGD 0.28 33.85 399.23 EGPP MoDMR 0.97 16.50 194.60 Fund for Assistance to the Small Farmer and Poultry Farms FD 0.10 1.00 11.79
Social assistance – Food 11.3 24.32 286.83 SFP MoPME 2.5 4.75 56.02
Table 3-1: Large programs by broad categories
12.9
3.4
4.9
0.8
51.2
13.3
25.5
4.5
4.7
1.2
12.5
2.2
Allowance (old-age, widows, disability,
freedom fighters, shaheed families)
Share of population Share of poor*
Food support (VGD, VGF, TR, 100 days
programme)
Pensions for Government employees
and their families
0.0 0.0
Rural Area Urban Area
10.0 10.020.0 20.030.0 30.040.0 40.050.0 50.060.0 60.0
Figure 3-3: Coverage of key programs in rural and urban areas, 2019 Source: Estimates from Sen, 2020, using MICS 2019 data. Note: * Estimates of share of poor assume all benefits go to the poor (and show the maximum coverage of the poor programs could have with their current deployment).
61BANGLADESH SOCIAL PROTECTION PUBLIC EXPENDITURE REVIEW

many are simply operated on a very small scale. This contributes to the fragmentation of the sector (see chapter 4). It also means that there is a significant gap in coverage for this type of programs, despite the multiplicity of programs.
3.2 IMPROVED GEOGRAPHIC AND SOCIO-ECONOMIC TARGETING COULD BOOST IMPACTS 48. The overall impact of social protection programs depends on coverage (discussed in section 3.1), but also on the programs’ ability to reach the right households or individuals (the focus of this section) and the programs’ adequacy in terms of benefits and design (the focus of section 3.3). We saw earlier that by design, some demographic groups were less covered than others. This section will highlight that (i) the social protection system remains focused on rural areas and allocations do not follow poverty patterns, (ii) while social
Program Agency Number of
beneficiaries (million)
Budget FY2019-20
(BDT billion)
Budget FY2019-20
(USD million)
VGF MoDMR 8.8 19.57 230.81 Social assistance - Stipend 17.83 19.50 229.98 SESIP MoE 2.93 10.00 117.94 SESP MoE 1.20 1.05 12.38 PESP MoPME 13.00 7.22 85.15 Higher Secondary Stipend MoE 0.60 0.03 0.35 Capitation Grants for Orphan Students in Non-Government Orphanages MoSW 0.10 1.20 14.15
Labor market programs 27.95 15.56 183.51 Livelihood Development Programme For Hijra (Transgender) Community MoSW 0.01 0.6 7.08
Micro-Credit through PKSF FID 26.86 7.85 92.58 SDF FID 0.58 2.35 27.72 Strengthening Women’s Ability for Productive New Opportunities (SWAPNO) LGD 0.07 0.43 5.07
SEIP FD 0.43 4.33 51.07 Social care services 0.38 0.65 7.67 Service and Assistance Center for Disabled MoSW 0.38 0.65 7.67 Total 67.73 414.93 4,893.64
Source: Safety Nets List, Finance Division, FY2019-20, validated with administrative data from line ministries, as available.
As percentage of
Total population
Poor population
Cash-based OA 9.0 35.7WA 3.3 13.0TR 5.0 19.9Food-based VGF 16.1 64.3GR 17.9 71.2SFP 10.0 39.7VGD 34.2 136.2StipendsPESP 37.0 147.6
Stipend for Secondary/Higher Students 4.8 19.1
Source: Bangladesh Bureau of Statistics (2017b), Coverage as a percent-age of poor population simulates the coverage which would result from perfect targeting.
Table 3-2: Coverage of key programs, 2016
PERFORMANCE OF PROGRAMS IN REACHING CORRECT BENEFICIARIES WITH ADEQUATE BENEFITS
62

assistance programs are progressive on average, their performance could be enhanced with better targeting, and (iii) that potential gains from improved targeting are significant and a social registry could provide a strong foundation for improved targeting.
The social protection system remains focused on rural areas, and allocations do not follow poverty patterns
49. Almost half of total expenditure are focused on rural areas, and most of the rest has nation-wide coverage, leaving the country ill-equipped to face increased urbanization. Over the years, the share of program specifically targeted at urban areas actually went down, from 10 percent in FY2013-14 to 5.5 percent in FY2017-18 (Figure 3-4). Within urban-focused programs, general subsidies (mostly OMS) occupy the largest share, and fluctuate dramatically from year to year (from 93 percent in FY2010-11 to only 7.2 percent in FY2015-16) (Figure 3-5). The Pension for Retired Government Employees and their Families has higher coverage in urban areas – where it reaches 2.2 percent of the population (Figure 3-3). Labor market programs are only beginning to emerge in urban areas since FY2013-14. Within these, skills and employment programs (such as those of the MoE and FD) are mostly urban and largely absent from rural areas; while economic inclusion and entrepreneurship support programs tend to be more focused on rural areas.
Figure 3-4: Social Protection expenditures on rural vs. urban safety nets Source: Analysis based on data from CGA.
Figure 3-5: Expenditure in urban areas, by nature of social protection programsSource: Budget data, Finance Division.Note: Data for FY2009-10 to FY2012-13 and FY2018-19 are revised budget data while FY2013-14 to FY2017-18 are actual expenditure data.
Community Development
Rural Urban Rural & Urban
General SubsidyLabor Market ProgramsSocial Care Service
Social Assistance - StipendSocial Assistance - Cash
FY2009-10 FY2010-11 FY2011-12 FY2012-13 FY2013-14 FY2014-15 FY2015-16 FY2016-17 FY2017-18 FY2018-19
100%90%80%70%60%50%40%30%20%10%
0%
FY2013-14 FY2014-15 FY2015-16 FY2016-17 FY2017-18
100%90%80%70%60%50%40%30%20%10%
0%
63BANGLADESH SOCIAL PROTECTION PUBLIC EXPENDITURE REVIEW

50. While a rural focus partly reflects higher poverty in rural areas, urbanization calls for increased focus on urban programming and adaptations to the urban context. As mentioned earlier, the poverty rate in urban areas stood at around 18.9 in 2016, versus 26.4 in rural areas (most of recent gains in poverty took place in rural areas). Coverage reflects past focus on rural areas, with 35.7 percent of rural households benefitting from at least one program, versus 10.9 percent of urban households (see Figure 3-6). So, while coverage is higher than poverty rates in rural areas, the opposite is true in urban contexts; and coverage has been increasing in rural areas, despite decreasing poverty. In light of ongoing urbanization, the NSSS highlight the importance of intensifying efforts on expanding social protection. it might be relevant to rebalance some of the programs. A greater focus on urban areas also calls for different or adjusted programs. The features of urban poverty are significantly different from those of rural poverty, with consequences for design and implementation approach. Systemic challenges include the lack of permanent address of slum dwellers, the floating population, as well as more granularity in poverty proxies. Urban programming also will require concerted efforts and coordination of multiple agencies that work on various issues affecting the urban population. Typically, countries have adjusted programs when expanding into urban areas – in Mexico, the government adjusted the Prospera conditional cash transfer program to reflect different constraints (after observing that the rural model yielded low participation in urban contexts).49
51. An equitable system would also orient more resources towards poorer areas, to ensure equal coverage of the poorest. Ideally, coverage should follow poverty rates, with areas with higher poverty benefiting from a stronger coverage. On figure 3-7, all areas should be aligned, either on the 45” angle line, or on others which show proportional coverage. In practice, in 2016, regions in the blue oval were “over” covered (e.g. Barisal with a poverty incidence of 26.5 percent and coverage of 59.9 percent) while those in the red oval were “under” covered (e.g. Mymensingh, with poverty of 32.8 percent and coverage of only 27.7 percent). Re-balancing these, with programs allocating funds partly as a function of poverty prevalence, would help improve the efficiency and equity of the national social protection system. With the detailed poverty mapping available in Bangladesh, programs now have the information they need to adjust their allocation of resources to regions, districts, or even upazilas.50 Indeed, EGPP already takes into account differential poverty rates in their allocation process; more programs could be doing the same.
Figure 3-6: Social protection coverage in urban (left-hand panel) and rural (right-hand panel) areas Source: Sen, 2020, based on HIES 2010 and 2016.
49 Gentilini, 2015. 50 https://www.worldbank.org/en/data/interactive/2016/11/10/bangladesh-poverty-maps.
PERFORMANCE OF PROGRAMS IN REACHING CORRECT BENEFICIARIES WITH ADEQUATE BENEFITS
2010 201610.99.4
89.490.6
18.921.3
100%
80%
60%
40%
20%
0%
Percentage of urban households not covered by social protectionPercentage of urban households covered by social protectionPercentage of poor
2010 2016
35.730.1
65.569.9
35.2
100%
80%
60%
40%
20%
0%
Percentage of rural households not covered by social protectionPercentage of rural households covered by social protectionPercentage of poor
26.4
64

Social assistance programs are progressive, but their performance could be enhanced with better targeting
52. On average, social assistance programs are progressive – they benefit the poor more than the rich – but there is scope for improvement. (Note that this discussion only focuses on social assistance and does not include labor market programs or social insurance/pensions). On average, 13 percent of the benefits accrue to the bottom decile in rural areas, and a cumulative 36 percent to the bottom 30 percent (Figure 3-8). At the other end of the distribution, the
Figure 3-7: Coverage of main social assistance programs and poverty, by region Source: Sen, 2020, based on HIES 2016.
Figure 3-8: Coverage of main social assistance programs and poverty, by region Source: Sen, 2020, based on HIES 2016. Note: Programs include VGF, VGD, OAA, WA, GR, TR, and SFP.
13.0
1
18.2
11.0
2
13.4
10.9
3
13.3
10.6
4
13.9
10.3
5
10.1
9.5
6
9.5 10
.5
7
6.8
9.5
8
6.8 8.
3
9
4.9 6.
4
10
3.3
Rural Urban
Rangpur
Mymensingh
Chittagong
Poverty rate (%)
60
50
40
30
20
10
0100 20 30 40 50 60
Dhaka
Rajshahi
Sylhet
Soci
al p
rote
ctio
n co
vera
ge ra
te (%
) Khulna
Barisal
65BANGLADESH SOCIAL PROTECTION PUBLIC EXPENDITURE REVIEW

10 percent richest only receive 6.4 percent of benefits. Programs in urban areas are more focused on the poor, with 18.2 percent of benefits accruing to poorest 10 percent, and almost 45 percent to the poorest 30 percent (only about 3.3 percent to the richest decile). An analysis of household characteristics shows that programs benefit the educationally poorer categories (those not in secondary and higher education groups), female-headed households (SFP, OAA, VGF, WA, GR, TR), those with lower land and non-land asset ownership (except for PESP), and older age-cohorts (except education stipends by design).
53. Some programs outperform others in their ability to reach the poor and vulnerable. Food support and allowances appear to be the best performer, followed by maternity allowances both in rural and urban areas. A cumulative 40 percent (maternity allowances in rural areas) to 68 percent (both food support and allowances in urban areas) of benefits accrue to the bottom 30 percent (Figure 3-9a and 3-9b). Pensions are regressive, reaching households in higher deciles of wealth on average. Interestingly, targeting is more progressive in urban areas (but coverage is lower). These findings corroborate those from the HIES, which showed that the best performers were the school feeding program and VGF, both in urban and rural areas, as well as the primary stipends and TR in urban areas. VGD and GR in rural and urban areas were next in terms of performance. At the other extreme, stipends for secondary school in both rural and urban areas, rural TR, and urban OAA had the least progressive distribution.51
54. Both inclusion and exclusion errors need to be addressed to improve social protection’s impact on poverty. Another way of looking at the incidence of a program is to see how many of the poor are excluded (the exclusion error is the percentage of the poor who are “wrongly” excluded) and how many non-poor are included but should not (the inclusion error is the percentage of beneficiaries who should not benefit). According to HIES data, about 76 percent of those who benefit should not benefit (inclusion error, for the 7 programs for which data is available) in rural areas while only about 32 percent are “wrongly” included in urban areas.52 Estimations using MICS data for 2019 suggest inclusion errors of 51 percent for the allowance programs, 54 percent for food support programs, and 62 percent for maternity allowances in rural areas (49.2, 45.4 and 65.5 percent respectively in urban areas).53
Figure 3-9a: Share of programs received by each wealth decile, rural areasSource: Sen, 2020, using MICS.
Figure 3-9b: Share of programs received by each wealth decile, urban areasSource: Sen, 2020, using MICS.
51 Sen, 2020, using HIES 2016. 52 Analysis of VGF, Widows’ allowances, VGD, GR, TR, OAA, and SFP for 2016, as reported in Sen, 2020. 53 Using an asset index as a proxy for consumption and a poverty rate of 26.7 percent for rural areas and 19.3 percent in urban areas. Estimates reported in Sen, 2020.
PERFORMANCE OF PROGRAMS IN REACHING CORRECT BENEFICIARIES WITH ADEQUATE BENEFITS
I IVI VI
II IIVII VII
III IIIVIII VIII
IV IVIX IX
V VX X
Food support
Food support
Allowances AllowancesPensions PensionsMaternity Maternity
100%90%80%70%60%50%40%30%20%10%
0%
100%90%80%70%60%50%40%30%20%10%
0%
66

Improving on targeting could yield important impacts, and a central social registry can provide a solid foundation
55. While the programs are progressive, much could be gained by improving their focus on the poor and vulnerable. As mentioned earlier, the impacts of programs depend on their coverage (number of beneficiaries), but also on their ability to reach the poor and vulnerable and on the adequacy of their benefits (next section). In rural areas, assuming no increase in the budget allocated to programs, allocating all benefits which currently go to non-poor households to poor ones would close about 24 percent of the gap for allowances, but would more than close the gap for food support and maternity allowances. Similar shift of benefits from non-poor to poor households in urban areas would also close the gaps for the aforesaid three programs but less than that of rural areas, reflecting the stronger actual targeting accuracy observed in urban areas.54 Of course, not all programs focus narrowly on the poor, but these simulations give an order of magnitude for potential improvements.
56. Part of the issue is due to programs’ rules themselves, part to implementation issues. For instance, OAA’s guidelines stipulate demographic conditions (over 62 years of age for women and 65 for men) and economic criteria (annual per capita income under BDT 10,000 (about US$ 125) and land ownership below 0.1 acre). However, as reflected in Figure 3-10, while 68 percent of beneficiaries met the demographic criteria, only 12 percent met the economic criteria (20 percent did not meet any criteria). This could be partly due to difficulties in verifying these criteria (many elderly have no proof of age, income is hard to verify, and land ownership is not always observable). It could also suggest that the economic criteria have become obsolete, so that local committees implicitly use a higher threshold.55 Similar analysis for EGPP shows that a greater share meets the economic eligibility criteria, but fewer meet the demographic criteria (age 18-60). Anecdotal information on EGPP indicates that older men (and working age women) tend to work on the program as working age males commute further for better paid work. These findings highlight the importance of regular revision of eligibility criteria (to reflect evolving living conditions of the poor), of selecting criteria which be easily observed, and of adjusting programs as needed (e.g. to recognize that people over the age of 60 work in EGPP).
57. Beyond improving each program’s eligibility criteria, setting up a central instrument would increase efficiency. While each program defines its own specific criteria and thresholds, it is costly for each program to collect similar information on living conditions and household composition. Because the data used by most programs are relatively similar (even if cut-offs are different, or they use them in different combinations), it would be cost-effective to undertake the data collection at the same time for all programs. In the case of Bangladesh, it could give local committees a starting point for their lists, and/or provide a verification mechanism for locally-drafted lists. It would also
Figure 3-10: Share of beneficiaries who meet different eligibility criteria of OAA (left) and EGPP (right) Source: Author’s estimates based on HIES 2016.
54 Sen, 2020, using MICS data. 55 It could also reflect the fact that some elderly recently passed away, with some household reporting having no elderly, but having received OAA during the previous 12 months (when their elderly member was still alive).
67.8 47.3
38.4 14.2
11.6
20.6Percentage of beneficiaries who meet demographic eligibility only
Percentage of beneficiaries who meet both demographic and economic eligibility
Percentage of beneficiaries who do not meet any eligibility criteria
67BANGLADESH SOCIAL PROTECTION PUBLIC EXPENDITURE REVIEW

reduce the burden imposed on households during application processes. Many countries have opted to put together central registries (often called social registries), which collect and periodically update information on households (at least on the poor and vulnerable). Most compile demographic and socio-economic data (data on living conditions, income sources, assets, disability, etc.), in line with typically used criteria by programs to identify their beneficiaries. Indonesia’s Unified Data Base (UDB) and Turkey’s Integrated Social Assistance System (ISAS) include information on 40-50 percent of their population, while the Philippines’ Listahanan or Colombia’s System of Identification for Social Subsidies Beneficiaries (SISBEN) contain information on about 75 percent of their population, and Pakistan’s National Socio-Economic Register (NSER) and the Dominican Republic’s Sistema Unico de Beneficiarios (SIUBEN) cover about 85 percent of their population.56
58. Social registries can result in significant savings, but also make the process more transparent and contestable. Around the world, social registries have been used by many types of programs in the process of identification of their beneficiaries – from cash transfers to legal service, health insurance benefits, education and training, housing, emergency assistance, social services, and employment services (as illustrated in Figure 3-11). Typically, social registries support one of the steps followed to identify beneficiaries, and can be combined with other elements, such as community-based elements, as well as caseworker assessments, statistical profiling, medical assessments, or disability assessments.
Figure 3-11: Types of programs using social registries to identify their beneficiariesSource: Leite et. al., 2017.
56 See Leite et al., 2017, for an in-depth discussion.
PERFORMANCE OF PROGRAMS IN REACHING CORRECT BENEFICIARIES WITH ADEQUATE BENEFITS
INTEGRATED SOCIAL REGISTRY
Cash Transfer
Social pension & other
allowances
Labor & Employment
Social Services
Emergency Assistance
In-kind Programs
Housing Benefits
Energy & other
subsidies
Education & Training
Health Benefits
Productive Inclusion
Legal Services
Chile, China, Colombia, DR,
Djibouti, Georgia, Mali, Pakistan,
Philippines, Turkey, Senegal
Chile, Georgia
Brazil, Chile, China, DR, Georgia, Indonesia, Philippines, Turkey
Chile, China, Colombia, DR, Djibouti, Georgia, Mali, Pakistan, Philippines, Turkey, Senegal
Chile, China, Colombia, DR,
Djibouti, Georgia, Mali, Pakistan,
Philippines, Turkey, Senegal
Chile, China, DR, Djibouti, Georgia, Mexico, Pakistan, Philippines, Turkey, Sierra Leone
All Countries
Chile, Colombia, Georgia, Mauritius, Mexico, Philippines, Turkey
Chile, China, Colombia, Philippines, Sierra Leone
Brazil, Chile, Colombia, Georgia,
Mauritius, Mexico, Pakistan, Philippines,
Sierra Leone
Brazil, Chile, Georgia, Indonesia, Mexico, Pakistan, Philippines, TurkeyBrazil, Chile, China, Colombia, Djibouti,
Mauritius, Pakistan, Philippines, Turkey
68

In addition to savings, data validation and verification, oversight and controls, and interoperability can also boost information quality and accuracy. While setting up these registries is costly, they can yield savings when multiple programs use the data, effectively spreading the cost of data collection across programs. For instance, in Turkey, the ISAS registry’s initial setup cost was about US$ 13.1 million, but ensuing savings were estimated at US$ 39 million each year. 57
59. In Bangladesh, the NHD provides a unique opportunity to improve performance and impact. The NHD is an information platform, currently managed by the BBS, which compiles a set of indicators for all households in the country (approximately 35 million). The purpose of the NHD is to support government programs in assessing household needs and conditions, with a view to identify potential beneficiaries. In addition to demographic and socio-economic data, the NHD also estimates a measure of household poverty – called a Proxy Means Test (PMT), through a weighted score based on observable household characteristics (variables presented in Table 3-3).58
60. The NHD can provide programs lists of potentially eligible households, thereby reducing the burden on programs and households. Local program administrators (union and upazila committees) can ask the NHD to produce lists of eligible households on the basis of their own set of criteria (e.g. age in the case of OAA), and use that list in combination with other steps (including community-based decision making, as established in the NSSS), to identify and select its beneficiaries. This common instrument can thereby reduce the burden on programs (local officials), by avoiding redundant data collection activities and streamline the assessment of households’ poverty levels (Figure 3-12).
61. The success of the NHD hinges on speedy implementation and adoption of the database by the implementing agencies. The NHD is in the last stage of its development, since the data collection and digitization have been completed and the MIS is nearing completion. Data sharing agreements have already been signed with LGD and MoDMR. MoDMR is expected to use the NHD in the process of beneficiary identification for EGPP+ in Cox’s Bazar and for EGPP in an additional 15 Upazilas in FY2021-22. Subsequently, other social protection agencies, such as the DSS and LGD, are expected to use the NHD as part of their process of identification of new beneficiaries for their cash transfer programs.
57 Ministry of Family and Social Policy (Republic of Turkey), 2017a and 2017b. See full discussion in Leite et al., 2017. 58 The PMT score uses an algorithm that weights variables in terms of their relative importance to predict monthly per capita household consumption expenditure. It is updated with each new HIES.
Location Material of roofHousehold size Type of sanitation
Electricity connection Amount of land owned by all members of the householdHouse ownership Source of drinking waterNumber of rooms Engagement in agricultural or nonagricultural work
Separate dining room Ownership of durablesSeparate kitchen Receipt of remittances from abroadMaterial of walls Receipt of assistance from social safety nets
Note: The NHD also collected data on each household member’s age, gender, relationship with head, religion, marital status, education, occupation code, nationality and residence status.
Table 3-3: NHD variables used to estimate the PMT
Figure 3-12: NHD can harmonize beneficiary identification for social protection programsSource: Authors’ own elaboration.
National Household Database Enroll
Pay
Pay
Pay
Monito
rMon
itor
Monito
rEnroll
Enroll
Collect & asses poverty
Outre
ach
Appl
icatio
n
Asse
s ho
useh
old
pove
rty
1 1 1
Prog
ram
3Pr
ogra
m 2
Prog
ram
1
69BANGLADESH SOCIAL PROTECTION PUBLIC EXPENDITURE REVIEW

62. The systemic adoption of the NHD requires a political consensus, institutional anchoring and fiscal sustainability. Key challenges remain to realize the full potential of the NHD. First, there is a need to build consensus around the adoption of a common platform for assessing households’ needs and conditions. It is also critical to identify an institutional anchoring for the NHD that will be conducive to its regular utilization by programs from all relevant agencies. The NHD sustainability also calls for ensuring it is clearly included in the revenue budget as a regular unit within government (it is currently part of the GOB’s development budget and exists as a project). The use of the NHD by MoDMR and DSS is expected to contribute to its further adoption, by demonstrating the relevance of the instrument, its role in reducing inclusion and exclusion errors, as well as the efficiency gains emerging from its use.
63. Ensuring the NHD’s regular updating and establishing a protocol for updating will also be essential to its success. The proposed updating strategy would entail a multi-stake-holder operation, coordinated by BBS. This would consist of two main modalities: On-demand dynamic registration which will use union offices to implement in-person on-going registration (e.g. at the Union Digital Centers (UDC)). Union personnel will need to be trained in using the data-intake web module of the NHD. Every union would need to sign “terms of adhesion” to the NHD stipulating performance metrics and incentives; and Rotating/adaptive en-masse registration which make BBS responsible for implementing local sweeps according to rotational and adaptive criteria set by the NHD administrator.
3.3 GREATER ADEQUACY OF PROGRAMS – IN TERMS OF BENEFITS, INCENTIVES FOR BEHAVIOR CHANGES, AND COMBINATION OF INTERVENTIONS – WOULD IMPROVE THEIR IMPACTS 64. Having discussed programs’ coverage (section 3.1) and their ability to reach the right households (section 3.2), this section discusses the fact that most programs (i) offer benefits that are too small to have a significant impact on poverty, (ii) miss the opportunity to promote behavioral changes, and (iii) lack an exit strategy. It closes by (iv) discussing the need to adopt a system’s approach and combine interventions for maximum impact.
PERFORMANCE OF PROGRAMS IN REACHING CORRECT BENEFICIARIES WITH ADEQUATE BENEFITS
Figure 3-13: Increasing trend in benefit amounts in nominal termsSource: Bangladesh national budget archives (budget speeches), administrative data from MoSW and MoDMR, and inflation rates from World Bank.Notes: EGPP is a public workfare program and operates for 80 days in two phases per year. OAA, DA and WA are long-term cash transfers, which have monthly allowance amounts.
FY2008-09 FY2009-10 FY2010-11 FY2011-12 FY2012-13 FY2013-14 FY2014-15 FY2015-16 FY2016-17 FY2017-08
700
472
500500500
400
300
375372
300200200
175175150266
120100
250
250276
300 300 300 300
281 277 200 200 200
500
471
378
600
EGPP (daily) WA (monthly) DA (monthly) OAA (monthly)
70

Relatively small benefits limit the impacts of many programs
65. With a focus on increasing coverage, the benefits provided by many programs have stagnated or remain very low. For instance, the monthly amounts for the OAA and the WA were last raised in FY2016-17 by about BDT 100 respectively (Figure 3-13). In the meantime, the number of beneficiaries was increased three times. Similarly, the daily rate for the EGPP was last increased in FY2013-14, while the number of beneficiaries continued to rise during the period, before stabilizing in recent years. Overall, these tend to keep up with inflation except EGPP which is barely managing. The DA is an exception and has seen more frequent increases in its monthly allowance and therefore performing better than others in real terms (from about BDT 280 in FY2013-14 to BDT 663 in FY2017-18), alongside its expansion in coverage (reaching 100 percent of insolvent persons with disability in FY2019-20).59
66. Many programs provide benefits which are small compared to household incomes, and priority seems to have been given to increased coverage. Taking expenditure data to estimate the average benefit (by dividing expenditure by the number of beneficiaries) suggest that most benefits represent 1 to 3 percent of total household income for the poor or extreme poor, with the exception of TR, OAA and WA which represent 9.4 percent, 6.9 percent and 7.3 percent of the poor’s average income (Tables 3-4 and 3-5). Among poor households receiving any of the 7 listed programs, transfers are on average equivalent to 2.6 percent of total income of a poor. It is also true that, for many programs, it is difficult to estimate the value of monthly transfers, for lack of data on number of beneficiaries and/or benefit structure, suggesting a need for greater clarity. Priority seems to be given to increased coverage in recent years. For FY2020’s budget, the Coordination Committee on Safety Nets (see chapter 4) decided to make the coverage of two programs universal (DA and Programme for Improving the Livelihood of Trans Gender) and to expand the coverage of most other programs in the list of 15 programs (with the exception of EGPP, National Service, and VGD). As a result, overall, coverage across all 15 programs increased by almost 1.4 million beneficiaries. Increase in allowance amount however was limited to only two programs: HIFF and DSSd.
67. Low benefits limit the impact of many programs on poverty and vulnerability. Figure 3-14 shows the extreme poverty estimates among beneficiaries (in rural areas). It simulates pre and post-transfer poverty and shows variation
59 Department of Social Services, 2019.
Program Monthly transfer Note
ISPP-JAWTNO Between BDT 1,700 and 3,200 per month (BDT 20,400 to 38,400 per year)
The amount varies according to the age of the child, and compliance with co-responsibilities (health visits). The program runs from pregnancy till child turns 5.
EGPPBDT 200 daily wageBDT 4,000 monthly wage (max 4 months a year) (max BDT 16,000 per year)
The program offers work for 8 weeks (5 days per week, 40 days), twice a year (November-December and May-June).
VGF 10 to 20 kg of rice, twice a year Transfers twice a year, typically during religious festivals
OAA BDT 500 per month (BDT 6,000 per year)
WA BDT 500 per month (BDT 6,000 per year)
DA BDT 700 per month (BDT 8,400 per year)
AULM BDT 800 per month (BDT 9,600 per year) Duration of three years.
Source: Bangladesh national budget archives (budget speeches), administrative data from MoSW, MoDMR and MoWCA.Note: Nominal period average exchange (BDT/US$) in FY2019-20 is 84.79.
Table 3-4: Transfer size for selected programs
71BANGLADESH SOCIAL PROTECTION PUBLIC EXPENDITURE REVIEW

in the impact of programs: greater positive poverty reducing effects for WA, OAA, VGF, and TR; and more limited effects for SFP, VGD and GR. Overall, among beneficiaries of any of seven programs, programs are responsible for a decrease in the extreme poverty headcount from 22.2 percent to 19.8 percent (from 36.1 percent to 34.1 percent for the poverty headcount). If one could reallocate all transfers that went to beneficiaries in the top 80 percent of the distribution to current beneficiaries in the bottom 20 percent (first quintile), amounts received by bottom quintile beneficiaries would be multiplied by 4 (from BDT 185 per beneficiary per month to BDT 750) and extreme poverty among current beneficiaries would decrease from 22 percent to 4 percent (poverty would decrease from 36 percent to 12 percent), as described in figure 3-15.60
68. Turning to the nature of the benefit, many programs still provide benefits in kind (mostly food), despite the NSSS’ recommendation. The plan of converting food-based transfers to cash is progressing: the share of total expenditures going to food transfers declined (share of food went from 35 percent in FY2013-14 to 14 percent in FY2017-18, see figure 3-16); but absolute amounts are more constant. This slow conversion (discussed more at length in section 5.3)
Program Mean Transfer per Beneficiary per year (BDT)As a share of total income for different groups
All Rural Poor Extreme poorVGF 2,338 1.83 2.66 3.04WA 6,000 5.15 7.26 7.82VGD 993 0.74 1.07 1.26GR 832 0.61 0.99 1.09TR 7,293 4.58 9.37 10.89OAA 6,000 4.54 6.88 7.56SFP 1,543 1.09 1.78 2.05Any of the seven programs above 2,221 1.68 2.57 2.88
Source: estimates based on Budget data and HIES 2016, reported in Sen (2020).Note: Nominal period average exchange (BDT/US$) in FY2019-20 is 84.79.
Table 3-5: Mean transfer (proxied by unit cost from budget), as share of average income (rural areas)
60 Other simulations also suggest that increased amounts are essential for greater impacts on poverty. For instance, expanding OAA to all the vulnerable at current transfer level would reduce poverty by an additional 2.09 percentage point (and need an increase in budget by 115 percent), but using this same amount to increase transfers to all those living under the poverty line would yield an even stronger impact, reducing poverty by 5.33 percentage points. Similar results are found for the WA and education stipend (though to a lesser degree). Khondker and Jalal, 2019.
Figure 3-14: Poverty estimates among beneficiaries, pre and post transfers (rural areas)Source: estimates based on HIES by Sen (2020).
Figure 3-15: Impact of reallocating all transfers from top 80% to beneficiaries in bottom 20%Source: estimates based on HIES by Sen (2020).
PERFORMANCE OF PROGRAMS IN REACHING CORRECT BENEFICIARIES WITH ADEQUATE BENEFITS
Poverty after program
Low
er p
over
ty
line
Uppe
r pov
erty
lin
e
Current
0 10 20 30 40
Current
Mini big push
Mini big push
Poverty before program
19.8 2.3 22.2
22.217.8
34.2 2.0 36.2
36.224.411.7
4.3
0 105 2015 3025 4035
2.319.8
4.210.2
1.437.9
1.1
0.0
20.6 Poverty before program
Reduction in poverty2.121.9
19.1
7.316.7
7.518.4
Any of seven programs
SFP
TR
GR
VGD
VGF
OAA
WAPoverty after program
72

has important consequences for beneficiaries. Indeed, a recent in-depth study concludes that public works beneficiaries overwhelmingly prefer to receive their wages in cash rather than food, because of the fungibility of cash, as well as the poor resale value of food (and uncertainty on quality). It also appears that local government implementers also show overwhelming preference for cash, because it is easier to implement. However, some underline the importance of food-based programs in ensuring capacity for market intervention for stabilizing prices (food-based programs can also be warranted when markets fail).61
69. In terms of administrative costs, food-based programs tend to be more expensive, because of costs associated with storage, transportation, and delivery. A recent evaluation of alternative delivery mechanisms (under Transfer Modality Research Initiative project) in Bangladesh suggested that the food-based alternative had transfer costs 65 percent higher than the cash-based program.62 While these numbers are significantly higher than the administrative costs of Government programs, as per other national and international studies, administrative costs of food transfer programs typically are almost 2.5 times higher than those of cash transfer programs.63 Since the impact of cash alternatives was always the same or better than that of food transfers, cash was always more cost-effective than its food alternative.
Harnessing social protection program’s outreach to promote behavior changes would boost impacts
70. Most programs only provide cash, missing an opportunity to provide their beneficiaries with interventions that further awareness and knowledge or encourage improved practices64. Poverty and vulnerability are not only a deficit in material resources but also a context in which decisions are made. They impose a cognitive burden on individuals and generate a mental model that can dull the poor’s capacity to imagine a better life. Interventions that alter this mental model, so that people can recognize their potential, can improve outcomes such as school achievement and labor market participation65. Increasingly, policymakers around the world are applying such insights from behavioral science, to enrich their programs with activities that convey information and promote behavioral changes in order to better address challenges such as healthy eating, educational attainment, financial inclusion, or climate-smart investments. This can create lasting change, a key to development.
61 Rahman et al, 2019. 62 Ahmed et al., 2016. Costs were 29 percent for cash transfers, versus 48 percent for food. 63 Khondker and Jalal, 2019.64 With the notable exception of ISPP and MAPPLM. 65 World Bank, 2015.
Figure 3-16: Share of total social protection expenditure, by nature of benefit Source: Expenditure data from iBAS, CGA.
100%90%80%70%60%50%40%30%20%10%
0FY2013-14
Expenditure Revised budget
Budget
FY2014-15 FY2015-16 FY2016-17 FY2017-18 FY2018-19 FY2019-20
MicrocreditStrengthened systems
Food and kind
TrainingPackage
Kind
CashFoodService
73BANGLADESH SOCIAL PROTECTION PUBLIC EXPENDITURE REVIEW

71. Bangladesh has pioneered comprehensive programs to promote economic inclusion; and behavior change components have demonstrated their impact on early childhood. The approach, sometimes called “graduation”, provides comprehensive services to the poor and vulnerable to improve productivity, meet immediate need for support (to free them from day to day coping and allow them to focus on longer-term planning)66, and promote self-efficacy. These approaches, pioneered by NGOs, such as BRAC, have been adopted in many countries and could be adapted to some large-scale government programs. Similarly, behavior change components can boost programs’ impact on early childhood development. Global evidence shows that behavior change counseling can help strengthen women’s use of transfers for improved diets. Evidence from Bangladesh itself showed that, when added to cash or food transfers, behavioral change communication led to significant improvements on child nutrition (beyond those reached by transfers alone).67 Also, adequate support from children’s environment is crucial for developing their full potential (including verbal interaction and cognitive and socio-emotional stimulation early in life), in addition to adequate nutrition and healthcare.68 Programs that alleviate income constraints also need to address behaviors, in order to translate into impacts on children.
72. By design, social protection programs enable interaction with households, either through group activities that are part of the program or at the time of payment. These activities (such as information sessions, public works sites, counseling sessions, training, etc.) provide an opportunity to communicate directly with the target population. Programs can use multiple mechanisms to promote behavioral changes. In some contexts, programs make transfers conditional upon a certain behavior or action (such as Maternity Allowance or ISPP-JAWTNO). Other programs can use their delivery mechanisms to convey important messages and provide psychosocial support, in order to promote behavioral changes, without imposing hard conditionalities69. And programs can combine objectives in multiple dimensions. For instance, MoSW’s WA, may have beneficiaries with young children who would benefit from counseling related to health, nutrition and early childhood development; as well as work-able beneficiaries who would benefit from economic inclusion promotion (also the case for VGD). Or MoSW’s OAA beneficiaries may benefit from social gatherings to help reduce their stress and ward off anxiety and depression, and could be used as conduits to influence their younger household members.
Putting in place a “system’s approach” to combine interventions for maximum impact
73. Many programs in Bangladesh explicitly rule out those who already benefit from other programs. For 5 of the 11 largest programs (Table 3-6), the rules explicitly state that those who received benefits (or regular benefits) from other governmental programs (and NGOs for some) are ineligible. Even where programs do not explicitly prohibit cumulation, reports from the field suggest this is often used as a criteria when preparing lists of eligible households. For instance, only 1 percent of EGPP beneficiaries also received support from an NGO (though this is not a cause for ineligibility in the guidelines70). Similarly, only 3 percent of beneficiaries from the DSF-MHVS also received support from NGOs. Estimates from UNICEF (2019) show that 84 percent of all beneficiary households in rural areas only receive one benefit (88 percent in urban areas). The rest received at most two benefits (only 1 percent received 3, none received more than 3), and these typically involve combining maternity benefits or school stipends (directed at a specific household member, on a temporary basis) with programs that on the households’ structural poverty, such as food support, allowances or pensions.71
74. While limiting combination might be reasonable for some programs, it might be counterproductive in other cases. If programs play similar functions (and have similar duration/ benefits, preventing their combination limits duplication (ideally, such programs might be combined). However, it is less opportune when programs are
66 Fell and Hewstone, 2015. Repeated shocks and daily stresses faced by low-income persons also induce a short-term approach towards life, reinforcing a risk-averse mindset that is low in aspirations and confidence. 67 Ahmed et al, 2016. 68 World Bank, 2015. 69 Summary in Ozler, 2020. 70 Also for OAA, which explicitly cites regular receipt of NGO benefits as cause for ineligibility. World Bank, 2019c. 71 Estimates from Sen, 2020, on the basis of MICS data.
PERFORMANCE OF PROGRAMS IN REACHING CORRECT BENEFICIARIES WITH ADEQUATE BENEFITS
74

complementary. For instance, the Demand Side Financing – Maternal Health Voucher (DSF-MHVS) is in place to cover time-bound additional costs incurred for pre- and post-natal visits, and does not aim at providing sustained income support. Therefore, it does not substitute long-term support programs (e.g. WA or DA). Similarly, programs that address specific event (e.g. a disaster/seasonal shocks) and most NGO programs typically have a limited duration, and are complementary to longer-term support. At worst, systematically excluding those who benefit from any other program can have negative long-term impacts on their welfare and ability to exit poverty. For instance, a crisis such as the one resulting from COVID-19 has deeply affected both the poor and most vulnerable (including those who are currently on the payroll of regular poverty alleviation programs) as well as new population (‘new poor’) groups not currently covered. Excluding the former group from additional measures would fail to recognize that the crisis also affected them, and that they remain at the very bottom of the distribution even with the ongoing support.
Program Nature of programIneligible if receiving
Not mentionedbenefits from other
GoB programsregular benefits from other
GoB or NGO programsEGPP Seasonal public works XFFW Seasonal public works XTR Seasonal public works XOAA Cash transfer XWA Cash transfer XDA Cash transfer XMAPP Cash transfers XAULM Cash transfers XVGD Food transfers, training, and grant XVGF Food transfer XGR Food, cash and in-kind X
Source: Implementation guidelines of different programs.
Table 3-6: Rules around combining programs, as per operational manuals
75. More generally, global evidence shows how some interventions are complementary, and together can boost impacts. For instance, evidence points to the importance of maintaining income support, while implementing economic inclusion programs for the poorest, to alleviate the daily pressure and provide space for households to effectively invest in their productivity and diversification of activities. Similarly, stipends can be essential for apprenticeship programs to be successful, as they help ensure apprentices duly attend their on-the-job training. Another example comes from the labor market side, where childcare can be an essential part of programs that aim at boosting female skills or labor force participation. In Bangladesh, MoSW’s WA could put in place exit mechanisms for younger widows and provide them with additional support to improve their income generating capacity (older women would remain permanent beneficiaries and could be served by the OAA). In cognizance of this challenge, the NSSS indeed recommended the consolidation of VGD and WA to become Vulnerable Women’s Benefit Program and emphasize women’s economic inclusion through childcare and income generating activities.
76. A systems approach calls for exit strategies for some programs – something most lack to date. Most programs only experience change in their rosters of beneficiaries when these die or age out. For programs such as the OAA or disability programs, there might not be a need to exit beneficiaries; and for programs that focus on specific age groups (e.g. PESP or maternity allowances), beneficiaries will naturally ‘age’ out of the program.72 However, many programs should include an exit strategy to reflect changes in their beneficiaries’ conditions. Limited updates typically reflect both the lack of dynamic information on the nature of the poor’s vulnerabilities, as well as the limited capacity to regularly
72 MAPPLM and AULM have a maximum duration of three years, including the pregnancy period; the DSF-MHVS covers the period from pregnancy to child-birth; ISPP-Jawtno supports women from pregnancy till the child turns 5; and VGD is limited to eighteen months.
75BANGLADESH SOCIAL PROTECTION PUBLIC EXPENDITURE REVIEW

update rosters. Programs that focus on chronic conditions can put in place exit strategies in multiple ways: some programs enroll beneficiaries for a given period of time, and then proceed to re-assessing their conditions to decide whether to maintain them. Such recertification process can be conducted individually (when a beneficiary notifies the program of changes) or systematically (periodic reassessment of all beneficiaries). Many programs that focus on chronic poverty in middle-income countries conduct these every few years, to reflect the chronic/structural nature of their beneficiaries’ vulnerabilities. Some programs create a “transition” period, during which benefits are reduced prior to exit.73 Programs which aim at boosting beneficiaries’ capacity for earnings should also by nature have a defined timeframe (as is the case for VGD).
77. A vision for a comprehensive social protection system. Ultimately, once programs cover the different life-cycle risks and functions adequately, individuals and households would “navigate” the social protection system – enrolling (and leaving) in different programs over their lifetime, depending on their vulnerabilities and evolving situations. They would leave programs when conditions improved, confident that they can re-join should the situation worsens.
RECOMMENDATIONS EMERGING FROM CHAPTER 3• To increase impact on poverty, reform key programs by focusing on the size of benefits or on expansion, depending on the
program. For some programs, it is critical to revisit the amounts transferred to ensure they can have a meaningful impact on poverty (slowing the expansion of their coverage) and take into account the evolution of prices. For others, expanding coverage is the priority, especially for labor market programs where large gaps are observed. Finally, for programs to yield lasting behavioral changes, they can use insights from behavioral science to enrich their interventions with accompanying measures and better address core development challenges – around economic inclusion as well as child development, for instance.
• Rebalance geographic allocations between rural and urban areas, with programs tailored to urban poverty. BBS’s poverty maps can be used to allocate resources by region, districts, or even upazilas. This is already the case for EGPP, and for the OAA/WA expansion to the 112 poorest upazilas, as part of the Government’s COVID-19 response. Other large programs should consider using this tool. Since poverty patterns, vulnerabilities, and constraints are likely different, there is also a need to adapt existing programs (or tailor urban modalities), then scale up interventions to support growing poor urban population.
• Revise eligibility criteria to boost programs impacts and ensure greater focus on the poor. Many programs would benefit from revising their eligibility criteria, in particular economic eligibility criteria, to reflect changes in poverty patterns and overall increases in incomes and living costs. This could be done using some income or poverty proxy calculated on the basis of multiple variables in the NHD, or by adding indicators that reflect different facets of poverty, to reflect the heterogeneity of the poor and vulnerable (e.g. while land ownership or remittances are relevant in rural contexts, other assets such as a computer/connection might be useful in urban contexts). It is also critical to define criteria that can help identify households who are not poor in normal times, but are vulnerable to shocks, such as the COVID-19 crisis (e.g. self-employed or informal wage worker; or those with income just above the national poverty line). This would allow for their quick identification and support in times of shocks. More generally, each program should anchor its choice of criteria in the analysis of the objective and groups it aims to support.
• Use a social registry, such as the NHD, to improve targeting at a reduced cost for both programs and households. By merging the data collection process for multiple programs, a registry can reduce costs. Meanwhile, each program can draw from its information using its own criteria, as part of their beneficiary selection process. Also, as information on beneficiaries is digitalized, low-cost procedures can be put in place to cross-check registries with other administrative databases (e.g. verification of age and proof of life with the civil registration databases). The ability of the NHD to contribute to gains in efficiency and impact depends on its regular use by key programs; itself requiring an ‘easy to use’ operational data sharing protocol as well as the regular updating of the information in the database.
• Use a social registry, such as the NHD, to improve targeting at a reduced cost. By merging the data collection process for multiple programs, a registry can reduce costs, both for programs and for households. Meanwhile, each program can draw from the registry’s information using its own criteria, as part of their beneficiary selection process. Also, as information on beneficiaries is digitalized, low-cost procedures can be put in place to cross-check registries with other administrative databases (e.g. verification of age and proof of life with the civil registration databases). For NHD to contribute to gains in efficiency and impact, it has to be used regularly by key programs, which requires an ‘easy to use’ operational data sharing protocol as well as the regular updating of the information in the database.
PERFORMANCE OF PROGRAMS IN REACHING CORRECT BENEFICIARIES WITH ADEQUATE BENEFITS
73 In Mexico, the program transitioned its ‘graduates’ to a temporary scheme, gradually reducing transfers. In Chile, Chile Solidario provides psychological and social services, decreasing transfers, and preferential access to other social programs during 2 years, while social workers monitor progress. See World Bank, 2020c.
76

77BANGLADESH SOCIAL PROTECTION PUBLIC EXPENDITURE REVIEW

EFFICIENCY IN THE PROGRAMMING AND FINANCING OF SOCIAL PROTECTION
Chapter 4
78

78. Chapter 2 asked whether the important resources devoted by Bangladesh to social protection are allocated in a manner that focuses on the issues they are meant to address. After proposing two typologies, it pointed to options to improve alignment with the policy in terms of life-cycle risks and the function programs perform. Chapter 3 then focused on whether the programs themselves are designed to be impactful, that whether they are reaching the intended beneficiaries in a manner that’s adequate or commensurate with their needs.
79. This chapter turns to the question of how interventions are effectively programmed and financed. By looking at the processes used to prioritize, budget and finance programs, it can identify options to improve their efficiency to increase value for money. This chapter starts by looking at institutions and the programs they implement, highlighting the multiplicity of actors and fragmentation of the sector (Section 4.1). The chapter then turns to the budgeting process, both for operating and development budgets, to identify options to streamline the processes and make them more closely linked to policy (Section 4.2). Finally, the chapter closes with an analysis of how institutions effectively use their budgets to identify bottlenecks (section 4.3). The following chapter (chapter 5) will close by focusing on the delivery at the local level, once programs are financed.
4.1 MULTIPLE AGENCIES IMPLEMENT NUMEROUS INTERVENTIONS, AFFECTING COORDINATION AND EFFICIENCY 80. Social protection in Bangladesh is characterized by a large number of programs, partly driven by interventions under the development budget. A large portfolio demonstrates the Government’s commitment in social protection and small projects provide opportunities to pilot innovative approaches. However, the plethora of interventions also represents significant challenges in coordination and efficiency. Over the last decade, the number of interventions has grown significantly from 77 in FY2009-10 (revised budget), to 125 in FY2019-20 (budget) (see Figure 4-1, and a complete list of programs in Annex 2)74. Focusing on operating and development budgets separately reveals that the number of development projects has increased significantly – it nearly doubled from 38 in FY2009-10 to 87 in FY2014-15. A spike in FY2013-14
EFFICIENCY IN THE PROGRAMMING AND FINANCING OF SOCIAL PROTECTION
74 Considering programs and projects with non-zero budget allocations.
79BANGLADESH SOCIAL PROTECTION PUBLIC EXPENDITURE REVIEW

came in tandem with the fulfillment of the election pledge of the Government and included forty-five new interventions. The development budget-funded projects, however, represent a constant share of the total development budget (about 10 percent), and new projects typically represented less than 1 percent of the total social protection budget (Table 4-1). This suggests that limited resources are spread thinly over a large number of interventions. While this reflects the good practice of trying small scale projects before scaling them up, a large number of such projects becomes difficult to administer and the scalability of such models remains largely untested as they are rarely absorbed as long term programs, regardless of their performance as projects. On the operating-budget side, there are also a growing number of funds and foundations can also limit sectoral transparency and efficiency (these include SDF, National Shamaj Kalyan Parishad, Joyeeta Foundation, Skill Development and Earthquake Risk Management Fund, Fund for Climate Change, and two block allocations75).
EFFICIENCY IN THE PROGRAMMING AND FINANCING OF SOCIAL PROTECTION
75 Based on their objectives, some funds have social protection features. Others (including the Skill Development and Earthquake Risk Management Fund, Fund for Climate Change and Block Allocation for various Programs) are less focused on social protection, and have been excluded from the list of programs for the purpose of this analysis.
Figure 4-1: Growth of Social Protection in BangladeshSource: Revised Budget. Operating budget, See list of projects and budget source in Annex 2. Notes: The operating budget finances long-term, regular expenses of the Government, and its programs tend to become non-discretionary commitments. The development budget finances short-term projects with specific objectives, which tend to be discretionary and can begin/end following ad-hoc decisions by the Government. Some programs are financed by the operating budget (e.g. EGPP or OAA), but also receive support through development budget. For this analysis, they are categorized under the operating budget. More information on operating budget financed programs that received budget support from development funding in available in Table 4-3.
FY2014-15 FY2015-16 FY2016-17 FY2017-18 FY2018-19
Development expenditure in Social Protection (BDT billion) 85.21 103.37 94.62 172.07 155.63
Total RADP (BDT billion) 804.76 959.08 1,159.90 1,536.88 1,734.49 Development expenditure in social protection as % of RADP 11% 11% 8% 11% 9%
Ongoing development projects in social protection 48 55 49 48 45New development projects in social protection 10 5 2 7 6Total number of development projects in social protection 58 60 51 55 51
Source: PIM Concept Note, World Bank, 2019; List of social protection except those found to be non/marginal social protection by the analysis in this PER. Notes: The RADP is the Government’s total development budget for a year, consisting of the list of development projects to be financed. The difference between the number of ongoing development projects in a year and the total number of development projects in the previous year (ongoing and new) reveals the number of projects that ended or discontinued during the period. However, FD elaborates the list of social protection programs and projects manually, which can result in inadvertent omissions of ongoing projects.
Table 4-1: Development expenditures in Social Protection in Bangladesh
2009-10 2010-11 2011-12 2012-13 2013-14 2014-15 2015-16 2016-17 2017-18 2018-19 2019-20*
Num
ber o
f pro
gram
s/pr
ojec
ts
BDT
billi
on
160
140
120
100
80
60
40
20
0
600
500
400
300
200
100
0
Revised operating budget (BDT billion)Revised development budget (BDT billion)Number of development budget financed programsNumber of operating budget financed programs
80

81. Progress towards consolidation, as recommended in the NSSS, is slow. This would include consolidation along phases of the life-cycle, as well as the consolidations of large programs (for instance, consolidation of MoSW’s WA and MoWCA’s VGD programs into a Vulnerable Women’s Benefit, or consolidation of all public workfare programs implemented by MoDMR and LGD into a single program). Slow progress partly reflects the fact that some of the concerned programs have long been implemented by different ministries, which are likely to be reluctant to relinquish programs. Also, there is a lack of guidance on how these processes can be amalgamated and how responsibilities for the consolidated programs will be redistributed. It is also unclear how short-term programs currently financed from the development budget would be consolidated with longer-term programs financed from the operating budget (e.g. MoDMR and LGD’s public workfare programs).
82. Despite lack of consolidation, expenditure is in practice concentrated among few large interventions. The largest 31 programs (including pensions) account for more than 90 percent of actual expenditure, and the top 10 account for 70 percent of the total (Table 4-2). Most programs in table 4-2 (representing nearly 80 percent of social protection expenditures) are funded from the operating budget which implies some assurance of stability and continuity.76 These may also have large numbers of beneficiaries and have implementation guidelines and practices that have been used for years. Because of their relative size, focusing reforms to improve efficiency and effectiveness on these large programs would likely yield greater gains than working with very small programs (which might be politically hard to reform). Indeed, these large programs have been the focus of recent efforts around digitized administration through MISs and electronic payments.
83. Most funding is domestic, so development partners do not play a key role in the proliferation of programs. In FY2018-19, development partners financed only about 4 percent (approximately US$ 290 million77) of the total revised social protection budget. Such financing is often invested in system’s strengthening: supporting the monitoring and coordination of the NSSS; contributing to digitization, enhancement and interlinkages of MISs; supporting development of the G2P to enhance efficiency in payment systems, etc. Some funds also contribute to stand-alone development projects focused on testing pilots for human development, resilience, skills and livelihoods. Finally, sector wide approaches in health and education receive development partner financing for stipends, health care, etc. Projects and programs identified as containing contributions from development partners in FY2018-19 are listed in table 4-3.
84. Multiple agencies implement social protection, resulting in coordination challenges. The Government’s overarching planning and policy documents are cognizant of the challenges of engaging too many agencies and recommend a narrower focus. According to the AoB, only four agencies, currently implementing core programs,
76 Note however that some programs under the operating budget also receive development funding as operating budget inflows as results-based financing e.g. EGPP and OAA, supported by the World Bank.77 Authors’ estimates based on project documents, disbursement figures and TPPs/DPPs.
Program NameTotal (BDT
billion)
% of social protection spending
Source of budget Type Agency
1Pension for Retired Government Employees and Their Families
534.25 36.0% Operating 1. Social insurance - Pension MoF
2 HIFF 88.04 5.9% Operating 2.1 Social assistance - Cash MoLWA
3 OAA 77.17 5.2% Operating 2.1 Social assistance – Cash MoSW
4 FFP 62.16 4.2% Operating 6. General subsidies MoFd
Table 4-2: Actual expenditures by largest thirty social protection programs (FY2013-14 to FY2017-18)
81BANGLADESH SOCIAL PROTECTION PUBLIC EXPENDITURE REVIEW

EFFICIENCY IN THE PROGRAMMING AND FINANCING OF SOCIAL PROTECTION
Program NameTotal (BDT
billion)
% of social protection spending
Source of budget Type Agency
5 VGF 55.49 3.7% Operating 2.2 Social assistance – Food MoDMR
6 VGD 54.86 3.7% Operating 3.2 Labor market program - Economic inclusion MoWCA
7 OMS 46.93 3.2% Operating 6. General subsidies MoFd
8 PESP 42.18 2.8% Development 2.3 Social assistance – Stipend MoPME
9 EGPP 34.63 2.3% Operating 2.1 Social assistance - Public workfare (cash) MoDMR
10 My House My Farm 34.26 2.3% Development 3.2 Labor market program - Economic inclusion LGD
11 FFW 32.27 2.2% Operating 2.1 Social assistance - Public workfare (food) MoDME
12 Food Subsidy 31.54 2.1% Operating 6. General subsidies MoFd
13 WA 28.33 1.9% Operating 2.1 Social assistance – Cash MoSW
14 TR (Food) 26.65 1.8% Operating 2.1 Social assistance - Public workfare (food) MoDMR
15 SFP 22.90 1.5% Development 2.2 Social assistance – Food MoPME
16 DA 19.65 1.3% Operating 2.1 Social assistance – Cash MoSW
17 Ashrayan 16.61 1.1% Development 4. Social Care Service LGD
18 Food Assistance in CTG-Hill Tracts Area 14.20 1.0% Operating 2.2 Social assistance – Food MoFd
19 SESIP 13.55 0.9% Development 2.3 Social assistance – Stipend MoE
20 GR (Food) 13.25 0.9% Operating 2.2 Social assistance – Food MoDMR
21 SDF 12.11 0.8% Operating 3.3 Labor market program - Entrepreneurship support FID
22 National Service 10.73 0.7% Operating 3.1 Labor market program Technical/vocational skills MoYS
23 MAPP 10.53 0.7% Operating 2.1 Social assistance – Cash MoWCA
24Emergency 2007 Cyclone Recovery and Restoration
9.92 0.7% Development 5. Community development LGD
25 SEQAEP 9.84 0.7% Development 2.3 Social assistance – Stipend MoE
26 SESP 9.65 0.7% Development 2.3 Social assistance – Stipend MoE
27 ROSC 7.78 0.5% Development 2.3 Social assistance – Stipend MoPME
28 SEIP 6.87 0.5% Development 3.1 Labor market program Technical/vocational skills FD
29Gucchagram (Climate Victims Rehabilitation Project)
5.23 0.4% Development 5. Community development MoL
30Economic Empowerment of the Poor
4.52 0.3% Development 3.2 Labor market program - Economic inclusion RDCD
82

Program/projectRevised budget
FY2018-19 (BDT billion)
Revised budget FY2018-19
(USD million)
% of development partner
contribution
OAA 24.00 285.7 7%
EGPP 16.50 196.5 65%
Micro-credit through PKSF 2.32 27.6 81%
SDF 4.00 47.6 91%
SFP 5.18 61.7 17%
ROSC 2.28 27.1 100%
SESIP 8.10 96.4 3%
Child and Maternal Health and Health Management Development 0.07 0.8 24%
Maternal, Neonatal, Child and Adolescent Health 7.82 93.1
Essential Service Delivery and Community based Health Care 9.89 117.8
National Nutrition Services 0.89 10.6
Maternal, Child, Reproductive and Adolescent Health 2.06 24.5
Northern Area Reduction of Poverty Initiative 0.21 2.5 100%
SEIP 3.94 46.9 100%
ISPP - JAWTNO 0.82 9.8 99%
Skills for Employment and Productivity 0.15 1.8 100%
Social Security Policy Support (SSPS) Programme 0.09 1.1 100%
Strengthening Public Financial Management for Social Protection 0.19 2.3 100%
Skill and Employment Programme in Bangladesh 0.39 4.6 100%
Increase Productivity and Opportunity for Employment for Women (SWAPNO) 0.27 3.2 75%
Skill and Training Enhancement 4.56 54.3 83%
Urban Resilience Project 4.13 49.2 95%
Cash Transfer Modernization Project (CTM) 0.03 0.4 98% Source: Based on revised budget FY2018-19, Finance Division, TPPs, DPPs, and project documents. The table is not comprehensive, as it is based on piece-meal information as available.
Table 4-3: Social protection programs/projects with contributions from development partners
Program NameTotal (BDT
billion)
% of social protection spending
Source of budget Type Agency
31 AULM 4.25 0.3% Operating 2.1 Social assistance - Cash MoWCA
Total for 31 programs 1340.35 90.3%Source: iBAS, Controller General of Accounts.Note: Programs and projects were listed in descending order of actual expenditures of incurred during FY2013-14 to FY2017-18, except those categorized as non/marginal social protection by this analysis (see Annexes 2 and 3).
83BANGLADESH SOCIAL PROTECTION PUBLIC EXPENDITURE REVIEW

are responsible for social protection. The SFYP concludes that the involvement of too many ministries increases administrative costs and complicates the coordination of programs; and stipulates that only five ministries should be involved. The NSSS takes a more integrated view of social protection including health, education and infrastructure, thus assigning specialized responsibilities to a wider range of ministries, as per table 4-4. Such differences in these policy documents create scope for confusion and duplications.
Agency Allocation of Business SFYP NSSS
MoDMR X X X
MoSW X X XMoFd X XMoLWA X X XMoWCA X X XMoPME XMoE XLGD XMoHFW X
Source: Authors’ compilation.
Name of agency Expenditure (BDT billion)
Main budget source
FD 519.35 Operating
MoDMR 168.43 OperatingMoSW 140.38 OperatingMoFd 109.09 OperatingMoLWA 96.01 OperatingMoWCA 74.17 OperatingMoPME 72.86 DevelopmentMoE 45.51 DevelopmentRural Development & Cooperatives Division 43.43 Development
LGD 16.84 DevelopmentTotal 1,286.067 % of total social protection budget/expenditure during the period (excluding non-social protection)
94%
Source: iBAS, CGA & FD’s published lists of social safety nets, except those categorized as non/marginal social protection by this analysis.
Table 4-4: Ministries responsible for social protection in key policy documents
Table 4-5: Agencies with largest social protection expenditures (FY2013-14 to FY2017-18)
85. In practice, there is an even larger number of agencies implementing social protection. By nature, social protection cuts across multiple agencies. In addition, because of the frequent disasters, social protection in Bangladesh also includes agencies involved in risk management and relief. As of FY2019-20, twenty-three divisions and ministries are engaged in social protection. However, as for programs, much of the expenditure is concentrated among few agencies: over 90 percent of Government expenditures from FY2013-14 to FY2017-18 was through ten agencies as shown in table 4-5 below. Their expenditures on social protection in those five years amounted to BDT 1,349 billion (more than US$ 16 billion). Among these ten agencies, 6 are responsible for implementing the bulk of operating budget financed social protection programs: MoF, MoDMR, MoSW, MoFd, MoLWA and MoWCA. The other (MoPME, MoE, LGD and MoHFW) implement mostly development budget funded programs and projects (see Annex 4 for a complete list of agencies engaged in social protection)
86. The coordination of social protection remains complex, as it cuts across multiple agencies. The MoF, CD, PC and BBS have been assigned the responsibility of monitoring and strengthening systems in social protection. Within these, the GED (in PC) monitors, documents and evaluates the activities and progress on the NSSS. Based on GED’s findings, CD tries to coordinate programs and agencies. Data from periodic surveys conducted by BBS also contributes to the macro level monitoring of social protection. On the other hand, FD (in MoF) allocates resources, prepares the annual list of social protection programs, implements the G2P scheme, and maintains budget allocations to social protection as a percentage of GDP (according to the SFYP). Greater integration between the NSSS and the process of resource allocation could contribute towards improved implementation of the NSSS (see further discussing in section 4.2). Also, a central social registry, which would contain detailed information on households and be available for programs to identify their beneficiaries, would be an essential central tool for coordination (in addition to its role in promoting enhanced targeting, as discussed in chapter 3).
EFFICIENCY IN THE PROGRAMMING AND FINANCING OF SOCIAL PROTECTION
84

87. The Government also needs to play a stronger role in coordinating programs implemented by NGOs. Many NGOs and other actors are actively engaged in the delivery of social protection interventions in Bangladesh. Significant flows of fund are channeled through international NGOs, which work with local NGOs and community-based partner organizations. While this expands coverage it also contributes to fragmentation, potentially creating duplication and inefficiency. The Government has supervisory agencies like the NGO Affairs Bureau and a dedicated wing of DSS to regulate and monitor NGOs, but their scale is limited. The Government should take a leading role in coordinating international NGOs, local NGOs and development partners to maximize impacts, and ensure lessons can be imported into large nation-wide programs, as relevant.
4.2 A FRAGMENTED BUDGETING PROCESS SHOULD STRENGTHEN ITS LINKS TO POLICY
The budget elaboration processes are fragmented
88. In Bangladesh, budgeting is largely top-down and incremental, with limited flexibility. Bangladesh adopted MTBF in 2006, to improve the link between medium term planning and budgeting. It spans over three years on a rolling basis and was implemented across all ministries by 2011, though consultations with some agencies suggest that the transition is still ongoing, as capacity for forward estimates increases. Budget preparation is supported by the iBAS++ which is a “home-grown” integrated financial information system administered by the FD.
89. The budget process starts with the updating of the MTMF and the estimation of the overall resource envelop (Figure 4-2). The MTMF provides estimates of the aggregate resources that will be available over the following three budget years, and is updated at least twice a year. Discussions focus on strategic priorities and choices that should inform the inter-sectoral allocation of resources, as well as revenue collection/administration. Based on the approved MTMF, preliminary indicative budget ceilings are determined for line ministries and communicated through Budget Call Circular (BC) 1. This preliminary ceiling is intended to provide an indication of the resource constraint within which, each line ministry can prioritize its intra-sectoral spending proposals in line with strategic objectives.
90. Within social protection line ministries, budget preparation draws from inputs from departments, but ceilings largely determine allocations. Some ministries perceive limitations on fiscal space as a key constraint to bottom-up budgeting. Indeed, limited fiscal space means most programs are not able to reach all their intended target population and bottom-up budgeting would result in unrealistically large demands. In each ministry, the Budget Management Wing (BMW) prepares the MBF with inputs from the Planning Wing and its departments. Each department (or division/institutions) prepares operating and development budgets based on planned activities, informed by the National FYP and sectoral plans. The Departmental Budget Management Committees (BMCs) approve estimates, proposals, procurement plans, and targets and recommends new programs and projects. The BMW then scrutinizes new program/project proposals from agencies in its jurisdiction. The Budget Working Group (BWG) submits the resource distribution proposal, aligned with the draft MBF, to the BMC. The BMC scrutinizes the MBF, redistributes resources across priorities as required, and submits it to FD.
91. After the tri-partite meetings between FD, PC and line ministries and the meeting of the Cabinet Committee on Safety Nets (see below), FD issues BC 2. The BC 2 contains final ceilings, divided into development and operating categories, inviting detailed budget estimates from line ministries. FD in collaboration with the PC consolidates the final MBFs and places the national budget before the Cabinet and the Parliament for approval.
92. Despite the move towards integrated budgeting, a dual system still prevails, with separate processes for operating and development budgets. Though very carefully led by the FD, the dual budgeting approach entails different preparation processes and timelines and separate responsible agencies, although there is significant collaboration in
85BANGLADESH SOCIAL PROTECTION PUBLIC EXPENDITURE REVIEW

Figure 4-2: National Budgeting Process in BangladeshSource: Author’s elaboration based on Ministry of Finance.
Strategic phase: Estimating the resource envelop
Preparation phase: Finalizing the budget
Approval phase
Medium-term Macroeconomic Framework (MTMF) updated and indicative ceiling determined
BC 2 issued with final resource ceiling
Consolidated budget submitted to the Cabinet and Parliament
MBF scrutinized
Tripartite meeting
Budget Circular (BC) 1 issued by FD
Ministry Budget Framework (MBF) prepared in response to BC 1 and ministry’s strategic objectives/priorities and submitted to FD and PC
MBF updated with final resource celling in BC 2, addressing tri-partitie meeting outcomes
Estimation of operating budget
Finalization of operating budget
Estimation of development budget
Finalization of the development budget
Clearance from Planning Commission (PC) on strategic alignment and expected ependiture of each project
Clearance from PC
Clearance from Economic Relations Division (ERD) on foreign sources of development financing
October
October
Junefirst week
February/ March
March/ April
November/ Deember
January
April/May
Coordination Council; Chaired by Minister of Finance
BMRC
FD
FD and PC
FD, PC and line ministries
Budget Management & Reforms Committee (BMRC); chaired by Miniter of Finance
Line ministry: Budget Management:
Committee (BMC) chaired by Secretary of line ministry & Budget Working Group (BWG) chaired by
Joint Secretary of line ministry
Line ministry: BMC & BWG
EFFICIENCY IN THE PROGRAMMING AND FINANCING OF SOCIAL PROTECTION
86

the preparation of the final budget. The FD, MoF is the agency with the overall responsibility of budget preparation and is directly in charge of preparing the operating and development budgets with inputs from the line ministries. The PC on the other hand is responsible for preparing the ADP which essentially lists out all development projects, added to other expenditure by Finance Division to arrive at the total development budget (Figure 4-3).78 The dual process can weaken the strategic alignment, create unduly burdens on line ministries, and more generally create inefficiencies.
93. The ADP consists of about 1,000 development projects, including newly approved ones. For each new development project, the line ministry is expected to prepare a TPP or DPP, including a detailed cost breakdown and procurement plan. Throughout the year, the ECNEC approves new projects following appraisal of the TPPs and DPPs by
Figure 4-3: Development project approval process affecting development budget preparationNote: (1) For each new development project, a line ministry needs to prepare a TPP or DPP based on the nature of the project. This document contains detailed cost breakdown of the project, procurement plan and some narrative information, and is used by the PC to appraise the project, and by Executive Committee of the National Economic Council (ECNEC) to approve the Project. (2) ECNEC is headed by the Prime Minister to review and approve development projects above a certain threshold; if a project is below that threshold, the Minister of Planning or Minister of the line ministry is authorized to approve.
Department/line ministry conceives project
Department/line ministry’s planning Wing develops TPP/DPP
Line ministry approves TPP/DPP followed by inter-ministerial meeting
TPP/DPP is sent to the relevant Sector Division of the PC for appraisal (the process may entail several rounds of revisions to the TPP/DPP (see note)
Following Project Evaluation Committee meeting, TPP is sent for Minister’s approval (line ministry or Planning, depending on threshold)/DPP is sent for ECNEC approval.
The Programming Division of the Planning Commission prepares the ADP for the new financial year.
Clearance from ERD if the
project includes foreign financing
Clearance from FD on the salaries of civil servants to
be deployed to the project
78 Capital Expenditure = Non-ADP FFW and Transfer + Non-ADP Special Programme + Scheme (Previous Development Programmes financed from Capital Expenditure) + ADP.
87BANGLADESH SOCIAL PROTECTION PUBLIC EXPENDITURE REVIEW

the PC. Since projects are approved throughout the year, this process remains outside of the budget cycle and does not take availability of resources into account.79 This process can lead to spreading resources thinly (affecting the funding and quality of existing projects), and can negatively affect overall strategic alignment. In addition, while the TPP and DPP include multi-year budget estimates, the ADP is prepared on an annual basis (there are plans to transform it into a three-year program, in line with the overarching MTBF).80
94. The multiplicity of processes also puts heavy demands on line ministries. Ministries are expected to provide multiple documents during budget preparation, imposing a toll on capacity. In addition to responding to the BCs’ request for updated MBFs and associated performance indicators, ministries need to provide regular updates to the Annual Performance Agreements monitored by the CD. This leads to significant workloads for ministries, FD and PC. They can also weaken the link between budgets and ministerial policies and priorities.
The dual budgeting process weakens the strategic alignment and creates inefficiencies
95. The first time a line ministry is able to present and justify its demands for resources is at the tri-partite meeting with the FD and PC. While some adjustments in ceilings may emerge in favor of ministries from the tri-partite meetings, for major safety nets, the final, binding resource allocation decisions materialize from the Cabinet Committee on the Overall Supervision of Social Protection81 that was formed in 2014 and has since been supported by MoSW for coordination. This Committee is chaired by the MoF and its members are the Ministers of Local Government, Rural Development & Cooperatives, Liberation War Affairs, Social Welfare, and State Ministers of Social Welfare and Women and Children Affairs. The Committee is mandated to review the annual performance and make decisions on the budget allocation of each program listed in table 4-6; the number of programs under the Committee’s purview was ten in 2014 but expanded to fifteen in subsequent years.
96. The Cabinet Committee on the Overall Supervision of Social Protection is expected to meet every three months. The most important meeting however takes place towards the end of April every year when it decides upon to budget allocation for each of the fifteen programs implemented by the MoSW, MoDMR, MoFd, MoWCA and MoYS. Budget allocations are decided mostly on the basis of beneficiary coverage and benefit amounts.
97. The list of social protection programs included in the purview of this Committee represented over 40 percent of the total revised budget for social protection in FY2018-19, excluding Government pensions and those found to be without social protection features (non/marginal social protection). From among the largest twenty social protection programs except Government pensions, the aforementioned list consists of seven. The remaining eight in this list are programs that cover different segments of the population including gypsies, marginalized communities as well as the youth. Other large, important programs that are safety nets but not part in this Committee’s purview include: VGF, OMS, PESP, One House One Farm, FFW, Food Subsidy among others.
98. The intervention of this high-level Committee plays a very important role in the budget allocation of major safety nets. Its decisions are the concluding inputs to finalize the social protection budget for the Parliament (as mentioned earlier, focus has often been on coverage rather than amounts/content). Because of its potential central role in aligning spending with policy priorities, the committee could both broaden its coverage and deepen its consideration of data on impacts, coverage and adequacy to make evidence-based budget allocation. The Committee can also consider meeting earlier in the year, to make more effective contributions to the budgeting process of social protection.
79 Nadoll, 2015. 80 The MTBF is a three-year rolling plan, which includes operating and development budgets. The ADP (for the development budget) maintains a one-year cycle, making it complex to incorporate into the MTBF. A three-year rolling ADP would help reconcile the processes. 81 Cabinet Division (https://bit.ly/2lQXl06).
EFFICIENCY IN THE PROGRAMMING AND FINANCING OF SOCIAL PROTECTION
88

4.3 BUDGET UTILIZATION AND MONITORING 99. Budget utilization rate for social protection (excluding Government pensions) has been improving in recent years, but remains below 80 percent of the revised budget (Figure 4-4). There is some heterogeneity among programs: larger programs tend to have higher utilization rates, due to their regularity (unlike disaster-response programs for instance, which by nature are variable). Using the total budget utilization figures during FY2013-14 to FY2017-18, these include MoSW’s allowance programs at 97 percent, MoWCA’s maternity allowance programs at 92 percent and MoLWA’s programs for freedom fighters at 90 percent. What help these programs utilize their budgets to the fullest, is that there are little or no change in beneficiaries over time and/or the unconditional nature of payments. Most of MoSW’s programs’ beneficiary lists are relatively stable throughout the year, except for deaths of beneficiaries and additions of new beneficiaries which usually represent less than 10 percent of the total transfers. The number of beneficiaries of the maternity allowance programs are also relatively constant.
100. However, utilization rates of almost 100 percent every year may also indicate weaknesses in financial reporting and/or capacity constraints at the local level. A fund flow analysis carried out for this report revealed that quarterly statements of the child accounts maintained at upazila level to pay out OAAs were almost never zero. This is linked to the fact that while around 10 percent of beneficiaries die each year, new beneficiaries are only added once a year.82 In addition,
Program name Implementing agency
% of total social protection expenditure
(excluding pensions and non-social protection)
FY2018-19
Stage of life cycle/ vulnerability addressed
1 HIFF MoLWA 9.41% Insolvent elderlies
2 OAA MoSW 7.54% Elderlies
3 VGD MoWCA 5.20% Vulnerable working age women
4 EGPP MoDMR 5.18% Working age, poor men and women
5 WA MoSW 2.64% Elderlies/vulnerable women
6 DA MoSW 2.64% Persons with special needs
7 MAPP MoWCA 2.18% Children and mothers of young children (rural)
8 National Service MoYS 2.10% Youth
9 FFP MoFd 2.00% Extreme poor
10 AULM MoWCA 0.78% Children and mothers of young children (urban)
11 DSSd MoSW 0.25% Students with special needs
12 Assistance for Cancer, Kidney, Liver Cirrhosis and other Patients MoSW 0.24% Insolvent patients
13 Programme for Improving the Livelihood of Bede & disadvantaged community MoSW 0.16% Insolvent gypsies and
disadvantaged communities
14 Programme for Livelihood Improvement of tea-garden laborers MoSW 0.06% Marginalized communities
15 Programme for Improving the Livelihood of Trans Gender MoSW 0.04% Insolvent transgender
community
Total 40.43%Source: Authors’ estimates based on list of programs, CD and Safety Net Budget, FD.
Table 4-6: Social protection programs in the purview of the Cabinet Committee on Safety Nets
82 World Bank, 2019c.
89BANGLADESH SOCIAL PROTECTION PUBLIC EXPENDITURE REVIEW

limited capacity at the local level can result in up to 10 months between enrolment and first transfers. Because budgets are estimated at the beginning of the fiscal year (or from the death of the beneficiary to be replaced), unpaid allowances for the period until the first payment accumulate in child accounts, but are reported as executed. Similarly, budget utilization for EGPP is reported to be almost full. However, in practice, since payments are conditional upon daily attendance at work, there can be some under spending. Across a small sample of upazilas, during the second half of FY2017-18, 3.1 percent of wage allocations, 8.7 percent of non-wage allocations and 31.4 percent of labor leader allocations were not utilized. Both these illustrate scope for improvements in financial reporting, the need for reconciliation at the local level, and issues of local level capacity (see Chapter 5).
101. Other programs have more variable budget utilization, particularly those focused on disaster response and food transfers, and require a dedicated financing strategy. Varying intensities of disasters mean that programs such as GR or VGF, have hard-to-predict budget utilization. Similarly, the scale of food-based programs like OMS, FFP or FFW can depend on food stock availability and need for market stabilization which varies year to year. If such considerations emerge early enough in the budget process, then resources can be reallocated to programs that have higher absorption capacity or to those which need to be scaled up (such as labor markets). It is also essential to strengthen the financing strategy for responses to shocks: Budget should be done on the basis of weather forecasts and simulations (using historical data and/or probabilistic models), in order to increase predictability in post-disaster spending, and minimize inefficiencies due to underutilization of allocations. This can involve combining operating budget financing for regular and predicable phenomena, with alternative lines of financing such as insurance, contingency financing or credit for exceptional expenses. A more efficient financing strategy, together with more flexible and scalable social protection programs, can help lower the cost of response while improving speed and impact.
102. Other systemic factors negatively affect utilization rates, particularly for projects funded by the development budget.83 The original operating budget is often considered to be flexible by line ministries as budget circulars contain notional ceilings. As a result, line ministries tend to expect significant reallocations throughout the year, and try to match their resource needs with the combined development and operating budgets ceilings. The development budget has historically been overprogrammed: As projects are approved throughout the year (see above) irrespective of resources available, allocations to older projects may be reduced and reallocated to newly approved projects that take time to get started. Delays often result from challenges in the formulation of project costs as part of the TPP/DPP, and rigidity comes from the complexity of the process of subsequently adjusting TPP/DPPs. Finally, low utilization rates can also reflect difficulties in managing large projects/programs in iBAS.84
83 World Bank, 2017a. 84 For instance, the FY2017-18 budget included a large allocation under Development of Living Standards of Extinct Enclaves, which could not be located in iBAS. Similarly, in FY2017-18, a large allocation was made under LGD’s Rural/Grameen Infrastructure Development, but this was not identified by iBAS (Some bunching of development projects may have happened through this program, which has become the second largest intervention after Government Pensions).
Figure 4-5: Budgets and expenditures (in billion BDT) of Pension for Retired Government EmployeesSource: Authors’ estimates based on budget and revised budget data, Finance Division; and expenditure data, CGA.
250
200
150
100
50
0
Budget Revised Actual
2013-14 2014-15 2015-16 2016-17 2017-18
Figure 4-4: Social Protection Budget UtilizationSource: Authors’ estimates based on expenditure data, CGA.Note: excludes Pension for Retired Government Employees and programs non/marginal social protection (annex 2).
100%
90%
80%
70%
60%
50%
Budget utilization (revised/actual)
2013-14 2014-15 2015-16 2016-17 2017-18
EFFICIENCY IN THE PROGRAMMING AND FINANCING OF SOCIAL PROTECTION
90

103. Since pensions represent a very large share of social protection expenditures, and increases are decided separately, we present its utilization rate separately.85 While the original budget for pensions continues to rise over time, the revised budget came down in FY2017-18 (Figure 4-5). There is, however, scope for budgets to be better anchored in realistic projections. Overall, allocations for pensions increased more than fivefold between FY2009-10 to FY2018-19 (equivalent to a compound annual growth rate of nearly 20 percent) reflecting adjustments put in place after decades of limited increases in civil servant salaries and pensions. Reforms in 2015 have resulted in variable utilization in three ways: First, following the revision in retirement benefit calculation, budget forecasts were overestimated (based on estimates of number retirees and benefits, rather than actuarial valuation)86. At the same time, forecasts might have failed to reflect the fact that the increase in age of retirement from 57 to 59 years resulted in no new retirees for 2 years. Finally, estimates might have underestimated the impact of the change in the maximum which can be withdrawn upon retiring.87
104. The largest agencies mostly have expenditures close to revised budgets, reflecting their strong financial planning and control. Figure 4-6 shows that the MoFd led the way, with the highest execution rate, both in terms of original (116.3 percent) and revised budget (146.4 percent), followed by FD, MoSW, MoWCA and others. LGD, MoHSW and MoDMR had lower budget execution rates than others. Revised budgets or expenditures in excess of original budget allocations can indicate scope for improved fiscal discipline or unforeseen circumstances. The latter may be common in case of the MoFd and its support following the onset of natural disasters. On the other hand, a low budget execution rate points towards either overbudgeting or implementation delays. LGD implements mostly development budget funded projects and also has the second lowest implementation rates among the ten largest agencies, again pointing to lower utilization of budget by development projects.
105. Use of iBAS at local level for budgeting and reporting remains limited, which explains part of the utilization rates. While central units use iBAS++ for budgeting and reporting, some local-level officials are yet to start using the system. For major programs, iBAS only records the first steps in a longer chain of transfers. While the use of the operating budget by design requires claiming expenses as reimbursements, transfers are in practice recorded as expenses without waiting for reconciliation with actual expenditure data. For EGPP, funds are transferred from the treasury to the ministry and then to upazila-level mother accounts.88 Funds are then transferred to union child accounts following selection of
Figure 4-6: Budget utilization by eleven agencies with largest social protection budgetsSource: Authors’ estimates based on Ministry Budget Frameworks (MBFs).
85 Pensions are updated by the National Pay Commission, based on inflation and market assessments. 86 Financial Express, 2018. 87 The maximum was reduced from 100 to 50 percent, to limit the elderly’s financial vulnerability. The remaining 50 percent must be paid as monthly pen-sions to pensioners or their eligible survivors. 88 Administered by the UNO and Project Implementation Officer.
30.7
MoHW
26.7 35
.9
LGD
30.4
96.0
ME
83.7 88
.5
MoPME
77.6
96.6
MoWCA
91.9
90.9
MoLWA
89.5
116.
3
MoFd
146.
4
97.2
MoSW
96.6
51.7
MoDMR
52.7
79.4
FD
106.
1
Expenditure as % of budgetExpenditure as % of revised budget
91BANGLADESH SOCIAL PROTECTION PUBLIC EXPENDITURE REVIEW

sub-projects, before transfers to beneficiary accounts (using lists verified by the Project Implementation Officers based on attendance records). The iBAS records transfers to upazila-level accounts as expenditure, and does not monitor further down the chain. For some other programs, the use of iBAS is even more limited: for OAA, WA and DA, allowances released from the Treasury pass through the MoSW and DSS banks accounts, before reaching upazila-level child accounts.89 From there, transfers are made to beneficiary accounts, using payment lists managed at the upazila level. The iBAS only tracks the transfer from the treasury to DSS, considered as an expenditure. Similarly, for MoHFW’s DSFMHV, iBAS only records the transaction from treasury to the ministry. For MoDMR’s FFW, no evidence of monetary accounting was found (possibly because transactions in food translate into financial adjustments at the treasury level, not reflected in iBAS). These practices may help explain the high budget utilization rates discussed earlier. The lack of reconciliation also means that agencies are not able to monitor and adjust their programs.
106. Finally, the audit of social protection programs is limited, which curtails opportunities for improvements. The extent of auditing in social protection programs is unclear. Agencies implementing social protection are mostly audited by Local and Revenue (responsible for auditing agencies which implement about 20 percent of social protection’s revised budget in FY2018-19), Civil Audit Directorate (19 percent), and Industry, Commerce and Financial Institutions Audit Directorate (nearly 50 percent), though in recent years the Directorate of Social Safety Net Audit has been launched by the OCAG. However, the definitions and scope of such audits focus mostly on entity level transactions and do not delve into program expenditures and processes. Projects receiving international development assistance are audited by the FAPAD, but their limited scale constrains the application of the Directorate’s good practices. Deeper audits would help enhance fiduciary management, as well as efficiency of processes, resulting in greater impacts.
RECOMMENDATIONS EMERGING FROM CHAPTER 4• While improving the design of large programs for maximum impact, progressively consolidate or terminate small projects to reduce
fragmentation. In addition to improving large programs that can have systemic and sustainable impacts (see recommendations in chapter 3), the government could consolidate some programs, potentially around their functions or target population. For instance, consolidation efforts could merge programs for vulnerable women, or programs focused on early childhood support, or public works programs. In terms of development projects, the government should only finance those that test new approaches (e.g. labor market projects). Such pilots are essential to foster adoption of successful innovations, and need to be rigorously evaluated before deciding on potential scale-up. All other small development projects, which don’t contribute to the innovation agenda, should be progressively terminated. To operationalize this recommendation, rules and guidance will be needed on: (1) how to amalgamate various processes; (2) how to redistribute responsibilities for consolidated programs; and (3) how to consolidate programs financed from development and operating budgets.
• Strengthen social protection coordination mechanisms and the link between policy and resources allocation. The Cabinet Committee on Social Protection should play a more important role in linking allocations to policy priorities – both by broadening its coverage and by deepening its consideration of data on impacts, coverage and adequacy to make evidence-based budget allocation. To broaden its coverage, the Committee should review all core programs, financed from both operating and development budgets, analyze programs’ alignment with core policies and objectives using core policy-relevant typologies, and anchor its analysis in evidence on impacts and cost-effectiveness. The Committee can also consider meeting earlier in the financial year, to make more effective contributions to the budgeting process of social protection. The Government could also revisit the number of agencies engaged in social protection, based on key policy documents such as the AoB, FYP and NSSS.
• Simplify and harmonize the budget process. This could involve bringing the development and operating budget processes more in line, rationalization of the reporting requirements by central level ministries (e.g. FD, CD, PC), and reducing the number of back and forth on budget preparation. Simplifying and flexibilizing the TPP/DPP preparation and revision processes would boost implementation of development budget-funded projects.
• Strengthen financial reporting and auditing to improve implementation and program management. At the local level, capacity needs to be developed to use central reporting systems (including iBAS) and effectively report actual expenses (using bank reconciliation statements). This would also allow for more informed program management at the local level. Financial audit of social protection programs can help increase transparency of expenditures and processes and contribute to efficiency. OCAG’s Directorate of Social Safety Net Audit covers seven ministries (including MoSW, MoCWA, MoDMR, MoFd, MoLE, MoLWA, and MoYS). The Directorate is carrying out the first financial audit of the MoSW’s cash transfer programs, and this practice should be emulated for other agencies’ programs. In addition, performance audit by the Directorate can bring a holistic view of program performance.
89 Administered by the Upazila Social Service Officer and the Upazila Nirbahi Officer (UNO) or equivalent urban area officials where applicable.
EFFICIENCY IN THE PROGRAMMING AND FINANCING OF SOCIAL PROTECTION
92

93BANGLADESH SOCIAL PROTECTION PUBLIC EXPENDITURE REVIEW

EFFICIENCY IN THE DELIVERY OF BENEFITS AND SERVICES TO BENEFICIARIES
Chapter 5
94

107. Previous chapters reviewed whether programs were aligned with policy directions (Chapter 2), whether they were effective in reaching the right beneficiaries with adapted benefits (chapter 3), and whether the planning, budgeting and financing processes were conducive to adequate and efficient flow of resources (chapter 4). They identified a series of options to improve efficiency along all steps of the process: by re-focusing some of the programs on core policy priorities around the life-cycle or the functions programs play; by designing programs that are better equipped to reach the right beneficiaries with benefits which can boost their impact on poverty; and by streamlining the institutional setup, coordination, and budget and reporting processes.
108. This chapter closes the chain by focusing on the last step of the process – the delivery of programs at the local level. It starts by discussing the way administrative and political actors both contribute, but how resources are too limited for meaningful engagement with beneficiaries (Section 5.1). The chapter then turns to the first step of most programs, that of identification of beneficiaries, as it is so central to the issue of reaching the right beneficiaries (Section 5.2). Finally, it focuses on mechanisms used to provide services – both cash and food transfers – to identify potential efficiency gains, both for Government and for households (Section 5.3).
5.1 LOCAL ADMINISTRATIVE AND POLITICAL IMPLEMENTERS OF SOCIAL PROTECTION
Administrative and political actors play important roles in local service delivery despite constraints in resources and capacity
109. Departments implementing social protection programs have in most cases offices down to the upazila level – the second last tier of administrative hierarchy in rural Bangladesh. Typically, the divisional level has no direct role in service delivery, the district level performs some supervisory functions, and the upazila and union levels are the most important for service delivery. Figure 5-1 shows that out of BDT 25.8 billion allocated for management of social protection programs (excluding social protection payments) implemented by four key agencies (MoDMR, MoLWA, MoSW, MOWCA), BDT 24.4 billion (95 percent) were allocated at the national and upazila level. Each ministerial department has offices or representatives at the national, divisional, district and upazila levels, in addition to central ministry
EFFICIENCY IN THE DELIVERY OF BENEFITS AND SERVICES TO BENEFICIARIES
95BANGLADESH SOCIAL PROTECTION PUBLIC EXPENDITURE REVIEW

staff. However, staffing thins out at the lower levels, and key departments such as the DSS, DDM and Department of Women Affairs (DWA) each have only one representative at the upazila level.
110. This centralized approach is reflected in the allocation of resources. MoLWA and MoDMR allocate over 90 percent of their resources (excluding the transfers themselves) to the national level (Figure 5-2). MoWCA allocates more to district and upazila levels but remains center-heavy. Only the MoSW dedicates significant resources to lower levels of government. Upazilas play the most important part in program implementation, and many programs rely on collaboration with Union Councils, but these two levels have limited or no allocations. Urban areas only receive allocations under MoSW, commensurate with the limited urban footprint of social protection.
111. Only the Department of Social Services (DSS, MoSW) deploys staff at the union level, though their numbers are inadequate. Managed by Upazila Social Service Offices (USSO), USWs facilitate beneficiary interactions for all DSS programs. In practice, they often have additional responsibilities from other departments that have no union-level staff. And this has important repercussions on SWs’ workload and efficiency (in addition to affecting the service delivery of these other agencies). Overall, like other South Asian countries – such as Afghanistan, Bhutan, Nepal and Pakistan - the number of staff at the local administrative level who support for social protection is inadequate in Bangladesh.90 There
Figure 5-1: Administrative hierarchy of Bangladesh and budget allocation (excluding social protection payments)Note: Data for social protection programs implemented by four key agencies (MoDMR, MoLWA, MoSW, MOWCA).Source: Authors’ estimates based on revised budget (FY2018-19), Ministry Budget Frameworks (MBFs).
Figure 5-2: Budget allocations (excluding social protection payments) across administrative levels Source: Authors’ estimates based on revised budget (FY2018-19), Ministry Budget Frameworks (MBFs).
National (Secretariat and HQ Division (region) District Upazila (subdistrict) Urban Non-geography focused
MoLWA
MoDMR
MoWCA
MoSW
0% 20% 40% 60% 80% 100%
EFFICIENCY IN THE DELIVERY OF BENEFITS AND SERVICES TO BENEFICIARIES
90 UNICEF, 2018b.
96

are 4,659 posts available for USWs, Urban Social Workers (UrSWs) (and other field-level staff positions, namely field supervisors and trade instructors), spread out over 481 upazila and paurasabha (Municipal Corporation) and 4,554 unions.91 About 20 percent of these positions remain vacant, and as a result some SWs are responsible for multiple unions. On average, each SW has a workload corresponding to 1.89 unions (although it can be as high as 11 unions) and 1,943 to a maximum of 17,912 beneficiaries.92
112. SWs’ responsibilities are numerous, limiting their ability to meaningfully engage with their beneficiaries, which are amongst the most vulnerable. In addition to implementing programs serving vulnerable groups, SWs also manage the Rural Social Services (RSS) – microfinance program, coordinate with other ministries, facilitate Ward Committee meetings, run awareness campaigns, respond to queries, conduct counseling, participate in the disability detection survey, oversee local volunteer clubs, and contribute to beneficiary data digitization efforts. Administrative tasks, including collection of repayments for the microfinance program, take up significant time (47 percent of total), and only 9 percent of SW’s time is dedicated to awareness activities and substantive interactions with beneficiaries (Figure 5-3). This is in sharp contrast to SWs’ preferences (preference for interacting with beneficiaries) and with their skills (Supervisors report that communication with beneficiaries was their strongest skill, while administrative/technological skills were the weakest). A 2018 pilot showed that small simplifications of processes could free significant time for SWs to focus on their core technical activities. For instance, small changes in the format of payment receipts for the microcredit program led to a 38.8 percent time saving, translating into an average of 2.6 hours saved per month for each SW. Greater clarity on prioritization of tasks would also help SWs improve their work practices.
113. Increasing training for Social Workers, increasing motivation, and better management of human resources could boost SWs’ impact on the population they serve. Social workers are confronted by complex challenges, rooted in cultural, political and socio-economic patterns of the communities they serve.93 But on average, they report having attended only three trainings during their tenure, mostly focused on procedures rather than the core function of attending vulnerable groups (one training every six years on average). Developing digital skills through training would be essential, as digitalization is essential to improving SWs’ time use (currently, 82 percent cannot input program data into the computer by themselves, 68 percent do not use computers, 61 percent continue to use only paper-based data for their work instead of the digitized MIS, 60 percent do not use smartphones, and 25 percent do not send or 33 percent do not read text messages). Managing and motivating frontline service providers is also essential to ensuring their performance. There is limited scope of career progression, as indicated by the average job tenure of 21 years with an average monthly salary of around US$300 (which is roughly half of their monthly average household income).94 While most SWs consider the impact on society and social recognition as the best parts of their jobs, only half are highly satisfied with their work and over a third feel appreciated by supervisors and beneficiaries. The Government needs to put in place a dynamic database on its social service workforce, to make informed and timely decisions regarding workforce planning, training, support and budgeting. This would also help mobilize rapid response during emergencies created by disaster and shocks of the nature of the ongoing COVID-19 pandemic.
Figure 5-3: Use of time by USWs (DSS)Source: World Bank, 2019d.
21%Targeting
10%Digitization
47%Microfinance management
9% Awareness
13% Beneficiary
replacement/duplication/phone calls
91 World Bank, 2019d.92 World Bank, 2019d and UNICEF, 2018b.93 UNICEF, 2018b. 94 World Bank, 2019d.
97BANGLADESH SOCIAL PROTECTION PUBLIC EXPENDITURE REVIEW

114. Most social protection agencies do not invest enough in core processes of budgeting, management, enrolment, delivery and accountability. Key agencies, such as FD, MoSW, MoLWA, MoDMR and MoWCA exhibit very low resources allocated to program management (defined here to include wages and salaries, administrative expenses and training, Figure 5-4).95 While FD’s focus on centrally-managed pensions may not require as much field level presence, the nature of other programs calls for greater engagement with beneficiaries. MoSW spent 8.5 percent on management, while MoDMR spent less than 2.5 percent, and MoLWA less than 1 percent.96 With such resources, it is likely that program staff can only provide basic supervision of enrolment and payment processes, with little space for meaningful engagement with beneficiaries. As further discussed in section 3.3, having more qualified staff locally would allow programs to include behavioral change communication, case management, support for social and economic inclusion, or grievance management, among other.
115. Elected political bodies operate down to the ward level, complementing the limited administrative structure, but resources are limited. The most important body in terms of service delivery in rural areas is the Union Council, which includes nine ward members one of whom acts as the Chairperson of the Union Council.97 Members typically have a good sense of communities’ needs and the poverty status of households and long-term social accountability to the community. The Union Council is the approving authority for the selection of beneficiaries at the union level (while there are subsequent layers of approval, the Union Council’s decision typically hardly changes).98 The Union Councils also supplement capacity-constrained administrative staff: they contribute to monitoring of public works and to the dissemination of information about program eligibility and enrolment.99 As was the case within ministries, resources allocated to the local governments are not commensurate with the scale of responsibilities they are assigned. Resources remain fairly centralized in Bangladesh, with only 7 percent of total government spending at the local level.100 As tax administration is also largely centralized, local governments rely mostly on the national budget. Such resource constraints impose limitations on Union Councils’ capacities to administer services.
Figure 5-4: Allocation of budgets on social protection benefits and management in FY2018-19Source: Revised budget (FY2018-19), Ministry Budget Frameworks (MBFs), FD.
95 Agencies focused on health, education and infrastructure allocate more resources to management (about two thirds of MoPME’s budget and two fifths of the Health Services Division’s budget). Agencies responsible for local infrastructure (LGD and RDCD) also allocate significant resources to management for technical supervision. 96 Khondker and Jalal, 2019 reported administrative costs of 4 percent for OAA and WA (noting that these failed to include cost of DSS local staff, local offices or bank transfers). Administrative costs were 10.4 percent in 2016-17 for the primary education stipends, and between 14 and 24 percent for livelihood programs. 97 A ward is an optional division of an upazila or municipal town. Nine wards make up a union.98 Lewis and Hossain, 2008. Members of Parliament sometimes play a role, which may or may not be fully aligned with the Union Council’s decision.99 Department of Disaster Management, 2019 and World Bank, 2019e.100 World Bank, 2019f.
100%
90%
80%
70%
60%
50%
40%
30%
20%
10%
0MosW
Wages and salaries in cashSocial Protection Benefits
Administrative expensesOther expenses
Training
MoDMR MoLWA MoFd MoHFW MoE MoPME FD LGD RDCD MoWCA
EFFICIENCY IN THE DELIVERY OF BENEFITS AND SERVICES TO BENEFICIARIES
98

116. While Union Councils can play an important coordination function, the combination of administrative and political bodies also results in complex accountability structures. As the gateway for social protection in rural areas, Union Councils can play a very important coordination function across programs and help harmonize delivery processes (For instance, instead of repeating selection processes several times a year for different programs, Union Committees formed out of Union Council members in decision making roles, could implement a consolidated selection process, thereby increasing efficiency and facilitating the process for households). For the functions they play in program implementation, government officials and staff working at the local level have key reporting lines to relevant departments at the central level. However, while working locally, there is also an element of reporting to local authorities, such as the Union Council. This dual reporting can create ambiguity or even contradiction, affecting service delivery.
5.2 PROCESSES OF IDENTIFICATION AND ENROLMENT OF BENEFICIARIES
Beneficiary identification is largely administered by local government representatives, with scope for nepotism
117. The processes of beneficiary identification are largely similar across the main programs. A few distinctions concern the frequency of enrolment: programs like MAPP receive applications all year round, programs like OAA only welcome applications once a year, while programs like VGD enroll every two years. Also, while most large programs have formal application formats (and planning to adopt online applications), the actual use of these formats is not consistent. Most programs require submission of a photo and National Identification Document (NID). For most programs, the Union Committee (typically headed by the Union Council Chairman and comprised of Union Council members, ward members, respected community members, the USW, and sometimes beneficiary representatives) prepares a first list.101 Local ward members or local leaders often play a role in assisting households in the application process (completing the form), while administrative officials are rarely solicited by households, highlighting their limited role in the process.102 The list is then submitted to the upazila program officer for submission to the Upazila Committee (after cursory review). The Upazila Committee, generally headed by the UNO or the Upazila Chairman, is primarily comprised of government administrative representatives and Chairmen of each of the Unions. While the Upazila Committee may request a further review of list, initial lists are typically largely left unchanged. Once approved, the list is sent back to the Union Parishad, which enrolls beneficiaries.
Age/Demographic criteria
Income (BDT/monthly)
Income (US$ monthly)
Land ownership
Employment status
Daily food intake
MAP Pregnant woman < 5,000 <62.5 Landless
EGPP 18-60 < 0.1 acres Daily laborer
VGF Landless Unemployed < 2 meals a day
AFID < 1,000 <12.5 Landless
WA Widow, divorced, separated Landless
Table 5-1: Program Eligibility Criteria
101 Each program sets up a separate committee, though they largely comprised of the same representatives.102 World Bank, 2019g and World Bank, 2018b.
99BANGLADESH SOCIAL PROTECTION PUBLIC EXPENDITURE REVIEW

118. Most programs have a combination of selection criteria, but lack of objective metrics and data can give discretional power to some individuals or committees. Core programs aim at reaching the poor and vulnerable, using varying criteria related to demographic composition, consumption, earnings, work, and asset ownership (Table 5-1). However, many of these are not easily verifiable objectively or loosely defined. One program, JAWTNO has used a combination of simple and observable proxy indicators to identify poor eligible beneficiaries. The combination of discretionary powers and lack of clear metrics can result in patronage and nepotism. Indeed, a small percentage of beneficiaries report having had to pay to be considered or enrolled in some programs.103 Reported payments were higher for the OAA, which provides benefits over a long period (till death) and with no conditionalities, while no enrolment commissions were reported for the DSF-MHVS which provides smaller and time-bound benefits.
119. Performance-based allocations to Union Councils, greater social accountability and improved grievance mechanisms could reduce discretional powers. Allocations to the local government could take into account some elements of performance, to incentivize Union Councils in applying more transparent and objective processes. For instance, grants could be allocated on the basis of independent verifications of the extent to which identified beneficiaries are indeed poor (this could consist, among others, in verifying that beneficiaries are below a certain threshold for certain indicators within the NHD). Together with such incentive mechanisms, greater social scrutiny by the community could also contribute to reduced scope of enrolment commissions. At the same time, promoting and activating the various existing grievance mechanisms in the country can enhance citizen engagement and improve transparency.
5.3 PROVISION OF TRANSFERS AND SERVICE 120. While Bangladesh has made significant progress in adopting modern payment systems, there is scope for efficiency gains in cash and food transfers. This can contribute to efficiency, transparency as well as convenience of beneficiaries. Leakage is extremely low within this process, though some beneficiaries report incurring some expenditures to access benefits.104 However, there are still delays and inefficiencies in the payment system – both during the cash-in process and during the cash-out process. Similarly, there is scope for efficiency gains in the transfer of food.
Age/Demographic criteria
Income (BDT/monthly)
Income (US$ monthly)
Land ownership
Employment status
Daily food intake
VGD Women between 18-40 years < 0.5 acres < 3 meals a
day
OAA Women over 62 yearsMen over 65 years < 10,000 <125 Landless
ISPP-JAWTNO
Pregnant woman or mother of child under 5 yearsPoverty score within bottom 50% of National Household Database OR1. Land ownership less than 0.5 acres and any two of the following:
2. Monthly income less than BDT 10,000 (about US$ 125)
3. Female household head
4. Daily wage labourer
5. Housing material made of jute, bamboo, straw, mud or tin sheet
6. Household does not own TV or fridge
Source: Authors’ estimates based on list of programs, CD and Safety Net Budget, FD.
103 World Bank, 2019a. Two percent of EGPP beneficiaries reported paying BDT 500-1,000 (3 to 6 percent of annual transfer); 2 percent of OAA beneficiaries report paying BDT 1,000-5,000 (16-83 percent of the annual benefit). This data is based on a survey undertaken for the PER, as part of the fund flow analysis in November 2019. The survey was on a sample of 2,000 beneficiaries from 20 unions across the country. 104 World Bank, 2019a.
EFFICIENCY IN THE DELIVERY OF BENEFITS AND SERVICES TO BENEFICIARIES
100

The cash-in process – transferring resources from the treasury to beneficiaries’ accounts
121. On average, it takes at least two months to transfer funds from the treasury to beneficiaries, in part because of multiplicity of steps, and delays can impact implementation. On average, the time lag between the release of funds from the treasury and the receipt of funds by beneficiaries is 82 days to six months for OAA, two to four months for EGPP and up to more than one year for the DSF-MHVS.105 There are at least 7 steps for OAA, while the EGPP, FFW and DSF-MHVS have eleven (see Figure 5-5 as an illustration for OAA).106 Breaking down the payment process highlights specific steps which cause delays. For OAA, once MoSW approves the quarterly payment and a Government Order is issued, the fastest step is the transfer of funds from Sonali Bank to other banks, while the most time-consuming step is the transfer from the child account at the upazila level to the beneficiaries – up to 61 days in FY2018-19 – partly because payment lists are still maintained manually (see Figure 5-6). Similarly, for EGPP, a combination of complex processes and limited local-level capacity led to delays in transfers from upazila-level accounts to beneficiary accounts.107 For FFW and TR in FY2016-17, central allocations were released relatively fast, but delays of up to 100 days were noted between receipt of funds, project approval, implementation, and payments.
122. Delays can represent substantial costs for both the Government and beneficiaries. Funds which remain idle, between treasury transfers and receipt by beneficiaries have substantial costs for the Government: losses in terms of interest, as well as potential increased costs related to cash management. Lost interest could represent up to 2 percent of the total program budget (Table 5-2). In addition, delays in payments, uncertainty on timing of payments, and long intervals between payments can have deep impacts on beneficiaries, affecting their consumption, investments, and capacity to manage their debts. For instance, MoDMR’s programs operate in two phases each year, expected to coincide with the agricultural lean season, and delayed payments miss the hardest period of the year for the poorest. Similarly,
105 World Bank, 2019c. 106 Including the selection of projects, job cards distribution, completion of work, and verification of attendance. 107 Department of Disaster Management, 2018.
MoSW approves fund release
DSS issues a bill to Chief Accounts Officer (CAO)
Each payee bank transfers funds to upazila branches, in the account jointly administered by theUSSO/UNO or DSSO/DD
Sonali Bank divides the amount and transfers to the head offices of each payee bank (5 state-owned banks)
The local branch transfers funds to individual beneficiary accounts based on list from USSO from the joint account
CAO issues cheque for the program
Treasury allocates cheque amount to Sonali Bank
Figure 5-5: Process mapping for OAA payments under conventional banking systemSource: World Bank, 2019c.
101BANGLADESH SOCIAL PROTECTION PUBLIC EXPENDITURE REVIEW

although OAA payments are expected to be made quarterly, more than a third of beneficiaries report receiving payments semi-annually or annually, while most count on this income for daily consumption.108
123. In addition to delays, a tracking of expenditures for the OAA suggests lack of clarity at the upazila level. The tracking, undertaken for this study for the second quarter of FY2018-19, shows instances of discrepancy between amounts allotted and amounts transferred, resulting in benefits per beneficiary which are either more or less than the official amount (Figure 5-7). This may indicate scope for greater consistency in allocation information and advice to banks. In contrast, payments which went through the G2P platform were consistent with the official amount, and this process eliminated many bank-related steps. Discrepancies and delays in enrolment of beneficiaries (for which funds have been released by treasury) also complicated accounting and reconciliation of upazila-level accounts (because of delay in enrolment of beneficiaries for which benefits have been released by treasury).
124. The G2P scheme, able to cut processing time to 10 days, has been linked to information systems in six line ministries . Initiated in 2018 by the FD with support from UKaid, G2P eliminates administrative layers while facilitating authenticated and secure payments. Under this scheme, the department, through its designated CAO, confirms digitized payment lists (with information on beneficiaries’ NID and bank account numbers) through the iBAS. Subsequently, Bangladesh Bank transfers amounts directly to beneficiary accounts, using the G2P platform of the SPBMU of FD. To
Figure 5-6: OAA Quarterly payment processing time (FY2018-19)Source: World Bank, 2019c.
Budget FY2019
(BDT crore)
Lag in months
Lost interest (BDT crore) at 7% per annum
Loss as percentage of total budget
1. OAA 2,400 2 to 6 54 2.25%
2. EGPP 1,643 2 to 4 29 1.77%3. DSF-MHVS 22 3 to 13 4 1.82%Total 87
Source: World Bank, 2019c.
Table 5-2: Loss to the treasury due to time lag in cash transfer of select programs
Fund Release: Release of Fund from Treasury to Sonali Bank Central Account
Beneficiary withdraws the amount from BankTransfer of fund from upazila accounts to beneficiary accountsTransfer of fund from the bank head offices to upazila acocunts managed by USSO / Union Executive Officer (UNO)Transfer of fund from Sonali Bank Central Account to the head office accounts five banks (including Bank)
Time taken in days
EFFICIENCY IN THE DELIVERY OF BENEFITS AND SERVICES TO BENEFICIARIES
108 World Bank, 2019a.
102

Figu
re 5
-7: T
rack
ing
of O
AA e
xpen
ditu
res (
Qua
rter
2, F
Y201
8-19
, sel
ect u
nion
s)So
urce
: Wor
ld B
ank,
201
9c.
RAIP
URA
Allo
tmen
t: 2.
58Tr
ansf
er: 2
.81
Varia
nce:
-0.2
4
1.71
8
1,63
7.08
3,61
3.0
1,39
9.4
597.
441,
374.
74,
306.
61,
865.
61,
563.
41,
179.
3
1.65
91.
849
1.87
32.
012
1.72
22.
084
2.12
72.
264 36
.174
1,50
0.0
ASSA
SUNI
Allo
tmen
t: 2.
49Tr
ansf
er: 5
.99
Varia
nce:
-3.5
MIR
ZAPU
RAl
lotm
ent:
2.77
Tran
sfer
: 2.5
9Va
rianc
e: 0
.19
SONA
LI B
ANK
LTD.
2,60
4.25
JANA
TA B
ANK
LTD.
862.
39
AGRA
NI B
ANK
LTD.
1,05
4.41
BANG
LADE
SH K
RISH
I UN
NAYA
N BA
NK LT
D.85
9.70
RAJS
HAHI
KRI
SHI
UNNA
YAN
BANK
LTD.
404.
83
G2P
54.2
6
MUK
SUDP
URAl
lotm
ent:
2.81
Tran
sfer
:1.1
2Va
rianc
e: 1
.69
SHYA
MNA
GAR
Allo
tmen
t: 3.
02Tr
ansf
er:2
.77
Varia
nce:
0.2
5
SHIB
CHAR
Allo
tmen
t: 2.
58Tr
ansf
er:7
.42
Varia
nce:
-4.8
3
GANG
ACHA
RAAl
lotm
ent:
3.12
Tran
sfer
:3.8
9Va
rianc
e: -0
.76
ULIP
URAl
lotm
ent:
3.19
Tran
sfer
:3.3
3Va
rianc
e: -0
.14
DAUL
ATPU
RAl
lotm
ent:
3.40
Tran
sfer
:2.6
7Va
rianc
e: 0
.73
Tran
sfer
to u
pazi
la le
vel c
hild
acc
ount
s at t
wo
sele
ct u
nion
s with
in e
ach
sele
ct u
pazi
la (B
DT m
illio
n):
Tota
l allo
tmen
t: 25
.96;
Tot
al tr
ansf
er: 3
5.58
Tran
sfer
from
Son
ali B
ank
to d
esig
nate
d ba
nks a
nd fo
r G2P
tran
sfer
s (BD
T m
illio
n): 5
,839
.83
Trea
sury
tran
sfer
to S
onal
i Ban
k Ce
ntra
l Acc
ount
(BDT
mill
ion)
: 5,8
39.8
3
Qua
rter
ly a
ppro
ved
budg
et (B
DT m
illio
n):
6,00
0.00
Amou
nt p
er b
enef
icia
ry (q
uart
er) [
BDT
1,50
0 if
the
allo
tted
bud
get i
s div
ided
by
the
num
ber o
f ben
efic
iarie
s]
Num
ber o
f ben
efic
iarie
s
103BANGLADESH SOCIAL PROTECTION PUBLIC EXPENDITURE REVIEW

date, the MISs of at least 13 programs in seven-line ministries109 have been linked to the SPBMU system to roll out G2P payments. Together, these programs represent 68 percent of all cash transfers, and 16 percent of all the social protection expenditures (excluding pensions) in FY2019-20. However, the pace of implementation varies across programs depending on the preparedness of ministry-level data and systems. While MAPP and AULM have transitioned nearly 82 and 85 percent of their respective budgets to G2P, other programs have displayed slower progress. Overall, only about 8 percent of their budget had actually transitioned by the end of FY2018-19 (see Table 5-3).110
125. The pace of scaling up G2P nationally depends on digitization of existing data as well as the readiness of systems and human resources. Several factors have contributed to the fast roll out by the DWA. First, the process was decentralized, with MoWCA’s upazila-level officials relying on UDCs to digitize enrolment data. Also, DWA has established a robust and user-friendly MIS, which supports the generation of payment lists, reconciliation and resolution of payments that have bounced. Third, DWA invested in the digital capacity of its frontline staff. Finally, beneficiaries can chose their own payment service provider (PSP), so the system used pre-existing accounts (and only created new ones for beneficiaries without accounts).112 More generally, success hinges on the digitization of existing manual records. This is often an additional responsibility for local staff who tend to have limited IT skills, so training is essential to boost digital literacy, in addition to relying on UDCs. Roll-out also depends on the ability of various systems to function in tandem and to have the capacity to handle the volume of transactions. Last, but not least, where necessary, provisions might need to be made to outsource the digitization, as well as highly specialized skills to operate such systems.
126. Expanding the network of payment service agents will help reduce costs for beneficiaries in accessing their transfers (“cash-out”). Transport to upazila-level branches might be too costly for some beneficiaries, who sometimes entrust intermediaries such as Union Council members to collect benefits on behalf of multiple beneficiaries.113 There are
Programs implementing G2P Revised budget FY2018-19
Amounts through G2P
% covered by G2P
1 HIFF 29,961.50 176.99 0.6%
2 OAA 24,000.00 728.75 3.0%3 PESP 15,500.00 121.80 0.8%4 EGPP 16,500.00 155.06 0.9%5 WA 8,400.00 228.36 2.7%6 DA 8,400.00 250.85 3.0%7 MAPP 6,940.20 5,668.69 81.7%8 SESP 8,100.00 0.012 0.0%9 AULM 2,488.80 2,101.77 84.4%
10 Improved Maternity and Lactating Mother Allowance (IMLMA)111 n.a. 40.29 n.a.
Total 120,290.50 9,472.56 7.87%Source: Analysis based on data from SPBMU-MIS, FD.
Table 5-3: G2P Progress (BDT million)
109 These include OAA, WA, DA, and Stipend for Disabled Students under MoSW; EGPP under MoDMR; MAPP, and AULM under MoWCA; HIFF under MoLWA; PESP under MoPME; Stipend for Secondary and Higher Secondary Education, Madrasha Education Stipend Program, and Technical Education Stipend Program under MoE; and Assistance for unemployed workers in the export-oriented garment and footwear industry due to Corona Pandemic under MoLE. 110 World Bank staff analysis based on data from SPBMU MIS, Finance Division, Ministry of Finance. In FY2019-20, 11 percent (BDT 5.4 Billion) of the total budget (BDT 50.5 Billion) for MoSW’s three largest programs (OAA, WA and DA) was transferred through the G2P platform.111 MoWCA pilot, embedded in MA/LMA’s budget but with a separate line item in SPBMU (different payment cycle).112 Findings based on information kindly shared by EU-supported Social Security Reform Project implemented by Cabinet Division and DfID supported SPFMSP implemented by Finance Division.113 70 percent of EGPP beneficiaries (82 and 60 percent for OAA and DSF-MHVC) report spending under BDT 50 for travel, and 20 percent (7 percent for OAA) reported having to pay for bank accounts or passbook. World Bank, 2019a.
EFFICIENCY IN THE DELIVERY OF BENEFITS AND SERVICES TO BENEFICIARIES
104

sometimes costs associated with opening bank accounts. These travel and financial costs can reduce significantly the benefits from a program, especially in early stages of participation. In the worst cases, taken together, these can amount up to 2-5 percent of benefits over time. In 2016, the MoSW began piloting digitized payments through the Bangladesh Post Office (BPO) and agent banking, and in 2020 using mobile financial services.114 The objectives were both to reduce the incidence of fraud and ghost beneficiaries (by adopting digitally authenticated secure payments) and to facilitate the payment process by bringing agents closer to beneficiaries. Pilots for OAA and WA revealed that agent banking was the preferred source of payment in contrast to commercial banks and post-offices, because of proximity and shorter queue/waiting times.115 As of December 2020, in 87 upazilas, there were 923 digital payment points (an average of 10.60 points per upazila), as opposed to typically a single bank branch per upazila. Since this time, MoSW has adopted MFS as the primary form of payment, which means beneficiaries will have access to a far greater number of cash-out points given the coverage of MFS agents in the country. The arrangements adopted by MoSW may serve as an example for other cash-based programs.
Constraints in the delivery of food-based transfers affect their cost-effectiveness
127. The need to manage food stocks puts pressure on social protection programs to continue using food, resulting in losses for beneficiaries. As part of its efforts to ensure food security, the Government maintains large stocks.116 Despite progress, the conversion of food programs to cash has been slow, partly because they represent over 80 percent of rice distribution by the PFDS (Table 5-4). While improved stock monitoring and planning led to a
ProgramsFY2017-18 FY2018-19
Rice Wheat Rice Wheat
FFP 299.00 - 748.00 -
OMS 155.00 195.00 100.00 350.00
FFW 178.00 21.50 140.00 119.00
SFP - 19.00 - -
TR - - - -
VGF 280.00 - 437.00 -
VGD 361.00 - 367.00 -
GR 88.00 - 125.00 -
FACHT117 and others 50.00 30.00 50.00 30.00
Total food transfers through social protection programs 1,411.00 265.50 1,967.00 499.00
Other channels 298.50 142.00 238.00 151.00
Total PFDS outflows 1,709.50 407.50 2,205.00 650.00
% PFDS transfers through social protection programs 83% 65% 89% 77%
Source: Calculations based on Bangladesh Food Situation Report, July-September 2019, Food Planning & Monitoring Unit, Ministry of Food.
Table 5-4: PFDS channels (actual distribution in thousand metric tons)
114 Agent banking aims to provide limited financial services to the underserved, under agency agreements with agents such as Union Digital Centers (UDCs) or potentially local shops, mobile phone agents or others.115 World Bank, 2017b.116 The PFDS employs about 15,000 people, spends annually approximately BDT 125 billion (about US$ 1,563 million) in the procurement and management of food, and manages a network of 670 storage depots.117 The Food Assistance in Chittagong Hill Tracts (FACHT).
105BANGLADESH SOCIAL PROTECTION PUBLIC EXPENDITURE REVIEW

significant decline in losses in the 1990s, losses in transit, storage and packaging are still substantial, and deterioration of grains calls for frequent rotation of stocks. Because social protection programs purchase food from the PFDS using an economic price (reflecting the average procurement price and administrative and handling costs, typically higher than the prevailing market price), programs de facto receive lower allocations than officially set, limiting their scope.118 As per Section 3.3, beneficiaries report preferring cash, partly because they can use it for other purchases, but also because the resale value of food is lower than the market price and the quality of rice is not ensured.119
128. Developing modern storage facilities, revising minimum food security stocks, and ensuring pricing is market-based can reduce pressure on social protection programs. The Government is developing modern storage facilities, which would reduce the pressure on social protection programs to absorb aging stocks.120 In the early 2000s, national stock levels were also reduced following downsizing of the FFW and discontinuation of the Food for Education scheme. Further rationalization could be considered to enhance the efficiency of social protection programs by increasing the share of cash transfers. If food-based programs continue to prevail, to act a channel to regularly roll-over stocks, processes might need to be revised to better reflect prevailing prices, limit inefficiencies, and improve monitoring and book-keeping.
Greater citizen engagement is needed to boost accountability and quality of service delivery
129. A key element for improved service delivery, in addition to improved capacity and processes, is the extent to which citizens are informed and able to hold government accountable. While program guidelines emphasize the importance of communication, there is still room for improvement. In the case of EGPP, campaigns tend to be regular and almost 70 percent of EGPP beneficiaries report that program information was publicly disseminated;121 but this was less the case for other programs. Generally, announcements are limited to payment schedules, with less focus on enrolment. Overall, knowledge about major programs is low: Knowledge of benefits amounts is generally higher than that of eligibility criteria, which oscillates between 40 and 60 percent (Figure 5-8). This is particularly limited among the elderly who exhibit limited literacy and numeracy as well as inhibitions about asking questions.122 Multiple efforts to promote engagement, transparency and accountability could improve the quality of public services, in addition to ongoing efforts to develop central grievance mechanisms.123
Figure 5-8: Beneficiary and community awareness about DDM’S major social protection programs Source: DDM, 2019.
118 Though FFW and TR are food-based, benefits are often paid out in cash, and the program monetizes the food received in local markets. Some local authorities sell their Delivery Orders to intermediaries. Rahman et al., 2019. 119 Rahman et al., 2019. 120. Ministry of Food and World Bank, 2013121 Department of Disaster Management, 2019.122 Department Social Services, 2018.123 World Bank, 2019a.
EFFICIENCY IN THE DELIVERY OF BENEFITS AND SERVICES TO BENEFICIARIES
Awareness about eligibility criteria Awareness about program benefits
106
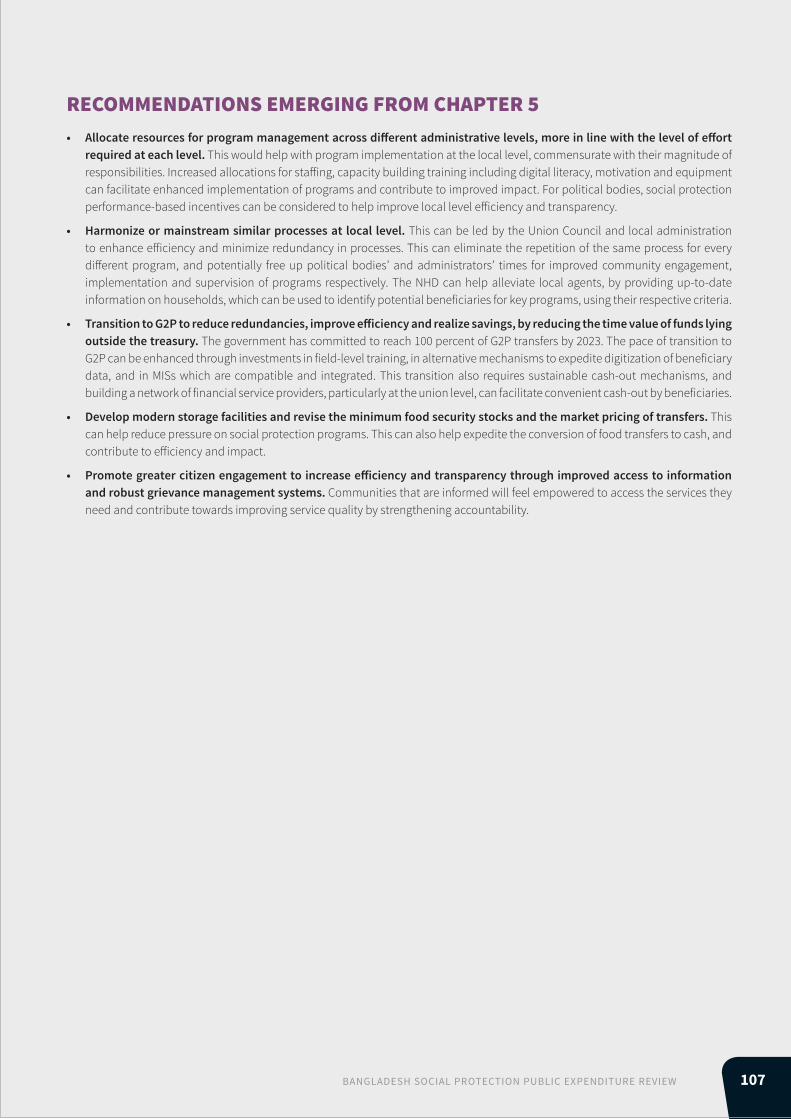
RECOMMENDATIONS EMERGING FROM CHAPTER 5• Allocate resources for program management across different administrative levels, more in line with the level of effort
required at each level. This would help with program implementation at the local level, commensurate with their magnitude of responsibilities. Increased allocations for staffing, capacity building training including digital literacy, motivation and equipment can facilitate enhanced implementation of programs and contribute to improved impact. For political bodies, social protection performance-based incentives can be considered to help improve local level efficiency and transparency.
• Harmonize or mainstream similar processes at local level. This can be led by the Union Council and local administration to enhance efficiency and minimize redundancy in processes. This can eliminate the repetition of the same process for every different program, and potentially free up political bodies’ and administrators’ times for improved community engagement, implementation and supervision of programs respectively. The NHD can help alleviate local agents, by providing up-to-date information on households, which can be used to identify potential beneficiaries for key programs, using their respective criteria.
• Transition to G2P to reduce redundancies, improve efficiency and realize savings, by reducing the time value of funds lying outside the treasury. The government has committed to reach 100 percent of G2P transfers by 2023. The pace of transition to G2P can be enhanced through investments in field-level training, in alternative mechanisms to expedite digitization of beneficiary data, and in MISs which are compatible and integrated. This transition also requires sustainable cash-out mechanisms, and building a network of financial service providers, particularly at the union level, can facilitate convenient cash-out by beneficiaries.
• Develop modern storage facilities and revise the minimum food security stocks and the market pricing of transfers. This can help reduce pressure on social protection programs. This can also help expedite the conversion of food transfers to cash, and contribute to efficiency and impact.
• Promote greater citizen engagement to increase efficiency and transparency through improved access to information and robust grievance management systems. Communities that are informed will feel empowered to access the services they need and contribute towards improving service quality by strengthening accountability.
107BANGLADESH SOCIAL PROTECTION PUBLIC EXPENDITURE REVIEW

ANNEX
108

I. OLD AGE ALLOWANCE (OAA)
PROGRAM OBJECTIVES & DESIGN
The Old Age Allowance (OAA) program was introduced by the Government of Bangladesh in FY1997-98 to provide financial support to the poor elderly. It is an unconditional cash transfer program administered by the Department of Social Services (DSS) under the Ministry of Social Welfare (MoSW). The program aims to target poor and vulnerable elderly (over 62 years of age for women and 65 for men). Initially a program with only rural coverage, the OAA today is one of the largest anti-poverty safety net programs covering the entire country. The program aims to work on the following aspects for the old age population:
• Socioeconomic development and social protection; • Improved status in the family and society;• Enhanced morale; and• Improved nutrition and health care.
ELIGIBILITY CRITERIA AND INTAKE As stated in the program implementation guidelines of the OAA, beneficiaries are selected based on these following eligibility criteria:
• Nationality: Bangladeshi;• Minimum age in years: 62 for women and 65 for men; • Permanent residency: in Bangladesh; and• Annual income: less than BDT 10,000 (US$ 120).
Eligible applicants shall be prioritized if they are: • among the oldest of applicants;• unable to work and/or, ill or weak; and• landless (own less than 0.5 acre) and/or destitute.
CHALLENGES• The beneficiary selection process has scope to be more objective and pro-poor. There is also significant
scope for wider availability of information to further improve the application and selection processes; • The payment process has scope for more efficiency and transparency, to enhance the convenience of
the old, often sick beneficiaries, by increasing the number of payment access points, closer to where beneficiaries live;
• The grievance process can be strengthened to be more accountable and provide reassurance to potential complainants about timely resolution and minimal chances of backlash;
• Lack of adaptive features to provide immediate support to a larger number of vulnerable people in the wake of a shock;
• The benefit amount is not adequate and in urgent need of a significant boost;• Given the high mortality rate of the target group, periodic and frequent recertification can significantly
improve the program’s service delivery.
Key features of OAA program
Number of Beneficiaries 4.17 million
Amount of monthly allowance BDT 500/ US$ 6Targeting Means-tested and age-based selection
Implementing Agency DSS
ANNEX 1: DETAILS OF MAJOR SOCIAL ASSISTANCE PROGRAMS
109BANGLADESH SOCIAL PROTECTION PUBLIC EXPENDITURE REVIEW

II. WIDOW ALLOWANCE PROGRAM (WA)
PROGRAM OBJECTIVE & DESIGN
The Government of Bangladesh introduced Allowances for the Widow, Deserted and Destitute Women (Widow Allowance [WA]) program in FY1997-98. It is an unconditional cash transfer program administered by the DSS under the MoSW. The program aims to provide cash transfers to poor and vulnerable widowed women to improve their socio-economic wellbeing. Initially a program with only rural coverage, the WA today is one of the largest anti-poverty safety net programs covering the entire country. The program aims to work on the following aspects for the widowed and deserted women:
• Socioeconomic development and social protection; • Improved status in the family and society;• Enhanced morale; and• Improved nutrition and health care.
ELIGIBILITY CRITERIA AND INTAKE As stated in the program implementation guidelines of the WA, beneficiaries are selected based on these following eligibility criteria:
• Nationality: Bangladeshi;• Minimum age in years: at least 18; • Permanent residency: in Bangladesh; and• Annual income: less than BDT 12,000 (US$ 145).
Eligible applicants shall be prioritized if they are: • among the oldest of applicants;• detached from the family and/or have no children;• with children who are less than 16 years old;• unable to work or ill;• landless (own less than 0.5 acre) and/or destitute.
CHALLENGES• The beneficiary selection process has scope to be more objective and pro-poor. There is also significant scope
for wider availability of information to further improve the application and selection processes; • The payment process has scope for more efficiency and transparency, to enhance the convenience of the old,
often sick beneficiaries, by increasing the number of payment access points, closer to where beneficiaries live; • The grievance process can be strengthened to be more accountable and provide reassurance to potential
complainants about timely resolution and minimal chances of backlash;• No Income generating opportunities (IGA) for the able bodied women;• Lack of adaptive features to provide immediate support to a larger number of vulnerable women in the wake
of a shock.• The benefit amount is not adequate and in urgent need of a significant boost.
Key features of WA program
Number of Beneficiaries 1.75 million
Amount of monthly allowance BDT 500/US$ 6Targeting Means-tested and age-based selection
Implementing Agency DSS
ANNEX 1: DETAILS OF MAJOR SOCIAL ASSISTANCE PROGRAMS
110

III. DISABILITY ALLOWANCE PROGRAM (DA)
PROGRAM OBJECTIVE & DESIGN
The Disability Allowance program (DA) began in Bangladesh in FY2005-06 with around 100,000 beneficiaries at a monthly allowance of BDT 200 (US$ 2.9 as of FY2005-06). It is an unconditional cash transfer program administered by the DSS under the MoSW. The program aims to provide basic income support to Persons With Disability (PWDs) living in poverty. The objectives of the DA specified in the Government’s policies and rules include:
• To comply with constitutional and legal commitments; • To promote socioeconomic development; • To ensure the inclusion of insolvent PWDs under social protection; • To provide monthly allowances to beneficiaries selected in compliance with implementation guidelines by
responsible authorities; and • To mainstream affairs related to PWDs in the national workplan.
ELIGIBILITY CRITERIA AND INTAKE As stated in the implementation guidelines of the DA, beneficiaries are selected based on the following eligibility criteria:
• Registered PWDs: in accordance to the definition of disability stipulated in the Persons with Disabilities Welfare and Protection Act 2013, and registered as a PWD in the area of residence;
• Residency: Permanent resident of the area; • Minimum age in years: At least 6; and • Annual income: less than BDT 36,000 (US$ 439).
Eligible applicants shall be prioritized if they are: • among the oldest of applicants;• affected by multiple disabilities;• children with intellectual disability or autism;• women;• landless (own less than 0.5 acre) and/or destitute; and• extreme poverty stricken or live in remote areas.
CHALLENGES• The identification of PWDs depends on self-reporting by PWDs which may eliminate many due to poor access
of the most vulnerable ones, including women and the severely disabled and old, to the Social Services Offices. At the same time, children with disabilities aged under six years fail to benefit from the program;
• The insolvency eligibility assessment has scope to be more objective and pro-poor;• The payment process has scope for more efficiency and transparency, to enhance the convenience of the PWDs; • The grievance process can be strengthened to be more accountable and provide reassurance to potential
complainants about timely resolution and minimal chances of backlash;• Lack of adaptive features to provide immediate support to a larger number of PWDs in the wake of a shock;• The benefit amount is not adequate and in urgent need of a significant boost.
Key features of DA program
Number of Beneficiaries 1.64 million
Amount of monthly allowance BDT 700/US$ 8.5Targeting Means-tested and age-based selection
Implementing Agency DSS
111BANGLADESH SOCIAL PROTECTION PUBLIC EXPENDITURE REVIEW

IV. EMPLOYMENT GENERATION PROGRAM FOR THE POOREST (EGPP)
PROGRAM OBJECTIVE & DESIGN
In response to the food, fuel, and financial crisis of 2007-08, the Government of Bangladesh introduced Employment Generation Program for the Poorest (EGPP) in 2009 - a public workfare program. The program is administered by the Department of Disaster Management (DDM) under the Ministry of Disaster Management and Relief (MoDMR). The program aims to create employment for the able-bodied, unemployed poor for 80 days per year in two phases during the seasonal lean period, to reduce poverty and enhance disaster resilience of vulnerable households. In January 2021, DDM has adopted an amendment to the program guideline, enhancing the program’s scope and ability to address large-scale shocks more effectively. Aside from the regular wage payments against performing public works, the newly introduced adaptive feature will allow beneficiaries to receive additional benefits for an extended period of time while providing stipends for participation in community services and hygiene/wellness activities. The program design has also been made flexible in terms of the categories of sub-projects that can be implemented and the preselection of beneficiaries and sub-projects, among others.
ELIGIBILITY CRITERIA AND INTAKE The program follows a geographic targeting approach i.e., increasing allocations to locations with high poverty levels and vice-versa. However, as stated in the program implementation guidelines of the EGPP, beneficiaries are selected based on these following eligibility criteria:
• aged between 18 and 60 years; • able bodied; • without over 0.1 acre of land, or a significant number of poultry or livestock; • earning less than BDT 4,000 (US$ 47) per month; and • not receiving benefits from any other safety net programs of the Government.
The guidelines specify that one third of all beneficiaries must be women. In addition, like other public works, EGPP sets wage rates lower than the market rates so those who are in greater needs can be selected into the program.
CHALLENGES• Influence of local politicians and elected representatives is significant in selecting program beneficiaries; • The payment process has scope for more efficiency and transparency, however, digitized payment systems
are being piloted using multiple channels; • The grievance process can be strengthened to be more accountable and provide reassurance to potential
complainants about timely resolution and minimal chances of backlash;• Weak infrastructure for compliance (beneficiary attendance at worksites) monitoring compounds the leakage
problem of the program.
Key features of EGPP
Number of Beneficiaries 967,051
Amount of daily allowance BDT 200/US$ 2.5
Targeting Means-tested, casual labor by occupation and owns less than 0.1 acre of land
Implementing Agency DDM
ANNEX 1: DETAILS OF MAJOR SOCIAL ASSISTANCE PROGRAMS
112

V. FOOD FOR WORK, WORK FOR MONEY & TEST RELIEF (FFW, WFM & TR)
PROGRAM OBJECTIVE & DESIGN
Food for Work (FFW) and Test Relief (TR) are public works programs which are two of the oldest social safety net programs of Bangladesh. They began primarily as relief programs in 1975 as a response to the famine of 1974 with the immediate objective of providing food to the severely food insecure poor. However, as cash payments became more prominent than food payments, the FFW program has been complemented by Work for Money (WFM) since FY2013-14. While FFW/WFM and TR are similar, the main difference is the type of projects undertaken: FFW/WFM is more concerned with developing rural roads and infrastructure, while TR projects are mainly focused on maintaining and developing local educational and religious institutions, including schools, madrasas, orphanages, mosques, temples, among others. The programs are administered by the DDM under the MoDMR. FFW/WFM & TR’s main objectives are-
• Generate seasonal employment for the rural poor; • Help build, repair or strengthen rural infrastructure to improve the performance of agriculture; and reduce
physical damage and loss of human life due to natural disasters, and meet the demand for electricity and renewable energy;
• Maintain equilibrium in food supply; and • Alleviate rural poverty.
ELIGIBILITY CRITERIA AND INTAKE FFW/WFW and TR use geographical targeting in the sense that the budget allocation depends on the size of population and area, as well as the poverty rate of each Upazila. In addition, the programs use self-targeting given the physically demanding nature of the work: better off households are discouraged while only the poorest households participate. Eligibility criteria for a household to participate in WFM/FFW and TR are:
• Landless due to natural disaster; and• Ownership of less than 0.5 acre of land.
CHALLENGES• FFW/WFM and TR have inadequate access to specialized planning, design, and supervision services. The
capacity within the government to ensure compliance with program standards is weak; • The objective of the programs have shifted to becoming rural infrastructure development programs from
safety net;• Rudimentary payment system (cash hand-out).
Key features of FFW/WFM & TR
Amount of daily allowance 8kg for 7 hours of work or cash equivalent
Targeting Means-tested; casual labor by occupation and owns less than 0.5 acre of land
Implementing Agency Department of Disaster Management
113BANGLADESH SOCIAL PROTECTION PUBLIC EXPENDITURE REVIEW

VI. VULNERABLE GROUP FEEDING (VGF)
PROGRAM OBJECTIVE & DESIGN
In the wake of the famine in 1974, the Government of Bangladesh, in partnership with the World Food Programme (WFP), launched the VGF Program. The program is administered by the DDM under the MoDMR. VGF provides food transfers to poor households during religious festivals like Eid-ul-Fitre and Eid-ul-Azha. The program also provides food transfers to people affected by natural disasters and works in tandem or concurrently with Gratuitous Relief (GR). About half of VGF support is provided during festivals and the other half is used for disasters relief. VGF’s main objectives include:
• Ensuring food security for poor and destitute people; • Preventing diseases of disaster affected people and children; • Ensuring stability of market price of basic food items; • Providing food transfers to unemployed people during recession; • Contributing to poverty reduction through temporary support to poor populations; and • Supporting the socioeconomic development of the extreme poor.
ELIGIBILITY CRITERIA AND INTAKE Selection of VGF beneficiaries uses a comprehensive set of twelve criteria out of which an applicant has to meet at least four to become eligible to be a beneficiary of the program. The twelve criteria are broadly grouped into the following-
• Poor and extreme poor who are unable to have two square meals a day; • People affected by natural disasters and in extreme need of food and financial support; • People who are food insecure because of unemployment; • Those who need to refrain from working, for greater public interest (e.g. fishermen during the breeding
season); • Children who are malnourished.
VGF has placed great emphasis on prioritizing women. Recognizing the importance of focusing on women, the Government has been using gender quota of 70 percent in VGF, as stipulated in the program’s implementation guidelines.
CHALLENGES• VGF continues to be a program marked by challenges of targeting eligible beneficiaries. At the same time, the
inherent design of the program that entails carrying back heavy loads of rice as entitlement, marginalizes women who are the preferred beneficiaries of the program;
• VGF has become a program that is expensive to administer and has significant scope for leakage.
Key features of VGF
Number of Beneficiaries 9.9 million (approximate number of VGF cards)
Amount of food transfer 10-30kg of rice per month per household with different provisions for specific vulnerabilities.
Targeting Means-tested
Implementing Agency DDM
ANNEX 1: DETAILS OF MAJOR SOCIAL ASSISTANCE PROGRAMS
114

VII. MATERNITY ALLOWANCE PROGRAM (MAPP) & ALLOWANCES FOR URBAN LACTATING MOTHERS (AULM)
PROGRAM OBJECTIVE & DESIGN
MAPP and AULM both focus on maternal and child health. MAPP began in FY2007-08 under the Ministry of Women and Children Affairs (MoWCA) and since then has expanded rapidly to become a large national program, focused on rural areas. On the other hand, AULM began in FY2010-11, also under MoWCA, focused on urban areas. The two programs have similar objectives -
• Reduced infant and maternal mortality;• Improved utilization of PNC and delivery services; and • Improved breastfeeding and family planning practices; • However, while the MAPP emphasizes on improved immunization; reduction of dowry, child marriage and
divorce; and increased registration of birth and marriage; AULM emphasizes on increased utilization of ANC, improved standard of living and living conditions.
ELIGIBILITY CRITERIA AND INTAKE In order to be eligible for MAPP, a woman must
• be at least twenty years old; • be pregnant with her first or second child during the annual enrolment of the program during July; • have a household income of less than BDT 1,500 (US$ 18) per month; and • not be a previous/existing beneficiary of similar programs.
Similarly, an AULM beneficiary has the same demographic criteria with the addition that she must be a working woman. The household income threshold is set at no more than BDT 5,000 (US$ 60).
NEW PROGRAMThe Mother and Child Benefit Program (MCBP) was introduced in July 2019 and implemented by MoWCA with technical assistance from WFP. It combines the previous MAPP and AULM and introduces new programme components based on the research outlined above, as well as prior programme evaluations and monitoring visits. The core components of the programmes – monthly CT and BCC – have been retained and are accompanied now by nutrition training, improved linkages to health services and a new child benefit programme. The MCBP aims to reach 7.5 million children 0-4 years of age by 2030 all over the country with the aim of achieving safe births; preventing stunting and wasting; and ensuring breast-feeding, optimal complementary feeding and proper cognitive and psychosocial development of young children.
CHALLENGES• Delayed training in many instances resulting in many beneficiaries not receiving any training during
pregnancy;• Mothers have difficulty attending sessions with their new-born babies;• Lack of educational attainment and knowledge of the trainers on the training content.
Key features of MAPP & AULM
Amount of monthly allowance BDT 800/US$ 9.5
Targeting Means-tested
Implementing Agency MOWCA
115BANGLADESH SOCIAL PROTECTION PUBLIC EXPENDITURE REVIEW

VIII. INCOME SUPPORT PROGRAM FOR THE POOREST (ISPP-JAWTNO)
PROGRAM OBJECTIVE & DESIGN
ISPP-Jawtno is a conditional cash transfer program aims to provide income support to poor mothers in selected locations while (a) increasing the mothers’ use of child Nutrition and cognitive development services and (b) enhancing local-level capacity to deliver safety nets. The program began in FY2014-15 under the Ministry of Local Government, Rural Development & Cooperatives (MoLGRD&C) and implemented by the Local Government Division (LGD). The Program is implemented across 43 Upazilas in Rangpur and Mymensingh Divisions which are poor and suffer with high rates of malnutrition. The beneficiaries of the program are pregnant women and mothers with children below the age of 5 years from the poorest households. Over the course of implementation period, around 600,000 mothers and pregnant women would get benefit from this program.
Beneficiary co-responsibility & benefit levels for ISPP-JAWTNO
ELIGIBILITY CRITERIA AND INTAKE Program beneficiaries are considered eligible based on a two-step process depending on the household’s-(i) Poverty status: A household would be considered as poor if it complies with three of the below mentioned criteria (land ownership criteria is a must for every household while the other two could be any of the remaining five).
• Household land ownership: Maximum 0.5 acre• Income source: Day laborer/Rickshaw puller/Beggar/Van puller etc.• Household head: Female/Widowed/Divorced/Disabled• Monthly household income: less than BDT 10,000• House made of: Jute stick/Bamboo/Straw/Mud/Tin sheet etc.• Household doesn’t own a TV or Fridge
(ii) Demographic profile: In addition to meeting the poverty criteria, only households meeting the following profile will be eligible to enroll in the Program:
• Households with a pregnant woman, and/or• Households with one child under the age of 48 months (must be first or second born child), and/or• Households with two children under the age of 48 months (must be first and second born child), and/or• Households with first child under the age of 48 months and one pair of twins (aged 0-48 months).• Households with previously enrolled beneficiary mother pregnant with second child
CHALLENGES• Low capacity of the local institutions in continuing program activities once it would be phased out;• Heavy dependence on the outsourced firms in conducting program activities i.e., beneficiary enrollment,
service delivery;• Lack of a robust attendance capturing mechanism to verify beneficiary co-responsibilities.
Eligible beneficiary Co-responsibility Benefit amount Payment condition
Pregnant women Up to four Antenatal care visits during pregnancy (ANC) BDT 1,000 per visit No visit, no payment
All beneficiary mothers with children aged 0-24 months
Take child for height and weight check every month (MGMP)
BDT 700 per visit plus a bonus of BDT 700 if all three visits are completed in a quarter
Quarterly (Payment allowed if at least two visits have been completed in three months)
All beneficiary mothers with children aged 25-60 months
Take child for height and weight check every 3 months (QGMP)
BDT 1,500 per visit Quarterly (No visit, no payment)
All beneficiary women Attend child nutrition and development counseling sessions every month (CNCD)
BDT 700 per visit (plus bonus BDT 700 if all three visits are completed in a quarter)
Quarterly (Payment allowed if at least two visits have been completed in three months)
ANNEX 1: DETAILS OF MAJOR SOCIAL ASSISTANCE PROGRAMS
116
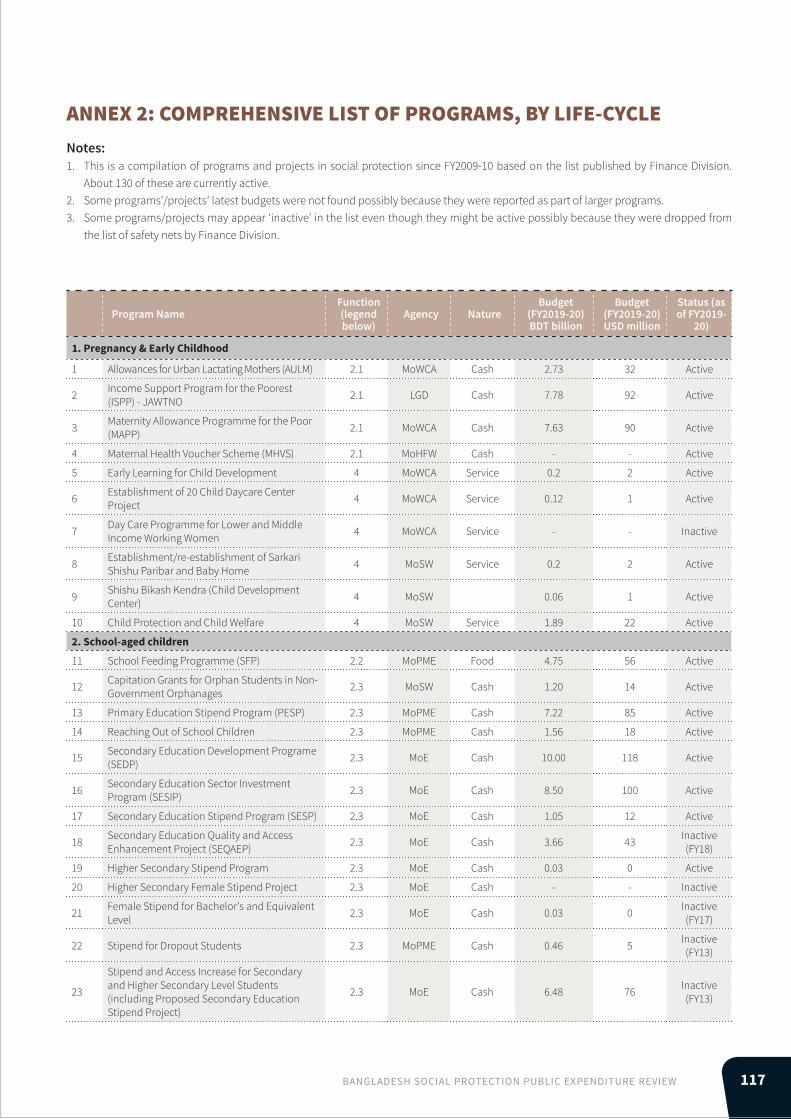
Program NameFunction (legend below)
Agency NatureBudget
(FY2019-20) BDT billion
Budget (FY2019-20) USD million
Status (as of FY2019-
20)
1. Pregnancy & Early Childhood
1 Allowances for Urban Lactating Mothers (AULM) 2.1 MoWCA Cash 2.73 32 Active
2 Income Support Program for the Poorest (ISPP) - JAWTNO 2.1 LGD Cash 7.78 92 Active
3 Maternity Allowance Programme for the Poor (MAPP) 2.1 MoWCA Cash 7.63 90 Active
4 Maternal Health Voucher Scheme (MHVS) 2.1 MoHFW Cash - - Active
5 Early Learning for Child Development 4 MoWCA Service 0.2 2 Active
6 Establishment of 20 Child Daycare Center Project 4 MoWCA Service 0.12 1 Active
7 Day Care Programme for Lower and Middle Income Working Women 4 MoWCA Service - - Inactive
8 Establishment/re-establishment of Sarkari Shishu Paribar and Baby Home 4 MoSW Service 0.2 2 Active
9 Shishu Bikash Kendra (Child Development Center) 4 MoSW 0.06 1 Active
10 Child Protection and Child Welfare 4 MoSW Service 1.89 22 Active
2. School-aged children
11 School Feeding Programme (SFP) 2.2 MoPME Food 4.75 56 Active
12 Capitation Grants for Orphan Students in Non-Government Orphanages 2.3 MoSW Cash 1.20 14 Active
13 Primary Education Stipend Program (PESP) 2.3 MoPME Cash 7.22 85 Active
14 Reaching Out of School Children 2.3 MoPME Cash 1.56 18 Active
15 Secondary Education Development Programe (SEDP) 2.3 MoE Cash 10.00 118 Active
16 Secondary Education Sector Investment Program (SESIP) 2.3 MoE Cash 8.50 100 Active
17 Secondary Education Stipend Program (SESP) 2.3 MoE Cash 1.05 12 Active
18 Secondary Education Quality and Access Enhancement Project (SEQAEP) 2.3 MoE Cash 3.66 43 Inactive
(FY18)
19 Higher Secondary Stipend Program 2.3 MoE Cash 0.03 0 Active
20 Higher Secondary Female Stipend Project 2.3 MoE Cash - - Inactive
21 Female Stipend for Bachelor's and Equivalent Level 2.3 MoE Cash 0.03 0 Inactive
(FY17)
22 Stipend for Dropout Students 2.3 MoPME Cash 0.46 5 Inactive (FY13)
23
Stipend and Access Increase for Secondary and Higher Secondary Level Students (including Proposed Secondary Education Stipend Project)
2.3 MoE Cash 6.48 76 Inactive (FY13)
ANNEX 2: COMPREHENSIVE LIST OF PROGRAMS, BY LIFE-CYCLE Notes: 1. This is a compilation of programs and projects in social protection since FY2009-10 based on the list published by Finance Division.
About 130 of these are currently active. 2. Some programs’/projects’ latest budgets were not found possibly because they were reported as part of larger programs.3. Some programs/projects may appear ‘inactive’ in the list even though they might be active possibly because they were dropped from
the list of safety nets by Finance Division.
117BANGLADESH SOCIAL PROTECTION PUBLIC EXPENDITURE REVIEW

Program NameFunction (legend below)
Agency NatureBudget
(FY2019-20) BDT billion
Budget (FY2019-20) USD million
Status (as of FY2019-
20)
24 Services for Children at Risk 4 Service Service 0.17 2 Inactive (FY17)
25 Development of Haji Nowab Ali Khan Orphanage 4 Service Service 0.07 1 Active
26 Construction of Hostel for Govt. Orphanage 4 Service Service 0.50 6 Inactive (FY17)
27 Establishment of Hostel for Government Shishu Paribar and Visually Impaired Children 4 Service Service 0.29 3 Inactive
(FY18)
28 Fundamental Education for Urban Working Children 4 Service Service 0.38 4 Active
(FY18)
29 Generation Breakthrough 4 Service Service 0.03 0 Active
30 Grants for Residents in Government Orphanages and other Institutions 4 Service Service 0.64 8 Active
31 Street Children Rehabilitation Programme 4 Service Service 0.04 0 Active
32 Eradication of Hazardous Child Labor in Bangladesh (3rd Phase) 4 Service Service 0.42 5 Inactive
(FY14)
33 Enabling Environment for Child Rights 4 Service Service 0.26 3 Inactive (FY17)
34Construction of Facilities at Dharmarajika Buddha Maha Bihar for Orphans and Disadvantaged
4 Service Service 0.07 1 Inactive (FY18)
35 Oppressed Women and Children Welfare Fund 4 Service Service 0.50 6 Active
36 Rehabilitation Centre for Destitute Children, Konabari, Gazipur 4 Service Service - - Inactive
37 Expansion and Development Project of PROYAS at Dhaka Cantonment 4 Service Service 0.13 2 Inactive
(FY14)
38 Child Sensitive Social Protection 4 Service Service 0.07 1 Inactive (FY17)
3. Working age
39 Rural Employment and Road Maintenance Programme 2.1 LGD Cash 1.10 13 Inactive
(FY17)
40 Rural Employment Opportunity for Public Asset (REOPA) 2.1 LGD Cash 0.38 4 Inactive
(FY12)
41 Joyeeta Foundation 3.1 MoWCA Training 0.03 0 Active
42 National Service 3.1 MoYS Package 6.82 80 Active
43 Skills and Training Enhancement Project (STEP) 3.1 MoE Training 4.30 51 Active
(FY19)
44 Skills for Employment and Productivity (SEP-B) 3.1 MoE Training 0.15 2 Active (FY19)
45 Skills and Employment Program 3.1 MoE Training 3.72 44 Active
46 Skills for Employment Investment Program (SEIP) 3.1 FD Training 4.33 51 Active
47 Training Programs for Autistic Children and Women through Pilot Training Centers 3.1 MoWCA Training 0.03 0 Active
48 Women's Skill Based Training for Livelihood 3.1 MoWCA Training 0.07 1 Active
49Establishment of Training and Employment generation Center for the Vulnerable Youth and Adolescents
3.1 FD Training 0.07 1 Inactive (FY17)
50 Swanirvar Training Programme 3.1 FD Training 0.02 0 Inactive (FY18)
51 Establishment of Vocational Training and Health Care Center for the Vulnerable youth 3.1 Not found Training 0.05 1 Inactive
(FY15)
52 Skill Development Fund for Expatriate Returnees and New Entrants to Labor market 3.1 MoEWOE Training 0.70 8 Inactive
(FY11)
ANNEX 2: COMPREHENSIVE LIST OF PROGRAMS, BY LIFE-CYCLE
118

Program NameFunction (legend below)
Agency NatureBudget
(FY2019-20) BDT billion
Budget (FY2019-20) USD million
Status (as of FY2019-
20)
53 Income Generating Activities (IGA) for Women at Upazila Level 3.2 MoWCA Training 0.91 11 Active
54 Northern Areas Reduction of Poverty Initiatives (NARI) 3.2 MoLE Training 0.21 2 Inactive
(FY19)
55 Poverty Reduction Through Inclusive and Sustainable Markets (PRISM) 3.2 MoI Package 0.49 6 Active
56 Tottho Apa: Empowering Women Through ICT Towards Digital Bangladesh 3.2 MoWCA Training 1.30 15 Active
57 Urban Based Marginal Women Development 3.2 MoWCA Training 0.21 2 Active
58 Vulnerable Group Development (VGD) 3.2 MoWCA Package 16.99 200 Active
59 Vulnerable Group Development for the Ultra Poor (VGD-UP) 3.2 MoWCA Package 0.02 0 Inactive
(FY12)
60 Livelihood Development Programme For Bede and Underprivileged Community 3.2 MoSW Training 0.67 8 Active
61 Livelihood of Grameen People "Rural Community" Building 3.2 RDCD Package 0.25 3 Active
62 My House My Farm 3.2 RDCD Package 11.44 135 Active
63 Program for Ensuring Employment for the Ultra Poor in Northern area 3.2 RDCD Training 0.19 2 Active
64Creation of Employment and Self-employment Opportunities for Unemployed Youths in 7 District of North Bengal
3.2 MoYS Training 0.12 1 Inactive (FY16)
65 Programme for Livelihood Improvement of Tea-garden Labourers 3.2 MoSW Cash 0.25 3 Active
66 Rehabilitation and Creation of Alternative Employment for Beggars 3.2 MoSW Package 0.04 0 Active
67 Livelihood Development Programme For Hijra (Transgender) Community 3.2 MoSW Package 0.06 1 Active
68 Economic Empowerment of the Poor 3.2 RDCD Training 0.16 2 Inactive (FY17)
69Extension of Palli Daridra Bimochon Foundation (PDBF) Activities for Poverty Alleviation and Self Employment
3.2 RDCD Package 0.56 7 Inactive (FY18)
70 Integrated Rural Employment Support Project for the Poor Women (IRESPPW) 3.2 RDCD Training 0.33 4 Inactive
(FY17)
71 Food and Livelihood Security (FLS) 3.2 MoWCA Training 0.04 0 Inactive (FY15)
72 Investment Component for Vulnerable Group Development Project 3.2 MoWCA Package 1.43 17 Inactive
(FY18)
73 Regional Duck Breeding and Hatchery 3.2 MoFL Package 0.42 5 Inactive (FY18)
74 Adaptation to Climate Change and Rehabilitation of Livelihood 3.2 MoEF Package 0.02 0 Inactive
(FY18)
75Integrated Support to Poverty and Inequality Reduction through Enterprise Development Project (INSPIRED)
3.2 MoI Package 0.20 2 Inactive (FY17)
76Comprehensive and Sustainable Health, Education and Livelihood Development Project
3.2 Not found Package 0.28 3 Inactive (FY18)
77Create Employment Opportunities of Char Dwellers in Greater Rangpur Districts Through Sugarcane Cultivation
3.2 MoA Package 0.03 0 Inactive (FY15)
78 Small Scale Dairy & Poultry Farmers’ Support Project in 22 Selected Districts 3.2 MoFL Package 0.04 0 Inactive
(FY15)
119BANGLADESH SOCIAL PROTECTION PUBLIC EXPENDITURE REVIEW

Program NameFunction (legend below)
Agency NatureBudget
(FY2019-20) BDT billion
Budget (FY2019-20) USD million
Status (as of FY2019-
20)
79 Poverty Reduction through Urban Partnership 3.2 LGD Package 0.18 2 Inactive (FY16)
80
Food Security through Enhanced Agricultural Production, Diversified Sources of Income, Value Addition and Marketing in Bangladesh (Mymensingh/Sherpur) (FSMSP)
3.2 MoA Package 0.35 4 Inactive (FY18)
81 Ghare Fera Programme (Returning Home) 3.2 FD Package 0.05 1 Inactive (FY10)
82 Char Livelihood 3.2 LGD Package 0.01 0 Active (FY18)
83 Micro-credit for Women Self-employment 3.3 MoWCA Microcredit 0.06 1 Active
84 Special Fund for Assistance to Women Development & Entrepreneurs 3.3 FD Training 1.25 15 Active
85 Strengthening Women’s Ability for Productive New Opportunities (SWAPNO) 3.3 LGD Training 0.43 5 Active
86 Interest Free Micro-Credit Programme 3.3 MoSW Microcredit 0.58 7 Active
87 Micro-Credit through PKSF 3.3 FID Microcredit 7.85 93 Active
88 Improving Working Condition in the Ready-Made Garments Sector 4 MoWCA Service 1.04 12 Inactive
(FY17)
4. Elderly
89 Pension for Retired Government Employees and Their Families 1 FD Cash 230.10 2,714 Active
90 Pension Insurance Scheme 1 FD Cash 0.12 1 Active
91 Allowances for the Widowed, Deserted and Destitute Women (WA) 2.1 MoSW Cash 10.20 120 Active
92 Honorarium for Injured Freedom Fighters 2.1 MoLWA Cash 4.80 57 Active
93 Honorarium for Insolvent Freedom Fighters (HIFF) 2.1 MoLWA Cash 33.85 399 Active
94 Old Age Allowance (OAA) 2.1 MoSW Cash 26.40 311 Active
95 Ration for Shaheed Family and Injured Freedom Fighters 2.2 MoLWA Food 0.51 6 Active
96 Amader Bari (Our Home): Integrated Old and Children Home 4 MoSW Service 0.10 1 Inactive
(FY19)
97 Construction of Residence for Landless & Poor Freedom Fighter 4 MoLWA Service 1.00 12 Active
98Establishment of Multipurpose Rehabilitation Center for Destitute, Aged People and Socially Disabled Adolescent Girls
4 MoSW Service 0.04 0 Active (FY14)
99 Construction of Probin Nibas in Five Divisional Head Quarter & One Zila 4 MoSW Service 0.11 1 Inactive
(FY17)
5. Persons with disability
100 Allowances for the Financially Insolvent Disabled (DA) 2.1 MoSW Cash 13.91 164 Active
101 Stipend for Disabled Students (DSSd) 2.3 MoSW Cash 0.96 11 Active
102Construction of Vocational Training and Rehabilitation Centre for the Disabled at CRP, Manikganj
3.1. MoSW Training 0.01 0 Active
103 Fund for the Welfare of Burnt and Disabled 3.3 MoSW Microcredit 0.02 0 Active
104 Establishment of Autistic Academy in Bangladesh 4 MoE Service 0.60 7 Active
105 Service and Assistance Center for Disabled 4 MoSW Service 0.65 8 Active
106 Construction of Multipurpose Sports Complex for Person with Disability 4 MoSW Service - - Inactive
ANNEX 2: COMPREHENSIVE LIST OF PROGRAMS, BY LIFE-CYCLE
120

Program NameFunction (legend below)
Agency NatureBudget
(FY2019-20) BDT billion
Budget (FY2019-20) USD million
Status (as of FY2019-
20)
107
The Sustainable Socio-economic Development and Rehabilitation Programs of Underprivileged and Poor Disabled and Autistic People through Special Education, Health Care and Various Training Programs
4 MoSW Service 0.02 0 Active
108 Grants for the Schools for the Disabled 4 MoSW Service 0.28 3 Active
109 Trust for the Protection of the Persons with Neuro-developmental Disabilities 4 MoSW Service 0.28 3 Active
110 Welfare Trust for the Physical Disabilities 4 MoSW Service 0.15 2 Active
111 Promotion of Services & Opportunity to the Disabled Persons in Bangladesh 4 MoSW Service 0.65 8 Inactive
(FY18)
6. Household (poverty)
112 Allowances for Distressed Cultural Personalities/Activists 2.1 MoCA Cash 0.05 1 Inactive
(FY16)
113 Test Relief (TR) Cash 2.1 MoDMR Cash 15.30 180 Active
114 Work For Money (WFM) 2.1 MoDMR Cash 7.50 88 Active
115 Employment Generation Program for the Poorest (EGPP) 2.1 MoDMR Cash 16.50 195 Active
116 Assistance for Cancer, Kidney and Liver Cirrhosis Patients 2.1 MoSW Cash 1.50 18 Active
117 T.B., Leprosy, Communicable Non-communicable Disease 2.1 MoHFW Cash 7.53 89 Active
118 Vulnerable Group Feeding (VGF) 2.2 MoDMR Food 19.57 231 Active
119 Food Assistance in CTG-Hill Tracts Area 2.2 MoCHTA Food 3.12 37 Active
120 Food For Work (FFW) 2.2 MoDMR Food 12.04 142 Active
121 Test Relief (TR) Food 2.2 MoDMR Food 12.81 151 Active (FY17)
122 Project for Small Farmers Development Foundation 3.2 RDCD Package 0.10 1 Inactive
(FY12)
123 Jatka (Fish)Protection and Alternative Employment for Fishermen 3.2 MoHFW Package 0.01 0 Inactive
(FY14)
124 Social Development Foundation (SDF) 3.3 FID Microcredit 2.35 28 Active
125 Child and Maternal Health and Health Management Development 4 MoHFW Service 1.08 13 Active
126 Development of Living Standards of Extinct Enclaves 4 Not found Service 0.04 0 Active
127 Development of the Living Standard of the Marginal People of Bangladesh 4 MoSW Service 1.83 22 Active
128 Improved Life Standard for Low-Income People 4 LGD Service 0.42 5 Active
129 National Legal Aid 4 MoLJ Service 0.21 2 Active
130Providing Primary Health, Reproductive Health and Nutrition Services to Underprivileged Woman and Children
4 MoWCA Service 0.20 2 Active
131 Ashrayan 4 PMO Service 4.50 53 Active
132 Bangladesh National Social Welfare Council 4 MoSW Service 0.70 8 Active
133Initiative for Development Project, Empowerment, Awareness & Livelihood, Kurigram
4 LGD Service 0.05 1 Inactive (FY17)
134 Empowerment of communities, groups and individuals 4 Not found Service - - Inactive
135 Promotion of Legal and Social Empowerment 4 Not found Service 0.40 5 Inactive (FY12)
121BANGLADESH SOCIAL PROTECTION PUBLIC EXPENDITURE REVIEW

Program NameFunction (legend below)
Agency NatureBudget
(FY2019-20) BDT billion
Budget (FY2019-20) USD million
Status (as of FY2019-
20)
136 Support Service for Vulnerable Group 4 Not found Service 0.10 1 Inactive (FY13)
137 Multi-Sectoral Programme to Prevent on Violence Against Women (4th Phase) 4 MoWCA Service 0.27 3
138 Participatory Rural Development Project 5 LGD Service 0.07 1 Inactive (FY15)
139 Pro Poor Slum Integration 5 MoHPW Service 0.01 0 Inactive (FY16)
140Poverty Eradication and Ensuring Livelihood for the People Living in Economically Backward Areas
5 Not found Service 0.02 0 Inactive (FY16)
141 Comprehensive Village Development Project 5 LGD Service 0.13 2 Inactive (FY16)
142 Rural Settlement Construction for improvement of Rural Livelihood 5 LGD Service 0.90 11 Inactive
(FY18)
143 Char Development & Settlement Project 5 MoWR Service 2.27 27 Active
144 Construction of Colony for the Cleaners of Dhaka City Corporation 5 MoHPW Service 0.70 8 Active
145 Special Assistance for the Development of Char, Haor and Undevelopment Area 5 Not found Service 0.50 6 Active
146 Food Subsidy 6 FD Food 13.10 155 Active
147 Non-Bengali Rehabilitation 6 MoDMR Service 0.10 1 Active
148 Open Market Sales (OMS) 6 MoFd Food 9.50 112 Active
149 Food Friendly Program (FFP) 6 MoFd Food 26.24 309 Active
7. Household (Shock)
150 Fund for Assistance to the Small Farmer and Poultry Farms 2.1 FD Cash 1.00 12 Active
151 Gratuitous Relief (Food) 2.2 MoDMR Food 5.44 64 Active
152 Agriculture Rehabilitation 2.4 MoA Kind 1.20 14 Active
153 Block Allocation for Disaster Management 2.4 MoDMR Food & kind 2.43 29 Active
154 General Relief Activities 2.4 MoDMR Food & kind 3.70 44 Active
155 Variety of Relief Work 2.4 MoDMR Food & kind 0.81 10 Active
156 Housing Support 4 MoHPW+FID Service 0.25 3 Active
157 Infrastructure and livelihood Development in Haor Area 5 LGD Service 8.68 102 Active
158 Gucchagram (Climate Victims Rehabilitation Project) 5 MoL Service 1.65 19 Active
159 Emergency 2007 Cyclone Recovery and Restoration 5 LGD Service 3.39 40 Inactive
(FY18)
160 Flood Management and Livelihood Improvement Project in Haor Area 5 LGD+MoWR Service 5.52 65 Active
161 Rehabilitation of AILA Affected Rural Infrastructure 5 LGD Service 0.65 8 Inactive
(FY17)
162 Reconstruction of Houses of SIDR affected landless people 5 LGD Service 0.47 6 Inactive
(FY10)
8. Overall system
163 Cash Transfer Modernization (CTM) Project 7 MoSW Strengthened systems 0.31 4 Active
164 Promoting Nutrition Sensitive Social Security & Policy Support Programe 7 CD Strengthened
systems 0.06 1 Active
ANNEX 2: COMPREHENSIVE LIST OF PROGRAMS, BY LIFE-CYCLE
122

Program NameFunction (legend below)
Agency NatureBudget
(FY2019-20) BDT billion
Budget (FY2019-20) USD million
Status (as of FY2019-
20)
165 Social Security Policy Support (SSPS) Programme 7 PC Strengthened
systems 0.03 0 Active
166 Strengthening Public Financial Management for Social Protection 7 FD Strengthened
systems 0.17 2 Active
167 Operations Support to the Employment Generation Program for the Poorest 7 MoDMR Strengthened
systems - - Active
Non/marginal Social Protection
168 Capacity Building of Joyeeta Foundation & Construction of Joyeeta Tower n.a. MoWCA n.a. 0.52 6 Active
169 Agriculture Infrastructure Improvement n.a. LGD n.a. 0.41 5 Active
170 Bangladesh Rural Water Supply and Sanitation n.a. LGD n.a. 2.00 24 Active
171 Special Rural Water Supply n.a. LGD n.a. 1.49 18 Inactive(FY18)
172 Block Allocation for Various Programs n.a. FD n.a. 14.63 173 Active
173 Clinical Contraception Services Delivery n.a. MoHFW n.a. 2.86 34 Active
174 Coastal Climate Resilient Infrastructure Improvement (CCRIP) n.a. LGD n.a. 1.56 18 Active
175 Construction of Flood Shelter in Flood Prone and River-Erosion Areas n.a. MoDMR n.a. 1.55 18 Active
176 Construction of the Multipurpose Disaster Shelters n.a. LGD n.a. 2.10 25 Active
177 Development Support for Special Needs n.a. Not found n.a. 9.62 113 Active
178 Essential Services Delivery & Community based Health Care n.a. MoHFW n.a. 9.88 117 Active
179 Community based Health Care n.a. MoHFW n.a. 0.07 1 Inactive (FY18)
180 Essential Services Delivery n.a. MoHFW n.a. 0.29 3 Inactive (FY17)
181 Family Planning Field Services Delivery n.a. MoHFW n.a. 3.10 37 Active
182 Fund for Climate Change n.a. MoEF n.a. 3.00 35 Active
183 Grameen Infrastructure Development n.a. LGD n.a. 41.26 487 Active
184 Lump Provision for Development of Special Areas (Except Hill Tracts) n.a. PMO n.a. 0.50 6 Active
185 Maternal, Child, Reproductive and Adolescent Health (MCRAH) n.a. MoHFW n.a. 2.35 28 Active
186 Maternal, Neonatal, Child and Adolescent Health (MNCAH) n.a. MoHFW n.a. 9.29 110 Active
187 Participatory Small Scale Water Resources Development n.a. LGD n.a. 0.30 4 Inactive
(FY19)
188 Preferential Village Water Supply n.a. LGD n.a. 5.02 59 Active
189 Rural Infrastructure Development n.a. LGD n.a. 4.20 50 Active
190 Second Chittagong Hill Tracts Rural Development Project (CHTRDPII) (LGED part) n.a. LGD n.a. 0.70 8 Active
191 Skill Development and Earthquake Risk Management Fund n.a. MoDMR n.a. 4.00 47 Active
192 Construction of Flood Shelter in Flood Prone and River-Erosion Areas n.a. LGD n.a. 0.56 7 Active
193 Urban Public Environmental Health Center Development Program (UPEHSDP) n.a. LGD n.a. 1.04 12 Active
194 Urban Resilience Project n.a. MoDMR n.a. 6.27 74 Active
195 Bangladesh Climate Resilient Participatory Afforestation and Reforestation n.a. MoEF n.a. 0.78 9 Inactive
(FY17)
196 Disaster and Climate Resilient n.a. MoDMR n.a. 0.50 6 Inactive (FY17)
123BANGLADESH SOCIAL PROTECTION PUBLIC EXPENDITURE REVIEW

Program NameFunction (legend below)
Agency NatureBudget
(FY2019-20) BDT billion
Budget (FY2019-20) USD million
Status (as of FY2019-
20)
197 Improvement and Quality Seed Production of Rice, Wheat and Maize n.a. MoA n.a. 0.55 6 Inactive
(FY18)
198 Greater Comilla Rural Infrastructure Development Project n.a. LGD n.a. 0.34 4 Inactive
(FY18)
199 Institute of Pediatric Neuro Disorder and Autism in BSMMU n.a. MoHFW n.a. 0.14 2 Inactive
(FY18)
200 Pulse and Oil Seed Project n.a. MoA n.a. 0.06 1 Inactive (FY18)
201Community Based Adaptation to Climate Change through Coastal Afforestation in Bangladesh
n.a. MoEF n.a. 0.05 1 Inactive (FY17)
202 Mujibnagar Integrated Agricultural Development Project n.a. MoA n.a. 4.23 50 Inactive
(FY17)
203 Sisimpur Outreach Project n.a. MoWCA n.a. 0.01 0 Inactive (FY14)
204 Water Supply and Sanitation Project in Cyclone Prone Sidr Affected Coastal Area n.a. LGD n.a. 0.29 3 Inactive
(FY15)
205 Comprehensive Disaster Management Program n.a. MoDMR n.a. 0.91 11 Inactive
(FY16)
206Integrated Fisheries & Livestock Development Project in Flood Control, Drainage and Irrigation
n.a. MoFL n.a. 0.20 2 Inactive (FY17)
207 Projects Undertaken for Fisheries Development n.a. MoFL n.a. 0.34 4 Inactive
(FY14)
208 Expansion of Existing Prime Mother and Child Care Hospital with Research Facilities n.a. MoHFW n.a. - - Inactive
209 Urban Primary Health Care Services Delivery Project n.a. LGD n.a. 0.57 7 Inactive
(FY18)
210 Post Literacy Education Project for Human Resource Development n.a. MoPME n.a. 0.95 11 Inactive
(FY12)
211 Disaster Risk Mitigation and Reduction n.a. MoDMR n.a. 0.24 3 Inactive (FY13)
212 Special Program for Irrigation and Water Logging n.a. MoA n.a. 1.50 18 Inactive
(FY13)
213 Poverty Eradication Through Social Afforestation n.a. MoEF n.a. 0.33 4 Inactive
(FY14)
214 NGO Foundation n.a. FD n.a. 0.10 1 Inactive (FY12)
215 Regional Fisheries and Livestock Development n.a. MoFL n.a. 0.29 3 Inactive (FY13)
216 Fishermen ID Card and Fisheries Project n.a. MoFL n.a. 0.11 1 Inactive (FY17)
217 Micro-Nutrient Supplementation n.a. MoHFW n.a. 0.22 3 Inactive (FY10)
218 National Nutrition Services n.a. MoHFW n.a. 0.96 11 Active
219 Revitalization of Community Health Care Initiative in Bangladesh n.a. MoHFW n.a. 6.87 81 Inactive
(FY18)
220 National Sanitation Project n.a. LGD n.a. 0.41 5 Inactive (FY18)
221 Health Economic Financing n.a. MoHFW n.a. 0.07 1 Inactive (FY18)
ANNEX 2: COMPREHENSIVE LIST OF PROGRAMS, BY LIFE-CYCLE
124

Nature of intervention
1. Social insurance - Pension Contributory/earnings related pensions and savings programs2.1 Social assistance - Cash Poverty targeted cash transfers2.2. Social assistance - Public workfare (cash) Poverty targeted conditional cash transfers through public workfare
2.3. Social assistance - Cash (one-off) Poverty targeted one-off cash transfers for specific shocks faced by households
2.4. Social assistance - Food Poverty targeted food distribution2.5. Social assistance - Public workfare (food) Poverty targeted conditional food distribution through public workfare2.6. Social assistance - Stipend Scholarships benefits/educational fee waivers2.7. Social assistance - Kind and/or food In-kind emergency support3.1 Labor market program - Technical/vocational skills development Training (vocational, life skills, cash for training), internship
3.2 Labor market program - Economic inclusion Income generating activity training, in-kind support, market linkage3.3 Labor market program - Entrepreneurship support / Startup incentives Cash and in kind grant, loans, training
4. Social Care Service Day care services for vulnerable children, orphans; foster care; care for the disabled; support services for vulnerable groups
5. Community development Infrastructure development restoration and human development at the community level
6. General subsidies Food subsidies, Fuel subsidies, Electricity subsidies
7. Technical Assistance Strengthening of policy and systems for improved administration of social protection
LEGEND
125BANGLADESH SOCIAL PROTECTION PUBLIC EXPENDITURE REVIEW

Program NameFunction (legend below)
Agency NatureBudget
(FY2019-20) BDT billion
Budget (FY2019-20) USD million
Status (as of FY2019-
20)
1. Social insurance - Pension
1 Pension for Retired Government Employees and Their Families 4. Elderly Cash FD 230.10 2,714 Active
2 Pension Insurance Scheme 4. Elderly Cash FD 0.12 1 Active
2.1 Social assistance - Cash
3 Allowances for Urban Lactating Mothers (AULM)
1. Pregnancy & Early
ChildhoodCash MoWCA 2.73 32 Active
4 Income Support Program for the Poorest (ISPP) - JAWTNO
1. Pregnancy & Early
ChildhoodCash LGD 7.78 92 Active
5 Maternity Allowance Programme for the Poor (MAPP)
1. Pregnancy & Early
ChildhoodCash MoWCA 7.63 90 Active
6 Maternal Health Voucher Scheme (MHVS)1. Pregnancy
& Early Childhood
Cash MoHFW - - Active
7 Allowances for the Widowed, Deserted and Destitute Women (WA) 4. Elderly Cash MoSW 10.20 120 Active
8 Honorarium for Injured Freedom Fighters 4. Elderly Cash MoLWA 4.80 57 Active
9 Honorarium for Insolvent Freedom Fighters (HIFF) 4. Elderly Cash MoLWA 33.85 399 Active
10 Old Age Allowance (OAA) 4. Elderly Cash MoSW 26.40 311 Active
11 Allowances for the Financially Insolvent Disabled (DA)
5. Persons with
disabilityCash MoSW 13.91 164 Active
12 Allowances for Distressed Cultural Personalities/Activists
6. Household (poverty) Cash MoCA 0.05 1 Inactive
(FY16)
2.1 Social assistance - One-off
13 Fund for Assistance to the Small Farmer and Poultry Farms
7. Household (shock) Cash FD 1.00 12 Active
14 Assistance for Cancer, Kidney and Liver Cirrhosis Patients
6. Household (poverty) Cash MoSW 1.50 18 Active
15 T.B., Leprosy, Communicable Non-communicable Disease
6. Household (poverty) Cash MoHFW 7.53 89 Active
2.1 Social assistance - Public workfare (cash)
16 Test Relief (TR) Cash 6. Household (poverty) Cash MoDMR 15.30 180 Active
17 Work for Money (WFM) 6. Household (poverty) Cash MoDMR 7.50 88 Active
ANNEX 3: COMPREHENSIVE LIST OF PROGRAMS, BY FUNCTION.Notes: 1. This is a compilation of programs and projects in social protection since FY2009-10 based on the list published by Finance Division.
About 130 of these are currently active. 2. Some programs’/projects’ latest budgets were not found possibly because they were reported as part of larger programs.3. Some programs/projects may appear ‘inactive’ in the list even though they might be active possibly because they were dropped from
the list of safety nets by Finance Division.
126

Program NameFunction (legend below)
Agency NatureBudget
(FY2019-20) BDT billion
Budget (FY2019-20) USD million
Status (as of FY2019-
20)
18 Employment Generation Program for the Poorest (EGPP)
6. Household (poverty) Cash MoDMR 16.50 195 Active
19 Rural Employment and Road Maintenance Programme
3. Working age Cash LGD 1.10 13 Inactive
(FY17)
20 Rural Employment Opportunity for Public Asset (REOPA)
3. Working age Cash LGD 0.38 4 Inactive
(FY12)
2.2 Social assistance - Food
21 School Feeding Programme (SFP)2. School-
aged children
Food MoPME 4.75 56 Active
22 Gratuitous Relief (Food) 7. Household (shock) Food MoDMR 5.44 64 Active
23 Ration for Shaheed Family and Injured Freedom Fighters 4. Elderly Food MoLWA 0.51 6 Active
24 Vulnerable Group Feeding (VGF) 6. Household (poverty) Food MoDMR 19.57 231 Active
25 Food Assistance in CTG-Hill Tracts Area 6. Household (poverty) Food MoCHTA 3.12 37 Active
2.2 Social assistance - Public Workfare (food)
26 Food for Work (FFW) 6. Household (poverty) Food MoDMR 12.04 142 Active
27 Test Relief (TR) Food 6. Household (poverty) Food MoDMR 12.81 151 Inactive
(FY17)
2.3 Social assistance - Stipend
28 Capitation Grants for Orphan Students in Non-Government Orphanages
2. School-aged
childrenCash MoSW 1.20 14 Active
29 Primary Education Stipend Program (PESP)2. School-
aged children
Cash MoPME 7.22 85 Active
30 Reaching Out of School Children (ROSC)2. School-
aged children
Cash MoPME 1.56 18 Active
31 Secondary Education Development Programe (SEDP)
2. School-aged
childrenCash MoE 10.00 118 Active
32 Secondary Education Sector Investment Program (SESIP)
2. School-aged
childrenCash MoE 8.50 100 Active
33 Secondary Education Stipend Program (SESP)
2. School-aged
childrenCash MoE 1.05 12 Active
34 Secondary Education Quality and Access Enhancement Project (SEQAEP)
2. School-aged
childrenCash MoE 3.66 43 Inactive
(FY18)
35 Higher Secondary Stipend2. School-
aged children
Cash MoE 0.03 0 Active
36 Higher Secondary Female Stipend Project2. School-
aged children
Cash MoE - - Inactive
37 Female Stipend for Bachelor's and Equivalent Level
2. School-aged
childrenCash MoE 0.03 0 Inactive
(FY17)
127BANGLADESH SOCIAL PROTECTION PUBLIC EXPENDITURE REVIEW
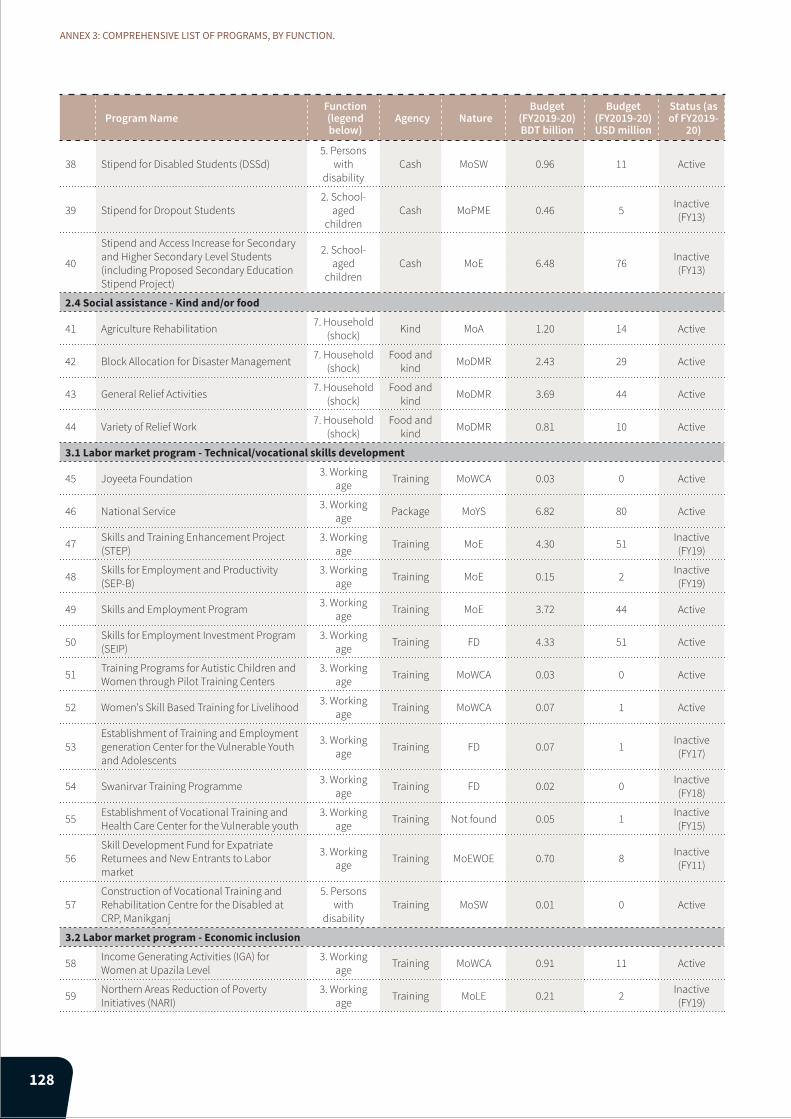
Program NameFunction (legend below)
Agency NatureBudget
(FY2019-20) BDT billion
Budget (FY2019-20) USD million
Status (as of FY2019-
20)
38 Stipend for Disabled Students (DSSd)5. Persons
with disability
Cash MoSW 0.96 11 Active
39 Stipend for Dropout Students2. School-
aged children
Cash MoPME 0.46 5 Inactive (FY13)
40
Stipend and Access Increase for Secondary and Higher Secondary Level Students (including Proposed Secondary Education Stipend Project)
2. School-aged
childrenCash MoE 6.48 76 Inactive
(FY13)
2.4 Social assistance - Kind and/or food
41 Agriculture Rehabilitation 7. Household (shock) Kind MoA 1.20 14 Active
42 Block Allocation for Disaster Management 7. Household (shock)
Food and kind MoDMR 2.43 29 Active
43 General Relief Activities 7. Household (shock)
Food and kind MoDMR 3.69 44 Active
44 Variety of Relief Work 7. Household (shock)
Food and kind MoDMR 0.81 10 Active
3.1 Labor market program - Technical/vocational skills development
45 Joyeeta Foundation 3. Working age Training MoWCA 0.03 0 Active
46 National Service 3. Working age Package MoYS 6.82 80 Active
47 Skills and Training Enhancement Project (STEP)
3. Working age Training MoE 4.30 51 Inactive
(FY19)
48 Skills for Employment and Productivity (SEP-B)
3. Working age Training MoE 0.15 2 Inactive
(FY19)
49 Skills and Employment Program 3. Working age Training MoE 3.72 44 Active
50 Skills for Employment Investment Program (SEIP)
3. Working age Training FD 4.33 51 Active
51 Training Programs for Autistic Children and Women through Pilot Training Centers
3. Working age Training MoWCA 0.03 0 Active
52 Women's Skill Based Training for Livelihood 3. Working age Training MoWCA 0.07 1 Active
53Establishment of Training and Employment generation Center for the Vulnerable Youth and Adolescents
3. Working age Training FD 0.07 1 Inactive
(FY17)
54 Swanirvar Training Programme 3. Working age Training FD 0.02 0 Inactive
(FY18)
55 Establishment of Vocational Training and Health Care Center for the Vulnerable youth
3. Working age Training Not found 0.05 1 Inactive
(FY15)
56Skill Development Fund for Expatriate Returnees and New Entrants to Labor market
3. Working age Training MoEWOE 0.70 8 Inactive
(FY11)
57Construction of Vocational Training and Rehabilitation Centre for the Disabled at CRP, Manikganj
5. Persons with
disabilityTraining MoSW 0.01 0 Active
3.2 Labor market program - Economic inclusion
58 Income Generating Activities (IGA) for Women at Upazila Level
3. Working age Training MoWCA 0.91 11 Active
59 Northern Areas Reduction of Poverty Initiatives (NARI)
3. Working age Training MoLE 0.21 2 Inactive
(FY19)
ANNEX 3: COMPREHENSIVE LIST OF PROGRAMS, BY FUNCTION.
128

Program NameFunction (legend below)
Agency NatureBudget
(FY2019-20) BDT billion
Budget (FY2019-20) USD million
Status (as of FY2019-
20)
60 Poverty Reduction Through Inclusive and Sustainable Markets (PRISM)
3. Working age Package MoI 0.49 6 Active
61 Tottho Apa: Empowering Women Through ICT Towards Digital Bangladesh
3. Working age Training MoWCA 1.30 15 Active
62 Urban Based Marginal Women Development
3. Working age Training MoWCA 0.21 2 Active
63 Vulnerable Group Development (VGD) 3. Working age Package MoWCA 16.99 200 Active
64 Vulnerable Group Development for the Ultra Poor (VGD-UP)
3. Working age Package MoWCA 0.02 0 Inactive
(FY12)
65 Livelihood Development Programme For Bede and Underprivileged Community
3. Working age Training MoSW 0.67 8 Active
66 Livelihood of Grameen People "Rural Community" Building
3. Working age Package RDCD 0.25 3 Active
67 My House My Farm 3. Working age Package RDCD 11.44 135 Active
68 Program for Ensuring Employment for the Ultra Poor in Northern area
3. Working age Training RDCD 0.19 2 Active
69Creation of Employment and Self-employment Opportunities for Unemployed Youths in 7 District of North Bengal
3. Working age Training MoYS 0.12 1 Inactive
(FY16)
70 Programme for Livelihood Improvement of Tea-garden Laborers
3. Working age Cash MoSW 0.25 3 Active
71 Rehabilitation and Creation of Alternative Employment for Beggars
3. Working age Package MoSW 0.04 0 Active
72 Livelihood Development Programme For Hijra (Transgender) Community
3. Working age Package MoSW 0.06 1 Active
73 Economic Empowerment of the Poor 3. Working age Training RDCD 0.16 2 Inactive
(FY17)
74Extension of Palli Daridra Bimochon Foundation (PDBF) Activities for Poverty Alleviation and Self Employment
3. Working age Package RDCD 0.56 7 Inactive
(FY18)
75 Integrated Rural Employment Support Project for the Poor Women (IRESPPW)
3. Working age Training RDCD 0.33 4 Inactive
(FY17)
76 Food and Livelihood Security (FLS) 3. Working age Training MoWCA 0.04 0 Inactive
(FY15)
77 Investment Component for Vulnerable Group Development Project
3. Working age Package MoWCA 1.43 17 Inactive
(FY18)
78 Regional Duck Breeding and Hatchery 3. Working age Package MoFL 0.42 5 Inactive
(FY18)
79 Adaptation to Climate Change and Rehabilitation of Livelihood
3. Working age Package MoEF 0.02 0 Inactive
(FY18)
80Integrated Support to Poverty and Inequality Reduction through Enterprise Development Project (INSPIRED)
3. Working age Package MoI - - Inactive
(FY17)
81Comprehensive and Sustainable Health, Education and Livelihood Development Project
3. Working age Package Not found 0.28 3 Inactive
(FY18)
82Create Employment Opportunities of Char Dwellers in Greater Rangpur Districts Through Sugarcane Cultivation
3. Working age Package MoA 0.03 0 Inactive
(FY15)
83 Small Scale Dairy & Poultry Farmers’ Support Project in 22 Selected Districts
3. Working age Package MoFL 0.04 0 Inactive
(FY15)
84 Poverty Reduction through Urban Partnership
3. Working age Package LGD 0.18 2 Inactive
(FY16)
129BANGLADESH SOCIAL PROTECTION PUBLIC EXPENDITURE REVIEW

Program NameFunction (legend below)
Agency NatureBudget
(FY2019-20) BDT billion
Budget (FY2019-20) USD million
Status (as of FY2019-
20)
85
Food Security through Enhanced Agricultural Production, Diversified Sources of Income, Value Addition and Marketing in Bangladesh (Mymensingh/Sherpur) (FSMSP)
3. Working age Package MoA 0.35 4 Inactive
(FY18)
86 Ghare Fera Programme (Returning Home) 3. Working age Package FD 0.05 1 Inactive
(FY10)
87 Char Livelihood 3. Working age Package LGD 0.01 0 Active
(FY18)
88 Project for Small Farmers Development Foundation
6. Household (poverty) Package RDCD 0.1 1 Inactive
(FY12)
89 Jatka (Fish)Protection and Alternative Employment for Fishermen
6. Household (poverty) Package MoHFW 0.01 0 Inactive
(FY14)
3.3 Labor market program - Entrepreneurship support / Startup incentives
90 Micro-credit for Women Self-employment 3. Working age Microcredit MoWCA 0.06 1 Active
91 Special Fund for Assistance to Women Development & Entrepreneurs
3. Working age Training FD 1.25 15 Active
92 Strengthening Women’s Ability for Productive New Opportunities (SWAPNO)
3. Working age Training LGD 0.43 5 Active
93 Interest Free Micro-Credit Programme 3. Working age Microcredit MoSW 0.58 7 Active
94 Micro-Credit through PKSF 3. Working age Microcredit FID 7.85 93 Active
95 Fund for the Welfare of Burnt and Disabled5. Persons
with disability
Microcredit MoSW 0.02 0 Active
96 Social Development Foundation (SDF) 6. Household (poverty) Microcredit FID 2.35 28 Active
4. Social Care Service
97 Early Learning for Child Development1. Pregnancy
& Early Childhood
Service MoWCA 0.19 2 Active
98 Establishment of 20 Child Daycare Center Project
1. Pregnancy & Early
ChildhoodService MoWCA 0.12 1 Active
99 Day Care Programme for Lower- and Middle-Income Working Women
1. Pregnancy & Early
ChildhoodService MoWCA - - Inactive
100 Establishment/re-establishment of Sarkari Shishu Paribar and Baby Home
1. Pregnancy & Early
ChildhoodService MoSW 0.2 2 Active
101 Shishu Bikash Kendra (Child Development Center)
1. Pregnancy & Early
ChildhoodService MoSW 0.06 1 Active
102 Child Protection and Child Welfare1. Pregnancy
& Early Childhood
Service MoSW 1.89 22 Active
103 Services for Children at Risk2. School-
aged children
Service MoSW 0.17 2 Inactive (FY17)
104 Development of Haji Nowab Ali Khan Orphanage
2. School-aged
childrenService MoSW 0.07 1 Active
105 Construction of Hostel for Govt. Orphanage2. School-
aged children
Service MoSW 0.5 6 Inactive (FY17)
ANNEX 3: COMPREHENSIVE LIST OF PROGRAMS, BY FUNCTION.
130

Program NameFunction (legend below)
Agency NatureBudget
(FY2019-20) BDT billion
Budget (FY2019-20) USD million
Status (as of FY2019-
20)
106Establishment of Hostel for Government Shishu Paribar and Visually Impaired Children
2. School-aged
childrenService MoSW 0.29 3 Inactive
(FY18)
107 Fundamental Education for Urban Working Children
2. School-aged
childrenService MoPME 0.38 4 Active
(FY18)
108 Generation Break through2. School-
aged children
Service MoWCA 0.03 0 Active
109 Grants for Residents in Government Orphanages and other Institutions
2. School-aged
childrenService MoSW 0.64 8 Active
110 Street Children Rehabilitation Programme2. School-
aged children
Service MoSW 0.04 0 Active
111 Eradication of Hazardous Child Labour in Bangladesh (3rd Phase)
2. School-aged
childrenService MoLE 0.42 5 Inactive
(FY14)
112 Amader Bari (Our Home): Integrated Old and Children Home 4. Elderly Service MoSW 0.10 1 Inactive
(FY19)
113 Construction of Residence for Landless & Poor Freedom Fighter 4. Elderly Service MoLWA 1.00 12 Active
114 Establishment of Autistic Academy in Bangladesh
5. Persons with
disabilityService MoE 0.60 7 Active
115 Service and Assistance Center for Disabled5. Persons
with disability
Service MoSW 0.65 8 Active
116 Construction of Multipurpose Sports Complex for Person with Disability
5. Persons with
disabilityService MoSW - - Inactive
117Establishment of Multipurpose Rehabilitation Center for Destitute, Aged People and Socially Disabled Adolescent Girls
4. Elderly Service MoSW 0.04 0 Active (FY14)
118
The Sustainable Socio-economic Development and Rehabilitation Programs of Underprivileged and Poor Disabled and Autistic People through Special Education, Health Care and Various Training Programs
5. Persons with
disabilityService MoSW 0.02 0 Active
119 Child and Maternal Health and Health Management Development
6. Household (poverty) Service MoHFW 1.08 13 Active
120 Development of Living Standards of Extinct Enclaves
6. Household (poverty) Service Not found 0.04 0 Active
121 Development of the Living Standard of the Marginal People of Bangladesh
6. Household (poverty) Service MoSW 1.83 22 Active
122 Improved Life Standard for Low-Income People
6. Household (poverty) Service LGD 0.42 5 Active
123 National Legal Aid 6. Household (poverty) Service MoLJ 0.21 2 Active
124Providing Primary Health, Reproductive Health and Nutrition Services to Underprivileged Woman and Children
6. Household (poverty) Service MoWCA 0.20 2 Active
125 Enabling Environment for Child Rights2. School-
aged children
Service MoWCA 0.26 3 Inactive (FY17)
126 Housing Support 7. Household (shock) Service MoHPW+
FID 0.25 3 Active
131BANGLADESH SOCIAL PROTECTION PUBLIC EXPENDITURE REVIEW

Program NameFunction (legend below)
Agency NatureBudget
(FY2019-20) BDT billion
Budget (FY2019-20) USD million
Status (as of FY2019-
20)
127Construction of Facilities at Dharmarajika Buddha Maha Bihar for Orphans and Disadvantaged
2. School-aged
childrenService MoSW 0.07 1 Inactive
(FY18)
128 Oppressed Women and Children Welfare Fund
2. School-aged
childrenService MoWCA 0.50 6 Active
129 Grants for the Schools for the Disabled5. Persons
with disability
Service MoSW 0.28 3 Active
130 Trust for the Protection of the Persons with Neuro-developmental Disabilities
5. Persons with
disabilityService MoSW 0.28 3 Active
131 Welfare Trust for the Physical Disabilities5. Persons
with disability
Service MoSW 0.15 2 Active
132 Ashrayan 6. Household (poverty) Service PMO 4.50 53 Active
133 Bangladesh National Social Welfare Council 6. Household (poverty) Service MoSW 0.70 8 Active
134Initiative for Development Project, Empowerment, Awareness & Livelihood, Kurigram
6. Household (poverty) Service LGD 0.05 1 Inactive
(FY17)
135 Empowerment of communities, groups and individuals
6. Household (poverty) Service Not found - - Inactive
136 Construction of Probin Nibas in Five Divisional Head Quarter & One Zila 4. Elderly Service MoSW 0.11 1 Inactive
(FY17)
137 Rehabilitation Centre for Destitute Children, Konabari, Gazipur
2. School-aged
childrenService MoSW - - Inactive
138 Expansion and Development Project of PROYAS at Dhaka Cantonment
2. School-aged
childrenService MoSW 0.13 2 Inactive
(FY14)
139 Child Sensitive Social Protection2. School-
aged children
Service MoWCA 0.07 1 Inactive (FY17)
140 Improving Working Condition in the Ready-Made Garments Sector
3. Working age Service MoWCA 1.04 12 Inactive
(FY17)
141 Promotion of Services & Opportunity to the Disabled Persons in Bangladesh
5. Persons with
disabilityService MoSW 0.65 8 Inactive
(FY18)
142 Promotion of Legal and Social Empowerment
6. Household (poverty) Service Not found 0.40 5 Inactive
(FY12)
143 Support Service for Vulnerable Group 6. Household (poverty) Service Not found 0.10 1 Inactive
(FY13)
144 Multi-Sectoral Programme to Prevent on Violence Against Women (4th Phase)
6. Household (poverty) Service MoWCA 0.27 3 Active
5. Community development
145 Infrastructure and livelihood Development in Haor Area
7. Household (shock) Service LGD 8.68 102 Active
146 Gucchagram (Climate Victims Rehabilitation Project)
7. Household (shock) Service MoL 1.65 19 Active
147 Emergency 2007 Cyclone Recovery and Restoration
7. Household (shock) Service LGD 3.39 40 Inactive
(FY18)
148 Flood Management and Livelihood Improvement Project in Haor Area
7. Household (shock) Service LGD+MoWR 5.52 65 Active
149 Rehabilitation of AILA Affected Rural Infrastructure
7. Household (shock) Service LGD 0.65 8 Inactive
(FY17)
150 Participatory Rural Development Project 6. Household (poverty) Service LGD 0.07 1 Inactive
(FY15)
151 Pro Poor Slum Integration 6. Household (poverty) Service MoHPW 0.01 0 Inactive
(FY16)
152Poverty Eradication and Ensuring Livelihood for the People Living in Economically Backward Areas
6. Household (poverty) Service Not found 0.02 0 Inactive
(FY16)
ANNEX 3: COMPREHENSIVE LIST OF PROGRAMS, BY FUNCTION.
132

Program NameFunction (legend below)
Agency NatureBudget
(FY2019-20) BDT billion
Budget (FY2019-20) USD million
Status (as of FY2019-
20)
153 Comprehensive Village Development Project
6. Household (poverty) Service LGD 0.13 2 Inactive
(FY16)
154 Reconstruction of Houses of SIDR affected landless people
7. Household (shock) Service LGD 0.47 6 Inactive
(FY10)
155 Rural Settlement Construction for improvement of Rural Livelihood
6. Household (poverty) Service LGD 0.90 11 Inactive
(FY18)
156 Char Development & Settlement Project 6. Household (poverty) Service MoWR 2.27 27 Active
157 Construction of Colony for the Cleaners of Dhaka City Corporation
6. Household (poverty) Service MoHPW 0.70 8 Active
158 Special Assistance for the Development of Char, Haor and Undevelopment Area
6. Household (poverty) Service Not found 0.50 6 Active
6. General subsidies
159 Food Subsidy 6. Household (poverty) Food FD 13.10 155 Active
160 Non-Bengali Rehabilitation 6. Household (poverty) Service MoDMR 0.10 1 Active
161 Open Market Sales (OMS) 6. Household (poverty) Food MoFd 9.49 112 Active
162 Food Friendly Program (FFP) 6. Household (poverty) Food MoFd 26.24 309 Active
7. Technical Assistance
163 Cash Transfer Modernization (CTM) Project 8. Overall system
Strengthened systems MoSW 0.31 4 Active
164 Promoting Nutrition Sensitive Social Security & Policy Support Programe
8. Overall system
Strengthened systems CD 0.06 1 Active
165 Social Security Policy Support (SSPS) Programme
8. Overall system
Strengthened systems PC 0.03 0 Active
166 Strengthening Public Financial Management for Social Protection
8. Overall system
Strengthened systems FD 0.17 2 Active
167 Operations Support to the Employment Generation Program for the Poorest
8. Overall system
Strengthened systems MoDMR - - Active
Non/marginal Social Protection
168 Capacity Building of Joyeeta Foundation & Construction of Joyeeta Tower n.a. MoWCA n.a. 0.52 6 Active
169 Agriculture Infrastructure Improvement n.a. LGD n.a. 0.41 5 Active
170 Bangladesh Rural Water Supply and Sanitation n.a. LGD n.a. 2.00 24 Active
171 Special Rural Water Supply n.a. LGD n.a. 1.49 18 Inactive (FY18)
172 Block Allocation for Various Programs n.a. FD n.a. 14.63 173 Active
173 Clinical Contraception Services Delivery n.a. MoHFW n.a. 2.86 34 Active
174 Coastal Climate Resilient Infrastructure Improvement (CCRIP) n.a. LGD n.a. 1.56 18 Active
175 Construction of Flood Shelter in Flood Prone and River-Erosion Areas n.a. MoDMR n.a. 1.55 18 Active
176 Construction of the Multipurpose Disaster Shelters n.a. LGD n.a. 2.10 25 Active
177 Development Support for Special Needs n.a. Not found n.a. 9.62 113 Active
178 Essential Services Delivery & Community based Health Care n.a. MoHFW n.a. 9.88 117 Active
179 Community based Health Care n.a. MoHFW n.a. 0.07 1 Inactive (FY18)
180 Essential Services Delivery n.a. MoHFW n.a. 0.29 3 Inactive (FY17)
181 Family Planning Field Services Delivery n.a. MoHFW n.a. 3.10 37 Active
182 Fund for Climate Change n.a. MoEF n.a. 3.00 35 Active
183 Grameen Infrastructure Development n.a. LGD n.a. 41.26 487 Active
133BANGLADESH SOCIAL PROTECTION PUBLIC EXPENDITURE REVIEW

Program NameFunction (legend below)
Agency NatureBudget
(FY2019-20) BDT billion
Budget (FY2019-20) USD million
Status (as of FY2019-
20)
184 Lump Provision for Development of Special Areas (Except Hill Tracts) n.a. PMO n.a. 0.50 6 Active
185 Maternal, Child, Reproductive and Adolescent Health (MCRAH) n.a. MoHFW n.a. 2.35 28 Active
186 Maternal, Neonatal, Child and Adolescent Health (MNCAH) n.a. MoHFW n.a. 9.29 110 Active
187 Participatory Small Scale Water Resources Development n.a. LGD n.a. 0.30 4 Inactive
(FY19)
188 Preferential Village Water Supply n.a. LGD n.a. 5.02 59 Active
189 Rural Infrastructure Development n.a. LGD n.a. 4.20 50 Active
190Second Chittagong Hill Tracts Rural Development Project (CHTRDPII) (LGED part)
n.a. LGD n.a. 0.70 8 Active
191 Skill Development and Earthquake Risk Management Fund n.a. MoDMR n.a. 4.00 47 Active
192 Construction of Flood Shelter in Flood Prone and River-Erosion Areas n.a. LGD n.a. 0.56 7 Active
193 Urban Public Environmental Health Center Development Program (UPEHSDP) n.a. LGD n.a. 1.04 12 Active
194 Urban Resilience Project n.a. MoDMR n.a. 6.27 74 Active
195 Bangladesh Climate Resilient Participatory Afforestation and Reforestation n.a. MoEF n.a. 0.78 9 Inactive
(FY17)
196 Disaster and Climate Resilient n.a. MoDMR n.a. 0.50 6 Inactive (FY17)
197 Improvement and Quality Seed Production of Rice, Wheat and Maize n.a. MoA n.a. 0.55 6 Inactive
(FY18)
198 Greater Comilla Rural Infrastructure Development Project n.a. LGD n.a. 0.34 4 Inactive
(FY18)
199 Institute of Pediatric Neuro Disorder and Autism in BSMMU n.a. MoHFW n.a. 0.14 2 Inactive
(FY18)
200 Pulse and Oil Seed Project n.a. MoA n.a. 0.06 1 Inactive (FY18)
201Community Based Adaptation to Climate Change through Coastal Afforestation in Bangladesh
n.a. MoEF n.a. 0.05 1 Inactive (FY17)
202 Mujibnagar Integrated Agricultural Development Project n.a. MoA n.a. 4.23 50 Inactive
(FY17)
203 Sisimpur Outreach Project n.a. MoWCA n.a. 0.01 0 Inactive (FY14)
204 Water Supply and Sanitation Project in Cyclone Prone Sidr Affected Coastal Area n.a. LGD n.a. 0.29 3 Inactive
(FY15)
205 Comprehensive Disaster Management Program n.a. MoDMR n.a. 0.91 11 Inactive
(FY16)
206Integrated Fisheries & Livestock Development Project in Flood Control, Drainage and Irrigation
n.a. MoFL n.a. 0.20 2 Inactive (FY17)
207 Projects Undertaken for Fisheries Development n.a. MoFL n.a. 0.34 4 Inactive
(FY14)
208 Expansion of Existing Prime Mother and Child Care Hospital with Research Facilities n.a. MoHFW n.a. - - Inactive
209 Urban Primary Health Care Services Delivery Project n.a. LGD n.a. 0.57 7 Inactive
(FY18)
210 Post Literacy Education Project for Human Resource Development n.a. MoPME n.a. 0.95 11 Inactive
(FY12)
ANNEX 3: COMPREHENSIVE LIST OF PROGRAMS, BY FUNCTION.
134

Program NameFunction (legend below)
Agency NatureBudget
(FY2019-20) BDT billion
Budget (FY2019-20) USD million
Status (as of FY2019-
20)
211 Disaster Risk Mitigation and Reduction n.a. MoDMR n.a. 0.24 3 Inactive (FY13)
212 Special Program for Irrigation and Water Logging n.a. MoA n.a. 1.50 18 Inactive
(FY13)
213 Poverty Eradication Through Social Afforestation n.a. MoEF n.a. 0.33 4 Inactive
(FY14)
214 NGO Foundation n.a. FD n.a. 0.10 1 Inactive (FY12)
215 Regional Fisheries and Livestock Development n.a. MoFL n.a. 0.29 3 Inactive
(FY13)
216 Fishermen ID Card and Fisheries Project n.a. MoFL n.a. 0.11 1 Inactive (FY17)
217 Micro-Nutrient Supplementation n.a. MoHFW n.a. 0.22 3 Inactive (FY10)
218 National Nutrition Services n.a. MoHFW n.a. 0.96 11 Active
219 Revitalization of Community Health Care Initiative in Bangladesh n.a. MoHFW n.a. 6.87 81 Inactive
(FY18)
220 National Sanitation Project n.a. LGD n.a. 0.41 5 Inactive (FY18)
221 Health Economic Financing n.a. MoHFW n.a. 0.07 1 Inactive (FY18)
Life-cycle risk (beneficiary profile)
1. Pregnancy & Early Childhood Pregnancy and aged 0 to below 5 years
2. School-aged children Aged 5 to 18 years
3. Working age Aged above 18 years to 60 years
4. Elderly Aged above 60 years
5. Persons with disability Physical and/or intellectual disabilities
6. Household (poverty) Household in chronic poverty
7. Household (shock) Household in disaster-related shock
Non/marginal Social Protection Not reflecting the features of social protection
135BANGLADESH SOCIAL PROTECTION PUBLIC EXPENDITURE REVIEW

Institution Programs (from the 167 programs classified as social protection in Annexes 2 and 3)
Cabinet Division (CD) Promoting Nutrition Sensitive Social Security & Policy Support Programe
Finance Division (FD)
Pension for Retired Government Employees and Their Families | Pension Insurance Scheme | Fund for Assistance to the Small Farmer and Poultry Farms | Skills for Employment Investment Program, | Establishment of Training and Employment generation Center for the Vulnerable Youth and Adolescents, | Swanirvar Training Programme | Ghare Fera Programme (Returning Home) | Special Fund for Assistance to Women Development & Entrepreneurs | Food Subsidy | Strengthening Public Financial Management for Social Protection
Financial Institutions Division (FID) Micro-Credit through PKSF | Social Development Foundation (SDF) | Housing Support (with MoHPW)
Local Government Division (LGD)
Income Support Program for the Poorest (ISPP) - JAWTNO | Rural Employment and Road Maintenance Programme | Rural Employment Opportunity for Public Asset (REOPA) | Char Livelihood | Poverty Reduction through Urban Partnership | Strengthening Women’s Ability for Productive New Opportunities (SWAPNO) | Improved Life Standard for Low-Income People | Initiative for Development Project, Empowerment, Awareness & Livelihood, Kurigram | Comprehensive Village Development Project | Participatory Rural Development Project | Rural Settlement Construction for improvement of Rural Livelihood | Infrastructure and livelihood Development in Haor Area | Emergency 2007 Cyclone Recovery and Restoration | Reconstruction of Houses of SIDR affected landless people | Rehabilitation of AILA Affected Rural Infrastructure | Flood Management and Livelihood Improvement Project in Haor Area (with MoWR)
Ministry of Agriculture (MoA)
Agriculture Rehabilitation | Create Employment Opportunities of Char Dwellers in Greater Rangpur Districts Through Sugarcane Cultivation | Food Security through Enhanced Agricultural Production, Diversified Sources of Income, Value Addition and Marketing in Bangladesh (Mymensingh/Sherpur) (FSMSP) |
MoCA Allowances for Distressed Cultural Personalities/Activists
Ministry of Chittagong Hill Tract Affairs (MoCHTA)
Food Assistance in CTG-Hill Tracts Area
Ministry of Disaster Management & Relief (MoDMR)
Employment Generation Program for the Poorest (EGPP) | Test Relief (TR) Cash | Work For Money (WFM) | Gratuitous Relief (Food) | Vulnerable Group Feeding (VGF) | Food For Work (FFW) | Test Relief (TR) Food | General Relief Activities | Block Allocation for Disaster Management | Variety of Relief Work | Non-Bengali Rehabilitation | Operations Support to the Employment Generation Program for the Poorest
Ministry of Education (MoE)
Secondary Education Development Programe (SEDP) | Secondary Education Sector Investment Program (SESIP) | Secondary Education Stipend Program (SESP) | Higher Secondary Stipend, Female Stipend for Bachelor's and Equivalent Level | Higher Secondary Female Stipend Project | Secondary Education Quality and Access Enhancement Project (SEQAEP) | Stipend and Access Increase for Secondary and Higher Secondary Level Students (including Proposed Secondary Education Stipend Project) | Skills and Employment Program | Skills and Training Enhancement Project (STEP) | Skills for Employment and Productivity (SEP-B) | Establishment of Autistic Academy in Bangladesh
Ministry of Environment and Forest (MoEF) Adaptation to Climate Change and Rehabilitation of Livelihood
Ministry of Expatriate Welfare and Overseas Employment (MoEWOE)
Skill Development Fund for Expatriate Returnees and New Entrants to Labor market
Ministry of Food (MoFd) Food Friendly Program (FFP) | Open Market Sales (OMS)
Ministry of Fisheries and Livestock (MoF)L
Regional Duck Breeding and Hatchery | Small Scale Dairy & Poultry Farmers’ Support Project in 22 Selected Districts
Ministry of Health and Family Welfare (MoHFW)
Maternal Health Voucher Scheme (MHVS) | T.B., Leprosy, Communicable Non-communicable Disease | Jatka (Fish) Protection and Alternative Employment for Fishermen | Child and Maternal Health and Health Management Development
Ministry of Housing and Public Works (MoHPW)
Construction of Colony for the Cleaners of Dhaka City Corporation | Pro Poor Slum Integration | Housing Support (with FID)
Ministry of Labor and Employment (MoLE)
Northern Areas Reduction of Poverty Initiatives (NARI) | Eradication of Hazardous Child Labour in Bangladesh (3rd Phase)
ANNEX 4: LIST OF ALL AGENCIES ENGAGED IN SOCIAL PROTECTION Notes: This is a compilation of programs and projects in social protection since FY2009-10. About 130 of these are currently active.
136

Institution Programs (from the 167 programs classified as social protection in Annexes 2 and 3)
Ministry of Information (MoI)
Poverty Reduction Through Inclusive and Sustainable Markets (PRISM) | Integrated Support to Poverty and Inequality Reduction through Enterprise Development Project (INSPIRED) | Gucchagram (Climate Victims Rehabilitation Project)
Ministry of Law, Justice and Parliamentary Affairs (MoLJPA
National Legal Aid
Ministry of Liberation War Affairs (MoLWA)
Honorarium for Freedom Fighters (HIFF) | Honorarium for Injured Freedom Fighters | Ration for Shaheed Family and Injured Freedom Fighters | Construction of Residence for Landless & Poor Freedom Fighter
Ministry of Primary and Mass Education (MoPME)
School Feeding Programme | Primary Education Stipend Program (PESP) | Reaching Out of School Children | Stipend for Dropout Students | Fundamental Education for Urban Working Children
Ministry of Social Welfare (MoSW)
Old Age Allowance (OAA) | Allowances for the Widowed, Deserted and Destitute Women (WA) | Allowances for the Financially Insolvent Disabled (DA) | Assistance for Cancer, Kidney and Liver Cirrhosis Patients | Capitation Grants for Orphan Students in Non-Government Orphanages | Stipend for Disabled Students (DSSd) | Construction of Vocational Training and Rehabilitation Centre for the Disabled at CRP, Manikganj | Livelihood Development Programme For Bede and Underprivileged Community | Programme for Livelihood Improvement of Tea-garden Labourers | Livelihood Development Programme For Hijra (Transgender) Community | Rehabilitation and Creation of Alternative Employment for Beggers | Interest Free Micro-Credit Programme | Fund for the Welfare of Burnt and Disabled | Child Protection and Child Welfare | Establishment/re-establishment of Sarkari Shishu Paribar and Baby Home | Shishu Bikash Kendra (Child Development Center) | Grants for Residents in Government Orphanages and other Institutions | Development of Haji Nowab Ali Khan Orphanage | Street Children Rehabilitation Programme | Construction of Facilities at Dharmarajika Buddha Maha Bihar for Orphans and Disadvantaged | Construction of Hostel for Govt. Orphanage | Establishment of Hostel for Government Shishu Paribar and Visually Impaired Children | Expansion and Development Project of PROYAS at Dhaka Cantonment | Rehabilitation Centre for Destitute Children, Konabari, Gazipur | Services for Children at Risk | Amader Bari (Our Home): Integrated Old and Children Home | Construction of Probin Nibas in Five Divisional Head Quarter & One Zila | Establishment of Multipurpose Rehabilitation Center for Destitute, Aged People and Socially Disabled Adolescent Girls | Service and Assistance Center for Disabled | Grants for the Schools for the Disabled | Trust for the Protection of the Persons with Neuro-developmental Disabilities | Welfare Trust for the Physical Disabilities | The Sustainable Socio-economic Development and Rehabilitation Programs of Underprivileged and Poor Disabled and Autistic People through Special Education, Health Care and Various Training Programs | Construction of Multipurpose Sports Complex for Person with Disability | Promotion of Services & Opportunity to the Disabled Persons in Bangladesh | Development of the Living Standard of the Marginal People of Bangladesh | Bangladesh National Social Welfare Council | Cash Transfer Modernization (CTM) Project
Ministry of Women and Children Affairs (MoWCA)
Maternity Allowance Programme for the Poor (MAPP) | Allowances for Urban Lactating Mothers (AULM), | Women's Skill Based Training For Livelihood | Joyeeta Foundation | Training Programs for Autistic Children and Women through Pilot Training Centers | Vulnerable Group Development (VGD) | Tottho Apa: Empowering Women Through ICT Towards Digital Bangladesh | Income Generating Activities (IGA) for Women at Upazila Level | Urban Based Marginal Women Development | Food and Livelihood Security (FLS) | Investment Component for Vulnerable Group Development Project | Vulnerable Group Development for the Ultra Poor (VGD-UP) | Micro-credit for Women Self-employment | Early Learning for Child Development | Establishment of 20 Child Daycare Center Project | Day Care Programme for Lower and Middle Income Working Women | Oppressed Women and Children Welfare Fund | Generation Break through | Child Sensitive Social Protection | Enabling Environment for Child Rights | Improving Working Condition in the Ready Made Garments Sector, Multi-Sectoral Programme to Prevent on Violence Against Women (4th Phase) | Providing Primary Health | Reproductive Health and Nutrition Services to Underprivileged Woman and Children
Ministry of Water Resources (MoWR)
Char Development & Settlement Project | Flood Management and Livelihood Improvement Project in Haor Area (with LGD)
Ministry of Youth and Sports (MoYS)
National Service | Creation of Employment and Self-employment Opportunities for Unemployed Youths in 7 District of North Bengal
Planning Commission (PC) Social Security Policy Support (SSPS) Programme
Prime Minister’s Office (PMO) Ashrayan
Rural Development and Cooperatives Division (RDCD)
My House My Farm | Livelihood of Grameen People "Rural Community" Building | Program for Ensuring Employment for the Ultra Poor in Northern area | Economic Empowerment of the Poor | Extension of Palli Daridra Bimochon Foundation (PDBF) Activities for Poverty Alleviation and Self Employment | Integrated Rural Employment Support Project for the Poor Women(IRESPPW) | Project for Small Farmers Development Foundation
137BANGLADESH SOCIAL PROTECTION PUBLIC EXPENDITURE REVIEW

ANNEX 5: THE FUND FLOW ANALYSIS UNDERTAKEN FOR THIS STUDY
The NSSS of the Government of Bangladesh lays emphasis on strengthening the delivery of the national social security system. The strategy prioritizes key reforms in strengthening payment mechanism to transition into Government to Person (G2P) payment systems so that it promotes financial inclusion and minimizes leakages. This is also one of the major areas of Government focus as part of the institutional reforms recommended by the NSSS, in order to modernize the social protection service delivery system. As part of this public expenditure review, the World Bank commissioned an analysis of fund flows of selected social protection programs implemented by the Government of Bangladesh. Ernst & Young LLP, India, was selected competitively for this assignment which included analyses of mainly three programs:
• OAA implemented by the Ministry of Social Welfare (MoSW)• EGPP implemented by the Ministry of Disaster Management & Relief (MoDMR)• MHVS implemented by the Ministry of Health & Family Welfare (MoHFW).
Data was collected during August and November, 2019. The analysis was based on a sample of twenty unions across nine districts.
The analysis included three distinct parts:A. Tracking of fund flow from treasury to the hands of the beneficiary and identifying good practices and inefficienciesB. Mapping the as-is process and identifying pain-pointsC. Survey of beneficiaries to assess beneficiary experience with the programs
The analysis has clustered its findings around cash-in and cash out, identifying the upazila level as a point of significant challenges in terms of timelines, reporting and staffing; accounting and financial reporting of allowance payment; and beneficiary experience in terms of eligibility, access to information, options of grievance reporting etc.
The findings of the analysis have been referenced particularly in Chapter 5 of the PER, and the report will be available as a background document.
138

BIBLIOGRAPHY
139BANGLADESH SOCIAL PROTECTION PUBLIC EXPENDITURE REVIEW

ACAPS (Assessment Capacities Project), 2018. “Thematic report: Rohingya crisis – Cyclones background”.
Ahmed, Manzoor; Nath, Samir Ranjan and Ahmed, Kazi Saleh, 2003. “Education Watch 2002: Literacy in Bangladesh need for a new vision”. Campaign for Popular Education (CAMPE), Dhaka, Bangladesh.
Ahmed, Akhter U.; Hoddinott, John F.; Roy, Shalini; Sraboni, Esha; Quabili, Wahidur R. and Margolies, Amy, 2016. “Which kinds of social safety net transfers work best for the ultra-poor in Bangladesh?” International Food Policy Research Institution (IFPRI) and World Food Programme (WFP), Dhaka, Bangladesh.
Ali, Zulfiqar, 2014. “Economic Costs of Disability in Bangladesh.” Bangladesh Development Studies, 37(4): 17-33.
Bangladesh Bureau of Statistics, 2007. “Report of the Household Income and Expenditure Survey 2005”. Dhaka, Bangladesh.
Bangladesh Bureau of Statistics, 2017a. “Bangladesh Sample Vital Statistics”. Dhaka, Bangladesh.
Bangladesh Bureau of Statistics, 2017b. “Preliminary Report on Household Income and Expenditure Survey 2016”. Dhaka, Bangladesh.
Bangladesh Bureau of Statistics, 2018a. “Labor Statistics in Bangladesh: An empirical study”. Dhaka, Bangladesh.
Bangladesh Bureau of Statistics, 2018b. “Labor Force Survey Bangladesh 2016-17”. Dhaka, Bangladesh.
Bangladesh Bureau of Statistics, 2019. “Report on the Household Income and Expenditure Survey 2016”. Dhaka, Bangladesh.
Bangladesh Bureau of Statistics and UNICEF, 2019, “Multiple Indicator Cluster Survey 2019 (MICS)”. Available at: https://mics.unicef.org/surveys.
BRAC Institute of Governance and Development (BIGD) and Power and Participation Research Centre (PPRC), 2020. “Livelihoods, Coping and Support During COVID-19 Crisis”. Dhaka, Bangladesh.
Department of Disaster Management, 2018. “SNSP Spot Checks, Phase 1, FY2017”. Dhaka, Bangladesh.
BIBLIOGRAPHY
140

Department of Disaster Management, 2019. “Spot Checks Report 5, Safety Net Systems for the Poorest Project”. Dhaka, Bangladesh.
Department Social Services, 2018. “Cash Transfer Modernization Project”. Dhaka, Bangladesh.
Fell, Ben and Hewstone, Miles, 2015. “Psychological Perspectives on Poverty”, Joseph Rowntree Foundation, University of Oxford.
Financial Express (the), 2018. “Pension Payments to Double Next Fiscal Year”.
Gentilini, Ugo, 2015. “What do we know (and what not) about safety nets in urban areas?” World Bank Blogs, August 05, 2015.
Hill, Ruth and Rahman, Hossain Zillur, 2019. “Poverty in Urban Bangladesh”. Background paper for the Bangladesh Poverty Assessment, World Bank. Dhaka, Bangladesh.
Hossain, Mohammed Amjed and Miah, Md. Giashuddin, 2011. “Environmental Disasters in History: Bangladesh Perspective”. Int. J. Soc. Dev. Inf. Syst. 2(1): 31-37.
Khondker, Bazlul Haque and Jalal, Jahid Ebne, 2019. “Cost-Benefit Ratio Study on Effects of Social Protection Cash Transfer”. South Asia Network on Economic Modeling (SANEM) and UNDP, Bangladesh.
Leite et al., 2017. “Social Registries for Social Assistance and Beyond: A guidance note and assessment tool”. Social Protection and Labor Discussion Paper No. 1704. World Bank, Washington, D.C.
Lewis, David and Hossain, Abul, 2008. “Understanding the local power structure in Rural Bangladesh”. Sida Studies No. 22, Stockhold, Sweden.
Ministry of Family and Social Policy (Republic of Turkey), 2017a. “Turkey’s Integrated Social Assistance System.” Government of Republic of Turkey & The World Bank joint publication.
Ministry of Family and Social Policy (Republic of Turkey), 2017b. “ISAS Butunlesik: Turkey’s Integrated Social Assistance System.” Government of Republic of Turkey. Presentation
Ministry of Finance, 2014. “Budget and Accounting Classification Manual”, Public Expenditure Management Strengthening Program. Finance Division, Dhaka, Bangladesh.
Ministry of Finance, 2019. “Climate Financing for Sustainable Development, Budget Report 2019-20”. Finance Division, Dhaka, Bangladesh.
Ministry of Food and World Bank, 2013. “Modern Food Storage Facilities Project (MFSP)”.
Nadoll, Jörg, 2015. “Public Investment Management Review and Reform Roadmap for Bangladesh”. World Bank, Dhaka, Bangladesh.
National Institute of Population Research and Training (NIPORT), and ICF. 2019. “Bangladesh Demographic and Health Survey 2017-18: Key Indicators”. Dhaka, Bangladesh, and Rockville, Maryland, USA.
National Institute of Population Research and Training (NIPORT), International Centre for Diarrhoeal Disease Research-Bangladesh (ICDDR-B), and MEASURE Evaluation. 2017. “Bangladesh Maternal Mortality and Health Care Survey 2016: Preliminary Report”. Dhaka, Bangladesh, and Chapel Hill, NC, USA.
Osmani, S.R; Ahmed, Akhter U; Ahmed, Tahmeed; Hossain, Naomi; Huq, Saleemul; and Shana, Asif, 2016. “Strategic Review of Food security and nutrition in Bangladesh.” Prepared for World Food Programme (WFP), Dhaka, Bangladesh.
Ozaki, Mayumi, 2016. “Disaster risk financing in Bangladesh”, Asian Development Bank. South Asia Working Paper series No. 46.
Ozler, Berk, 2020. “How should we design cash transfer programs?” in Artuc et al., 2020, Toward Successful Development Policies, World Bank Policy Research Working Paper No. 9133. World Bank, Washington, DC.
Planning Commission, 2005. “Unlocking the Potential, National Strategy for Accelerated Poverty Reduction.” General Economic Division, Dhaka, Bangladesh.
Planning Commission, 2015. “National Social Security Strategy of Bangladesh”. General Economic Division, Dhaka, Bangladesh.
141BANGLADESH SOCIAL PROTECTION PUBLIC EXPENDITURE REVIEW

Rahman et al., 2019. “Transition from Food to Cash-Based Workfare Programmes: a Comparative Analysis and Implications for National Social Security Strategy of Bangladesh”. Report prepared by Power and Participation Research Center (PPRC) with support from World Food Programme (WFP), Dhaka, Bangladesh.
Save the Children, 2015. “Malnutrition in Bangladesh: Harnessing Social Protection for the Most Vulnerable”. mimeo
Sen, Binayak, 2020. “Analysis of coverage and impact of key Social protection programs, using HIES 2016 and MICS 2019”. Background paper prepared for this report.
UNDP, 2008. “Human development report 2007/2008: Fighting climate change - Human solidarity in a divided world. New York”.
UNDP, 2012. “The Millennium Development Goals Report 2012”. United Nations, New York.
UNFPA, 2015. “The Impact of Demographic Transition on Socio-economic Development in Bangladesh”. Dhaka, Bangladesh.
UNFPA, 2016. “Urbanization and Migration in Bangladesh”. Dhaka, Bangladesh.
UNFPA, 2018. “United Nations Population Division’s World Urbanization Prospects: 2018 Revision”.
UNICEF, 2018a. “A Scoping Analysis of Budget Allocations for Ending Child Marriage in Bangladesh”. Dhaka, Bangladesh.
UNICEF, 2018b. “State of the Social Service Workforce in South Asia”. Regional Office for South Asia.
United Nations, 2019. “World Population Prospects 2019”. Available at: https://population.un.org/wpp/.
Farole, Thomas; Cho, Yoonyoung; Bossavie, Laurent; and AterIdo, Reyes, 2017. “Bangladesh Jobs Diagnostic”, World Bank, Washington, DC, USA.
World Bank, 2010. “Bangladesh Poverty Assessment”. World Bank, Washington DC.
World Bank, 2015. “World Development Report: Mind, Society and Behavior”. World Bank, Washington DC.
World Bank, 2016. “Fiscal Space for Health in Bangladesh: Towards Universal Health Coverage”. World Bank, Washington DC.
World Bank, 2017a. “Strengthening the Basics: How to Improve the Bangladesh Budget Preparation Process”. Policy Note. Dhaka, Bangladesh.
World Bank, 2017b. “Pilot Evaluation Report”.
World Bank, 2018a. “Promising Progress: A Diagnostic of Water Supply, Sanitation, Hygiene, and Poverty in Bangladesh”. World Bank, Washington DC.
World Bank, 2018b. “Safety Nets Systems for The Poorest: Monitoring Equity, Efficiency, And Transparency”. Mimeo
World Bank, 2019a. “Bangladesh Poverty Assessment, Facing old and new frontiers in poverty reduction”. World Bank. Dhaka, Bangladesh.
World Bank, 2019b. “Investing in Adolescent Girls’ Nutrition in Bangladesh Situation Analysis of Trends and Ways Forward”, Health, Nutrition and Population Discussion Paper. Washington, DC.
World Bank, 2019c. “Social Protection Fund Flow Analysis”. Analysis undertaken by EY Bangladesh for this analysis. World Bank. Dhaka, Bangladesh. See Annex 4.
World Bank, 2019d. “Union Social Workers for Local Service Delivery in Social Protection”. eMBeD, World Bank, KWPF.
World Bank, 2019e. “Program Brief, Old Age Allowance”.
World Bank, 2019f. “Local Government PFM Systems Assessment”.
World Bank, 2019g. Assessment Note on Safety Net Program Implementation at the Local Level.
World Bank, 2020a. “COVID-19 Monitoring Survey in Poor and Slum Areas of Dhaka and Chittagong: Labor Market Impacts from Round 1”, Poverty & Equity GP, Word Bank, Dhaka, Bangladesh.
World Bank, 2020b. “Losing Livelihoods: The Labor Market Impacts of COVID-19 in Bangladesh (Round 2)”. Poverty & Equity GP, Word Bank. Dhaka, Bangladesh.
World Bank, 2020c. “Sourcebook on the Foundations of Social Protection Delivery Systems”. World Bank, Washington, DC .
BIBLIOGRAPHY
142