Domestic food consumption and expenditure - GOV.UK
187
tic Food Consumption and Expenditure : 1956
-
Upload
khangminh22 -
Category
Documents
-
view
0 -
download
0
Transcript of Domestic food consumption and expenditure - GOV.UK

tic Food Consumptionand Expenditure : 1956


MINISTRY OFAGRICULTURE, FISHERIES AND FOOD
Domestic Food Consumption
and Expenditure : 1956
Annual Report of the
National Food Survey Committee
LONDONHER MAJESTY'S STATIONERY OFFICE
1958

THE NATIONAL FOOD SURVEY COMMITTEE
NORMAN C. WRIGHT, C.B., M.A., D.SC., PH.D., F.R.I.C.
Ministry ofAgriculture, Fisheries and Food, Chairman
M. A. ABRAMS, PH.D. (l-CON.)Director of Research, London Press Exchange Ltd.
W. T. C. BERRY, M.D., M.R.C.S., M.R.C.P., D.T.M. & H.Ministry of Health
H. S. BOOKER, M.SC. (ECON.)London School of Economics
C. J. BROWNMinistry of Agriculture, Fisheries and Food
MISS I. LEITCH, O.B.E., M.A., D.SC.Director of the Commonwealth Bureau ofAnimal Nutrition
E. M. H. LLOYD, C.B., C.M.G.
PROFESSOR E. F. NASH, M.A.Department ofAgricultural Economics, University ofWales
J. H. KIRK, C.B.E.Ministry of Agriculture, Fisheries and Food
R. J. PETERS, M.D., D.P.H., Q.H.P.Department of Health for Scotland
J. A. SUTHERLAND-HARRISMinistry of Agriculture, Fisheries and Food
Secretaries
MISS D. F. HOLLINGSWORTH, O.B.E., B.SC., F.R.I.C, M.I.BIOL.
A. H. J. BAINES, M.A.
11

Contents
I. INTRODUCTIONII. FOOD SUPPLIES, 1956III. THE HOUSEHOLD DIET IN 1956
Food Expenditure and Prices .....Consumption ........Milk, Cheese, Meat, Fish and EggsFats, Sugar and PreservesFruit and VegetablesCereals, Beverages and Miscellaneous Foods
Energy Value and Nutrient Content ....IV. HOUSEHOLD DIETS OF SOCIAL CLASSES . . . .
Classification
Expenditure and Consumption .....Energy Value and Nutrient Content ....
V. HOUSEHOLD DIETS OF OCCUPATIONAL GROUPS BASEDON THE REGISTRARS-GENERAL'S CLASSIFICATION .
VI. HOUSEHOLD DIETS AND FAMILY COMPOSITIONClassification
Expenditure and ConsumptionEnergy Value and Nutrient Content ....Effect of Children on Expenditure ....Effect of Children of School and Pre-school Age
VII. FAMILY COMPOSfTION AND SOCIAL CLASSVIII. GEOGRAPHICAL DIFFERENCES IN THE HOUSEHOLD DIET .
Classification ........Quarterly Changes in Expenditure and Value of Consumption
Free Supplies
Consumption, Expenditure and Prices; Individual Foods .Milk, Cheese, Meat, Fish and Eggs
| Fats, Sugar and PreservesVegetables and Fruit ......Cereals, Beverages and Miscellaneous Foods
Summary of Regional Differences in Consumption of, andExpenditure on, the Main Food Groups .
Energy Value and Nutrient Content
APPENDICESA Composition of the Sample .....B Tables of Consumption, Expenditure and Prices .C Contribution of Different Foods to the Nutrient
Content of the DietD Sources of Fat in the Household DietE Details of Expenditure and Consumption by Region
and Type of AreaF Variations in Types of Bread Consumed .
Paragraphs
i- 45-10
11-44
11-20
21-3722-26
27-28
29-32
33-37
38-44
45-7345-4950-65
66-73
74-89
90-126
90-92
93-110
111-117118-120
121-126
127-143
144-176
144-145
146
147-148
149-167
150-155
158-162
163-167
168
169-176
Page
in120
132
144
152
163
ui

Preface
The Annual Report of the National Food Survey Committee for 1956 is theseventh of the series which was introduced in 1950 in order to provide a continuousrecord of trends in domestic food consumption, expenditure and nutrition inGreat Britain. The scale of the Survey, which is based on a stratified random sampleof all types of household, had to be somewhat reduced in 1956 for reasons ofeconomy, but its distinctive features of continuity and national coverage werepreserved.
The present volume broadly follows the arrangement of the previous year'sReport. It describes the diets of households in different income groups and ofdifferent family composition, and of households in the main regions and in urbanand rural areas; but a number of the analyses have been amplified. The definitionof social class has been modified as a result of the finding that, at least towards thelower end of the income scale, food expenditure per head tends to be more closelyrelated to the income of the principal earner than to that of the nominal head of thehousehold. Rural areas have been distinguished from semi-rural areas (which areexposed to urban influence), and the tables giving details of regional food consumption and expenditure incorporate the classification by degree of urbanization.A new chapter deals with differences in the dietary pattern which are associated withoccupational status. In view of the current interest in consumption of fat in relationto health, detailed tables have been provided for the information of workers in thisfield. One of the appendices deals with the immediate consequences of the decontrolof bread.The preparation of the Report was undertaken jointly by the Secretaries of theCommittee. Mr. A. H. J. Raines was responsible for the sections on food supplies,expenditure, consumption and prices, and Miss D. F. Hollingsworth for thesections on the nutritional value of the diet. The Committee wish to renew theirthanks to these officers of the Ministry, and to their colleagues in the Ministry'sEconomic Advice and Food Consumption Division and Scientific Adviser'sDivision (Food) for the way in which they have implemented the Committee'srecommendations. The Ministry and the Committee also desire to express theirindebtedness to the staffs of the Social Survey Division of the Central Office ofInformation and of the Combined Tabulating Installation of H.M. StationeryOffice and, not least, to the many housewives who willingly provided the informationon which this Report is based.
NORMAN C. WRIGHT
April, 1958 Chairman, National Food Survey Committee

IIntroduction
1. Most of the changes in the pattern of domestic food consumption which accompanied or followed the ending of controls had taken place by the beginning of 1956.The present Report is therefore the first to record the buying habits of the Britishhousewife under trading conditions approximating to those which obtained beforethe war. During the year the transition to a free market was almost completed bythe decontrol of bread, the immediate effects ofwhich are discussed in Appendix F.
2. The Annual Report for 1956 follows the same general arrangement as that forthe previous year. The chapter dealing with family composition includes a preliminary study of differences between families containing older and younger children, and the analysis of geographical differences in the diet distinguishes whollyrural areas from those districts which, although not administratively urban, are
exposed to strong urban influence. Other new features are a chapter on occupationaldifferences, based on the Registrars-General's definitions of social class, and anappendix on sources of fat in the household diet.
3. The basic tabulations of survey data, although not all published, are available toresearch workers and contain the usual particulars of domestic food consumptionand expenditure in each class, type of household, region and type of area for 116kinds of food. The series of national and regional averages for this full classificationis continued in Appendices B and E, but elsewhere in the Report a simplified list of39 food groups has been used. Chapters III to VIII include nutritional assessmentsof the diets of the groups concerned, and, as in all previous Annual Reports, scalesof allowances based on the recommendations of the British Medical Association'sCommittee on Nutrition (1950) have been used for purposes of comparison.
4. In some of the tables, figures have been rounded to the nearest final digit shown,and this may cause an apparent slight discrepancy between the total and the sum ofthe constituent items. The following symbols are used throughout:
— = nil
... = less than half the final digit shown
n.a. = not available, or not applicable.
IIFood Supplies, 1956
5. In 1956 there was a further modest increase in the real value of consumption asestimated by revaluing at constant prices the quantities purchased. At 1948 prices,the rise in total food purchases per head was i per cent, about the same as in theprevious year, though the total volume of goods and services, similarly measured,was virtually unchanged compared with 3 per cent, mainly because of a sharp

Domestic Food Consumption and Expenditure, 1956
TABLE I
Changes in National Supplies of Principal Foods,1Pre-war, 1947, 1952, 1955 and 1956
(Ib. per head per annum}
7956
1934- 1947* 1953 '955 1956 percentage percentage
I93« change on change on
Dairy products, excluding
1955 I934-Z93S
butter (as milk solids) . 38-3 49-0 SI'S 52-2 52-6 + i + 37Cheese (included also indairy products) 8-8 9'3 7'7 9-0 9'4 + 4 + 7
Meat (edible weight) IIO'O 83-2 84-6 110-4 »3'3 + 3 4- 3
Fish, poultry, game (edibleweight) 32-7 37-' 28-2 25-9 27-5 4-6 - 16Eggs (total shell egg equi
valent) 28-3 24-9 27-6 29-5 28-7 — 3 4- iOils and fats:Butter 24-7 II -2 10-9 14-6 15-6 4-7 - 37Margarine 8-7 15-0 19-3 17-9 16-9 —6 4- 94Lard and compoundcooking fats . 9'3 7'4 II -0 10-6 10-8 + 2 4- 16
Other edible oils and fats 10-0 6-6 8-7 10-4 10-8 + 4 4- 8
Total (fat content) . 47-1 36-0 j 45-1 48-2 48-7 + 1 4- 3
Sugar and syrups' 104-6 84-1 90-7 III -2 114-1 + 3 4- 9Potatoes 181 -9 285-9 237-8 223-3 210-4 -6 + 16
Pulses, nuts, etc. . 9'5 8-0 9'4 u-5 13-1 4-14 4- 38Fruit, including tomatoes
(fresh equivalent)1 137-4 131-1 123-1 140-9 I35-4 -4 — iVegetables, other than
potatoes' . 107-0 118-0 100-9 IOI-I 105-7 4-5 — r
Cereal products 2IO-I 241-7 219-5 196-4 193-5 — I - 8Tea . 9'3 8-5 8-5 9-4 lo-i 4-7 4- 9Coffee . 0-7 1-6 i - 5 I -3 1-6 4-23 4-129
Chocolate confectionery* . 10-3 6-7 9-2 n-8 12-9 4-9 4- 25
Sugar confectionery4 12-4 6-7 9-0 16-0 I5-4 -4 4- 24
Total calories per head perday .... 3,000 2,880 2,950 3,12° 3,MO + i 4- 5
Protein per head per dayAnimal (g.) 43'5 44-6 42-9 47'5 ; 48-5 4-2 4- iiVegetable (g.) . 36-8 46-2 40-7 35-o 34-6 — i - 6Fat per head per day (g.) 130-0 106-3 122-5 137-2 138-4 4-1 4- 6
Calcium per head per day(mg.) 688 1,142 1,095 1,100 1,107 4-i 4- 61
Ironperheadperday(mg.) 13-2 14-6 13-4 14-1 '4-3 4-1 4- 8
Vitamin A per head perday (i.u.) 3,699 3,691 3,620 4,208 4,449 4-6 4- 20
Vitamin Bi per head perday (mg.) i'3 1-8 i-7 i"7 1-6 -6 4- 23Vitamin C per head perday (mg.) 93 no 96 96 93 -3 o
'More detailed estimates will be found in the Board of Trade Journal, Vol. 173, No. 3154.'Excludes sugar used in brewing and distilling.'Tomato and tomato products have been included with fruit (in terms of fresh equivalent)
to conform with National Food Survey practice.'Ingredients of chocolate and sugar confectionery are also included elsewhere.'Relates to civilian population only.

Food Supplies, 1956 3
fall in durable household goods and private motoring, which had previously beenleading the rise. Food thus accounted for most of the net increase in real consumption in 1956, as against an eigth in 1955.
6. Before examining in detail the National Food Survey data on the domestic foodconsumption of private households, it is convenient to consider estimates of totalfood consumption based on supply data. Table i summarizes changes between1955 and 1956 in supplies moving into consumption, and gives comparative figuresfor 1934-38, 1947 (the most difficult of the post-war years) and 1952, which maybe regarded as the last year of full control. Survey estimates of consumption are notdirectly comparable with those given in Table i, which include items not coveredby the Survey, such as meals, snacks and ice-cream obtained outside the home,
sweets and soft drinks, and all food consumed in institutions. The items omittedby the Survey are those for which experience in other enquiries has shown thatinformants systematically record less than their full expenditure.
7. In 1956 more of the main food groups showed an increase than in 1955. Meatsupplies, which in the previous year had reached parity with 1934-38, moved aheadof the pre-war level, and total supplies offish, poultry and game, which had beenfairly steady since 1953 following a steep decline, rose by 6 per cent. During theseyears poultry and fish, especially imported canned fish, increased steadily, whilerabbits almost disappeared from the diet. The total for dairy products, because ofthe very stable demand for liquid milk, again showed little change. Total oils andfats, in terms of fat content, recovered to the 1954 figure, and there was an increasedsubstitution of butter for margarine, though the former was still well below andthe latter nearly double the pre-war average. The downward trend in cereal products was continued and that in potatoes resumed after a two-year pause. Suppliesof eggs, fruit and vegetables other than potatoes were very near the pre-war levels.Among foods which attained new high levels were sugar and syrups, pulses and nuts,and tea. Coffee supplies also increased to more than twice those in 1934-38.Supplies of chocolate confectionery showed an increase, partly at the expense ofsugar confectionery; both were about one-fourth greater than before the war.
8. The nutrient data in Table i relate to total supplies moving into consumption,and are not comparable with those relating to food obtained for domestic consumption, given later in this Report. They are included primarily to indicate the changeswhich have occurred during the past two decades. The energy value of availablefood supplies rose to 3,140 Cal. per head per day, the highest yearly average so far
recorded and 5 per cent more than before the war. With the increased supplies ofmost animal foods, animal protein reached a new high level of 48 .5 g. per day andfat of 138 g. per day. Nevertheless the carbohydrate content of the diet did not falland was 3 per ,cent above the 1934-38 level. The only absolute fall compared withthose years was in vegetable protein, though with the decline in potato consumptionvitamin C has fallen back to its pre-war level. The most marked improvementsover the period were in calcium (almost unchanged since 1947 at 60 per cent above
1934-38) and hi vitamins A and Bj. The iron content of the diet increased in 1956but was still below the maximum attained in 1946.
9. In reviewing the economic background of the British diet, 1952 is a suitablebase period. The movement towards decontrol was resumed towards the end ofthat year, and during the next four years earnings moved steadily ahead of prices,and household food expenditure ahead of food prices. Indeed, domestic expenditureon food roughly kept pace with the growth of earnings, and the proportion of

4 Domestic Food Consumption and Expenditure, 1956
consumers' total expenditure devoted to food continued to increase. In terms of1948 prices, however, food accounted for a rather smaller proportion of the totalthan in 1952-54 though slightly more than in 1955. Over the five years, the generallevel of retail prices rose by one-seventh, retail food prices by one-fifth and weeklyearnings and domestic food expenditure by about a third.
TABLE 2
Changes in Earnings, Prices and Expenditure on Food 1952-56
1952 '953 1954 '955 1956
Index of average weekly earnings1 . 100 106 113 "3 133Index of retail prices (all items) IOO i°3 105 no "5Retail food prices:National Food Survey Index IOO 105 107 "4 119London and Cambridge Index* . IOO 105 108 116 121
Domestic food expenditure per head (N.F.S.) . IOO no 114 124 I3»Total food expenditure per head at currentprices* ....... IOO 107 "5 125 132Total food expenditure as percentage of totalexpenditure on consumers' goods and services9at current prices ..... 31-0 31-6 31-8 32-4 32-7at 1948 prices ..... 27-7 27-5 27-0 26-5 26-81Ministry of Labour Gazette, Vol. 65, No. 3, March 1957.'Bulletin of the London and Cambridge Economic Service in The Times Review of Industry,
March 1957.'Monthly Digest of Statistics.
10. Table 3 compares quarterly changes hi domestic food expenditure per head in
1955 and 1956 with changes in prices, weekly wage rates and estimated weeklyearnings. For the first nine months of 1956 food prices were fairly steady, exceptfor a peak in the second quarter caused by the spring shortage of vegetables, butthe general level of prices continued to rise because of the increased cost of services,transport, fuel, housing and tobacco. Food expenditure more than kept pace withprices but began to lag behind earnings.
TABLE 3Household Food Expenditure, Wages, Earnings and Prices, 1955-56
(January-March 1955 = 100)
'955 19 56
ISt and
Quarter
3rdQuarter
4th
Quarter
ISt 2nd
Quarter
3rdQuarter
4th
QuarterQuarter Quarter
Weekly wage rates .
Estimated weeklyearnings1ruk-x of retail prices:All itemsFood1Household food ex
penditure (NationalFood Survey)
IOO
IOO
103
i°3
104
106
104 108
109
in 112 112
107 112 114 "4
IOO
IOO
IOI i°3104
i°5 106 108 107
107
108108102 107 106 no
IOO i°5 104 106 107 114 109 in'Official estimates for April and October; intermediate values interpolated using themonthly index of weekly wage rates."The food component of the Index has a discontinuity at the beginning of 1956.

IllThe Household Diet in 1956
Food Expenditure and Prices
11. Estimates of total domestic food expenditure and the value of free food aregiven in Table 4 for each quarter of 1955 and 1956. Average domestic expenditureon food was only slightly higher in the first quarter of the year than in the precedingquarter. After a sharp fall to 25$. yd. per head per week in January, attributable toreduced expenditure on such foods as dried fruit and nuts after Christmas, the
average rose to 265. nd. in March and reached a new high level of 28s. yd. in April,largely because of the seasonal increase in expenditure on vegetables and especiallythe shortage of old potatoes (see paragraphs 29-31 below). The average then declined steadily to 26$. lod. in September as expenditure on vegetables decreased.Price control on bread was lifted and the subsidy was withdrawn at the end of thethird quarter; the subsequent rise in expenditure on bread, together with the usualincreases in purchases of several foods in December, contributed to the higheraverage for the last quarter. As in previous years, the field work for the year endedon the Saturday before Christmas, and the quarter's averages for a few highlyseasonal foods may be appreciably depressed by the exclusion of the last twoshopping days before the holiday.
TABLE 4Domestic Food Expenditure, Value of Free Food, and Value of Food
obtained for Domestic Consumption, 1955 and 1956(per head per week)
Expenditure on Food
Per
Value of FreeFood
Value of Consumption
Per1955 1956 centage
Change1955 1956 1955 1956 centage
Change
s. d. s. d. s. d. s. d. t. d. j. d.ist Quarter2nd Quarter .3rd Quarter4th Quarter
24 926 o
26 528 4
27 I27 4
+ 7+ 9
8
9
6
6
i 59
25 526 9
27 I27 3
26 ii28 10
28 6
28 I
+ 6+ 8+ 5+ 3
25 926 3
+ 5+ 4
I 4I 0
Yearly Average 25 8 27 3 + 6 it 10 26 7 28 I + 6
12. "Free" food comprises food which enters the household without paymentduring the survey week, including supplies obtained from a garden, allotment orfarm, or from an employer, and withdrawals from larder stocks of such home-produced foods as are stored in quantity1"5, but excluding gifts of food from onehousehold to another. These free supplies were valued for each group of householdsby applying the average prices currently paid by that group for corresponding
(a) Potatoes, beans, bottled fruit and tomatoes, preserves, apples and pears, eggs.

6 Domestic Food Consumption and Expenditure, 1956
purchases, and the value of free food has been added to the household food expenditure to obtain an estimate of the total value of food obtained for domestic consumption (abbreviated as "value of consumption"). This appears to be the mostappropriate method of attributing a money value to self-supplies, though it isprobable that if the households concerned had had to purchase all their food atcurrent retail prices they would not have spent as much as the value of their presentconsumption. School milk, free welfare milk, welfare cod liver oil and vitamin Aand D tablets were not valued. Purchases were recorded when they were made, andnot at the time of eventual consumption; this may slightly distort seasonal differencesin consumption, but should give a true picture over the year as a whole.
13. The average value of free food in 1956 at current retail prices was nearly lod.per head per week, 14 per cent less than in the preceding year. From February toJuly the value of free supplies was uniformly lower than a year before. The seasonalpeak of is. 6d. was reached in August instead of July, free supplies of peas andbeans lagging some weeks behind the commercial crop. The weather was lessfavourable to garden produce than in 1955, free supplies of tomatoes and softfruit being particularly small. As the availability of free food is inversely related tourbanization, discussion is deferred to Chapter VIII, paragraphs 147 and 148.14. In the year 1956, 17^ per cent of total domestic expenditure on food wasdevoted to milk, cheese and eggs, 32 per cent to meat and fish, 17 per cent to fruitand vegetables, 26 per cent to cereals, fats, sugar and preserves and j\ per cent toall other foods. Corresponding percentages for the autumn and winter quartersfrom October 1956 to March 1957 were 18, 32, 15, 27 and 8, compared with 18,30, 14, 27 and ii found by Crawford and Broadley, exactly twenty years earlier.Housewives tended to spend relatively more on meat and less on beverages andmiscellaneous foods than before the war; fruit and vegetables also accounted for agreater share of the housewife's outlay than in 1936-7, though less than underrationing. But the most striking feature of the comparison is the stability of Britishspending habits, as between broad groups of commodities, despite the considerablechanges in prices.
15. For comparison with the proportional outlay ofmoney on the different groupsof foods, Table 5 gives the proportions of energy and nutrients obtained from thesame food groups. The relative cheapness of the cereals group as a source of energy,protein, calcium, iron, vitamin BI and nicotinic acid is very striking. Other noteworthy points are the relative cheapness of the milk, cheese and eggs groups forcalcium and riboflavin; of fruit and vegetables (including potatoes) for vitamin C;of meat and fish for nicotinic acid; and of the group containing fats for vitaminsAandD.
16. The seasonal pattern of domestic food expenditure during 1944-45 and ofthe value of consumption during 1951-55 was illustrated by charts in the AnnualReports for 1950* and I9552, in which seasonal variations were measured as deviations from the general rising trend indicated by a 12 months' centred movingaverage; this upward movement continued during the first half of 1956, thoughmore slowly than before, but levelled off during the second half of the year. Maximain expenditure and in value of consumption occurred exceptionally in April;previously the maximum expenditure had always been recorded between May andJuly, and the maximum value of consumption usually in July, when garden andU) Domestic Food Consumption and Expenditure, 1950 ; paragraph 37, H.M.S.O., 1952.(2) Domestic Food Consumption and Expenditure, 1955 ; paragraph 16, H.M.S.O., 1957.

The Household Diet in 1956
TABLE 5
Percentages of Energy and Nutrient Values of the AverageHousehold Diet obtained from certain Food Groups, 1956
Percentage of Milk, Meat and Fruit and Fats, sugar Othertotal cheese and fish vegetables Cereals and foods and
egg! preserves beverages
i
Energy value M 15 9 35 26 i
Protein 27 29 10 34 0 | IFat . 21 31 1 i 9 38 | oCalcium 59 i 3 8 29 I ; 0
Iron . ii 3i 22 34 0 IVitamin A 22 ; 24 26 3 25 o
Vitamin B, 16 24 26 33 o 0
Riboflavin . 49 22 13 9 o 8
Nicotinic acid 4 42 21 29 0 3Vitamin C 10 2 86* o 0 oVhaminD 26 23 o 5 47 o
Domestic foodexpenditure . i?i . 32 i/ : 15 ; ii i 7*
•of which potatoes 34 per cent.
allotment produce is at or approaching its peak. A subsidiary rise in food expenditure in the spring, followed by a higher peak in the summer, had been noticed insome years. The seasonality of food expenditure, as affected by supplies and pricesof home produce, is considered further in paragraphs 26 and 29-32.17. Table 6 indicates the principal changes in domestic food expenditure andprices since 1952. Up to 1954 the increase was entirely concentrated on a limited
TABLE 6
Principal changes in Average Food Expenditure and Prices 1952-1956(1952=100)
Expenditure Price
1952 1953 1954 1955 195° 1952 1953 1954 1955 195°
Cheese . IOO in 123 133 162 IOO 102 101 H3 135
Carcase meat . 100 142 170 195 2IO IOO 106 "4 128 131
Eggs, shell IOO 151 136 148 153 100 i 109 88 98 94Butter . IOO 151 212 238 240 IOO 120 M7 '49 144
Margarine IOO 112 151 152 152 IOO 115 138 144 149Sugar . too 144 191 204 217 IOO "7 125 128 '34Tea IOO 130 168 200 188 IOO 109 131 160 '45Canned andbottled fruit . IOO 128 176 234 252 IOO 96 101 IQI 107
Total above foods 100 138 .64 185 194 IOO 109 "5 126 127
Potatoes IOO 99 93 112 124 IOO 107 105 128 148
Bread . IOO 95 93 93 101 IOO 107 in i'3 'SiAll other foods. IOO 101 99 i°5 112 IOO 102 104 107 113
Total all foods . IOO no 114 124 132 IOO i°5 107 114 119
8 Domestic Food Consumption and Expenditure, 1956
number of foods, especially meat, butter, sugar, tea and canned and bottled fruit,for which there had long been an unsatisfied demand. In 1955 expenditure on mostformerly rationed foods continued to increase, though less rapidly, and expenditureon potatoes rose steeply after the end of price control on ist August, because ofthe poor main crop. In 1956 the largest price rises were for bread, which wasdecontrolled on 3oth September, and natural cheese. The rise in expenditure oncarcase meat continued, but expenditure on fats showed little change, while that ontea decreased. The eight foods shown above the line in Table 6 accounted for 25per cent of the household food budget in 1952 and for 37 per cent in 1956. Over thisperiod expenditure on the remaining foods, and especially on bread and potatoes,had not kept pace with rising prices.
18. Estimates of household expenditure on the main foods during each quarterof the year are given in Table 8, which also shows percentage changes comparedwith the previous year. Details of changes in expenditure during the year are liableto be misleading, however, unless they are considered in connection with the corresponding changes in consumption, which are discussed in paragraphs 21-37 below.Total domestic food expenditure rose by is. 7d. per head per week (6 per cent)compared with rises of 2s. id. (9 per cent) between 1954 and 1955, nd. (4 per cent)between 1953 and 1954 and 2s. id. (10 per cent) between 1952 and 1953. Theincrease in 1956 was spread over many foods; beef and veal accounted for 2d.,mutton and lamb for ifd., fish ifd., bread ijd., fresh fruit ijd., potatoes, liquidmilk and cheese each i Jd. No other commodity contributed as much as a penny perhead per week, though there were large percentage increases for cream (18 per cent)and branded dried milk (33 per cent), poultry (58 per cent), quick-frozen legumes
(31 per cent) and breakfast cereals other than oatmeal (15 per cent). The rise inexpenditure on potatoes was due entirely to the shortage of old potatoes in the firsthalf of the year, and that on bread to the price increases which preceded andaccompanied decontrol. Expenditure on flour, cooking fats and preserves continuedto decline, and there were decreases for pork and pork sausages.
19. Table 7 shows for each quarter of the year, and for each of the main foodgroups, the percentage change in the average price paid and the average "quantity"purchased, compared with the corresponding quarters of 1955. The comparisonhas been made in this way in order to eliminate seasonal variations as far as possible,and so to indicate the underlying trend of prices. The quantity index has beenconstructed by dividing the index of the expenditures in the two periods by a priceindex of the Fisher Ideal type, the geometric mean of indices with weights appropriate to the earlier and the later periods respectively. The main purpose of thecalculation is to apportion the 6 per cent increase in domestic food expenditurebetween price and "quantity", and so to assess the real improvement in the diet interms of consumer satisfaction (which may not correspond to its nutritional value).As explained in paragraph 29 of the Annual Report for I9551 the term "quantity"must be understood with some latitude as including elements of quality and service.The index actually constructed does not realise this concept precisely, because allthe changes in the quality of purchases could only be separated from changes inprice if the classification of foods were indefinitely detailed, which is not possiblein practice. With this qualification, it may be concluded that of the 6 per centincrease in average domestic food expenditure per head in 1956, over 4 per centwas attributable to higher prices and nearly 2 per cent to an improvement in thestandard of purchases, as measured by consumer preference.W Domestic Pood Consumption and Expenditure: 1955. H.M.S.O., 1957.

The Household Diet in 1956 9
TABLE 7Changes in Indices of Average Prices and Quantities Purchased
Quarters of 1956 compared with corresponding Quarters of 1955(percentage change)
t
Price
1956
Quantity purchased
1956lit 2nd 3rd 4th on ISt -W 3rd 4th on
MILK AND MILK
Qtr. Qtr. Qtr. Qtr. 1955 Qtr. Qrr. Qtr. Qtr. 1955
PRODUCTS:
Liquid milk + i + 0 + 7 + 8 + 4 + o + i + o + o + iAll + 5 + 4 + 9 + 8 + 7 — 0 + 2 + o + 2 + i
MEAT:Carcase . + 6 + 7 — o — 2 + 3 — 0 + I + 12 + 6 + 4Bacon + " + 27 + 8 — 4 + 10 + I -16 - 5 + 2 - 5Other . + 6 + 7 + 3 — o + 4 + 2 + 8 + 2 + 6 + 4AU + 7 + 10 + 2 — 2 + 4 + I — 0 + 6 + 6 + 3
FISH + 6 + 9 + 13 + 8 + 8 + 5 + 9 + 10 + o + 6
EGGS + 4 — 2 - 4 -14 - 4 + 7 + 5 + 7 + 12 + 8FATS:
Butter . + 6 - 7 - 4 — ii - 4 + 3 + 9 + 2 + 7 + 5Margarine + I + 3 + 5 + 7 + 4 - 6 — 2 - 3 - 6 - 4Other . -H - 5 — 4 — i - 6 — i - 4 + 3 - 6 — 2
AD + I - 4 — 2 - 5 — 2 + o + 4 + i + i + ISUGAR . + 7 + 7 + 2 + 3 + 5 + 2 + i + 3 + 2 + 2
PRESERVES . + 7 + 9 + 5 + 6 + 7 - 7 — 6 - 5 -13 - 8VEGETABLES:Potatoes . +46 +47 -17 -18 + 15 - 3 - 7 + o - 5 - 3Fresh green . + 16 + 23 + i -16 + 7 -14 - 6 + 2 + 14 — 2
Other . — o — i + 4 + i + i +" + 16 + 6 + 3 + 9AU + 20 + *4 - 6 — ii + 8 + I + o + 3 + 2 + i
FRUIT:Fresh . + 8 + 16 + 9 + 2 + 9 + 9 - 5 —
4 + 6 + o
Other . + 8 + 5 + 5 + 5 + 6 + I + 5 - 5 + 6 + 2AH + 8 + 13 + 8 + 3 + 8 + 6 - 3 - 4 + 6 + ICEREALS:Bread . + 7 + 14 + 13 + 32 + 16 - 7 - 4 - 7 - 8 - 7Flour + 2 + 3 + 5 + 7 + 4 — 12 — 12 — 2 - 6 - 8Cakes andbiscuits + 2 + i + 2 + 2 + 2 + 10 + 2 — I + 3 + 4Other . + I + 2 + 3 + 3 + 3 + 5 + 11 + I + 8 + 6AU + 4 + 6 + 7 + 13 + 7 + i — 0 - 3 — i — i
BEVERAGES:Tea - M — 12 - 5 - 4 - 9 + 3 + 4 + i + 5 + 3Other . + 9 + o + 6 + 2 + 5 — 2 + 14 + 9 + 4 + 5AU - 9 — 10 - 3 - 3 - 6 + 2 + 6 + 2 + 5 + 4Miscellaneous(a) + I + o + .3 + 4 + 3 + 2 + 5 + 16 + 7 + 7
AU Foods (a) . + 5-6 + 7-5 + 3-o +0-9 + 4-3 + 1-3 + i-i + 2-1 + 3-2 + 1-9(a) Excludes a few miscellaneous items for which expenditure only was recorded.

io Domestic Food Consumption and Expenditure, 1956
20. During the first half of the year, and especially the second quarter, the generallevel of food prices was well above the previous year's level, mainly because of thescarcity of old potatoes and, to a smaller extent, of fresh green vegetables, and alsobecause bacon had been exceptionally cheap in the spring of 1955. Food prices inthe second half of the year were relatively stable, rises in bread, milk, cheese andfish compared with the previous year being largely offset by substantial reductionsfor potatoes and (in the last quarter) butter, eggs and fresh green vegetables. Indeed,but for the removal of the bread subsidy, average food prices in the last quarterwould have been lower than a year before, for the first time since the spring of1954. The Suez crisis in November hardly affected food supplies or prices duringthe period under review, though it led to a sharp increase in some non-food prices.The quantity index continued to record an upward trend, which began in the lastquarter of 1952 and continued somewhat unevenly until the beginning of 1957. Theprincipal contributions to the increase of i •9 per cent recorded for the year as awhole (compared with 2-4 in the preceding year) were from "other" vegetables
(9 per cent), eggs (8 per cent), fish and "other" cereals (each 6 per cent) and frommiscellaneous foods (7 per cent). For each of these commodities, and also for butter,sugar, tea and "other" meat, the quantity index recorded an increase in each quartercompared with a year before. The largest decreases were for bread (7 per cent),flour and preserves (each 8 per cent). For these foods, and also for margarine, thequantity index recorded a fall in each quarter compared with the correspondingquarter of 1955.
Consumption
21. Tables 8 and 9 summarize domestic expenditure and consumption for themain foods during each quarter of the year, and show annual averages for 1955 and
1956. Tables showing consumption and expenditure in more detail, with averageprices paid by housewives and the proportion of households purchasing each typeof food during the survey week, are given for all foods in Appendix B. The percentage changes shown in the last column of Table 9 differ from the correspondingchanges in the quantity index in Table 7 partly because the latter is confined topurchases and takes no account of changes in the volume of free supplies, and partlybecause the quantity index is affected by any change in the proportions of differentfoods within each group. Most of the quarterly changes shown in Tables 8 and 9are seasonal variations.
MILK, CHEESE, MEAT, FISH AND EGGS
22. Total domestic consumption of liquid and processed milk was almost the sameas in 1954 and 1955. An increase of \A. per pint in the maximum retail price ofliquid milk on ist July had no appreciable effect on demand, the slight fall inpurchases in the third quarter being seasonal. It is clear that the absence of schoolmilk during the August holidays is not made good in the home; this tends to confirmthe view that if milk were not provided at school, children would not make up forthe lack of it by drinking more at home. National dried milk continued to loseground to branded dried milk, though the latter was five times as expensive.Consumption of cream averaged o •26 oz. per head per week compared with o •23 oz.in 1955 and o- 18 oz. in 1954; from June to October inclusive the average was 0-31oz. Evaporated milk, which is sometimes used instead of cream, showed a similarseasonal variation.
The Household Diet in 1956 IITABLE 8
Domestic Food Expenditure by All Households, 1956
(fence per head per week)
1955 '956 Percentage
Yearlyaverage
Quarter Yearlyaverage
change
7956 on
1955
MILK AND CREAM:
i 2 3 4
Liquid retail . 27-39 27-84 28-28 28-94 29-53 28-65 + 5Liquid welfare . 1-04 1-13 I -08 i -06 1-09 1-09 + 5
All Liquid Milk 28-43 28-97 29-36 30-00 30-62 29-74 + 5
Condensed 1-22 1-18 1-22 i-39 1-42 1-30 + 7Dried and other 0-39 0-41 0-45 o-57 0-46 0-47 + 19Cream . o-75 0-72 0-97 i -06 0-81 0-89 + 18
Total Milk and Cream 30-79 31-28 32-00 33-02 33-31 32-40 + 5
CHEESE:Natural . 4-68 5-56 5-7° 5-92 5-96 5-78 + 24Processed and packeted 1-19 1-20 1-36 '•45 1-51 1-38 + 16
Total Cheese 5-87 6-76 7-06 T37 7-47 7-16 + 22
MEAT:Carcase . 44-57 47-52 47-73 47-24 49-3° 47-95 + 8
Bacon and ham,uncooked 14-3° 15-00 14-86 14-90 15-23 15-00 + 5
Other(a) . 25-84 26-33 28-77 28-36 28-99 28-11 + 9
Total Meat 84-71 88-85 91-36 90-50 93-52 9.1-06 + 7
FISH:Fresh and processed (b) 7-38 8-20 7-77 7-81 8-16 7-99 + 8
Prepared(c) 3-93 4-72 5-60 5-35 4-46 5-°3 + 28
Total Fish 11-31 12-92 13-37 13-16 12-62 13-02 +15
EGGS . . . ' 17.35 17-73 16-38 18-55 18-84 17-88 + 3
FATS:
Buner . . . 12-90 13-47 12-71 12-81 13-06 13-01 + iMargarine . . I 6-05 5-92 6-02 6-01 6-20 6-04 — o
Lard and compoundcooking fat . . < 3-02 2-75 2-50 2-50 2-82 2-64 -13Other fats o-73 0-88 0-70 0-73 0-85 0-79 + 8
Total Pats 33 -JO 23-02 21-93 22-05 22-93 22-48
SUGARAND PRESERVES: i
Sugar 8-80 9-04 8-98 9-88 9-62 9-38 + 7Honey, preserves,syrup and treacle . 4-05 4-03 4-30 3-79 3-78 3-98 ~ 2
Total Sugar andPreserves • . ' 12-85 I3-07 '3'28 13.67 13-40 13-36 + 4
(a) Includes cooked and canned meats, and meat products.(b) Includes smoked, dried and salted.
(c) Includes cooked, canned and bottled fish, and fish products.

Domestic Food Consumption and Expenditure, 1956
TABLE 8—continued
(pence per head per week)
'955
Quarter
'956 Percentagechange
1956 on
Z955
VEGETABLES:Potatoes, includingchips and crispsFresh greenOther(d) .
Yearlyaverage i 2 3 4
YearlyAverage
11-386-00
9-56
13-74 I9-IO8-2712-62
8-776-84
8-755-°59-67
12-59 +«5-0711-48 8-58
6-3110-58
+ 5+ u
Total Vegetables 36-0.4 30-29 39-99 24-19 23-47 29-48 + 9
FRUIT:Fresh(e) .
Other(f) .16-69 '4-47
7-5121-658-94
22-62
7-9814-2910-88
18-258-83
+ 98-22 + 7
Total Fruit(e) • 24-91 21-98 3° -59 30-60 25-77 27-08 + 9
CEREALS:Brown bread(g)White bread(h)Wholewheat andwholemeal bread .
Other bread(i) .
0-70 0-7813-89
0-86
15-46
0-91
15-03
I-OI 0-8915-24
+ 28+ 714-22 16-57
0-81
1-920-771-92
0-892-15
0-832-13
0-82
2-540-832-18
+ 2+ M
Total Bread® . 17-65 17-36 19-36 18-90 20-94 19-14 + *
FlourCakesO) .
Biscuits .
Oatmeal and oat
productsBreakfast cereals
Other
3'6o 3'439-978-62
3-36 3-28 3-7610-29
3-46 - 4+ 7+ 4
9-398-65
IO-IO 9-749-00
10-038-968-90 9-32
0-902-453-36
1-19 0-732-97
o-453-183-62
i-n2-763-77
0-872-81
3-61
-132-333-28
+ 153-77 + 7
Total Cereals . 46-00 46-18 49-19 48-17 St-95 48-88 + 6
BEVERAGES:Tea ...CoffeeCocoaBranded food drinks.
I4-582-190-61
0-70
13-762-650-700-98
13-84
2-440-510-78
I3-3I2-33
14-01 13-732-480-580-79
- 60-52
2-530-590-86
+ 13-4
+ 13o-55
Total Beverages 18-08 18-09 iy-57 i6-yz 77-99 WSS - 3MISCELLANEOUS(k) . 6-46 7-23 6-93 6-74 7'49 7-09 + 10
TOTAL ALL FOODS . 308-0725s. 8d.)
3I7-3326s. 5d.)
339-62285. 4d.)
324-77275. id.)
328-17273. 4d.)
327-47(275. 3d.)
+ 6
(d) Includes dried and canned vegetables, and vegetable products.
(e) Includes tomatoes.
(f) Includes dried, canned and bottled fruit.(g) Includes national brown bread.
(h) Includes national bread (other than brown), national milk bread, and unsubsidizedwhite bread.
(i) Includes rolls, fruit bread and sandwiches.(j) Includes buns, scones, tea cakes, muffins and crumpets.
(k)Invalid and baby foods, spreads and dressings, soups, meat and vegetable extractsand items on which expenditure only was recorded.

The Household Diet in 1956
TABLE 9Domestic Food Consumption by all Households, 1956(Oz. per head per week except where otherwise stated)
1955 1956 Percentage
Yearly Quarter Yearly change
average average 1956 on
MILK AND CREAM:
i a 3 4 1955
Liquid retail (pt.) 4-02 3-97 4-04 3-98 3-99 4-00 — oLiquid welfare andKhool (pt.) 0-79 0-84 0-83 0-76 0-86 0-83 + 5
All Liquid Milk (pi.) . 4-81 4-81 4-87 4-74 4-«5 4-83 + o
Condensed (eq. pt.) . 0-16 0-14 0-15 0-16 0-17 0-16 + oDried and other (pt oreq. pt.) . O-II O-IO 0-09 0-15 O-II O-II — 5Cream (pt.) O-OI O-OI O-OI O-OI O-OI O-OI + 10
Total Milk and Cream(pt. or eq. pt.') 5'°9 5-06 5-12 5-06 5-14 5-11 + o
CHEESE:
Natural . 2-46 2-41 2-47 2-48 2-45 2-45 — 0Processed and packeted o-37 0-35 0-39 o-43 0-44 0-40 + 9
Total Cheese 2-83 2-76 2-86 2-pr 2-«p 2-85 + IHEAT:Carcase 18-23 19-08 19-09 18-61 19-46 19-06 + 5Bacon and ham,uncooked 5-35 5'34 5-11 5-°3 4'95 5-11 — 4Other(a) . 10-84 ii -09 11-06 10-88 11-72 11-18 + 3
Total Meat 34-4" 35-51 35-26 34-52 36-I3 35-35 + 3
FISH:Fresh and processed(b) 4-58 4-87 4-29 4'33 4-60 4'53 — iPrepared(c) i-37 1-48 1-72 1-71 1-48 1-60 + 17
Total Fish 5-95 6-35 6-01 6-04 6-08 6-13 + 3
EGGS . . (No.) 4-19 4-40 4'5° 4-27 4-24 4'35 + 4
FATS:
Butter 4-47 4-38 4-78 4-82 4-80 4-70 + 5Margarine 4-68 4-5i 4'53 4-42 4-46 4-48 - 4Lard and compoundcooking fat 2-18 2 -2O 1-99 1-99 2-15 2-08 - 5Other fats o-55 0-68 0-50 o-53 0-65 0-58 + 6
Total Fats 11-88 71-77 ii -So 11-76 12-06 11-84 — o
SUGAR AND PRESERVES:Sugar 17-64 17-52 17-30 19-13 18-04 18-00 + 2Honey, preserves, syrupand treacle 4-09 3-86 3-96 3'53 3-44 3-69 — IO
Total Sugar andPreserves . 21-73 21-38 21-26 22-66 21-48 21-69 — 0

Domestic Food Consumption and Expenditure, 1956
TABLE 9—continued
(Oz. per head per week except where otherwise stated}
19551956 Per-
centage
Yearly Quarter Yearly changeaverage average 1956 on
VEGETABLES:
i 2 3 4 1955
Potatoes, including chipsand crisps 61 -17 62-18 53-16 55-87 62-51 58-43 - 4Fresh green 14-79 9-29 II -OO 22-10 14-96 M-34 - 3Other(d) . 15-87 19-29 15-80 H-57 17-83 16-89 + 6
Total Vegetables 01-83 90-76 79.96 9* -54 95 -jo 89-66 + 2
FRUIT:Fresh(e) . 20-65 17-64 19-94 25-95 18-68 20-56 — O
Other(f) . 6-49 5-83 6-74 5-77 7-68 6-51 + o
Total Fruir(e) . 27-14 23-47 26-68 31-72 26-36 27-07 — 0
CEREALS:Brown bread(g) . 2-25 2-37 2-39 2-48 2-30 2-38 + 6White bread(h) . 48-59 44-78 46-43 45-16 41 -06 44'36 — 9Wholewheat andwholemeal bread l -69 1-54 i "73 1-61 1-52 1-60 — 5Other bread(i) . 2-60 2-49 2-60 2-56 3-3° 2-74 + 5
Total Bread(i) . 55-13 51-18 53-15 51-81 48-18 51-08 7
Flour 8-57 8-04i
7-67 7-46 8-40 7-89 - 8Cakes® . 5-56 5-91 5'7° 5-38 5-68 5-67 + 2Biscuits 5-12 5-10 5-3° 5-37 5-4i 5-3° + 4Oatmeal and oat products i -19 i-55 0-96 0-58 1-35 i -ii —
7
Breakfast cereals i -69 1-56 1-90 2 -O2 1-77 1-81 + 7Other 2-78 2-90 3-07 2-87 3'°9 2-97 + 7
Total Cereals 80-04 76-24 77-75 75-49 73-88 75-83 - 5BEVERAGES:Tea . 2-79 2-86 2-91 2-81 2-95 2-88 + 3Coffee 0-36 0-40 0-39 : 0-36 0-38 0-38 + 6Cocoa O-2I 0-24 0-18 0-19 O-22 0-21 — iBranded food drinks . I 0-18 0-25 0-20 0-15 0-21 O-2O + 10
Total Beverages . . 3-54 3-75 3-68 3-5i 3-76 3-67 + 4
(a) Includes cooked and canned meats, and meat products.
(b) Includes smoked, dried and salted.
(c) Includes cooked, canned and bottled fish, and fish products.
(d) Includes dried and canned vegetables, and vegetable products.
(e) Includes tomatoes.
(f) Includes dried, canned and bottled fruit.
(g) Includes national brown bread.
(h) Includes national bread (other than brown), national milk bread and unsubsidizedwhite bread.
(i) Includes rolls, fruit bread and sandwiches.
(j) Includes buns, scones, tea cakes, muffins and crumpets.
The Household Diet in 1956 15
23. Cheese consumption was almost unchanged at 2-85 oz. per head per week,with a slight rise in the summer months, when the demand for natural cheesesproved wholly inelastic to an average price rise of over 30 per cent compared with ayear before (in part, no doubt, a change in quality and variety).
24. Expenditure on carcase meat amounted to 45. od. per head per week, and theaverage consumption for the year exceeded 19 oz. for the first time since the war;of this, 10 oz. was beef and veal, over 7 oz. mutton and lamb and less than 2 oz.pork, which had become dearer than beef. From May to August consumption ofmutton was high and that of pork low. Until the last quarter bacon was moreexpensive than a year before and consumption accordingly declined, expenditure
remaining near is. 3d. per head per week throughout the year. Expenditure onand consumption of other types of meat increased, with the exception of porksausages (which lost ground to beef sausages) and rabbit, game and miscellaneousmeats, which fell almost to nothing in the summer. The usual summer reductionsin purchases of sausages, meat products, bones and offals other than liver werecounterbalanced by increases in corned and other canned meat and cooked ham.
25. Fish consumption, though still much lower than when meat was rationed, rosefro™- 5 '95 to 6- 13 oz. per head per week, mainly because of improved supplies ofthe dearer kinds of canned fish, such as canned salmon and crab (the average priceof canned fish rose to 6s. tod. per Ib. in March). Slight decreases in consumption ofall types of fresh fish were offset by a further increase in purchases of cooked fish,the only type of fish which was no dearer than in 1955.
26. Consumption of eggs varied remarkably little, ranging from 4 •6 per head perweek in the spring flush to 4 •2 at the end of the year. The variation in expenditurewas also narrower than usual, the spring minimum being is. 4d., the autumnmaximum is. 8d. Free supplies were unusually scarce and late. Average prices werelowest (35. lojd. per dozen) in May, and rose to no more than 55. ijd. in September.
FATS, SUGAR AND PRESERVES
27. Total consumption of fats was almost unchanged at n-8 oz. per head perweek, but there were some interesting changes within this total. From the secondquarter onwards the consumption of butter exceeded that of margarine. Theaverage of butter prices fell from 45. 4d. per Ib. at the beginning of the year tounder 35. 5d. in May, but then rose to 35. 8Jd. in October, after which the downward trend was resumed. The average price ofmargarine gradually rose during theyear from is. gjd. to is. lojd. per Ib., with consumption fairly steady at 4-5 oz.Consumption of lard and compound cooking fats was lower than a year before,although prices were easier. Purchases of cooking fats and of suet and dripping werehighest in the winter and relatively low from May to August. Demand forother fats, oils and creams (including vegetable and salad oil) increased, especiallyin the summer months, when expenditure was four times that of the previousseason.
28. Sugar consumption rose further from 17•6 to 18 •o oz. per head per week (July
maximum 19-8 oz.), while consumption of preserves decreased from 4•i to 3 •7 oz.
and hi the last quarter averaged only 3-4 oz., prices remaining very firm in spite ofthe declining purchases. The price of sugar was steady at 8 Jd. per Ib. until nearlythe end of the year, when it began to increase without at first affecting demand.

i6 Domestic Food Consumption and Expenditure) 1956
FRUIT AND VEGETABLES
29. In view of the severe shortage of potatoes in the spring of 1956 and its markedeffect on the general price index, the monthly records are of interest and are shownin Table 10. In April, with only limited supplies of new potatoes arriving, the priceof old potatoes reached 4-gd. per Ib. compared with 2 -3d. in April 1955. TheApril-June average consumption of 53 oz. per head per week was the lowest andthe corresponding expenditure of is. 7d. the highest so far recorded for any quarter.The new season's supplies were plentiful and from July onwards prices were some20 per cent lower than a year before, but consumption during the latter part of1956 was below the previous year's level, when purchasers were buying for stockand thereby precipitating the shortage they anticipated.
TABLE 10
Old and New Potatoes: Consumption and Prices, 1956
Consumption (oz. per head
Jan. Pet. Mar. Apr. May Jun. July Aug. Sept. Oct. Nov. Dee.
per week)1955 crop 61-8 60-3 5»-» 50-8 35-8 tt-7 5-6 O- 1 — — — —1956 crop (a) . 0-3 a-7 5'3 13-8 26-9 44-4 55-» 58'0 6I-I 61-1 60-1Price (pence per Ib.)1955 crop 3'I 3'4 3'8 4-9 4-4 3'4 3'2 (2-0) — — — —1956 crop (12.0) 6-9 9-2 "•5 IO- X 7-1 3-6 2-5 3-3 2-3 2-3 »•*
(a) From ist September potatoes of the 1956 crop were regarded as "old".
30. Consumption of fresh green vegetables at 14-3 oz. per head per week wasslightly lower but expenditure at 6 •3d. 5 per cent higher than in 1955; the maintypes were scarce and dear in the spring, but towards the end of the year priceswere much lower and supplies more plentiful than a year before. Consumption ofcabbage was above the year's average in May and June and again from August toNovember; the price rose to n £d. per Ib. in April, falling steadily to 4d. in October.Brussels sprouts were also unusually expensive in the spring, but by the end of theyear the price was below yd. per Ib. and consumption had risen to 6 •9 oz. per head
per week. Even for cauliflower the average consumption varied more than usual,ranging from 0-4 oz. at over is. 2d. per Ib. in March to about 3 oz. at under 8d. inthe autumn. The consumption of leafy salads was highest (3 •3 oz.) and priceslowest (n£d. per Ib.) in July, when fresh legumes were also cheapest (yfd. per Ib.),though garden produce was, as often, some weeks behind the commercial crop, sothat consumption of peas and beans was greatest (13-4 oz.) in August, when retailsupplies were already declining. Purchases of quick-frozen legumes again increased,rising to 0-4 oz. per head per week in March when other green vegetables werescarcest.
31. The spring shortage of green vegetables was partly made good by carrotsand dried and canned vegetables, especially canned peas and beans, all of whichwere cheaper than in the corresponding months of 1955. Except during this period,the demand for dried pulses tended to lag, but purchases of canned beans wereuniformly higher than a year before, rising to 2 •6 oz. per head per week during thethree difficult months in the spring and falling only to i -9 oz. in July. Demand forcanned peas was also assisted by lower prices, and purchases did not fall below i . 9oz. even in August, when fresh peas were most abundant. Supplies of onions, shallotsand leeks were about the same as in 1955, but in March the pressure of demandforced the price up to 10 •id. per Ib. and it did not subsequently fall below yd.

The Household Diet in 1956 17
Consumption of carrots remained above the previous year's level until the autumn,but in the last quarter, with green vegetables remaining plentiful, lower prices forroot vegetables failed to stimulate demand.
32. Total consumption of fresh fruit was practically unchanged at 20 •6 oz. perhead per week, although the average was running below the previous year's level
during the spring and summer, when soft fruit and oranges were scarcer and more
erpensive than in 1955. Tomato consumption was also lower than in 1955 duringthe peak season (June-September), but these declines were offset by a 16 per centincrease in purchases of bananas, which averaged 3-4 oz. and were maintained at3-0 oz. or above throughout the year, and by a 24 per cent increase for canned andbottled tomatoes. Apples and pears were dearer than in the previous season, thoughnot less plentiful. Consumption of dried fruit was lower and prices higher than inthe corresponding quarters of 1955, with average expenditure maintained. Consumption of fruit juices (other than welfare orange juice) showed a rise in the thirdquarter, not found in previous years. About a third of the year's total sales of nutsand of fruit and nut products occurred in the month before Christmas.
CEREALS, BEVERAGES AND MISCELLANEOUS FOODS
33. Expenditure on bread at is. 7Jd. per head per week was 8 per cent higher andconsumption at 51
•i oz. per head per week 7 per cent lower than in 1955. With theremoval of the subsidy and price control on 3oth September, 1956, prices immediately rose. That of the large if Ib. national "white" loaf had averaged gd.; upondecontrol the price of the corresponding unwrapped and unsliced white loaf was' •d. or nd. Consumer reaction was quite marked, consumption in the last quarterof the year falling to 48 •2 oz. for an expenditure of is. gd. compared with 5 1 •8 oz.and is. 7d. in the third quarter and with 54-0 oz. and is. 5d. a year earlier. Clearly,however, some time must elapse before reliable conclusions can be drawn concerning the relationship between price and demand. The fall in the quantity of breadactually eaten may not have been so great as would appear; with higher prices theremay have been less wastage, especially as there was no corresponding reduction inpurchases of butter and margarine.
34. With the ending of the bread subsidy the term "national" bread, applied tosubsidized bread made from national flour, which should legally have been of 80per cent extraction or the equivalent, ceased to be applicable, and the Survey'sclassification of types of bread was revised. Details are given in Appendix F, whichcontains an analysis of expenditure on and consumption of these types of bread bysocial class, household composition, region and type of area.
35. Flour purchases were 7-9 oz. per head per week, 8 per cent less than in 1955.There were slight increases in purchases of cakes (but not buns), biscuits andpuddings. Oatmeal again lost ground to other breakfast cereals, even in the wintermonths.
36. From February onwards the average price of tea was within a halfpenny of, 6s. 4d. per Ib.; 9 per cent lower than in 1955. Consumption was 3 per cent greaterat 2 -88 oz. per head per week, and increased from 2 -8 oz. at the beginning of theyear to 3 •o oz. at the end, with a slight seasonal fall in the summer; this was alsoperceptible for coffee, and more pronounced for cocoa and the branded food drinks.
37. Expenditure on pickles and sauces was uniformly higher than in correspondingquarters of 1955; the average for the year was i ~7d. per head per week, a 19 per

i8 Domestic Food Consumption and Expenditure, 1956
cent increase, but no price data are available. Expenditure on spreads and dressingsand on table jellies was seasonally high, and on soups and meat and vegetableextracts low, from May to August.
Energy Value and Nutrient Content
38. The energy value and nutrient content of the household diet in 1956 wascalculated by the method described in The Urban Working-Class Household Diet
1940 to 1949*. As in the reports for 1954 and 1955, the only major change in theprocedure was that the nutrient values of flour and bread were estimated usinganalyses of flour made by the Government Chemist for the National Flour Survey.The figures shown in Table n represent the nutritive value of the edible portionof food purchased or obtained "free" for consumption at home or in packed mealscarried and eaten away from home: other food eaten outside the home is not included, nor are sweets, soft or alcoholic drinks, fish liver oil or vitamin tablets, whetherproprietary or welfare. In calculating the nutritive value of the diet, no allowancewas made for kitchen or plate wastage, but the estimated intakes of vitamins Bjand C were adjusted to allow for cooking losses, in accordance with the recommendations of the Medical Research Council, t
39. Table n shows the quarterly averages for all households during 1956 and theyearly averages for 1952, 1955 and 1956. The changes between 1955 and 1956reflect the rise in the consumption of all meats (excluding bacon), fish, eggs, butterand cheese and the fall in that of bread, flour, potatoes, margarine, cooking fat andgreen vegetables. In addition to the fall in the consumption of flour as such, or asbread, there were changes in the composition of flour. Until the end of Septembermost of the bread purchased was national bread fortified with creta preparata;during the last quarter national was replaced by white bread in which iron, vitamin
B! and nicotinic acid had been restored to prescribed levels, and the addition ofcreta maintained. J The Government Chemist's analyses snowed that in 1956,compared with 1955, there was a fall in the vitamin Bt content of national flourwhich was accompanied by smaller, but still considerable, reductions in iron andnicotinic acid. In all National Food Survey reports bread had been shown to beone of the most important sources of protein, calcium, iron, vitamin B! and nicotinicacid in the diet. Thus in comparison with 1955 the small changes in the amounts ofprotein and calcium (up to 2 per cent) arose mainly from the fall in consumption ofbread and flour, offset to some extent by the rise in that of other foods; the smalldecreases in vitamin B,, nicotinic acid and iron (also up to 2 per cent) reflected boththe lower consumption of, and their reduced content in, flour; they would have beengreater but for the change to white bread made from flour containing markedlyhigher quantities of these three nutrients during the last quarter (Table ir)§.
*The Urban Working-Class Household Diet 1940 to 1949. H.M.S.O., 1951, paragraph 117.
^Nutritive Value of Wartime Foods, Medical Research Council, War Memorandum No. 14,H.M.S.O., 1945.
JSee Statutory Instrument No. 1183, 1956.
§ There was some delay in making administrative arrangement for the regular sampling ofwhite flour after decontrol, and in estimating the vitamin and mineral content of flour in thelast quarter of 1956, analyses made during the first quarter of 1957 have been used.
The Household Diet in 1956
TABLE IIEnergy Value and Nutrient Content of Domestic Food Consumption
All Households, 1952, 1955 and 1956(per head per day)
195* 1955 1956 1956Yearly Yearly Yearlyaverage average average 1st 2nd 3rd 4th
Qtr. Qtr. Qtr. Qtr.
Energy value (Cal.) . 2447 2641 2624 2632 2628 2622 2614Total protein (g.) 77 77 76 76 75 75 75Animal protein (g.) . 38 42 43 42 43 42 43
Fat(g.) . 94 107 108 109 108 107 109
Carbohydrate (g.) 324 342 337 337 338 34° 333Calcium (mg.) . 1043 1044 1029 IO2I 1039 1027 1028Iron (mg.) 13-0 I3-5 I3-3 12-7 12-7 13-4 14-3Vitamin A (i.u.) 3551 4199 4310 14058 4327 44*2 4434Vitamin BI (mg.) 1-28 1-24 I-2I 1-18 1-15 I -19 1-31Riboflavin (mg.) 1-64 1-65 I-65 1-63 1-64 1-66 1-66
N'icotinic acid (mg. i . 12-9 13-' I3-0 12-8 12-5 12-8 14-0Vitamin C (mg.) 53 5' 5° 40 43 69 47Vitamin D (i.u.) 148 144 150 146 '47 159 146
40. Increases in the vitamin A content of the diet between 1955 and 1956 werethe result of higher consumption of liver and carrots. The decrease in the vitaminC content, caused partly by reduced potato consumption, was relatively small (2 per
cent). Between 1952 and 1956 potato consumption fell from 66 oz. to 58 oz. perhead per week. Over the same years the total consumption of fruit increased bynearly 7 per cent; but there was a tendency for the contribution from fresh fruit tofall and that from other fruits to rise. The other important changes in the sourcesof nutrients between 1952 and 1956 can be summarized as follows: between 1952and 1954 there was a continuous rise in the consumption of sugar, cheese, carcasemeat, bacon, fat and flour; milk consumption showed little change, but breadconsumption fell. In 1955, the first complete year after the end of rationing, therewere further increases in meat, fat and sugar consumption accompanied byslight decreases in cheese, eggs, bread and flour. In 1956 there were still further andgreater decreases in bread and flour consumption, and increases in meat, eggs andsugar. Between 1952 and 1956 bread consumption fell from 60 to 51 oz. per headper week. Milk consumption remained remarkably constant throughout.
41. Quarterly averages shown in Table n do not vary by more than 2 per centfrom the yearly figures for energy value, protein, fat, carbohydrate, calcium andriboflavin. Apart from the usual fluctuations in vitamins A and C, arising mainlyfrom seasonal changes in the consumption of vegetables and fruit, there were markedvariations from the yearly average in iron (+8 per cent), vitamin Bl (+8 per cent)and nicotinic acid content (+8 per cent) in the fourth quarter, arising from thereplacement of national bread with white bread fortified with these nutrients.
42. Table 12 gives figures illustrating the relative adequacies of the average house-bold diet for the years 1952, 1955 and 1956 and the four quarters 1956 in comparisonwith allowances based on the scale of dietary requirements recommended by theBritish Medical Association, which take into account, inter alia, sex, age of youngpeople, and activity of adult occupations. In this comparison adjustments have been

20 Domestic Food Consumption and Expenditure, 1956
made for meals taken outside the home and a further adjustment of 10 per cent hasbeen applied to allow for plate and other wastage or spoilage of edible food, and alsofor food bought for human consumption and given to domestic pets. Only in tablesrelating to the adequacy of the diet has this 10 per cent been deducted. In interpreting the percentages in Table 12 and in similar tables, it is important to bear in
TABLE 12
Comparison of Energy Value and Nutrient Content of Domestic Food Consumptionwith Allowances based on the British Medical Association's Recommendations^)
All households, 1952, 1955 and 1956(per cent)
7952 1955 1956 1956Yearly Yearly Yearlyaverage average average ISt znd 3rd 4th
Qtr. Qtr. Qtr. Qtr.
Energy value . 99 105 i°5 106 105 i°5 105Total protein . 104 i°3 102 102 IOI IOI 102Calcium . 108 108 107 106 108 105 107Iron 106 109 108 103 i°3 109 117Vitamin A I48 176 182 172 183 187 189Vitamin BI 131 124 122 119 116 120 134Riboflavin 109 108 109 108 108 109 noNicotinic acid . 131 131 132 130 126 129 142Vitamin C (b) . 244 231 226 183 197 3" 217
(a) See paragraph 42.
(b) Use of the Vitamin C allowances recommended by the National Research Council of theU.S.A., which are over three times those of the British Medical Association, would give muchlower figures here and in Tables 21, 26, 36, 48 and 59.
mind that there may be wide variations in wastage in different groups and that the10 per cent is no more than a rough approximation. It is also necessary to appreciatethe approximate nature of the estimates of average nutritional requirements onwhich the tables are based.* All such percentages relate to the averages for groups;within any one group there must be many households considerably above and belowthe average. In assessing the significance of the results given it is important to notethat the British Medical Association related their scales of requirements for proteinand the vitamins of the B complex to energy requirements, and that from the datacollected by the National Food Survey it is difficult to be precise in the estimates oftotal energy needs of individuals. The considerable difference of opinion betweenscientists in this country and the United States of America on the magnitude ofthe vitamin C allowance should also be borne in mind in interpreting the percentages given in Table 12 and elsewhere for that vitamin.
43. Estimates of the adequacy of the average household diet were all over 100 percent in each of the four quarters. The percentages for 1956 were very close to thoseof 1955 for energy value and all nutrients. Between 1952 and 1956 the percentagesfor protein, vitamin Bl and vitamin C tended to fall and for vitamin A to rise; thosefor calcium, iron, riboflavin and nicotinic acid remained fairly constant and those
* See Domestic Food Consumption and Expenditure, 1955: para. 51, H.M.S.O. 1957.

The Household Diet in 1956 21
TABLE 13
Percentage of Energy Value Derived from Protein, Fat and CarbohydrateAll Households, 1952, 1955 and 1956
(per cent}
1952 Z955 1956 1956Yearly Yearly Yearlyaverage average average ISt 2nd 3rd 4th
Qtr. Qtr. Qtr. Qtr.
Protein . 12-6 n-6 11-5 n-6 "•5 11-5 "•5Fit ... 34'5 36-6 37'i 37'i 37'i 36-6 37-5Carbohydrate - 52-9 5i-7 5i-4 5i-3 5i-4 5'-9 51-0Total energy value IOO IOO IOO IOO IOO IOO IOO
Animal protein as percentage of total protein 48-6 54'5 56-3 55'7 56-6 56-0 57'4
for energy value did not change after 1954. Over these years those for vitamins Bland C decreased more than for other nutrients (because of reduced consumption ofbread and potatoes); a similar effect on the estimates for nicotinic acid was prevented by the rise in the consumption of many foods of animal origin. Although allpercentages remained above the standard, the decrease for protein brought the levelfor this nutrient down to 102 per cent in 1956.
44. The proportions of the total energy derived from protein, fat and carbohydratearc shown in Table 13. The most interesting feature is the slight fall in the percentages from protein and carbohydrate and the corresponding rise in that fromfet. There was also some replacement of the vegetable protein by protein of animalorigin.

IV
Household Diets of Social Classes
Classification
45. In previous Annual Reports the definition of social class was based on the grossweekly income of the head of the household, as stated by the housewife or if necessary imputed from occupation or other information, the points of subdivision usedin 1953-55 being £24, £15, fy and fjo per week. The lowest income group (Class D)was further divided into households solely or mainly dependent on old age pensions1
(abbreviated as O.A.P.), other households containing no earner (Class Dz) andhouseholds containing one or more earners (Class Di).
46. During 1955 it became clear that the income limits required revision. Becauseof the steady rise in earnings, an increasing proportion of manual workers' households shifted from Class C (£6-^9 per week) to Class B (£9-^15.) It was thereforedecided that in 1956 the income ranges should be modified, the proportions to beaimed at (before the further adjustment described in paragraph 48 below) beingClass Ai, 2\ per cent; A2, j\ per cent; B, 35 per cent; C, 30 per cent, and D, 25per cent—approximately the proportions found in the first half of 1955. The newincome grades had to be settled before the Ministry of Labour's October estimatesof earnings were available, but taking into account the April estimates, subsequentchanges in wage rates and further increases to be expected during 1956, the new
points of subdivision were fixed at £27, £16, £10 and £6 IDS. For the year 1956these gave the percentage distribution Ai, 2-8; A2, 9-8; B, 35-4; C, 29-6; D, 22-5.47. It was known at the beginning of 1956 that agricultural workers in Englandand Wales, and probably also in Scotland, were shortly to have their minimumwage increased from £6 75. to something over ££> ros. In order to keep the occupational composition of Classes C and Di as constant as possible throughout the year,the lower income limit for Class C households in which the head was an agriculturalworker was temporarily fixed at £6 75. pending the anticipated wage increases,which did in fact take place during the first quarter.
48. A further limitation of the old classification was that Class C was not welldistinguished from Class Di, which in some quarters had a higher average foodexpenditure per head. An experimental reclassification of earlier data suggestedthat this similarity was largely due to the inclusion in Class Di of a number ofhouseholds, in receipt of incomes from members other than the head, whose foodexpenditure was characteristic of a higher income grade. Towards the lower endof the income scale, food expenditure per head appeared to be more closely relatedto the income of the chief earner than to that of the nominal head of the household,so that the effect of reclassifying on the income of the principal earner was todiscriminate more sharply between Classes C and Di in food expenditure per head,net family income and household size, without appreciably affecting the averages forClasses A, B and C. The change was therefore introduced experimentally in 1956,with the results shown in Table 14, which gives the average domestic food expenditure per head and per household for each social class on both definitions, with some
'Including non-contributory and contributory retirement pensions, and pensions of widowsover 60 years of age.
22

Household Diets of Social Classes
TABLE 14Food Expenditure and Social Class Distribution of Households, 1956
ASocial Class
excludingO.A.P.
D
Allhouse
holdsAi A2 All B c with without
earners
CD*)
O.A.P.
Gross weekly
earners
(Di)
income ofhead of household 1955 £24 or £>5- £i5 or £9- £6- Under £6
more £24 more £'5 £91956 £27 or £16- £16 or £10- £6 ios. Under £6 ios.
more £27 more £16 -£ioNo. of households (a)
(b)
272
276
940969
1,212 3,402 2,8433,i85
1,164
587V 303 693 9,617
1,245
(c) 4 29 33 202 342 577No. of persons (a)
(b)973988
3,2253,323
12,181 9,67510,783
3,452
} 5371,020 31,0634,3" 12,867 i,545
Percentage of(c) 15 98 113 686 1,108 1,907
households 1955 2-5 7'5 IO-I 37-1 27-4 13-6 3-9 7.9 IOO-O
1956(8) 2-8 9-8 12-6 35'4 29-6 I2-I}
7'2 100-0
Average size of house(b) 2-9 IO-I 12-9 37'5 33'' 6-1 /
hold 1955 3'57 3' 52 3'53 3'54 3'39 3-oo 1-72 1-49 3-191956(8)(b)
3-583-58
3'433-43 3-46
3-583-57
3-403'39
2-972-63 }.-„ i'47 3-23
Average no. of adults(c) (3-75) 3-38 3-42 3-40 3-24 3-31
(a) ! 2-24 2-18 2-20 2-16 2-21 2-22I -46 2-12
(b) 2-24 2-20 2-21 2-19 2-25 I -80'
Average no. of children(c) (2-50) 2-79 2-76 2'75 2-59 2-66
under 15 (a)(b)
i -06
1-051-03 1-03
I -021-18 o-93
0-870-480-55\o-i7 O'OI 0-89I -01 1-14
Percentage of adult(c) (o-75) 0-41 o-45 0-51 o-34 0-40
males under 65 innon-sedentary occupations (a)
(b)
16 38 33 60 74 51 DO16 38 34 60 72 24
Food expenditure per(c) (100) 58 59 66 60 62
week:i. d. s d s. d. s. d. s. d. j. d. s d s. d. s. d
per person (a)(b)
34 2
33 ii29 7
29 630 8
30 7
27 4
27 4
26 526 5
26 2
24 ii j.2710 24 9 27 3(c) (22 3) 28 7 28 o 28 o 26 9 27 3
per household (a)(b)
122 I121 6
101 5101 4
106 I
105 10
98 o
97 889 10
89 677 8
65 8 j-493 36 b 88 2
Percentage change in(c) (83 5) 96 S 95 10 95 2 86 9 89 n
expenditure (a) com
pared with 1955 :
per person + 5-8+ 5'6 + 5-4 + 5-4 + 6-8 + 4-1 + 9-4 + 10-9 + 6-3perhousehold . . |+ 6-o|+ 3-0 + 3-5 + 6-6 + 7-1 + 3-o + 12-6 + 9'3 + 7'5
(a) Based on income of head of household with new points of subdivision.(b) Based on income of head where this was £6 IDS. per week or more, or where there wa*no earner; otherwise on income of chief earner.(c) Transferred households in which income of head was less than £6 ios. per week andincome of chief earner £6 ios. or more.

24 Domestic Food Consumption and Expenditure, 1956
demographic information. The new percentage distribution of households wasAi, 2-9; Aa, 10-1; B, 37-5; C, 33'i; D, 16-5.49. Table 4 shows that the 577 transferred households, in which there was a chidearner other than the head, were of larger family size and greater food expenditureper head than the 587 households left in Class Di. Of the reallocated households,4 were assigned to Class Ai, 29 to Az, 202 to B and 342 to C. The Di householdspromoted to Classes B and C had relatively high food expenditure, no doubtbecause they contained comparatively few children, but for the 33 families promotedto Class A the difference in expenditure went the other way; these householdstended to resemble those in Class B, although they included an earner with a ClassA income—probably because that earner was in most cases a manual worker. Onthe whole, however, it appears that in most respects the promoted households werecloser to the groups with which the new rule associates them than to the remainderof Class Di. Their inclusion in Classes A, B and C had an almost negligible effecton the average food expenditure for those classes, and gave much sharper discrimination between Classes C and Di. The revised classification has thereforebeen adopted in the tables and text of the present Report, but analyses on the oldbasis (though with the revised income limits) are available for the four quarters of1956, and have been used for comparison with the previous year. Experimentalwork on an alternative definition of social class based on occupation is reported inChapter V.
Expenditure and Consumption50. Table 14 gives the average domestic food expenditure per head and per household for each social class, with some demographic information. The average numberof adults per household was almost the same (2 •2) in Classes A, B and C, butthe number of children was greatest (i •i) in Class B, as in 1954-5. The proportionof adult men under 65 who were engaged in non-sedentary occupations ranged from16 per cent in Class Ai to 72 per cent in Class C on the new basis of classification,compared with 16 to 74 per cent on the old; comparative figures for 1955 were 14and 76 per cent. The proportion of non-sedentary adult males whose work wasclassified as active or very active was again highest in Class A.
51. All classes spent more per head on food than in 1955, the increase being 5 to 7per cent in Classes A, B and C, 4 per cent in Class Di as hitherto denned, 9 percent hi Class D2 and n per cent in old age pensioner households, who thus regainedmost of the ground they had lost during the previous year. The increase in pensionsin April 1955 seems to have had a delayed effect. Expenditure per head in pensioners' households was almost as high as in the reduced Class Di. In terms ofexpenditure per household, the rise was 3 to 7 per cent in the five earning classes,
12^ per cent in Class Dz and 9 per cent in old age pensioner households.
52. To determine whether class differences in food expenditure had really widenedsince 1952, when account is taken of the rise in money incomes, an alternative formof analysis was applied to eleven of the more common types of household (thoselisted in Table 16 below) which included some 69 per cent of all households, 60per cent of all persons and about 63 per cent of the total expenditure recorded byall the households in the sample. The households of each type in each year wereranged in order of declared family income, and the median and upper and lowerquart lies were determined for each year. The four income groups thus determinedfor each household type were then combined for all the eleven types each year.**In 1952 and 1953 " children " became "adolescents" on their fourteenth birthday; subsequently, on their fifteenth. The change in definition has little effect on the analysis.

Household Diets of Social Classes 25
Over the five years considered the demographic composition of each of the fourequal groups thus defined varied only slightly. The proportion of earners washighest in the highest income group.
53. In Table 15 the average domestic food expenditure and declared family incomeper head in each of the four income groups defined above is expressed as a percentage of the average expenditure and family income for all households of theselected types who stated their total income, and also as a percentage of the corresponding averages in the year 1952.
TABLE 15
Average Domestic Food Expenditure and Declared Family Income per head 1952-56,by Income Groups
(Group 7, above upper income quartiles; II upper income quartiles to medians;III medians to lower income quartiles; IV below lower income quartiles)
Domestic food Expenditure per head Declared family income per head
Income Group / // /// IV I -IV / // /// IV I-IVYear Averagehouseholdsize
(selectedtypes)
1952 2-77
(as percentage of values for all households ofselected types in each year)
114 103 96 87 IOO 153 103 82 62 IOO
( = 2is. 6d.) ( = 598.)
'953 2'73J954 2'75'955 '2-731956 2-78
112 104
104104
i°3
97
9687
878688
IOO 150
153
152
153
104
104
104
84
83
83
83
62
6060
60
IOOIOOIOOIOO
112 IOO
IOO100
"3 97
97112
(As percentage of corresponding values in 1952)
104
'952'953
'954'955
1956
IOO IOO IOO
112
IOO IOO IOO IOO112
119
129
IOO IOO IOO108 III
116
126
in no"5
108
117
127
112 no no115 118
125 128114
124
116
126"5124 125
118
129
131 '33 '35 134 133 '45 .46 146 142 M5
54. Table 15 confirms the finding that, when allowance is made for the fall in thevalue of money, there has been virtually no widening since 1952 of differences infood expenditure which can be attributed to differences in family income. Thisconclusion is not invalidated by the known propensity of informants to understatefamily incomes, since the definition of the income groups depends only on the ranking of incomes in each year, not on their absolute magnitude. All four income groupsincreased their expenditure by between 31 and 34 per cent between 1952 and 1956,in marked contrast to the very different percentage increases recorded for households of different composition. These disparities were even more marked in 1956than in 1955, as is shown by Table 29 paragraph 95, Chapter VI. Table 15 alsoindicates that, for the groups shown in the table, while family incomes per personrose by about 13 per cent between 1955 and 1956, the increase in food expenditurewas about 6 per cent.
55. The regression coefficient of the logarithm of mean food expenditure perperson on the logarithm ofmean family income per head for a sample of households

26 Domestic Food Consumption and Expenditure, 1956
of given composition is an estimate of the income elasticity of total domestic foodexpenditure. The combined estimate for the eleven selected types was 0-28 in1956, compared with 0-30, 0-29, 0-28 and 0-30 for the years 1952-55 respectively.The values obtained for the different household types varied considerably, butbecome more consistent if the average expenditures of the income groups are firstadjusted for the effects of outside meals and visitors. This adjustment was largestfor younger childless couples, for whom income differences in the incidence ofmeals taken outside the home were very marked. These younger couples with highincomes tend to eat out more often: for women living alone, however, the adjustment is in the opposite sense, since in their case those with high incomes are able toreceive more visitors.
TABLE 16
Estimated Income Elasticity of Domestic Food Expenditure
1956 estimatesType of Household Average adjusted for
1956 I952-S6 effects of meals
One man, one woman and:
out and visitors
No other (both under 55) 0-13 0-14 0-27No other (one or both 55 or over) 0-36 o-34 0-36i child 0-24 0-26 0-312 children ..... 0-24 0-28 0-313 children ..... o-34 o-33 0-39i adolescent 0-20 0-26 0-28i child and i adolescent . 0-22 0-27 0-26One woman only .... 0-31 0-30 0-28Two women ..... 0-32 0-30 0-35One man, two women 0-24 0-31 0-27Two men, one woman 0-30 o-34 o-37
All above households (weighted average) . 0-28 0-29 0-32
56. The values of the income elasticities of total domestic food expenditure ofeach household type in 1956 are shown in Table 16 with corresponding averages forthe quinquennium 1952-56. Estimates obtained after adjusting for the effects ofmeals out and visitors on domestic food expenditure are also given. For nearly everyselected household type the income elasticities are thereby increased, the estimatefor all households rising by 0-04 to 0-32.
57. In view of the fairly consistent differences found between the elasticities shownby the selected household types, a study was undertaken on 1956 data of additionalhousehold types, and a closer analysis of the n types was also carried out, involvingmuch stricter definitions of household composition. This more detailed treatment ofthe ii selected types, which accounted for 63 per cent of the total domestic foodexpenditure of all the households in the sample, involved their sub-division into26 more closely defined types, and these yielded a similar estimate (o •273 against0-278). A further 46 types, mostly larger households (average size 3-9), accountedfor an additional 16 per cent of households, 19 per cent of persons and 18 per centof the total food expenditure, and these yielded an estimated income elasticity of0-310. The difference between these values was not statistically significant, and the

Household Diets of Social Classes 27
combined estimate, which relates to households recording over 80 per cent of totalexpenditure was o •280, almost exactly the same as that obtained from the originalii types.58. The results quoted for income elasticities in 1956 and previous years do nottherefore appear to be seriously biased by the choice of household types, which forpractical reasons must be limited to those occurring most frequently. However,understatement of family incomes is known to be relatively greater among households with higher incomes, so that all absolute values of income elasticity derivedfrom declared incomes are probably a little on the high side.
59. The average food expenditure and value of food obtained for domestic consumption by households of different social class are shown for each quarter of theyear in Table 17. Expenditure was highest in the second quarter in all classesexcept Ai and Dz, for which the peak was delayed until the third. As in previousyears the value of free food was greatest in Class Ai and slightly but consistentlyless in Class B than in Class C, which included most of the agricultural workers'households. The lowest average occurred in Class Di, but on the old classificationthe minimum would have been in old age pensioner households as before. Alldasses recorded lower averages than in 1954 and 1955, partly because of the unfavourable summer and partly, no doubt, because of a growing disinclination tocultivate allotments. The value of free supplies was highest in the third quarterexcept for Class Ai households, whose average tends to remain relatively highduring winter months because of their access to free milk and cream, eggs andpoultry.
60. Class differences in food prices were similar to those found in 1955, rangingfrom 8 per cent above the national average in Class Ai to 5 per cent below in oldage pensioner households. This price index is of the Laspeyres type; the nationalaverage purchases per head of each food have been costed for each class at theaverage prices paid by that class, and the resulting total has been expressed as a
percentage of the average domestic food expenditure per head for the whole sample;but a Paasche index, weighted according to the pattern of purchases in each class,gives closely similar results. The largest price differences between classes werefound for coffee, ranging from 72 per cent above the national average in Class Aito 22 per cent below in old age pensioner households; fish, +20 per cent in ClassAi to —13 per cent in the O.A.P. group; carcase meat, +12 to —12; bacon, +8to —9, and other meat and meat products, +12 to —7; fresh green vegetables, +12to —8, other vegetables (excluding potatoes), +17 to — 10; cakes and biscuits,•f ii to —7. For liquid milk, butter, margarine, bread and flour the range of classdifferences in price was 5 per cent or less, and for natural cheese, sugar and teabetween 5 and 10 per cent.
61. A "price of energy" index, calculated by dividing the value of consumptionby the energy value of the diet, varied from 30 per cent above the national averagein Class Ai to 8 per cent below in old age pensioner households; the correspondingrange in 1955 was from +28 to —8 per cent. The cost per calorie in Class D2 was
4 per cent above the national average and greater than in Class B.
62. Details of class differences in domestic food expenditure and consumption aregiven in Tables 18 and 19, which may be compared with Tables 17 and 18 in theAnnual Report for 1955. For nearly all the main foods, class differences in expenditure and consumption conformed to one of the following patterns:-

28 Domestic Food Consumption and Expenditure, 1956
TABLE 17
Food Expenditure and Value of Consumption by Social Class, 1956(per head per week)
A
Social Class
ExcludingO.A.P.
D
Allhouseholds
Ai A2 ,4/7 B C
tuithearners
(Di)
withoutearners
(Da)
O.A.P.
ist QuarterExpenditureValue of free food
s. d. S. d. s. d. s. d. j. d. s. d. j. d. s. d. s. d.
3i 6 28 4 29 ii i
26 6
5
25 ii624 10
4
28 o 24 43
26 562 3 9 4
Value of consumption . 33 8 29 J 30 a 26 xo 26 5 25 2 2S 5 24 7 26 ii2nd QuarterExpenditureValue of free food
34 8 30 6
I o31 6i i
28 9
5
27 i6
26 I 26 55
25 5 28 46i 4 3 4
Value of consumption . 36 I 31 6 32 7 29 2 »7 7 26 4 26 9 «5 9 25 10
3rd QuarterExpenditureValue of free food
36 2 30 o 3i 6 26 II 25 iii 3
24 3 3° ii 4
24 8 27 I2 3 2 8 2 7 i 3 I O I 0 i 5
Value of consumption . 38 4 32 8 34 -r 28 2 27 2 *5 3 3i 5 *5 7 28 6
4th QuarterExpenditureValue of free food
33 6 29 4 30 2 27 2 26 10
9
24 8
3
26 9 24 9 27 492 8 * 4 I 6 8 8 4
Value of consumption . 36 i 30 8 3* 7 27 10 27 7 24 ii 27 5 25 i 38 IYearly AverageExpenditureValue of free food
33 ii 29 6i 5
3° 7i 7
27 48
26 5
924 ii5
27 10
824 9
627 3
2 2 10
Value of consumption . 36 I 31 o 32 / 28 o 27 2 *5 5 28 6 ^5 3 28 I
Price index (all foods)'Price of energy' index(all foods) .
108-4
129-5
103-7
in-5
104-9
115-6
100 -I 98-6
96-2
97. 2 98-4
101 -5
95-0
92-2
100-0
100-099-7 93-5
Maximum in Class AT., minimum in old age pensioner households:
cream, processed and packeted cheese; other meat, eggs; fresh green vegetables
(expenditure), other vegetables (consumption), fresh and other fruit; breakfastcereals.
Maximum in Class Ai or Dz, minimum in Class B, C or (most commonly) Di :liquid milk, natural cheese; carcase meat, bacon (expenditure), fresh and processed

Household Diets of Social Classes 29
TABLE 18
Domestic Food Expenditure by Social Class, 1956(pence per head per week)
A
Social Class
ExcludingO.A.P.
D
Allhouse
holds
Ai Aa All B C
withearners
CD*)
withoutearners
O.A.P.
MILK AND CREAM:Liquid, retail .Liquid, welfare
(D2)
35-121-24
31-111-18
32-041-19
27-961-30
27-09 29-020-59
36-380-24
34-91 28-651-09I -01 O-O2
Att Liquid Milk 36-36 32-29 33-13 29-26 28-10 29'6jT 36-62 34-93 29-74
CondensedDried and otherCream • •
0-980-503-54
1-270-571-56
I -21 i-340-560-80
1-320-410-66
I -08 1-150-08
i •ri
0-141-300-470-89
o-55 0-230-492-02 1-17 O-20
Total Milk and Cream 4I-3S 35-69 37-01 31-96 30-49 31-41 39-02 36-3* 32-40
CHEESE:Natural .Processed and
packeted
6-76
1-76
6-40
1-44
6-47
1-50
5-54
1-40
5-80
1-39
4-82
1-24
6-54
1-19
6-43 5-78
1-38I-OI
Total Cheese 8-5» 7-84 7-97 6-94 7 -19 6-06 7-73 7-44 7-16
MEAT:Carcase .
Bacon and ham,uncookedOther meat (a)
65-54 53-33 56-13 46-76 46-69 44-45 49-16 45-30 47-95
16-3134-84
I5-5829-90
15-7531-06
15-27 14-7028-34
13-2226-00
13-6324-06
14-8319-19
15-0028-1128-00
Total Meat 116 . 69 98-81 102-94 90-03 89-73 83-67 86-85 79-32 97-06
FISH:Fresh and processed (b]Prepared (c)
16-074'35
9-804-85
11-244-74
7-385-4i
7-345-02
7-044-43
11-153'53
8-713-02
7-995-°3
Total Pish 20-42 14-65 15-98 X2-79 72-36 11-47 14-68 11-73 J3-02
EGGS 21-76 19-61 20 -U 18-34 16-93 16-37 17-85 14-67 17-88
FATS:ButterMargarineLard and compoundcooking fat .Other fats
17-885-08
14-925-44
15-595-36
12-91
6-0712-16
6-3111-146-26
15-46
5-7814-565-38
13-016-04
2-21I -SO
2-450.77
2-39 2-780-79
2-68 2-08
0-762-240-84
2-360-72
2-64o:791-02 0-69
Total Fats 26-97 23-58 24-36 22-55 21-84 20-24 24-32 23-02 23-48
(a) Includes cooked and canned meats, and meat products.(b) Includes smoked, dried and salted.(c) Includes cooked, canned and bottled fish, and fish products.

Domestic Food Consumption and Expenditure, 1956
TABLE 1 8 continued
(fence per head per week)
A
Social Class
ExcludingO.A.P.
D
Allhouse
holds
Ai A2 All B C
withearners
(£>/)
withoutearnersO.A.P.
SUGAR ANDPRESERVES
(D2)
SugarHoney, preserves,syrup and treacle .
10-06
5-27
9-27
4-33
9-46
4-54
9-26
4-01
9-43
3-64
9-33 9-80
5-i6
9-67
4-47
9-38
3-98
Total Sugar andPreserves
3'7°
VEGETABLES:Potatoes (includingchips and crisps) •
Fresh greenOther (d)
15-33 13-60 14-00 13-27 13-07 13-03 14-96 14-14 13-36
8-4010-3711-14
10-65
7-2511-38
10-13
7-9611-32
13-426-41ii -04
12-75 13-475-789-62
9-86 9-835-366-85
12-59
6-3110-58
5-7310-26
6-20
9-07
Total Vegetables 29-91 29-28 20-41 30-87 28-74 28-87 25-13 23-04 29-48FRUIT:Fresh (e)Other (f)
34-54I3-78
24-57"•35
26-9011-96
18-61
9-2315-58 13-96
5'7419-777-09
12-034-71
18-257-90 8-83
Total Fruit (e) . 48-32 35-9^ j*~-«6~ 27-84 23-48 19-70 26-86 16-74 27-08
CEREALS:Brown bread .
White bread .
Wholewheat andwholemeal bread .
Other bread (g)
i'549-41
1-26
12-231-32u-57
0-8415-25
0-7216-70
0-7717-16
1-81ii -16
1-28
I4-450-89
15-24
1-38
3-72
I -10 1-16
2-87o-73 0-70 0-88
2-302.042-65
1-322-41
0-832-62 2-OO 2-11 2-18
Total bread 16-05 17-21 16-92 18-82 20-23 21 -II /7-66 19-46 19-143-46Flour
Cakes (h)Biscuits .
Oatmeal and oat-productsBreakfast cerealsOther cereals . •
3-158-3210-04
3'54 3'449-639-98
3-46 3-38 3-10 4-399-439-66
4-338-16
7-61
9.99 10-28
9-2410-338-54
8-587-21
10-038-969-97
0-99 0-89 0-923-244'49
0-82
3-003-68
0-902-66
3-37
0-741-96
2-73
1-28
2-493-30
0-97i -602-74
0-873-565-24
3-154-28
2-81
3-61
Total Cereals . 47-35 49-03 48-62 49-30 49-41 45-43 48-21 44-87 48-88BEVERAGES:Tea ...Coffee .
CocoaBranded food drinks .
10-948-400-750-87
I3-I33-830-500-86
12-61
4-900-560-87
I3-302-170-61
0-72
14-071-99I4-751-870-390-83
16-10
3-57o-771-81
I7-442-240-491-32
13-732-480-58o-57
0-76 0-79
Total Beverages 20-96 18-32 18-94 16-80 17-39 17-84 22-25 21-49 17-58MISCELLANEOUS: . 9-76 8-18 8-57 7-43 6-52 5'37 5-85 5-64 7-09Total Expenditure 407-39
(33ln)354-45 366-75 328-20
(27/4)317-1 [290-45 333 -7 f 297-46 327-47
(27 13}
(29/6) (30/7) (26/5)1(24/17) (27/10) (24/9)
(d) Includes dried and canned vegetables, and vegetable products.(e) Includes tomatoes.(f) Includes dried, canned and bottled fruit.(g) Includes rolls, fruit bread and sandwiches.(h) Includes buns, scones, tea cakes, muffins and crumpets.

Household Diets of Social Classes
TABLE IQDomestic Food Consumption by Social Class, 1956(oz per head per week except where otherwise stated)
Social Class
A
ExcludingO.A.P.
D
AllAi A2 All B C
withearners
(Di)
withoutearners
O.A.P.
house
holds
MILK AND CREAM:Liquid, retail (pt.)Liquid, welfare andschool (pt.) .
(D2)
5-02
0-86
4-45 4-58
0-86
3-86
0-99
3-83 3-92
0-49
4-83
0-32
4-69 4-00
0-830-86 0-77 O.O2
All Liquid Milk (pt.).Condensed (pt. or eq.pt.) .
Dried and other (pt. oreq. pt.)Cream (pt.)
5-88 5-3i
0-15
0-15
5-44 4-85
0-16
0-12
4-60
0-16
4-4i
0-13
5-15
0-14
4-71
0-13
0-02
4-83
0-16O-IO 0-14
,':'.;/ Milk and Cream(pt. or eq. pt.)
0-040-05 0-O2
0-130-03 o-oi
0-12O-OI
0-08o-oi
0-03o-oi
O-IIO-OI
CHEESE:
Natural .
Processed andpacketed
6-07 5-63 5-74 5-14 4-89 4-63 5-33 4-86 5-ii
2-67
0-51
2-64
0-42
2-64
o-43
2-36 2-48
0-41
2-09
o-35
2-84
0-36
2-74
0-29
*-45
0-400-40
Total Cheese 3-iS 3-06 3-07 2-76 2-89 2-44 3-20 3-03 2-85
MEAT:
Carcase .
Bacon and ham,uncookedOther meat (a)
23-33 20-17
5-28
20-88 18-47 18-86 18-63 20-15 20-46 19-06
5-u11-76
5-2411-45
5-i811-05
5-00 4-6610-85
4-7710-29
5-49 5-11"'34 11-55 8-44 i i
• ilS
Total Meat 40-20 36-79 37-57 34-70 35-4I 34-14 35-ai 34-39 35-35
FISH:Fresh and
processed (b)Prepared (c) .
7-071-05
4'931-38
5-421-31
4-251-71
4-291-64
4-541-56
6-451-17
5-641-19
4-531-60
Total Pish 8-12 6-31 6-73 5-96 5-93 6-10 7-6a 6-83 6-13
EGGS . . No. 5-45 5-°4 5-13 4-40 4-15 3-88 4-19 3'5° 4-35
FATS:ButterMargarineLard and compoundcooking fat .
Other fats
6-493'7°
5'393'96
5-643-89
4-644'47
4-42 4-004-80
5-614-14
5-223-96
4-704-484'74
1-630-66
1-850-51
i -800'55
2-20O-62
2-130-55
1-700-62
1-82
0-672-05 2-08
0-580-56
Total Fats 12-48 11-71 11-88 u-93 11-84 II -12 12-24 11-79 11-84(a) Includes cooked and canned meats, and meat products.(b) Includes smoked, dried and salted.(c) Includes cooked, canned and bottled fish, and fish products.

Domestic Food Consumption and Expenditure, 1956
TABLE 19 continued
(pz per head per week except where otherwise stated}
A
Social Class
ExcludingO-A.P.
D
AllhouseAi At All B C
with without O-A.P.hold!
earners earners
SUGAR AND
(Dx) (f>2)
PRESERVES:Sugar 18-41 17-61 17-81 17-79 18-17 18-02 18-53 18-67 18-00Honey, preserves,syrup and treacle . 4-62 4-00 4-M 3-75 3-38 3'3° 4-92 4-35 3-69Total Sugar andPreserves 23-03 21 -6l 21-95 ai-54 "•55 2J-J2 '3-45 23-02 21-69
VEGETABLES:Potatoes (includingchips and crisps) . 39 '51 50-11 47-60 60-79 60-87 6 1 -04 48-41 46-46 58-43Fresh green 18-69 15-15 15-97 14-28 14-05 12-52 15-26 13-82 14-34Other (d) 17-22 17-14 17-14 17-21 16-83 15-68 17-16 13-18 16-89
Total Vegetables 75-4^ 82-40 80-71 02-28 91-75 89-24 80-83 73-46 89-66
FRDIT:Fresh (e) 38-5I 27-79 30-26 20-92 I7-39 I5-05 24-91 14-85 20-56Other (f) 9-58 8-u 8-46 6-88 5-90 4-23 4-73 3-63 6-51
Total Fruit (e) . 4$-op 35-9° 35-73 27-80 23-29 19-28 29-64 18-48 37-07
CEREALS:Brown bread . 4'3° 3'45 3-63 2-23 1-90 1-96 4-88 3-43 2-38White bread . 27-40 35-59 33-67 44-20 48-82 49-62 32-41 41-48 44-36Wholewheat andwholemeal bread . 2-61 2-12 2-22 t-4* 1-36 I-78 4-02 2-54 i -60Other bread (g) 4-28 3-1? 3-44 2-46 2-67 2-95 3-49 3-62 2-74
Total Bread 38-59 44-33 42-06 50 -3i 54-75 56-3I 44-80 5*'°7 51-08
Flour 7-11 8-08 7-84 7-88 7-76 6-96 10-20 9.70 7-89Cakes (h) 4-16 5-27 5-02 5-78 5-97 5-07 5-41 5-02 5-67Biscuits . 5-52 5-62 5-60 5-4i 5-M 4-50 6-12 5-01 5-30Oatmeal and oatproducts 1-24 1-14 1-16 1-02 1-16 0-98 1-62 1-28 i-nBreakfast cereals 2-12 2-02 2-04 1-92 1-74 1-29 1-64 i -09 r-8iOther cereals . 3-92 3-29 3-45 3-00 2-86 2-53 3-04 2-59 2-97
Total Cereals . 62-66 69-75 68-07 75-33 79 -38 77-64 72-83 75-76 75 -83

Household Diets of Social Classes 33
TABLE 19 continued
(pz per head per week except where otherwise stated)
A
Social Class
ExcludingO.A.P.
D
AllAi A2 All B C house
holdswithearners
(Z)x)
withoutearners
O.A.P.
BEVERAGES:Tea ...CoffeeCocoaBranded food drinks .
(D2)
2-171-140-28
2-630-520-18
2-520-67
2-77o-34
3-02o-33
3-220-310-15
3-360-440-240-46
3-72o-430-16
0-34
2-88
0-380-21O-22
0-22 O-2OO-2O
0-21
O-2OO-22 0-22 0-18 0-21
Total Beverages 3-81 3-55 3-62 3-5' 3-75 3-89] 4-5° 4-65 3-67
(d) Includes dried and canned vegetables, and vegetable products.
(e) Includes tomatoes.
(f) Includes dried, canned and bottled fruit.
(g) Includes rolls, fruit bread and sandwiches.
(h) Includes buns, scones, tea cakes, muffins and crumpets.
fish; butter; sugar (expenditure), preserves; fresh green vegetables (consumption);flour, biscuits, oatmeal; coffee, cocoa, branded food drinks; miscellaneous foods(expenditure).
Maximum in Class B, C or Di, minimum in Class Ai or old age pensioner households:prepared fish, margarine, lard and compound cooking fats (consumption); potatoes;bread, cakes.
Maximum in old age pensioner households, minimum in Class AT or Az:sugar (consumption); tea.
63. As in 1955, tea was the only commodity to show a regular upward gradient inconsumption and expenditure from the highest income group to the lowest. Processed and packeted cheese had an almost equally regular downward gradient, butmost foods exhibited either a mq-ximiim or a minimum at an intermediate point onthe income scale, because class differences, though defined in terms of income, alsoinvolve differences in household composition; in particular there were relativelyfew children in Class D but more elderly adults. For most foods, the pattern of classdifferences in consumption followed those in expenditure, and the exceptions arereadily explained. Thus, although Class Ai had the highest expenditure on uncookedbacon and ham, consumption was greatest in the old age pensioner households,who bought cheaper cuts. The discrepancies for biscuits and sugar can be explainedsimilarly.

34 Domestic Food Consumption and Expenditure, 1956
64. Consumption of liquid milk was as usual greatest in Class Ai households,many of which benefited by welfare and school milk and some by free supplies, butexpenditure was higher in Class D2 and not much lower in old age pensioner households, which did not enjoy these benefits. Expenditure on liquid milk was lowest inClass C, but consumption was smallest in Class Di, which contained fewer childrenentitled to benefit, though full-price retail purchases were slightly greater in ClassDi than in Classes B and C.
65. Of the three sections of Class D, the old age pensioner households and Class Dzboth tended to improve their position. In some respects, such as their large purchases of tea, flour and branded food drinks, these two groups are similar, but ClassDa is characterized by several well-established middle-class features, such as aliking for fresh fruit and coffee. Their strong preference for butter rather thanmargarine and their small consumption of potatoes are shared by Class A and by oldage pensioner households. The diet in Class Di households, after the removal to a
TABLE 20
Energy Value and Nutrient Content of Diets of Households ofDifferent Social Class, 1956(per head per day)
A
Social Clau
D All
Ai Ai All B C Excluding^.A. P.O.A.P.
household,
vrith withoutearners earners
Energy value
(Oil (DO
(Cal.) 3,603 a,59* ".397 2,624 2,642 2,337 2,626 2,562 2,624Total piotein (g.) 78 76 76 73 76 73 75 73 76Animal protein (g.) 30 46 47 42 42 40 44 41 43Fat (g.) . 118 112 "3 IOS 107 101 III 105 108Carbohydrate (g.) 308 322 319 337 343 334 33» 331 337Calcium (mg.) . 1,104 1,068 1,078 1,032 1,022 966 1,048 997 1,029Iron (mg.) 13-9 '3-4 I3'5 I3'3 I3'4 12-6 13-1 12-2 13 3Vitamin A (i.u.) 5,088 4.714 4,804 4,366 4,196 3,950 4.271 3,714 4,310Vitamin Bi (mg.) 1-23 I -22 1-22 i •li 1-21 1-16 I *2O I-I3 I-flRiboflavin (mg.) 1-82 1-74 i-73 1-65 1-62 1-55 1-68 1-57 1-65Nil-mime acid(mg.) . 13-9 13'I 13-3 13-0 IJ-0 12-7 13-2 n-6 13-0Vitamin C (mg.) 64 3* 58 51 47 43 48 39 50Vitamin D (i.u.) >34 156 133 152 130 138 '43 124 150
higher income grade of households with a chief earner in that grade, was lessattractive than that in any other class. They had the smallest consumption ofmilk,natural cheese, bacon, eggs, butter and fresh green vegetables, but the largest ofbread, potatoes and margarine.
Energy Value and Nutrient Content
66. Table 20 shows the energy and nutritive value of household diets according toclass. For all nutrients except carbohydrate and vegetable protein there were downward gradients, somewhat irregular, from Class Ai to Class Di; within Classes Aand D, the sub-groups differed markedly, Classes Ai and D2 obtaining in mostrespects the more abundant diet. In spite of these downward gradients, the simi

Household Diets of Social Classes 35
larity in the nutrient composition of the diets of households in Classes A2, B, C andDJ was striking, their consumption of all nutrients except animal protein and vitamins A and C being within 6 per cent of the national average; for Classes B and Cthe nutritional pattern of the diet was almost identical with the national average.These two groups contained 71 per cent of all households and 76 per cent of allpersons in the sample. The greatest class variation was found for vitamin C, theconsumption of which was 28 per cent above the average for all households inClass Ai and 22 per cent below in old age pensioner households. In other respects,too, these two sub-groups, and also Class Di, differed markedly from the rest.In Class Ai the values were much higher than the national average; in addition totheir high vitamin C consumption these households obtained between q per centand 18 per cent more animal protein, fat, vitamin A and riboflavin than the nationalaverage. Within Class D, the nutritive value of the diet of Class D2 exceeded thatof the other two sub-groups for energy value and all nutrients except carbohydrate.
67. Thus the data in Table 20 tend to divide themselves into three levels, withClass Ai at one end of the scale, Classes A2, B, C and D2 intermediate and Class Diand old age pensioner households at the other end. It is interesting to note thatClasses Ai and D2 differ from the remainder of Class A and Class D in the samenutrients, namely animal protein, fat, vitamin A, riboflavin, nicotinic acid and vitamin C, and for the same reasons—mainly because of their relatively high consumption of milk, cheese, carcase meat, fish, butter, fruit and vegetables and theirrelatively low consumption of bread.
68. In comparison with similar data for 1955 the household diet in Class Ai showeda fall of between 2 and 8 per cent in the estimates for most vitamins and up to 4 percent in energy value, protein, calcium and iron; the only nutrient to reach the 1955level was vitamin C. Classes A2, B and C either maintained the 1955 level or showedslight increases in animal protein, fat and vitamins A and D; Class C also slightlyincreased its intake of riboflavin. For energy value and other nutrients these classesshowed decreases of up to 4 per cent. Because of the change in the definition of ClassDi in 1956 it is not possible to make a comparison between the years. Old age pensioner households, however, either maintained or increased their dietary levels forenergy value and all nutrients (the greatest increases were 5 and 6 per cent foranimal protein and fat respectively) ; Class D2 likewise increased their dietary levelsfor energy value and all nutrients, the greatest increase being 8 per cent for vitaminA. Thus the differences between Classes Ai and A2 and between old age pensionerhouseholds and the rest of Class D were less in 1956 than in 1955.
69. Decreased consumption of bread and other cereals was common to all classes;in addition consumption of flour and potatoes fell in all the earning classes. Theeffect of the lower consumption of bread in old age pensioner households waswholly or partly counterbalanced by increased consumption of most other mainfoods, including all meats, fish, eggs, fats, fresh fruit and vegetables. Similar trends,namely an increase in milk, all meats (excluding bacon), cheese, eggs, fats, freshfruit and vegetables occurred in Class D2. No other class showed a similar rise in somany foods. Thus, compared with 1955, the overall picture is that the trend wasdownward in Class Ai, hi which consumption fell for most foods of animal originother than carcase meat, butter and eggs, and upward in old age pensioner households and Class D2: in other classes the effect of the fall in the contribution fromcereals and potatoes was not offset so fully by the increase in the consumption ofmany other foods, especially those of animal origin.

36 Domestic Food Consumption and Expenditure, 1956
TABLE 21
Energy value and Nutrient Content of Diets of Households of Different Social Class
expressed as a Percentage of Allowances based on the British MedicalAssociation's Recommendations
(per cent)
A
Social Class
Excluding
O
AllAi A3 All B C O.A.P. house
O.A.P. holdswith withoutearners earners
(Dz) (D2)
Energy value no 107 108 106 i°3 102 112 in i°5Total protein 109 105 105 101 99 98 112 114 102
Calcium "5 112 "3 106 106 IOO "3 112 107Iron . 114 III in no 108 99 IOO 92 108
Vitamin A . 219 204 207 190 175 161 160 135 182
Vitamin B, . 131 127 128 123 118 117 130 "5 122
Riboflavin 126 118 120 no 104 103 117 112 109Kicotinic acid 149 136 139 132 127 128 142 137 132Vitamin C . 294 258 267 235 214 197 214 I78 226
70. Table 21 shows the comparison between dietary intake and nutritional allowances based on those recommended by the British Medical Association. The onlynutrients for which percentages of less than 100 were found were protein in ClassesC and Di (99 and 98 respectively) and iron in old age pensioner households (92).Downward gradients occurred from Class Ai to Class Di. Most of the percentagesin Class Da and old age pensioner households were higher than in Class Di; forenergy value and protein and the B vitamins, the allowances for which are associated with energy value, the percentages for these two groups of elderly adultsexceeded those for Classes B and C and in some instances even those for Class A.The resemblance between the calcium percentages in Classes A and D2 and the oldage pensioner households arose partly on account of the relatively high milkconsumption in Classes A and D2 and also because of the relatively low calciumrequirements of the two non-earning classes.
71. Compared with the previous year the changes in the percentages in Table21 are similar to those described for the nutritive value of the diet. In Class Ai thepercentages for energy value and all nutrients except vitamin C fell; in Classes A2,B and C changes were smaller, but also generally downward for calcium, iron andall vitamins except A. There were no downward changes for the old age pensionerhouseholds and almost none for Class Da. Low percentages for iron in these twogroups have been a constant feature of their diets but both were greater in 1956than in 1955; for Class D2 the increase was from 96 to 100 per cent and for old agepensioner households from 90 to 92 per cent. All but these two groups shared thedecreases in the percentages for iron and vitamin Bl and all but these two and ClassAi those for vitamin C; only the old age pensioner group escaped the general fallin the percentages of protein. All classes except Ai showed increases for Vitamin A.

Household Diets of Social Classes 37
72. The proportions of the total energy value derived from protein, fat and carbohydrate in 1952, 1955 and 1956 are shown in Table 22. In 1956, compared with1955, there was a tendency for the contributions from carbohydrate and proteinto decrease and for that from fat to rise in all types of household except Class Ai;the latter showed an increase for carbohydrate and decreases for both protein andfat—a reflection of the general downward trend in the consumption ofmany foodsof animal origin (see para. 69). Nevertheless the changes were slight and Class Ai
TABLE 22
Percentage of Energy Value derived from Protein,Fat and Carbohydrate, 1952, 1955 and 1956
(per cent)
A
Social Class
DA 11
Ai Aa All B C ExcludingAllhouse
O.A.P./-\ A n
holds
with without(J.A.r.
earners earners
FROTBIN
(Dzy (Dz)
1952 - n.a. n.a. 12-9 12-6 12-6 12-7 12-5 12-6
'955 • 12-2 lt-7 u-8 11-7 "•5 11-7 n-6 "•5 n-61956 . H-9 11-7 n-8 11-5 "'5 "•5 u-4 11-4 ii-5
FAT
1952 • n.a. n.a. 36-7 34-6 33-8 34-i 34-6 34-5'955 • 40-8 38-0 38-7 36-9 36-0 36-1 36-9 36-0 36-61956 . 40-7 38-7 39-1 37-1 36-6 35'9 38-0 37-o 37-i
CARBOHYDRATE1952 . n.a. n.a. 50-4 52-8 53-6 53'2 52-9 52-9'955 • 47-0 5°-3 49-5 51-5 52-4 52-1 51-5 52-5 5i-71956 . 47'4 49-6 49-1 51-4 52-0 52-6 50-6 51-6 5i-4
Animal protein as aPerci ntoge oj 'Total Protein derived from Ai timal Soitrees
percentage of totalprotein
1952 • n.a. n.a. 55-0 49-4 47-2 48-3 48-3 48-6'955- 62-5 57'5 58-8 54'9 52-8 53-4 56-6 54-8 54-5
1956. 64-4 60-2 61-1 56-3 55-4 54-2 58-0 56-9 56-3
Percentage of calories from animalprotein
1952. n.a. n.a. 7-1 6-2 6-0 6-1 6-0 6-2
'955 • 7'7 6-7 6-9 6-4 6-1 6-3 6-5 6-2 6-31956. 7'7 7-1 7-2 6-5 6-3 6-2 6-6 6-5 6-5
'Data for Class Di in 19.55 and 1956 are not strictly comparable.

38 Domestic Food Consumption and Expenditure, 1956
maintained its position as the class deriving the greatest proportion of the energyvalue of the diet from protein and fat. All classes showed decreases in the proportionsfrom protein and carbohydrate and increases in those from fat between 1952 and
1956. From Class Ai to Class Di the most noteworthy gradient was a replacementof fat by carbohydrate as a source of energy. The percentage from protein, althoughhighest in Class Ai, was similar in all classes. The pattern of the diet of old agepensioner and Class D2 households was, by the criterion of this analysis, closer tothat of Class B than to that of Class Di.
73. Table 22 also shows that the proportions of total protein derived from animalsources and of energy value derived from animal protein rose between 1952 and1956, increases caused mainly by the changes in the consumption of bread, Sour,potatoes and meat. In 1956 the proportion of the total protein from animal sourceswas greater in Class D2 and old age pensioner households than in Class B and thatin Class Ai, despite the generally decreased nutritive value of its household diet,continued to increase, to over 64 per cent.

Household Diets of Occupational Groups based on
the Registrars- General's Classification
74. The definition of social class used elsewhere in this report is based on theincome of the head of the household (or, in certain cases, on that of the chief earner),but for many purposes it is of advantage to adopt the alternative definition, based onoccupation, which is used by the Registrars- General, who define five broad socialclasses principally in terms of occupational skill or status. This classification has nothitherto been employed in the analysis of National Food Survey data, since theprerequisite information on occupational skill was not obtained from informantsbefore July 1956. The present study, restricted therefore to the second half of 1956,considers these five broad social classes, but further distinguishes skilled miners inClass III, agricultural workers in Class IV, and non-manual workers in Classes IIIand IV as follows: —
Class I Professional and technical occupations
Class II Intermediate occupationsClass III Skilled occupations: —
(a) manual workers engaged in mining
(b) other manual workers
(c) non-manual workers
Class IV Partly skilled occupations: —
(a) agricultural workers
(b) other manual workers
(c) non-manual workers
Class V Unskilled occupations
There is also a heterogeneous residual group of households in which the head is notgainfully occupied, or in which his occupation was not described in terms whichcould be classified as above.
75. Table 23 shows for each of these groups, the number of households, the averagehousehold size, declared net family income per person (no doubt understated insome groups), and weekly expenditure on food in the second half of 1956. Becauseof seasonal variations, the tables in this chapter are not comparable with similartables in Chapters III, IV, VI, VII and VIII.76. The classification of households according to the occupational skill of the headproduces a markedly different social class distribution from that obtained byclassifying according to his income. The former classification allocates only 18 percent of the households in the sample to the two highest classes (compared with50 per cent placed in Classes A and B by the latter), and concentrates 46 per centof households in Class III. At the lower end of the scale, there is, in comparison
39
40 Domestic Food Consumption and Expenditure, 1956
with the 1951 census results, some apparent under-representation of households inwhich the head is in an unskilled occupation, but this most probably arises fromexaggeration of occupational status by informants.
TABLE 23
Domestic Food Expenditure of Occupational Groups, July-December, 1956
De Expen Valutclared diture Value ofnet on of con
No. of No. of family food fru sumpGroup per child No. of income per food tion
No. sons ren earners per person per perNo. of of per per per person per person personhouse per- house house house per week per perholds lons hold hold hold week week weeh
I Professional and technical£ t. d. t. d. s. d.
occupations '74 586 3-37 1-02 •37 «-74 S* i i 6 33 111 Intermediate occupations 657 -,-3- 3-40 0-92 •57 3-13 28 3 2 9 30 IIIII Skilled occupations:Mining, T^P""^ workers 95 366 3.85 I.3I •57 4-33 28 8 7 19 sOther manual workers 1.6*3 5,748 3-54 I •IO •67 3-98 »7 o 9 27 9Non-manual workers . 448 1,381 3-08 0'8i •58 4-46 27 10 8 28 7
IV Partly skilled occupations:86 306 -,•46 1. nc •71 91 ^
Other mannal workers 398 1,4783 3U WJ /*
3-84 26 6Z7 7
3-71 I-I7 •73 7 *7 *Non-manual workers . 30 133 2-66 0-62 •50 3-55 26 4 8 27 0
V Unskilled occupations 370 1,303 3-52 0-99 •79 3-74 26 2 3 26 7Not gainfully occupied . 813 1,656 2-04 0-26 •4' 2-99 26 4 I 0 37 4
All households .... 4,116 13,1*9 3-13 0.90 '•43 4-11 17 1 10 ** I
77. Households in which the head is a manual worker tend to contain more adultsand more children than households of the same class in which the occupation ofthe head is non-manual. Class variations in household size are, for manual workers'households, associated with the number of children, who are most numerous inthe families ofminers and partly skilled industrial workers; in non-manual workers'households, however, the number of children increased from Class IV up to ClassI and the number of adults from Class IV to Class II. Although the number ofadults was fairly constant in manual workers' households, the number of earnerswas greater in the lower social classes; in the non-manual workers' households, thenumber of earners varied less, but the proportion of adults who are employedincreased with diminishing occupational skill. Income was naturally closely relatedto social class, except that unskilled workers in Class V had higher earnings (perfamily and per person) than the rather small sample of non-manual workers inClass IV, while agricultural workers' incomes were the lowest among the gainfullyoccupied groups shown in the table.
78. It was presumably to be expected that a social classification based on occupational skill would exhibit a rather narrower range of family income and hence ofexpenditure on food than one determined by reference to income. It can be seenfrom Table 23 that weekly food expenditure declined from 325. id. per head inClass I to 265. 2d. in Class V, compared with a range from 345. xod. in Class Aito 245. 5d. in Di in the classification used in Chapter IV, but there is little differencebetween expenditure in all sections of Classes IV and V, if allowance is made forthe substantial free supplies of food obtained by agricultural workers. Even inClass III, the households of skilled manual workers other than miners spent onlyzod. more on food per head per week than households in Class V. Miners in Class
Household Diets of Occupational Groups
I; JS 5»* S»OH N O%•»• ^
f^'c- tnOt
Oi H 0 M 0 ON * ! »nM " iH s
•
-II * '-0•0 « O « Ok•* |J 0 MO O Os Ok
NM «t M« "i 0 tsOO•*o «M 0 O Cs <OM ts ts *n •* s
00PI n
1* 00
X
II1 s M fx " 0 0 Oi m M x>
^•"2 ? *•l
*1SO tn
10* « N•I «R 5 ts O « OSOB,
| =MlO On M M O O 8
-* M * oo •*m
*s»
1
to
O
111S « O f^i£>ts « -*1V^ o 0 IDOO 0*
| 1
M * *« *, Os
^ 1 1 -o * M• 5"3 J «ooo moo M ts H Ot vt ts«O 0,
j
0,
Si3 >,a
c- OM
O O O O •l•l
•OM OS•*M M 00.
j • i| 0 0 o a T -T' Okt|
1OM
«J
tn M -r "- - :< 000 W)M M Ok
1
•
5 II n M m M o M * m M ts * j? M k
It]
sf jiil 00 O SS^tt S KS ? ^R5i 3
3
«^ w « 5,
«M <. o
1 s-ys O M «.j^« H 00 M Oi ts OS« OQ
III « K * ft M N0\
trtoo mmon 0, o o o *-00 M« •*»
n
5^S'§ 00 M 0 »-.0 M 3 *s w 00 •0- so
to «nM c* o\
1
• 2-^ <oo * o « •*
5- 00 moo vO
O n ^- I
*1| ts * ts »n ts
SMts M O Men * kfi Os "-5 o
s sc
rfsa
•snaS
• • ....
1
1 11
MILKANDCREAM
Liquid,retail
Liquid,welfare
AllLiquidMilk
Condensed
.
Driedandother
Cream
TotalMilkand<">,
CHEESE:
Natural
Processedandpack
TotalCfuest
Baconandham,ur
Othermeat(a)
r,;..-/ Mear
.
(a)Includescoo
MEAT:
Carcase

Domestic Food Consumption and Expenditure, 1956
A•) O 2 R
- 0 '0 00% tS tN
» •RS?->«o" CJ 00 « «o « o «* fcj,
5 iii4
H H ••
-t^ ts *fi>0
»- 00 c c c- >- 0. j.m Ol ?«a p
*glOt* .7 IN m4 W O H 0. <• ? oo m rs
•i
5i? eo ts O O *O«O 2 OOv> ? OOM fO jII1
« OO « M •«•fs C- -r '0 o
1\o ^»
sOO M IX M O
3 "" 9 M •*M i•1| rl S
Oi * 00 0 f. IX •li
I *!!fN ^
o » « * 00 00 O *N«n
5IN s« n
OO(OH
O « oo • I1 ill S5 IX 8 >OM OsOO
0 « 5 S.'SS;
-z
tN •0ki B"
^>
„ to
«l ^M«OM O s
n " ?1
O | i *» * 00 o. •*OO 9i 00 00 N *•lit fN 00 00 O 0 m o
1 ^ 2 *?^ N w « IN to O ? O <-i * "* Ot 8
M
jS S»o«p»9 'S-'O "£ C. J^
oo O O«M O hi
0*b||" (t jiii ft
•l
«o ro « «
11
M o- •* ? OO*NO> V-.
I _i ji| s% « . SO tN «0 ^ m*; «N » M ts « 2
1 «llIN •*
KI00M s
d0»fi**° * ."
$.*ii Oi Oi 00 OO M O «o«•» 0 o •«•
? s« * ^1
III0
H M M M * M « '
« Q o.R O CO *
5 |00 M 0. O M »OOO 00 o> IN O •*
to^O00H•X m <o« O O
1tN * tN JS; N &M ««• -0 ts rn00 M 0 *O fOW
" tN " jfiil M o •*iT
IN00 0 •e•
i
Freshandprocessed(b)
...
Prepared(c)
.....
TotalFith
FATS:
Butter
......
Margarine......
Lardandcompoundcookingfat
Otherfats......
TotalFats......
SUGARANDPRESERVES:
Sugar.......
Honey,preserves,syrupandtreacle
VEGETABLES:
Potatoes(includingchipsandcrisps)
Freshgreen......
Other(d)
.
.
.
tb)Includessmoked,driedandsailed,
(d)Includesdriedandcannedvegetables,
TotalSugarandPreserves
i5-0
a
FISH:
OO
!•3sHI
'i
Houseihole1Diets of Occupational Gro *P*
(e)Include*tomatoes.
(g)Include*rolls,fruitbreadandsandwiches.
4^
(f)Include*dried,cannedandbottledfruit.
(h)Include*bun*,iconei,tea-cake*,muffin*andcrumpet*.
w
•*•**•0
otco oo m O*>0O •-*tx O« { SM * O^ «n*>» M
**
".2.
*fl *?
H MM „« M °""°°0"" * .CN ° -i
k
!J*
r- n ? 5«* o «nin O <Oco MS •*O *NOOv OO M o *
V e ??0 00 fx
£5
Non-
Manual
Workers oo m 5 H 0-
«r»
|f
IV
PartlySkilltdOccupation!
M 5
° - ° " m * M
Htx
Manual
Workers RS 3 *5 J8 00«« O
8 e us
Other <O*4 ft OlO 00M 0 M (X,U^O
\
Regiitrars-OeneroJ'iSocialClou
M " x 10 M fct
*i
ill
*o 0
3
* o* •*« ^ O COCD«rt H
•o00
irt ?*O Oi 0 O OOO M H «r>O OOO "•."•* '--, tn M o o
(penceperheadperweek)
M
TABLH
24continued
Non-
Manual
Workers ss 00 § ss* O O*" *x tx M M ^ M IX «*> tx
tx
^
^,
IllSkilledOccupation!
nH - N « * M -i
Other
Manual
Workers-
°°
•?« 0
s » S£ 2 M O' -\ '1 I' tl ^ s 00 O
- " ° - ° «« M * tx *"*
S|
Mining
Manual
Workers K,
fx O
tl piiiii^ tx **
• njj
M M M - M
H 00 O •(
CD!?E 8
" "" " - *"0'0"* * 2 *"• ° IX. 00 .
.a!
s
- 4--I « 00 t
O osooooo> o o>«
M«OM O??(« — ' ~ •--.'••* 00 »r»w-i>OOO IM M 5 M «e n •0MOOO O fn m * ft -0 O O Os
s
1
TotalBeverages.....
MISCELLANEOUS.....
TotalExpenditure.....
|I |• •
* B, • • '
Cocoa
Brandedfooddrink
N
FRUIT:
Fresh(e)
Other(O
TotalFruit(e) Is . . .il
J||| | 1«J 1BEVERAGES:
Tea
.
Coffee
.

44 Domestic Food Consumption and Expenditure, 1956
t
a -1COM0100 rs M M o
Oi0 •** oo> 0 0-.M K
Ti
,0 *hO O 0 " "° ' '**'* 5
rfl £•5 Qo*•O O t * * =-. ^ ts n Os
^!l-*•o •»o o c 10 Cl O " =•«•*o
it
atp MOO 0*ts 10t« M M
, • 3 o «„ oU •* 2.1 to O V O O • * <«e
-0 ts•I M M l-l
B ^
-v, MO «ft to n o ts ^ •noao >
^11-* o ^ o o : * W O " Ch-*•M K
1
M M
h«S *f Of) O r-j.M ? o 0 IS
ts•-O— C" t
oil•o M •*
a 1
a" V 0 0 0 * ct O ' co m «
t-3
•« 1 -i. P -« R"** - 5 a o> M -*•O-Is
3 4-1 M M z
I
ill
.. «O M O O«10 0 0
•*••*-M Oo O O «O
I
|
T- O - C*u~,O
Z
i
*i\COCO ^srrs •oO * * s O OvOi n
a; --, st ts
1
OO•*•M(-1
3
»16 « 00 O moo N>*M rfto 5 0 «« 0
illo o •o o en
M H *n
•+« 5.T2S is « o t 0, « •-.•i
a s
*Q oo •*• ts « O»
,5 «|
to Ov t M M 0 ** o •* > C?sO CO 5
Q^ g 2
oM H
ts
MILKANDCREAM:
Liquid,retail
....
(pt.
Liquid,welfareandschool
.
.
(pt.
-•!// /.iVmJMilk
....
(pi.'
Condensed
.
.
.
(pt.oreq.pt.)
Driedandother
.
.
(pt,oreq.pt.
Cream
(pi.)
CHEBSB:
Natural
Processedandpacketed
.
MEAT:
Carcase
......
Baconandham,uncooked
Othermeat(a)
TotalMeat......
ik
TotalCheese
.
11

Household Diets of Occupational Groups 45
3 II
i
j
to oo1
0,00
oooo •c J« w £o 00 * O "I «o•*• 0
1"*•H >0 * •* •*M O H
Noo m n
O
1
-=t1 S3 S01?. fx £ S M •+ V) 0.** txtx O
00«011 »O " w. -r - 0
seo •*• *
fOtx •«•58
Unskilled
Occupa
tions
-»--O O N*0« O -0
11 QVJ rx m n-i
jleproducts
n O Wj O - '
^ «n -1-M-lM O 0] OOIx O •j
M e
i^s N to 00 g OOO « ul o 8S 00 5s; ?
*li 1- O j»5
•|
•f n 10 * •* •*M O H«o «o
H •« i
3 jf
O •«« a « tx ~ 00 fs « « M fx 00 «« OS ctoo t *
s||Sl
** * „ ^ * « O N eo «
2
* is. tx •>ios
| ! Ii^g S S
0 H COtO « tx ootoO OO
-1- 00 O M 0oo « >Omoo in Oi m tx to o
a. ' *""4§l ii H M Ot
i_«»
P^SM tn O O ootO m O. M M
5 M to O X
| ^IIto « oo •o
HH &- N 00OOtO<*M ** "* m to M o Ot
o
| i
.,1
|£ s•5Soo O OOM to
•A»nM in R
tn<oOO«
HH ??s H
§11 00 o
* ^
•t-H V) * * * n O S M 8
O 00tOOt
1
•US £
(s SSS^ fi *s 00 O Oi Ot •D
IIItx m "*" oo B
ofl« w 10 * 2 00 H M
^
tsi? s? o O 000
o V*O 00
8
5
H 00 vOoo O «n tnoo •t •0 -r 0
ni'1»nM to "* u->rt « O
H M 8 *"" V)
Profes
sional)ttc.
Occupations
tx •* Htx«
tx tx O "O
1
00*X B 00« CO
OOw tx
aO- V) oo -*• IX
«0
d
andcrisps)
driedandsalted.
*
• -5 •
.. 1I
jceased(b)
I .1
1
t
essmoked,
8"
Freshandpr
Prepared(c)
FATS:
Butter.
Margarine
Lardandcon
Otherfats
SUGARAND
Sugar
.
Honey,prese
TotalSugar
VEQBTABLBS
Potatoes(inc
Freshgreen
Other(d)
a
"§
FISH:
TotalPish
oo T
otalPats ^ *
•^i5II
1I
Domestic Food Consumption and Expenditure, 1956
i1
I?' i
n
!
n V| •4> >»• IN, <•*
5
4>TJ w.ifl O\00oOIN «1<*•*CiO « "•>IN.OfO O O w»QO
tx. moo *Nts IN•^^ O 00 o\ O <••-'O "-, O « f) M « OS^'5.*-gs N • * •*• ts
'*
00
3*«* OiM O^ S
si §• 1X
ll1 ^* <1 m <o °0«">
•IJ CO«*1 SH«0
| 54^ 2"" »*
^ -"^S 00 O «c 4
1•21-*«I1
*N\O *^*1
M O*O W «- I . -O <.-,O W '1 00ts.
r^O O O «n
1
•* "1
O
I•1 1-aiOOrf^ p-t «^MO,*-0. H « 00« M
OOin w wINK
4
^
ft,
In 'S*'s
»»«« «n V%H °0
5 *M §2 * o r«.txoo O DOH->txCOO " ^ fs «n« w »
|
-; i s
^5fe"»
«0 WOOD <->
\ §
H ^ n^ «
- \ uM •-iIN OO O 00 N 0 tN -f >O•*ONO » <n Oi M « w «
5(5
11
oil W « * «0 (N.»-»
^•3 t Os
«!•*Ill 00 IN *on
M IN O M«n
N O m vi O M n rx°o
« O O O *i
-its
-3 "
00 •*••* M fl00ft
^
:: -3 ?• =
5"S S-g'EO
OtOO ts, 5 ^ « >n
, al
e* *->
.5 V? w oo CK Moooo m --'/-- J - COCO H MOO« « c>
Hi rs,oo V) <n
o. § 8
* w f-i <O
•s<3
1
A
V
1
CEREALS:
Brownbread
Whitebread
.
Wholewheatandw
Otherbread(g)
1
Tora/Bread1
.
Flour
.
Cakes(h)
.
Biscuits
Oatmealandoatpi
Breakfastcereals
Othercereals
BEVERAGES:
Tea
.
Coffee
.
Cocoa
Brandedfooddrinl
. . . 3
5
ToialCereals
TotalBeverages
FRUIT:
Fresh(e)
Other(0 11«5
.1• ^
!!
SS

Household Diets of Occupational Groups 47
III spent more on food than other workers in the same class, and even more thanthose in Class II, whose families contained fewer children; the latter group, however, more than made up the difference by obtaining free supplies from gardensand allotments, and more meals outside the home.
79. Tables 24 and 25 show the expenditure on and consumption of the main foodsby households of each occupational group in July-December 1956. If the comparatively small segregated groups of miners', agricultural workers' and non-manualworkers' households in Classes III and IV are disregarded, the consumption ofmost main foods declined steadily from Class I to Class V, the gradation beingsteepest for fresh fruit. For bread and potatoes, margarine and tea, the class gradientin consumption was, however, reversed. Somewhat surprisingly, reversed classgradients in consumption were also exhibited for bacon except for a peak in ClassII, and for cakes except for a fall in Class V. Downward class gradients in the consumption of several foods are reversed in Class V households who consumed morecarcase meat, fish, eggs, butter, oatmeal and preserves than the households of partlyskilled "other" manual workers in Class IV.80. The diets of non-manual workers' households in Classes III and IV were, inmany respects, superior to those of "other" manual workers' households in the sameclasses, but were generally inferior to the diets of the next higher class. Thus, thenon-manual workers obtained more milk and eggs than the corresponding manualworkers; they exercised a stronger preference for butter and for brown and wholemeal bread; they consumed more fresh fruit and fresh green vegetables, and wereless dependant on bread and potatoes as sources of energy.81. The main feature of the average diet of the skilled miners' households in ClassHI is their heavy consumption of most of the main energy foods. They obtainedmore bread, potatoes, beef and veal, pork, bacon, prepared fish, welfare and dried
milk (though not total milk) than any other class, but had the lowest consumptionof liquid milk, rolls, wholemeal bread, fresh green vegetables, mutton and lamb,cheese, oatmeal and cocoa. They had a relatively high consumption of fats and offlour, and a low consumption of prepared breakfast and "other" cereals.82. The average diet of the agricultural workers' households in Class IV, while insome respects governed by their high energy requirements, was influenced by freeor cheap supplies of certain foods and by distribution problems. These householdsconsumed more sugar, fats, flour, fresh green vegetables, natural cheese, cream and
cocoa than any other group of households, but had the lowest consumption of fish,"other" vegetables, brown bread, processed cheeses and "other" cereals; they consumed larger quantities of liquid milk, bacon, eggs, preserves, bread and coffee thanother Class IV households, but smaller quantities of condensed milk and potatoes.83. Table 26 shows the calorie value and nutrient content of the average householddiet of these groups. For all nutrients, except carbohydrate, the general tendencywas slightly downwards from Class I to Class V. There were, however, severalexceptions; within Classes III and IV, there were marked differences between thegroups, largely due to the individuality of the diet in families of miners and agricultural workers. Indeed, apart from these two groups and Classes I and II, thenutrient composition of the diets was within 5 per cent of the average for allnutrients other than vitamins A and C, with manual (other than mining) and non-manual workers in Class III and manual (other than agricultural) workers in ClassIV nearest to the national average.84. The values for Class I were, on the whole, the highest, particularly for vitaminsA and C; this class also obtained 8-9 per cent more animal protein and riboflavin

48 Domestic Food Consumption and Expenditure, 1956
1
s IIInilIJ£•« t
I
r i oo <n000 t*. «jrt«oi-,i-i«QO» mM<o««o*xOWjfM Is, •*•O PI o 1-1'« w «i «n OOOMCOWMWHO
00 M* •*n<0
[ «? •«* ^>
-llt^J•S
« •*« '-o M- rtromiHMtntnao eoOWMMrsMoo^oorx^-oct MM^ Mino oooovtffMvtm
« «•« M
«T> MCOO OV « MMMMMUMWW
Unskilled
Occupa
tions
00 N* M" m
O>-i-O MO eo
u Otxnootri oo<^OMMmmM moonn^^mM^OC !-«.•*•O V) OMn n v-iO OCTiOwWMO'O1*»*. Mmo^tn M MMMMWMMW
iiiIJ1
«* *<* *
* « o *ao Mo —'.-'. «mvtMM<n«*.w MOM«O»«IS«*nis^-OM tsMtn Minm oOOO<O<IO*lv*
a<?& «
*
•*o.
SkilledOccu
Other
Manual
Workers « M* «*»
M»OM»sN tnmtOHHtn^OO W^MM«**Mt^o n
IV M rx -t 0 -*• OtM« Mm^- ootOMQOMOom
i « M tn W « M MMWMMM**«
i3
&
«" •*
CTv•*00 « \D M
1
g'S.S C !-•-1 "'>C"> •4-mOOMMtOtltS. T4^-MOl«OrvtSAM'EaS nts-4-MiO OMO winm oo*MQir»MO.i-ifO
1
*afe M"
•«
ristrars~Gtnt
Non-
Manual
Workers
oo fo moo M MrottMHrOMm oo f^iQ>fno M 9 O **•-• r, - r r< NMirt M o -T ooOMA«OMtoe
f* O<O t* «vH
'ledOccupatt
S B S 0^ «J « M.MMMMMMMW
m
in
Other
Manual
Workers
(OinMtxCi ^•«nmww<or^*O -^OitriMNioOpn-*MtN^-om ctHm tHnm ooiOMOiMMtnvo
0 « O fO*9Q
«O W«O-* « MMMt-MMM«
g
111
«T M" •*
cn*oA - •--'•«•lOMfn-^tx —--,-«--- -i n- <nrs>(no<noeoHtf•-•j- - ~ i-^ — - ™ j- en OeiOM*O«t<Knr«
?5E6 «T J
a:
]
sl|s ifiiOtOMts Mro MMtOMt* oommmMO^OMCO « fs.*«n»o
*1J*-i r-s -r i- '» OOH MO1 O O M M O ft M •«•O3<O weno M MMMM«W*«M*|
771
W
«"
M"
« w oo>Ovi O
1*4 iOv)txm<+ o<n MMCIMM f>O*Om«O«OOMao
!ll r-*t^ -*•M I-. OOM Mts.«o MMHtM«<nM»nfn
c? M* in
•
2
'
«
2 &3
0, M
1
3
"
S 3f 3 ,. ?li||? s
«'s'S 's M -^IB^SO 2 a ^JuliPiilMj.iiiiSMil

Household Diets of Occupational Groups 49
than the national average, but slightly less iron, findings which reflect their higherconsumption of fresh fruit and vegetables, of milk, cheese and meat and theirlower consumption of bread and flour. The intake of Class II equalled or slightlyexceeded the national average for all nutrients. Miners' (Class III) householdswere above average for all nutrients, except vitamin A. Their large consumptionof bread, flour, and potatoes contributed to their high intakes of iron, vitamin Bjand nicotinic acid. Agricultural workers' families obtained 14 per cent less vitaminA and 10 per cent less vitamin C than the average, mainly because of their relativelylow consumption of liver, carrots and fresh fruit, especially citrus fruit, while lowconsumption of liver and margarine were the main causes of the relatively low vitamin A intake of the families of non-manual workers in Class IV. The diet of ClassV was in many respects similar to or slightly better than that of non-manual workersin Class IV. The diet of those not gainfully occupied was for all nutrients, exceptfor vitamins A and C, less than 4 per cent below the average.85. Table 26 also shows the comparison between dietary intake and nutritionalallowances based on the recommendations of the British Medical Association.Since the Registrars-General's classification is based on occupation, and hencereflects physical activity as well as skill, the energy allowances of the classes varymore widely than in the classification by income; in general the more active manualworkers, except miners and agricultural workers, are less skilled. These variationsin requirements alter the relative dietary status of certain groups.86. Again the general gradient was downwards from Class I to Class V, but withinClasses III and IV the percentages for the nutrients associated with energy (proteinand the B vitamins) tended to increase as energy requirements decreased. Althoughthe nutrient composition of the diet of the group of households whose head was notgainfully occupied was the least, their requirements were correspondingly low,because they contained few children and, by their definition, no active workersexcept a few whose occupation was vaguely described. Thus this class showedpercentages above 100 for all nutrients. For similar reasons, the groups of non-manual workers in Classes III and IV had satisfactory intakes of all nutrients.Class I showed the highest values for all nutrients, followed by Class II and thegroups of households with less active workers mentioned above.87. Percentages below 100 were found for protein in miners' and other manualworkers' households in Class III, in agricultural and other manual workers' households in Class IV and in Class V. Miners' and agricultural workers' households alsoshowed relatively low values for riboflavin, for which the allowance is related toenergy requirements and in which bread, flour and potatoes are not particularlyrich.
88. The proportions of total energy value derived from protein, fat and carbohydrate for these households are given in Table 27. This analysis emphasized thegreater part played by carbohydrate foods in the diets of the more active workers.Class I derived the greatest proportion of energy from protein and fat. The non-manual workers' households exhibited a fairly common pattern similar to that ofClass II. Indeed, the contribution of protein to the energy value of the diets of allgroups—apart from agricultural workers —was remarkably constant.89. Table 27 also shows the proportion of total protein obtained from animalsources. This reflects the previous findings: the lowest percentages were found inthe households containing the most active workers; Classes I and II, the non-manualworkers in Classes III and IV and those not gainfully employed all showed valuesabove the average for all households.

Domestic Food Consumption and Expenditure, 1956
I
s
IW •«
^ 1
I
"1«•>•-!•*• IN
M n m «
*m
211•* » IS. «n
rs.M VO M
lii00
•• f» «n VI
"
J!J •* M «n O
Non-
Manual
Workers
M <O nM m vi •)
00 M 0
PartlySkilledOccupations
n <n m )•m
III«IS
tv
•* >O Oi ooM * « •*
mKegistrars-Omtral'sSocialClass
M *1 *1
Agricul
tural
Workers O *s « m
Non-
Manual
Workers
M « WM *-l ITi
•*•in
4> M n OM 00 0 Oi
SkilledOccupations
N n n m
Other
Manual
Workers
III
•*• IN CT>M « M «« rt « in
Mining
Manual
Workers •* W Is. <nM m nM «n <n
M
, ill a
*n
"
1111
>o m M OOM CO O«o
iilw *O «r»
"|s"l
* * 00H a. gQ n*- m •* •
Protein
......
Fat
Carbohydrate
.....
AnimalproteinMpercentageoftotalprotein

VI
Household Diets and Family Composition
Classification
90. The extent to which the size and composition of a household influences its diethas been emphasized in earlier reports. Since 1954 the Survey sample has beendivided into eight "classified" types of household, in which the adult elementconsisted of one man and one woman (a "couple", usually man and wife) and three"unclassified" groups, in which the adults numbered one, or three or more, or twoof the same sex. In 1956 the classified groups included 65 per cent of the householdsin the sample, 66 per cent of the persons, 62 per cent of the adolescents (15 butunder 2 1) and 80 per cent of the children under 15. Childless couples are subdividedinto "younger" (both under 55) and "older" (one or both 55 or over); the formergroup provides a suitable basis for comparison with classified households containingdifferent numbers of children (called "family households"), since few adults in suchhouseholds are over 55.
91. As in 1955, the diet of the unclassified households with adults only wasgenerally similar in pattern to that of the older couples, though at a somewhatlower level. The diet of unclassified households containing adolescents but nochildren approached that of the corresponding classified group, while the residualunclassified group containing children had a pattern of food expenditure broadlyresembling that of the two-adult families with children and adolescents. Thenutritional position of these groups is discussed in paragraph in.92. It can be inferred from Table 3 of Appendix A that heads of families with twochildren tended to have higher incomes than those with only one child, and slightlyhigher than those with more than two. Class A contained nearly as large a percentageof the households with four or more children as of the one-child families, andthere were relatively fewer of the former than of the latter below Class B. In theselarge families 29 per cent of the men of working age were engaged in active or veryactive manual work and 30 per cent in sedentary occupations, compared with 16and 38 per cent respectively in one-child families and 15 and 45 per cent foryounger childless couples. The heavy manual worker can command the m^imnmearnings in his occupation much earlier than the sedentary worker, and in generalthe size of his family is probably less affected by economic considerations.
Expenditure and Consumption
93. Table 28 gives the food expenditure and value of consumption per head perweek in households of different composition during each quarter of 1956 and for theyear. Expenditure in all types of household was greatest in the second quarter, whenfood prices were at their peak. The rise between the first and second quarters wasgreatest for younger childless couples, whose average food expenditure reached theunprecedented level of 395. sd. per head per week, and smallest in households withfour or more children who spent 175. rod. per head. Part of the widening of thegap between large and small families was seasonal, but the effect of even a temporarysharp rise in food prices is more marked in families with several children, as it isfor those living on fixed incomes. In the third quarter the lower prices of fruit
51

oo
:it
j
N•d ° *° M " * VOO •d 2-c •slj
a '§2i ^ ^ f M <o ^
;5
]i
-
1 11Tj N °* s 0* - „„
s M . ,. -2 =«-
J
| \n • • 0 to n « " • " • ?>
1 it"O
ti O
•o ** O
••*
moo - o «« • •" IT)O « •d 2
•ss •
•o ° i. •d *11
N M w OOO»
1
i "5 ct -l w * - -
adolescents
only
•o ° * •> M «X °0 * *. H Ol M * •*0 K
1 CO »1 COM
5 --
| Ij
» O m - fs. Is - 0>Oi •> .. O --
V
M++
• E*
s1 „
JB- •* O OtO I1,, «* M « «++^
e
e
O H o S 0
C
1•c
=5 '- «0 *. . O n « "*• * MOO -
*o« •d °*
i H
M
^
•ft
1 d •
|
N00 « O 9" 8
, ft 0, <o O,++-a
5
bothadults
under55
I* n
-rj r' 'c
" «
O w n n o •o
': ;H «n•*
. * am
O. OOM S «OM 0 rs.
oneorboth
adultsaged
53oroveri ^-^ N OtMH00 * n H
Ho 00 « •d" .
m *»• M M n n M(O
•
• • •
• •
PERCENTAGEINCREASE
IN1956OVBH1955
Expenditureperhouaeho
Yearlyaverage
Expenditure
.
Valueoffreefood.
Valutofconsumption
Expenditure
.
Valueoffreefood
.
Valueofconsumption
Expenditure
.
Valueoffreefood
.
Valueofconsumption
Expenditure
.
Valueoffreefood
.
Valueofconsumption
YEARLYATBSAOE
Expenditure.
Valueoffreefood
.
Value
of
consumption
Expenditure.
Valueofconsumption
PriceIndex(allfood))
1STQUARTER
2NDQUARTER
3RDQUARTER
1THQUARTER

Household Diets and Family Composition 53
and vegetables enabled all types of household to reduce their food expenditure.The fall in value of consumption was relatively greatest in the largest families, whosediet compared unfavourably with that in the third quarter of 1955; this declinewas apparently made good in the fourth quarter, when, however, the proportionof Class A households in the group was unusually high. The groups containingadolescents, which had previously been lagging behind the general upward trendin food expenditure, gained some ground during the year, and the older couplesand other wholly adult households improved their relative position.
94. Households of all types spent more on food in 1956 than in any previous year,the increase in expenditure per head being greatest in unclassified households withadolescents but no children (35. 3d. or 12 per cent), unclassified adult households
(35. or 10 per cent) and older couples (25. 6d. or 8 per cent). The increases inexpenditure per household in family households of different sizes were of the sameorder of magnitude, rising from 35. yd. for younger childless couples to 55. 8d.in families with two children and falling to 35. lod. in those with four or more.The corresponding increases per head exhibited their usual regular downward trendwith size of family, from is. gd. for younger couples to only 5d. in households withfour or more children.
95. The widening of the differences in expenditure per head between large andsmall families since 1952 is illustrated in Table 29.
TABLE 29
Increase in Domestic Food Expenditure per head, 1952-1956(1952=100)
ALL HOUSEHOLDS
1952 1953 1954 '955 1956
Food price index .... IOO 105 107 .114 IIQFood expenditure per head . 100 no 114 124 132
FOOD EXPENDITURE PER HEADOlder couples, one or both 55 or over IOO 112 123 131 141
Younger couples, both under 55 IOO IOO 114 127 133
One man and one woman withi child 100 109 114 124 132
2 children ..... IOO 107 112 120 128
3 children ..... IOO 105 109 121 127
4 or more children .... IOO 105 107 H5 118
adolescents only .... IOO 110 116 127 135
adolescents and children . IOO 107 in 120 13°
96. Thus all except the largest families increased their expenditure on food morethan enough to keep pace with the general increase hi the price of food. As thegeneral level of food prices rose between 1955 and 1956 by 4 per cent, it wouldappear at first sight that families with four or more children, whose food expenditureincreased by only z\ per cent, suffered an absolute as well as a relative deteriorationin their position; but the point requires closer examination. Under free conditionsit can no longer be assumed that price increases affect all types of household almostequally. A price index of the Fisher Ideal type has therefore been constructed

54 Domestic Food Consumption and Expenditure, 1956
(Table 30) for three selected family groups, with 1952 as base year, and a quantityindex has been calculated by dividing the expenditure index shown in Table 29 bythis price index.
TABLE 30
Indices of Average Prices and Quantities Purchased, 1952-56(1952 = 100)
1952 1953 1954 1955 Z956
PRICE INDEX i
Younger couples, both under 55One man and one woman with
100 105 108 l'5 121
2 children .....4 or more children .... 100
100104
105
107
107
"3114
118
"5
QUANTITY INDEXYounger couples, both under 55One man and one woman with
100 104 105 no no
2 children .....4 or more children .... 100 103 105 107 109
102100 100 99 101
97. The simplest explanation of these figures is that the increase in expenditureby childless households between 1955 and 1956 went to buy improved quality orservice, with no increase in quantity, while the families with four or more childrenmaintained the quantity of their purchases, but only by seeking cheaper varietiesand possibly sacrificing quality. These comparisons are related to the base year1952, but the point is confirmed by calculating index numbers for 1956 directlyon 1955 as base period; these show a price rise of 5 per cent for younger couples,with no change in the quantity index, while families with four or more childrenshowed almost no change in the price level, but an increase of some 2 per cent inquantity. The last line of the above table suggests that the largest families participated hardly at all in the general improvement in the level of the diet whichoccurred between 1952 and 1956.
98. As is explained in paragraph 29 of the 1955 Report, changes in the averagequality of purchases affect the price index because the Survey cannot distinguishevery variety of food. With an indefinitely detailed classification of foods, suchchanges in average quality would always be regarded as a replacement of some foodsby others; they would thus affect not the price but the quantity index, which couldthen be regarded as a true measure of consumer satisfaction.
99. Because of the general decrease in the value of free supplies of fruit andvegetables, the percentage rise in the value of consumption between 1955 and 1956was somewhat lower in nearly all types of household than the corresponding risein food expenditure.
100. The average expenditure per calorie ranged from 14 per cent above the generalaverage in younger childless two-adult households to 23 per cent below in familieswith four or more children. In 1955 the range was from +12 to —18 per cent. Thecorresponding range in a Laspeyres-type index of food prices was from 4 per centabove the average for younger couples to 6 per cent below in the largest families,compared with +3 to —2 per cent in 1955. Although the effect of family size on

Household Diets and Family Composition 55
;•
I*
SI
I*
1 5 5 5 I"S*:1358
O M SSS^ &e <MO^00 f - 00 »0 N
00 t*1*t1^ 0 SI
j iii1
1
•
00 00 00 00 00aoo o moo
o r^ooN 00 sQ ^ IO oo
••t
S « 00 OO r- r-. o oo oo o
i "° "S
13
If -2 ^ C' 00 O OO a. ~ 00X vO
WOw 00 *
hi
OO00 CO o^o oo 00
« m S^SSR 00 00 ss* « 00 \o m * N
•§>
5
a< ** M <o
a§•w
It1 0 00 r. -i i ^ i - C00 00 00 dv00 s& « «*• Q 5"&5 s 1M —
M »^o oo 5
\
00 00
•J
* M
If 1 »i COM ,«s. mooo r~ ^f O^»O sa 00 u^^O ^ eg
1 11
i*) $* O O - »0 N 00 00>O tv
vO "«*•*O •-<ITJ 00 M M
s> s
1
w* ^ ^O
§ „ PO VI IT) N O* ^" C* n IH M *0 N its?: 00 s
•*
f~00 oo o r-
- *5 «tLKM J?8 O^Is*00*O N
OOOO00 s 3-
1
•5-2 fe
I HS » »00 O*00 OO l^
«Oi
§
a «iy,
88 88888 8 8 888 88 888 8 8
*1|
nrequirements
imrequirements
.
dmilk
.
e
..
.
(includingbacon)
.
andpreserves
>es(includingchips
crisps)
greenvegetables
.
vegetables
.
'2.
1I
1 lalll s | III! 1|
• • 8
I Id,U PQ E O

56 Domestic Food Consumption and Expenditure, 1956
the prices paid for particular commodities was thus more marked than before, itremained less pronounced than the effect of social class (cf. Table 17). Takingthe general level of food prices as the datum line, the relative level of prices paidby different groups for the commodities constituting the average household dietincreased in all types of household without children, but declined in all groupscontaining children, though the changes between 1955 and 1956 were slight exceptfor the largest families.
101. Table 31 summarizes the main differences in consumption per head betweenthe different types of household, taking as the standard of reference the averagesfor younger childless couples, whose energy and nutrient requirements were, however, less than in 1955 because the sample contained fewer manual workers. Formost foods the pattern of group differences was much the same as in the previousyear; there was a slight levelling up in consumption of sugar and preserves, potatoes,
TABLE 32
Differences in the consumption of butter, margarine and cooking fats by households
of one man and one woman (both under 55) and by households of one man andone woman with four or more children, 1952-56.
(a) (») w WasCommodity Year Younger Large Differences percentage
Couples Families of (a)
oz. per head per weekButter .... 1952 2-91 2-75 0-16 95
1953 3-86 3-20 0-66 83
1954 5-38 2-71 2-67 5°1955 6-84 2-28 4-56 33
1956 6-86 2-13 4-83 3i
Margarine .... 1952 4-61 4'44 0-17 96
'953 4'49 4-16 o-33 93
1954 5-14 4-77 0-37 93
1955 4-58 4-96 -0-38 108
1956 4-12 5-24 — I-I2 127
Lard and compound cooking 1952 2-17 2-04 0-13 94fats 1953 2-29 1-86 o-43 81
1954 2-87 1-89 0-98 66
1955 2-89 i-57 1-32 54
1956 2-70 i -40 1-30 52i i
cereal foods and total fats, but some widening for fresh green vegetables andfresh fruit, for which the downward trend with increasing family size was evensteeper than in 1955. In comparison with their relative energy requirements,shown at the foot of the table, families with one to three children obtained morethan a proportionate amount of potatoes and milk, but rather less bread and muchless of other important foods than their energy requirements would indicate.Families with four or more children obtained relatively more than their share ofbread and potatoes, but less milk and much less of all other major foods. In comparison with their protein and especially with their calcium requirements, the
position of the larger families was decidedly less favourable than for energy value.
102. For most of the formerly rationed commodities the redistribution of demandwhich accompanied or followed decontrol was completed during 1955, and changes

Household Diets and Family Composition 57
vO
m
M
a
H
*,
I
g __ ai K ^ o § 00 M S <tS S 5» § Si Si W N Is •0
11!|•g fer M
V>M 0 0 "" •0 M tn to5
"1 s B
M ^ M r*
1 S e E tn o 5S.S 8 O •*IS If !£•? t K
1 [ll o o « " ° - at « M oo -s l-s
|•
• M «OIs O £ tx «OO9M «
1*
ts,fn M M en« OO Oi
' s° tOH O M ^n IN H *° Sao
HM cn•1 N
H
bl <OIS 5R2^ i O ft 5 ft « O HI1!
•0
• t« i cnw w ts
}
*•&o>o 0- ^ 0 OS > M K O S-R* <0
i
H<nM O o i Ai oo 0000 IO •I
N
1
«
« M cn
1 |
»SM co-0 O m Ot 3* SMO IS «SOOM Is O O tN
•a
I M H S «t M
|
to o
S oi« 5-
tNCO 8
V) OO09 M Is
«i«0 O «s IN
1 1
M ft f-j 0 0 0«
* M OtO N
1 | >O00 ^ VDM•s
moo* I? s»
1
O M a O BQViIN M O O Ot * •o M cn
•N
•1
n <*
«« 0..00,,. ^ OO(S « M „« O
1
H O>M H M O M
^
V) M 10 COv%O
1 "3 >o O
** "5
IX O IS M O M N «x« 0\
S.
« 5-
SIs|
||t8 M O H >0O O* 2 M CO JJ in » S <o•1
115Is O (NM O O OL 00 M 01 « 0 0 00
H
....
1
. i
MILKANDCREAM
Liquid,retail
Liquid,welfare
.-ItfAIJWI
J Ms/A
Condensed
.
Driedandother
Cream
TotalMilkandCn
CHEESE:
Natural
Processedandpack
MEAT:
Carcase
Baconandham,un
Other(a)
Q
TotalChast
TotalMeat
.
1

Domestic Food Consumption and Expenditure, 1956
1-*;fe
3 I<H
f-c ». *• e' C 9 Q £Z <o Oi •*o 00ts O
5 ??o
* 2•* •« cH O O MOO 0 10O 00
1
1i hi 3 ** M "* ** N * * M •4
IQ
i3
5 1 £ *><* «* rs. M IH00 Ol h •nm e •*<O00 °0 O M Nj 3 sS CO<*">? S *-\o « o * '*'" -t -r- IH 5, o>o Os
|; J«t
M N M H
1
•
|3i Is. IN ^ rt »r»* vOO> ^ 0 ? o, «»* w 0 * *>I \i T*T ^*r* « n *o ?* « Os .*
3g- • . . I
3.
1
IH *"* M M d K, M H «i H *
M N SO « S.w *nwico s, 00so
JT S « 5, ^oi1?
M O « CO00
,. 1
N M • K M • " f*
It 1 *S 3
CO"«•
5
1^ «« w S $ r* 00 M Os O rs.
I 3 S
OSH. •O --to m M
& •?
-1 • " " M h' M M *> " - n.
: i
1 | 3| tSOOOso ? 0^s£* 1
C1C
s « tnts.
5 ts ° * 5- •k"* "^ *"
IP•2. t " M ? N N N 00
ei00 -f
5
i•? 25 t?J
s s-s!
| t
- ^ ^ *<* -' oM 3331^8
1
•-
•^
O*Os
1 i OSM Q
S 1,2 SS3*o n o <o 5 Oits
fl-c * to ts. trtvO OsOO Osft ts
S!
h M M H
oOsM
3 5 O COffttO
1 - 'C Ot*O ^ •*00« '0-1-
^
ts C* o
»
"" ? • « w-iM O
S
os *nH M"° M R O o «
J 5« ir>rs «*> oo rt »N*0 so Os '^t-
<"» WOO00 0, 0 Os W| «{
>!\>•* 1
!
Is0 is. * Osu-im M Oi O -t- •
C1
-r C -r * aom «J
Ii
H tl N M
«•S^fc is III sa H R
ts,M n so «O r» « oo*Si *>• ?§ V
•0
*•!* •*«•nosO M so
1
Hs«0 Oi *N<nm M IX O -f- «n <HtS O Oi O Os *>•«
(b)Includessmoked,driedandsalted.
(c)Includescooked,emnedandbottled
£
(d)Include,chip,andcrup..
PISH:
Freshandprocessed(b)
...
Prepared(c).
PATS:
Butter.......
Margarine......
l*ardandcompoundcookingfat
Otherfats
TotalPats
Sugar.......
Honey,preserves,syrupandtreacle
VBOBTABLES:
Potatoes(d)
.....
Freshgreen......
Other(e)
Tofa/Vegetable*
TotalFruit(f)
~C
S
SUGARANDPRESERVES:
TotalSugarandPreserves
..ss
2
M s«e
• BX»£00
H

Household Diets and Family Composition 59
Ih -gsss^s «4 inao o oo ts» 5 *i
1
oneor 2;s-s.3
•••1° « ° « ° * - ^ n
j |8|
o it M M »0«3N 00 M M 0 «o O « M » ts & si
|*1
Is «OIs to
"*
tn fx tn«o
H •o S
| •M " - w
3§| i* *.* -00. « 0 0 » »«o n H ?* *r r Oi
30 N -"3
i | :^55?j
i
u•
o j §t
1* H j-ijjio^ «n
« «0 0
(4** 00 *i
«
t »nM O MV*IS. (4 N00t M O O •* O
%
«r>M oo O0 5 ft?
1 5
c '•<oo - -J •' —
"1
*R*S «8*«R at 0 «noO0 •^•a
4
IS. O •? s
1 | "1
fj
4-
Q
1 ii <OO<" c. «o o oo H <n•<M .1 O ooO <r> 0 N 7> J
1
~ - •* M s ^ ri
i
??« 00 fOIs tO Z1RZSSZ x « *5 5 o n
b
"S
1 "3 5 CO•*•* CO
1 I |i
"""* «*--0'"' *o M " O <n ^
G 1 S £ B o O 0,^
. 1
O iri O Oi O « «*i>n
COin O H ;? Is is
CEREALS:
Brownbread
Whitebread
.
Wholewheatandw
Otherbread(h)
• 1 • .......
TeaCoffee
.
Cocoa
Brandedfooddrin]
MISCELLANEOUS
_
g 3|li||
/:.-:,'Cereals
BBVBRAQES:
TotalBeverages
TotalAllFoods
•o
II -dSi
?!e
E
•3
81!
11if

60 Domestic Food Consumption and Expenditure, 1956
o»9I
•*• s B
"^Sw _ c-g*I< KH.g j.
•u
E £ jjf « O CO oo 8«l, 0 >o*no«* Si•5 ^^
•000
1
I"8 11
1
**2 ft
*
8
escents
SI ^-
oon U1 M 5 « o '0 »n* m O -1-
DO
*1•»•« : o lx in en-r so -o
1
1
« H *
1 •3 •* 0.0 0 « 0 O J M -r s oo <no ! «0« "0
a "~ *
SJU93S
?l <OM Jj.JJ do p, H «OO 0000 S3 tv
1 0:s?*2 * «nM **
1 f
C4<O 00*S M« M .O « o <n Ot 04C«M »*• O 1« o is m H H (I M
I1 1
n M *
1 |•g 1
0 ts "1O O. R« 00 M00OO0000 <1
00 O ts ts
k
H O cH O
ON ft Mt"i
1
M « ^fro o * H 0 M00 H « M'•*
1
OO*->OiOO
OtM V> «0 *R t O>*s « 2
tSQO ?ts «-«N . o moo
|
« » > O O * " M O H t« cnoo
^
M M
3Q M
|£
i
tS •*M M «, 00« J n<0 >x 1 Is ^A
«
tn M »r>O O O * « 0 * M00 "1M *
I H O M H M N O * «* ts W M *N 8 M 00 O
i R
3Q
1? mo *-)0 « m *. mco N «« „ » IS OS 0 j
|
*'S i»*i oo m « *^
I3 -j-
i 111 li2S N OO M
H M . OO *8 ts SS; »
si00 « M Ok -e
'lHs «t M 8
•aeg
S u
^ 5!!p * 11
••&•
6
h
i
••8 •1
is
K e •sf
MILKANDCREAM
Liquid,retail
Liquid,welfare
AllLiquidMilk
Condensed
Driedandother
Cream-
TotalMilkandCrta
CHEESE:
Natural
Processedandpackc
Baconandham,unc
Other(a)
FISH:
Freshandprocesses
Prepared(c).
(•)Include*cook
(c)Includescook
j
TutalMeat
.
TotalFuh
.
MEAT:
Carcase

Household Diets and Family Composition
M
"1
*Js -to
00 «-,« OOi *»eo*c Os jnjo w. m M oo
0 IS M-c M W-l IN
•g t »0* M O O *O f. OtS « M « 00 M
*° :-3
fiedhotutho «
butno
children
i J
00 O O «
f
OS
000
£tn ts fT>O 0 00«BOOCO
MO moo o
J<OM M 0
i1
Is ci o>M m•0 ?S Is •RSS v> C1CO H 1
1 * •O<nW O ft 0. n s "ttr 00o >n
1
1 nl
H it* OP>
1Is oo m m M ff. 0 o\ rs rs »J inir, M- O «n •O Oi
i <*im « oH
r.. m H
•3 — Oi OOW-t •Q
i
00 «
%v
f O C. ~ M c xs m n •0 oo enO (n " S
1 i s «n «n>n« oN ? * <
? M rs 9t *«w r»
11
| 1 O\ 17
w ° *, tx o>
0 0 S
0Oi
N 00 O
4
11
1
6 M n «nN-o & »nm•I
Oioo rom M 5 0 m "5"
'Z,
O
H
1
00 *«:; » 00 * 3; SSS £• *!• II';*, oe *»?• n m
1 \
- H m M 00 •
| IN •"•Own ^s; ^ §» ^i«" IS s
ASO •O '0 M O
3O - •l 00 s •l
1
« n •-.M o\ O M -i•O
00 to>n tn *• Oi * O IN in o*
|
* * * " ° oo ro
5
O ••••'- s 3
*" e
1 -5 *•»
N \O M M
it *n * M O «S
5 o>o Oi $ •f H «0 00 »•IN Is 0000 •e -t T. m
1 11 •n * •*•W O S o n J MOM CT-Ol Oi
oneorbath
adultsaged
55orover
0 1-1ft 0
ts « « •*fs «o
J
o\moo H
* •«•« O O -f —OlOOin M M
•l H
i
M ON
1. . z .
Sugar....
Honey,preserves,syrupandtr
j
PATS:
Butter....
Margarine
Lardandcompoundcooking
f
Otherfata
(d)Include*chipsandcrisp
(f)'Include*tomatoes.
EGGS:....
SUGARANDPRESERVES.1
TotalSugarandPreserves
FRUIT:
Fresh(0
...
Other(g)
.
TotalFats
.
VEGETABLES:
Potatoes(d)
.
Freshgreen
.
Other(e)
Tora/K«f«(oft/«
.
Tora/Frw'r(f)

Domestic Food Consumption and Expenditure, 1956
I1
Jf,
M M§ •0
iI1 :I1|
iiii ^iiiiii tN
| 1 il *.
1
*! N 00fv •*O *>« K m o o c v
1
n OQ
1 i •t
3 i o i,i,i«iii
R
*
I ii ^ t».•«o\ ^ - 00 00 -*>O*t CT>O tn H n%O 5
ecCOn M «eo -^-lOP*
i V) -1*
M
*,
a 1
iiii s""00""' * *
1
•
^Uiii
1
k •*• <o- O O O M
{ «o« 00 O 8aMtls v, »«;£ W
i f
f) >c**""" * *
! |I
pjjjj iiiiiiiao
|
-ft»- * •
I
5 «
«i"« * -«too
"§ t 0 ~* ° *«& - 8SS 00 §.» ?°
| J'I-! **« -4-00tx O *) 0 •0IN.O O 0
OsO •*•M »>. ao
ii^ 5 S! 00
1
.1 .
CEREALS:
Brownbread
Whitebread.
Wholewheatandw
Otherbread(h)
TotalBread
.
Flour
.
Cakes(i)
Biscuits
Oatmealandoatpi
Breakfastcereals
Othercereals
Cocoa
Brandedfooddrin!
TotalBeverages
TotalCtrealt
BEVERAOES:
TeaCoffee
.
Household Diets and Family Composition 63
in 1956 were quite small; indeed, for tea, sugar and cheese the largest families
regained some of the ground lost in 1953-55. For fats, however, the widening ofdifferences associated with family size continued into 1956, as Table 32 indicates.Rationing had probably been more strictly observed for fats than for other commodities, and, for half a generation, housewives had been conditioned to take theirentitlement of butter, margarine and cooking fats, whatever their relative prices.Many were slow to adjust their buying behaviour to free conditions.
103. Details of expenditure and consumption per head are given in Tables 33and 34, which may be compared with Tables 26 and 27 of the Report for 1955.Changes in the consumption of liquid milk were o •i pt. or less except in familieswith both children and adolescents, whose average consumption rose by 0-2 pt.K> 4 '37 pt. per head per week; the increase was wholly in full-price milk, of whichlarge families in general fully maintained their purchases. Liquid milk consumptionranged from 5-33 pt. in younger two-adult households to 4-23 pt. in familieswith four or more children; group differences thus remained smaller than for anyother major food except potatoes. Taking processed milks and cream into account,the range in total consumption of milk and cream was from 5 •57 pt. (or equiv. pt.)per head per week for younger couples to 4-58 pt. for couples with children andadolescents. In 1955 the corresponding range was from 5-61 to 4-42 pt., and in
1954 from 5-70 to 4-44 pt. Families with two or more children or with childrenand adolescents slightly increased their total milk consumption in 1956.
104. All types of household spent more on both natural and processed and packetedcheese than in the previous year, but changes in consumption were small anderratic. Consumption of carcase meat increased in all groups, usually at the expenseof bacon and ham. All groups also spent more on fish, and consumption increasedexcept in families with three or more children; older childless couples increasedtheir lead. Parents who would otherwise choose fish as a main dish may oftenforgo it if their children find it unacceptable, but the difficulty does not extend toadolescents. Expenditure on and consumption of eggs was maintained or increasedexcept in families with three children.
105. Butter consumption increased except in the largest families, who were alsothe only group to buy more margarine. The tendency to replace margarine bybutter did not extend to these households until early in 1957, when butter pricesfell sharply.
106. Sugar expenditure increased in all and consumption in most types of household; expenditure on preserves, on the other hand, declined in all save three andconsumption in all but one group. Although the average consumption of preserveswas much lower in households with children than in wholly adult households, itshowed no association with the number of children.
107. All groups spent more on potatoes than in 1955, but because of the acuteshortage in the second quarter all except families with three or more childrenobtained smaller quantities. Most groups slightly reduced their consumption offresh green vegetables, the fall being relatively greatest in families with three ormore children. The reduction in potatoes and green vegetables was partly madegood by root and other vegetables. Consumption of fresh fruit and of all fruitwas increased or approximately maintained except in the largest families.
108. Bread consumption decreased in all types of household. Even before decontrol,the minimum had shifted from the third to the second child, as for potatoes.

64 Domestic Food Consumption and Expenditure, 1956
Flour purchases continued to decline, and oatmeal again lost ground to otherbreakfast cereals, even among the older couples and the unclassified adult house
holds (also mainly elderly).
109. All types of family increased their consumption of beverages; in most casestea accounted for the greater part of the rise, although coffee and branded fooddrinks also gained. The demand for branded drinks remained primarily adult,families with children tending to buy cocoa instead.
110. Younger childless couples consumed more bread and potatoes per head thanolder couples, and also more liquid and other milk, fats, eggs, meat other thancarcase meat and bacon, fruit and vegetables. The older couples obtained morefresh but less cooked and canned fish; more preserves, but slightly less sugar;much more flour, but fewer cakes and biscuits; more natural but less processedcheese; more oatmeal, but less of other breakfast cereals.
Energy Value and Nutrient Content
111. The energy value and nutrient content of the average diet of households ofdifferent composition are shown in Table 35. Among the "classified" households
(those containing one man and one woman) the diet of the younger childless couplesremained of greater nutritive value than that of any other group, and the usualdownward gradients in energy value and all nutrients with increasing familysize were found. As in 1955, the diet of unclassified adult households suppliedless of each nutrient than that of older or younger couples; similarly, the nutritivevalue of the diet of unclassified families with adolescents but no children remainedless than that for the corresponding classified households, although both theseunclassified groups without children recorded higher values for energy and mostnutrients than in the previous year. Family households containing both adolescentsand children obtained more of several nutrients on a slightly reduced calorieintake, and families with four or more children increased their fat and carbohydrateintakes and hence the energy value of their diet; but in all other classified groups,and in unclassified households with children, the average values for energy, and allnutrients except animal protein, vitamins A and D and nicotinic acid, were eitherthe same as in 1955 or somewhat lower. Vitamin Bt declined in almost all groups,the decrease being greatest (6 per cent) for younger couples; the main reason forthe fall was the reduction, shared by all groups, in purchases of bread and flour.Changes in the other B vitamins were smaller, the effect of reduced bread consumption being offset by changes in the composition of flour. In general, the greaterconsumption of carcase meat, together with increases in sugar or in fats, wassufficient to compensate for the reduced consumption of cereal foods, potatoesand green vegetables, so that most changes were small.
112. The vitamin A content of the diet increased by up to n per cent in all buttwo household groups, mainly because of increased consumption of carrots andliver. Vitamin C fell by 2 to 8 per cent in all but two of the classified types ofhousehold because of lower consumption of potatoes and green vegetables and areduced contribution from fruit, because of changes in the kinds of fruit obtained.In families with adolescents and children, and in all three unclassified groups, thereduction in the contribution from potatoes was offset by increased amounts fromother vegetables and canned and bottled fruit. The estimates for vitamin D are notstrictly comparable with those given in previous Annual Reports, as account had
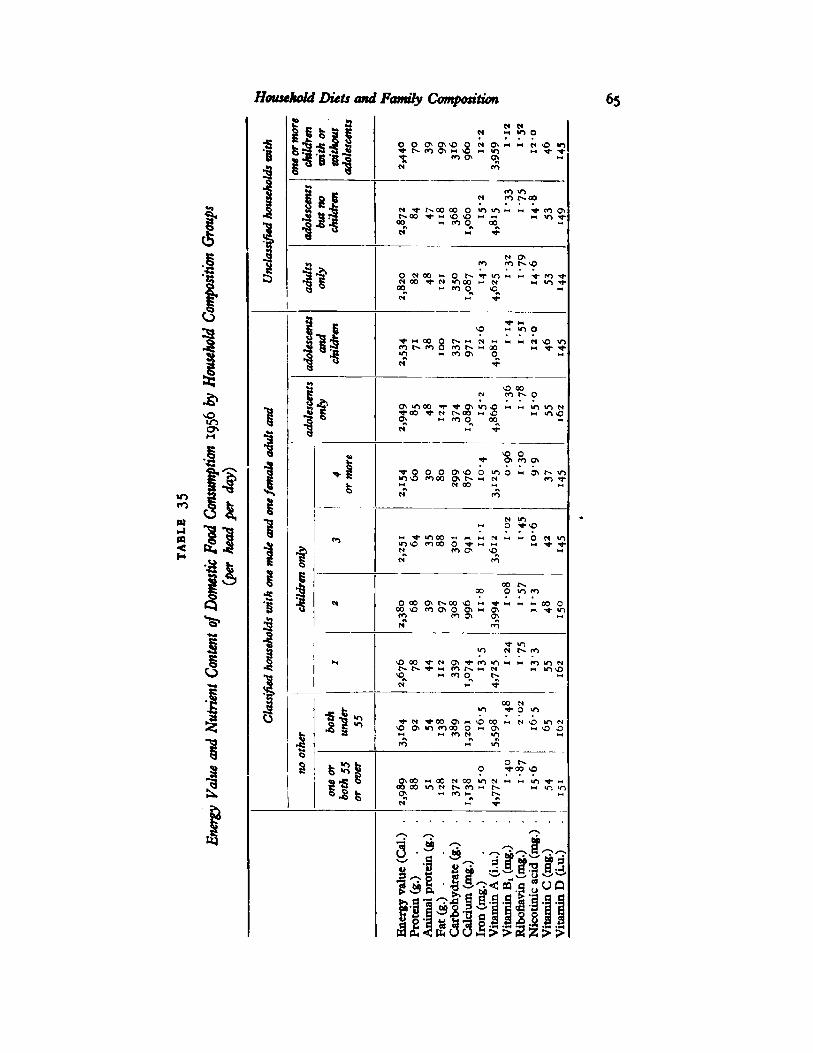
Household Diets and Family Composition
•5;
a»
iI*vO«nON
S I*
i Ji14
*&
1
§'£
^
u?i
1
5 S
i
i•s
'§
I
N M tfl O
*OQNO*«MWO»
N -^-r-QOOo o triio— i-» ^-m^t-Hoo^Mvooi-"!-" HHirjtfoo M m o oo M
O N 00 «« O t^
"J, " m °«N i-T
-i »O O
to r>.ro o m t^.
5
C* «-t m O 00*
orn o*
00 O
oo c^r^ooo HI -^-MmM
00 Nul •«•O >0
•00 ONM vo 00 M
M ro NM10
~ / MCO
C (_, H rt C9 fl C L1 L"

66 Domestic Food Consumption and Expenditure, 1956
I
00 ••- 03 ~
M • * ^i O
« ji "* fe
2
P fe s 5
Ill
I
1
t« s?; -s
II
'85
MOO t>.«-i
u-iao « >noo O roo -*oaoooow^Nm
rJ<Ill-Ill

Household Diets and Family Composition 67
not previously been taken of the fortification of proprietary as distinct from nationaldried milk; this is the main reason for the apparent increases in households withchildren.
113. In Table 36 the nutrient content of the diets is compared with allowancesbased on the British Medical Association's recommendations and, as in similarearlier tables, 10 per cent has been deducted from the nutritive value of foodobtained, in order to allow for wastage and other losses in the home.* The lowestpercentages were for protein and calcium in families with three or more childrenand unclassified households with children, and for protein, calcium and ribottavinin families with both adolescents and children: in no other case did the percentagefall below 96. In the three types ofwholly adult household and in families with onlyone child all values were well above the recommended allowances.
114. Compared with similar data in 1955, the values in Table 36 show only smallchanges, mostly downwards, for most nutrients. Both classified and unclassifiedhouseholds with adolescents but no children showed some improvement, but familieswith three children fell back, although those with four or more maintained theirposition. For protein, iron and vitamins El and C, the values in all types of household with children were among the lowest recorded in the five years 1952-56;changes in calcium during this period were less marked, and percentages in 1956were generally about the same as in 1954. The most general decreases were invitamin B,. In contrast, the percentages for vitamin A continued to rise in 1956in all groups except families with three children, who showed an exceptionalrise in the previous year; the largest families, who had then barely maintained theirground, now shared in the general increase.
115. Chart I illustrates the trends for protein in all households and several typesof family during 1952-56 by annual moving averages centred on each quarter of theyear. The decline in protein has been almost continuous, when seasonal variationsare eliminated. All the groups in question increased their consumption of cheese,carcase meat and eggs between 1952 and 1956, whilst for liquid milk and after 1952for fish there was little change. The decline in bread and potato consumption,however, more than offset the increases attributable to the animal protein foods.
116. Table 37 shows the proportion of the energy value derived from protein,fat and carbohydrate by classified households of different composition in 1952,1955 and 1956. In each of these years the percentage of energy value from proteindecreased as family size increased, a finding contrary to the British MedicalAssociation's recommendation that protein should supply a higher proportion ofthe calories hi children's than in adults' diets. The proportion from protein declinedin all types of household between 1952 and 1956, most of the fall occuring hiJ953-54- 1° childless households and in households with adolescents (with orwithout children) or with one child, the proportion from fat increased steadilybetween 1952 and 1956, while that from carbohydrate declined; in families withtwo or three children both percentages fluctuated narrowly, while in the largestfamilies the contribution from fat declined and that from carbohydrate rose from
1953 onwards, because of their increased consumption of sugar after decontrol, sothat differences between large and small families were accentuated in this as in otherrespects. Table 37 also shows the percentage of total protein derived from animalsources, and of calories derived from animal protein; both illustrate the effect of theconsiderable rise in the consumption of foods of animal origin between 1952and 1956.'For further discussion of the effect of wastage, see Chapter VII, paragraphs 132, 141 and 142.


Household Qiets and Family Composition 69
S 2 8
PERCENTAGES OF ALLOWANCES


Household T)iets and Family Composition 69
'a
PERCENTAGES OF ALLOWANCES

70 Domestic Food Consumption and Expenditure, 1956
117. The chief sources of energy in the diets of households of different compositionin the years 1952, 1955 and 1956 are shown in Table 38. In 1952, sugar, visiblefats and a number of foods of animal origin were still rationed or in limited supply.Since that period all types of household have tended to switch from bread and flourand potatoes to foods which were then rationed, except that families with threeor more children did not increase their purchases of fats in relation to other foods,probably because the uniform entitlement per head under rationing had providedas much as they wished to buy.
Effect of Children on Expenditure
118. The Annual Reports for 1952-1954 gave regression estimates of the expenditure attributable to the adult couple and each child in a selected group ofhouseholds consisting of childless couples (both under 55 years) and householdsconsisting of one man and one woman with varying numbers of children. Thisseries has now been extended to 1956 and the results are shown in Table 39.
TABLE 37
Percentage of Energy Value derived from Protein, Fat and Carbohydrate,1952, 1955 and 1956(per cent)
Classified households with one male and one female adult and
no other
1
children only
adoles adolescents
one or j both i cents andboth 55 under i 2 3 4 or only children
or over 55 more
Protein 1952 n.a. n.a. 12-6 12-4 .12-1 12-0 12-8 12-41955 11-7 ii -7 ii -6 n-6 ii'5 "•3 11-7 n-31956 11-7 u-7 II -6 n-5 "•3 II -2 it -3 II -2
Fat 1952 n.a. n.a. 35-o 35-2 34-8 33-6 33-8 JZ-61955 37'9 38-5 37'4 36-5 35-Q 33'4 37'3 34-61956 38-5 39-1 37-7 36-8 35-i 33'3 37-8 35-6
Carbo- 1952 n.a. n.a. 52-4 52-4 53'i 54'4 53'4 55-ohydrate 1955 5°'4 49-8 51-0 5i-9 53'5 55-3 51-0 54'i
1956 49-8 49-2 50-8 5f7 53-5 55'5 5°-7 53-1
Animal proteinPercent age of Total Protein derived from Animal Simrces
as percentage oftotal protein
1952 n.a. n.a. 50-2 5°'3 48-5 45-0 47-8 44-61955 57'° 56-2 55-9 55'0 53'4 49-8 54'5 49'71956 58-7 58-9 57'4 57'3 54-5 5°-5 56-2 53-2
Percentage ofcalories fromanimal protein
1952 n.a. n.a. 6'3 6-2 5-9 5-4 6-1 5'51955 6-7 6-6 6-5 6-4 6-2 5-6 6-4 5-61956 6-9 6-9 6-7 6-6 6-2 5-6 6-5 6-0

Household Diets and Family Composition
ooCO
MH)
•o AOO -r C- -T '^^
Isa O c .- r- "-i'f -
*•*
11«1•o»Sw 0»>O« **.«
^1
H
i ?» . O fs O O -r fxOt ^ 00tX-O •** *•
«o -T''< -i r ^>O -r
£
Os ^-^-^-« «n•«•*•
»n
•I>n•** •*m m ^ •*
ik
Ot
•B>o. * •*<y\o>o oo
*•
to •*ooo * o *o fo„ ON ..,. j -•(-•-...-<
g g<1.3 <*•)v£ O\P*V% tIrt O
5<sfc
»n
SH
•& i£, •t . m M n « n >O9
\
Oi ^ « O O O A Ot
S.
**
w M (Of>O»•*M IS
s
o m (OM -r t^«~io
<£
I• «> •*•* •*•«r>oo*O»•5
A
47, . «-iM n
Meo Otex g rx r oo M o n
»n•rwi>oo f*. «•>«* 0
1
CN•l
*) tno •«is M oo^o
1OvH
«l . o ooO -T.e. IQOi B
Householdswithonemalean
onefemaleadultand
H
Noother(bothunder55)
i child
2
children
.
3
children.
4
ormorechildren
Adolescentsonly
Adolescentsandchildren

Domestic Food Consumption and Expenditure, 1956£
I"" n M SOM N n " •>1 " H
If r w ** MM H " """> 1 " H-.«
5| i4
lj 1"N M M *M * " "* 1 " •t
i
f?5 lo-}
1
O.M « « Ov ft ft ^ « «« ^ „ o •*«. o Ok
percent
13 9 (N.0 « ->«1 M IN. «• «O«N.Ot * n «"" = •0N
„ o,
H -*--r ^
•MM MM•J "• rf, O '-
HH 4N 5 O «O
w 00 O « 00 O * 5H 1
oooo N o o * v O -*0 M <n •O
I S-- t1 - > -, -r t- VN M* * M \O M * • m« O T|
•>>
J"
M T „_ •« 2
"
S H 1 5
mOs
„
g 1 *"Cn°- - I H
* •m
|
0 0,« «*
a H
J H«
|
•"51? of •*- !n rxH e<
"1""•>•
M M Ct« •a
* •*« oo nk^no^ tO IS to O oo >n M + O «OM <O O
| •^o^'S* 5* n $ io &
5
0 M 0>oo H V>O 00H M I* M £
^
T -, -
«
1
•» 0 »0^OOH
8 •0
Ol O oooo M *no m M „ "•:-•*"• Ok •n W* -*« «
•«£? o. **2 ^ ? ?5 4
OOO<OO
<•?
£ O Mts,m *
M » ^•o *>.MOD
M H M M
^
•*R2 O M<OM 0.N«* s
Moo IN. •g * Ol W O *X •o
i
MILKANDCREAM
CHEBSE....
MEAT;Carcase....
Baconandham(uncooked)
Sausages
Othermeat
AllMe.it....
TotalMilk,Chetst,Mtat,Pi$kand
BUTTER....
MARGARINE
SugarandPreserves
.
Newpotatoes,chipsandcrisps
Oldpotatoes
Freshgreenvegetables
Othervegetables
1
h na Otherfats
!

Household Diets and Family Composition 73
«o I., o *l O ~r-f.,r-. MV) M ao n J 00OO O0. M
i• •n So.,9,
: ^ Ii^f |
M O »>.
451
Jj
!* 15 n<r
.:
ai- O * c« M o r« «
1
00
1
pirant
3
\' HN 5-8 (*1 M 0 «
o ~ 1
00<X
<o iH
Oi h N 1
•n
1
o. MOM
NO* M 0'C 1 2 "a
11
o> S
M M " H*•* S
s
(S M r IX T4f^00 M H r^s
1
•to. N O «
M tn« o
1
q •o
S,-£I s
i M 00 o «r« <o « •*O «n •J COiO CO "•«3;
5
^ « « -
I to *i* °? * O « ^ »o« « «x T 0 0> *X
S *;*
V
a. V) « W t«
" -
, H HI o orxo « «*«. o - T-o-S
— ? ^«M
0
2-3
? ]
JTotalVegetablesandFi
TotalBreadandFlour
Biscuits
Cakesandpastries
Oatmealandotherbre
Othercereals
"5
Nationalbread
.
Otherbread
Flour
Tow/CerealFoods
c
•
||
1] "I
?
so O

Domestic Food Consumption and Expenditure, 1956
5 i
Iw M -3 M * ** « « J HT N
!* gr r ** MlM "• m mm | - S
s •it iCJ
•
i
i~ r tt M M *« * ft * * 1 " **>n
ftONH
i ii r i"" H M M «•*•*<:« * " « *• 1 « ^
^ I.«fe•*-, *,
1^M N 8 «o O « «o o *
1 s
a 0000 H O O<O « o •*o M m «o
^
3 H i,1 N
§ 1 „
1 1•QO M 8 8 1 N
a _,. »
| i 1 ^»- oo «o« o OQ O 0 >o•*•-.5oo
1•l
^ -o «M *«,-««-2 i i - N
1§ M« r-?r^r . g n MO «4 Ot « ao «ooo *n »£
r|I '51?
M «« V "0
•3 | »» -m««o «^ •0 O 00 10 ., * 0«««. O
s $H V ? ts.
1
3 «« »•>*««
|^ 00 M s -
1
*i-•0
•a
•*!;:: ki • "2SS^
Jph s, « *
^
i i1 •c B
§
1
MEAT:Carcase
.
Baconandham(uncooket
Sausages
Othermeat
AllMeat
.
r<.<o/ MiV*.CA..5.,M«at,Fi
Newpotatoes,chipsandcris
Oldpotatoes
Freshgreenvegetables
Othervegetable*
MILKANDCREAM
.
BUTTER
.
MARGARINE
SugarandPretervet
.
1
CHEESE
2§
Otherfats
1
DUDO
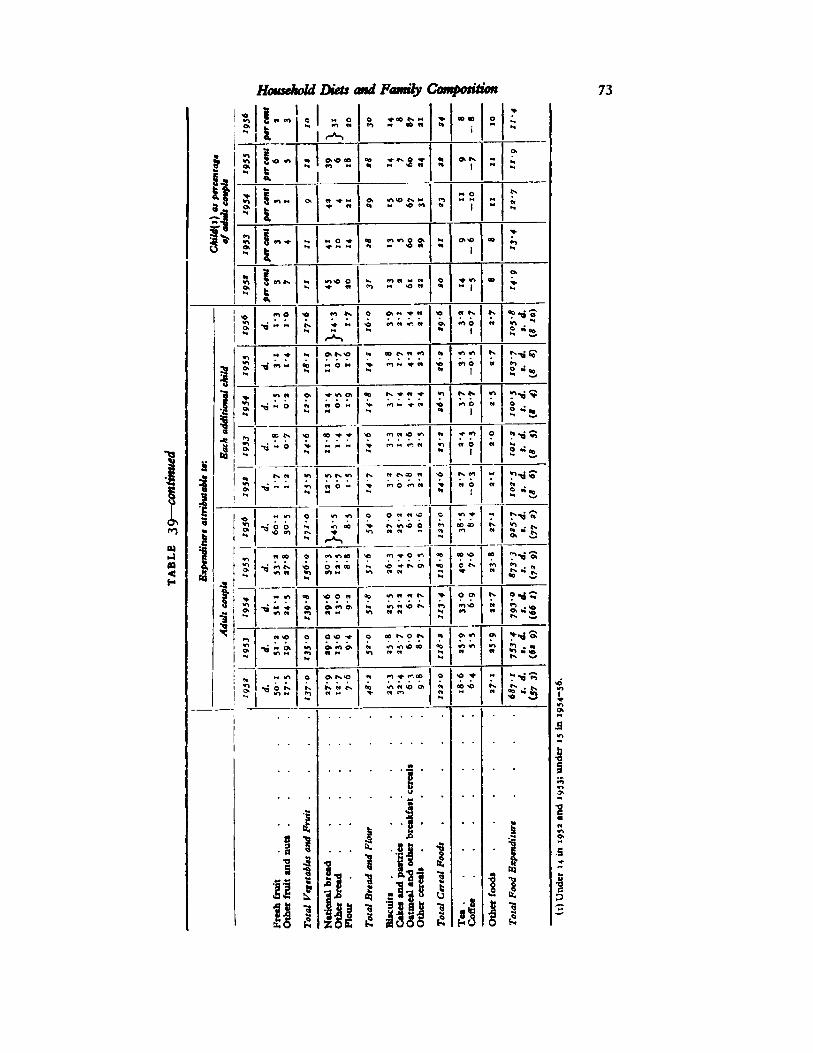
Household Diets and Family Composition 73
1 (" 2- 0 O *00 IN M J 0000
I
o6
1«.1
Ot
5,5O»« OO •i M «CN 3 1
M N
if
percent
3« 0- » ts.
1 Os "~ ? s-s^ S
-H
f!••
eH ~ :• - «o £ «-io CTI s Of
^"^
1 H
r*H m« O S
, Z"5S O -TOO |
E-
H»O «»iw m « Ov
i
«
2 "»
1
-4 «« * joi ? --*" «0
i
N
2 "s
|
-q - 0 n 0 - > "- »« •g N 0
t* i 2 "5.
I -q - o H 3
- - ^t- m w ri « •1 n o1
w N
I
* 0 -
3tureattr O
i,"^ ^
1h, .0 to ^ is. m-o O 0000 IS.sO Cl IX d
| N OO O nm. »O W)•*O •rt 00 00O 00 7^-a
5 •"SS ^ « « £•"&-s
- « •0 * O M71 « « o.
s
S M " " " 5 R-s
H^ fO^ ft SS«- 1 S"
IDS-s
n »i»m» "•o'R-Q O IN
? 62* ««<e°' H 8-3
|
TotalVegetablesandFruit
.
Biscuits
.
Cakesandpastries
Oatmealandotherbreakfast
Othercereals
Freshfruit
Otherfruitandnuta
.
TotalBreadandFlour g
Nationalbread
.
Otherbread
Flour
Tola/CerealFoods •^
it"«
O 1*

74 Domestic Food Consumption and Expenditure, 1956
The basic element in domestic food expenditure associated with the two adultmembers of the household increased from 575. 3d. in 1952 to 725. gd. in 1955, and to
775. 2d. in 1956. In contrast, the average increment in household food expenditurefor each additional child increased only from 8s. 6d. in 1952 to 8s. 8d. in 1955 and8s. lod. in 1956. This increment is not an estimate of what is actually spent ona child's food, for, as the number of children increases, the standard of the diet ofthe whole family declines, a higher proportion of its food expenditure beingdevoted to the cheaper foods. Between 1952 and 1956 the average weekly household
food expenditure of all types of household in the selected groups increased byroughly £i, whatever the family size; hence the increasing disparity in expenditureper head. The corresponding average weekly family incomes increased by about
£3 los. during the same period.
119. Under rationing the effects of children on total household food expenditurewere somewhat greater than those which have since been observed in a free market,especially for meat and fats, for which the incremental expenditure for a child hasdecreased markedly during the five year period, even though prices have increasedconsiderably, so that the corresponding increment in consumption would haveshown an even greater decrease. The percentage increment for a child has decreasedfor carcase meat, bacon, eggs, butter and tea, but has increased for sausages,margarine, old potatoes and to some extent for cakes and fish.
TABLE 40
Regression estimates of Domestic Food Expenditure attributable to Adult Coupleand to a Child in Classified Households for the years 1952-56
/(above upper)quartile)
// III IV(below lowerquartile)
All household'sof SelectedGroups1
Income
Group(upper quartileto median)
(median tolower quartile)
Constant element associated with the adult couple {pence)
1952
1953
1954
1955
1956
739-8802-2
817-0925-7973-5
700-1760-9814-4880-3922-0
665-1749-9792-6846-1919-2
626-4696-2
729-4803-5853-9
687-1753-4793-0
Average increment for each additional child (pence)
873-3925-7
1952
1953
126-6
120-7145-4131-7144-9
103-4113-2
95-9 83-779-173-877-586-8
102-5IOI-21OO'5
88-8
'9541955
1956
101 -0 9i'3106-6
Child increment as percentage of amount associated with adult couple
112-3126-9 93-3
103-7105-8
1952
1953
1954
1955
1956
17-115-017-814-214-9
14-8
14-914-4n-8
13-411-4
14-913-4
12-4 ii-512-6
10- I 12-7ii -912-8 9-b
IO-213-8 10-2 11-4
1 Including households not stating family income, and those with four or more children.
120. Table 33 in the Annual Report for 1955 gave regression estimates for the
years 1952-55 of the two-adult element and the child increment within four groups,obtained by dividing each selected household type at the median and quartiles of

Household Diets and Family Composition 75
the distribution of family income, in order to show how the basic element and theincrement varied with income. This series is continued for 1956 in Table 40.The adult element appears much less responsive to differences in income than thechild increment. Thus the standard of diet in households with incomes below themedian for their family type falls more rapidly as the number of children increasesthan is the case in families with incomes above the median.
Effect of Children of School and Pre-school Age
121. The standard classification of households used in the National Food Surveymakes no distinction between children of school age (5 but under 15) and preschool age (under 5). As the attainment of school age by a child may necessitatesubstantial changes in the domestic economy of the household, a special analysishas been made of the 1956 sample of families containing one man, one womanand three children. Table 41 shows the number of households, the average netfamily income as stated by the housewife, the number of earners and the weeklyexpenditure on food in each of the four sub-groups defined by the number ofchildren under 5.
TABLE 41
Food Expenditure in Households of One Man, One Woman and Three Children, 1956
Number of children under 5
3 2 1 o
No. of households . 33 69 188 105No. of earners per household . (I -00) I -06 I -IO i-39Declared weekly family incomePer head GO (*-*3) 2-45 2-62 2-85per household GO (11-15) 12-25 13-10 14-25Weekly food expenditureper head .... (173. lod.) IQS. 9d. 2IS. id. 22S. Od.
per household (89S. 2d.) 983. 9d. 1055. jd. i ios. od.
122. As children grow older the average family income steadily rises, partlybecause the mother is more free to go out to work. In 1956 the difference in household food expenditure between families with three children under 5 and those inwhich one of these children was of school age was gs. ;d.; with two of the threechildren of school age, there was an additional increase of 6s. 8d. and with allthree a further rise of 45. ~d. Of these amounts, liquid milk accounted respectivelyfor is. 2d., 2s. 3d. and 2s. ,sd. Table 42 indicates that the cessation at the age of 5 ofthe provision of welfare milk (to which national dried milk is an alternative) wasnot fully counterbalanced either by increased purchases of full-price milk at homeor by access to free milk at school. In view of the increase in the price of welfaremilk in 1957, it is proposed to repeat the analysis for that year.
123. Differences in the pattern of consumption between the four types of three-child families will not be discussed in detail. It may, however, be noted that mostof the increase in food expenditure when the first child attained school age wasdevoted to meat and eggs. The corresponding increase in consumption of alltypes of meat was from 21-8 to 25-0 oz. per head per week, which was no morethan maintained as the second and third child in turn reached the age of 5; instead,

Domestic Food Consumption and Expenditure, 1956
TABLE 42
Milk Consumption in Families with Three Children, 1956(pt. or equiv. pt. per head per week)
No. of children under 5
3 2 I o
Liquid Milk: full price .welfareschool
Total liquid milk .Condensed milkDried and other milkCream .....
(1-77)(3-4i)(o-oi)
2-05 2-95i"340-46
3-980-052-47
0-22 0-74
(5-19)(0-08)(0-66)(...)
4'74O-I2
0-58
4'75o-iio-ig
4'770- 12
O.OI
Total milk and cream (5-93) 5'44 5'°5 4-90
most of the further increases in expenditure went to milk and fats, with someswitching from butter to margarine, although the samples were not large enoughto establish the significance of these changes in outlay.
124. Table 43 gives estimates of the energy value and nutrient content of the dietof the four sub-groups, and compares these with allowances based on the recommendations of the British Medical Association. For energy and all nutrients except
TABLE 43Energy Value and Nutrient Content of the Diets of
families with three children, 1956
No. of children under 5
INTAKE PER PERSON
3 2 I 0
PER DAYCalories .... 2,093 2,089 2,260 2,34!Total protein (g.) . 61 62 64 65Animal protein (g.) 34 36 35 34Fat(g.) .... 81 82 87 92Carbohydrate (g.) . 281 276 3°5 3MCalcium (mg.) 971 939 938 937Iron (mg.) .... 9-8 10-4 II 'O "•5Vitamin A (i.u.) 3,4<>2 3,566 3,670 3,585Vitamin B, (mg.) . 0-94 0-97 1-02 1-03Riboflavin (mg.) 1-48 1-45 I-46 1-40Nicotinic acid (mg.) 9'5 9'9 10-7 10-9Vitamin C (mg.) 42 40 45 40Vitamin D (i.u.) . 171 165 140 129AS A PERCENTAGE OFRECOMMENDED ALLOWANCESCalories .... 108 103 IOI 97Total protein 101 99 91 85Calcium .... 96 94 92 93Iron 99 102 99 99Vitamin A . . . 164 !74 179 184Vitamin B, . 124 123 116 107Riboflavin .... 124 116 107 96Nicotinic acid 126 124 121 "4Vitamin C . 227 213 219 186
Household Diets and Family Composition 77
calcium and vitamin A the allowances recommended for children of school age aresubstantially greater than those for younger children. Hence relative to allowancesthere was a progressive lowering of the nutrient content of the diet, except inrespect of iron and vitamin A; the decline was steepest for riboflavin, vitaminC, protein and vitamin B,, in that order. Other changes in the diet were a fallin the proportion of calories from protein and a rise in the proportion ofprotein from vegetable sources. The decrease in vitamin D was to be expected.
125. The nutrient content of school meals recommended by Ministry of EducationCircular 290 of 5th August 1955 is greater than the amounts allowed in Table 43for the nutritive value of dinners eaten outside the home by schoolchildren. Hencethe percentages in that table may be underestimated for households with childrenat school; but even if it is assumed that all mid-day meals recorded as being eatenby schoolchildren outside the home were school meals* of the recommendedcomposition, the percentages in Table 43 for families with three children of schoolage would be increased by net amounts ofonly 2 for protein, calcium and iron and 3to 5 for the B vitamins and vitamin A: for families with only one or two of theirthree children at school the increases would have been smaller. The adjustments for vitamin C are larger, and would almost remove the downward gradientshown.
126. In general, it would appear that the diet in family households deterioratesas the children attain school age, and it may well be that older schoolchildren fareworse than younger ones, though the point has not been specifically examined.The downward trend would be obviated if more of the additional earnings of thefamily were spent on food, especially on foods rich in protein.
'About 46 per cent of the number of children attending school in England and Walesd 33 per cent of those in Scotland take school meals.

VIIFamily Composition and Social Class
127. Chapter V of the Annual Report for 1955 contained for the first time a two-way analysis by family composition within social classes indicating to what extentthe less satisfactory features of the diet of the larger families were confined to thelower income groups within each type of family. It appeared that for iron andriboflavin in all groups, and for protein and calcium in families with not more thanthree children, the position could be remedied, where necessary, by a rise in realincome, but that in the largest families relatively low protein and calcium intakesextended even to the highest income group, and could be raised to the recommended levels only by a change in the pattern of their diet, which would not besecured merely by a general rise in their standard of living.
128. In a similar analysis for 1956, each of the classified household types exceptolder couples has been analysed by social class. As before, Class DJ and the old agepensioner group, which contained scarcely any large families, were omitted fromthe analysis. Classes Ai and Di contained too few families with several childrento justify detailed treatment, and these groups were therefore combined with A.2and C respectively, giving three broad income groups, A, B, and C & Di. Bachof the resulting 21 sub-groups contained over 50 households and over 200 persons,except the Class A couples with four or more children, of whom there were 28,including 180 persons, and those with adolescents but no children, numbering 58households and 181 persons. Households of one man and one woman with three ormore children or with children and adolescents comprised only 13 per cent of allhouseholds in the sample, but they included 22 per cent of the persons, 40 per centof the children and 38 per cent of the adolescents. Details are given in Table 3 ofAppendix A.
129. Table 44 gives the average weekly domestic food expenditure per head andper household for each sub-group. Classes Ai and A2 and Classes C and Di aredistinguished, but averages based on fewer than 25 households are shown inbrackets. The extreme range was from 495. nd. per head per week in the mostprosperous group of younger childless couples to 135. 3d. in the largest and poorestfamilies. These two extreme groups were, by chance, among those eight of the 35shown in Table 44 which showed decreases in 1956; the falls were confined toClasses A and Di, and should probably be discounted in the latter because of thechange in definition (paragraph 45). In all classes, younger childless couples spentmore than twice as much per head as families with four or more children (the ratioranging from 2-0 in Class Ai to 2-5 in Di), but in all household types, Class Aihouseholds spent only i •i to i •8 (average i •4) times as much as the correspondingsub-groups in Class Di. Class differences in food expenditure per head wererelatively greatest for the families with four or more children and least for familieswith adolescents only. In all classes, the total food expenditure of families with fouror more children was about i •5 times that of the younger two-adult households.130. In all classes, the first child occasioned a greater addition to the food expenditure of the household than did the second child. In Classes Ai, Az and B theincrement associated with the third child was greater than that for the second andabout equal to that for the first, but in both C and Di the increment for the thirdchild was the smallest. The numbers in the sub-groups are not large enough to
78

Family Composition and Social Class 79
1
M5
j£ ll
1
H tsoO Oi O M O «
1
• aA
|| ^ SSS8-*-t^
4|l0.
QM M O<** «*OO*
jg]
S •«**»•"K
Ij! ^^o-*«o**; <ctxooooo>oi^.
OD
Q /—. ^->^^-, ,
^
4J3
4 ^^"CC^^ 8
OiO
•0
43^ =*«0»«. •>- ".««--«« 8
•« - _ _»
3 <£ =*1 2
a * ^ ^00 0,0 M 0 « 0
805
3
13 * nim* Is. m
*j!"^* MM O
I„
W00 •*•O «•>O>*Oo
%
41 " rsi'rir 8
o •8
l|l
^ n oo m M ^ M M
•
* CO0 O M N M NO >nM ^-N o N0
\5] tj MMo M in moo w»-1
•0
«13s ;^-^»^ |H h
i
.=
41
•o
HI H MOO«O«T1IX
J
i
1
-r •a
1
t U x-v
[[
l
Classifiedhouseholdsof
onefemaleadultand:—
Noother(bothunder
i child
2
children
3
children
4
ormorechildren
adolescentsonly
adolescentsandchildrc
'
Averageallhouseholds
]

8o Domestic Food Consumption and Expenditure, 1956
TABLE 45
Expenditure on Main Foods by Household Composition Groups and Social Class, 1956(pence per person per week}
Classified households with one male and one femalt adult ana
Social Class A (A i & A 2)
no other(bothunder 55)
childa
children children4
or morechildren
adoles~emuonly
ailtrnrcM
MUk, liquid, retail ...Milk, liquid, welfare .... 40-41 35-3°
0-46 I -So29-042-29
29-23 22-142-31
36-37o 08
'»2-21 o
All Liquid Milk 4<>-«7
1-59
37-10 3' -33 3' -44 24-45 36-4S »»
Milk, condensed .....Milk, dried and other ....Cream ....... 1-43
0-69I -080-61r-32
i -421-79'•°'
0-891-85o- 10
1-450-40i-45
i0-21 0
3-90 2-51 I
Total Milk and Cream .... 4J-J7 4' -73 34-34 35-66 i 27-29 39-75 3'
Cheese (natural) .....Cheese (processed and packeted)
9-461-40
5-901-21
5-691-30
4-17 3-37 6-511-38 0-53 2-19
60
Total Cheese ...... 10-86 J- 12 «'99 5-55 3'«o 8-70 7'
Butter .......Margarine . . ...Lara and compound cooking fatsOther fats ..... 21 •505-803-001-54 17-07
5-052-680-84
12-585-252- 220-62
12-254-852-230-34
8-625-641-58
18-705 812-882-79
12'5'
0-632<O'
Total Fau .... 31-84 if- 64 20-67 lytj , 16-41 \ 30-18 11-
Eggs 27-72 23-78 18-36 15-39 12-98 23-49 16-
Carcase meat ......Bacon and ham, uncookedAll other meat ..... 78-86 57-01
16-6735-07
45-13 37-60I3-58 12-0224-18 21-10
24-38 63-669-65 16-8031-26 42-44
47-12-22-12
45-82 29-
Total Meat ...... 146-10 108-75 Si -If. ! 70-72 i 55-29 in -go If-
Fresh fishAll other fish ...... 13-39 "'OS 8-00
3-848-633-72
5-05 10-493-81 6-53
«;6-48 1 4-85
Total Fish ">'«7 IS- ill 11-84 72-35 i 8-S6 1-/-02 ifSugar .......Preterves ...... 11-185-37 9-41
4-578-744-67
8-24 8-513-69
10*46 8-4'4-08 4-55
Total Sugar and Preserves 16-55 '3-98 13-41 11-31 i a -20 15-07 '}•
Potatoes . ....Fresh green vegetables ....Other vegetables ..... ir -5613-0415-88 10-87
8-3313-45
9-507-029-80
8-505-379 '87
10-093-887-50
14-389-0413-36
5'9'
Total Vegetables 40-48 32-65 26-32 33-74 21 '47 3° -7* 34-
Fresh fruitOther fruit
36-1620-14
27-44l6-r8
22-8210-18
18-4010-35
12-64 30-135-29 13-23
23-9'
Total Fruit .... 56-30 43-61 33-00 2* -75 '7-93 43-36 33'
Brown bread ......White bread ......Wholewheat and wholemeal breadOther bread ...... 1-79
11-831-764'33
x -20 0-989-680-95I-ll
1-299-801-041-69
0-9313-070-152-15
0-9615-07I'll
I •u-o-
II -00r-262-80 2-39 2-
Total Bread ...... Ifjl 16-26 '3-4' 13- S3 16-30 19-60 'T.3-.Flour .......
CakesBiscuits .....Oatmeal and oat productsBreakfast cereals .....Other cereals......
4-70 4-07 >'*S 3-60 2-186-007-02
3-85"•49"•230-433-713-95
13-6514-340-772-435-8l
10-95JI-520-803-025-14
7-98 7-769-070-914-274-74
IO-.9-77I -023-72
6-10-744-892-90
I :3 <
4-82 3-;
Total Cereals ..... 61-41 51-7* 43-98 43-'? 40-03 53~*6 4*-<
TeaCoffeeCocoa .... . .Branded food drinks .... 18-487-050-26J-44 13-82
5-270-971-08
10-11 8-882-86o- 50
9-34l -06o-540-34
16-51 ;4-850-94I-IJ
II-J3-350-630-73
s-«01
0-23 o-j
Total Beverages ..... »7 ' *.? 11-14 14-81 11-47 11-18 33-43 '5-S
Miscellaneous ...... 12-30 9-28 7-89 8 61 5-86 9-34 6-J
Total Food Expenditure .... 490-94s. d.(41 S)
395 -31i. d.(32 11)
3t3-45t. d.
'88-43s. d.(14 o)
133-47i. d.
422 •10i. d.(35 2)
I'l '9s. t
(»6 I) ('9 5) (»«

Family Composition and Social Class 81
TABLE 45 continued
(pence per person per week)
Social Class B Social Clouts C & Di
Classified households with one male and ont female adult and
XTchild MU- dkJW- or more
children
adoles-ctntsonly
adolescentsandchildren
no other(bothunder 55)
child children
childrenren
4or morechildren
adoles-ctnuonly
adoles-centsandchildren«)| ren rffrt
(5 29-321-75
24-612-33
21-652-46
16-472-68
33-780-04
26-910-58
36-64 27-63 22-32 17-19 11-13 33-31 23 -ito-3»17
S-- 30-97 26-94 24-11
I -01
'9- *f 33-Sa '7-49 36-85 29-40 24-75 19-67 13-80 J3-31
1-56
0-61
23-76
)7>41-420-660-90
1-28I-I50-46
0-74 1-310-06I'll
1-480-090-53
1-53 I-JO 1-050-86o-54
0-690-37
0-820-49
i -140-090-40
0-74 0-820-18
o- 101-62
I -OO0-72Jl 0-33 0-27 O- 11
H 33-95 »9-«3 26-19 20 -*9 36-34 29-59 40-10 35-4^ 25-39
68455-56 4-87
1-143-70 3-46
0-946-54 5-45
1-367-59i-77
5-311-44
4-321-33
3-750-79
3-490-99
5-88I -60
4-701-25'•58 I -OI i-77
'3
V
7-14 , 6-01 4-71 4-4° S-31 6-«l 9-36 6-75 5-65 4-54 4-4* 7-4* 5-95
4813 755 733-040-65
10-675-742-560-67
9-176-132-340-64
6-086-811-99I -02
16-426-852-980-76
10-337-502-820-68
18-665-933-51I -OI
12-615-862-870-60
9-496-042-560-67
6-796-132-000-61
4-656-711-490-43
14-527-072-610-59
8-007-»i2-34o-6x
S395
56
64
23-17 19-64 18-28 15-90 27 -01 21-33 29-11 21-94 zS-76 15-53 13-28 24-79 i«-7«
19-67 16-81 15-50 13-28 21-21 17-03 22-70 17-92 15-23 11-98 10-84 19-19 14-51
«9 48-9816-1629-74
38-5I 30-8610-4422-46
25-088-1717-69
60-9220-7533-69
39-8112-8924-66
67-34 46-35 34-1111-0923-55
28-60 21-977-2114-59
54-1617-1035-21
34-0311-8730
3812-10 20-43 j I3-9I
40-51 29-097-9517-7522-61 24-79
*7 94-88 73-22 63-76 50 •94 115-36 77-3< 128-28 S» -35 64-75 54-30 43-77 106-47 70-69
29 7-166-47
5-694-40
5 -064-15
4-003-03
8-559-00
6-51 9-527-31
6-325-28
5-424-30
3-623-24
2-942-34
8-995-60
5-034-7265 4-65
9-f '3 -*J 10-09 9-21 7-03 17-55ji- 16 16 -83 11-60 ' 9-72 6-S6 5-2* '4-59 9-75
•I 9 -2}4-05
8-913-75
8-603-79
8-513-46
9-525-25
9-18 10-743-85
9-833-28
9-063-55
7-653-63
7-763-15
10-334-n
9-513-7355 4-20
5* *3- JO 12-66 12-39 11-97 '4-77 13 -J« '4-59 13-11 12-61 11-38 10-91 *4'44 13-24
259114-027-2112-40
12-995-39
12-464-539-20
13-213-178-66
14-947-9812-95
13-385-36
14-529-7614-32
I3-385-9611-67
11-533-978-93
14-133-098-98
11-921-787-88
'3-306-4610-89
14-043-609-3222 IO- II 10-09
3> 33-63 '8-49 26-19 25-04 35-87 28-83 3«-6o 31-01 24-43 26-20 21-58 30 -is 26-96S: 20-6611-42
16-568-25
13-767-23
9-454-78
23-5512-26
16-70 23-44II •1017-129-65
13-I97-16
9-595-31
5-743-76
'0-379-50
12-705-72IL 7-71
•0 32 -OH a*-*/ 20-99 14-33 35 'Si 24-4' 34-62 26-77 20-35 14-90 9-50 2»-«7 18-42
16564442
0-89 0-6613-480-451-73
0-4314-060-561-64
0-6815-00
I -06i7-«70-932-30
0-6817-180-251-76
0-8217-461-313-33
0-7615-730-502-OI
0-5014-090-23i-57
0-4714-240-431-27
0-2517-23
0-6518-610-742-23
0-5018-600-361-75
14 -Rl0-671-98
0-20I -10
O-221-05
J* iS-35 16-32 16-69 16-9*
\\\21-96 19 -«7 22-92 19-00 16-39 16-41 18-75 22-23 21-21
«9 3-50n-aj 3-108-929-290-893-364-31
3-137-897-560-743-693-77
3-9714-25
3-20 3-9214-4112•IO0-92
3-1810-399-690-872-933-94
a-859-218-40o-8r3-403-51
2-647-056-880-752-733-22
a-155-565-18i-432-93
3-4513-609-680-672-513-17
2-7305'3696554
9-12 7-9010-740-822-704-26
7-071-184-082-52
HII 7-64 7-oi0-980-73
2-834-05
0-803-662-97
2-59 j:a4-48 2-10
J3 51-62 46-19 43-47 40-06 5* -90 47 -»6 61-34 50-00 44-63 39 -68 38-Og 55-3' 45-94
S"87SI
14-21 11-131-650-590-54
9-68 8-770-810-570-32
16-342-670-720-74
12-37i-580-75o- 50
18-523-00o-57I '93
M'491-840-670-95
"•351-320-720-53
9-560-830-34o- 29
7-810-650-340-27
16-462-820-781-03
n-881-310-550-24
2-130-481-07
I •120-640-47
13 1T91 13-9' ri -91 10-47 20-47 15-20 24-04 '7-95 13-92 11-22 9-07 21- 09 I3-98
36 9-02 7-57 6-25 4-93 7-61 6-53 8-78 8-00 6-35 4-98 3-80 7-17 5-15
f Tl 289-16 158-83s. d.(21 7)
219 -15s. d.(.18 J)
399-20S. d.(3? 3)
20S-91s. d.('4 ")
428-3]s. d.(35 8)
327-06s. d.
267 -60i. d.
222-49 185-78i. d,(.15 6)
365-65s. d.(30 6)
264-79i. a.J. J. I. d.
7) («» »> (2* 1) (27 3) (22 4) (IS «) (22 5)

82 Domestic Food Consumption and Expenditure, 1956
TABLE 46
Quantities of Food obtained for consumption by Household Composition Groups and SocialClass
(ounces per person per week (a))
no other ' i ' i 3(both child ' children childrenunder is) '
Classified houteholds with oni male and one female adult and
Social Class A (Ai & Ai)
4or martchildren
adolescentsonly
O4
Milk, liquid, retail .... (ft.)Milk, liquid, welfare and school . (pt •
5-45 4-630-25 1-09
3-96 4-081-63
3-ia 4 9«0-07
c*mci
1-57 1-98
All Liquid Millt .... (ft.) 3-70
0-18
i-7* i-53 S'7> 5-.ro 1-03
Milk, condensed . . • (eq. pt. ;Milk, dried and other . (pt. or eq. pt.)Cream (pt.)
o- 16o- 160-03
0-12O-2O0-01
o- 160-30o-ox
O-10 0-18o-oxO-OI 0-71
0-05 O-O2 1
Total MM and Cnam . (pt. or eq. ft.) S-94 6 •07 5'*7 6-18 ( s~9* 5-*4
Cheete, (natural)Cheese (processed and packeted)
3-720-40
2-430-31
2-37 1-72 1-430-15
2-720-730-37 0-44
Total Chtete ...... 4-11 2-76 '•74 2-16 ffo 3-43•
Butter .......Margarine .....Lard and compound cooking fatOther fata
7-534-092-19
6-013-661-990-56
4-613-841-66o-37
4-363-471-67
3-044-401-290-54
6-63 1
4'si2-18 i•O-ll 0-27 1-38
Total Fau 14-62 13-22 10-48 , 9-77 9-27 14-43 n
Egg, (No.) 6-»2 5-43 4-73 3-88 2-95 5-«3 4
Carcase meat ......Bacon and ham, uncookedAll other meat ..... 27-526-7615-31 20-60
5-3412-43
17-074-339-39
13-993-028-07
IO-OI 24-24 rj3-5710-26
5-94 <14-08 ii
Total Mtat ...... 49-59 3* -37 30-81 2, -88 '3->4 44 •»« J<
Fresh fishAll other fish
6-411-59
5-331-26
3-981-26
3-901-28
2-85'•57
6 -021-89
41
Total Fish 8-00 6-59 5-24 5-'* 4-4' 7-or 3
Sugar .......Preserves ...... 20 '844'34 17-02
4-1616-434-33
I6-I23 69
16-713-20
19-984-06
z«4
Total Sugar and Prettrvtl 13-18 11-98 10-76 19-81 /9-9r •4-04 10
Potatoes . ....Fresh green vegetables ....Other vegetables ..... 48-0821-2822-12 52-07
16- 1218-59
44-1115-3415-26
41-009-9413-74
50-4211-7112-98
32-83 4518-92«9'37
1216
Total Vegetables ..... 9I-4S S6-J8 74-71 64-68 73-11 91-14 74
Fresh fruitOther fruit
37-46 30-3510-55
26-70 22-617-09 6-89
16-074-12
33-949-46
26113-55
Total Fruit ...... SI-OI 40-90 33-79 29-50 ao- 19 43-4° 34
Brown bread ......White bread ......Wholewheat and wholemeal breadOther bread ...... 4-77
32-473-385-95
3-3031-402-403-59
2-7J27-86i -80
3-8029-022-07I -80
2-5736-32
a 6345-172-573-20
a
0-2037o
2-22 3-60 •
Total Brtad ...... 46-57 40-69 34-60 36-69 42-69 S3-S7 44
10-496-637-590-981-554-44
9-265-616-230-881-793-58
7-384-025-36
5-984-145-i6I •122-733-62
4-983-754-640-893-282-44
8-845-976 390-421-762-90
t3
BiscuitsOatmeal and oat productsBreakfast cereals ....Other cereals ...••• 1-27 ?
2-313-59
•2
Total Certo.lt •Ji -25 61-04 5* '53 39-44 62-67 79 -8j «9
3-051-090-080-36
2-830-640-36
2-070-440-22
1-770-430-260-06
a -020 18
3-180-610-330-31
ICoffee ....-••Cocoa .... • •Brarded food drirka .
0-20O-O9
0
0-27 o 18o0
}-II 4-70 3-gi 2- $2 '•49 4-43 3
(a) except pints (or equivalent pints) of milk and cream and numbers of eggs.

Family Composition and Social Class
TABLE 46 continued
(ounces per person per week (a))
Social Class B Social Claim C & Di
Classified households with one male and one female adult andi X adoles
cent!only
adolescentsandchildren
no other(bothunder}!)
child children
4or tnortchildren
\ child .-AiVJ-rt- n
child- or morer*n children
children
a
3-95\ l-ll I'll 2 •2O
2-074 -600-06
3-77o-74
5-090-13
3-881-14
3-32I -61
a -591-84
1-762-13\ 1-13
J- JO 4-99 4-66
0-16
4-5* 5-22
0-19
5-o> 4-93 4-43 3'*9
\ 1 0-J5 I 0-160-16 / o- 19
]_J o-oi o-or1 0- T2 0-10
O-2Oo- 180-03
0-170-28
0-130-26
0-08o-ao
O-II0--X7 0-28O-OI O-O2 O'OI 0-02 O-OI O-OI
•~iO"** 5 "3S 3-19 4-57 4-84 4-73 5-43 5-4* 5-33 4-7i 4-*S
•'
2-35 I 2-1°^^0-44 0-32
1-63o - 30
I -50o- 28
2-740-52
2-340-40
3-300-51
2-260-46
1-86o-39
1-620-23
1-56O-29
. »"79 »•** 1-93 1-78 3-36 3'Sr 1-85 i-85
4'954-19
\ a "39
V 0-49
3-934-28
3-2*
0-55
2 -19 5-884-92
3-775-48
6-644-3'2-70
4-544-422- 300-48
3-494-532-OJ0-56
2-474-691-640-53
1-725-47l-ao0-43
2 -01
5 -30I -590-86 0-66
2-220-76o- 56 o-55
12-02 ZO-78 10-19 9-94 13-*7 J2-O2 14-41 11-74 1O-61 9-33 S-Ss
4-56 3-98 3-7* 3-16 4-96 4-25 5-33 4-18 3-82 3-07 2-66
\l9-25 : 15-665-42 4-1513-54
3 -689-32
I I -392-918-61
23-426-9012-49
I5-87 25-876-7215-06
18-964-75II'll
13-753-809-88
12-342-818-37
10-562-677-16
. ; "-6s 9-324-5710-37
. 3« -3' 39-I3 35-5-t aa-9l 4'-*i 30-81 47-65 35 -62 IT 43 2J-52 30-39
3-41 3 - 02 a-38 4-762-56
3.971-57
5-35 3-801-78
3-331-52
2-291-23
1-730-92__J 2-12 1-45 I - 54 I - 22 2 -II
~-^?-J' i 4-86
\ + -S6 .3 - 60 7-32 5-54 7-46 \ 3-52 2-65
^Bl<^,-34
17-173-45 *S:S5 *3-«°
18-354-97
17-644-01
20-513-34
19-022-89
17-493-39
I4-853-23
15-15
20-63 »o-*«> X9-94 »3'3» 21-65 '3-85 11-91 10-88 18-08 18-39
S8-3712-19IS-7I
61 -388-6214-72
63-3217-6920- 19
63-0614-1316-10
63-2019-3521-59
61-8714-5118-24II -0614-64
60-697-2913-89
59-49
^5-07^J*9'41
9 -70 6-2213-48
~8S-98 8*-7* JOJ-2O 93 -'9 104-14 94-62 S5-53 81-87 79-19
23 -O6 l8-796-0415-88 4-08
25-698-98
19-596-00
24-717-86
19-076-96
15-20 10-934-00
6-263-18s -73 5-41
^7/-»o"~15-79 3*'«7 25-59 32-57 «<-03 20-61 14-93 9-44
1-76i-95 2-79
50-871-792-59
1-8350-240-461-95
2-1850-842-444-33
2-0546-610-982-61
1-36 1-2943-110-871-53
0-7051-100-391-23
2-2742-011-32
38 120-89*° • xyz- 10
0-39i-45
41-700-451-85
1 2 5647 -'5 58-04 54-4* 50-79 51-15 45-36 46-80 53-4'
7.065-09 1 V-U 3-61
4-311-542-672-30
9-017-726-330-921-853-30
7-295-294-71
8-73 7-27 6-58 6-144-154-231-031-772-75
4-963-543-361-841-981-96
7-956-i76-xao-991-65
1-05a-iS3-3*
4 - 54o-95
1 2-3°
I -012-392-58
8-256-971-18
I -693-67
5-785-781-071-913-14
5-275-091-082-142-88
J_ ~67-67 67 -oo 87-17 77-75 90-2 8 77-20 68-40 ««-«7 77-06
3^3^
n £? 1-99I 0-14
3-3' 2-650-260-260-13
3-840-45o- 200-49
3-08o- 290-24
2-460-230-25o- 14
2 • II 1-880-142-93
, E:S
I 0-21
| 0-08
o-450-27
o- 19O-II
/ S-?i i \ °-i O-2O 0-27o- 190-08 0-05
/ o-a5 •--\ rrrr »•«« 4-23 3-30 4-98 3-88 3-08 '•57 2-18 \

84 Domestic Food Consumption and Expenditure, 1956
confirm the significance of these departures from linearity, which differ somewhatfrom those found in 1955, when the increment for the first child was smaller in thehighest income group than in the others.
131. Details of expenditure on and consumption of the main foods by each of theseven types of household in each of the three broad classes are given in Tables45 and 46. Differences associated with family size were in general greater thanthose attributable to social class; indeed, Classes B and C & Di had very similardiets, and class effects became marked only in Class A. For most foods, expenditureand consumption per head decreased with increasing family size in all classes, theprincipal exceptions being bread, margarine, potatoes, preserves, oatmeal andother breakfast cereals, for which consumption per head tended to increase withfamily size, at least in the larger households. For several of these foods, the averageconsumption at first fell off with the addition of children, because of their smaller
TABLE 47
Energy Value and Nutrient Content of the DietHouseholds of Different Composition within Social Classes, 1956(3)
Class
Unit! ofintakeperpersonper day
no other
(bothunder 5s]
Households with one male and one female adult and
children onlyadolescentsonly
adolescents andchildrenI a 3 4 or
more
Energy value . A Cat. 3,096 2,666 2,328 2,227 2,177 2,925 3,473B 3,226 2,675 2,397 2,316 2,194 2,971 3,568C& Di 3,'4i 2,671 2,373 2,150 2,097 2,905 3,505
Total protein . A 8- 9i 78 69 65 63 85 73B 94 78 69 66 61 87 7*C&Di 92 78 67 61 59 84 70
Animal protein A 8- 57 48 42 39 35 50 43B 54 45 39 3« 31 49 39C& Di 53 44 38 32 28 47 35
Fat A 8- 140 1X6 IOO 93 85 128 104B 138 113 97 89 83 126 103C&Di 135 109 94 82 74 lit 94
Carbohydrate . A g. 368 326 288 283 191 359 3X2B 402 339 312 3>3 301 374 338C&Di 39° 345 313 292 300 376 343
Calcium . A rug. 1,227 1,116 1,029 1,020 991 1,128 1,032B 1,221 1,074 999 95S 880 1,099 994C&Di 1,198 1,080 99 886 854 1,080 917
Iron A mg. 16-2 14-0 I -9 11-3 II •X 15-0 l*-tB I7-S 13-7 I -0 II-6 10-7 15-6 13-3C& Di 16-8 13-7 I '4 1O- 1 IO- 1 14-7 xa-3
Vitamin A A i.u. 5,858 5,005 4,41 3,901 3,797 5,282 4,498B 5,715 4,722 3,97 3,756 3,321 4,850 4,20C&Dl 5,32 4,593 3,71 3,195 2,657 4,726 3,77
Vitamin B, A mg. •48 •27 •08 •01 I '01 1-35 •«4B •53 •25 •10 •OI o-97 1-39 •16C&Di •46 •23 •06 •95 0'9i '•34 •II
Riboflavin A mg. •04 •82 •63 •57 1-48 1-82 •61
B •05 •74 •55 •47 1-32 x-77 •54C&Di •95 •73 •51 •33 I -19 1-76 •40
Nicotinic acid . A mg. 16-5 I3-4 I '4 10-7 10-4 15-3 12-2B 16-9 13-6 I -4 II -O IO- 1 I5'4 12- 1
C& Di 16-1 13-2 I -2 10-8 9-4 I4'7 n-7Vitamin C A mg. 68 61 5 46 41 61 50
B 67 55 48 45 40 56 49C& Di 60 52 44 39 33 51 43
Vitamin D A i.u. 175 '59 146 150 197 154 141B 162 160 148 »53 138 167 149C&Di 157 164 150 130 138 158 140
fa) The numbers of household* and persons to which these figures refer are shown in Appendix A, Table 3.

Family Composition and Social Class 85
needs, but rose again in the larger families, because of their greater dependence onthe cheaper commodities. The higher the income, the larger the family size at whichthis upward turn occurred. Thus, margarine exhibited a minimum at the third childin Class A but increased fairly uniformly with family size in the lower income groups.For potatoes, the minimum was also at the third child in Class A, but in B andC & Di, it occurred at the second child with a slight downward turn at the fourth.The decrease in the largest families is associated with increased dependence onbread rather than potatoes as a source of energy, and is not found in Class A.The average bread consumption was lowest for two-child families in all classes,though in Class A the minimum shifted to the third child in the last quarterof the year, after bread was decontrolled. An indication of the effect of the measureon large families of small means is that in Classes C & Di bread consumption perhead during the fourth quarter was lowest in families with four or more children,although it remained their most important single source of energy.
TABLE 48
Households of Different Composition within Social Classes, 1956Comparison of Energy Value and Nutrient Content of theDiet with Allowances based on the British Medical
Association's Recommendations
(per cent)
Households with one male and one female adult and
Class other
(bothunder 55)
nochildren only
adoles
cents
only
adoles
cents andchildreni 2 3
4ormore
Energy value . A 121 114 I07 104 106 109 96B 121 112 «°5 103 IOO 106 97C&Di 114 108 102 97 97 IOI 94
Total Protein . A 128 "3 103 97 95 i°3 88
B 127 109 98 93 87 IOI 86
C&Di 120 106 95 8? 85 94 81
Calcium A 144 i'7 108 103 IOO "5 98B 144 U5 IOI 94 85 no 93C&Di 139 "3 101 8? 82 106 85
Iron A 131 119 109 104 107 III 99B 141 117 106 l°5 99 114 102
C&Di '33 116 IOI 92 94 106 94Vitamin A A 228 218 213 '95 205 205 205
B 222 207 186 186 171 191 191C&Di 204 199 174 156 138 182 171
Vitamin B, A 147 138 127 119 126 126 inB M5 13* 121 "3 H3 124 noC&Di '34 126 116 108 107 116 104
Riboflavin A 132 127 H3 120 118 in 103B 128 119 III 108 99 104 96C&Di 118 "5 107 98 90 IOO 86
Nicotinic acid . A 163 M5 133 127 129 141 119
B 160 144 126 124 117 '37 "5C&Di M7 135 123 123 109 127 109
Vitamin C A 3i8 288 264 230 2IO 250 207B 317 266 231 219 I96 228 202
C&Di 278 244 216 191 162 203 I76

86 Domestic Food Consumption and Expenditure, 1956
132. Table 47 gives the energy value and nutrient content of the diets of theseven household types within the three broad classes, and Table 48 expresses thesevalues as percentages of the recommended allowances, with the usual 10 per centdeduction to allow for plate losses and food given to pets or otherwise wasted.Although there is little evidence on the variation in wastage in different types ofhousehold it seems probable that the larger families waste less than 10 per centof their food and it is considered that no particular remark need be made on anysub-group of such families whose intake is estimated as not less than 95 per centof the recommended allowances. Only one of the sub-groups shown in Table 48,namely families with children and adolescents in Classes C & Di, fell slightlybelow 95 per cent in energy value. Most of the sub-groups in Classes Ai and Diare too small to support a detailed nutritional analysis, although the results confirmthe general gradient, nearly all household groups in Class Ai having a more abundant diet than comparable ones in A2, while most sub-groups in Class Di faredless well than corresponding households in Class C.
133. Table 48 indicates that the relative nutritive value of the diet tended toincrease with increasing income within each type of household, although the energyvalue and the absolute intakes of protein, iron, vitamin Bt and nicotinic acid shownin Table 47, were in several cases higher in Class B than in A, since the latter contained fewer adults engaged in manual work and thus had lower average requirements ofenergy, protein and the vitamins of the B complex. In all types of household,the Class A diet was characterized by high intakes of animal protein and vitamins Aand C and low intake of carbohydrate. The vitamin D estimates were somewhatirregular, as might be expected for a nutrient obtained from comparatively fewsources, not all of which are included in the Survey.
134. In families with not more than two children or with adolescents but nochildren, class effects were relatively small, the differences in intakes betweenClass A and Classes C & Di being less than 10 per cent except for vitamins A and C.In the larger families with three or more children or with children and adolescentsthe range of class difference was greater, especially for calcium (i i to 14 per cent),riboflavin, animal protein and vitamin C (all between 13 and 20 per cent) and vitaminA (16 to 30 per cent). Class differences were accentuated in the larger familiesbecause nutrient intake fell off with increasing family size more steeply in ClassesC & Di than in Class A.
135. In families with four or more children, the household diet provided 95 percent of the recommended allowance of protein in Class A, 87 per cent in Class Band 85 per cent in C & Di, exactly the same as in 1955. For calcium, the percentagesin 1956 were 100 in Class A, 85 in B and 8z in C & Di, compared with 95, 85 and83 in 1955. The slight narrowing of differences in energy value (106, 100 and 97 percent in 1956 compared with 108, 99 and 95 in 1955) was not reflected in eithercalcium or protein. In families with three children, the protein proportions were
93 per cent in Class B and 87 per cent in C & Di, compared with 95 and 90 in 1955-For calcium the corresponding figures were 94 per cent in B and 87 in C & Dicompared with 94 and 88 in 1955. In the small sample of households in Class Di
(not shown separately) the values were below 95 per cent even for two-child familiesin both years; the largest families of this group obtained only 75 per cent of theirestimated allowances of protein and 69 per cent of those of calcium.
136. Table 49 shows that the consumption ofmany foods of animal origin, includingmilk, was substantially higher in Class A than in other classes, especially for families
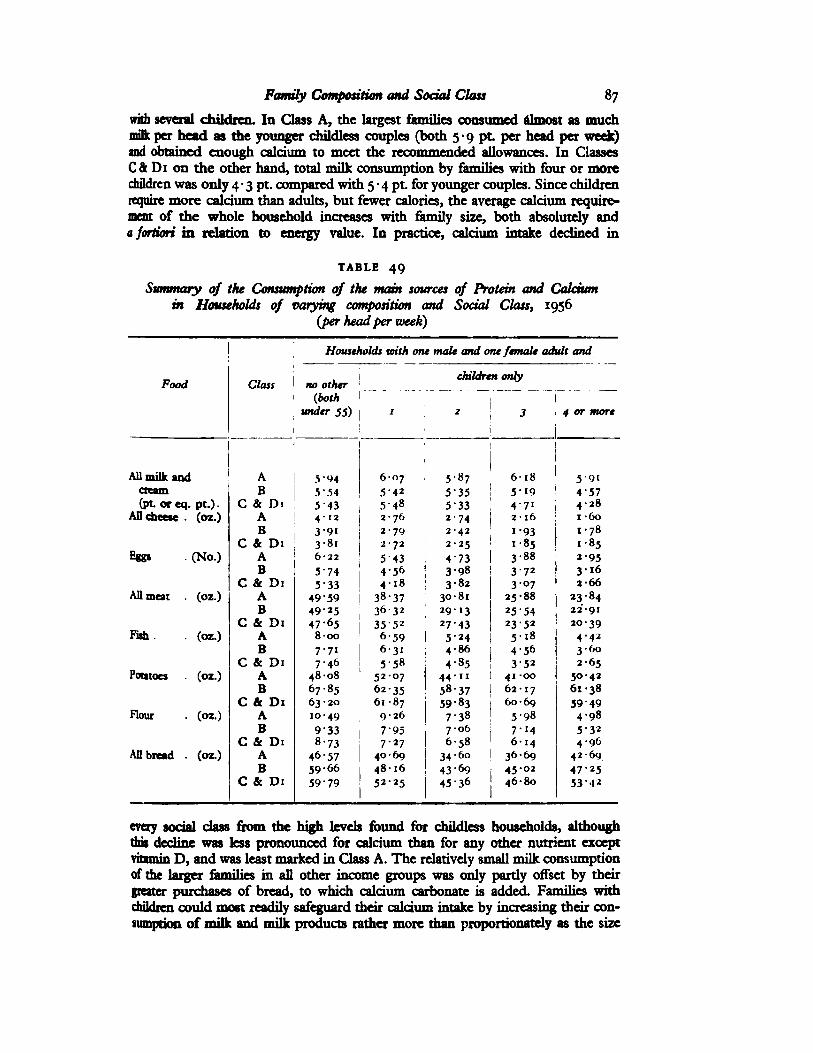
Family Composition and Social Class 87
with several children. In Class A, the largest families consumed almost as muchmilk per head as the younger childless couples (both 5-9 pt. per head per week)and obtained enough calcium to meet the recommended allowances. In ClassesC & Di on the other hand, total milk consumption by families with four or morechildren was only 4 •3 pt. compared with 5 •4 pt. for younger couples. Since childrenrequire more calcium than adults, but fewer calories, the average calcium requirement of the whole household increases with family size, both absolutely anda fortiori in relation to energy value. In practice, calcium intake declined in
TABLE 49
Summary of the Consumption of the main sources of Protein and Calciumin Households of varying composition and Social Class, 1956
(per head per week)
Households with one male and one female adult and
Food Class no other
(bothunder 55) i
children only
' 4 or more
All milk and A 5-94 6-07 5-87 6-18 5-91cream B 5'54 5-42 5-35 5-19 4-57(pt. or eq. pt.) . C & Di 5'43 5-48 5-33 4-7i 4-28All cheese . (oz.) A 4-12 2-76 2-74 2-16 I -60
B 3-91 2-79 2-42 1-93 1-78C & Di 3-81 2-72 2-25 1-85 1-85
Egg* - (No.) A 6-22 5-43 4-73 3-88 2-95B 5'74 4-56 3-98 3-72 3-16
C & Di 5-33 4-18 3-82 3-°7 2-66All meat . (oz.) A 49-59 38-37 30-81 25-88 23-84
B 49-25 36-32 29-13 25-54 22"-9IC & Di 47-65 35-52 27-43 23-52 20-39
Fish . . (oz.) A 8-00 6-59 5-24 5-18 4-42B 7-71 6-31 4-86 4-56 3-60C & Di 7-46 5-58 4-85 3-52 2-65
Potatoes . (oz.) A 48-08 52-07 44-11 41 -oo 50-42B 67-85 62-35 58-37 62-17 61-38C & Di 63-20 61-87 59-83 60-69 59-49
Rour . (oz.) A 10-49 9-26 7-38 5-98 4-98B 9'33 7-95 7-06 7-14 5-32C & Di 8-73 7-27 6-58 6-14 4-96
All bread . (oz.) A 46-57 40-69 34-60 36-69 42-69B 59-66 48-16 43-69 45-02 47-25C & Di 59-79 52-25 45-36 46-80 53-42
1
every social class from the high levels found for childless households, althoughthis decline was less pronounced for calcium than for any other nutrient exceptvitamin D, and was least marked in Class A. The relatively small milk consumptionof the larger families in all other income groups was only partly offset by theirgreater purchases of bread, to which calcium carbonate is added. Families withchildren could most readily safeguard their calcium intake by increasing their con
sumption of milk and milk products rather more than proportionately as the size

88 Domestic Food Consumption and Expenditure, 1956
of the family increases. Table 50 shows, however, that in 1956 expenditure per headon milk and cheese decreased so steeply with family size at all income levels thateven the provision of cheap or free welfare and school milk did not suffice to maintainconsumption.
137. The pattern of protein intake expressed as a percentage of the recommendedallowances broadly resembled that found for calcium, though both class and household composition differences were somewhat smaller. The reasons for the lowpercentage for both nutrients in households with several children were basicallythe same—the pattern of the diet in large families varied comparatively little from
TABLE 50
Summary of the Expenditure on the Main Sources of Protein and Calciumin Households of varying composition and Social Class, 1956
(pence per head per week)
Households with one male and one female adult and
children onlyFood Class no other
(bothunder 55) i 2 3 4 or more
All milk and A 45 '57 l'-73 34-34 35-66 27-29cream . B 41-54 33-95 29-83 26 •19 20-89
C & Di 40-10 32-62 27'20 21-00 15-22All cheese A i o •86 7-12 6-99 5-55 3-80
B 10-13 7-14 fa-oi 4-71 4-40C & Di 9-36 6-75 5-56 4-54 4'48
Eggs . . A -27-72 23-78 18-36 15-39 | 12-98B 25-64 19-67 16-81 15
' 5° 13-28C & Di 22-70 17-92 15-23 11 -98 10-84
All meat . . A i 46 •80 108-75 81-89 70-72 55' -29
B!135-87 94-88 73-22 63-76 5"-94
C & Di 128-28 «9-35 68-75 54-3° 43-77Fish A 19-87 15-88 , 11-84 iz-35 8-86
B 18-94 13-63 j 10-09 <)-2I 7-03C & Di 16-83 II -60 9-72 6-86 5-28
Potatoes . . A 11 •56 10-87 , 9-5° 8-50 10-09B 15-25 14-02 - 12-99 12 •4(1 I 3
' - IC & Di 14-52 I3-38 n-53 14-13 11-9-
Flour . . A 4-70 4 '"7 3-25 2-00 2-l8B 4-09 3-50 3-i° 3-i3 -i'35
C & Di 3-92 3-18 2-85 2-64 2-15All bread . A 19-71 I(>-26 13-42 13-82 16-30
B 23-58 i8-35 16-32 16-69 16-98C & Di 22MJ2 19-00 16-39 16-41 18-75
that in adult households, and in any event the variation was in the wrong direction,in that they consumed relatively less of the foods rich in protein and calcium.The Committee on Nutrition of the British Medical Association considered that,although it was sufficient for adults not engaged in hard work to obtain n percent of their calories in the form of protein of a mixed diet, infants, children andadolescents and pregnant and nursing mothers should consume relatively more
protein —14 per cent of the energy value of the diet was suggested. In fact nogroup of households obtained more than 12 per cent of its energy from protein, and

Family Composition and Social Class 89
the percentage decreased slightly with family size instead of rising, the decreasebeing very marked for animal protein, but not for vegetable protein, because ofthe larger families' greater dependence on cereal foods. Tables 49 and 50 showthat average expenditure on, and consumption of the "main dish" animal proteinfoods in the largest families was in general less than half of that in childless two-adult households of the same class. It is noteworthy that the downward trend forcheese (an excellent source of calcium as well as protein) was about as steep as thatfor meat, and in Class A even steeper, as in 1955. To suggest reasons for therelative unacceptability of cheese in families containing several children, even(indeed especially) in those with well-to-do parents, is not within the scope of thisReport, but further research on this subject might make it possible to bring aboutthe change in the pattern of the diet referred to in paragraph 127 above at littlecost to parents.
138. The energy value of the diet of families containing adolescents as well aschildren was not in excess of their estimated needs, even in Class A, and since theallowances recommended for protein are related to those for calories, the proteinpercentages were lower for this group than for any other. The lowest value foundfor protein in this or any type of household was 81 per cent in Classes C & Di compared with 83 in 1955. The corresponding percentage for Class B was unchangedat 86. The Class A percentage declined from 96 to 88, partly because of a fall inconsumption of liquid milk from 5 •6 to 5 •2 pt. per head per week.
139. Of the other nutrients, iron was below 95 per cent in families with three orfour or more children or with children and adolescents in Classes C and Di(respectively 92, 94 and 94 per cent, compared with TOO, 93 and 96 in 1955). The
riboflavin percentages in the same three sub-groups were 98, 90 and 86 per centin 1956 compared with 98, 91 and 86 in 1955. Riboflavin has a fairly marked classgradient in all types of household, and even in Class B the percentage was only 99in families with four or more children and 96 in those with both children and adolescents. The values for the other B vitamins were in most cases well above those foundfor riboflavin, the smallest percentage being 104 for vitamin B! in families wichchildren and adolescencs in Classes C & Di. Nicotinic acid was marginal onlyin the largest households of Class Di.
140. In general, the nutritional position of Class A households was relativelyand absolutely nearer to other classes in 1956 than in 1955, especially for childless
couples (who, however, were still ahead of any other sub-group) and for familieswith adolescents and children. Class B households fared rather better than in theprevious year; the changes were small and rarely significant, but mostly upwards.In Classes C & Di, however, there were more decreases than increases. Of thesub-groups with protein or calcium percentages of 90 or less in 1955, none exhibitedany improvement and most showed small decreases.
Ml. It has already been suggested that there may be variations in wastage indifferent types of household. On the one hand, it would appear possible that thelarger families may need to exercise more economy in their use of food, and on theother, it seems unreasonable to assume that the smaller households waste only 10per cent of their food purchases and are, in fact, consuming increasing amounts offood each year without either marked increases in their activity or in their body-weight. There is no evidence that such increases have taken place. In view of this,calculations were made in Table 51 on the adequacy of the diets using arbitrarygraduated adjustments for wastage for different sizes of household, irrespective of

9° Domestic Food Consumption and Expenditure, 1956
class. These percentage allowances were as follows: 20, 15 and 10 respectively forhouseholds with no child, with one and with two children; 10 for households withadolescents only, since, in size, these are most similar to households with 2 children;and 5 for households with 3 and with 4 or more children and with children andadolescents. (Since the intake of all the groups was satisfactory for vitamin A,nicotinic acid and vitamin C in the previous analysis, calculations have not beenincluded for these nutrients). On the basis of graduated wastage, the diets of all thegroups appeared to be satisfactory for energy value, iron and vitamin B, althoughmarginal values were shown in Classes C & Di for energy value by households withadolescents and children, and for iron by households with 3 children. For familieswith 4 or more children, the household diet still provided less than 95 per cent of therecommended allowance of protein and of calcium in Classes B and C & Di ; infamilies with 3 children shortfalls were only shown in protein and calcium in Classes
TABLE 51Households of Different Composition within Social Classes, 1956
Comparison of Energy Value and Nutrient Content of the Diet with Allowances basedon the British Medical Association's Recommendations, using graduated wastage
allowances
(per cent)
no
other
(bothunder 55)
Households with one male and one female adult and
children onlyadoles
cents
only
adolescents andchildren
Classi 3 • 4 or
more
Energy value . ABC&Di
108
107
108 I07 no109
112 109106
102
i°5102
I°5 106 103
99IO2 102 102 IO2 101
Total Protein . ABC&Di
II4112
107
if>5
104
«°3 IOI 102
92
103 94
9086
98 too IOIIOO 95 92 89 94
Calcium ABC&Di
128
128
I24
in 108 109 105 "5no106
104
108
107
101
1019992
89
86
9990
Iron ABC&Di
116 112
III109
109
106inno
113
105
in114106
104
107"5119 IOI 97 IOO IOO
Vitamin B, ABC&Di
130
129
H9
131
125
119
127 126
120
114
133 126
124116
it?116
109
121
116
119
"3
Riboflavin ABC&Di
117
"3i°5
120
112
109
123 127
"4i°3
125 in104
109
III 104
95
IOI
Assumed wast
age allowance
107 IOO 9i
{per cent}
20 «5 10 C 5 10 5

Family Composition and Social Class
TABLE 52
Percentage of Energy Value derived fromProtein, Fat and Carbohydrate, and of Proton from Animal Sources
Households with one male and one female adult and
no otherchildren only , , .
adoles- adoles-
Class (both cents i cents
under I 2 3 4 or only and
55) more childreni •
1
Protein . A 11 •8 n-8 n-8 11-7 ii -5 1 1 -6 ii -7B 11-7 n-6 "•5 ii -3 11 •i 11 '7 "'3lc& DI 11-7 n-6 11-4 "'3 11-2 II-5 II •I
i
Fat ... A 40-6 39'3 38-7 37'4 35'°'39-^ 37-8
B 38-4 37-7 36-5 34'7 34-0 38-0 ! 36-0C&Dii 38-6 36-7 35-8 34'3 3'"5 36-7 33-S
1
Carbohydrate A 47-6 48-9 49'5 50-9 53'5 40-1 50-4B i 49 -Q 50-6 52-0 54-0 54-8 5°'3 52-7C&Di 49'7 51-7 52-8 54'3 57'2 5i's 55-o
Animal pro- A 62-1 60-6 61-5 60-4 56-5 , 58-9 58-8tein as per- B 57'7 57'9 56-7 54'5 Ji-i 56'2 53 =5
centage of C& Di 57'7 56-3 5<>-i 52-5 48-0 55-7 50-6total
protein
C & Di. For families with children and adolescents, the diet still providedless than 95 per cent of the recommended allowances of protein in all classes andof calcium and riboflavin only in Classes C & Di. The measurement of adequacyof the diet of families with two children and with adolescents only was unalteredby this calculation.
142. This method of making adjustments for wastage, therefore, suggested ingeneral, that intakes of less than 95 per cent moved back for calcium from Class Bto Classes C & Di and that the diet on this basis appeared relatively satisfactoryin all groups for energy value, iron and vitamin B,. The results for total proteinappeared to be least affected by this method of calculation; only the larger familiesin Class A could be considered to have moved into, at best, a border-lineposition.
143. The percentages of the energy value of the diet derived from protein, fatand carbohydrate, and the proportion of protein from animal sources are shownin Table 52, which illustrates the increasing dependence on carbohydrate ratherthan fat as a source of energy as family size increased (especially in the lowerincome groups) and as income diminished (especially in the large families). Thecontribution from protein, though exhibiting much the same pattern as that from
fe,
varied only between n-8 and n-i per cent, compared with 40-6 to 31-5 perpent for fat. The proportion of total protein derived from animal sources increased
in almost all groups; it was more than 50 per cent in all groups, except the largestfamilies in Classes C & Di, and exceeded 60 per cent in Class A households with
UP to three children.

VIIIGeographical Differences in the Household Diet
Classification
144. Since 1952 Survey results have been shown separately for urban and ruralareas. In 1954 households in the seven major conurbations were distinguishedfrom those in other urban administrative areas, and in 1955 the London conurbation was treated separately from the others, also appearing as a standard regionin the regional analysis introduced in that year. The present Report distinguishesnine regions and five types of area classified according to concentration of population, London appearing both as a separate region and as the largest conurbation.
(i) Wales
(ii) Scotland
(iii)-(viii) Standard regions of England, except that the Northern and East andWest Ridings regions and the North Midland and Eastern regions havebeen combined, and the London conurbation has been separated fromthe remainder of the London and South-Eastern region, which has itselfbeen combined with the Southern region.
(ix) The London conurbation (Greater London), almost coterminous withthe Metropolitan police district.
(x) The provincial conurbations, as denned by the Registrars-General.These are the largest areas of continuous urban development, centredon Birmingham, Manchester, Liverpool, Newcastle-on-Tyne, Leedsand Glasgow.
(xi) Other urban areas, including boroughs and urban districts.
(xii) Semi-rural areas, denned as those rural districts which are eithercontiguous to urban areas with a population of 25,000 or more, or whichthemselves have a population density exceeding one person per fouracres.
(xiii) Rural areas, i.e. all other rural districts. With improvements in transport,suburban and "exurban" influences have increasingly obscured thedistinction between town and country over a wide area around even
middle-sized towns. To obtain a truly rural sample, therefore, ruraldistricts adjoining such towns have been excluded. The criterion ofdensity per acre is also somewhat stricter than the 30 persons per 100
acres used by the late Professor Sir Arthur Bowley.*
145. Although the general sample is representative of Great Britain as a whole,the areas sampled in any one region may not be fully representative of that region.This applies particularly to Wales, whose small but heterogeneous populationcannot be adequately represented by two parliamentary constituencies (in 1957the number has been increased to three). The complete change of constituenciesat the beginning of 1956 made it possible to ascertain whether the differences
•A. L. Bowley, j7Ray. Stat. Soc., (1914), Vol. 77, p. 598.
92

G 93SQgTCtphl *cal IdDitDifferences in the Househo
-W 80w <O
t<oo * «« * •n f\\I M
•*•§ t «ln *M
« k>•oo A
(4 H0 AM
H* - O •* * -s - - VMO « A (t
g i1
i g
U 0 •*• » 0 « 0 ,,„ Ot « 00
Oa •! *o K •0M s i s a
DomesticFoodExpenditure
andValueofConsumptionbyRegionandType
of
Area,1956
(perpersonperweek)
||M
H *•« H
3 a
A COA A"* «OO 9
Conur
London
* |(0 CO « «n
1! H •t
•1•s I i ? A •>»m
CO GO•T
Ok A 0M
Ijljj •n MM *» «OA
•N
n MtOM
^ m •O w
•»M tOM« o SM0
| •si
Oi Qv •o A OM M
Jll " <TM •0 M a>•t •8" t •AM K ftfrk A A S Si
TABLE
53
1
Tj 0>»> • «* N
M N H
*•
** * tx 0M M i s4 a oo <*> 0 0
iN
M H M M
* •A« « Mft
K t 1 *N ooA A
A CD• «
IN, 1%• t A A
H
•1 •1
„ 00 ^ fc ^ 00 » •NM ? g %
A 0A AH
4 «« t ?
M H S
S
s S 5
< 3 q^M
Scotland * -„ - mo • •« " O M N 00 O
CD oA O
O A
H•O A0 A
|
N
M M
?1
w * G 4 if " tt fj It il H
hi to
H00 ^ *XM
H
g S s g
M M
1STQUARTER
Expenditure
Valueoffreefood
Valueofconsumption
.
Expenditure
Valueoffreefood
Valueofconsumption.
Expenditure
Valueoffreefood
Value
of
consumption
Expenditure
Valueoffreefood
Valueofconsumption
.
ANNUALAVERAGE
Expenditure
.
.
Valueoffreefood
Valueofconsumption.
Expenditurealper
centageofthatinall
households.
Valueofconsumption
aspercentageofthat
inallhouseholds
.
Priceindex(allfoods)
'Priceofenergy'index
(allfoods).
2NDQUARTER
3RDQUARTER
4THQUARTER

94 Domestic Food Consumption and Expenditure, 1956
^«.$>g
"3 a. 00 IH 0 P>S ?£ 0 <*•)1
1 ; b b b bob
SIf) M 9 0.
O
M : : « oo o b
ooo O O o O o o
II N OO OOo' o : o :
*0
bo S b bo
Provincial
o O o o o o o
Conurbations
IS, o e»
b b o 1
ooo 0
0oo
|
rs
o «o o
t~i
1
00
o o o
•leo
O ob i : ' o 'in o o 0
iM 0 o>
o
ts * V)
1 ^i§!rsm
o o i = lil 0
-5 £
Is
o o o o
cog
*ors.M 00 m „ 00 m M tx « ^ M
bo
o o o 0 b o o O O O O o o
• 1 o 0. M
? ? | r 1
•o
o'5
1
m
b b
inooo
0
a: W-l o o o o o
1
*> -^ |l| n ON•*
«"5o
11Ocl «0« «0
10 00 . 0 0 o
bo o o b b o o ' o o o
l! b b
o\
o l b
oo
? 1 1 ? 1
o
Illi- 0 ' ' 0 ' o o
Illi01 * M tx M « •*•
O O . O I f» g1
o o o o o o o o ' o '
o o
|1
fi OO s Os
m>ON o o . i o o o
1
31
Is? o\ ?
00 o rf 9?| 1«n
b b b b s
*il
•5,
oo
b
00 •* OO o
ob b b
O O . O . o
bOS O o O O " O "
&•
Liquid—Retail
.
.
(pi.)
,,
—Welfareandschool(pt.)
TotalLiquidMilk
.
.
(pr.)
6
Carcaseandoffal
.
Baconandham,uncooked
Baconandham,cooked(incl.
canned)....
Poultry
....
Rabbit,game,etc.
TotalMeat....
i •
5
HONEYANDPRESERVESo
3
•§?8?— I*
°*
|l
H
MEAT
MILK
HHD
M0
0
u
-B)
M

Geographical Differences in the Household Diet 96
•<3 «
11I*? &
HN)^ B*
'}I,1
1J. — r* if, r-, « >•«D « u-,C JO o oo moo ^- tn «o 00
4 (nMOOMQQtOMNOOM
Oi o o o o o •I b
,
«^
A11" - ^ I •,f: -"
l( , - tv r - . - 00 *•M O M * H O
1! (^Moo«no«^oooo ^>««
M O O O O «1 o O
II •*M —JO M>Orx^-*N.lO M fO 5 00 •*M ts O«r>o * M •* 0 »n *o
51VO M o
wOOO-HOtn-oOOO o O 0 O O O - O o
,J•~l
OOlO'frN'O •-'O (ONO>O N »n«*»
00\Ooo *N M-• O O O ens(s•* HI«OOwMO*-.O«OO O O
3 «
oooooooooooo 1-1 o o o o o O o o
i c
(3 i OMQMlHI-irxOONmMM H 0»M M « 5 Os « .
J iiOOO'-iOMOOOOO •o o o o o o N o
ihi m«^^fc-^-oom^oots.M-»«0 « ««Ofs.MOO OiOO«O•«••*«^o* in ts ^ M«OM o *n IN
»•-, mmo\
T
^l1!O\ M
•&MMOO«O«nMOOOO Oi M O M O O <*> O O
8
s
(? if«!
«CO « *N « N »x
1
£ I
H 04«000 0 *J O
1
1
«>0 <Nmo o\ oo *n
°0
1
-si's E
oooooomooooo IS. o o o o o o o
||-ai HODm v->o M TT-K. '£ o n M 9v OOM COM lO 0 w o
II1! nOOOc*OO«OOOO « o o o o o •i o o
«1 „„„„ * H oo ?
II
•Q
Jillo o o e o O o o
CT-M« •^•'••Mo* WOOO •* «t •* M «n o
W . M O * 0 N
HTlQWfltnno<emoAMB o\
o*o o o
o. o i
•HOCOOOC4MOOOO « 0 0
1 O.OOOi«0 .^OMOOOfO gi « 00 O <* 5 ff
1
MOOOO vtMOOOO »H o ' o o o H o 1
s
!
-* >f-TP,:,c „, , - ,rt 5, _.. "... O •*w to0 1 O M *rOi •<f«M^.M .;. "
i ootso\o<^o Oi
1MOOOn M « O « 0 0 <*1tt
O MO O •] o
Q i-5« « 00 0 0,00 «M *«« Ot
Cs00 s
ys 00 M
H
•
H o 0
83
1
1
! j- i II om>j
o 8 2 5
- • § • • i 6« > • s5 5
s '1s'
Applesandpears
Stonefruit
.
Softfruit
Tomatoes,fresh
Otherfreshfruit,ex
andcitrusfruit
TtoaJFreshFruit,
t
bananasandcitru.
CANNEDANDHUT
BREAD(alltypes)
s ftiih?! sis 2
FRESHFRUIT
oa it H E-9 w v « « SM^
1s|li!!:fff!fisiiliiilliill •agjlajslslldsll 1

96 Domestic Food Consumption and Expenditure, 1956
previously observed were peculiar to the areas surveyed or characteristic of dieregion. Although the regional features recorded in 1955 were thus severely tested,most of them were found to persist
Quarterly Changes in Expenditure and Value of Consumption146. Table 53 gives quarterly estimates of domestic food expenditure and value ofconsumption in regions and types of area in 1956. Food expenditure was 6 per centabove the average for Great Britain in the London area, 6 per cent below in Walesand the South-West, and 14 per cent below in the rural sample (6 per cent for ruraland semi-rural areas together, as in 1955). The pattern of differences was much thesame as in the previous year, except that the Welsh sample was then more urbanin character and had expenditure 4 per cent above the average for all households.Differences in value of consumption, including free supplies, were much smallerthan in expenditure, ranging from +5 per cent in London to —3 per cent in theSouth-West and in the rural areas. The peak in expenditure occurred in the secondquarter in nearly all types of area and in most regions, but in the rural and semi-rural households and in the more rural regions of England the peak in value ofconsumption was delayed until the third quarter by the seasonal maximum inhomegrown fruit and vegetables, which are valued at their current retail prices.
Free Supplies
147. Table 54 gives details of the quantities of the more important kinds of freesupplies, and the total value of free food. There were some free supplies for abouttwo-thirds of the foods distinguished by the Survey but for most of these the
TABLE 55Value offree supplies of vegetables, fruit, eggs and otherfoods as a percentage of therespective total values of these foods obtained for consumption, 1952-56
(per cent)
ALL HOUSEHOLDS
1952 1953 1954 '955 1956
Potatoes 7'7 9'5 IO-2 II-O 8-4All other vegetable* .... 15-8 I7-3 16-0 14-7 14-0Fruit 9-1 9'9 6-8 7-6 6-2Eggs 17-1 14-2 11-3 10-8 7-9All other foods 0-8 I'O '•3 1-2 0-9All foods 3-8 4-0 3'5 3'5 2-9ALL URBAN AREASPotatoes 3'7 4'3 4'7 4'7 4'7All other vegetables .... 9'5 10-8 9-8 8-6 9-9Fruit 6-0 6-7 5'4 5-4 5-2Eggs 6-3 5-8 3-8 4-0 2-9All other foods O-2 0-2 0-3 0-4 o-3All foods 1-9 2-0 1-7 1-7 1-6RURAL AND SEMI-RURAL AREASPotatoes 25-3 3°-5 29-3 32-7 23-3All other vegetables .... 37'7 43-2 37-6 35-6 3* '4Fruit 22-6 21-4 12-3 14-3 10-7Eggs 45-7 38-8 35'7 33'2 27-8All other foods 3-3 3'7 4'3 3-6 3'5All foods 10-9 ii'i 9'5 9-1 7-9

Geographical Differences in the Household Diet 97
quantities involved were negligible. The largest contributions were made byfresh vegetables and fruit, eggs and milk, which accounted for some 75-90 per centof the total value of free supplies in all regions and types of area. The value of freefood ranged from 35. lod. per head per week in rural households (14-0 per cent oftotal value of consumption) to 51! (i -4 per cent) in London and only rjd. (0-5 percent) in the provincial conurbations, and from as. id. in Wales to 3£d. in theNorth-West. Wales was the only region with appreciable free supplies of butter andbacon, and had the highest averages for milk, eggs and carcase meat and offal.The South-West had the greatest free supplies of all the main types of green vegetables, potatoes, onions, apples and pears, soft fruit and tomatoes, preserves andpoultry; Wales took the lead for root vegetables, and the eastern areas for stonefruit.
148. The percentage contributions of free supplies were higher than in 1955 forcabbage, cauliflower, leafy salads, peas and beans, carrots and stone fruit. Forall these except cabbage the absolute contributions were also greater, but for allother main commodities both the absolute and the percentage contributionsdecreased. Table 55 shows that the decline in the relative importance of self-supplyduring the transition from control was more marked in the country than in thetowns, and was most pronounced for eggs.
Consumption, Expenditure and Prices; Individual Foods
149. Details of expenditure and consumption are given in Appendix E for allfoods by region and type of area. A Laspeyres-type price index, in which theweights assigned to different foods are taken from the national sample, indicatesthat the level of food prices continued to be significantly above the average inScotland and Wales, especially for fruit, fresh green and other vegetables, fish,carcase meat and (in Scotland) bacon; potatoes were, however, cheap in Scotlandthough dear in Wales. The degree of urbanization also had some effect on prices,the index for all foods ranging from 2 •5 per cent above the general average in ruralareas to 0-7 per cent below in London. The indices for English regions were allwithin i per cent of the average. Fresh meat and bacon, fresh fish, fruit, fresh greenand other vegetables were all more expensive in rural areas than in the towns;potatoes and eggs, on the other hand, were cheaper in the country. The cost percalorie (value of consumption divided by energy value of the diet) was highest inLondon (7
•5 per cent above the average for all households) reflecting the Londoner's
high expenditure on fruit and green vegetables, and lowest in the rural sample
(8-3 per cent below), because of the rural household's greater dependence on breadand flour.
Milk, Cheese, Meat, Fish and Eggs
150. Consumption of liquid milk was, as in 1955, greatest in London (5 •26 pintsper head per week), closely followed by the adjoining South-Eastern and Southerncounties (5-22 pints). The North-East, with 4-04 pints compared with 4-15 pintsin 1955, had much the smallest average, with Wales the next lowest. These geographical differences in milk consumption cannot be explained in terms of differinglevels of income; they appear to have persisted from habits formed before the war,which may yield only very slowly to time and education. As before, towns outsidethe London area obtained less milk than the national average. Rural householdsobtained 43 per cent of their domestic milk supply, other than welfare milk,

98 Domestic Food Consumption and Expenditure, 1956
free of charge, and their total expenditure on milk was 37 per cent below the averagefor all households, although their consumption at 5 •oi pints was 4 per cent above.Purchases of condensed milk were greatest in the South and South-East, as in 1955,and of dried and other milk in the Midlands.
151. Total consumption of cheese ranged from 3-8 oz. per head per week in theMidlands to 1-9 oz. in the North-East. The range in expenditure was similar,and wider than in 1955. Purchases of natural cheese were greatest in the Midlands,which moved ahead of the South-West. As before, demand for processed andpacketed cheese was greatest in Scotland and London and least in the South-Westand in the rural areas.
152. The range in consumption of carcase meat was from 15 per cent above thenational average in London to 17 per cent below in Scotland, compared with
+20 to —20 in 1955. Regional differences in expenditure were smaller thanthose for consumption, because of variations in the average prices paid by housewives, which ranged from 5 per cent below the national average in the North-West to 16 per cent above in Scotland, where most of the meat sold was no doubtprime quality home-killed. Purchases of beef exceeded those of mutton exceptin the South-East and South and the North-West; the preference for beef wasstrongest in Scotland and in rural areas. Pork consumption declined except inScotland, where it was already very low. Consumption of uncooked bacon and hamalso decreased in most regions and differences narrowed, the range being from
+ 17 per cent in the North-East to —33 per cent in Scotland, where the pricespaid were 28 per cent above the average for Great Britain, partly, no doubt, becauseof the different types sold. The average prices for fresh meat and bacon were9 to 10 per cent higher in rural areas than in semi-rural and urban areas, withconsumption accordingly lower.
153. Scottish households, as in the previous year, had much the highest expenditureon and consumption of sausages, and the North-East and North-West the lowest.The strong preference in Scotland and the rural areas for beef extended to beefsausages, which accounted for 75 per cent of the sausage consumption in Scotlandand 64 per cent of that in rural households, compared with 54 per cent in theNorth-East, 44 per cent for Great Britain and only 27 per cent in the Midlandareas. Consumption of offals was greatest in London and least in the rural areasand in Scotland; differences were more marked for liver than for other offals.
Consumption of rabbit, game and miscellaneous meats fell below o •i oz. per headper week everywhere. Poultry consumption was greatest (0-85 oz.) in the ruralhouseholds, though expenditure at o •god. was less than half the national averageof i-Sgd. because of free supplies. London, with almost equal consumption (0-84oz.) had the highest expenditure (3
•26d.).
i154. Geographical variations in the consumption of fish were much wider thanin the previous year, the range being from +22 per cent in the North-East to—24 per cent in Wales and —26 per cent in rural areas. Scotland had the highestaverage for fresh and processed fish, especially white fish, but, except for ruralareas, the lowest for prepared fish and much the lowest for shellfish. Purchases of
herrings were greatest in the South and South-East. In the North-East, consumption of cooked fish was 155 per cent and of chips 127 per cent above thenational average, compared with 83 and 72 per cent in 1955. Fish prices in generalweie highest in Wales and Scotland and lowest in the North-East and South-West.

Geographical Differences in the Household Diet 99
155. Scotland again showed the highest and the Midlands the lowest consumptionof eggs, the range being from +20 to —14 per cent of the national average compared with +18 to — ii per cent in 1955. Price variations were small, with ruralareas 5 per cent below and Wales 4 per cent above the average.
Fats, Sugar and Preserves
156. Consumption of fats was again greatest in Welsh households (13-1 02. perhead per week) because of their consumption of butter (7 •o oz.), accounting for 53per cent of the total compared with 40 per cent in the whole sample. Butter consumption was also high (5
•5 oz.) in rural areas and in the largely rural South-West;
ehewhere it was 5 •o oz. or less. The North- West again had the lowest expenditureon and consumption of butter and the highest average for margarine. Scottishhouseholds continued to record the lowest figures for cooking fats and the North-East and North Midland and Eastern regions the highest. Purchases of suet anddripping ranged from 37 per cent above the average in the North-East to 54 percent below in Wales, compared with +33 and —57 per cent in the same regions in1955. The demand for other fats, oils and creams increased markedly in GreaterLondon and the adjoining regions, but not elsewhere.
157. Variations in the consumption of sugar were as usual small, ranging from+ 10 per cent in rural areas and +8 per cent in Wales to —9 per cent in theNorth-East. Scotland, the North-West and the rural areas had the highest consumption of preserves, other than marmalade, for which London took the lead.Total consumption of preserves continued lowest in the Midlands (—24 per cent).The price of sugar was almost uniform throughout Great Britain; that of preserveswas 7 per cent above the average in Wales, but elsewhere showed little regionalvariation.
Vegetables and Fruit
158. Variations in potato consumption are largely dependent on local conditionswhich change from year to year. Thus, the South-West, which showed the highestaverage in the 1949 analysis, and the Midlands, which headed the list in 1955,were both near the general average, while Scotland took the lead at +8 per cent.The low value of —10 per cent in the South-Eastern and Southern area is
,
how
ever, persistent. The ratio of new to old potatoes was highest in London and lowest
in the countryside. The range in expenditure was from +19 per cent in the industrialNorth-West to — 18 per cent in the South West, and from +14 per cent in theprovincial conurbations to —46 per cent in rural areas, where 44 per cent of thetotal supplies were "free". Average prices varied from -f-n per cent in Wales, as inJ955» to — 18 per cent in Scotland.
159. Geographical differences in the consumption of fresh green vegetables weresimilar to those found in 1955, and only slightly less marked, while those inexpenditure were even wider. The ranges were: consumption, South-West, +35per cent (+44 in 1955), Scotland —62 per cent (—04); expenditure, London +57per cent (+60), Scotland —66 per cent (—59) with rural households at —74 percent, not wholly because of their reliance on garden produce —their consumption
of
cauliflower and leafy salads was even below the Scottish level. When housewives
in country districts did purchase green vegetables, they paid prices 22 per cent above
the national average. Prices were also high in Wales and Scotland. The Scottish
consumption of fresh legumes, which was only 4 per cent of the average for Great

ioo Domestic Food Consumption and Expenditure, 1956
Britain in 1949 and 10 per cent in 1953, rose to 14 per cent in 1956. The highaverages for cauliflower in Wales and for peas and beans in the South-West wereconfirmed.
160. The consumption range for vegetables other than fresh greens and potatoeswas from 13 per cent above the average in the North West, as in 1955, to 21 percent below in the South West. The North- Western lead arose from onions andcarrots; for other root vegetables Wales had the highest average, followed by Scotland. London and the Home Counties, with more varied tastes and better distribution facilities, recorded the largest purchases of the miscellaneous fresh vegetables.Consumption of and expenditure on all types of canned vegetables was smallest inthe rural districts and in Scotland, Wales and the largely rural South West. TheNorth East had the highest averages for canned beans and shared the lead with theSouth East and South for canned peas; for other canned vegetables expenditure andconsumption were greatest in London.
161. Although differences in the pattern of vegetable consumption are amongthe most characteristic regional features, they are largely compensatory. Forvegetables as a group, the extreme deviations were only +2 per cent in the SouthWest and —6 per cent in rural households. The expenditure range was of coursemuch wider, from + 17 per cent in London to —50 per cent in the country, beinglargely governed by the availability of free supplies.
162. Regional differences in the consumption of fresh fruit tended to follow thosefound in 1955, the range being from 27 •4 oz. per head per week in Greater London(33 per cent above the average) to 16-3 oz. in rural areas (21 per cent below). Thecorresponding range in expenditure was from +28 to —24 per cent. London had adear lead for all the main kinds of fresh fruit except soft fruit. Consumption ofother fruit was greatest in Wales and the North Midland and Eastern area andsmallest in Scotland. Rural households recorded the highest average for dried vinefruit but the lowest (apart from Scotland) for canned and bottled fruit. Themarketfor canned and bottled tomatoes was curiously localized, purchases in the NorthMidland and Eastern area being some 30 times as great as in Scotland. Consumptionof welfare orange juice was greatest in London and smallest in rural areas, no doubtbecause of difficulties in distribution. Fruit prices were highest in Scotland (+nper cent fresh fruit, +7 per cent other fruit) and lowest hi London (—5 per centfresh, —4 per cent other).
Cereals, Beverages and Miscellaneous Foods
163. Regional differences in the consumption of cereal foods followed muchthe same pattern as in the previous year, the range being from 9 per cent abovethe average in Scotland to 12 per cent below in London (1955, +10 to —14 percent), though the greatest consumption (+17 per cent) was in rural households,which were not distinguished from those in semi-rural areas in 1955. Consumptionof bread in the rural sample was 18 per cent above the national average; among theregions, the Midlands with + 15 per cent took the lead from Wales, with Londonstill lowest at —14 per cent. Expenditure, however, was highest hi Scotland (+24per cent) because of higher prices (+6 per cent) and a demand for rolls. TheNorth East recorded the lowest expenditure on wholemeal but much the higheston other brown bread, though the estimated prices suggest that some proprietarybrown bread conventionally grouped with wholemeal bread by the Survey wasthere described simply as brown bread.

Geographical Differences in the Household Diet 101
164. Purchases of flour were again greatest in the North East with 12-0 oz. perhead per week, 52 per cent above the average for Great Britain; of this 5-0 oz-was plain flour, twice as much as in any other region. Flour consumption was ashigh in the semi-rural as in the rural areas (both 9-9 oz.), 26 per cent above theaverage; this was one of the few instances of the former group conforming to therural rather than the urban pattern of demand, even though they paid urban pricesfor their Sour. The lowest averages were in the Midlands, the provincial conurbations and Scotland, respectively 39, 29 and 26 per cent below the average. Differencesin expenditure closely paralleled those in consumption.
165. Consumption of cakes and biscuits ranged from +33 per cent in Scotlandto — 16 per cent in Wales and —14 per cent in the two Midland areas. Averageprices were 12 per cent above the average in Scotland but elsewhere fairly uniform.Scotland and the rural areas had the highest consumption of oatmeal and oatproducts (+159 and +120 per cent respectively) but the lowest of other breakfastcereals (—37 and —38 per cent) for which London moved ahead of the Midlands.As in 1955, London took most flour-based cereals.
166. Tea consumption varied from 3-25 oz. per head per week (+13 per cent)in the Midlands, closely followed by the North West, to 2-56 oz. (—n per cent)in Scotland and only 2-44 oz. (—15 per cent) in rural households. Prices were
7 per cent below the average in the provincial conurbations and the North West.The consumption of coffee ranged from +39 per cent in the South West to —47per cent hi Scotland and— 55 per cent hi Wales. The North West, though its totalcoffee purchases were below average, showed a strong relative preference for beanand ground coffee rather than extracts and essences. Cocoa consumption became
more uniform, and increased markedly in Scotland, which obtained more than theNorth of England. For branded food drinks, however, the old differences persisted,giving a range from +70 per cent in the Midlands to —75 per cent in Scotland
(-77 in I955.-70 "» 1953)-
167. A minor characteristic of the diet of households in London and the HomeCounties is then- use of salad dressings and of meat and vegetable extracts, whichare less popular hi Wales, Scotland and the countryside. Purchases of soups, bothcanned and powdered, generally increased but remained much greater in Scotland
than elsewhere.
Summary of Regional Differences in Consumption of, and Expenditureon, the Main Food Groups
168. In Tables 56 and 57 the main food groups are classified in each region ortype of area according to whether the average expenditure or consumption perhead was more than 5 per cent above or below the national average, and are alsoarranged hi order of magnitude outside these limits. Households in towns outsidethe conurbations, hi semi-rural areas and hi the North Midland and Eastern and theSouth Eastern and Southern regions conformed most closely to the national patternof consumption, while rural, Scottish and North-Eastern households divergedmost widely from the average for Great Britain. Expenditure broadly followed thesame patterns as consumption, although price differences and the varying incidence
of free supplies resulted in some degree of transference, especially in the SouthWest.

IO2 Domestic Food Consumption and Expenditure, 1956
TABLE 56
Household Food Consumption—Regional Differences expressed as PercentageDeviations from National Average, 1956
Northern andWale, Scotland East and Weit North Western North Midland Midi*
Ridings and Eastern
Mart than Butter +49 Cakes and Flour +ja Margarine +30 Cooking Cheese
S per ant Flour +15 biscuits +33 Suet and Other fata +19 Breadabove i/i.- Cooking Other dripping +37 vegetables + 13 Flour +19 Teanational fatS +12 cereals +33 Cooking Bread + 11 Freah Cookingaverage Fresh Suet and fats +23 Tea +ia green fata
green dripping +27 Fish +»a Other meat + 8 vegetables + 14vegetable! + 10 Eggs +10 Cakes and Cakes and Cheese +8Bread +10 Potatoes + 8 biscuits +14 Biscuits + 6
Fruit + 8 Butter +7 OtherBread +6 vegetables + 11
Other meat + 11
Margarine + 6
Between 95 Cheese Liquid IT ilk Eggs Liquid milk Liquid milk Liquid nulmad 105 Sugar and Sugar and Total meat Suet and Margarine Butterper cent o/ preserves preserves Potatoes dripping Suet and Margarineo/ rA* Carcase meat Other meat Bread Sugar and dripping Sugar andnational Other meat Fish Tea preserves Eggs preserves
average Total meat Other Carcase meat Sugar and Carcase rr.c
Potatoes vegetables Total meat preserves Other metOther Fish Carcase meat Total meatvegetables Potatoes Total meat ; Freah greetTea Other cereals Potatoes vegetable
Fruit Potatoes
Bread Other ceraOther cereals
Tea
Mart than) per antbeloa the
nationalaverage
Eggs —10
Liquidmilk —itOther
cereals —14Cakes and
biscuits —16
Margarine —22
Margarine —6
Total meat —8Cheese —10
Tea -iiCarcase
meat —17Fruit —19Flour -26
Carcase
meat —6
Sugar andpreserves —7Butter —10
Fruit —10Liquidmilk —16
Eggs -7Fruit - 11Cooking
fats —iiCheese —13Butter —13Flour — iiFreah
Othermeat —6
Othervegetables —6
Butter —7Fish -8Cakes and
biscuits —14
FishFruitOther
Fish -14 Cooking Other green : dripping
vegetable
Eggs
Cakes and
biscuits
Suet and
Suet and fats -43 cereals —20 vegetables— 34 ' Floordripping -54 Fresh Fresh t
green green
vegetables —62 vegetables — itCheese -33
•

Geographical Differences in the Household Diet 103
TABLE 56— continued.
nail Wtslsrn oourn Easitmand Southern
ConurbationsUtlur urban SV.T-, r:-i :l Rural
London Provincial
ocml-rurdj
A Fresh Fresh Margarine +13 Cooking Flour +j6 Flour + atea green green Other fat* +7 Fresh Bread + itstable* +35 vegetable* + 33 vegetable* + 29 vegetable* + 11 Suet and green Eggs +17e«e +17 Cheese +13 Fruit +38 Tea +10 dripping + 6 vegetable* + 18 Hut lot + 16
ter + 16 Liquid Carcase Bread +8 Flour +6 Cooking Otherfrjl^g milk + 8 meat + 15 Cake* and fat* + 16 cereal* +141 +9 Fruit +8 Other biscuit* + 8 Cheeoe +9
cereal* +14 Other meat +6 Sugar and
Cheese +11 Fish +6 preserves +91 1 Cake* and
Liquid 1 biscuit* +o
milk +9 Suet and
Egg* +8 dripping + 8
Margarine + 6
uidmilk Butter Butter Liquid milk Liquid milk Liquid milk Liquid milkjar and Cooking fats Sugar and Eggs Cheese Cheese Other meat
serve* Eggs preserves Sugar and Butter Butter Potatoe*
'casemeat Sugar and Total meat preserves Margarine Margarinelal meat preserves Fish Carcase meat Eggs Suet and
itoct Carcase meat Potatoes Total meat ' Sugar and drippingad Other meat Other Potatoes preserves Eggsmind Total meat vegetables Other cereals Carcase meat Sugar andxma Fish Tea Other meat preserve*I Other Total meat Carcase meat
vegetables Fish Other meat
Flour Fresh green Total meatOther cereals vegetables Potatoes
Potatoes FruitOther Bread
vegetables Other cereals
Fruit Tea
Bread
Cakes and
biscuits
Tea
g» -6 Suet and Suet and Suet and Other Other Totalher dripping —6 dripping —6 dripping —6 cereals —6 vegetables —7 meat —9eat -8 Tea -8 Margarine —8 Butter —9 Cakes and Tea — ijDUT —9 Margarine —9 Other Fruit — i o bi*cuits —13 Carcaseher Cakea and meat —8 Cooking Fi«h -15 meat —16
JeaU —9 biscuits —9 Cooking fat* - 15 Othernit -ii Potatoes — J o fats — 11 Cheese —16 vegetable* —17argirine — 16 Bread —10 Cakes and Flour —29 Fruit —19sh _19 biscuits —11 Fresh Cookingther Bread —14 green fats —21Egnabln -21 Flour —16 vegetables —31 Fish - »6Letand Fresh
ripping —35 green
vegetables —31

104 Domestic Food Consumption and Expenditure, 1956
TABLE 57
Household Food Expenditure —Regional Differences expressed as Percentage Deviationsfrom National Average, 1956
Northern and
Walts Scotland Ban and Wat North Western North Midland MitHmRidingt and Eaittrn
More than Butter +40 Cakes Flour +51 Margarine +28 Flour +18 Che«eS f*r ant Flour + 17 and Suet and Potatoes +19 Cooking Freshabove th. Cooking biscuits +43 dripping +38 Bread + 11 fats +16 greennational fan +13 Bread + 24 Fish +»o Other Suet and vegetablesoutrage Fruit + 10 Other Cooking vegetable* + 10 dripping +15 Tea
cereal* +16 fat* +17 Other Chee*e +8 CookingButter +14 Potatoes +16 meat +8 fat*Egg* +14 Other BreadSuet and vegetable* + 12 Fishdripping +10 Other Liquid
meat +11 milkCakes and
biscuits +11Margarine + 8
Eggs +7Tea +«
Bttmtn 9} Cheese Sugar and Butter Liquid milk Liquid milk Butterand 10} PIT Sugar and preserve* Sugar and Suet and Margarine Margarineetnt of tkt preserves Carcase preserves dripping Sugar and Sugar andnational Carcase meat Carcase Egg* preserve* preserve!average meat Other meat meat Sugar and Carcase Carcase
Total meat Total meat Total meat preserve* meat meat
Fresh Fish Fruit Carcase Other meat Other meatgreen Bread meat Total meat Total meatvegetable* Total meat Fresh Potatoes
Bread Fish green OtherTea Cake* and vegetable* vegetable*
biscuit* Other FruitOther vegetables Othercereal* Fruit cereal*
Tea Other
cereal*
Tea
Mori than 1ptr ant
Other
meat —7Potatoes —10
Fiih —iiOthervegetable! —13Cakes and
bitcuia —ij
Cheese -7Margarine —7Othervegetables —10
Fruit -IILiquidmilk —13
Tea -15
Fresh
green
vegetable* —16
Liquidmilk —19Othercereal* —21
Cheese -30
Fruit -6Cheese —10
Butter —itCooking
fat* -13Fresh
greenvegetables —19
Potatoe* —6
Bread —6
Butter -7Fish -7Eggs -8Cakes and
biscuits — 14
Eggs
Cakes andbiscuita
Suet anddripping -Flour •
bloathtnationalaveragt
Other Potatoes —to Flour —19cereals —16 Flour —31Eggs -19 CookingLiquid fat* -36milk -aj FreshMargarine —30 green
Suet and vegetables— 66
dripping —51

Geographical Differences in the Household Diet 105
TABLE 57—continued.
uA Wuttm South Eastern
and Southern
ConurbationsOrhtr urban Simi-rural Rural
London Provincial
V* + 1$ Liquid Fresh:- T !J milk +15 green
anf Cheese +10 vegetables + 37 Margarine +14 Suet and Flour +aj Bread +*i+ 8 Fresh Fruit +« Potatoes +14 dripping +8 Cooking Flour + 19
green Other Fish +10 Flour +6 fats +17 Cake* and
vegetables + 10 cereals us Other Butter +6 biscuit* +1$Other Liquid vegetables + 10 Butter +iacereals +8 milk +15 Bread +10 Cheese +9
Carcase Cakes and Sugar
meat + 11 biscuits +8 *ndEggs +10 Other preserve* +6Cheese +9 meat +7Other Eggs +6vegetables +8
lidmilk
meButterCooking fats
Suet and
ButterSugar andpreserves
Liquid milkSugar andpreserves
Liquid milkCheese
Butter
Liquid milkCheeseMargarine
Margarine
Suet anddrippingI
1 dripping Other meat Carcase Margarine Suet and Othera and Eggs Total meat meat Cooking fata dripping cerealsoin Sugar and Fish Total meat Eggs Sugar and
1 preserves Potatoes Fruit Sugar and preservesOb Carcase Tea Other preserves Carcase
meat cereals Carcase meat
Total meat Tea meat Other meat
Other Other meat Total meatvegetables Total meat FruitFruit Fish Bread
Flour Fresh Othergreen cereal*vegetables TeaPotatoes
Othervegetables
FruitBread
Cakes and
biscuit*
Tea
Imcu -6 Other meat -6 Margarine —7 Butter -7 Other Fish —11 Carcase
rind Tea -7 Suet and Fresh cereal* —6 Other meat —7etrei —7 Fish -8 dripping —8 green vegetables —11 Total meat —10i Margarine —9 Cooking vegetables —11 Cakes and Other meat —14a Cakes and fats —9 Suet and biscuits —13 Tea -15SsbUs -7 biscuit* —9 Cakes and dripping —13 Eggs -15 Fruit —30r -8 Bread —13 biscuits —10 Cheese —14 Potatoes —15 Cooking
»nett -u Potatoes -16 Bread —14 Cooking Fresh fats —11
-14 Flour —16 fats -14 green Fish —29I -17 Flour —38 vegetable* —18 Eggs —30BW -18 Liquidtttine -19 milk —37
-*4 OtherIt vegetables —40(tables -17 Potatoes —46and Fresh•Ping -38 green
vegetables— 74

io6 Domestic Food Consumption and Expenditure, 1956
O
I
a*MH)«H
•S
I"s
*
"3
3a •<>MOO^ &•tf, '<•,*-iHI n ciOiOOfx*O*vO»Hi»n M -«•-r
i"?n « \O M
II«* M* -^
ij61 "O^ HI COO^ W^ HI
•-3
3o •*
1 «
^ « "T C -t M
H VOts.*-OHiir>Hirv i- ir, -t*n HI m o « HIM" H? ~f
||l 0 M^W
<?l^
jf^ "^HlIoo''-<§. *H?
1Ci N >OO
ll-sl
i •O HI eno w H
M>O
S|'| ^ M m O^ ro MrT *T •*
fl O N «0 N
« wJno^m *H,W* H* 4
IIIl - "rr< a tj
| •*oB
I t-" " °- 4
"
1
DO M V~,U->M fn
VO^ M fOO^ O HIW* H? 4 .
S3 » 2jJ „ SS?
^ *.c^••*I^<S*SSS."2
""-
MM c t* o 3 *S'S "5 (c '*3 'S '2
wH<tSuUJ3>>2Z>>

Geographical Differences in the Household Diet 107
5
i
°i•5
111.1
Ml
• -oaoctotnm
^ ot < mo o*co«
s.sOPO«
OOnOOOMMflc
»0O t^.00 «-i
^Ot^OOOOOOOOMMfOm
••<• 01-i --<o M m
« oo cn%o M
s
§

io8 Domestic Pood Consumption and Expenditure, 1956
MftM<H
1
« » o 00H"1 •*•+0
asM <nin o
Jlm
M M m oVI
ijS 5ii o i
O a N
| O « -O H
3 ^
M« M 0M «*)1OO
H"
J1
•0 t^«O
|1|
M m •*oH
a
lO 0-,V. aeM ts o e
VIw M v%O
<E ^ m m mn
** *»*M O
"S>
M n m o
|
>Cm MM *S >HO
o
Ntv
ii,i « r^-Hc I
il
M ^ « 0
M
mi now
HV|
*n*
j
ii
M ^ «noM rt «noH
0
I
H 0-.0 »M* « eM ro w>o S
5 1^ M Ps M O
•o
M fn v»oH
V)
' '
1 inasper-
f total
*'f!
Animalprott
centage
o
protein

Geographical Differences in the Household Diet 109
Energy Value and Nutrient Content
169. Estimates of the energy value and nutrient content of the household dietin regions and urban and rural areas are shown in Table 58. The most strikingfeature of the data is their uniformity. Except for vitamins A, C and D, whichusually show a more marked variation, and for carbohydrate in rural areas, whichwas 12 per cent above the average for Great Britain, the nutritive value of thediet in each region and type of area was within 8 per cent of the average. For mostgroups and most nutrients uniformity was even greater: few values differed bymore than 4 per cent from the national average. The main departures occurred inLondon, the North East, Scotland and Wales, and in the rural sample.
170. The London diet contained upwards of 7 per cent more animal protein,vitamins A and C and riboflavin than the average, and 5 per cent less carbohydrate.North Eastern households, with relatively greater consumption of flour, cakes,biscuits, fried fish, bacon and canned and dried vegetables, and much smallerconsumption ofmilk and cheese, obtained 5 per cent more iron and 7 per cent lesscalcium than the average. The diets in Scotland, Wales and the rural areas werebetween 3 and n per cent below the average in animal protein, vitamin A andriboflavin and 3 to 12 per cent above in carbohydrate; the Scottish and rural dietswere also 14 and 15 per cent respectively below in vitamin C. The highest valuesfor energy, total protein, carbohydrate and calcium occurred in the rural households, which satisfied their greater energy needs mainly by relatively high consumption of nearly all cereal foods, especially bread, and of milk, potatoes, butterand sugar. The intakes ofmost vitamins were below average in Wales and Scotlandin the rural areas and the smaller towns; an exception to this was the high valuefound for vitamin C in Welsh households because of their relatively high consumption of fresh fruit and green vegetables.
171. Changes between 1955 and 1956 were not great, and comparisons are therefore
affected by small changes in the average requirements of the groups compared.Generally, there were decreases in vitamin B, , and, to a lesser extent, in nicotinicacid, mainly attributable to changes in the consumption and the composition ofbread and flour. The energy value and total protein, carbohydrate, calcium andiron content of the diet were about the same or slightly less than in 1955, and theanimal protein, fat, vitamin A and vitamin D content about the same or slightlygreater. These changes generally reflect decreased bread and potato consumptionand increased consumption of carcase meat and fish.
172. An assessment in Table 59 of the adequacy of the household diets, by comparison with allowances based on the recommendations of the British MedicalAssociation, shows that all percentages equalled or exceeded 97, and that onlythose for protein in Wales, Scotland and the "other urban" and rural areas, calciumin the North East and riboflavin in Wales and the rural areas fell below 100 per cent.London recorded the highest percentages for all nutrients, while the lowest percentages for energy value and all nutrients except calcium occurred in Wales,Scotland or the rural areas. All the Scottish and "other urban" percentages were lessthan the average for Great Britain, as were all but one in Wales, the North East andthe rural sample. The diet in the provincial conurbations was above the averagein most respects: that in the semi-rural areas was in general superior to that ineither the rural or the "other urban" areas, though below the level of theconurbations.

no Domestic Food Consumption and Expenditure, 1956
173. Compared with the previous year, most of the percentages for vitamin Arose and those for energy value changed little, but for all other nutrients there weredecreases in nearly all regions and types of area. The most consistent decrease, thatfor vitamin B,, was shared by all groups, but was most pronounced in the Midlands,which showed the greatest reduction in potato consumption as well as sharing inthe general fall in the consumption of bread and other cereal foods.
174. The decreases between 1955 and 1956 in the percentages for energy valueand for the protein, calcium and iron content of the diet were most marked inScotland and the South West. Changes in the percentages for vitamins A and Cwere less regular than those for other nutritients, as would be expected. Except inWales and the South West, percentages for vitamin A increased, mainly becauseconsumption of carrots and liver increased somewhat. The greatest decrease in thevitamin C percentage occurred in the Midlands because of reduced consumptionofmost types of fruit and vegetables, especially tomatoes, potatoes and fresh greens.
175. The sources of the energy value of the diet of different regions and types ofarea are shown in Table 60. The London diet had the highest proportions of energyvalue from fat and protein and the lowest from carbohydrate, the Welsh diet thelowest from protein, and the Scottish and rural diets the lowest from fat and thehighest from carbohydrate. The diet of the South and South East was closest tothe London pattern; in other regions and types of area the percentages conformedclosely to the national average. In almost all groups the percentages for proteinwere either the same as in 1955 or slightly less. Except in Wales the percentages forfat increased and those for carbohydrate tended to decline, mainly because ofreduced cereal consumption and increased consumption of many foods of animalorigin containing more fat.
176. Table 60 also gives the proportion of protein derived from animal sources,which increased in 1956 in all regions and types of area, ranging from over 60 percent in London to 53-54 per cent in Wales, Scotland and rural areas.

Appendix A
Composition of the Sample
1. In 1956 the scale of the National Food Survey was reduced for reasons ofeconomy. Fifty parliamentary constituencies, listed in Table i, were surveyedduring the year, compared with the 60 which had been included in each yearsince 1951. The 50 constituencies were selected, one from each of 50 groups havingapproximately equal populations; the probability of selecting any given constituencywas made proportional to the size of its electorate, so that households in large andsmall constituencies had approximately equal chances of inclusion. In constructingthese 50 groups the 618 constituencies in Great Britain (excluding 6 in the croftingcounties of Scotland) were classified by regions, and within each region purelyurban constituencies (i.e. those containing no part of a rural district or (in Scotland)no part of the landward area of a county) were separated from others. Purely urbanconstituencies in England and Wales were further classified within each regionby Corlett's "juror index",1 i.e. the proportion of the electorate qualified forjury-service, to help in securing more correct representation of areas of differentresidential character. In Scotland, where the juror index was not available, purelyurban constituencies were classified by rateable value (other than industrial orfreight transport) per head of population. Constituencies containing part of a ruraladministrative area were stratified within each region by the proportion of thepopulation living in rural districts (in England and Wales) or landward areas ofcounties (in Scotland). The 50 first-stage units were randomly selected from 50separate groups thus defined, subject to the restriction that constituencies surveyed
during the preceding two years were not to be selected.
2. The second-stage sampling units were polling districts within the selected constituencies, four being selected in each constituency for each quarter. As the mainanalyses of the data were quarterly, the problem was regarded as that of designingthe best possible sample for three months, spreading the work as continuously aspossible. In purely urban areas all the polling districts in the constituency werestratified by the juror index, and four were selected, the probability of selecting aparticular district being proportional to its electorate in order to equalize the chanceof any given household appearing in the sample. In other constituencies, pollingdistricts were first classified as urban or rural according to their administrativestatus; the "percentage rural" figure for the constituency, already used as a basis ofclassification at the first stage, then determined how many of the four polling districtsshould be rural, as follows: —
Less than
12-5
Over
87-5Percentage rural 12-5-37-5 37-5-62-5 62-5-87-5
No. of rural pollingdistricts . 0 i 2 3 4
'Applied Statistics (1952). vol. i, p. 34.
Ill

112 Domestic Food Consumption and Expenditure, 1956
3. The urban and rural polling districts in the constituency were then stratifiedseparately by the juror index. Where only one polling district of a given type, sayurban, was required, this additional stratification was confined to the three of theother type. In urban areas in Scotland, polling districts were selected at random,since the juror index was not available and the alternative criterion, rateable valueper head, could not readily be obtained for individual polling districts.
4. The third stage of sampling consisted of the selection of addresses from theelectoral register for each selected polling district at constant intervals from arandomly chosen starting-point. The method of selecting addresses at this finalstage and the instructions given to interviewers followed the Social Survey'sstandard practice described elsewhere.1
5. Interviews were made in half the constituencies alternately for periods of threeweeks, during which two polling districts within each of these constituencies were
TABLE IConstituencies surveyed in 1956
Region Contrinuncy* Region Constiiumcy*
Northern andEast and West
Cleveland (Yorkshire,North Riding)t Leeds SouthMiddlesbrough EastMiddlesbrough Westt Morpeth (Northumberland)t Penistone (Yorkshire,West Riding)Rotherham
London(conurbation)
t Camberwell, Peckhamt Chigwell (Essex)t Baling Southt Erith and Crayfordt Islington Northt Kensington Southt South West Hertfordshire (part) (Hertfordshire)t Spelthorne (Middlesex)t Willesden Eastt Woodford
Hiding!
North Western t Crosbyt { Huyton (Lancashire)tt Knutsford (Cheshire)t Liverpool, Exchanget Manchester, ArdwickNelson and Colne
t Stockport North
South Easternand Southern
Bournemouth WestIsle of Thanet (Kent)ReadingJ South Buckinghamshire(Buckinghamshire)t Wycombe(Buckinghamshire)North Midland
and Easternt Bolsover (Derbyshire)CambridgeJ Gramham (Lincolnshire,Kesteven)%Hemel Hempnead(Hertfordshire)t Loughborough(Leicestershire)Romfordt South West Hertfordshire (part) (Hertfordshire)
South Western Bristol North EastGloucestert Taunton (Somerset)t Tiverton (Devon)
Wales t Brecon and Radnor(Brecknockshire and
Radnorshire)Cardiff West
Midland t Birmingham, All SaintsCoventry Southt Kidderminster(Worcestershire)Stoke-on-Trent South
Scotland Dunfermline BurghsJ East Fife (Fife)t East Renfrewshire(Renfrewshire)t Glasgow, KelvingroveJ South Ayrshire(Ayrshire)
•County constituencies are followed by the name of the county in parenthesis; the rest are borough constituencies. All constituencies are as denned in the First Periodical Reports of the Boundary Commissions.Constituencies marked t are wholly or partly within conurbations (i.e. the largest areas of continuous urbandevelopment as denned by the Registrars-General). Those marked t contain rural districts.
'P. G. Gray, T. Corlett and P. Frankland, The Register of Electors as a sampling front(1950) London: The Social Survey.

Appendix A
sampled for ten days each. A polling district was worked for only one ten-dayperiod. The selected polling districts in a constituency were operated systematically,so that the sample covered, even in a shorter period than a quarter, should approximate as closely as possible to a representative sample of the whole.
6. During 1956, households in 838 polling districts (involving 16,760 addresses)were visited and 9,617 completed log-books were obtained, giving an effective
response rate of 57 per cent compared with 56 per cent in 1955. The proportionof children under 15 was 27-5 per cent compared with 26-0 per cent in 1955 and
1954-
7. The numbers of households and of persons surveyed in each quarter of 1956are shown in Table 2. The sample averaged 2,404 households per quarter (meansize 3-23 persons) compared with 2,613 households per quarter (mean size 3-19persons) in 1955 and 2,892 households per quarter (mean size 3-24) in 1954.As in previous years, the mean household size was smallest in London and greatestin rural households. The negative association between household size and the degree
TABLE 2
Composition of the Sample, 1956
ISt 2nd 3rd 4th
Year
HOUSEHOLDS IN
Quarter Quarter Quarter Quarter 1955 1956
CONURBATIONSLondonHouseholds 446 431 437 439 1,581 1.753Persons .... 1,378 1,284 1,317 1,351 4,904 5,330
Persons per household 3-09 2-98 3-01 3-08 3-xo 3-04Provincial ConurbationsHouseholds 461 395 369 428 1,899 1.653Persons .... 1.537 1,238 1,168 1,301 6,064 5,244
Persons per household 3-33 3-13 3-17 3-°4 3-19 3-17
OTHER URBAN HOUSEHOLDSHouseholds 1,171 I,I2O 1,071 1,070 4,676 4,433
Persons .... 3.8i3 3,021 3,557 3,389 M,77i 14,380
Persons per household 3-26 3-23 3'3« 3-17 3-16 3-24
SEMI-RURAL HOUSEHOLDSHouseholds 34° 295 37i 346
^1,352
Persons .... 1,136 995 i,234 1,199 4,564
Persons per household 3-34 3'37 3'33 3-472,297
3-38
RURAL HOUSEHOLDS • 7,642 '
Households 127 "5 88 97
3'33427
Persons .... 454 418 345 328 1,545
Persons per household 3-57 3-63 3-9* 3-38. . 3-62
ALL HOUSEHOLDSHouseholds 2.545 2,356 2,336 2,380 io.453 9,6i7Persons .... 8,318 7>556 7,621 7,568 33,38i 31,063
Persons per household 3-27 3-21 3'36 3-18 3-19 3-23

Domestic Food Consumption and Expenditure, 1956
-S ~ « «•S 5 • •
'•> o*m
0 O M O
tt
^3V» O O 0 0 O O M « o 0
1 25 ?l?r * 0 *«n ?
•
g
T3 O OOOOOOO
« « w « ; M
- i P o o o o o >oM ox; K •r o O O O O « O •»• K m M o CO m
P) M O CO o M
5,« « «0 « « m
=5J3u : rr^:::
Oo MOO*
f-> * Ov•<•
8« M 0, *1Q H MCO •
00 «^ « O O »1
^ .., •»• 0*00000 Ok (*1 IH«O H8
1
O'
»n <n o o ft * : o >^ «
"o N
•£ *^ «>»> m S
a. J • •£•s c o, ^ m OOOOOOO so m tt *s.(*i «n
O8Mft •->O •* **^ -tOO N
O § " £ °M o" -o «NO
1 ill*-., in fi w ^>o* ^o»H QX
8ft oo M m <O 00m ^
hi <O VOIS tx^ MOO •
N t* P) tn
§ t c •^ •n co «*iM
ts.8
m>orv ao O
ft M M00 ^)
.0 Q OO tx^OiM*x,O»* O CO
%* «" h) n
ti
»* to tOO**^^1^!*^
^ ts. -ts-OOWCOM
§
ft M n M ^
OQ tx MCO <oo> 1
^ W O M *too m oo t*.<5 * Ml
n
T
O w « fs M >OO 00?* N N M
"0Is.8ft «•« O *O « - m
«5 trij^-rg
«o<o
o
< n 0 M PI
>-, 05 m •*M Hox> « N O 1
& ««««»-« vo * M^0 J £^ ft O M ^
"% i
«« c J "? 1 . . . .g-o 3. -^• -
Otherhouseholds:
Adultsonly
.
Withadolescents(15-2
nochildren
Withchildren(0-14)
Totalunclassifiedhousehold
1'otalallhouseholdtypes x:"° a K3 i'o'g
|| ||l--^|Jj
Totalofabovehouseholds
• . .S •
•S
7^i P '
l||s*§ ili&lj
C u u„ -SS3
line i
x « < ^

Appendix A 115
of urbanization is more evident hi the 1956 analysis than in the previous Reportsbecause of the separation of semi-rural from purely rural households. The proportion of persons living in rural (including semi-rural) areas fell to 19-7 per centin the 1956 sample compared with 22-9 in 1955, 23-9 in 1954, and 21-6 hi 1953.The Census (1951) figure for Great Britain was 19-3 per cent.
8. Table 3 gives the distribution of the sample by household composition withineach social class. Although the income limits denning the classes were revisedin 1956 to allow for changes hi money incomes, the percentages are not strictlycomparable for those with earlier years because of the change described hi paragraphs 4 and 5 of Chapter IV, by which households in Class Di were reclassifiedon the income of the principal earner instead of the nominal head of the household,
TABLE 4Age and Sex Composition of Social Classes, 1956
(per cent)
\Di Da All
At A2 B C (with (without O.A.P. house
Men, 21-64:
earners) earners) holds
Sedentary . 19-2 17-7 "•5 8-1 n-8 6-3 0-8 10-8
Moderately active. 0-9 5'i I2-O M'4 2-2 — O-I 10-7Active or very active 2-7 5'9 5-5 7-0 1-6 — — 5-5Men, 65 and over . 3-8 2-0 1-8 3'0 6-1 21 -O 32-0 3-9Women, 21-59:Sedentary . 25-8 22-5 19-8 I7-5 16-4 22-9 3'3 18-8
Moderately active 4'5 5-3 6-6 9-1 14-2 O-I 7'3Active or pregnant i -I i'5 I -2 1-8 1-7 — i'4Women, 60 and over 4-6 4-2 3'I 5-7 14-3 38-4 62-6 7'3Adolescents andchildren:15-20 male. 2-6 3-5 3-0 3-8 5-2 0-6 — 3'315-20 female 5-3 2-9 3'5 4-0 5-5 0.9 O-I 3-65-M 20-4 20-2 21-6 16-9 15-7 6-3 0-7 18-51-4 7'9 7'3 8-6 7-0 4-2 3'4 0'3 7'3Under i . I -I 1-9 1-8 1-8 I -0 O-2 — '•7
IOO IOO IOO IOO IOO IOO IOO zoo
\
who was often a retired person or widow living with an adult son or daughter.Under this rule nearly half the Class Di households were transferred to a higherincome grade. Class D differs widely in household composition from Classes A,B and C, with a much smaller proportion of family households or younger couples.There were more older than younger childless couples in Classes Ai and C as wellas D, but fewer in A2 and B. As before, the average household size was somewhatgreater in Classes Ai and B than in A2 and C. The number of children per household was as usual greatest in Class B. The two-child family was the commonestsingle household type in Classes A and B, but in C there were more one-childfamilies.

zz6 Domestic Food Consumption and Expenditure, 1956
I
3 *It
IIIInS> ^^*•-•^?
F1>aaiM o
O ONO OO O1^1>r>ooOM
•g • • •
1 Jrilii*- j

Appendix A 117
.—
4
i
«a
•iH
*J3*•*
«** m A OO** *• rt\ •ItO « « Is,O O «0 CO 00 IS M Is m «noois M oMM M
., ft •* oo A is.eoo» -* M o oo tnoo
11
|M H *»&"- 8
• A A •*• A *•M IS,M •>•>•»>- gM
is *« «t oo moo « * M «SO M«
O aO M 10 « CHO M h* «»1« A ts M OM
2
1' 8
|M
« A 00 to « AtO ft O *••O 00MO mm ^oo M ? m •*•tsoo M oMM M ts M O
1tO <n AiO co •*•m n «*«***•»
1•*o M m tsOM is. -n n ooo M o
•sE 1
MM MM M OM
oo m M ix wi« M oe 00 M« O Vt
«r|MM «) -r- O<OM OO rtfsto M g
M
1 i A A A A moo «t OO •• • M«|
4sAO <n -*- A>OM oo rt fl ts *s M oM M M O
M
1 ON vt •*• ooc««i is, o to ^ is n
1
A^ •* n <OAM o « M o^vo« OM 0
*vM M
M
MAOO m M •*•f> ix ««00 «*o A m m A<O M o <*>m o oo M o« 0M M
M
fi M » « *. «tOts « ~ OM^an
II MO «*• « ISOOM OO ""*" §1 3.8 5 wto *n » ^ m M m IS.M A A«
1
OOO A "*i O\<OM <OM O
OO«OO tft M«tO M is M oa is o
1AOO IS. rt O to « toet n^ooixfi o
H «ts. ^ ^ oo AV> n |s.«tx»0 A
i OOA O\ •* O^O to «n-*« >oM oM O
llfL 1 ?ttf 1.I|. i a .11 1 1 l1||"..:iiati"& m j Q u « J SHOO S
•lllis * §ll| I slr??^lIss^AStf 5* 5 c S t!5 u 8un<< u ov><< 5
S S & st <

118 Domestic Food Consumption and Expenditure, 1956
vO
to
£
1
3* «. tx »ix 0 tv m o m
•S^g 1 J** «T "2iS"
•3 O O 00O M M » ? i 5
§
$- , t . ^ .- N o 1 7
,«
.. •5 <O00 O O>Moo>O o •*•
| 1 ^°""""2'5
Q'C J • M« »nO « O** o o
£ 1N oo « m «n11m
%I26
1 o *s " * m* * ^ "ft'S
1r
oo 0 « M rv <nm 0 0
**
•ftT mOO•«•M M § 1s
|| 0« «M - « N.^
!•§ • M 1
§•0
1« mmM »
, •*& w -a osmo o r^
811ot
M
j
—
J''
Is. M * O — O OO
§?l1
s «2iS*»-
C1
k e
II'<
O
• ro 1
1|
"°° SS* mtx
00 « 0 ^ »00 « 0 m
I I
- 0»O ^ ts M (0i1?1
| I « «*0 -ts« 0 «
SocialClou
3
" *"• !§'
"a i
No.ofhouseholds
No.ofpersons
I!
.as .^^B.
<<muQDd All

Appendix A 119
9. Table 4 shows the age and sex distribution of households in each social class.The removal from Class Di of households with an earner in a higher incomegrade has left that class with relatively fewer men than in previous years, but morechildren and adolescents. In all three sections of Class D, women outnumberedmen by more than two to one. Class Da contained a fairly high proportion ofwomen under 60, who were living on small unearned incomes, but comparativelyfew men of working age.
10. Table 5 gives the distribution of households and of persons in the sample,by region and type of area, and compares the percentages for persons with thosederived from the Registrars-General's estimates of population. The two distributions are in reasonable agreement except for Wales, which was under-representedin the sample (cf. Chapter VIII, paragraph 145). There were also somewhat toomany informants from the smaller towns and too few from the provincial conurbations. The age and sex composition of the regional samples is shown in Table 6.The average household size in the North Midland and Eastern area and in Wales wasappreciably greater than in the 1955 sample, though still less than in Scotland.As in 1955, the conurbations, and especially London, had the highest proportionof sedentary men and of women whose occupations were classified as moderatelyactive, but much the lowest of active or very active men, who constituted under 2
per cent of the sample in London compared with 15 per cent in the rural areas.The proportion of elderly men, but not of elderly women, was lowest in theconurbations and highest in rural areas.
11. As explained in Chapter VIII, paragraph 144, households in rural districtswere classified in 1956 as semi-rural or purely rural. Table 7 indicates that the socialclass distribution of the semi-rural households was more similar to that in theprovincial towns than to that of the remaining rural households, which resembledLondon in having a relatively high proportion in Class A, but differed from allother types of area in having a considerably higher proportion in Class C than in B.

Appendix BTables of Consumption, Expenditure and Prices
TABLE IDomestic Food Expenditure, 1956 All Households
(pence per head per week)Percentage
of allzst 2nd 3rd 4th Yearly householdsQuarter Quarter Quarter Quarter average purchasing
each type offood during
MILK AND CREAM
survey week
LiquidFull price . 27-84 28-28 28-94 29-53 28-65 96Welfare 1-13 i -08 i -06 1-09 1-09 21
Total Liquid Milk 28 -97 29-36 30-00 30-62 49-74CondensedSkimmed, sweetened . 0-08 O-IO 0-07 0-12 0-09 2
Whole, sweetened 0-19 0-13 O-2O O-2O 0-18 3Whole, unsweetened 0-91 0-99 I-I2 I -IO 1-03 33DriedNational . 0-09 0-07 0-13 0-12 O-IO 2
Branded 0-28 0-30 0-40 O-29 0-32 IOther milk 0-04 0-08 0-04 0-05 0-05 ICream .... 0-72 0-97 1-06 0-81 0-89 13
Total Milk and Cream 31-18 32-00 33-02 33-31 32-40
CHEESENatural.... 5-56 5-70 5-92 5-96 5-78 67Processed and packeted . I -20 1-36 i-45 i-5i 1-38 23
Total Cheese 6-76 7-06 7-37 7-47 7-16
MEAT AND MEAT PRODUCTSCarcase MeatBeef and veal 26-36 25-39 25-30 27-58 26-21 81
Mutton and lamb 14-88 17-48 17-67 16-17 16-55 61
Pork .... 6-28 4-86 4-07 5-55 5-19 *4(«>
Total Carcase Meat . 47 -5' 47-73 47-24 49-30 47-95
Other MeatCorned meat 2-22 2-72 2-97 2-37 2-57 3iBones 0-23 0-16 O-2I 0-27 0-22 5Bacon and ham, uncooked I5-CO 14-86 14-90 15-23 15-00 86Bacon and ham, cooked(including canned) 3-26 4-39 4-51 4-02 4-04 36Other cooked meat (notcanned) . I-78 2-47 2-O9 2-16 2-12 22
Other canned meat 2-84 3-5° 3-37 3-48 3-3° 34Liver 2-40 2-70 2-56 2-65 2-58 3<>Offals (other than liver) i-37 I-2I I-OO !-46 1-26 20Poultry 1-78 1-77 2-10 1-91 1-89 4Rabbit, game and othermeat 0-13 0-06 0-04 0-17 O-IO ISausages, uncooked, pork 4-35 4-13 3-94 4-54 4-24 39Sausages, uncooked, beef 2-62 2-31 2-43 2-51 2-47 28
Other meat products 3'35 3-35 3-M 3-45 3-3* 4°
Total Other Meat 41-33 43-63 43-»6 44.33 43-n120

Appendix B 121
TABLE—I continued(pence per head per meek)
Percentage
of allISt 2nd 3rd 4th Yearly householdsQuarter Quarter Quarter Quarter average purchasing
each type
offoodduring
FISH
survey week
White, fresh 5-86 5'43 5-33 5'53 5-54 48Herrings, fresh . O-22 o-io 0-24 0-27 O-2I 4(a)Fit, fresh, other. 0-22 o-35 0-4! O-I2 0-28 2
White, processed O'QI 0-83 0-74 1-04 0-88 IIFat, processed . O-6O 0-36 0-47 0-62 0-51 9<a)Shell 0-39 0-70 0-62 0-58 °-57 6Cooked .... I-83 2-09 2-28 2-17 2-09 23Canned and bottled - 2-44 3-07 2-72 1-86 2-52 21
Rib products . o-45 0-44 o-35 o-43 0-42 9
Total PiA 12-92 13-37 13-16 72-62 13-02
SGGS .... 17-73 16-38 18-55 18-84 17-88 88
FATS
Butter .... 13-47 12-71 12-81 13-06 13-01 87Margarine. 5-92 6-02 6-01 6 -20 6-04 74Lard and compound cooking6t 2-75 2-50 2-50 2-82 2-64 n.a.Suet and dripping 0-75 0-48 0-47 0-74 0-61 16
Other fats, oils and creams . 0-13 O-22 0-26 O-II 0-18 2
Total Fats 23-02 »i-93 22-05 22 -93 22-48
SUGAR AMD PRESERVESJunes, jellies and curds 2-22 2-49 2-04 2-02 2-19 30Sugar .... 9-04 8-98 9-88 9-62 9-38 91Marmalade I-I6 1-23 1-23 I -08 1-18 2O
Syrup, treacle and honey . 0-65 0-58 0-52 0-68 0-61 IO
Total Sugar and Preserves . I3-OJ 13-28 13-67 13-40 13-36
VEGETABLESOld potatoes 12-13 9.92 2-50 7-68 8-06 02(«)New potatoes . 0-59 7-85 4-89 — 3-33 27(a)Chips .... 0-87 1-13 1-18 0-93 1-03 21
Criip. .... 0-15 O-2O O-2O 0-14 0-17 4
Total Potatoes . 13-74 ly-ZO 8-77 8-75 12-59
Cabbages 1-51 3-27 1-17 0-97 1-73 35(a)Brussels sprouts i-53 O-II O-IO 1-98 0-93 2o(a)Cauliflower 0-60 1-32 I -02 0-89 0-96 I7(«)Leafy salads
Fresh legumes .Quick frozen legumes .
0-68
0-030-66
2'430-310-62
0-973-33
0-470-300-39
1-140-990-47
29(a)i2(a)50-21
Other fresh green vegetables 0-06 0-21 0-04 0-05 0-09 2
Total Preih Green Vegetables 5-°7 8-27 6-84 5-05 6-31

122 Domestic Food Consumption and Expenditure) 1956
TABLE i—continued(pence per head per week)
Percentage
of allhouseholds
ISt 2nd 3rd 4th Yearly purchasingQuarter Quarter Quarter Quarter average each type
of foodduringsurvey week
Carrots .... I -22 i -19 0-79 0-96 1-04 4'(«)Other root vegetables . 0-84 o-53 0-48 0-66 0-63 *4(a)Onions, shallots, etc. . 1-90 1-71 1-17 1-41 i-55 47(a)Miscellaneous fresh vegetables 0-78 2-25 1-83 I-lj 1-50 26
Dried pulses 0-go 0-76 o-35 0-52 0-63 16
Canned peas 3-20 3-43 1-84 2-58 2-76 4700Canned beans 2-19 Z- 12 i -80 2-06 2-04 4'Canned vegetables (other than
pulses) .... 0-38 °-57 0-26 0-23 0-36 6
Vegetable products 0-07 0-06 0-06 O-IO 0-07 z
Total Other Vegetables 11-48 12-62 8-58 9-67 10-58
Total Vegetables 30-29 39-99 24-19 23-47 29-48
FRUITFreshOranges 3-'i 2-50 i'53 1-49 2-16 3i«Other citrus fruit 0-87 0-80 0-60 0-63 0-72 '4Apples and pears 4-52 5-3i 4-25 4-41 4-62 53Stone fruit 0-09 0-16 '"77 0-13 0-54 9(«)Soft fruit 0-29 0-68 2 -O2 0-58 0-89 9(a)
Quick frozen soft fruit O-OI —Bananas.... 2-75 3-59 3-76 3-2i 3'33' 45
Other fresh fruit 0-30 0-42 0-25 0-14 0-28 5Tomatoes, fresh and quickfrozen 2-52 8-19 8-44 3-7° 5-7i 6o(a)
Total Fresh Fruit 14-47 31-65 22-62 14-29 18-25
OtherTomatoes, canned and
bottled 0-90 0-93 0-63 0-77 0-81 15Canned and bottled fruit. 4-26 5-78 5'« 5'39 5-i4 46Dried vine fruit 0-78 0-87 0-94 1-86 i •ii 18
Other dried fruit o-37 0-36 0-29 0-46 0-37 6
Nuts and fruit and nutproducts 0'59 0-48 0-33 1-72 0-78 iiFruit juices 0-52 0-42 0-56 o-59 0-52 5
Welfare orange juice 0-09 O-IO o-n 0-09 o-io 3
Total Other Fruit and FruitProducts 7-Si 8-94 7-98 10-88 8-83
Total Fruit 21-98 30-59 30-60 25-I7 27-08

Appendix B 123
TABLE i—continued(pence per head per week)
Percentage
of allISt 2nd 3rd 4th Yearly households
Quarter Quarter Quarter Quarter average purchasingeach type offood during
CEREALS
survey week
National bread, brown 0-78 0-86 0-910-89
119
Brown bread — — n.a.National bread, white . I3-5I 15- 10 14-68 9*National bread, milk, white . 0-26 0-19 0-16 3
White bread, unsubsidized . 0-12 0-17 0-19 '5--H 3
White bread, large loaves — — n.a.White bread, small loaves — — n.a.Wholewheat and wholemealbread .... 0-77 0-89 0-83 0-82 0-83 18
Malt bread 0-15 0-17 0-17 0-15 0-16 4
Other bread 1-77 i -98 1-96 2-39 2 -O2 3'Total Bread 17-36 19-36 18-90 20-94 I9-I4Self raising flour 2-70 2-61 2-51 2-82 2-66 45Other flour °'73 o-75 0-77 0-94 0-80 13Buns, scones and tea cakes . 2-09 1-50 I -22 1-57 I -60 3*Cakes and pastries 7-88 8-60 8-52 8-72 8-43 t>3Biscuits .... 8-62 8-90 9-00 9-32 8-96 81
Puddings .... 0-63 i -08 I-I4 1-09 0-98 16
Oatmeal and oat products . i -19 °-73 0-45 i-ii 0-87 I5(a)Breakfast cereals 2-33 2-97 3-i8 2-76 2-81 3»(a)Rice .... 0-83 0-71 0-61 0-72 0-72 18
Cereals, flour base 0-89 0-89 0-85 o-97 0-90 18
Other cereals o-93 i -09 I -02 0-99 I -OI *5
Total Cereals 46-18 49-19 48-17 5' '95 48-88
BEVERAGESTea 13-76 13-84 13-31 14-01 13-73 90Coffee, bean and ground 0-69 0-67 0-64 0-49 O-b2 5
Coffee, extracts and essences i -96 1-77 1-69 2-04 1-86 19Cocoa and drinking chocolate 0-70 0-51 0-52 o-59 0-58 9(a)Branded food drinks . 0-98 0-78 o-55 0-86 o-79 •
j1
;'•-.'.//Beverages • 18-09 *7'57 16-71 17-99 VSSMISCELLANEOUSInvalid and baby foods o-35 0-27 °"34 0-32 0-32 4
Spreads and dressings . 0-13 0-61 °-59 0-21 0-38 8
Soups, canned . 2-05 1-26 1-22 1-99 1-63 -24(3)Soups, dehydrated andpowdered 0-16 0-12 O-I2 0-25 0-16 3
Meat and vegetable extracts . 0-90 0-63 0-63 0-85 0-75 i?(a)Other (expenditure only)Pickles and sauces . 1-76 1-81 I-50 1-82 1-72 26
Table jellies, squares andcrystals 0-49 0-81 o-75 °-57 0-66 i7(a)Miscellaneous (b) . 1-39 1-42 i-59 1-48 1-47 37
Total Miscellaneous Foods 7-23 6-93 6-74 7-49 7-09Total All Foods . 3IT33 339-62 324-77 328-17 327-47
(z6s. 5d.) (285. 4d.)\ (275. id.) (2ji. 4d.) (271. 3d.)
(a)
Details of the proportions of all households purchasing these types of seasonal foods
in each quarter of 1956 are given in Table i A.(b) An analysis of one quarter's National Food Survey data suggests that of the expenditureon miscellaneous items, approximately one-fourth would be in respect of salt, one-fourthon vinegar, one-fifth on gravy salt and smaller proportions in respect of herbs, spices, stuffings,mustard, pepper and other miscellaneous items.

124 Domestic Food Consumption and Expenditure, 1956
TABLE IA
Percentage of all Households Purchasing Seasonal
Types of Food During Survey Week, 1956
ist Quarter and Quarter 3rd Quarter 4th Quarter
Pork 27 23 21 26
FishHerrings, fresh . 4 2 4 5Fat, processed 10 6 8 10
VegetablesCabbages .... 3° 52 29 28
Brussels sprouts . 3i 2 3 42
Cauliflower 10 19 21 19
Leafy salads 15 55 34 MFresh legumes I 4 39 6
Old potatoes 81 63 (a) 75
New potatoes 6 54 (b) —Carrots .... 52 37 3i 45
Other root vegetables . 32 20 18 28
Onions, shallots, etc. 54 49 38 46
Canned peas 54 56 33 45
FruitOranges .... 42 33 24 24
Stone fruit .... i 2 28 3
Soft fruit .... 3 7 19 9Tomatoes, fresh and quickfrozen .... 39 68 82 5°
CerealsOatmeal and oat products 20 12 8 19
Breakfast cereals . 33 39 42 36
Cocoa ii 8 8 9
Soups, canned 29 18 18 3°Meat and vegetable extracts 20 15 15 18
Table jellies, squares and crystals H 20 20 15
(a) 6 per cent in July-August (1955 crop) 76 per cent in September (1956 crop).From ist September potatoes of the 1956 crop were regarded as "old".
(b) 73 per cent in July-August (1956 crop).

Appendix B
TABLE 2
Domestic Food Consumption, 1956, All Households
(oz. per head per week except where otherwise stated)
at 2nd 3rd 4th Yearly
MILK AND CREAM
Quarter Quarter Quarter Quarter average
LiquidFull price - . (pt.) 3-97 4-04 3-98 3'99 4-00Welfare .... (pt.) 0-62 0-61 0-60 0-60 0-61
School .... (pt.) O-22 0-22 0-16 0-26 0-22
Total Liquid Milk . • (pt.) 4-81 4-87 4-74 4-85 4-83
CondensedSkimmed, sweetened . (eq. pt.) 0-01 O-O2 o-oi 0-02 O-O2
Whole, sweetened . (eq. pt.) 0-O2 O-OI O-O2 O-O2 O-O2
Whole, unsweetened (eq. pt.) O-II 0-12 0-13 0-13 O-I2
DriedNational . . . (eq. pt.) 0-06 °'°5 0-09 O-O8 0-07Branded . . . (eq. pt.) 0-04 0-04 0-05 0-03 0-04Other milk .... (pt.) ... O-OI ...
o-oiCream .... (pt.) o-oi O'OI O-OI O-OI
Total Milk and Cream (pt. or eg. pt.) 5-06 5-12 5-06 5-14 5'«
CHEESENatural ..... 2-41 2-47 2-48 2-45 2-45
Processed and packeted o-35 o-39 o-43 0-44 0-40
Total Cheese .... 2-76 2-56 3-91 3-Sg 2-85
MEAT AND MEAT PRODUCTSCarcase MeatBeef and veal .... 10-16 9-62 9-69 io-54 10-00
Mutton and lamb 6-52 7-68 7-45 6-98 7-16Pork 2-40 1-79 1-47 i-94 1-90
Total Carcase Meat ig -08 19-09 18-61 19-46 79-06
Other MeatCorned meat .... 0-69 0-87 0-95 0-79 0-83Bones ..... o-55 0-28 0-32 0-50 0-41
Bacon and ham, uncooked 5-34 5'" 5-03 4-95 5-nBacon and ham, cooked (including
canned) .... 0-64 0-81 0-83 0-70 0-74Other cooked meat (not canned) . 0-38 o-54 0-42 o-43 0-44Other canned meat . I'M 1-37 1-31 i'35 I -29Liver 0-82 o-93 0-88 0-90 0-88
Offals (other than liver) 0-87 0-68 o-54 0-83 0-73
Poultry o-53 0-46 0-69 0-67 0-59Rabbit, game and other meat 0-07 0-03 O-O2 0-08 0-05
Sausages, uncooked, pork . i -98 1-87 1-79 2-IO 1-94
Sausages, uncooked, beef . 1-61 i-43 1-47 1-58 1-52
Other meat products 1-81 1-79 1-66 i-79 1-76
Total Other Meat 16-43 16-17 15-9^ 16-67 16-29

126 Domestic Food Consumption and Expenditure, 1956
TABLE 2—continued
(oz. per head per week except where otherwise stated)1
ISt 2nd 3rd 4th Yearly
FISH
Quarter Quarter Quarter Quarter average
White, fresh . 3'35 3-14 2-95 2-97 3-10Herrings, fresh.... 0-27 0-12 0-27 0-33 0-25Fat, fresh, other 0-13 O-IO 0-18 0-06 o-uWhite, processed o-55 0-51 °-43 o-59 0-52Fat, processed .... 0-49 0-28 0-39 0-51 0-42Shell 0-08 0-14 O-II 0-14 0-12Cooked 0-79 0-89 I -OO 0-89 0-89Canned and bottled . o-54 0-68 0-60 °'45 0-57Fish products .... 0-15 0-15 O-II 0-14 0-I4
Total Fish 6-35 6-01 6-04 6-08 6-13
EGGS 4-40 4-50 4-27 4-24 4-35
FATSButter 4-38 4-78 4-82 4-80 4-70Margarine .... 4-5i 4-53 4-42 4-46 4-48Lard and compound cooking fat . 2 -2O 1-99 1-99 2-15 2-08Suet and dripping . O'62 °-43 0-44 0-61 0-52Other fats, oils and creams 0-O6 0-07 0-09 0-04 0-06
Total Fats ..... 11-77 II -So 71-76 12-06 11-84
SUGAR AND PRESERVESJams, jellies and curds 1-98 2-12 i '73 1-71 1-88Sugar 17-52 I7-30 19-13 18-04 18-00Marmalade .... I'M I-I4 1-16 I -01 I-IOSyrup, treacle and honey . 0-77 0-70 0-64 0-72 0-71
Total Sugar and Preserves 21-38 31-26 22-66 21-48 21-69
VEGETABLESOld potatoes .... 60-04 37-26 21 -O9 61-43 44-95New potatoes .... 1-05 14-79 33-56 — iz-35Chips 1-04 1-05 I-I7 1-04 i -08Crisps ..... 0-05 O-06 0-05 0-04 0-05
Total Potatoes .... 62-18 53-16 55 -*7 62-51 58-43
Cabbages .... 3'9i 5-92 6-09 6-16 5-52Brussels sprouts 3-77 O-IO 0-18 5-22 2-32Cauliflower .... 0-91 '•75 2-28 1-93 1-72Leafy salads .... 0-28 2-05 2-17 0-35 I-2IFresh legumes .... 0-04 0-46 ii -09 I-OO 3-I5Quick frozen legumes 0-28 0-27 0-09 0-16 0-20Other fresh green vegetables o-io o-45 O-2O 0-14 O-22
Total Fresh Green Vegetables . 9-29 II -OO 22-1O 14-06 14-34

Appendix B 127
TABLE 2—continued
(oz. per head per week except where otherwise stated)
at and 3rd 4th Yearly
Quarter Quarter Quarter Quarter average
Carrots 3-87 2-35 2-89 3-68 3-20
Other root vegetables 3'5* I -22 1-79 3-13 2-42Onions, shallots, etc. 3-85 2-95 2-71 3-56 3-27Miscellaneous fresh vegetables o-39 1-40 2-25 1-28 i-33Dried pulses .... I -01 0-89 o-39 o-54 0-71
Canned peas .... 3-74 3'99 2 -2O 2-99 3-23
Canned beans .... 2-53 2-44 2-08 2-39 2-36
Canned vegetables (other thanpulses) o-33 0-52 0-22 0-19 0-32
Vegetable products 0-05 0-04 0-04 0-07 0-05
Total Other Vegetables 19-39 15-80 14-57 IT «3 16-89
Total Vegetables .... 90-76 79-96 9' -54 95-30 89-66
FRUITFreshOranges ..... 4-78 3-°5 1-97 1-78 2-90
Other citrus fruit 1-07 0-94 0-62 0-65 0-82
Apples and pears 6-06 5-56 6-18 8-52 6-58Stone fruit 0-07 0-12 3-o8 0-30 0-89Soft fruit. 0-14 0-47 2-71 0-58 0-98
Quick frozen soft fruit3-58
...
3-56... —
3-40...
Bananas ..... 3-I4 3-33
Other fresh fruit o-33 a -07 0-83 0-17 0-85Tomatoes, fresh and quick frozen 2-05 4-i5 7-00 3-35 4-14
Total Fresh Fruit 17-64 19-94 25-95 18-68 40-56
OtherTomatoes, canned and bottled °-93 0-98 0-65 0-82 0-85Canned and bottled fruit . 3'3° 4-14 3'47 3-84 3-09Dried vine fruit 0-71 0-78 0-83 i-55 0-97Other dried fruit 0-25 0-25 O-2O 0-28 0-24Nuts and fruit and nut products . 0-32 0-24 0-17 0-83 0-39Fruit juices .... 0-21 0-22 0-32 0-25 0-25
Welfare orange juice O-It 0-13 0-13 O-II 0-12
Total Other Fruit and Fruit Products 5-83 6-74 5-77 7-68 6-5I
Total Fruit 23-47 26-6* 31-72 86-36 2T07
CEREALSNational bread, brown . 2-37 2-39 2-48
~i
2-38Brown bread .... — — — - a-3pJTNational bread, white . 43-82 45-61 44-34 -1National bread, milk, white . 0-70 0-46 o-39 -White bread, unsubsidized . 0-26 0-36 o-43 - \ 44-36White bread, large loaves — 36-76
White bread, small loaves — •| 4-3°J
Wholewheat and wholemeal bread . '•54 1-73 1-61 1-52 1-60
Malt bread .... 0-17 O-2O O-22 0-19 0-20
Other bread .... 2-32 2-40 2-34 3-u 2-54
Total Bread .... 51-18 53-15 5i-8i 48-18 51-08

128 Domestic Food Consumption and Expenditure, 1956
TABLE 2—continued
(oz. per head per week except where otherwise stated)
ISt 2nd 3rd : 4th Yearly
Quarter Quarter Quarter Quarter average
Self-raising flour.... 6-28 5'9i 5-68 6-25 6-03Other flour .... 1-76 1-76 1-78 2-15 1-86
Buns, scones and teacakes 1-83 I -22 0-99 1-32 1-34
Cakes and pastries 4-08 4-48 4-39 4-36 4'33Biscuits ..... 5-10 5'3° 5'37 5-41 5-3°Puddings ..... 0-46 0-75 0-78 O'74 i 0-68
Oatmeal and oat products i'55 0-96 0-58 i -35 i •!!Breakfast cereals .... 1-56 1-90 2-02 1-77 1-81
Rice 0-99 0-85 0-72 0-85 0-85Cereals, flour base 0-78 0-74 0-72 0-82 0-76Other cereals .... 0-67 0-73 0-65 0-68 0-68
Total Cereals .... 76-24 77-75 75-49 73-88 75 '*J
BEVERAGESTea 2-86 2-91 2-81 2-95 2-88
Coffee, bean and ground 0-13 0-13 O-I2 0-09 0-12
Coffee, extracts and essences 0-27 0-26 0-24 0-29 0-26
Cocoa and drinking chocolate 0-24 0-18 0-19 0-22 0-21
Branded food drinks 0-25 0-20 0-I5 O-2I 0-20
Total Beverages .... 3-75 3-68 3-5* 3-76 3-67
MISCELLANEOUSInvalid and baby foods O.22 0-15 O-20 0-18 0-19Spreads and dressings . 0-06 0-25 0-25 o-io 0-16
Soups, canned .... 2-08 f»5 I-I3 1-97 1-61
Soups, dehydrated and powdered . 0-03 0-03 0-02 0-05 0-03Meat and vegetable extracts . 0-16 0-12 O-I2 0-16 O-M
Total Miscellaneous Poods 2-55 i -So I-72 2-46 2-13

Appendix B izg
TABLE 3Domestic Food Prices, 1956, All Households
Average prices paid (a)
ISt 2nd 3rd 4th Yearly
MILK AND CREAM
Quarter Quarter Quarter Quarter average
LiquidFull price .... 7-28 7-22 7-70 7'74 7-48Welfare 1-83 1-78 1-78 1-84 1-81
Total Liquid Milk Purchased 6-52 6-49 6-88 6-95 6-70
Condensed
Skimmed, sweetened . 5-6i 5-61 5-22 5-69 5-55Whole, sweetened 9-94 10-16 9-90 10-18 10-03Whole, unsweetened . 8-34 8-47 8-45 8-63 8-48Dried
National..... 1-48 1-50 1-49 i '53 1-50Branded ..... 7-11 7-44 7-85 8-45 7-69Other milk ..... 15-26 I7-54 18-21 18-22 17-30Cream ..... 75-82 75-13 73-35 72-33 74-11
CHEESE
Natural 36-92 36-99 38-15 38-87 37-72Processed and packeted 55-06 55-56 53-83 55-41 54-95
MEAT AND MEAT PRODUCTSCarcase MeatBeef and veal .... 41-67 42-49 42-15 42-08 42-08Mutton and lamb 36-58 36-97 38-01 37-17 37-19Pork 41-87 43-63 44-32 43'72Other meat
Corned meat .... 51-63 5° '39 49-99 48-39 50-09Bones ..... 6-94 8-96 10-27 8-49 8-37Bacon and ham, uncooked . 45-25 46-88 48-56 49-29 47-40Bacon and ham, cooked(including canned) . 82-77 86-87 87-07 91-81 87-13Other cooked meat (not canned) . 75-18 72-58 80-20 80-20 76-76Other canned meat . 39
' 96 40-92 41-36 41 -26 40-89Liver 46-71 46-81 46-61 47-49 46-90Offals (other than liver) 25-13 28-74 29-34 28-25 27-56Poultry ..... 60-66 66-66 61-20 54-33 60-31Rabbit, game and other meat 36-81 35-59 34-92 35-04 35-70Sausages, uncooked, pork . 35-15 35-36 35-28 34-74 35-12Sausages, uncooked, beef . 26-10 25-92 26-44 25-69 26-04Other meat products 29-65 30-01 30-40 30-87 30-21
FISH
White, fresh ....Herrings, fresh ....Fat, fresh, other .... 28-0212-7927-80 27-85
13-9755-75
28-9314-0442-48
29-99 28-65I3-I331-10
I3-3739-38
White, processed....F«> processed .... 26-5319-63 26-15
20-2527-6019-23
28-2919-60
27-1419-63
Shell 77-25 80-39 93-16 66-16 78-45Cooked
Canned and bottledFish products .... 37-8346-82 37-98
72-01'48-12
36-41 38-76
51 -06
37'7°71-0272-53
50-28 48-87
EGGS 4-32 3-93 4-82 4-81 4-45

130 Domestic Food Consumption and Expenditure, 1956
TABLE 3 continued
Average prices paid (a)
ISt 2nd 3rd 4th Yearly
FATS
Quarter Quarter Quarter Quarter average
Butter 49-48 42-68 42-65 43-72 44-^3Margarine ..... 21-03 21 -30 21 -72 22-23 21-55Lard and compound cooking fat 19-95 20-08 20-10 21 -OI 20-28
Suet and dripping 19-52 18-29 17-33 19-53 18-84Other fats, oils and creams . 36-69 49-08 47-95 39-19 44-13
SUGAR AND PRESERVESJams, jellies and curds . 19- 16 19-36 20-10 20-33 19-68Sugar . 8-26 8-30 8-27 8-53 8-34Marmalade..... 16-91 17-27 I7-OI 17-13 17-08Syrup, treacle and honey 13-61 I3-4I I3-22 15-08 13-84
VEGETABLESOld potatoes .... 3-41 4-47 2-42 2-3* 3-19New potatoes .... 8-95 8-64 3-oo — 5-nChips. ..... I3-58 17-28 16-23 14-38 15-36Crisps . . . 48-73 55-73 60-84 60-16 56-00Cabbages ..... 7-28 9-68 5-02 4-34 6-90Brussels sprouts .... 8-86 23-82 10-19 7-50 8-26Cauliflower .... 10-79 13-06 8-68 8-44 10-09Leafy salads .... 4°-33 22-29 14-12 26-54 21 -56Fresh legumes .... 34-99 12-58 8-84 8-66 9-08Quick frozen legumes . 37-20 36-60 37-37 40-07 37-56Other fresh green vegetables . 16-99 IO-I2 8-97 9-59 10-66
Carrots ..... 5-»i 8-32 6-75 4-71 5'94Other root vegetables . 4-35 7-35 7-77 4-60 5-30Onions, shallots, etc. 8-33 9-47 8-00 7-°3 8-20Miscellaneous fresh vegetables 33-28 26-87 15-82 15-58 20-34Dried pulses .... 14-22 13-72 M-43 15-35 »4-3iCanned peas .... 13-69 13-77 13-46 13-81 13-70Canned beans .... 13-86 13-90 13-81 13-78 13-84Canned vegetables (other than
pulses) ..... 18-27 •7-58 18-72 19-69 18-27Vegetable products 22-81 23-42 21-37 21-86 22-31
FRESH FRUITOranges 10-46 13-14 12-39 13-42 11-89Other citrus fruit 12-93 13-49 15-55 15-64 14-09Apples and pears.... 12-60 15-45 13-10 10-06 12-62
Stone fruit ..... 21-44 20-59 10-09 7'73 '0-54Soft fruit 32- '5 28-17 22-04 20-47 23-35
Quick frozen soft fruit . 44-40 32-00 33-oo — 38-00 -
Bananas ..... I4-03 16-10 16-94 15-46 I5-65 ,Other fresh fruit .... 15-07 8-32 10-77 14-08 10-83Tomatoes, fresh and quick frozen . 19-78 31-72 20-47 19-61 23-10
OTHER FRUITTomatoes, canned and bottled 15-66 15-33 I5-58 15-17 I5-43Canned and bottled fruit 22-99 23-24 23-83 23-42 23-37Dried vine fruit .... !7'44 17-78 18-11 19-22 18-35Other dried fruit.... 23-32 22-86 23-67 26-01 24-02Nuts and fruit and nut products . 29-55 31 -62 3I-30 33-05 31-88Fruit juices . 38-65 31-02 28-39 38-04 33-68Welfare orange juice 13-69 13-33 I3-36 13-33 13-43

Appendix B
TABLE 3—continued
Average prices paid (a)
ist 2nd 3rd 4th Yearly
CEREALS
Quarter Quarter Quarter Quarter average
National bread, brown .Brown bread .... 5-24 5-82 5-88
7-ooJ5-96
National bread, white . 4-94 5'3° 5-3°«
National bread, milk, white . 6-05 6-59 6-68 —White bread, unsubsidized 6-99 7-49 7-06 — . 5-49White bread, large loaves — 6-37White bread, small loaves — — —. 7-34JWholewheat and wholemeal bread . 7-98 8-19 8-24 8-62 8-25Malt bread ..... 14-00 13-35 12-80 12-86 13-24Other bread .... 12-17 13-21 13-42 "•33 12-74Self-raising flour .... 6-88 7-°5 7-08 7-21 7-05Other flour .... 6-67 6-83 6-97 7-02 6-87Buns, scones and tea cakes 18-32 19-70 19-61 19-03 19-02Cakes and pastries 3°-97 30-72 31-09 32-03 31-20Biscuits ..... 27-06 26-84 26-82 27-57 27-07Puddings ..... 21-87 23-04 23-28 23-64 23-05Oatmeal and oat products 12-31 12-25 12-48 13-23 12-59Breakfast cereals .... 23-91 25-04 25-28 24-92 24-82Rice I3-4I 13-41 I3-49 13-62 13-48Cereals, flour base 18-29 19-23 18-83 18-93 18-80Other cereals .... 21-99 24-09 25-10 23-19 23-55
BEVERAGESTea 77-09 75-96 75-70 75-88 76-18Coffee, bean and ground 83-77 82-20 88-23 82-79 84-24Coffee, extracts and essences . 116-87 109-99 114-04 114-22 113-90Cocoa and drinking chocolate 46-14 44-79 44-78 43-8i 44-96Branded food drinks 62-26 61-48 60-38 65-05 62-45
MISCELLANEOUSInvalid and baby foods . 26-11 27-65 27-35 28-05 27-19Spreads and dressings . . : 35-86 39-12 38-50 35-7° 38-08Soups, canned .... '5-78 16-15 17-18 16-15 16-20
Soups, dehydrated and powdered . 75-34 69-93 91-98 78-60 78-05Meat and vegetable extracts . 87-37 83-42 83-21 86-93 85-56
(a)
Pence per pint of liquid and other milk and cream, pence per equivalent pint ofcondensed and dried milk, and pence per shell egg. Otherwise pence per Ib.

Q"i
fc B-s'3« «OMrr *ts. r-~
I IM M«
as=3^
CJ
9 5ex f-a<
I*H ^1
3 I<A
I•c
1
si
.e* 8 | 3
* M N n »
o
£ a IX N OkH I i- «•> M« CT. OOM • <o
IN w ^ •*
VI M
0 •*\ 0 Mi 1 1 1 1 1 I
1 ru-i [\
v%1 1" -
. 1 I 1 1 i
1 *1>103 ttfOO
O "->-*-* °0«0« «n
1 1 iH «o
1
*<^n O
im v^ O •**
m o «0 -r0 1 1 :O '• O «o
•|*H w m fN. * W00 «n >o <i
1 I iis,o i 0*M <?> o M •0»
m fit
•| i 00 *o H. O >- »-» o M1 1 i
O O
m IN >o« (s. oOIs O •»- «oM
«f N O P«Noo Is <O f^
dn 1 1
=
1 i»rt »O M (7,00 00 M —
os MQO •I oo
1 1 iO 0 O O O o o
£!•*-0 «0
0 1*
1
a. 8 s H N H 1 « M 4
.H
N OIs. «Ott Rll i M o f» •»00 N
ft* *« ttj
<•H
<*l•*r*«n«rt ki
K i* ^ "S O is. <*> rs m ^4- «0 v Is, M * n
. lr»i n o * m M n 0>v«•-1 « O O • O
•£
*«OM •o M n rs o ? A . r . r
t Ss_"3 fl M <^ .• -a M o •* eO Cl 0
§ 4r»S 00 O> IS, 0 0 M •1 M M : o ' o* «0
o i
»n<*1 s 00 « M N(t « 00 •t •*o>o>
•nM
•*
fc 8 ';3 »xis. > M« 10 to o M n mo »
Si*! m M ts, m IN,Is o M fl •*^-Oi *.'
s
H s (^
£
4
00 O «0 to « M\OoO«
«0 »nM•**N*
•* •* ag
5, « ** 10O tH
t - "3 n ts O c i - — *O o Om 1 io
^
I Sg^a OQtn ••* « Is, V t
p
M M •l
0. 4 n w M 5" i n ft 1 io oH H
1 *MMCO 0. n M M
is «n*0 OO 00 rt *-O
w»«omO M SN
>*So •••
| 3
*QO <i P»« 00 £
MMCO^ft •-.* •»1^0 * H
<•»C*.QOO
Mn •*CT.
M
7*0to/Afttt,Cream
andCheese
Milkandcream
Cheese
.
Meat,carcase
Bacon
.
Othermeat
.
TotalMeat
.
Margarine
Butter
.
Otherfats
1
J3
1
"?
S S
132

Appendix C 133
q«1>1 1 i I i i I \ \ 1 M-
tx1 i
oo
.e
i a1 i i i i I \ \ 1 1 1- * 1 i
o»rj
Ml toooO sO V, o^c V,
! 1 i 1CO o
" fO<*)« M Cl«* s o
_, a
- M •g m n ts 1 1 i 1o =
a|
g
?a
4$>i K '*§•a
"C 0t N M V( V MM ^ >00* ^ ^. o
I M O O O * O O O « O O •» O ? ll 1
t ~ 'o
- oooo m M N mm 00 ts O 00 v, 0 ft o 3(3 8"
s O IS M O M H M O ^ «M « OQ f>* 0 •OjJ S
si i
1 * M o : o •;
O O ? O 'I O » « M to ll io o o Oo c o O o o o o o o o O o H *-a |
II
a^S"S *O<OtxOO
ft]•*N O ", MO-0 a 0 o
0
5
-S
M
o£
a
. . & -» o o o N O 0 0 no™k,
gS 1o o o o O o o o o o o o
is 1^ t 5^2 j
* 7** ? »? « :| ^
« *
s
-5
- S u
•2 «> §g
a
M •OW M 0000tO «** s I 1 2
OO
1
„ *% 0 is ? o
OOVI
4
fe
" "3 H o H §2^H n.1^8 s =
2 *: * • ' '
r
M **> .
Os I
. V. •*•v g^S
•*• oo Is .- c 00 -« IN, -* M0 o « N
s •o
*
1
o.««M
0 H
1 s
g *
* 00ts 9i>0 o -•» 0»« (N 00 N •
a 1- ^
«0 H
8
hi
a*H o
'l1 : 0 1 i 0 M O<O OO O o
0
•5 f
< ill : 1 i
O r* m
i < go O M O fN OS o o
I
•Sa^s MMOfl A o o 0 s o 0
o Ji &.C Ms
I w ntt o, 00 S'5 |
°* M O O M « •"" p* rs Hit»
h " "3 J.^U
| a, §^3 5 •C u £ "ntfi 60M ^
$ ;? Is O »1>O s «" ot>0V
| B|I|3
a * M ft V) fl MOtOM N
~O
SugarandPreserve
Potatoes'
Greenvegetables
Rootvegetables
Othervegetables
TotalV*xetablf.s
Freshfruit'.
Otherfruit
.
Toro/frut*
.
Allbread
Flour
.
Ochetcereals
TotalCereals
Beverage*
1 TOTALALLFOOD
, - -
IS;-a

134 Domestic Food Consumption and Expenditure, 1956
-nta ~y ^ill< "•« SiV
I
u.
&
fc B'ft'5 rr ao\ \ i r
* 7 :>-r ri
| 1 1 1 1
1a, 3 g " - •"" *I•1
a -S * 1 1 « i •o ^i o ^1 1 1 1 1 1
6 *H tS *•1 1 - ' I 1 1 1 1 I
SO O •*« W •?
! E<a
M M
i £i s lift o I 1 1 1 1 I7 ? rr*?
s
1
|41*1
10 "? >nO >n o ?111
•Oao« oo ?ro ^ O 0 O>M 0 M
I 0 « **»<* -, e M1 1 0M M * «H n -
'i • o : 0 * O M K o O o - O O O •
i 41*1 s« i O « O i » £ 1 1 i « « o *« »
1 iM 00IN O t-
aO
1 1 i- o o oo o o o
A
o o 0 o o o o o o
j 4H":8
O « ON
itN
I 1 :O 30IX M
*
i
M aoao 0 *
s ioo
oo01 1 :
- O 0 O Cso 0 boo o o o o o b 0
«.?*§"3 fs tN ,. 00 M-' -, ^. •o *>« « «
1 *«„~ •*« tx
.cOvO
so I o
so IS to « oM ? 5
Ia ISS 'S
. *
1 S ? N 55," 1 CT,0 »1 ^s •*•
5
1 « &~
[j 5 *fc <; n tv <t«v
c- 00 •-•N
5
N " o o : o o i*~fl »
B «« -o O fl O -> « « M N H O 9>(• "^ VI
• O O *
I 45*1 is S! O O M - - • O O M n o H »
o i 55 IS.« ^^ - M rx to ** * •*o>« «
t^
t ~ "3 R.H « H OO•«• -i H 1C H o m 7> n
a
a.SI*§ " * h, &».^ s M M * 1 : 0
$,
•i
f*co r
•*! O O i f1 0
-- '*' -000 o 1 1 : •
45*1•n>n
1 0 0M « ft V O ft CO V)
•i
** •*
H U"°° OS * « o m « O « *
| o « s o r^« -. O « M t. ^ « 00 M« Ix* >
£ «
s
0 0
s fc Sv.'a0 - -. O «00 -. o « M^ o\ oO Ol* « OO i
^
a. 8 3 o w
5 5 2 -
ft . 0 9 „ 0 Ol N ^ M 0. 00-0 iO 0 * 11ao « «o o,
3 "1 ' «t M M " M N M * tn M ""
Tata;AfiM,Cream
am/Cheese
.
SugarandPreserves
Potatoes*
Greenvegetables
.
Rootvegetables
Othervegetables
I
Meat,carcase
Bacon.
Othermeat
.
TotalMeat
.
Margarine
Butter
.
Otherfats
.
TotalPau
.
TotalVtgtlablts
ua s
I 1

Appendix C 135
w-Ica-cH
*,
1
Q•5
fe S^"3 i i 1 1 Ud\ 1
oo
<£S^s to H
a i i 1oo
1 1 0«0i 1
>OH
«Ohs*<
u IN OttO >n1 1 i 1
^ OONO »n «
C *• >••
1 ?l**00 •o
I I ; IOO f*(>,^O
r. « H«H
O«
'§
4IN O n ?1
>•n« «***•* •*
Oi •0OO O0)o
CO«"t «o kit«
8 i«-»nO O
ts. 9<tx rs (^ m »n
1O WOO ^ O b •0
| £NO O O. •*O Ov
M M (O•^t^«nrs.o oo
«« H
I i <r«0 0« ID N QO •O
H<o
O?
s.O 000 o
b0 0 O O O O O l|
.S e-v'a
oo e% <0 « m « oo 0
03•£3^2 <*»
*i
I£
tX M <* » 00 0- •o 00
s O O O O O O O -
•^ IN rs m Oi 1 «n fnm O
o»o3
.1!•T)M (V H
* ^ 00 M 01 H
tv n Min*o«0
2 a ft tx O *n«0 * <-( 10
5
SsVa« 10 s ** Pt IS, ? m n
§
|*• 3 2 ** n
>£
?*<o O sC-IN.\O
WO".Okb
^0 0 > o <o
N
IN 00 O H<*»«*>0O 9. •*
b0O
* •f •** >(^O
•§
u i M M n *Nm fs O •lH <")
1
IN vo1 0>o H m M ^fr •*
b0
O M O A* ao bo
1
"1
i: Oi «O•*Ol «0 no o 00OvQ* O MOO1! KH
o*"»
IN 9t vi0 0
>N\o <n»n v» •* m O
3»4
\<O•*tvM OD
«n0 b
I oo m *^ « M tV O •*b
•»« 0 0 N »n•*O ^o
«O3\
1 IN « H. ^>*^vO00 u-iwi * O
0H*"*
tno<ooo
H N3
3
1 3^-? ? 50>0Irt « O 0 00 «O«0 H o\
o^•*M rn O*fn
il iAU
bread
.
Flour
.
Othercereals
TotalCereals
,•2
TOTALALLFOODS
i 1
o
| nI =
S 9
§1 Is•°l §z
SL«j?
=1
21
-I -sl
.9s -o^
s .
S 2 .36-a &s
fl U4
8
•o
!
^"l^S«3^.2 o, S «
^2|-°•3 " * -O* gag
1111iiii
•5
3

134 Domestic Food Consumption and Expenditure, 1956
vO
O•Sj
I
Q 4hi £J 00\ \ I
•H
mtrto •* «o o o o 1 1 1 1 1 1
1 a «n«• 00 lit •o 00v> •O W00 OV) M ^ 1 1 1 1 1 1
*hl Elts,
1 1 i ? 1 1 1 1 1 i* --
.•
~r-' •< -1
I i :« V) II" o 1 1 1 1 1 I
7
V o - « *O
| 4hi t 1 1 1
-.
>O<n•*• ? « o 0 •-•- H'Co * •O rr>^ ^ 0 M
\ \ •* -. «,
2: t o • ! 1 o 0 - o o o *
1
4hi js r o
1 1 i
•«••*•>oO
2O - O"1
A IDM Q M
i
•H00 o. M m « •o ^. 0
1 1 :
- «M M 0O O 0 O O 0 0 o 0 o o o o i
. -a n w O M Ot ^ IS. H
1 1 '•• O 90ts H „
0) CMS 2
' n «-iGOQO 30 o * - * O MH
1 £
OO
3 •22? 5.
\ \ '•• ts.
o O - O 0 O •1o 0 O O O O o o o o o o O
feS^StS is. V 00 IT, ? » ? p»
1
r *r ^^. 0 1 i
.« H •" -
5S 3 IS.H 00 *
1 S
* w J | o»oto PI
4s-*!
•A(1
'"
•*•OV>H
« ts,« K
I
ao « N 3, * a O O : O O >O V « w
H
1 «M
• O 0
v. - ^5 wo a O>w f «, 30 • ^ » n - •* »oo •i
*«*! * « S! O O i-> • N " :0 : e o M M O M *
u * £ 17 - H M "* " ™ M v»c i •>
fc - "3
is, M ^ •-iOO•* P, M •o - 0 « ft •) ^
=-8^a M * •0 IN.X.N N M M OOOOO * oil: eM (H
"• (S.OO •n ^asm H n O « H* 00 ^. ^
M M *«If-t O O 5
M in ?« S i o M : •
4hi .0 « 0
1 O O
« « „ •»•Q M OO „
1
ir^ (I Is. 1^1ao CS * * 0 m « o M *•N
1 o « - O rs » •n O n 1 T .
n Moo n to Is•o •*
n« « f.
*
3 fc - "3 0 '•
".hS o «
5 - 3 -
£j
3 zs S O O\N
00 O •*
5
tn S 00« >On M oO
1 3? "5 f
Tata/.Ui.'A.C'r<am
andCheat.
Potatoes'
Greenvegetables
.
Rootvegetables
Othervegetables
Milkandcream
Cheeie
.
Meat,carcase
Bacon
.
Othermeat
.
j
Margarine
Butter.
Otherfats
|1
1 I
1 1 1
V)

Appendix C 135
Q 41*1 1 1 1 1 U \ I0o
*o H
a3 1 1 1
CO1 1 0
as\ i
>.•n-I 0s rxN
iH CMO »n1 1 i \
^* 00 o « o
=3| 8>o HJ * •>
ll 11E i
ft <Ofs. «n
>n1 1 i I
QO ^sH O tNi»» 0
1 £H o « ^ «O« M Ot ooo O
Si->O' - -r •n
(1tft HM
'GIE 0\ tx tv S's -g sm «tO O
(S p">
>Ml •n *j c 9 o
i * O MOO o o •o *i !zNl'° 1-s•=* S V
|t B*-,8a. 8*8
o o 9tr»•*•O <T> *t m
*<.o 0QM Ml*i
M M M HI CO rv
:1 •«!
i
* «0 0« W>C1OO «n m N ?* O O O O H o
- ^ * a
."§ fl§
m t tj . "a oo Ix "•> f* m « oo 0 |s l|
CQ
g
41*1 *0 *o 0i «n*O o^ te IBu 5 7; 5
I
it
rs.M OD W 00 <^ >n
^ .38 -S|s- ? ? . . ?
8 * a uo o o
S 2 .2. -5
K g ^ "3 CNm o m "^ M o» O -s «.s^ *r*S 10~ ts. i 1 « C( O o •l IS S7
s 5 S g
,c
1
•* •*m tvw
00 M 0 tx. IT) CO 00
iSlllaa o
•f- 1 ? <*•> «1 sH4
fc r'^'3 0 *> H>0
i-*m rx mOCi i <• •
sis^a M CO •O•*Os 0<•»
MM
»i;
r
•*«ao o
O 0 fs.0WO «
Ov PI•o §>*• O o
B
* s^loo m N
<*iMOO* ^"O
OA •*O*o oa ? 8
| a. 5*8>*<
o •o -5
•3 S
4 2 &
u
1
« M c^ tx m ts 0*^
c*J
„ D.
2 ou •
*N is>o >
1C^>oO
a !o M O tv oo
i ai4 u 0.
0Wl»f CT\M O CTi
«0 «o00
< io A<«»
•i
-sM
iM o»m ^frHvO>o*O >o *
om 3O-*
3 8
» 0 0 O •*»N OQ«l
0
If 'I -S ^ii
OQ«n <n « M fS. 0 * tfl f*l•3|«£S.2 >-
O O h, *n •*0 <odo o
%
s £H^<n« 00 Ti o
(^
«n *o O StlJ
"a M M •o^t- O 0 0
a x-33,a ic to at g
91 3
M ^>** <0 •*o « 0 o 00 « 111!o 00m M•4-M ro
•o M OvH o* o w u u >* ^££.S
if *i£g£ Allbread
Flour
.
Othercereals
TotalCereals
Beverages I
TOTALALLPOODS
*•£ &X•1
£§ •s
o

136 Domestic Food Consumption and Expenditure, 1956
8
Q
1o
I
3 11 I
s
§5I
Iii
«8*gO 0 •o
\ \ -Vft
« 0 o •^ IO OO -• *o o —•k.B VI 10
s a en ts.I In *< OO IM
IN. ; <nr^
0 *M 1 Is Hi a>c 1 1 1 1 1 1«ii-.
S r *l•^
1 1 i 1 1 1 1 1 \
3j t rv."3 >0N «* 10* M Os *s. *n9 Si^s <*O > OCN CT- o. M o 1 1 1 \y n'g
1
O i •*• » fs WOO «0 M1 1 1 \o : O ^oo r* O
S iS^I tv N a «0psN »x 00 M1 i 1
1
°« u g ">>• *t
(5 i « *V) O
«»TIo\ M r*O O O
ts.%
O O O 0 0 Os O 1 1 1 iO 0 0
1 t S'-.'sH « n » •*tv 0 N »
El_e* IPs f O *+• V «0•* ? 0 N 1 1 1 1
arn
O
«-) •*•«o•*O O 0
«»•
rNO
O1 1 1 1- o o o o o
•^ ,Mtj- M>0 tx OO « o CO M00 « N
.c "<• 1 •
"i «t"°
<n
9
£O « «
8 15, <«1 - mo« 00VCsfl |.3
O 0- Ot1 «*1
(N S8•* ^« «"»
fc S--.20 •4- o N w%O «0 ^ *o to rt w»
£ s *s * O >n N M O <^ o «n o o = oc C1
•t
*in •n N M tot >>
*•*«O : : i
NOo : o « O M
tS^'3 c<•*<^ 0 M CO 0 fs, •* H M «|
1ol S S 00«N w, 0 0 M ^ o N o o • ••*•
8OO«1MO H •°M : Is. 4 vt M M ^ ?i
?BO s^
K - "w 0 m N
£ 5*2 *o to O ft »n<o *fto <o iOCvOO
'»
<zs
M <H M
N \0 QO rs ««o «0 •* n O ts.n Ov ™ ** ^»- OO•*•* Cv o vt O*mo 0H "^
4MtV « 9i tx CT*m 00
00Mw 1 I !•
•Ot<n *
««O M to
s •*
1 oi* a >0 « M tS N CO *
1 : :? O w M H M «H
s i SO -O m H O M « PI «o •* n ^ >x fo
3&<Sa *a o -
S s IN
13
M VI ^*n* ro txO ** > 0 O M M« •o« m >-,
«to r^«-i»o IN.
•IM M M H
TotalMilk,Cream
andCheese
Milkandcream
Cheeae
.
2 S
TotalMeai
.
Margarine
Butter
.
Otherfats
13 E
«2£SraO
.G«
1
"5
£ s2

Appendix C 137
<H
Q feS-,3a. 5*8 \ \ \ \ \ i \ \ 1 1 it, ? 1 i
o
aB
1 .2 \ \ \ \ \ i \ \ 1 1 1" -
1 i 5
u fcSvS H «•>M t". ^ r> r? •>i 1 : •? 0
i a. v> a « •o - 8I o
§ i » f " " «* ». -o 1 1 i 1 5M *
.•s
t " "3 00 0 B| 5
a-Pg 0 0 0 «tt S"*10 is *| |
g
. O.H « « n M H **»0 n to v §| §i • HI o O O 11
O • 0 W 0 0 n o •
1|
^^
c t s^a OOM fWltQ 00 «« ? w 00 « ., 0 fv o ga %S
1
a. 5 ° a 5 Z% BZ
I |p •?
o ; o HS0 o o o 5 O O
Oi Jo
g a" s«o o o O 0 000 C o o N s S =j!
••~ "3 0.01S* O O m ^ <*«<* ^ M 0 «Jj2 j"2
1
•Ss^a 0 - 0 m £ " ° ^ w^^
S o
fi JiI! 18i M o O OV)o :
•* •*•IN •o0 n C O Oso o o o o o o O 0 O 0 O
B S 1 §«•- "o - •»« *-. « o oo 10 « „ o
.K *I_J
: 1 „„„ Ov " " * fl o" 0 «> S
1 i 0 « u
S a 1"** § OO* :|*- « S
> e
s K • O '"
1 S"
fc
" "3 ll1 . " &
1
=. § ° 3
\
S"1"* S S"S a
°^dl^
-t azr •
)
1? O i-. O • O - • O 0 MOM » 0 o o
>• B "5 t* M M *NOO •o •r:•* oo 00 NO ^ M o 5
•rSs^a O M M 0 M 10 O O o J "1 •* a 0
S
r
M oowo tr>
^ *«! K M »N01 00 M I 1 «
1 &
s- 1 1
t ~ 'o n M H i»no< „ _ M 0 2 g
a. S^s oil o 1 0 o ~ 0 10 0 o 0
1 as
H 0 1 1
>
1 0H ^ *r, M ^ „ M ^ Q |
o o HJ O -0 o o 0
Ix
•< "c
,K is1*! «o o o « o O O on %
o o0
i i
1 1 - 1
ta «1O O W •o •J" •* Cl k if :
3 fe S "3 00 ^ M M •*• C- <•.tx 0 OO(ON > M M 0 *$i&I a-S^a (4 tN O O M " O 0 * 0 mo> 9> o o fc- llh
3
•3•« B £
1 u
s ao 0^ 1 «>«>!
SugarandPreserves
Potatoes1
Greenvegetables.
Rootvegetables
Othervegetable!
.
TotalVegetables
.
TOTALALLFOODS a|ll
& >5»S J5
Freshfruit'
.
Otherfruit
.
*
Allbread
Flour
.
Othercereals
1
Beverages
Otherfoods4
. « n n •
"5

138 Domestic Food Consumption and Expenditure, 1956
a §>
Q IN » «o M
H1 I -t*> •x OO *
«^« Ot it Ok
1O>M N •*• MttS O *"l
5
n ^f
Ua M S
i I<n « •nM ; *o
1
&
| *I>1OO •0
00 IU *s •o
1
i 1 1 1 1 1 1 i M
fIO «n
i i
" H1 1 1 1 1 i
M
1 t «•&! %
<o» >o o «o m1 1 0
>oa. 5 * 2
n o S fO O O
f>
'1r o • 0 Crt0 M Wj 0 1 1 :
fc S^"3 « « ft OtH <O »n «o m M
*i^l ^ « -«>f>M O H
•1M 00 1 1 '•
•
O
g H|
iV i « o «s MOM **J o 7 \ \ •: ;
CQ «H •*»o «"»
fci o A*^
S1 0 *n \ \ •:
KM
a i
« *O rl? of^ 0 ?
\ \
'M ;0 000
T>•- "3 O *
!*J«a. 8 ° g M **!
H «l M Mr M
| S5m M
*fraois, m •• •* «
M«•* nooo ootn m
«0 M
z .5 "6«n 1 o* T"> Oi
0^*»
H S
b s^'a 00« >»• • 10<o ^ M M H •* w^ VI
I
a, s 2 M 0 •* IS W W H<">M *x O O : o M
1 m M •0 t*»« Is (1 M 0 M M ti
o o • MOM t- o M • o • 0 O
b B. •» M 0 s O>n oo OQ •^ « ft «•* ID
i IH M O N•OO O O S M w : o '• o O
|
trtM
«OM-l s>Ol MOO Ot
Nto O«
«o *•» «
?
*oo<nH «0
M
h Sw"3 00 M Ot •*o>o ^ 00 m M <SOO <o
'S^i * •* *»
hi MC Ix H
«^o m « *00 •e
a
<^
« M V> w O «-O N O( 00 <*)O O o\
•i « •* 0 d rs fs >
n O« —-~ r SG
*I>100« H ovwtoo <S O*
«O<0
1 ii <•)•«
o>* <t-«H>OM>O
"8
«n o
1
o\ « N IX Pi M Is Ot <t M •I
s * w 00M -
! 4«>1VI M <n
«nK 9>O\ao n m
»n SO O
MO**«Ti10«
S <0M MM
<n o > OJH s H
! 3
ss O «»1«Ti ts.O*«^
M«« O>* ts o
* « is. O* *> r* -r 3d «e^M
« n
7'fra/Afi/it,Crtam
andCtuest
SugarandPreserves
Milkandcream
Cheese
.
Meat,carcase
Bacon
Othermeat.
Toro/Af«ox
.
1 1 Margarine
Butter
.
Otherfata
Tora/Few
.

Appendix C 139
CO-C
Q *H 1 1 1 1 \ \ 1OO «o o
i 1 1 ; <* \ iQN
5 1 1 1 1 I i i 1 1 1
rs *x\ I
Oia -T-
H
IN m «•Ottn 000
••o1 1 : \
<••. 00 O>to w «
^f>«n i 0
OHM
f*S O»Hi IH %
nOi «*» •i
«1 1 :
k•— \
wj
=31 |T9
d-Klcnts ts.«n « 10b. »> 00 N *• V f <i o n !
•a•55
M * M Mo
?| i"C
«j COM M « «•» rt w > * •*» M- 0 V) ss s1
E M O O 0 « O O o MOO ») 0 f"t
?l 1,«S^2i- 2O
H
§=3 |§"1 BI *§ S|
33 So5U e-a^S i <«•* « «o m w
O O^o^ « O fr» * n ts
g-s >sMO : o •-. o o o k| O h8 8 J|o o o o O O o o o o O o 0 N
Si ••«•- *!•*! .... O o.05 « S
•3 3 ••!
.K~ • M et
"-=3 a§| i S'SS? (t. ?s »0 COinto« 0 0 <o(^ N ?a =
«l
3 «• S
i?
d o ta
o-S 1|fc
.si -s|
T.5*1^Iv s . ^
3
1 •* rri Mm Moo v^ M 0 <q
: 1 M1 * o> m 0
8& «so. m M <o ki O N
s" '2%
I 2" u*3 1 M M00
0 -*•* o
St n GO
•* ^*-
M
e
: 1
* M« M «« 00 ss g.aI N <OOi !••.
»OOi «
* •28 2-a
s 3 °S
S a SB^H13
« CO« «C (*) O 00 •0 •00 '0 tx r to s s* • S ST« o ?« 3a, 8 2 N C^ a
j V 8
s
M Mi22o^;
i £
i H1 .92. 5
3^1^2.... O 1
1
*• S 2 M «l8
•§
u -a
0
1
M M M 0 M •1 *a «*»'« «n ? 1 S
8 JM «l
£
= i
4hii. - "aM s
« 5oil: o ' O o M O « ^ o Oo
3
H
3 1ft. M N ^ ^ »OW M "O w <o O Q g
«• oil: o : O o « c r-- «o 0 o Ov •O 1o g
1I*
«H 0
< c
* <+H>O M «C 0 0 0 oo tn r* Os«to o N 3 •
1 36£ •P.: g,
* ?" ** P| *N 1*4= tg-ji m «nN oo •e « m « » tx » «0 ^ •* o l|s^
3
*< S 2 M <no
HJ!
g
•o <*•* O > M •* >0 0** fO «oo 3
M o« J-33-o5^g
a 3 3 3
w
*s. >o m Oi in00
M
"24
^33 =•BU" >
gt a c c
_._-..-.
Potatoes1
Greenvegetables
.
Rootvegetables
Othervegetables
TotalVegetables
Fre»hfruit1
.
Otherfruit
.
TotalFruit
,
Allbread
Flour
.
OtherCereals
7*oio/Cereals
Beverages
Otherfood*4
TOTALALLFOODS

140 Domestic Food Consumption and Expenditure, 1956
10
£
I"I
1-«i<j $W 'C <i,-1 § t?nil£ J^J•tevA
L.
|I
Q fc rV.2 rr ^>1 I* o> ISi m ae>ft « <o
.C "•5^8 S M »t - #) ^>
g
S 2 OC« n1 1
n « «nM ; *o
fc u»l*K tx i: a
1
0 1 o o 1 1 1 1 1 1
r "I»n1 1 .= 1 1 1 1 1 1
•« IH•5 1 1 io •r o >t- « « M rx*->tn O
1"C m •^ r^en«o« o •-
»n *O
o
f o = 0 •» o 1 1 :*
| *M«-»h C\ O eo
N «1 1 i•o «n
tn >• OQ o
VH M
•*. i« •*HI m O»
**M «o
£0 O *e •-.O M O
1 1 :
•
4hi0 0
H « m tv %•^tx
1 1 :03 «no •^ *om« o •*r H
1
1•o «0 «OvoflO O M J-.
1 1 :g - . . .
*•£ w"3 ts (O O ^ i T H « n *•*HI« hi^;4 S^2 M tn >n 0 1 « K. o o> « « o •a
.C s H M •i
t** •* 0
O S.,5 O 00 « O M ^«^^S
f- «V 1 «0
Oi tN. M HI HI««Ox> t»»
••T
*?0» r^•* H 0 eo m Ol (^ •* H. * »n
*S*5 « o > MlO HIM HI N.«
o 00 b b : 0
•^ i
tOM •0 M H,« IX M M M HO O o « O HI 1*1 o M : o : 0
fcS'&'S<6« 00 <OM «
0 0 HIO ooOM tn f>
1
a, S * S *NflO in H n : o '• 0
' •* «n
0. •*0000
<*it^•o« M 0-1 0 00 n **) *-l
P
Ci M
fcS-fcSa. S ° 2
m m•*«
0 — --•.-'• -• T
Oi*0vO •** Oi
'•+*><£>act
«0•H «•O <* IX
s
M ™>
S.
Cs« f*> *O«"»r*« ift Ov
fn >o C4 0 00O*>O tx
>•«4 •*M «0 •^ o * to
*">H ^
4HOi M n M Ov« s «
1 O O<^
i ^ m "i«1enMao i> »o oM <«
1
m ft 0 * ••*•« •o sN <o M M t*M « N <o OSM« IS. w * I O O OM M
3 fc gs^'gO.O •o 00 wCO (N. 0 « O QO-* <«
2
•Ss^g Oi « H H -
I 3
M « r^ M *otxin «nN
>•^^IS. oomN w tnm «>o
r*.« ^> S, "»-
r^H '*"
TotalMilk,Cream
amiCheese
Milkandcream
Cheese
.
Meat,carcase
Bacon
Othermeat
i
Margarine
Buner
.
Otherfats
.
in
1
a J3nin "3
£
Si
A''
£u

Appendix C 141
il «I>1i i i i i 1 \ \ 1 l!i * I i §«
•Ia
i I i i i 1 \ \ 1 IIs oI i
5
v. *. -a
N
o UM «« to * * «n 00 ^ N i i ; 1o
e •n n (O
is i
M \o m « «•**M** *»•
i i i I
M t^*9-
9l 5^ t Ss,"3 0 91 i
;jja <IM o * M PI
p 8
1 i
O M « « <n C. M <^ r* ^-oo o< >1
l| 1^»•Ss^'S
« o o o * 0 0 O MOO M 4
S3 |§£§*a 5§ II
a H H
J3 89
i M"
O 3 O00 N M V| rs M Ot
O O O•o o O -* I"
O 0 0 O
s 0 0 o <0
8I 1-
t ¥^"3
e 0 0 •"
R« 51^
«i*l «1 'g'8"^ "a |
0)
•
« ?*2 (^
I I
0 -H « -r« O O O
>o • ? is. m N •^ ^.v
S
o : N O M >•N o« ^ S
*Ma S a &. *, "a
1 -i I H *no T- : 1 ;,
M " 0N „ 1 « s
.c
1
•i il '3|
i: aM
I ts « 1 ? <^ •* *^
^ £S ^M N NV
tg 3 s 2
h. •• "3
l|r|a£5*1 - O C D •/,
5- « O « N S 0 o
O
EM n M
H 5^gt I
4
i
, ^ .3Zf a
4H
o M o O O •l 0 0 ° K,2. w •;•
o M O M MM
|1
»ft M O H o «n*^ O H
-3
N t-1
1 ^" ?
M MM »0 M »« M rt *XM
* «•»O 1 9<n
"C
1 |
fc Ss.'a r , , «« . « «l *•*M *X '0 N <n f S *
£§*§ oil: O 1 0 O M O « N O o H
•
Ft
Q f« H «•) C1 n <sfnoo •e (t M ^»>
1
1
H o 1 1 : O 1 0 O M O O> H o o ONN
• *M « O O crt 0* o : O m M o\ «o o oo< S
'CM
a 3
1 O « w « « fO <^ •*w « -i M tn A'
* &
M <« 4XS'§ 4
« »H«
1s k. a "3 0 00 « O
sill4I>1 «t to O O M •N o o " M mm S o 0= .§•1*
& -g-SSfl
1 3 M M H m «n Oi •o^«
<S
M»gSlls
S 3 a-3
SugarandPreserve
Potatoes'
Greenvegetables
Rootvegeubles
Othervegetables
TotalVtgetabhs
Freahfruit*
.
Otherfruit.
7*oro/FrUK
.
Allbread
Flour
.
Othercereals
{
Otherfoods'
TOTALALLPOOD &5£5
IBeverages
"H(S

142 Domestic Food Consumption and Expenditure, 1956
I
: '^N
it» IM ft,
fc Sv's r r »\ \* 0 • ^ -0- „
e';a. 8 * 2 17 M - * 0
ia•9
n ? M" * 00 S •CM . - \
541*1
•*» lit o 1 1 1 1 1 1 rM H
fi *|*I I ; 1 1 1 1 1 1
••
1
|41*1
* *• V m N oo TI I ;V 0 •n ft O b
1 i f •?rr t- fl Mi i :
41*100 rr: r 0
1 1 :
In 5 sO o 0
j. -??OIN rgs so 0 M
1 1 :
fel-s'S r ^rr T r 001 1 :
ca. u 8 " N
1i f •2 :•oSS1^ J o
I 1 ;O O o o o 0 0
* I*-":?*« ft OO M •. n »n 0 m ft SO
c 4 i °8 « f K,S R
I .2 iff « a. on 1 <O i >0 S Slw '1
—
t r «v.^3 C.GO * -T C O o OO « « » <o M
5<£§*•$ *no *
-J- M 0 •g o oO o o : 0 M
. *H W| »N rt » M M _ M m
t O O O MOM " O M : o : O e
t. - •g 00 * ft « n O ^ « O m n -»
i
*!** « 0 *s;
0 0 n • O t* : o : " •
f H. O-0 « C. M ts
n :
"
:
•* *
*1V3 •?r r -r -r - e m c rr? «
"• u a M N " » M H •»
tt. f r o * O ** •i in r •* •*» r
M " M «i " - •*
41*1M O nt ? f * 1 ^c 00 •*• M o
c1 * ^ N :•: 1
0 «
1 O 0 o
4 fc Svl! f ? •
u
"< 8 * 2 K, - " «
m 3
m <4ftOi O «moo o S
J* - « « «^ g 2
To/a/Milk,Cream
andCheese
SugarandPretervei
Milkandcream
Cheeie
Meat,carcase
Bacon
Othermeat
J
Margarine
Butter
.
Otherfan
TotalFats
.
2
jq
M

Appendix C 143
Q
| *H 1 1 1 1 1 \ \ 1 \\l « 1 19O
v\
S MM \ \ \ 1 \\~«0i 1
O.a *»•
N
0 4M IN O tn M 5 COM NPI \ \; i I H
O
_e to M 9
!•2 i
0 •*N -. <n 2 M f*»« s1 1 : i
M^«
1 4*>1'0" '
OO
•s
'CA
C>>-«'-«N •* W t-l «•> O r^r- «•> M <">
1f s
Jfc c •*-"^
M o
1
">«8 ° a H H
ienw M NM O O O
«Ok, t* M 5YNft IN •c.
so 0
O O O O O v%^
aT £*•»! «"0' o
e
i» H O O O »1 o : 0 «0O M •^> •l
— 0 0 O O 0 o O o o o O H
fc S«_"3 • * r r 00 o « *o 1w Oi IT) 0
• <U*2 1 «* M o. V o »»• : 1 « ^ O M
1 "-£*O>« «0 «n*
>r»MtxIN M:
o M Ow*n1-1U •J >o NOD^N Nr^
£H 01M O m •o n M m M 12,
o 0O
h)
|
s
•-« f) « M »* H N « w» O«IN<O «1 M •sp)H
i *M -lei **• 0 0 H M •**r\w
V|•^O o
O
1
*«
i
-r.j"1O <—, >»•«rj O 00 00 •OfO « HM M Oi
Oiro tO>OM
•n*n o
^c
,3
IN i II : O 1 0 O « O ts o O 0
o
a.. i | | :
N
1 0ft •1 tx •* 0 N ft M Pk
* OH
t S^"3 W O»f>N s * O « t* O IS A M «n ?
1
41*1 •* O O ft QO O O o m m (N IN O O
|
ft O
>• Kl O O M <o 0 0 2"""° O *0ft «N
I t E->1 ft n Moo >• * M rx IN M m «t <o «n o
o
1
a. 8 *S r* M <*1
3
«nrs.•*•M Atx00 OM (O BO
<0M00 «n 09 «> *ot- HM N
t> *O* OO
•8 OQ
CN
fTU)
Potatoes'
Greenvegetables.
Rootvegetables
Othervegetable*
T0<o/Vegetables
s"
TOTALALLPOODS
Freshfruit*
.
Otherfruit
TotalFruit
.
Allbread
Flour.
Othercereals
Tora/Ctreals
Beverages
Otherfoods4
.
h S>

Appendix D
Sources of Fat in the Household Diet
1. When arrangements were made for the analysis of the National Food Surveyrecords for 1956 it was thought that the total quantity of fat consumed and also theproportions of this obtained from animal and vegetable sources might be ofnutritional importance. The table of food composition used for the nutritionalanalysis of the records was therefore designed so that the quantities of fat ofanimal and vegetable origin obtained from any food or group of foods could becalculated. In compiling this table as much information as possible was obtainedabout the composition of margarine, cooking fat and other foods containing mixtures of fats. It was, of course, necessary to make assumptions and arbitrary decisions on these matters because of the varying chemical composition of margarineand cooking fats and their varying usage in such foods as cakes and pastries.On the basis of the amounts of animal and vegetable oils and fats used in the manufacture of margarine and compound cooking fat in recent years, it was assumedthat 18 per cent of the fat content ofmargarine and 37 per cent of that of compoundcooking fat was derived from animal sources.
2. It was at first intended to present the results in terms of total fat consumptionfrom animal and vegetable sources respectively by the several household groups.Since these plans were made subsequent research has suggested that, with the typesof fats eaten in Great Britain, totals of this kind might not provide very meaningfulinformation. It now seems likely that the actual fatty acids constituting the fatseaten by the various groups of the population may be of much greater interest andimportance. Nevertheless, at the time ofwriting the nutritional role of any particularfat had not been established and the very detailed Tables i, 2 and 3 were compiledin the hope that they might contain information which would help to throw lighton the unsolved problems of fat metabolism. These, therefore, give the individual,as well as the total, quantities of fat from animal and vegetable sources obtainedfrom the main groups of foods. Table i shows the results for the whole sample andthe various social classes, Table 2 by family composition and Table 3 by the differentgeographical areas. In interpreting these data it should be borne in mind that theyare derived from quantities of foods entering the kitchen and that no allowancecan be made for wastage in the kitchen or on the plate: it seems likely that wastageof the fat of meat either on the plate or as dripping will be greater than wastage ofother types of fat.
3. The detailed material from which Tables i, 2 and 3 were compiled has alsobeen classified to show the consumption of a few broad groups of fats which maybe of physiological importance. These summaries are given in Tables 4, 5 and 6.The groups given in these tables contain the following types of fat from Tables i,2 and 3, though it was not possible to estimate the quantities of pork fat in porkpies, which is included with the fat of "other meats", or of lard in pastry or anyother cooked food, which is included with the fat of "other meats" and "otherfoods". Lard, although shown separately, may not always have been satisfactorilydistinguished by informants from compound cooking fats.
144

Appendix D 145
Tables 4, 5 and 6
Milk and milk products
Margarine
Other visible fats
Pig meat
Other meats
Classification in:
Tables i, 2 and 3("Liquid and other milk
•jCheese
L Butter
Animal and vegetable fats from margarine
/Animal fats, other than lard, and vegetable\fats from "other fats".
rPork1 Bacon and ham
| Pork sausagesI Lard
FishBread and flour
Other foods
r Beef and veal
J Mutton and lamb1 Animal fat from "all other meat" exceptLpork sausages
Animal fat from "fish"Bread and flour
(-Animal and vegetable fats fromPotatoes, fruit and vegetablesOther cerealsBeverages
Other foodsVegetable fats from fish and "all othermeat"
4. The most striking feature of Table 4, the summary of Table i, is the similarity in pattern of fat consumption between Classes A2 and D2, each of whichshows in many other ways middle-class characteristics. The similarity betweenClasses B and C, predominantly manual workers, is also marked. The other interesting point is the unique nature of the Class Ai pattern, which shows especiallyhigh contributions from milk and its products and "other" meats. In general,however, it is clear that in all but old age pensioner households class variations intotal fat intake arose mainly from variations in the consumption of milk and milkproducts, including butter.
5. The material for classified households from Table 2. is similarly summarizedin Table 5. The variations, both absolute and proportional, are very marked, theextremes being, as might be expected, the adult families and those with 4 or morechildren. The most noteworthy points are, with increasing family size, the increasein the proportion of the total from margarine and the decreases in the absolutequantity, and to a much smaller extent in the proportion, ofmilk fat and meat fats.Comparing younger couples with the largest families, the couples obtained abouttwice as much milk fat and more than twice as much meat fats per head as thefamilies, but milk fat made up 33 per cent of their total, pig fat 18 per cent and thefat of other meats 19 per cent, compared with 29, 13 and 16 per cent respectivelyfor the families. Though the couples obtained nearly a quarter less fat from margarinethan the largest families, this comprised only 10 per cent of their total, comparedwith 23 per cent of the family total.

146 Domestic Food Consumption and Expenditure, 1956
6. Table 6 gives a summary of the sources of fat in different regions and typesof area. The uniformity in the total quantity of fat is striking, all areas receivingwithin 2 per cent of the national average, except Scotland which obtained about
6£ per cent less, though there were some marked regional differences in thesources. Wales obtained more fat from butter (see Table 3) than any other regionor type of area, and also more than Class Ai, and less fat from margarine than eventhis class. Scotland obtained less than half of the national average amount of fatfrom pig meat and less than half that consumed in any other region; it obtainedjust over half the rural average. The patterns for London and the South Easternand Southern regions resembled those for Classes A2 and D2. If London is excluded from the comparison, the country districts obtained more fat from milkand its products and eggs and less from meats than the towns. They got more fatfrom margarine than the semi-rural areas and smaller towns but less than theprovincial conurbations. The only consistent gradient from London and the otherconurbations to the remote rural areas was the downward one for the amount offat obtained from "other meats".

Appendix D 147
TABLE ISocial Class Variations in the Sources of Fat in the Household Diet
(grams per person per day)
At 4* All A By-i
Animal
fat/« total
Animal
fatfat totalfat
Animal
fatfat
% o/total
fat
Animal
fat
Vfat %of
total
fat
/1m-
mal
fat/«%o/total
fatfat
J milkrmilk .
Z7-2 14-60-8IJ-4Z-2
z3-8z-zZ5-8 Z4-0
Z'OZ4-I0-9
13-00-8ij'40-9
Z2-J
z -o Z-I 0-8
T3-Jmilk . '5-5 if-6 '4-9 76-9 JJ-O ,5-0 '3-9 x*-J
». . . . 4-4 3'7 4'3 3'9 4-3 3-8 39 3-6 4-z 3-8
15-2
* . . 21-6 18-4 z8-o Z6-2 zS-8 .6-7 15-5 Z4'3 14-7
2-9•zinc
rfiti
F«» . .
4-0 3'4 5-0 4-5 4'9 4'3 6-z J-6 6-213-4
»9-7 '3-S 36-7 ,7-4 13-0 36-7 lg-4 JJ-O J«-7 '7-3 T4-3 38-6 2«-5 ^•* 3«-5
4-4 3'7 4-1 3-7 4-2 3-7 3'5 3'2 3-3 3-1
.- i veal
on2nd lamb .9-67-2
3-2
8-2
6-z7-67-02-7
6-86-3
2-4
8-z
2-8
7-2
6-3
2-J
7-2 6-65-72*2
7-36-5
2-3
6-86-1
2'76-2
2-4 2-Z
T5-0Carcast Mtat 20 -o 17 "0 •T7-J *5-5 18-0 16-0 'S-* /«•< /6-.T
a and ham, uncookeduusages
ther meat
8-2 7-02-5
8-42-6
7-5
2-4
8-4 7-43-5
8-2
2-Z7-6 8-0 7-3
z-93-8
Boom u-ij Or/wr
2-9 o- z o- z 2-7 o- z o-z 2-0 3-D0-6
Mt . . - n-3 0-« '3-S ,5-* 0-6 H; IJ-S 0-6 r«-j T5-7 0-7 *5'' „•« a-. T5-I
1 -O 0'2 I -O 0-8 0-3 I -O 0-8 0-3 z-o 0-8 o-4 z-z 0-8 0-4 ...
utd Vegetables ' 0-1 0-7 0-7 o- z 0-7 0-7 o- z 0-8 0-8 O-I o-7 0-7 0-7 0-7
1 . . '•30-35-6
z • z
0-36-2
1-3
0-35-9
Z-2
0-37-0
'•30-35-7
z-60-35-8
i-50-3
1-60-37-1
r .
r cereals z-7 z-9 z-80-36-6 t-7 6-9 z-7
0-3
5-9
I Cmab 1-7 7-2 7-6 '•9 7-S 8-4 J-« 7-3 8: 1-7 7-7 *-7 '•7 7-9
nga . 0-3 0-3 O*3 0-1 0-2 0'2 0-3 0-2 0-2 0-2
i food* . 0-4 0-3 0-3 0-3 0-3 0-3 0-3 0-3 0-2 O-2
- All Foods M-f if 7 TOO SS-S "•' TOO 90-2 •*« too 131 14-} 100 °"< 25-0 IOO
1 Including mincemeat.

148 Domestic Food Consumption and Expenditure, 1956
TABLE i—continued
(grams per person per day)
Di D* O.A.P. All tunafluiAnimal
fat
v«. % oftotal
fat
Animal
fat
V*. %•/ Animal
fat
Vtg.
fat%oftotal
fat
Animal
fat
Vtg.fa*r,
•f
fat fat total
fat
•j~
Liquid milkOther milk .... 12-90-6 12-8 14-9
0-7'3-40-6
13-6
0-3
12-9
0-3
13-9
0-9
P0-6
Total Milk .... '3'i '3'4 15-6 14-0 iJ-9 13-1 *<•' j»_
Cheese .... 3'4 3'4 4'4 4-0 4-2 4-0 4-0
«
Butter ....Margarine ....LardOther fats .... 13-43-05-22-8 13-3
16-6
5'24-0
18-8
2-5
5'9
16-912-8
5-3
3'4
'7-4 16-6
12-97'i2-6
15-7
2-76-0
2-7
i1r13-7 n-7
1-3
2-4
7'52-3
II • 2
0-4
ia-7
i-7
D
I -2 2-5
a|6
Total Fats .... '4 4 '4'9 38-9 29-7 13-0 3*-4 -Hi-fi n-6 JO- 2 27-7 *4'4 ^
Eggs 3-2 3-2 3-4 3-1 2-9 2-8 3-5 9
Beef and veal
Mutton and lambPork
7-06'72-3
6-96-6
2-3
6-97'82-9
6-2
7-02-6
7-5
7-7
*"3
7'i7-32-2
7-4
6-5
1-4
0
(-
ISs
Total Carcase Meat 16 -a '5'9 /7-« ZJ-i /7-j 16-1 16-3 1.9
Bacon and ham, uncooked
Pork sausages7'4
i-77'3
• 1-7
7-6
2 • I
6-8 8-8
'•5
8-4
'•4
8-22 • I
d
o er mea
...
;:; O- I
B1t
Total Bacon and Other Miat . '4'5 0-7 !}•! '4'4 o-S rj-* '<••< 0-4 '¥•' 15-6 o-7
>
VFish 0-5 0-5 I -O 0-8 0-3 i -o 0-6 0-4 I *O 0-7 0-4 r
j
Fruit and Vegetable!1 0-7 0-7 0': 0-6 0-6 o-J 0-5 O- 1 0-6 «•
Bread
Flour.....Other cereals
1-7 i-7
:
1-5
0-4
6-4
l'40-4
7-5
1-7 1-6 1-60-35'8
r«<:
O-2 O-2 0-4
5-1
0-4
6-3i'5 4-8 6-2 1-9 1-5 1-7
Total Ctrtalt '•i 6-7 t-l 1-9 S'3 0-2 '•5 7'» *'J ft r-7 «•
Beverages . O'2 0-2 0-3 0-3 0-3 0-3 o-a Or
Other foods O-2 O- 2 0-2 0-2 O-I o- 1 0-3 ••
Tatal All Foods . 77-' 34-0 100 *7-9 iJ-0 100 Si-g 20-S 100 13-t »«-3 IT
Including mincemeat.

one or both adultsaged 55 or over
no other
Animal
fat
Vet.
fat
%«/total
fat
Animal
fat
Liquid milk .Other milk
I4'80-6
n-6 I5'3i-eO-J
Total Milk 'S-4 13 -X T«-J
Cheese .... i'4 4'2 5-3
Butter ....Margarine
Lard ....Other fats
10 -a 16-3II -3
»3-«a-3
7-c
3'«
3-6 u-o
I'48-0 6-3
3'22-7
Total Fan 34'' '3'4 3T3 3«-3
Eggs .... 3'8 3-0 4-6
Beef and veal
Mutton and lamb .Pork .... 9-89'53'8 7-7
7'53-0
10-1
9.0
3'7
Total Carcase Meat 33-1 lS-I aa-9
Bacon and ham, uncooked
Pork sausages
All other meat
II-4 9-02-0
4'7
n-33 -2
7'"2-5
5'4
O'l0-6
Total Bacon and Other Meat '9'3 0-7 15-7 21-6
Fi»h .... 0-9 0-4 I-O 0-9
Fruit and Vegetables1 o- 1 0-4 0-4 O- 2
Bread ....Flour ....Other cereals .
I'S0-56-1
1-2
°'<1-8 6-2 2-3
Total Cereali 1-8 8-1 7-8 2 ' 3
Beverages 0-3 O*2
Other foods . o-i O- I
Total All Poodl 1104-3 ] 13-6 ; /oo |iro-S
1Including minceme

urbaiion$
O»A«r Semi-
ruralAural
Provincial urtan
Animal
fat
VV.fat
% "/ ^m-mal
fat
Vtf.fat! %^
'^m-
mal
fat
V'*.fat%oftotal
fat
^IM- Vtt-fat%oftotal
fat
Liquid-Other
total
fattotal
fatmal
fat
13-6 13-6 '3-5 ia-50-8
14-3
0-9J2-9 14-6
1 -O13-3
0-9Total +•
Cheese-
0-9 0-8 0-9 0-8
'4'5 *J-S •<••*••* *3'* /5-/ JJ-7 li-t '4'S
Butter -
Mar*fl
3, 3-2 4-0 3'7 4'» 3-8 4'4 4-i
'4-43'24'8
13-4 I5'52-66-8
«4-4
>3'9
6-3
16-5 IJ-0 18-4
2-9
3-3
17-t13-2
3'iLard .Other
I4'7 16-6
4'512-4 2-7
7-7
12-6 13-97-o
13-3
Total •
Eggs -1}-0 /6-3 J«M 27-7 '3'9 38-6 ^9-6 13' 8 39-4 17-8 15-6 40-1
Beef a-Motto
3'4 3-1 3'4 3-2 3-4 3'i 4'2 3'9
Pork7-2
7-31-6
6-7
7-01-5
7-i5'9
6-65'52-3
7-86-1
3-8
7'i5'3
7-7
4-01-7
7'l3'71-6
7Y.ro/ •2'5 2'5
Bacon16-3 J5-.T ,5-5 *•<••> 16-7 IS- 3 '3'4 it- 4
Pork. • 8-51-8
7-9i-7
8-2
2-07-6
1-9
8-82-3
8-0 8-0
I'S7-4
1-4All otlj O'l 2-2
Total ;«•« 0-7 15-1 T5'» 0-7 *S'4 /5'7 0-6 '•r* '*•? o-S 14'«
FUh 0-5 0-5 0-9 0-9 0-5 1-3 0-7 0-3 0-9 0-4 O-I 0-5
Fruit ! ... 0-8 0-7 O-I 0-8 0-8 O- I 0-8 0-8 0-3 O'J
BwdFloor
'•7 1-6 1-6
0-33-9
.-5 1-6
0-4i-S0-46-1
1-7
0-41-6
0-47-4
0-2 O- 2 0-37-1Other 17 6-1 7-* 1-8 1-6 5'I 1-8 6-2
Tftal ' •7 S-o 9-0 r-S 7'* *•!> 1-6 7'J 7'9 1-8 *-J »•«
Beren o-» o-j O>2 0'2 O- 2 o-a 0-2 0*1
Other 0-3 0-2 0-2 0'2 0-2 0-2 O'l O'l
Total t'-s '6-i JOO *3'7 14-1 too S7-l 13-' 7OO 81-3 'S'4 /o*

Appendix D 149
-5 1
"**
—•-.•: OIIHM
O>-t -r •-•-» « M VI O
-1-•.-.w-.,3-,c -r ^ MO
. -!- -1 '--•_->•-*•1-1« O
00M •«•«,'--
It.,•go A°2 «
l • ••siS^SM ^^
lia
I
1 1
3 £ 3

150 Domestic Food Consumption and Expenditure, 1956
1
"i
2 '<H iI
I
fa
0*O»-r 'C fs to M tt Ol
o •»* o--•» m
v>vtm«^H c* O
•r,.f «-!—•"; ; MOO
avii«-m«O«
M MM
MM mo * « M « co
3 -
iif i - -
!i
1
11!•S3

Appendix D
1to \o m -*•(N •* ;«O •0
1K H
«'"Om-«-«flo<n>«w»tn M n M
•H
I!
H
ii—ui •*o Osi«in WOm M M IH M
1
I §
M^^-is.Mcn ;«o 1
*-, * w-,l-x« -* w « C-. 0,0*t
iMmM M «
^l 0 •*«n» o*<0M « o*«nM MM
rv.
if
on
*ioo «n•vOtoo fn M w O
1
1j
ft M M M MH
1
r-. •'-itn (nj', OM n Otm M N M
o
lli I ^•* ^ « 00 »0M M 0» «oo
5 tqm M « M
H
«|
H
ti O -* '-0 «-i"".- t* O(O« M <• M o
H
i«lN
iii^O**MO«^««« Om M «t M M N«
i
s
I
tf>M M M os
1
M«tnMOt(OMC4flO oT -• n M
!A
**•%
1 ....
i
2
'*- -* 3. J
liifi . .11
ill 11 S3 11 "3^So£O WfeCQO iS
Ia
I B i
a £ &
.5,5.2
IMill!•§!w £3
3e3

"i O «i'n *NOO n^nt* «
I8a
-£
I* ?
H f |1
2A90 tN. Oe*<n MMQVI ^i- •* •0
I M fi
_ fl «*_«S - ' '•-' rv^oo omtN.o\ ••»»^
tsOO(f «
»n
II IS.MBO 0-«0 M N 0 0> »n
Nao 00- OOOO N
">'C M t-s
J5W «•o0
t- Of*>O O*4-rtM »»««
r» o r«»
81
v-, M«O Mtnooo « -- O00 »« Ot O O -•• OOOO B|
"^M M ^s
llM
•c--f« W O *.**• r* '0 H H IX -« ^ o>N«o O M o ^ -1-c rs H O H
00 MC*» OOM OOOO H
•^m M •e<«
^
1
O -i- * *I«O 0 f-. -r C 10P^« « SN M ^ MHlQ O««M d t^
s- *-) ^
iM n -r.m ^
••*-. OOOOM ooaofsm'•« OMM OMOM S 0 Cl NO
44*1
^ * **n0 > OOM OOOM t>. •CM iSn <*1 <t
il O -r•0 O
O t<O<O oomM«o«0 OMOO Ot«Of* s, tf>Mt O
i|0 0 S
00 O i ei »>.M BO
•3
• ^
• M O <« Ow« wOOt*. H O ""I t*ttj M M *i OOM OOOO
^ v> OBM t>
?cn ^
fhl O O* ft O oo«n<s Hf*mo\ tv GOtt o
ijpj*O Q « 0 Mf)O«O H IN
Ol -. 0 OO»« OOOO ^ •CHI IN.M ^1
li 00 •*« M IH 0 -r u-, 0tMMOO Ot>0» « N
llOn O M O O •*•C f. m o ^1"
00 M Ok OO» OOOOZ
«o<-> •c•J
ill* 2-§ BO^) T u-1 C- O -J W( M o o
cs mO0s HotM OmO^ o\
fe'flM.'SI1§* " MW<•
M M •n
•g.g
OiOO O
V) ^Ot*> v, * f -* $ O ts INH OMV% MOO-* M «n <eI#
V MM *O OOO OOOO ts •".M •0c.
1
fn *•OIs.
r«. -r •- o O oo «N^ M M « MM 0
«l t*i tn •oW
M OM «* 'OOO O O 1 Nt
h,
wt ft M <o•I
- i-3 vi Ot* 0 * »00 ft O « n"tO>ts O«o Mmooo O 0000 •
^|l* *•*m N
OOM 0- OOM OOOO "s*•*
m M IN
MILKANDMILKPRODUCT
«
•O -rt
TOIJ/AfiVAdirfCrtam
.
Natural
Processedandpacketedtl u
§nl
5 «1S
5 -«a
LiquidFullprice
Welfare
. •» j * 3 ....
S -Ou53 -3T3J*| ||tfrf |||
CHEESE
TotalChrist
1
^ O Q OU
152
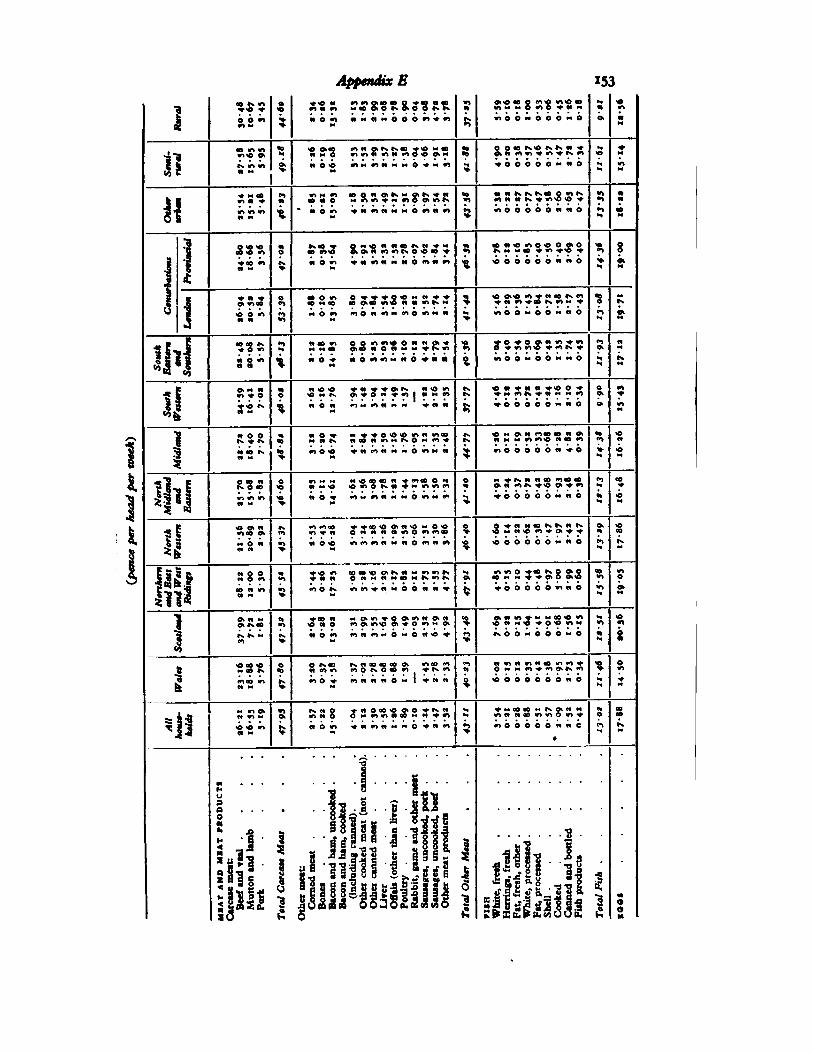
Appendix E 153
QOfrvm 0 » o M <o<n9>coaoO4-aonaoOttCl MieOvOts.OiOOtN*N<n OMOOOO «^>O"-Jo (O s <etft
1** * « n w,« w 0 .-i C- •*M M «l
Iq n M ^t- E
00<rt<n ^ ocx r-Trf .r-.r-. r- •« -f o i- JDn H G v^irtWinwfOO'OO'M
QO o ooo^\or*i^« •* •*•il •n* O* N «B Ot« coui^-vt^lxci «o
it M > N M
* w 00 <"1 w^Mm coONOit^MO>rN.^e«QOt«O Mrtift^'^mOOsiots00v»
n N rx is. is.ao o m ix 5n
i§ «-.r* T •t (0 W « ts * «0*O« * tt
ii SI?" ** ° « * ° >• N M
1o <o« Ci] r--co t o « o r« M so I--*<•«-r ~
oomo OkO»Sw«^O<Ow^rt» ao n«Ov>O>O O O-C cs
8« --0wi o f> ** H MOOf "- t '0 T *n
1 **oo m ts* " -!-• N M
•*•« *O*moo
O**coon O^--*^O*Hiw^-^- % •J59*O « * « 00*Si#1 •s fv
(3 |oo - ao eoo\oo«ri>OM«>^t^« •*« m *oo t^«o« *
•neOMOOM«tO« O <nc* «
P»»rj «O« mo«»^«<nO«nM« t«* (*> O\
iKJ, BN
i|3•*O "i H M Mao a>oo«O«MW ^i^in n -r w, "i c- •«•"i I-N-*• •>.
« O « *>>»0* « 0 ««H « 0 *• • N
c* «« N M
0>M Mm ^ O
flO
n«o«o — 'i - - o .-. -i -c •-•-,«MfN. ^^rOM^mlnMCi
(.,ts.« n ^ t* n t a o -t O tn* » -T - -^(-. -f rj M M tn 0 <*
«S n M >• M "» M
1MOOfx •*tx
<« r. C 1- n - ~rT ~ C u. 'I "'•J" ts. « M « n MOOoo M (7- 00 0•% M«(^ ««w«onts.O»im*fr ts -( - p- "i '•--.- « ao m <n=3
5« 00 tx ^ ">0 - *" "" ° ? H
*1 E O 00 M O «- - -. n^Cooaott^ moo O M o « ^ r-. -. n 00 *0«000 <•>OO
till « M<e ffr.t1 •
S* § 3<5 3
M M >h M » N
*!vOOl M«1000
tx "- moo ~ -r *•o cr>'«-""•-"in^n ownwwmowwioDO O ^ •' <-,.,,/, r . ri r^
<OM «>O rt^-Oi*'*0.t«o
IIr*> **• QO
>• M H M
Illi N O OM O fOClVI
^r'-O**! aoco>oo^txnMinmtx•«-c«N OMMNMooMt^mrv
H0«
MIwtO —"^f-. :•,?•:• oo»OM
COM M * ^ O>0 OH*O O
|i"sS< i f r. ->•-: tf) "°« ^m* °° '- N M>
1O. « M •1 *aoc» «o*«*O«m«o««
<OMO mo>moa>^O<n>HOf• Oit« 1^1-r - MOOVOu->ON M>O•*O'O«n«
I-H «of»tt txCO Wi *h •ri
1tn > " V H ct
I0 ^ 0 o Ofv-eo txwooooeooi tocO*n « cvnci trj r»oo i/icni* "5 o
i > " i N
« "-. 7 •o tx«O *«Oao««O*»^W««O OMMiowoOMM^m ^•MOOOOH-.---.-J M«W Woo iow^O *•»•*P* OO00
~tl Ot Kl O
*B -t -•
H M
1H
1' I 8 »IIUP
0
i!lii i III!S j>
MEATANDMEAT
Carcasemeat:
Beefandveal
.
Muttonandlam
Pork
TotalCarcaseMea
•-6 = 988
' | 'gggo
TotalOtherMeat
•o
H- 8*3 * a
HiH'11
TotalFish
.
BgSggcSS S-3|3 S S 6^KeSSsJ5J:>i23-Q33.g flllLllK|u,SSS o63o.2a5.So illrfjfUJl
NO0•
I

154 Domestic Food Consumption and Expenditure, 1956
.^
1-*•O ft O O <-»
*»N O O O > « o o o «o o o o o o o o N
J-lJl
M IH
Ok
M *i h s «n
11fc 5
0 *0« *t
0 & Cl - s«
'C O >Ofv M00 ^ M« 00 9 V) <"»»O oo f*">O * *<N oo ^ m *»•
HIM oo w «nM 0 «-1M -) ft "I •** «nO -i-oo 9>tn r*km O« O N O O s
*• K HHI
! 4^ 1
M
°J
«« «« 0 0
"t 5 s^M0~-«0 O.
*hJ *" a™ s"1* *J
|11lM in m«ON n <x
«* <? M «• 5 H-c
si11
* „«, « »ri
*s**« 0 0
-i H s
1-** MOM *n
ts.-f 3 0 ..O\ O tN fl °oO •4OOn OO 00
NM O "1 « •*OV*fV M M M Cl IT)O
«t
i?
<oaoO\•*O
8
« « m M <0"
C| H M^.
|1,I 00 O ^ O « s O •** IN ft MOO -*-*O H 00»O« "^» O * «0
|ii|1
< |2 [qM *l H H
•0
f Sjl i •*01* 6 n r%oo M w»ro o
H•**s m\o M •- t^^ (* m i>, HM fs M O O tt Ct O>M o >»> OVm M O >H
H 0 0 M 0 0 0 »nM tl N
Jill O MOO* •* t* « OO00 w »«0
« MOO« >0»O<oc«M rx o M M OV
m wi o oo O o\ -r .0 9>O •** « « (« 0 « 0 r- - C «*
Illi M « N N
fs O>9>(N\O 00(X
<om M «*i<om » r*.
«r> oo O •«•O -iHO 0003 -* O -D -I »
^t» u-.LI C>G «0 tNOO^ M «e fl ••>m 0 M e H
1—10M O C «1 « 01M O *n
Ntx M O O O o o o o o o o •l
d H
5•O«i oo O <O« M O»fOO
ts. ro ts * •«•ft n f>m ff •NO * P^ O
*"»iO ts.M<0-^vi O> 0.
v>
i00 \O M rt M
00 •*« O O »0 « O O O ^H
tN <*»O O H M O H O ••O O •0(t H
=53-3W •** MOO * Oioooo IHM m Mso
•O»^
\O (O*OfxO M O M
Otv>r^OtO -f r *- ,7*r . c>, 1-1O«•*O
N«^
T 3 o. ^^-§
O O * * MM t>M O <*»
Hoo m ** O t«
HM 0 0 M 0 0 0 wf>« WOO «l
1
«v
1 i 1 1
•J §
w >.to
il 1Sfl
1nb * I
Mmrgarinc
.
Lardandcompou
Suetanddripping
Otherfats,oilsan
SUGARANDPRE<
Jams,jelliesand
c
Sugar.
Marmalade
Syrupjtreacleanc
TotalSugarand
F
Cabbages.
Brusselssprouts
Cauliflower
Leafysalads
Freshlegumes
Quickfrozenlegu
Otherfreshgreen
TotalFreshGreen
FATS
Butter
TotalFats
.
VBGBTABLES
Oldpotatoes
Newpotatoes
Chips.
Crisps
TotalPotatoes

Appendix E 155
LU-J
1
n m« wi osv, to oo MO M O rotsm-^-M M
i^«•»IN, ««<o«o*«- ««.mi>« tsjts « PI >r>H *N t^MM1 ... •o
•1 H<••»H
11N «nO O»ooo 0 * -i- H * ? 000010O " -*"-C
«OTN-<^OO «*»MOO1' ' "
»ehf
c?S
DO^fOV^iO^OO «O V *-.(S,
N s
-SI(O «t •*«'.C- -f u~,r*>OO*-O>O'•HOCTiw « O <"•»s V4«0C*tO'+ •*Oi O.
%
Itts, 00 MSOl*»•*00 « n vf
*x
1
H •t *•
8 *« O O Oi 0*M *nH •o X3 M IO<iOU".Cf.OOC-f OC Q
1 *wO«MO««OO N
NH«•»
nO^OOOMOO •e
§ s •x
<3 1 -O-i f«Of -DO S 5 NHOOM 1 •*O '-0 iN
llJ OOO-*-0-MO-r 0 •o Oi O -^tx O IN-"TO •0
«3«loo ts otoo n o o •*o O «n oo«omrvc< i^.n TT •1
N
fS-^u-,z m-4-inmroi-if>fOON<ororo'O '* O
•0tse» O*s«i*«n «n»no in
l|Oi iO —M o ,j-. *NIHM o
^s>«* H
1«O^O«««i-i(iOtmtsts-4-OvOtfvtO 5 5 Ot<OM MSO 00 ^ *s
M^-MIOOO OlMM«•»»>,
1OOMMOttMOO O N
<"»«O«OO 1 MOO ts,
s H
«1,E S
ll1^ OOMMOMMOO o 00*»
• • • • •1• • •
«s
<^ tq H H
« E «eC S
«JMOMMQMMOO s H
«^CfO-^OMOnOiO o.
H H
J** *" 01
l|.sr OO^nOOmrnM «o 0 MiomMoo »nH.^ r-
111^HiOMM>-.(nnOO N
HH«•»
•NH
1 V
I MOMOMMflOO 0. N«•
«isj
1
<«-Onaoooeo«4t4Ooo <omo « o <No «
•-(«nO
MOO^rom o ri •... "it . •,•'.<)• -5 i , -f ,--,;, n
fe 9| s
— i-5•«*•en»rio Mvo •*« *s 00 00 c n •• -»•o- moo M *i
xj| MOHtMOMMOO 0HOi NO-4-OO • « O «n •o
ki
V
PI
.- ,.t. •§
Carrots
Otherrootvegetables
.
Onions,shallots,etc.
Miscellaneousfreshvegetable
Driedpulses
Cannedpeas
Cannedbeans
Cannedvegetables(otherthan
Vegetableproducts
TotalOtherVegetables
.
Fresh Oranges.
Othercitruafruit
Applesandpears
Stonefruit
Softfruit
.
Quickfrozensoftfruit
Bananas
.
Otherfreshfruit
Tomatoes,freshandquick
TotalVegetables
.
Tora/freshFruit
FRUIT

156 Domestic Food Consumption and Expenditure, 1956
fi *•1H iiHJPS
<H
1oooo •*<o« cn-oHI M M •*m *no
>n (S,«*» fM .+• Q> fsiOtOOHiOVOOMn*~. «OOOO»*'O'OCO«s.OOtr-»*o
1
o. -o <n»o- o
- °0.
(^ •»•»
il -, eo OOO»O* Q» 0. 5S^2? H moontO-4-04^iO>«-OH.0, MMH>mOOtoOOitsfs9io
ll•* « * « » « O Is OtHI «AM O O O O 9> O m O O M s •^
IJ « o o <ors ^ o 0 X, f<*-. - C Oi ^ f? -O (? <-O '* fs IS.QCO ?»•§ o «nM o o o o «0 O m O O M OQ MOHOooiOOMOOO 00 &
3
•»
. 'i
J*».«n* enM oioo•*ts oo cn<oir>Q « ts Is. O*0 0. MOO•*O M •«•
f> r>- oo o u".>c -t ••/;* C r%s Otm«<«-^Hit>co«aooo t;O •*O O O O O tx O « M O w H M o N o>aoM o M O O O
« *^
<! 1•«ooO n rt eo«O O
*S•*-«eO 00<O >*• Mo*>o«Hirs*nc«Hif«o *-iT- (•,- U-,0.00 HI 01tn M o O »^l w-i»*loO<^«Ots«oO*rO o
3"
SM#
iM o>•*o <ow «oeo IS, §*s «*«n«M OtO U"l^0 aOMioooaoao(N.*-aOMOQ-c «n9tno>HirN.omH.M »^
4
^8||V)OO—5-r C -r O txO * HIO M 0 0 °0 "
N»ri»
ifm « o>m t* eo O h, 0 M to O *s N oooMootnn —o --. •1
«
l|TT-« n -ran m M >n tS tX ts HI M vt ONrO«OOS«NO>O>OOt
«0 O m o o MN eo
>
i is.co-o an ts ootcM •*OsHJ -* -* O §
w o •*M oo H i- f-.-"-: f! ^0w f* -*--.-.•*•» OtN«tn«O(s,OtOVs9Ot *n« f O>M *O •o
1s n
*-
fillt] H to moo «oeo « N<On O moo " •M 5 *0 « * C -'I
ts w m O «*)00 Otxrs««aOHiiOt«o >n>Oo, OOao-4-orsls.Ols.aoO %
•is § 3^5 «
M h «n
*g
>•
ll(^
o •*o o o o o (s. o rs M o HIM S M O HI ^,00H, 0 N O O Or<o«n
ill| f m o>«ooo o ooHI o oo HI ts m oM m«o n ot o i oooooM^-nnnoOHi^') OHidtmmOmmfs.ino •
s,
>•
IITl•w
00M K •^
§ o * ot«o 4 •., i - tl moo r,
n -- QO FxOO>OvCif^i-iO^C-f CO
I *«1 . , ,-. N
<•
| w, oooo O Om Moo ' - t RS^So?S^S>o?SS »
«o
i
O*•*HI •COO•*M t^
s HI »o•»
«i*M ^-M (SCO« O p* ~ ^-— : -i
OOM00 M O"* OCO"lvCoo(s.-.r*0-N O OO>O^fO>OiOO00ts O>O 9
'11 .oo M M m ts.m M oo
M s i
i 1 | 1
li «t
! 5 .5 .
OtherFruit
Tomatoes,cannedan
Cannedandbottled
f
Driedvinefruit
Otherdriedfruit
Nutsandfruitandn
Fruitjuices
Welfareorangejuice
TotalOtherFruitand
F
Brownbread
Whitebread
Wholewheatandwholei
Maltbread
.
Otherbread
' '|s ' -B, • s •°
1
I sj 11 a
1 fflll .!« 11(Q M * . , -H hi . *a ••
TotalCertali
CEREALS 2 1 . "lil --SS
1 SlHsllll5!

Appendix E157
Iw *.
s! I
•3OiOO-t t-. (-- >o ooommooNM '->• fs f*.
& M O M O O •f->-• OOMOOMOM »o •» tn4 ^ **si
i'a<680 M !••-C. •
s, *N•- txog * m m «<n•* tn O IN-o »O« o
|g
»o«oo*»oo 00 " •« "^« O w O O .-, c c - •.:•o i- c " «o ^ «N S,"i
t§ oo •*•c>«noo «0 mtmo M t^rs«o t s S,i«51 m o •-»o o K OO^OOMOM ** •o rs.M S -1 « '*
, 1
PI v^
Q n r- <Jv- « t^H o otmrnoeo fl ^ ^-\
•0 ^ tx1
*H S s-^
1 1
n m is, •*is. »oo MOors«On(OO«n«n«««o*xoo 0
N^O*C>M M fs,CO ^*1M ft O O 0- OO«OMMQM «0 00 0.
^ *»«(^ *-*
Ihl « •«•Is, O>Oeo Is tfi*o O-
<1wnn o<nr<.o moo Is. ^g«*>SOCOM ~ ,•-."vC Is,
<%3§J>ts
ft-S
it * -t M WOO •*i*i**O ">O »n C4f->^«*
*!
M m\o (xoo r^ •'.',- M Q^OISlS O
M tsts •e x^
s Si-i
1
00 O QCOOOi 5 O -r co O -Ooo «*•O *o A ^x
1
«o^-w «o« mr«r*iiOO»n'£> 00 f -a °*o •0 ooM H «n *
;
«frj s^
sl-,6 <Nr*•£;- ON Ors.
HOO « ^^O^M*CO•<••»Moo ts.« « 00
Oi *-*0 ^ is.
*1§|-* H-)M VCCfl ttm o rt o o ^ OOMOOMQM ts, 0, «0
• s-8*
If
« «nos f d ts, moo co -;•-''., cM«*«.W uin<o «
<»•O"0 y-.*.^J «0"-.(-.•- -r o >
** Nx> o. rx~ 3,-i
c ** **
E » o t* 'C ineoO M -t O vi<o « «Ooo *nJr3£ & «O V « x^•BftJK-lIlll -* O M O O Is. OOMOOi*O" •o 00 «N
H <*b| «1(»> S-f
1
oo « O >O« OD •HC T T . '1 - T k.
S •-?
1
s 5,-i
3. M «nwioo o>
•nrtoo m *%« •*>OOOOO M O*1* «N Ot /-s
^-^ CK
1
« •HMMOrOONtNM «*no o o o •0 OOMOOMOM v^ Os «nht |<s
aS-3fl M*O00 ON ?, ^ ^
m ts Cs. Is,M tq n U «i
TeaCoffee,beanandground
Coffee,extractsandessencea
Cocoaanddrinkingchocolate
Brandedfooddrinks
Invalidandbabyfoods
Spreadsanddressings.
Soups,canned
Soups,dehydratedandpowdered
Meatandvegetableextracts
.
Picldesandsauces
Tablejellies,squaresandcrystals
Miscellaneous
TotalMiscellaneousFoods
t*i s^
MISCELLANBOU5
TOTALALLFOODS
BEVERAGES
14"5
(S
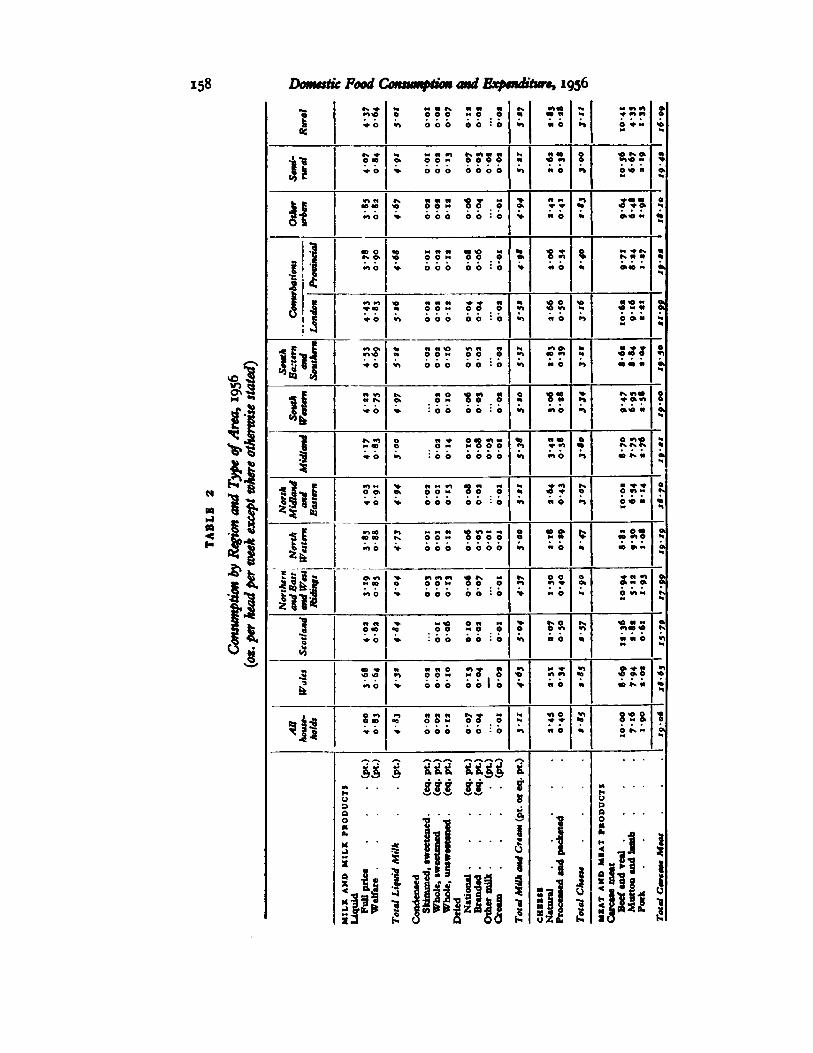
158 Domestic Food Consumption and Expenditure, 1956
1•N«•
0 O O O *« 0 O"100
3M ft « •
o
1
m«O -1 co n >*•r-l "»io"
inrs.^> "i M««tt r ,--',-< h n ao
«O"iO * t" O m
%
|5o «o o o o - oooo n o *^« -
« -~
*J!>. TCft M C TT M > n M *"l *oo co •
8100CO -0 0 0 * O 0 0 0V •** % O •*O
COO «0 M Cf N CO«O M •o o - •«-*•- *•rv ^ -0 0 0 M 00 0 ON 0 m -*• IS.f* « n
m o "»• o o o o o : o > "° •1 0 oc - Ot
1 1M m•«to
•o -<-,-. - -T n* O O M O O O
n C O-c «•-.« ft « M fkOt*n H « M N
•*0 v> O O O O O : O «ri w O <•» O « ft *
iM £S «l ', r, C: tn (• M rt O *•<«
" - f*o« o O
^rln COM O O O Vl BO<n V|
* 0 coQOn &kf
?!«•«nn is.
t-v n O « <*t <« o •oaoo n
*«*<•>
4VWtO»•*» «ft
C
Ij « O M O O f O VI O
1r*.m o M ^ o eo m M 00 ft CO
•*•« o•9 O "rt*r%K »s *
S
» 40 O O M M O O O "l
-.
•55-gE^ * M M >• M M m oo n M ^1
f** «*>
s--<-f T 0
|35sO <* o> o o •« o o o !O — o <n•* <-
^5 iS•*O * o o o oo^o v» n O «•» o « « ?
"5 tmce (•) MMK C --. - « 0 ?ff 5 ~ - -c
oo <noOtH
tr Mdoco rs. 00- OOOO o
l|l|H
» »1 > «~-—- —. c rx «O O O M O O O
iS. O O o -F M .--> (XOt
IlllMCO «•» •n•+ 0. 0 - C.
H
T» *•o
r~O0 «n
•N. «o « «- «I•
V M« O N M v> "-.-0« iN
5
O CO •0 O O - O _ OM N
i CO* N n n o « * n »n M •*• »n«o
C* -r '• in« « m o o x *• o o >o in «n « o. o *
& H
?i=§W1at
(-1 (t M « !- -r M HN
«o 8-28, 0•0 0 0 M 00 0 r* i* 0
T^*
11 £ lii ?1I1 E** H
M . . .T.T.T ^S1 • • 81 M ...U 15
DD
y
.>.'.;/ Mi/AJ*K/Cr«am
'f
Natural
Processedandpacketed
a
MILKANDMILKPMO
1 I!!
MEATANDMEATPRO
Carcasemeat
Beefandveal
.
Muttonandlamb
Pork
TotalCarcaseMeat
LiquidFullprice
Welfare
.
1 ^^""§ *!>*'
TotalChute
5 m Jiafl
1 I^Illlll CHEESE
s 0 Q OO

Appendix E 159
N
M
A<I-
I,8
1N -*•» >oco«OO<o<ni-io>o
«i OO>-»OsOf*O«NO 3^
10 0 -r- OO"OOOOMr*r*
*s MOOOOOOOO *
ii,
O O v. Q C — O G Q Q '«'••-*s nOOOOOOOO
v
ji o* T 1-1 K v) tneo\o <<o oo «->o o •g-sssssras Si
0 &
•3•5
'O
1 i«« o « ««n*«^^o* e. „00« OOMOOOOMnn »s. "1OOOOOHQO *
<! 1
1
•C 'J O txNMMOOOOO-4-MOS O 0* N»* « ^^ o 9<
O O ^ OOMMOOOHMO «0 moooooooo •es
*!*!
o»<oa* ••MMOi^fOfno'w?
•4-OOtNiOOOOO -i O\
wooooobob -
* s Ba
*J O O •* OOMOOOOi"i-tM J MOOOOOOOO•H
J o,« o* ^« N WrN« o «» «n 1 ts.
1H 0000 0 «0
•slU t S^S £'S,?SS?'§'S,'§,S Oi£ <*2 5.
« £££ ^ •0
5|'| 00-0 OOMOOOOHO" »n NOOOOOOOO010
•s t »o<S 5!S*5£R?S5J ^ *-o* cnts,o<M o«rs x>«OM O -r "-i ,:,> -v -,
II 00« 00-OOOOM-.1
^ *">OOOOOOOO *
lll§ •Si1?, g,^'££5Si??,S£' 00 S^-gSJSSJS 5o
ill* «O« OOMOOOOHine* oo mOOOOOMOO ts.
•3
<S£3 ^S^^^^S^^^ ?> OOWOMiO oOOOfs. IS,i1
10
a fT*18? ^Tr^frifT''!* 5 SZSZZ'S'ZZS vo
* t-
"|1rrjMM — — r- i- "~r~'r. •?-•'i -•
*«
Mooooobbb"1
j | 3
|| I ? J||
o
|l fa 1 ||||
^
To^uFit
A
.

160 ic Food Consumption and Expenditure, 1950Domest
IcaJH<"a.
1
0 oao O O « •*O »
{
H fOv-i30<Oft O ft •o
" M d n * A
N a»o,^»0jl - * -.00 8 * M •n<e
II• i«9enft m O 00 5S?K 5
3 ••~ '? K t;S;2§S55 t ° " * *
."3
* %
Vt •J- -T^ O C i-"O ;
Conurbations
M «ow IN ^-o " O -• -r «o* in o 00"O u- ™ -^—O
I N ** *< •»- c
e 00 R?» ?? >O tS.M - 1. O Jtri? c OOIs. ^ ^ O f T
•st S
s s 8 »: «n•e
•^i1!* " - " ° 8
-000 -
0
Ot
li
O .N IS* * ft 12 ^ a as? o O. ft <OO -r r- - o><*•(<*ft <n 0 *0 Cs. 0 _ /-i - — ~i~ -r
s - Cl *- " Ok
i
^ 1
B -?oo 5 52"° ft H
S^^So1 &!S?S J 00CO<Ots. S ssi^^s^j; ;*• *J Ta C
3 ttj
O H M O>O'
a
* " ^ M 81 •*
ii
-- •. *r —•C
8
M O « 00 ? tx in « ft *o £5 t^S^o Moo00 in O
! „ 0
8 isCl
Ot<o
ii ? •8 J' Tf -I-''.
2
oo O «r»•^>« » •*O K 00 « M M « ft O ntt tx >nr>o N M O O 00 O O
•*•*•« O O •lH« « 0 0M O "~ °
>n h
• M n c- o toO w M<O O 2
tOOO-r •-' s in M ^ O
00 •*•« O « * fs «t
5
i n •H
•*m o oo
M • V) M 10
•0 f- iT-0 4- i O
i
(O
CO0 oo moo — ft
V)
S H s * i>
*iiK-) O oooo n «O
rx * 0 m 0 000 Q M Ot SSI'S1 3
i i-, r, — , , -,00 00 O M K
1
s - 52 H
Margarine.
Lardandcompoundcooking
Suetanddripping
Otherfats,oilsandcreams 1
/:•
r.JFreshOreenVegetable.
SUGARANDPRESERVED
Jams,jelliesandcurds
Sugar.
Marmalade
.
Syrupitreacleandhoney
TotalSugarandPreserves
it
TotalFats
. Bg| • • |Cabbages.
Brusselssprouts
Cauliflower
Leafysalads
Freshlegumes
Quickfrozenlegu
Otherfreshgreen
Butter £ §• ? S. el -aM
PATS gsSt-S ISozuo ^
O
e
M

Appendix E 161
1» »NO OxCT>M-vO »-»«<•>-O
Oi<«»n
»N«i^iO M<OO.«-*w<noo tsoom
1 - • •t« 00 M« « "I «/-,0M 0 00 N (1 M 0
Wl
iO mo -• a- z>t-~ MO <^ i«
H ao H"0
il a « f v «j-j" -^ '< M-*9>-r«. - -~ts M mO
Os•0>•O
t^moxmO *O« MtOr^Heort « O\M
>nO\
<Om O eoeo« M *>•
«S2WW « M O « N O O «0 0 1 0*
-TK- « 1-1 M M(N,
J 5H 0» H
00
11c<«t m M o m c* o o 0 >.
BOf*o>£oo -mom Oi o m o o o o o 0
•3
s
8 1QOM w O «n•* tt O»"OM •*H tv,O <Ovi wo t"J
K.Ov R« in IX O « « 00<. ;•-o r- o»O Ov
00 O --it" w oo om M (s M m n M %|j -r 'I -f- 3 -" «"t« OO *>0S o
I j
»«Ox<*0
" »n
aoo o ao m o m •*»n *-.•0V) *O"Otoioi ono
m to M m o -r 1-1"-i ^', 0 f-v«,--•* 0 'rt -0J- O ~ <•*<••<ro n ,*-:j tN. 10^ » m * * M «-»
Nts. ISo\ •1
iU ^ Q O fi -*•O '•*> (•«•,r<-co w m « <TO m mo
^ "O •^N D t -< mOm^•OOMM*O go^m 5t
tO » M -«••* •*O^ o.» *3 *OOOM fO«f « O ts.
<*I§J N °o <1Xi
li f-«oo M *noo Mao " '-' 5 H t«QOCv<OQO 1-1-*•C « « H.0 00 O 10 N >o»
*l•o
S 0\ H«o
1 c «-."^M -t i-n- tnO »*> ao•"O^cUo*
« o m « M * N rs o\
1•^ QO «0 M ^o 0 0 0 0 0hi
•a* §«^(*x«OO« «« >
<*V m c>o c .- >omoo tX ts,O m •*•O «*•<n «l«
c-2"? -•>-n '•-r^ -*•-f - mO 0 OOOSWwO. -+OOO s fs ix ot n *n c*M
•5* § 3 MMNMomv* oo >*1 O ts
*S tgS A «
•* 5
_OvoOooGOoO ts,oo 11 0, -t -J A- i ro (» O «
**•«•M <*•O *•<<nN OO Oi >
ao«0 »0
iifei Hfnmoontnoo cow A do
ao
H
o
Illi S «0 M m o o o o o <0N
| « •'.•T, -• ~ -j- a. O*O >fr"^i OH«OO> ts^QO
is «nm m\o oo « m00 •o " i 1. n • o OO ooco •*M m M *0
1
tv tnap M ^ M M h' M OtN o «-.o o : ci M m
O tvfocnmo^nn oo K »n *N. O <«O O O O O ^H =o
I r- -r .:>-t o ^ o tor* tx?
O « 'J~--f -o >,-•-,m »QO -O •* •*N. O
|• • • ?
« I- O « M ts M «r,«Oo '- " -n c- - 5- HO N O 9)00 -!-*•-,_
b K, 0. "»tN,
sMO w f* «nM tn>o « <oM^nmtsnm mo
Oi «x>
OctoOO^co O u-.-ro\co mo>CT ^oo HI
-0 >«Ov»*•* O\« w HQO "O oo«OO « <nw M »n
'§.*
c«
, • «
•o
.. .. ......JH* Li... 8 ... h .i «
1..1Q
^ 2 . . s •i
S j " 1ff 6
TotalOtherVegetables 2 "a
.. „ - 9
•'3% • •'o•
-g •=
Tomatoes
.
cannedan
Cannedandbottled
f
Driedvinefruit
Otherdriedfruit
Nutsandfruitandni
Fruitiuicea
Welfareorangejuice
TotalOthtrFruitandFt
•1«1• • -a -8
TotalVegetables.
*^ S *|
TotalFreshFruit
is'* .1 I
•:!§S3!&-& •§1f «8
-1»"g-S g3 aj. >~>> 8 -3 ? 5 1 -a a i 8
sSniiiiil g'sls'r-gisgs-gs-sal's'sl-sl2*jou3gcd3«HJC-SS--gcSaM
• fQi3^33«BOOOSQOOO >
a 8OO<«<«O'BOHSB. O
ther
: 3
1
*IA

162 Domestic Food Consumption and Expenditure, 1956
N
H
•300 M « « O ^ kOGOOlCkVIO^OflOOOl*^ o •*O « * ^1 ts 0 O 0 O ? s«
*00 0
o ° » s « o o o o " O O M O O *.
il C C ir, rn M5 SRSRSSSS'.ZSS Is R?S?S f« (S,— -* — %
IIN •0 M n <no M «•
• " R
•^1
•*ts O O W 5 SZI&ISSZZZS oo ONOOO O £ ao * « m * s00 OOO « «* M M M« O ~ -
61 * "> ^
1«»«-« * 0. -.»..«, »»<,., 0 53333 X, >OM -O * O «8
i 1 "-"om 5 **v,o»-000 «0 00000 **> O O M O O •
•
o •§> « ,00, .00, ,«£,.«,« M ««n O (• V
'"S," ° " ; ,00..oo.o-0
•« E 1»=0 -r.g J 00 ONfv f* •*O *
f •*!*! M « w O M » *-0 **00~000 -> M O O O O il O O M O O 4|
1 * ? o £?o,«»S 3,""^'°
'•O
<*V ii "-"°" . »oo»-no = -ooo -* •g
=1 ijiii ?. 00000 * 0 0 n 0 0 Hu i1 •sl-sS ?-* 0 0 0IS M M«Q S SaSSS-iSS-tRS IS. «*O O « «•)
*x « «*»N Mts 00 O ON"-''O IQ
H -0
Jll"l * >•>
*
li -* « fsoo O ? •sssssss's.s,,?:!, 5 m to ^-moo $ n M K O O -
1 11
- I , " r» .^55 oc
M M M M M
fe Illi «, CO10N tOvO ^ •OM« M m «
1»j»iii . ««.».,.. »ooo -
"fe •?
i|i*4«««»» H
g 1
«0
12
00 |^>0n «« -
iJM 1 b « QOOO*-*O>HMOOO - « O 0 O O •» O O M o O K
E: A-3O OOOflt*>rt>OwoOOOts>C 9 OOM « « M xs --re'- N
^|3 - 8
•
1
Brownbread
Whitebread
Wholewheatandwholemeal
b
Maltbread
.
Otherbread
Tea.
Coffee,beanandground
Coffeerextractsandessences
Cocoaanddrinkingchocolate
Brandedfooddrinks
Invalidandbabyfoods
.
Spreadsanddressings
.
Soups,canned
Soups,dehydratedandpowdi
Meatandvegetableextncti
. ..J...B....
TotalAfitc«//an«owjF-'oodt
1
3
8 «
s •*! «: J '
TotalBeverages.
MISCELLANEOUS
1 :i |1
Toto/Cfreals
BEVERAGES
CBKEALS ^ -| « « « 3 jf "g J •J5 ^

Appendix F
Social Class, Household Composition
and Geographical Variations in the Types of Bread
Consumed
1. The Bread (Amendment No. 2) Order, 1956, terminated, with effect from
30th September, 1956, the provisions of an earlier Bread Order under whichbread made from national flour (flour of 80 per cent extraction or the equivalent)was known as national bread and sold at a controlled and subsidized price. Thequantity of white bread sold without subsidy was very small. With the removal ofthe subsidy and price control on bread, the term national bread ceased to beapplicable and the opportunity was taken to revise the types of bread distinguishedin the Survey. Tables i and 2 give analyses by social class, household type, regionand type of area of the consumption during the six months after decontrol of thefollowing kinds of bread:
(a) Brown bread, other than wholewheat or wholemeal
(i) unwrapped; (ii) wrapped.
(b) White bread, large loaves (28 oz. and over)
(i)
unwrapped; (ii) wrapped.
(c) White bread, small loaves (14 oz.)• (i
)
unwrapped; (ii) wrapped.
(d) Wholewheat and wholemeal bread.
(e) Other bread, including malt, fruit, milk, barley, rye, diabetic, Vienna
and French breads, rolls, bread cakes, sandwiches and bread and butter.
In Appendix A, malt bread is shown separately.
2. In the period under review (October 1956-March 1957), total bread consumption
was 47•
9 oz. per head per week, some 9 per cent less than in the correspondingquarters of 1955-56; expenditure, however, was 23 per cent greater. White breadconstituted 86 per cent of all purchases, wholewheat and wholemeal bread 3 percent, other brown bread about 4^ per cent and other types of bread nearly 7 percent. The large wrapped white loaf accounted for 44 per cent of all bread purchases,the large unwrapped loaf 33 per cent, the small unwrapped white loaf 7 per centand the small wrapped loaf 2 per cent.
3. In the five classes containing earners, the proportion of wrapped to unwrapped
loaves tended to increase with decreasing income; it was lowest in Class Ai, andalmost the same in Class C as in Class B, but rose again in Class Di. Class D2 andthe old age pensioner households, on the other hand, resembled Class Ai in buyingmore unwrapped than wrapped loaves. Because of their small average householdsize, these two groups bought many more small loaves than other classes. Class Aihad the lowest average consumption of bread, but the highest of brown, wholemeal
163

i<i.". Domestic Food Consumption and Expenditure, 1956
and other bread. A liking for these types of bread (especially wholemeal) is one ofmany middle-class tastes still indulged by Class Dz households; it is shared to aless extent by old age pensioner households.
4. The large white loaf accounted for most of the bread purchased in all types ofhousehold, varying from about 63 per cent in wholly adult households to 91 percent in families with four or more children. All types of household except oldercouples and unclassified childless households bought substantially more wrappedthan unwrapped large loaves, the preference increasing in the large families, nodoubt because many wrapped loaves are also sliced, and the saving of time andlabour in slicing may mean more to the mother of a large family than the differencein price. As might be expected, the small white loaf was bought mainly by thesmaller wholly adult households, who also purchased much more wholemeal,other brown and "other" bread than did any type of family with children.
5. In London, purchases of wrapped and unwrapped loaves were almost equal.In other towns, especially the provincial conurbations, wrapped bread predominated, but in semi-rural and still more in rural areas most white bread was soldunwrapped. The position, however, was not stable; during the period underreview the large wrapped loaf lost ground to the unwrapped in all types of areaoutside London, especially in the rural districts. The uniformity of the swing suggests that it was not due merely to the change in constituencies sampled. Very fewsmall loaves were bought by rural households. Semi-rural areas had a relativelylarge consumption of brown bread, the provincial conurbations of "other" breadand London of wholemeal bread.6. Regional differences in the types of bread purchased were very marked. Whilstin Wales the large unwrapped loaf was predominant, in Scotland there was an even
stronger attachment to the large wrapped loaf, which accounted for two-thirds of allScottish bread purchases; however, a large part of Scotland is served by a fewbread-making firms, whose production methods probably determined the broad
pattern of consumption. The small baker frequently buys wrapped bread from theselarge plants and bakes his own rolls and fancy breads. Of the bread obtained byScottish households, 15 per cent was "other" bread, including rolls. Differences inEngland were smaller, but the northern regions and to some extent the Midlandsresembled Scotland in favouring the large wrapped white loaf, while the Southern
regions, like Wales, bought far more unwrapped bread. No doubt controllingfactors are the location of large plant bakeries, the methods of distribution availableand the prevalence in some areas of small bakers who tend to sell unwrappedbread. Purchases of small white loaves were greatest in the North West (6-0 oz.per head per week) and least in Scotland (1-3 oz.). Except in Scotland, smallloaves were usually bought unwrapped. Purchases of brown bread other thanwholemeal were much larger in the North East (3
•5 oz.) and the South and South -
East (2-9 oz.) than in Scotland (1-2 oz.) and the Midlands (0-8 oz.). Averageconsumption of wholemeal bread was greatest in the North West (2 •2 oz.) followedby London and the South and South East (both i •9 oz.), and smallest in Scotlandand the North Midland and Eastern area (both i •i oz.).7. The average price of the unwrapped if Ib. loaf was n-id., ranging fromio-7d. in the North West to n-4d. in Scotland. The if Ib. wrapped loaf wasO'7d. dearer, but the difference in cost varied widely, probably because of variationsin the prevalence of the sliced loaf. The average price of the unwrapped 14 oz. loafwas 6-4d., varying from 6 -id. in the Midlands to 6-6d. in Scotland. The averageprice difference associated with wrapping (or wrapping and slicing) was o
•6d.

Appendix F 165
3
' *>2. «3r
•»
It
lit
3O
OO O flO
oo ao M
O oo •* O
O M Iso w o
to O«•> o
%O O O> <t
m o **• -
O oo >o
iu3 •
« 0 O Mv* fll ft O
ESS5 R o^ —
«O oo
O H
ao OonMMoo «nO O
oo IsWO
1
' Ill-all •*!£

i66 Domestic Food Consumption and Expenditure, 1956
3 Sa-S2 V&3
1tO -*•OSOO 9>
<f\^-w* •* >o*eo>ooo M O*iW « trt
4 «nM o O 00 HOW* -T-« N ^h >o
il «MrO•* « r%« o oo 00
4e« m m *• f- tx *^f) O »nw » « O ^ M O •" « 0* >•
II O « « w «»tsO n O oo >r,
0. O «nW —Is , -iM O n (*)
«55 -r ~ '-- _ O
ilH M t- ^>
OO«OOOft •* 00* O «M10(^CD•Tiix,o »n»n o\ •^
•§ 1WOO*OM «l M O M <+ *1
•3 (T^> »n
-o 21J -1 SM
« OfOO «
^»- {>« O.W ««0 •*• «00 O\ »n
•*•-0 •*M «»•**>H O M «
>•
iu| ro « O « rs. « IS>O00 >
*35J•••«•>«oo 00 N ° - N •aN M •*> *t-
•c 5
11
o\ o m«oro fs f%m
00 O oo O Ooo O «n>o
>oH »
>OM ro O ^ M O M M c>^1-
1 S-T :-f
M%t«CSd •*•f»*Oi <*^O M fo tn
1^1
1r* c<« o
<nO O M «
BO
H WM«O
>n•^i
*1 Erl-as11 5 5<5 iq
OtM co«>Ooo«Ooo
^»- m *•« o^ •*•M o S0
0*00M O « M O M « tx^ >
IS •*•moo o (X MflO O 00 •0
11N >o«nM M-» M o « <n ta«^
JillM W
« « « oo«o« o * •
s, M M O *
K
111*fs V V «M
oi*O «nMts, „ M M ^ <o
^
13
*^
1• 00 O •*OO ooO IN
C| »* O « 5
I
*« oo <nM nu->« O O 9i
«n0 0 - IN «0>•
V ?,jc:^ 00 ts O** «fx «nvi M
(«rx
g -• •*«no>o
«O«n
Oi M O M MIOw >
*il O O 0000rs 9, rt O
*o IX 0»0 O
•**o m w0000Ot
•«* >nO *nw o M O « «O IX1HN >•
Brownbread,unwrapped
Brownbread,wrapped
.
Wholewheatandwholemealbread
Otherbread(includingmalt)
.
*••
WHITBBRBAD
Largeloaves,unwrapped.
Largeloaves,wrapped
Smallloaves,unwrapped.
Smallloaves,wrapped
1
AllBread....%
»)%
i"3iS

Index
(Numbers refer to paragraphs; App. -Appendix)
Allotment produce, see GardensAneurin, see Vitamin B,Ascorbic acid, see Vitamin C
Bacon
consumption 24, 39, 40by household composition 104, no, 119by occupational grouping 79, 8 1, 82by regions 152, 17-0by social class 63, 65, 69expenditure 24by household composition 119by regions 152by social class 60, 62, 63fat from, App. Dfree supplies 147prices 20, 24, 60
by regions 149, 152
Beverages
all 14, 109
branded food drinks 36, 62, 65, 109, 166cocoa and drinking chocolate 36, 62, Si,82, 109, 166
coffee 7, 36, 60, 62, 65, 82, 109, 166fat from, App. Dtea
consumption 20, 36by household composition 102, 109,119
by occupational grouping 79by regions 166
by social class 62, 63, 65expenditure 17by household composition 1 19by social class 60, 62, 63prices 17, 36, 60supplies 7
Biscuits, 35, 60, 62, 63, no, 165, 170Bread
consumption, 20, 33, 39, 40, 43by household composition 34, 101, 108,:io, in, n5, n7, 131, 136, App. Fby occupational grouping 79, 80-82, 84,8?by regions 34, 149, 163, 170, 171, 173,App. Fby social class 34, 62, 65, 67, 69, 73, 131,136, App. F
decontrol i, n, 17, 33, 108, 131, App. Fenergy value and nutrient content 38-41,73. ni, 115, 117expenditure n, 17, 18, 33by household composition 34, 131by regions 34, 163by social class 34, 60, 62, 131
fat from, App. Dnational 33, 34, 39, 41. App. Fprices n, 17, 20, 33, 60, App. Fsubsidy u, 20, 33, 34, App. Fwhite 33> 39, 41, App. FBreakfast cereals 18, 35, 62, 81, 108, no, 131,165British Medical Association —Committee onNutrition. Recommended energy and nutrient allowances, 3, 42, 70, 85, 113, 116,"4. '37, 172Butterconsumption 20, 27, 33, 39by household composition 102, 105, 119by occupational grouping 79, 80by regions 156, 170by social class 62, 65, 67, 69expenditure 17, 27by household composition 119, 123by regions 156by social class 60, 62fat from, App. Dfree supplies 147prices 17, 20, 27, 60, 105supplies 7
Cakes 35, 60, 62, 79, no, 119, 165, 170Calcium (see also individual foods)content of the diet 8, 15, 39, 41, 43by household composition 101, 113, 114,124, 125, 127, 134-137, 140-142by regions 170-172, 174by social class 68, 70, 71, 127, 134-137,
140-142recommended allowances 70, 71, 113, 135,137, 140-142
Calories, see Energy foodsCarbohydrateby household composition in, 116, 133,M3by occupational grouping 83, 88by regions 169-171, 175by social class 66, 72, 133, 143content of the diet 8, 41energy value from 44, 72, 116, 143Cereals (see also individual items)calcium 15consumptionby household composition 101,111, 137by occupational grouping 81, 82
by regions 163, 165, 173by social class 69, 137expenditure 14fat from, App. Diron 15
167
168 Domestic Food Consumption and Expenditure, 1956
nicer in ic acid 15prices 15protein 15supplies 7vitamin B, 15Cheesecalcium 15, 40, 137consumption 23, 39, 40by household composition 102, 104, 110,
"5> 137by occupational grouping 8 1, 82, 84by regions 151, 170by social class 62, 63, 65, 67, 69, 137expenditure 14, 17, 18
by household composition 104, 136by regions 15 1
by social class 60, 62, 63, 136fat from, App. Dprices ij, 20, 23, 60riboflavin 15Children, see Household CompositionChips 154Chocolate and sugar confectionery see
SweetsCocoa, see BeveragesCoffee, see BeveragesCod liver oil, see FishControls, see RationingCooking fats, see FatsCooking losses 38, 113Crawford and Broadley 14Creamconsumption 22, 62by household composition 103by occupational grouping 82expenditure 18by social class 59, 62
Decontrol, derationing (see also under individual foods) i, 9, 17, 102, ii 6, 117, 119Demand, elasticities of 55, 56Diet, nutritive value of (see also under individual nutrients) 3, 8, 15, 38-44, 83-89,in, 124, 132, 133, 138, 149by occupational grouping 83-89contribution of different foods to, App. CDrinks, alcoholic 38
soft 6, 38other, see Beverages
Dripping, see Fats
Earnings, estimated weekly 9, 10, 126Education, Ministry of 125EggsCalcium 15Consumption 20, 26, 39, 40by household composition 104, 110, 115,
119
by occupational grouping, 79, 80, 82by regions 155by social class 59, 62, 65, 69
expenditure 14, 26
by household composition 104, 119, 123by social class 62fat from, App. Dfree supplies 26, 59, 147, 148prices 20, 26, 155by regions 149riboflavin 15supplies 7
Energy foodsby household composition 101, in, 116,117, 124, 131, 133, 135, 137, 138, 141-M3by occupational grouping 81, 88by social class 68, 70-72, 131, 133, 135,
137. 138, Mi-143calories from carbohydrate, fat and protein44, 88, in, 116, 124, 137, 143recommended allowances 42, 70, 71, 132,135, 141, 142
Family Composition, see Household Composition
Fatby household composition in, 116, 143,App. Dby occupational grouping 88by regions 171, 175, App. Dby social class 66-68, 72, 143, App. Dcontent of the diet 40, 41, App. Denergy value from 40, 44, 72, i 16, 143, 173sources of 2, App. Dsupplies 8
Fats (see also Butter and Margarine)consumption 27, 39, 40by household composition 101, 102, no,in, 117, 119, App. Dby occupational grouping 81, 82by regions 156, App. Dby social class 62, 6g, App. Dderationing 117dripping and suet 27, 156energy value 117expenditure 14, 17, 18, 27by household composition 119, 123by regions 156lard 27, 62
prices 17, 27, 119sources, App. Dsupplies 7vitamin A 15vitamin D 15Fish, fresh, canned, manufactured and processedconsumption 20, 25, 39by household composition 104, 110, 115,
119
by occupational grouping 79, 8 1 82by regions 154, 170, 171by social class 62, 67, 69

Index
expenditure 14, 18
by household composition 104, 119by social class 60, 62fat from, App. Dliver oil 12, 38nicotinic acid 15prices 20, 25, 60, 154by regions 149supplies 7, 25Flour
consumption 20, 35, 39, 40by household composition 108, 110, 111,"7by occupational grouping 81, 82, 84, 87by regions 149, 164, 170, 171by social class 62, 65, 69, 73energy value and nutrient content 38-40,73, ni, 117expenditure 18
by regions 164by social class 60, 62extraction rate 34fat from, App. Dfortification 39, 41, 136national 34, 39national survey 38prices 60
Food consumption levels 5-8Free food, self supplies (see also under individual foods) 11-13, 21, 26, 38, 59, 82, 99,146-148, 150, 161, 168Fruitcanned and bottled 17, 162citrus 32, 84consumption 32, 40, 41by household composition 101 , 107, no,112
Household Composition 2, 3, 90-143analysis, classification, definition 90-92,121, 128
composition of the sample, App. Aconsumption by 101-110, 123, 131cost per calorie 100
effect of children onconsumption 131expenditure 96, 97, 118-120, 122, 123,
13°nutrient content of diet 124, 132-143effect of children of school and pre-schoolage 121-126
expenditure 93-96, 103, 104, 106, 107, 123,129-131income and family size 92, too, 118, 120,133, 131nutrient content of diets 111-117, ' 32social class distribution within 54-57, 127-M3
Ice cream 6
Incomeelasticities 54-58, 65family 52-55, 58, 65, 75, 92, 120, 122of heads of households 74Index, price of energy 61, 100, 149food expenditure 19price 19, 29, 60, 96-98, 100, 149quantity (see also individual foods) 19-21,96-98
Institutions, food consumed in 6
Ironby household composition 114, 124, 125,
127. '33. '39, Mi> 142by occupational grouping 84by regions 170, 171, 174by social class 68, 70, 71, 127, 133, 139,141, 142content of the diet 8, 41, 43, 114from flour 15, 39recommended allowances 70, 71, 139, 141,
142
Jam, see Preserves
Lard, see FatsLarder stocks 12Liver 24, 40, 84, 112, 153, 174
Margarineconsumption 20, 27, 33, 39by household composition 102, 105, 119,
131
by occupational grouping 79, 80, 84by regions 162, 170, 174by social class 62, 65, 67, 69dried, and nuts, 7, n, 32expenditure 14, 18, 32by household composition 93by regions 162by social class 62fat from, App. Dfree supplies 13, 99, 146-148prices 17, 32by regions 149, 162soft 13, 32 147stone 147, 148supplies 7tomatoes 13, 32, 147, 174vitamin C 15, 40, 41, 112
Game, see Poultry and gameGardens and allotments, food from 12, 13,I6> 3°, 59, 159Geographical differences, see Regional variations (see also individual foods)
by occupational grouping ?9> 84by regions 156by social class 62, 65, 131

170 Domestic Food Consumption and Expenditure, 1956
expenditure 27, 60, 62, 119, 123, 131, 156fat from, App. Dprices 27, 60
supplies 7Meals eaten away from home 6, 38, 42, 55,56, "5Meat, carcaseconsumption 20, 24, 39, 40by household composition 104, 110,111,
"5. i'9i i23> 137by occupational grouping 79, 81, 84by regions 152, 171by social class 62, 67, 69, 73, 137energy value from 40, 73expenditure 14, 17, 18, 24by household composition 119, 123by regions 152by social class 60, 62fat from, App. Dfree supplies 147nicotinic acid 15prices 17, 60, 119by regions 149, 152protein 73, 115supplies 7products 24, 60
Medical Research Council 38Milkcalcium 15consumption 22, 40by household composition 101, 103, 110,115, 136, 138by occupational grouping 80-82, 84by regions 150, 170by social class 62, 64, 65, 67, 69, 70, 136,
138
Nuts, see Fruit dried, and nuts
Oatmeal and oat products 18, 35, 62, 79, 81,108, no, 131, 165Occupational groups and differences 2, 42,74-89Offal 24, 147, 153Old age pensioners, see Social ClassOranges, see Fruit, citrus
Pickles and sauces 37
Potatoes
consumption 8, 29, 39, 40, 43by household composition 101, 103, 107,108, no-112, 115, 117, 119, 131by occupational grouping 79-82, 84, 87by regions 158, 170, 171, 173, 174by social class 62, 65, 69, 73, 131energy value from 73, 117, 131expenditure 17, 18, 29, 60
by household composition 107, 1 19, 131by regions 158by social class 62, 131free supplies 147prices 17, 29, 60
by regions 149, 158supplies 7, n, 20vitamin C 8, 40, 112Poultry and game 7, 18, 24, 59, 147, 153Preservesconsumption 20, 28
by household composition 101, 106, 110,131by occupational grouping 79, 82by regions 157by social class 62, 131expenditure 14, 18
by household composition 106, 131by social class 62, 131free supplies 147prices 28, 157Prices (see also under individual foods) 5, 9,10, 14, 19, 20, 60
Protein (see also under individual foods)animalby household composition 111,115, 1 16,
133. '34> 137, '43by occupational grouping 84, 89by regions 170, 171, 175, 176by social class 66-68, 73, 133, 134, 137,M3
energy value 138expenditure 14, 18
by household composition 103, 122, 123,
136by regions 150by social class 60, 62, 64, 136fat from, App. Dfree supplies 59, 64, 122, 136, 147, 150prices 20, 22, 60processed 18, 22,81,82, 103,112, 122, 136,'5°
protein 115riboflavin 15school 12, 22, 64, 122, 136supplies 7vitamin D 112welfare 12, 64, 81, 122, 136, 150
Nicotinic acid (see also under individualfoods)by household composition in, 115, 133,»39, 14'by occupational grouping 84, 86by regions 171by social class 67, 70, 133, 139, 141content of the diet, 15, 39, 41, 43
supplies 8
total 41, 44by household composition 101, 113—116,124-127, 133, 135, 137, 138, 140, 141,M3by occupational grouping 86, 88, 89by regions 171, 172, 174-176by social class 66, 68, 70, 71, 73, 127,'33. I35t 137. 138, 140, 141. '43
Index 171
Sugar and Syrupconsumption 20, 28, 40by household composition 101, 102, 106,no, in, iio, 117by occupational grouping 82by regions 157, 170by social class 62, 63energy value from 40, 116, 117expenditure 14, 17by household composition 106by social class 60, 62, 63prices 17, 28, 60, 157supplies 7Supplies entering into civilian consumption5-9
energy value from 15, 39, 44, 72, 73, 88,n6, 124, 137, 138, 143, 175
recommended allowances 42, 70, 71,»3, 135, 137, I38, M°, M'
vegetable 8, 44, 66, 124, 137
Rabbit 7, 24, 153Rationing (see also under individual foods) i ,14, 102, 119Recommended allowances, see individualnutrientsRegional variations (see also under individualfoods) 2, 3classification 144, 145composition of the sample 145, App. Aconsumption 146, 149-168, App. Esummary of regional differences 146, 168energy value and nutrient content 169-176expenditure 146, 149-168, App. Esummary of regional differences 146, 168free supplies 146-148prices 149value of consumption 146Registrars-General's classification of occupations 2, 74-89Riboflavin (see also under individual foods)4«, 43by household composition 113, 124, 125,"7, 134, 139, 141, M*by occupational grouping 84, 86, 87by regions 170, 172by social class 66-68, 70, 127, 134, 139,141, 142
Sample, samplingcomposition, App. Afamily composition 90-92occupational groups 74-78social class 45-49Sausages 18, 24, 119, 153, App. DSchool meals 125Social Classclassification 45-49, 74, 129composition of the sample 49, 50, 129,App. Aconsumption 50-65, 131dietcost per calorie 61nutrient content of 66-73, I27, 132~I43distribution of households 45-49expenditure 50-65, 129-131household composition within 54, 55, 63,127-143
old age pensioners 45, 51, 59-71, 73, 128prices 60Registrars-General's definition 2Soups 37, 167Suet see FatsSuez crisis 20
Survey technique and field work 11, App. ASweets, 6, 7, 38Syrup, see Sugar
Tea, see BeveragesThiamin, see Vitamin B,Tomatoes, see Fruit
Vegetables (other than potatoes)canned and dried 31, 160, 170consumption 30, 39-41by household composition toi, 107,IIO-II2by occupational grouping 80, 81, 82, 84by regions 159-161, 170, 174by social class 62, 65, 67, 69expenditure n, 14, 18, 30by household composition 93by regions 159-161by social class 60, 62
fat, from, App. Dprices 10, 20, 30, 60, 159by regions 149quantity index 20
supplies 7, 10, 20, 31free 13, 99, 146-148, 161
vitamin A 40, 41vitamin C 15, 41Green fresh, including peas and beansconsumption 30, 31, 39by household composition 101, 107, in,112
by occupational grouping 80-82, 84by regions 159, 170, 174by social class 62, 65expenditure 30by regions 159by social class 60, 62
prices 20, 30, 60
by regions 149, 159supplies free 13, 147, 148vitamin C 112Root vegetables 31, 40, 84, 107, 112, 147,148, 160, 174

172 Domestic Food Consumption and Expenditure, 1956
Vitamins (see also under individual foods)vitamin Aby household composition 111,112,114,124, 125, 133, 134, 141by occupational grouping 83, 84by regions 169-171, 173, 174by social class 66-68, 71, 133, 134, 141content of the diet 8, 40, 41, 43, 112,114recommended allowances 71, 141vitamin B,by household composition in, 114, 124,125, I33> 139, I4!> MZby occupational grouping 84, 86by regions 171, 173by social class 70, 71, 133, 139, 141, 142content of the diet 8, 15, 39, 41, 43, 114cooking losses 38recommended allowances 42, 70, 71,141, 142
vitamin Cby household composition 112, 114, 124,125, 133. 134. Mi
by occupational grouping 83, 84by regions 169, 170, 174by social class 66-68, 71, 133, 134, 141content of the diet 8, 40, 41, 43, 112, 114cooking losses 38recommended allowances 42, 71, 141vitamin Dby household composition 111, 112, 124,133, 13°by regions 169, 171by social class 68, 71, 133, 136content of the diet 112vitamin tablets, A and D 12, 138
Wages 10Waste, allowance for 38, 42, 113, 132, 141,
142Welfare foods 162
Printed In Oreat Britain under the authority of Her Majeitr't Stationery Offlceby Charles Blrchall & Soni. Limited. Liverpool. 1.
Wt. 2263 fi'58 K.9 C.B.&S.Lld. Op .999.