Ashford - GOV.UK
26
1 Ashford Census 2001 and Access to Services Focus on Rural Areas Ashford is in the South East Government Office Region
-
Upload
khangminh22 -
Category
Documents
-
view
3 -
download
0
Transcript of Ashford - GOV.UK

1
Ashford
Census 2001 and Access to Services Focus on Rural Areas
Ashford is in the South East Government Office Region
- 2 -
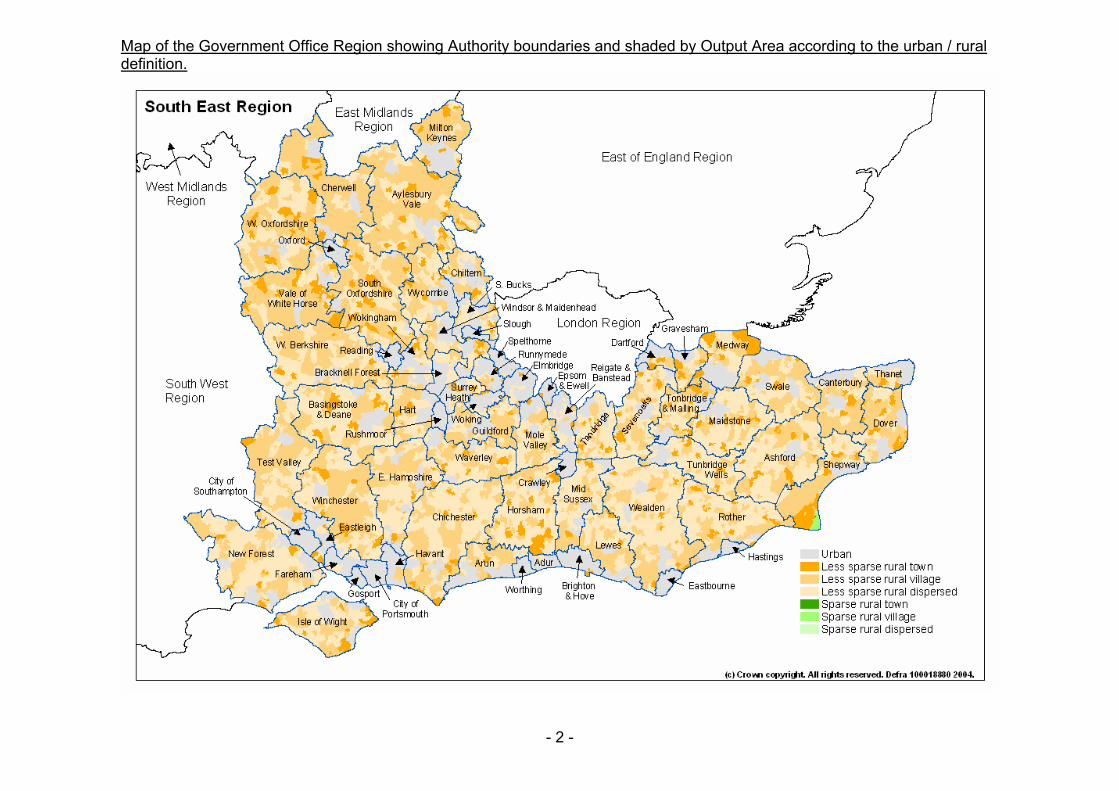
Map of the Government Office Region showing Authority boundaries and shaded by Output Area according to the urban / rural definition.
3
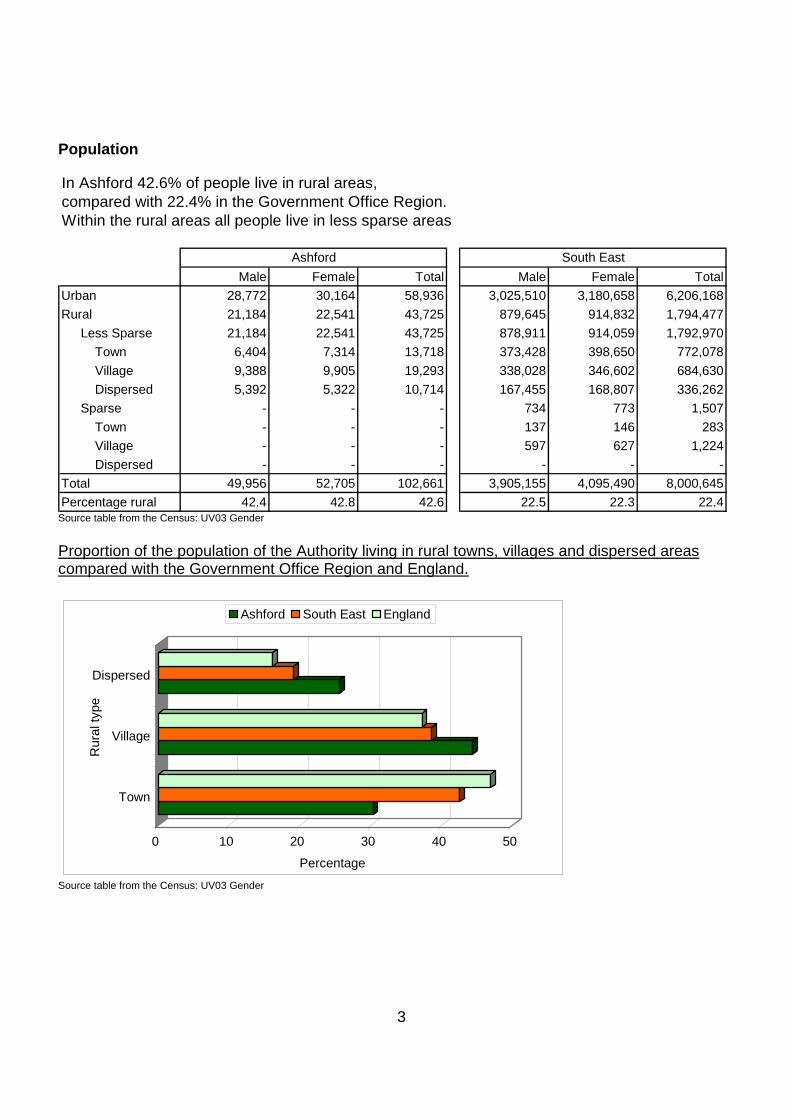
Population In Ashford 42.6% of people live in rural areas,compared with 22.4% in the Government Office Region.Within the rural areas all people live in less sparse areas
Male Female Total Male Female TotalUrban 28,772 30,164 58,936 3,025,510 3,180,658 6,206,168Rural 21,184 22,541 43,725 879,645 914,832 1,794,477
Less Sparse 21,184 22,541 43,725 878,911 914,059 1,792,970Town 6,404 7,314 13,718 373,428 398,650 772,078Village 9,388 9,905 19,293 338,028 346,602 684,630Dispersed 5,392 5,322 10,714 167,455 168,807 336,262
Sparse - - - 734 773 1,507Town - - - 137 146 283Village - - - 597 627 1,224Dispersed - - - - - -
Total 49,956 52,705 102,661 3,905,155 4,095,490 8,000,645Percentage rural 42.4 42.8 42.6 22.5 22.3 22.4
Ashford South East
Source table from the Census: UV03 Gender Proportion of the population of the Authority living in rural towns, villages and dispersed areas compared with the Government Office Region and England.
0 10 20 30 40 50
Percentage
Town
Village
Dispersed
Rur
al ty
pe
Ashford South East England
Source table from the Census: UV03 Gender

4
Age In Ashford 4.7% of the population live in rural areas and areunder 10 years old. 9.5% of the Authority's population live in rural areas and areunder 19 years of age. 6.3% are aged 70 or over and live in rural areas. Total population within the Authority, broken down by age.
Total
Less sparse Sparse Less
sparse Sparse Less sparse Sparse
Under 10 13,517 8,700 4,817 1,432 - 2,132 - 1,253 - 35.610 to 19 12,830 7,857 4,973 1,535 - 2,158 - 1,280 - 38.820 to 29 10,872 7,438 3,434 1,299 - 1,379 - 756 - 31.630 to 39 15,959 10,393 5,566 1,785 - 2,434 - 1,347 - 34.940 to 49 13,863 7,747 6,116 1,725 - 2,676 - 1,715 - 44.150 to 59 13,914 6,792 7,122 1,802 - 3,294 - 2,026 - 51.260 to 69 9,708 4,499 5,209 1,569 - 2,440 - 1,200 - 53.770 to 79 7,539 3,445 4,094 1,508 - 1,799 - 787 - 54.380 to 89 3,812 1,710 2,102 943 - 838 - 321 - 55.190 and over 603 284 319 155 - 117 - 47 - 52.9
102,617 58,865 43,752 13,753 - 19,267 - 10,732 - 42.6
% Rural
Totals
Urban RuralAge
Rural breakdownTowns Villages Dispersed
Source table from the Census: UV04 Age Age of the population in urban/rural parts of the Authority and totals for the Government Office Region.
0
200
400
600
800
1000
1200
Under1
10 20 30 40 50 60 70 80 90 100andover
Age
Num
ber o
f peo
ple
in th
e A
utho
rity
0100002000030000400005000060000700008000090000100000110000120000130000140000
Num
ber o
f peo
ple
in th
e G
OR
Rural Ashford Urban Ashford South East
Source table from the Census: UV04 Age

5
Proportion of children under 5 split by the urban rural definition, for the Authority and the Government Office Region Authority: Government Office Region:Ashford South EastNumber of under 5's: 6,500 Number of under 5's: 472,500
Urban
Less Sparse Rural Town
Less Sparse Rural Village
Less Sparse Rural Dispersed
Sparse Rural Town
Sparse Rural Village
Sparse Rural Dispersed
Source table from the Census: UV04 Age

6
Marital Status The ‘Marital Status’ table (UV07) classifies all people (i.e. from babies upwards) according to their marital status. To create the following table it has been assumed that all people aged under 16 would be in the “single – never married” category. All people under 16 years of age have been deducted from the original “single – never married” figures on the marital status to estimated figures on the marital status of people aged 16 or over. Estimated number of people in the Authority and Government Office Region aged 16 or over, by marital status
Single (never
married)
Married (first marriage)
Re-married Separated (but still legally
married)
Divorced Widowed
Urban 12,515 20,187 3,867 1,263 4,115 3,255Rural 7,738 17,952 3,488 752 2,538 3,297
Less Sparse 7,738 17,952 3,488 752 2,538 3,297Town 2,645 5,275 990 229 818 1,381Village 3,255 8,029 1,575 345 1,202 1,385Dispersed 1,838 4,648 923 178 518 531
Sparse - - - - - -Town - - - - - -Village - - - - - -Dispersed - - - - - -
Total 20,253 38,139 7,355 2,015 6,653 6,552South EastUrban 1,484,269 2,144,729 394,163 117,467 419,736 402,101Rural 334,414 720,409 138,401 29,317 105,734 115,963Total 1,818,683 2,865,138 532,564 146,784 525,470 518,064
Ashford
Source tables from the Census: UV04 Age and UV07 Marital Status Estimated proportions of people aged 16 or over in rural parts of the Authority, by marital status.
22%
50%
10%
2%
7%
9% Single (nevermarried)
Married (firstmarriage)
Re-married
Separated (but still legallymarried)Divorced
Widowed
Source tables from the Census: UV04 Age and UV07 Marital Status

7
Household composition In Ashford 43.3% of households are inrural areas. 24.7% of rural households are single person households.6% of rural households are lone parent family households. Number of households, by composition of the household
Urban % ruralTotal Total
Town Village Dispersed Town Village DispersedTotal number of households 23,492 17,948 5,914 7,925 4,109 - - - 43.3One person household 5,894 4,429 1,837 1,844 748 - - - 42.9
pensioner 2,676 2,828 1,263 1,143 422 - - - 51.4other 3,218 1,601 574 701 326 - - - 33.2
All pensioner family 1,798 2,373 842 1,062 469 - - - 56.9Married couple family 9,525 7,685 2,118 3,453 2,114 - - - 44.7
no children 3,295 3,154 805 1,424 925 - - - 48.9with one dependent child 1,652 1,188 356 520 312 - - - 41.8with two or more dependent children 3,291 2,174 649 943 582 - - - 39.8all children non-dependent 1,287 1,169 308 566 295 - - - 47.6
Cohabiting couple family 2,675 1,325 405 614 306 - - - 33.1no children 1,458 769 208 359 202 - - - 34.5with one dependent child 558 229 101 100 28 - - - 29.1two or more dependent children 566 267 69 125 73 - - - 32.1all children non-dependent 93 60 27 30 3 - - - 39.2
Lone parent family 2,125 1,071 383 482 206 - - - 33.5with one dependent child 761 319 115 148 56 - - - 29.5with two or more dependant children 730 292 95 143 54 - - - 28.6all children non-dependent 634 460 173 191 96 - - - 42.0
Other households 1,475 1,065 329 470 266 - - - 41.9with one dependent child 268 129 38 54 37 - - - 32.5with two or more dependent children 313 167 43 73 51 - - - 34.8all student 6 22 19 3 - - - - 78.6all pensioner 155 190 70 95 25 - - - 55.1other 733 557 159 245 153 - - - 43.2
RuralLess sparse Sparse
Source table from the Census: UV65 Household Composition (households) A dependent child is a person in a household aged 0 to 15 (whether or not in a family) or a person aged 16 to 18 who is a full-time student in a family with parent(s).

8
Percentage of households by composition of household for the Authority and the Government Office Region.
0%
5%
10%
15%
20%
25%
30%
35%
40%
45%
50%
Urban Rural Urban Rural
Ashford South East
Pro
porti
on o
f tot
al n
umbe
r of h
ouse
hold
s
one person all pensioner familymarried couple family cohabiting couple family householdlone parent family other households
Source table from the Census: UV65 Household Composition (households) Classification of household deprivation The classification of household deprivation on the Census is independent of the English Indices of Multiple Deprivation published by the Office of the Deputy Prime Minister. Four dimensions from the Census returns have been identified as giving an indication of household deprivation. Households are considered deprived if one or more of the following definitions applies to that household: Employment – any member of the household aged 16-74 who is not a full-time student is classified as either unemployed or permanently sick. Education – no member of the household aged 16 to pensionable age has at least 5 GCSE’s (grade A to C) or equivalent AND no member of the household aged 16 to 18 is in full-time education. Health and disability – any member of the household has general health ‘not good’ in the year before the census or has a limiting long term illness. Housing – The household’s accommodation is either overcrowded, or is in a shared dwelling, or does not have sole use of bath/shower and toilet, or has no central heating.

9
Classification of household deprivation (number of households)
Not deprived on any
dimension
Deprived on 1
dimension
Deprived on 2
dimensions
Deprived on 3
dimensions
Deprived on all 4
dimensions
Not deprived on any
dimension
Deprived on 1 or more
dimensions
Urban 7,662 8,793 5,291 1,571 112 894,858 1,671,844Rural 5,926 6,741 4,303 978 58 277,521 443,090
Less Sparse 5,926 6,741 4,303 978 58 277,406 442,550Town 1,710 2,276 1,594 324 12 116,111 204,884Village 2,590 2,976 1,895 440 24 107,661 165,481Dispersed 1,626 1,489 814 214 22 53,634 72,185
Sparse - - - - - 115 540Town - - - - - 18 109Village - - - - - 97 431Dispersed - - - - - - -
Ashford South East
Source table from the Census: UV67 Classification of household deprivation Comparison of household deprivation in urban and rural parts of the Authority
0%
10%
20%
30%
40%
50%
60%
70%
80%
90%
100%
Pro
porti
on o
f hou
seho
lds
Urban Ashford Rural Ashford South East
Deprived on all 4dimensions
Deprived on 3dimensions
Deprived on 2dimensions
Deprived on 1dimension
Not deprived onany dimension
Source table from the Census: UV67 Classification of household deprivation Health and provision of unpaid care There were two measure of ‘health’ on the Census. In one measure respondents were asked to rate their general level of health over the last twelve months as ‘good’, ‘fairly good’ or ‘not good’. The other measure was to ask respondents whether they (in their opinion) had a limiting long-term
10
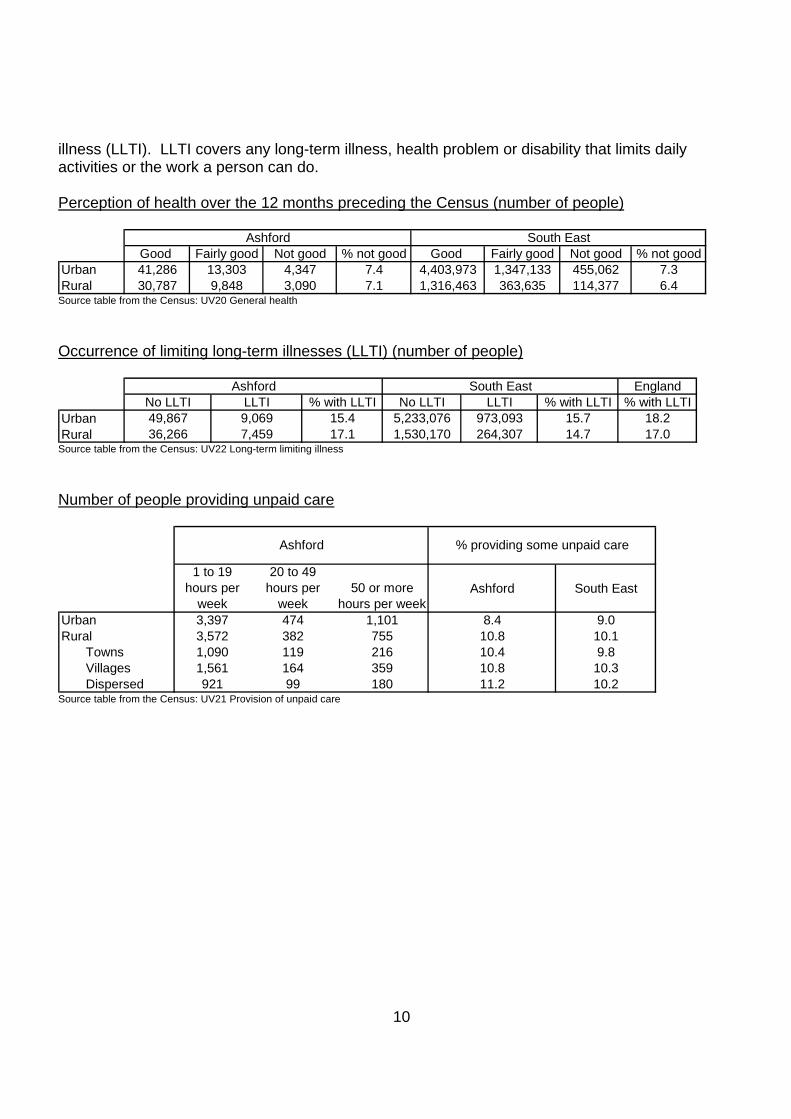
illness (LLTI). LLTI covers any long-term illness, health problem or disability that limits daily activities or the work a person can do. Perception of health over the 12 months preceding the Census (number of people)
Good Fairly good Not good % not good Good Fairly good Not good % not goodUrban 41,286 13,303 4,347 7.4 4,403,973 1,347,133 455,062 7.3Rural 30,787 9,848 3,090 7.1 1,316,463 363,635 114,377 6.4
Ashford South East
Source table from the Census: UV20 General health Occurrence of limiting long-term illnesses (LLTI) (number of people)
EnglandNo LLTI LLTI % with LLTI No LLTI LLTI % with LLTI % with LLTI
Urban 49,867 9,069 15.4 5,233,076 973,093 15.7 18.2Rural 36,266 7,459 17.1 1,530,170 264,307 14.7 17.0
Ashford South East
Source table from the Census: UV22 Long-term limiting illness Number of people providing unpaid care
1 to 19 hours per
week
20 to 49 hours per
week50 or more
hours per weekAshford South East
Urban 3,397 474 1,101 8.4 9.0Rural 3,572 382 755 10.8 10.1
Towns 1,090 119 216 10.4 9.8Villages 1,561 164 359 10.8 10.3Dispersed 921 99 180 11.2 10.2
Ashford % providing some unpaid care
Source table from the Census: UV21 Provision of unpaid care
11
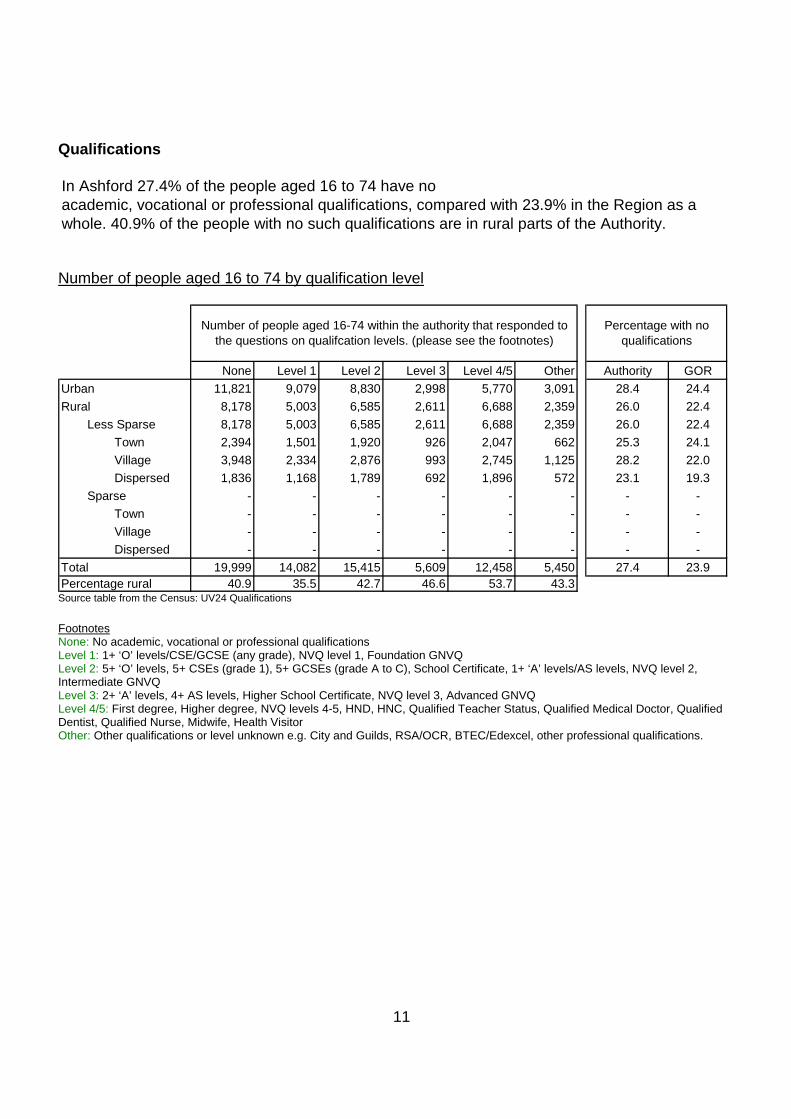
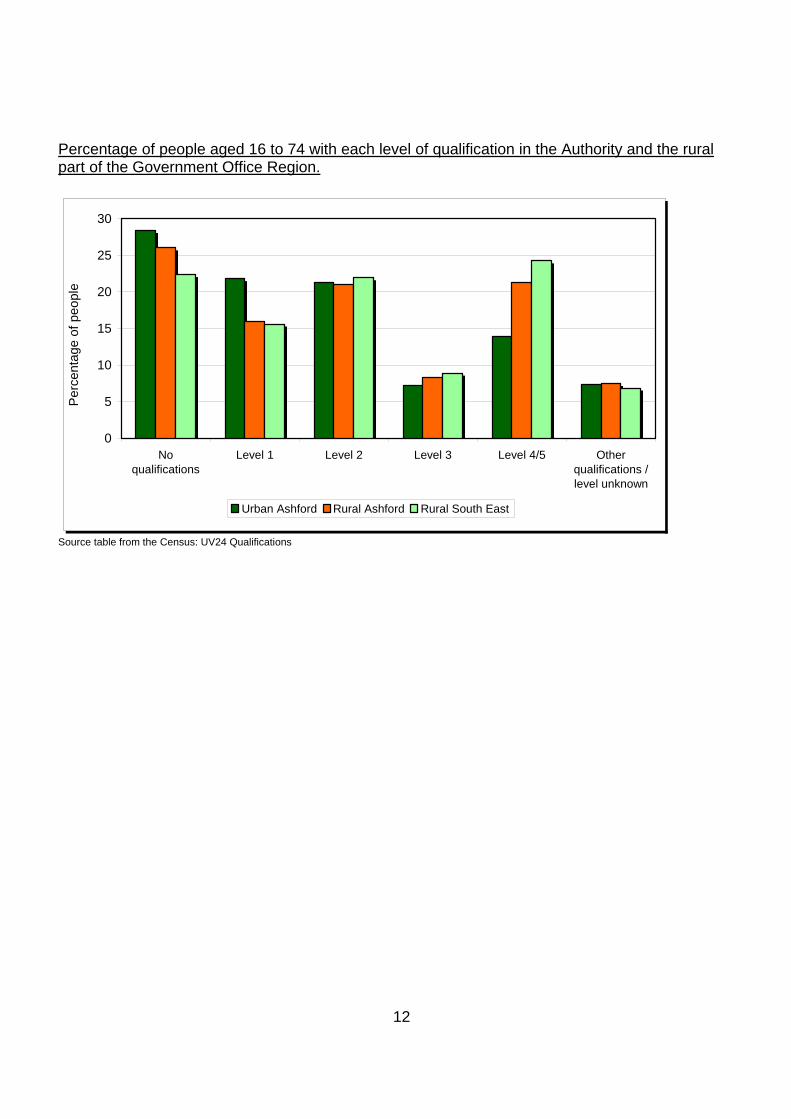
Qualifications In Ashford 27.4% of the people aged 16 to 74 have noacademic, vocational or professional qualifications, compared with 23.9% in the Region as awhole. 40.9% of the people with no such qualifications are in rural parts of the Authority. Number of people aged 16 to 74 by qualification level
None Level 1 Level 2 Level 3 Level 4/5 Other Authority GORUrban 11,821 9,079 8,830 2,998 5,770 3,091 28.4 24.4Rural 8,178 5,003 6,585 2,611 6,688 2,359 26.0 22.4
Less Sparse 8,178 5,003 6,585 2,611 6,688 2,359 26.0 22.4Town 2,394 1,501 1,920 926 2,047 662 25.3 24.1Village 3,948 2,334 2,876 993 2,745 1,125 28.2 22.0Dispersed 1,836 1,168 1,789 692 1,896 572 23.1 19.3
Sparse - - - - - - - -Town - - - - - - - -Village - - - - - - - -Dispersed - - - - - - - -
Total 19,999 14,082 15,415 5,609 12,458 5,450 27.4 23.9Percentage rural 40.9 35.5 42.7 46.6 53.7 43.3
Percentage with no qualifications
Number of people aged 16-74 within the authority that responded to the questions on qualifcation levels. (please see the footnotes)
Source table from the Census: UV24 Qualifications Footnotes None: No academic, vocational or professional qualifications Level 1: 1+ ‘O’ levels/CSE/GCSE (any grade), NVQ level 1, Foundation GNVQ Level 2: 5+ ‘O’ levels, 5+ CSEs (grade 1), 5+ GCSEs (grade A to C), School Certificate, 1+ ‘A’ levels/AS levels, NVQ level 2, Intermediate GNVQ Level 3: 2+ ‘A’ levels, 4+ AS levels, Higher School Certificate, NVQ level 3, Advanced GNVQ Level 4/5: First degree, Higher degree, NVQ levels 4-5, HND, HNC, Qualified Teacher Status, Qualified Medical Doctor, Qualified Dentist, Qualified Nurse, Midwife, Health Visitor Other: Other qualifications or level unknown e.g. City and Guilds, RSA/OCR, BTEC/Edexcel, other professional qualifications.
12
Percentage of people aged 16 to 74 with each level of qualification in the Authority and the rural part of the Government Office Region.
0
5
10
15
20
25
30
Noqualifications
Level 1 Level 2 Level 3 Level 4/5 Otherqualifications /level unknown
Per
cent
age
of p
eopl
e
Urban Ashford Rural Ashford Rural South East
Source table from the Census: UV24 Qualifications

13
National Statistics Socio-Economic Classification (NS-SeC) In this table all people aged 16 to 74 are classified according to their type of occupation using the National Statistics Socio-Economic Classification. Further details of this classification system are available from the National Statistics web site at: http://www.statistics.gov.uk/methods_quality/ns_sec/default.asp Number of people in the Authority aged 16 to 74 by NS-SeC classification
UrbanTotal Total Towns Villages Dispersed Urban Rural
Higher managerial and professional occupations 3,022 3,005 862 1,227 916 461,351 161,117Lower managerial and professional occupations 7,850 6,392 1,818 2,845 1,729 932,373 288,729Intermediate occupations 4,404 2,467 720 1,106 641 476,167 117,990Small employers and own account workers 2,576 3,977 846 1,815 1,316 311,829 135,783Lower supervisory and technical occupations 4,044 1,792 607 819 366 315,985 77,885Semi-routine occupations 5,954 2,808 908 1,319 581 496,792 115,350Routine occupations 4,439 2,155 687 1,067 401 343,728 80,000Never worked and long-term unemployed 1,062 635 151 278 206 103,870 21,453Not Classified 8,270 8,193 2,782 3,616 1,795 1,028,126 296,344
RuralAshford
South East
Source table from the Census: UV31 National Statistics Socio-economic classification Percentage of people in the Authority aged 16 to 74 by NS-SeC classification
0%
20%
40%
60%
80%
100%
Urban Rural Urban Rural
Ashford South East
Per
cent
age
of p
eopl
e ag
ed 1
6 to
74
Not Classified
Never worked and long-term unemployed
Routine occupations
Semi-routine occupations
Lower supervisory andtechnical occupations
Small employers and ownaccount workers
Intermediate occupations
Lower managerial andprofessional occupations
Higher managerial andprofessional occupations
Source table from the Census: UV31 National Statistics Socio-economic classification

14
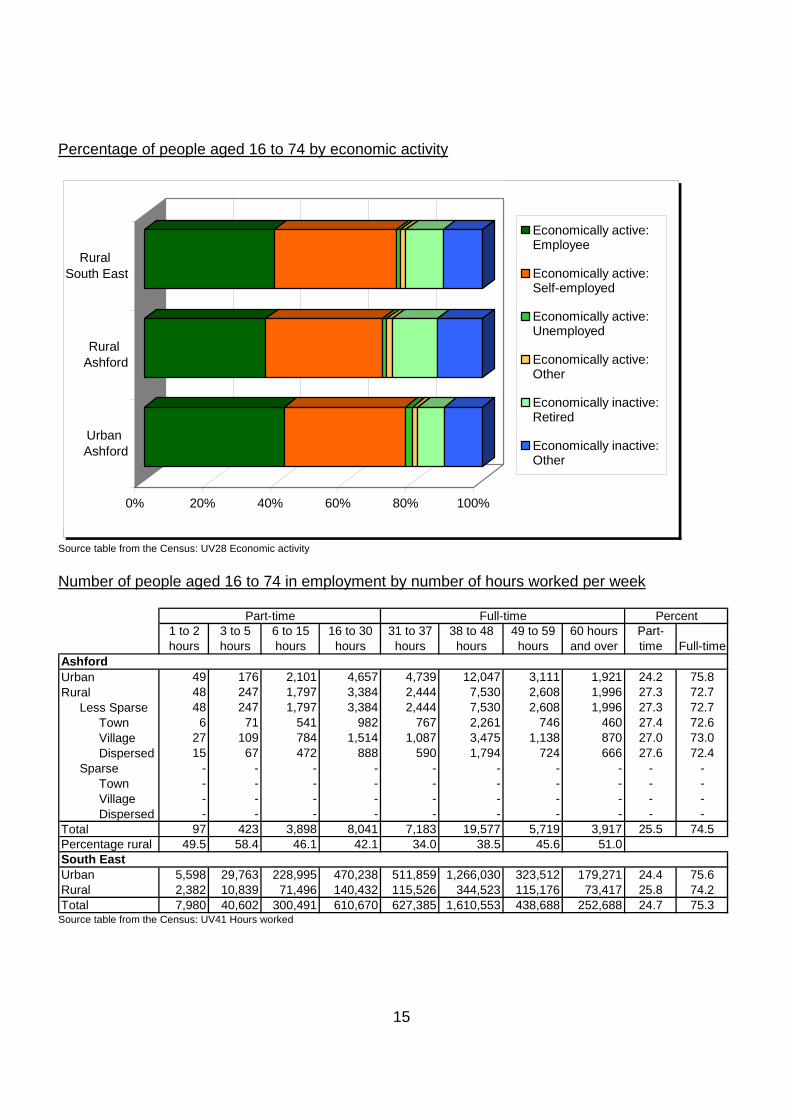
Economic activity and average number of hours worked In rural Ashford 34.3% of people aged 16 to 74 are economicallyinactive. 50.2% of those people are retired, 10.9% are students and 22.2% arelooking after the home or family.
In comparison 27.6% of people aged 16 to 74 are economically inactive in urban Ashford and 30.6% are economically inactive in ruralparts of the Government Office Region. Number of people aged 16 to 74 by economic activity
UrbanTotal Total Towns Villlages Dispersed Urban Rural
Economically active 30,148 20,643 6,013 9,256 5,374 3,138,371 899,331Employee 25,026 14,643 4,546 6,608 3,489 2,520,096 675,484
Part-time 5,610 3,775 1,163 1,685 927 545,708 157,638Full-time 19,416 10,868 3,383 4,923 2,562 1,974,388 517,846
Self-employed with employees 886 1,662 363 716 583 119,414 60,992Part-time 149 275 49 125 101 17,437 9,504Full-time 737 1,387 314 591 482 101,977 51,488
Self-employed without employees 1,990 3,130 669 1,438 1,023 259,523 112,498Part-time 460 931 195 416 320 74,434 37,294Full-time 1,530 2,199 474 1,022 703 185,089 75,204
Unemployed 1,208 536 165 233 138 110,115 23,253Full-time Students 1,038 672 270 261 141 129,223 27,104
Economically inactive 11,465 10,779 3,424 4,772 2,583 1,332,898 395,949Retired 4,665 5,415 1,774 2,498 1,143 579,666 193,269Student 1,169 1,176 497 391 288 195,738 44,813Looking after home/family 2,871 2,389 641 1,039 709 285,622 91,906Permanently sick/disabled 1,776 1,083 318 516 249 162,934 36,059Other 984 716 194 328 194 108,938 29,902
% economically active 72.4 65.7 63.7 66.0 67.5 70.2 69.4% economically inactive 27.6 34.3 36.3 34.0 32.5 29.8 30.6
Ashford South EastRural
Source table from the Census: UV28 Economic activity For the Census part-time working is defined as working 30 hours a week or less. Full-time is defined as working 31 or more hours a week.
15
Percentage of people aged 16 to 74 by economic activity
0% 20% 40% 60% 80% 100%
Urban Ashford
Rural Ashford
Rural South East
Economically active: Employee
Economically active: Self-employed
Economically active: Unemployed
Economically active: Other
Economically inactive: Retired
Economically inactive: Other
Source table from the Census: UV28 Economic activity Number of people aged 16 to 74 in employment by number of hours worked per week
1 to 2 hours
3 to 5 hours
6 to 15 hours
16 to 30 hours
31 to 37 hours
38 to 48 hours
49 to 59 hours
60 hours and over
Part-time Full-time
AshfordUrban 49 176 2,101 4,657 4,739 12,047 3,111 1,921 24.2 75.8Rural 48 247 1,797 3,384 2,444 7,530 2,608 1,996 27.3 72.7
Less Sparse 48 247 1,797 3,384 2,444 7,530 2,608 1,996 27.3 72.7Town 6 71 541 982 767 2,261 746 460 27.4 72.6Village 27 109 784 1,514 1,087 3,475 1,138 870 27.0 73.0Dispersed 15 67 472 888 590 1,794 724 666 27.6 72.4
Sparse - - - - - - - - - -Town - - - - - - - - - -Village - - - - - - - - - -Dispersed - - - - - - - - - -
Total 97 423 3,898 8,041 7,183 19,577 5,719 3,917 25.5 74.5Percentage rural 49.5 58.4 46.1 42.1 34.0 38.5 45.6 51.0South EastUrban 5,598 29,763 228,995 470,238 511,859 1,266,030 323,512 179,271 24.4 75.6Rural 2,382 10,839 71,496 140,432 115,526 344,523 115,176 73,417 25.8 74.2Total 7,980 40,602 300,491 610,670 627,385 1,610,553 438,688 252,688 24.7 75.3
Part-time Full-time Percent
Source table from the Census: UV41 Hours worked

16
Percentage of people in rural and urban parts of the Authority aged 16 to 74 in employment by number of hours worked.
0% 20% 40% 60% 80% 100%
Urban Ashford
Rural Ashford
Urban South East
Rural South East
1 to 2 hours
3 to 5 hours
6 to 15 hours
16 to 30 hours
31 to 37 hours
38 to 48 hours
49 to 59 hours
60 hours and over
Source table from the Census: UV41 Hours worked Employment by industry type The three most common industries employing people aged 16 to 74in rural Ashford are: "Wholesale and retail trade; repairs","Real estate, renting and business activities" and "Manufacturing"

17
Number of people aged 16 to 74 in employment by industry type
UrbanTotal Total Towns Villages Dispersed Urban Rural
Agriculture, hunting and forestry 350 1,076 174 494 408 27,285 28,865Fishing 3 9 3 3 3 541 311Mining and quarrying 33 39 6 24 9 5,342 1,848Manufacturing 4,498 2,285 635 1,066 584 371,703 99,934Electricity, gas and water supply 199 134 43 70 21 22,488 5,557Construction 2,590 1,995 555 919 521 211,619 65,707Wholesale and retail trade; repairs 5,605 3,246 1,045 1,457 744 504,852 130,940Hotels and restaurants 1,301 849 270 386 193 129,515 37,695Transport, storage and communications 2,529 1,153 333 539 281 256,859 59,531Financial Intermediation 1,272 835 229 363 243 157,096 41,068Real estate, renting and business activities 3,008 2,691 730 1,163 798 460,568 145,557Public administration and defence, social security 1,397 836 262 365 209 181,049 49,562Education 1,700 1,701 594 710 397 232,185 72,975Health and social work 3,149 2,152 636 981 535 298,491 83,761Other community, social & personal service activities 1,129 980 294 430 256 150,932 47,183Private households with employed persons 42 27 12 15 - 3,724 2,646Extra-territorial organisations and bodies - 6 3 3 - 871 337
RuralAshford
South East
Source table from the Census: UV34 Industry Accommodation and tenure In rural Ashford 91.5% of households live in houses or bungalows, 6% live in flats, apartments (and other similar properties) and 2.5% live in other typesof accommodation such as shared dwellings, caravans, mobile or temporary structures.In urban Ashford 86.8% of households live in houses or bungalows, 13% live in flats, apartments (and other similar properties) and 0.2% live in other typesof accommodation such as shared dwellings, caravans, mobile or temporary structures. Number of households in the Authority and Government Office Region by accommodation type
UrbanTotal Total Towns Villages Dispersed Urban Rural
In an unshared dwelling 24,200 18,699 6,119 8,206 4,374 2,636,761 751,637 House or bungalow 21,037 17,133 5,376 7,611 4,146 2,076,368 674,182 Detatched 5,220 9,248 2,267 3,946 3,035 653,823 342,291 Semi-detatched 8,262 5,163 1,843 2,434 886 746,350 221,521 Terraced (including end-terrace) 7,555 2,722 1,266 1,231 225 676,195 110,370 Flat; maisonette or apartment 3,151 1,129 728 279 122 550,501 63,736 In a purpose-built block of flats 2,544 700 507 162 31 400,404 42,406 Part of a converted or shared house 438 272 133 76 63 117,658 13,930 In a commercial building 169 157 88 41 28 32,439 7,400 Caravan, mobile or temporary structure 12 437 15 316 106 9,892 13,719In a shared dwelling 41 26 23 3 - 12,185 928
RuralAshford
South East
Source table from the Census: UV56 Accommodation Type (Households)

18
Percentage of households in the Authority and the Government Office Region by type of accommodation.
0
10
20
30
40
50
60
Det
ache
d
Sem
i-de
tach
ed
Terra
ced
In p
urpo
sebu
ilt b
lock
s
Par
t of
conv
erte
dho
use/
buili
ng
Inco
mm
erci
albu
ildin
gs
Car
avan
s et
c.
Sha
red
dwel
lings
House/bungalow Flats, apartments etc: Other
Per
cent
Urban Ashford Rural Ashford South East GOR
Source table from the Census: UV56 Accommodation Type (Households) In rural Ashford 77.3% of housholds live in ownedaccommodation, 12.3% live in social rented accommodation and 7.4% live in privaterented accomodation.In urban Ashford 72.4% of housholds live in ownedaccommodation, 18.4% live in social rented accommodation and 7.3% live in privaterented accomodation. Number of households in the Authority and Government Office Region by tenure
UrbanTotal Total Towns Villages Dispersed Urban Rural
Owned 16,961 13,943 4,373 6,096 3,474 1,875,258 556,134Owns outright 5,561 7,228 2,306 3,091 1,831 764,086 264,079Owns with a mortgage or loan 11,323 6,627 2,033 2,960 1,634 1,089,453 288,072Shared ownership 77 88 34 45 9 21,719 3,983
Social rented 4,320 2,210 998 1,045 167 381,845 77,446Rented from Council (Local Authority) 3,448 1,842 791 909 142 208,516 33,304Other social rented 872 368 207 136 25 173,329 44,142
Private rented 1,699 1,330 416 543 371 268,379 65,706Private landlord or letting agency 1,545 1,093 339 448 306 236,252 51,769Employer of a household member 15 59 12 24 23 8,716 6,109Relative or friend of a household member 121 129 48 48 33 15,226 3,966Other 18 49 17 23 9 8,185 3,862
Living rent free 449 548 153 241 154 41,448 21,260
RuralAshford South East
Source table from the Census: UV63 Tenure (Households)

19
Percentage of households by tenure
0% 20% 40% 60% 80% 100%
Percent
Urban Ashford
Rural Ashford
South East GOR
Owned Social rented Private rented Living rent free
Source table from the Census: UV63 Tenure (Households) Car ownership 12.9% of households in rural Ashford do not have a car or vanavailable for private use. In urban parts of the Constituency it is 21.6%. Number of households by car/van availability to the household and the total number of cars*
Authority GOR
No car or van
1 car or van
2 cars or vans
3 cars or vans
4 or more cars or vans
No car or van
1 or more cars or vans
Urban 5,062 10,890 6,233 1,009 230 555,758 2,011,160 27,381 3,135,430Rural 2,329 6,921 6,371 1,715 671 82,969 637,585 27,829 1,135,906
Less Sparse 2,329 6,921 6,371 1,715 671 82,893 637,002 27,829 1,135,016Town 1,149 2,623 1,670 361 115 48,392 272,635 7,581 453,915Village 922 3,036 2,896 792 287 26,301 246,822 12,485 451,260Dispersed 258 1,262 1,805 562 269 8,200 117,545 7,763 229,841
Sparse - - - - - 76 583 - 890Town - - - - - 12 117 - 167Village - - - - - 64 466 - 723Dispersed - - - - - - - - -
Total 7,391 17,811 12,604 2,724 901 638,727 2,648,745 55,210 4,271,336Percentage rural 31.5 38.9 50.5 63.0 74.5 13.0 24.1 50.4 26.6
Ashford South East
Total number of cars or vans
Source table from the Census: UV62 Cars or Vans *(includes any company car or van if it is available for private use)

20
Access to Service The following tables give figures on the distance from rural households to ten types of services:
1. Cash machines / ATMs 2. Banks 3. GPs 4. Jobcentres 5. Libraries 6. Petrol stations 7. Post offices 8. Supermarkets 9. Primary Schools 10. Secondary Schools

21
Distance to Cash Machines / ATMs and Banks Cash Machines / ATMs <2km 2-4km 4-6km 6-8km 8-10km 10-12km 12-14km 14-16km >16km TotalNumber of rural households in the Authority within X km of a cash machine / ATMLess Sparse 4,336 3,610 5,469 3,856 709 2 - - - 17,982 Town 2,917 643 1,321 1,209 22 - - - - 6,112 Village 880 2,016 2,908 1,780 426 - - - - 8,010 Dispersed 539 951 1,240 867 261 2 - - - 3,860Sparse - - - - - - - - - - Town - - - - - - - - - - Village - - - - - - - - - - Dispersed - - - - - - - - - -Rural Total 4,336 3,610 5,469 3,856 709 2 - - - 17,982% of rural households in the Authority 24.1 20.1 30.4 21.4 3.9 - - - - 100.0 in the Government Office Region 58.3 28.1 10.1 3.0 0.5 - - - - 100.0
Banks <2km 2-4km 4-6km 6-8km 8-10km 10-12km 12-14km 14-16km >16km TotalNumber of rural households in the Authority within X km of a bankLess Sparse 4,242 1,830 5,372 5,130 1,363 45 - - - 17,982 Town 3,771 199 516 1,049 577 - - - - 6,112 Village 144 824 3,696 2,914 387 45 - - - 8,010 Dispersed 327 807 1,160 1,167 399 - - - - 3,860Sparse - - - - - - - - - - Town - - - - - - - - - - Village - - - - - - - - - - Dispersed - - - - - - - - - -Rural Total 4,242 1,830 5,372 5,130 1,363 45 - - - 17,982% of rural households in the Authority 23.6 10.2 29.9 28.5 7.6 0.3 - - - 100.0 in the Government Office Region 35.0 30.7 22.5 8.5 2.9 0.5 - - - 100.0
Source: Countryside Agency

22
Distance to GPs and Jobcentres GPs <2km 2-4km 4-6km 6-8km 8-10km 10-12km 12-14km 14-16km >16km TotalNumber of rural households in the Authority within X km of a GPLess Sparse 7,430 4,915 4,702 935 - - - - - 17,982 Town 5,055 662 346 49 - - - - - 6,112 Village 1,703 2,664 3,138 505 - - - - - 8,010 Dispersed 672 1,589 1,218 381 - - - - - 3,860Sparse - - - - - - - - - - Town - - - - - - - - - - Village - - - - - - - - - - Dispersed - - - - - - - - - -Rural Total 7,430 4,915 4,702 935 - - - - - 17,982% of rural households in the Authority 41.3 27.3 26.1 5.2 - - - - - 100.0 in the Government Office Region 50.4 31.5 14.2 3.5 0.4 - - - - 100.0
Jobcentres <2km 2-4km 4-6km 6-8km 8-10km 10-12km 12-14km 14-16km >16km TotalNumber of rural households in the Authority within X km of a jobcentreLess Sparse - 711 2,417 2,287 4,007 1,542 1,280 3,240 2,498 17,982 Town - 155 616 840 1,238 - 17 2,400 846 6,112 Village - 176 1,559 861 1,956 1,121 933 289 1,115 8,010 Dispersed - 380 242 586 813 421 330 551 537 3,860Sparse - - - - - - - - - - Town - - - - - - - - - - Village - - - - - - - - - - Dispersed - - - - - - - - - -Rural Total - 711 2,417 2,287 4,007 1,542 1,280 3,240 2,498 17,982% of rural households in the Authority - 4.0 13.4 12.7 22.3 8.6 7.1 18.0 13.9 100.0 in the Government Office Region 1.3 11.8 21.6 19.7 17.7 11.3 7.8 4.2 4.5 100.0
Source: Countryside Agency

23
Distance to Libraries and Petrol Stations Libraries <2km 2-4km 4-6km 6-8km 8-10km 10-12km 12-14km 14-16km >16km TotalNumber of rural households in the Authority within X km of a libraryLess Sparse 5,320 2,703 5,295 4,422 242 - - - - 17,982 Town 4,511 140 181 1,275 5 - - - - 6,112 Village 311 1,641 3,798 2,035 225 - - - - 8,010 Dispersed 498 922 1,316 1,112 12 - - - - 3,860Sparse - - - - - - - - - - Town - - - - - - - - - - Village - - - - - - - - - - Dispersed - - - - - - - - - -Rural Total 5,320 2,703 5,295 4,422 242 - - - - 17,982% of rural households in the Authority 29.6 15.0 29.4 24.6 1.3 - - - - 100.0 in the Government Office Region 40.9 29.7 20.1 7.4 1.6 0.3 0.1 - - 100.0
Petrol Stations <2km 2-4km 4-6km 6-8km 8-10km 10-12km 12-14km 14-16km >16km TotalNumber of rural households in the Authority within X km of a petrol stationLess Sparse 10,335 4,214 3,127 306 - - - - - 17,982 Town 5,469 59 543 41 - - - - - 6,112 Village 3,535 2,621 1,795 59 - - - - - 8,010 Dispersed 1,331 1,534 789 206 - - - - - 3,860Sparse - - - - - - - - - - Town - - - - - - - - - - Village - - - - - - - - - - Dispersed - - - - - - - - - -Rural Total 10,335 4,214 3,127 306 - - - - - 17,982% of rural households in the Authority 57.5 23.4 17.4 1.7 - - - - - 100.0 in the Government Office Region 60.3 30.4 8.4 1.0 - - - - - 100.0
Source: Countryside Agency
24
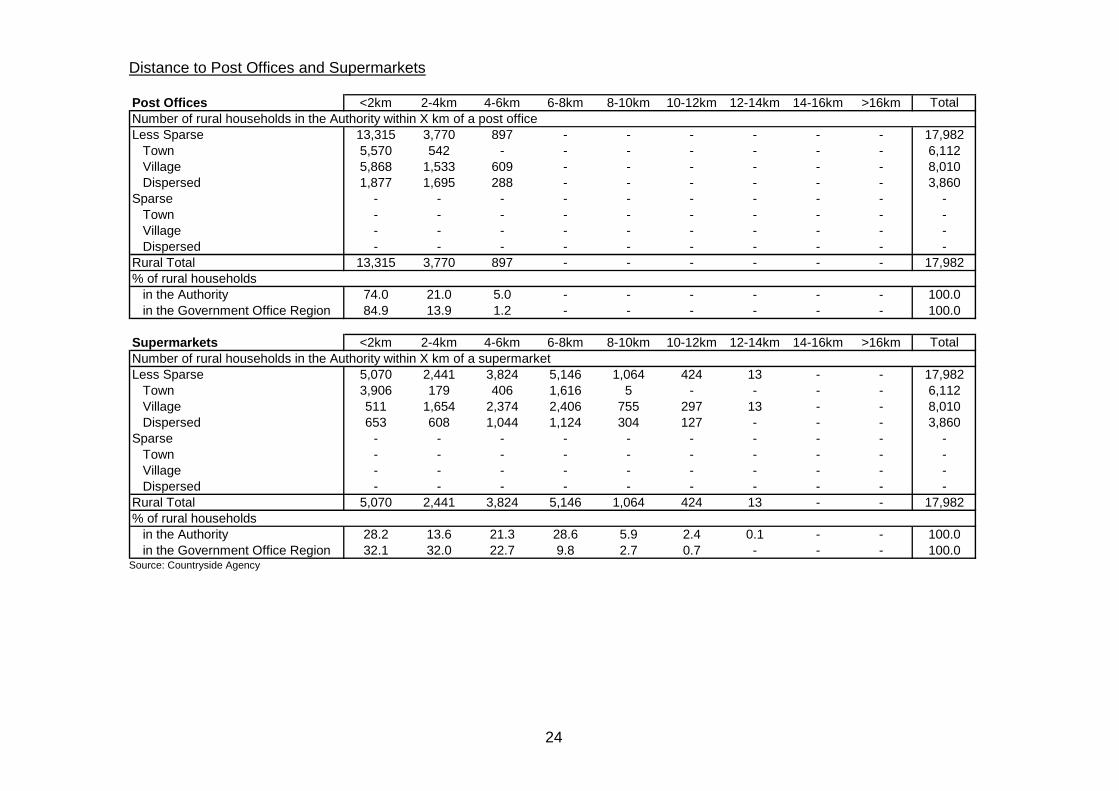
Distance to Post Offices and Supermarkets Post Offices <2km 2-4km 4-6km 6-8km 8-10km 10-12km 12-14km 14-16km >16km TotalNumber of rural households in the Authority within X km of a post officeLess Sparse 13,315 3,770 897 - - - - - - 17,982 Town 5,570 542 - - - - - - - 6,112 Village 5,868 1,533 609 - - - - - - 8,010 Dispersed 1,877 1,695 288 - - - - - - 3,860Sparse - - - - - - - - - - Town - - - - - - - - - - Village - - - - - - - - - - Dispersed - - - - - - - - - -Rural Total 13,315 3,770 897 - - - - - - 17,982% of rural households in the Authority 74.0 21.0 5.0 - - - - - - 100.0 in the Government Office Region 84.9 13.9 1.2 - - - - - - 100.0
Supermarkets <2km 2-4km 4-6km 6-8km 8-10km 10-12km 12-14km 14-16km >16km TotalNumber of rural households in the Authority within X km of a supermarketLess Sparse 5,070 2,441 3,824 5,146 1,064 424 13 - - 17,982 Town 3,906 179 406 1,616 5 - - - - 6,112 Village 511 1,654 2,374 2,406 755 297 13 - - 8,010 Dispersed 653 608 1,044 1,124 304 127 - - - 3,860Sparse - - - - - - - - - - Town - - - - - - - - - - Village - - - - - - - - - - Dispersed - - - - - - - - - -Rural Total 5,070 2,441 3,824 5,146 1,064 424 13 - - 17,982% of rural households in the Authority 28.2 13.6 21.3 28.6 5.9 2.4 0.1 - - 100.0 in the Government Office Region 32.1 32.0 22.7 9.8 2.7 0.7 - - - 100.0
Source: Countryside Agency

25
Distance to Primary Schools and Secondary Schools Primary Schools <2km 2-4km 4-6km 6-8km 8-10km 10-12km 12-14km 14-16km >16km TotalNumber of rural households in the Authority within X km of a primary schoolLess Sparse 13,196 3,697 1,089 - - - - - - 17,982 Town 5,607 161 344 - - - - - - 6,112 Village 5,447 2,094 469 - - - - - - 8,010 Dispersed 2,142 1,442 276 - - - - - - 3,860Sparse - - - - - - - - - - Town - - - - - - - - - - Village - - - - - - - - - - Dispersed - - - - - - - - - -Rural Total 13,196 3,697 1,089 - - - - - - 17,982% of rural households in the Authority 73.4 20.6 6.1 - - - - - - 100.0 in the Government Office Region 85.1 13.6 1.3 - - - - - - 100.0
Secondary Schools <2km 2-4km 4-6km 6-8km 8-10km 10-12km 12-14km 14-16km >16km TotalNumber of rural households in the Authority within X km of a secondary schoolLess Sparse 3,668 3,325 4,346 5,700 943 - - - - 17,982 Town 2,910 909 537 1,751 5 - - - - 6,112 Village 355 1,779 2,776 2,498 602 - - - - 8,010 Dispersed 403 637 1,033 1,451 336 - - - - 3,860Sparse - - - - - - - - - - Town - - - - - - - - - - Village - - - - - - - - - - Dispersed - - - - - - - - - -Rural Total 3,668 3,325 4,346 5,700 943 - - - - 17,982% of rural households in the Authority 20.4 18.5 24.2 31.7 5.2 - - - - 100.0 in the Government Office Region 25.8 33.2 25.5 11.6 3.6 0.3 - - - 100.0
Source: Countryside Agency
26
Further information: All the information in this document, except the tables on “Access to Services”, has been calculated from the 2001 Census Univariate Tables for Census Output Areas published by the Office of National Statistics (http://www.statistics.gov.uk). Further information about the Census is available at: http://www.statistics.gov.uk/census2001/default.asp There are slight differences (e.g. in total population) between tables because of imputation for non-response and disclosure issues when using Output Area data. Overall the 2001 Census achieved a 98% response rate. For further information on the quality of data at Local Authority level please see: http://www.statistics.gov.uk/census2001/la.asp Each Output Area in England and Wales has been classified using the harmonised urban / rural definition published by the ONS on 2nd August 2004 in Bulletin 2004/14 (http://www.statistics.gov.uk/geography/bulletins/bulletin2004_14.asp). The Output Area urban/rural data was then aggregated to provide the urban / rural totals for the Local Authority, Government Office Regions and England. More information about the urban / rural definition is available at: http://www.statistics.gov.uk/geography/nrudp.asp The “Access to Services” information comes from the Countryside Agency. Defra’s website also has further information about rural affairs: http://www.defra.gov.uk/rural/default.htm Produced by: Defra, Rural Statistics Unit Email: [email protected] October 2004