Income, Expenditure, Productive Assests - Directorate of ...
169
-
Upload
khangminh22 -
Category
Documents
-
view
1 -
download
0
Transcript of Income, Expenditure, Productive Assests - Directorate of ...


Income, Expenditure, Productive Assests &
Indebtedness of Agricultural Households
in Odisha
(Based on State Sample Data of 70th Round NSS January 2013- December 2013)
Directorate of Economics and Statistics
Government of Odisha
The report is based on the Situation Assessment Survey (SAS) of Agricultural
Households conducted in the 70th round of NSS during January2013-
December2013.The survey conducted in the rural area of the state in two visits,
was sprade over 209 villages covering 1669 households.The key estimates relating
to farming and other socio-economic characteristics of agricultural households.
Along with information on type of land possessed, household consumer
expenditure, income and productive assets.It also highlighted indebtedness,
average amount of loan outstanding & sources of borrowing of the agricultural
households in Odisha in respect of agricultural year July 2012- June 2013.

Director, Economics &Statistics, Government of Odisha Bhubaneswar, 751001, E-mail: [email protected]
PREFACE
National Sample Survey Office (NSSO) unlike
previous round , conducted a nation-wide survey on “Situation Assessment Survey of
Agricultural Households “ (SAS) in its 70th round during January-December 2013.The
Directorate of Economics & Statistics,Odisha,like previous round participated in this survey
with equal matching sample basis.
The present report on “Income, Expenditure,
Productive Assests & Indebtedness of Agricultural Households in Odisha “is based on
result of state sample data.
This report contains five Chapters.Chapter one is
introduction. Chapter Two gives the concepts and definitions followed in the Survey. Summary
of findings of the Survey related to household characteristics of agricultural households are
presented in Chapter Three.chapter four contains Income, Expenditure, Productive Assets
and chapter five contains Indebtedness of Agricultural Households.
The technical assistance provided by NSSO,
Government of India and the cooperation extended by the sample households is
acknowledged. I use this opportunity to place on record the work done by the supervisors,
field staff of the DPMUs who worked hard to make the survey a success and all other officers
& staff attachhed to the National Sample survey Division at the Headquarter in the Directorate
who have contributed in different ways to the success of the survey and the subsequent
production of the report.
I hope that this report will be useful to the planners, policy makers, academicians and
researchers. Suggestions for improvement of the content of the report will be highly
appreciated.
Director.
Place- Bhubaneswar
Date- 04.08.2017

Planning & Convergence Department has constituted a “Technical
Expert Committee” for finalisation of NSS reports relating to state
sample and pooled sample.
Members of Technical Expert Committee:
1. Sri. K.P Mishra, Deputy Director General, (FOD), NSSO, Bhubaneswar.
2. Prof. (Dr.) Kunja Bihari Panda, HOD (Statistics), Utkal University, Vanivihar,
Bhubaneswar.
3. Prof. (Dr.) Srijit Mishra, Director, Nabakrushna Choudhury Centre for
Development Studies, Bhubaneswar.
4. Representative from XIMB, Bhubaneswar.
5. Expert, Poverty & Human Development Monitoring Agency (PHDMA), P&C
Department.
6. Sri K.D. Sahoo, Director, Regional Institute of Planning and Applied Statistics
(RIPAES), Bhubaneswar.
Sri Dushasan Behera, Director, DES, Odisha is the chairman of the committee.

Detail Involvement
From Data Collection to Report Preparation
1. Field work
State sample data collection by district level Primary workers and
Supervisors.
2. Data Entry and Validation (state sample)
Primary Workers and Supervisors of District Planning & Monitoring
Units of all 30 districts.
3. Data entry software
Using DPD software and guidelines provided by NSSO, Government
of India.
4. Estimation and table generation (using software and guidelines
provided by NSSO, Government of India).
Dr. Sujata Priyambada Parida, Assistant Director.
5. Data Analysis and Report Writing
Sri Rashmi Ranjan Kanungo, S.A NSS –Division.
6. Report Verification
All Officers of NSS Division, Internal committee of DES and Director,
DES, Odisha.
7. Final Approval
Members of Technical Expert Committee.

CONTENT
Page no
List of Tables i
List of figures ii
Acronym iii
Executive Summary iv-v
Chapter-I Introduction 1-6
Chapter-II Sample Design, Concepts and Definitions
7-23
Chapter-III
Some Characteristics of Agricultural Households
24-42
Chapter-IV Income, Expenditure and Productive Assets
43-52
Chapter-V Indebtedness of Agricultural Households
53-57
Chapter-V Conclusion & Suggestion 58-60
Appendix-A Annexure Tables 61-116
Appendix-B Estimation Procedure 117-127
Appendix-C Schedule 33 128-156

i
LIST OF TABLES
Sl. No
Table No
Title
1 2 3
CHAPTER_III
1 3.2.1 social group wise estimated households in rural odisha
2 3.3.1 Per 1000 distribution of agricultural households by social group for each decile class of MPCE
3 3.4.1 Number per 1000 of agricultural households engaged in various activities during the 365 days prior
to the date of survey for each decile class of MPCE
4 3.4.2 per 1000 distribution of agricultural households by principal source of income during the 365 days
prior to the date of survey for each decile class of MPCE
5 3.5.1 Social group wise Number per 1000 of agricultural households engaged in various activities during
the 365 days prior to the date of survey
6 3.5.2 per 1000 distribution of households by major source of income
7 3.6.1 per 1000 distribution of agricultural households by type of land possesed
8 3.6.2 Per 1000 distribution of agricultural households by type of land possessed and number per 1000
of agricultural households operated any land for agricultural activities for each decile class of
9 3.6.3 Per 1000 distribution of agricultural households by type of land possessed and number per 1000 of
agricultural households operated any land for agricultural activities for each principal source of
household income
10 3.7.1 Per 1000 distribution of agricultural households by land possession outside the village for each
social group
11 3.8.1 Per 1000 distribution of agricultural households by type of ration card possessed for each Social
Group
12 3.8.2 Per 1000 distribution of agricultural households by type of ration card possessed for each principal
source of income
13 3.9.1 Average households size, sex ratio of agricultural households for each decile class of MPCE
14 3.9.2 Estimated number of farmers among the member of agricultural households aged 7 years and
above ( in millions)
15 3.10.1 per 1000 distribution of members of agricultural households (farmers/all members) by level of
general education
16 3.11.1 Per 1000 distribution of persons by principal activity status
17 3.12.1 sex wise per 1000 distribution of persons age 7 Years and above stayed away for more
than 15 days for the purpose of Employment in each decile class of MPC July 12-
June2013
CHAPTER_IV
18 4.1.1 The average monthly income from different sources and average monthly consumption expenditure
per agricultural household for the agricultural year July 2012 – June 2013 for each decile class of
MPCE
19 4.3.1 Average monthly expenditure (₹ ) incurred on productive assets used for farm and non-farm
business per agricultural household by decile class of MPCE during the agricultural year July 2012
- June 2013
20 4.4.1 Average monthly expenses and receipts for crop production per cultivating agricultural household
during the agricultural year July2012-June2013
21 4.5.1 Percentage distribution of average monthly expenditure for farming of animals per agricultural
household engaged in farming of animals by type of input during July 2012 -June 2013
22 4.5.2 Percentage distribution of average monthly receipts from farming of animals per agricultural
household engaged in farming of animals by type of livestock product during July 2012 -June
2013
CHAPTER_V
23 5.1.1 social group wise average amount (₹ 00) of outstanding loan per household belonging to the MPCE
decile class
24 5.2.1 social group wise per 1000 distribution of outstanding loans per agricultural household by sources
of loan taken

ii
LIST OF FIGURES
Sl
No
Figure
No Title
1 2 3
CHAPTER_III
1 3. 2.1 Estimated rural & agricultural households in Odisha
2 3. 2.2 Percentage Share of Agricultural Households by Social Group in Odisha
3 3.3.1 Percentage Distribution of Agricultural Households by Social Groups for each Decile Class of
MPCE
4 3. 5.1 Percentage Distribution of Agricultural Households by Principal Source of Income for each Social
Group
5 3. 6.1 Percentage of Agricultural Households operated land for Agricultural Activities/Possessing
MGNREG Job Card for each Social Group
6 3. 7.1 Percentage distribution of agricultural households possessing land outside village
7 3. 8.1 Percentage distribution of agricultural households by type of ration card for each social group
8 3. 10.1 Percentage distribution of members of agricultural households (farmers/all members) by level of
general education
9 3. 11.1 Percentage distribution of persons aged 7 years and above by principal activity status
10 3. 12.1 Number per 1000 of persons age 7 Years and above stayed away for more than 15 days for the
purpose of Employment in each decile class of MPC
CHAPTER_IV
11 4. 1.1 Percentage distribution of average monthly income per agricultural househod by sources
12 4.1. 2 Distribution of Average Monthly Income per Agricultural Household by their Sources for each
Decile Class of MPCE during July 2012- June 2013
13 4. 1.3 Percentage distribution of average monthly income per agricultural household during July 2012-
June 2013 for each decile class of MPCE by their sources
14 4.1. 4 The decile class wise income and expenditure inequality
15 4.3.1 Percentage Distribution of Monthly Expenditure on Productive Assets by Type of Assets
CHAPTER_V
16 5.1.1 Estimated agricultural household and indebted agricultural households in Odisha
17 5.1.2 Social group wise Percentage Distribution of indebted Agricultural Households in Rural Odisha
18 5.1.3 MPCE decile class wise average amount (₹ 00) of outstanding loan per Agricultural household
19 5.2.1 Social group wise percent distribution of outstanding loans per agricultural household by sources of
loan taken.

iii
Acronym
Abbreviations Description
BPL Below Poverty Line
DES Directorate of Economics and Statistics
DPD Data Processing Division
MGNREGS Mahatma Gandhi National Rural Employment
Guarantee Scheme
MHCE Monthly Household Consumer Expenditure
MPCE Monthly Per Capita Consumer Expenditure
MSP Minimum Support Price
NSS National Sample Survey
NSSO National Sample Survey Office
SAS Situation Assessment Survey
UPR Usual Place of Residence

iv
Executive summary
During the agricultural year July 2012- June 2013, estimated agricultural
households in Odisha was 60.72 percent of the total estimated rural
households.
Average household size and sex ratio of agricultural households was 4.5&
958.
There were 71.99 lakh estimated rural households in Odisha during the
agricultural year July 2012- June 2013.
More than 96 percent agricultural households were estimated to have
performed cultivation during the 365 days prior to the date of the survey
in Odisha.
Cultivation was the principal source of income for about 77 percent of the
agricultural households in Odisha during the period the period July 2012-
June 2013.
0.7 percent agricultural households in Odisha dose not possessed any type
of land.
55.1 percent agricultural households in Odisha possessed MGNREGS job
cards.
78.1 percent agricultural households reported during the survey has
possessed land within the village.
51.8 percent percent agricultural households in rural Odisha has possessed
BPL cards.
15.4 percent agricultural households reported during the survey has
possessed no ration cards.
33.8 percent female and 16.8 percent male of agricultural households (all
members) were not literate.
During the agricultural year July 2012 - June 2013 the average monthly
income per agricultural household was estimated as ₹ 5109.
v
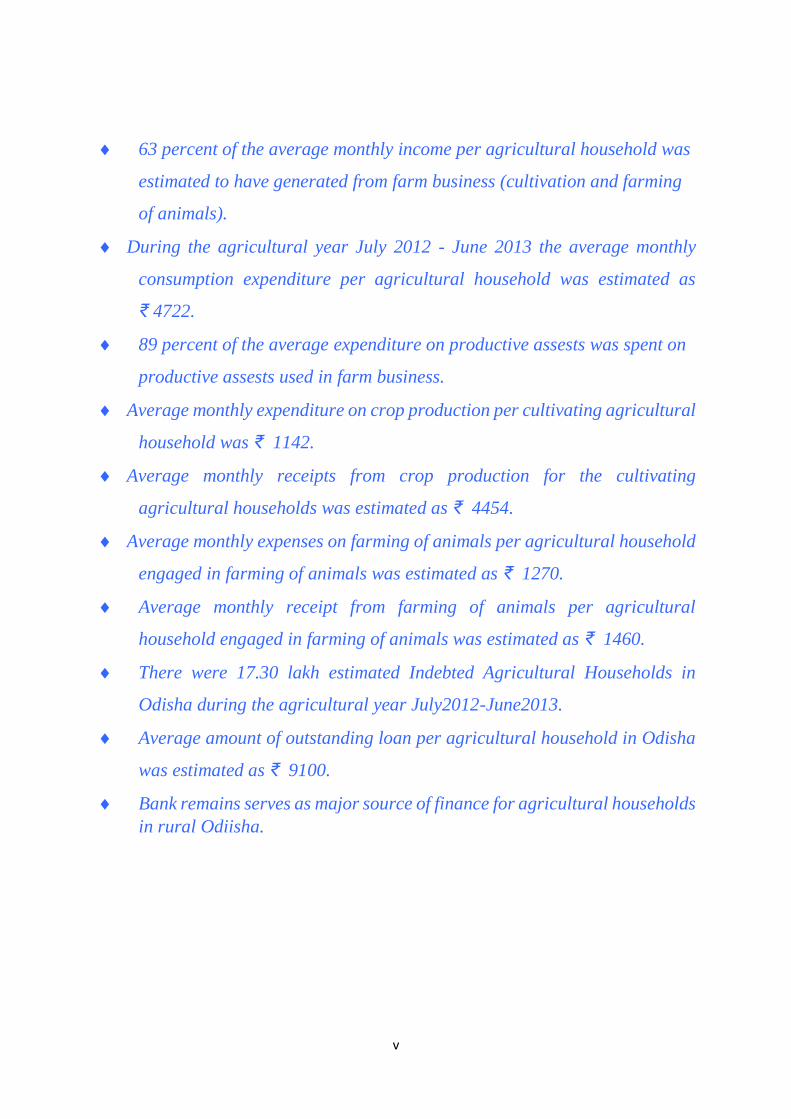
63 percent of the average monthly income per agricultural household was
estimated to have generated from farm business (cultivation and farming
of animals).
During the agricultural year July 2012 - June 2013 the average monthly
consumption expenditure per agricultural household was estimated as
₹ 4722.
89 percent of the average expenditure on productive assests was spent on
productive assests used in farm business.
Average monthly expenditure on crop production per cultivating agricultural
household was ₹ 1142.
Average monthly receipts from crop production for the cultivating
agricultural households was estimated as ₹ 4454.
Average monthly expenses on farming of animals per agricultural household
engaged in farming of animals was estimated as ₹ 1270.
Average monthly receipt from farming of animals per agricultural
household engaged in farming of animals was estimated as ₹ 1460.
There were 17.30 lakh estimated Indebted Agricultural Households in
Odisha during the agricultural year July2012-June2013.
Average amount of outstanding loan per agricultural household in Odisha
was estimated as ₹ 9100.
Bank remains serves as major source of finance for agricultural households
in rural Odiisha.

1 Income, Expenditure, Productive Assests & Indebtedness of Agricultural Households in Odisha during the year
January 2013-December 2013 (NSS 70th Round)
Chapter1
Introduction
Background
Objective of the
Survey
Comparability of
Terminology
Contents of this
Report
Scope and
coverage
Period of the
Survey
Sample Size

2 Income, Expenditure, Productive Assests & Indebtedness of Agricultural Households in Odisha during the year
January 2013-December 2013 (NSS 70th Round)
Chapter One
Introduction 1.1 Background
1.1.1 The National Sample Survey Office (NSSO), set up by the Government of India in
1950 to collect socio-economic data employing scientific sampling methods, conducted
nation-wide survey, in its 70th round of survey, conducted during the period 1st January,
2013 to 31st December, 2013, NSSO carried out a Situation Assessment Survey of
Agricultural Households. Prior to this, Situation Assessment Survey of farmers was
conducted in NSS 59th round (January, 2003-December, 2003).
The Directorate of Economics & Statistics was set up in Odisha in the
year 1958, it is pertinent to mention here that the annual round of this survey is conducted
by NSSO and state Directorate of Economics & Statistics on equal matching sampling basis.
1.2 Objective of the Survey 1.2.1 At the beginning of this millennium, the Ministry of Agriculture, Government of India
had planned for a comprehensive assessment of the situation of farmers in the country. The
areas of interest were their level of living as measured by household consumer expenditure,
income and productive assets, their indebtedness, farming practices and preferences,
resource availability, their awareness of technological developments and access to modern
technology in the field of agriculture. To meet these requirements, the Situation Assessment
Survey (SAS) has been conducted in periodic basis.
1.2.2 The Situation Assessment Survey of Agricultural Households in NSS 70th Round
(January, 2013- December, 2013) was conducted as a repeat survey of Situation Assessment
Survey of farmers conducted in 59th round. The survey also aimed at capturing the condition
of agricultural households in the country in the context of policies and programmes of
Government of India.
1.2.3 The survey schedule was designed for collection of information on various aspects
relating to farming and other socio-economic characteristics of agricultural households.
Along with information on household consumer expenditure, income and productive assets,
their indebtedness, farming practices and preferences, resource availability, their awareness
of technological developments and access to modern technology in the field of agriculture,
information on crop loss, crop insurance and awareness about Minimum Support Price
(MSP) was also collected during 70th round. The information was collected in two visits from
the same set of sample households with a view to collect relevant information separately for

3 Income, Expenditure, Productive Assests & Indebtedness of Agricultural Households in Odisha during the year
January 2013-December 2013 (NSS 70th Round)
the two major agricultural seasons in a year. The first visit was made during January to July,
2013 and the second during August to December, 2013. The survey, like in 59th round, was
conducted in rural areas only.
1.3 Comparability of Terminology used in 59th round (2003) & 70th round (2013).
59th round (2003) 70th round (2013)
a) ‘Situation Assessment Survey of
Farmers’ conducted in 59th Round
defined ‘farmer’as person who
operated some land (owned or taken
on lease or otherwise possessed)
and was engaged in agricultural
activities in broad sense of the term
e.g., cultivation of field crops,
horticultural crops, plantation,
animal husbandry, poultry, fishery,
piggery, bee-keeping, vermiculture,
sericulture, etc., on that land during
last 365 days preceding the date of
survey. If any member of a
household was a farmer, the
household was treated as a farmer
household for the purpose of the
survey. The definition followed in
NSS 59th Round had kept all
agricultural activities (whether
nominal or substantial) of
households which did not possess
and operate any land outside the
scope of the survey.
a) An agricultural household for 70th
Round survey was defined as a
household receiving some value of
produce more than Rs.3000/- from
agricultural activities (e.g.
Cultivation of field crops,
horticultural crops, fodder crops,
plantation, animal husbandry,
poultry, fishery, piggery, bee-
keeping, vermiculture, sericulture
etc.) And having at least one member
self-employed in agriculture either in
the principal status or in subsidiary
status during last 365 days.
However, as in NSS 59th round,
households which were entirely
agricultural labour households and
households receiving income
entirely from coastal fishing, activity
of rural artisans and agricultural
services were not considered as
agricultural households and they
were kept outside the scope of the
survey.
b) Possession of land was an essential
condition for defining a person as
farmer (farmer household) in 59th
b) But an agricultural household as
defined in NSS 70th round may or may
not possess land.

4 Income, Expenditure, Productive Assests & Indebtedness of Agricultural Households in Odisha during the year
January 2013-December 2013 (NSS 70th Round)
round
c) In 59th round, farmers having
insignificant farming activities, like
kitchen garden, etc. were excluded
from the survey coverage.
c) In 70th round, In order to eliminate
households pursuing agricultural
activities of insignificant nature,
households with at least one member
self-employed in agriculture either in
principal status or subsidiary status and
having total value of produce during last
365 days more than Rs. 3000/- were only
considered for inclusion in the survey
coverage.
d) In 59th Round, data was collected
for ‘kharif’ and ‘rabi’ seasons from
each sample household
d) Whereas the referance period of data
collection for 70th round were two
halves of the agriculture year 2012-
13 as July to December, 2012 and
January to June, 2013 from each
sample household.
e) In 59th round, imputed figures in
respect of consumption of input out
of home stock or out of free
collection as well as received in
exchange or borrowed were
considered.
e) In 70th round, actual expenditure (out
of pocket expenditure) incurred by
the agricultural households for
running farm and non-farm business
was collected.
1.3.1 Due to the change in coverage and difference in some important concepts and
Definitions followed in the two rounds, the estimates of SAS 2013 (NSS 70thRound) are not
strictly comparable with the same of SAS 2003 (NSS 59th Round). While making any
comparison of estimates of these two rounds, sufficient care should be taken to account for
these differences.
1.4 Reports of 70th Round Situation Assessment Survey (SAS) of Agricultural
Households
5 Income, Expenditure, Productive Assests & Indebtedness of Agricultural Households in Odisha during the year
January 2013-December 2013 (NSS 70th Round)
1.4.1 The estimates of NSS rounds are released in reports based on comprehensive
Tabulation of subject parameters and indicators in various cross classifications generated from
the sample data. For the use in decision support, policy inferences and analysis, the detailed
findings of the survey are based on the state sample data.
1.5 Contents of this Report
1.5.1 This report brings out some household characteristics like principal source of income,
possession of land, type of ration card and demographic characteristics like general education,
formal training in agriculture, usual principal activity status, staying away from home for
employment etc., of agricultural households emanating from Situation Assessment Survey of
Agricultural Households of NSS 70th Round. It contains six Chapters and three
Appendices.Chapter one is introduction, Chapter Two gives the concepts and definitions
followed in the Survey. Summary of findings of the Survey related to household
characteristics of agricultural households are presented in Chapter Three.chapter four contains
Income, Expenditure, Productive Assets of Agricultural Households,chapter five contains
Indebtedness of Agricultural Households , loan outstanding & sources of loan, chapter six is
conclusion. The detailed tables are presented in Appendix A. Appendix B provides the details
of the sample design and estimation procedure for the survey. A copy of each of the schedules
of enquiry –“Schedule -33” used is given in appendix – C.
1.7 Features of the Survey: Scope and coverage
1.7.1 Geographical coverage
The Situation Assessment Survey (SAS) covered the rural areas of the state.
1.7.2 Population coverage: The following rules were adhered to:
1. Floating population, i.e., persons without any normal residence, was excluded. But Persons
residing in open space, roadside shelter, under a bridge, etc., more or less regularly in the
same place were covered.
2. Foreign nationals were excluded, as well as their domestic servants, if by definition the
latter belonged to the foreign national's household (see Chapter Two for definition of
household).
3. Persons residing in barracks of military and paramilitary forces (like police, BSF etc.) were
kept outside the survey coverage. However, the civilian population residing in their
neighbourhood, including the family quarters of service personnel, was covered.
4. Orphanages, rescue homes, ashrams and vagrant houses were outside the survey Coverage.
However, the persons staying in old age homes, the students staying in ashram/hostels and

6 Income, Expenditure, Productive Assests & Indebtedness of Agricultural Households in Odisha during the year
January 2013-December 2013 (NSS 70th Round)
the residential staff (other than monks/nuns) of these ashrams were covered. Although
orphans living in orphanages were excluded, the persons looking after them and staying there
were covered. Convicted prisoners undergoing sentence were outside the coverage of the
survey.
1.7.3 Period of the Survey: The survey was conducted during the calendar year 2013 (1st
January, 2013 to 31st December, 2013). The same household was visited twice during the
survey period. The period of first visit (visit 1) was January to July 2013 and that of second
visit (visit 2) was August to December 2013.
1.8 Sample Size
1.8.1 The number of sample villages surveyed by state in 70th round was 209. This is known
as State Sample. The results presented in this document are, however, based on state sample
alone. For this particular survey, 8 households were selected in each sample village, for
canvassing Sch.33 both in visit 1 and visit 2. A total of 1669 households were surveyed in
both visit-I and visit II. Sector-wise number of villages surveyed and the number of
households in which Schedule 33 was canvassed separately for visit 1 and visit 2 are given in
Table 1.1.
Table:-1.1
Odisha
Number of
Sample
Villages
Surveyed
Number of Households Surveyed
Number of
Households
Estimated (00)
Visit-I Visit-II Visit
Combined
State# Sample 209* 1669 1669 43718
Central$
Sample 214 1684 1677 44934
Combined 423 3353 3346 44326
(* 3 FSU having zero case, 1 fsu casuality and 1 fsu having no farming household)
# State Sample surveyed by DE&S, Govt.of Odisha
$Central sample surveyed by NSSO, Govt.of India

7 Income, Expenditure, Productive Assests & Indebtedness of Agricultural Households in Odisha during the year
January 2013-December 2013 (NSS 70th Round)
Chapter2
Concepts and Definition
Conceptual Framework
Reference Period
Agricultural Household
Monthly Per Capita
Consumer Expenditure
(MPCE)
Household
Household Size
Economic Activity
Principal Source of
Income
Principal Activity
Status
Subsidiary Economic
Activity Status
General Educational
Level
Usual Place of
Residence
Different Sources of
Drinking Water
Productive Assets
Loans (cash and kind)
8 Income, Expenditure, Productive Assests & Indebtedness of Agricultural Households in Odisha during the year
January 2013-December 2013 (NSS 70th Round)
Chapter TWO
Concepts and definitions
2.1 Conceptual Framework
2.1.1 Reference Period: Information was collected primarily for the agricultural year 2012-
13 in two visits, viz., visit 1 and visit 2. For crops, information on expenses and receipts from
cultivation were collected for the period July to December 2012 in visit 1 and for January to
June 2013 in visit 2. However, it was ensured that all the crops, whether principal or not,
harvested during agricultural year 2012-13 were duly considered in either visit 1 or visit 2.
The same reference period was used for collecting information on productive assets.
2.1.1.1 For other items of information, different reference periods were used, viz., ‘as on the
date of survey’ for land possession and indebtedness, ‘last 30 days’ for farming of animals,
non-farm business and consumer expenditure and ‘last 365 days’ for principal source of
income. For information on productive assets and expenses and receipts from cultivation, the
reference period was July to December 2012 in visit 1 and January to June 2013 in visit 2.
2.1.1.2 The estimates of number of households presented in this report are based on data with
a moving reference point, from 01.01.2013 to 31.07.2013, which spans over a period of seven
months. These estimates, therefore, may be taken to represent the number of households
existing as on 15.04.2013, the midpoint of the seven month period.
2.1.2 Agricultural Household: For the purpose of Situation Assessment Survey (SAS) of
NSS 70th round, an agricultural household was defined as a household receiving some value
of produce from agriculture activities (e.g., cultivation of field crops, horticultural crops,
fodder crops, plantation, animal husbandry, poultry, fishery, piggery, bee-keeping,
vermiculture, sericulture, etc.,) during last 365 days. However, household which were entirely
agricultural labour household were excluded from the coverage. In contrast to the definition
of farmer used in 59th Round of NSS survey, the necessary condition of ‘land possession’ had
been dispensed with in this round. In this connection, it was also important to note that apart
from agricultural labourers, households receiving income entirely from coastal fishing,
activity of rural artisans and agricultural services were not considered as agricultural
household and they were kept out of the scope of the survey. Further, to eliminate households
pursuing agricultural activities of insignificant nature, households with at least one member
self-employed in agriculture either in the principal status or in subsidiary status and having
total value of produce more than ₹ 3000/- during the last 365 days were only considered for

9 Income, Expenditure, Productive Assests & Indebtedness of Agricultural Households in Odisha during the year
January 2013-December 2013 (NSS 70th Round)
being selected for this survey.
2.2 Monthly Per Capita Consumer Expenditure (MPCE)
2.2.1 Monthly Per Capita Consumer Expenditure (MPCE) for a household, is its total
consumer expenditure divided by its size and expressed on a per month (30 days) basis. A
person’s Monthly Per capita Consumer Expenditure (MPCE) is understood as that of the
household to which he or she belongs.
2.2.2 In all the reports of Sch.33 in NSS 70th round, estimates of some important parameters
of the survey are being presented for decile classes of MPCE. These decile classes are formed
based on the common households of both visit 1 and visit 2. Wherever State-wise estimates
are presented, decile classes are worked out separately for different States.
2.3 Combined Aggregates of Estimates
2.3.1 In Schedule 33, information on various parameters has been collected with different
reference period. Information on wage/ salary, receipts and expenditure from crop production,
purchase and sale of productive assets are collected for the reference period of 6 months
whereas, information on expenses and receipts for farming of animals, expenses and output
for non-farm business and household consumer expenditure are collected for the reference
period of last 30 days.
2.3.2 Wherever information was collected for the reference period of 30 days, combined
estimates for the agricultural year July 2012- June 2013 were calculated as weighted mean of
estimates for common households of visit 1 and visit 2, where weights are 7 and 5
respectively. For information collected for the reference period of 6 months, combined
aggregates were calculated as simple average of estimates for common households of visit 1
and visit 2 estimates.
2.4 Other Concepts and Definitions
2.4.1 Household: A group of person normally living together and taking food from a common
kitchen constituted a household. By "normally" it was meant that temporary visitors were
excluded while temporary stay-aways was included. Thus, a son or a daughter residing in a
hostel for studies was excluded from the household of his/her parents, but a resident employee
or resident domestic servant or paying guest (but not just a tenant in the house) was included
in the employer’s/host's household. "Living together" was usually given more imp ortance
than "sharing food from a common kitchen" in drawing the boundaries of a household in case
the two criteria were in conflict. For example, a person taking food with his family but
sleeping elsewhere (say, in a shop or a different house) due to space shortage or otherwise,

10 Income, Expenditure, Productive Assests & Indebtedness of Agricultural Households in Odisha during the year
January 2013-December 2013 (NSS 70th Round)
the household formed by such a person's family members was taken to include the person
also. Each inmate of a mess, hotel, boarding and lodging house, hostel, etc. was considered
as a single-member household except that a family living in such an establishment was
considered as one household only.
2.4.2 Household Size: The size of a household was defined as the total number of persons
normally residing together (i.e., under the same roof) and taking food from the same kitchen
(including temporary stay away and excluding temporary visitors).
2.4.3 Dwelling Unit: By dwelling unit, it was referred to an entire structure or only a part of
a structure where a household usually resided. The said unit may be owned, hired or otherwise
occupied. However, if any household was found living under trees, bridges, in pipes, etc., it
was not treated as living in dwelling unit. It may be noted that a dwelling unit constructed on
a plot of land which was taken under long-term lease, usually 30 years or more, was
considered as being held in owner-like possession. Similarly, a dwelling unit possessed by a
household under a long-term lease was also treated as in owner-like possession.
2.4.4 Economic Activity: The entire spectrum of human activity falls into two categories:
economic activity and non-economic activity. Any activity that results in production of goods
and services that adds value to national product was considered as an economic activity. The
economic activities have two parts - market activities and non-market activities. Market
activities were those that involve remuneration to those who perform it, i.e., activity
performed for pay or profit. Such activities include production of all goods and services for
market including those of government services, etc. Non-market activities were those
involving the production of primary commodities for own consumption and own account
production of fixed assets. The term ‘economic activity’ in the NSS 70th round of survey of
NSSO included:
(i) all the market activities, i.e., the activities performed for pay or profit which resulted in
production of goods and services for exchange,
(ii) of the non-market activities-
(a) all the activities relating to the primary sector (i.e., industry Divisions 01 to 09 of NIC-
2008) which resulted in production (including free collection of uncultivated crops, forestry,
firewood, hunting, fishing, mining, quarrying, etc.) of primary goods, including threshing and
storing of grains for own consumption. and
(b) the activities relating to the own-account production of fixed assets. Own account
production of fixed assets included construction of own houses, roads, wells, etc., and of
11 Income, Expenditure, Productive Assests & Indebtedness of Agricultural Households in Odisha during the year
January 2013-December 2013 (NSS 70th Round)
machinery, tools, etc., for household enterprise and also construction of any private or
community facilities free of charge.
2.4.5 Principal Source of Income: The principal source of income of the household was the
source which yielded maximum income among various sources from which the household
received any income during the 365 days prior to the date of survey. The different sources
were (i) cultivation, (ii) livestock, (iii) other agricultural activity, (iv) wage/salaried
employment, (v) non-agricultural enterprises, (vi) pension, (vii) remittances, (viii) interest and
dividends and (ix) others (which included income from dividends, interest etc., as well as
income from non-economic activities like begging, prostitution etc.,).
2.4.6 Principal Activity Status: The usual principal activity was determined with reference
to the fixed period of July to December 2012 in visit 1 and with reference to January to June
2013 in visit 2. The activity status on which a person spent relatively longer time (major time
criterion) during the fixed period July to December 2012 / January to June 2013, was
considered the usual principal activity status of the person.
2.4.6.2 To decide the usual principal activity of a person, he/ she was first categorised as
belonging to the labour force or not, during the reference period on the basis of major time
criterion. Persons, thus, adjudged as not belonging to the labour force were assigned the broad
activity status 'neither working nor available for work'. For the persons belonging to the labour
force, the broad activity status of either 'working' or ‘not working but seeking and/or available
for work’ was then ascertained again on the basis of the relatively longer time spent in the
labour force during the reference period. Within the broad activity status so determined, the
detailed activity status category of a person pursuing more than one such activity was
determined again on the basis of the relatively longer time spent.
2.4.6.3 The detailed activity statuses were as follows:

12 Income, Expenditure, Productive Assests & Indebtedness of Agricultural Households in Odisha during the year
January 2013-December 2013 (NSS 70th Round)
2.4.6.4 Codes 11, 12, 21, 31, 41, 42 & 51 referred to the status 'employed', 81 to the status
'unemployed' and the remaining codes viz. 91 to 97 (excluding 96) referred to the 'not in
labour force'.
2.4.7 Subsidiary Economic Activity Status: A person whose principal usual status was
determined on the basis of the major time criterion might have pursued some economic
activity for 30 days or more during the reference period. The status in which such economic
activity was pursued during the reference period July to December 2012/ January to June 2013
was the subsidiary economic activity status of the person. In case of multiple subsidiary
economic activities, the major activity and status based on the relatively longer time spent
criterion was considered. Engagement in work in subsidiary capacity might arise out of the
two following situations:
i. a person might be engaged in a relatively longer period during the referenceperiod in
economic (non-economic activity) and for a relatively minor period, which was not
less than 30 days, in another economic activity (any economic activity).
ii. a person might be pursuing an economic activity (non-economic activity) almost
throughout the reference period in the principal status and also simultaneously
pursuing another economic activity (any economic activity) for relatively shorter time
Activity status code
worked in households enterprise (self-employed) as own account worker
worked in households enterprise (self-employed) as employer
worked as helper in households enterprises (unpaid family worker)
worked as regular salaried/wage employee
11
12
21
31
worked as casual wage labour : in public works other than MGNREG public works
in MGNREG public works
in other types of work
41
42
51
did not work but was seeking and/or available for work
attended educational institutions
attended domestic duties only
attended domestic duties and was also engaged in free collection of goods
(vegetables, roots, firewood, cattle-feed etc.) sewing, tailing, weaving, etc. for
households use
rentiers, pensioners, remittance recipients, etc.
not able to work due to disability
others (including begging, prostitution, etc.)
81
91
92
93
94
95
97
13 Income, Expenditure, Productive Assests & Indebtedness of Agricultural Households in Odisha during the year
January 2013-December 2013 (NSS 70th Round)
in a subsidiary capacity. In such cases, since both the activities were being pursued
throughout the reference period and hence the duration of both the activities were more
than 30 days, the activity which was being pursued for a relatively shorter time was
considered as his/ her subsidiary activity.
2.4.8 Self-employed: Persons who operated their own farm or non-farm enterprises or were
engaged independently in a profession or trade on own-account or with one or a few partners
were deemed to be self-employed in household enterprises. The essential feature of the
selfemployed was that they had autonomy (i.e., how, where and when to produce) and
economic independence (i.e., market, scale of operation and money) for carrying out their
operation. The remuneration of the self-employed consisted of a non-separable combination
of two parts: a reward for their labour and profit of their enterprise. The combined
remuneration was given by the revenue from sale of output produced by self-employed
persons minus the cost of purchased inputs in production.
2.4.9 Regular Wage/ Salaried Employee: Persons worked in other’s farm or non-farm
Enterprises (both household and non-household) and got in return salary or wages on a regular
basis (and not on the basis of daily or periodic renewal of work contract) were the regular
wage/ salaried employees. This category not only included persons getting time wage but also
persons receiving piece wage or salary and paid apprentices, both full time and part -time.
2.4.10 Casual Wage Labour: A person casually engaged in other’s farm or
nonfarmEnterprises (both household and non-household) and got in return wage according to
the terms of the daily or periodic work contract was a casual wage labour.
2.4.11 Pension: These were, generally, post-retirement benefits that an employee received
from employers. Besides, pension might be earned as social security measures, such as old
age pension scheme, etc., or through pension income through investment in pension schemes.
2.4.12 Remittance: These were the transfers, in either cash or kind, to the households generally
by former household members. However, remittances received from persons other than
former household members and institutions were also included. If such transfers were in the
form of loans, these were not considered. The valuation of the remittances received in kind
was done by considering the market value of the kind received by the household. If the cash
remittances were in any foreign currency, exchange value of the cash remittances in Indian
Rupee was applied to arrive at the amount of remittances.
2.4.13 General Educational Level: General educational level was defined as the highest
level of education successfully completed by the members of the household considering
general/ technical/ vocational education.

14 Income, Expenditure, Productive Assests & Indebtedness of Agricultural Households in Odisha during the year
January 2013-December 2013 (NSS 70th Round)
2.4.13.1 A person who could both read and write a simple message with understanding in at
least one language was considered literate. Those, who were not able to do so, were considered
not literate.
2.4.13.2 Persons who were literate through means other than formal schooling were
considered as literate without formal schooling. Some persons achieved literacy by attending
Non-formal Education Courses (NFEC) or Adult Education Centres (AEC) or by attending
primary schools created under Education Guarantee Scheme (EGS). Persons who had become
literate through attending Total Literacy Campaign (TLC) were also considered in this
category.
2.4.13.3 The criteria for deciding primary, middle, secondary, etc., levels were the same that
was followed in the concerned states/union territories. Persons who attained proficiency in
Oriental languages (e.g., Sanskrit, Persian, etc.,) through formal but not through the general
type of education were classified appropriately at the equivalent level of general education
standard.
2.4.13.4 Formal Training in Agriculture: Any training in the field of agriculture, having a
course structure, time schedule and maybe issuing of certificate on successful completion
conducted generally by a institution was considered as formal training in agriculture for the
purpose of the survey.
2.4.14 Usual Place of Residence: Usual place of residence (UPR) of a person was defined as
a place (village/town) where the person had stayed continuously for a period of six months or
more. Any member of a household might stay away from his/her usual place of residence for
purpose of employment. For the purpose of determining the period of staying away, only those
periods was considered for which the member stayed away from the household continuously
for 15 days or more for employment or in search of employment only.
2.4.15 Ownership of Land: (i) A plot of land was considered to be owned by the household if
permanent heritable possession, with or without the right to transfer the title, was vested in a
member or members of the household. Land held in owner-like possession under long term
lease or assignment was also considered as land owned. Thus, in determining the ownership
of a plot of land two basic concepts were involved, namely,
(a) Land owned by the household, i.e., land on which the household was the right of
permanent heritable possession with or without the right to transfer the title, e.g., Pattadars,
Bhumidars, Jenmos, Bhumiswamis, RayatSithibans, etc. A plot of land might be leased out
to others by the owner without losing the right of permanent heritable possession.
(b) Land held under special conditions such that the holder did not possess the title of

15 Income, Expenditure, Productive Assests & Indebtedness of Agricultural Households in Odisha during the year
January 2013-December 2013 (NSS 70th Round)
ownership but the right for long term possession of the land (for example, land possessed
under perpetual lease, hereditary tenure and long term lease for 30 years or more) was
considered as being held under owner like possession. In the States where land reform
legislations had provided for full proprietorship to erstwhile tenants, they were considered as
having owner like possession, even if they have not paid the full compensation.
(ii) Sometimes a plot might be possessed by a tribal in accordance with traditional tribal rights
from local chieftains or village/district council. Again, a plot might be occupied by a tenant,
for which the right of ownership vests in the community. In both the cases, the tribal or other
individual (tenant) was taken as owner, for in all such cases, the holder was the owner like
possession of land in question.
2.4.16 Homestead Land: Homestead of a household was defined as the dwelling house of
the household together with the courtyard, compound, garden, out-house, place of worship,
family graveyard, guest house, shop, workshop and offices for running household enterprises,
tanks, wells, latrines, drains and boundary walls annexed to the dwelling house. All land
coming under homestead was defined as house site (homestead land). Sometimes, gardens,
orchards or plantations, though adjacent to the homestead and lying within the boundary walls
located on a clearly distinct piece of land. In such cases, land under garden, orchard or
plantation was not considered as house site.
2.4.17 Lease of Land: (i) Land given to others on rent or free by owner of the land without
surrendering the right of permanent heritable title was defined as land leased-out. It was
defined as land leased-in if it was taken by a household on rent or free without any right of
permanent or heritable possession. The lease contract might be written or oral.
ii) Sometimes orchards and plantations were given to others for harvesting the produce for
which the owner received a payment in cash or kind. Such transactions were not treated as
‘lease’ for the purpose of the survey.
2.4.18 Otherwise Possessed Land: This was understood to mean all public/institutional land
possessed by the household without title of ownership or occupancy right. The possession
was without the consent of the owner. Private land (i.e. land owned by the household sector)
possessed by the household without title of ownership and occupancy right were not included
in this category. All private land encroached upon by the household was treated as leased-in
land.
2.4.19 Land Possessed: Land possessed was defined by land owned (including land under
‘owner like possession’) + land leased in - land leased out + land held by the household but
neither owned nor leased in (e.g., encroached land).

16 Income, Expenditure, Productive Assests & Indebtedness of Agricultural Households in Odisha during the year
January 2013-December 2013 (NSS 70th Round)
2.4.19.1 Size Class of Land Possessed: Different estimates obtained from the survey have
been presented for seven size classes of land possessed, namely, <0.01 ha., 0.01-0.40 ha.,
0.41-1.00 ha., 1.01 – 2.00 ha., 2.01-4.00 ha., 4.01- 10.00 ha. 10.00 ha.+. The class limits are
exclusive in the sense the class 0.01 -.40 covers land 0.01 to less than 0.40 ha. Similarly the
class 0.41 -1.00 covers 0.40 ha. to less than 1.00 ha. Similarly the class 4.01- 10.00 ha.
Includes 4.00 ha. To less than 10.00 ha. The last class includes lands that are 10 ha. Or more.
2.4.20 Agricultural Production: Agricultural production included:
a) Growing of field crops (including fodder crops), fruits, grapes, nuts, seeds, seedlings in the
nurseries, bulbs, vegetables and flowers both in open and under glass, production of fodder
crops etc.
b) Production of plantation crops like tea, coffee, cocoa, rubber etc.
c) Forest production in parcels of land which form part of enumeration holding and
d) Production of livestock and livestock products, poultry and poultry products, fish, honey,
rabbits, furbearing animals and silk-worm cocoons. However, rearing pet animals were not
considered as agricultural production.
2.4.21 Cultivation: All activities relating to production of crops and related ancillary
activities were considered as cultivation. Growing of trees, plants or crops as plantation or
orchards (such as rubber, cashew, coconut, pepper, coffee, tea etc.) were not considered as
cultivation activities for the purpose of this survey. In general, the activities covered under
NIC-2008 classes 0111, 0112, 0113, 0114, 0116, 0119 and among class 0128 sub classes
01281, 01282, etc., were considered as cultivation.
2.4.22 Livestock: Livestock were those animals which were used for food, fibre, labour, etc.
Animals kept as pets, snakes, reptiles, frogs, fishes were excluded from the coverage of
livestock.
2.4.23 Other Agricultural Activity: Other agricultural activities included all the activities in
the agricultural sector, except cultivation and livestock farming activities, like activities of
growing of plantation, orchard, forestry, logging, fishery, etc.
2.4.24 Farm Business: Farm business comprised household economic activities like
cultivation, including cultivation of plantation and orchard crops, and processing of produce
on the farm, e.g., paddy hulling and gur making. Although gur making was a manufacturing
activity, this was covered under farm business for the purpose of this survey only when such
activity was carried out in the farm by indigenous method. Such activities when they were
carried out in non-household enterprises were to be excluded from the purview of the farm
business. Farm business also included activities ancillary to agriculture, like livestock raising,

17 Income, Expenditure, Productive Assests & Indebtedness of Agricultural Households in Odisha during the year
January 2013-December 2013 (NSS 70th Round)
poultry, fishing, dairy farm activities, bee keeping and other allied activities coming under
Section A (Division 01 to Division 03) of the National Industrial Classification 2008.
2.4.25 Non-farm Business: Non-farm business was defined as all household economic
activities other than those covered in the farm business. This covered manufacturing, mining
& quarrying, trade, hotel & restaurant, transport, construction, repairing and other services.
For the purpose of this survey, non-farm business excluded such activities when they were
carried out in non-household enterprises. All non-farm business enterprises, which were
registered under section 2m(i) or 2m(ii) and section 85 of the Factories Act, 1948, were
excluded from the scope of this survey. Further, Bidi and cigar manufacturing establishments
registered under the Bidi and Cigar Workers (condition of employment) Act, 1966, were also
kept outside the coverage of this survey.
2.4.26 Agricultural Labour: A person was considered to be engaged as agricultural labour,
if he/ she followed one or more of the following agricultural occupations in the capacity of a
wage paid manual labour, whether paid in cash or kind or both:
(i) farming
(ii) dairy farming
(iii) production of any horticultural commodity
(iv) raising of livestock, bees or poultry
(v) any practice performed on a farm as incidental to or in conjunction with farm operations
(including forestry and timbering) and the preparation for market and delivery to storage or
to market or to carriage for transportation to market of farm produce. Further, 'carriage for
transportation' referred only to the first stage of the transport from farm to the first place of
disposal.
2.4.27 Different Sources of Drinking Water
2.4.27.1 Tap: An arrangement made by corporation, municipality, panchayat or other local
authorities or any private or public housing estate or agency to supply water through pipe for
household uses was considered as tap water. Drinking water carried through pipe from sources
like well, tank, river, etc., by the owner / occupants only for convenience of the household,
however, were not treated as tap water.
2.4.27.2 Tube Well/Borehole: Tube well or borehole was a deep hole that had been driven,
bored or drilled, with the purpose of reaching groundwater supplies. Boreholes/tube wells
were constructed with casing, or pipes, which prevent the small diameter hole from caving in
and protect the water source from infiltration by run-off water. Water was delivered from a
tube well or borehole through a pump, which may be powered by human, animal, wind,

18 Income, Expenditure, Productive Assests & Indebtedness of Agricultural Households in Odisha during the year
January 2013-December 2013 (NSS 70th Round)
electric, diesel or solar means. Boreholes/tube wells were usually protected by a platform
around it, which leaded spilled water away from the borehole and prevented infiltration of
run-off water at the well head.
2.4.27.3 Protected Well/Unprotected Well: A well was considered as protected if it had
generally the following protective measures to lower the risk of contamination:
i. A headwall around the well with a properly fitting cover
ii. A concrete drainage platform around the well with a drainage channel
iii. A hand pump or bucket with windlass.
If instead of hand pump or bucket with windlass, electric pump was used to pump water from
such wells, where the conditions (1) and (2) existed, it was considered as protected well.
2.4.27.4 Protected Spring/Unprotected Spring: A spring was considered protected, if it was
protected from runoff, bird droppings and animals by a "spring box", which was constructed
of brick, masonry, or concrete and was built around the spring so that water flows directly out
of the box into a pipe or cistern, without being exposed to outside pollution. A spring which
was not protected was called unprotected spring.
2.4.27.5 Rainwater Collection: Rainwater refers to rain that was collected or harvested from
surfaces (by roof or ground catchment) and stored in a container, tank or cistern until used.
Traditionally, rainwater collection had been practised in arid and semi –arid areas and had
provided drinking water and water for other uses of the household. When such water was used
for drinking purpose, the source of drinking water was considered as rainwater collection.
2.4.27.6 Surface Water: Surface water was water located above ground and includes rivers,
dams, lakes, ponds, streams, canals and irrigation channels.
2.4.27.7 Others (tanker-truck, cart with small tank or drum, bottled water etc.): In
‘tanker-truck’, water was trucked to a locality and supplied from tanker. In ‘cart with small
tank or drum’, water was supplied in small tank or drum to a locality by donkey carts,
motorized vehicles and other means. Drinking water packaged in bottles, jars, pouches, and
similar containers was classified as bottled drinking water. However, tap water, well water,
etc., kept by households in bottles, for convenience, was not treated as bottled drinking water.
2.4.28 Mahatma Gandhi National Rural Employment Guarantee Act (MGNREGA):
The Mahatma Gandhi National Rural Employment Guarantee Act, 2005 (MGNREGA) was
an important step towards the realization of the right to work and to enhance the livelihood
security of the households in the rural areas of the country. According to this Act, Rural
Employment Guarantee Schemes (REGS) were formed by the State Governments. The
Scheme provided at least 100 days of guaranteed wage employment in every financial year to

19 Income, Expenditure, Productive Assests & Indebtedness of Agricultural Households in Odisha during the year
January 2013-December 2013 (NSS 70th Round)
every household whose adult members volunteer to do unskilled manual work. Adult was
defined a person who had completed his/ her eighteen years of age. Unskilled manual work
was meant any physical work which any adult person was capable of doing without any
special skill/ training. The implementing agency of the scheme might be any Department of
the Central Government or a State Government, a ZilaParishad, Panchayat/ Gram Panchayat
or any local authority or Government undertaking or non-governmental organization
authorized by the Central Government or the State Government.
2.2.1 Agricultural Production: Agricultural production included: a) Growing of field crops
(including fodder crops), fruits, grapes, nuts, seeds, seedlings in the nurseries, bulbs,
vegetables and flowers both in open and under glass, etc.
b) Production of plantation crops like tea, coffee, cocoa, rubber etc.
c) Forest production in parcels of land which form part of enumeration holding and
d) Production of livestock and livestock products, poultry and poultry products, fish, honey,
rabbits, furbearing animals and silk-worm cocoons. However, rearing pet animals are not
considered as agricultural production.
2.2.2 Cultivation: All activities relating to production of crops and related ancillary activities
are considered as cultivation. Growing of trees, plants or crops as plantation or orchards (such
as rubber, cashew, coconut, pepper, coffee, tea etc.) are not considered as cultivation activities
for the purpose of this survey. In general, the activities covered under NIC-2008 classes 0111,
0112, 0113, 0114, 0116, 0119 ( growing of non-perennial crops other than tobacco) and
among class 0128 sub classes 01281, 01282, etc., are considered as cultivation. Only activities
of the household in self employment capacity in cultivation are considered for the purpose of
the survey
2.2.3 Livestock: Livestock are those animals which are used for food, fibre, labour, etc.
Animals kept as pets, snakes, reptiles, frogs, fishes are excluded from the coverage of
livestock. Only activities of the household in self employment capacity in livestock activities
are considered for the purpose of the survey
2.2.4 Other Agricultural Activities: Other agricultural activities include all the activities in the
agricultural sector, except cultivation and livestock farming activities, like growing of
plantation, orchard, forestry, logging, fishery, etc. Only activities of the household in self
employment capacity in other agricultural activities are considered for the purpose of the
survey
2.2.5 Transactions in Livestock: An agricultural household might have purchased and sold
livestock for various purposes. It is necessary to understand characteristics of such transaction

20 Income, Expenditure, Productive Assests & Indebtedness of Agricultural Households in Odisha during the year
January 2013-December 2013 (NSS 70th Round)
and distinguish them for reporting in various blocks of this schedule. Purpose of such
transactions is classified into three broad groups namely, for the purpose of business, for the
purpose of acquiring productive asset and for the purpose of trading.
2.2.6 Pre-harvest Sale (₹ ): Farmers sometimes sold entire produce of a plot of land before
harvesting. Land area used and value of such pre-harvest sales are collected for the survey.
For pre-harvest sale, generally volume of production is not known. Therefore, care is taken
not to include quantity of production for pre-harvest sale, even if it is available while reporting
quantity. While reporting land corresponding to the quantity of production, area relating to
pre-harvest sale is excluded. Irrigated and un-irrigated land area corresponding to pre-harvest
sale are separately reported along with value of pre-harvest sale in designated fields in block
5a of the Schedule.
2.2.7 Value of Products (₹ ): Value of produces for each major crop is calculated multiplying
quantity with rate. For crops clubbed together as ‘others’, value is based on actual sale or
assessment of the informant.
2.2.8 Value of By-products (₹ ): Value of by-products for 4 major crops and ‘others’, if any,
are reported based on actual sale or assessment of the informant.
2.2.10 Seeds: Expenditure incurred on seeds for 4 major crops as reported in Block 5a are
recorded in the same order. When there are more than 4 crops, crops other than 4 major crops
are clubbed together and reported. The term ‘seeds’ also included seedling (baby plant).
2.2.11 Fertilizer: Fertilizers are mostly inorganic material of natural or synthetic origin (other
than liming materials) that is added to a soil to supply one or more plant nutrients essential to
the growth of plants. Generally these are industrially manufactured chemicals containing plant
nutrients.
2.2.12 Manure: Manure is organic matter used as organic fertilizer in agriculture. Manures
contributed to the fertility of the soil by adding organic matter and nutrients. There are three
main classes of manures used in soil management:
a) ‘animal manure’ made from cattle dung, excreta of other animals.
b) ‘compost’ made from decomposed remnants of organic materials – usually of plant origin,
but often including some animal dung or bedding.
c) ‘plant manure’ which are crops grown for the express purpose of ploughing them in, thus
increasing fertility through the incorporation of nutrients and organic matter into the soil.
2.2.13 Plant Protection Chemicals: Plant protection chemicals included all pesticides,
herbicides, insecticides, fungicides, as well as biotechnology products which helped control
the thousands of weed species, harmful insects and numerous plant diseases that could afflict
21 Income, Expenditure, Productive Assests & Indebtedness of Agricultural Households in Odisha during the year
January 2013-December 2013 (NSS 70th Round)
crops.
2.2.14 Cost of ‘Animal Seeds’: Expenditure incurred on purchase of ‘animal seeds’ for
Cattle/buffalo, sheep, goat, piggery etc., poultry & duckery and others. Young animals
Purchased for the purpose of business only are considered here.
2.2.15 Animal Feed: Expenditure incurred on animal feed is collected for the following
specific fodder items. The animal feed had been grouped into the following four classes,
namely (1) Green fodder, (2) Dry fodder, (3) Concentrates (4) Other feed including minerals
(salt etc.,) and medicines. If animal feeds are used from home stock or from free collection as
well as received in exchange or borrowed, zero expenditure is recorded.
2.2.16 Green Fodder: Green fodder is obtained through crop cultivation. Some crops are
taken up exclusively for green fodder purpose. These includes Berseem, Lucerne, Cowpea,
Guar, Rice bean, Velvet bean, Sorghum (fodder varieties like MP chari, Sorghum sudan grass
(a hybrid developed by crossing sorghum and sudan grass), Sudax, Red chari), Napier bajra
hybrid (a hybrid developed by crossing crops Napier grass &bajra), Maize (fodder varieties
like African tall, J-1006, Vijay composite), Jowar, Oats, Chinese cabbage, Turnip, Fodder
beet, all palatable grasses. Some crops that are primarily taken for human consumption are
also used as green fodder for animals. These include maize, sugarcane, cowpea, oats etc.
2.2.17 Dry Fodder: Dry residue of some crops is used as fodder. These include straws of
wheat, paddy, sorghum, barley, jowar, gram etc.
2.2.18 Concentrates: Concentrates generally include oil cake, crushed pulses, gram, grains,
bran, husk, oil seed and gur.
2.2.19 Veterinary Charges: Veterinary charges include charges for medicine, vaccination,
artificial insemination etc.
2.2.20 Expenditure on Human Labour: The expenditure on payment of wages/salaries by
the agricultural household for carrying out cultivation during the reference period is
considered. Payment of wages and salaries are made for two different categories of labour:
a) Regular wage/salary: Labour which is regular in nature. This includes the payments made
to persons working in farm and getting in return of salary or wages on a regular basis (and not
on the basis of daily or periodic renewal of work contract). The category not only includes
persons getting time wage but also persons receiving piece wage or salary and paid
apprentices, both full time and part-time.
b) Casual labour: Labour which is casual in nature. Payments made to person(s) casually
engaged in farm and getting wage according to the terms of the daily or periodic work contract
are regarded as payments made for casual labour. Total Payment to both categories made

22 Income, Expenditure, Productive Assests & Indebtedness of Agricultural Households in Odisha during the year
January 2013-December 2013 (NSS 70th Round)
either in cash or in kind is reported. If it is paid in kind, the corresponding monetary value is
evaluated at purchaser’s price.
2.2.21 Expenses Incurred for Non-firm Business: Expenses incurred (paid or payable)
towards running the non-farm business during the last 30 days prior to the date of survey is
recorded. Only actual expenses out of pocket (both in cash and in kind) are reported.
Consumptions of inputs out of home stock or out of free collection as well as received in
exchange or borrowed are taken as zero expenses. Further, expenses on inputs actually
consumed only are considered. Depending on the type of non-farm business, expenses on
inputs included raw materials used, cost of commodities traded, articles used for food and
drink preparation, petrol, diesel, lubricants etc., minor repair and maintenance, electricity
charges, fuel other than electricity, rent, travelling, freight and cartage expenses,
communication expenses (telephone, telegram, fax, postal, courier, e-mail, etc.), consumable
stores, packing materials, paper, printing and stationary expenses, service charges for work
done by other establishments (e.g. legal, audit, advertising and other accounting services;
warehousing expenses, etc.), cost of own construction (building, furniture and fixtures etc.),
interest, wages and salaries, etc.
2.2.22 Value of Output from Non-firm Business (₹ ): Value of outputs during the reference
period from running non-farm business of the household is collected. The value of output that
is not sold is evaluated at price in the local market or based on the assessment of the informant.
Value of products lost by theft/damage/destroyed by fire etc. during the reference period is
excluded. Depending on the type of non-farm business receipts from non-farm business
included value of products and by-products manufactured, sale value of commodities traded,
amounts receivable from contractor, receipts from sale of prepared food, refreshment and
drinks, earnings from goods and passenger traffic, communication charges receivable from
customers (STD/courier, fax, etc.), receipts for educational activity (like tuition fees,
examination fees, capitation fees, etc.), receipts from consultation fees and medical services,
receipts from services provided to others including commission charges, market value of own
construction (on building, furniture and fixtures, etc.), value of consumption of goods/services
produced or traded for own use, rent receivable on plant and machinery and other fixed assets,
etc.
2.2.23 Productive Assets: Assets represented all the things owned by the household which
had money value, e.g. land, buildings, livestock, agricultural machinery and implements, etc.
Assets which are used repetitively for producing goods or providing services are treated as
productive asset. In this survey, information on productive assets used for farm and non-firm

23 Income, Expenditure, Productive Assests & Indebtedness of Agricultural Households in Odisha during the year
January 2013-December 2013 (NSS 70th Round)
business are collected separately along with information on land and residential buildings.
2.2.24 Loans (cash and kind): The information pertaining to the household’s indebtedness
as on the date of survey is collected and each loan is record separately irrespective of the type
of loan and amount outstanding. Loans included borrowing in cash and/or kind (including
hire purchases/credit purchase). Borrowings in kind are evaluated at current retail price
prevalent in the local market. An advance payment received for forward delivery of goods
also considered as loan. Cash loans taken for short period without any security are excluded.
For each loan, the total amount due on the date of survey (i.e., the outstanding principal plus
the interest due) is recorded. Initial discount allowed, if any, in the principal is taken into
account while recording the total amount of loan outstanding on the date of survey. In the case
of credit purchase, it is ascertained whether such credits are really due on the date of survey
or not. Dues are considered only after the expiry of the stipulated due date of payment of such
charges.

24 Income, Expenditure, Productive Assests & Indebtedness of Agricultural Households in Odisha during the year
January 2013-December 2013 (NSS 70th Round)
Chapter3
Summary of Findings
Number of Agricultural
Households Estimated
Agricultural Households by
Social Group
Agricultural Households by
Decile Classes of MPCE
Principal Source of Income
of Agricultural Households
Principal Source of Income
of Agricultural Households
for Social Group
Type of Land Possessed by
Agricultural Households
Land Possession by
Agricultural Households
Outside Village
Type of Ration Card
possessed by Agricultural
Households
Demographic Characteristics
of Agricultural Households
Educational Characteristics
of Agricultural Households
Principal Activity Status
25 Income, Expenditure, Productive Assests & Indebtedness of Agricultural Households in Odisha during the year
January 2013-December 2013 (NSS 70th Round)
Chapter Three
Some Characteristics of Agricultural Households
3.1 Introduction
3.1.1 The Situation Assessment Survey of Agricultural Households was conducted in NSS
70th round (January – December, 2013) to have a comprehensive picture of the agricultural
households in Odisha. The survey collected information on various aspects of farming, such
as farming practices and preferences, availability of resources, awareness of technological
developments and access to modern technology in the field of agriculture and level of living
measured in terms of household consumer expenditure, income and indebtedness from the
agricultural households in rural India. The survey, with its two visits, made a detailed
assessment of the situation of the agricultural households for the agricultural year July 2012-
June 2013.
3.1.2 This chapter presents estimates of some characteristics of agricultural households for
the reference period. Most of the parameters for which estimates are presented in this chapter
were collected only during the visit 1 of the survey. However, some demographic
characteristics such as activity status of household members were collected during both the
visits.
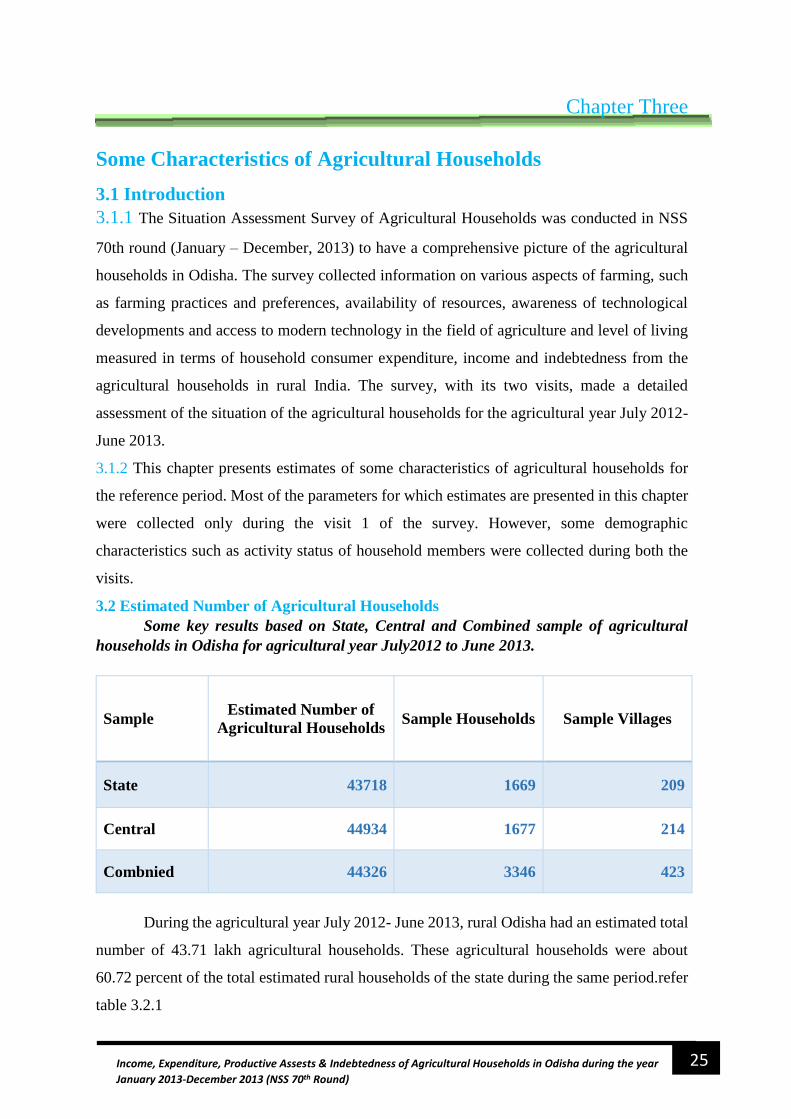
3.2 Estimated Number of Agricultural Households
Some key results based on State, Central and Combined sample of agricultural
households in Odisha for agricultural year July2012 to June 2013.
Sample Estimated Number of
Agricultural Households Sample Households Sample Villages
State 43718 1669 209
Central 44934 1677 214
Combnied 44326 3346 423
During the agricultural year July 2012- June 2013, rural Odisha had an estimated total
number of 43.71 lakh agricultural households. These agricultural households were about
60.72 percent of the total estimated rural households of the state during the same period.refer
table 3.2.1
26 Income, Expenditure, Productive Assests & Indebtedness of Agricultural Households in Odisha during the year
January 2013-December 2013 (NSS 70th Round)
Table 3.2.1: Agricultural Households by social groups
Social Group Estimated Number of (00) Percentage Share (%) of
Agricultural
households
Rural
households
Agricultural
households
Rural
households
1 2 3 4 5
Schedule Tribe 14010 21674 32.05 64.34
Schedule Caste 5993 17520 13.71 34.21
OBC 13768 20511 31.49 64.39
Others 9946 12204 22.75 73.89
All 43718 71992* 100 60.72
*With respect to 71.99 lakh rural households as estimated by the Land and Livestock Holdings Survey of NSS
70th round.
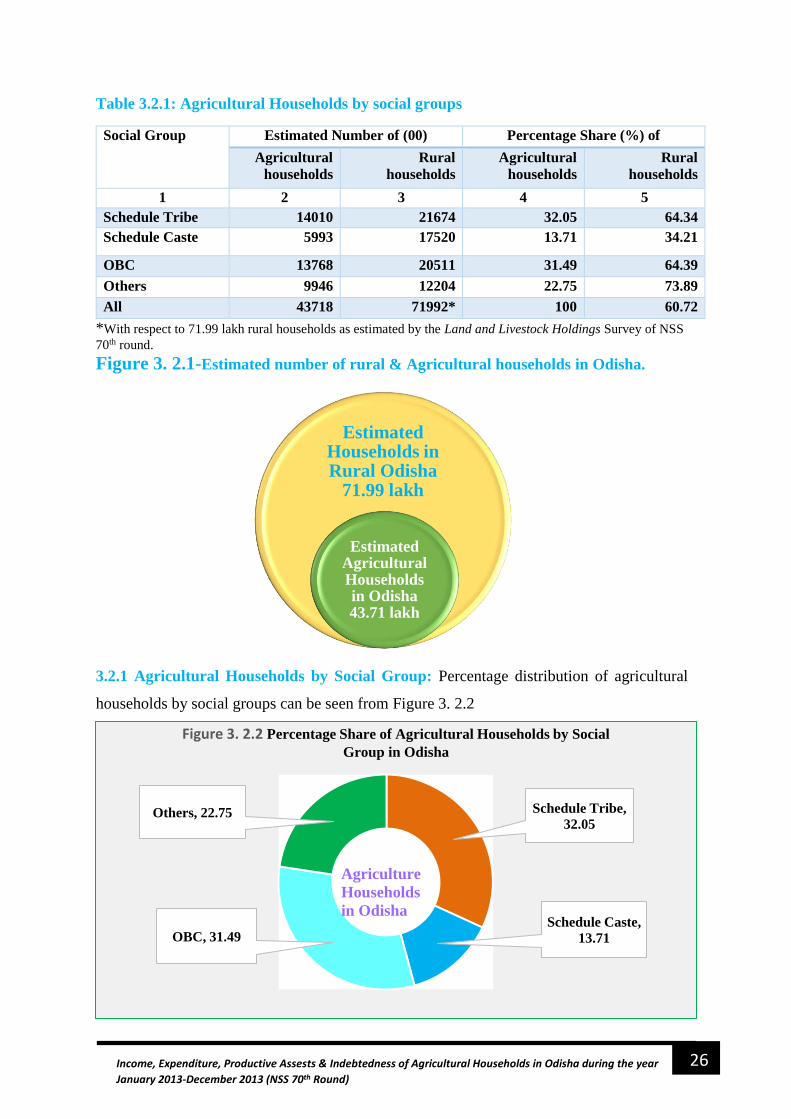
Figure 3. 2.1-Estimated number of rural & Agricultural households in Odisha.
3.2.1 Agricultural Households by Social Group: Percentage distribution of agricultural
households by social groups can be seen from Figure 3. 2.2
Estimated Households in Rural Odisha
71.99 lakh
Estimated Agricultural Households in Odisha 43.71 lakh
Schedule Tribe,
32.05
Schedule Caste,
13.71OBC, 31.49
Others, 22.75
Figure 3. 2.2 Percentage Share of Agricultural Households by Social
Group in Odisha
Agriculture
Households
in Odisha
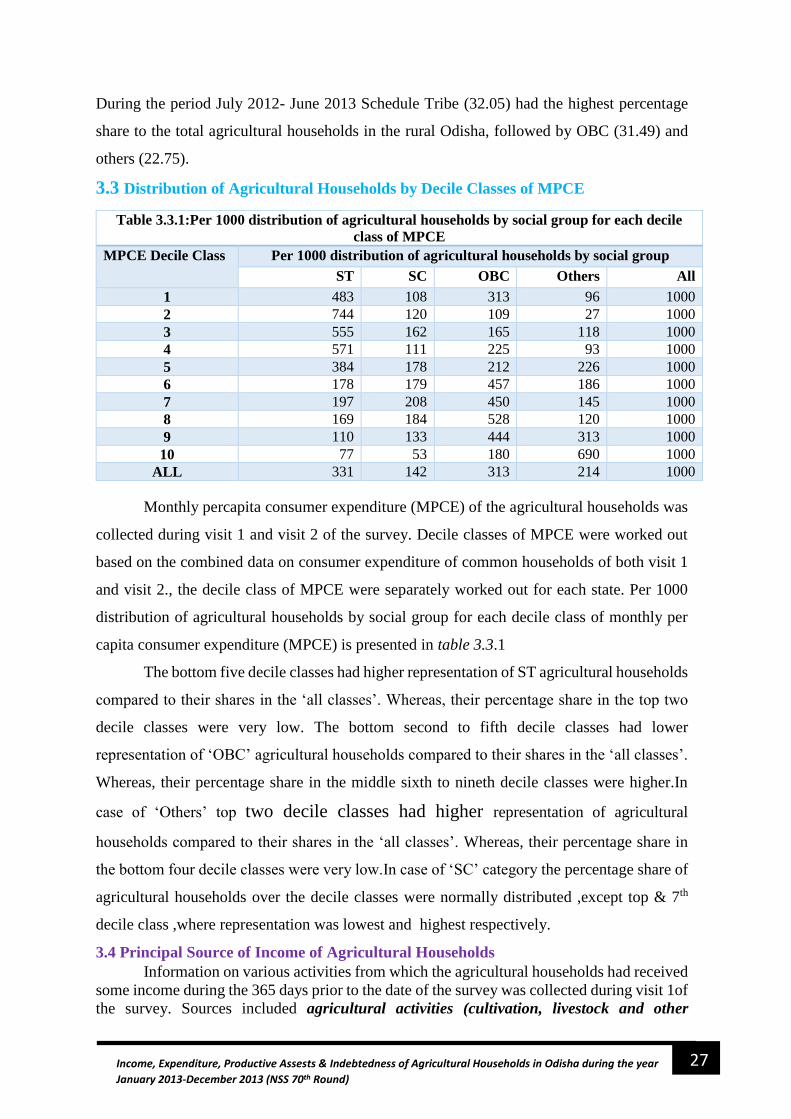
27 Income, Expenditure, Productive Assests & Indebtedness of Agricultural Households in Odisha during the year
January 2013-December 2013 (NSS 70th Round)
During the period July 2012- June 2013 Schedule Tribe (32.05) had the highest percentage
share to the total agricultural households in the rural Odisha, followed by OBC (31.49) and
others (22.75).
3.3 Distribution of Agricultural Households by Decile Classes of MPCE
Table 3.3.1:Per 1000 distribution of agricultural households by social group for each decile
class of MPCE
MPCE Decile Class Per 1000 distribution of agricultural households by social group
ST SC OBC Others All
1 483 108 313 96 1000
2 744 120 109 27 1000
3 555 162 165 118 1000
4 571 111 225 93 1000
5 384 178 212 226 1000
6 178 179 457 186 1000
7 197 208 450 145 1000
8 169 184 528 120 1000
9 110 133 444 313 1000
10 77 53 180 690 1000
ALL 331 142 313 214 1000
Monthly percapita consumer expenditure (MPCE) of the agricultural households was
collected during visit 1 and visit 2 of the survey. Decile classes of MPCE were worked out
based on the combined data on consumer expenditure of common households of both visit 1
and visit 2., the decile class of MPCE were separately worked out for each state. Per 1000
distribution of agricultural households by social group for each decile class of monthly per
capita consumer expenditure (MPCE) is presented in table 3.3.1
The bottom five decile classes had higher representation of ST agricultural households
compared to their shares in the ‘all classes’. Whereas, their percentage share in the top two
decile classes were very low. The bottom second to fifth decile classes had lower
representation of ‘OBC’ agricultural households compared to their shares in the ‘all classes’.
Whereas, their percentage share in the middle sixth to nineth decile classes were higher.In
case of ‘Others’ top two decile classes had higher representation of agricultural
households compared to their shares in the ‘all classes’. Whereas, their percentage share in
the bottom four decile classes were very low.In case of ‘SC’ category the percentage share of
agricultural households over the decile classes were normally distributed ,except top & 7th
decile class ,where representation was lowest and highest respectively.
3.4 Principal Source of Income of Agricultural Households Information on various activities from which the agricultural households had received
some income during the 365 days prior to the date of the survey was collected during visit 1of
the survey. Sources included agricultural activities (cultivation, livestock and other

28 Income, Expenditure, Productive Assests & Indebtedness of Agricultural Households in Odisha during the year
January 2013-December 2013 (NSS 70th Round)
agricultural activities), non-agricultural enterprises, wage/salaried employment, pension,
remittance and others. Number per 1000 of agricultural households engaged in various
activities during the 365 days prior to the date of survey for each decile classes of MPCE is
given in table 3.4.1 Table 3.4.1: Number per 1000 of agricultural households engaged in various activities during
the 365 days prior to the date of survey for each decile class of MPCE
MPCE
Decile
class
cultivation livestock other
agricultural
activity
non-
agricultural
enterprises
wage/
salaried
employment
others
1 2 3 4 5 6 7
1 908 369 21 176 207 150
2 979 446 64 30 498 126
3 980 361 184 88 549 155
4 962 514 114 58 494 152
5 977 312 46 174 586 165
6 946 308 57 150 499 113
7 990 328 132 244 411 141
8 967 358 78 198 352 49
9 981 397 117 249 192 179
10 956 494 15 142 171 167
ALL
classes
964 391 80 153 388 139
Among various sources from which the agricultural households received any income
during 365 days prior to the date of survey, the source which yielded maximum income was
taken as principal source of income. Per 1000 distribution of agricultural households by their
principal source of income during the 365 days prior to the date of survey for each decile class
of MPCE is given in table 3.4.2
Table: - 3.4.2 per 1000 distribution of agricultural households by principal source of
income during the 365 days prior to the date of survey for each decile class of MPCE
MPCE
Decile
class
cultivation Livestock other
agricultural
activity
non-
agricultural
enterprises
wage/
salaried
emplyoment
others All(inc.nr)
1 2 3 4 5 6 7 8 1 730 37 5 147 49 30 1000
2 896 20 6 26 35 14 1000
3 915 10 0 2 69 3 1000
4 859 16 0 25 93 7 1000
5 724 16 0 110 149 1 1000
6 742 8 0 61 168 17 1000
7 748 10 0 150 58 33 1000
8 711 19 17 147 103 4 1000
9 742 36 0 170 50 2 1000
10 696 2 0 58 133 110 1000 All
classes 770 17 3 92 93 23 1000

29 Income, Expenditure, Productive Assests & Indebtedness of Agricultural Households in Odisha during the year
January 2013-December 2013 (NSS 70th Round)
About 96 percent of the agricultural households were estimated to have performed
cultivation during the 365 days prior to the date of the survey and cultivation was the principal
source of income for about 77 percent of the agricultural households. Even though, livestock
activity was performed by nearly 39 percent of the agricultural households, only about 2
percent of the agricultural households reported this activity as their principal source of
income.Nearly 39 percent of the agricultural households were engaged in wage/salaried
employment, and it was the second highest reported principal source of income. Nearly 10
percent of the agricultural households reported wage/salaried employment as their principal
source of income.
3.5 Principal Source of Income of Agricultural Households for Social Group
Number per 1000 of agricultural households engaged in various activities during the
365 days prior to the date of survey for each social group is given in table 3.5.1 and principal
sources of income in table 3.5.2
Table3.5.1:Number per 1000 of agricultural households engaged in various activities during
the 365 days prior to the date of survey for each social group
Social
group cultivation livestock
other
agricultural
activity
non-
agricultural
enterprises
wage/
salaried
employment
others
1 2 3 4 5 6 7
ST 981 367 73 61 425 172
SC 933 382 57 228 429 110
OBC 952 404 113 247 348 120
Others 979 413 57 109 363 136
All 964 391 80 153 388 139
Majority of the households from all the social groups reported agricultural activities
like cultivation as major engagement and followed by, livestock activity & wage salaried
employment.In case of engagement on non-agricultural enterprises agricultural households
belongs to SC and OBC category shows higher percentage share than, social group all.

30 Income, Expenditure, Productive Assests & Indebtedness of Agricultural Households in Odisha during the year
January 2013-December 2013 (NSS 70th Round)
Table: - 3.5.2 Per 1000 distribution of agricultural households by principal source of income
during the 365 days prior to the date of survey.
Social
group cultivation
livestoc
k
other
agricultural
activity
non-
agricultural
enterprises
wage/
salaried
employment
others All(inc
.nr)
1 2 3 4 5 6 7 8
ST 879 8 3 36 52 22 1000
SC 651 36 7 124 146 33 1000
OBC 720 19 3 167 79 9 1000
Others 754 16 0 48 141 40 1000
All 770 17 3 92 93 23 1000
Cultivation shows major source of income for ST (88%) agricultural households
compared to all other social groups.In case of income from non-agricultural enterprises OBC
agricultural households leads with 17%, followed by SC (12%). The source of income from
this activity for ST (4%) & others (5%) agricultural households is below the social grop all
(9%).Similarly percentage share for wage salaried employment as source of income for SC
(15%) & others (14%) agricultural households was more than the all social groups (9 %).
3.6 Type of Land Possessed by Agricultural Households: Possession and operation of land
was not an essential condition for a household to be treated as an agricultural household for
the purpose of Situation Assessment Survey of 70th round 2013, unlike 59th round SAS 2003.
87.9
65.172 75.4 77
0.8
3.61.9
1.6 1.7
0.3
0.70.3
0 0.3
3.6
12.4
16.74.8
9.2
5.214.6
7.914.1
9.32.2 3.3 0.9 4 2.3
0
10
20
30
40
50
60
70
80
90
100
ST SC OBC Others All
% o
f A
gric
ult
ura
l Ho
use
ho
lds
Social Group
Figure 3. 5.1Percentage Distribution of Agricultural Households by Principal Source of Income for each Social Group
others
wage/ salariedemployment
non-agriculturalenterprises
other agri-cultural activity
livestock
cultivation

31 Income, Expenditure, Productive Assests & Indebtedness of Agricultural Households in Odisha during the year
January 2013-December 2013 (NSS 70th Round)
However, information on land possessed by the agricultural households as on date of survey
and operation of such land for agricultural activities any time during the 365 days prior to the
date of survey were collected from the selected households during visit 1 of the survey.Table
3.6.1 shows per 1000 distribution of agricultural households by type of land possessed for
each social group.It also gives i) number per 1000 agricultural households having MGNREG
job card & ii) number per 1000 agricultural households operated any land during 365 days
prior to the date of survey .
Table 3.6.1:per 1000 distribution of agricultural households
by type of land possesed
Number per 1000 households
having
Social
Group
homestead
only
homestead
and other
land
other
land
only
no land
operated any
land for
agriculturural
activities
during last 365
days
MGNREG
job card
1 2 3 4 5 6 7
ST 29 961 2 5 981 714
SC 88 908 2 2 933 752
OBC 37 944 7 11 952 444
Others 38 928 11 8 979 323
All 42 941 6 7 965 551
Percentage share of agricultural households possessing only homestead land among
Scheduled Caste (8.8 %) agriculture households were almost double than that in other social
groups.In case of not any type of land possessed by the agricultural households, 1.1 percent
of agricultural households belongs to ‘OBCs’ followed by 0.8 ‘Others’ and 0.5 ‘ST’ reported
at the time of survey.About 94 percent of agricultural households in Odisha, reported to have
possessed both homestead and other land at the time of the survey.
All most 98 percent of households from STs and Other category were estimated to
have operated some land during the 365 days prior to the date of the survey.In case of social
category SCs (93 %) and OBCs (95 %) the percent share was lower than that of social group
all(96 %).

32 Income, Expenditure, Productive Assests & Indebtedness of Agricultural Households in Odisha during the year
January 2013-December 2013 (NSS 70th Round)
Possession of MGNREGS job card was maximum among SCs (75.2 percent) and
followed by STs (71.4 percent) & OBCs (44.4 percent) and minimum in case of other category
(32.3 percent). Share of agricultural households possessing MGNREGS job cards were
comparatively higher in the bottom decile classes.
Table: - 3.6.2Per 1000 distribution of agricultural households by type of land possessed and
number per 1000 of agricultural households operated any land for agricultural activities for
each decile class of
Decile
Class
Agricultural households by type of land possesed Number per 1000 households
having
homestead
only
homestead
and other
land
other
land
only
no land
operated land for
agriculturural
activities during
last 365 days
MGNREG
job card
1 2 3 4 5 6 7
1 93 873 32 1 909 657
2 26 974 0 0 979 787
3 67 930 0 2 980 646
4 42 945 7 6 962 744
5 59 940 1 0 977 728
6 31 911 28 30 946 567
7 70 928 0 3 990 489
8 21 964 0 15 967 515
9 25 968 2 5 981 397
10 16 963 15 5 956 109
All
Classes 42 941 6 7 965 551
98.1 93.3 95.2 97.9
71.475.2
44.4
32.3
0
10
20
30
40
50
60
70
80
90
100
ST SC OBC Others
% o
f A
gri
cult
ura
l H
ou
seh
old
s
Social Group
Figure 3. 6.1Percentage of Agricultural Households operated land for
Agricultural Activities/Possessing MGNREG Job Card for each Social Group
operated any
land for
agriculturural
activities during
last 365 days
MGNREG job
card

33 Income, Expenditure, Productive Assests & Indebtedness of Agricultural Households in Odisha during the year
January 2013-December 2013 (NSS 70th Round)
Decile class wise distribution of agricultural households presented in table 3.6.2, it shows that
bottom decile class has comparetively higher percent share, in possission of homestead land only than
the top decile class.In case of possion of homestead and other land by agricultural households, top
decile class has comparetively higher percent share than that of bottom decile class. At all Odisha 96.5
percent households operated any land for agricultural activities during the last 365 days .In case of 7th
decile class the percent share was maximum (99) which was more than state percent.
Possession of MGNREGS job card was higher upto 5th decile class and gradually decreses
from 6th to 10th decile class except 8th decile class.At all Odisha the possission of Job card
(MGNREGS) was 55.1 percentage. Percent share of Possession of MGNREGS job card was maximum
for 2nd decile class (78.7) and minimum for 10th decile class (10.9).
Table: - 3.6.3 Per 1000 distribution of agricultural households by type of land possessed and number
per 1000 of agricultural households operated any land for agricultural activities for each principal
source of household income
Principal
Source of
Income
Agricultural households by type of land possesed Number per 1000 households
having
homestead
only
homestead and
other land
other
land
only
no land
operated land
for
agriculturural
activities during
last 365 days
MGNREG
job card
1 2 3 4 5 6 7 Cultivation 8 982 5 0 1000 562
Livestock 496 397 61 43 513 593
other
agricultural
activity
326 674 0 0 674 508
non-agricultural
enterprises 127 842 0 31 924 521
wage/salaried
employment 92 868 10 28 861 558
Pension 16 984 0 0 1000 39
Remittances 326 393 0 282 393 354
Others 702 298 0 0 298 815
All (inc nr) 42 941 6 7 965 551
Per 1000 distribution of agricultural households by type of land possessed for each principal
source of income is given in table 3.6.3 The share of households having only ‘homestead land’ was
highest among the households which have reported livestock activity as their principal source of
income. 48.6 percent of agricultural households in this group had only homestead land at the time of
the survey which is more than ten times the average (4.2percent) of all types of principal sources of
income taken together. As available from the same table, the percentage of the households which
reported to have operated some land for agricultural activities during last 365 days was lowest (29.8
percent) among the households with ‘others’ as their principal source of income. The estimated share
of households reported possession of MGNREGS job card was highest (81.5 percent) among the

34 Income, Expenditure, Productive Assests & Indebtedness of Agricultural Households in Odisha during the year
January 2013-December 2013 (NSS 70th Round)
households with ‘Others’ as their principal source of income, followed by households with ‘Livestock’
as principal source of income (59.3 percent).
3.7 Land Possession Outside Village
Information on land possessed by the agricultural households outside the village they were
residing was collected in the survey. If the surveyed household possessed any such land, its location
(within State/outside State/within and outside State) was reported. Table 3.7.1 represent per 1000
distribution of agricultural households by land possession outside the village for each social group.
Table: - 3.7.1 Per 1000 distribution of agricultural households by land possession outside
the village for each social group
Social group land out side village no land out
side village
all( inc.nr)
within state out side state both within
and outside
village
1 2 3 4 5 6
ST 125 104 1 770 1000
SC 66 90 0 844 1000
OBC 218 88 0 687 1000
Others 80 23 0 894 1000
All 136 80 0 781 1000
It shows that at all Odisha level 78 percent agricultural households reported during the survey,
which possessed no land out side the village.Among social groups 30.6 percent agricultural households
belongs to ‘OBC’ category possessed land out side village, followed by 23.0 ‘ST’ and 15.6 “SC”
category respectively.Land possessed outside village and within state social category ‘OBC’ (21.8 %)
was highest among all social group, followed by “ST” (12.5 %) and “Others” (8.0 %).In case of
agricultural households possessed land out side village and out side state, 10.4 percent of household
belongs to Social category schedule Tribe reported at the time of survey ,was highest among all type
of social group. Agricultural households belongs to others (2.3 %) reported to have possessed land
out side village and out side state was lowest among all social group.
23
15.6
30.6
10.3
21.6
0
5
10
15
20
25
30
35
ST SC OBC Others All
% o
f a
gri
cult
ura
l h
ou
seh
old
s
Social Group
Figure 3. 7.1 Percentage distribution of agricultural households possessing land
outside village

35 Income, Expenditure, Productive Assests & Indebtedness of Agricultural Households in Odisha during the year
January 2013-December 2013 (NSS 70th Round)
3.8 Type of Ration Card
Information on type of ration card possessed by the agricultural households (such as
Antyodaya, BPL and Others) at the time of the survey was collected during visit 1. The information
collected at the time of the survey did not differentiate between different types of cards on the basis
of PDS facilities attached to such cards. The survey Schedule did not have provision to report the cases
of possessing multiple cards by the same household. Whenever multiple cards were possessed by the
same household, only one type was reported.
Table: - 3.8.1Per 1000 distribution of agricultural households by type of ration card
possessed for each Social Group
Social Group Antyo-daya BPL others no ration card
1 2 3 4 5
ST 49 692 155 104
SC 28 601 172 199
OBC 27 441 352 179
Others 30 305 502 162
All 35 518 293 154
Percentage of agricultural household possessing Antyodaya or BPL card was higher among
STs compared to other social groups.SCs (19.9 %) had the highest share of the agricultural households
having no ration card, followed by the OBC (17.9 %) and others (16.2%).It is depicted In figure 3.8.1,
that agricultural households belongs to others social group (50.2 %) had highest percent share of
possession of ration card type others, followed by OBC (35.2 %) and SC (17.2%).
4.9 2.8 2.7 3 3.5
69.260.1
44.130.5
51.8
15.5
17.235.2
50.2
29.3
10.419.9 17.9 16.2 15.4
0
10
20
30
40
50
60
70
80
90
100
ST SC OBC Others All
FIGURE 3.8.1 Percentage distribution of agricultural households by
type of ration card for each social group
no rationcardothers
BPL
Antyo-daya

36 Income, Expenditure, Productive Assests & Indebtedness of Agricultural Households in Odisha during the year
January 2013-December 2013 (NSS 70th Round)
Table: - 3.8.2Per 1000 distribution of agricultural households by type of ration card
possessed for each principal source of income
Principal Source of
Income
type of ration card possessed
Antyo-daya BPL other card No ration
1 2 3 4 5
Cultivation 34 522 304 140
Livestock 67 566 41 326
other agricultural
activity
166 354 0 480
non-agricultural
enterprises
29 570 363 38
wage/salaried
employment
21 477 210 292
Pension 0 281 302 417
Remittances 274 674 52 0
Others 331 217 96 356
All (inc nr) 35 518 293 154
The percentage share of agricultural households having Antyodaya ration card was highest
among those households whose principal source of income as others reported at the time of survey,
followed by remittance (27.4%) and other agricultural activities (16.6 %).The agricultural households
whose principal source of income as remittance (67.4%) reported to be the highest In possession of
BPL ration cards among others.The highest percent share of agricultural households having no ration
card (48 %) reported to be those whose principal source of income was other agricultural
activities,followed by pension (42%) and livestock (33%).
3.9 Demographic Characteristics of Agricultural Households
In addition to the common demographic particulars like relation to head, sex, age, general
education, etc., information on formal training in agriculture, principal and subsidiary activity status,
staying away from home in search of employment, wages and salaries earned during the reference
period were also collected in the survey. Though the designated block was canvassed during both the
visits, only some selected information like principal and subsidiary activity status, staying away from
home in search of employment, wages and salaries earned during the reference period were collected
during visit-2. No addition or deletion of household members listed during the visit-1 was allowed
during visit-2.
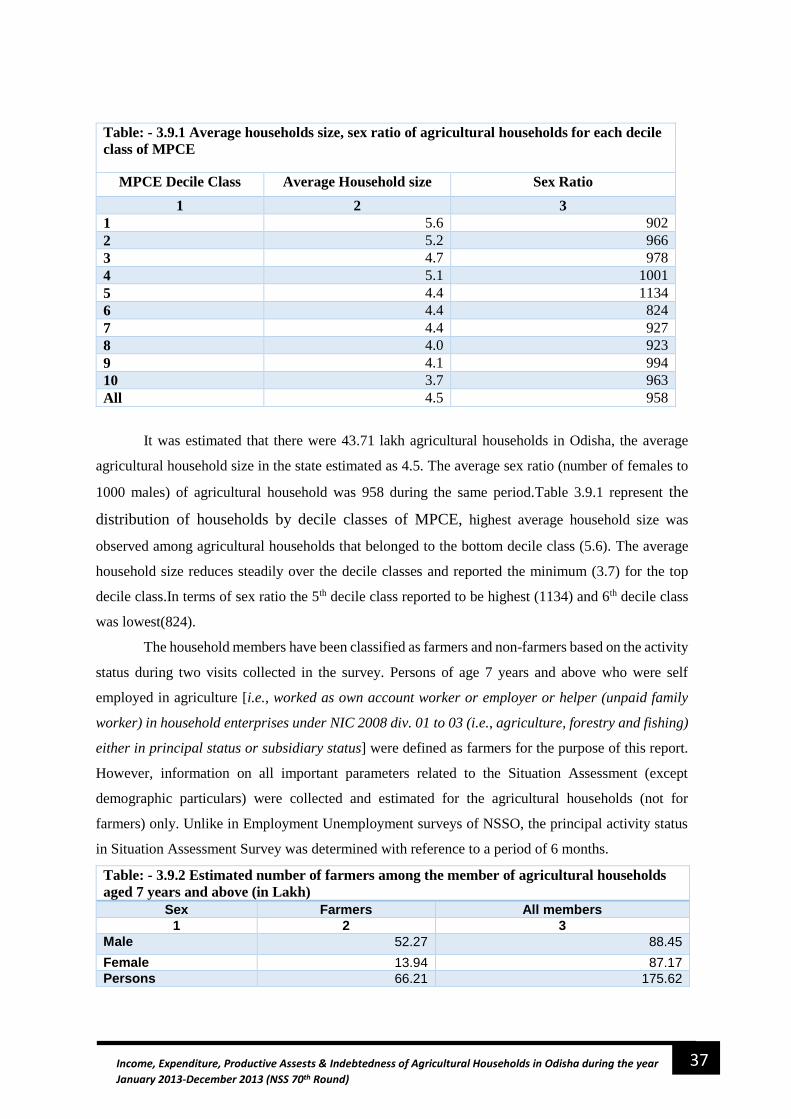
37 Income, Expenditure, Productive Assests & Indebtedness of Agricultural Households in Odisha during the year
January 2013-December 2013 (NSS 70th Round)
Table: - 3.9.1 Average households size, sex ratio of agricultural households for each decile
class of MPCE
MPCE Decile Class Average Household size Sex Ratio
1 2 3
1 5.6 902
2 5.2 966
3 4.7 978
4 5.1 1001
5 4.4 1134
6 4.4 824
7 4.4 927
8 4.0 923
9 4.1 994
10 3.7 963
All 4.5 958
It was estimated that there were 43.71 lakh agricultural households in Odisha, the average
agricultural household size in the state estimated as 4.5. The average sex ratio (number of females to
1000 males) of agricultural household was 958 during the same period.Table 3.9.1 represent the
distribution of households by decile classes of MPCE, highest average household size was
observed among agricultural households that belonged to the bottom decile class (5.6). The average
household size reduces steadily over the decile classes and reported the minimum (3.7) for the top
decile class.In terms of sex ratio the 5th decile class reported to be highest (1134) and 6th decile class
was lowest(824).
The household members have been classified as farmers and non-farmers based on the activity
status during two visits collected in the survey. Persons of age 7 years and above who were self
employed in agriculture [i.e., worked as own account worker or employer or helper (unpaid family
worker) in household enterprises under NIC 2008 div. 01 to 03 (i.e., agriculture, forestry and fishing)
either in principal status or subsidiary status] were defined as farmers for the purpose of this report.
However, information on all important parameters related to the Situation Assessment (except
demographic particulars) were collected and estimated for the agricultural households (not for
farmers) only. Unlike in Employment Unemployment surveys of NSSO, the principal activity status
in Situation Assessment Survey was determined with reference to a period of 6 months.
Table: - 3.9.2 Estimated number of farmers among the member of agricultural households
aged 7 years and above (in Lakh)
Sex Farmers All members
1 2 3
Male 52.27 88.45
Female 13.94 87.17
Persons 66.21 175.62

38 Income, Expenditure, Productive Assests & Indebtedness of Agricultural Households in Odisha during the year
January 2013-December 2013 (NSS 70th Round)
As per this definition of farmers, about 38 percent of the estimated 175.62 lakh persons of
aged 7 years and above were found to be farmers. The share of farmers among male members (of age
7 years and above) of the agricultural household was 59 percent against 16 percent among the female
members.
3.10 Educational Characteristics of Agricultural Households
The level of general education of each of the members of the agricultural household aged 7
years or more was collected during the visit 1 of the survey. As per the results of the survey, an
estimated 25.2 percent of persons aged 7 years and above of agricultural households in the state were
found to be illiterate at the time of the survey. The share of illiterates among the male members of the
agricultural households was estimated as 16.8 percent whereas, the share of illiterates was 33.8 percent
among female members. Per 1000 distribution of members of agricultural households (farmers/all
members) by level of general education is given in table 3.10.1
Table: - 3.10.1 Per 1000 distribution of members of agricultural households (farmers/all
members) by level of general education
Level of
Education
Male Female Persons
Farmers All
Members
Farmers All
Members
Farmers All
Members
1 2 3 4 5 6 7
not literate 226 168 700 338 328 252
literate
without
formal
Schooling
14 9 8 9 13 9
literate but
below primary
181 205 123 208 168 207
primary 129 153 46 111 111 132
middle 271 241 110 207 237 224
secondary 101 113 5 66 81 90
higher
secondary
37 54 7 47 31 50
diploma
ertificate
course
5 7 0 1 4 4
graduate 34 48 0 13 27 31
post graduate
and above
1 1 0 0 1 1
all (inc nr) 1000 1000 1000 1000 1000 1000
The percentage of persons with educational level below primary and primary are slightly
higher in case of all members of agricultural households taken together than their farmer members,
which probably indicates that some members of the agricultural households having below primary and
primary level education (pursuing studies) did not participate in farming activities as identified by
their status code at the time of survey. Level of Education of members of agricultural households of
age 7 years and above for farmers and all members. Share of male members with different educational

39 Income, Expenditure, Productive Assests & Indebtedness of Agricultural Households in Odisha during the year
January 2013-December 2013 (NSS 70th Round)
levels were consistently higher than the corresponding share of female members of the agricultural
households.
Figure 3. 10.1 Percentage distribution of members of agricultural households (farmers/all
members) by level of general education.
3.11 Principal Activity Status
The usual principal activity of the members aged 7 years or more of agricultural households
were determined with reference to the fixed period of July 2012- December 2012 in visit I and with
reference to January 2013- June 2013 in visit II. The activity status on which a person spent relatively
longer time (major time criterion) during the fixed period July to December 2012/ January to June
25.2
0.9
20.7
13.2
22.4
9.0
5.0 0.4 3.10.1
All Members
32.8
1.316.811.1
23.7
8.1
3.1
0.42.7 0.1
Farmers
16.80.9
20.5
15.3
24.1
11.3
5.4
0.7
4.8
0.1
Male
33.8
0.920.8
11.1
20.7
6.64.7
0.11.3
0.0
Female

40 Income, Expenditure, Productive Assests & Indebtedness of Agricultural Households in Odisha during the year
January 2013-December 2013 (NSS 70th Round)
2013, was considered as the usual principal activity status of the person. Per 1000 distribution of
persons aged 7 years and above of agricultural households by principal activity status for the period
July 2012- December 2012 and January 2013 – June 2013 is given in table 3.11.1 and figure 3.11.1
Table: - 3.11.1 Per 1000 distribution of persons aged 7 years and above of agricultural
households by principal activity status for the period July 2012- December 2012 and January
2013 – June 2013
Sex
Self employed Regular
employment Casual wage labourer in
Others All
Agriculture
Non-agricul
ture
Agriculture
Non-agricult
ure
Public work Others
MGNREGS
Other
Agriculture
Non-agricul
ture
1 2 3 4 5 6 7 8 9 10 11
July 2012- December 2012
Male 515 95 0 32 2 4 28 21 303 1000
Female 147 15 0 7 1 1 6 1 823 1000
Person 332 55 0 19 1 3 17 11 561 1000
January 2013- June 2013
Male 357 109 0 38 3 20 50 90 333 1000
Female 98 17 0 8 0 4 9 11 853 1000
Person 229 63 0 23 2 12 30 51 591 1000
During the period July 2012- December 2012, 33.2 percent of the members of
agricultural households in the state were self-employed (own account worker, employer or unpaid
family worker) in agriculture as per the usual activity status.During the same period 51.5 percent male
members of the agricultural households were self employed in agriculture,wheres for female share
was 14.7 percent.
As per the usual activity status, during the period January 2013 – June 2013, 22.9
percent of the members of agricultural households were estimated to be self-employed in
agriculture.For the same period percent share of the male members of the agricultural households was
35.7 percent & for female was 9.8 percent were estimated to be self-employed in agriculture.
At state level 56.1 percent of the members of the agricultural households were estimated
to be either unemployed or out of labour force during the July to December 2012. The share was 59.1
percent during January to June 2013. Estimated share of unemployed/ out of labour force during July
to December 2012 was 34.7 percent among male members and 66 percent for female members of
agricultural households. During the period January to June 2013, the corresponding shares were 35.3
percent and 67.4 percent for male and female members, respectively.

41 Income, Expenditure, Productive Assests & Indebtedness of Agricultural Households in Odisha during the year
January 2013-December 2013 (NSS 70th Round)
3.12 Staying Away from the Usual Place of Residence (UPR) for Employment
Information on staying away from the usual place of residence for more than 15 days for the
purpose of employment in respect of persons aged 7 years and above, was collected for the two halves
of the agricultural year (seasons) i.e July-December2012 & January- June2013.
The table 3.12.1 and figure 3.12.1 contains decile class & sex wise per 1000 of persons aged
7 years and above stayed away from home more than15 days for the purpose of employment.
30.3
82.3
56.1
33.3
85.3
59.15.5
0.9
3.2
16.3
2.4
9.5
3.2
0.7
1.9
3.8
0.8
2.351.5
14.7
33.235.7
9.8
22.9
9.51.5 5.5 10.9
1.7 6.3
0%
10%
20%
30%
40%
50%
60%
70%
80%
90%
100%
male Female Person male Female Person
July 2012- December 2012 January 2013- June 2013
Figure 3. 11.1 Percentage distribution of persons aged 7 years and above by
principal activity status
unemployed/ out of labour force casual labour regular salary/ wage
self-employed agriculture self-employed non- agriculture
31
8
13
6
32
24
11
13
0 0
44
5
0
16
0 1 0
34
0
5
10
15
20
25
30
35
40
45
1 2 3 4 5 6 7 8 9 10
per
cen
t d
istr
ibu
tion
of
per
son
s
sta
yed
aw
ay
MPCE decile class
Figure 3. 12.1 Sex wise percent distribution of persons age 7 Years
andabove stayed away for more than 15 days for the purpose of
Employment in each decile class of MPC July2012-June2013
male Female
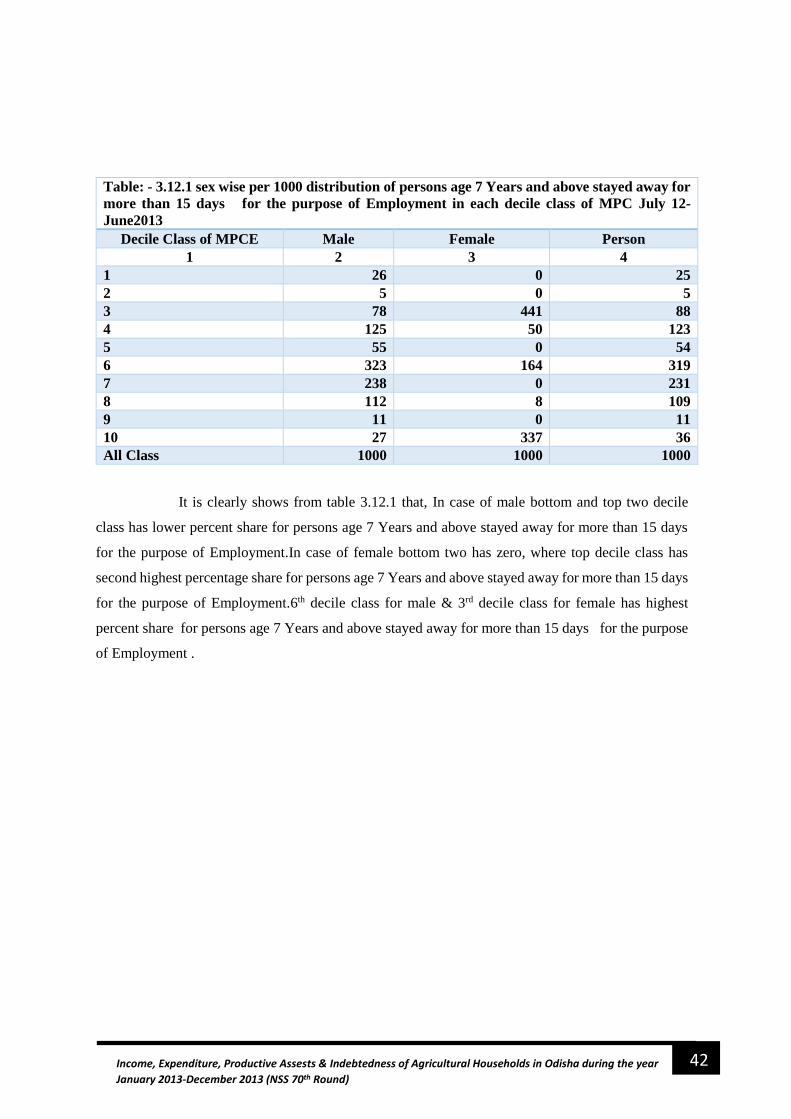
42 Income, Expenditure, Productive Assests & Indebtedness of Agricultural Households in Odisha during the year
January 2013-December 2013 (NSS 70th Round)
Table: - 3.12.1 sex wise per 1000 distribution of persons age 7 Years and above stayed away for
more than 15 days for the purpose of Employment in each decile class of MPC July 12-
June2013
Decile Class of MPCE Male Female Person
1 2 3 4
1 26 0 25
2 5 0 5
3 78 441 88
4 125 50 123
5 55 0 54
6 323 164 319
7 238 0 231
8 112 8 109
9 11 0 11
10 27 337 36
All Class 1000 1000 1000
It is clearly shows from table 3.12.1 that, In case of male bottom and top two decile
class has lower percent share for persons age 7 Years and above stayed away for more than 15 days
for the purpose of Employment.In case of female bottom two has zero, where top decile class has
second highest percentage share for persons age 7 Years and above stayed away for more than 15 days
for the purpose of Employment.6th decile class for male & 3rd decile class for female has highest
percent share for persons age 7 Years and above stayed away for more than 15 days for the purpose
of Employment .

43 Income, Expenditure, Productive Assests & Indebtedness of Agricultural Households in Odisha during the year
January 2013-December 2013 (NSS 70th Round)
Chapter4
Summary of Findings
Average Monthly Income
per Agricultural
Households
AverageMonthlyExpenditu
re per Agricultural
Households
Decile Class wise Average
Income & Expenditure of
Agricultural Households
Inequality of Income
Productive Assets Owned by
the Agricultural Households
Expenses and Receipts for
Crop Production
Expenses and Receipts for
Farming of Animals
Receipt from Household
Non-Farm Business

44 Income, Expenditure, Productive Assests & Indebtedness of Agricultural Households in Odisha during the year
January 2013-December 2013 (NSS 70th Round)
Chapter Four
Income, Expenditure, Productive Assets of Agricultural Households
This chapter presents estimates related to the economic characteristics of the agricultural
households such as their receipts from and expenditure incurred in farm and nonfarm business. It also
provides estimates of their indebtedness, consumption expenditure, productive assets and income
generated from all economic activities including farm and nonfarm business and wage/salary
employment.
The information pertaining to the parameters like income from different sources,
expenditure incurred for farm and non-farm business, net investment in productive assets, which are
discussed in this chapter (except indebtedness) had been collected separately for the two halves of the
agricultural year July 2012 - June 2013. Even though in the detailed tables (Appendix) these estimates
are presented for both the halves of the agricultural year and also for the combined period, the
discussions in this chapter are restricted to estimates for the combined period (i.e., the whole
agricultural year July 2012 - June 2013). The estimates of indebtedness of the agricultural households
are presented ‘as on date of survey’ as the information is available for the loan outstanding as on the
date on which the household was surveyed.
Some key results based on State, Central and Combined sample of agricultural
households in Odisha for agricultural year July2012 to June 2013.
Sample
Average Monthly Income per
agricultural household from
different source (₹)
Average monthly Consumption
Expenditure per agricultural
household (₹)
1 2 3
State 5109 4722
Central 4976 4307
Combined 5039 4512
4.1 Average Monthly Income and Consumption Expenditure per Agricultural
Households
The survey collected information on the receipts and expenditure relating to cultivation,
farming of animals and non-farm business, separately for the two halves of the agricultural year July
2012 - June 2013. Income from wage/salary employment was also recorded for the same period. Based
on this information, average monthly income per agricultural household has been worked out for the
agricultural year July 2012 - June 2013 by adding up income from wages/salary, net receipt from
cultivation, farming of animals and non-farm business. Net receipt was worked out by deducting total
expenses from total receipts for each source of income. Expenses included only the actual expenses

45 Income, Expenditure, Productive Assests & Indebtedness of Agricultural Households in Odisha during the year
January 2013-December 2013 (NSS 70th Round)
incurred (out of the pocket expenses) for farm and non-farm business. Imputed expenses in respect of
inputs out of home stock or out of free collection as well as receipt in exchange or borrowed were not
considered for reporting expenses for the purpose of the survey. Income of the agricultural households
from various other non-economic activities such as pension, remittances, etc. were not collected in
the survey and not included in the average monthly income presented here.
For working out the combined aggregates only the common households of visit-1and
visit-2 were considered. In respect of figures collected for the reference period six months (e.g. Income
from crop production, wage/ salary income), the combined aggregate was calculated as a simple
average of visit-1 and visit-2 figures. Wherever information was collected for the reference period of
last 30 days (e.g. income from livestock, non-farm business) combined aggregate was calculated as a
weighted mean of estimates for common households of visit-1 and visit-2 where the weights are 7 and
5 respectively as the survey period of visit-1 and visit-2 were 7 and 5 months, respectively.
The average monthly income from different sources and average monthly consumer
expenditure per agricultural household for the agricultural year July 2012 – June 2013 for each decile
class of MPCE are given in table 4.1.1
During the agricultural year July 2012 - June 2013 the average monthly income per
agricultural household was estimated as ₹ 5109. About 63 percent of the average monthly income per
agricultural household was estimated to have generated from farm business (cultivation and farming
of animals).The percent share of non-farm business was 18% during the same period, similarly about
19 percent of the average monthly income per agricultural household was contributed by income from
wage/salary employment.
income from wages (₹)
19%
net receipt from cultivation
62%
net receipt from farming of
animals
net receipt from nonfarm
business
Figure 4. 1.1 Percentage distribution of average monthly income per
agricultural househod by sources

46 Income, Expenditure, Productive Assests & Indebtedness of Agricultural Households in Odisha during the year
January 2013-December 2013 (NSS 70th Round)
The average monthly income from different sources and average monthly consumption
expenditure per agricultural household for the agricultural year July 2012 – June 2013 for each decile
class of MPCE are given in table 4.1.1
Table: 4.1.1 average monthly income from different sources and average monthly consumption
expenditure per agricultural household for the agricultural year July 2012 – June 2013 for each
decile class of MPCE
Decile class of MPCE
Income from wages/salary
(₹)
net receipt from agricultural activity
Netreceipt from non-
farm business
total income
Average monthly income (₹)
Total consumption expenditure
cultivation Farming of animals
1 2 3 4 5 6 7 8
1 13.53 73.38 3.14 9.95 100 4415 2210
2 17.03 81.29 1.65 0.04 100 3880 2636
3 35.66 65.62 -3.31 2.03 100 3338 2893
4 36.95 53.2 3.31 6.54 100 2737 3418
5 18.14 64.25 0.62 16.99 100 5035 3546
6 39.12 53.35 0.21 7.31 100 2862 4066
7 16.61 74.89 -1.71 10.2 100 5826 4770
8 33.68 50.53 1.17 14.62 100 5035 4981
9 6.25 61.71 1.09 30.95 100 12004 6596
10 15.2 49.66 3.75 31.39 100 5037 9699
All Classes
19.24 62.1 1.02 17.65 100 5109 4722
D1 D2 D3D4 D5D6 D7D8 D9D10,
Figure 4.1. 2 Distribution of Average Monthly Income per Agricultural Household by
their Sources for each Decile Class of MPCE during July 2012- June 2013
net receipt fromcultivation
net receipt fromnonfarmbusiness
net receipt fromfarming ofanimals
income from wages (₹)

47 Income, Expenditure, Productive Assests & Indebtedness of Agricultural Households in Odisha during the year
January 2013-December 2013 (NSS 70th Round)
Inequality in Income
Figure 4.1. 4
The decile class wise income and expenditure inequality represented in figure 4.1.4 it is
depicted that more inequality in income observed among middle decile class, as the Lorenz curv
becomes flatty in middle. The Gini coefficient is also related to the Lorenz curve in a diagrammatical
way. The Gini is actually equivalent to the area between the 45 degree line and the Lorenz curve
divided by the entire area beneath the 45 degree line. Hence, the higher the Gini the more ‘bowed’
the Lorenz curve and the higher the degree of income inequality.
4.2 Productive Assets Owned by the Agricultural Households
-505101520253035404550556065707580859095100
-505
101520253035404550556065707580859095
100
D1 D2 D3 D4 D5 D6 D7 D8 D9 D10
Figure 4. 1.3 Percentage distribution of average monthly income per agricultural
household during July 2012- June 2013 for each decile class of MPCE by their sources
income from wages (₹)
net receipt fromnonfarm business
net receipt fromfarming of animals
net receipt fromcultivation
Net receipt fromAgriculturalactivities
0
10
20
30
40
50
60
70
80
90
100
0 10 20 30 40 50 60 70 80 90 100
Line_Equ Income Expenditure

48 Income, Expenditure, Productive Assests & Indebtedness of Agricultural Households in Odisha during the year
January 2013-December 2013 (NSS 70th Round)
The focus of the survey being the agricultural households, the expenditure made on productive
assets is an important aspect while estimating the parameters related to their economic characteristics.
These are the assets used repeatedly for the production process by the agricultural households both in
farm business and non-farm business. Assets considered for farm business included various
agricultural machinery and implements, livestock among others. The immovable assets like land and
building were separately accounted for farm business and non-farm business.
The survey collected information on the expenditure incurred (both by way of purchase and
major repair/improvement) on various productive assets used for crop production, livestock activity
and also for the household non-farm business during both halves of agricultural year July 2012 - June
2013. Corresponding to each such asset, any receipt earned by the household by way of sale was also
reported so as to work out the ‘net investment’ in productive assets. The survey also collected similar
information related to residential building including land.
4.3 Average Monthly Expenditure per Agricultural Household on
Productive Assets Used for Farm and Non-farm Business
Average monthly expenditure (₹ ) incurred on productive assets used for farm and non-farm
business per agricultural household by decile class of MPCE during the agricultural year July 2012 -
June 2013 presented in table-4.3.1. In rural Odisha as a whole, average monthly expenditure incurred
per agricultural household on productive assets used for farm and nonfarm business (i.e., excluding
expenses on ‘residential building including land’) during the agricultural year July 2012 - June 2013
was estimated as ₹ 308.Nearly 89 percent of the average expenditure on productive assests was spent
on productive assests used
in farm business (agricultural machinery and implements (72 percent), livestock and poultry
(14 percent) and other assets in farm business (3 percent)).In case of average expenditure on productive
assests used in non-farm business shows a wide variation across the decile class of MPCE, bottom 40
14
72
311
Figure 4.3.1 Percentage Distribution of Monthly Expenditure on Productive
Assets by Type of Assets
Livestock and poultry
Agricultural machinery and
implementst
Other productive assets*
Non-farm business
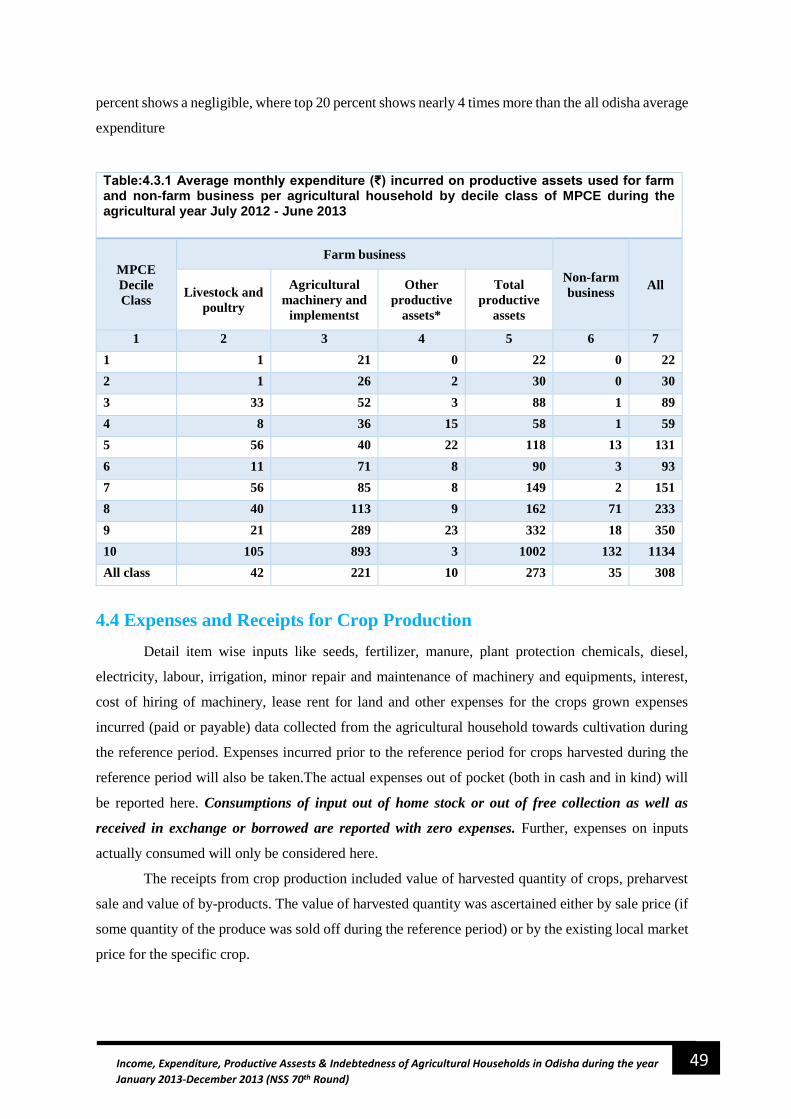
49 Income, Expenditure, Productive Assests & Indebtedness of Agricultural Households in Odisha during the year
January 2013-December 2013 (NSS 70th Round)
percent shows a negligible, where top 20 percent shows nearly 4 times more than the all odisha average
expenditure
Table:4.3.1 Average monthly expenditure (₹) incurred on productive assets used for farm and non-farm business per agricultural household by decile class of MPCE during the agricultural year July 2012 - June 2013
MPCE
Decile
Class
Farm business
Non-farm
business All
Livestock and
poultry
Agricultural
machinery and
implementst
Other
productive
assets*
Total
productive
assets
1 2 3 4 5 6 7
1 1 21 0 22 0 22
2 1 26 2 30 0 30
3 33 52 3 88 1 89
4 8 36 15 58 1 59
5 56 40 22 118 13 131
6 11 71 8 90 3 93
7 56 85 8 149 2 151
8 40 113 9 162 71 233
9 21 289 23 332 18 350
10 105 893 3 1002 132 1134
All class 42 221 10 273 35 308
4.4 Expenses and Receipts for Crop Production
Detail item wise inputs like seeds, fertilizer, manure, plant protection chemicals, diesel,
electricity, labour, irrigation, minor repair and maintenance of machinery and equipments, interest,
cost of hiring of machinery, lease rent for land and other expenses for the crops grown expenses
incurred (paid or payable) data collected from the agricultural household towards cultivation during
the reference period. Expenses incurred prior to the reference period for crops harvested during the
reference period will also be taken.The actual expenses out of pocket (both in cash and in kind) will
be reported here. Consumptions of input out of home stock or out of free collection as well as
received in exchange or borrowed are reported with zero expenses. Further, expenses on inputs
actually consumed will only be considered here.
The receipts from crop production included value of harvested quantity of crops, preharvest
sale and value of by-products. The value of harvested quantity was ascertained either by sale price (if
some quantity of the produce was sold off during the reference period) or by the existing local market
price for the specific crop.

50 Income, Expenditure, Productive Assests & Indebtedness of Agricultural Households in Odisha during the year
January 2013-December 2013 (NSS 70th Round)
Table: 4.4.1 Average monthly expenses and receipts for crop production per cultivating
agricultural household during the agricultural year July2012-June2013.
land
possess
ed (All
Class)
see
ds
Fer
tiliz
er/
ma
nur
e
plant
protec
tion
chemi
cals
irri
gati
on
minor
repair and
maintenan
ce of
machinery
and
equipment
inte
rest
leas
e
rent
for
lan
d
labour
all
other
expen
ses
total
expen
ses
Avera ge
receipt
human ani
mal
1 2 3 4 5 6 7 8 9 10 11 12 13
Visit-I 78 474 78 16 16 3 39 532 57 283 1575 5839
Visit-II 91 363 117 15 38 1 3 417 32 336 1412 6031
Visit
combi
ned
63 326 69 12 18 1 19 369 36 228 1142 4454
At all Odisha rural level it is estimated that, average monthly expenditure on crop production
per cultivating agricultural household was ₹ 1142. Of which 32.3 percent on “human labourer”,
followed by 28.5 percent on “fertilizer/manure” and 20.0 percent on “other “expenses were spent
during the agriculture year july2012-june 2013.The average monthly expenditure on crop production
during the 1st halves of the agriculture year july-December2012was estimated as ₹ 1575,wheres it
was ₹ 1412 for 2nd halves of the agriculture year january-June2013.
During the agricultural year July 2012 - June 2013, the average monthly receipts from crop
production for the cultivating agricultural households was estimated as ₹ 4454. It included value of
harvested products, by-products and value of pre-harvest sale.Further it was estimated as ₹ 5839 and
₹ 6031 for 1st & 2nd halves of the agriculture year respectively.
4.5 Expenses and Receipts for Farming of Animals
Information on item-wise disposition of produce, value of outputs for farming of animals
during 30 days prior to the date of survey was collected from the surveyed agricultural households
during both the visits of the survey. Information on the item wise expenditure incurred during the same
period was also collected for inputs used in farming of animals. Based on the common households
surveyed during both the visits, average monthly expenditure for and receipts from farming of animals
for the agricultural year July 2012 - June 2013 were estimated.

51 Income, Expenditure, Productive Assests & Indebtedness of Agricultural Households in Odisha during the year
January 2013-December 2013 (NSS 70th Round)
Table: - 4.5.1 Percentage distribution of average monthly expenditure for farming of animals
per agricultural household engaged in farming of animals by type of input during July 2012 -
June 2013
All size & class of land holding
cost of animal `seeds'
animal feed
veterinary charges
labour charges
all other expenses
total expenses
Average Monthly Expenses
( ₹ )
(1) (2) (3) (4) (5) (6) (7) (8)
Visit -I (July-December2012)
14.2 73.2 4.2 0.9 7.5 100 1797
Visit-II (January -June 2013)
0.7 94.2 2.8 0.3 2.1 100 1357
Visit_Combined (July 2012-June2013)
9.4 80.6 3.7 0.7 5.6 100 1270
In rural Odisha during the agricultural year July 2012 - June 2013, the average monthly
expenses on farming of animals per agricultural household engaged in farming of animals was
estimated as ₹ 1270.More than 80 percent of the average monthly expeniture goes towords animal
feed, followed by animal seeds (9.4 percent) & other expenses (5.6 percent).The average expenses on
farming of animals for the first half of agricultural year (July to December 2012) was ₹ 1797,where
for second half of agricultural year (January to June 2013) was ₹ 1357 .
Table: - 4.5.2 Percentage distribution of average monthly receipts from farming of animals
per agricultural household engaged in farming of animals by type of livestock product
during July 2012 -June 2013
All size & class of
land holding
Average
Monthly
receipt
(₹ ) milk egg live
animals
wool fish all other
expenses
total
expenses
(1) (2) (3) (4) (5) (6) (7) (8) (9)
Visit -I
(July-
December2012)
88.4 0.2 10.1 0 0 1.2 100 2101
Visit-II (January -
Juner 2013)
88.8 0.5 9.4 0.1 0 1.1 100 1515
Visit_Combined
(July 2012-
June2013)
88.6 0.3 9.9 0 0 1.2 100 1460
The average monthly receipt from farming of animals per agricultural household engaged in
farming of animals was estimated as ₹ 1460 during the agricultural year July 2012 - June 2013 for
rual Odisha.The percent share of production of milk (88.6) was highest in the average monthly receipt,
followed by Sale of live animals (9.9).For the period July to December 2012 the average monthly
receipt from farming of animals was estimated for rural Odisha as ₹ 2101, where it was ₹ 1515 for
the period January to June 2013.

52 Income, Expenditure, Productive Assests & Indebtedness of Agricultural Households in Odisha during the year
January 2013-December 2013 (NSS 70th Round)
4.6 Net Receipt from Household Non-Farm Business
In order to estimate the total monthly income of agricultural households, information on non-
agricultural economic activities performed by the agricultural households during the reference period
was also collected in the survey. While information on income from wage/salaried employment was
collected against each of the members of the agricultural household, detailed expenses and value of
output related to non-agricultural entrepreneurial activities performed by the household were recorded
activity-wise.

53 Income, Expenditure, Productive Assests & Indebtedness of Agricultural Households in Odisha during the year
January 2013-December 2013 (NSS 70th Round)
Chapter5
Summary of Findings
Indebtedness of
Agricultural Households
Source of Loans

54 Income, Expenditure, Productive Assests & Indebtedness of Agricultural Households in Odisha during the year
January 2013-December 2013 (NSS 70th Round)
Chapter Five
5.1 Indebtedness of Agricultural Households
Information on the amount of outstanding loan as on date of survey (i.e. the day on which data
was collected from the household) was collected from each of the surveyed agricultural households
during the first visit. Along with the outstanding amount, information on source and nature of the loan
was also collected. In this survey, loans included all kind of outstanding loans irrespective of the
purpose for which loans were taken.
Loans will include borrowing in cash and/or kind (including hire purchases/credit purchase).
Borrowings in kind should be evaluated at current retail price prevalent in the local market. An
advance payment received for forward delivery of goods should also be regarded as loan. Cash loans
taken for short period without any security will be excluded. if the original amount of an unsecured
loan is less than ₹ 500/- and the said loan is fully repaid within a period of one month, then, it will not
be considered as a loan for the purpose.
Figure 5.1.1 Estimated Agricultural Household & indebted Agricultural Households in Rural
Odisha.
There were 43.71 lakh agricultural households estimated in Odisha during the year 2013, out
of which 17.30 lakh households were indebted during the same period.71.99 lakh households were
estimated in rural Odisha, out of which 61 % households were estimated as agricultural
households.Among these agricultural households 40% households were indebted households .
Estimated Agricultural
Households in rural Odisha
43.71 lakh
Estimated Indebted
Agricultural Households in Odisha 17.30
lakh
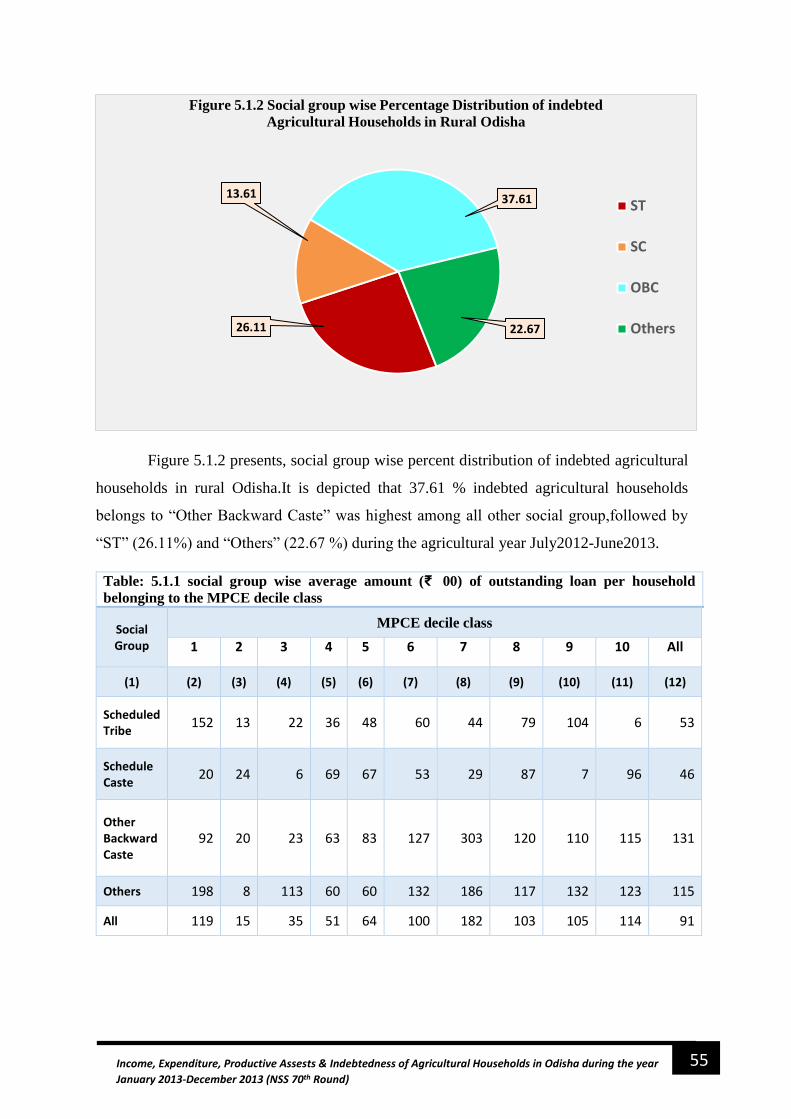
55 Income, Expenditure, Productive Assests & Indebtedness of Agricultural Households in Odisha during the year
January 2013-December 2013 (NSS 70th Round)
Figure 5.1.2 presents, social group wise percent distribution of indebted agricultural
households in rural Odisha.It is depicted that 37.61 % indebted agricultural households
belongs to “Other Backward Caste” was highest among all other social group,followed by
“ST” (26.11%) and “Others” (22.67 %) during the agricultural year July2012-June2013.
Table: 5.1.1 social group wise average amount (₹ 00) of outstanding loan per household
belonging to the MPCE decile class
Social Group
MPCE decile class
1 2 3 4 5 6 7 8 9 10 All
(1) (2) (3) (4) (5) (6) (7) (8) (9) (10) (11) (12)
Scheduled Tribe
152 13 22 36 48 60 44 79 104 6 53
Schedule Caste
20 24 6 69 67 53 29 87 7 96 46
Other Backward Caste
92 20 23 63 83 127 303 120 110 115 131
Others 198 8 113 60 60 132 186 117 132 123 115
All 119 15 35 51 64 100 182 103 105 114 91
26.11
13.61 37.61
22.67
Figure 5.1.2 Social group wise Percentage Distribution of indebted
Agricultural Households in Rural Odisha
ST
SC
OBC
Others

56 Income, Expenditure, Productive Assests & Indebtedness of Agricultural Households in Odisha during the year
January 2013-December 2013 (NSS 70th Round)
Table 5.1.1 and figure 5.1.3 presents, social group wise average amount (₹ 00) of outstanding
loan per household belonging to the MPCE decile class.The average amount of loan outstanding for
bottom 10 percent households belongs to social group “ST” and “Others” was higher than top 10
percent .Similarly for social group “SC” and “OBC” average amount of loan outstanding for top 10
percent was higher than bottom 10 percent.In case of other backward caste and schedule tribe there
was a rising trend from 2nd decile class to 9th decile class except 7th decile class.
5.2 Source of Loans Per 1000 distribution of outstanding loans by source of loan taken by agricultural households
with different social group wise is given in table 5.2.1., and Percentage distribution of outstanding
loans per agricultural household by sources of loan taken social group is given in figure 4.8.1.It is
clearly indicated from table that bank remains serves as major source of finance for agricultural
households in rural Odiisha.For social group “OBC” co-operative society serves as major source of
finance, where for all other social category bank remains serves as major source of finance
Table: 5.2.1 social group wise per 1000 distribution of outstanding loans per agricultural household by sources of loan taken
Social Group
per 1000 distribution of loans by source of loan no of hhs having outstanding loan
Governme
nt
co-operati
ve society
bank emplyoer/Landlord
agricultural/professional money
lender
shopkeeper/tr
ader
relative &friends
others All
(inc nr) estd. (00)
sample
(1) (2) (3) (4) (5) (6) (7) (8) (9) (10) (11) (12)
Scheduled Tribe
42 179 667 0 21 1 50 39 1000 4518 201
Schedule Caste
2 283 285 12 161 14 158 85 1000 2354 130
Other Backward Caste
24 340 82 2 375 7 133 37 1000 6507 289
Others 17 274 389 2 118 1 144 56 1000 3923 164
All 24 287 295 2 219 5 122 46 1000 17302 784
0
50
100
150
200
250
300
350
1 2 3 4 5 6 7 8 9 10
Av
era
ge
loa
n o
uts
tan
din
g p
er
ag
ricu
ltu
ral
ho
use
ho
ld
Decile class of MPCE
Figure 5.1.3 Average amount (₹ 00) of outstanding loan per Agricultural
household belonging to the MPCE decile class
Scheduled Tribe Schedule Caste Other Backward Caste Others

57 Income, Expenditure, Productive Assests & Indebtedness of Agricultural Households in Odisha during the year
January 2013-December 2013 (NSS 70th Round)
It is depicted in figure 5.2.1 that, the agricultural household belongs to social group ‘Schedule
Tribe’has the highest percent share (88.8) of loan taken from institutional source, followed by ‘Others’
(68.0) and ‘Schedule Caste’ (57.0).In rural area agricultural/professional money lander plays a vital
role for financing agricultural households.The percent share of agricultural/professional money lander
as source of finance to agricultural households belongs to social group “OBC” (37.5) was
maximum,where it was minimum for social group “ST” (2.1).The contributon of Government as
source of finance to agricultural households was very negligible.In case of non-institutional source of
finance ,the households belongs to social group ‘OBC’ has maximum percentage share (55.4)
followed by ‘SC’ (43.0) and others (32.0) .
4.2 0.2 2.4 1.7
17.9 28.334
27.4
66.7
28.5 8.2
38.9
0
1.2
0.2
0.2
2.1
16.1 37.5
11.8
0.1
1.4
0.7 0.1
5
15.813.3 14.4
3.9 8.5 3.7 5.6
88.8
57.0
44.6
68.0
0.0
10.0
20.0
30.0
40.0
50.0
60.0
70.0
80.0
90.0
100.0
0%
10%
20%
30%
40%
50%
60%
70%
80%
90%
100%
Figure 5.2.1 Percentage distribution of outstanding loans per agricultural
household by sources of loan taken
others
relative &friends
shopkeeper/trader
agricultural/professional moneylenderemplyoer/Landlord
bank
co-operativesociety
Government
Institutional

58 Income, Expenditure, Productive Assests & Indebtedness of Agricultural Households in Odisha during the year
January 2013-December 2013 (NSS 70th Round)
Chapter6
Conclusion
Conclusion
&
Suggestions
59 Income, Expenditure, Productive Assests & Indebtedness of Agricultural Households in Odisha during the year
January 2013-December 2013 (NSS 70th Round)
Chapter Six
Conclusion
Odisha is primarily an agrarian economy, but still Odisha farmers continue to be
among the poorest in the country. With presence of abundant raw materials in the form of natural
resources, it lags far behind in ensuring food security for its own citizens. This state is a combined
consequence of various factors, such as lack of advanced scientific methods in agriculture,
unavailability of modern machinery to the farmers, lack of electricity in villages and lack of financial
support and inadequate storage facilties.
Agriculture in Odisha still depends on the small and marginal farmers, which
constitute more than 80% of the total holdings. It continues to be characterized by low Productivity
due to traditional agricultural practices, inadequate capital formation and low investment, inadequate
irrigation facilities, low water use efficiency, uneconomic size of holding.As a result the agricultural
households forced to lay their lives in miseriable condition.
The recent past India has been witnessed a series of suicidial case of farming
households in different parts.This situation happens due to combination of factors like, indebtedness,
crop loss and low yield rate of production.
There are 61% agricultural households in Odisha and out of which 40% are indebted
.Indebtedness among ‘SC’ & ‘ST’ categories are significally less than that of ‘OBC and ‘Others’
categories. The major source of loans for agricultural households are bank, co-operative society,
shopkeepers & money lender.The proportion of finance from other source are very negligeble.
Similarly for average loan outstanding in poorest class is comparatively more than middle classes.the
amount of loan outstanding is in incling trend from lower middle class to upper class.
For sustainable growth in the field of agriculture, more comprehensive target oriented
grass root planning is required
o Appropiate steps should be taken to increase irregation potential
o Improved and high yielding seeds and fertilizer should be provided to farmers at
subsidised rate.Proper monitoring of the process is required to ensure that the actual
benefit reached at the targeted population.
o Easy short term loan through institutional source should be provided to farmer at low
rate of interest at the time of their requirment.
o Food processing enterprises should be developed in cluster, where the agricultural
produce plently available.
o For preserving agricultural produce, warehousing and cold storage facilities should
be provided to farmers, so that they can preserve their produce for future use.

60 Income, Expenditure, Productive Assests & Indebtedness of Agricultural Households in Odisha during the year
January 2013-December 2013 (NSS 70th Round)
o Agricultural marketing socities should be developed so that, farmers will get best
price of their produce.

Appendix-A

61 Income, Expenditure, Productive Assests & Indebtedness of Agricultural Households in Odisha during the year January 2013-December 2013 (NSS 70th Round)
Table -1 Number of first stage units (FSUs) allotted, surveyed, number of sample households surveyed and Estimated in Rural Odisha.
State
Rural Rural
Number of FSUs number of households
surveyed (Visit Combined)
number of households Estimated (00)
(Visit Combined) Allotted (Visit Combined)
Surveyed (Visit Combined)
Odisha 214 209 1669 43718

62 Income, Expenditure, Productive Assests & Indebtedness of Agricultural Households in Odisha during the year January 2013-December 2013 (NSS 70th Round)
Table 1.2st: Per 1000 distribution of agricultural households , persons , minimum and maximum of MPCnumber per 1000 agricultural households of adults and children by sex in different MPCE decile classe
State: ODISHA
MPCE decile class
MPCE ( Rs)
no.per 1000
of hhs
no.per 1000
of person
no per 1000 households of
all sex
ratio
av. no. of persons per 1000 hhs
estd. no of
persons (00)
sample no of hhs
Minimum Maximum
Adults children
Attended formal
training in agriculture
engaged in
farming during the last
six month
Male Female Male Female male female
()1 (2) (3) (4) (5) (6) (7) (8) (9) (10) (11) (12) (13) (14) (15) (16)
1 263 442 77 100 2193 2173 910 538 5816 874 17 0 1500 19681 111
2 444 557 95 110 1720 2025 855 596 5197 1018 2 0 2238 21649 135
3 563 644 84 90 1740 1610 672 795 4818 997 16 0 1789 17686 136
4 646 758 92 100 1790 1736 601 755 4881 1041 12 0 1800 19600 179
5 759 866 103 100 1447 1478 696 733 4354 1031 10 0 1091 19588 161
6 868 998 105 101 1616 1651 652 411 4330 909 18 6 1370 19901 168
7 999 1142 99 100 1811 1589 565 537 4501 895 27 0 1578 19575 175
8 1143 1383 113 100 1615 1454 518 409 3996 874 92 2 1543 19754 219
9 1385 1745 106 99 1714 1974 283 234 4205 1106 442 18 1339 19562 182
10 1748 6125 124 100 1404 1341 446 425 3616 955 508 63 1129 19676 203
All 263 6125 1000 1000 1683 1681 604 531 4499 967 130 11 1516 196671 1669
est no (00)
X X 43718 196671 73575 73488 26411 23196 196671 X 5692 462 66265 X X
sample no
X X 1669 8195 3160 2995 1106 934 8195 X 122 17 2796 X X

63 Income, Expenditure, Productive Assests & Indebtedness of Agricultural Households in Odisha during the year January 2013-December 2013 (NSS 70th Round)
Table 1.5st: Per 1000 distribution of agricultural households by major source of income during last 365 days for each MPCE decile class
State: ODISHA Social group: S.T
MPCE Decile class
no,per 1000 households engaged in per 1000 distribution of households by major source of income agricultural hhs
cultivation livestock
other agri-
cultural activity
non-agricultural enterprises
wage/ salaried
emplyoment others cultivation Livestock
other agricultural
activity
non-agricultural enterprises
wage/ salaried emplyoment
others All(inc
.nr) estd. (00)
sample
(1) (2) (3) (4) (5) (6) (7) (8) (9) (10) (11) (12) (13) (14) (15) (16)
1 982 374 117 50 406 123 930 10 7 24 23 7 1000 6341 167
2 982 419 23 55 477 162 886 4 1 38 61 11 1000 2960 123
3 966 276 47 16 557 338 865 13 0 0 88 30 1000 2282 109
4 984 432 183 212 236 243 942 0 0 0 53 5 1000 461 48
5 979 241 13 43 154 20 966 0 0 0 34 0 1000 265 20
6 1000 435 48 0 140 237 1000 0 0 0 0 0 1000 254 27
7 1000 250 7 478 550 26 522 0 0 478 0 0 1000 486 27
8 1000 931 0 29 26 0 1000 0 0 0 0 0 1000 430 9
9 1000 167 0 50 361 65 703 0 0 0 297 0 1000 120 16
10 980 27 0 0 434 486 125 20 0 0 375 479 1000 337 12
ALL 981 371 73 63 424 172 879 8 3 36 52 22 1000 13935 558
estd. no.of (00)
13670 5166 1018 874 5913 2393 12249 109 46 496 720 308 13935 X X
sample no of hhs.
514 210 46 34 212 73 478 22 3 8 33 13 558 X X

64 Income, Expenditure, Productive Assests & Indebtedness of Agricultural Households in Odisha during the year January 2013-December 2013 (NSS 70th Round)
able 1.5st: Per 1000 distribution of agricultural households by major source of income during last 365 days for each MPCE decile class
State: ODISHA Social group: S.C
no,per 1000 households engaged in per 1000 distribution of households by major source of income agricultural hhs
MPCE Decile class
cultivation
livestock
other agri-cultural activity
non-agricultural enterprises
wage/ salaried emplyoment
others
cultivation
Livestock
other agricultural activity
non-agricultural enterprises
wage/ salaried emplyoment
others
All(inc.nr)
estd. (00)
sample
(1) (2) (3) (4) (5) (6) (7) (8) (9) (10) (11) (12) (13) (14) (15) (16)
1 875 464 0 57 852 311 633 29 0 25 242 56 1000 883 49
2 932 438 61 361 339 28 563 91 0 218 118 10 1000 1598 57
3 992 287 125 253 412 88 652 4 21 155 126 42 1000 1865 49
4 890 590 11 362 171 203 692 39 0 176 93 0 1000 373 28
5 997 202 7 0 242 39 797 44 0 0 137 22 1000 474 19
6 1000 439 13 230 353 6 987 13 0 0 0 0 1000 239 12
7 1000 866 0 21 198 353 641 0 0 21 0 337 1000 133 15
8 205 116 0 28 897 0 205 0 0 0 795 0 1000 135 7
9 953 374 0 278 323 137 860 0 0 57 83 0 1000 259 16
10 776 371 107 29 374 0 597 0 0 29 374 0 1000 34 8
ALL 933 385 57 228 429 110 651 36 7 124 146 33 1000 5993 260
estd. No of hhs (00).
5590 2306 344 1369 2570 661 3904 217 40 742 877 198 5993 X X
sample no. of hhs
218 117 13 42 139 47 164 16 1 19 43 16 260 X X

65 Income, Expenditure, Productive Assests & Indebtedness of Agricultural Households in Odisha during the year January 2013-December 2013 (NSS 70th Round)
Table 1.5st: Per 1000 distribution of agricultural households by major source of income during last 365 days for each MPCE decile class
State: ODISHA Social group: OBC
MPCE Decile class
no,per 1000 households engaged in per 1000 distribution of households by major source of income agricultural
hhs
cultivation
livestock
other agri-
cultural
activity
non-agricultu
ral enterpris
es
wage/ salaried
emplyoment
others
cultivation
Livestock
other agricultu
ral activity
non-agricultu
ral enterpris
es
wage/ salaried
emplyoment
others
All(inc.nr)
estd. (00)
sample
(1) (2) (3) (4) (5) (6) (7) (8) (9) (10) (11) (12) (13) (14) (15) (16)
1 874 503 63 274 304 205 635 49 0 249 32 35 1000 2251 62
2 948 382 120 234 570 152 751 55 0 99 83 2 1000 1902 96
3 974 451 130 333 226 10 718 11 13 239 18 2 1000 3266 108
4 951 423 55 296 425 16 550 1 0 160 289 0 1000 1554 65
5 993 129 54 224 623 33 707 0 0 193 100 0 1000 1056 32
6 988 359 120 41 472 272 887 4 0 0 106 4 1000 1007 35
7 1000 539 36 491 128 14 657 0 0 332 5 6 1000 621 27
8 1000 618 157 106 207 0 1000 0 0 0 0 0 1000 272 17
9 967 144 453 32 121 526 903 0 0 14 50 33 1000 802 47
10 904 634 5 181 141 71 867 0 0 17 108 7 1000 476 39
ALL 952 409 113 253 348 120 720 19 3 167 79 9 1000 1320
7 528
estd. No of hhs (00).
12570 5408 1489 3335 4601 1582 9513 256 41 2206 1045 125 13207 X X
sample no.of hhs
489 258 50 99 169 75 412 13 1 39 51 11 528 X X

66 Income, Expenditure, Productive Assests & Indebtedness of Agricultural Households in Odisha during the year January 2013-December 2013 (NSS 70th Round)
Table 1.5st: Per 1000 distribution of agricultural households by major source of income during last 365 days for each MPCE decile class
State: ODISHA Social group: Others
MPCE Decile class
no,per 1000 households engaged in per 1000 distribution of households by major source of income agricultural
hhs
cultivation
livestock
other agri-
cultural
activity
non-agricultu
ral enterpris
es
wage/ salaried
emplyoment
others
cultivation
Livestock
other agricultu
ral activity
non-agricultu
ral enterpris
es
wage/ salaried
emplyoment
others
All(inc.nr)
estd. (00)
sample
(1) (2) (3) (4) (5) (6) (7) (8) (9) (10) (11) (12) (13) (14) (15) (16)
1 960 212 80 31 687 18 608 11 0 30 344 7 1000 1130 24
2 932 442 132 90 778 143 695 2 0 75 229 0 1000 1332 38
3 1000 256 78 201 560 112 871 0 0 13 115 0 1000 934 40
4 1000 348 19 325 416 557 837 38 0 57 68 0 1000 510 21
5 1000 668 71 437 35 8 834 103 0 58 0 6 1000 1014 20
6 847 362 8 359 284 224 524 20 0 176 178 104 1000 351 31
7 1000 580 46 151 313 29 970 0 0 0 30 0 1000 244 25
8 1000 698 15 0 283 314 403 0 0 0 283 314 1000 385 8
9 1000 630 8 109 75 93 937 0 0 8 55 0 1000 1229 30
10 999 546 32 143 164 156 729 0 0 69 102 99 1000 1889 85
ALL 979 473 57 168 363 136 754 16 0 48 141 40 1000 9017 322
estd. no.of hhs(00)
8826 4265 511 1518 3269 1223 6802 146 0 437 1275 357 9017 X X
sample no.of hhs
312 137 26 70 131 63 233 8 0 27 44 10 322 X X

67 Income, Expenditure, Productive Assests & Indebtedness of Agricultural Households in Odisha during the year January 2013-December 2013 (NSS 70th Round)
Table 1.5st: Per 1000 distribution of agricultural households by major source of income during last 365 days for each MPCE decile class
State: ODISHA Social group: All
no,per 1000 households engaged in per 1000 distribution of households by major source of income agricultural hhs
MPCE Decile class
cultivation livestock
other agri-
cultural activity
non-agricultural enterprises
wage/ salaried
emplyoment others cultivation Livestock
other agricultura
l activity
non-agricultural enterprises
wage/ salaried
emplyoment
others All(inc.
nr) estd. (00)
sample
(1) (2) (3) (4) (5) (6) (7) (8) (9) (10) (11) (12) (13) (14) (15) (16)
1 948 391 92 96 452 145 809 20 4 72 77 17 1000 10613 303
2 955 418 73 168 523 129 754 34 0 96 107 6 1000 7791 314
3 979 345 100 214 395 128 761 9 10 129 72 18 1000 8346 306
4 957 433 63 296 361 171 681 12 0 118 187 1 1000 2899 162
5 995 346 48 246 302 24 793 45 0 93 64 6 1000 2809 91
6 964 380 75 120 375 224 846 7 0 33 91 22 1000 1851 105
7 1000 480 25 389 303 51 663 0 0 297 7 33 1000 1484 94
8 912 698 40 37 243 99 724 0 0 0 177 99 1000 1222 41
9 984 418 155 99 131 240 905 0 0 15 68 11 1000 2410 109
10 977 495 24 130 196 180 677 3 0 51 140 128 1000 2736 144
ALL 964 407 80 168 388 139 770 17 3 92 93 23 1000 42161 1669
estd. no.of hhs (00)
40664 17145 3362 7096 16361 5859 32476 728 126 3882 3918 989 42161 X X
sample no.of hhs
1534 722 135 245 652 258 1288 59 5 93 171 50 1669 X X

68 Income, Expenditure, Productive Assests & Indebtedness of Agricultural Households in Odisha during the year January 2013-December 2013 (NSS 70th Round)
Table 1.15: Per1000 distribution of persons aged 7 yearand above among agricultural household by ps during two halves of the agricultural year 2012-13 for each state/UT
Gender: MALE
per 1000 distribution of persons by ps during july- december -2012 per 1000 distribution of personsby ps during january -june 2013 no.of persons aged 7 years& above
State
self employed (11,12,21 ) regular employment
casual wage labour in
other all
self employed (11,12,21 ) regular employment
casual wage labour in
other all
std
. (0
0)
sam
ple
Agr
icu
ltu
re
No
n-a
gric
ult
ure
Agr
icu
ltu
re
No
n-a
gric
ult
ure
public works
other
Agr
icu
ltu
re
No
n-a
gric
ult
ure
Agr
icu
ltu
re
No
n-a
gric
ult
ure
public work
other-
MG
NR
EGA
oth
er
Agr
i-cu
ltu
re
No
n-a
gric
ult
ure
MG
NR
EGA
oth
er
Agr
i-cu
ltu
re
No
n-a
gric
ult
ure
(1) (2) (3) (4) (5) (6) (7) (8) (9) (10) (11) (12) (13) (14) (15) (16) (17) (18) (19) (20) (21) (22) (23)
Orissa 515 95 0 32 2 4 28 21 303 1000 357 109 0 38 3 20 50 90 333 1000 88454 3822
ALL 515 95 0 32 2 4 28 21 303 1000 357 109 0 38 3 20 50 90 333 1000 88454 3822
estd. no. Hhs (00)
45528 8419 0 2834 144 375 2462 1859 26833 88454 31622 9618 0 3351 306 1726 4438 7925 29468 88454 X X
sample no.of hhs
1994 297 0 185 11 27 59 82 1167 3822 1471 336 0 198 20 88 118 277 1314 3822 X X

69 Income, Expenditure, Productive Assests & Indebtedness of Agricultural Households in Odisha during the year January 2013-December 2013 (NSS 70th Round)
Table 1.15: Per1000 distribution of persons aged 7 yearand above among agricultural household by ps during two halves of the agricultural year 2012-13 for each state/UT
Gender: FEMALE
per 1000 distribution of persons by ps during july- december -2012 per 1000 distribution of personsby ps during january -june 2013 no.of persons aged 7 years&above
State self employed
(11,12,21 )
regular employment (31)
casual wage labour in
other all
self employed (11,12,21 )
regular employmen
t (31) casual wage labour in
oth
er
all
std
. (0
0)
sam
ple
Agr
icu
ltu
re
No
n-a
gri
Agr
icu
ltu
re
No
n-a
gri
public works
other
Agr
icu
ltu
re
No
n-a
gric
ult
ure
Agr
icu
ltu
re
No
n-a
gric
ult
ure
public work
other
MG
NR
EGA
(42
)
oth
er(4
1)
Agr
i-cu
ltu
re
No
n-a
gric
ult
ure
MG
NR
EGA
-(4
2)
oth
er-(
41
)
Agr
i-cu
ltu
re
No
n-a
gric
ult
ure
(1) (2) (3) (4) (5) (6) (7) (8) (9) (10) (11) (12) (13) (14) (15) (16) (17) (18) (19) (20) (21) (22) (23)
Orissa 147 15 0 7 1 1 6 1 823 1000 98 17 0 8 0 4 9 11 853 1000 87168 3527
ALL 147 15 0 7 1 1 6 1 823 1000 98 17 0 8 0 4 9 11 853 1000 87168 3527
estd. no.of hhs (00)
12775 1272 0 588 54 112 483 125 71759 87168 8519 1477 0 725 32 346 745 975 74349 87168 X X
sample no.of hhs
521 52 0 30 6 4 12 6 2896 3527 423 60 0 31 6 17 12 32 2946 3527 X X

70 Income, Expenditure, Productive Assests & Indebtedness of Agricultural Households in Odisha during the year January 2013-December 2013 (NSS 70th Round)
Table 1.9: Per 1000 distribution of agricultural households by type of dwelling unit, by type of structure, by type of land possessed, by type of ration card and no. per 1000
agricultural households having MGNREG job card and operated any land for agricultural activities during last 365 days for each major source of income
State:- ODISHA Social group: -S T
MPCE decile class
per 1000 distribution of agriculture household by no per 1000 agricultural hhs
having agricultural hhs
type of dwelling unit type of structure type of land possesssed type of ration card o
wn
ed
hir
ed
no
dw
ellin
g u
nit
oth
er
N.R
.
katc
ha
sem
i-p
ucc
a
pu
cca
N.R
.
ho
mes
tead
on
ly
ho
mes
tead
an
d o
ther
la
nd
oth
er
lan
d o
nly
no
lan
d
An
tyo
-day
a
BP
L
oth
er c
ard
No
rat
ion
op
erat
ed a
ny
lan
d f
or
agri
cult
ura
l act
ivit
ies
du
rin
g la
st 3
65
day
s
MG
NR
EG j
ob
car
d
estd
.(0
0)
sam
ple
(1) (2) (3) (4) (5) (6) (7) (8) (9) (10) (11) (12) (13) (14) (15) (16) (17) (18) (19) (20) (21) (22)
Cultivation 985 3 0 12 0 559 285 157 0 6 993 0 0 53 700 143 104 1000 761 12310 479
Livestock 1000 0 0 0 0 788 203 9 0 587 57 0 59 106 445 0 448 324 471 116 22
other agricultural activity
1000 0 0 0 0 1000 0 0 0 0 1000 0 0 461 78 0 461 1000 539 46 3
non-agricultural enterprise
1000 0 0 0 0 473 510 18 0 306 645 0 48 11 521 451 18 908 312 496 8
wage/salaried employment
958 0 0 42 0 372 469 159 0 89 814 42 55 0 684 288 28 859 371 720 33
Pension 1000 0 0 0 0 0 716 284 0 0 1000 0 0 0 716 0 284 1000 10 229 3
Remittances 1000 0 0 0 0 0 0 1000 0 0 1000 0 0 0 1000 0 0 1000 1000 24 1
Others 1000 0 0 0 0 619 381 0 0 679 321 0 0 0 475 204 321 321 1000 56 9
All (inc nr) 985 3 0 13 0 539 308 153 0 29 961 2 5 49 689 157 105 980 711 14010 559
estd. No of hhs (00).
13797 37 0 176 0 7550 4319 2142 0 413 13459 30 72 688 9654 2200 1468 13733 9962 14010 XXX
sample no.of hhs 551 1 0 7 0 280 164 115 0 53 496 1 6 34 321 117 87 516 356 559 XXX

71 Income, Expenditure, Productive Assests & Indebtedness of Agricultural Households in Odisha during the year January 2013-December 2013 (NSS 70th Round)
Table 1.9: Per 1000 distribution of agricultural households by type of dwelling unit, by type of structure, by type of land possessed, by type of ration card and no. per 1000
agricultural households having MGNREG job card and operated any land for agricultural activities during last 365 days for each major source of income
State:- ODISHA Social group: -S C
MPCE decile class per 1000 distribution of agriculture household by no per 1000 agricultural hhs having
agricultural hhs
type of dwelling unit type of structure type of land possesssed type of ration card
ow
ned
hir
ed
no
dw
ellin
g u
nit
oth
er
N.R
.
katc
ha
sem
i-p
ucc
a
pu
cca
N.R
.
ho
mes
tead
on
ly
ho
mes
tead
an
d o
ther
la
nd
oth
er
lan
d o
nly
no
lan
d
An
tyo
-day
a
BP
L
oth
er c
ard
No
rat
ion
op
erat
ed a
ny
lan
d f
or
agri
cult
ura
l act
ivit
ies
du
rin
g la
st 3
65
day
s
MG
NR
EG j
ob
car
d
estd
.(0
0)
sam
ple
(1) (2) (3) (4) (5) (6) (7) (8) (9) (10) (11) (12) (13) (14) (15) (16) (17) (18) (19) (20) (21) (22)
Cultivation 996 0 0 4 0 430 327 243 0 1 996 4 0 28 532 214 226 1000 712 3904 164
Livestock 1000 0 0 0 0 448 500 51 0 564 379 0 57 10 579 88 322 546 532 217 16
other agricultural activity 1000 0 0 0 0 1000 0 0 0 0 1000 0 0 0 0 0 1000 1000 1000 40 1
non-agricultural enterprises 1000 0 0 0 0 132 686 181 0 316 684 0 0 36 885 21 58 914 905 742 19
wage/salaried employment 1000 0 0 0 0 498 150 352 0 96 904 0 0 0 793 120 87 810 895 877 43
Pension 1000 0 0 0 0 130 0 870 0 130 870 0 0 0 0 630 370 1000 0 79 3
Remittances 1000 0 0 0 0 0 0 1000 0 0 1000 0 0 0 1000 0 0 1000 1000 10 1
Others 1000 0 0 0 0 557 443 0 0 545 455 0 0 271 208 18 503 455 871 109 12
All (inc nr) 997 0 0 2 0 407 346 247 0 88 908 2 2 28 601 172 199 933 752 5993 260
estd. no.of hhs (00) 5978 2 0 14 0 2438 2073 1482 0 528 5439 14 12 167 3603 1029 1195 5590 4509 5993 XXX
sample no.of hhs
258 1 0 1 0 117 58 85 0 50 208 1 1 15 142 58 45 218 183 260 XXX

72 Income, Expenditure, Productive Assests & Indebtedness of Agricultural Households in Odisha during the year January 2013-December 2013 (NSS 70th Round)
Table 1.9: Per 1000 distribution of agricultural households by type of dwelling unit, by type of structure, by type of land possessed, by type of ration card and no. per 1000
agricultural households having MGNREG job card and operated any land for agricultural activities during last 365 days for each major source of income
State:- ODISHA Social group: -OBC
MPCE decile class per 1000 distribution of agriculture household by no per 1000 agricultural hhs having
agricultural hhs
type of dwelling unit type of structure type of land possesssed type of ration card o
wn
ed
hir
ed
no
dw
ellin
g u
nit
oth
er
N.R
.
katc
ha
sem
i-p
ucc
a
pu
cca
N.R
.
ho
mes
tead
on
ly
ho
mes
tead
an
d o
ther
la
nd
oth
er
lan
d o
nly
no
lan
d
An
tyo
-day
a
BP
L
oth
er c
ard
No
rat
ion
op
erat
ed a
ny
lan
d f
or
agri
cult
ura
l act
ivit
ies
du
rin
g la
st 3
65
day
s
MG
NR
EG j
ob
car
d
estd
.(0
0)
sam
ple
(1) (2) (3) (4) (5) (6) (7) (8) (9) (10) (11) (12) (13) (14) (15) (16) (17) (18) (19) (20) (21) (22)
Cultivation 997 0 0 3 0 299 284 418 0 2 991 6 1 11 432 386 171 1000 424 9689 412
Livestock 1000 0 0 0 0 396 256 348 0 605 229 118 48 59 896 15 31 301 930 256 13
other agricultural activity
1000 0 0 0 0 1000 0 0 0 1000 0 0 0 0 1000 0 0 0 0 41 1
non-agricultural enterprises
1000 0 0 0 0 84 696 220 0 18 972 0 10 31 450 500 20 975 405 2591 39
wage/salaried employment
925 75 0 0 0 136 550 314 0 117 799 8 68 78 147 130 645 790 398 1045 51
Pension 1000 0 0 0 0 0 0 1000 0 0 1000 0 0 0 0 310 690 1000 0 10 3
Remittances 1000 0 0 0 0 940 0 60 0 504 60 0 436 424 496 80 0 60 0 61 4
Others 1000 0 0 0 0 844 156 0 0 1000 0 0 0 844 0 156 0 0 484 54 4
All (inc nr) 992 6 0 2 0 256 378 367 0 35 946 7 10 26 423 377 174 954 426 13768 528
estd. no.of hhs (00) 13661 78 0 29 0 3520 5199 5049 0 488 13029 99 143 355 5830 5189 2394 13131 5860 13768 XXX
sample no.of hhs 525 2 0 1 0 129 161 238 0 38 479 3 7 15 185 199 129 489 231 528 XXX
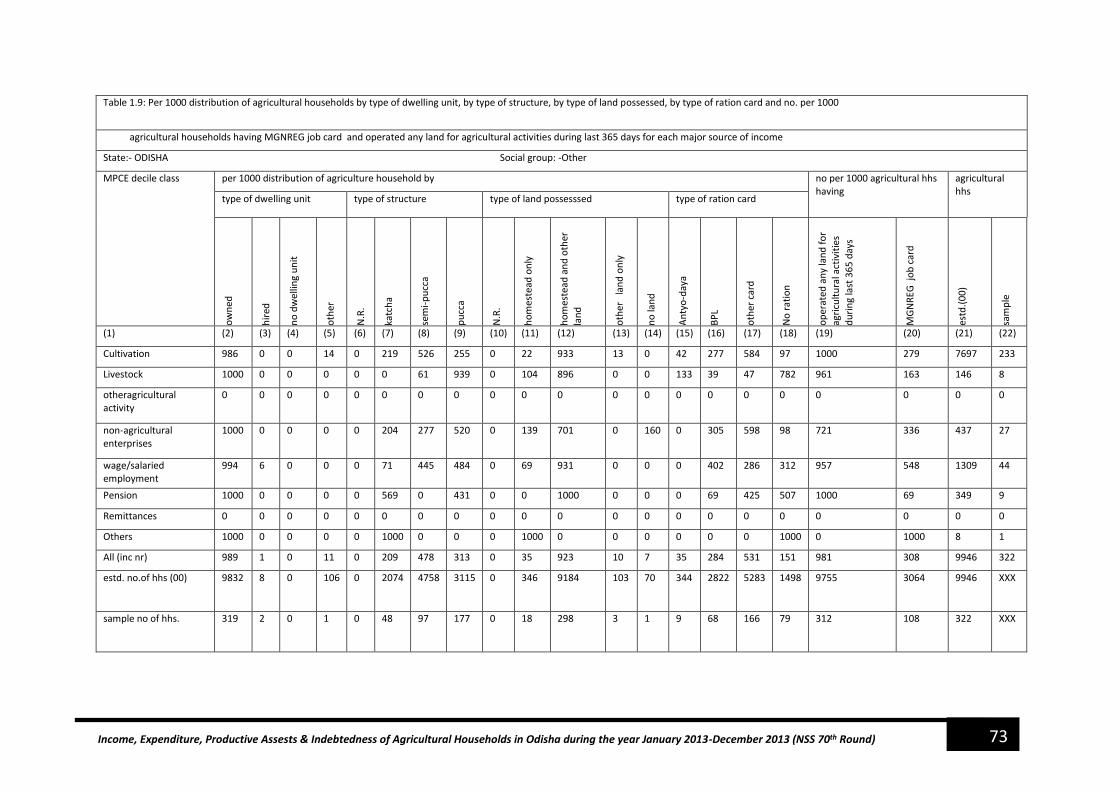
73 Income, Expenditure, Productive Assests & Indebtedness of Agricultural Households in Odisha during the year January 2013-December 2013 (NSS 70th Round)
Table 1.9: Per 1000 distribution of agricultural households by type of dwelling unit, by type of structure, by type of land possessed, by type of ration card and no. per 1000
agricultural households having MGNREG job card and operated any land for agricultural activities during last 365 days for each major source of income
State:- ODISHA Social group: -Other
MPCE decile class per 1000 distribution of agriculture household by no per 1000 agricultural hhs having
agricultural hhs
type of dwelling unit type of structure type of land possesssed type of ration card
ow
ned
hir
ed
no
dw
ellin
g u
nit
oth
er
N.R
.
katc
ha
sem
i-p
ucc
a
pu
cca
N.R
.
ho
mes
tead
on
ly
ho
mes
tead
an
d o
ther
lan
d
oth
er
lan
d o
nly
no
lan
d
An
tyo
-day
a
BP
L
oth
er c
ard
No
rat
ion
op
erat
ed a
ny
lan
d f
or
agri
cult
ura
l act
ivit
ies
du
rin
g la
st 3
65
day
s
MG
NR
EG j
ob
car
d
estd
.(0
0)
sam
ple
(1) (2) (3) (4) (5) (6) (7) (8) (9) (10) (11) (12) (13) (14) (15) (16) (17) (18) (19) (20) (21) (22)
Cultivation 986 0 0 14 0 219 526 255 0 22 933 13 0 42 277 584 97 1000 279 7697 233
Livestock 1000 0 0 0 0 0 61 939 0 104 896 0 0 133 39 47 782 961 163 146 8
otheragricultural activity
0 0 0 0 0 0 0 0 0 0 0 0 0 0 0 0 0 0 0 0 0
non-agricultural enterprises
1000 0 0 0 0 204 277 520 0 139 701 0 160 0 305 598 98 721 336 437 27
wage/salaried employment
994 6 0 0 0 71 445 484 0 69 931 0 0 0 402 286 312 957 548 1309 44
Pension 1000 0 0 0 0 569 0 431 0 0 1000 0 0 0 69 425 507 1000 69 349 9
Remittances 0 0 0 0 0 0 0 0 0 0 0 0 0 0 0 0 0 0 0 0 0
Others 1000 0 0 0 0 1000 0 0 0 1000 0 0 0 0 0 0 1000 0 1000 8 1
All (inc nr) 989 1 0 11 0 209 478 313 0 35 923 10 7 35 284 531 151 981 308 9946 322
estd. no.of hhs (00) 9832 8 0 106 0 2074 4758 3115 0 346 9184 103 70 344 2822 5283 1498 9755 3064 9946 XXX
sample no of hhs. 319 2 0 1 0 48 97 177 0 18 298 3 1 9 68 166 79 312 108 322 XXX

74 Income, Expenditure, Productive Assests & Indebtedness of Agricultural Households in Odisha during the year January 2013-December 2013 (NSS 70th Round)
Table 1.9: Per 1000 distribution of agricultural households by type of dwelling unit, by type of structure, by type of land possessed, by type of ration card and no. per 1000
agricultural households having MGNREG job card and operated any land for agricultural activities during last 365 days for each major source of income
State:- ODISHA Social group: -All
MPCE decile class
per 1000 distribution of agriculture household by no per 1000 agricultural hhs having
agricultural hhs
type of dwelling unit type of structure type of land possesssed type of ration card
ow
ned
hir
ed
no
dw
ellin
g u
nit
oth
er
N.R
.
katc
ha
sem
i-p
ucc
a
pu
cca
N.R
.
ho
mes
tead
on
ly
ho
mes
tead
an
d o
ther
lan
d
oth
er
lan
d o
nly
no
lan
d
An
tyo
-day
a
BP
L
oth
er c
ard
No
rat
ion
op
erat
ed a
ny
lan
d f
or
agri
cult
ura
l act
ivit
ies
du
rin
g la
st 3
65
day
s
MG
NR
EG j
ob
car
d
estd
.(0
0)
sam
ple
(1) (2) (3) (4) (5) (6) (7) (8) (9) (10) (11) (12) (13) (14) (15) (16) (17) (18) (19) (20) (21) (22)
Cultivation 990 1 0 9 0 391 344 265 0 8 979 5 0 35 507 322 136 1000 548 33600 1288
Livestock 1000 0 0 0 0 395 281 324 0 491 378 41 43 66 561 41 332 508 588 735 59
other agricultural activity
1000 0 0 0 0 1000 0 0 0 326 674 0 0 166 354 0 480 674 508 126 5
non-agricultural enterprises
1000 0 0 0 0 150 630 220 0 116 856 0 28 26 519 421 34 930 474 4267 93
wage/salaried employments
971 22 0 8 0 238 412 350 0 92 869 10 28 21 473 208 298 862 553 3952 171
Pension 1000 0 0 0 0 313 245 441 0 16 984 0 0 0 281 302 417 1000 39 668 18
Remittances 1000 0 0 0 0 607 0 393 0 326 393 0 282 274 674 52 0 393 354 95 6
Others 1000 0 0 0 0 656 344 0 0 702 298 0 0 331 217 96 356 298 815 227 26
All (inc nr) 990 3 0 7 0 356 374 270 0 41 940 6 7 36 501 313 150 965 535 43718 1669
estd. no.of hhs ( 00) 43267 125 0 325 0 #### 16349 11787 0 1775 41111 246 298 1554 #### #### 6554 42209 23395 43718 XXX
sample no.of hhs 1653 6 0 10 0 574 480 615 0 159 1481 8 15 73 716 540 340 1535 878 1669 XXX

75 Income, Expenditure, Productive Assests & Indebtedness of Agricultural Households in Odisha during the year January 2013-December 2013 (NSS 70th Round)
Table 1.11: Per 1000 distribution of agricultural households by land possession outside the village for each major source of income
State: Orissa Social group: - S T
per 1000 distributibution of households possessing land outside village agricultural hhs
majour Sources of Income
within state out side state Both within and
outside state no land outside
village all inc( nr) estd.(00) sample
(1) (2) (3) (4) (5) (6) (7) (8)
Cultivation 136 115 1 748 1000 12310 479
Livestock 0 44 0 956 1000 116 22
other arricultural activity
0 78 0 922 1000 46 3
non-agricultural enterprises
0 0 0 1000 1000 496 8
wage/salaried employment
0 42 0 958 1000 720 3
Pension 284 0 0 716 1000 229 3
Remittances 0 0 0 1000 1000 24 1
Others 0 0 0 1000 1000 56 9
All(inc nr) 124 104 1 771 1000 14010 559
estd. no.of hhs 1741 1454 11 10804 14010 X X
sample no of hhs. 79 59 1 420 559 X X

76 Income, Expenditure, Productive Assests & Indebtedness of Agricultural Households in Odisha during the year January 2013-December 2013 (NSS 70th Round)
Table 1.11: Per 1000 distribution of agricultural households by land possession outside the village for each major source of income
State: Orissa Social group: - S C
per 1000 distributibution of households possessing land outside village agricultural hhs
majour Sources of Income
within state out side
state
Both within and outside
state no land outside village all inc( nr) estd.(00) sample
(1) (2) (3) (4) (5) (6) (7) (8)
Cultivation 77 115 0 808 1000 3904 164
Livestock 0 103 0 897 1000 217 16
other agricultural activty
0 0 0 1000 1000 40
non-agricultural enterprises
61 62 0 877 1000 742 19
wage/salaried employment
44 11 0 946 1000 877 43
Pension 0 0 0 1000 1000 79 3
Remittances 0 1000 0 0 1000 10 1
Others 0 29 0 971 1000 109 12
All(inc nr) 66 90 0 844 1000 5993 260
estd. no.of hhs 397 540 0 5056 5993 X X
sample no.of hhs 31 21 0 208 260 X X
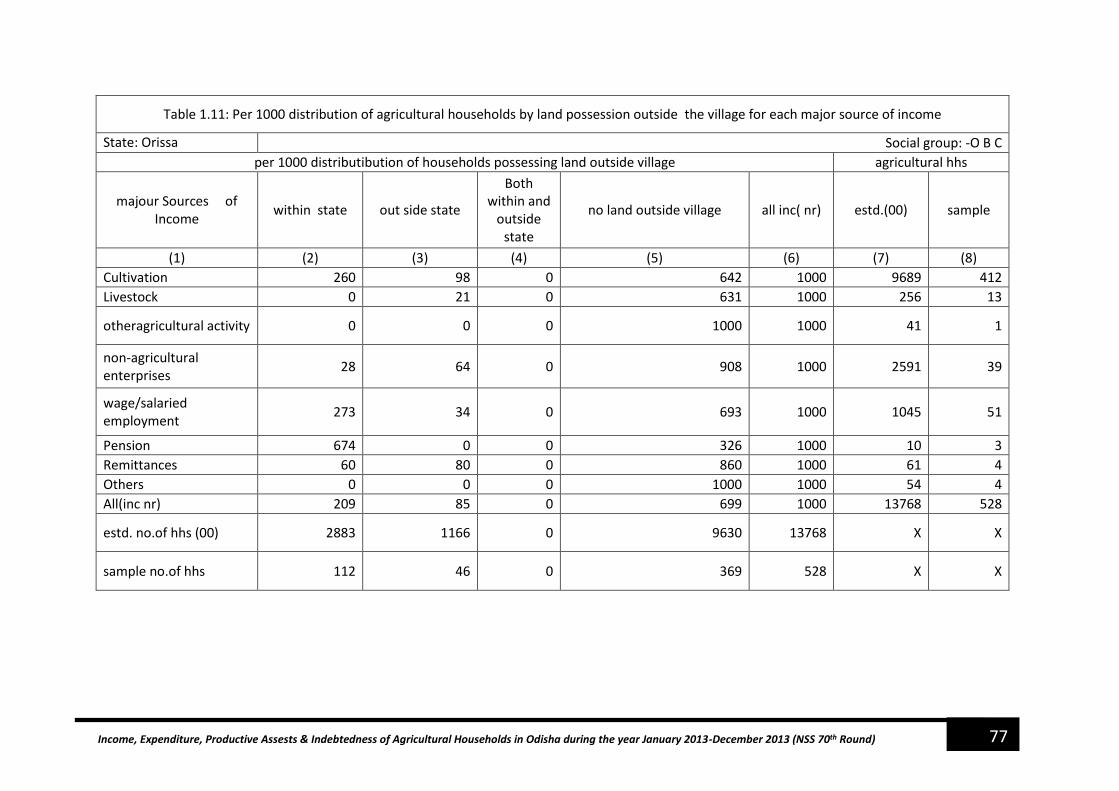
77 Income, Expenditure, Productive Assests & Indebtedness of Agricultural Households in Odisha during the year January 2013-December 2013 (NSS 70th Round)
Table 1.11: Per 1000 distribution of agricultural households by land possession outside the village for each major source of income
State: Orissa Social group: -O B C
per 1000 distributibution of households possessing land outside village agricultural hhs
majour Sources of Income
within state out side state
Both within and
outside state
no land outside village all inc( nr) estd.(00) sample
(1) (2) (3) (4) (5) (6) (7) (8)
Cultivation 260 98 0 642 1000 9689 412
Livestock 0 21 0 631 1000 256 13
otheragricultural activity 0 0 0 1000 1000 41 1
non-agricultural enterprises
28 64 0 908 1000 2591 39
wage/salaried employment
273 34 0 693 1000 1045 51
Pension 674 0 0 326 1000 10 3
Remittances 60 80 0 860 1000 61 4
Others 0 0 0 1000 1000 54 4
All(inc nr) 209 85 0 699 1000 13768 528
estd. no.of hhs (00) 2883 1166 0 9630 13768 X X
sample no.of hhs 112 46 0 369 528 X X

78 Income, Expenditure, Productive Assests & Indebtedness of Agricultural Households in Odisha during the year January 2013-December 2013 (NSS 70th Round)
Table 1.11: Per 1000 distribution of agricultural households by land possession outside the village for each major source of income
State: Orissa Social group: - OTHERS
per 1000 distributibution of households possessing land outside village agricultural hhs
majour Sources of Income
within state out side state
Both within and
outside state
no land outside village all inc( nr) estd.(00) sample
(1) (2) (3) (4) (5) (6) (7) (8)
Cultivation 73 25 0 899 1000 7697 233
Livestock 0 23 0 977 1000 146 8
other agricultural activity
0 0 0 0 0 0 0
non-agricultural enterprises
56 0 0 944 1000 437 27
wage/salaried employment
33 9 0 958 1000 1309 44
Pension 512 0 0 488 1000 349 9
Remittances 0 0 0 0 0 0 0
Others 0 0 0 1000 1000 8 1
All(inc nr) 81 21 0 895 1000 9946 322
estd. no.of hhs (00) 807 210 0 8905 9946 X X
sample no.of hhs 58 21 0 242 322 X X

79 Income, Expenditure, Productive Assests & Indebtedness of Agricultural Households in Odisha during the year January 2013-December 2013 (NSS 70th Round)
Table 1.11: Per 1000 distribution of agricultural households by land possession outside the village for each major source of income
State: Orissa Social group: - All
per 1000 distributibution of households possessing land outside village agricultural hhs
majour Sources of Income
within state out side state Both within and outside
state no land outside village all inc( nr) estd.(00) sample
(1) (2) (3) (4) (5) (6) (7) (8)
Cultivation 150 90 0 759 1000 33600 1288
Livestock 0 49 0 830 1000 735 59
other agricultural activity
0 28 0 972 1000 126 5
non-agricultural enterprises
33 50 0 917 1000 4267 93
wage/salaried employment
93 22 0 885 1000 3952 171
Pension 375 0 0 625 1000 668 18
Remittances 39 153 0 808 1000 95 6
Others 0 14 0 986 1000 227 26
All(inc nr) 133 77 0 787 1000 43718 1669
estd. no.of hhs (00) 5829 3370 11 34395 43718 X X
sample no. Of hhs 280 147 1 1239 1669 X X

80 Income, Expenditure, Productive Assests & Indebtedness of Agricultural Households in Odisha during the year January 2013-December 2013 (NSS 70th Round)
Table 1 . 20st: per 1000 distribution of persons aged 7 year s and above who stayed away from usual place of residence for 15 days or more
for purpose of employment among agriculturalhouseholds by MPCE decile class
Gender: MALE season: july 2012 - dec 2012
state/UT ODISHA
Per 1000 distributions of persons who stayed away by MPCE decile class persons aged 7 years and above
1 2 3 4 5 6 7 8 9 10 All no. per 1000 who stayed
away estd.(00) Sample
(1) (2) (3) (4) (5) (6) (7) (8) (9) (10) (11) (12) (13) (14) (15)
Orissa 26 5 78 125 55 323 238 112 11 27 1000 33 88454 3822
estd. no of hhs (00). 8893 8495 7344 8710 8047 9007 9439 9922 8820 9778 88454 X X X
sample no. of hhs 295 314 317 428 368 383 396 477 386 458 3822 X X X
Gender: FEMALE Season: July 2012 --Dec 2012
state/UT ODISHA
Per 1000 distributions of persons who stayed away by MPCE decile class persons aged 7 years and above
1 2 3 4 5 6 7 8 9 10 All no. per 1000 who stayed
away estd.(00) Sample
(1) (2) (3) (4) (5) (6) (7) (8) (9) (10) (11) (12) (13) (14) (15)
Orissa 0 0 441 50 0 164 0 8 0 337 1000 1 87168 3527
estd. no of hhs (00). 8489 10124 7592 8057 8259 8564 8035 8827 10030 9191 87168 X X X
sample no. of hhs 275 321 299 401 353 349 356 408 356 409 3527 X X X
Gender: ALL season: july 2012 - dec 2012
state/UT ODISHA
Per 1000 distributions of persons who stayed away by MPCE decile class persons aged 7 years and above
1 2 3 4 5 6 7 8 9 10 All no. per 1000 who stayed
away estd.(00) Sample
(1) (2) (3) (4) (5) (6) (7) (8) (9) (10) (11) (12) (13) (14) (15)
Orissa 25 5 88 123 54 319 231 109 11 36 1000 17 175622 7349
estd. No of hhs (00). 17383 18619 14936 16767 16306 17571 17474 18749 18850 18969 175622 X X X
sample no. of hhs 570 635 616 829 721 732 752 885 742 867 7349 X X X
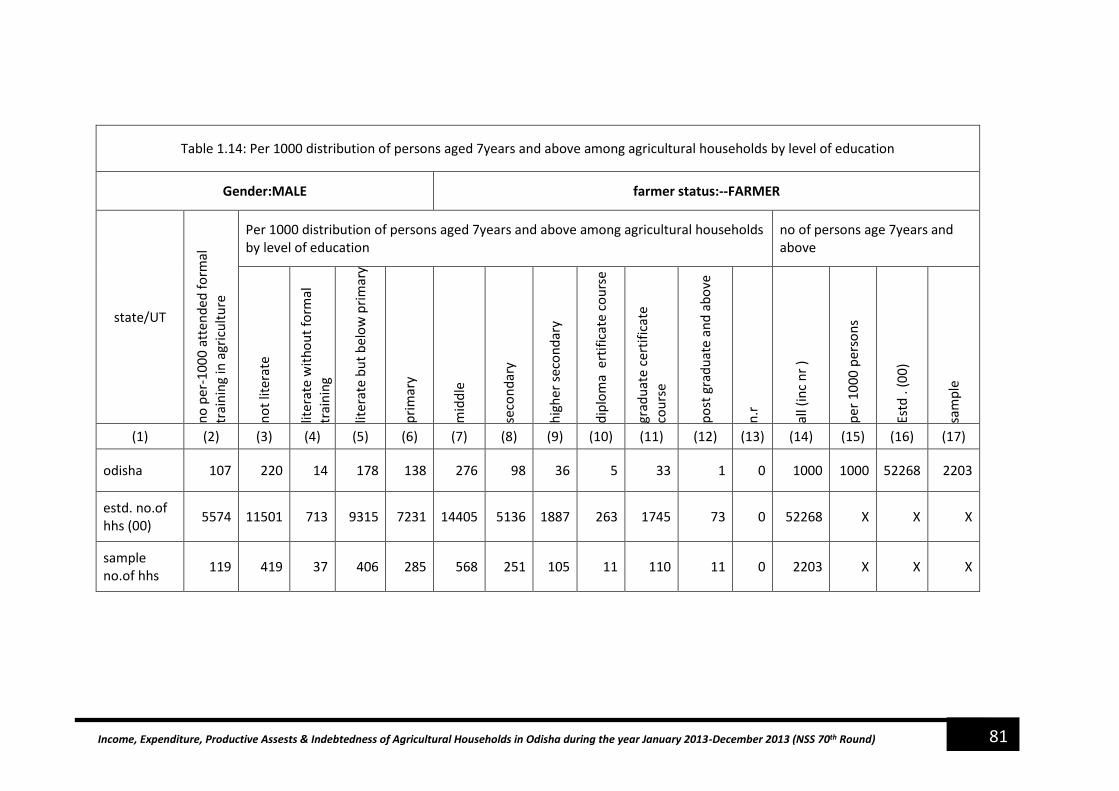
81 Income, Expenditure, Productive Assests & Indebtedness of Agricultural Households in Odisha during the year January 2013-December 2013 (NSS 70th Round)
Table 1.14: Per 1000 distribution of persons aged 7years and above among agricultural households by level of education
Gender:MALE farmer status:--FARMER
state/UT
no
per
-10
00
att
end
ed f
orm
al
trai
nin
g in
agr
icu
ltu
re
Per 1000 distribution of persons aged 7years and above among agricultural households by level of education
no of persons age 7years and above
no
t lit
erat
e
lite
rate
wit
ho
ut
form
al
trai
nin
g
liter
ate
bu
t b
elo
w p
rim
ary
pri
mar
y
mid
dle
seco
nd
ary
hig
her
sec
on
dar
y
dip
lom
a e
rtif
icat
e co
urs
e
grad
uat
e c
erti
fica
te
cou
rse
po
st g
rad
uat
e an
d a
bo
ve
n.r
all (
inc
nr
)
per
10
00
per
son
s
Estd
. (0
0)
sam
ple
(1) (2) (3) (4) (5) (6) (7) (8) (9) (10) (11) (12) (13) (14) (15) (16) (17)
odisha 107 220 14 178 138 276 98 36 5 33 1 0 1000 1000 52268 2203
estd. no.of hhs (00)
5574 11501 713 9315 7231 14405 5136 1887 263 1745 73 0 52268 X X X
sample no.of hhs
119 419 37 406 285 568 251 105 11 110 11 0 2203 X X X

82 Income, Expenditure, Productive Assests & Indebtedness of Agricultural Households in Odisha during the year January 2013-December 2013 (NSS 70th Round)
Table 1.14: Per 1000 distribution of persons aged 7years and above among agricultural households by level of education
Gender:MALE farmer status:--NON FARMER
state/UT
no
per
-10
00
att
end
ed f
orm
al t
rain
ing
in
agri
cult
ure
Per 1000 distribution of persons aged 7years and above among agricultural households by level of education
no of persons age 7years and above
no
t lit
erat
e
lite
rate
wit
ho
ut
form
al t
rain
ing
lit. b
ut
bel
ow
pri
mar
y
pri
mar
y
mid
dle
seco
nd
ary
hig
her
sec
on
dar
y
dip
lom
a e
rtif
icat
e co
urs
e
grad
uat
e c
erti
fica
te c
ou
rse
po
st g
rad
uat
e an
d a
bo
ve
n.r
all (
inc
nr
)
per
10
00
per
son
s
estd
. (0
0)
sam
ple
(1) (2) (3) (4) (5) (6) (7) (8) (9) (10) (11) (12) (13) (14) (15) (16) (17)
Orissa 3 82 3 234 183 204 132 86 9 66 1 0 1000 758 36186 161
9
estd. No of (00).
118 2972 90 8483 6635 7374 4784 3113 309 2376 50 0 36186 X X X
sample no of hhs.
3 138 12 430 223 306 197 158 19 128 8 0 1619 X X X

83 Income, Expenditure, Productive Assests & Indebtedness of Agricultural Households in Odisha during the year January 2013-December 2013 (NSS 70th Round)
Table 1.14: Per 1000 distribution of persons aged 7years and above among agricultural households by level of education
Gender:MALE farmer status:-ALL
state/UT
no
per
-10
00
att
end
ed f
orm
al
trai
nin
g in
agr
icu
ltu
re
Per 1000 distribution of persons aged 7years and above among agricultural households by level of education
no of persons age 7years and above
no
t lit
erat
e
lite
rate
wit
ho
ut
form
al
trai
nin
g
lit. b
ut
bel
ow
pri
mar
y
pri
mar
y
mid
dle
seco
nd
ary
hig
her
sec
on
dar
y
dip
lom
a e
rtif
icat
e co
urs
e
grad
uat
e c
erti
fica
te c
ou
rse
po
st g
rad
uat
e an
d a
bo
ve
n.r
all
(in
c n
r )
per
10
00
per
son
s
estd
. (0
0)
sam
ple
(1) (2) (3) (4) (5) (6) (7) (8) (9) (10) (11) (12) (13) (14) (15) (16) (17)
Orissa 64 164 9 201 157 246 112 57 6 47 1 0 1000 885 88454 3822
estd. no.of hhs (00)
5692 14473 803 17798 13866 21779 9920 5000 573 4120 123 0 88454 X X X
sample no of hhs.
122 557 49 836 508 874 448 263 30 238 19 0 3822 X X X

84 Income, Expenditure, Productive Assests & Indebtedness of Agricultural Households in Odisha during the year January 2013-December 2013 (NSS 70th Round)
Table 1.14: Per 1000 distribution of persons aged 7years and above among agricultural households by level of education
Gender:FEMALE farmer status:-FARMER
state/UT
no
per
-10
00
att
end
ed f
orm
al
trai
nin
g in
agr
icu
ltu
re
Per 1000 distribution of persons aged 7years and above among agricultural households by level of education
no of persons age 7years and above
no
t lit
erat
e
lite
rate
wit
ho
ut
form
al
trai
nin
g
lit. b
ut
bel
ow
pri
mar
y
pri
mar
y
mid
dle
seco
nd
ary
hig
her
sec
on
dar
y
dip
lom
a e
rtif
icat
e co
urs
e
grad
uat
e c
erti
fica
te c
ou
rse
po
st g
rad
uat
e an
d a
bo
ve
n.r
all
(in
c n
r )
per
10
00
per
son
s
estd
. (0
0)
sam
ple
(1) (2) (3) (4) (5) (6) (7) (8) (9) (10) (11) (12) (13) (14) (15) (16) (17)
Orissa 25 700 8 122 48 109 5 7 0 0 0 0 1000 996 13941 592
estd. no.of hhs (00)
355 9752 117 1702 664 1524 73 103 0 6 0 0 13941 X X X
sample no of hhs.
11 334 4 108 44 85 10 6 0 1 0 0 592 X X X

85 Income, Expenditure, Productive Assests & Indebtedness of Agricultural Households in Odisha during the year January 2013-December 2013 (NSS 70th Round)
Table 1.14: Per 1000 distribution of persons aged 7years and above among agricultural households by level of education
Gender:FEMALE farmer status:- NON FARMER
state/UT
no
per
-10
00
att
end
ed f
orm
al
trai
nin
g in
agr
icu
ltu
re
Per 1000 distribution of persons aged 7years and above among agricultural households by level of education
no of persons age 7years and above
no
t lit
erat
e
lite
rate
wit
ho
ut
form
al
trai
nin
g
lit. b
ut
bel
ow
pri
mar
y
pri
mar
y
mid
dle
seco
nd
ary
hig
her
sec
on
dar
y
dip
lom
a e
rtif
icat
e co
urs
e
grad
uat
e c
erti
fica
te c
ou
rse
po
st g
rad
uat
e an
d a
bo
ve
n.r
all
(in
c n
r )
per
10
00
per
son
s
estd
. (0
0)
sam
ple
(1) (2) (3) (4) (5) (6) (7) (8) (9) (10) (11) (12) (13) (14) (15) (16) (17)
Orissa 1 256 8 237 123 230 76 53 1 15 0 0 1000 886 73227 2935
estd. No of hhs (00)
107 18716 617 17378 9017 16818 5574 3897 106 1103 1 0 73227 X X X
sample no of hhs.
6 787 34 653 332 575 289 163 6 95 1 0 2935 X X X

86 Income, Expenditure, Productive Assests & Indebtedness of Agricultural Households in Odisha during the year January 2013-December 2013 (NSS 70th Round)
Table 1.14: Per 1000 distribution of persons aged 7years and above among agricultural households by level of education
Gender:FEMALE farmer status:- ALL
state/UT
no
per
-10
00
att
end
ed f
orm
al
trai
nin
g in
agr
icu
ltu
re
Per 1000 distribution of persons aged 7years and above among agricultural households by level of education
no of persons age 7years and above
no
t lit
erat
e
lite
rate
wit
ho
ut
form
al t
rain
ing
lit. b
ut
bel
ow
pri
mar
y
pri
mar
y
mid
dle
seco
nd
ary
hig
her
sec
on
dar
y
dip
lom
a e
rtif
icat
e co
urs
e
grad
uat
e c
erti
fica
te c
ou
rse
po
st g
rad
uat
e an
d a
bo
ve
n.r
all
(in
c n
r )
per
10
00
per
son
s
estd
. (0
0)
sam
ple
(1) (2) (3) (4) (5) (6) (7) (8) (9) (10) (11) (12) (13) (14) (15) (16) (17)
Orissa 5 327 8 219 111 210 65 46 1 13 0 0 1000 902 87168 3527
estd. No of hhs (00).
462 28469 734 19080 9681 18342 5646 4000 106 1109 1 0 87168 X X X
sample no of hhs.
17 1121 38 761 376 660 299 169 6 96 1 0 3527 X X X

87 Income, Expenditure, Productive Assests & Indebtedness of Agricultural Households in Odisha during the year January 2013-December 2013 (NSS 70th Round)
Table 1.14: Per 1000 distribution of persons aged 7years and above among agricultural households by level of education
Gender:ALL farmer status:- FARMER
state/UT
no
per
-10
00
att
end
ed f
orm
al t
rain
ing
in a
gric
ult
ure
Per 1000 distribution of persons aged 7years and above among agricultural households by level of education
no of persons age 7years and above
no
t lit
erat
e
lite
rate
wit
ho
ut
form
al t
rain
ing
lit. b
ut
bel
ow
pri
mar
y
pri
mar
y
mid
dle
seco
nd
ary
hig
her
sec
on
dar
y
dip
lom
a e
rtif
icat
e co
urs
e
grad
uat
e c
erti
fica
te c
ou
rse
po
st g
rad
uat
e an
d a
bo
ve
n.r
all
(in
c n
r )
per
10
00
per
son
s
estd
. (0
0)
sam
ple
(1) (2) (3) (4) (5) (6) (7) (8) (9) (10) (11) (12) (13) (14) (15) (16) (17)
Orissa 90 321 13 166 119 241 79 30 4 26 1 0 1000 999 66209 2795
estd. No of hhs (00).
5929 21253 829 11017 7895 15929 5208 1990 263 1750 73 0 66209 X X X
sample no of hhs.
130 753 41 514 329 653 261 111 11 111 11 0 2795 X X X

88 Income, Expenditure, Productive Assests & Indebtedness of Agricultural Households in Odisha during the year January 2013-December 2013 (NSS 70th Round)
Table 1.14: Per 1000 distribution of persons aged 7years and above among agricultural households by level of education
Gender:ALL farmer status:-NON FARMER
state/UT
no
per
-10
00
att
end
ed f
orm
al t
rain
ing
in
agri
cult
ure
Per 1000 distribution of persons aged 7years and above among agricultural households by level of education
no of persons age 7years and above
no
t lit
erat
e
lite
rate
wit
ho
ut
form
al t
rain
ing
lit. b
ut
bel
ow
pri
mar
y
pri
mar
y
mid
dle
seco
nd
ary
hig
her
sec
on
dar
y
dip
lom
a e
rtif
icat
e co
urs
e
grad
uat
e c
erti
fica
te c
ou
rse
po
st g
rad
uat
e an
d a
bo
ve
n.r
all
(in
c n
r )
per
10
00
per
son
s
estd
. (0
0)
sam
ple
(1) (2) (3) (4) (5) (6) (7) (8) (9) (10) (11) (12) (13) (14) (15) (16) (17)
Orissa 2 198 6 236 143 221 95 64 4 32 0 0 1000 839 109414 4554
estd. no.of hhs (00)
225 21688 707 25862 15652 24192 10358 7009 415 3479 51 0 109414 X X X
sample no of hhs.
9 925 46 1083 555 881 486 321 25 223 9 0 4554 X X X

89 Income, Expenditure, Productive Assests & Indebtedness of Agricultural Households in Odisha during the year January 2013-December 2013 (NSS 70th Round)
Table 1.14: Per 1000 distribution of persons aged 7years and above among agricultural households by level of education
Gender:ALL farmer status:-ALL
state/UT n
o p
er-1
00
0 a
tten
ded
fo
rmal
tra
inin
g in
agr
icu
ltu
re
Per 1000 distribution of persons aged 7years and above among agricultural households by level of education
no of persons age 7years and above
no
t lit
erat
e
lite
rate
wit
ho
ut
form
al t
rain
ing
lit. b
ut
bel
ow
pri
mar
y
pri
mar
y
mid
dle
seco
nd
ary
hig
her
sec
on
dar
y
dip
lom
a e
rtif
icat
e co
urs
e
grad
uat
e c
erti
fica
te c
ou
rse
po
st g
rad
uat
e an
d a
bo
ve
n.r
all
(in
c n
r )
per
10
00
per
son
s
estd
. (0
0)
sam
ple
(1) (2) (3) (4) (5) (6) (7) (8) (9) (10) (11) (12) (13) (14) (15) (16) (17)
Orissa 35 245 9 210 134 228 89 51 4 30 1 0 1000 893 175622 7349
estd. no.ofhhs (00)
6154 42941 1537 36878 23547 40121 15566 9000 678 5229 124 0 175622 X X X
sample no of hhs.
139 1678 87 1597 884 1534 747 432 36 334 20 0 7349 X X X

90 Income, Expenditure, Productive Assests & Indebtedness of Agricultural Households in Odisha during the year January 2013-December 2013 (NSS 70th Round)
Table 3.3: Average monthly income and consumption ( in Rs) expenditure per agricultural household by state for each decile class of MPCE
STATE-- ODISHA social Group --S T Season: july-dec-2012
MPCE income from
wages
net receipt from purchase and sale
of productive assets
net receipt from culti-
vation
net receipt from farming
of animals
net receipt from non-
farm business
total income
total consumption expenditure
Agricultural household
estd(00) sample
(1) (2) (3) (4) (5) (6) (7) (8) (9) (10)
1 100.27 14.57 4962.37 19.28 0 5081.93 1991.88 1723 62
2 316.31 19.34 2860.74 -51.96 0 3125.09 2670.02 2494 82
3 592.62 43.59 2227.32 -273.99 64.09 2610.05 2909.38 2431 77
4 524.06 60.95 2078.93 281.06 5.62 2889.67 3312.31 1830 78
5 137.6 191.82 4978.63 -108.67 257.72 5265.28 3229.24 1412 54
6 2098.01 114.84 2974.53 18.07 12.38 5102.99 3942.28 1011 55
7 753.39 62.59 27746.58 95.22 159.92 28755.11 3811.96 901 47
8 182.15 561.21 5034.54 4.97 675.48 5897.13 5484.42 1473 63
9 3288.85 245.53 4124.62 -74.97 0 7338.51 5274.06 479 30
10 84.06 2994.72 1778.07 136.3 0 1998.43 4985.81 258 11
ALL 586.59 174.94 4981.1 -20.76 120.01 5666.94 3361.05 14010 559
Estd no of hhs (00)
6789 2126 4593 1707 390 11173 14010 XXXXX XXXX
sample no of hhs
164 297 503 111 15 554 559 XXXXX XXXX
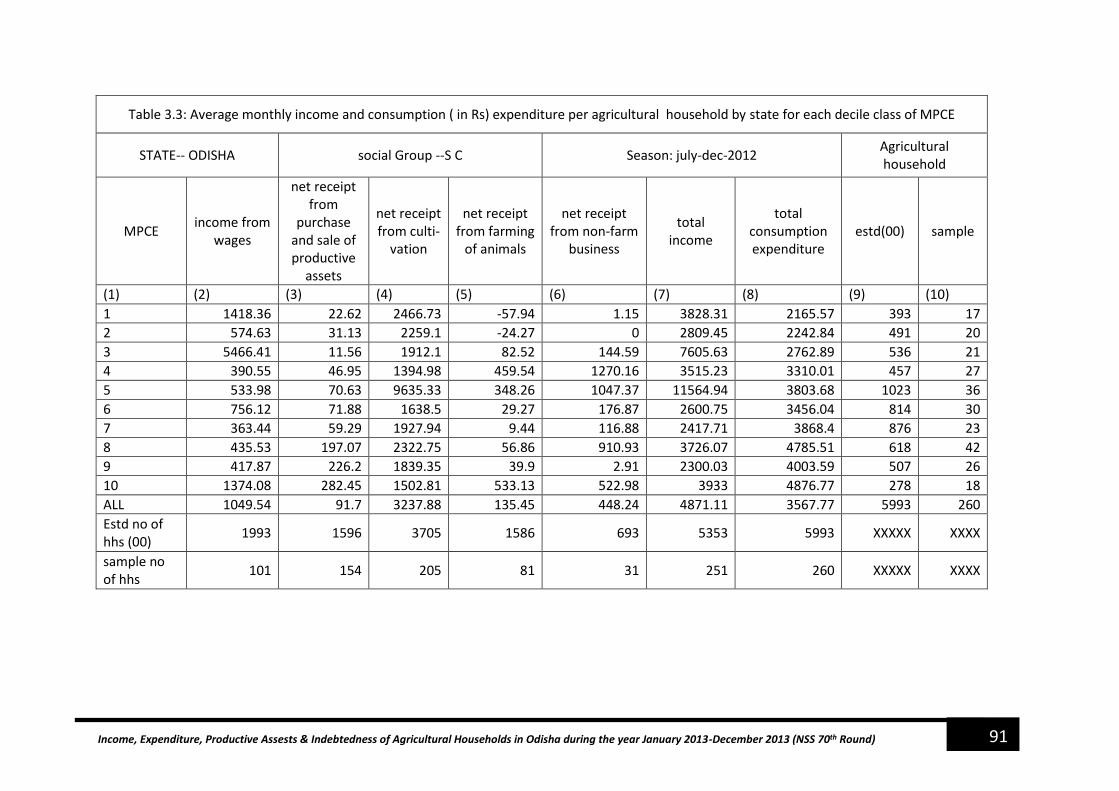
91 Income, Expenditure, Productive Assests & Indebtedness of Agricultural Households in Odisha during the year January 2013-December 2013 (NSS 70th Round)
Table 3.3: Average monthly income and consumption ( in Rs) expenditure per agricultural household by state for each decile class of MPCE
STATE-- ODISHA social Group --S C Season: july-dec-2012 Agricultural household
MPCE income from
wages
net receipt from
purchase and sale of productive
assets
net receipt from culti-
vation
net receipt from farming
of animals
net receipt from non-farm
business
total income
total consumption expenditure
estd(00) sample
(1) (2) (3) (4) (5) (6) (7) (8) (9) (10)
1 1418.36 22.62 2466.73 -57.94 1.15 3828.31 2165.57 393 17
2 574.63 31.13 2259.1 -24.27 0 2809.45 2242.84 491 20
3 5466.41 11.56 1912.1 82.52 144.59 7605.63 2762.89 536 21
4 390.55 46.95 1394.98 459.54 1270.16 3515.23 3310.01 457 27
5 533.98 70.63 9635.33 348.26 1047.37 11564.94 3803.68 1023 36
6 756.12 71.88 1638.5 29.27 176.87 2600.75 3456.04 814 30
7 363.44 59.29 1927.94 9.44 116.88 2417.71 3868.4 876 23
8 435.53 197.07 2322.75 56.86 910.93 3726.07 4785.51 618 42
9 417.87 226.2 1839.35 39.9 2.91 2300.03 4003.59 507 26
10 1374.08 282.45 1502.81 533.13 522.98 3933 4876.77 278 18
ALL 1049.54 91.7 3237.88 135.45 448.24 4871.11 3567.77 5993 260
Estd no of hhs (00)
1993 1596 3705 1586 693 5353 5993 XXXXX XXXX
sample no of hhs
101 154 205 81 31 251 260 XXXXX XXXX

92 Income, Expenditure, Productive Assests & Indebtedness of Agricultural Households in Odisha during the year January 2013-December 2013 (NSS 70th Round)
Table 3.3: Average monthly income and consumption ( in Rs) expenditure per agricultural household by state for each decile class of MPCE
STATE-- ODISHA social Group --O B C Season: july-dec-2012 Agricultural household
MPCE income from
wages
net receipt from
purchase and sale of productive
assets
net receipt from culti-
vation
net receipt from farming
of animals
net receipt from non-farm
business total income
total consumption expenditure
estd(00) sample
(1) (2) (3) (4) (5) (6) (7) (8) (9) (10)
1 390.2 155.06 811.05 390.9 2298.68 3890.84 2362.87 1108 25
2 422.8 33.73 2897.94 235.57 0 3556.31 2164.48 444 27
3 184.66 152.83 3720.45 89.48 86.39 4080.98 2495.51 618 25
4 542.15 89.57 1903.55 -31.2 162.52 2577.02 3549.21 944 46
5 673.49 347.24 2587.79 -72.42 2490.59 5679.45 3538.92 1178 49
6 712.95 142.92 2051.47 136.5 378.1 3279.03 4342.49 2087 62
7 938.69 319.59 2351.94 -356.97 662.57 3596.23 5308.11 2137 75
8 1276.21 144.49 3623.79 -153.79 675.8 5422.01 4704.43 1840 82
9 422.73 463.75 14885.71 179.92 6467.06 21955.43 6243.46 2249 81
10 2930.16 718.03 2410.38 342.35 1665.87 7348.75 8195.77 1164 56
ALL 889.1 283.28 4473.01 37.78 1860.64 7260.53 4741.37 13768 528
Estd no of hhs (00)
3739 3641 7916 3455 2803 11946 13768 XXXXX XXXX
sample no of hhs
137 314 454 194 72 511 528 XXXXX XXXX

93 Income, Expenditure, Productive Assests & Indebtedness of Agricultural Households in Odisha during the year January 2013-December 2013 (NSS 70th Round)
Table 3.3: Average monthly income and consumption ( in Rs) expenditure per agricultural household by state for each decile class of MPCE
STATE-- ODISHA social Group --OTHERS Season: july-dec-2012 Agricultural household
MPCE income from
wages
net receipt from
purchase and sale of productive
assets
net receipt from culti-
vation
net receipt from farming
of animals
net receipt from non-farm
business total income
total consumption expenditure
estd(00) sample
(1) (2) (3) (4) (5) (6) (7) (8) (9) (10)
1 1385.94 50.48 1889.55 -104.8 0 3170.7 2327.91 160 7
2 25.24 3.98 -715.53 1007.02 22.75 339.48 2989.06 231 5
3 386.56 47.87 85.3 -109.75 0 362.11 2796.56 592 13
4 2626.57 47.49 2016.52 -148.48 7.53 4502.15 3396.15 785 29
5 3211.92 26.03 1104.13 42.71 92.03 4450.79 3158.81 886 22
6 1253.7 13.33 1742.83 -204.2 78.79 2871.12 3967.33 684 21
7 1111.03 415.57 3471.06 10.81 544.57 5137.47 4924.9 435 30
8 2818.03 138.38 5001.47 210.19 7.35 8037.04 3881.59 1014 32
9 597.95 188.59 812.11 191.65 435.11 2036.82 6335.22 1418 45
10 472.68 1288.72 2019.41 365.3 1479.96 4337.35 10050.11 3741 118
ALL 1224.55 554.67 1933.29 179.82 658.04 3995.7 6390.28 9946 322
Estd no of hhs (00)
2260 2649 7177 3769 1600 8674 9946 XXXXX XXXX
sample no of hhs
90 176 300 99 36 314 322 XXXXX XXXX

94 Income, Expenditure, Productive Assests & Indebtedness of Agricultural Households in Odisha during the year January 2013-December 2013 (NSS 70th Round)
Table 3.3: Average monthly income and consumption ( in Rs) expenditure per agricultural household by state for each decile class of MPCE
STATE-- ODISHA social Group -ALL Season: july-dec-2012 Agricultural household
MPCE income from
wages
net receipt from
purchase and sale of productive
assets
net receipt from culti-
vation
net receipt from farming
of animals
net receipt from non-farm
business total income
total consumption expenditure
estd(00) sample
(1) (2) (3) (4) (5) (6) (7) (8) (9) (10)
1 409.15 63.2 3167.99 126.11 752.71 4455.96 2149.41 3384 111
2 345.55 21.7 2558.96 53.41 1.43 2959.35 2571.49 3660 134
3 1128.23 56.25 2104.22 -151.21 68.63 3149.88 2813.37 4176 136
4 924.11 63.45 1947.61 144.01 186.88 3202.61 3384.13 4017 180
5 973.75 172.29 4648.03 34.53 989.11 6645.42 3427.03 4499 161
6 1105.68 104.87 2135.39 40.75 217.49 3499.31 4041.69 4596 168
7 801.7 223.53 7639.48 -152.72 436.74 8725.2 4669.9 4349 175
8 1161.41 273.94 4163.89 -5.54 568.02 5887.79 4778.17 4944 219
9 770.42 331.56 8068.18 142.02 3259.23 12239.86 5927.71 4652 182
10 1025.84 1196.1 2065.12 358.12 1400.55 4849.63 9148.66 5442 203
ALL 890.47 284.04 3888.69 64.73 835.6 5679.49 4513.29 43718 1669
Estd no of hhs (00)
14781 10011 23391 10517 5485 37146 43718 XXXXX XXXX
sample no hhs
492 941 1462 485 154 1630 1669 XXXXX XXXX

95 Income, Expenditure, Productive Assests & Indebtedness of Agricultural Households in Odisha during the year January 2013-December 2013 (NSS 70th Round)
Table 3.3: Average monthly income and consumption ( in Rs) expenditure per agricultural household by state for each decile class of MPCE
STATE-- ODISHA social Group --S T Season: jan--june - 2013 Agricultural household
MPCE income
from wages
net receipt from purchase
and sale of productive
assets
net receipt from culti-
vation
net receipt from
farming of animals
net receipt from non-
farm business
total income total
consumption expenditure
estd(00) sample
(1) (2) (3) (4) (5) (6) (7) (8) (9) (10)
1 1123.63 0.68 1977.77 -10.98 0 3090.43 2119.9 1723 62
2 1109.91 31.5 1340.76 -1.5 0 2449.17 2896.45 2494 82
3 601.54 33.12 690.43 -59.12 33.44 1266.3 3020.92 2431 77
4 1177.96 55.36 323.14 32.69 3.3 1537.09 3271.94 1830 78
5 248.44 18.84 2428.73 9.1 293.23 2979.51 3407.24 1412 54
6 2327.2 15.74 822.01 48.74 11.43 3209.37 3806.19 1011 55
7 716.91 20.94 1375.46 15.2 0 2107.57 3778.04 901 47
8 259.73 25.41 512.36 -3.78 958.62 1726.93 6010.93 1473 63
9 3428.9 42.71 44361.33 155.97 0 47946.19 5926.63 479 30
10 58.76 3.73 707.36 0 0 766.12 5668.37 258 11
ALL 978.49 27.25 2618.54 2.74 137.37 3737.13 3527.32 14010 559
Estd no of hh (00)
6789 2126 4593 1707 390 11173 14010 XXXXX XXXX
sample no hhs
226 89 249 93 12 461 559 XXXXX XXXX

96 Income, Expenditure, Productive Assests & Indebtedness of Agricultural Households in Odisha during the year January 2013-December 2013 (NSS 70th Round)
Table 3.3: Average monthly income and consumption ( in Rs) expenditure per agricultural household by state for each decile class of MPCE
STATE-- ODISHA social Group --S C Season: jan--june - 2013 Agricultural household
MPCE income
from wages
net receipt from
purchase and sale of
productive assets
net receipt from culti-
vation
net receipt from farming
of animals
net receipt
from non-farm
business
total income total
consumption expenditure
estd(00) sample
(1) (2) (3) (4) (5) (6) (7) (8) (9) (10)
1 903.91 2.02 9027.35 -85.97 7.5 9852.79 2185.06 393 17
2 640.91 16.56 6694.35 -123.9 0 7211.35 2230.39 491 20
3 4442.41 5.7 3505.04 -29.92 262.55 8180.08 3010.11 536 21
4 297.09 15.43 229.97 517.85 1204.74 2249.65 3828.58 457 27
5 686.59 33.65 2757.69 144.16 390.99 3979.43 4103.52 1023 36
6 699.71 53.69 673.05 -295.32 157.55 1234.99 3828.84 814 30
7 800.81 135.47 894.15 21.54 1121.46 2837.96 3951.34 876 23
8 946.35 80.67 1439.9 202.96 1732.13 4321.34 5559.97 618 42
9 408.32 197.57 1446.38 67.19 7.17 1929.05 4466.44 507 26
10 1424.23 350.95 688.26 427.91 296.97 2837.37 5550.9 278 18
ALL 1059.05 77.34 2467.53 55.2 560.9 4142.67 3893.92 5993 260
Estd no of hhs (00)
1993 1596 3705 1586 693 5353 5993 XXXXX XXXX
sample no of hhs
99 57 130 90 26 227 260 XXXXX XXXX
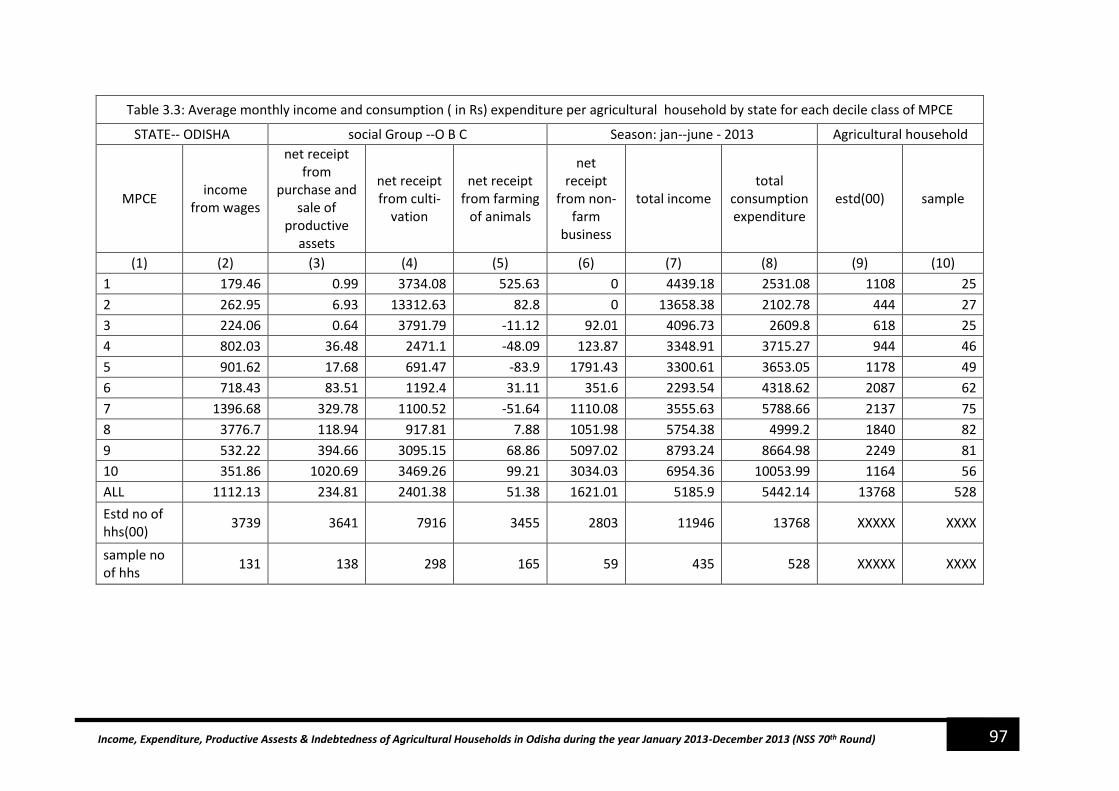
97 Income, Expenditure, Productive Assests & Indebtedness of Agricultural Households in Odisha during the year January 2013-December 2013 (NSS 70th Round)
Table 3.3: Average monthly income and consumption ( in Rs) expenditure per agricultural household by state for each decile class of MPCE
STATE-- ODISHA social Group --O B C Season: jan--june - 2013 Agricultural household
MPCE income
from wages
net receipt from
purchase and sale of
productive assets
net receipt from culti-
vation
net receipt from farming
of animals
net receipt
from non-farm
business
total income total
consumption expenditure
estd(00) sample
(1) (2) (3) (4) (5) (6) (7) (8) (9) (10)
1 179.46 0.99 3734.08 525.63 0 4439.18 2531.08 1108 25
2 262.95 6.93 13312.63 82.8 0 13658.38 2102.78 444 27
3 224.06 0.64 3791.79 -11.12 92.01 4096.73 2609.8 618 25
4 802.03 36.48 2471.1 -48.09 123.87 3348.91 3715.27 944 46
5 901.62 17.68 691.47 -83.9 1791.43 3300.61 3653.05 1178 49
6 718.43 83.51 1192.4 31.11 351.6 2293.54 4318.62 2087 62
7 1396.68 329.78 1100.52 -51.64 1110.08 3555.63 5788.66 2137 75
8 3776.7 118.94 917.81 7.88 1051.98 5754.38 4999.2 1840 82
9 532.22 394.66 3095.15 68.86 5097.02 8793.24 8664.98 2249 81
10 351.86 1020.69 3469.26 99.21 3034.03 6954.36 10053.99 1164 56
ALL 1112.13 234.81 2401.38 51.38 1621.01 5185.9 5442.14 13768 528
Estd no of hhs(00)
3739 3641 7916 3455 2803 11946 13768 XXXXX XXXX
sample no of hhs
131 138 298 165 59 435 528 XXXXX XXXX

98 Income, Expenditure, Productive Assests & Indebtedness of Agricultural Households in Odisha during the year January 2013-December 2013 (NSS 70th Round)
Table 3.3: Average monthly income and consumption ( in Rs) expenditure per agricultural household by state for each decile class of MPCE
STATE-- ODISHA social Group --OTHERS Season: jan--june - 2013 Agricultural household
MPCE income
from wages
net receipt from
purchase and sale of
productive assets
net receipt from culti-
vation
net receipt from farming
of animals
net receipt
from non-farm
business
total income total
consumption expenditure
estd(00) sample
(1) (2) (3) (4) (5) (6) (7) (8) (9) (10)
1 1058.92 5.16 683.88 -18.78 0 1724.01 2819.37 160 7
2 1613.16 0.11 5111.2 1367.94 22.75 8115.05 3143.76 231 5
3 2110.69 52.11 6098.25 -94.59 0 8114.35 3341.21 592 13
4 1739.42 7.82 1077.08 -237.8 0 2578.7 3404.15 785 29
5 1941.79 194.09 1275.34 65.4 92.05 3374.57 3832.56 886 22
6 1153.54 4.79 517.21 -100.71 51.97 1622.02 4194.15 684 21
7 1380.48 11.71 820.12 -67.64 432.49 2565.45 4879.71 435 30
8 3068.68 135.59 1222.98 597.24 381.06 5269.95 4487.11 1014 32
9 248.21 225.02 1737.99 193.82 6201.06 8381.07 7369.91 1418 45
10 515.55 651.29 3094.36 -132.06 1701.52 5179.37 11295.53 3741 118
ALL 1172.2 312.83 2298.93 41.81 1594.1 5107.04 7186.18 9946 322
Estd no of hhs(00)
2260 2649 7177 3769 1600 8674 9946 XXXXX XXXX
sample no of hhs
97 88 202 89 35 272 322 XXXXX XXXX

99 Income, Expenditure, Productive Assests & Indebtedness of Agricultural Households in Odisha during the year January 2013-December 2013 (NSS 70th Round)
Table 3.3: Average monthly income and consumption ( in Rs) expenditure per agricultural household by state for each decile class of MPCE
STATE-- ODISHA social Group --ALL Season: jan--june - 2013 Agricultural household
MPCE income
from wages
net receipt from
purchase and sale of
productive assets
net receipt from culti-
vation
net receipt from farming
of animals
net receipt
from non-farm
business
total income total
consumption expenditure
estd(00) sample
(1) (2) (3) (4) (5) (6) (7) (8) (9) (10)
1 785.92 1.15 3311.11 155.62 0.87 4253.52 2295.14 3384 111
2 975.97 24.54 3749.08 78.65 1.43 4805.14 2726.38 3660 134
3 1252.24 27.49 2276.69 -53.3 66.76 3542.39 3004.1 4176 136
4 1099.03 37.08 964.85 16.08 167.82 2247.77 3465.39 4017 180
5 852.69 56.43 1821.48 26.55 668.01 3368.73 3713.69 4499 161
6 1133.67 51.61 918.48 -42.43 197.83 2207.55 4100.69 4596 168
7 1134.24 194.85 1087.87 -24.66 814.62 3012.07 4911.21 4349 175
8 2230.2 89.71 924.87 149.63 971.6 4276.3 5265.64 4944 219
9 730.12 285.28 6746.66 115.72 4354.75 11947.25 7531.22 4652 182
10 505.39 684.19 2938.17 -47.69 1833.85 5229.73 10469.18 5442 203
ALL 1075.69 164.46 2456.73 34.14 994.11 4560.67 5013.06 43718 1669
Estd no of hhs (00)
14781 10011 23391 10517 5485 37146 43718 XXXXX XXXX
sample no of hhs
553 372 879 437 132 1395 1669 XXXXX XXXX

100 Income, Expenditure, Productive Assests & Indebtedness of Agricultural Households in Odisha during the year January 2013-December 2013 (NSS 70th Round)
Table 3.3: Average monthly income and consumption ( in Rs) expenditure per agricultural household by state for each decile class of MPCE
STATE-- ODISHA social Group --S T Season: Combined Agricultural household
MPCE income
from wages
net receipt from
purchase and sale of productive
assets
net receipt from culti-
vation
net receipt from farming of
animals
net receipt from non-farm
business
total income
total consumption expenditure
estd(00) sample
(1) (2) (3) (4) (5) (6) (7) (8) (9) (10)
1 611.95 7.63 3470.07 6.67 0 4088.7 2045.22 1723 62
2 713.11 25.42 2100.75 -30.94 0 2782.92 2764.37 2494 82
3 597.08 38.35 1458.87 -184.46 51.32 1922.82 2955.85 2431 77
4 851.01 58.16 1201.03 177.57 4.65 2234.27 3295.49 1830 78
5 193.02 105.33 3703.68 -59.6 272.52 4109.62 3303.41 1412 54
6 2212.6 65.29 1898.27 30.85 11.98 4153.71 3885.58 1011 55
7 735.15 41.76 14561.02 61.88 93.29 15451.33 3797.82 901 47
8 220.94 293.31 2773.45 1.32 793.45 3789.16 5703.8 1473 63
9 3358.87 144.12 24242.98 21.25 0 27623.11 5545.97 479 30
10 71.41 1499.23 1242.71 79.51 0 1393.63 5270.21 258 11
ALL 782.54 101.09 3799.82 -10.97 127.24 4698.63 3430.33 14010 559
Estd no of hhs (00)
7753 7079 13724 2342 504 13976 14010 XXXXX XXXX
sample no of hhs
250 307 514 137 18 558 559 XXXXX XXXX

101 Income, Expenditure, Productive Assests & Indebtedness of Agricultural Households in Odisha during the year January 2013-December 2013 (NSS 70th Round)
Table 3.3: Average monthly income and consumption ( in Rs) expenditure per agricultural household by state for each decile class of MPCE
STATE-- ODISHA social Group --S C Season: Combined Agricultural household
MPCE income from
wages
net receipt from
purchase and sale of productive
assets
net receipt from culti-
vation
net receipt from farming of
animals
net receipt from non-farm business
total income
total consumption expenditure
estd(00) sample
(1) (2) (3) (4) (5) (6) (7) (8) (9) (10)
1 1161.13 12.32 5747.04 -69.62 3.8 6842.36 2173.69 393 17
2 607.77 23.85 4476.72 -65.78 0 5018.7 2237.65 491 20
3 4954.41 8.63 2708.57 35.67 193.74 7892.39 2865.9 536 21
4 343.82 31.19 812.48 483.84 1242.9 2883.03 3526.08 457 27
5 610.28 52.14 6196.51 263.22 773.88 7843.89 3928.61 1023 36
6 727.91 62.78 1155.77 -105.98 168.82 1946.52 3611.37 814 30
7 582.13 97.38 1411.04 14.48 535.46 2543.11 3902.96 876 23
8 690.94 138.87 1881.33 117.73 1253.1 3943.09 5108.2 618 42
9 413.09 211.89 1642.87 51.27 4.68 2111.91 4196.44 507 26
10 1399.15 316.7 1095.53 489.29 428.81 3412.79 5157.66 278 18
ALL 1054.3 84.52 2852.7 102.01 495.18 4504.19 3703.67 5993 260
Estd no of hhs (00)
2327 3820 5340 1689 1104 5959 5993 XXXXX XXXX
sample no of hhs
119 160 214 97 35 256 260 XXXXX XXXX

102 Income, Expenditure, Productive Assests & Indebtedness of Agricultural Households in Odisha during the year January 2013-December 2013 (NSS 70th Round)
Table 3.3: Average monthly income and consumption ( in Rs) expenditure per agricultural household by state for each decile class of MPCE
STATE-- ODISHA social Group --O B C Season: Combined Agricultural household
MPCE income
from wages
net receipt from
purchase and sale of productive
assets
net receipt from culti-
vation
net receipt from farming of
animals
net receipt from non-farm
business
total income
total consumption expenditure
estd(00) sample
(1) (2) (3) (4) (5) (6) (7) (8) (9) (10)
1 284.83 78.02 2272.57 447.04 1340.9 4345.34 2432.96 1108 25
2 342.87 20.33 8105.29 171.92 0 8620.08 2138.77 444 27
3 204.36 76.74 3756.12 47.56 88.73 4096.77 2543.13 618 25
4 672.09 63.02 2187.32 -38.23 146.42 2967.59 3618.4 944 46
5 787.56 182.46 1639.63 -77.2 2199.27 4549.25 3586.48 1178 49
6 715.69 113.21 1621.94 92.59 367.06 2797.28 4332.54 2087 62
7 1167.69 324.68 1726.23 -229.75 849.03 3513.19 5508.34 2137 75
8 2526.46 131.71 2270.8 -86.43 832.54 5543.37 4827.25 1840 82
9 477.47 429.2 8990.43 133.64 5896.21 15497.76 7252.43 2249 81
10 1641.01 869.36 2939.82 241.04 2235.93 7057.8 8970.03 1164 56
ALL 1000.61 259.05 3437.19 43.44 1760.79 6242.05 5033.36 13768 528
Estd no of hhs (00)
4152 9939 13060 5182 3514 13617 13768 XXXXX XXXX
sample no of hhs
154 337 486 218 80 523 528 XXXXX XXXX

103 Income, Expenditure, Productive Assests & Indebtedness of Agricultural Households in Odisha during the year January 2013-December 2013 (NSS 70th Round)
Table 3.3: Average monthly income and consumption ( in Rs) expenditure per agricultural household by state for each decile class of MPCE
STATE-- ODISHA social Group --OTHERS Season: Combined Agricultural household
MPCE income
from wages
net receipt from
purchase and sale of productive
assets
net receipt from culti-
vation
net receipt from farming of
animals
net receipt from non-farm business
total income
total consumption expenditure
estd(00) sample
(1) (2) (3) (4) (5) (6) (7) (8) (9) (10)
1 1222.43 27.82 1286.72 -68.96 0 2440.19 2532.68 160 7
2 819.2 2.05 2197.84 1157.4 22.75 4197.19 3053.52 231 5
3 1248.63 49.99 3091.77 -103.43 0 4236.97 3023.5 592 13
4 2182.99 27.65 1546.8 -185.69 4.39 3548.49 3399.48 785 29
5 2576.86 110.06 1189.73 52.16 92.04 3910.79 3439.54 886 22
6 1203.62 9.06 1130.02 -161.08 67.62 2240.18 4061.84 684 21
7 1245.76 213.64 2145.59 -21.87 497.87 3867.34 4906.07 435 30
8 2943.35 136.98 3112.22 371.46 163.06 6590.1 4133.89 1014 32
9 423.08 206.8 1275.05 192.55 2837.59 4728.27 6766.34 1418 45
10 494.11 970 2556.89 158.07 1572.28 4781.34 10569.03 3741 118
ALL 1198.37 433.75 2116.11 122.31 1048.07 4484.87 6721.91 9946 322
Estd no of hhs (00)
2409 5583 9755 3980 1667 9927 9946 XXXXX XXXX
sample no of hhs
109 191 312 111 42 321 322 XXXXX XXXX

104 Income, Expenditure, Productive Assests & Indebtedness of Agricultural Households in Odisha during the year January 2013-December 2013 (NSS 70th Round)
Table 3.3: Average monthly income and consumption ( in Rs) expenditure per agricultural household by state for each decile class of MPCE
STATE-- ODISHA social Group -ALL Season: Combined Agricultural household
MPCE income
from wages
net receipt from
purchase and sale of productive
assets
net receipt from culti-
vation
net receipt from farming of
animals
net receipt from non-farm
business
total income
total consumption expenditure
estd(00) sample
(1) (2) (3) (4) (5) (6) (7) (8) (9) (10)
1 597.53 32.17 3239.55 138.41 439.44 4414.94 2210.13 3384 111
2 660.76 23.12 3154.02 63.93 1.43 3880.14 2636.03 3660 134
3 1190.24 41.87 2190.46 -110.41 67.85 3338.13 2892.84 4176 136
4 1011.57 50.27 1456.23 90.71 178.94 2737.44 3417.99 4017 180
5 913.22 114.36 3234.76 31.21 855.32 5034.5 3546.47 4499 161
6 1119.67 78.24 1526.94 6.09 209.3 2862 4066.27 4596 168
7 967.97 209.19 4363.68 -99.36 594.19 5826.48 4770.44 4349 175
8 1695.8 181.82 2544.38 59.12 736.18 5035.48 4981.28 4944 219
9 750.27 308.42 7407.42 131.06 3715.7 12004.45 6595.84 4652 182
10 765.62 940.15 2501.65 189.03 1581.09 5037.39 9698.88 5442 203
ALL 983.08 224.25 3172.71 51.98 901.65 5109.42 4721.53 43718 1669
Estd no of hhs (00)
16641 26421 41879 13194 6790 43479 43718 XXXXX XXXX
sample no of hhs
632 995 1526 563 175 1658 1669 XXXXX XXXX
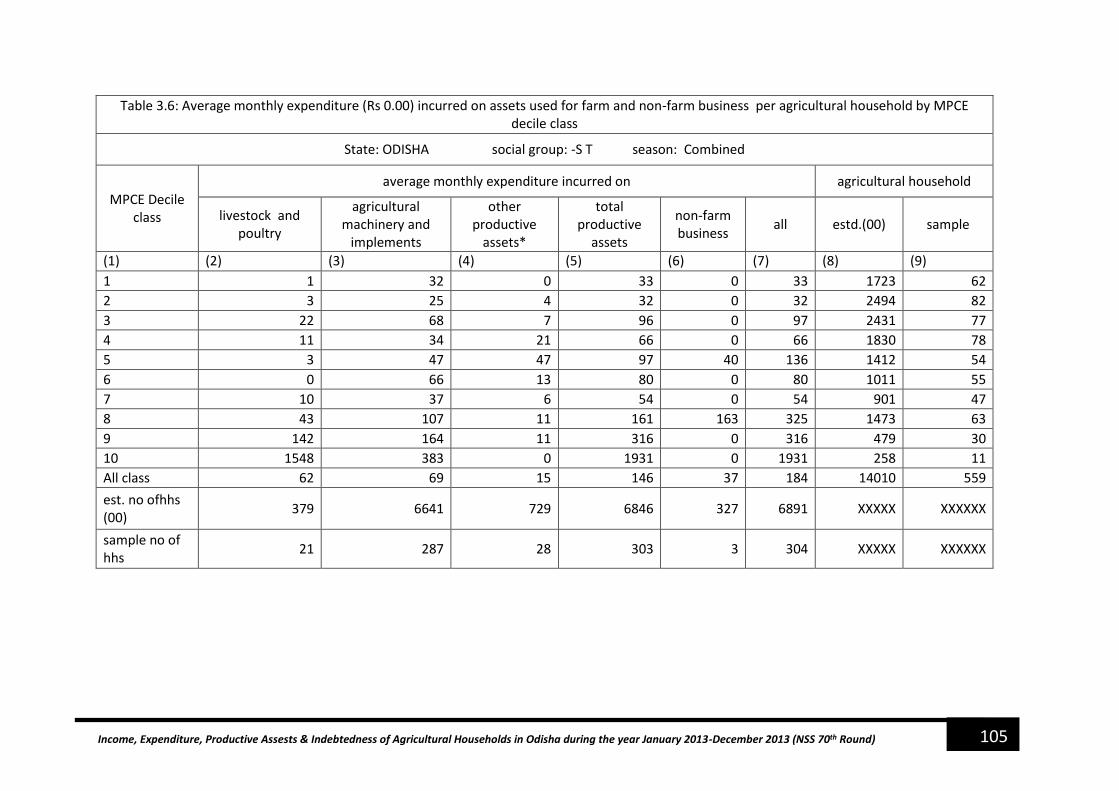
105 Income, Expenditure, Productive Assests & Indebtedness of Agricultural Households in Odisha during the year January 2013-December 2013 (NSS 70th Round)
Table 3.6: Average monthly expenditure (Rs 0.00) incurred on assets used for farm and non-farm business per agricultural household by MPCE decile class
State: ODISHA social group: -S T season: Combined
MPCE Decile class
average monthly expenditure incurred on agricultural household
livestock and poultry
agricultural machinery and
implements
other productive
assets*
total productive
assets
non-farm business
all estd.(00) sample
(1) (2) (3) (4) (5) (6) (7) (8) (9)
1 1 32 0 33 0 33 1723 62
2 3 25 4 32 0 32 2494 82
3 22 68 7 96 0 97 2431 77
4 11 34 21 66 0 66 1830 78
5 3 47 47 97 40 136 1412 54
6 0 66 13 80 0 80 1011 55
7 10 37 6 54 0 54 901 47
8 43 107 11 161 163 325 1473 63
9 142 164 11 316 0 316 479 30
10 1548 383 0 1931 0 1931 258 11
All class 62 69 15 146 37 184 14010 559
est. no ofhhs (00)
379 6641 729 6846 327 6891 XXXXX XXXXXX
sample no of hhs
21 287 28 303 3 304 XXXXX XXXXXX
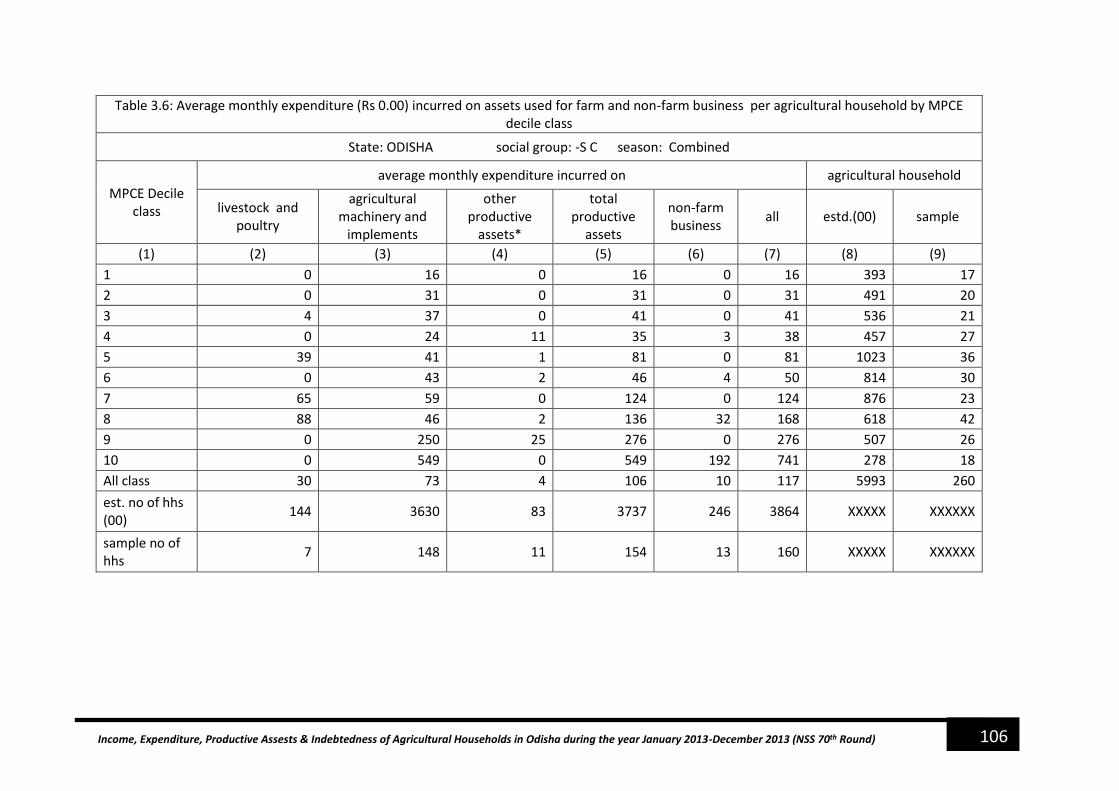
106 Income, Expenditure, Productive Assests & Indebtedness of Agricultural Households in Odisha during the year January 2013-December 2013 (NSS 70th Round)
Table 3.6: Average monthly expenditure (Rs 0.00) incurred on assets used for farm and non-farm business per agricultural household by MPCE decile class
State: ODISHA social group: -S C season: Combined
MPCE Decile class
average monthly expenditure incurred on agricultural household
livestock and poultry
agricultural machinery and
implements
other productive
assets*
total productive
assets
non-farm business
all estd.(00) sample
(1) (2) (3) (4) (5) (6) (7) (8) (9)
1 0 16 0 16 0 16 393 17
2 0 31 0 31 0 31 491 20
3 4 37 0 41 0 41 536 21
4 0 24 11 35 3 38 457 27
5 39 41 1 81 0 81 1023 36
6 0 43 2 46 4 50 814 30
7 65 59 0 124 0 124 876 23
8 88 46 2 136 32 168 618 42
9 0 250 25 276 0 276 507 26
10 0 549 0 549 192 741 278 18
All class 30 73 4 106 10 117 5993 260
est. no of hhs (00)
144 3630 83 3737 246 3864 XXXXX XXXXXX
sample no of hhs
7 148 11 154 13 160 XXXXX XXXXXX

107 Income, Expenditure, Productive Assests & Indebtedness of Agricultural Households in Odisha during the year January 2013-December 2013 (NSS 70th Round)
Table 3.6: Average monthly expenditure (Rs 0.00) incurred on assets used for farm and non-farm business per agricultural household by MPCE decile class
State: ODISHA social group: -O B C season: Combined
MPCE Decile class
average monthly expenditure incurred on agricultural household
livestock and poultry
agricultural machinery and
implements
other productive
assets*
total productive
assets
non-farm business
all estd.(00) sample
(1) (2) (3) (4) (5) (6) (7) (8) (9)
1 0 13 0 13 0 13 1108 25
2 0 27 0 27 0 27 444 27
3 105 26 0 132 2 134 618 25
4 6 34 10 50 0 50 944 46
5 186 45 30 262 0 262 1178 49
6 22 81 8 112 4 116 2087 62
7 80 90 13 183 4 187 2137 75
8 29 81 14 124 5 128 1840 82
9 15 285 2 302 12 314 2249 81
10 90 565 2 658 263 921 1164 56
All class 51 151 9 210 28 238 13768 528
est. no of hhs (00)
691 8979 595 9271 466 9328 XXXXX XXXXXX
sample no of hhs
29 312 29 322 25 327 XXXXX XXXXXX

108 Income, Expenditure, Productive Assests & Indebtedness of Agricultural Households in Odisha during the year January 2013-December 2013 (NSS 70th Round)
Table 3.6: Average monthly expenditure (Rs 0.00) incurred on assets used for farm and non-farm business per agricultural household by MPCE decile class
State: ODISHA social group: -OTHERS season:Combined
MPCE Decile class
average monthly expenditure incurred on agricultural household
livestock and poultry
agricultural machinery and
implements
other productive
assets*
total productive
assets
non-farm business
all estd.(00) sample
(1) (2) (3) (4) (5) (6) (7) (8) (9)
1 53 88 0 141 0 141 160 7
2 0 21 0 21 0 21 231 5
3 0 52 0 52 0 52 592 13
4 9 57 10 76 1 77 785 29
5 0 19 0 19 0 19 886 22
6 0 102 0 102 0 102 684 21
7 0 202 3 205 0 205 435 30
8 4 285 2 291 3 295 1014 32
9 0 435 151 586 81 668 1418 45
10 20 1037 4 1061 100 1160 3741 118
All class 12 640 11 664 60 723 9946 322
est. no of hhs (00)
36 5490 85 5513 429 5521 XXXXX XXXXXX
sample no of hhs
4 182 13 185 18 188 XXXXX XXXXXX

109 Income, Expenditure, Productive Assests & Indebtedness of Agricultural Households in Odisha during the year January 2013-December 2013 (NSS 70th Round)
Table 3.6: Average monthly expenditure (Rs 0.00) incurred on assets used for farm and non-farm business per agricultural household by MPCE decile class
State: ODISHA social group: ALL season: Combined
MPCE Decile class
average monthly expenditure incurred on agricultural household
livestock and poultry
agricultural machinery and
implements
other productive
assets*
total productive
assets
non-farm business
all estd.(00) sample
(1) (2) (3) (4) (5) (6) (7) (8) (9)
1 1 21 0 22 0 22 3384 111
2 1 26 2 30 0 30 3660 134
3 33 52 3 88 1 89 4176 136
4 8 36 15 58 1 59 4017 180
5 56 40 22 118 13 131 4499 161
6 11 71 8 90 3 93 4596 168
7 56 85 8 149 2 151 4349 175
8 40 113 9 162 71 233 4944 219
9 21 289 23 332 18 350 4652 182
10 105 893 3 1002 132 1134 5442 203
All class 42 221 10 273 35 308 43718 1669
est. no of hhs (00)
1249 24739 1491 25367 1468 25604 XXXXX XXXXXX
sample no of hhs
61 929 81 964 59 979 XXXXX XXXXXX

110 Income, Expenditure, Productive Assests & Indebtedness of Agricultural Households in Odisha during the year January 2013-December 2013 (NSS 70th Round)
Table 3.9: Average expenses and receipts (in Rs) on farming of animals per agricultural household during a period of 30 days by State/UT
Season: july-dec,2012
state Expenses (Rs.) Receipt (Rs.)
no.per 1000 hhlds
engaged farming
of animals
households engaged in farming
of animals
cost
of
anim
al `
seed
s'
anim
al f
eed
vete
rin
ary
char
ges
lab
ou
r ch
arge
s
all o
ther
exp
ense
s
tota
l exp
ense
s
milk
egg
live
anim
als
wo
ol
fish
all o
ther
rec
eip
ts
tota
l
estd
.(0
0)
sam
ple
(1) (2) (3) (4) (5) (6) (7) (8) (9) (10) (11) (12) (13) (14) (15) (16) (17)
Odisha 255 1316 75 17 135 1797 1858 5 212 0 0 25 2101 213 9325 433
est. no of hhs (00)
865 8249 2241 293 1143 9325 5592
141 481 0 0 658 6613 9325 XXXXX XXXXXX
sample no of hhs
46 377 130 18 73 433 187 18 50 0 0 35 259 433 XXXXX XXXXXX
Season: jan - june-2013
Odisha 9 1278 38 4 29 1357 1346 7 143 1 0 17 1515 217 9492 381 est. no of hhs (00)
65 8689 1592 127 498 9492 4979 214 533 10 0 608 6105 9492 XXXXX XXXXXX
sample no of hhs
13 356 85 5 42 381 151 20 41 1 0 32 228 381 XXXXX XXXXXX
Season: -Combined
Odisha 119 1024 47 9 71 1270 1294 5 144 0 0 17 1460 273 11926 500 est. no ofhhs (00)
896 10635 2983 385 1484 11926 6721 268 837 10 0 686 8061 11926 XXXXX XXXXXX
sample no of hhs
54 443 165 20 91 500 211 27 68 1 0 38 301 500 XXXXX XXXXXX

111 Income, Expenditure, Productive Assests & Indebtedness of Agricultural Households in Odisha during the year January 2013-December 2013 (NSS 70th Round)
Table 3.18: Average amount of outstanding lone per agricultural household by MPCE decile class
social group:- S T
State
average ammount (Rs"00) of outstanding loan per household belonging to the MPCE decile class
proportion of indebted agri
.hhs
No. of hhs having outstanding loan
1 2 3 4 5 6 7 8 9 10 All Est hhs (00) Sample
(1) (2) (3) (4) (5) (6) (7) (8) (9) (10) (11) (12) (13) (14) (15)
ODISHA 152 13 22 36 48 60 44 79 104 6 53 32.2 4518 201
estd. no. of hhs (00)
1723 3000 1925 1830 1412 1011 901 1473 479 258 14010 XX XX XX
sample no. of hhs 62 83 76 78 54 55 47 63 30 11 559 XX XX XX
social group: -S C ODISHA 20 24 6 69 67 53 29 87 7 96 46 39.3 2354 130
estd. no. of hhs (00)
393 491 536 457 1023 814 876 618 507 278 5993 XX XX XX
sample no. of hhs 17 20 21 27 36 30 23 42 26 18 260 XX XX XX
social group: O B C ODISHA 92 20 23 63 83 127 303 120 110 115 131 47.4 6532 289
estd. no. of hhs (00)
1108 444 618 944 1178 2087 2137 1840 2249 1164 13768 XX XX XX
sample no. of hhs 25 27 25 46 49 62 75 82 81 56 528 XX XX XX
social group: -OTHERS ODISHA 198 8 113 60 60 132 186 117 132 123 115 39.4 3923 164 estd. no. of hhs (00)
160 231 593 784 886 684 435 1014 1418 3741 9946 XX XX XX
sample no. of hhs 7 5 14 28 22 21 30 32 45 118 322 XX XX XX
social group: All ODISHA 119 15 35 51 64 100 182 103 105 114 91 39.6 17327 784
estd. no. of hhs (00)
3384 4166 3671 4015 4499 4596 4349 4944 4652 5442 43718 XX XX XX
sample no. of hhs 111 135 136 179 161 168 175 219 182 203 1669 XX XX XX

112 Income, Expenditure, Productive Assests & Indebtedness of Agricultural Households in Odisha during the year January 2013-December 2013 (NSS 70th Round)
Table 3.16: Per 1000 distribution of loans by source of loan taken for different sources of major income of agricultural households
State: ODISHA Social group: --S T no of hhs having
outstanding loan
source of major income
per 1000 distribution of loans by source of loan
Government
co-operati
ve society
bank emplyoer/La
ndlord
agricultural/professional
money lender
shopkeeper/trader
relative &friends
others
All (inc nr)
estd .
(00)
sample
(1) (2) (3) (4) (5) (6) (7) (8) (9) (10) (11) (12)
Cultivation 47 162 703 0 22 1 50 16 1000 3838 179
Livestock 143 0 363 0 378 0 116 0 1000 15 4
other agricultural activity 0 0 0 0 0 0 0 0 0 0 0
non-agricultural enterprises
0 84 406 0 28 0 0 481 1000 320 3
wage/salaried employment
0 594 284 3 2 0 114 2 1000 343 14
Pension 0 0 0 0 0 0 0 1000 1000 2 1
Remittances 0 0 0 0 0 0 0 0 0 0 0
Others 0 0 0 0 0 0 0 0 0 0 0
All 42 179 667 0 21 1 50 39 1000 4518 201
estd. no. of hhs (00) 202 976 1950 4 156 30 745 454 14010 XX XX
sample no. of hhs 13 69 49 2 11 2 47 8 559 XX XX

113 Income, Expenditure, Productive Assests & Indebtedness of Agricultural Households in Odisha during the year January 2013-December 2013 (NSS 70th Round)
Table 3.16: Per 1000 distribution of loans by source of loan taken for different sources of major income of agricultural households
State: ODISHA Social group: --S C no of hhs having
outstanding loan
source of major income
per 1000 distribution of loans by source of loan
Government
co-operative
society bank
emplyoer/Landlord
agricultural/professional money
lender
shopkeeper/trader
relative &friends
others All (inc
nr) estd . (00)
sample
(1) (2) (3) (4) (5) (6) (7) (8) (9) (10) (11) (12)
Cultivation 4 266 231 19 144 22 211 104 1000 1391 87
Livestock 0 60 60 0 850 0 30 0 1000 100 5
other agricultural activity
0 0 0 0 0 0 0 0 0 0 0
non-agricultural enterprise
0 208 701 0 3 2 84 2 1000 434 13
wage/salaried employment
0 444 144 8 313 0 83 8 1000 311 18
Pension 0 1000 0 0 0 0 0 0 1000 29 1
Remittances 0 0 0 0 0 0 1000 0 1000 10 1
Others 0 54 0 0 88 0 7 850 1000 65 4
All 2 283 285 12 161 14 158 85 1000 2354 130
estd. no. of hhs (00)
13 617 446 129 148 52 642 307 5993 XX XX
sample no. of hhs 1 40 18 2 11 3 38 17 260 XX XX

114 Income, Expenditure, Productive Assests & Indebtedness of Agricultural Households in Odisha during the year January 2013-December 2013 (NSS 70th Round)
Table 3.16: Per 1000 distribution of loans by source of loan taken for different sources of major income of agricultural households
State: ODISHA Social group: --O B C no of hhs having outstanding loan
source of major income
per 1000 distribution of loans by source of loan
Government
co-operative
society bank
emplyoer/Landlord
agricultural/professional money
lender
shopkeeper/trader
relative &friends
others All (inc
nr) estd . (00)
sample
(1) (2) (3) (4) (5) (6) (7) (8) (9) (10) (11) (12)
Cultivation 10 470 103 4 179 0 187 48 1000 4434 231
Livestock 114 629 174 0 58 0 0 24 1000 115 6
other agricultural activity
0 1000 0 0 0 0 0 0 1000 41 1
non-agricultural enterprise
0 109 31 0 792 0 45 23 1000 1429 23
wage/salaried employment
212 143 97 0 261 90 77 121 1000 503 25
Pension 0 760 128 0 112 0 0 0 1000 10 3
Remittances 0 0 0 0 0 0 0 0 0 0 0
Others 0 0 0 0 0 0 0 0 0 0 0
All 24 337 81 2 372 7 131 45 1000 6532 289
estd. no. of hhs (00)
75 2814 545 0 1290 16 1302 490 13768 XX XX
sample no. of hhs
7 151 44 0 31 4 36 16 528 XX XX

115 Income, Expenditure, Productive Assests & Indebtedness of Agricultural Households in Odisha during the year January 2013-December 2013 (NSS 70th Round)
Table 3.16: Per 1000 distribution of loans by source of loan taken for different sources of major income of agricultural households
State: ODISHA
Social group: -OTHERS no of hhs having outstanding loan
source of major
income
per 1000 distribution of loans by source of loan
Government
co-operative
society bank
emplyoer/Landlord
agricultural/professional
money lender
shopkeeper/trader
relative &friends
others All (inc
nr) estd . (00)
sample
(1) (2) (3) (4) (5) (6) (7) (8) (9) (10) (11) (12)
Cultivation 25 405 153 3 178 0 158 78 1000 3085 120
Livestock 0 168 0 0 36 0 519 277 1000 135 4
other agricultural activity
0 0 0 0 0 0 0 0 0 0 0
non-agricultural enterprise
0 108 515 0 23 18 214 121 1000 144 13
wage/salaried employment
3 25 912 0 16 0 45 0 1000 410 24
Pension 0 226 84 0 0 0 690 0 1000 149 3
Remittances 0 0 0 0 0 0 0 0 0 0 0
Others 0 0 0 0 0 0 0 0 0 0 0
All 17 274 389 2 118 1 144 56 1000 3923 164
estd. no. of hhs (00)
22 1570 624 0 434 4 1235 34 9946 XX XX
sample no. of hhs
3 84 36 0 17 1 17 6 322 XX XX

116 Income, Expenditure, Productive Assests & Indebtedness of Agricultural Households in Odisha during the year January 2013-December 2013 (NSS 70th Round)
Table 3.16: Per 1000 distribution of loans by source of loan taken for different sources of major income of agricultural households
State: ODISHA
Social group: --ALL no of hhs having outstanding loan
source of major income
per 1000 distribution of loans by source of loan
Government
co-operative
society bank
emplyoer/Landlord
agricultural/profession
al money lender
shopkeeper/trader
relative &friends
others All (inc
nr) estd . (00)
sample
(1) (2) (3) (4) (5) (6) (7) (8) (9) (10) (11) (12)
Cultivation 23 360 278 3 136 2 145 52 1000 12748 617
Livestock 65 395 114 0 238 0 117 71 1000 365 19
other agricultural activity
0 1000 0 0 0 0 0 0 1000 41 1
non-agricultural enterprises
0 115 132 0 642 1 57 53 1000 2326 52
wage/salaried employment
56 122 608 1 98 23 60 31 1000 1568 81
Pension 0 367 76 0 8 0 548 1 1000 190 8
Remittances 0 0 0 0 0 0 1000 0 1000 10 1
Others 0 54 0 0 88 0 7 850 1000 65 4
All 24 285 294 2 218 5 122 50 1000 17327 784
estd. no. of hhs (00)
312 5977 3565 133 2027 102 3924 1286 43718 XX XX
sample no. of hhs
24 344 147 4 70 10 138 47 1669 XX XX

Appendix-B

118 Income, Expenditure, Productive Assests & Indebtedness of Agricultural Households in Odisha during the year January
2013-December 2013 (NSS 70th Round)
Note on Sample Design and Estimation Procedure of NSS 70th Round
1. Introduction
1.1 The National Sample Survey (NSS), set up by the Government of India in 1950 to collect
socio-economic data employing scientific sampling methods, started its seventieth round from
1st January 2013. The survey will continue up to 31st December 2013.
1.2 Subject Coverage: The 70th round (January 2013 - December 2013) of NSS is earmarked
for surveys on land and livestock holdings, debt and investment and situation assessment
survey of agricultural households. The last survey on these subjects was conducted in 59th
round of NSS (January 2003 - December 2003).
2. Outline of Survey Programme
2.1 Geographical coverage: This survey covers the whole of the Indian Union.
2.2 Visits 1 & 2: Each sample FSU is being visited twice during this round. Since the workload
of the first visit (i.e. visit 1) is more, the first visit continues till the end of July 2013. Thus,
period of the first visit is January – July 2013 and that of the second visit (i.e. visit 2) is August
– December 2013.
The listing schedules (sch 0.0) are canvassed only in the first visit. Schedules 18.1, 18.2 and
33 are canvassed in independent sets of sample households. Each sample household is visited
twice. Visit 1 and visit 2 schedules are to be canvassed in the same set of sample households
during first and second visit respectively. Contents of the schedules for the two visits are not
same since the information relate to two different seasons.
2.3 Sub-rounds: The survey period of the round are divided into two sub-rounds. Sub-round
one will consist of the first half of the survey period of each visit i.e. 1st Jan -15th April 2013
for visit 1 and 1st August – 15th October 2013 for visit 2 while sub-round two consists of the
remaining period of the respective visits. Thus, each sub-round are three and a half months for
visit 1 and two and a half months for visit 2.
In each of these two sub-rounds equal number of sample villages/ blocks (FSUs) are allotted
for survey with a view to ensuring uniform spread of sample FSUs over the entire survey
period. Attempt will be made to survey each of the FSUs during the sub-round to which it is
allotted. Because of the arduous field conditions, this restriction need not be strictly enforced
in Andaman and Nicobar Islands, Lakshadweep and rural areas of Arunachal Pradesh and
Nagaland. The villages/blocks visited in the first sub-round of first visit is being revisited
during the first sub-round of the second visit. Similarly, villages/blocks of sub-round 2 of visit
1 to be revisited in sub-round 2 of visit 2.
2.4 Schedules of enquiry: During this round, the following schedules of enquiry are being
canvassed:
Schedule 0.0 : list of households
Schedule 18.1 : land and livestock holdings (rural only)
Schedule 18.2 : debt and investment
Schedule 33 : situation assessment survey of agricultural households
(rural only)

119 Income, Expenditure, Productive Assests & Indebtedness of Agricultural Households in Odisha during the year January
2013-December 2013 (NSS 70th Round)
3. Sample Design
3.1 Outline of sample design: A stratified multi-stage design has been adopted for the 70th
round survey. The first stage units (FSU) are the census villages (Panchayat wards in case of
Kerala) in the rural sector and Urban Frame Survey (UFS) blocks in the urban sector. The
ultimate stage units (USU) are households in both the sectors. In case of large FSUs, one
intermediate stage of sampling is the selection of two hamlet-groups (hgs)/ sub-blocks (sbs)
from each rural/ urban FSU.
3.2 Sampling Frame for First Stage Units: For the rural sector, the list of 2001 census
villages updated by excluding the villages urbanised and including the towns de-urbanised after
2001 census (henceforth the term ‘village’ would mean Panchayat wards for Kerala) constitutes
the sampling frame. For the urban sector, the latest updated list of UFS blocks (2007-12) is
considered as the sampling frame.
3.3 Stratification:
(a) Stratum has been formed at district level. Within each district of a State/ UT, generally
speaking, two basic strata have been formed: i) rural stratum comprising of all rural areas of
the district and (ii) urban stratum comprising all the urban areas of the district. However, within
the urban areas of a district, if there were one or more towns with population 10 lakhs or more
as per population census 2011 in a district, each of them formed a separate basic stratum and
the remaining urban areas of the district was considered as another basic stratum.
(b) However, a special stratum in the rural sector only was formed at State/UT level before
district- strata were formed in case of each of the following 20 States/UTs: Andaman & Nicobar
Islands, Andhra Pradesh, Assam, Bihar, Chhattisgarh, Delhi, Goa, Gujarat, Haryana,
Jharkhand, Karnataka, Lakshadweep, Madhya Pradesh, Maharashtra, Odisha, Punjab,
Rajasthan, Tamil Nadu, Uttar Pradesh and West Bengal. This stratum will comprise all the
villages of the State with population less than 50 as per census 2001.
(c) In case of rural sectors of Nagaland one special stratum has been formed within the
State consisting of all the interior and inaccessible villages. Similarly, for Andaman & Nicobar
Islands, one more special stratum has been formed within the UT consisting of all inaccessible
villages. Thus for Andaman & Nicobar Islands, two special strata have been formed at the UT
level:
(i) special stratum 1 comprising all the interior and inaccessible villages
(ii) special stratum 2 containing all the villages, other than those in special stratum
1, having population less than 50 as per census 2001.
3.4 Sub-stratification:
Rural sector: Different sub-stratifications are done for ‘hilly’ States and other States. Ten (10)
States are considered as hilly States. They are: Jammu & Kashmir, Himachal Pradesh,
Uttarakhand, Sikkim, Meghalaya, Tripura, Mizoram, Manipur, Nagaland and Arunachal
Pradesh.

120 Income, Expenditure, Productive Assests & Indebtedness of Agricultural Households in Odisha during the year January
2013-December 2013 (NSS 70th Round)
(a) sub-stratification for hilly States: If ‘r’ be the sample size allocated for a rural stratum, the
number of sub-strata formed was ‘r/2’. The villages within a district as per frame have been
first arranged in ascending order of population. Then sub-strata 1 to ‘r/2’ have been demarcated
in such a way that each sub-stratum comprised a group of villages of the arranged frame and
have more or less equal population.
(b) sub-stratification for other States (non-hilly States except Kerala): The villages within a
district as per frame were first arranged in ascending order of proportion of irrigated area in
the cultivated area of the village. Then sub-strata 1 to ‘r/2’ have been demarcated in such a
way that each sub-stratum comprised a group of villages of the arranged frame and have more
or less equal cultivated area. The information on irrigated area and cultivated area was obtained
from the village directory of census 2001.
(c) sub-stratification for Kerala: Although Kerala is a non-hilly State but because of non-
availability of information on irrigation at FSU (Panchayat Ward) level, sub-stratification by
proportion of irrigated area was not possible. Hence the procedure for sub-stratification was
same as that of hilly States in case of Kerala.
3.5 Total sample size (FSUs): 214 FSUs have been allocated for the central sample at all-
Odisha level. For the state sample, there are 214 FSUs allocated .
3.6 Allocation of total sample to States and UTs: The total number of sample FSUs have
been allocated to the States and UTs in proportion to population as per census 2011 subject to
a minimum sample allocation to each State/ UT. While doing so, the resource availability in
terms of number of field investigators as well as comparability with previous round of survey
on the same subjects has been kept in view.
3.7 Allocation of State/ UT level sample to rural and urban sectors: State/ UT level sample
size has been allocated between two sectors in proportion to population as per census 2011
with double weightage to urban sector subject to the restriction that urban sample size for
bigger states like Maharashtra, Tamil Nadu etc. should not exceed the rural sample size. A
minimum of 16 FSUs (minimum 8 each for rural and urban sector separately) is allocated to
each state/ UT.
3.8 Allocation to strata: Within each sector of a State/ UT, the respective sample size has been
allocated to the different strata in proportion to the population as per census 2011. Allocations
at stratum level are adjusted to multiples of 2 with a minimum sample size of 2. For special
stratum formed in the rural areas of 20 States/UTs, as discussed in para 3.3 (b), 2 FSUs were
allocated to each. For special stratum 1 in the rural areas of Nagaland and Andaman & Nicobar
Islands, 4 and 2 FSUs were allocated respectively.
3.9 Allocation to sub-strata:
3.9.1 Rural: Allocation is 2 for each sub-stratum in rural.
3.9.2 Urban: Stratum allocations have been distributed among the two sub-strata in proportion
to the number of FSUs in the sub-strata. Minimum allocation for each sub-stratum is 2.
3.10 Selection of FSUs:

121 Income, Expenditure, Productive Assests & Indebtedness of Agricultural Households in Odisha during the year January
2013-December 2013 (NSS 70th Round)
For the rural sector, from each stratum x sub-stratum, required number of sample villages has
been selected by Simple Random Sampling Without Replacement (SRSWOR). For the urban
sector, FSUs have been selected by using Simple Random Sampling Without Replacement
(SRSWOR) from each stratum x sub-stratum. Both rural and urban samples were drawn in the
form of two independent sub-samples and equal number of samples has been allocated among
the two sub rounds.
3.11 Selection of hamlet-groups/ sub-blocks - important steps
3.11.1 Criterion for hamlet-group/ sub-block formation: After identification of the
boundaries of the FSU, it is first determined whether listing is to be done in the whole sample
FSU or not. In case the approximate present population of the selected FSU is found to be 1200
or more, it is divided into a suitable number (say, D) of ‘hamlet-groups’ in the rural sector and
‘sub-blocks’ in the urban sector by more or less equalising the population as stated below.
approximate present population of the sample FSU no. of hg’s/sb’s to be formed
less than 1200 (no hamlet-groups/sub-blocks) 1
1200 to 1799 3
1800 to 2399 4
2400 to 2999 5
3000 to 3599 6
…………..and so on .
For rural areas of Himachal Pradesh, Sikkim, Uttarakhand (except four districts Dehradun,
Nainital, Hardwar and Udham Singh Nagar), Poonch, Rajouri, Udhampur, Reasi, Doda,
Kistwar, Ramgarh, Leh (Ladakh), Kargil districts of Jammu and Kashmir and Idukki district
of Kerala, the number of hamlet-groups are formed as follows:
approximate present population of the sample village no. of hg’s to be formed
less than 600 (no hamlet-groups) 1
600 to 899 3
900 to 1199 4
1200 to 1499 5
1500 to 1799 6
.………..and so on .
3.11.2 Formation and selection of hamlet-groups/ sub-blocks: In case hamlet-groups/ sub-
blocks are to be formed in the sample FSU, the same is done by more or less equalizing

122 Income, Expenditure, Productive Assests & Indebtedness of Agricultural Households in Odisha during the year January
2013-December 2013 (NSS 70th Round)
population. While doing so, it is ensured that the hamlet-groups/ sub-blocks formed are clearly
identifiable in terms of physical landmarks. Two hamlet-groups (hg)/ sub-blocks (sb) are
selected from a large FSU wherever hamlet-groups/ sub-blocks have been formed in the
following manner – one hg/ sb with maximum percentage share of population is always selected
and termed as hg/ sb 1; one more hg/ sb is selected from the remaining hg’s/ sb’s by simple
random sampling (SRS) and termed as hg/ sb 2. Listing and selection of the households is done
independently in the two selected hamlet-groups/ sub-blocks.
3.12 Formation of second stage strata and allocation of households
3.12.1 Schedule 18.1: Land & Livestock Holdings Survey (LHS) (rural only):
Four SSS are formed for schedule 18.1 based on four land possessed codes. SSS number is
same as the land possessed code. Each household has been given a land possessed code
according to the following criteria:
land possessed
code
criterion: area of the land possessed by the household
as on the date of survey 1 less than 0.005 hectare
2 equal to or more than 0.005 hectare but less than 1.000 hectare
3 equal to or more than 1.000 hectare but less than 2.000 hectares
4 equal to or more than 2.000 hectares
3.12.2 Schedule 33: Situation Assessment Survey of Agricultural Households (SAS)
(rural only): Only ‘agricultural households’ are considered for this schedule. The agricultural
households have been divided into four SSS based on land possessed codes similar to LHS
second stage strata.
3.12.3 Schedule 18.2: Debt and Investment Survey (AIDIS):Three SSS are formed both in
rural and urban sector: (i) households indebted either to institutional agencies only or to both
institutional and non-institutional agencies, (ii) households indebted to non-institutional
agencies only and (iii) households without any indebtedness.
3.12.4 Allocation and selection of sample households: The total number of households to be
surveyed in an FSU is given below for each schedule type:
Two households have been selected from each SSS for schedule 18.1 and 33. In case of hamlet
group formation, one household is to be selected from each hg × SSS for schedule 18.1 and 33.
For schedule 18.2, the number of sample households are 6, 4 and 4 from SSS 1, 2 and 3
respectively. In case of hamlet group/sub-block formation, the number of sample households
are 3, 2 and 2 from each (hg/sb) x SSS for schedule 18.2. The number of SSS, allocations and
sampling scheme by schedule type are illustrated in the following table.

123 Income, Expenditure, Productive Assests & Indebtedness of Agricultural Households in Odisha during the year January
2013-December 2013 (NSS 70th Round)
schedule
type
number
of SSS
number of sample households to be surveyed
rural urban
sampling
scheme
within
each SSS
18.1 4 8
(2 households from each
SSS)
----
SRSWOR
18.2 3 14
(SSS1 = 6, SSS2 = 4, SSS3
= 4)
14
(SSS1 = 6, SSS2 = 4, SSS3 =
4)
33 4 8
(2 households from each
SSS)
----
3.12.5 Selection of households: From each SSS the sample households for each of the
schedules are selected by SRSWOR.
4. Estimation Procedure
4.1 Notations:
s = subscript for s-th stratum
t = subscript for t-th sub-stratum
m = subscript for sub-sample (m =1, 2)
i = subscript for i-th FSU [village (panchayat ward)/ block]
d = subscript for a hamlet-group/ sub-block (d = 1, 2)
j = subscript for j-th second stage stratum in an FSU/ hg/sb
k = subscript for k-th sample household under a particular second stage stratum within an FSU/
hg/sb
D = total number of hg’s/ sb’s formed in the sample FSU
D* = 0 if D = 1
= (D – 1) for FSUs with D > 1
N = total number of FSUs in any rural/urban sub-stratum
n = number of sample FSUs surveyed including ‘uninhabited’ and ‘zero cases’ but excluding
casualty for a particular sub-sample and sub-stratum.
H = total number of households listed in a second-stage stratum of an FSU / hamlet-group or
sub-block of sample FSU
h = number of households surveyed in a second-stage stratum of an FSU / hamlet-group or sub-
block of sample FSU
x, y = observed value of characteristics x, y under estimation

124 Income, Expenditure, Productive Assests & Indebtedness of Agricultural Households in Odisha during the year January
2013-December 2013 (NSS 70th Round)
X , Y = estimate of population total X, Y for the characteristics x, y
Under the above symbols,
ystmidjk = observed value of the characteristic y for the k-th household in the j-th second stage
stratum of the d-th hg/ sb (d = 1, 2) of the i-th FSU belonging to the m-th sub-sample for the t-
th sub-stratum of s-th stratum.
However, for ease of understanding, a few symbols have been suppressed in following
paragraphs where they are obvious.
4.2 Formulae for Estimation of Aggregates for a particular sub-sample and stratum
sub-stratum:
4.2.1 Schedule 18.1/33:
4.2.1.1 Rural:
(i) For j-th second stage stratum:
j
i
h
kjki
ji
jii
h
kjki
ji
ji
jj
ny
h
HDy
h
H
n
NY
jiji
1 12
2
2*
11
1
121
ˆ
(ii) For all second-stage strata combined:
j
jYY ˆˆ
Note: i) Schedule 18.1 and 33 has been canvassed in rural sector only
ii) Values of j for different schedules are as follows:
for sch. 33, j = 1, 2, 3 or 4
4.2.2.2 Estimates in respect of joint operational holdings: In the case of joint operational
holdings operated by the sample household jointly with other household(s), the value of a
characteristic of the operational holding will be first multiplied by the percentage share of land
of the sample household(s) and then the higher estimates will be built up.
4.3 Overall Estimate for Aggregates for a sub-stratum:
Overall estimate for aggregates for a sub-stratum ( stY ) based on two sub-samples is obtained
as:
2
ˆ2
1ˆ
1mstmst YY

125 Income, Expenditure, Productive Assests & Indebtedness of Agricultural Households in Odisha during the year January
2013-December 2013 (NSS 70th Round)
4.4 Overall Estimate for Aggregates for a stratum:
Overall estimate for a stratum ( sY ) will be obtained as
t
sts YY ˆˆ
4.5 Overall Estimate of Aggregates at State/UT/all-India level:
The overall estimate Y at the State/ UT/ all-India level is obtained by summing the stratum
estimates sY over all strata belonging to the State/ UT/ all-India.
4.6 Estimates of Ratios:
Let Y and X be the overall estimates of the aggregates Y and X for two
characteristics y and x respectively at the State/ UT/ all-India level.
Then the combined ratio estimate )ˆ(R of the ratio )(X
YR will be obtained as
X
YR
ˆ
ˆˆ
.
4.7 Estimates of Error: The estimated variances of the above estimates will be as follows:
4.7.1 For aggregate Y : s t
st
s
s YraVYraVYraV )ˆ(ˆ)ˆ(ˆ)ˆ(ˆ where )ˆ(ˆ stYraV is
given by
221
ˆˆ4
1ˆˆ ststst YYYrVa , where 1ˆstY and 2
ˆstY are the estimates for sub-sample 1
and sub-sample 2 respectively for stratum ‘s’ and sub-stratum ‘t’.
4.7.2 For ratio R :
s t
st RESMRESM )ˆ(ˆ)ˆ(ˆ
where )ˆ(ˆ RESM st is given by
2121
2
2122
212ˆˆˆˆˆ2ˆˆˆˆˆ
ˆ4
1)ˆ(ˆ
ststststststststst XXYYRXXRYYX
RESM
4.7.3 Estimates of Relative Standard Error (RSE):
100
ˆ
ˆˆˆˆ
Y
YraVYESR
100ˆ
ˆˆˆˆ
R
RESMRESR

126 Income, Expenditure, Productive Assests & Indebtedness of Agricultural Households in Odisha during the year January
2013-December 2013 (NSS 70th Round)
5. Multipliers:
5(a) Two sets of multipliers may be generated:
(i) For visit 1 only
(ii) For visit 2 only
Hence, household multiplier will be equal to:
(i) visit 1 multiplier, if household is casualty in visit 2.
(ii) half x (visit 1 multiplier + visit 2 multiplier), if household is common in both the
visits.
5(b) The formulae for multipliers at stratum/sub-stratum/second-stage stratum for a sub-sample
and schedule type are given below:
sch type sector formula for multipliers
hg / sb 1 hg / sb 2
18.1 / 33 rural
jstmi
jstmi
stmj
st
h
H
n
N
1
1
jstmi
jstmistmi
stmj
st
h
HD
n
N
2
2*
( j = 1, 2, 3, 4)
Note: (i) For estimating any characteristic for any domain not specifically considered in
sample design, indicator variable may be used
(ii) Multipliers have to be computed on the basis of information available in the listing
schedule irrespective of any misclassification observed between the listing
schedule and detailed enquiry schedule.
(iii) For estimating number of villages possessing a characteristic, *
stmiD = 0 in the
relevant multipliers and there will be only one multiplier for the village.
6. Treatment for zero cases, casualty cases etc.:
6.1 While counting the number of FSUs surveyed (nstm) in a stratum x sub-stratum, all the FSUs
with survey codes 1 to 6 in schedule 0.0 will be considered. In addition, if no SSU is available
in the frame for a particular schedule then also that FSU will be treated as surveyed in respect
of that schedule. However, if the SSUs of a particular schedule type are available in the frame
of the FSU but none of these could be surveyed then that FSU has to be treated as casualty and
it will not be treated as surveyed in respect of that schedule.
6.2 Casualty cases: FSUs with survey code 7 as per schedule 0.0 are treated as casualties. In
addition to this, an FSU, although surveyed, may have to be treated as casualty for a particular
schedule type and a particular second stage stratum as given in the following para:
6.2.1 FSUs with survey codes 1 or 4 as per schedule 0.0 having number of households in the
frame of j-th second stage stratum greater than 0 but number of households surveyed according

127 Income, Expenditure, Productive Assests & Indebtedness of Agricultural Households in Odisha during the year January
2013-December 2013 (NSS 70th Round)
to data file, considering both hg/sb together, as nil (i.e. Hi1j + Hi2j >0 but hi1j + hi2j =0) will be
taken as casualties for j-th second stage stratum.
All the FSUs with survey codes 1 to 6 as per schedule 0.0 minus the number of casualties as
identified above will be taken as the number of surveyed FSUs (nstmj ) for that (stratum x sub-
stratum) × ( second stage stratum).
When casualty for j-th second stage stratum occurs for a particular hg/sb but not for the other
hg/sb, the FSU will not be treated as casualty but some adjustments in the value of H for the
other hg/sb will be done as follows:
(i) Suppose for hg/sb 1, Hi1j > 0 but hi1j = 0 while for hg/sb 2, Hi2j > 0 and hi2j > 0. In that
case jii HD 2
* will be replaced by )(2
*
1 jiijiHDH in the formula for multiplier
of hg/sb 2.
(ii) Suppose for hg/sb 1, Hi1j>0 and hi1j > 0 while for hg/sb 2, Hi2j>0 but hi2j=0. In that case
jiH
1 will be replaced by )(
2
*
1 jiijiHDH in the formula for multiplier of hg/sb 1.
It may be noted that nstmj would be same for hg/sb 1 & 2 of an FSU.
*********************************************************************

visit 1 Schedule 33 : 128
RURAL CENTRAL
STATE
GOVERNMENT OF INDIA
NATIONAL SAMPLE SURVEY OFFICE
SOCIO-ECONOMIC SURVEY
SEVENTIETH ROUND : JANUARY TO DECEMBER 2013
SCHEDULE 33: SITUATION ASSESSMENT SURVEY OF AGRICULTURAL HOUSEHOLDS
VISIT 1
[0] descriptive identification of sample household
1. state/u.t.: 5. hamlet name:
2. district: 6. name of head of household:
3. tehsil: 7. name of informant:
4. village name:
[1] identification of sample household
item
no. item Code
item
no. item code
1. srl. no. of sample village 12. FOD sub-region
2. round number 7 0 13. sample hamlet-group number
3. schedule number 3 3 14. second stage stratum number
4. sample (central - 1, state - 2) 15. sample household number
5. sector (rural - 1) 1 16. visit number 1
6. NSS region
7. district
17. serial number of informant #
(as in column 1 of block 4)
8. stratum 18. response code
9. sub - stratum 19. survey code
10. sub-round
20. reason for substitution of original
household
11. sub-sample
CODES FOR BLOCK 1
item 18: response code: informant: co-operative and capable -1, co-operative but not capable -2, busy
-3, reluctant - 4, others - 9.
item 19: survey code: original – 1, substitute – 2, casualty – 3.
item 20: reason for substitution of original household: informant busy -1, members away from home
-2, informant non-cooperative -3, others – 9
* tick mark ( ) may be put in the appropriate place.
# if the informant is not a household member, code 99 will be recorded.

visit 1 Schedule 33 : 129
[2] particulars of field operations
srl. no. item
field investigator (FI)
/assistant superintending
officer (ASO)
field officer (FO)/
superintending officer
(SO)
(1) (2) (3) (4)
1 (a)
i) name (block letters)
ii) code
iii) signature
1 (b)
i) name (block letters)
ii) code
iii) signature
2.
date(s) of : DD MM YY DD MM YY
(i) survey/ inspection
(ii) receipt
(iii) scrutiny
(iv) despatch
3. number of additional sheets attached
4.
total time taken to canvass the schedule
by the team of investigators (FI/ASO)
(in minutes)
5. number of investigators (FI/ASO) in the
team who canvassed the Schedule
6.
whether any remarks
have been entered by
FI/ ASO/
supervisory officer
(yes –1, no-2)
(i) in block 16/17
(ii) elsewhere in
the schedule
[16] remarks by investigators (FI/ASO)
[17] comments by supervisory officer(s)

visit 1 Schedule 33 : 130
[3] househlold characteristics
1. household size source of income of the household during last 365
days
2. religion (code)
activity
whether
performed?
(yes -1,no-2)
principal
income
source?
(yes-1, no-
2) 3. social group (code)
4. dwelling unit code (owned –1, hired –
2, no dwelling unit –3, others –9)
16. cultivation
5. type of structure
(katcha-1, semi-pucca-2, pucca-3)
17. livestock
6. principal source of drinking water
(code) 18.
other agricultural
activity
7. whether household possess any land?
(yes - 1, no - 2)
19.
non-agricultural
enterprises
8. if ‘1’ in item 7, type of land possessed
(code)
20.
wage/salaried
employment
9. does the household possess any land
outside the village (code)?
21. pension
10.
whether operated any land for
agricultural activities during last 365
days? (yes-1, no-2)
22. remittances
11.
land as
on date
of
survey
(ha
0.000)
owned
23. others
12. leased-in
13. neither owned nor
leased-in
24.
whether the household has
MGNREG job card (yes-1, no-2).
14. leased-out
25. does the household possess ration
card (yes -1, no – 2)?
15. total possessed
( 11+12+13-14 )
26.
if ‘1’ in item 25, type of ration
card (code)
CODES FOR BLOCK 3
item 2: religion: Hinduism-1, Islam-2, Christianity -3, Sikhism-4, Jainism-5, Buddhism-6, Zoroastrianism-
7, others-9
item 3: social group: scheduled tribe-1, scheduled caste-2, other backward class-3, others-9.
item6: principal source of drinking water: tap-1, tube well/borehole-2, well: protected-3
unprotected-4, spring: protected-5, unprotected-6; rainwater collection -7, surface water
(tank/pond-river, dam, stream, canal, lake, etc.)-8, others (tanker-truck, cart with small tank or drum,
bottled water, etc)-9
item 8: type of land possessed: homestead only - 1, homestead and other land - 2, other land only -
9.
item 9: does the household possess any land outside the village: yes: within state - 1, outside state
- 2, both within and outside state – 3; no - 4.
item 26: type of ration card: Antyodaya -1, BPL – 2, others – 9

visit 1 Schedule 33 : 131
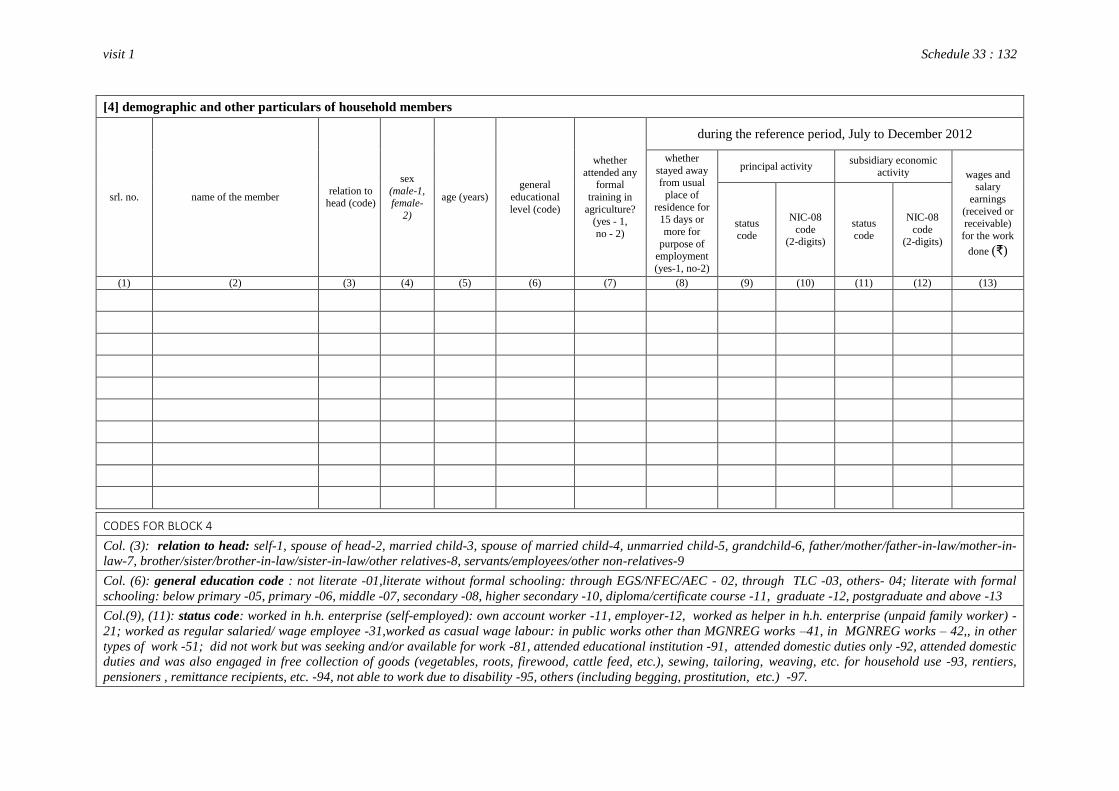
visit 1 Schedule 33 : 132
[4] demographic and other particulars of household members
srl. no. name of the member relation to
head (code)
sex
(male-1, female-
2)
age (years)
general
educational
level (code)
whether
attended any formal
training in
agriculture? (yes - 1,
no - 2)
during the reference period, July to December 2012
whether
stayed away from usual
place of
residence for 15 days or
more for
purpose of employment
(yes-1, no-2)
principal activity subsidiary economic
activity wages and salary
earnings
(received or receivable)
for the work
done (₹)
status
code
NIC-08
code (2-digits)
status
code
NIC-08
code (2-digits)
(1) (2) (3) (4) (5) (6) (7) (8) (9) (10) (11) (12) (13)
CODES FOR BLOCK 4
Col. (3): relation to head: self-1, spouse of head-2, married child-3, spouse of married child-4, unmarried child-5, grandchild-6, father/mother/father-in-law/mother-in-
law-7, brother/sister/brother-in-law/sister-in-law/other relatives-8, servants/employees/other non-relatives-9
Col. (6): general education code : not literate -01,literate without formal schooling: through EGS/NFEC/AEC - 02, through TLC -03, others- 04; literate with formal
schooling: below primary -05, primary -06, middle -07, secondary -08, higher secondary -10, diploma/certificate course -11, graduate -12, postgraduate and above -13
Col.(9), (11): status code: worked in h.h. enterprise (self-employed): own account worker -11, employer-12, worked as helper in h.h. enterprise (unpaid family worker) -
21; worked as regular salaried/ wage employee -31,worked as casual wage labour: in public works other than MGNREG works –41, in MGNREG works – 42,, in other
types of work -51; did not work but was seeking and/or available for work -81, attended educational institution -91, attended domestic duties only -92, attended domestic
duties and was also engaged in free collection of goods (vegetables, roots, firewood, cattle feed, etc.), sewing, tailoring, weaving, etc. for household use -93, rentiers,
pensioners , remittance recipients, etc. -94, not able to work due to disability -95, others (including begging, prostitution, etc.) -97.

visit 1 Schedule 33 : 133
crop codes
paddy ……………… 0101 plum………………… 0612 groundnut……………... 1001
jowar ……………… 0102 kiwi fruit……………. 0613 castorseed……………. 1002
bajra ……………….. 0103 chiku ……………… 0614 sesamum (til) ……….... 1003
maize ……………… 0104 papaya ……………… 0615 rapeseed& mustard ……. 1004
ragi ……………….. 0105 guava…………………. 0616 linseed ……………….. 1005
wheat ……………… 0106 almond……………….. 0617 coconut……………….. 1006
barley ……………… 0107 walnut………………… 0618 sunflower…………….. 1007
small millets ……… 0108 cashewnuts……………. 0619 safflower…………….. 1008
other cereals ……….. 0188 apricot………………… 0620 soyabean…………….. 1009
gram ………………. 0201 jackfruit……………… 0621 nigerseed……………... 1010
tur (arhar) …………. 0202 lichi……………………. 0622 oil palm………………. 1011
urad ……………….. 0203 pineapple……………… 0623 other oilseeds………… 1088
moong …………….. 0204 watermelon……………. 0624 cotton………………… 1101
masur ……………… 0205 musk melon…………… 0625 jute…………………… 1102
horsegram …………. 0206 bread fruits……………. 0626 mesta…………………. 1103
beans (pulses) …….. 0207 ber……………………... 0627 sunhemp……………... 1104
peas (pulses) ……… 0208 bel……………………... 0628 other fibres…………… 1188
other pulses ………. 0288 mulberry (sahatoot)…… 0629 indigo………………… 1201
sugarcane ………….. 0401
aonla (amla)…………… 0630
other dyes &
tan.materials 1288
palmvriah ………….. 0402 other fruits…………….. 0688 opium………………… 1301
other sugar crops ….. 0488 potato…………………. 0701 tobacco………………. 1302
pepper (black) ……... 0501 tapioca (cassava)……… 0702 other drugs & narcotics 1388
chillies …………….. 0502 sweet potato…………… 0703 guar…………………... 1401
ginger………………. 0503 yam……………………. 0704 oats………………….. 1402
turmeric……………. 0504 elephant foot yam…….. 0705 green manures……….. 1403
cardamom (small)….. 0505 colocasia/arum………… 0706 other fodder crops…… 1488
cardamom (large)….. 0506 other tuber crop……….. 0707 tea……………………. 1501
betelnuts (arecanuts).. 0507 onion………………….. 0708 coffee………………… 1502
garlic……………….. 0508 carrot………………….. 0709 rubber………………... 1503
coriander……………. 0509 radish………………… 0710 other plantation crops... 1588
tamarind…………….. 0510 beetroot……………….. 0711 orchids……………….. 1601
cumin seed………….. 0511 turnip (shalgam)………. 0712 rose…………………... 1602
fennel / anise seed….. 0512 tomato………………… 0713 gladiolus……………... 1603
nutmeg……………… 0513 spinach……………….. 0714 carnation…………….. 1604
fenugreek…………… 0514 amaranths (chaulai)…… 0715 marigold……………... 1605
cloves……………….. 0515 cabbage………………... 0716 other flowers………… 1688
cinnamon…………… 0516 other leafy vegetable….. 0717 asgandh………………. 1701
cocoa……………….. 0517 brinjal…………………. 0718 isabgol……………….. 1702
kacholam……………. 0518 peas (vegetable) (green) 0719 sena…………………... 1703
beetlvine…………….. 0519 lady’s finger (bhindi)….. 0720 moosli……………….. 1704
othercondi. & spices.. 0588 cauliflower…………….. 0721 other medicinal plant… 1705
mangoes…………….. 0601 cucumber……………… 0722 lemon grass………….. 1711
orange and kinu…….. 0602 bottle gourd (lauki)……. 0723 mint………………….. 1712
mosambi……………. 0603 pumpkin………………. 0724 menthol……………… 1713
lemon / acid lime…… 0604 bitter gourd……………. 0725 eucalyptus…………… 1714
othercitrous fruits….. 0605 other gourds…………… 0726 other aromatic plant….. 1715
banana………………. 0606 vench (guar)…………... 0727 canes…………………. 1801
table grapes…………. 0607 beans (green)………….. 0728 bamboos……………... 1802
wine grapes (black)…. 0608 drumstick……………… 0729 other non-food crops… 1888
apple………………… 0609 green chillies………….. 0730
pear…………………. 0610 other vegetables……….. 0788
peaches……………… 0611 other food crop……….. 0801

visit 1 Schedule 33 : 134
[5a] value of output for the crops produced during July to December 2012
srl
no.
crop
(code)
un
it c
od
e
produce from irrigated land produce from un-irrigated
land pre-harvest sale all
wh
eth
er m
ixed
cro
p?
(cod
e)
land
(0.000 ha)
quantity
wh
eth
er m
ixed
cro
p?
(cod
e)
land
(0.000 ha)
quantity
irrigated
land
(0.000 ha)
un-
irrigated
land
(0.000
ha)
value of
pre-harvest
sale (₹)
land
(0.000 ha)
col.(5 + 8 +
10 + 11)
quantity
col.(6 + 9)
rate
(₹
0.0
0)*
value of
products
(₹)
col.(14 x
15)
value of by-
products
(₹)
total
value (₹)
col.(12 +
16 +17)
(1) (2) (3) (4) (5) (6) (7) (8) (9) (10) (11) (12) (13) (14) (15) (16) (17) (18)
1.
2.
3.
4.
5. other
9. All
*rate (₹ 0.00) may be reported here as in col.20, block 5b if available, otherwise price in the local market may be recorded
CODES FOR BLOCK 5a
col.(3): unit code: kg - 1, number – 2
col.(4), (7): whether mixed crop: sole crop - 1, mix major - 2, mix minor – 3

visit 1 Schedule 33 : 135
[5b] disposition of crops produced during July to December 2012 sr
l no
. as
in
co
l.(1
), b
lock
[5a]
crop
code as in
col. (2),
block [5a]
unit
co
de
as i
n c
ol.
(3)
blo
ck [
5a]
first major disposal second major disposal third major disposal other disposals all
rate
(₹
0.0
0)
col.
19
/ c
ol.
18
agen
cy (
cod
e)
is s
atis
fact
ory
? (c
od
e)
quantity
sold
sale value
(₹)
agen
cy (
cod
e)
is s
atis
fact
ory
? (c
od
e)
quantity sold
sale value
(₹)
agen
cy (
cod
e)
is s
atis
fact
ory
? (c
od
e)
quantity sold
sale
value (₹)
quantity sold
sale
value (₹)
quantity sold col.(6 + 10 +
14 + 16)
sale value
(₹) col.(7 + 11 + 15 + 17)
(1) (2) (3) (4) (5) (6) (7) (8) (9) (10) (11) (12) (13) (14) (15) (16) (17) (18) (19) (20)
1
2
3
4
CODES FOR BLOCK 5b
col.(3): unit code: kg - 1, number – 2
col.(4), (8), (12): agency: local private - 1, mandi - 2, input dealers - 3, cooperative& govt. agency - 4, processors - 5, others - 9.
col.(5), (9), (13): is satisfactory: satisfactory - 1, not satisfactory: lower than market price - 2, delayed payments - 3, deductions for loans borrowed - 4, faulty weighing and
grading - 5, other cause of dissatisfaction – 9

visit 1 Schedule 33 : 136
[6] particulars of inputs and their expenses for crop production during July to December 2012
srl
no. inputs
srl. no. of
crop as in
col. 1 of
block [5a]
crop code
as in col.
2 of
block
[5a]
how
procured?
(code)
agency
(code)
quality
(code)
expenses
(₹)
(1) (2) (3) (4) (5) (6) (7) (8)
1.
seeds
1.
2. 2.
3. 3.
4. 4.
5. 5. other
6. fertilisers
7. manures
8. plant protection chemicals
9. diesel
10. electricity
11. labour human
12. labour animal
13. irrigation
14. minor repair and maintenance of machinery and equipment
15. interest
16. cost of hiring of machinery
17. lease rent for land
18. other expenses
19. total (1 to 18)
CODES FOR BLOCK 6
col.(5): how procured: farm saved - 1, exchange - 2, purchase – 3, borrowed – 4, others – 9
col.(6): agency: own farm- 1, local trader - 2, input dealer - 3, cooperative & govt. agency - 4, others – 9
col.(7): quality: good - 1, satisfactory - 2, poor - 3, don’t know– 4

visit 1 Schedule 33 : 137
[7] disposition of produce and value of outputs on farming of animals during last 30 days
srl.
no.
item description
first major disposal second major disposal other disposals* all
agen
cy (
cod
e)
is s
atis
fact
ory
?
(co
de)
quantity
sold
sale
value
(₹)
agen
cy (
cod
e)
is s
atis
fact
ory
?
(co
de)
quantity
sold
sale value
(₹)
quantity
sold
value
(₹)
qu
anti
ty s
old
(co
l. 5
+9
+1
1)
sale value
(₹)
(col. 6 +
10 + 12)
(1) (2) (3) (4) (5) (6) (7) (8) (9) (10) (11) (12) (13) (14)
1. milk (dairy, sheep, goat, etc.) (litre)
2. egg (poultry, duckery, etc.) (no.)
3. live animals (e.g., cattle, sheep, goat,
pig, poultry & duckery, etc.)
4. wool (sheep, goat, etc.) (kg)
5. fish (kg)
6. honey (kg)
7. hide, bones, manure
8. other receipts (₹)
9. total receipts (1 to 8)
*other includes retention for future sell, own consumption, use as animal seed, etc
CODES FOR BLOCK 7
col.(3) & (7): agency: directly to other household - 1, local trader - 2, commission agent - 3, cooperative & govt. agency - 4, processor - 5, others - 9
col.(4) & (8): is satisfactory: satisfactory - 1, not satisfactory: lower than market price - 2, delayed payments - 3, deductions for loans borrowed-– 4, faulty weighing and
grading - 5, other cause of dissatisfaction - 9

visit 2 Schedule 33 : 138
[8] expenses and other particulars of input on farming of animals during last 30 days
srl
no. input item
how
procured?
(code)
agency
(code)
quality
(code) expenses (₹)
(1) (2) (3) (4) (5) (6)
1.
cost of
animal
‘seeds’
cattle/buffalo
2. sheep, goat,
piggery etc.
3. poultry & duckery
4. others
5.
animal
feed
green fodder
6. dry fodder
7. concentrates
8. others
9. veterinary charges
10. Interest
11. lease rent for land
12. labour charges
13. other expenses
14. total (1 to 13)
[9] expenses and value of outputs for non-farm business during last 30 days
sl.
no.
non-farm business
expenses (₹) value of
output (₹)
net receipt (₹)
(col. 5 – 4) description NIC - 2008
(5-digit code)
(1) (2) (3) (4) (5) (6)
01.
02.
03.
04.
05.
99. all
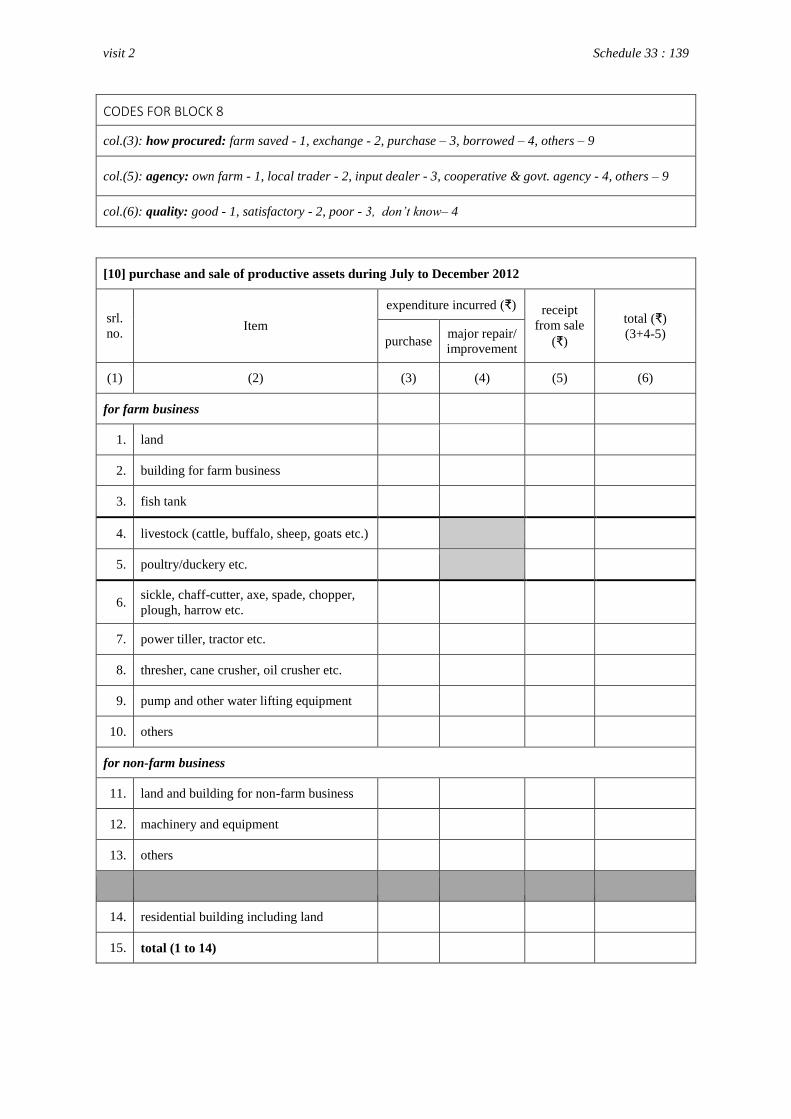
visit 2 Schedule 33 : 139
CODES FOR BLOCK 8
col.(3): how procured: farm saved - 1, exchange - 2, purchase – 3, borrowed – 4, others – 9
col.(5): agency: own farm - 1, local trader - 2, input dealer - 3, cooperative & govt. agency - 4, others – 9
col.(6): quality: good - 1, satisfactory - 2, poor - 3, don’t know– 4
[10] purchase and sale of productive assets during July to December 2012
srl.
no. Item
expenditure incurred (₹) receipt
from sale
(₹)
total (₹)
(3+4-5) purchase
major repair/
improvement
(1) (2) (3) (4) (5) (6)
for farm business
1. land
2. building for farm business
3. fish tank
4. livestock (cattle, buffalo, sheep, goats etc.)
5. poultry/duckery etc.
6. sickle, chaff-cutter, axe, spade, chopper,
plough, harrow etc.
7. power tiller, tractor etc.
8. thresher, cane crusher, oil crusher etc.
9. pump and other water lifting equipment
10. others
for non-farm business
11. land and building for non-farm business
12. machinery and equipment
13. others
14. residential building including land
15. total (1 to 14)
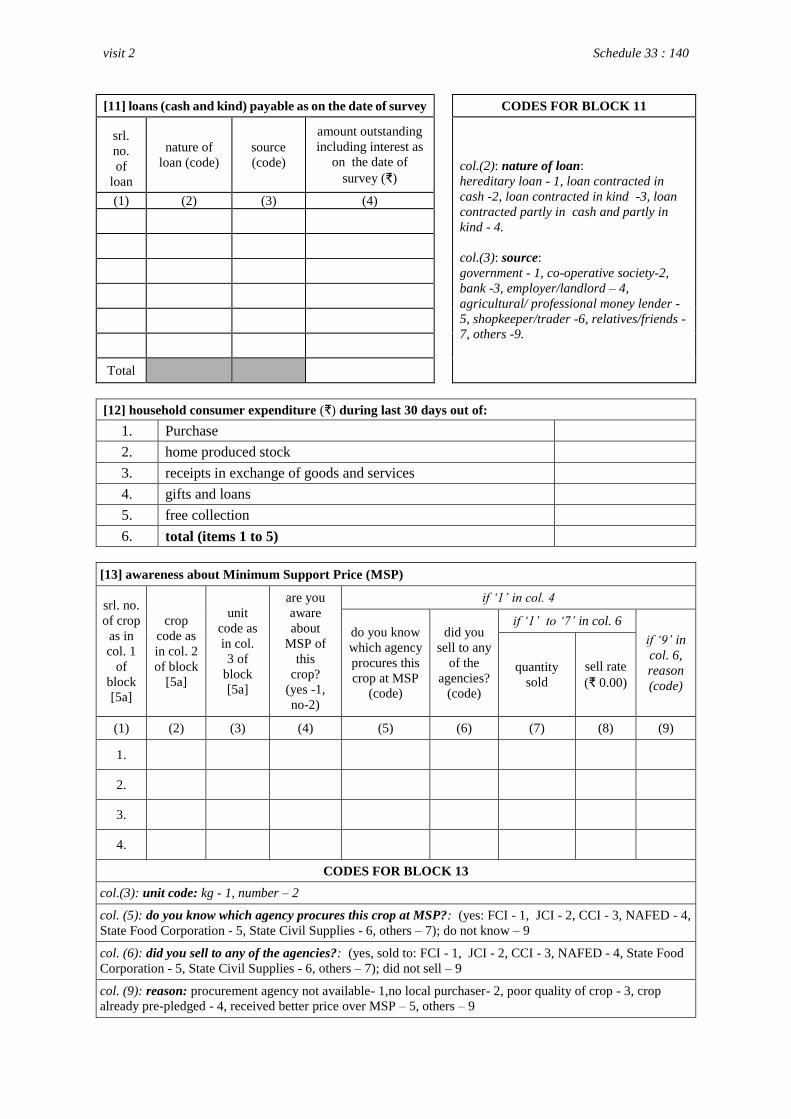
visit 2 Schedule 33 : 140
[11] loans (cash and kind) payable as on the date of survey CODES FOR BLOCK 11
srl.
no.
of
loan
nature of
loan (code)
source
(code)
amount outstanding
including interest as
on the date of
survey (₹)
col.(2): nature of loan:
hereditary loan - 1, loan contracted in
cash -2, loan contracted in kind -3, loan
contracted partly in cash and partly in
kind - 4.
col.(3): source:
government - 1, co-operative society-2,
bank -3, employer/landlord – 4,
agricultural/ professional money lender -
5, shopkeeper/trader -6, relatives/friends -
7, others -9.
(1) (2) (3) (4)
Total
[12] household consumer expenditure (₹) during last 30 days out of:
1. Purchase
2. home produced stock
3. receipts in exchange of goods and services
4. gifts and loans
5. free collection
6. total (items 1 to 5)
[13] awareness about Minimum Support Price (MSP)
srl. no.
of crop
as in
col. 1
of
block
[5a]
crop
code as
in col. 2
of block
[5a]
unit
code as
in col.
3 of
block
[5a]
are you
aware
about
MSP of
this
crop?
(yes -1,
no-2)
if ‘1’ in col. 4
do you know
which agency
procures this
crop at MSP
(code)
did you
sell to any
of the
agencies?
(code)
if ‘1’ to ‘7’ in col. 6
if ‘9’ in
col. 6,
reason
(code)
quantity
sold
sell rate
(₹ 0.00)
(1) (2) (3) (4) (5) (6) (7) (8) (9)
1.
2.
3.
4.
CODES FOR BLOCK 13
col.(3): unit code: kg - 1, number – 2
col. (5): do you know which agency procures this crop at MSP?: (yes: FCI - 1, JCI - 2, CCI - 3, NAFED - 4,
State Food Corporation - 5, State Civil Supplies - 6, others – 7); do not know – 9
col. (6): did you sell to any of the agencies?: (yes, sold to: FCI - 1, JCI - 2, CCI - 3, NAFED - 4, State Food
Corporation - 5, State Civil Supplies - 6, others – 7); did not sell – 9
col. (9): reason: procurement agency not available- 1,no local purchaser- 2, poor quality of crop - 3, crop
already pre-pledged - 4, received better price over MSP – 5, others – 9

visit 2 Schedule 33 : 141
[14] access to technical advice for any of the crops listed in Block [5a]
srl.
no. source of technical advice
wh
eth
er a
cces
sed
(y
es-1
, n
o-2
)
if ‘
2’
in c
ol.
3,
reas
on
fo
r no
t
acce
ssin
g (
cod
e)
if ‘1’ in col. 3
frequency
of contact
(code)
wh
eth
er r
ecom
men
ded
adv
ice
ado
pte
d?(
yes
- 1
,no
- 2
)
if ‘
2’
in c
ol.
6, re
aso
n f
or
no
t
ado
pti
ng (
cod
e)
if ‘1’ in col. 6
use
fuln
ess
of
adv
ice
(co
de)
ho
w w
as t
he
imp
act
(co
de)
(1) (2) (3) (4) (5) (6) (7) (8) (9)
1. extension agent
2. krishi vigyan Kendra
3. agricultural university
/college
4.
private commercial agents
(including drilling
contractor)
5. progressive farmer
6. radio/tv/newspaper/internet
7.. veterinary department
8. NGO
CODES FOR BLOCK 14
col.(4): reasons for not accessing : not aware - 1, not available - 2, not required - 3, others - 9.
col.(5): frequency of contact: daily - 1, weekly - 2, monthly - 3, seasonally - 4, need based - 5,
casual contact - 6.
col.(7): reasons for not adopting: lack of financial resources - 1, non-availability of input and physical
resources - 2, lack of technical advice for follow-up - 3, difficulty in storage, processing and marketing of
products - 4, others - 9.
col.(8): usefulness of advice: useful - 1, not useful - 2, don’t know - 3
col.(9):impact: beneficial - 1, moderately beneficial - 2, no effect - 3, harmful - 4, don’t know - 5

visit 2 Schedule 33 : 142
[15] particulars of other aspects of farming during July to December 2012 sr
l. n
o.
of
crop
as
in c
ol.
1 o
f blo
ck 5
a
cro
p c
od
e as
in
co
l. 2
of
blo
ck5
a
did
you
hav
e th
is c
rop i
nsu
red?
(co
de)
if ‘2’ in
column 3,
total
premium
paid (₹)
if ‘
3’
in c
olu
mn
3,
rea
son
fo
r n
ot
insu
rin
g (
cod
e)
hav
e yo
u e
xp
erie
nce
d a
ny
cro
p l
oss
?
(yes
- 1
, n
o -
2)
if ‘1’ in column 6
cau
se o
f cr
op
lo
ss
(co
de)
total loss
(₹)
if ‘2’ in column 3
did
you
rec
eiv
e cl
aim
am
oun
t in
tim
e (c
od
e)
if ‘1’ or
‘2’ in
column 9,
claim
amount
received
(₹)
if ‘
3’
in c
olu
mn
9,
reas
on
fo
r no
t
rece
ivin
g c
laim
(co
de)
(1) (2) (3) (4) (5) (6) (7) (8) (9) (10) (11)
1.
2.
3.
4.
CODES FOR BLOCK 15
col. (3): did you have this crop insured?: insured only when received loan -1, insured additionally - 2,
not insured - 3
col. (5): reason for not insuring: not aware - 01, not aware about availability of facility - 02, not interested -
03, no need - 04, insurance facility not available - 05, lack of resources for premium payment - 06, not satisfied
with terms & conditions - 07, nearest bank at a long distance - 08, complex procedures - 09,
delay in claim payment - 10, others - 11
Col. (7): cause of crop loss: inadequate rainfall/drought - 1, disease/insect/animal - 2, other natural causes
(fire, lighting, storm, cyclone, flood, earthquake etc.) - 3, others - 9.
col. (9): did you receive claim amount in time?: received in time - 1, received but delayed - 2, not received -
3
col. (11): reason for not receiving claim: cause outside coverage - 1, documents lost - 2, others - 9

visit 2 Schedule 33 : 143
RURAL CENTRAL
STATE
GOVERNMENT OF INDIA
NATIONAL SAMPLE SURVEY OFFICE
SOCIO-ECONOMIC SURVEY
SEVENTIETH ROUND : JANUARY TO DECEMBER 2013
SCHEDULE 33: SITUATION ASSESSMENT SURVEY OF AGRICULTURAL HOUSEHOLDS
VISIT 2
[0] descriptive identification of sample household
1. state/u.t.: 5. hamlet name:
2. district: 6. name of head of household:
3. tehsil: 7. name of informant:
4. village name:
[1] identification of sample household
item
no. item Code
item
no. Item code
1. srl. no. of sample village 12. FOD sub-region
2. round number 7 0 13. sample hamlet-group number
3. schedule number 3 3 14. second stage stratum number
4. sample (central - 1, state - 2) 15. sample household number
5. sector (rural - 1) 1 16. visit number 2
6. NSS region
7. district
17. serial number of informant #
(as in column 1 of block 4)
8. stratum 18. response code
9. sub - stratum 19. survey code
10. sub-round
20. reason for casualty
11. sub-sample
CODES FOR BLOCK 1
item18: response code: informant: co-operative and capable -1, co-operative but not capable -2, busy -3,
reluctant - 4, others - 9.
item 19: survey code: original – 1, casualty – 3.
item 20: reason for casualty: informant busy -1, members away from home -2, informant non-cooperative -3,
others – 9
* tick mark ( ) may be put in the appropriate place. # if the informant is not a household member, code 99 will be recorded.

visit 2 Schedule 33 : 144
[2] particulars of field operations
srl. no. Item
field investigator (FI)
/assistant superintending
officer (ASO)
field officer (FO)/
superintending officer
(SO)
(1) (2) (3) (4)
1 (a)
i) name (block letters)
ii) code
iii) signature
1 (b)
i) name (block letters)
ii) code
iii) signature
2.
date(s) of : DD MM YY DD MM YY
(i) survey/ inspection
(ii) receipt
(iii) scrutiny
(iv) despatch
3. number of additional sheets attached
4.
total time taken to canvass the schedule
by the team of investigators (FI/ASO)
(in minutes)
5. number of investigators (FI/ASO) in the
team who canvassed the Schedule
6.
whether any remarks
have been entered by
FI/ ASO/
supervisory officer
(yes –1, no-2)
(i) in block 16/17
(ii) elsewhere in
the schedule
[16] remarks by investigators (FI/ASO)
[17] comments by supervisory officer(s)

visit 2 Schedule 33 : 145

visit 2 Schedule 33 : 146
[4] demographic and other particulars of household members
srl. no. name of the member relation to
head (code)
sex
(male-1,
female-2)
age (years) general
educational
level (code)
whether
attended any
formal training in
agriculture?
(yes - 1, no - 2)
during the reference period, January to June 2013
whether
stayed away
from usual place of
residence for
15 days or more for
purpose of
employment (yes-1, no-2)
principal activity subsidiary economic
activity wages and
salary earnings
(received or
receivable) for the work
done (₹)
status code
NIC-08
code
(2-digits)
status code
NIC-08
code
(2-digits)
(1) (2) (3) (4) (5) (6) (7) (8) (9) (10) (11) (12) (13)
CODES FOR BLOCK 4
Col. (3): relation to head: self-1, spouse of head-2, married child-3, spouse of married child-4, unmarried child-5, grandchild-6, father/mother/father-in-law/mother-in-
law-7, brother/sister/brother-in-law/sister-in-law/other relatives-8, servants/employees/other non-relatives-9
Col. (6): general education code : not literate -01,literate without formal schooling: through EGS/NFEC/AEC - 02, through TLC -03, others- 04; literate with formal
schooling: below primary -05, primary -06, middle -07, secondary -08, higher secondary -10, diploma/certificate course -11, graduate -12, postgraduate and above -13
Col.(9), (11): status code: worked in h.h. enterprise (self-employed): own account worker -11, employer-12, worked as helper in h.h. enterprise (unpaid family worker) -
21; worked as regular salaried/ wage employee -31,worked as casual wage labour: in public works other than MGNREG works –41, in MGNREG works – 42,, in other
types of work -51; did not work but was seeking and/or available for work -81, attended educational institution -91, attended domestic duties only -92, attended domestic
duties and was also engaged in free collection of goods (vegetables, roots, firewood, cattle feed, etc.), sewing, tailoring, weaving, etc. for household use -93, rentiers,
pensioners , remittance recipients, etc. -94, not able to work due to disability -95, others (including begging, prostitution, etc.) -97.
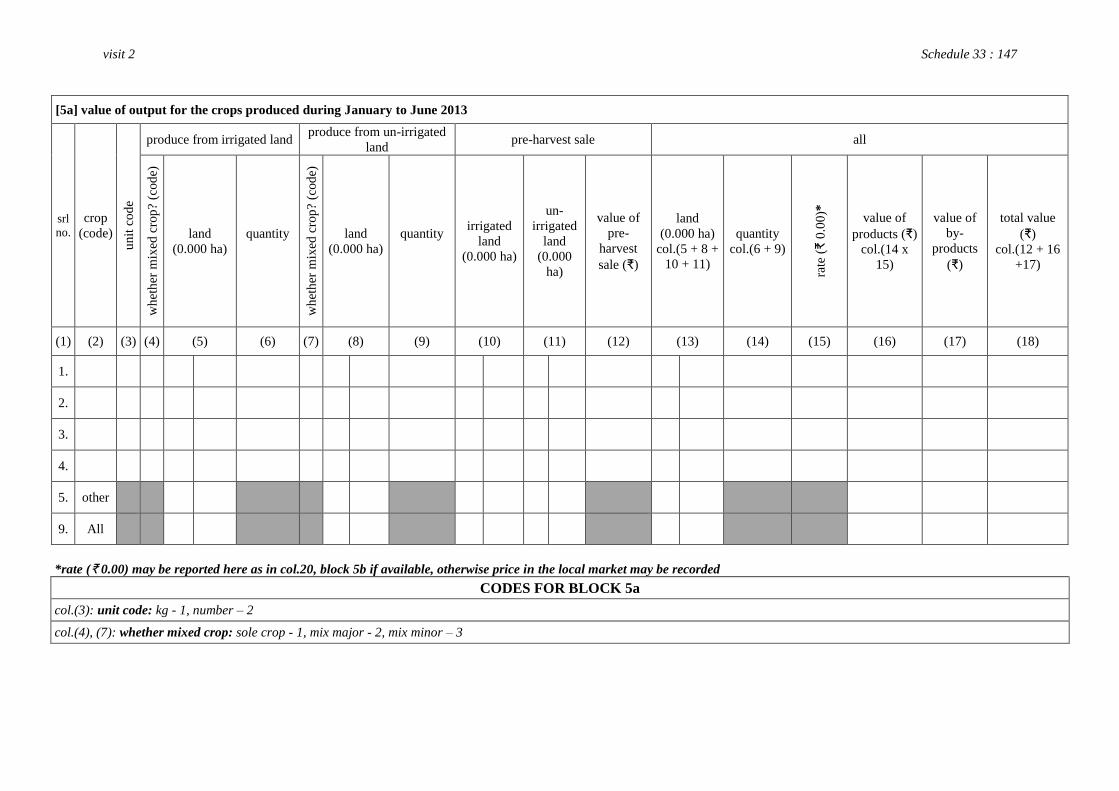
visit 2 Schedule 33 : 147
[5a] value of output for the crops produced during January to June 2013
srl
no. crop
(code)
un
it c
od
e produce from irrigated land
produce from un-irrigated
land pre-harvest sale all
wh
eth
er m
ixed
cro
p? (
cod
e)
land
(0.000 ha)
quantity
wh
eth
er m
ixed
cro
p? (
cod
e)
land
(0.000 ha)
quantity
irrigated
land
(0.000 ha)
un-
irrigated
land
(0.000
ha)
value of
pre-
harvest
sale (₹)
land
(0.000 ha)
col.(5 + 8 +
10 + 11)
quantity
col.(6 + 9)
rate
(₹
0.0
0)*
value of
products (₹)
col.(14 x
15)
value of
by-
products
(₹)
total value
(₹)
col.(12 + 16
+17)
(1) (2) (3) (4) (5) (6) (7) (8) (9) (10) (11) (12) (13) (14) (15) (16) (17) (18)
1.
2.
3.
4.
5. other
9. All
*rate (₹ 0.00) may be reported here as in col.20, block 5b if available, otherwise price in the local market may be recorded
CODES FOR BLOCK 5a
col.(3): unit code: kg - 1, number – 2
col.(4), (7): whether mixed crop: sole crop - 1, mix major - 2, mix minor – 3

visit 2 Schedule 33 : 148
[5b] disposition of crops produced during January to June 2013
srl
no
. as
in
co
l.(1
), b
lock
[5
a]
crop
code as
in
col. (2),
block
[5a]
un
it c
od
e as
in
co
l.(3
) b
lock
[5a]
first major disposal second major disposal third major disposal other disposals all
rate
(₹
0.0
0)
col.
19
/ c
ol.
18
agen
cy (
cod
e)
is s
atis
fact
ory
? (c
od
e)
quantity
sold
sale value
(₹)
agen
cy (
cod
e)
is s
atis
fact
ory
? (c
od
e)
quantity
sold
sale value
(₹)
agen
cy (
cod
e)
is s
atis
fact
ory
? (c
od
e)
quantity
sold
sale value
(₹)
quantity
sold
sale value
(₹)
quantity
sold
col.(6 +
10 + 14 +
16)
sale value
(₹)
col.(7 + 11
+ 15 + 17)
(1) (2) (3) (4) (5) (6) (7) (8) (9) (10) (11) (12) (13) (14) (15) (16) (17) (18) (19) (20)
1.
2.
3.
4.
CODES FOR BLOCK 5b
col.(3): unit code: kg-1, number-2
col.(4), (8), (12): agency: local private - 1, mandi - 2, input dealers - 3, cooperative& govt. agency - 4, processors - 5, others - 9.
col.(5), (9), (13): is satisfactory: satisfactory - 1, not satisfactory: lower than market price - 2, delayed payments - 3, deductions for loans borrowed - 4, faulty weighing and grading - 5,
other cause of dissatisfaction – 9

visit 2 Schedule 33 : 149
crop codes
paddy ……………… 0101 plum………………… 0612 groundnut……………... 1001
jowar ……………… 0102 kiwi fruit……………. 0613 castorseed……………. 1002
bajra ……………….. 0103 chiku ……………… 0614 sesamum (til) ……….... 1003
maize ……………… 0104 papaya ……………… 0615 rapeseed& mustard ……. 1004
ragi ……………….. 0105 guava…………………. 0616 linseed ……………….. 1005
wheat ……………… 0106 almond……………….. 0617 coconut……………….. 1006
barley ……………… 0107 walnut………………… 0618 sunflower…………….. 1007
small millets ……… 0108 cashewnuts……………. 0619 safflower…………….. 1008
other cereals ……….. 0188 apricot………………… 0620 soyabean…………….. 1009
gram ………………. 0201 jackfruit……………… 0621 nigerseed……………... 1010
tur (arhar) …………. 0202 lichi……………………. 0622 oil palm………………. 1011
urad ……………….. 0203 pineapple……………… 0623 other oilseeds………… 1088
moong …………….. 0204 watermelon……………. 0624 cotton………………… 1101
masur ……………… 0205 musk melon…………… 0625 jute…………………… 1102
horsegram …………. 0206 bread fruits……………. 0626 mesta…………………. 1103
beans (pulses) …….. 0207 ber……………………... 0627 sunhemp……………... 1104
peas (pulses) ……… 0208 bel……………………... 0628 other fibres…………… 1188
other pulses ………. 0288 mulberry (sahatoot)…… 0629 indigo………………… 1201
sugarcane ………….. 0401
aonla (amla)…………… 0630
other dyes &
tan.materials 1288
palmvriah ………….. 0402 other fruits…………….. 0688 opium………………… 1301
other sugar crops ….. 0488 potato…………………. 0701 tobacco………………. 1302
pepper (black) ……... 0501 tapioca (cassava)……… 0702 other drugs & narcotics 1388
chillies …………….. 0502 sweet potato…………… 0703 guar…………………... 1401
ginger………………. 0503 yam……………………. 0704 oats………………….. 1402
turmeric……………. 0504 elephant foot yam…….. 0705 green manures……….. 1403
cardamom (small)….. 0505 colocasia/arum………… 0706 other fodder crops…… 1488
cardamom (large)….. 0506 other tuber crop……….. 0707 tea……………………. 1501
betelnuts (arecanuts).. 0507 onion………………….. 0708 coffee………………… 1502
garlic……………….. 0508 carrot………………….. 0709 rubber………………... 1503
coriander……………. 0509 radish………………… 0710 other plantation crops... 1588
tamarind…………….. 0510 beetroot……………….. 0711 orchids……………….. 1601
cumin seed………….. 0511 turnip (shalgam)………. 0712 rose…………………... 1602
fennel / anise seed….. 0512 tomato………………… 0713 gladiolus……………... 1603
nutmeg……………… 0513 spinach……………….. 0714 carnation…………….. 1604
fenugreek…………… 0514 amaranths (chaulai)…… 0715 marigold……………... 1605
cloves……………….. 0515 cabbage………………... 0716 other flowers………… 1688
cinnamon…………… 0516 other leafy vegetable….. 0717 asgandh………………. 1701
cocoa……………….. 0517 brinjal…………………. 0718 isabgol……………….. 1702
kacholam……………. 0518 peas (vegetable) (green) 0719 sena…………………... 1703
beetlvine…………….. 0519 lady’s finger (bhindi)….. 0720 moosli……………….. 1704
othercondi. & spices.. 0588 cauliflower…………….. 0721 other medicinal plant… 1705
mangoes…………….. 0601 cucumber……………… 0722 lemon grass………….. 1711
orange and kinu…….. 0602 bottle gourd (lauki)……. 0723 mint………………….. 1712
mosambi……………. 0603 pumpkin………………. 0724 menthol……………… 1713
lemon / acid lime…… 0604 bitter gourd……………. 0725 eucalyptus…………… 1714
othercitrous fruits….. 0605 other gourds…………… 0726 other aromatic plant….. 1715
banana………………. 0606 vench (guar)…………... 0727 canes…………………. 1801
table grapes…………. 0607 beans (green)………….. 0728 bamboos……………... 1802
wine grapes (black)…. 0608 drumstick……………… 0729 other non-food crops… 1888
apple………………… 0609 green chillies………….. 0730
pear…………………. 0610 other vegetables……….. 0788
peaches……………… 0611 other food crop……….. 0801

visit 2 Schedule 33 : 150
[6] particulars of inputs and their expenses for crop production during January to June 2013
srl
no. inputs
srl. no. of
crop as in
col. 1 of
block [5a]
crop code
as in col.
2 of
block
[5a]
how
procured?
(code)
agency
(code)
quality
(code)
expenses
(₹)
(1) (2) (3) (4) (5) (6) (7) (8)
1.
seeds
1.
2. 2.
3. 3.
4. 4.
5. 5. other
6. fertilisers
7. manures
8. plant protection chemicals
9. diesel
10. electricity
11. labour human
12. labour animal
13. irrigation
14. minor repair and maintenance of machinery and equipment
15. interest
16. cost of hiring of machinery
17. lease rent for land
18. other expenses
19. total (1 to 18)
CODES FOR BLOCK 6
col.(5): how procured: farm saved - 1, exchange - 2, purchase – 3, borrowed – 4, others – 9
col.(6): agency: own farm- 1, local trader - 2, input dealer - 3, cooperative & govt. agency - 4, others – 9
col.(7): quality: good - 1, satisfactory - 2, poor - 3, don’t know– 4

visit 2 Schedule 33 : 151
[7] disposition of produce and value of outputs on farming of animals during last 30 days
srl.
no.
item description
first major disposal second major disposal other disposals* all
agen
cy (
cod
e)
is s
atis
fact
ory
?
(co
de)
quantity
sold
sale
value
(₹)
agen
cy (
cod
e)
is s
atis
fact
ory
?
(co
de)
quantity
sold
sale value
(₹)
quantity
sold
value
(₹)
qu
anti
ty s
old
(co
l. 5
+9
+1
1)
sale value
(₹)
(col. 6 +
10 + 12)
(1) (2) (3) (4) (5) (6) (7) (8) (9) (10) (11) (12) (13) (14)
1. milk (dairy, sheep, goat, etc.) (litre)
2. egg (poultry, duckery, etc.) (no.)
3. live animals (e.g., cattle, sheep, goat,
pig, poultry & duckery, etc.)
4. wool (sheep, goat, etc.) (kg)
5. fish (kg)
6. honey (kg)
7. hide, bones, manure
8. other receipts (₹)
9. total receipts (1 to 8)
*other includes retention for future sell, own consumption, use as animal seed, etc
CODES FOR BLOCK 7
col.(3) & (7): agency: directly to other household - 1, local trader - 2, commission agent -3, cooperative& govt. agency - 4, processor –5, others – 9
col.(4) & (8): is satisfactory: satisfactory – 1, not satisfactory: lower than market price – 2, delayed payments – 3, deductions for loans borrowed – 4, faulty weighing and
grading – 5, other cause of dissatisfaction – 9
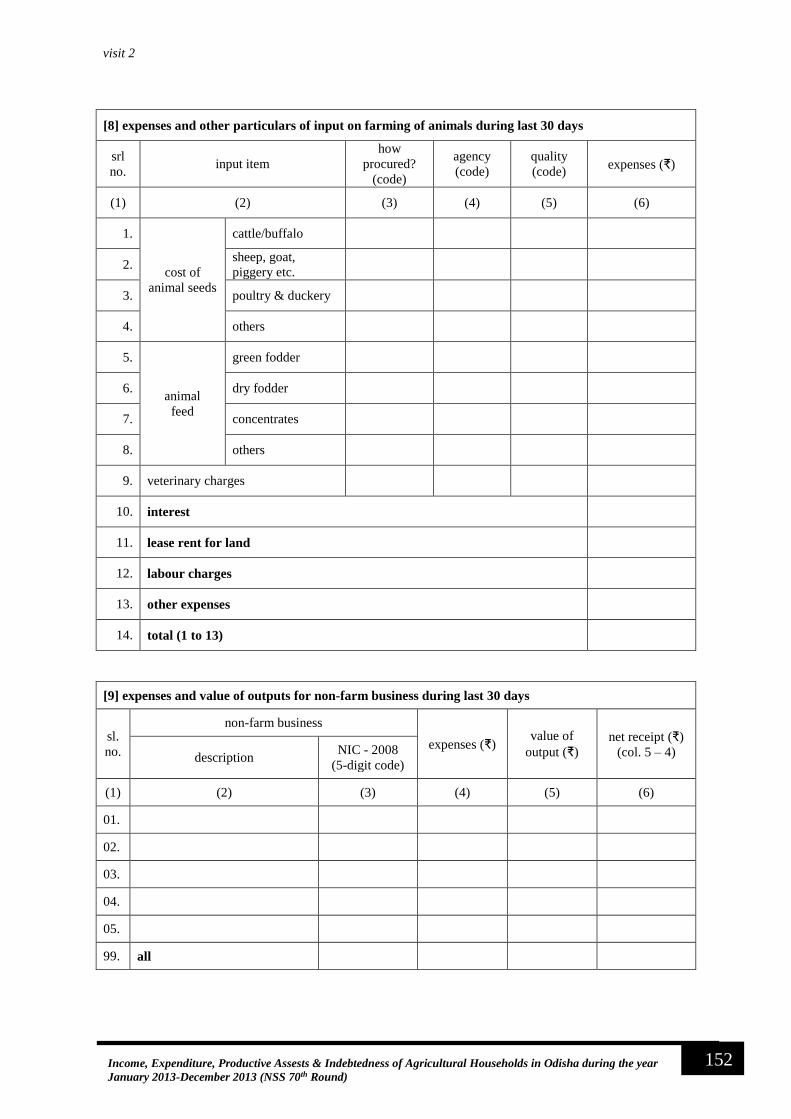
visit 2 Schedule 33 : 152
152 Income, Expenditure, Productive Assests & Indebtedness of Agricultural Households in Odisha during the year
January 2013-December 2013 (NSS 70th Round)
[8] expenses and other particulars of input on farming of animals during last 30 days
srl
no. input item
how
procured?
(code)
agency
(code)
quality
(code) expenses (₹)
(1) (2) (3) (4) (5) (6)
1.
cost of
animal seeds
cattle/buffalo
2. sheep, goat,
piggery etc.
3. poultry & duckery
4. others
5.
animal
feed
green fodder
6. dry fodder
7. concentrates
8. others
9. veterinary charges
10. interest
11. lease rent for land
12. labour charges
13. other expenses
14. total (1 to 13)
[9] expenses and value of outputs for non-farm business during last 30 days
sl.
no.
non-farm business
expenses (₹) value of
output (₹)
net receipt (₹)
(col. 5 – 4) description NIC - 2008
(5-digit code)
(1) (2) (3) (4) (5) (6)
01.
02.
03.
04.
05.
99. all

visit 2 Schedule 33 : 153
153 Income, Expenditure, Productive Assests & Indebtedness of Agricultural Households in Odisha during the year
January 2013-December 2013 (NSS 70th Round)
CODES FOR BLOCK 8
col.(3): how procured: farm saved - 1, exchange - 2, purchase - 3, borrowed - 4, others - 9
col.(5): agency: own farm - 1, local trader - 2, input dealer - 3, cooperative & govt. agency - 4, others - 9
col.(6): quality: good - 1, satisfactory - 2, poor - 3, don’t know - 4
[10] purchase and sale of productive assets during January to June 2013
srl.
no. item
expenditure incurred (₹) receipt
from sale
(₹)
total (₹)
(3+4-5) purchase
major repair/
improvement
(1) (2) (3) (4) (5) (6)
for farm business
1. land
2. building for farm business
3. fish tank
4. livestock (cattle, buffalo, sheep, goats etc.)
5. poultry/duckery etc.
6. sickle, chaff-cutter, axe, spade, chopper,
plough, harrow etc.
7. power tiller, tractor etc.
8. thresher, cane crusher, oil crusher etc.
9. pump and other water lifting equipment
10. others
for non-farm business
11. land and building for non-farm business
12. machinery and equipment
13. others
14. residential building including land
15. total (1 to 14)
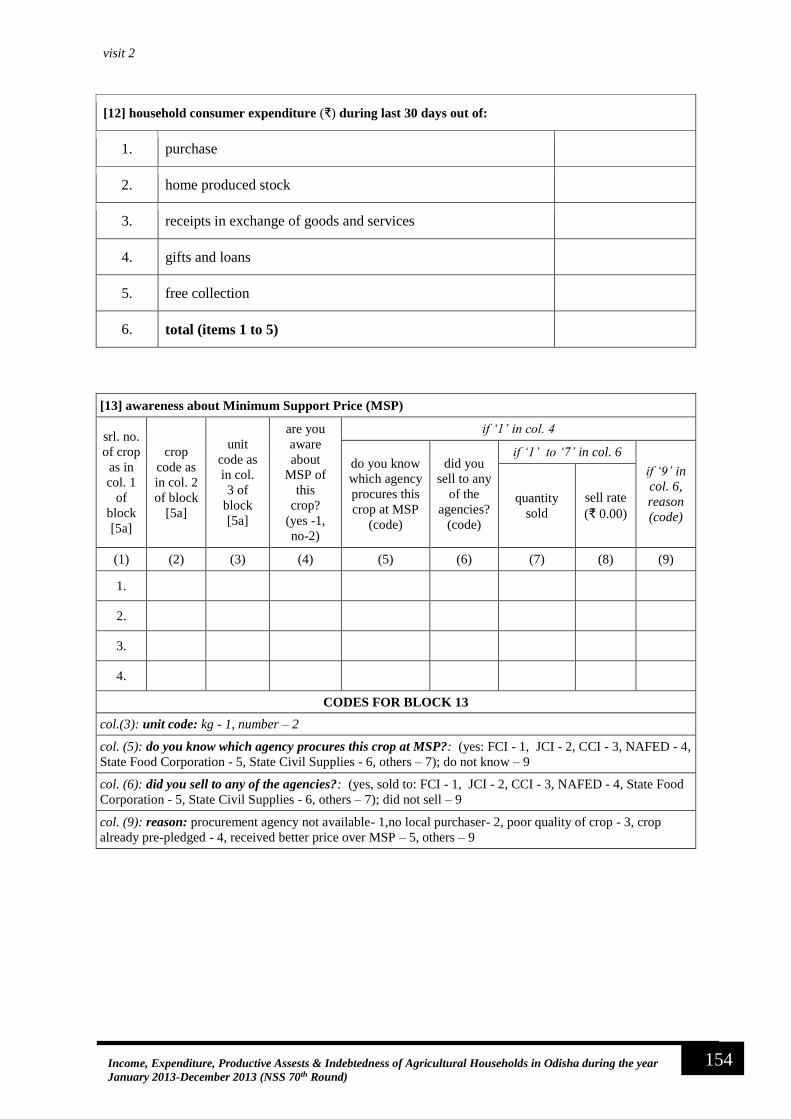
visit 2 Schedule 33 : 154
154 Income, Expenditure, Productive Assests & Indebtedness of Agricultural Households in Odisha during the year
January 2013-December 2013 (NSS 70th Round)
[12] household consumer expenditure (₹) during last 30 days out of:
1. purchase
2. home produced stock
3. receipts in exchange of goods and services
4. gifts and loans
5. free collection
6. total (items 1 to 5)
[13] awareness about Minimum Support Price (MSP)
srl. no.
of crop
as in
col. 1
of
block
[5a]
crop
code as
in col. 2
of block
[5a]
unit
code as
in col.
3 of
block
[5a]
are you
aware
about
MSP of
this
crop?
(yes -1,
no-2)
if ‘1’ in col. 4
do you know
which agency
procures this
crop at MSP
(code)
did you
sell to any
of the
agencies?
(code)
if ‘1’ to ‘7’ in col. 6
if ‘9’ in
col. 6,
reason
(code)
quantity
sold
sell rate
(₹ 0.00)
(1) (2) (3) (4) (5) (6) (7) (8) (9)
1.
2.
3.
4.
CODES FOR BLOCK 13
col.(3): unit code: kg - 1, number – 2
col. (5): do you know which agency procures this crop at MSP?: (yes: FCI - 1, JCI - 2, CCI - 3, NAFED - 4,
State Food Corporation - 5, State Civil Supplies - 6, others – 7); do not know – 9
col. (6): did you sell to any of the agencies?: (yes, sold to: FCI - 1, JCI - 2, CCI - 3, NAFED - 4, State Food
Corporation - 5, State Civil Supplies - 6, others – 7); did not sell – 9
col. (9): reason: procurement agency not available- 1,no local purchaser- 2, poor quality of crop - 3, crop
already pre-pledged - 4, received better price over MSP – 5, others – 9

visit 2 Schedule 33 : 155
155 Income, Expenditure, Productive Assests & Indebtedness of Agricultural Households in Odisha during the year
January 2013-December 2013 (NSS 70th Round)
[14] access to technical advice for any of the crops listed in Block [5a]
srl.
no. source of technical advice
wh
eth
er a
cces
sed
(y
es-1
, n
o-2
)
if ‘
2’
in c
ol.
3,
reas
on
fo
r no
t
acce
ssin
g (
cod
e)
if ‘1’ in col. 3
frequency
of contact
(code)
wh
eth
er r
ecom
men
ded
adv
ice
ado
pte
d?(
yes
- 1
,no
- 2
)
if ‘
2’
in c
ol.
6, re
aso
n f
or
no
t
ado
pti
ng (
cod
e)
if ‘1’ in col. 6
use
fuln
ess
of
adv
ice
(co
de)
ho
w w
as t
he
imp
act
(co
de)
(1) (2) (3) (4) (5) (6) (7) (8) (9)
1. extension agent
2. krishi vigyan Kendra
3. agricultural university
/college
4.
private commercial agents
(including drilling
contractor)
5. progressive farmer
6. radio/tv/newspaper/internet
7.. veterinary department
8. NGO
CODES FOR BLOCK 14
col.(4): reasons for not accessing : not aware - 1, not available - 2, not required - 3, others - 9.
col.(5): frequency of contact: daily - 1, weekly - 2, monthly - 3, seasonally - 4, need based - 5,
casual contact - 6.
col.(7): reasons for not adopting: lack of financial resources - 1, non-availability of input and physical
resources - 2, lack of technical advice for follow-up - 3, difficulty in storage, processing and marketing of
products - 4, others - 9.
col.(8): usefulness of advice: useful - 1, not useful - 2, don’t know– 3
col.(9): impact: beneficial - 1, moderately beneficial - 2, no effect - 3, harmful – 4, don’t know– 5

visit 2 Schedule 33 : 156
156 Income, Expenditure, Productive Assests & Indebtedness of Agricultural Households in Odisha during the year
January 2013-December 2013 (NSS 70th Round)
[15] particulars of other aspects of farming during January to June 2013 sr
l. n
o.
of
crop
as
in c
ol.
1 o
f blo
ck 5
a
cro
p c
od
e as
in
co
l. 2
of
blo
ck5
a
did
you
hav
e th
is c
rop i
nsu
red?
(co
de)
if ‘2’ in
column 3,
total
premium
paid (₹)
if ‘
3’
in c
olu
mn
3,
rea
son
fo
r n
ot
insu
rin
g (
cod
e)
hav
e yo
u e
xp
erie
nce
d a
ny
cro
p l
oss
?
(yes
- 1
, n
o -
2)
if ‘1’ in column 6
cau
se o
f cr
op
lo
ss
(co
de)
total loss
(₹)
if ‘2’ in column 3
did
you
rec
eiv
e cl
aim
am
oun
t in
tim
e (c
od
e)
if ‘1’ or
‘2’ in
column 9,
claim
amount
received
(₹)
if ‘
3’
in c
olu
mn
9,
reas
on
fo
r no
t
rece
ivin
g c
laim
(co
de)
(1) (2) (3) (4) (5) (6) (7) (8) (9) (10) (11)
1.
2.
3.
4.
CODES FOR BLOCK 15
col. (3): did you have this crop insured?: insured only when received loan -1, insured additionally - 2,
not insured - 3
col. (5): reason for not insuring: not aware - 01, not aware about availability of facility - 02, not interested -
03, no need - 04, insurance facility not available - 05, lack of resources for premium payment - 06, not satisfied
with terms & conditions - 07, nearest bank at a long distance - 08, complex procedures - 09,
delay in claim payment - 10, others - 11
Col. (7): cause of crop loss: inadequate rainfall/drought - 1, disease/insect/animal - 2, other natural causes
(fire, lighting, storm, cyclone, flood, earthquake etc.) - 3, others - 9.
col. (9): did you receive claim amount in time?: received in time - 1, received but delayed - 2, not received -
3
col. (11): reason for not receiving claim: cause outside coverage - 1, documents lost - 2, others - 9