hydrogen production from steam reforming of light ...
309
HYDROGEN PRODUCTION FROM STEAM REFORMING OF LIGHT HYDROCARBONS IN AN AUTOTHERMIC SYSTEM
-
Upload
khangminh22 -
Category
Documents
-
view
0 -
download
0
Transcript of hydrogen production from steam reforming of light ...
HYDROGEN PRODUCTION FROM STEAM
REFORMING OF LIGHT HYDROCARBONS
IN AN AUTOTHERMIC SYSTEM
HYDROGEN PRODUCTION FROM STEAM
REFORMING OF LIGHT HYDROCARBONS IN
AN AUTOTHERMIC SYSTEM
by
LIYAN MA
B.E. (Chem.)(Hons. 1)
A Dissertation
Submitted to the School of Chemical Engineering and Industrial Chemistry,
University of New South Wales, in partial fulfilment of the requirements for the
Degree of Doctor of Philosophy.
University of New South Wales
May, 1995
Doctor of Philosophy ( 1995) University of ~ew South Wales
(School of Chemical Engineering Sydney, Australia
and Industrial Chemistry)
TITLE: Hydrogen Production from Steam Reforming of Light
Hydrocarbons in an Autothermic System
AUTHOR: LIY AN MA, B.E. (Chem.)(Hons.l)
SUPERVISORS: Professor David L. Trimm
Doctor Adesoji A. Adesina
No. of Pages: i-xxiv; l-284
RESEARCH PAPERS AND PUBLICATIONS:
1. L. Ma, D.L. Trimm, C.J. Jiang and N.W. Cant, "The production of hydrogen by oxidation and steam reforming of methane over platinum based catalysts", Proc. 6th Asian Pacific Confederation of Chemical Engineering Conference combined with the 21st Australian and New Zealand Chemical Engineering Conference, APCChE & CHEMECA'93. Melbourne. Vol.3, 93(1993).
2. L. Ma, C.J. Jiang, A.A. Adesina, D.L. Trimm and XW. Cant, "Studies of hydrogen production by catalytic autothermic oxidation and steam reforming of light hydrocarbons", Proc. 22nd Australian and ~ew Zealand Chemical Engineering Conference, CHEMECA'94. Perth, Vol.l. 86(1994).
3. L. Ma, C.J. Jiang, A.A. Adesina, and D.L. Trimm, "Kinetic studies of steam reforming of light hydrocarbons over nickel based catalysts", Proc. 22nd Australian and New Zealand Chemical Engineering Conference, CHEMECA'94, Perth, Vol. I, 189(1994).
4. L. Ma, C.J. Jiang, A.A. Adesina, D.L. Trimm and M.S. Wainwright, "Autothermal reactor system for the conversion of methanol to H2 for fuel cells", Chem. Eng. Journal (in press), (1995).
ll
CANDIDATE'S CERTIFICATION
This is to certify that the work presented in this thesis was carried out in the School
of Chemical Engineering and Industrial Chemistry, The University of New South
Wales, and has not been submitted to any other university or technical institution for
a degree or award.
L. Ma
iii
THE UNIVERSITY OF NEW SOUTH SALES
DECLARATION RELATING TO DISPOSITION
OF
PROJECT REPORTffHESIS
SR P TOl
Form 1
WAIVER
This is to certify that I, ..... Ll.;I.~ ....... 11CJ.. ........ being a candidate for the degree of ..... P,~1) ....... , am fully aware of the policy of the University relating to the retention and use of higher degree project reports an these, namely that the University retains the copies submitted for examination and is free to allow them to be consulted or borrowed. Subject to the provisions of the Copyright Act, 1968, the University may issue a project report or thesis or in part, in photostat or microfilm or other copying medium.
In the light of these provtstons I grant the University Librarian permission to publish, or to authorise the publication of my project report/thesis, in whole or in part.
I also authorise the publication by University Microfilms of a 350 word abstract in Dissertation Abstracts International.
Signature ... ~ .. ~ Witness4~ .. .
Date ... ~!/..!~./1.~:. ..... .
lV
ABSTRACT
An autothermic process for hydrogen production from light hydrocarbons (C1-C3) has
been studied. The process is based on the concept that part of light hydrocarbons is
oxidised to produce heat and steam for steam reforming of the rest of hydrocarbons
to produce hydrogen. The hydrogen production system can be started at room
temperature and external heat sources are avoided.
The use of platinum based catalysts, active for oxidation, and nickel based catalysts,
for steam reforming of light hydrocarbons have been explored. Initiation of oxidation
of light hydrocarbons over platinum based catalysts was found to occur at
temperature as low as 589K, depending on the air:fuel ratio. A more reactive medium
(ie. methanol or hydrogen) was oxidised, at the beginning of the operation, to heat
the system from ambient temperature to the initiation temperature. Continuous
oxidation of part of the hydrocarbon fed produces heat for the steam reforming
reactions.
Kinetic studies of oxidation of methane, ethane and propane over a Pt/o-Al20 3
catalyst at 423-733K indicated that the oxidation rates are almost first order with
respect to hydrocarbons and negative order with respect to oxygen. Correlation of the
kinetic data for methane oxidation was interpreted by a Langmuir-Hinshelwood
model.
Kinetic studies of steam reforming of methane, ethane and propane over a Ni!Mg0-
Al203 catalyst showed that the reaction rates are almost first order with respect to
hydrocarbons and are inhibited by steam. Carbon dioxide had no effect on the steam
reforming reactions at low temperature. However, hydrogen was found to retard the
reactions of steam reforming and to accelerate the methanation rate. Methane steam
reforming rate data were also explained by a Langmuir-Hinshelwood mechanism. The
results suggested that a surface reaction between the CH2 * and 0* species is the rate
determining step.
V
Ceria was found to significantly improve the activity and decoking ability of the
nickel on alumina catalysts.
Comprehensive studies on the combined oxidation and steam reforming of light
hydrocarbons reveal that the key to optimise operation conditions is to minimise the
resistances of both heat and mass transfers in the catalyst bed. The high yields of
hydrogen can be produced efficiently using a mixed (Pt/<5-Al20 3 and Ni/Mg0-Ah03)
catalysts bed and/or a composite (Pt-Ni) catalyst bed at the feeding conditions of
CH./02: 1.4-1. 7 and of H20/CH4 : 1.1-1.4. The reaction temperature of system can
be delicately controlled by air/hydrocarbon and steam/hydrocarbon ratios. A bench
scale reactor system for the autothermic operation for hydrogen production from light
hydrocarbons (ie. methane) has been finally tested.
VI
Acknowledgments
I would like to express my gratitude to all of the people who have helped me
throughout the course of this project. In particular, I am greatly indebted to:
My research supervisor. Professor David L. Trimm, for his constant encouragement,
guidance, patience and financial support throughout this study, and Dr. Adesoji A.
Adesina, for his interest in this project and assistance with computer modelling.
Australian International Development Assistance Bureau, for the award of a
scholarship covering two years of this study, and Australian Research Council, for
the financial support for this project.
Professor Noel \Y. Cant, for his valuable suggestions and discussion, and Professor
Mark S. Wainwright. for his patience, support and friendship.
The laboratory technical staff, Mr. Philip McAuley, Mr. John Starling and Dr. Dean
Benke for their valuable technical assistance.
All my colleagues in this Department, for their cheerful and pleasant companionship.
To my husband and my daughters (Wei and Sarah) for their love and patience,
especially to my husband, Chongjun, for his great help, support and encouragement
during this long period of stress. To my parents-in-law, for their special effort, help
and understanding. and finally to my parents and all my family who encouraged and
supported me to complete my study overseas.
vu
Abstract
Acknowledgments
Table of Contents
List of Tables
List of Figures
Table of Contents Pages
V
vii
viii
XV
xviii
Chapter 1 Introduction
Chapter 2 Literature Review 4
2.1 Introduction 4
2.2 Oxidation 4
2.2.1 Oxidation of methanol 5
2.2.2 Oxidation of hydrogen 6
2.2.3 Oxidation of carbon monoxide 6
2.2.4 Oxidation of natural gas 7
2.2.4.1 Partial catalytic oxidation 8
2.2.4.2 Oxidative coupling 12
2.2.4.3 Catalytic combustion 13
2.3 Catalytic Steam Reforming 18
2.3.1 Related reactions in steam reforming of light hydrocarbons 20
2.3.1.1 Steam reforming reactions 20
2.3.1.2 The water gas shift reaction 22
2.3.1.3 Methanation of carbon oxides 24
2.3.1.4 Carbon formation or gasification reactions 25
2.3.2 Catalysts of steam reforming 29
2.3.2.1 Activity of steam reforming catalysts 29
2.3.2.2 Deactivation of steam reforming catalysts 32
2.3.2.3 The methods of solving the carbon-formation
problem 35
2.3.3 Kinetics and mechanism studies 38
2.3.3.1 Steam reforming of methane 38
2.3.3.2 Steam reforming of higher hydrocarbons 46
viii
2.3.4 The thermodynamic analysis of steam reforming reactions
of hydrocarbons 49
2.4 Autothermic Catalytic Reforming 55
2.4.1 Autothermic catalytic reforming of methanol 55
2.4.2 Autothermic catalytic reforming of light hydrocarbons 57
2.5 The Objectives of This Project 59
Chapter 3 Experimental Techniques 61
3. 1 Materials 61
3 .1.1 Gases 61
3.1.2 Chemicals 62
3.2 Catalyst Preparation and Pretreatment 62
3.2.1 Support preparation 62
3.2.2 Preparation of supported metal (ie. Ni, Pt} catalysts 63
3.2.3 Preparation of dual metal (ie. Ni-Ce, Pt-Ni} catalysts 65
3.2.4 Catalyst pretreatment 66
3.3 Experimental Apparatus 67
3.3 .1 Fixed bed reactor 67
3.3.2 Temperature control system 71
3.3.3 Flow system 71
3.3.4 Product analysis 73
3.4 Experimental Procedures 75
3.4.1 Oxidation of light hydrocarbons 75
3.4.2 Steam reforming of light hydrocarbons 76
3.4.3 Autothermic oxidation/steam reforming of light
hydrocarbons
3.5 Catalyst Characterisations
3.5.1 Catalyst composition by X-ray fluorescence (XRF)
3.5.2 Surface area measurement
3.5.2.1 Total surface area
3.5.2.2 Metallic surface area
3.5.2.3 Pore size distribution of solid
76 '
78
78
79
79
80
81
lX
Chapter 4
4.1
4.2
4.3
3.5.3 X-ray diffraction (XRD)
3.5.4 Temperature programmed reduction (TPR)
3.5.5 Thermogravimetric analysis (TGA)
Oxidation of Methane, Ethane and Propane
Introduction
Experimental
4.2.1 Blank test
4.2.2 Measurement of the initiation temperatures
4.2.3 Kinetic measurements
Results and Discussions
4.3.1
4.3.2
4.3.3
4.3.4
Oxidation of methane, ethane and propane over Pt/8-al2o3
4.3.1.1 Comparison of "light Off' temperatures of
oxidation of individual hydrocarbons
4.3.1.2 Effect of hydrocarbon to oxygen ratios on the
"light off' temperatures
4.3.1.3 Effect of hydrocarbon to oxygen ratios (HC/0~
on the oxidation product distribution
Oxidation of methane, ethane and propane over nickel
based catalysts
Comparison of activities of Pt/8-Al20 3 and Ni/Mg0-Al20 3
for Oxidation of Hydrocarbons
Kinetic studies of oxidation of methane, ethane and
propane
4.3.4.1 Power-Law methods of describing the oxidation
kinetics of methane, ethane and propane
4.3.4.2 Theoretical Approach to the Kinetics of
Oxidation
4.3.4.3 Simulation of the Catalytic Reactor Bed for
Hydrocarbon Oxidation
4.4 Conclusions
Chapter 5 Steam Reforming of Methane, Ethane and Propane
5.1 Introduction
83
85
86
87
87
88
88
88
89
91
91
91
93
97
99
106
107
109
120
130
133
135
135
X
5.2 Experimental 136
5.2.1 Blank Test 136
5.2.2 Steam Reforming of Light Hydrocarbons 136
5.2.3 Kinetic Measurements of the Steam Reforming of Methane,
Ethane and Propane 137
5.3 Results and Discussions 139
5.3.1 Steam reforming catalysts 139
5.3.1.1 Activity comparison 139
5.2.1.2 Reduction of nickel based catalysts 141
5.3.1.2.1 TPR profiles 141
5.3.1.2.2 Effect of reducing media on activities
of nickel based catalysts 143
5.3.1.3 Effect of steam treatment on the activity of
platinum based catalysts at high temperatures 146
5.3.2 Effect of operating conditions on steam reforming reactions 148
5.3.2.1 Comparison of "light out" temperatures of
steam reforming of methane, ethane and propane 148
5.3.2.1.1 The light out temperatures of steam reforming
of light hydrocarbons (C1-C3) over a Pt/Al20 3
catalyst 148
5.3.2.1.2 The light out temperatures of light
hydrocarbons (C1-C3) over nickel based
catalysts 149
5.3.2.2 The effect of reaction temperature on product
(dry) distribution of steam reforming of light
hydrocarbons 152
5.3.2.2.1 Steam reforming over a platinum based
catalyst 152
5.3.2.2.2 Steam reforming over a nickel based
catalyst 154
5.3.2.3 Effect of steam to carbon ratios in the feedstock
on steam reforming reactions 157
Xl
5.3.2.3.1 Effect of steam to carbon ratios in the
feedstock on steam reforming reactions at
varied space velocities
5.3.2.3.2 Effect of steam to carbon ratios in the
feedstock on steam reforming reactions at
158
constant space velocity 160
5.3.3 Kinetic studies of steam reforming of methane,
ethane and propane over a ni/mgo-al2o3 catalyst 163
5.3.3.1 Experimental measurements 163
5.3.3.2 Theoretical approach to the kinetics of steam
reforming 172
5.3.3.3 Application of the kinetic models 179
5.4 Conclusions 182
Chapter 6 Ceria Promoted-nickel on Alumina Catalysts for Steam
Reforming of Light Hydrocarbons 185
6.1 Introduction 185
6.2 Experimental 186
6.2.1 Catalyst preparation
6.2.2 Catalyst characterisation
6.2.3 Catalyst evaluation
6.3 Results and Discussions
6.3.1 Physico-chemical Properties of the Catalysts
6.3.2 The anti-coking abilities of the catalysts
6.3.3 The effect of ceria added to nickel/alumina
catalysts on the product selectivity of methane
186
187
187
187
190
steam reforming 193
6.4 Conclusions 196
Chapter 7 Hydrogen Production from Autothermic Steam Reforming
of Light Hydrocarbons at Ambient Temperature 197
7.1 Introduction 197
7.2 Experimental 198
7.2.1 Catalysts 198
Xll
7 .2.2 Experimental Procedures
7.3 Results and Discussions
7.3.1 Start-up of the System
7.3.1.1 Adiabatic calculation to predict the
amount of hydrogen or methanol required for
the initiation
7.3.1.2 Experimental Confirmation
7.3.1.2.1 Methanol as the Initiator
7.3.1.2.1 Hydrogen as the Initiator
7.3.2 Configuration of the supported Pt and Ni catalysts
in a tubular reactor
7.3.2.1 The Dual Bed System
7.3.2.2 A mixed bed system
7.3.2.3 An uniform bed system using a composite
metal (Pt-Ni) catalyst
7.3.2.4 Comparisgn of the working efficiencies of
the different catalyst beds
7.3.3 Optimisation of the operation conditions
7.3.3.1 Modelling
7.3.3.1.1 Mass balance analysis
7.3.3.1.2 Thermodynamic calculations
7 .3.3.2 Experimental confirmation
7.3.4 Testing a bench-scale autothermic reactor system
for conversion of light hydrocarbons to hydrogen
7.3.4.1 Experimental
7.3.4.2 Results and discussions
7.4 Conclusions
Chapter 8 Conclusions and Recommendations
8.1 Conclusions
8.2 Recommendations
199
200
200
203
.203
203
204
206
207
209
211
213
216
216
216
219
224
226
226
228
232
234
234
237
Xlll
References
Appendixes
Appendix I
Appendix II
Kinetic data of catalytic oxidation of methane,
ethane and propane over a Pt/~-Al203 catalyst
Derivation of Langmuir-Hinshelwood models (4-7-11)
for methane oxidation over a Pt/o-Al20 3 catalyst
Appendix Ill Kinetic data for correlation of Langmuir-Hinshelwood
kinetic models (I-VI) for methane oxidation
Appendix IV Derivation of Equations 4-23-4-25
Appendix V Calculation of equilibrium conversion and dry-gas
compositions for methane steam reforming
Appendix VI Kinetic data measured from steam reforming of
methane, ethane and propane over Ni/Mg0-Al20 3
in this study
Appendix VII Data used for correlation of Langmuir-Hinshelwood
models (1-5) for steam reforming of methane over
238
250
250
253
263
264
265
269
a Ni/Mg0-Al20 3 catalyst 272
Appendix VIII Solution of the equations (5-7) and (5-8) in Chapter 5 273
Appendix IX Derivation of the equations 7-1-4 283
xiv
List of Tables
pages
Table 2.1 Catalysts used for oxidative conversion of methane to syngas. 11
Table 2.2 Kinetics of catalytic oxidation of light hydrocarbons. 16
Table 2.3 Kinetic parameters on catalytic oxidation of hydrocarbons over different catalysts. 17
Table 2.4 Kinetic parameters of steam reforming of methane at 733-823K, 1 atm (adapted from [115]). 42
Table 2.5 Kinetics of methane steam reforming. 44
Table 2.6 Thermodynamic properties of the reactants and the products in steam reforming of hydrocarbons at 298K [151]. 51
Table 2.7 The standard free energy change (t..GT. 0• kJ/mol) for the various reaction
during steam reforming of hydrocarbons. 53
Table 2.8 The equilibrium constants for the possible reactions in steam reforming of hydrocarbons. 54
Table 3.1 Gas specification. 61
Table 3.2 Chemicals specification. 62
Table 3.3 Gas chromatograph retention times and response factors for vanous components. 74
Table 4.1 Conditions used for measurement of the initiation temperatures of hydrocarbon oxidation. 89
Table 4.2 Conditions for the kinetic measurements of the catalytic oxidation of hydrocarbons. 90
Table 4.3 The light off temperatures (T L) needed and the maximum temperatures (T max) and the maximum conversion (XmaJ achieved at different hydrocarbon to oxygen ratios. 96
Table 4.4 Product distribution of methane oxidation at different CH/02 ratios (R).97
Table 4.5 The light off temperatures of oxidation of methane, ethane and propane over Ni/Mg0-Al20 3 catalyst. 100
XV
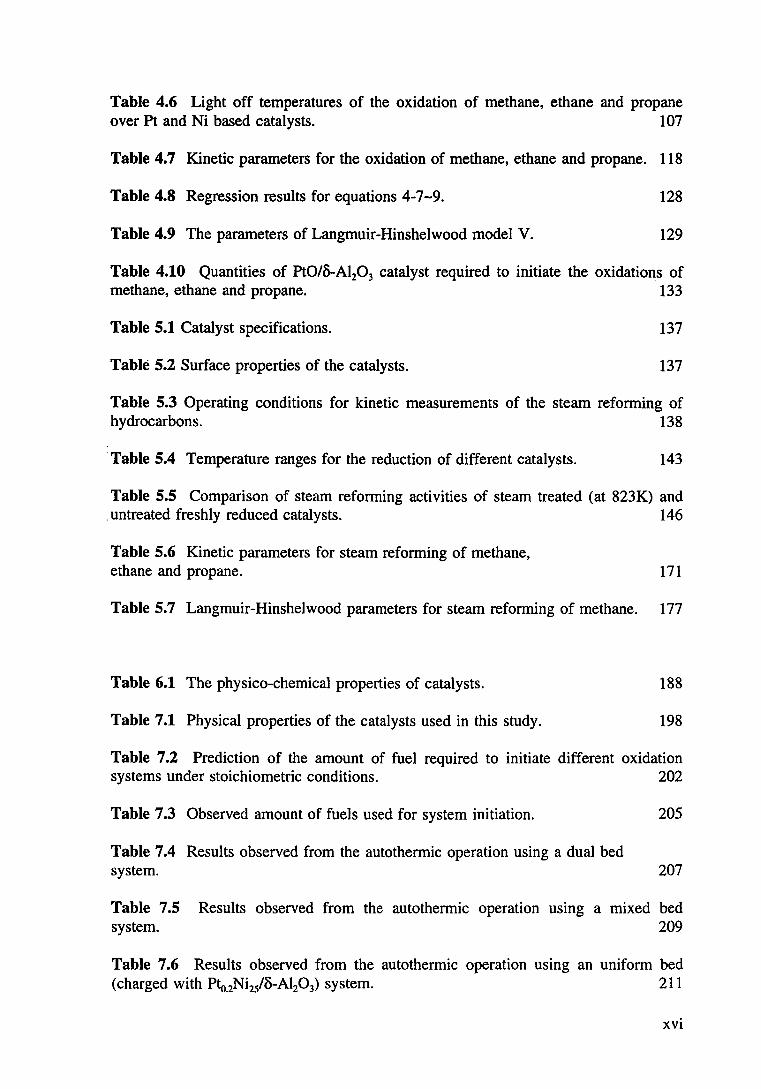
Table 4.6 Light off temperatures of the oxidation of methane, ethane and propane over Pt and Ni based catalysts. 107
Table 4.7 Kinetic parameters for the oxidation of methane, ethane and propane. 118
Table 4.8 Regression results for equations 4-7-9. 128
Table 4.9 The parameters of Langmuir-Hinshelwood model V. 129
Table 4.10 Quantities of Pt0/B-Al20 3 catalyst required to initiate the oxidations of methane, ethane and propane. 133
Table 5.1 Catalyst specifications. 137
Table 5.2 Surface properties of the catalysts. 137
Table 5.3 Operating conditions for kinetic measurements of the steam reforming of hydrocarbons. 138
·Table 5.4 Temperature ranges for the reduction of different catalysts. 143
Table 5.5 Comparison of steam reforming activities of steam treated (at 823K) and . untreated freshly reduced catalysts. 146
Table 5.6 Kinetic parameters for steam reforming of methane, ethane and propane. 171
Table 5.7 Langmuir-Hinshelwood parameters for steam reforming of methane. 177
Table 6.1 The physico-chemical properties of catalysts. 188
Table 7.1 Physical properties of the catalysts used in this study. 198
Table 7.2 Prediction of the amount of fuel required to initiate different oxidation systems under stoichiometric conditions. 202
Table 7.3 Observed amount of fuels used for system initiation. 205
Table 7.4 Results observed from the autothermic operation using a dual bed system. 207
Table 7.5 Results observed from the autothermic operation using a mixed bed ~~n m
Table 7.6 Results observed from the autothermic operation using an uniform bed (charged with Pto_2Ni2/B-Al20 3) system. 211
xvi

Table 7.7 Results of thermodynamic calculation of a combined methane oxidation and steam reforming system. 222
Table 7.8 The conditions used for the simulating experiments. 224
Table V.l Equilibrium constants (Kp1 and Kp2) at different temperatures [8]. 268
Table V.2 Results obtained from the equilibrium calculation. 268
Table VIII.l The parameters of heat capacities [151]. 277
xvii
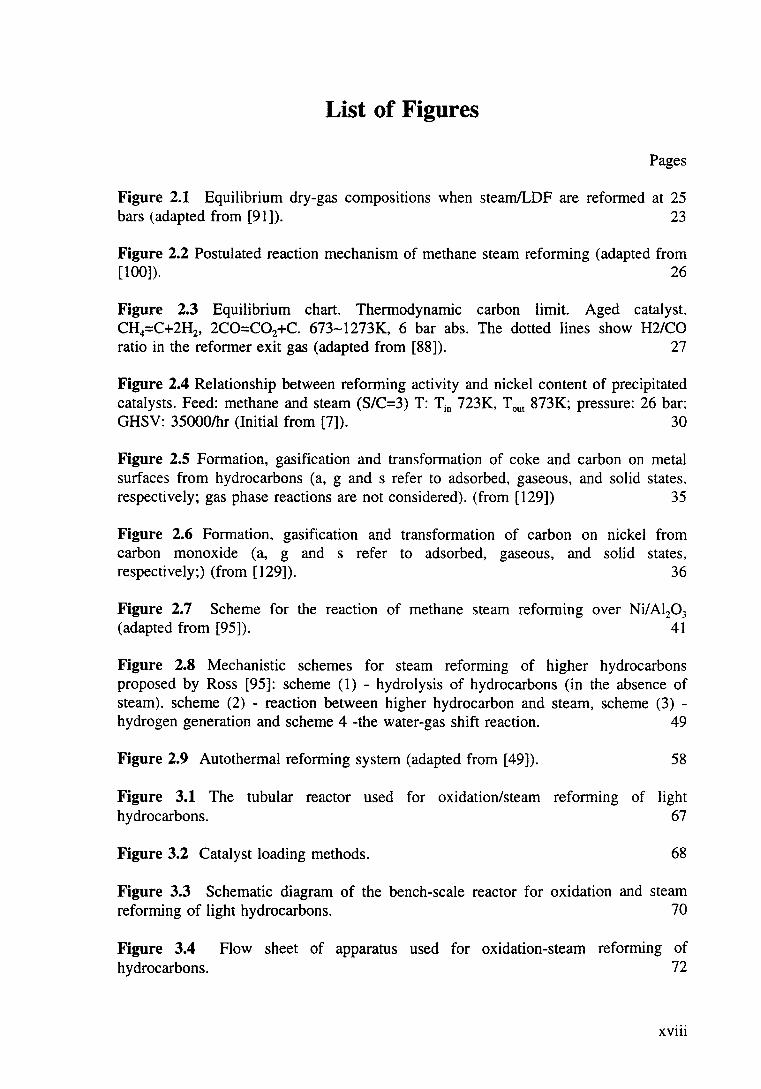
List of Figures
Pages
Figure 2.1 Equilibrium dry-gas compositions when steam/LDF are reformed at 25 bars (adapted from [91]). 23
Figure 2.2 Postulated reaction mechanism of methane steam reforming (adapted from [100]). 26
Figure 2.3 Equilibrium chart. Thermodynamic carbon limit. Aged catalyst, CH4=C+2H2, 2CO=C02+C. 673-1273K, 6 bar abs. The dotted lines show H2/CO ratio in the reformer exit gas (adapted from [88]). 27
Figure 2.4 Relationship between reforming activity and nickel content of precipitated catalysts. Feed: methane and steam (S/C=3) T: Tin 723K, Tout 873K; pressure: 26 bar; GHSV: 35000/hr (Initial from [7]). 30
Figure 2.5 Formation, gasification and transformation of coke and carbon on metal surfaces from hydrocarbons (a, g and s refer to adsorbed, gaseous, and solid states, respectively; gas phase reactions are not considered). (from [129]) 35
Figure 2.6 Formation, gasification and transformation of carbon on nickel from carbon monoxide (a, g and s refer to adsorbed, gaseous, and solid states, respectively;) (from [129]). 36
Figure 2.7 Scheme for the reaction of methane steam reforming over Ni/Al20 3
(adapted from [95]). 41
Figure 2.8 Mechanistic schemes for steam reforming of higher hydrocarbons proposed by Ross [95]: scheme (1) - hydrolysis of hydrocarbons (in the absence of steam). scheme (2) - reaction between higher hydrocarbon and steam, scheme (3) -hydrogen generation and scheme 4 -the water-gas shift reaction. 49
Figure 2.9 Autothermal reforming system (adapted from [49]). 58
Figure 3.1 The tubular reactor used for oxidation/steam reforming of light hydrocarbons. 67
Figure 3.2 Catalyst loading methods. 68
Figure 3.3 Schematic diagram of the bench-scale reactor for oxidation and steam reforming of light hydrocarbons. 70
Figure 3.4 hydrocarbons.
Flow sheet of apparatus used for oxidation-steam reforming of 72
XVlll
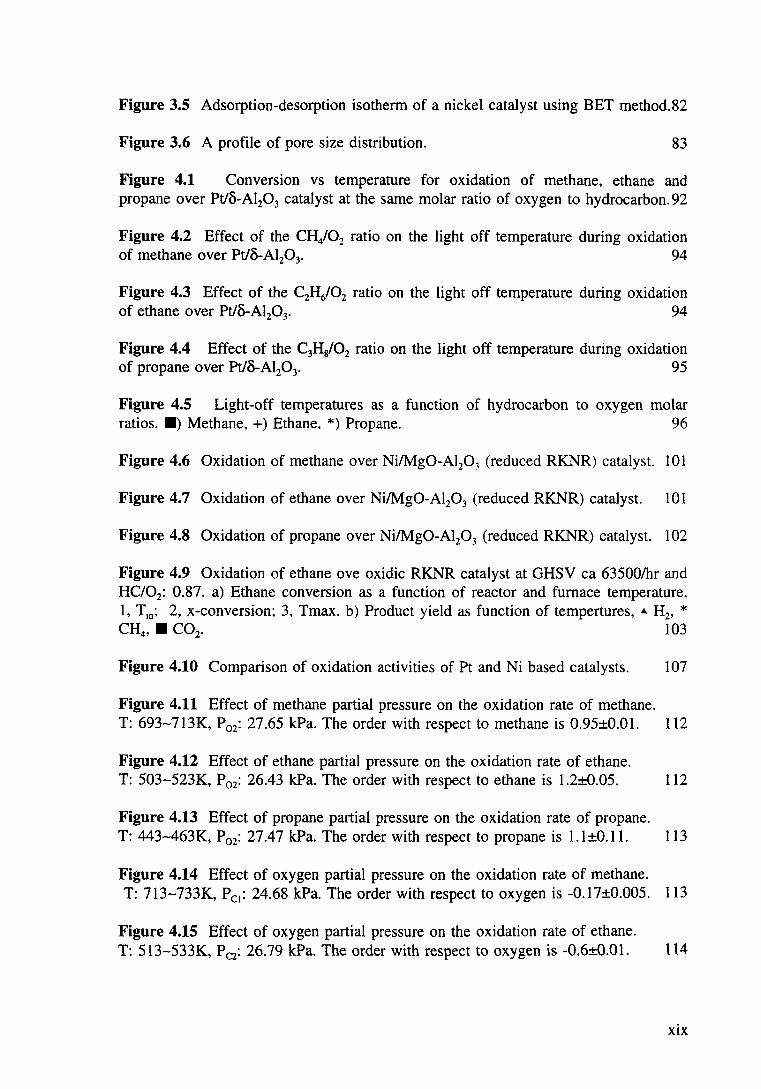
Figure 3.5 Adsorption-desorption isotherm of a nickel catalyst using BET method.82
Figure 3.6 A profile of pore size distribution. 83
Figure 4.1 Conversion vs temperature for oxidation of methane, ethane and propane over Pt/8-Al20 3 catalyst at the same molar ratio of oxygen to hydrocarbon. 92
Figure 4.2 Effect of the CH,/02 ratio on the light off temperature during oxidation of methane over Pt/8-AI20 3• 94
Figure 4.3 Effect of the C2Hi02 ratio on the light off temperature during oxidation of ethane over Pt/8-AI20 3• 94
Figure 4.4 Effect of the C3Hg/02 ratio on the light off temperature during oxidation of propane over Pt/8-Al20 3• 95
Figure 4.5 Light-off temperatures as a function of hydrocarbon to oxygen molar ratios. •) Methane, +) Ethane. *) Propane. 96
Figure 4.6 Oxidation of methane over Ni/Mg0-Al20 3 (reduced RKNR) catalyst. 101
Figure 4.7 Oxidation of ethane over Ni/Mg0-Al20 3 (reduced RKNR) catalyst. 101
Figure 4.8 Oxidation of propane over Ni/Mg0-Al20 3 (reduced RKNR) catalyst. 102
Figure 4.9 Oxidation of ethane ove oxidic RKNR catalyst at GHSV ea 63500/hr and HC/02: 0.87. a) Ethane conversion as a function of reactor and furnace temperature, 1, Tm; 2, x-conversion; 3, Tmax. b) Product yield as function of tempertures, • H2, * CH40 • C02• 103
Figure 4.10 Comparison of oxidation activities of Pt and Ni based catalysts. 107
Figure 4.11 Effect of methane partial pressure on the oxidation rate of methane. T: 693-713K, P02: 27.65 kPa. The order with respect to methane is 0.95±0.01. 112
Figure 4.12 Effect of ethane partial pressure on the oxidation rate of ethane. T: 503-523K, P02: 26.43 kPa. The order with respect to ethane is 1.2±0.05. 112
Figure 4.13 Effect of propane partial pressure on the oxidation rate of propane. T: 443-463K, P02: 27.47 kPa. The order with respect to propane is 1.1±0.11. 113
Figure 4.14 Effect of oxygen partial pressure on the oxidation rate of methane. T: 713-733K, Pc1: 24.68 kPa. The order with respect to oxygen is -0.17±0.005. 113
Figure 4.15 Effect of oxygen partial pressure on the oxidation rate of ethane. T: 513-533K, Pc2: 26.79 kPa. The order with respect to oxygen is -0.6±0.01. 114
xix
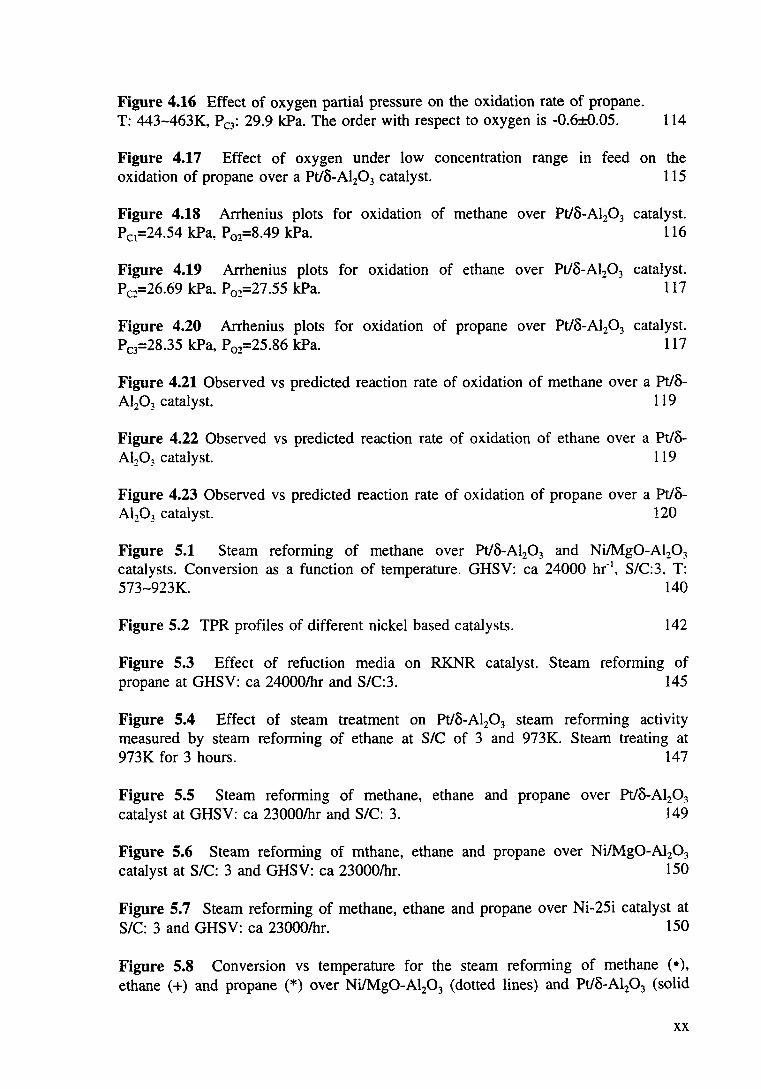
Figure 4.16 Effect of oxygen partial pressure on the oxidation rate of propane. T: 443-463K, P0 : 29.9 kPa. The order with respect to oxygen is -0.6±0.05. 114
Figure 4.17 Effect of oxygen under low concentration range in feed on the oxidation of propane over a Pt/o-Al20 3 catalyst. 115
Figure 4.18 Arrhenius plots for oxidation of methane over Pt/o-Al20 3 catalyst. Pc1=24.54 kPa, P02=8.49 kPa. 116
Figure 4.19 Arrhenius plots for oxidation of ethane over Pt/o-Al20 3 catalyst. P c2=26.69 kPa. P oz=27 .55 kPa. 117
Figure 4.20 Arrhenius plots for oxidation of propane over Pt/o-Al20 3 catalyst. Pc3=28.35 kPa, P02=25.86 kPa. 117
Figure 4.21 Observed vs predicted reaction rate of oxidation of methane over a Pt/o-Al203 catalyst. 119
Figure 4.22 Observed vs predicted reaction rate of oxidation of ethane over a Pt/o-Al203 catalyst. 119
Figure 4.23 Observed vs predicted reaction rate of oxidation of propane over a Pt/o-Al203 catalyst. 120
Figure 5.1 Steam reforming of methane over Pt/o-Al20 3 and Ni/Mg0-Al20 3
catalysts. Conversion as a function of temperature. GHSV: ea 24000 hr-1, SIC:3. T:
573-923K. 140
Figure 5.2 TPR profiles of different nickel based catalysts. 142
Figure 5.3 Effect of refuction media on RKNR catalyst. Steam reforming of propane at GHSV: ea 24000/hr and SIC:3. 145
Figure 5.4 Effect of steam treatment on Pt/o-Al20 3 steam reforming acttvtty measured by steam reforming of ethane at SIC of 3 and 973K. Steam treating at 973K for 3 hours. 147
Figure 5.5 Steam reforming of methane, ethane and propane over Pt/o-Al20 3
catalyst at GHSV: ea 23000/hr and SIC: 3. 149
Figure 5.6 Steam reforming of mthane, ethane and propane over Ni/Mg0-Al20 3
catalyst at SIC: 3 and GHSV: ea 23000/hr. 150
Figure 5.7 Steam reforming of methane, ethane and propane over Ni-25i catalyst at SIC: 3 and GHSV: ea 23000/hr. 150
Figure 5.8 Conversion vs temperature for the steam reforming of methane ( • ), ethane (+) and propane (*) over Ni/Mg0-Al20 3 (dotted lines) and Pt/o-Al20 3 (solid
XX
lines) catalysts at S/C: 3 and GHSV: ea 23000/hr. 151
Figure 5.9 Profile of product composition vs temperature for steam reforming of methane over Pt/o-Al20 3 catalyst at S/C: 3 and GHSV: ea 24000/hr. 152
Figure 5.10 Profile of product composition vs temperature for steam reforming of ethane over Pt/o-Al20 3 catalyst at S/C: 3 and GHSV: ea 24000/hr. 153
Figure 5.11 Profile of product composition vs temperature for steam reforming of propane over Pt/o-Al20 3 catalyst at S/C: 3 and GHSV: ea 24000/hr. 153
Figure 5.12 Product composition as a function of reaction reforming of methane over Ni/Mg0-Al20 3 catalyst at S/C: 3 and GHSV: ea 23000/hr.
Figure 5.13 Product composition as a function of reaction reforming of ethane over Ni/Mg0-Al20 3 catalyst at S/C: 3 and GHSV: ea 23000/hr.
Figure 5.14 Product compositiOn as a function of reaction reforming of propane over Ni/Mg0-Al20 3 catalyst at S/C: 3 and GHSV: ea 23000/hr.
temperature.
temperature.
temperature.
Steam
155
Steam
156
Steam
156
Figure 5.15 Effect of steam to carbon ratio on conversion and product distribution at varied space velocity. Steam reforming of ethane over Ni/Mg0-Al20 3 catalyst at 673K. 158
Figure 5.16 Effect of steam to carbon ratio on conversion and product distribution at varied space velocity. Steam reforming of propane over Ni/Mg0-Al20 3 catalyst at 673K. 159
Figure 5.17 Effect of steam to carbon ratio on conversion and product distribution at varied space velocity. Steam reforming of propane over Ni/Mg0-Al20 3 catalyst at 773K. 159
Figure 5.18 Effect of steam to carbon ratio on conversion and product distribution at constant space velocity. Steam reforming of ethane over Ni/Mg0-Al20 3 catalyst at 673K and GHSV: ea 86800/hr. Conversion -dotted line, Gas yield - solid line. 161
Figure 5.19 Effect of steam to carbon ratio on conversion and product distribution at constant space velocity. Steam reforming of propane over Ni/Mg0-Al20 3 catalyst at 673K and GHSV: ea 101300/hr. Conversion- dotted line, Gas yield - solid line. 161
Figure 5.20 Steam reforming of methane over a Ni/Mg0-Al20 3 catalyst under the conditions stated in Table 5.3. The effect of partial pressure of steam (a), propane (b) and hydrogen (c) on the reaction rate at different temperatures. 165
XXI

Figure 5.21 Steam reforming of ethane over a Ni/Mg0-Al20 3 catalyst under the conditions stated in Table 5.3. The effect of partial pressure of steam (a), propane (b) and hydrogen (c) on the reaction rate at different temperatures. 166
Figure 5.22 Steam reforming of propane over a Ni/Mg0-Al20 3 catalyst under the conditions stated in Table 5.3. The effect of partial pressure of steam (a), propane (b) and hydrogen (c) on the reaction rate at different temperatures. 167
Figure 5.23 Arrhenius plots for steam reforming of methane (a). ethane (b) and propane (c) over Ni/Mg0-Al20 3 catalyst. 168
Figure 5.24 Effect of carbon dioxide in the feedstock on steam reforming of methane over Ni/Mg0-Al20 3 catalyst at 723K and GHSV: ea 54000/hr. 169
Figure 5.25 Effect of hydrogen on steam reforming of ethane at 603K. 169
Figure 5.26 Predicted vs observed reaction rate of steam reforming of hydrocarbons: e) methane, *)ethane and ")propane 171
Figure 5.27 Observed vs predicted by Langmuir-Hinshelwood model 5 (eqn. 5-6) at n=2 reaction rate of the steam reforming of methane. 178
Figure 5.28 Arrhenius plot for the reaction constant k in equation (5-6) at n=2. 178
Figure 5.29 The temperature distribution in a methane steam reforming catalyst bed: comparison of predicted values of the kinetic models with experimental values. a) experimental data, b) predicted using Langmuir-Hinshelwood expression (5-6), c) predicted using kinetic expression (5-1). 181
Figure 6.1 X-ray diffraction patterns of freshly reduced Ni0/8-Al:03 catalysts with and without addition of ceria. SR-0, 0 wt% Ce02 ; SR-2, 2 wt% Ce02; SR-5. 5 wt% Ce02. 189
Figure 6.2 X-ray diffraction patterns of unreduced (a) and reduced (b) SR-5 catalyst. 189
Figure 6.3 Activity comparison of nickel based catalysts. Steam reforming of methane at 1056K; GHSV ea 1500, 7500/hr; S/C: 3 for 1.5 hours, 1 for 1.5 hours. 3 for 2 hours. 190
Figure 6.4 TGA profiles for the catalysts used in aging test (Figure 6.3). 191
Figure 6.5 Life tests for SR-5 and SR-0 catalysts. Steam reforming of propane at 723K, S/C:3, GHSV ea 23000/hr. 192
Figure 6.6 Comparison of hydrogen selectivity of methane steam reforming over both SR-0 and SR-5 catalysts. SR-5 contains ceria and SR-0 contains no ceria. GHSV: ea 23000/hr, S/C:3. 194
XXll
Figure 6.7 Comparison of carbon dioxide selectivity of methane steam refonning over both SR-0 and SR-5 catalysts. SR-5 contains ceria and SR-0 contains no ceria. GHSV: ea 23000/hr, S/C:3. 195
Figure 6.8 Comparison of carbon monoxide selectivity of methane steam refonning over both SR-0 and SR-5 catalysts. SR-5 contains ceria and SR-0 contains no ceria. GHSV: ea 23000/hr, S/C:3. 195
Figure 7.1 Initiation test -- Profile of temperature vs time on stream. Oxidation of methanol initiated at room temperature. Catalyst: Pt/8-Al20 3, CH30H/02(mol)=0.7, GHSV: ea 15600/hr. 203
Figure 7.2 Initiation test -- effect of flow rate of initiator. Temperature vs time on stream. Oxidation of hydrogen intiated at room temperature. Catalyst: Pt/8-Al20 3• 204
Figure 7.3 Comparison of the efficiencies between different bed configurations in a tubular reactor. *) dual bed (Pt/8-Al20 3 and Ni/Mg0-Al20 3 in series), +) mixed bed (Pt/8-Al:P3 and Ni/Mg0-Al20 3 physical mixture. D) one bed (Pt-Ni/8-Al20 3
composite catalyst). 213
Figure 7.4 Comparison of relative hydrogen production efficiencies of various bed configurations. (*)dual bed, (+) mixed bed, and (c) one (catalyst) bed. 214
Figure 7.5 Theoretical calculation of the relationship between the hydrocarbon to oxygen molar ratio (p) and the oxidation conversion (X ox) as well as the steam to carbon ratio (q). (a) Methane, (b) ethane. and (c) propane. 216
Figure 7.6 Methane conversion by steam reforming and reaction temperature as functions of methane conversion by oxidation. Comparison of predicted methane conversion (+ solid curve) and experimental values (* dashed curve). Reaction temperatures (c solid curve) applied in the analog experiments are maintained electrically and the values were predicted and required for the steam refonning conversions under the corresponding oxidation conversions. 225
Figure 7.7 Hydrogen yields by steam refonning vs methane conversion by oxidation in the autothennic hydrogen production system. Comparison of predicted hydrogen yields ( + solid curve) and experimental values (* dotted curve). Reaction temperatures (c solid line) applied in the analog experiments are maintained electrically and the values were predicted and required for the steam refonning conversions under the corresponding oxidation conversions. 225
Figure 7.8 Temperature distribution in the bed of the bench-scale reactor under the conditions: CH/02=1.94. H20/CH4=0, Feedstock: Air 587.8 ml(STP)/min, H20 0, CH4 239 ml(STP)/min, GHSV ea 200 hr" 1
• 228
Figure 7.9 Temperature distribution in the bed of the bench-scale reactor under the conditions: CH/02= 1.14, H20/CH4=4.17, Feedstock: Air 1001.3 ml(STP)/min, H20 64 ml(l)lhr, CH4 239 ml(STP)/min, GHSV ea 650 hr-1
• 229
XXlll
Figure 7.10 Effect of molar ratio of H20/CH4 and CH/02 in fed on conversion of oxidation-steam reforming of methane in the bench-scale autothermic reactor. 229
Figure 7.11 Effect of molar ratio of H20/CH4 in feed on hydrogen selectivity of oxidation-steam reforming of methane in the bench-scale autothermic reactor. 230
Figure 7.12 Effect of molar ratio of CH/02 in feed on conversion and hydrogen selectivity of oxidation-steam reforming of methane in the bench-scale autothermic reactor. H20/CH4: 1.3, FcH4=239 ml(STP)/min. 230
Figure V.1 Equilibrium dry-gas composition of methane steam reforming at a S/C ratio of 3:1 and 1 atm. 269
xxiv
Chapter 1 Introduction
Hydrogen is widely recognised as a clean fuel, producing only water on oxidation
[ 1 ]. It has long been used in fuel cells [2] to supply electricity indirectly, and has
recently been suggested as a fuel for internal combustion engines [3,4,5]. When used
in internal combustion engines the compression ratio can be increased markedly and
yet. due to its wide combustion limits, hydrogen can be burnt in mixtures much
leaner than is possible using conventional hydrocarbon/air mixtures [6]. The use of
hydrogen as a fuel for internal combustion engines instead of petrol can increase
thermal efficiencies by ea. 30-40% [6]. In the petro-chemical industry. hydrogen is
widely used in the processes of heavy oil processing and fraction oil hydrotreating
etc ..
Hydrogen is usually produced from solid, liquid and gaseous fuels (such as coal.
methanol and hydrocarbons). One of the well established processes is steam
reforming which extracts the maximum hydrogen contained in molecules of steam
and fuels.
Steam reforming of natural gas is the most attractive process for production of
hydrogen. because natural gas. in which methane, ethane and propane are the main
constituents [7], is an inexpensive, naturally rich material possessing high H/C ratios.
Nickel based catalysts are the most useful catalysts for this process. The reactions are
usually carried out at a temperature of 773-1173K generated using an external
furnace.
The steam reforming reactions are strongly endothermic and require a large heat
input. This in turn makes hydrogen generation both capital and energy intensive. In
the last decade, much attention has been paid to the systems where external heat is
supplied [8]. For example, configurations of reformer furnace were improved in order
to increase heat-transfer efficiencies. At present, the possibility of a self heating
system where reaction is initiated at lower temperature has many attractions [6,9, 10].
This novel concept has been successfully used in the production of hydrogen from
methanol [6,9,10,11]. The reaction systems have been designed in the way that
methanol is partially oxidised [6,9] or reformed by steam [10,11] into hydrogen and
carbon oxides without supplying any external energy. In such systems, the heat
required by steam reforming or partial oxidation of methanol was supplied by
oxidising part of methanol fed. Oxidation of methanol over platinum based catalyst
has been found to be initiated at a temperature as low as 273K and steam reforming
of methanol over copper based catalysts took place at temperatures below 573K [10].
The combination of exothermic oxidation and endothermic steam reforming offers an
optimal route for energy utilisation and hydrogen production. However, methanol, as
the feedstock of such process, is expensive and is only suggested for the case of
small scale hydrogen production.
The same concept could be applied to light hydrocarbons, although oxidation of light
hydrocarbons may not begin at ambient temperature. A more reactive fuel such as
hydrogen or methanol may be required to raise the temperature to the point where
oxidation of hydrocarbons is initiated. Once the temperature reaches the desired
value, at which significant oxidation of light hydrocarbon occurs, a balance must be
maintained between catalytic oxidation (producing heat and steam) and steam
reforming (consuming heat and steam but producing hydrogen). The whole reaction
system can be considered as an autothermic process.
The design of such systems is obviously critical. It involves initiation of the reaction
system, both exthothennic oxidation and endothermic steam reforming over different
catalysts and the heat and mass balance between the two reactions. Selection of the
catalysts and control of the operation conditions are very important. Due to the high
reaction temperature, particular attention should be paid to design of a reactor and
optimisation of operation conditions.
The present study has focused on investigation of this autothermic hydrogen
production system. Attention is mainly paid to the processes of oxidation and steam
reforming of light hydrocarbons, including the development, selection and usage of
2

catalysts, and to optimisation of the operation conditions. The kinetics of both
oxidation and steam reforming of light hydrocarbons have been studied and the
results are used to design and examine the autothermic reactor system.
3
Chapter 2 Literature Review
2.1 Introduction
In this chapter, it is intended to provide a background to the variety of processes
involved in the catalytic oxidation and steam reforming of hydrocarbons. The ch~pter
deals mainly with the development of catalysts, reaction kinetics and mechanisms, as
well as related reactions to the processes. The deactivation of reforming catalysts due
to carbon deposition is also reviewed.
2.2 Catalytic oxidation
Oxidation reactions of hydrocarbons can take place either homogeneously or
heterogeneously. In the case of homogeneous oxidation, reactions occur in the gas
phase. The course of the reaction is governed by a series of radical reactions [12].
Early in 1964, Shtern [13] reviewed all previous work in the areas of homogeneous
gas phase oxidation of hydrocarbons and described the mechanism, kinetics and
characterisation of the homogeneous reactions in detail. Brown and Parkyns [12]
have reviewed studies of homogeneous gas phase oxidation of methane to produce
methanol and formaldehyde. They claimed that optimal operating conditions (such as
temperature, pressure and the presence of sensitisers) can improve the selectivity and
conversion of the homogeneous reactions significantly. Even so, relatively low yields
of methanol and formaldehyde from methane homogeneous oxidation were obtained.
In order to improve the yields of the desired products, catalytic oxidation of methane
is needed. Such reactions usually take place on the surface of solid catalysts,
although - in some case - reactions may also occur in different phases.
As described in Chapter 1, one of the most important factors in the autothermic
catalytic reforming of natural gas to hydrogen is the need to generate heat to
4
maintain the temperature required by steam reforming. This heat is best obtained by
the total oxidation of hydrocarbons, either in the same phase or over a catalyst.
Catalytic oxidation is initiated at low temperatures, but even light hydrocarbons are
not catalytically oxidised at room temperature. At the beginning of the operation, a
more active material (eg. methanol or hydrogen) must be oxidised to heat the system
to a temperature where the oxidation of light hydrocarbons can be initiated.
Subsequent complete oxidation of part of the hydrocarbon fed can then produce the
heat and steam necessary for the steam reforming process.
Previous work on aspects of total catalytic oxidation will be reviewed in this section.
The oxidation of methanol, hydrogen, carbon monoxide and light hydrocarbons are
considered and other processes involved in the more selective oxidative conversion of
natural gas or light hydrocarbons will also be discussed briefly.
2.2.1 Oxidation of Methanol
The oxidation of methanol produces both heat and steam according to the following
reactions:
CH30H + 1.502 ---7 C02 + 2H20
or CH30H + 0.502 ---7 CO + H2 + H:O
aH=-677 kJ/mol
aH=-152 kJ/mol
(2.1)
(2.2)
Partial oxidation (reaction (2.2)) only takes place under oxygen deficient conditions
and produces much less heat than total oxidation (reaction (2.1)).
Platinum wues [14,15] and y-Al20 3 supported Rh, Pd, Pt, Ag or Cu-Cr catalyst
[ 16-18] have been employed as total oxidation catalysts for the efficient oxidation of
exhaust pollutants generated from methanol-fuelled vehicles.
Jiang [ 1 0] investigated the oxidation of methanol over both platinum and copper
based catalyst with and without the presence of water in the feedstock. He observed
that the reaction took place at initial temperature as low as 273 K. The platinum on
gamma-alumina catalyst used in his study showed extremely high activity and
5
excellent stability. and could be used continuously, without further retreatment, once
it was reduced. He also claimed that the exit temperature of the oxidation catalyst
bed can be sensitively controlled by such parameters as the ratio of air to methanol
and water to methanol as well as by controlling the feed rate. Oxidation of all
oxygen-rich methanol mixtures over alumina supported platinum catalysts was found
to produce carbon dioxide and water only [ 10, 19]. However. partial oxidation was
also observed at lower temperature (300-400 K) [ 16] or over bulk platinum catalysts
[20].
2.2.2 Oxidation of Hydrogen
Hydrogen is a physically invisible, tasteless, colourless gas and a chemically very
reacti\·e material. \Vhen burnt. hydrogen produces virtually nothing but water vapour.
Oxidation of hydrogen is extremely fast. 9.5-66.3 v% of H1 in air can result in a
strong explosion. However. hydrogen as a fuel for internal combustion engine is
found to enhance the efficiency of the engine. Prigent et al [2] and other authors
[3.-1-] also found that hydrogen fuel cells give better performance and longer catalyst
life than methanol fuel cells.
The catalytic oxidation of hydrogen is well documented and established [21-24].
Dabill et al [21] investigated the characteristics of hydrogen oxidation over a
platinum wire catalyst. They claimed that there is a distinct kinetic region (320-360
K) with an apparent activation energy (Ea=19.12 kcal/mol (80 kJ/mol)) during the
oxidation process. Above 360 K, the rate of reaction becomes limited by diffusion
processes [21 ].
2.2.3 Oxidation of Carbon Monoxide
The catalytic oxidation of carbon monoxide to carbon dioxide is widely used to clean
up car and industrial exhausts. The reaction is exothermic.
6
2CO + 0, ... 2CO, ~H=-282.99 kJ/mol (2.3) - -
Noble metals (ie. Pt [25-27]. Pd. Rh [28]) and transition metal based catalysts are
active for this reaction. Palladium has been found to be more active than platinum
for carbon monoxide oxidation but less active for the oxidation of saturated
hydrocarbons [28]. Promoted platinum catalysts have been observed to give a lower
light off temperature (about 338K) compared with un-promoted platinum when .both
catalysts were used for exhaust gas oxidation [28]. The oxidation activity of
transition metal-based catalysts is much lower than that of noble metal based
catalysts [28].
The kinetics of carbon monoxide oxidation has been measured by many researchers
[28,29]. Boulahouache et al [26] studied the oxidation of CO over platinum-tin
dioxide catalysts over a temperature range of 298-333 K with the partial pressure of
the reactants (ie. oxygen. carbon monoxide and steam) varying in the limits of 2-200
mbar, 10-2-10 mbar and 0-18 mbar respectively. They claimed that the addition of
water has a positive effect on the oxidation rate which was zero order with respect to
carbon monoxide. They also suggested that the observation of a synergistic effect
between platinum and tin dioxide was due to oxygen spill-over [26].
Matsumura [30] et al investigated the mechanism of formation of carbon dioxide in
the catalytic oxidation of carbon monoxide. A mechanism was proposed as following:
CO + o- + Si-0-Si ~ C02 + Si-0--Si
CO + 0 2 + Si-0--Si ~ Si-OCO + 0 2--Si
Si-OCO + 0 2--Si ~ C02 + o· + Si-0-Si
(2.4a)
(2.4b)
(2.4c)
Studies of Langmuir-Hinshelwood, Rideal-Eley and power rate law kinetics have also
been reported in the literature [25, 31-36].
7
2.2.4 Oxidation of Natural Gas
Natural gas. of which methane, ethane and propane are the chief constituents, is a
very good candidate for the production of hydrogen. synthesis gas and other.forms of
fuel and chemicals. This results from their lower cost and higher atomic ratios of
hydrogen to carbon in the molecules. 93-95% of world-wide natural gas is used for
the generation of inexpensive heat. The remaining 5-7% is used largely to generate
synthesis gas for the production of ammonia. methanol and chemicals [37].
Depending on the end products, the processes involved with natural gas catalytic
oxidative conversion can be classified into four groups: (1) Catalytic partial
oxidation; (2) Oxidative coupling; (3) Oxidative dehydrogenation; and (4) Catalytic
combustion. Catalytic partial oxidation mainly produces synthesis gas (ie. a mixture
of H: and CO). which is used as a feedstock for ammonia, methanol and Fischer
Tropsch synthesis. Oxidative coupling reactions usually take place at very high
temperature (ie. T> 1023 K). The products are normally ethane, ethylene and heavier
hydrocarbons in small amounts together with carbon oxides. Oxidative
dehydrogenation processes convert saturated hydrocarbons (ie. alkanes) into
unsaturated hydrocarbons (ie. olefines). A typical example is ethane oxidative
dehydrogenation to ethylene. Catalytic combustion generates high heat energy and
less pollutant emissions.
2.2.4.1 Catalytic Partial Oxidation
Catalytic partial oxidation of natural gas IS a well established process for syngas
production. The typical reaction is
CH4 + 0.502 ~ CO + 2H2 e.H298 °=-35.7 kJ/mol (2.5),
The reaction produces synthesis gas with a "just right" stoichiometric ratio of H2:CO
for further methanol and Fisher Tropsch synthesis.
Hickman and Schmidt [38,39] have demonstrated that the direct oxidation of methane
8
to synthesis gas is a promising alternative to steam reforming. Surprisingly high
selectivities of hydrogen and carbon monoxide formation are achieved with almost
complete conversion of the methane fed over platinum and rhodium based-monoliths
catalysts at very short residence times (1 04 -10-2 second). In addition, Rh catalysts
have been shown to give hydrogen selectivities vastly superior to Pt catalysts.
Ashcroft's research group [40] have studied partial oxidation of methane to synthesis
gas over a number of transition metal catalysts under a range of conditions. They
found that the metals Ni, Ru, Rh, Pd, Ir and Pt, either supported on alumina or
present in mixed metal oxide precursors, will bring the reaction system to
equilibrium. The yields of CO and H2 improve with increasing temperature in the
range 650-1 050K, and decrease with increasing pressure between 1 and 20 atm. At
l050K and atmospheric pressure, with a 4:2:1 N2:CH4:02 ratio, an excellent yield
( -92%) can be obtained.
Dissanayake et al [41,42] investigated the partial oxidation of methane to carbon
monoxide and hydrogen over Ni/Al20 3 catalysts. They observed that sudden increases
in CH4 and 0 2 conversions occurred at about l023K when the total surface carbon
content of the catalyst increased to about one monolayer. The effect of CH4:02 feed
ratio on the amount of surface carbon generated on the Ni catalyst was also studied.
The results showed that, at CH4:02 ratio ~ 2, the reaction produced large amounts of
surface carbon that filled the catalyst pores and caused the granules to disintegrate
into a fine powder. However, when CH4:02 ratios of 1.78 was employed for the
experiment, the steady-state concentration of surface carbon ( -1 monolayer) caused
no observable decrease in catalytic activity. even after 50 hours continuous reaction
at l073K.
The formation of CO and H2 rather than C02 and H20 in the partial oxidation
process at equilibrium is favoured above 973K [40,41]. Because of the operational
problems and explosive hazards, the process is much more practicable and
commercially attractive if it is operated at lower temperatures. Choudhary et al [43]
investigated the oxidative conversion of methane to syngas over a NiO-CaO catalyst
9
under low temperatures (~973K) and extremely high space velocities (GHSV) (ea.
145-150 cm3/g/s). They reported that, at 573-973K and GHSV 145 cm:./g/s with a
feed CH/02 ratio of 2.0 over a reduced NiO-CaO catalyst. 62.3-83.4% of methane
conversion with 78.3-92.0% hydrogen selectivity was achieved.
Many metals are found to be active catalysts for this process. These include nickel
[40-43], cobalt [44], rhodium [39,40]. ruthenium [40], palladium [40,45]. iridium [40].
platinum [38,40.45] and lanthanum [46]. The activities and selectivities of these
metal based catalysts are summarised in Table 2-l.
10
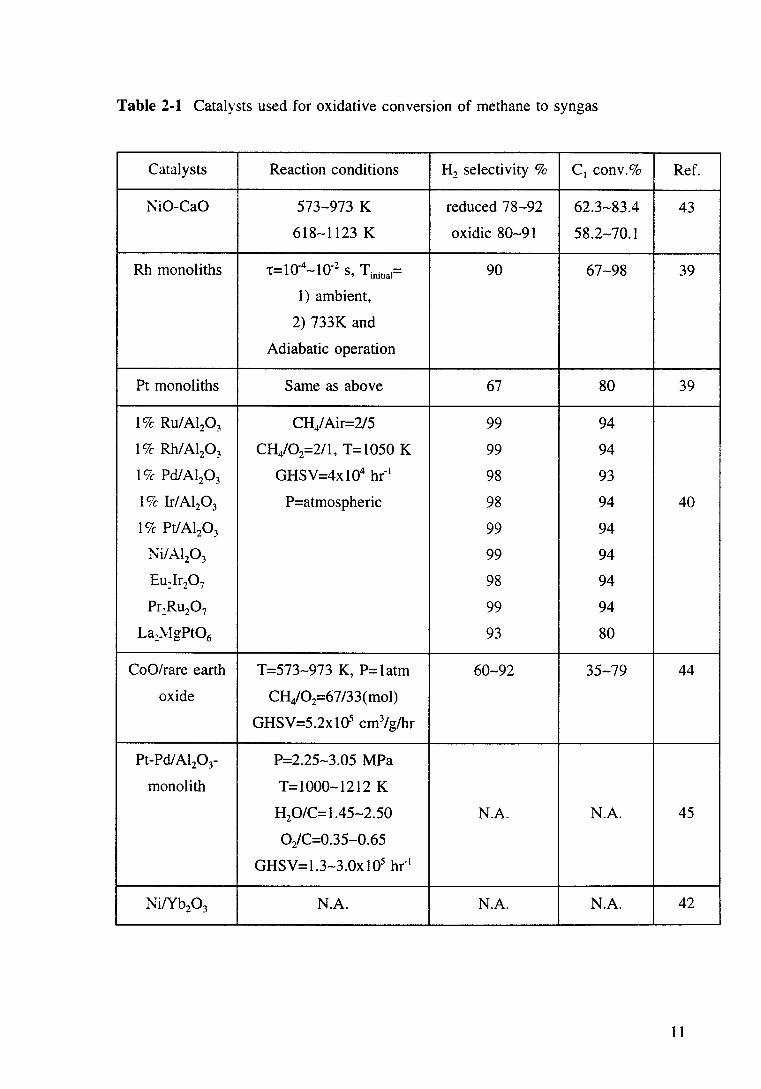
Table 2-1 Catalysts used for oxidative conversion of methane to syngas
Catalysts Reaction conditions H2 selectivity % cl conv.% Ref.
I\iO-CaO 573-973 K reduced 78-92 62.3-83.4 43
618-1123 K oxidic 80-91 58.2-70.1
Rh monoliths t= 1 o-4 -10-2 S, Tiniual= 90 67-98 39
1) ambient,
2) 733K and
Adiabatic operation
Pt monoliths Same as above 67 80 39
1 Ck Ru/ Al20 3 CH/Air=2/5 99 94
1 Ck Rh/Al20 3 CH/02=211, T=l050 K 99 94
19c- Pd/ Al20 3 GHSV=4xl04 hr- 1 98 93
19c Ir/ Al20 3 P=atmospheric 98 94 40
19c- Pt/ Al20 3 99 94
I\i/Al20 3 99 94
Eu)r20 7 98 94
Pr:Ru20 7 99 94
La)~lgPt06 93 80
CoO/rare earth T=573-973 K, P=1atm 60-92 35-79 44
oxide CH/02=67 /33( mol)
GHSV=5.2x10S cm3/glhr
Pt-Pd/Al20 3- P=2.25-3.05 MPa
monolith T=l000-1212 K
H20/C=1.45-2.50 N.A. N.A. 45
Oz!C=0.35-0.65
GHSV=l.3-3.0x10⁵ hr"1
Ni/Yb20 3 N.A. N.A. N.A. 42
11
The mechanism of the catalytic partial oxidation has been studied over the last sixty
years [47]. Prettre et al [48] investigated the reaction over a nickel catalyst and
concluded that synthesis gas is generated by a complex mechanism where the
methane/oxygen mixture reacts first through an exothermic reaction. to give mainly
water and carbon dioxide. In a second step, water and carbon dioxide react further
with unconverted methane to produce synthesis gas. ie.
CH.~ + 202 ~ C02 + 2H20
CH.~ + C02 ,.... 2CO + 2H2
CO + H20 ,.... C02 + H2
(2.6)
(2.7)
(2.8)
Amongst the processes for catalytic partial oxidation, an interesting process is
reported by Hochmuth [45] and Solbakken [49]. Natural gas is mixed with steam and
air (or oxygen) and introduced to a catalyst, where a portion of the hydrocarbon is
oxidised to provide the heat necessary to drive the steam reforming reaction. The
oxidation step is thought to be a total oxidation to carbon dioxide and water
[28.50.51] as opposed to partial oxidation to carbon monoxide and hydrogen
[38.39.40,41 ,43,45]. No more detailed studies were carried out.
Direct catalytic oxidation of methane to methanol and formaldehyde is another highly
attractive route for the utilisation of natural gas. At present, reported yields of
oxygenated products are only a few percent at most [12,52-54].
2.2.4.2 Oxidative Coupling
Oxidative coupling of methane to higher hydrocarbons has attracted the interest of
many researchers during the last decade. It is a possible route for utilisation of
natural gas, but is an expensive process costing as much as 50 to 60% above the
investment of current technologies in which syngas is applied, eg. Fischer Tropsch or
methanol synthesis [55].
The main reactions in the oxidative coupling of methane to higher hydrocarbons are
summarised as:
12
nCH4 + (n-m/4)02 = CnHm + (2n-0.5m)H:P
CH4 + ( l +0.5x)02 = COx + 2H20
(2.9)
(2.10)
Several metal oxides (ie. MgO, CaO. ZnO, MgMn08 and Sm20 3) modified with Li.
Na, Mn, Cd, Zn or Pb oxide or ions [37,56-58] are found to be catalytically active
(30-40% methane conversion) and selective (40-70% C/ selectivity). Other
combined metal catalysts used for oxidative coupling include, for example, Sr/L~03 ,
SrCe0_9 Yb0_10 2_95 , BaPb03, BaBi03, LiCa2Bi30 4Cl6 [37]. More recent studies of
catalyst development for oxidative coupling have also been published in the literature
[59].
The mechanisms of the oxidative coupling reactions have been studied by many
researchers. A detailed review of this area has been carried out by Lunsford [37].
2.2.5.3 Catalytic Combustion
Catalytic combustion is an effective approach to energy generation (ie. catalytic
heaters, catalytic boilers, catalytic gas turbines, autothermic process) or to remove
pollutants (ie. car exhaust clean-up catalysts etc). This process offers significant
advantages over conventional flame combustion [28], such as lower local peak
temperatures and lower emission levels of contaminants (nitrogen oxides) in the
exhaust gas together with better fuel efficiency.
Catalytic combustion of hydrocarbons has been developed over the last decade [51].
The emphasis has been mainly on applications, such as gas turbines, catalytic boiler
and so on [28]. Early works in this subject were reviewed extensively in 1983 by
Trimm [28], and in 1984 by Prasad et al [29].
In the process of catalytic combustion, mixtures of fuel and air pass through a
catalyst bed maintained at a temperature high enough to favour total oxidation of
hydrocarbons. The products of the total oxidation are carbon dioxide and water,
which may be safely discharged into the atmosphere. The reactions are strongly
13
exothermic, for example,
.e.H=-802.31 kJ/mol (2.11)
As a result, catalysts for these reactions have to operate at high temperatures. Some
materials possessing low thermal expansion or high thermal shock resistance (such as
porous/dense alumina. aluminium titanate, silica, silica carbide/nitride. mullite, zircon
mullite. cordierite and fecralloy) have been suggested as catalyst supports [28]. These
substances can be used at least up to 1373K without sintering [28].
Supported noble metals (eg. Pt [41,60], Pd [44,50,61,62], Ir and Rh [19]) and metal
oxides [28,41,63.64] (such as Ag20, CuO, Co30 4, NiO, Mn02, CdO, Fe20 3, V20 5,
Cr20 3• Ce02, Al:03, Th02, Ti02, ZnO, and Cr20 3-Co20 4 as well as lanthanum
perovskite [65] [ie. LaCr03, LaFe03, LaMn03, Lao.75Sr0.25Mn03• Lao5 Sr05Mn03,
Co30~-rich LaCo03, Lao.75Sr0.25Co03 ... ]) have been proven to be active for the total
oxidation of hydrocarbons. Noble metals are used almost invariably as the active
phase and are relatively stable at high temperatures. It has been confirmed that a
combination of platinum and palladium (or of platinum with a transition metal oxide
- favouring the oxidation of carbon monoxide) forms a very suitable catalyst for
combustion systems [28].
In recent years, more attention has been focused on palladium based catalysts for
methane combustion [50,61,62,66] as a result of the observation of a lower light off
temperature than for Rh and Pt [66]. Oh et al [66] compared the activities of Pt, Pd
and Rh on alumina catalysts. They observed that the oxidation activities for methane
decrease in the sequence of Pd>Rh>Pt and for carbon monoxide as Pt>Pd>Rh.
Farrauto et al [50] studied the catalytic chemistry of supported palladium for methane
combustion. They claimed that methane oxidation occurs only on PdO. Palladium, as
a metal, does not chemisorb oxygen at high temperatures (above 923K) and thus is
completely inactive toward methane oxidation. Li and Armor [62] investigated
palladium cation exchanged zeolite (ZSM-5) for the combustion of methane. They
observed that Pd-zeolite catalysts are more active than conventional supported
14
palladium catalysts (PdO/ Al:03); The light-off temperature of methane oxidation over
Pd-zeolite is much lower than that over PdO/ Al20 3• This finding was explained in
terms of the fact that the palladium exchanged zeolite catalyst possessed a highly
dispersed form of Pd(II) supported on high surface area zeolite. This resulted in
highly active palladium catalysts.
Oxidation of hydrocarbons on supported noble metal catalysts has been found to
depend on metal particle size. Hicks et al [67] reported that methane oxidation is a
structure sensitive reaction on supported Pd and Pt, with turnover frequencies
decreasing with increasing metal dispersion. Otto et al [68] studied the influence of
platinum concentration and particle size on the oxidation kinetics of light
hydrocarbons over Pt/y-Al20 3• They found that oxidation rates were enhanced with an
increase of Pt particle size and that the turnover frequency (TOF) for methane
oxidation changed with Pt concentration by one order of magnitude, and by two
orders for propane oxidation. Armor et al [62] observed that methane TOF values
over Pd-zeolite were very high. They suggested that CH4 combustion can take place
on a single atom. Thus, the palladium cations positioned on zeolite sites were highly
active. The atomic dispersion of palladium achieved during ion exchange resulted in
enhancement of the overall activity.
Kinetic studies of hydrocarbon oxidation have been carried out since 1950. The
expression of reaction rate and kinetic parameters obtained from catalytic oxidation
of different hydrocarbons over a series of catalysts are summarised in Tables 2-2 and
2-3. From these results, it can be seen that the catalytic oxidation reaction rates are
generally first order with respect to hydrocarbons, but there is less agreement with
other kinetic parameters. Activation energy values for methane oxidation are
scattered from 13 to 45 kcal/mol and, for other hydrocarbons (ie. C2H4, C2H6, C3H8
and C4H 10), lie between 10 and 27 kcal/mol.
15
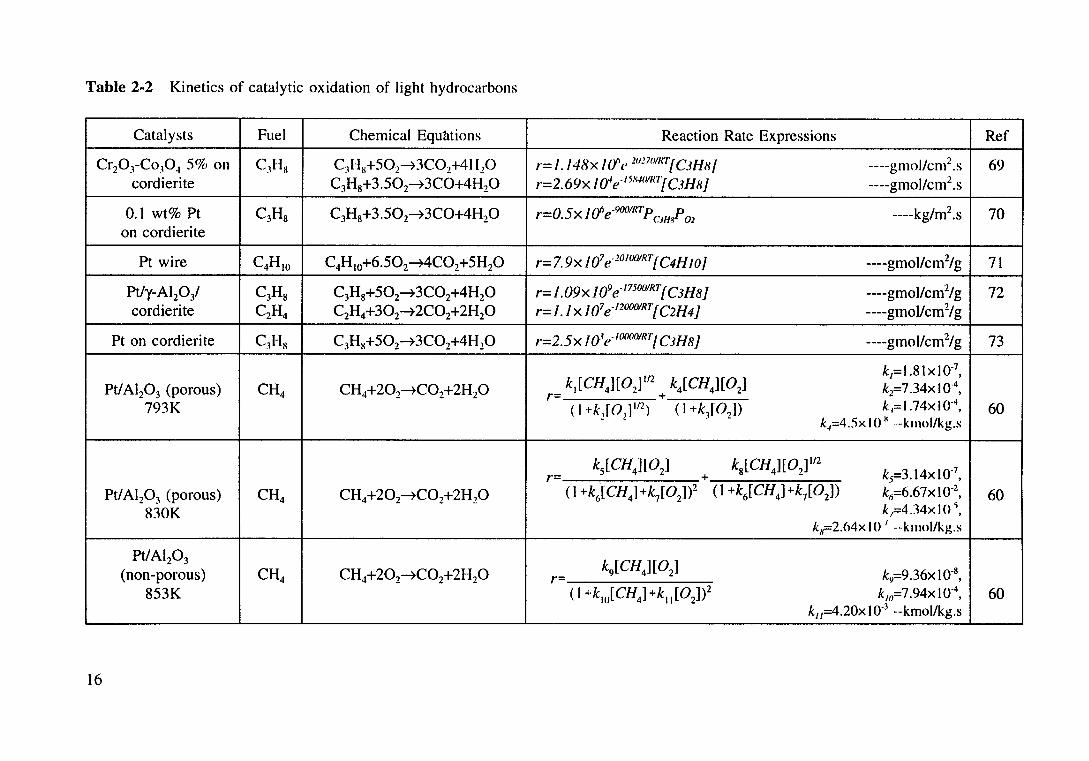
Table 2-2 Kinetics of catalytic oxidation of light hydrocarbons
Catalysts Fuel Chemical Equtttions Reaction Rate Expressions Ref
Cr20 3-Co,04 5% on C1Hx C3Hx+502~3C02+41120 r= I./4Rx I 0" e 1017011f
1j CJH HI ----gmol/cm2 .s 69 cordierite C3H8+3.502~3C0+4H20 r=2.69x !a'e- 158401
R1[C3H8) ----gmol/cm2 .s
0.1 wt% Pt C3Hs C3H8+3.502~3C0+4H20 -0 5 1 {j -900/R1p p r- • X e CJHH 02 ----kg/m2.s 70 on cordierite
Pt wire C4HIO C4H10+6.502~4C02+5H20 r=7.9x /07 e·lOIOOIRT{C4HJO) ----gmol/cm2/g 71
Pt/y-Al20/ C3Hs C3H8+502~3C02+4H20 r= 1.09x 109 e·175001RT[ C3H8] ----gmollcm2/g 72 cordierite C2H4 C2H4+302~2C02+2H20 r= I. 1 x 107 e·120001RT [ C2H4] ----gmol/cm2/g
Pt on cordierite C)HH C3HK+502~3C02+4H 20 r=2.5x 101e· 1()(){
101RTI C3H8] ----gmol/cm2/g 73
ki[CH4][0z]Itz k4[CH4][0z] k1=l .8txt0·7,
Pt/AI20 3 (porous) CH4 CH4+202~C02+2H20 k2=7.34xt0·4, r- +
793K (I +k2[0
1]
112) (I +k3[02])
k,=l.74xt0·4, 60
k.1=4.5x I 0 x ---kmol/kg.s
r-k
5[CH4][0
2]
+ k8[CH4][02]
112
kf=3.14xt0·7,
Pt/AI20 3 (porous) CH4 CH4+202~C02+2H20 (1 +k~[CH4l+k7[02])2 (1 +k6[CH4]+k7[02]) k11=6.67xto·2, 60 830K k;=434xto·\
k11=2.64x I 0 1 --kmol/kg.s
Pt/AI20 3 k9
[ CH4][ 02
] (non-porous) CH4 CH4+202~C02+2H20 r= ky=9 .36x 10"8
'
853K (I +k10
[CH4] +k11[0
2])2 k111=7.94xto·4
, 60 ku=4.20xt0·3 --kmol/kg.s
16
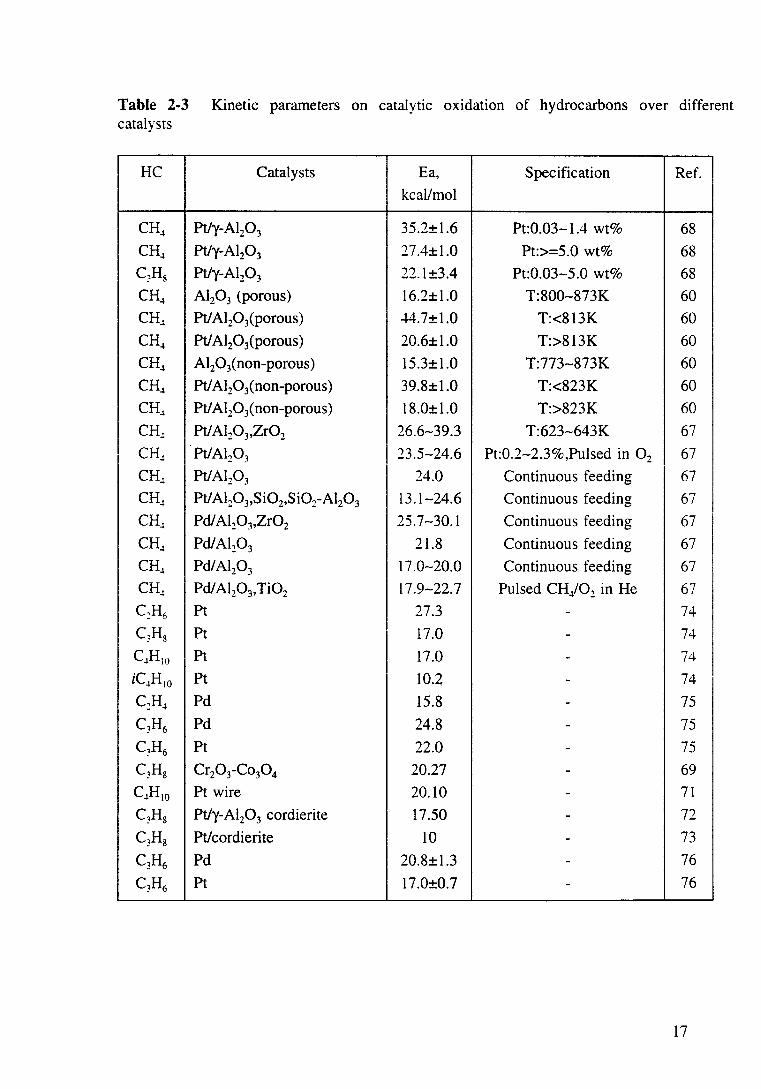
Table 2-3 Kinetic parameters on catalytic oxidation of hydrocarbons over different catalysts
HC Catalysts Ea, Specification Ref. kcal/mol
CH~ Pt/y-AI20 3 35.2±1.6 Pt:0.03-1.4 wt% 68
CH~ Pt/y-Al20 3 27.4±1.0 Pt:>=5.0 wt% 68 C3H8 Pt/y-AI20 3 22.1±3.4 Pt:0.03-5.0 wt% 68
CH~ Al20 3 (porous) 16.2±1.0 T:800-873K 60
CH.l Ptl A120 3(porous) 44.7±1.0 T:<813K 60
CH~ Ptl Al20 3(porous) 20.6±1.0 T:>813K 60
CH~ Al20 3(non-porous) 15.3±1.0 T:773-873K 60
CH~ Ptl Al20 3(non-porous) 39.8±1.0 T:<823K 60
CH~ Ptl Al20 3(non-porous) 18.0±1.0 T:>823K 60
CH.l Ptl Al20 3,Zr02 26.6-39.3 T:623-643K 67
CH.! Pt/AI20 3 23.5-24.6 Pt:0.2-2.3%,Pulsed in 0 2 67
CH~ Pt/Al20 3 24.0 Continuous feeding 67
CH~ Pt/AI20 3,Si02,Si02-AI20 3 13.1-24.6 Continuous feeding 67
CH.l Pdl Al20 3,Zr02 25.7-30.1 Continuous feeding 67
CH~ Pd/Al20 3 21.8 Continuous feeding 67
CH.l Pd/Al20 3 17.0-20.0 Continuous feeding 67
CH.! Pd/ Al20 3,Ti02 17.9-22.7 Pulsed CH/02 in He 67 C2H6 Pt 27.3 - 74
c,H8 Pt 17.0 - 74
C~HIO Pt 17.0 - 74
iC~H 10 Pt 10.2 - 74
C2H~ Pd 15.8 - 75
C3H6 Pd 24.8 - 75
C3H6 Pt 22.0 - 75
C3H8 Cr20 3-Co30 4 20.27 - 69
C~HIO Pt wire 20.10 - 71
C3H8 Pt/y-Al20 3 cordierite 17.50 - 72
C3Hs Pt/cordierite 10 - 73
C3H6 Pd 20.8±1.3 - 76
C3H6 Pt 17.0±0.7 - 76
17
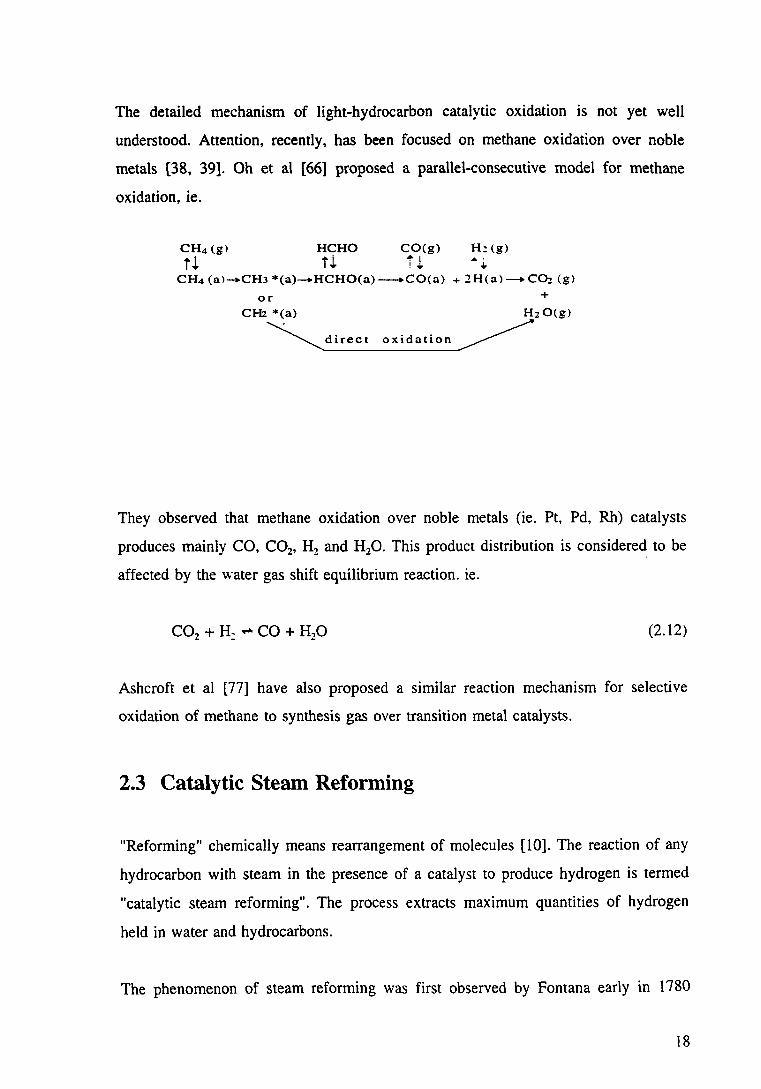
The detailed mechanism of light-hydrocarbon catalytic oxidation is not yet well
understood. Attention, recently, has been focused on methane oxidation over noble
metals [38, 39]. Oh et al [66] proposed a parallel-consecutive model for methane
oxidation, ie.
CH4 (g> HCHO CO(g) H: (g)
t l f' ~I • · ... + I ,p + CH4 (a>-CHJ *(a)-+HCHO(a)-CO(a) + 2H(a)-C{)z (g)
or CH2 *(a)
direct oxidation
+
H:z O(g)
They observed that methane oxidation over noble metals (ie. Pt, Pd, Rh) catalysts
produces mainly CO, C02, H2 and H20. This product distribution is considered to be
affected by the water gas shift equilibrium reaction. ie.
(2.12)
Ashcroft et al [77] have also proposed a similar reaction mechanism for selective
oxidation of methane to synthesis gas over transition metal catalysts.
2.3 Catalytic Steam Reforming
"Reforming" chemically means rearrangement of molecules [10]. The reaction of any
hydrocarbon with steam in the presence of a catalyst to produce hydrogen is termed
"catalytic steam reforming". The process extracts maximum quantities of hydrogen
held in water and hydrocarbons.
The phenomenon of steam reforming was first observed by Fontana early in 1780
18
[78]. Gntil 1868, Tessue du Motay and Marechel [79] claimed that hydrogen was
generated by reforming hydrocarbon over calcium oxide. Later on (1889), Mond and
Langer [80] employed nickel as a catalyst for this process. At the same time. the
homogeneous reaction between methane and steam was studied by Long [81].
Detailed studies of catalytic methane steam reforming was reported by Neumann and
Jacob [82] in 1924.
In 1930, the catalysed hydrocarbon steam reforming reaction became of commercial
value. The first unit was commissioned in this year, the reaction involving light
hydrocarbon feedstock at atmospheric pressure [83]. Twenty years later, ( 1.950-1959)
ICI developed a commercial catalyst and a large scale steam reformer for naphtha
[84]. In 1962, a 15-atm steam reformer using liquid hydrocarbon feedstock was built
in the United Kingdom [85].
In the catalytic steam reforming process, natural gas and other hydrocarbons are
reacted with steam to produce mixtures of hydrogen, carbon monoxide. carbon
dioxide and methane. The reactions may be formally described by the following
equations:
CnHm + nH20 ~ nCO + (n+rni2)H2 (.t.H298 °>0)
CO + H20 ,.... C02 + H2 (.t.H298 °=-41.2 kJ/mol)
CO + 3H2 ,.... CH4 + H20 (.t.H298 °=-206.2 kJ/mol)
(2.13)
(2.8)
(2.14)
Reaction (2.13) is strongly endothermic, absorbing more heat than the following
methanation reaction (2.14) and water gas shift reaction (2.8) evolved, thus making
the overall process normally endothermic [7]. The product gas produced from this
process depends on operating conditions such as temperature, pressure, the ratio of
steam to carbon in the feedstock, and the catalyst used for this process. Generally,
high temperatures and low pressures are favourable for hydrogen production.
It has been found that the biggest problems with the steam reforming system arise
from the necessary presence of steam and the high temperature required to produce
19
hydrogen. Steam, at high temperature, accelerates catalyst sintering and interactions
between catalyst and support. High temperatures favour the formation of coke. which
is a major problem in the process.
This section is intended to provide an overview of the reactions related to and
catalysts used in the steam reforming process. Previous research into catalyst
deactivation and the improvement of steam reforming catalysts, together with studies
of kinetics and mechanism of the steam reforming reactions, are now addressed.
2.3.1 Related Reactions in Steam Reforming of Light Hydrocarbons
The steam reforming of light hydrocarbon is a relatively complicated process. which
involves many reactions depending on the number of carbon atoms in the
hydrocarbon molecules. Beside the reaction of hydrocarbons with steam to produce
carbon monoxide and hydrogen and the water gas shift reaction (2.8) (to convert
carbon monoxide to carbon dioxide), there exist many possible side reactions. These
include methanation, in which carbon monoxide reacts with hydrogen reversely to
form methane and steam, and carbon formation reactions, which take place rapidly at
low steam to carbon ratios and high temperatures to cause catalyst deactivation. Only
when a better understanding of the side reactions is obtained can the process of
hydrocarbon steam reforming be optimised.
The reactions involved in the process of light hydrocarbons steam reforming are
discussed individually in the following sections.
2.3.1.1 Steam Reforming Reactions
The reactions involved with the conversion of hydrocarbons and steam to carbon
monoxide and hydrogen are named "steam reforming reactions" and are the most
important ones for hydrogen production. In the steam reforming process, these
reactions present high energy costs, due to their high endothermicity.
20
The steam reforming reactions are the reverse of the Fisc her-Tropsch synthesis,
occurring at temperatures below 620K. However, at high temperatures, the steam
reforming of hydrocarbons (except methane) can be considered as being irreversible
te.
CH4 + H20 ,.... CO + 3H2 (.o.H298 °=206.2 kJ/mol)
C2H6 + 2H20 --? 2CO + 5H2 (.h.H298 °=347 .3 kJ/mol)
C3H8 + 3H20 --? 3CO + 7H2 (.h.H198 °=497. 7 kJ/mol)
CnHm + nH20 --? nCO + (n+m/2)H2 (ili298 °>0)
(2.15)
(2.16))
(2.17)
(2.13)
The molecule of methane is believed to be the most stable, with four C-H bonds with
bond energies of ea. 420 kJ/mol [8]. The activation sequence obtained from
measurement of methane pyrolysis at temperatures higher than 1270K [86] was
shown to be:
CH4 --? C2H6 --? C2H4 --? C2H2 --? C (2.18)
Higher hydrocarbons have C-H bond energies in the range of 350-400 kJ/mol and C
C bond energies of ea. 320 kJ/mol [8]. These hydrocarbons are more reactive with
steam than methane.
In fact, the reactions of C2 + hydrocarbons with steam produces not only hydrogen and
carbon monoxide but also methane by reaction (2.19). Particularly when low steam
to carbon ratios and low exit catalyst bed temperatures are employed, a large amount
of methane appears in the product gas [8].
(2.19)
It is clear that the selectivity to hydrogen is much dependent on the temperature and
on the steam to carbon ratios (SIC) in the feedstock. Previous studies [87 ,88] have
suggested that the steam to carbon ratios should be controlled within a range of
1.3-2 for methane steam reforming and 2-3 for higher hydrocarbons in order to
obtain maximum hydrogen production, minimal carbon formation and the lowest
21
operating expenses.
Steam reforming reactions are also affected by operating pressures. The reactions are
favoured by low pressures.
During the steam reforming process, due to the formation of carbon monoxide from
reaction (2.13), the water gas shift reaction may occur.
2.3.1.2 The Water Gas Shift Reaction
The water gas shift reaction was first reported by Mond and Langer as early as in
1888 [89]. Later on (1915), the catalytic water gas shift reaction was incorporated
into the first coal-based ammonia process. Since then, it has played a vital role in
syntheses of methanol [10} and ammonia [7,8].
The water gas shift reaction is moderately exothermic (reaction 2.8) and hence the
equilibrium constant decreases with temperature. High conversions are favoured by
low temperature.
(.t.H298 °=-41.2 kJ/mol) (2.8)
Under commercial conditions of steam reforming, reaction (2.8) is reversible. The
equilibrium constant is a function of temperature and independent of pressure. The
relation between the equilibrium constant and reaction temperature is simply
described as [90]:
lnKp =A+ BIT
where, Kp is the equilibrium constant of reaction (2.8);
A and B are constants. A=-3.79762, B=4159.54.
(2-1)
The water gas shift reaction largely influences the composition of the steam
reforming products. Figure 2.1 shows the equilibrium dry gas composition when
22
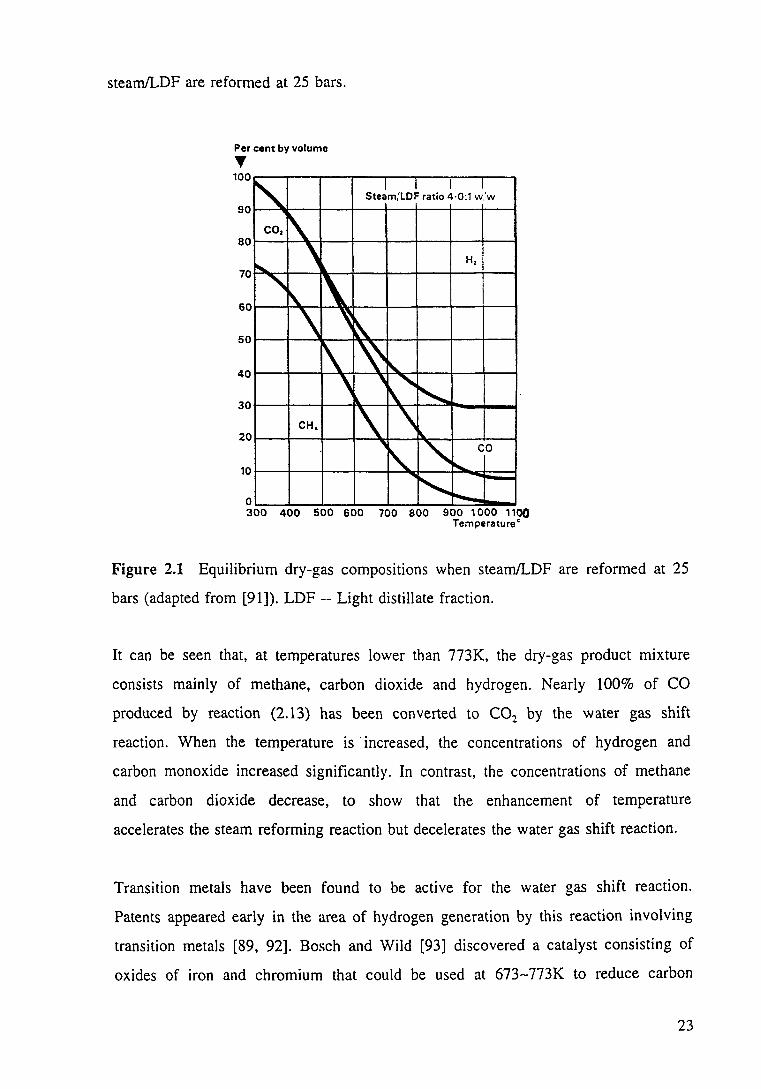
stearn!LDF are reformed at 25 bars.
Per cent by volume .,. 100
~ I I I I
Steam,'LDF ratio 4·0:1 w.'w
eo, r\ ""- ' H,
' 1\ 1\ \ ~ ~
1\ ~ ~
' ' ," " CH. \ \ I\.
90
80
70
60
50
40
30
20
10 i'\. " CO
"'-
"' -loo..... 0
300 400 500 600 700 800 900 1 000 1100 Temperature •
Figure 2.1 Equilibrium dry-gas compositions when steam/LDF are reformed at 25
bars (adapted from [91]). LDF --Light distillate fraction.
It can be seen that, at temperatures lower than 773K, the dry-gas product mixture
consists mainly of methane, carbon dioxide and hydrogen. Nearly 100% of CO
produced by reaction (2.13) has been converted to C02 by the water gas shift
reaction. When the temperature is ·increased, the concentrations of hydrogen and
carbon monoxide increased significantly. In contrast, the concentrations of methane
and carbon dioxide decrease, to show that the enhancement of temperature
accelerates the steam reforming reaction but decelerates the water gas shift reaction.
Transition metals have been found to be active for the water gas shift reaction.
Patents appeared early in the area of hydrogen generation by this reaction involving
transition metals [89, 92]. Bosch and Wild [93] discovered a catalyst consisting of
oxides of iron and chromium that could be used at 673-773K to reduce carbon
23
monoxide [93]. Copper-based catalysts and copper zinc catalysts have been reported
to have good activity for the water gas shift reaction [7]. Because copper catalysts
are particularly prone to sintering, they can only be used in low-temperature
operations. Nickel based catalysts can catalyse the reaction to equilibrium [7,8.94.95].
Shido and Iwasawa [96] studied a reactant-promoted reaction mechanism for water
gas shift reaction on Rh-doped Ce02• They reported that the catalytic water gas shift
reaction proceeds on Ce-0 pair sites in Rh/Ce02, and not on Rh metallic particles.
Water molecules also promote the desorption of the carbonate as C02.
The water gas shift reaction is one of the important reactions in the process of steam
reforming. It not only produces hydrogen but also gasifies carbon deposited on the
surface of catalysts. This will be discussed later.
2.3.1.3 Methanation of Carbon Oxides
The methanation of carbon oxides is an undesirable reaction for hydrogen generation
by the steam reforming of hydrocarbon. It consumes much hydrogen generated by
reaction (2.13) and (2.8), and produces methane which is a very stable gas. On the
other hand, methanation of carbon (eq. 2.20) could be useful for gasification of
carbon deposited on catalyst surface in the steam reforming process.
CO + 3H2 .,.. CH4 + H20 .6.H298 °=-206.2 kJ/mol
C02 + 4H2 .... CH4 + 2H:P .6.H298°=-165.0 kJ/mol
(2.20)
(2.21)
(2.22)
The methanation reactions are the reverse of those describing methane steam
reforming, and are strongly exothermic. The reactions usually take place at relatively
low temperature, high pressure and in the absence of water.
Methanation reactions are used in the process of ammonia synthesis to remove
carbon oxides, which are pronounced catalyst poisons [7]. In 1920, methanation was
24
first used as a method to remove carbon monoxide at very high pressures by George,
in France, and Casales, in Italy [7]. Later in the 1930s, the reaction was employed in
isolated cases in ammonia and hydrogen plants in the USA [7].
Nickel catalysts are usually used in the commercial methanation process. The
reaction temperatures are normally controlled over a range of 573-623K for a typical
ammonia synthesis process.
2.3.1.4 Carbon Formation and Gasification Reactions
Carbon formation in the steam reforming process is a well recognised problem and is
a main cause of catalyst deactivation and bad operability due to high pressure drop
[8.85.97-102]. Since the first commercialisation of the steam reforming process, much
attention has been paid to suppress carbon formation. A brief review of previous
work is given below.
The reactions of carbon formation can be represented by the following equations:
CO + H2 ... C + H20 aH298 o=-131.3 kJ/mol (2.23)
2CO ... C + C02 aH298 °=-172.5 kJ/mol (2.24)
CH4 ... C + 2H2 aH298 °=74.9 kJ/mol (2.25)
C02 ... C + 0 2 aH298 °=393.5 kJ/mol (2.26)
Carbon formation from higher hydrocarbons can be described by equation (2.27):
(2.27)
Reactions (2.23) - (2.26) are reversible, but reaction (2.27) is not. These reactions
are catalysed by nickel. The carbon grows as a fibre (whisker) with a nickel crystal
at the tip. At high temperature (ie. T>923K), higher hydrocarbons may react in
parallel by thermal cracking (pyrolysis or "steam cracking") to give olefines which
may easily form coke. Reaction (2.27) results in pyrolytic carbon encapsulating the
25
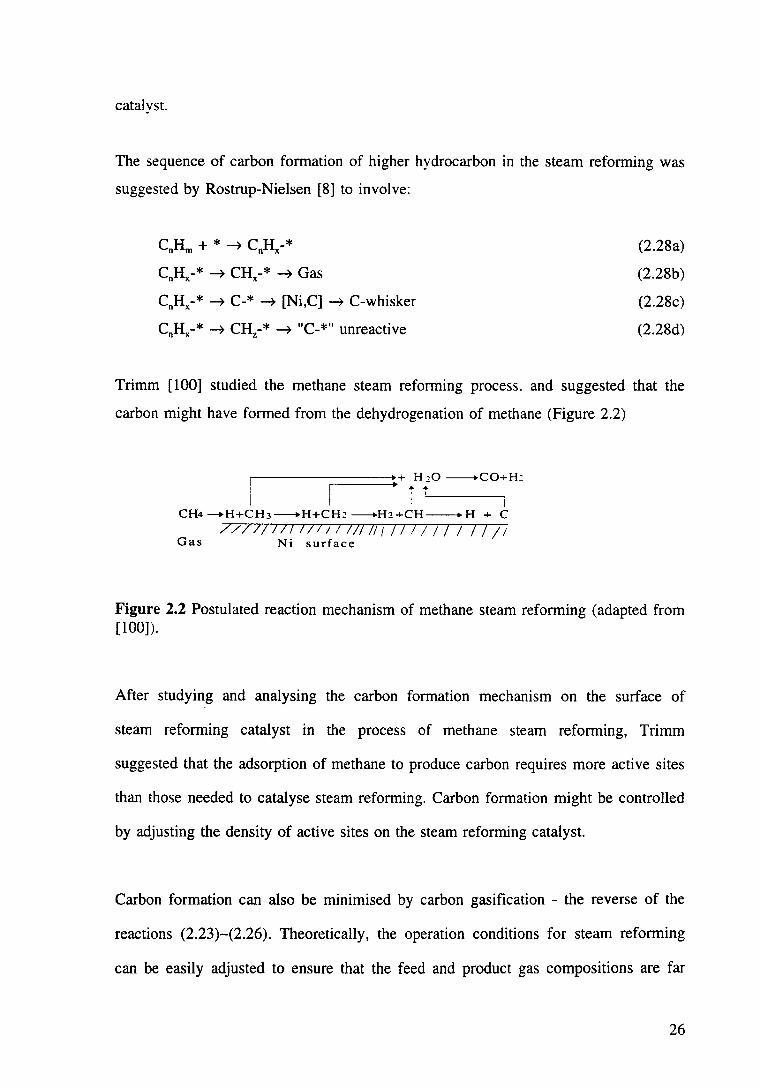
catalyst.
The sequence of carbon formation of higher hydrocarbon in the steam reforming was
suggested by Rostrup-Nielsen [8] to involve:
CnHm + * ~ CnHx-*
CnHx-* ~CH"-*~ Gas
CnHx-* --? C-* ~ [Ni,C] ~ C-whisker
(2.28a)
(2.28b)
(2.28c)
(2.28d)
Trimm [ 1 00] studied the methane steam reforming process. and suggested that the
carbon might have formed from the dehydrogenation of methane (Figure 2.2)
~---~:=:=~+ HzO --CO+H: ... ... '--' ------,
i CH4-+H+CH3---+H+CHz---+H2•CH---+H -1- C
7// /I Ill /Ill I 11/ I! I /1 I I I I I I I I I Gas Ni surface
Figure 2.2 Postulated reaction mechanism of methane steam reforming (adapted from [100]).
After studying and analysing the carbon formation mechanism on the surface of
steam reforming catalyst in the process of methane steam reforming, Trimm
suggested that the adsorption of methane to produce carbon requires more active sites
than those needed to catalyse steam reforming. Carbon formation might be controlled
by adjusting the density of active sites on the steam reforming catalyst.
Carbon formation can also be minimised by carbon gasification - the reverse of the
reactions (2.23)-(2.26). Theoretically, the operation conditions for steam reforming
can be easily adjusted to ensure that the feed and product gas compositions are far
26
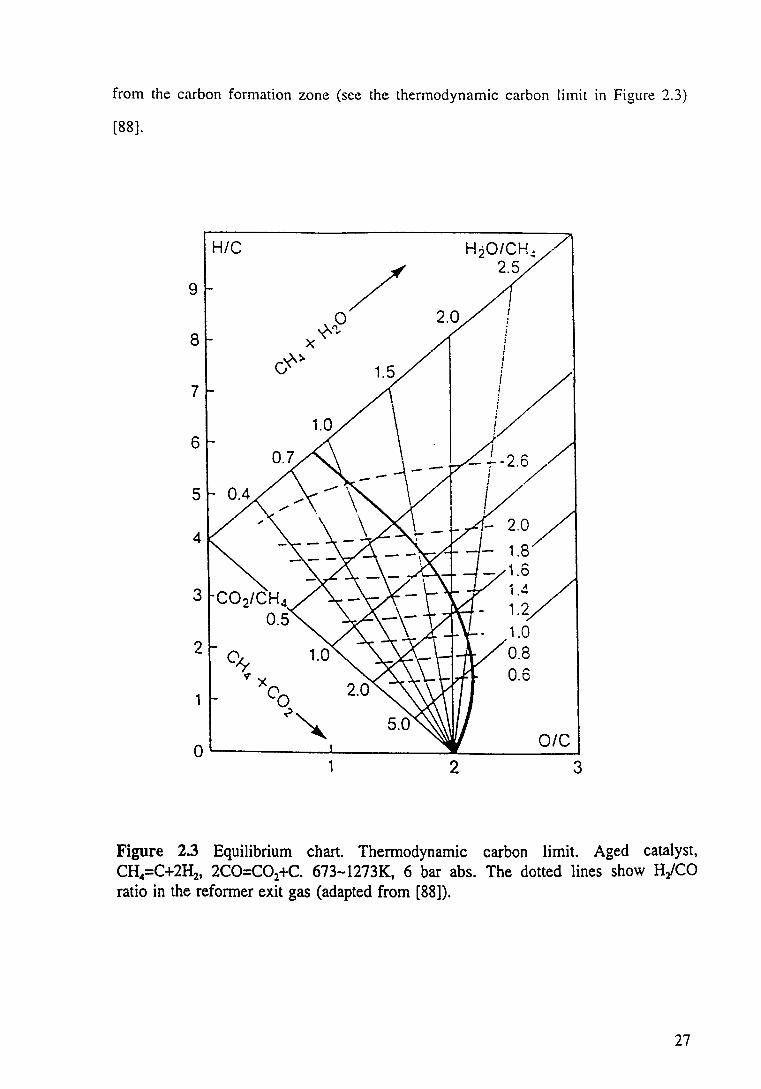
from the carbon formation zone (see the thermodynamic carbon limit in Figure 2.3)
[88].
H/C
9
8
7
6
5
3
2 O,y ~x
0
eo ~~
1 2
I ! 1 i
V
1.0 0.8 0.6
OIC
3
Figure 2.3 Equilibrium chart. Thermodynamic carbon limit. Aged catalyst,
CH4=C+2H2, 2CO=C02+C. 673-1273K, 6 bar abs. The dotted lines show H/CO
ratio in the reformer exit gas (adapted from [88]).
27
From Figure 2.3. It can be seen that, when the 0/C and HIC ratios are below the
values indicated, there exists thermodynamic potential for the formation of carbon.
However carbon can be gasified by water gas shift reaction (2.8) and methanation
(2.22).
Some transition metals such as nickel and cobalt have been reported to catalyse
carbon gasification [103]. Tomita and Tamai [104,105] observed that the catalysis
occurs in two temperature regions ((1) T: 673-973K and (2) T: > 1023K). The low
temperature region reaction takes place nearly in the same temperature region
irrespective of the nature and pressure of gasifying agent [106] and the reaction rate
is reported to decrease from 873-973K [107,108]. In contrast, the high temperature
region reaction proceeds without serious deactivation as long as carbon substrate
remains [109]. Figueiredo [102] studied the kinetics and the mechanism of carbon
gasification over nickel foil and supported nickel catalysts. He found that gasification
by hydrogen is a second order reaction with an activation energy of 31±3 kcal/mole
and the rate was proportional to initial carbon weight. In contrast, a zero order
reaction was suggested for the gasification of carbon by steam over nickel foil.
Activation energies of 32±2 kcal/mole and 18±1 kcal/mole with respect to nickel foil
and supported nickel catalysts were reported by the same author. The gasification of
carbon by steam on nickel surface was predicted as [102]:
H20 + 3(Ni) ~ (Ni-0*) + 2(H*-Ni)
(Ni-0*) + C ~ (C-0*) + (Ni)
(C-0*) ~CO
CO + H20 .,... C02 + H2
(2.29a)
(2.29b)
(2.29c)
(2.8)
The rates of gasification were sufficiently high to produce a partial pressure of
hydrogen capable of maintaining the nickel in the reduced state. The metal may then
act as a dissociation centre for steam. Carbon monoxide produced from the
gasification may be converted to carbon dioxide by the water gas shift reaction (2.8).
28
2.3.2 Catalysts for Steam Reforming
The group VIII metals of the periodic system are found to be active catalysts for the
steam reforming reaction [8]. Nickel is the most suitable metal because it is cheap
and sufficiently active. Other metals can be used, for example, cobalt, platinum,
palladium, iridium. ruthenium and rhodium. Some of these are too expensive for
general commercial use. The nature of the support is also important for stability of
the steam reforming catalysts.
2.3.2.1 Activity of Steam Reforming Catalysts
The activities of steam reforming catalysts have been compared in the literature
[94.110]. Rostrup-Nielsen [94] claimed that the specific activities of metals based on
alumina or magnesia followed a sequence
Rh, Ru > Ni, Pd, Pt > Re > (Ni0.7Cu0.3) > Co
Some authors also observed that the specific activity of nickel for reforming,
hydrogenolysis and methanation is strongly influenced by the carrier employed and
by the presence of alkali. A carrier effect in the reforming reactions has been
recognised by Balashova, Slovokhotova and Balandin [111] who observed nickel on
carbon to be nearly inactive for reforming cyclohexane compared with nickel on
silica. Sinfelt [112] reported the specific activity for hydrogenolysis of silica-alumina
based nickel catalysts to be much less than those of alumina-or silica-based nickel
catalysts. For methanation of carbon dioxide, the specific activity of supported nickel
was found [113] to decrease in the order: chromia < alumina < silica.
Rostrup-Nielsen also observed that the use of supports such as zirconia and carbon
results in very poor specific activities for steam reforming reactions. Some decrease
of the specific activity was also found by the same author using silica-alumina and
titania [94]. Magnesia supported nickel catalysts were active and stable for the steam
reforming of methane [114].
29
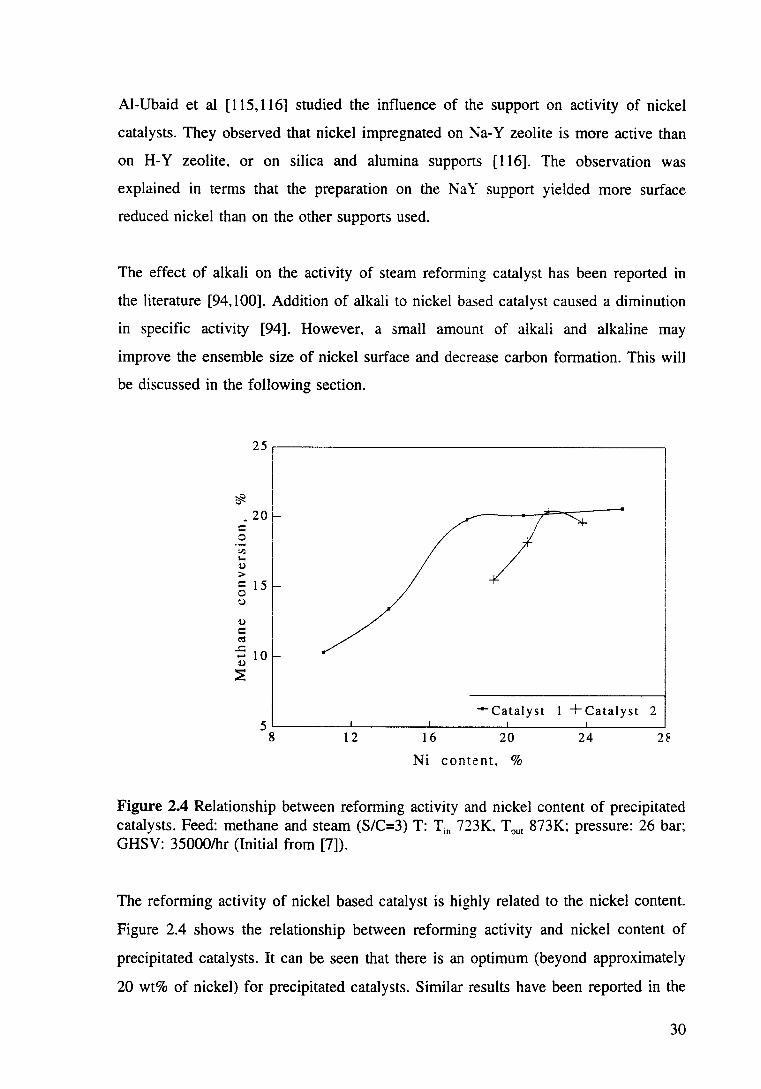
Al-Ubaid et al [115,116] studied the influence of the support on activity of nickel
catalysts. They observed that nickel impregnated on ~a-Y zeolite is more active than
on H-Y zeolite, or on silica and alumina supports [116]. The observation was
explained in terms that the preparation on the NaY support yielded more surface
reduced nickel than on the other supports used.
The effect of alkali on the activity of steam reforming catalyst has been reported in
the literature [94, 100]. Addition of alkali to nickel based catalyst caused a diminution
in specific activity [94]. However, a small amount of alkali and alkaline may
improve the ensemble size of nickel surface and decrease carbon formation. This will
be discussed in the following section.
25.-----------------------------------------~
~ 20 = 0 ;ll ... 1)
> = 15 0 u
/
---Catalyst +Catalyst 2 5~------~------~--------~------~------~
8 12 16 20 24 2~
Ni content, %
Figure 2.4 Relationship between reforming activity and nickel content of precipitated catalysts. Feed: methane and steam (S/C=3) T: Tin 723K, Tout 873K; pressure: 26 bar; GHSV: 35000/hr (Initial from [7]).
The reforming activity of nickel based catalyst is highly related to the nickel content.
Figure 2.4 shows the relationship between reforming activity and nickel content of
precipitated catalysts. It can be seen that there is an optimum (beyond approximately
20 wt% of nickel) for precipitated catalysts. Similar results have been reported in the
30
literature [7,8]. However. for impregnated catalysts, the optimum appears above ea
15 wt% of nickel [7].
Under steam reforming conditions, the reaction between nickel and support (eg.
Al20 3) may take place:
( -t.H298 °=5.6 kJ/mol) (2.30)
The formation of the blue-coloured nickel aluminium spinel may start at temperatures
above about 970K [8]. A similar trend was discovered [117,118] for the reaction
between nickel and magnesium oxide at high temperatures.
xNiO + (1-x)MgO -4 (Nix, Mg 1.JO !2.31)
It is reported [8] that the steam reforming catalysts in industrial plants can be
activated by various reducing agents (such as hydrogen, ammonia, methanol and
hydrocarbons) added to steam. The reduction temperature depends on the conditions
of catalyst calcination and on the reducing media.
Some minerals in coal. containing Si02, Al20 3, CaO. MgO, Na20. K20, Fe20~. Ti02
and P20 5, have been found to have catalytic activity for the steam reforming and
water gas shift reactions [94]. A typical study was conducted by Chen et al [110] in
which the catalytic activity of Clarion 4A coal ash on water gas shift, steam
reforming and carbon dioxide - methane steam reforming reactions was studied in an
atmospheric fluidised bed over temperatures ranging from 643 to 1173K. It was
elucidated that coal ash catalyses both the water gas shift reaction and the steam
methane reforming reaction [110]. The catalytic activity of coal ash is one order of
magnitude lower than that of the commercial catalysts.
31
2.3.2.2 Deactivation of Steam Reforming Catalysts
Deactivation of the steam reforming catalysts IS normally caused by poisoning.
fouling and sintering [97,107,119.120].
Poisoning
Poisoning results from (i) irreversible adsorption or reaction of poison precursors on
or with the surface: (ii) competitive reversible adsorption of poison precursors; (iii)
poison-induced restructuring of catalytic surface or (iv) physical/chemical blockage of
support pore structure. Sulfur and halogens are well known to be poisons for steam
reforming catalysts because their compounds are strongly chemisorbed on the metal
surface. e.g.
;..Ti + H2S .. Ni-S + H2 (2.32)
This surface reaction is found to take place even below room temperature and to be
rapid [121]. Sulphur and halogen compounds usually present in the reactants can be
remo\·ed effectively over activated zinc oxide with or without preceding
hydrogenation over a sulphated Co-Mo catalyst.
Catalyst deactivation by sulphur and halogens results from competitive reversible
adsorption of such poisons on nickel active sites. Some metals (ie. arsenic) cause
permanent deactivation of the steam reforming catalysts. The poisoning effect is due
to alloying with nickel [8].
Chinchen [ 119] concluded that the common poisons for poisoning metals (such as Fe,
Co, Ni, Ru, Rh, Pd, Ir, Pt and Cu) are either the free elements of Group 5B and 6B
or molecules containing these elements ie. N, P, As, Sb, 0, S, Se, Te. Molecules
containing multiple bonds such as carbon monoxide, or strong adsorbates such as
benzene, are also poisons for the metal based catalysts. The general kinetic equation
to describe quantitatively the behaviour of a catalyst subject to poisoning (or indeed
to any form of deactivation) has been reported by Levenspiel [122] and Chinchen
32
[ 119].
Sintering
The sintering of supported metal catalysts refers to the loss of catalytic sites due to
the agglomeration of metal or support. Sintering processes result in the growth of
metal particles, which leads to overall loss of surface area or of the active metal
crystallites. In the case of steam reforming, the main cause of sintering of the
catalysts is probably the thermal instability of the alumina support. Studies of the
sintering of Ni/Al20 3 by Williams et al [123] showed that steam plays an important
role in this context. It is claimed that the loss in nickel surface area is caused by
coalescence of the nickel particles when they agglomerate as a result of the sintering
of the alumina. This is accelerated under hydrothermal conditions.
The sintering rate of nickel is also found to be dependent of the hydrogen partial
pressure [124]. A fast rate of nickel sintering occurs at low hydrogen pressures and
vice versa. In practice, sintering causes an initially fast loss of activity [ 123].
The rates of sintering have been considered by Chinchen [119] using a traditional
power law function of the form:
or
where, D0 is the initial particle size;
D is the particle size at time t;
k1, k2 and m are constants.
(2-2) dt n<m-1)
(2-3)
Alternatively, if the surface area is used to measure the degree of sintering, the rate
can be presented as:
33
_dA =,Y n dt
(2-4)
or
1 1 ----=kt (2-5) An-1 An-1 4
0
where Ao is the initial area and A is the area at time t. The values of the exponents
m and n are found to depend on the sintering mechanism [71].
Trimm [ 1 00] studied the kinetics of nickel and alumina sintering. He claimed that
Ni/ Al~03 sinters more rapidly than alumina even in hydrogen. In steam, the rate of
sintering of both Ni/Al20 3 and Al20 3 is higher, with nickel having relatively less
effect on the stability of the solids [100].
Sintering may cause a collapse of pore structure and changes of alumina solid phase
from y-alumina to the 8, 8 and, eventually, a-phase of alumina. A detailed review
involving the role of deposited poisons and crystallite surface structure in the activity
and selectivity of reforming catalysts has been published [125].
Fouling
Fouling of catalysts results from physical blocking of the active sites on the surface.
A typical foulant is coke on catalysts, usually observed in catalytic reactions
involving hydrocarbons. Highly unsaturated species of high molecular weight are
adsorbed onto the catalyst, polynuclear aromatics being especially potent. After
adsorption, further condensation can lead to the formation of a hydrogen-deficient
"coke" [119]. The deactivation of Ni/Al20 3 at temperatures between 673 and 773K
was explained by Moseley et al [ 126] and Bhatta et al [ 127] in terms of the
formation of a film of polymers that blocks the nickel surface. Evidence was
obtained by analysis of high molecular weight hydrocarbons in an extract of the
deactivated catalyst [127]. Macak et al [153] suggested that the carbonaceous
depositions block the nickel surface and result in deactivation. Detailed studies of
34
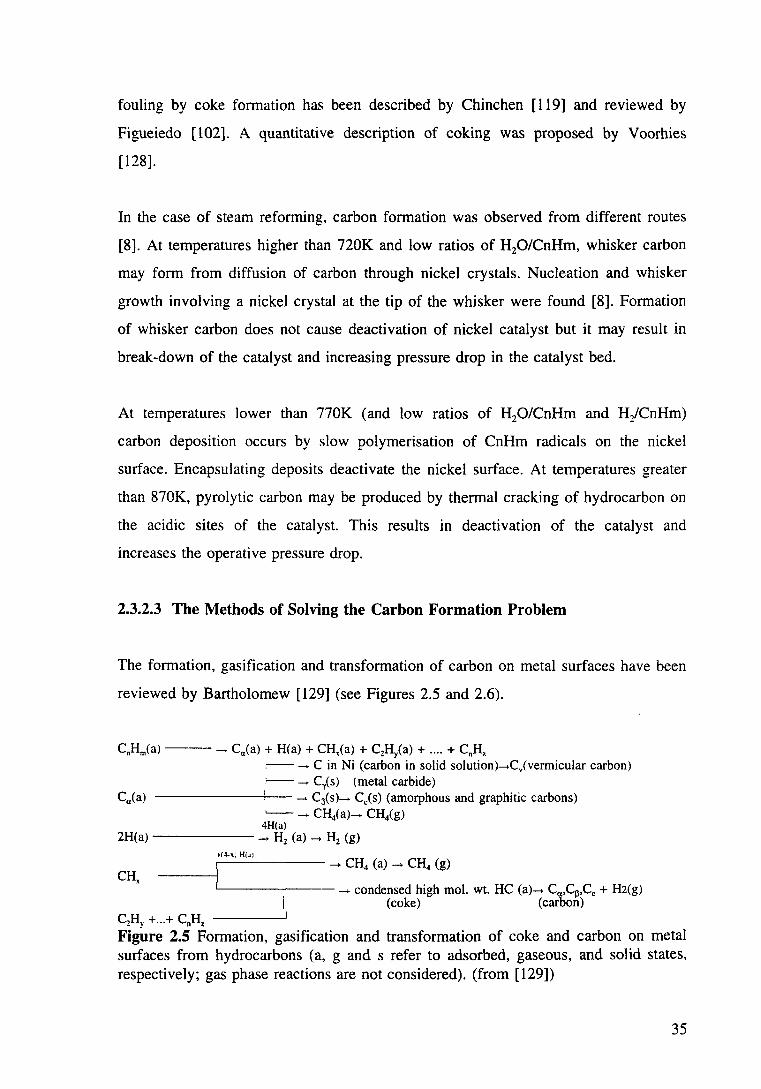
fouling by coke formation has been described by Chinchen [ 119] and reviewed by
Figueiedo [ l02]. A quantitative description of coking was proposed by Voorhies
[ 128].
In the case of steam reforming, carbon formation was observed from different routes
[8]. At temperatures higher than 720K and low ratios of H20/CnHm, whisker carbon
may form from diffusion of carbon through nickel crystals. Nucleation and whisker
growth involving a nickel crystal at the tip of the whisker were found [8]. Formation
of whisker carbon does not cause deactivation of nickel catalyst but it may result in
break-down of the catalyst and increasing pressure drop in the catalyst bed.
At temperatures lower than 770K (and low ratios of H20/CnHm and H/CnHm)
carbon deposition occurs by slow polymerisation of CnHm radicals on the nickel
surface. Encapsulating deposits deactivate the nickel surface. At temperatures greater
than 870K, pyrolytic carbon may be produced by thermal cracking of hydrocarbon on
the acidic sites of the catalyst. This results in deactivation of the catalyst and
increases the operative pressure drop.
2.3.2.3 The Methods of Solving the Carbon Formation Problem
The formation, gasification and transformation of carbon on metal surfaces have been
reviewed by Bartholomew [129] (see Figures 2.5 and 2.6).
C.Hm(a) ---- C,/a) + H(a) + CH,(a) + C2Hy(a) + .... + c.H.
Ca(a)
,------ C in Ni (carbon in solid solution)-+C.(vennicular carbon) r--- C.1(s) (metal carbide)
-------+-- ..... C6(s)-+ Cc(s) (amorphous and graphitic carbons) .____- CH4(a)- CHig)
4H(a) 2H{a) ------ -+ H2 (a) -+ H2 (g)
CH,
+14-'J Hf•l ..--------+ CH4 (a)-+ CH4 (g)
-----1
L..._ ______ -+ condensed high mol. wt. HC (a)-+ Ca,C~,Cc + H2{g) (coke) (carbon)
C2Hv + ... + C.H. FigUre 2.5 Formation, gasification and transformation of coke and carbon on metal surfaces from hydrocarbons (a, g and s refer to adsorbed, gaseous, and solid states, respectively; gas phase reactions are not considered). (from [129])
35
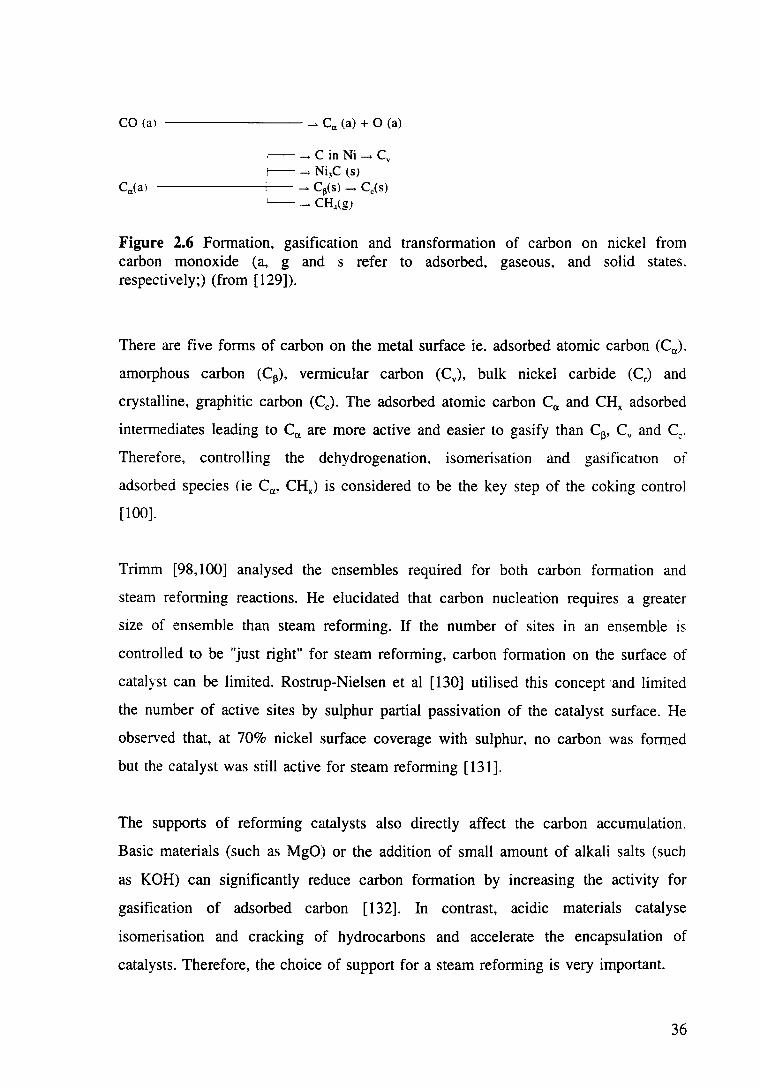
CO (al -------- ___... C11
(a) + 0 (a)
.-- ___... C in Ni __.. C. r--- ___... Ni3C (SJ
------.,.----- ___... Ca(s) __. Cc(s)
-'- ___... CHig)
Figure 2.6 Formation, gasification and transformation of carbon on nickel from carbon monoxide (a, g and s refer to adsorbed, gaseous, and solid states. respectively;) (from [ 129]).
There are five forms of carbon on the metal surface ie. adsorbed atomic carbon (Ca.).
amorphous carbon (C13), vermicular carbon (Cv), bulk nickel carbide (Cr) and
crystalline, graphitic carbon (Cc). The adsorbed atomic carbon Ca. and CHx adsorbed
intermediates leading to Ca. are more active and easier to gasify than C13, Cv and Cc.
Therefore, controlling the dehydrogenation. isomerisation and gasification oi
adsorbed species ( ie Ca., CHx) is considered to be the key step of the coking control
[lOO].
Trimm [98, 1 00] analysed the ensembles required for both carbon formation and
steam reforming reactions. He elucidated that carbon nucleation requires a greater
size of ensemble than steam reforming. If the number of sites in an ensemble is
controlled to be "just right" for steam reforming, carbon formation on the surface of
catalyst can be limited. Rostrup-Nielsen et al [130] utilised this concept ·and limited
the number of active sites by sulphur partial passivation of the catalyst surface. He
observed that, at 70% nickel surface coverage with sulphur, no carbon was formed
but the catalyst was still active for steam reforming [ 131].
The supports of reforming catalysts also directly affect the carbon accumulation.
Basic materials (such as MgO) or the addition of small amount of alkali salts (such
as KOH) can significantly reduce carbon formation by increasing the activity for
gasification of adsorbed carbon [132]. In contrast, acidic materials catalyse
isomerisation and cracking of hydrocarbons and accelerate the encapsulation of
catalysts. Therefore, the choice of support for a steam reforming is very important.
36
The reactions occurring on the surface of catalysts involve both carbon formation and
carbon gasification. The net result depends on the rates of the both reactions. If the
carbon formation rate (re) is higher than the carbon gasification rate (rg),
accumulation of coke occurs and carbon may adsorb on or dissolve in nickel. The
catalyst may be deactivated. In contrast, if the carbon formation rate (re) is equal to
or lower than the carbon gasification rate (rg), carbon formation is controlled and no
bulk carbon can be observed in the reaction system.
Gasification involves reaction of coke with gases such as oxygen, hydrogen, steam
and carbon dioxide (described earlier in section 2.3.1.4). Figueriedo [102] found that,
in the steam reforming process, carbon was first deposited on a supported nickel or
nickel foil catalyst by pyrolysis and then gasified by steam and hydrogen. As a
result. the ability for water adsorption on nickel foil or on supported nickel catalyst is
very imponant.
Some interesting studies dealing with additives to steam reforming catalysts are
reported in the literature [133-135]. Liu et al [133] investigated the effect of addition
of heaYier rare earth oxides (RE20 3) on water adsorption and on the resulting
catalytic activities for methane cracking and carbon gasification of nickel on a
alumina. They reported that addition of heavier rare earth oxides improved the
decoking ability of the nickel based catalysts. The RE20 3 doped catalysts were
prepared by doping the heavier rare earth oxide prior to (method 1) and/or after
(method 2) the process of supporting Ni on a-Al20 3 by impregnation. Ni0-RE20 3/a
Al203 prepared by method 1 showed significant enhancement for water adsorption
(-35Ck). carbon gasification (-192%) at 513K and methane cracking (14%) at 390K
compared with Ni0/a-Al20 3• However, the RE20 3-Ni0/a-Al20 3 prepared by method
2 was found to have lower activity (-39%) for methane cracking and higher activity
( -82%) for carbon gasification than Ni/ Al20 3• Coking retardation in methane steam
reforming may thus be realised either by using Ni0-RE20/a-Al20 3 to enhance the
water adsorption or by using RE20 3-Ni0/a-Al20 3 to decrease methane cracking.
Shido and Iwasawa [136] further investigated the mechanism of enhancement of
water gas shift reaction by the presence of Ce02.
37
Andrew [134] has suggested that alkali moves across the nickel surface to accelerate
the rate of removal of carbon residues. Haque [97] also observed that the addition of
a small amount of alkali and alkaline earth metals produces a large reduction in
carbon formation with little effect on the steam reforming activity of nickel catalyst.
Bhatta et al [ 135] suggested that the addition of urania results in enhanced
gasification by means of a "spill over" supply of oxygenated species from the support
to nickel. About 5% of silver or metals of group IV -A (Sn and Pb) and group V -A
(Sb. Bi and As) of the periodic table were found to result in minimal carbon
formation and very little change in the steam reforming activity of nickel catalysts
[97]. The reason was explained as surface segregation of these metals with strong
electronic interaction with nickel [97].
In fact. carbon formation in the process of steam reforming is affected not only by
the catalyst but also by the operation conditions such as reaction temperature and
feedstock/product compositions. The detailed effect of such parameters was reviewed
by Haque [97] and Trimm [98, 132] as well as by Bartholomew [129].
2.3.3 Kinetics and Mechanism of Steam Reforming of Hydrocarbons
Several studies of the kinetics and mechanism of steam reforming of hydrocarbons
have been published [7,8,85,94,95,115,116,137-139]. Reviews of this subject have
been contributed by Rostrup-Nielsen [8], by Van Hook [46] as well as by Twigg et
al [7].
2.3.3.1 Steam Reforming of Methane
From the published results of methane steam reforming kinetics, it can be clearly
found that there is general agreement on first order kinetics with respect to methane
but less agreement for other kinetic parameters [7]. The observed activation energies
are scattered from ea. 20 to 160 kJ/mole, which may be caused by varying degrees of
38
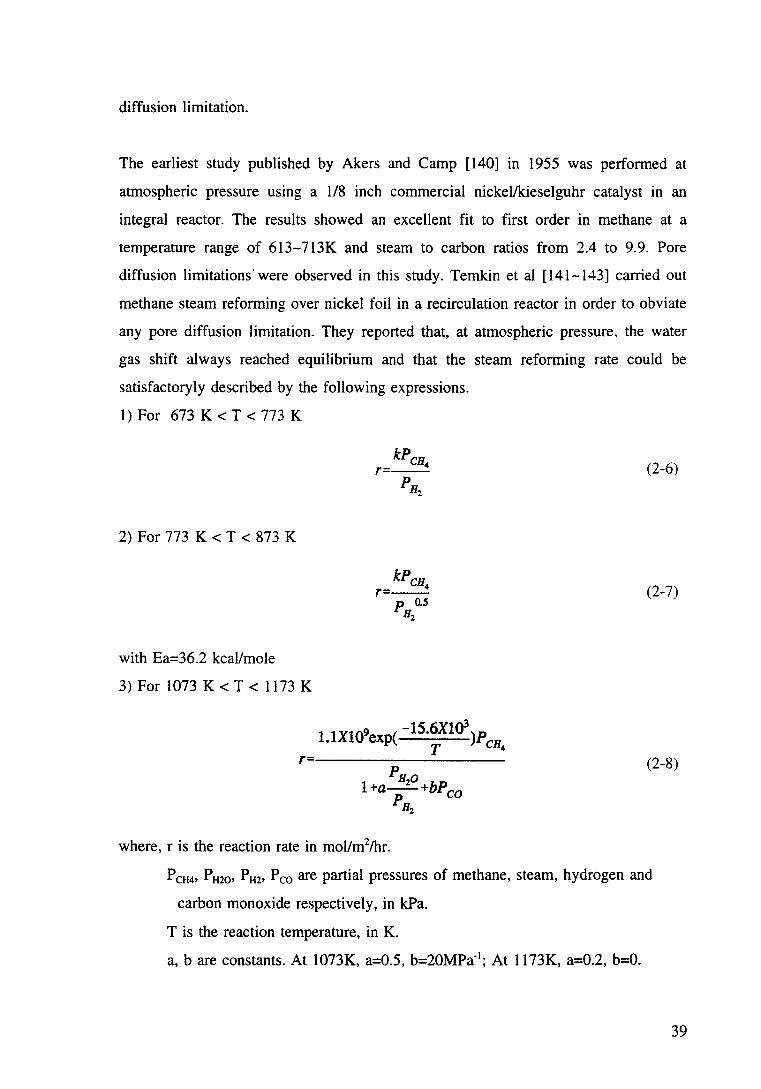
diffusion limitation.
The earliest study published by Akers and Camp [ 140] in 1955 was performed at
atmospheric pressure using a 1/8 inch commercial nickel/kieselguhr catalyst in an
integral reactor. The results showed an excellent fit to first order in methane at a
temperature range of 613-713K and steam to carbon ratios from 2.4 to 9.9. Pore
diffusion limitations'were observed in this study. Ternkin et al [141-143] carried, out
methane steam reforming over nickel foil in a recirculation reactor in order to obviate
any pore diffusion limitation. They reported that, at atmospheric pressure, the water
gas shift always reached equilibrium and that the steam reforming rate could be
satisfactoryly described by the following expressions.
1) For 673 K < T < 773 K
2) For 773 K < T < 873 K
with Ea=36.2 kcal/mole
3) For 1073 K < T < 1173 K
r
kPcH r=--4
p o.s Hz
l.lXl<fexp( -15.6Xl<f )PcH T 4
where, r is the reaction rate in mol/m2/hr.
(2-6)
(2-7)
(2-8)
PcH4, PH20, PH2, Pco are partial pressures of methane, steam, hydrogen and
carbon monoxide respectively, in kPa.
T is the reaction temperature, in K.
a, bare constants. At 1073K, a=0.5, b=20MPa·1; At 1173K, a=0.2, b=O.
39
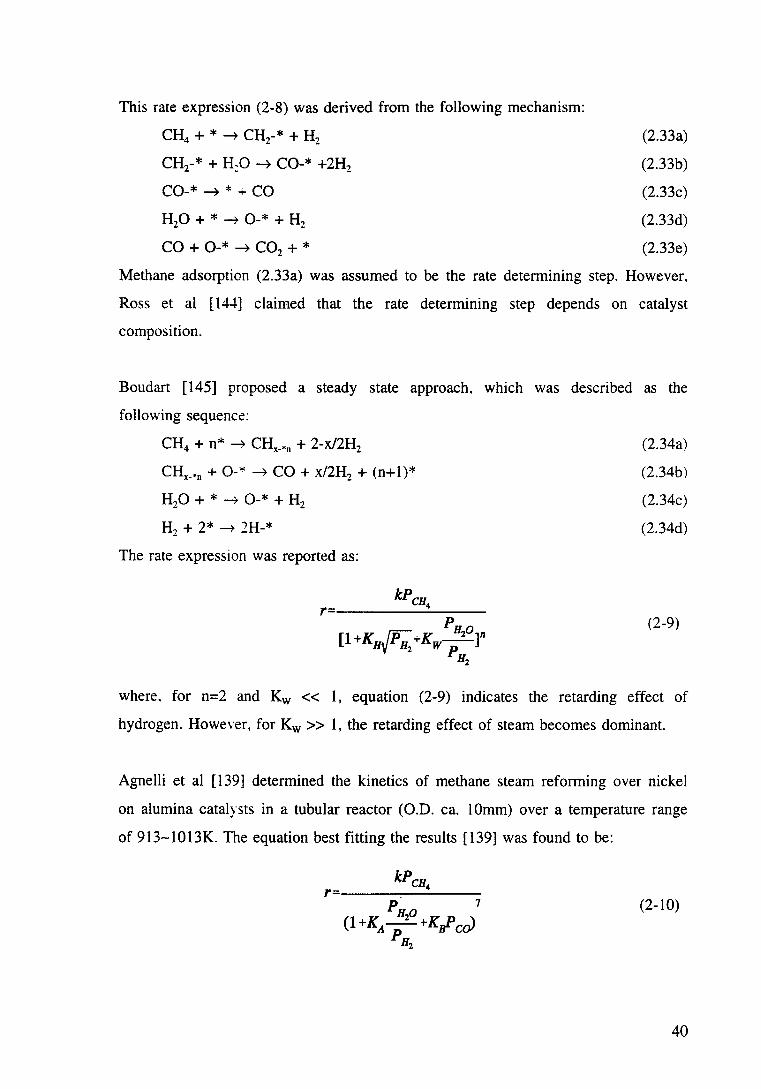
This rate expression (2-8) was derived from the following mechanism:
CH4 + * ~ CH2-* + H2
CH2-* + H:O ~ CO-* +2H2
CO-*~*+ CO
H20 + * ~ 0-* + H2
CO + 0-* ~ C02 + *
(2.33a)
(2.33b)
(2.33c)
(2.33d)
(2.33e)
Methane adsorption (2.33a) was assumed to be the rate determining step. However,
Ross et al [14-+] claimed that the rate determining step depends on catalyst
composition.
Boudart [ 145] proposed a steady state approach, which was described as the
following sequence:
CH4 + n* ~ CHx-•n + 2-x/2H2
CHx-•n + 0-"' ~CO+ x/2H2 + (n+1)*
H20 + * ~ 0-* + H2
H2 + 2* ~ 2H-*
The rate expression was reported as:
(2.34a)
(2.34b)
(2.34c)
(2.34d)
(2-9)
where. for n=2 and Kw << 1, equation (2-9) indicates the retarding effect of
hydrogen. However, for Kw >> 1, the retarding effect of steam becomes dominant.
Agnelli et al [139] determined the kinetics of methane steam reforming over nickel
on alumina catalysts in a tubular reactor (O.D. ea. 10mm) over a temperature range
of 913-10 13K. The equation best fitting the results [ 139] was found to be:
r P~a 7
(1 +KA-2 +Kif' cd pll
2
(2-10)
40
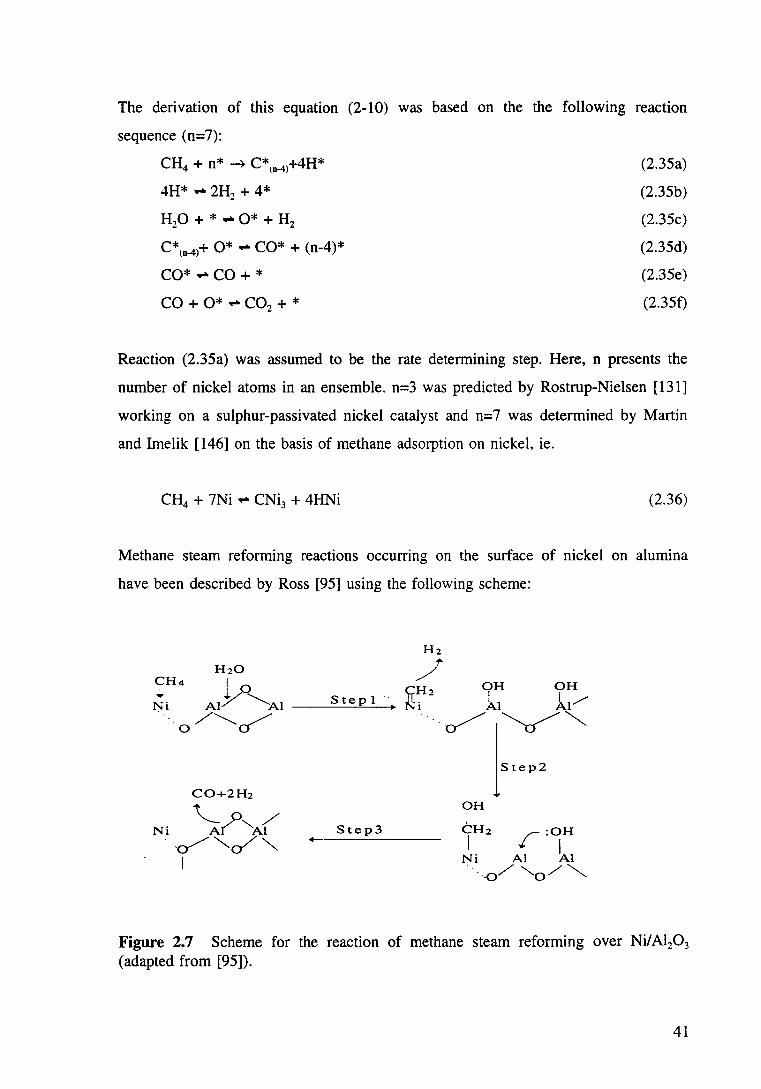
The derivation of this equation (2-10) was based on the the following reaction
sequence (n=7):
CH4 + n* ~ C*(n-4l+4H*
4H* .. 2H2 + 4*
H20 + * .. 0* + H2
C*(n-4)+ 0* .. CO* + (n-4)*
CO* .. CO+*
CO + 0* .. C02 + *
(2.35a)
(2.35b)
(2.35c)
(2.35d)
(2.35e)
(2.35f)
Reaction (2.35a) was assumed to be the rate determining step. Here, n presents the
number of nickel atoms in an ensemble. n=3 was predicted by Rostrup-Nielsen [131]
working on a sulphur-passivated nickel catalyst and n= 7 was determined by Martin
and Imelik [146] on the basis of methane adsorption on nickel, ie.
CH4 + 7Ni ..., CNi3 + 4HNi (2.36)
Methane steam reforming reactions occurring on the surface of nickel on alumina
have been described by Ross [95] using the following scheme:
/ OH OH
~H., I I S t e p I " ~ i - Al Al /
···.~~~"" Step2
l OH '
Step3 -----=-----
Figure 2.7 Scheme for the reaction of methane steam reforming over Ni/Al20 3
(adapted from [95]).
41
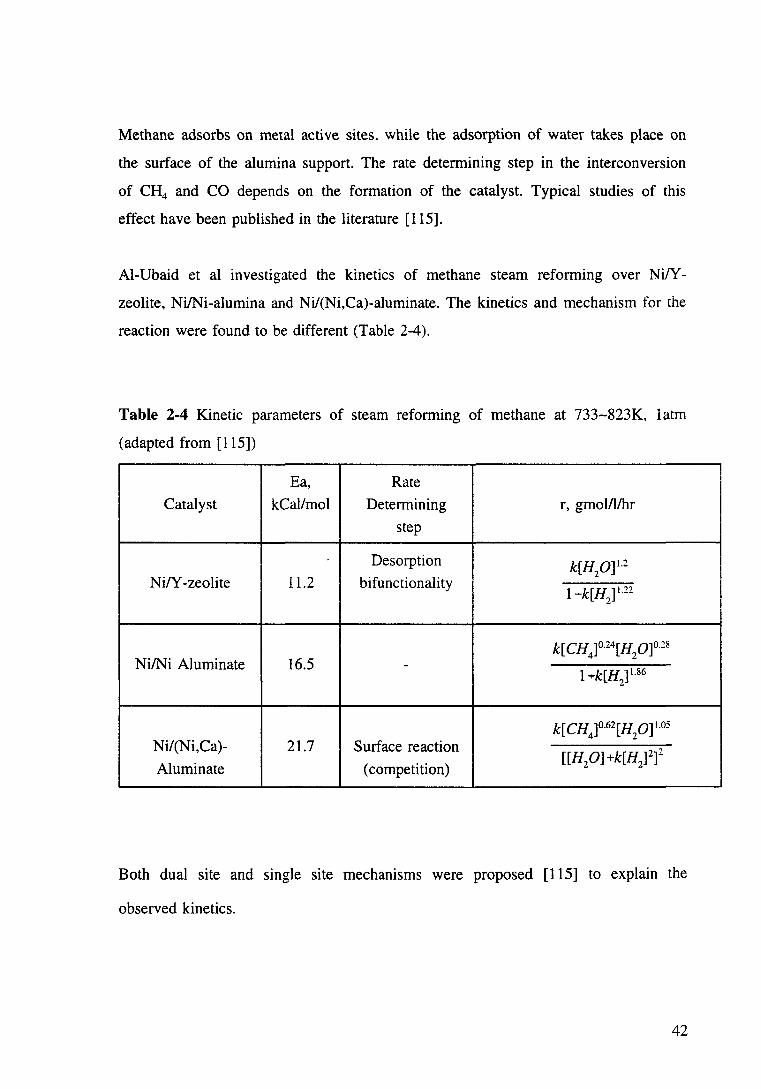
Methane adsorbs on metal active sites, while the adsorption of water takes place on
the surface of the alumina support. The rate determining step in the interconversion
of CH4 and CO depends on the formation of the catalyst. Typical studies of this
effect have been published in the literature [115].
Al-Ubaid et al investigated the kinetics of methane steam reforming over Ni!Y
zeolite, Ni/Ni-alumina and Ni/(Ni,Ca)-aluminate. The kinetics and mechanism for the
reaction were found to be different (Table 2-4 ).
Table 2-4 Kinetic parameters of steam reforming of methane at 733-823K, latm
(adapted from [115])
Ea, Rate
Catalyst kCallmol Determining r, gmol/1/hr
step
Desorption k[H20]1.2
Ni/Y -zeolite 11.2 bifunctionality 1 -k[Hz] 1.22
Ni/Ni Aluminate 16.5 k[ CH 4]o.24[ H2 O]o.zs
-1..-k[H2]J.s6
k[ CH4]o.62[H20] Los
Ni/(Ni,Ca)- 21.7 Surface reaction [[H20] +k[Hz]z]2
Aluminate (competition)
Both dual site and single site mechanisms were proposed [115] to explain the
observed kinetics.
42
Dual sites mechanism:
H20 + S .,. H20·S
CH4 + M .,. C-M +2H2
C·M + H20·S .,. HCO·M + 112H2 + S
HCO·M + H20·S .,. HCOO·M + H2 + S
HCOO·M ~ C02 + l/2H2 + M
Single site mechanism:
CH4 + M .,. CH2·M + H2
H20 + M .,. O·M + H2
CH2·M + O·M ~ CO·M + H2 +M
CO·M + O·M .,. C02 + 2M
(2.37a)
(2.37b)
(2.37d)
(2.37t)
(2.37e)
(2.38a)
(2.38b)
(2.38c)
(2.38d)
where S and M represent the support site and the metal site respectively. The dual
site mechanism was suggested to be suitable for catalysts with more acidic supports.
For catalysts with less acidic supports, the competition between steam and methane
for the same active sites gave a positive order in certain regions and a negative order
in other regions.
Over Rh based catalysts for steam reforming, zero order kinetics with respect to
methane have been determined by Kikuchi et al [ 14 7].
Table 2-5 summarises the kinetic studies for methane steam reforming over different
catalysts.
43
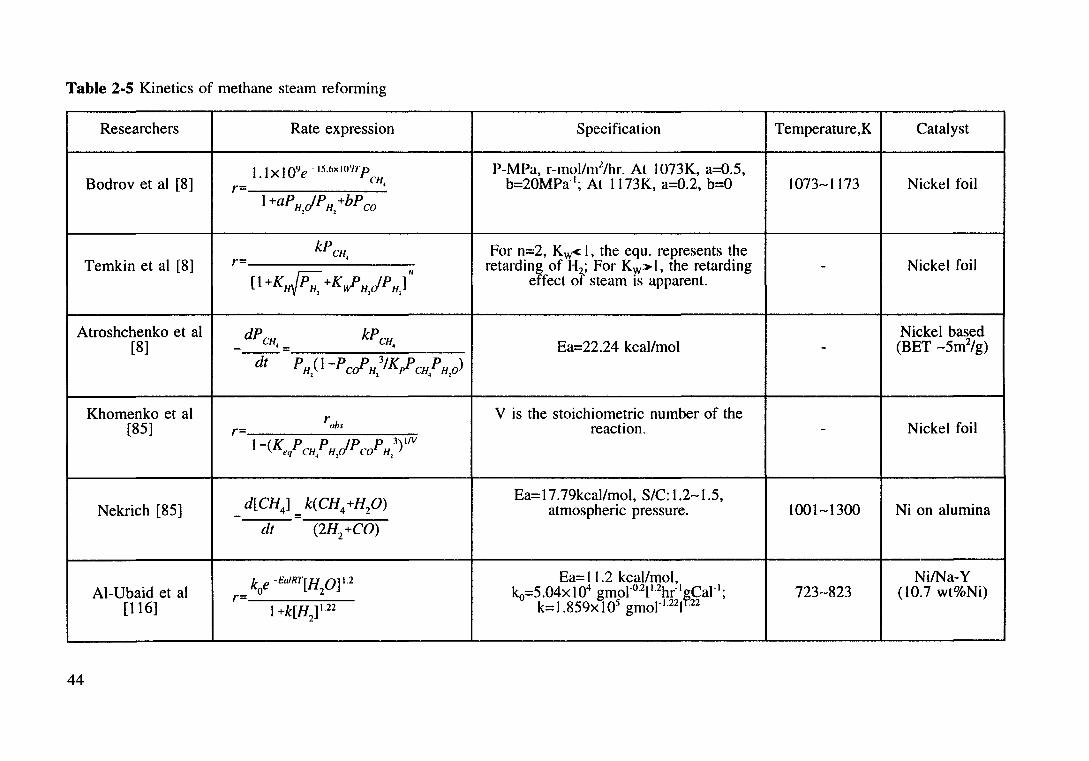
Table 2-5 Kinetics of methane steam reforming
Researchers Rate expression Specification Temperature,K Catalyst
1.1 X I OlJe -l5.t>xW'n·pCH P-MPa, r-mol/m2/hr. At I 073K, a=0.5, Bodrov et al [8] r- ' b=20MPa· 1
; At ll73K, a=0.2, b=O 1073-1173 Nickel foil l +aP11 JP 11 +bP eo
' '
kPCH For n=2, Kw< I, the equ. represents the Temkin et al [8] r= ' retarding of H2; For Kw> I, the retarding Nickel foil -
[ l +K~ +K~ H,JP H) 11
effect of steam is apparent.
Atroshchenko et al dPCH kPCH Nickel based [8] - ·- 4 Ea=22.24 kcal/mol - (BET -5m2/g)
dt PH(l-PC~H 3/K~CHPHO) 2 2 4 l
Khomenko et al rob.,
V is the stoichiometric number of the [85] r- reaction. - Nickel foil
1-(K,,/CH,P H,JPcoPH,3)ltV
d[CH4
] k(CH4+H20) Ea=l7.79kcal/mol, S/C: 1.2-1.5,
Nekrich [85] - - atmospheric pressure. 1001-1300 Ni on alumina dt (2H2+CO)
koe -Ea/RT[H20] 1.2 Ea= 11.2 kcal/mol, Ni/Na-Y Al-Ubaid et al k0=5.04x 10⁴ gmot·0·
2JJ.2h( 1¥.Cal" 1; 723-823 (10.7 wt%Ni) r=
[116] I +k[H2]1.22 k= 1.859x 10⁵ gmoi"J.221 ·22
44
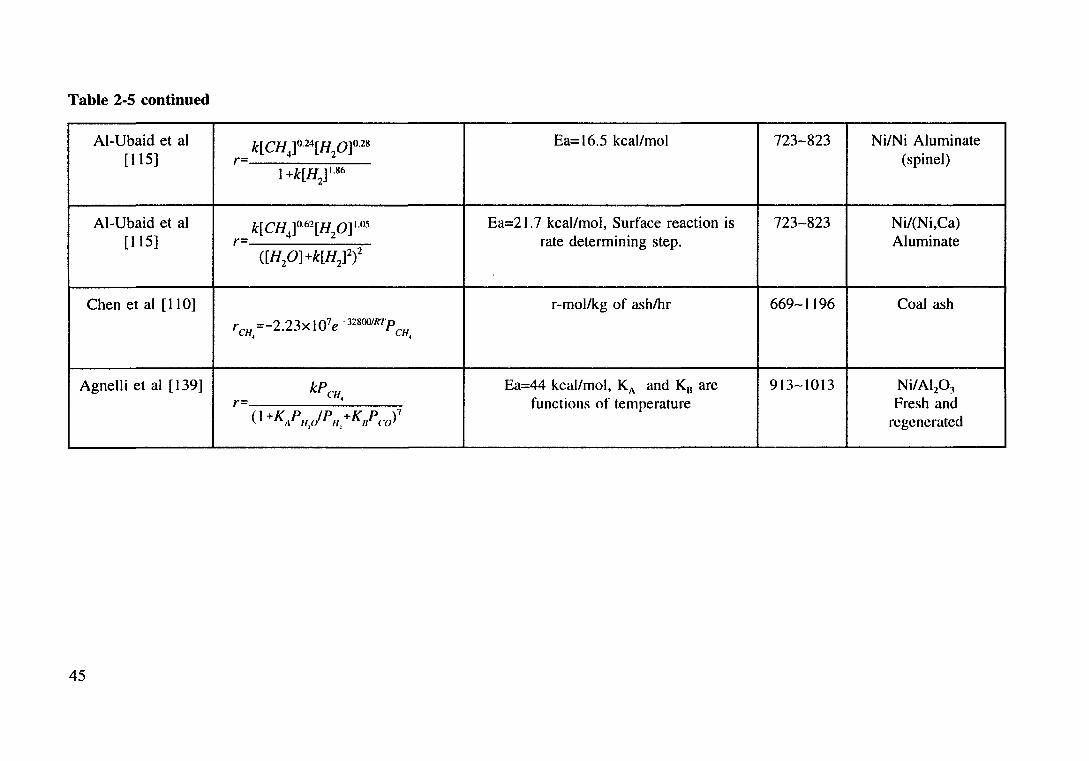
Table 2-5 continued
Al-Ubaid et al k[ CH 1o.24[H O]o.2s Ea= 16.5 kcal/mol 723-823 Ni/Ni Aluminate [ 115] r- 4 2 (spinet)
I +k[H2]I.s6
Al-Ubaid et al k[CH ]o.62[H O]t.os Ea=2l.7 kcal/mol, Surface reaction is 723-823 Ni/(Ni,Ca) [ 115] r- 4 2 rate determining step. Aluminate
([H20] +k[H2]2)2
Chen et al [I 10] r-mol/kg of ash/hr 669-1196 Coal ash r =-2.23x I 07 e -32800/RTp
CH, CH,
Agnelli et al [ 139] kPCH Ea=44 kcal/mol, KA and K8 are 913-1013 Ni/AI20 3 r= • functions of temperature Fresh and
(I +K,,Pu,JPII, +KIIPc)7 regenerated
45
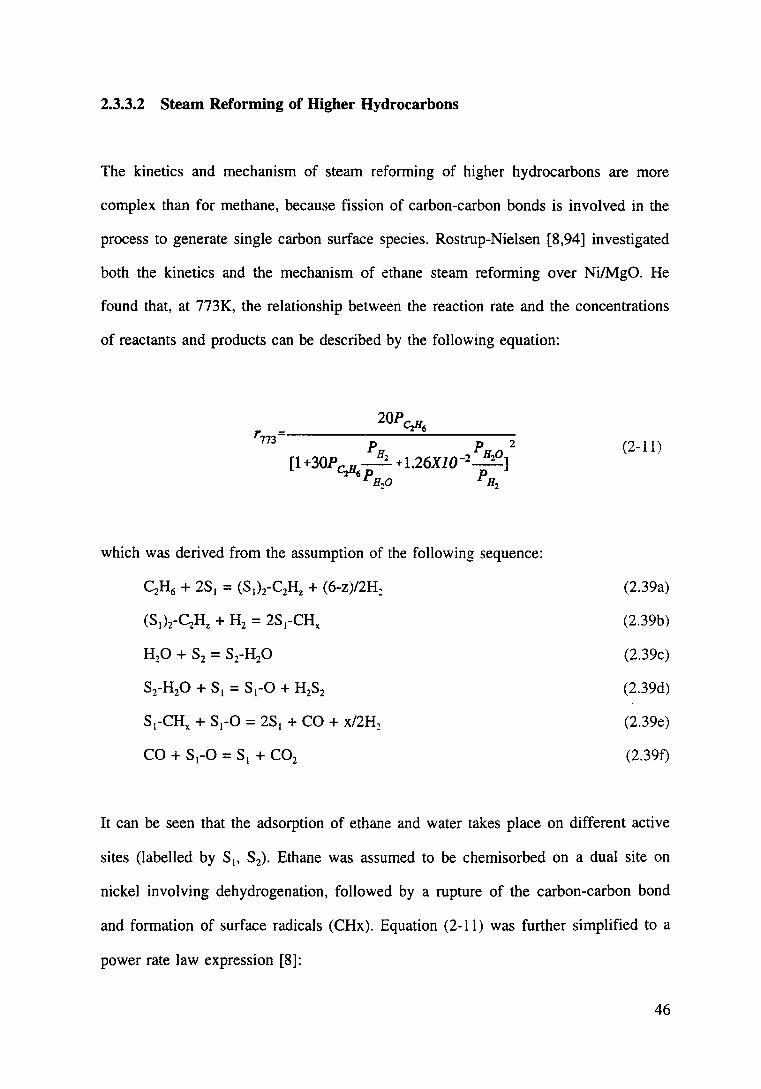
2.3.3.2 Steam Reforming of Higher Hydrocarbons
The kinetics and mechanism of steam reforming of higher hydrocarbons are more
complex than for methane, because fission of carbon-carbon bonds is involved in the
process to generate single carbon surface species. Rostrup-Nielsen [8,94] investigated
both the kinetics and the mechanism of ethane steam reforming over Ni/MgO. He
found that, at 773K, the relationship between the reaction rate and the concentrations
of reactants and products can be described by the following equation:
which was derived from the assumption of the following sequence:
S1-CHx + S1-0 = 2S 1 +CO+ x/2H2
CO + Sl-0 = SI + C02
(2-11)
(2.39a)
(2.39b)
(2.39c)
(2.39d)
(2.39e)
(2.39f)
It can be seen that the adsorption of ethane and water takes place on different active
sites (labelled by S1, S2). Ethane was assumed to be chemisorbed on a dual site on
nickel involving dehydrogenation, followed by a rupture of the carbon-carbon bond
and formation of surface radicals (CHx). Equation (2-11) was further simplified to a
power rate law expression [8]:
46
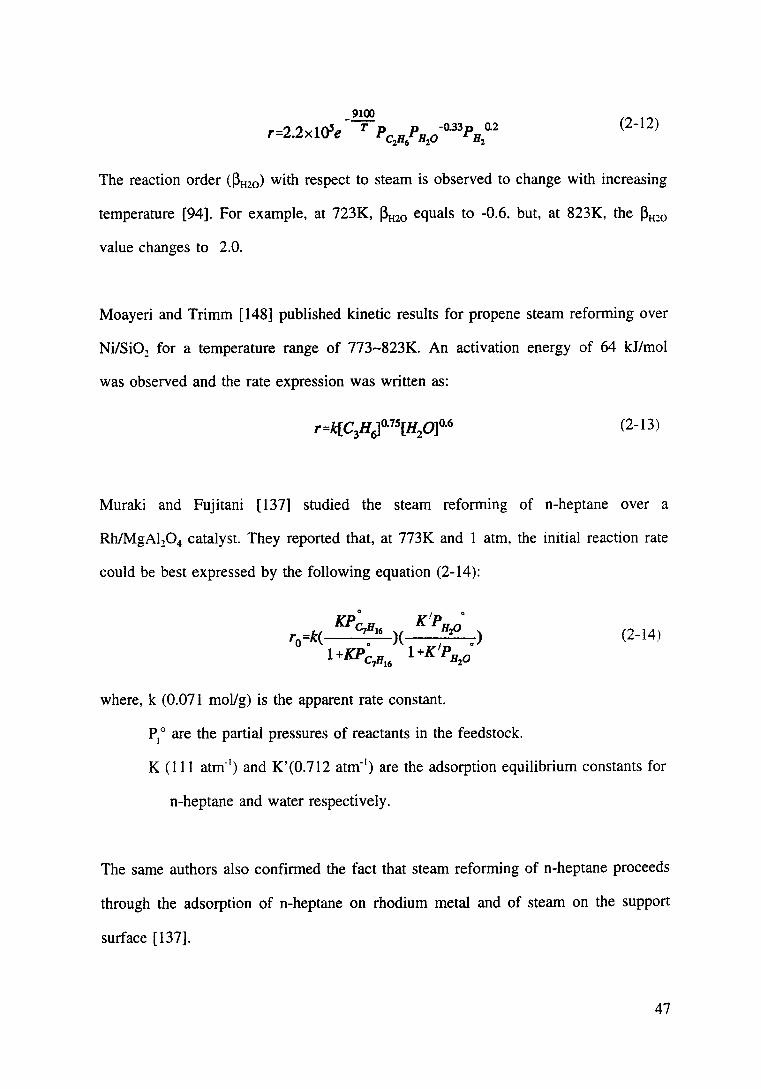
9100
r=2.2x10Se --:r P P -o.33P o.z C2H6 H.p B,_
(2-12)
The reaction order (~H20) with respect to steam is observed to change with increasing
temperature [94]. For example, at 723K, ~H2o equals to -0.6. but, at 823K, the ~H:::o
value changes to 2.0.
Moayeri and Trimm [ 148] published kinetic results for propene steam reforming over
Ni/Si01 for a temperature range of 773-823K. An activation energy of 64 kJ/mol
was observed and the rate expression was written as:
(2-13)
Muraki and Fujitani [137] studied the steam reforming of n-heptane over a
Rh/MgA110 4 catalyst. They reported that, at 773K and 1 atm, the initial reaction rate
could be best expressed by the following equation (2-14):
0
KPr-B K'P • ro=k( "7. 16 )( ,BzO .)
1 +KPc_11 1 +K Pn 0 ., .... 6 l
(2-14)
where, k (0.071 mol/g) is the apparent rate constant.
P1 o are the partial pressures of reactants in the feedstock.
K (Ill atm-1) and K'(0.712 atm-1
) are the adsorption equilibrium constants for
n-heptane and water respectively.
The same authors also confirmed the fact that steam reforming of n-heptane proceeds
through the adsorption of n-heptane on rhodium metal and of steam on the support
surface [137].
47
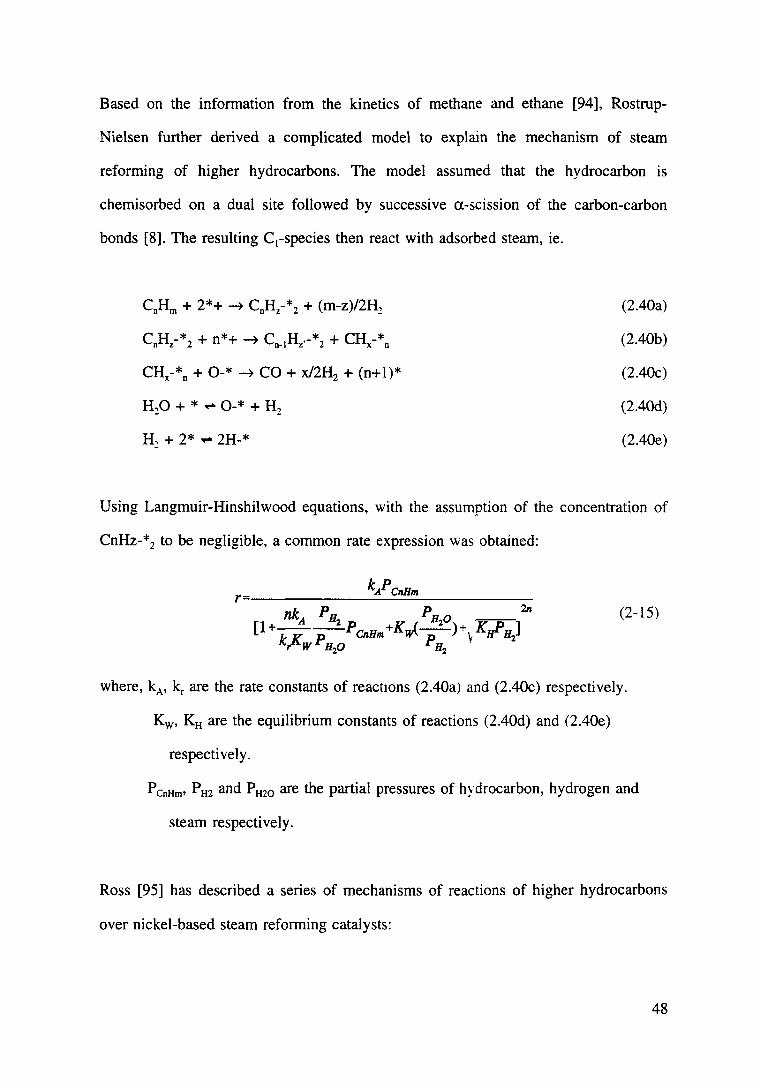
Based on the information from the kinetics of methane and ethane [94], Rostrup-
Nielsen further derived a complicated model to explain the mechanism of steam
reforming of higher hydrocarbons. The model assumed that the hydrocarbon is
chemisorbed on a dual site followed by successive a-scission of the carbon-carbon
bonds [8]. The resulting C1-species then react with adsorbed steam, ie.
CHx-*n + 0-* ~ CO + x/2H2 + (n+ 1)*
H:::O + * ,.... 0-* + H2
H.+ 2*,.... 2H-*
(2.40a)
(2.40b)
(2.40c)
(2.40d)
(2.40e)
Using Langmuir-Hinshilwood equations, with the assumption of the concentration of
CnHz-* 2 to be negligible, a common rate expression was obtained:
r (2-15)
where, kA, kr are the rate constants of reactions (2.40a) and (2.40c) respectively.
Kw, KH are the equilibrium constants of reactions (2.40d) and (2.40e)
respectively.
PcnHm• PH2 and PH2o are the partial pressures of hydrocarbon, hydrogen and
steam respectively.
Ross [95] has described a series of mechanisms of reactions of higher hydrocarbons
over nickel-based steam reforming catalysts:
48
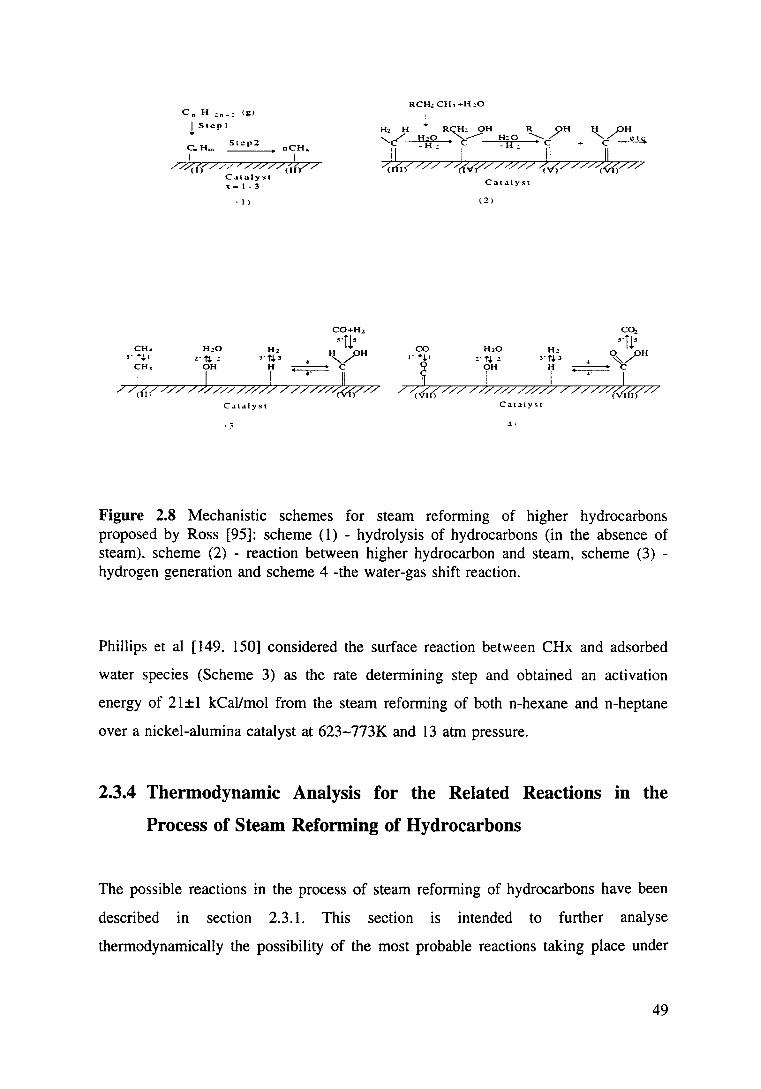
C" H .::n-.: <gJ
1 Step 1
C.Hrn Step2 nCH"
I I 70_((7 // ?T/?'7/M?7
C.ualyst ~ = 1-3
•1)
CO+Hz
CH. HzO Hz H •·n~H t••,j,t 2'f,j,; 3'f,j,3 4 '-../
CH, OH H C
~ I 4' k / 7((0:/ //7 7C //////77 77777/7(777
C .ualyst
·3
RC H.! CH, +H ,o
(2)
Figure 2.8 Mechanistic schemes for steam reforming of higher hydrocarbons proposed by Ross [95]: scheme (1) - hydrolysis of hydrocarbons (in the absence of steam). scheme (2) - reaction between higher hydrocarbon and steam, scheme (3) -hydrogen generation and scheme 4 -the water-gas shift reaction.
Phillips et al [149. 150] considered the surface reaction between CHx and adsorbed
water species (Scheme 3) as the rate determining step and obtained an activation
energy of 21±1 kCalfmol from the steam reforming of both n-hexane and n-heptane
over a nickel-alumina catalyst at 623-773K and 13 atm pressure.
2.3.4 Thermodynamic Analysis for the Related Reactions in the
Process of Steam Reforming of Hydrocarbons
The possible reactions in the process of steam reforming of hydrocarbons have been
described in section 2.3.1. This section is intended to further analyse
thermodynamically the possibility of the most probable reactions taking place under
49
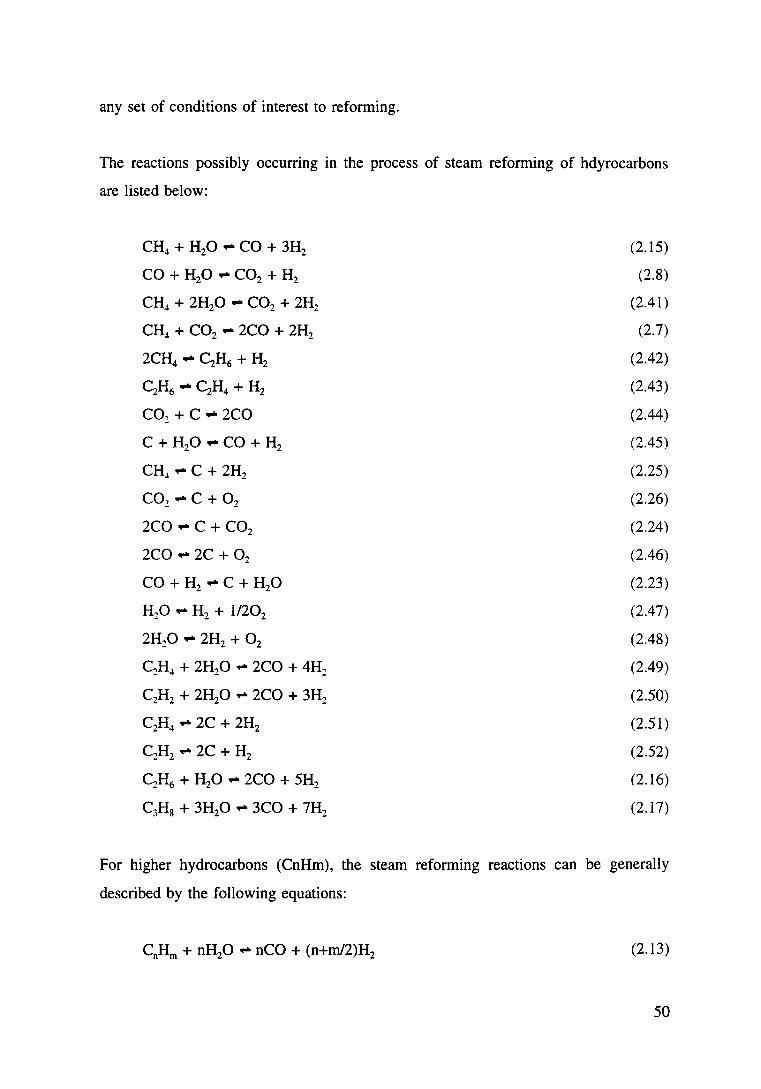
any set of conditions of interest to reforming.
The reactions possibly occurring in the process of steam reforming of hdyrocarbons
are listed below:
CH~ + H20 .,. CO + 3H2 (2.15)
CO + H20 .,. C02 + H2 (2.8)
CH~ + 2H20 .,. C02 + 2H2 (2.41)
CH~ + C02 .,. 2CO + 2H2 (2.7)
2CH4 .,. C2H6 + H2 (2.42)
C2H6 .,. C2H4 + H2 (2.43)
eo,+ c ... 2co (2.44)
C + H20 .,. CO + H2 (2.45)
CH.l.,. C + 2H2 (2.25)
C02 .,. C + 0 2 (2.26)
2CO.,. C + C02 (2.24)
2CO.,. 2C + 0 2 (2.46)
CO + H2 .,. C + H20 (2.23)
H20 .,. H2 + 11202 (2.47)
2H:P ... 2H2 + 0 2 (2.48)
C1H~ + 2H20 .,. 2CO + 4H1 (2.49)
C2H2 + 2H20.,. 2CO + 3H2 (2.50)
C2H.~ .,. 2C + 2H2 (2.51)
C2H2 .,. 2C + H2 (2.52)
C2H6 + H20 .,. 2CO + 5H2 (2.16)
C3H8 + 3H20 .,. 3CO + 7H2 (2.17)
For higher hydrocarbons (CnHm), the steam reforming reactions can be generally
described by the following equations:
(2.13)
50
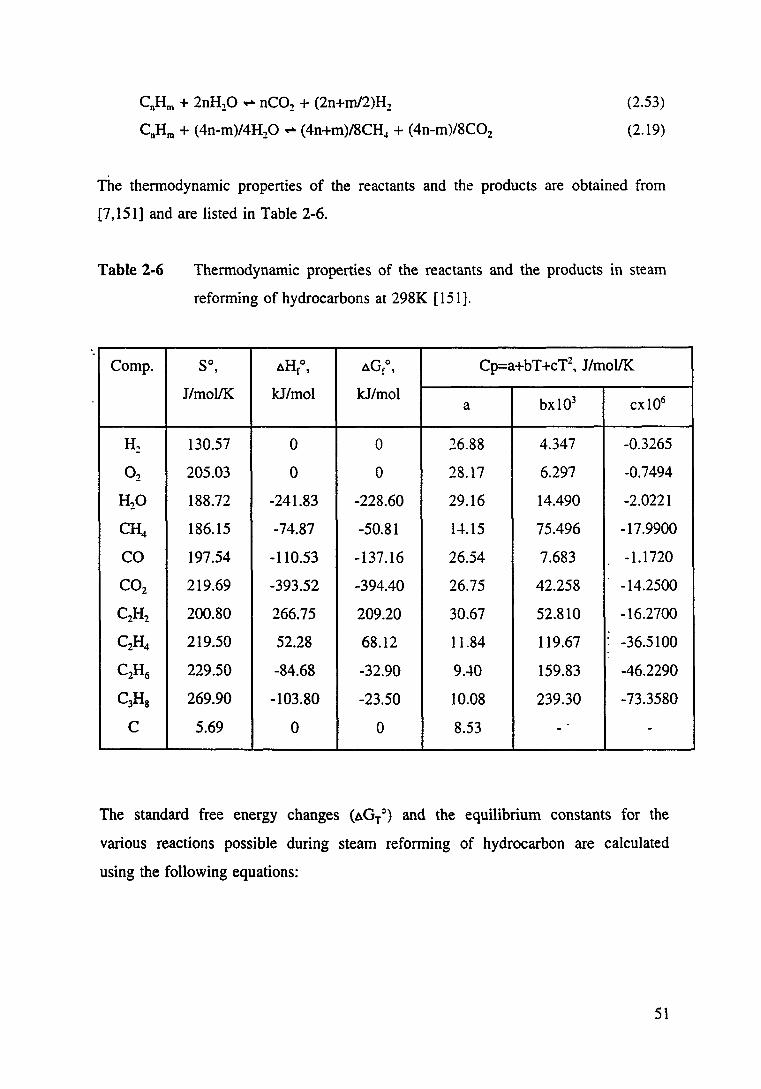
CnHm + 2nH20 ..... nC02 + (2n+m/2)H2 (2.53)
(2.19) CnHm + (4n-m)/4H20 ..... (4n+m)/8CH~ + (4n-m)/8C02
The thermodynamic properties of the reactants and the products are obtained from
[7,151] and are listed in Table 2-6.
Table 2-6
Comp.
H~
02
H20
CH4
CO
C02
C2H2
C2H4
C2H6
C3Hs
c
Thermodynamic properties of the reactants and the products in steam
reforming of hydrocarbons at 298K [ 151].
so, dHt. dGro, Cp=a+bT +cT2, J/moVK
JlmoVK kJ/mol kJ/mol bx103 cxl06 a
130.57 0 0 26.88 4.347 -0.3265
205.03 0 0 28.17 6.297 -0.7494
188.72 -241.83 -228.60 29.16 14.490 -2.0221
186.15 -74.87 -50.81 1-t-.15 75.496 -17.9900
197.54 -110.53 -137.16 26.54 7.683 -1.1720
219.69 -393.52 -394.40 26.75 42.258 -14.2500
200.80 266.75 209.20 30.67 52.810 -16.2700
219.50 52.28 68.12 11.84 119.67 -36.5100
229.50 -84.68 -32.90 9.-t.O 159.83 -46.2290
269.90 -103.80 -23.50 10.08 239.30 -73.3580
5.69 0 0 8.53 - -
The standard free energy changes (t.G/) and the equilibrium constants for the
various reactions possible during steam reforming of hydrocarbon are calculated
using the following equations:
51
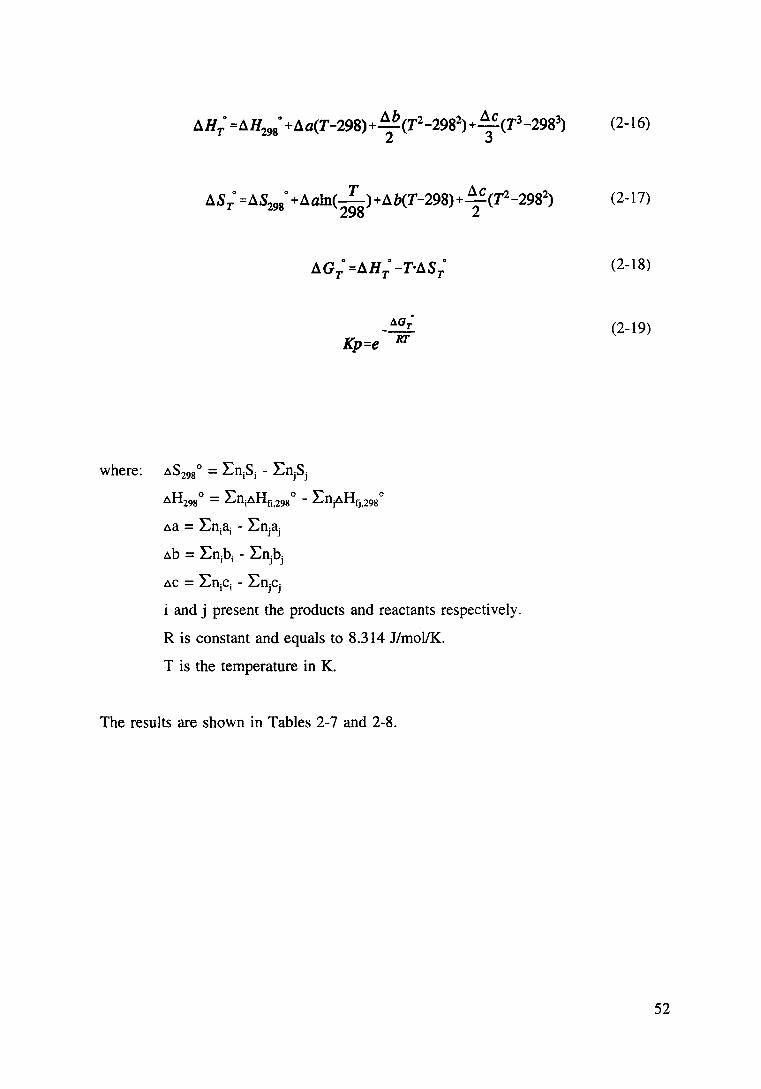
o o T llc 2 2 llSr =118298 +.AaJn(-)+llb(T-298)+-(T -298)
where: Ll.S298 o = :EniSi - :Enjsj
298 2
- t~.G; Kp=e RT
Ll.H29s o = LniLl.Hfi.29s o - LnpHfj.29s o
Ll.a = Lnii\ - Lnjaj
Ll.b = :Enibi - Lnjbj
Ll.C = :Ln.c. - :En.c. I I J J
i and j present the products and reactants respectively.
R is constant and equals to 8.314 J/mol/K..
T is the temperature in K.
The results are shown in Tables 2-7 and 2-8.
(2-16)
(2-17)
(2-18)
(2-19)
52
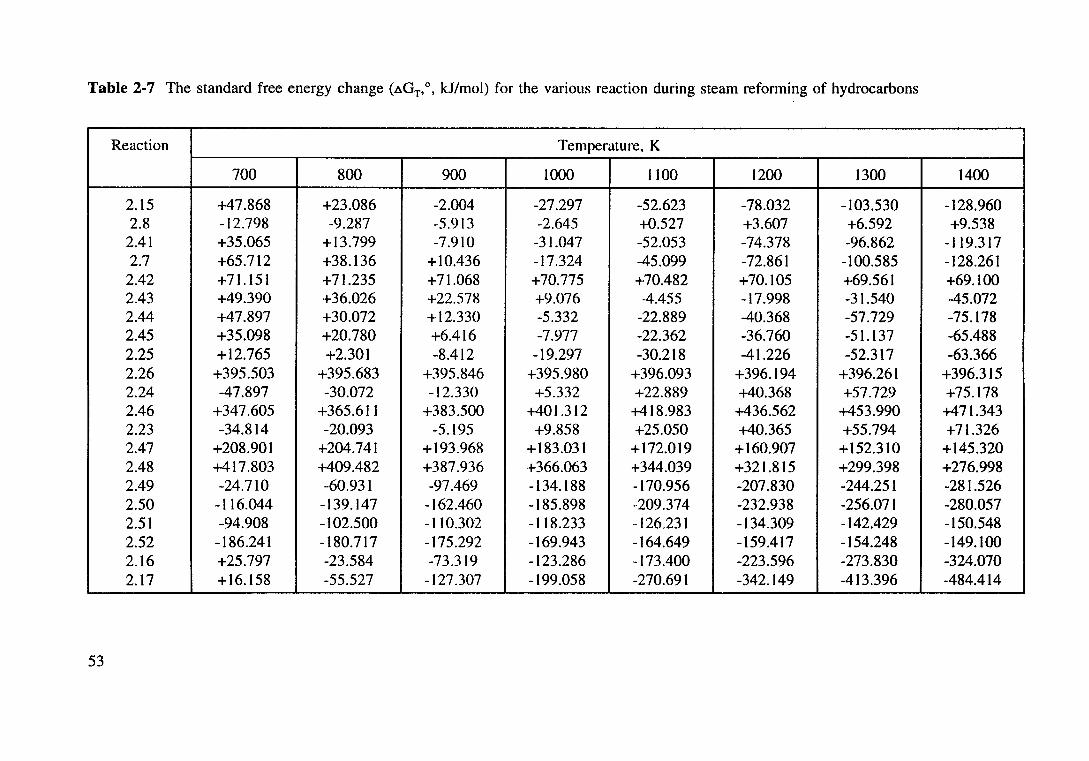
Table 2-7 The standard free energy change (ll.GT,o• kJ/mol) for the various reaction during steam reforming of hydrocarbons
Reaction Temperature, K
700 800 900 1000 I 100 1200 1300 1400
2.15 +47.868 +23.086 -2.004 -27.297 -52.623 -78.032 -103.530 -128.960 2.8 -12.798 -9.287 -5.913 -2.645 +0.527 +3.607 +6.592 +9.538
2.41 +35.065 +13.799 -7.910 -31.047 -52.053 -74.378 -96.862 -119.317 2.7 +65.712 +38.136 +10.436 -17.324 -45.099 -72.861 -100.585 -128.261
2.42 +71.151 +71.235 +71.068 +70.775 +70.482 +70.105 +69.561 +69.100 2.43 +49.390 +36.026 +22.578 +9.076 -4.455 -17.998 -31.540 -45.072 2.44 +47.897 +30.072 +12.330 -5.332 -22.889 -40.368 -57.729 -75.178 2.45 +35.098 +20.780 +6.416 -7.977 -22.362 -36.760 -51.137 -65.488 2.25 +12.765 +2.301 -8.412 -19.297 -30.218 -41.226 -52.317 -63.366 2.26 +395.503 +395.683 +395.846 +395.980 +396.093 +396.194 +396.261 +396.315 2.24 -47.897 -30.072 -12.330 +5.332 +22.889 +40.368 +57.729 +75.178 2.46 +347.605 +365.611 +383.500 +401.312 +418.983 +436.562 +453.990 +471.343 2.23 -34.814 -20.093 -5.195 +9.858 +25.050 +40.365 +55.794 +71.326 2.47 +208.901 +204.741 +193.968 +183.031 +172.019 +160.907 +152.310 +145.320 2.48 +417.803 +409.482 +387.936 +366.063 +344.039 +321.815 +299.398 +276.998 2.49 -24.710 -60.931 -97.469 -134.188 -170.956 -207.830 -244.251 -281.526 2.50 -116.044 -139.147 -162.460 -185.898 -209.374 -232.938 -256.071 -280.057 2.51 -94.908 -102.500 -110.302 -118.233 -126.231 -134.309 -142.429 -150.548 2.52 -186.241 -180.717 -175.292 -169.943 -164.649 -159.417 -154.248 -149.100 2.16 +25.797 -23.584 -73.319 -123.286 -173.400 -223.596 -273.830 -324.070 2.17 +16.158 -55.527 -127.307 -199.058 -270.691 -342.149 -413.396 -484.414
53

Table 2-8 The equilibrium constants for the possible reactions in steam reforming of hydrocarbons.
Reaction Temperature, K
700 800 900 1000 1100 1200 1300 1400
2.15 2.76xl0-~ 3.1lxt0·2 1.3lx 10° 2.67xl01 3.15xl02 2.49xl03 1.45xl04 6.48xl04
2.8 9.02xl0° 4.04xl0° 2.20x10° L37xl0° 1.06x 10° 6.97xl0·1 5.43x10·1 4.41 x w·' 2.41 2.42xto·3 1.26xl0-1 2.88xl0° 4.19xl01 2.96x10² 1.73xl03 7.80xl03 2.83xl04
1.7 L25x10·5 3.24xto·3 2.48x10·1 8.03x10° 1.39xl02 1.48xl03 l.10x104 6.10x10⁴
2.42 4.90x10·6 2.23x10·5 7.50x10⁻⁵ 2.0lx10-4 4.50x10⁻⁴ 8.88x10⁻⁴ 1.60x10·3 2.64x10·3
2.43 2.06x10⁻⁴ 4.44xto·3 4.89x10⁻² 3.36xto·' 1.63x10° 6.07xl0° l.85x101 4.8lxl01
2.44 2.67xto·4 1.04xt0·2 1.92xl0 1 1.90xl0° 1.22xl01 5.72xl01 2.09xl02 6.38xl02
2.45 2.40xto·.l 4.40x 10 2 4.24xl0 1 2.6lxl0° 1.15xl01 3.98xl01 1.13x 10² 2.78xl02
2.25 1.12xl0-1 7.08xto·1 3.08xl0° 1.02xl01 2.72xl01 6.23xl01 1.27x 10² 2.3Ixl02
2.26 3.06xl0-30 1.46xl 0'26 1.06x10⁻²³ 2.07x 10'21 1.55xto·'9 5.67x10⁻¹⁸ l.20xl0·16 1.63xl0-15
2.24 3.75x 10³ 9.20xl01 5.20xl0° 5.27xl0·1 8.19x 10'2 l.75x 10'2 4.79xto·3 1.57xto·3
2.46 l.l5xl0·26 I.34x to-24 5.5lx 10 2·1 1.09xl0-21 1.27xi0-20 9.91 x w-20 5.73xl0-19 2.59x )()' 18
2.23 3.96xl02 2.05xl01 2.00xl0° 3.06xlo·' 6.46xl0"2 l.75xl0 2 5.73xl0"3 2.J8xJ0-·1
2.47 2.58xl0- 16 4.28xto·'4 5.52xi0-12 2.75xto·10 6.78xto·9 9.90xl0·8 7.58xl0·7 3.78xl0·6
2.48 6.64x10'32 1.83xi0-27 3.05x10⁻²³ 7.55x10⁻²⁰ 4.60xto·17 9.80x10⁻¹⁵ 9.32x10⁻¹³ 4.62xl0· 11
2.49 6.98x101 9.52x10³ 4.54xl05 1.02xl07 1.31 X 10⁸ 1.11 x10⁹ 6.52xl09 3.19x10¹⁰
2.50 4.57x10H 1.22x 10⁹ 2.69xl09 5.14xl09 8.76xl09 1.38x 10¹⁰ 1.59xl010 2.81xl010
2.51 l.21x 107 4.93xl06 2.52xl06 1.50xl06 9.87xl05 7.02xl05 5.29xl05 4.14xl05
2.52 7.9lx10 13 6.31 X 10¹¹ l.49x I 0 10 7.54xl08 6.59xl07 8.70xl06 l.58xl06 3.66xl05
2.16 I. 19xto·2 3.47xl01 1.80xl04 2.75xl06 l.72xl08 5.4Ixl09 l.Olx1011 1.23x10¹²
2.17 6.23xto·2 4.22xl03 2.45x10⁷ 2.50xl010 7.15x10¹² 7.83x10¹⁴ 4.08xl016 l.19xl018
54
From the results of thermodynamic calculation. it can be seen that. for a temperature
range of 700-1400K, reactions 2.16, 17, 49, 50, 51 and 52 occur easily and
spontaneously since the aGT 0 S of these reactions are negative (ie. aGT 0 <0). The
forward reactions 2.15, 25, 41, 7, 43, 44 & 45 can automatically take place when the
reaction temperatures are higher than 900K. Their equilibrium constants increase
significantly with the enhancement of temperature. However, reactions 2.8, 23, 24 are
favoured at low temperatures and the possibilities of these reactions taking place
decline with increase of temperature. It also can be shown that the forward reactions
2.26, 42, 46, 47 & 48 can hardly occur even at very high temperatures but the
reverse reactions are favoured.
2.4 Autothermic Catalytic Reforming
Autothermic catalytic reforming is a very important process for effective utilisation
of energy. The process spontaneously generates heat for the endothermic steam
reforming reaction. The key feature of the process is that no external energy source
is required [10].
2.4.1 Autothermic Catalytic Steam Reforming of Methanol
Hydrogen production from autothermic catalytic steam reforming of methanol has
been investigated by Jiang et al [10,11] using a dual bed flow reactor system. The
process involves balancing the heat of combustion of methanol over a platinium on
y-alumina catalyst with that required to produce hydrogen and carbon dioxide by
steam reforming of methanol over a Cu0/Zn0-Al20 3 catalyst. They demonstrated that
the reaction system could start up at room temperature when water/methanol mixtures
55
and air were admitted into the system. The temperature of the inlet catalyst increased
rapidly. The heat generated by oxidation was then carried down-stream continuously
by the exit gas from the bed (Pt/Al20 3) to a steam reforming catalyst bed (Cu0/Zn0-
Al203). The Cu0/Zn0-Al20 3 catalyst was reduced by the products from the oxidation
section during the start-up. When the temperature of the reforming bed increased to
above 473K, significant amount of hydrogen was produced. The reaction temperature
can be efficiently controlled by limiting the level of air in the feed.
In such autothermic systems, 100% conversion of methanol with a 100% selectivity
to hydrogen via the steam reforming reaction (reaction 2.54) can be achieved in an
once-through process [10]. The product mixture only contains hydrogen. carbon
dioxide. nitrogen and unconverted water [11].
(2.54)
A similar · autothermic process for production of hydrogen from methanol has been
patented by Johnson Matthey [9]. A "hot spot" reactor [6] has been developed and
employed for hydrogen generation. Distinct from Jiang, the process developed by
Johnson Matthey is suggested to be based on the oxidation of methanol over a
platinum group metal catalyst in the first zone followed by partial oxidation of
methanol in a second zone of copper based catalyst [11].
(2.55)
The Hot Spot reactor™ produces carbon monoxide and methane as additional
products [152]. Comparing both processes, the dual bed flow reactor system proposed
by Jiang et al is much more easily controlled than the Johnson Matthey system, in
56
that the oxidation zone is controlled by limiting the oxygen to methanol ratio and
consuming all the oxygen in the oxidation zone [11]. The conversion of methanol
and selectivity to hydrogen in Jiang's system are higher than that in the Johnson
Matthey system. However, the dual bed reactor system, due to the extra amount of
water pumped in the feedstock for steam refonning, requires more methanol to be
oxidised to sustain the reaction temperature of the system.
Jenkins and Shutt [6,153] attempted to use a Hot Spot reactor loaded with a 1% Pt
and 3% Cr on silica catalyst to generate hydrogen from hydrocarbons. They found
that the catalytic oxidation of hydrocarbons cannot start at ambient and must be
initiated using either methanol or product hydrogen as the initiator. After lighting off.
the system can be sustained by introducing the hydrocarbons instead of the initiator.
Hydrogen has been produced in this hot spot reactor mainly by partial oxidation of
hydrocarbons and the selectivity is highly dependent on the ratio of oxygen to carbon
in the feedstock. High hydrogen selectivities can be obtained when the ratio of
oxygen to carbon is controlled at 1.5-2.5. Jenkins et al also reported that hydrogen
selectivity greater than 80% (at a hydrocarbon conversion greater than 90%) was
achieved at stoichiometric ratio of oxygen to carbon of 2.0 using gasoline feedstock.
However, carbon fonnation was observed in this process.
2.4.2 Autothermic Catalytic Reforming of Light Hydrocarbons
The commercial process of autothennic catalytic reforming is based on the reactions
between natural gas, steam and oxygen passing first through a burner, then over a
high temperature nickel based catalyst bed [49].
57
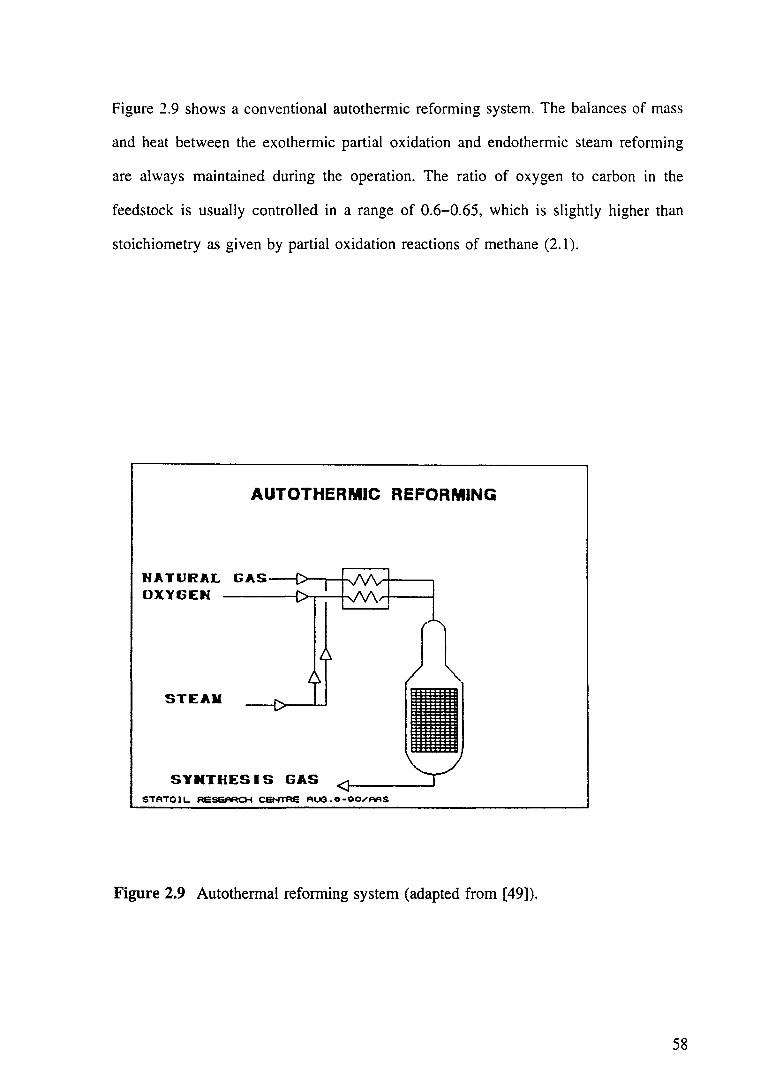
Figure 2.9 shows a conventional autothermic reforming system. The balances of mass
and heat between the exothermic partial oxidation and endothermic steam reforming
are always maintained during the operation. The ratio of oxygen to carbon in the
feedstock is usually controlled in a range of 0.6-0.65, which is slightly higher than
stoichiometry as given by partial oxidation reactions of methane (2.1 ).
AUTOTHERMIC REFORMING
HATURAL OXY6Etl
STEAII
SYHTHESIS GAS STATOl~ RESEARCH CENTRE AUG.O•OO~AAS
I
Figure 2.9 Autothermal reforming system (adapted from [49]).
58
2.5 The Objectives of This Project
Amongst the processs dealing with hydrocarbons, an important reaction is steam
reforming for hydrogen production. Due to its industrial impact, the process has
attracted more and more interest since the first commercialisation. The literature
survey in the previous sections reveals that a great deal of work has been done on
this process, including catalyst preparation and reactor design. However, the main
concern has been focused on the systems with external heat supplies. Recent studies
[10] have confirmed the possibility of using a self-sustained autothermic reactor for
converting methanol (and steam) into hydrogen.
The present project was designed to investigate the possibility of using the same
concept to convert light hydrocarbons, especially natural gas, into hydrogen. Due to
the complexity, the design of the proposed· system is not simple. It involves both
oxidation and steam reforming of hydrocarbons, and the mass and heat balance
between the exothermic and endothermic reactions, which are catalysed by different
catalysts. Attention will be mainly focused on:-
1. Investigation of total oxidation of light hydrocarbons (methane, ethane and
propane over both Pt/Al20 3 and Ni/Mg0-Al20 3 catalysts;
2. Investigation of steam reforming of these light hydrocarbons over both
Pt/Al20 3 and Ni/Mg0-Al20 3 catalysts;
3. Measurement of the kinetics of total oxidation of these light hydrocarbons
over Pt/ Al20 3;
59
4. Measurement of the kinetics of steam reforming of these light hydrocarbons
over Ni!Mg0-Al20 3;
5. Improvement of performance of nickel based catalysts by using heavy rare
earth oxides (i.e. ceria) as promoters;
6. Optimisation of the proposed process - the combination of oxidation and
steam reforming of the light hydrocarbons;
7. Designing and testing the reactor system.
60
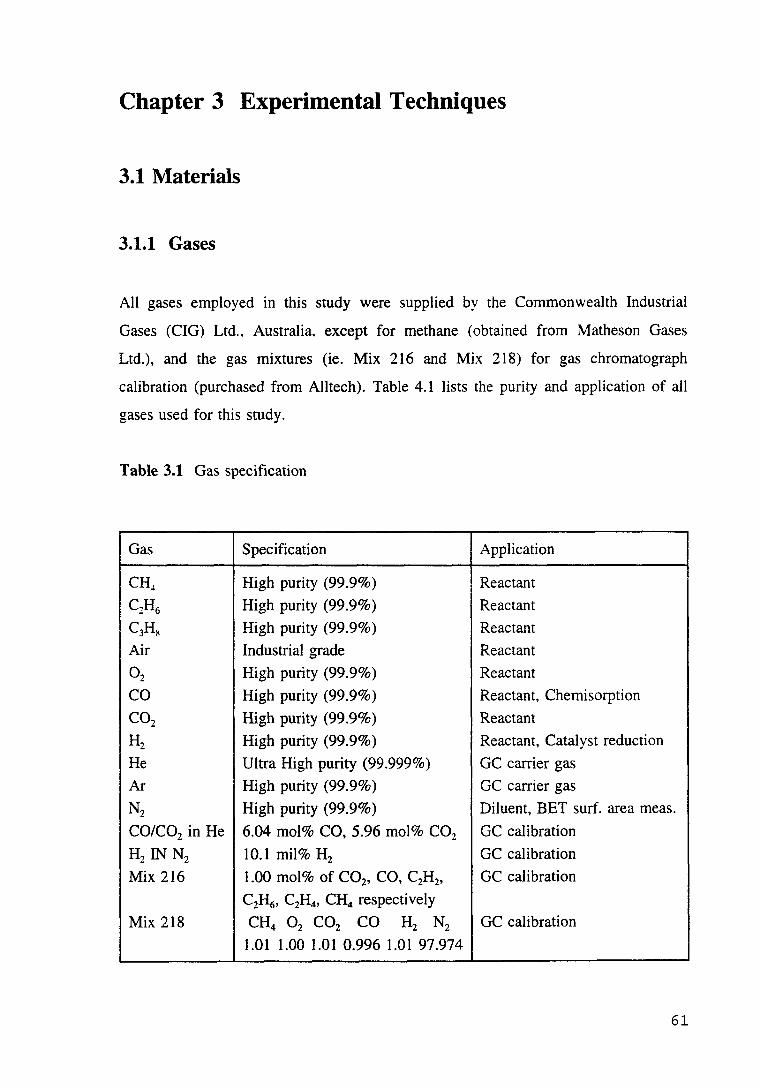
Chapter 3 Experimental Techniques
3.1 Materials
3.1.1 Gases
All gases employed in this study were supplied by the Commonwealth Industrial
Gases (Cl G) Ltd.. Australia, except for methane (obtained from Matheson Gases
Ltd.), and the gas mixtures (ie. Mix 216 and Mix 218) for gas chromatograph
calibration (purchased from Alltech). Table 4.1 lists the purity and application of all
gases used for this study.
Table 3.1 Gas specification
Gas Specification Application
CH.l High purity (99.9%) I
Reactant
C2H6 High purity (99.9%) Reactant
C3Hs High purity (99.9%) Reactant
Air Industrial grade Reactant
02 High purity (99.9%) Reactant
CO High purity (99.9%) Reactant, Chemisorption
C02 High purity (99.9%) Reactant
Hz High purity (99.9%) Reactant, Catalyst reduction
He Ultra High purity (99.999%) GC carrier gas
Ar High purity (99.9%) GC carrier gas
N2 High purity (99.9%) Diluent, BET surf. area meas.
CO/C02 in He 6.04 mol% CO, 5.96 mol% C02 GC calibration
H2 IN N2 10.1 mil% H2 GC calibration
Mix 216 1.00 mol% of C02, CO, C2H2, GC calibration
C2H6, C2H4, CH4 respectively
Mix 218 CH4 0 2 C02 CO Hz Nz GC calibration
1.01 1.00 1.01 0.996 1.01 97.974
61
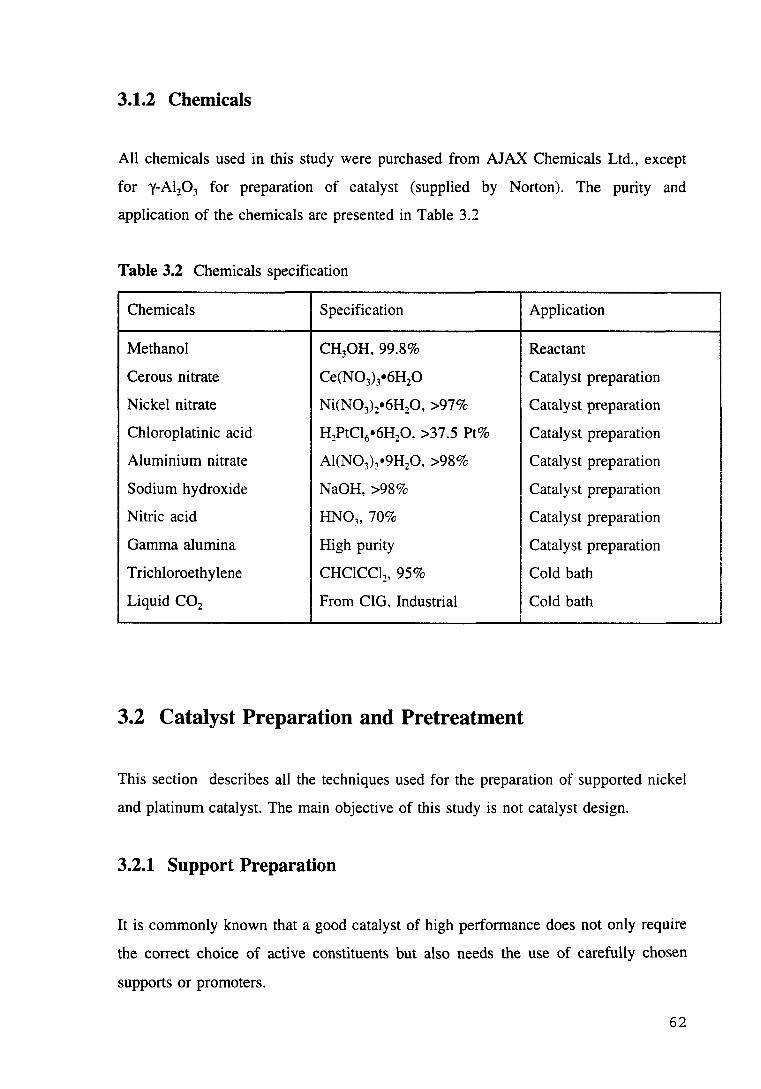
3.1.2 Chemicals
All chemicals used in this study were purchased from AJAX Chemicals Ltd., except
for y-Al20 3 for preparation of catalyst (supplied by Norton). The purity and
application of the chemicals are presented in Table 3.2
Table 3.2 Chemicals specification
Chemicals Specification Application
Methanol CH30H, 99.8% Reactant
Cercus nitrate Ce(N03) 3•6H20 Catalyst preparation
Nickel nitrate Ni(N03h•6H20, >97% Catalyst preparation
Chloroplatinic acid H2PtC16•6H20, >37.5 Pt% Catalyst preparation
Aluminium nitrate Al(N03h•9H20. >98% Catalyst preparation
Sodium hydroxide NaOH, >98% Catalyst preparation
Nitric acid HN03, 70% Catalyst preparation
Gamma alurnina High purity Catalyst preparation
Trichloroethylene CHC1CC12, 95% Cold bath
Liquid C02 From CIG, Industrial Cold bath
3.2 Catalyst Preparation and Pretreatment
This section describes all the techniques used for the preparation of supported nickel
and platinum catalyst. The main objective of this study is not catalyst design.
3.2.1 Support Preparation
It is commonly known that a good catalyst of high performance does not only require
the correct choice of active constituents but also needs the use of carefully chosen
supports or promoters.
62
In the case of steam reforming of light hydrocarbons, the choice of support is
particularly important due to the high temperatures involved, together with the
presence of steam in the process. The commonly used high surface area y-Al20 3
( -250 m2/g) was not considered to be a candidate for the proposed catalysts for
either oxidation or steam reforming, due to the concerns that: (1) the relatively high
acidity of y-Al20 3 might be the cause of carbon formation during reforming
operations; (2) y-Al10 3 is an unstable material which, under high temperatures (ie.
T>873K). is subject to change to other phases (ie. 8-. 8-, a-) or is sintered at
temperatures above 1470K. Concerning the high temperature stability, a-alumina can
be considered as a candidate for the support. However, the relatively low surface
area (ea. <5m2/g) usually results in a low dispersion of active metals and, therefore,
poor activities.
The supports for the oxidation and steam reforming of light hydrocarbons should
have not only reasonably large surface area but also high stability. The support used
in this study was prepared by calcining y-Al20 3 (BET surface area ea. 255 m2/g) at
1273K for four hours. The resulting alumina was scanned by X-ray diffraction
technique and the results indicated that the sample is 8-Al20 3, which is believed to
have relatively high thermostability with quite large surface area (BET ea 130 m2/g).
The alumina was crushed and sieved to 250-500 Jlm and used as the support for all
catalysts prepared by impregnation in this study.
3.2.2 Preparation of Supported Metal Catalysts
Both impregnation and eo-precipitation methods have been used for the preparation
of the supported metal (Pt, Ni) catalysts used in this study.
3.2.2.1 Impregnation
The impregnation method was reported by Alder et al [154]. This method is usually
used either when low metal content catalysts are required or when a catalyst pellet of
63
high mechanical strength is required [155]. High metal dispersion and mechanical
strength are typical advantages of catalysts prepared in this way.
The incipient wetness technique described by eiapetta et a1 [ 156] has also been
applied in this study. A certain amount of salt (ie. nickel nitrate) or acid (ie. chloro
platinic acid) containing metal (Ni or Pt) was accurately weighed and dissolved in
distilled water. The resulting aqueous solution was adjusted to give a volume
equivalent to approximately twice the pore volume of the support. A certain amount
of support (prepared by the method described in 3.2.1) was added to this solution to
form a slurry. This mixture was gently stirred in a glass beaker for three hours at
room temperature to ensure complete penetration of the pores and then heated at ea.
330-343K until dry. The catalyst was finally heated at 393K overnight in an air
oven. The dried catalyst was calcined in a muffle furnace with a flow of air at 773 K
(for Pt catalyst) or 873K (for nickel catalyst) for four hours.
3.2.2.2 eo-precipitation
eo-precipitation as a method for preparing nickel on alumina catalysts has been
established since 1924 [ 157]. This method is mainly employed in the case where
higher metal content catalysts are required. eo-precipitated nickel catalysts, for
example, are widely used for commercial processes such as steam reforming of
hydrocarbons and methanation of synthesis gas [7].
In this study, the eo-precipitation method was used to prepare a high nickel content
catalyst (ie. 25% Ni on alumina). The procedures of preparation employed are as
follows:
i) Solutions were prepared using 56.75 grams of Al(N03) 3•9H20 in 375 ml
water, 25.01 grams NaOH in 125 ml water and 12.625 grams Ni(N03) 2.6H20
in 7 5 ml water.
64
ii) The Al(N03h solution was titrated by the NaOH solution with fast stirring for
two hours. The mixture was then further mixed with the Ni(N03) 2 aqueous
solution added with 6 ml of 70 w% of HN03 at 283-293K for one hour. The
eo-precipitate was filtered and washed with distilled water until neutral. The
solid was then dried at 378K for 16 hours. After drying. the sample was
calcined in a muffle furnace with a flow of air at 773K for four hours. The
resulting catalyst was ground to the desired size (250-500 jlm) for
experiments.
3.2.3 Preparation of Dual Metal Catalysts
Composite bimetallic catalysts were prepared by a multi-impregnation-calcination
method. Two kinds of these catalysts were studied e.g. Ni0-Ce0/8-AI20 3 (labelled
as SR-2 and SR-5 l and Pt0-Ni0/8-Al20 3•
3.2.3.1 Preparation of Ni0-Ce0j8-Al20 3
Aqueous solutions of nickel and cerium nitrates were prepared individually. A certain
amount of support (8-Al20 3) was impregnated in the aqueous solution of cerium
nitrate at room temperature with gentle stirring for three hours. The mixture was then
heated by a hot plate to 333-343K (with stirring) until dry. Finally, the solid was
heated in a air furnace at 393K overnight to remove moisture. The dried sample was
calcined at 873K in air for four hours in order to decompose cerium nitrate into
ceria. The resulting Ce0/8-Al20 3 sample was further impregnated using an aqueous
solution of nickel nitrate. Exactly same procedures as those described for the
preparation of Ce0/8-Al20 3 were used to produce a Ni0-Ce0/8-Al20 3 catalyst.
3.2.3.2 Preparation of Pt0-Ni0/8-Al20 3
A similar method was also used to prepare Pt0-Ni0/8-Al20 3 catalysts. Chloro-
65
platinic acid and nickel nitrate were employed as the impregnants. Alumina was
chosen as the support. The support was first impregnated with a aqueous solution of
nickel nitrate usmg the same technique as described in section 3.2.2.1. After
calcination at 873K to decompose nickel nitrate, catalysts were impregnated by
chloro-platinic acid solution and calcined in air at 773K for four hours.
3~2.4 Catalyst Pretreatment
The oxidic metal catalysts after calcination have usually no activities for the required
reactions. The catalysts have to be reduced prior to use. The reduction of catalyst is a
very important process for activity and stability of the catalyst, and is carried out
very carefully. The basic principle for controlling the reduction conditions is to limit
any temperature rise and to minimise exposure of the catalyst to water vapour
produced in the reduction, since both high temperatures and high levels of steam can
cause premature sintering of the catalyst.
In this study, pure hydrogen was chosen as the reductant. 0.5-1 g of catalyst was
loaded in a constant temperature zone of a reactor which was mounted in an
electrical furnace. A flow of nitrogen was first introduced to the catalyst bed for ten
minutes at room temperature to remove oxygen in the system. About 80 ml(STP)/min
of hydrogen instead of nitrogen were then admitted to the reactor. The reactor was
heated at 10 K/min to 423K and maintained at this temperature for 20 minutes to
remove water adsorbed on the surface of the catalyst. The temperature of the catalyst
bed was then raised at a rate of 5 K/min to 573K for 30 minutes to further remove
constitutional water from the catalyst. Finally, the catalyst was heated in hydrogen
(ea. 80 ml/min) at a rate of 2 K/min to 773 or 873K, depending on the calcination
temperature required. After four hours reduction at this temperature, the temperature
was decreased with a flow of hydrogen continuously passing through catalyst bed
until the temperature was below 473K. A flow of oxygen-free nitrogen was then
introduced to the system to replace hydrogen for about half an hour. The catalyst was
then sealed under nitrogen in the reactor and was ready for use.
66
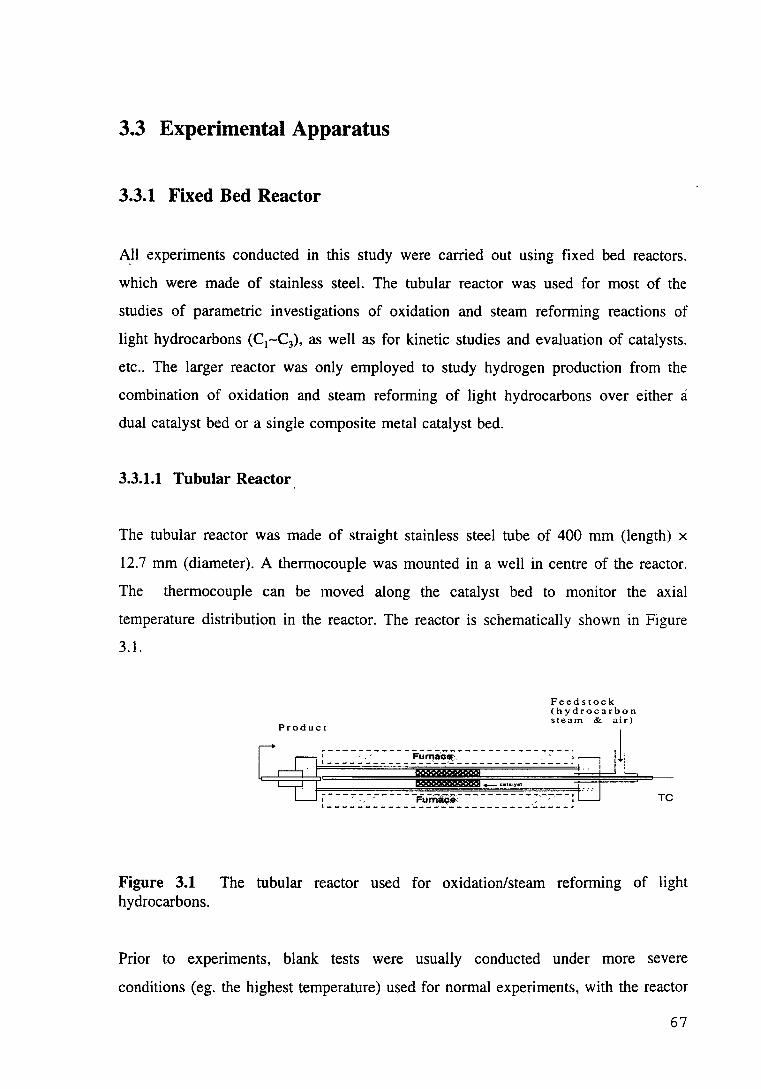
3.3 Experimental Apparatus
3.3.1 Fixed Bed Reactor
All experiments conducted in this study were carried out using fixed bed reactors.
which were made of stainless steel. The tubular reactor was used for most of the
studies of parametric investigations of oxidation and steam reforming reactions of
light hydrocarbons (C1-C3), as well as for kinetic studies and evaluation of catalysts.
etc .. The larger reactor was only employed to study hydrogen production from the
combination of oxidation and steam reforming of light hydrocarbons over either a dual catalyst bed or a single composite metal catalyst bed.
3.3.1.1 Tubular Reactor
The tubular reactor was made of straight stainless steel tube of 400 mm (length) x
12.7 mm (diameter). A thermocouple was mounted in a well in centre of the reactor.
The thermocouple can be moved along the catalyst bed to monitor the axial
temperature distribution in the reactor. The reactor is schematically shown in Figure
3.1.
Feed stock (hydrocarbon steam & air)
TC
Figure 3.1 The tubular reactor used for oxidation/steam reforming of light hydrocarbons.
Prior to experiments, blank tests were usually conducted under more severe
conditions ( eg. the highest temperature) used for normal experiments, with the reactor
67
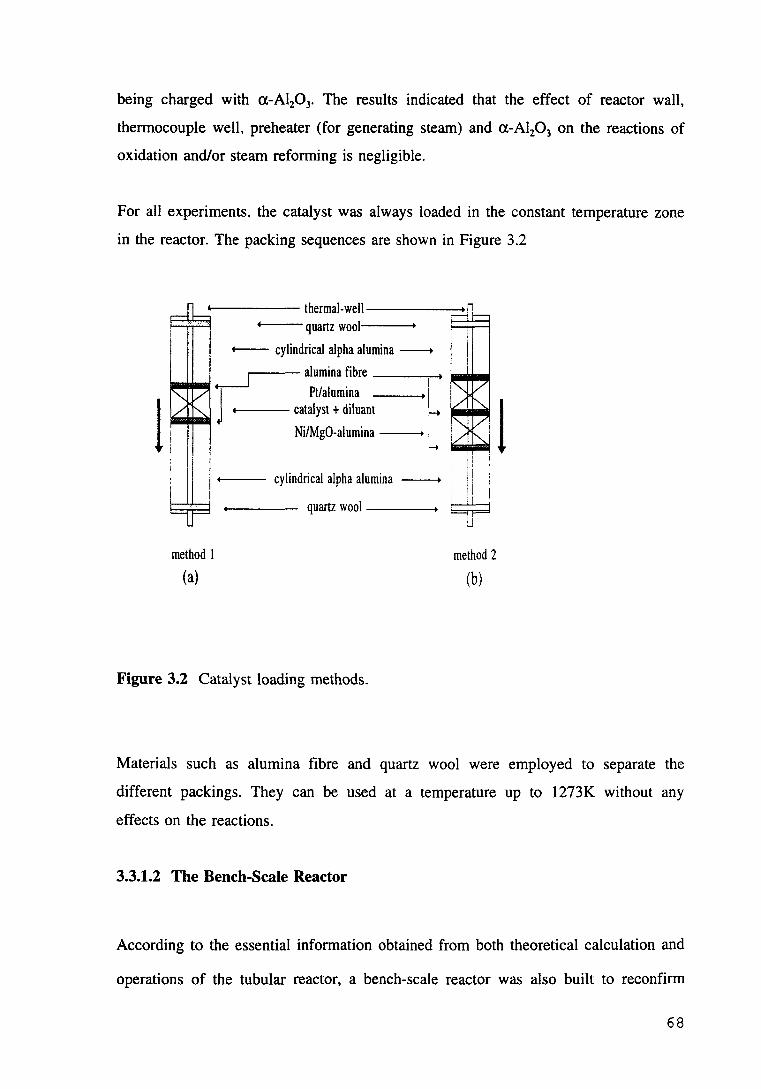
being charged with a-Al20 3• The results indicated that the effect of reactor wall,
thermocouple well, preheater (for generating steam) and a-Al20 3 on the reactions of
oxidation and/or steam reforming is negligible.
For all experiments, the catalyst was always loaded in the constant temperature zone
in the reactor. The packing sequences are shown in Figure 3.2
.\------ thermal-well-----..... ~~ quartz wool----+
+---- cylindrical alpha alumina -----.
__r- alumina fibre 1
~~ J Pt/alumina L 1
catalyst + diluant 1
-..........,.; 1 I Ni/MgO-alumina L 1
method I
(a)
..____ cylindrical alpha alumina ----+
quartz wool-----.
Figure 3.2 Catalyst loading methods.
. I i
li i 11 1
~ u
method 2
(b)
Materials such as alumina fibre and quartz wool were employed to separate the
different packings. They can be used at a temperature up to 1273K without any
effects on the reactions.
3.3.1.2 The Bench-Scale Reactor
According to the essential information obtained from both theoretical calculation and
operations of the tubular reactor, a bench-scale reactor was also built to reconfirm
68
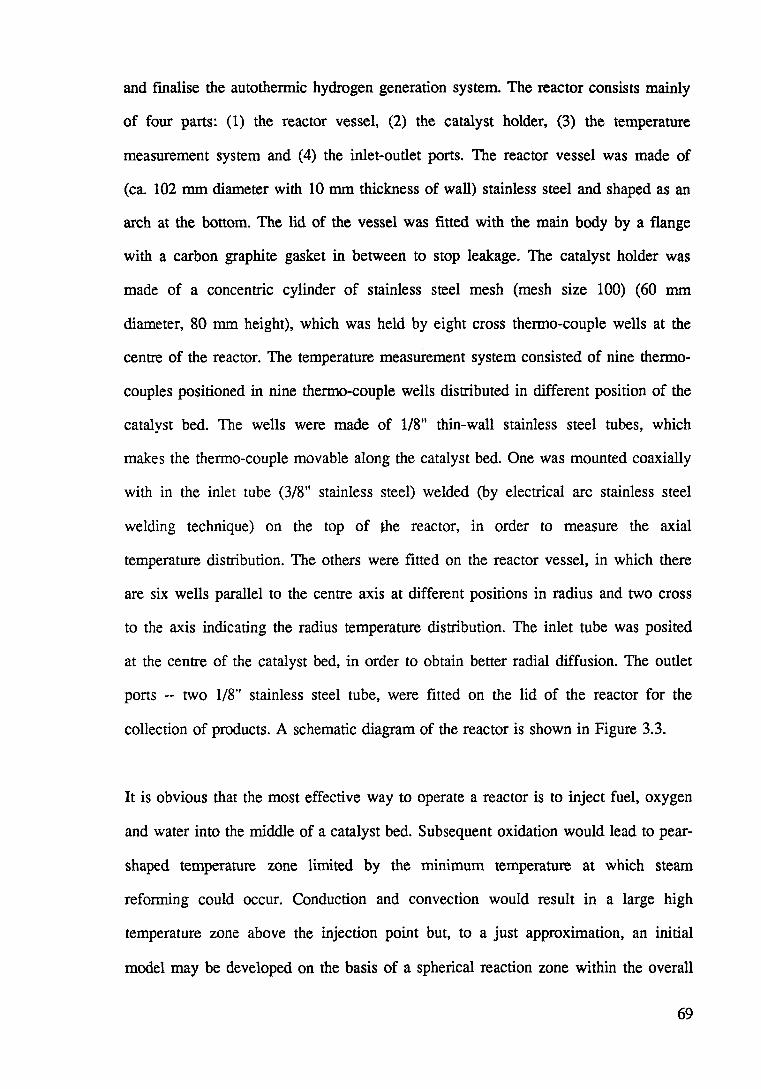
and fmalise the autothermic hydrogen generation system. The reactor consists mainly
of four parts: (1) the reactor vessel, (2) the catalyst holder, (3) the temperature
measurement system and (4) the inlet-outlet ports. The reactor vessel was made of
(ea. 102 mm diameter with 10 mm thickness of wall) stainless steel and shaped as an
arch at the bottom. The lid of the vessel was fitted with the main body by a flange
with a carbon graphite gasket in between to stop leakage. The catalyst holder was
made of a concentric cylinder of stainless steel mesh (mesh size 100) (60 mm
diameter, 80 mm height), which was held by eight cross thermo-couple wells at the
centre of the reactor. The temperature measurement system consisted of nine thermo-
couples positioned in nine thermo-couple wells distributed in different position of the
catalvst bed. The wells were made of 1/8" thin-wall stainless steel tubes, which "
makes the thermo-couple movable along the catalyst bed. One was mounted coaxially
with in the inlet tube (3/8" stainless steel) welded (by electrical arc stainless steel
welding technique) on the top of the reactor, in order to measure the axial
temperature distribution. The others were fitted on the reactor vessel, in which there
are six wells parallel to the centre axis at different positions in radius and two cross
to the axis indicating the radius temperature distribution. The inlet tube was posited
at the centre of the catalyst bed, in order to obtain better radial diffusion. The outlet
ports -- two 1/8" stainless steel tube, were fitted on the lid of the reactor for the
collection of products. A schematic diagram of the reactor is shown in Figure 3.3.
It is obvious that the most effective way to operate a reactor is to inject fuel, oxygen
and water into the middle of a catalyst bed. Subsequent oxidation would lead to pear-
shaped temperature zone limited by the minimum temperature at which steam
reforming could occur. Conduction and convection would result in a large high
temperature zone above the injection point but, to a just approximation, an initial
model may be developed on the basis of a spherical reaction zone within the overall
69
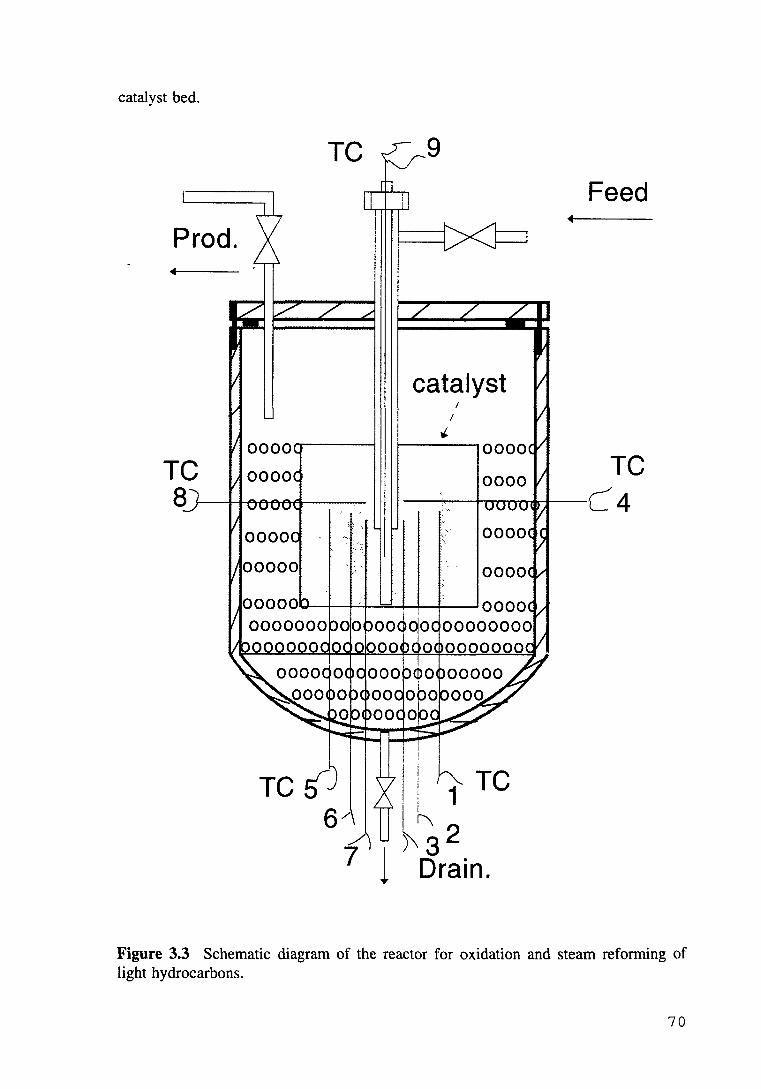
catalyst bed.
TC
Prod.
catalyst I
I
Feed
TC ---+---+..........n-'l'"'rn"11r-1--L4
I
I i ~TC ' : 1
~~2 Drain.
Figure 3.3 Schematic diagram of the reactor for oxidation and steam reforming of light hydrocarbons.
70
3.3.2 Temperature Controlling System
All heating elements used in the laboratory rig were controlled by Shinku electronic
temperature controllers except for those heating lines and the preheater which were
controlled by a transformer.
The temperature of the preheater was normally maintained at about 503K in order to
evaporate liquid-phase water fed. All the lines between the preheater and the first gas
chromatograph (GCl) were heated electrically to a temperature of ea. 393K to avoid
the condensation of steam.
The reactor was heated by an electrical furnace which was temperature controlled
using a Shinku temperature controller. The controlling thermocouple was located in
between the furnace and the reactor tube. The bed temperature was indicated and
recorded by another thermocouple located in thermocouple well in the centre of the
reactor. In order to obtain better heating efficiency, alumina particles were used to
fill the gap between the reactor tube and the furnace for the steam reforming
reactions.
3.3.3 Flow System
A flow diagram (Figure 3.4) shows the main apparatus used for the experiments of
oxidation/steam reforming. As can be seen, the rig was designed to have very good
operative flexibility for both oxidation and steam reforming reactions. The flow rates
of gas-phase reactants were metered by electronic mass flow controllers (Brooks
5850E) which were carefully calibrated using a bubble meter. The calibration was
conducted at the same conditions as those for the reactions. The liquid feedstock (e.g.
water) was pumped by a ISCO LC-2600 stainless steel syringe pump (capacity of
0-260 cm3/hr, pressure rating 20 MPa) and evaporated in a preheater at above 503K
before reaching the reactor. The steam generated from the preheater was mixed with
purified gas-phase hydrocarbons and other gases (ie. N2, air, CO or C02) and was
71
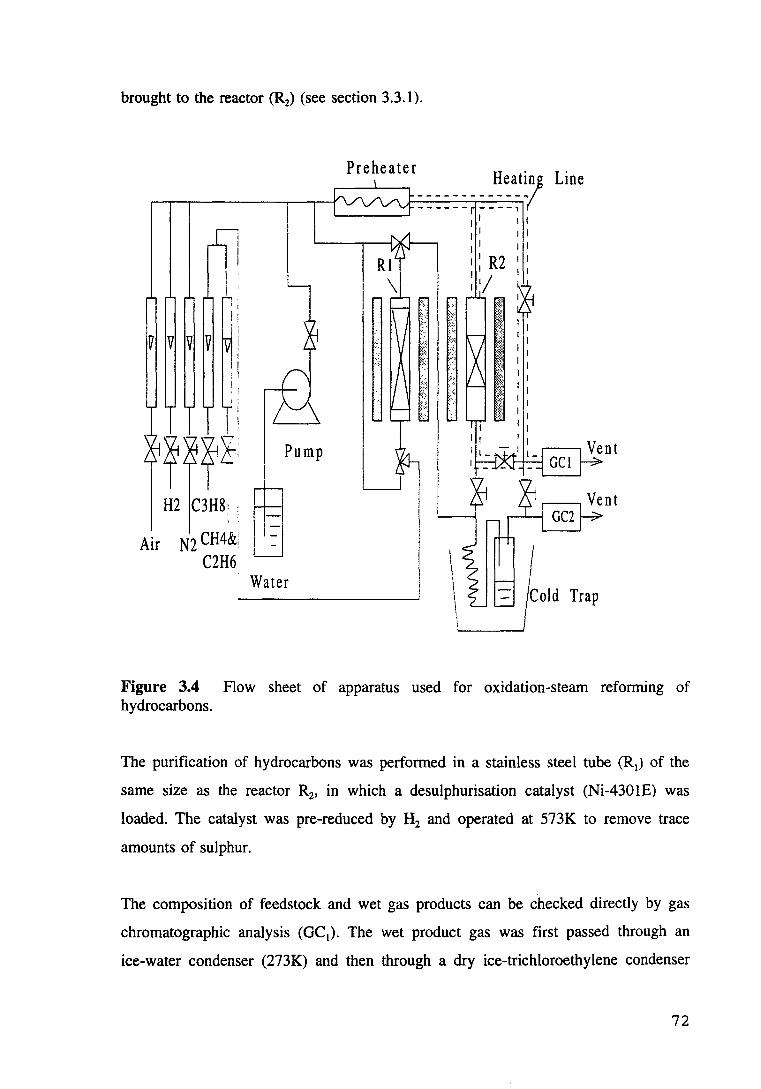
brought to the reactor (R2) (see section 3.3.1).
r---;---,-------,-.---r Preheater ===== = _ ==~~·;1 Line
(ll ~ ~;
'' 1!
' '2:~ I Pump
H2 C3H8; I I[
Air N2 CH4&l 1
-
C2H6 Water
I I I I I I I I I I
Trap
Figure 3.4 Flow sheet of apparatus used for oxidation-steam reforming of hydrocarbons.
The purification of hydrocarbons was performed in a stainless steel tube {R1) of the
same size as the reactor R2, in which a desulphurisation catalyst (Ni-4301E) was
loaded. The catalyst was pre-reduced by H2 and operated at 573K to remove trace
amounts of sulphur.
The composition of feedstock and wet gas products can be checked directly by gas
chromatographic analysis (GC1). The wet product gas was first passed through an
ice-water condenser (273K) and then through a dry ice-trichloroethylene condenser
72

( 195K). For the experiments with propane. the dry ice-trichloroethylene condenser
was by-passed, in order to prevent the condensation of unreacted propane.
3.3.4 Product Analysis
Products analysis of all experiments were conducted using two on-line gas
cliromatographs. which could be operated in parallel or in series. A Porapak Q
column of 3m (length) x 3mm (O.D.) was used in an up-stream gas chromatograph
(GC1) (Shimatzu 9A) equipped with both FID and TCD detectors. Helium was
employed as carrier gas with a flow rate of 30 mllmin. The column temperature was
programmed from 333 to 423K at 40 K/min.
This gas chromatograph was used for the analysis of methane, carbon dioxide.
ethylene. ethane, propane, water and methanol. In the case of the steam reforming
reaction, carbon monoxide was also measured by this GC, when using only
hydrocarbons and steam as feedstock in the absence or presence of helium diluent
gas.
A 1.8 m length of CTR-1 combined with a 0.26 m of Porapak N in senes was
employed in the down-stream gas chromatograph (GC2) (Shimatzu 8A) fitted with a
thermal conductivity detector (TCD). Argon was used as carrier gas with a flow rate
of 30 mllmin. The column temperature was controlled at 303K. This chromatograph
analysed hydrogen. carbon dioxide, ethane, oxygen, nitrogen, methane and carbon
monoxide.
Hewlett Packard 3390 integrators were used to determine peak areas. The columns
used for two GCs were regenerated regularly and calibrated by standard gas on a
daily basis.
Table 3.3 indicates the retention time and response factor for various compounds.
The response factor (Fi) was defined as the following:
73
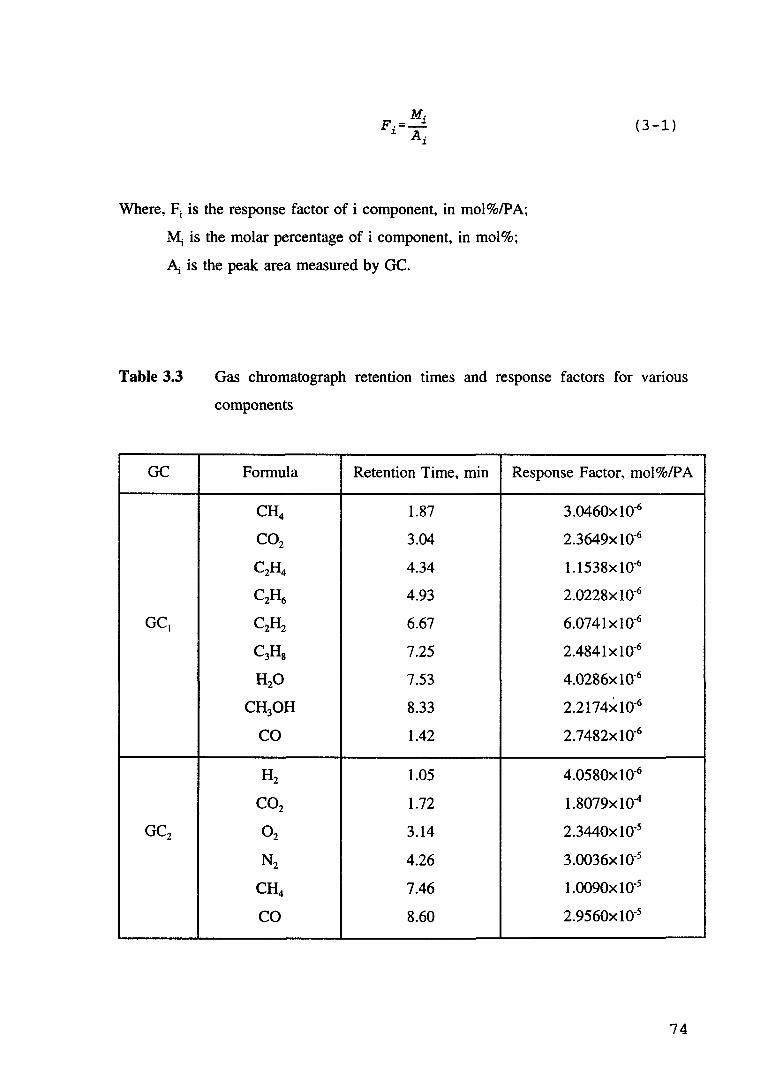
M. F.=-=. ~ A·
~
Where, Fi is the response factor of i component, in mol%/PA;
Mi is the molar percentage of i component, in mol%;
~ is the peak area measured by GC.
( 3-1)
Table 3.3 Gas chromatograph retention times and response factors for various
components
GC Formula Retention Time, min Response Factor, mol%/PA
CH4 1.87 3.0460xl0-6
C02 3.04 2.3649x 1 o-6
C2H4 4.34 1.1538xl0-6
c2~ 4.93 2.0228x10⁻⁶
GC, C2H2 6.67 6.0741xl0-6
C3Hs 7.25 2.4841x1o-6
H20 7.53 4.0286x1o-6
CH30H 8.33 2.2174xw-6
CO 1.42 2.7482xl0-6
H2 1.05 4.0580x 1 o-6
C02 1.72 1.8079x10⁴
GC2 02 3.14 2.3440x1o-s
N2 4.26 3.0036x 1 o-s
CH4 7.46 1.0090x10⁻⁵
CO 8.60 2.9560x1o-s
74
3.4 Experimental Procedures
3.4.1 Oxidation of Light Hydrocarbons
The apparatus used for oxidation of light hydrocarbons over platinum or nickel based
catalysts has been shown in Figure 3.4.
A certain amount of Pt0/o-Al:P3 and/or nickel based catalysts diluted with a-Al20 3
powder of the same particle size was loaded into the reactor (R2) and reduced in situ
using the method described in Section 3.2.4. Following the catalyst pretreatment,
hydrocarbon gas, air/oxygen and nitrogen were metered by mass flow controllers
individually and then mixed before passing to the reactor. The temperature of the
reactor was carefully adjusted and the total pressure in the reactor was nearly one
atmosphere (101.3 kPa).
The partial pressure of the hydrocarbon was controlled by changing the flow rates of
the hydrocarbon and the balance gas (N2). Similarly, the molar ratio of hydrocarbon
to oxygen was controlled either by changing the flow rate of air/oxygen at constant
flow rate of hydrocarbon or by adjusting the flow rate of hydrocarbon while
introducing constant amounts of oxygen. The balance gas was changed respectively
during the adjustment in order to maintain a constant gas velocity through the
catalyst bed.
The flow rate of total (dry) product gas was measured by a soap film bubble meter
and analysed on-line by two gas chromatographs (section 3.3.4). The mass balance
could be made easily at anytime during the operation.
For the sake of safety, the concentrations of hydrocarbon and oxygen in the feedstock
were always kept outside the explosive limits.
75
3.4.2 Steam Reforming of Light Hydrocarbons
The experiments for steam reforming of light hydrocarbons were conducted using the
same reactor as that for oxidation reactions. Due to the strong endothermicity of the
steam reforming reactions, more attention was focused on the insulation of the
reaction system in order to minimise the heat loss, and on the provision of better heat
transfer media between the reactor and heating furnace. For example. the, gap
between the reactor and the furnace was filled with cylindrical (<j>l.5mm x 3-5mm)
alumina particles. The two ends of the reactor (outside of the furnace) were heated
by electric heating tapes and isolated by Kaowool.
The loading and pretreating of the reforming catalysts were performed using exactly
the same procedures as those for oxidation experiments. After pretreatment, the
temperature of the reactor was adjusted to 473K with a flow of oxygen-free nitrogen
passing through the catalyst bed. The desired amounts of hydrocarbon and water
were then introduced to the reaction system. As described in Section 3.3.3, water was
first evaporated in a preheater and then mixed with the gas-phase hydrocarbon before
reaching the reactor. In order to prevent carbon formation, the ratio of steam to
carbon (atom) in feedstock was always controlled at above 2. The temperature was
carefully increased to the desired value, and the conversion and reaction rates at
different operative conditions were measured.
3.4.3 Autothermic Oxidation/Steam Reforming of Light
Hydrocarbons
The autothermal oxidation and steam reforming of light hydrocarbons was carried out
using the so-called "adiabatic" reactors charged with both platinum and nickel based
catalysts.
Both the tubular reactor (made of 160mm long x 12.7 mm O.D stainless steel) and
the scaled-up reactor (see section 3.3.1.2) were used for this study.
76
The tubular reactor could be charged with: (a) a single bed configuration with a
composite dual metal (Pt-Ni) catalyst and/or a Pt0/Al20 3 catalyst mixed uniformly
with a Ni0/Al20,. or (b) a dual bed with the Pt0/Al20 3 catalyst on top, followed by
NiO~lg0-Al203 bed. All the catalysts, prior to use, were reduced in-situ by pure
hydrogen at 773K for four hours (The detailed procedure is described in Section
3.2.3.2). After reduction, the reactor was cooled to room temperature and insulated
by Kaowool, before being positioned and sealed in a Dewar flask. There were two
thermocouples to monitor the reactor temperature. One located in a thermocouple
well in the reactor centre was used to measure the temperature distribution in the
catalyst bed. The other was positioned on the reactor wall.
The scaled up reactor was configured with a single bed filled with a physical mixture
of the above two catalysts. The catalysts, before loading to the reactor. were reduced
in a tubular reaCtor by pure hydrogen at 773K. and then immersed into liquid
methanol to keep the reduction status. The wet catalysts were removed to the sample
holder of the reactor and dried with a flow of oxygen-free nitrogen passing through
the bed at 623K overnight. Finally, the reactor was cooled to room temperature.
The autothermic reactor system was initiated by the oxidation of hydrogen and/or
methanol at room temperature, in which a certain amount of hydrogen and/or
methanol mixed with air was introduced to the reactor. The oxidation reaction
occurred spontaneously. When the reactor temperature rose to the light off
temperatures for hydrocarbon oxidation (e.g. methane:-670K, ethane and propane:
-520K), hydrocarbon was admitted to the system to replace hydrogen (and/or
methanol). Continuous oxidation of hydrocarbon occurred in the reactor and the
reactor temperature was further enhanced. When the temperature increased to the
desired value, a certain amount of water was pumped to the reactor. After one hour,
the product composition was measured. By changing the ratios of steam to
hydrocarbon and air to hydrocarbon in the feedstock, the hydrogen yield and
conversion of hydrocarbon could be determined and the optimal operative conditions
could be studied.
77
3.5 Catalyst Characterisations
Activity. selectivity and stability of a catalyst are directly dependent on its physical
properties. These physical properties can be characterised by using techniques such as
X-ray diffraction. adsorption-desorption of solid and thermo-analysis etc.. This
section will describe briefly the techniques used for the characterisation of the
catalysts involved in this study.
3.5.1 Catalyst Composition by X-ray Fluorescence (XRF)
X-ray fluorescence analysis is a very useful technique for qualitative analysis of
solid, powdered and liquid samples [158]. This method is based on measurements of
the wavelength and the intensity of the radiation emitted by those excited (by X-ray)
elements in the sample [158]. In modern X-ray analysis, the sample is irradiated by
polychromatic radiation from an X-ray tube and the elements in the sample are
excited to emit their characteristic X-ray radiation. This secondary radiation consists
of several lines which are diffracted by a crystal plate and separated into the
individual wavelengths. Every spectrum emitted by an element consists of only a few
characteristic lines. Therefore, the qualitative composition of a sample can be
determined by identifying those characteristic lines emitted by the elements in the
sample. At the same time, quantitative analysis can be performed by measuring both
wavelength and intensity of the emitted radiation.
The compositions of several nickel catalysts used in this study were analysed using
the X-ray fluorescence technique. The catalyst sample (Ca. 0.5 grams) were diluted
to 10 grams with high purity quartz, then ground to very fine and uniform powder,
and pressed into a 40 mm boric acid-backed disc, and finally analysed using a
Siemens SRS-300 sequential spectrometer with a rhodium end-window tube.
78

3.5.2 Surface Area Measurements
The surface characteristics of catalysts are usually described by such parameters as
total surface area, metallic surface area and pore size distribution, all of which may
directly affect the performance of a catalyst. The technique for surface area
measurement is based on the fact that adsorption may be either physical or chemical,
depending on the system involved and the conditions employed. The total surface
area and pore size distribution are usually determined by physical adsorption but
metallic surface area is measured using chemisorption.
3.5.2.1 Total Surface Area
Total surface areas of catalysts are usually determined using the BET approach [159].
The quantity of adsorbate (gas) necessary to form a mono-iayer of molecules on the
catalyst surface is determined. The most commonly used BET expression is in the
following form [159] :
( 3-2)
where, V a is the volume of gas adsorbed at pressure P;
P0 is the saturation pressure of gas;
V m is the volume of gas required to cover the entire adsorbing surface by a
mono-molecular layer;
and C is a constant involved with adsorption energy.
By measuring the volume of gas adsorbed at a certain temperature (77 .5K for N2)
and at various pressures, a plot of PNa(P0-P) versus relative pressure P/P0 in the
range of 0.05 to 0.3 can give a straight line with the intercept and slope of which are
1NmC and (C-1)NmC, respectively. Hence, it is possible to calculate the volume of
gas required to form an adsorbed mono-molecular layer (Vm) and the surface area
per gram of sample (S) that is:
79
Vm.Am.Na S= . . W. V0
where, S is the specific surface area of catalyst in m2/g:
Na is the Avogadro's number, Na=6.023xl023 molecules/mol:
~ is the area of an adsorbed molecule in m2:
V0 is the mass of sample. in gram.
( 3-3)
The determination of total surface area in this study was carried out using an ASAP-
2000 surface area analyser. The sample (ea. 0.5 grams) was first dried and degassed
at 573K for two hours and then cooled to 77 .5K by immersing the sample tube into
liquid nitrogen. Adsorption of nitrogen at different pressure was automatically
measured and recorded and calculated by this analyser.
3.5.2.2 Metallic Surface Area
The metallic surface area is the total active metal surface area available for
interaction with the adsorbate. The measurements of metallic surface areas of
catalysts are based on chemisorption of gases, which are selectively retained by the
metal [ 160]. Nickel has been found to chemisorb many gases such as oxygen, carbon
dioxide, hydrogen and hydrogen sulphide. However, the most commonly used gases
for nickel surface area measurements are hydrogen and carbon monoxide [8].
In this study, carbon monoxide chemisorption was employed to measure the metallic
surface areas of supported platinum and/or nickel catalysts. About 0.4 g of catalyst
sample was reduced by pure hydrogen (eg. 573K for Pt catalyst, 873K for Ni
catalyst) for two hours, and degassed at the same temperature at least for thirty
minutes. Then the sample was cooled to 298K for Pt catalyst and/or to 197K for Ni
catalyst by immersing the sample tube in a dry ice-acetone mixture. After that, the
reduced sample was exposed to carbon monoxide at different pressures. The amount
of carbon monoxide adsorbed by the fresh surface of catalyst resulted either from
chemisorption (on the active metal surface) or physical adsorption (on the catalyst).
80
Since the physi-sorbed carbon monoxide is reversibly adsorbed and chemisorption is
irreversible, the physi-sorbed carbon monoxide was desorbed by degassing the
sample at the same temperature as used for adsorption. After degassing, the same
procedure of adsorption was used again to re-measure the amount of carbon
monoxide adsorbed physically by the tested sample. The quantity of carbon
monoxide required for chemisorption can be easily worked out by taking the amount
of physi-sorbed carbon monoxide from the initial total adsorption, in which carbon
monoxide was adsorbed both chemically and physically. The metallic surface area of
catalyst was then calculated using the following equation:
S = 6. 023. x1023
·V·F ·A m 22414 cal AS
( 3-4)
where. sm is the metallic surface area (m2/g);
V is the quantity of carbon monoxide chemisorbed on the sample (cm3/g);
Peal is the calculated stoichiometry factor depending on adsorbate and
metals on the catalyst.
AAs is the effective area of one active metal atom (m2/atom).
It was found from the experiments that the nickel surface area of the Nil Al20 3
catalyst cannot be determined at room temperature, because carbon monoxide was
not only chemisorbed on the surface but also reacted with or dissolved in the
catalyst. It was necessary to decrease the adsorption temperature in order to avoid
such side-effects. The influence of temperature on the chemisorption was tested and
finally the temperature of dry-ice in acetone ( 197K) was found to be the best for the
measurements.
3.5.2.3 Pore Size Distribution
The pore size of a catalyst is an important parameter and usually determines the
selectivity of the catalyst. Techniques used to measure catalyst pore size include the
application of gas desorption and mercury pressure porosimetry. The former 1s
suitable for materials containing pores of about 100 A radius, while the latter IS
81
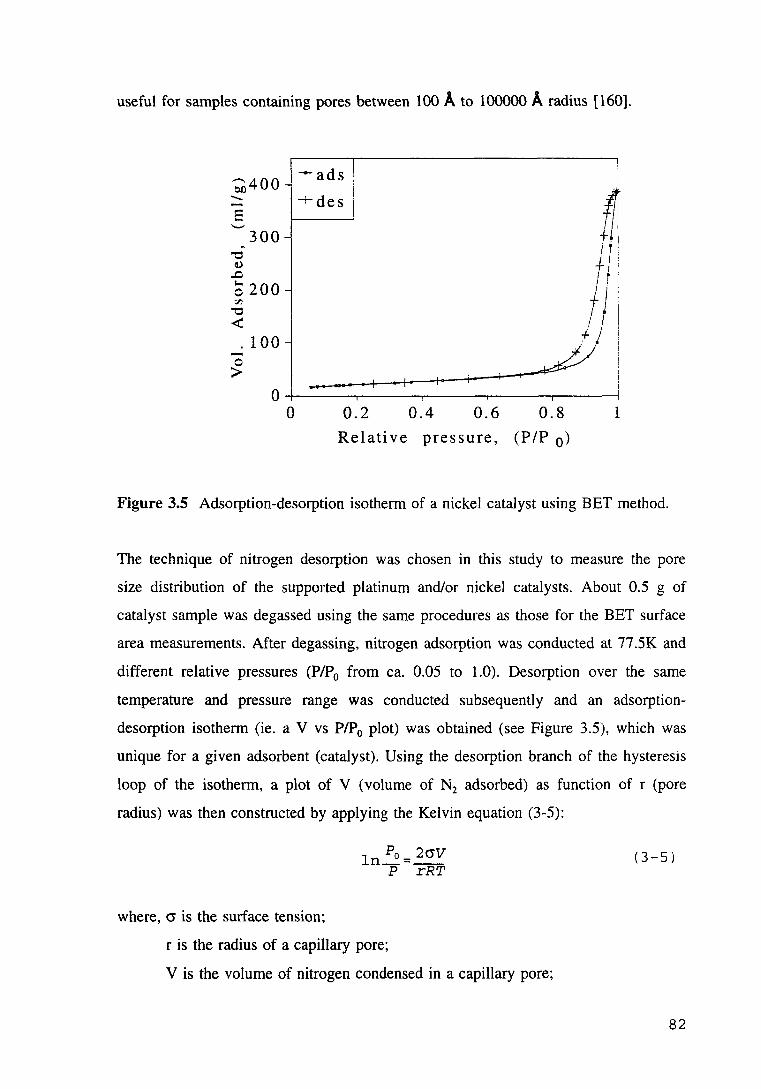
useful for samples containing pores between 100 A to 100000 A radius [ 160].
~400
E ._
~
"'0 ~
.D
300
0 200 'Jl
"'0 <
. 100 0 >
I
~ tll ' ' I
f! I ~I
\--ads\ I
-+-des j
-··-·--·--·-r!--·~~---+--4---+-~~ I 0~-----r-----.------,------,----~
0 0.2 0.4 0.6 0.8 1
Relative pressure, (P/P o)
Figure 3.5 Adsorption-desorption isotherm of a nickel catalyst using BET method.
The technique of nitrogen desorption was chosen in this study to measure the pore
size distribution of the supported platinum and/or nickel catalysts. About 0.5 g of
catalyst sample was degassed using the same procedures as those for the BET surface
area measurements. After degassing, nitrogen adsorption was conducted at 77 .5K and
different relative pressures (P/P0 from ea. 0.05 to 1.0). Desorption over the same
temperature and pressure range was conducted subsequently and an adsorption
desorption isotherm (ie. a V vs P/P0 plot) was obtained (see Figure 3.5), which was
unique for a given adsorbent (catalyst). Using the desorption branch of the hysteresis
loop of the isotherm, a plot of V (volume of N2 adsorbed) as function of r (pore
radius) was then constructed by applying the Kelvin equation (3-5):
where, cr is the surface tension~
ln Pa = 20"V P rRT
r is the radius of a capillary pore;
V is the volume of nitrogen condensed in a capillary pore;
(3-5)
82
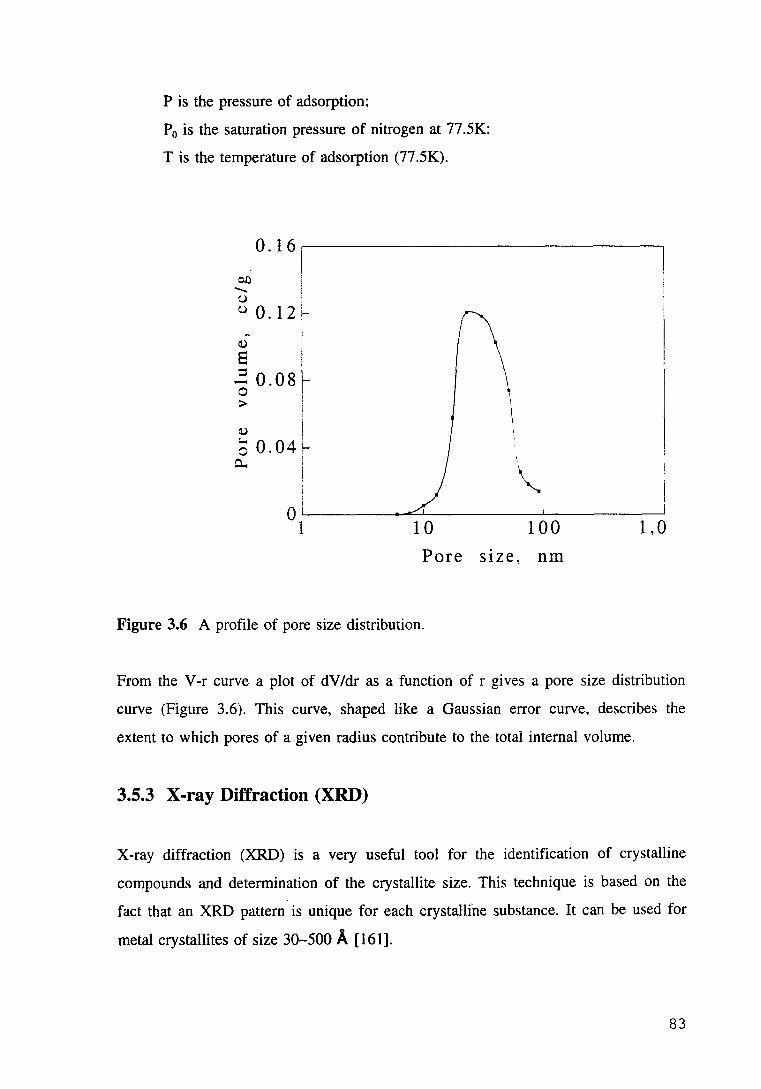
P is the pressure of adsorption;
P0 is the saturation pressure of nitrogen at 77.5K;
T is the temperature of adsorption (77.5K).
0.161 I
0..0 i
~ i u 0.12 ~
I
~ I
8 I :::s ~ 0 0.081 \ , > I
I
~ I \
Cl. I ~ ~ 0.04~ )'
o~i ----------·-~------------~----------~~ 1 10 100 1,0
Pore size, nm
Figure 3.6 A profile of pore size distribution.
From the V-r curve a plot of dV/dr as a function of r gives a pore size distribution
curve (Figure 3.6). This curve, shaped like a Gaussian error curve, describes the
extent to which pores of a given radius contribute to the total internal volume.
3.5.3 X-ray Diffraction (XRD)
X-ray diffraction (XRD) is a very useful tool for the identification of crystalline
compounds and determination of the crystallite size. This technique is based on the
fact that an XRD pattern is unique for each crystallfne substance. It can be used for
metal crystallites of size 30-500 A [161].
83
The relationship between the known wavelength (A.) and the angle of incidence of X
ray radiation fulfils the Bragg equation [ 162]:
nA.=2dsin8
where. n is an integer, n=l, 2, 3 .... ;
A. is the wavelength of incident radiation:
d is the crystal plane distance, or "d spacing";
·and 8 is the angle of incidence.
(3-6)
The determination of "d spacing", together with the relative intensities of the
diffraction lines, constitutes the diffraction pattern of a given crystal.
Assummg the diffraction lines shaped are Gaussian, the line width due to particle
size broadening is given by the following equation:
where. ~ is the true line width at half maximum intensity in degree (28);
~obs is the observed width at half maximum intensity in degree (28);
( 3-7)
~ins is the instrumental line width from the standard crystal, which is obtained
by a calibration procedure using a standard of high quality with a crystallite size
greater than 1000 A.
The mean crystallite size (diameter) can be then calculated using the Scherrer
equation [162]:
k·/.. D=-=-----=
~·cose
where. D is the crystallite size, in A.; A. is the X-ray wavelength, in A.; ~ is the angular width at half maximum intensity, in degree;
8 is the Bragg angle in degree;
K is the Scherrer constant and equals to 51 [163].
( 3-8)
84
In this study, the technique of X-ray diffraction line broadening was used to measure
the metallic nickel and nickel oxide crystallite size in the fresh and used catalysts.
The XRD patterns were determined by a Phillip's X'Pert System with a 3710
controller and 1830 generator using Ni-filtered CuKa (A= 1.542 A.) radiation at 40 kV
and 30 mA. The scanning speed was at 0.04 °(28)/sec from 40 to 100 °(28) for Ni
and from 35 to 80 °(28) for NiO. The catalyst sample was first ground to a size of
smaller than 1 OOJ.lm and reduced by H2• The powder was then pressed into a
cylindrical trough of size 250 mm (diameter) x 1 mm (depth) with a glass slide to
obtain an even, smooth surface of the sample for the measurement of XRD.
3.5.4 Temperature Programmed Reduction (TPR)
The technique of temperature programmed reduction (TPR) is one of the most useful
tools for the measurement of bulk chemical properties of catalysts [ 164]. This
technique gives much information. such as the quantity of the reductant required and
the temperature range of reduction as well as the information about species formed
during the treatment of the catalyst.
The TPR techniques were employed to determine the reduction temperature range of
all the catalysts used in this study. The measurements were conducted using a Du
Pont 2100 Thermal Gravimetric Analyser (TGA).
About 40-60 mg of catalyst were loaded in a stainless steel pan hung on the end of
a microbalance in the thermo-cell. Oxygen-free nitrogen was introduced into the
thermo-cell. The cell temperature was programmed from 298K to 373K at 20 K/min.
After one hour at 373K, a flow of hydrogen (ea. 30 mllmin) instead of nitrogen was
admitted into the cell. The temperature of the cell was then increased from 373K to
1023K at 10 K/min. The weight change of the catalyst was recorded by the
microbalance and the relative amount of hydrogen required for the reduction as
function of the temperature was measured using an on-line computer.
85
3.5.5 Thermogravimetric Analysis (TGA)
Thermogravimetric Analysis (TGA) is usually used to monitor high temperature solid
state reactions [164]. This technique is based on the measurement of weight changes
of a material as a function of temperature or, isothermally, as a function of time.
In the present study, the TGA technique was employed to measure carbon deposited
on used nickel based catalysts. A Du Pont 2100 Thermogravimetric Analyser was
used and the experimental procedures were the same as those used for measurements
of TPR except that air instead of hydrogen was admitted to the cell. The loss of
weight resulting from oxidation of deposited carbon was recorded as a function of
temperature or of time.
86
Chapter 4 Oxidation of Methane, Ethane and
Propane
4.1 Introduction
As mentioned in chapter 1, the steam reforming process is highly endothermic· and
requires high energy (external) expenditure. However, the feedstocks for this process
(e.g. natural gas) are usually inexpensive. This has led to the concept that hydrogen
generation from light hydrocarbons could be carried out in an autothermic system, in
which heat and steam needed in the steam reforming process are generated by
complete or partial combustion of the fuel. Studies with methanol in such systems
indicated that oxidation of methanol over a Pt/y-Alz03 was initiated at temperatures
as low as 273K and that the production of hydrogen from methanol could be
achieved by partial and complete combustion of the fuel, followed by steam
reforming of the residual alcohol [10].
The autothermal production of hydrogen from light hydrocarbons requires more
extreme conditions. Steam reforming of methane does not become significant until
about 700-SOOK, temperatures which requires the combustion of more fuel. Methane
oxidation does not become significant until about 550-700K, and it is necessary to
heat the system to this temperature to induce oxidation. This may be done electrically
or by combustion of a more active fuel such as methanol or hydrogen at the
beginning of the operation.
Detailed information that describes the light hydrocarbon oxidation process is
unknown. Attempts have been made to study the oxidation process parametrically
and to answer the following questions:
a) How does the composition of a feedstock influence the oxidation of light
hydrocarbon?
87
b) What is the difference between platinum and nickel based catalysts when
employed to promote the oxidation of light hydrocarbons?
c) What are the kinetic characteristics of the catalytic oxidation of individual
hydrocarbons?
4.2 Experimental
All experiments to test the catalytic oxidations of methane, ethane and propane were
carried out using a tubular fixed bed reactor (see section 3.3.1.1). A Pt0/0-Al20 3 (ea.
0.2 wt% of Pt) was prepared in the laboratory using the method described in 3.2.2.1.
A low temperature steam reforming catalyst (RKNR) was supplied by Haldor Tops0e
NS in Denmark. Both catalysts were used to measure the initiation temperatures of
light hydrocarbon oxidation and to study the kinetics of oxidation.
The loading and pretreatment of catalysts has been described m section 3.3.1.1
(Figure 3.2a) and 3.2.4 respectively.
4.2.1 Blank Test
Blank runs were performed with the reactor charged with a-Al20 3 (diluent used in
the normal runs) under the same conditions as those employed in the kinetic studies
of the oxidation of methane, ethane and propane. The results showed that, under the
conditions used, the preheater and the reactor wall as well as the a-Al20 3 exhibited
no detectable activity for the reactions.
4.2.2 Measurement of the Initiation Temperatures
The initiation, or "light off", temperatures are the temperatures required for
significant oxidation (ie. 10% conversion) of a fuel. The initiation temperatures for
oxidation of methane, ethane and propane over Pt/o-Al20 3 and/or Ni/Mg0-Al20 3
88
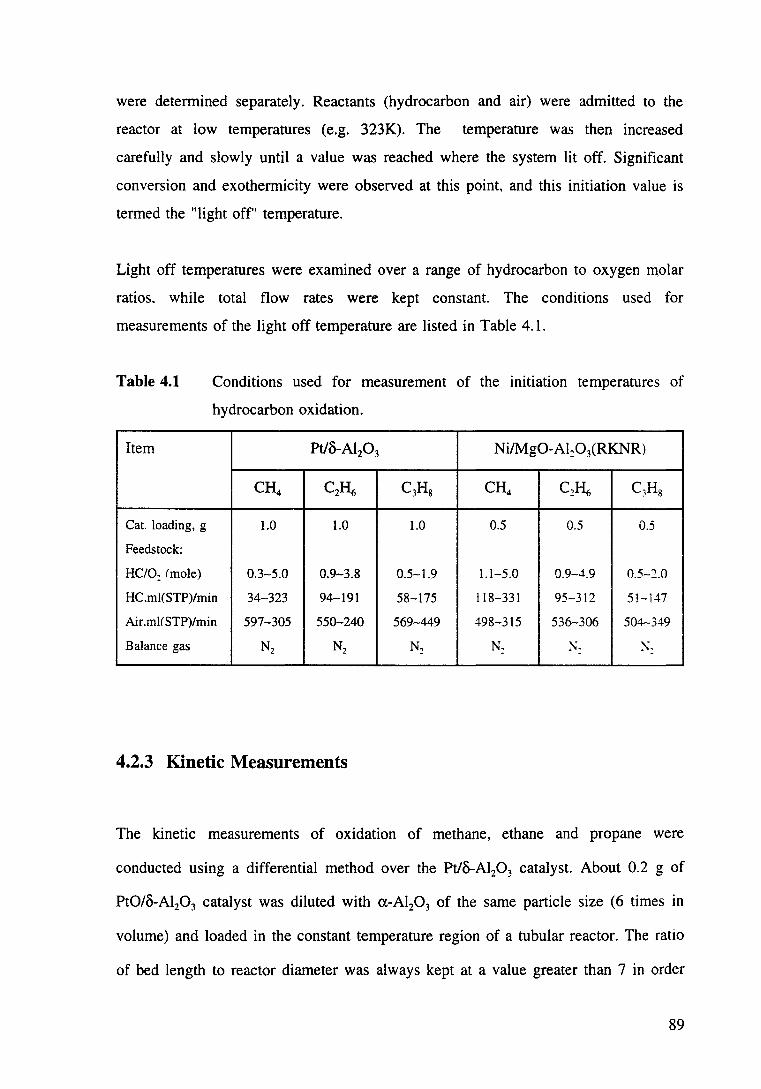
were determined separately. Reactants (hydrocarbon and air) were admitted to the
reactor at low temperatures (e.g. 323K). The temperature was then increased
carefully and slowly until a value was reached where the system lit off. Significant
conversion and exothermicity were observed at this point, and this initiation value is
termed the "light off" temperature.
Light off temperatures were examined over a range of hydrocarbon to oxygen molar
ratios. while total flow rates were kept constant. The conditions used for
measurements of the light off temperature are listed in Table 4.1.
Table 4.1 Conditions used for measurement of the initiation temperatures of
hydrocarbon oxidation.
Item Pt/o-Al20 3 Ni/MgO-Al:OlRKNR)
CH4 CzH6 C3Hs CH4 CzH6 C3Hs
Cat. loading, g 1.0 1.0 1.0 0.5 0.5 0.5
Feedstock:
HC/0: (mole) 0.3-5.0 0.9-3.8 0.5-1.9 1.1-5.0 0.9-~.9 0.5-2.0
HC.ml(STP)/min 34-323 94-191 58-175 118-331 95-312 51-147
Air.mHSTP)/min 597-305 550-240 569-449 498-315 536-306 504-349
Balance gas N2 N2 N2 N. ~- :-.;.
4.2.3 Kinetic Measurements
The kinetic measurements of oxidation of methane, ethane and propane were
conducted using a differential method over the Pt/o-Al20 3 catalyst. About 0.2 g of
Pt0/o-Al20 3 catalyst was diluted with a.-Al20 3 of the same particle size (6 times in
volume) and loaded in the constant temperature region of a tubular reactor. The ratio
of bed length to reactor diameter was always kept at a value greater than 7 in order
89
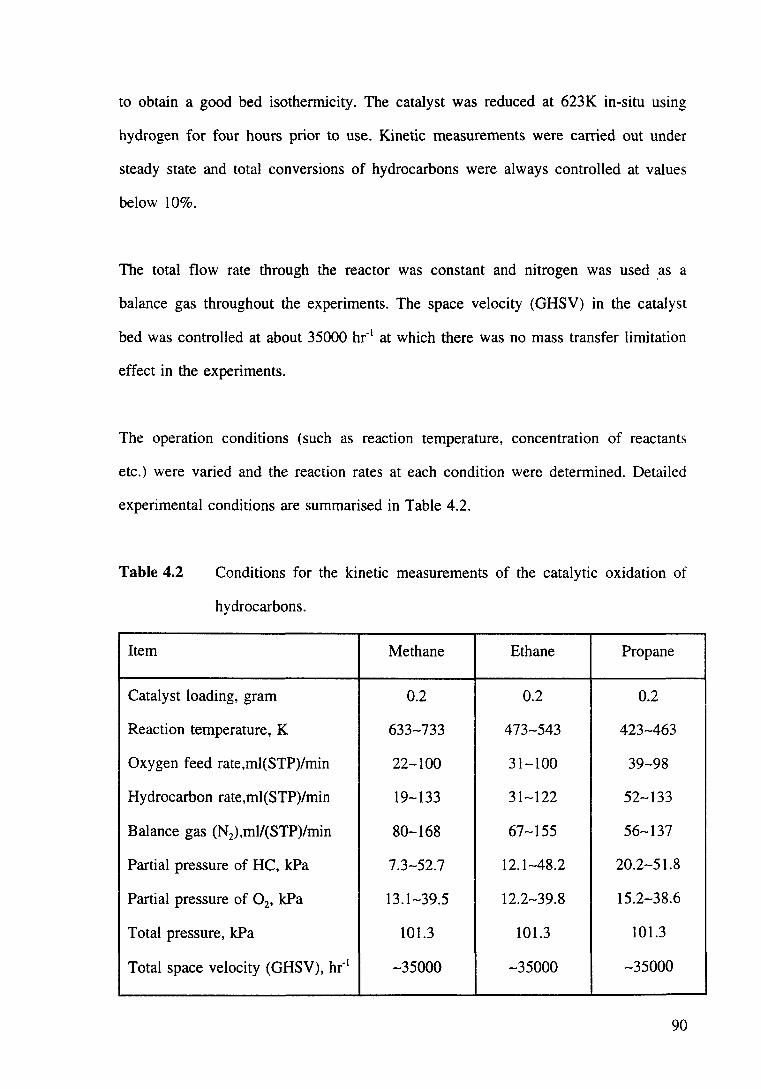
to obtain a good bed isothermicity. The catalyst was reduced at 623K in-situ using
hydrogen for four hours prior to use. Kinetic measurements were carried out under
steady state and total conversions of hydrocarbons were always controlled at values
below 10%.
The total flow rate through the reactor was constant and nitrogen was used as a
balance gas throughout the experiments. The space velocity (GHSV) in the catalyst
bed was controlled at about 35000 hr- 1 at which there was no mass transfer limitation
effect in the experiments.
The operation conditions (such as reaction temperature, concentration of reactants
etc.) were varied and the reaction rates at each condition were determined. Detailed
experimental conditions are summarised in Table 4.2.
Table 4.2 Conditions for the kinetic measurements of the catalytic oxidation of
hydrocarbons.
Item Methane Ethane Propane
Catalyst loading, gram 0.2 0.2 0.2
Reaction temperature, K 633-733 473-543 423-463
Oxygen feed rate,ml(STP)/min 22-100 31-100 39-98
Hydrocarbon rate,ml(STP)/min 19-133 31-122 52-133
Balance gas (N2),ml/(STP)/min 80-168 67-155 56-137
Partial pressure of HC, kPa 7.3-52.7 12.1-48.2 20.2-51.8
Partial pressure of 0 2, kPa 13.1-39.5 12.2-39.8 15.2-38.6
Total pressure, kPa 101.3 101.3 101.3
Total space velocity (GHSV), hr"1 -35000 -35000 -35000
90
4.3 Results and Discussions
4.3.1 Oxidation of Methane, Ethane and Propane over Pt/8-Al20 3
Since one of the objectives of the oxidation experiments was to observe the light off
temperatures, the oxidation of methane, ethane and propane over Pt/8-Al20 3 catalyst
has been carried out individually. The effect of hydrocarbon to oxygen ratios on the
initiation of the reactions was also investigated.
4.3.1.1 Comparison of "Light Off'' Temperatures of Oxidation of Individual
Hydrocarbons
The "light off" temperatures for the oxidation of methane, ethane and propane were
examined at the same hydrocarbon to oxygen ratio (ea. 0.9) and the results are
presented in Figure 4.1
It was observed, from the experiments, that the oxidation of hydrocarbons, at low
temperatures, was slow. However, when the reaction temperature reached the "light
off' point, the oxidation reaction proceeded rapidly and the temperature of catalyst
bed rose rapidly until either oxygen or hydrocarbon in the feedstock was completely
consumed.
91
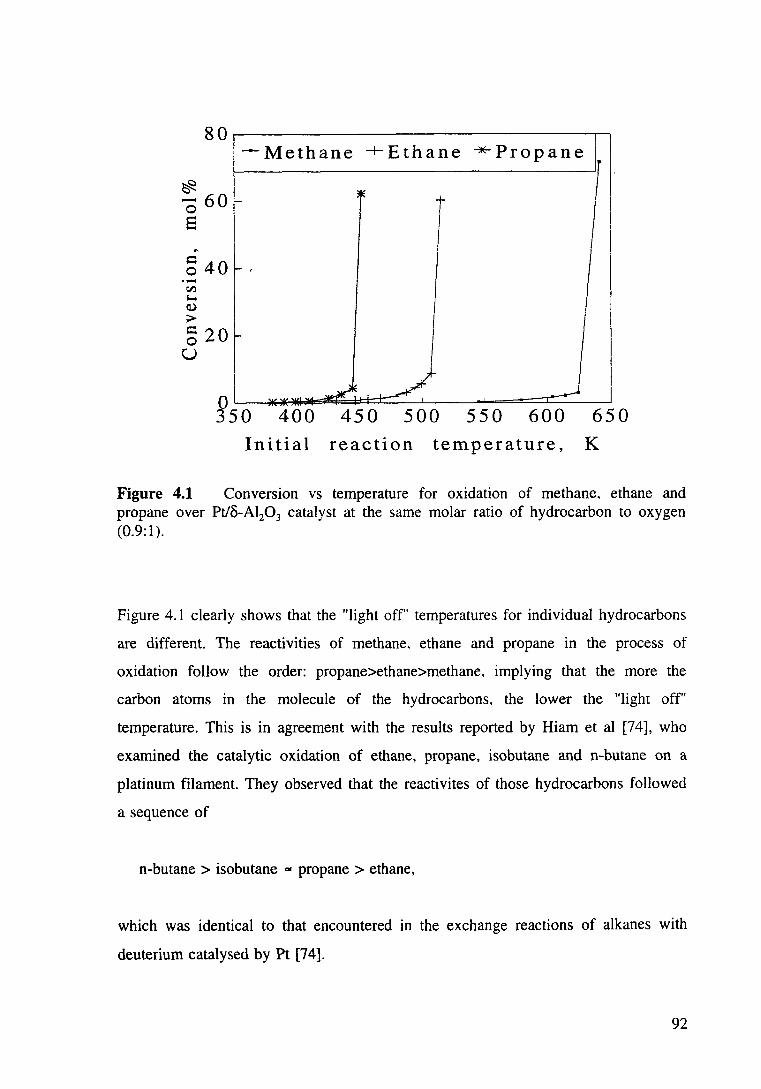
80 ~-Methane +Ethane "*Propane 1
I ~ -60 t
I I 0
I 8 I
~
I ~ 40 I ·-Cl)
"'"' 0
I > ~ 20 u
R5o 400 450 500 550 600 650 Initial reaction temperature, K
Figure 4.1 Conversion vs temperature for oxidation of methane. ethane and propane over Pt/8-Al20 3 catalyst at the same molar ratio of hydrocarbon to oxygen (0.9:1).
Figure 4.1 clearly shows that the "light off' temperatures for individual hydrocarbons
are different. The reactivities of methane. ethane and propane in the process of
oxidation follow the order: propane>ethane>methane. implying that the more the
carbon atoms in the molecule of the hydrocarbons. the lower the "light off"
temperature. This is in agreement with the results reported by Hiam et al [74], who
examined the catalytic oxidation of ethane, propane, isobutane and n-butane on a
platinum filament. They observed that the reactivites of those hydrocarbons followed
a sequence of
n-butane > isobutane ... propane > ethane,
which was identical to that encountered in the exchange reactions of alkanes with
deuterium catalysed by Pt [74].
92
As a result, the "light off' temperatures highly depend on the reactivities of
hydrocarbons. The higher the reactivities; the lower the "light off" temperatures.
Methane is the least reactive hydrocarbon, lighting off at ea. 630K, while the more
reactive ethane and propane only require temperatures of ea. 500K and 450K
respectively to be significantly oxidised at the given HC/02 ratios.
It should be noted· that the comparison of hydrocarbon reactivities is based on
saturated hydrocarbons (paraffins). If considering unsaturated hydrocarbons (ie.
olefins), the results may be totally different. For example, Moro-oka et al [64]
examined the oxidation of iso-butane, acetylene, and propane over various oxides and
found the reactivity sequence to be:
with most catalysts.
4.3.1.2 Effect of Hydrocarbon to Oxygen Ratios on the "Light Off"
Temperatures
In order to understand the relationship between the light off temperatures and the
compositions , a series of experiments were conducted with different HC/02 ratios.
Ratios were varied up to 5, 4, and 2 for methane, ethane and propane respectively.
Figures 4.2-4.4 show the dependence of conversion of methane, ethane and propane
on the initial reaction temperature as well as on the hydrocarbon to oxygen ratios
over a Pt/o-Al20 3 catalyst. As seen, the "light off" temperatures vary with the
hydrocarbon to oxygen ratios. As the ratios increase, the light off temperatures
decrease.
This observation can be explained by the fact that the oxidation of these
hydrocarbons (before lighting oft) is kinetically limited. This will be further
93
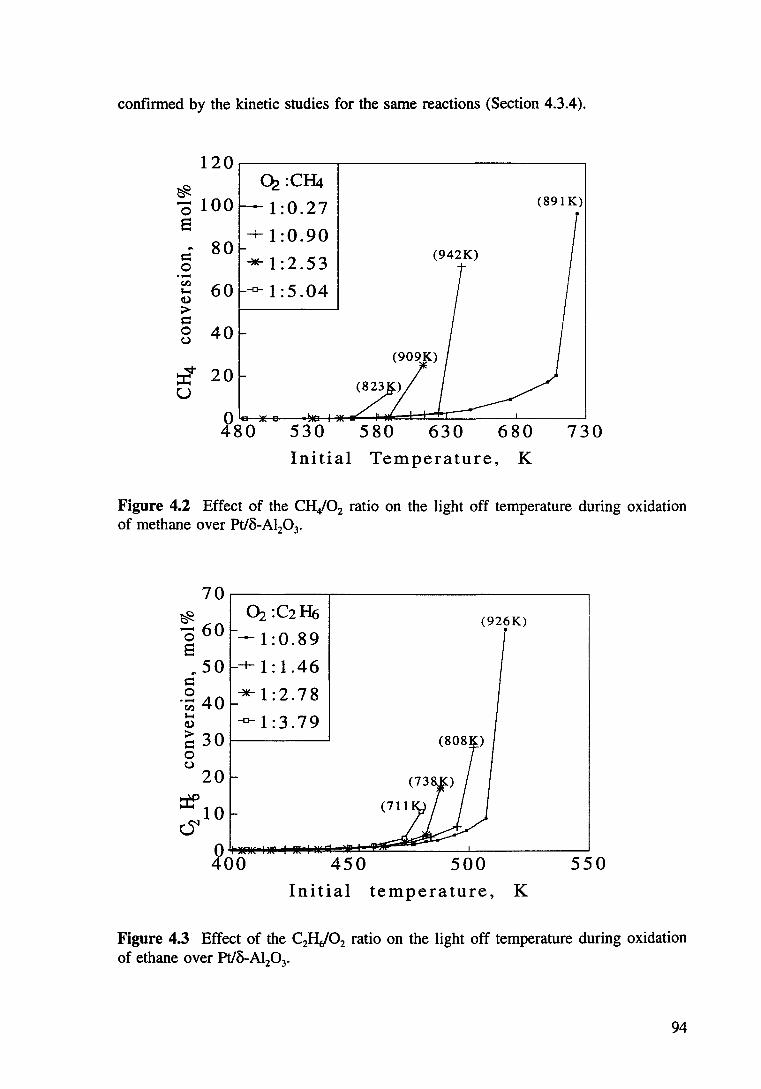
confirmed by the kinetic studies for the same reactions (Section 4.3.4).
120
~ ~:CI-4
- 100 1:0.27 (891 K) 0 e -+-1:0.90 ~ 80 (942K) c:
0 ·-C'-1 60 '""' (I)
> c: 0 40 u
~ 20 u
28o 530 580 630 680 730 Initial Temperature, K
Figure 4.2 Effect of the CH/02 ratio on the light off temperature during oxidation of methane over Pt/B-Al20 3•
70
~ 60 0 e ~50
c: 0
·;; 40 '""' (I)
~ 30 0 u
20
=:tf' 1 0 c.S
0z :C2H6 (926K)
--1:0.89 -+- 1: 1.46
*-1:2.78 -o-1:3.79
2oo 450 500 Initial temperature, K
550
Figure 4.3 Effect of the C2HJ02 ratio on the light off temperature during oxidation of ethane over Pt/&-Al20 3•
94
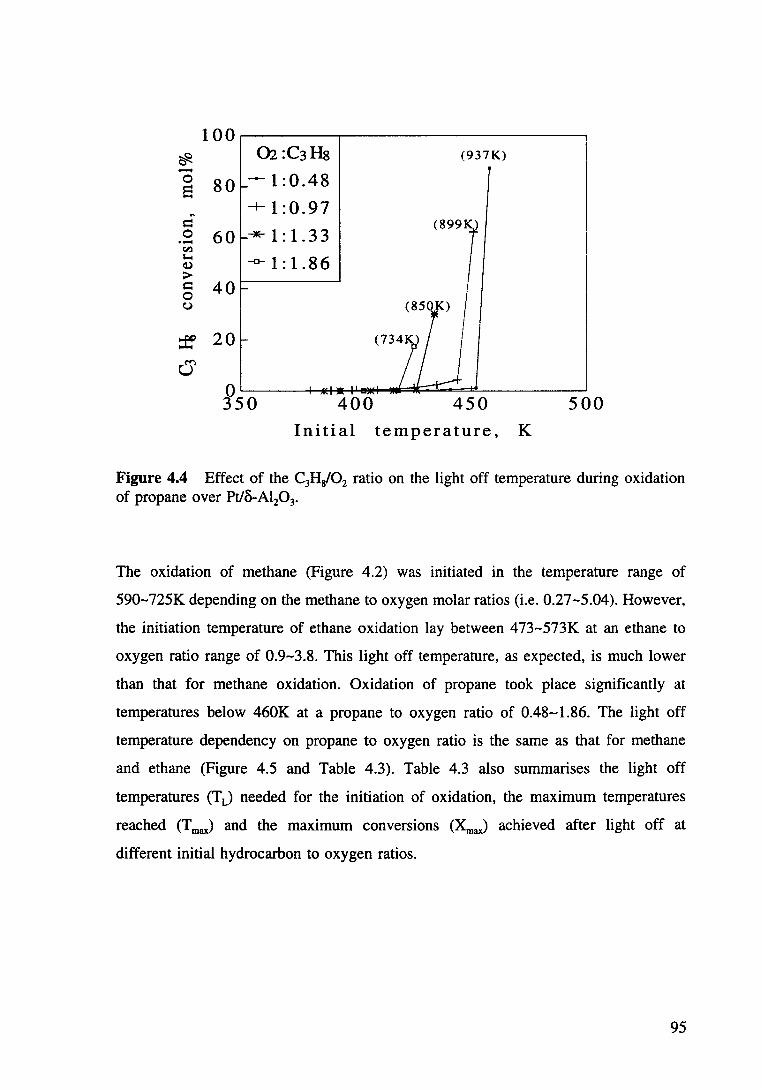
100 ~ 02:C3Hs (937K) -0 80 I --I :0.48 s
~ + 1:0.97
s::: (8991 0 60 ""*"1:1.33 ·-1:1) ..... -o-}:1.86 G)
> s::: 40
I 0 c:.>
~ 20
a ~50 400 450 500
Initial temperature, K
Figure 4.4 Effect of the C3Hgl02 ratio on the light off temperature during oxidation of propane over Pt/8-Al20 3•
The oxidation of methane (Figure 4.2) was initiated in the temperature range of
590-725K depending on the methane to oxygen molar ratios (i.e. 0.27-5.04). However,
the initiation temperature of ethane oxidation lay between 473-573K at an ethane to
oxygen ratio range of 0.9-3.8. This light off temperature, as expected, is much lower
than that for methane oxidation. Oxidation of propane took place significantly at
temperatures below 460K at a propane to oxygen ratio of 0.48-1.86. The light off
temperature dependency on propane to oxygen ratio is the same as that for methane
and ethane (Figure 4.5 and Table 4.3). Table 4.3 also summarises the light off
temperatures (T L) needed for the initiation of oxidation, the maximum temperatures
reached (T max) and the maximum conversions (~ax) achieved after light off at
different initial hydrocarbon to oxygen ratios.
95
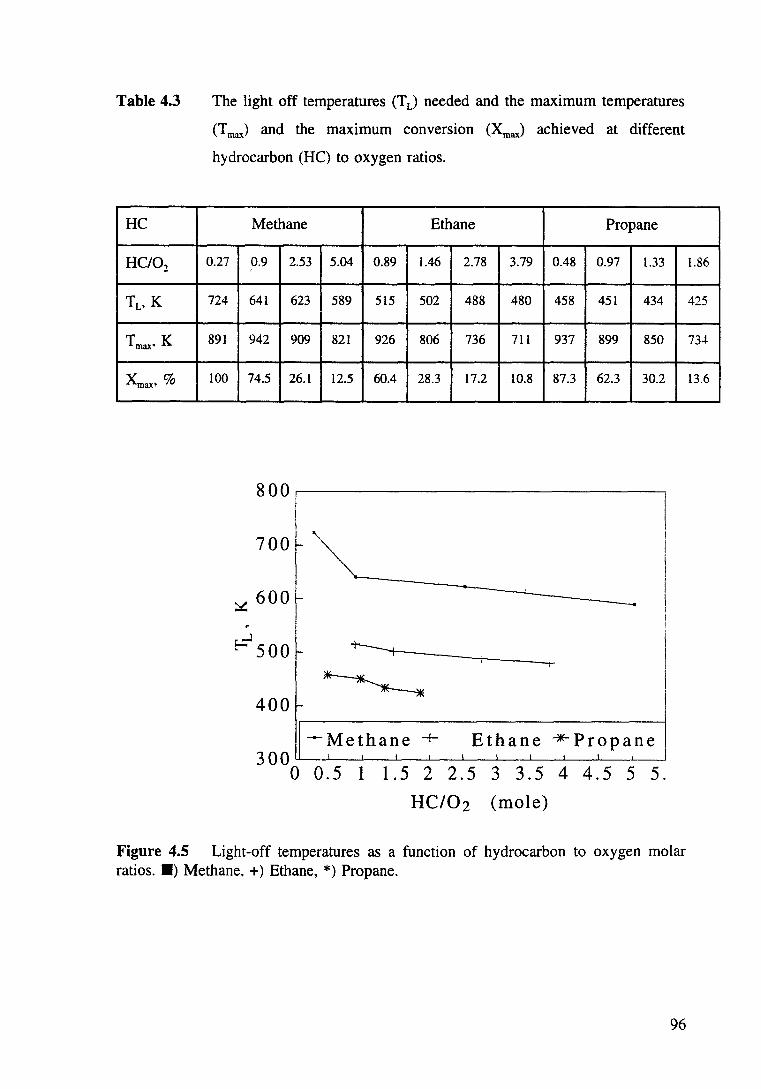
Table 4.3
HC
HC/02
TL, K
Tmax• K
Xma~•%
The light off temperatures (T L) needed and the maximum temperatures
(T ma.•) and the maximum conversion (Xmax) achieved at different
hydrocarbon (HC) to oxygen ratios.
0.27
724
891
100
Methane Ethane Propane
0.9 2.53 5.04 0.89 1.46 2.78 3.79 0.48 0.97 1.33
641 623 589 515 502 488 480 458 451 434
942 909 821 926 806 736 711 937 899 850
74.5 26.1 12.5 60.4 28.3 17.2 10.8 87.3 62.3 30.2
800~----------------------------~
I 700
1
~ 600
...J ~ 500
400
+---.,.,_ __ -+-_----!+
~
--Methane + Ethane *Propane 300~~~--~~~--~~--~~~~
0 0.5 1 1.5 2 2.5 3 3.5 4 4.5 5 5.
HC/02 (mole)
Figure 4.5 Light-off temperatures as a function of hydrocarbon to oxygen molar ratios. •) Methane, +) Ethane, *) Propane.
96
1.86
425
73-1.
13.6
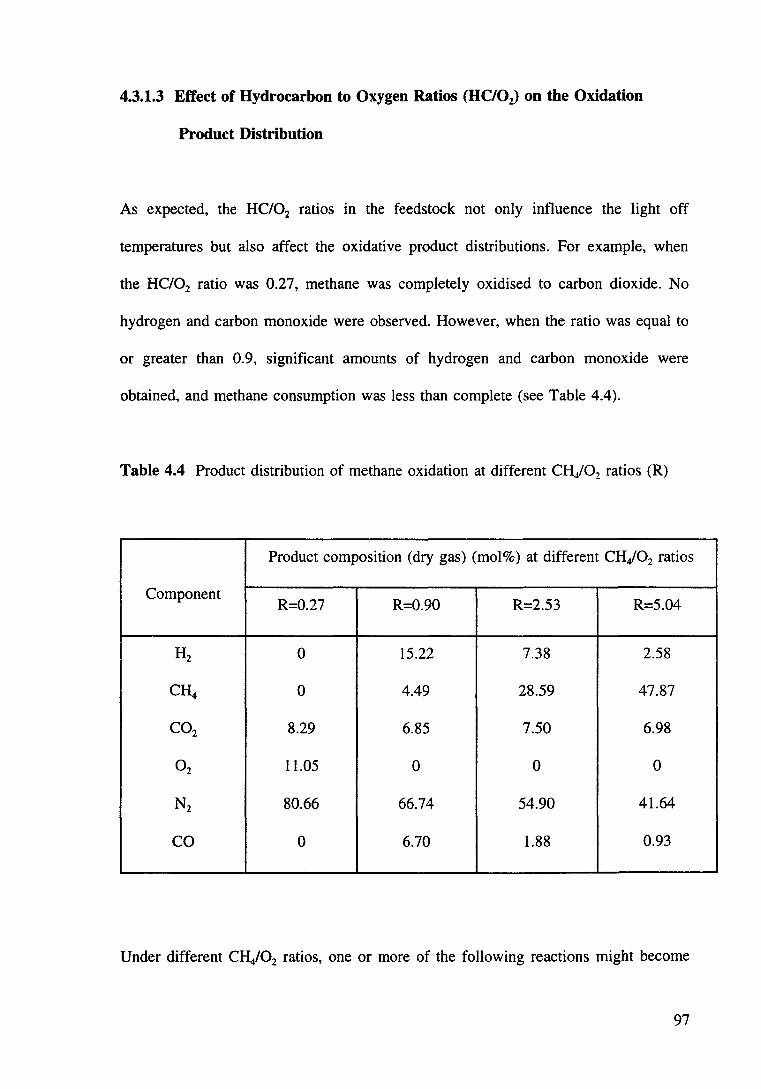
4.3.1.3 Effect of Hydrocarbon to Oxygen Ratios (HC/01) on the Oxidation
Product Distribution
As expected, the HC/02 ratios in the feedstock not only influence the light off
temperatures but also affect the oxidative product distributions. For example, when
the HC/02 ratio was 0.27, methane was completely oxidised to carbon dioxide. No
hydrogen and carbon monoxide were observed. However, when the ratio was equal to
or greater than 0.9, significant amounts of hydrogen and carbon monoxide were
obtained, and methane consumption was less than complete (see Table 4.4).
Table 4.4 Product distribution of methane oxidation at different CH./02 ratios (R)
Product composition (dry gas) (mol%) at different CH/02 ratios
Component R=0.27 R=0.90 R=2.53 R=5.04
Hz 0 15.22 7.38 2.58
CH4 0 4.49 28.59 47.87
C02 8.29 6.85 7.50 6.98
02 11.05 0 0 0
Nz 80.66 66.74 54.90 41.64
CO 0 6.70 1.88 0.93
Under different CH/02 ratios, one or more of the following reactions might become
97
dominant: total oxidation (2.6), partial oxidation (2.5), the water-gas shift reaction
(2.8) or steam reforming (2.15)
CH4 + 202 ,... C02 + 2H10
CH4 + 11202 ,... CO + 2H:
CO + H20 ,... C02 + H::
CH4 + H20 ,... CO + 3H2
(2.6)
(2.5)
(2.8)
(2.15)
As observed, once initiated, the strong exothermic oxidation reactions (mainly
reaction 2.6) take place rapidly and generate a huge amount of heat. As a result, the
catalyst bed was heated to a maximum temperature (Tmax) very rapidly, at which the
system stabilises. Product gases were usually analysed and the maximum conversion
(XmaJ was measured at this status. Table 4.3 shows some results from typical runs.
The values of Tmax and Xmax depend on the concentration of oxygen in the
feedstock when hydrocarbon is in excess. Increase in oxygen concentration (or
decrease in hydrocarbon to oxygen ratios) increases both Tmax and Xmax. This is
not surprising because, in this case, I 00% of the oxygen in the feedstock Is
consumed in the process. The more the oxygen supplied, the higher is the
temperature and conversion. However, excess amounts of oxygen did not favour heat
generation, since the extra amounts of oxygen and nitrogen in air can remove the
heat generated. For example. in the case of methane oxidation, the maximum
temperature obtained for a methane to oxygen ratio equal to 0.27 is lower than that
for cases when CHi02 ratios larger than 0.27 but lower than 5.04.
Obviously, it is not satisfactory only to compare the bed temperature. For instance, in
the case of ratio 0.90, the bed temperature was 942K, compared with 821K for a
ratio of 5.04. However, the methane consumption was ea. 75% for the lower ratio,
compared to only 12.5% for the higher ratio. The optimum HC/02 ratio not only
determines the maximum bed temperature but also governs the product distribution.
The analyses of the products produced from oxidations of methane, ethane and
98
propane showed that the main products were carbon dioxide. carbon monoxide. water
and hydrogen. A trace amount of methane was observed during ethane oxidation and
small amounts of ethane, ethylene and methane were also found in the product gases
of propane oxidation over Pt/o-Al20 3 catalysts.
The Pt/o-Al20 3 catalyst was found to be very active and stable for the oxidation of
C,-C3 hydrocarbons: Once reduced, the catalyst was used in many runs without any
re treatments.
4.3.2 Oxidation of Methane, Ethane and Propane over Nickel Based
Catalysts
As described above, there has been no doubt that the heat and the steam required by
the steam reforming process can be generated by oxidising hydrocarbons fed over
platinum based catalysts, while nickel based catalysts have been long known to be
very active for the steam reforming of light hydrocarbons [8]. However, platinum
based catalysts have been also used for steam reforming [8] and nickel based
catalysts have been reported for use in hydrocarbon oxidation [41.42]
In the autothermic hydrogen production system proposed in this study. both oxidation
and steam reforming of hydrocarbons are involved. Contributions of each catalyst to
both reactions have to be quantified.
There are two reasons to study the oxidation reactions of hydrocarbons over nickel
based catalysts:
i) Some residual oxygen from the heat generation (oxidation) section may be present
in the feed to the steam reforming section where a nickel based catalyst is used (in a
two bed configuration). Oxidation reaction may take place in this bed since nickel
catalysts have been known to promote the oxidation of hydrocarbons [42].
ii) It is possible that nickel based catalysts can be used for both oxidation and steam
99
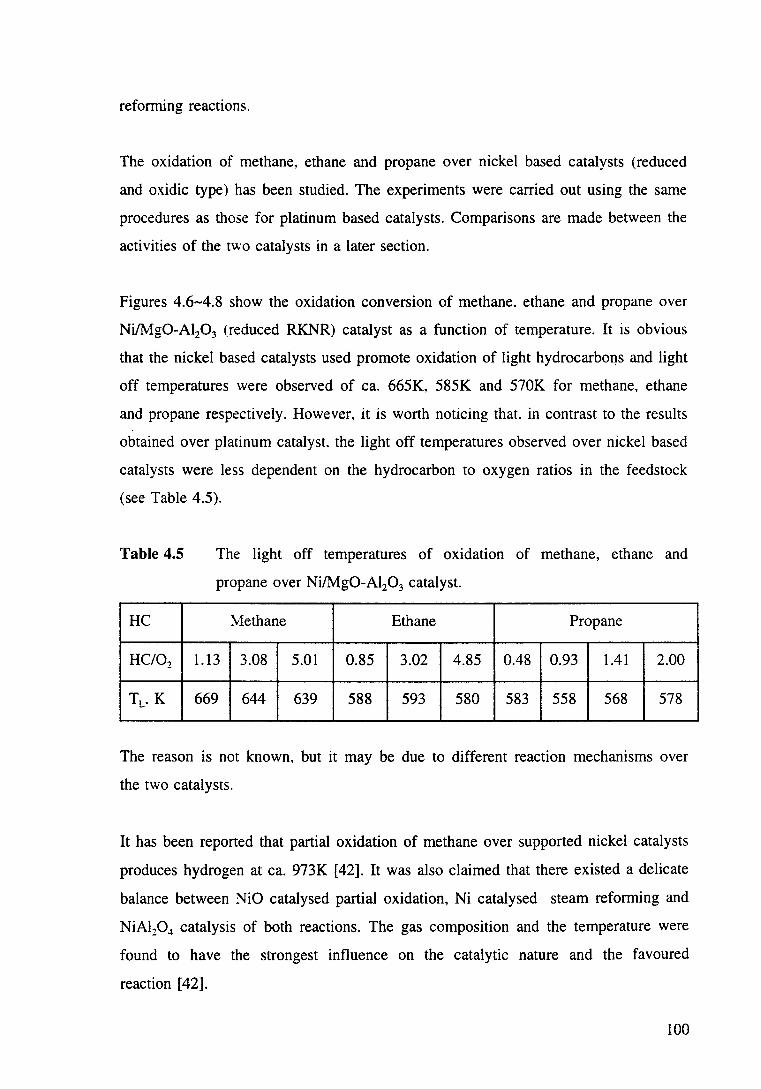
reforming reactions.
The oxidation of methane, ethane and propane over nickel based catalysts (reduced
and oxidic type) has been studied. The experiments were carried out using the same
procedures as those for platinum based catalysts. Comparisons are made between the
activities of the two catalysts in a later section.
Figures 4.6-4.8 show the oxidation conversion of methane. ethane and propane over
Ni/Mg0-Al20 3 (reduced RKNR) catalyst as a function of temperature. It is obvious
that the nickel based catalysts used promote oxidation of light hydrocarbons and light
off temperatures were observed of ea. 665K, 585K and 570K for methane, ethane
and propane respectively. However, it is worth noticing that. in contrast to the results
obtained over platinum catalyst. the light off temperatures observed over nickel based
catalysts were less dependent on the hydrocarbon to oxygen ratios in the feedstock
(see Table 4.5).
Table 4.5
HC
HC/02
TL. K
The light off temperatures of oxidation of methane, ethane and
propane over Ni/Mg0-Al20 3 catalyst.
~!ethane Ethane Propane
1.13 3.08 5.01 0.85 3.02 4.85 0.48 0.93 1.41 2.00
669 644 639 588 593 580 583 558 568 578
The reason is not known, but it may be due to different reaction mechanisms over
the two catalysts.
It has been reported that partial oxidation of methane over supported nickel catalysts
produces hydrogen at ea. 973K [42]. It was also claimed that there existed a delicate
balance between NiO catalysed partial oxidation, Ni catalysed steam reforming and
NiA120 4 catalysis of both reactions. The gas composition and the temperature were
found to have the strongest influence on the catalytic nature and the favoured
reaction [42].
100
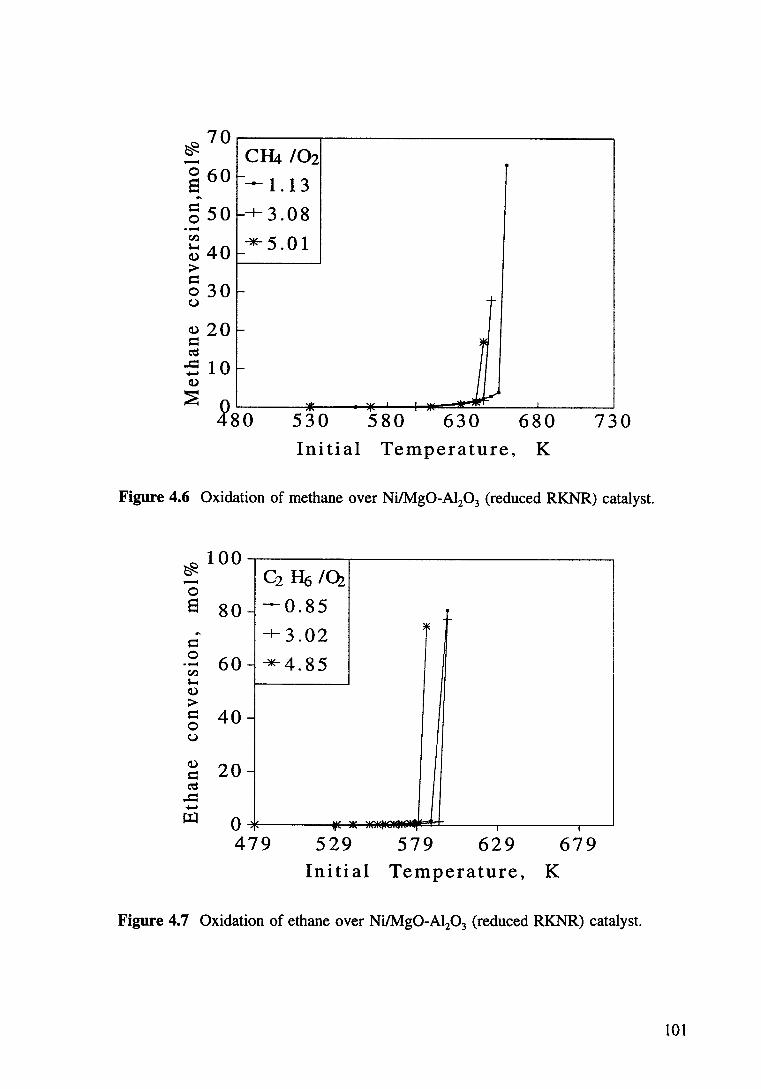
Q 70 ~ -0 60 e
"' g 50 ·-
(1.) 20 s::: ea
-5 10 (1.)
C&I02 --1.13
--t- 3. 08
"*5.01 -
-
-
-
:E 28o ""
530
+-
I ~ b.-'
580 630 680
Initial Temperature, K
730
Figure 4.6 Oxidation of methane over Ni/Mg0-A120 3 (reduced RKNR) catalyst.
Q 100 ~ -0
e 8o "' s:::
.~ 60 t'-l ~ (1.)
> s::: 40 0 u
c2 If() 1~
--0.85
+3.02
- *-4.85
-
-
0 479
0"
529
~
579 629 Initial Temperature, K
i I
679
Figure 4.7 Oxidation of ethane over Ni/Mg0-Al20 3 (reduced RKNR) catalyst.
101
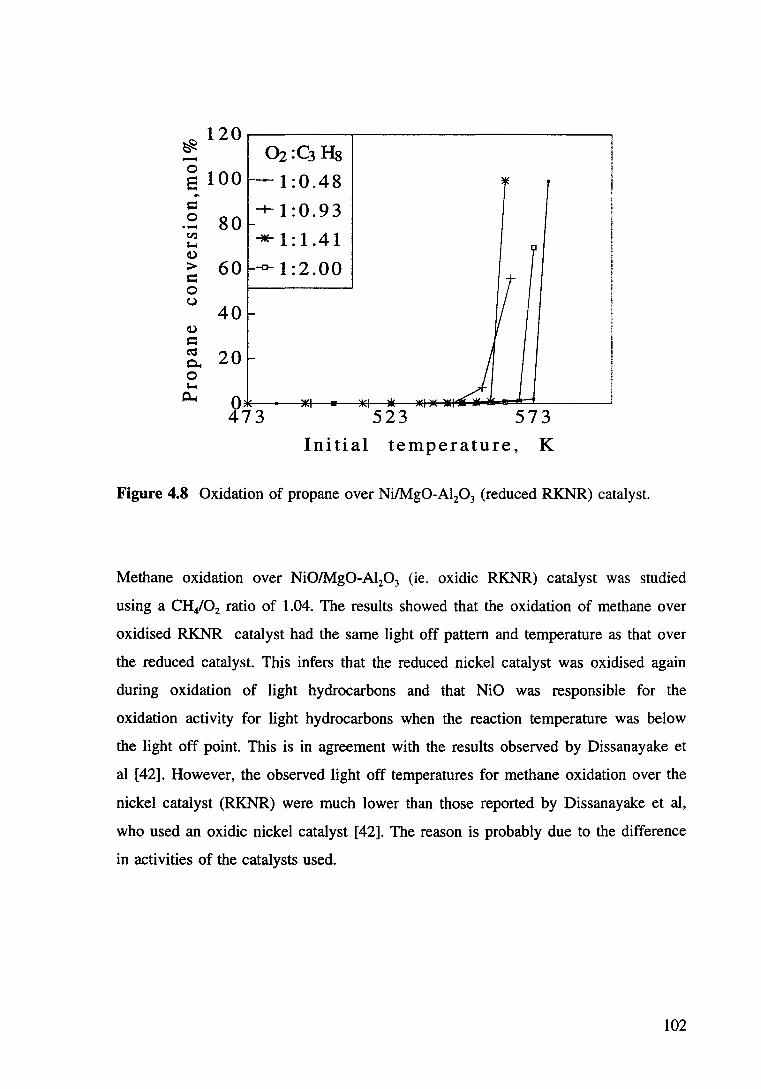
120 ~ -8 100 .. = 0 ·- 80
60
40
20
0z :C3 Hs ,___ 1:0.48 lE ' -t-1:0.93 I
f-
""*""1:1.41 'i'
... -o- 1:2.00
If I
I I -
I -j
"-'I VI J ~·
523 573
Initial temperature, K
Figure 4.8 Oxidation of propane over Ni/Mg0-Al20 3 (reduced RKNR) catalyst.
Methane oxidation over Ni0/Mg0-Al20 3 (ie. oxidic RKNR) catalyst was studied
using a CH/02 ratio of 1.04. The results showed that the oxidation of methane over
oxidised RKNR catalyst had the same light off pattern and temperature as that over
the reduced catalyst. This infers that the reduced nickel catalyst was oxidised again
during oxidation of light hydrocarbons and that NiO was responsible for the
oxidation activity for light hydrocarbons when the reaction temperature was below
the light off point. This is in agreement with the results observed by Dissanayake et
al [42]. However, the observed light off temperatures for methane oxidation over the
nickel catalyst (RKNR) were much lower than those reported by Dissanayake et al,
who used an oxidic nickel catalyst [42]. The reason is probably due to the difference
in activities of the catalysts used.
102
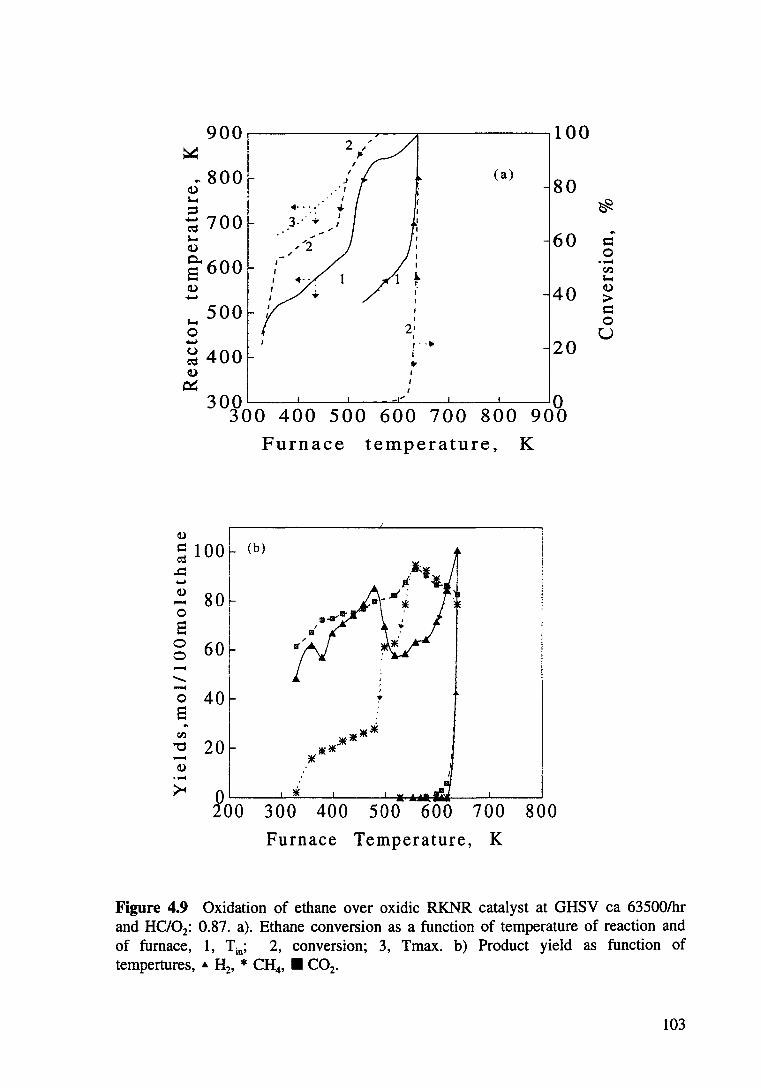
900 ~
.. 800 Q) ~
::s ~ 700 ~ ~
Q) / ,"2
Q..600 s •·· 1 Q) ... ..... I
500 I I
~
0 ..... ~ 400 Q)
~
30~00 400 500 Furnace
~
~ 100~ (b)
~ sol s I 0 60 0 ---0 40 8 tl.l
"'0 20 -~ ..... ~
~00 300 400
(a)
I
2' I
r. ·• i .. I I
I
600 700 800 temperature,
500 600 700 Furnace Temperature, K
100
80 ~
.. 60 c
0 • .-4
Cl)
~
40 Q)
> c 0 u
20
90~ K
800
Figure 4.9 Oxidation of ethane over oxidic RKNR catalyst at GHSV ea 63500/hr and HC/02: 0.87. a). Ethane conversion as a function of temperature of reaction and of furnace, 1, Tin; 2, conversion; 3, Tmax. b) Product yield as function of tempertures, "' H2, * CH4, • C02•
103
From the experiments, it was also found that, when the oxidation of light
hydrocarbons was significant. a large amount of hydrogen was produced. The
production of hydrogen might result from the steam reforming and/or the partial
oxidation of hydrocarbons. In order to explain this phenomenon and particularly to
understand the reactions occurring after the light off point, further experiments were
conducted using oxidic RKNR catalyst. Reactants (hydrocarbon and air) were
admitted to the reactor at low temperature and the catalyst was slowly heated to the
light off temperature. The temperature of the bed was decreased step by step.
Temperatures in the reactor were monitored and the products at different
temperatures were analysed. Some typical results are presented in Figure 4.9. In these
studies. experiments of ethane oxidation were carried out using 0.5 g of oxidic
RKNR catalyst diluted with 1.5 g of a-Al20 3) at a gas space velocity (GHSV) of ea
63500 hr" 1 and a C2HJ02 ratio of 0.87. Figure 4.9 (a) shows ethane conversion as a
function of reactor inlet/furnace temperatures, while Figure 4.9 (b) depicts the
relatiOnship between the yields of product gases and the reaction temperatures.
It can be seen from Figure 4.9 (a) that ethane oxidation lit off at ea 638K, which is
slightly higher than the values indicated in Figure 4.7. This is not surprising because
the diluent ( a-Al:03) in the catalyst bed absorbed some heat and the light off
temperature of ethane increased. At the light off temperature ( 638K), nearly 100% of
ethane in the feed was converted into methane, carbon monoxide, carbon dioxide and
water (curve 2 in Figure 4.9a), and the temperature of the inlet catalyst bed (Tin,
solid curve 1 in the Figure 4.9a) increased dramatically (from ea 638K to 897K). The
increase of temperature resulted from significant oxidation of ethane.
When the furnace temperature was decreased, the Tin value declined respectively
(curve 1 in Figure 4.9a) but the temperature difference between Tin and the furnace
was maintained until the furnace temperature dropped below 500K. This can be
explained by referring to the conversion curve (2). As seen, after the initiation of the
oxidation reaction, a maximum conversion appeared, corresponding to the maximum
inlet temperature. This was maintained on decreasing temperature until the inlet
temperature declined below 500K. This means that during the period of decreasing
104
heat supply from 638 to 500K, the reaction system produced enough heat to sustain
the process and to maintain a I 00% conversion.
Combining the information given in Figure -1-.9 (b) with that of Figure 4.9 (a) allows
a better understanding of the reaction system under light off condition, and of the
reactions occurring during the light off process. Figure 4.9 (b) shows the yields of
hydrogen and methane as a function of furnace temperature. It can be seen that, at
the light off point, the maximum amount of hydrogen (ea 100 molH/100molC2H6)
was generated mainly by partial oxidation of ethane, because of the suitable feed
(HC/02) ratio (0.87) and the lack of steam formed at this point. However, the
hydrogen produced reacted further with ethane by hydrogenolysis (ie. H2 + C2H6 --?
2CH4) and/or with carbon oxide by methanation (ie. 3H2 + CO --? CH4 + H20 or 4H2
+ C02 --? CH4 + 2H20) to produce more methane. which resulted in the increase of
methane yield and a significant decrease of hydrogen, even though the total
conversion of ethane indicated in Figure 4.9 (a) was maintained at ea. 100% when
the furnace temperature was decreased.
When the temperature was dropped below 500K. the hydrogen yield, after dropping
to a minimum, (ea 58 mol/100molC2H6), rose again significantly to a second peak
value (ea 85 mol/100molC2H6) at 478K, followed by a steady decrease with the
decrease of the furnace temperature. At the same time, the methane yield drastically
declined. This phenomenon may result from the fact that, at the. light off
temperatures, the nickel catalyst might be reduced by the product mixture. Nickel
metal would promote the reaction of steam reforming of ethane due to the production
of steam by oxidation. Therefore, lower amounts of methane were formed. The steam
reforming reaction, which is highly endothermic and produces hydrogen and carbon
dioxide would make the inlet temperature decline continuously.
The above experiments confirmed that, once initiated, the oxidation reactions
proceeded continuously and automatically even without external heating. The
composition of the product obviously depends on the ratios of hydrocarbon to oxygen
in feed.
105
A large pressure drop was observed during the oxidation of propane over reduced
nickel based catalyst when the light-off occurred. The pressure drop built up so
rapidly (in a few minutes) and to such a high value that the reactor was blocked and
the experiment had to be discontinued. However, no pressure drop was observed
over the oxidic type of the same catalyst under similar conditions.
After being flushed with nitrogen and cooled to room temperature. the blocked
reactor was discharged and a dark grey coloured hard cake of high density was found
to have caused the pressure drop. Thermogravimetric analysis (TGA) confirmed that
the cake consisted mainly of carbon, which was formed due to rapid dehydrogenation
(coking) effected by highly active nickel metal [100]. This could be favoured by the
high temperatures produced by the initial oxidation of propane.
The originally particulate nickel catalyst was found to be powdered by the reactions.
The high temperature and steam generated in the reactions could well be responsible
for the structure collapse of the catalyst.
4.3.3 Comparison of Activities of Pt/8-AI20 3 and Ni/Mg0-AI20 3 for
Oxidation of Hydrocarbons
The individual oxidation of methane, ethane and propane over both Pt/B-Al20 3 and
Ni/Mg0-Al20 3 catalysts has been reported in previous sections (4.3.2 and 4.3.3).
Comparisons for the two catalysts are shown in Table 4.6 and Figure 4.1 0. As seen.
the light off temperatures for methane, ethane and propane over nickel based
catalysts are much higher than those over platinum based catalysts. This indicated
that nickel based catalysts are less active and stable than platinum based catalysts for
the oxidation reactions. Carbon formation and powdering were not observed during
the tests using platinum catalysts.
The nickel based catalyst, in contrast, showed lower activity and poor stability for the
oxidation process, and are not suitable for use in oxidation to generate heat and
steam in the authothermic steam reforming process.
106
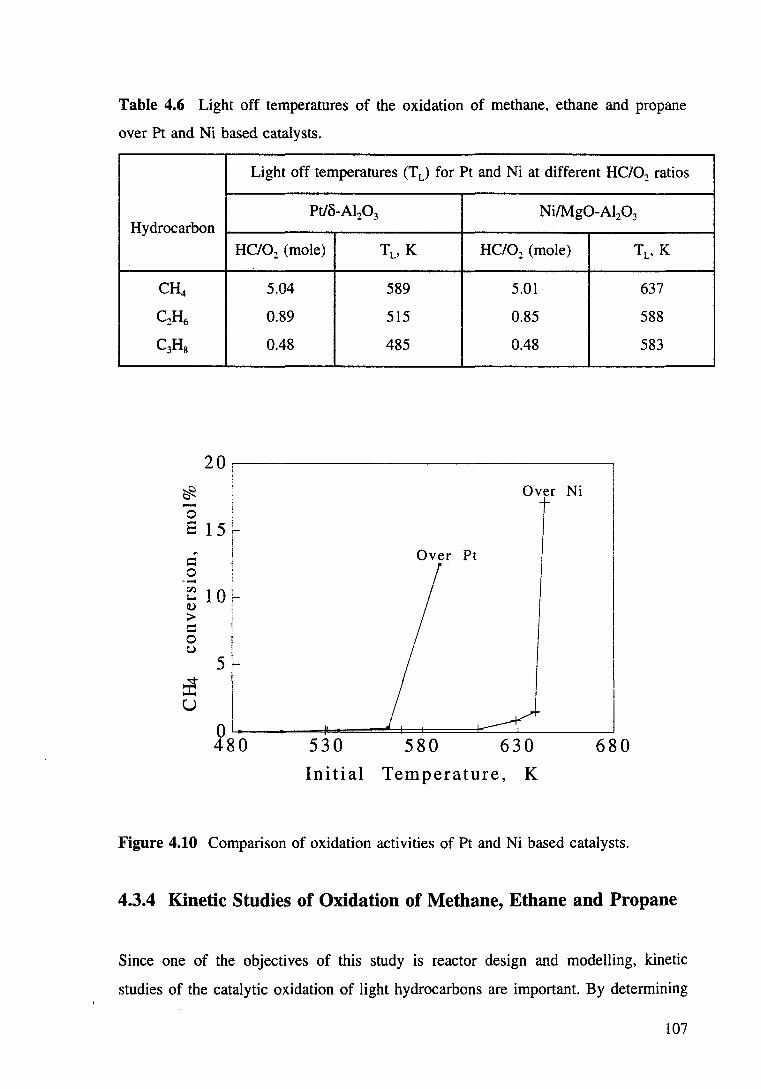
Table 4.6 Light off temperatures of the oxidation of methane, ethane and propane
over Pt and Ni based catalysts.
Light off temperatures (T L) for Pt and Ni at different HClOz ratios
Pt/B-Al20 3 Ni/Mg0-Al20 3 Hydrocarbon
HC/02 (mole) TL, K HC/02 (mole) TL. K
CH4 5.04 589 5.01 637
C2H6 0.89 515 0.85 588
C3Hs 0.48 485 0.48 583
20, I
~ Over Ni -r
0
15 ~ a I
~
I Over Pt s::
I 0
i
I Cf.) 10 ~ 1-o a) I
> ! s:: i 0 i I u
5~ I
~ i I
u I 0 480 530 580 630 680
Initial Temperature, K
Figure 4.10 Comparison of oxidation activities of Pt and Ni based catalysts.
4.3.4 Kinetic Studies of Oxidation of Methane, Ethane and Propane
Since one of the objectives of this study is reactor design and modelling, kinetic
studies of the catalytic oxidation of light hydrocarbons are important. By determining
107
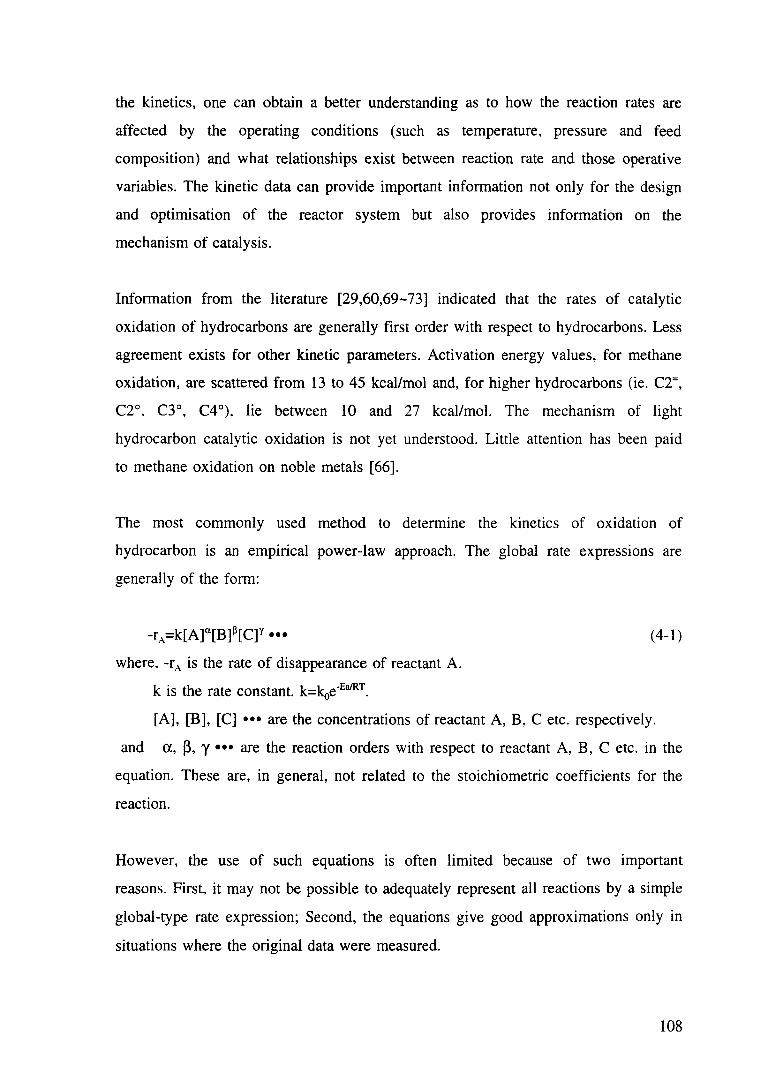
the kinetics, one can obtain a better understanding as to how the reaction rates are
affected by the operating conditions (such as temperature, pressure and feed
composition) and what relationships exist between reaction rate and those operative
variables. The kinetic data can provide important information not only for the design
and optimisation of the reactor system but also provides information on the
mechanism of catalysis.
Information from the literature [29,60,69-73] indicated that the rates of catalytic
oxidation of hydrocarbons are generally first order with respect to hydrocarbons. Less
agreement exists for other kinetic parameters. Activation energy values, for methane
oxidation, are scattered from 13 to 45 kcal/mol and, for higher hydrocarbons (ie. c2=,
C2°, C3°, C4°). lie between 10 and 27 kcal/mol. The mechanism of light
hydrocarbon catalytic oxidation is not yet understood. Little attention has been paid
to methane oxidation on noble metals [66].
The most commonly used method to determine the kinetics of oxidation of
hydrocarbon is an empirical power-law approach. The global rate expressions are
generally of the form:
(4-1)
where. -r A is the rate of disappearance of reactant A.
k is the rate constant. k=koe·EaJRT.
[A], [B], [C] ••• are the concentrations of reactant A, B, C etc. respectively.
and a, ~. y ••• are the reaction orders with respect to reactant A, B, C etc. in the
equation. These are, in general, not related to the stoichiometric coefficients for the
reaction.
However, the use of such equations is often limited because of two important
reasons. First, it may not be possible to adequately represent all reactions by a simple
global-type rate expression; Second, the equations give good approximations only in
situations where the original data were measured.
108
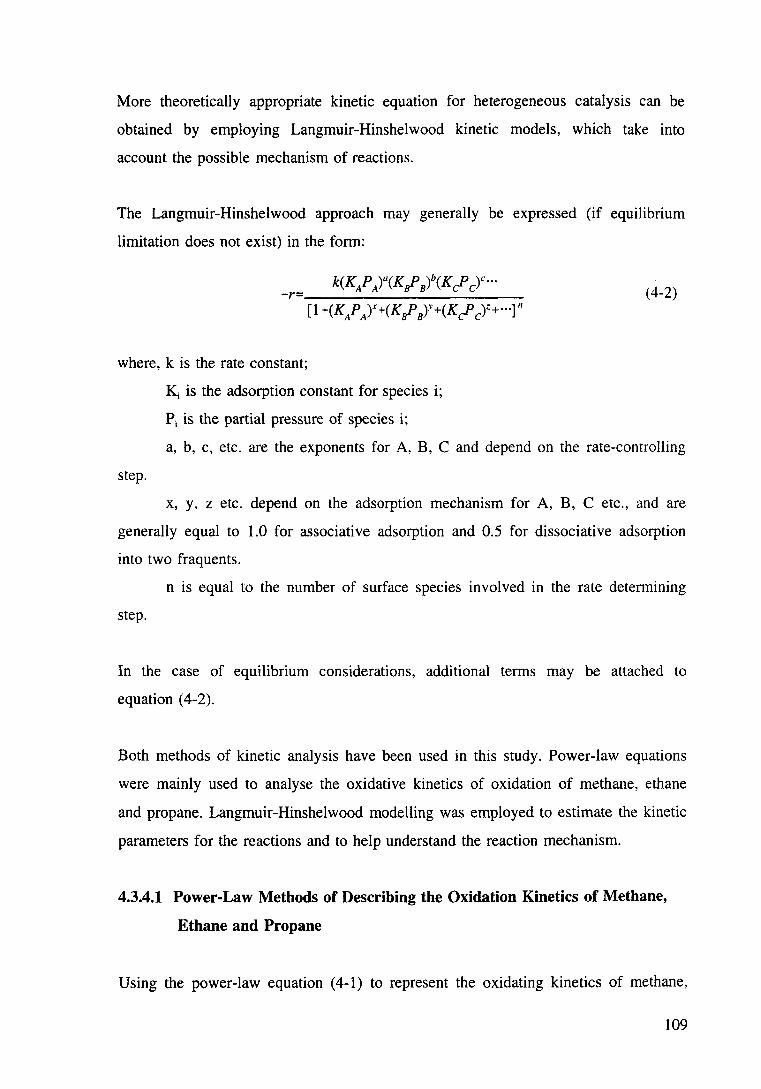
More theoretically appropriate kinetic equation for heterogeneous catalysis can be
obtained by employing Langmuir-Hinshelwood kinetic models, which take into
account the possible mechanism of reactions.
The Langmuir-Hinshelwood approach may generally be expressed (if equilibrium
limitation does not exist) in the form:
(4-2)
where, k is the rate constant;
step.
~ is the adsorption constant for species i;
Pi is the partial pressure of species i;
a, b, c, etc. are the exponents for A, B, C and depend on the rate-controlling
x, y, z etc. depend on the adsorption mechanism for A, B, C etc., and are
generally equal to 1.0 for associative adsorption and 0.5 for dissociative adsorption
into two fraquents.
n is equal to the number of surface species involved in the rate determining
step.
In the case of equilibrium considerations, additional terms may be attached to
equation (4-2).
Both methods of kinetic analysis have been used in this study. Power-law equations
were mainly used to analyse the oxidative kinetics of oxidation of methane, ethane
and propane. Langmuir-Hinshelwood modelling was employed to estimate the kinetic
parameters for the reactions and to help understand the reaction mechanism.
4.3.4.1 Power-Law Methods of Describing the Oxidation Kinetics of Methane,
Ethane and Propane
Using the power-law equation ( 4-1) to represent the oxidating kinetics of methane,
109
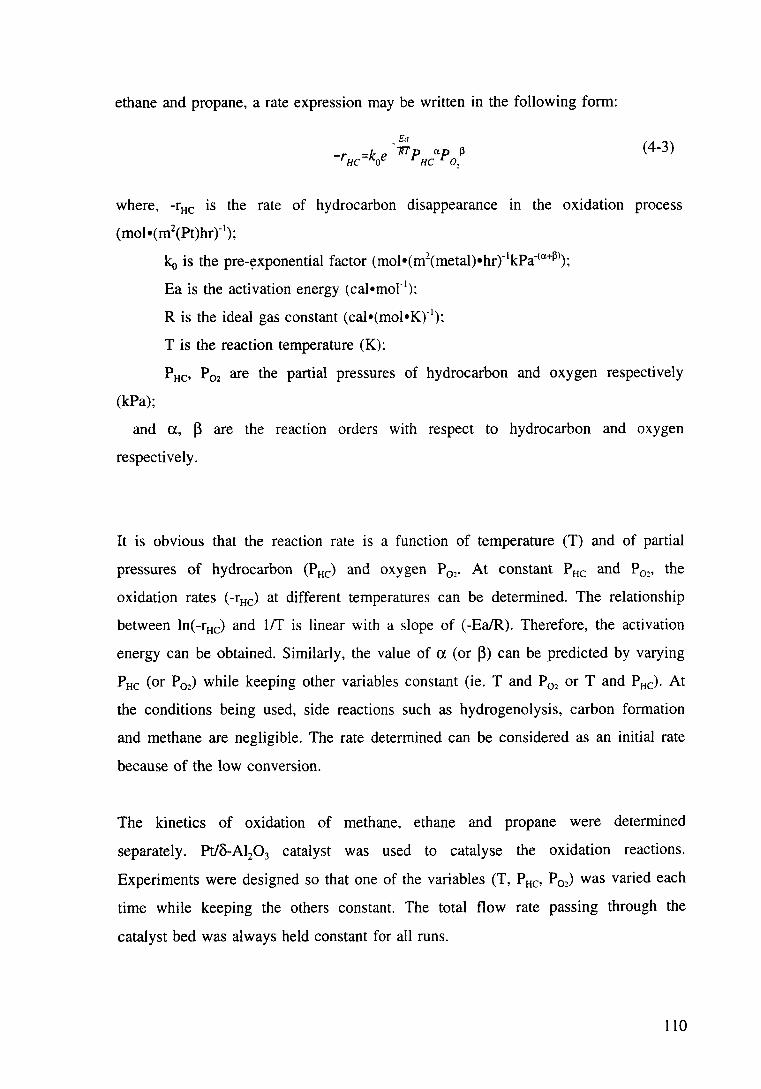
ethane and propane, a rate expression may be written in the following form:
£a
-rHc=koe -7rT'pHcapo.13 (4-3)
where, -rHc is the rate of hydrocarbon disappearance m the oxidation process
(mol•(m2(Pt)hrY1);
(kPa);
ko is the pre-~xponential factor (mol•(m2(metal)•hrr1kPa·(a+Pl);
Ea is the activation energy (cal•mo1"1):
R is the ideal gas constant (cal•(mol•K)"1);
T is the reaction temperature (K);
PHc• P02 are the partial pressures of hydrocarbon and oxygen respectively
and a, ~ are the reaction orders with respect to hydrocarbon and oxygen
respectively.
It is obvious that the reaction rate is a function of temperature (T) and of partial
pressures of hydrocarbon (PHc) and oxygen P02. At constant PHc and P02, the
oxidation rates (-rHc) at different temperatures can be determined. The relationship
between ln( -rHc) and lff is linear with a slope of ( -Ea/R). Therefore, the activation
energy can be obtained. Similarly, the value of a (or ~) can be predicted by varying
PHc (or P02) while keeping other variables constant (ie. T and P02 or T and PHd- At
the conditions being used, side reactions such as hydrogenolysis, carbon formation
and methane are negligible. The rate determined can be considered as an initial rate
because of the low conversion.
The kinetics of oxidation of methane, ethane and propane were determined
separately. Pt/o-Al20 3 catalyst was used to catalyse the oxidation reactions.
Experiments were designed so that one of the variables (T, PHc• P02) was varied each
time while keeping the others constant. The total flow rate passing through the
catalyst bed was always held constant for all runs.
110
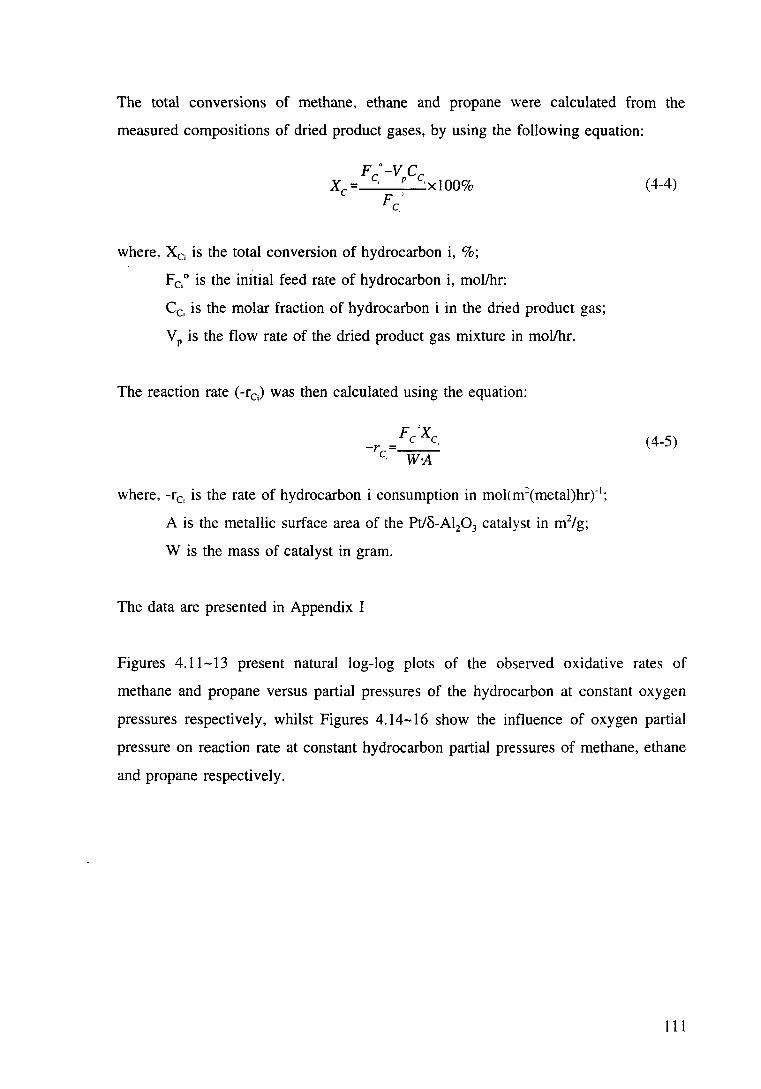
The total conversions of methane, ethane and propane were calculated from the
measured compositions of dried product gases, by using the following equation:
where, XCi is the total conversion of hydrocarbon i, %;
Fc,0 is the initial feed rate of hydrocarbon i, mollhr:
Cc, is the molar fraction of hydrocarbon i in the dried product gas;
VP is the flow rate of the dried product gas mixture in mollhr.
The reaction rate (-re) was then calculated using the equation:
where, -re, is the rate of hydrocarbon i consumption in mol(m2(metal)hr)"1;
A is the metallic surface area of the Pt/b-Al20 3 catalyst in m2/g;
W is the mass of catalyst in gram.
The data are presented in Appendix I
(4-4)
(4-5)
Figures 4.11-13 present natural log-log plots of the observed oxidative rates of
methane and propane versus partial pressures of the hydrocarbon at constant oxygen
pressures respectively, whilst Figures 4.14-16 show the influence of oxygen partial
pressure on reaction rate at constant hydrocarbon partial pressures of methane, ethane
and propane respectively.
111
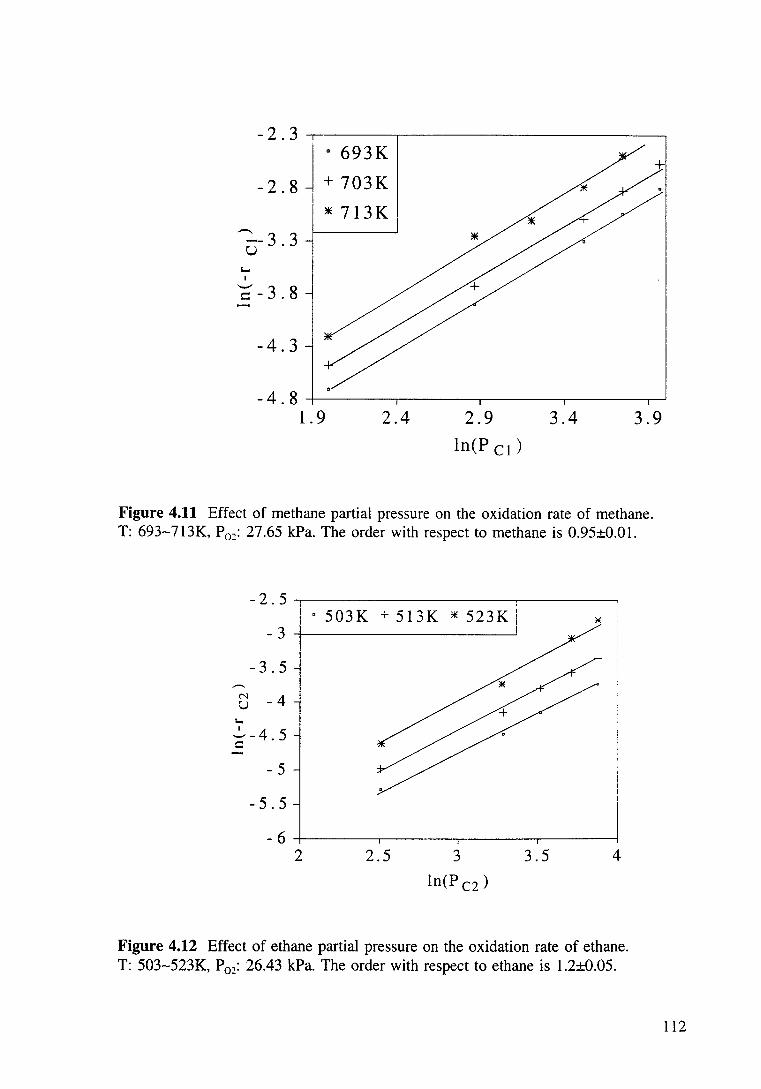
-2.3~------~--------------------~ • 693K
-2.8 +703K
~-3.3 u
s..., I
C'-3.8
-4.3
* 713K
-4.8~------~----~------~------~ 1.9 2.4 2.9
ln(Pc 1 )
3.4 3.9
Figure 4.11 Effect of methane partial pressure on the oxidation rate of methane. T: 693-713K, P02: 27.65 kPa. The order with respect to methane is 0.95±0.01.
-2.5
- 3
-3.5
N -4 u ~
~-4. 5 =
- 5
-5.5
- 6 2
· 503K + 513K * 523K
2.5 3
ln(P Cl)
3.5 4
Figure 4.12 Effect of ethane partial pressure on the oxidation rate of ethane. T: 503-523K, P02: 26.43 kPa. The order with respect to ethane is 1.2±0.05.
112
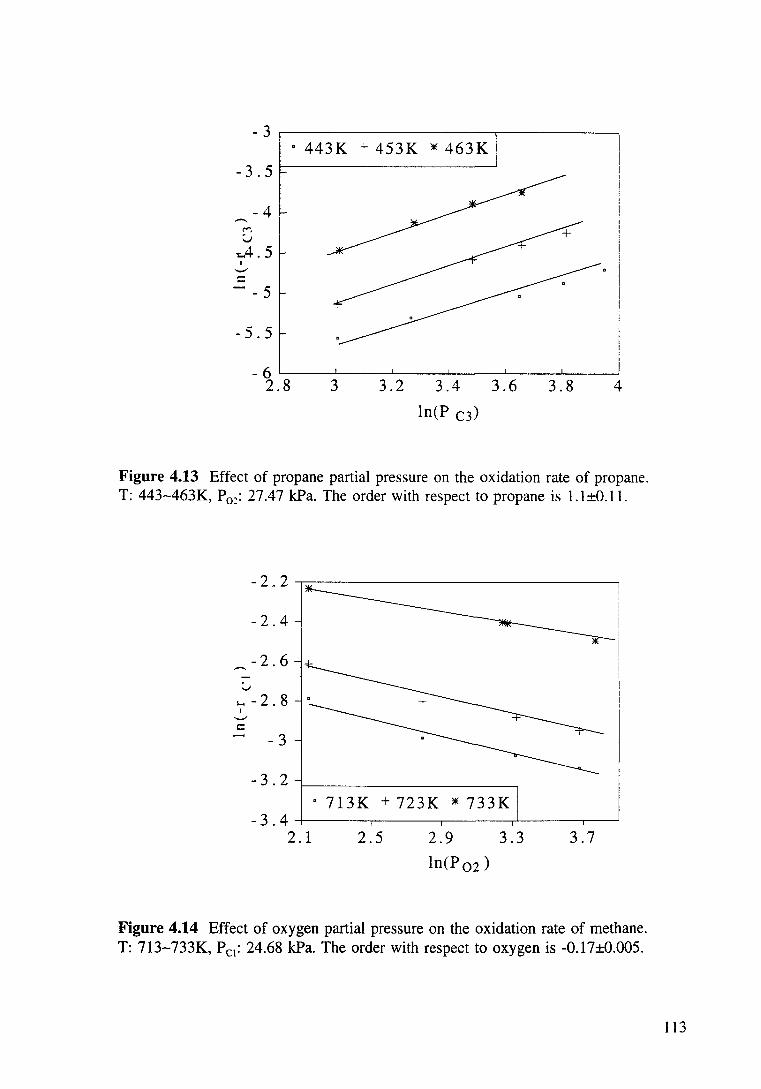
- 3 r---------------,r-------. • 443K -'- 453K * 463K
-3.5
-4 -r. v
,.4. 5 I
--5
-5.5
- 6 L------1-----L----'-------'-------'-------'
2.8 3 3.2 3.4
ln(P c3)
3.6 3.8 4
Figure 4.13 Effect of propane partial pressure on the oxidation rate of propane. T: 443-463K, P 0 :: 27.47 kPa. The order with respect to propane is 1.1±0.11.
-2.4
-2.6 -::..;
:... -2. 8 I --c:
- 3
-3.2
· 713K + 723K * 733K -3.4~------,---~---r----.~
2.1 2.5 2.9 3.3 3.7
ln(P 02 )
Figure 4.14 Effect of oxygen partial pressure on the oxidation rate of methane. T: 713-733K, PC!: 24.68 kPa. The order with respect to oxygen is -0.17±0.005.
113
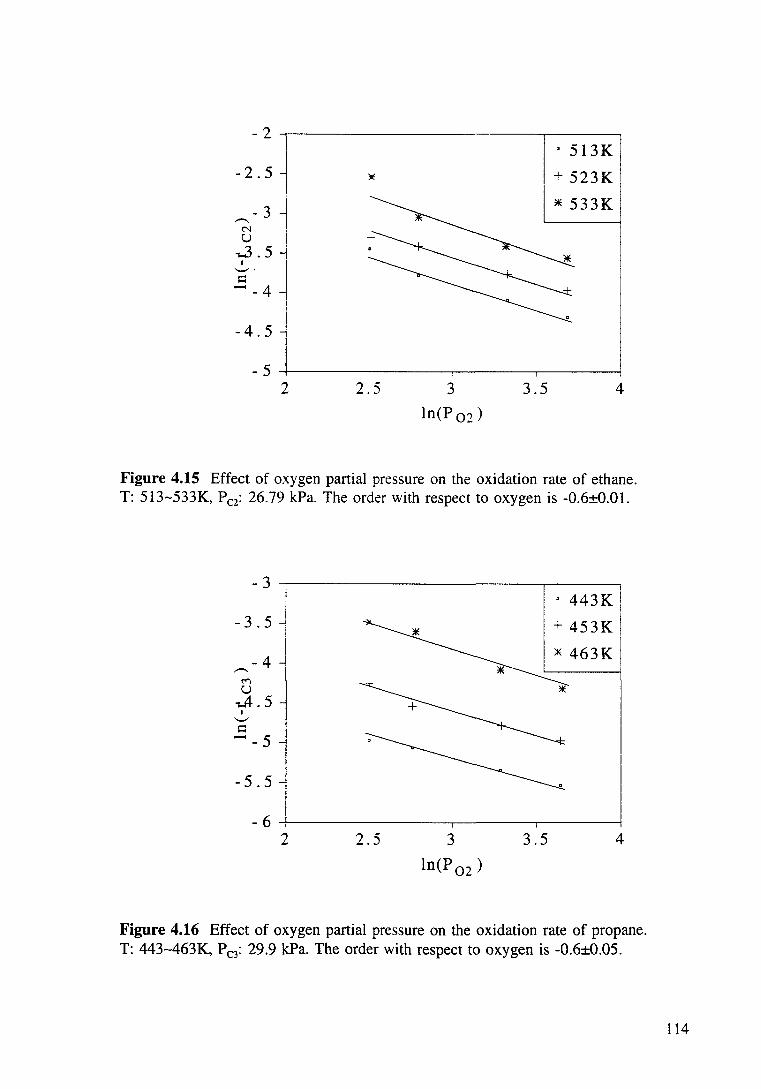
- 2
-2.5
- 3 ,.-.... N u
,_3. 5 I
"""" ' l:l - -4
-4.5
- 5 2 2.5 3
ln(P 02 )
3.5
• 513K
+ 523K
* 533K
4
Figure 4.15 Effect of oxygen partial pressure on the oxidation rate of ethane. T: 513-533K, Pc2: 26.79 kPa. The order with respect to oxygen is -0.6±0.01.
- 3
-3.5
-4 ,.-.... ('<)
u -;.JI. • 5
I
"""" l:l - - 5
-5.5
- 6 2 2.5 3
ln(P 02 )
3.5
. 443K I + 453K I
* 463K I
4
Figure 4.16 Effect of oxygen partial pressure on the oxidation rate of propane. T: 443-463K, Pe3: 29.9 kPa. The order with respect to oxygen is -0.6±0.05.
114
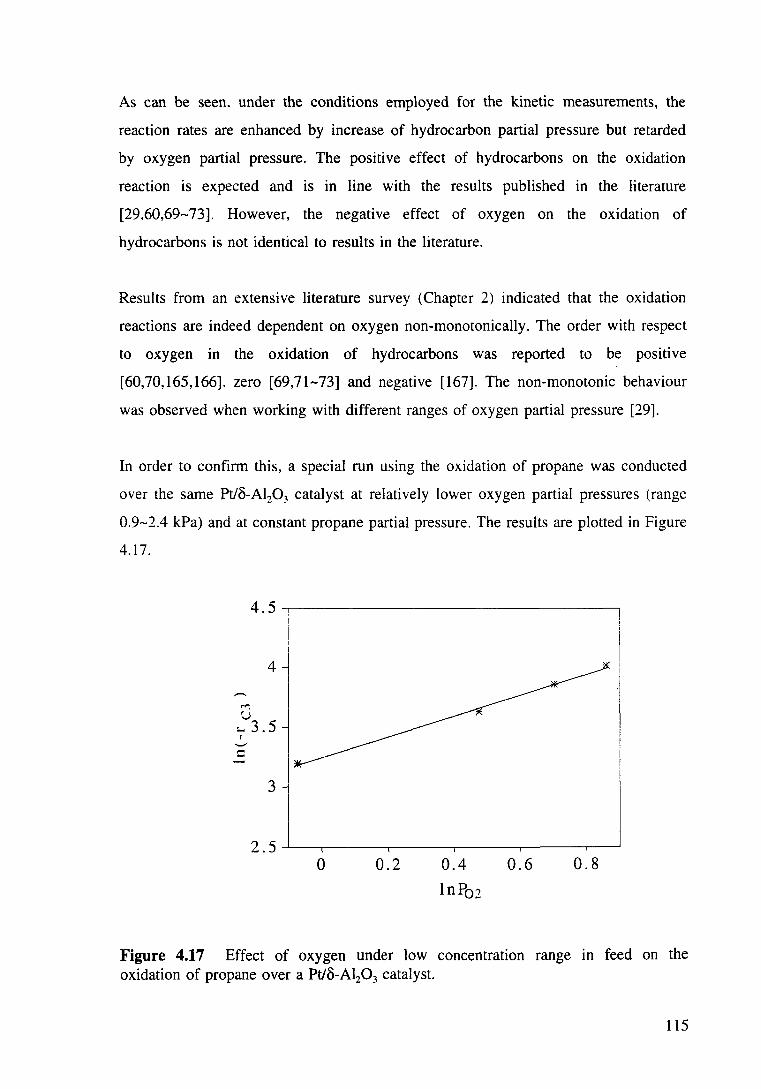
As can be seen. under the conditions employed for the kinetic measurements, the
reaction rates are enhanced by increase of hydrocarbon partial pressure but retarded
by oxygen partial pressure. The positive effect of hydrocarbons on the oxidation
reaction is expected and is in line with the results published in the literature
[29.60,69-73]. However, the negative effect of oxygen on the oxidation of
hydrocarbons is not identical to results in the literature.
Results from an extensive literature survey (Chapter 2) indicated that the oxidation
reactions are indeed dependent on oxygen non-monotonically. The order with respect
to oxygen in the oxidation of hydrocarbons was reported to be positive
[60,70,165,166]. zero [69,71-73] and negative [167]. The non-monotonic behaviour
was observed when working with different ranges of oxygen partial pressure [29].
In order to confirm this, a special run using the oxidation of propane was conducted
over the same Pt/8-Al20 3 catalyst at relatively lower oxygen partial pressures (range
0.9-2.4 kPa) and at constant propane partial pressure. The results are plotted in Figure
4.17.
4.5,-------------------------------~
4
1¥',
u :... 3.5 I ._.,
::::
3
0 0.2 0.4
lnP02
0.6 0.8
Figure 4.17 Effect of oxygen under low concentration range in feed on the oxidation of propane over a Pt/8-Al20 3 catalyst.
115
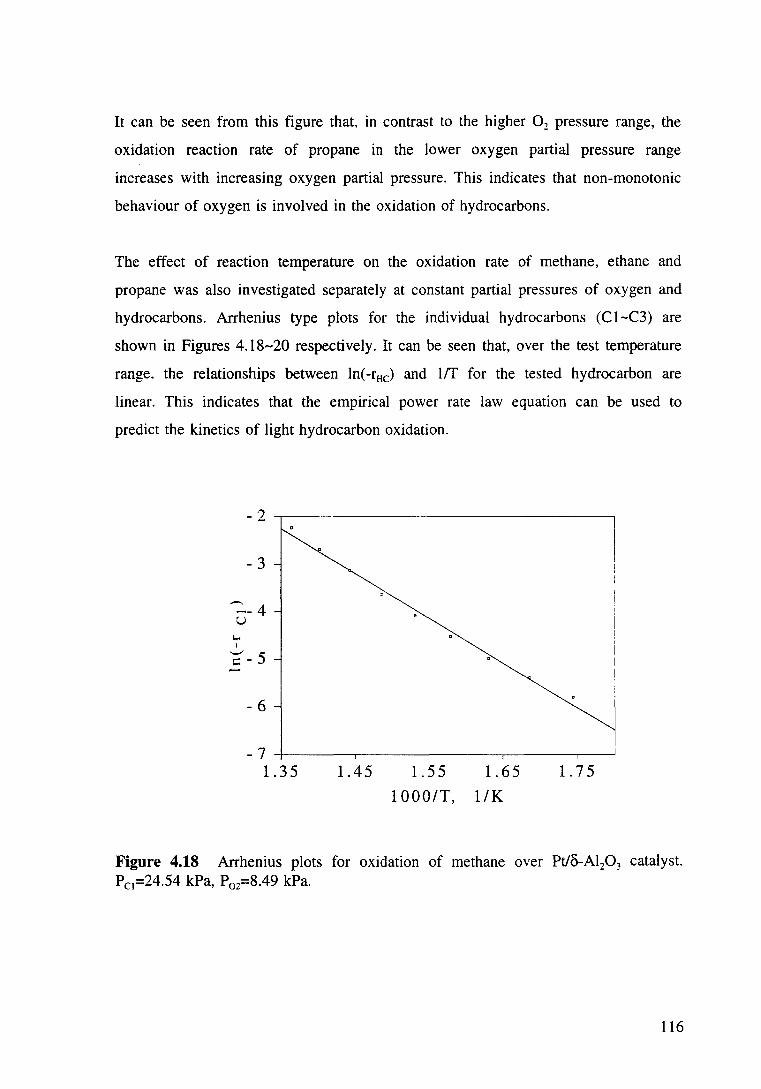
It can be seen from this figure that, in contrast to the higher 0 2 pressure range, the
oxidation reaction rate of propane in the lower oxygen partial pressure range
increases with increasing oxygen partial pressure. This indicates that non-monotonic
behaviour of oxygen is involved in the oxidation of hydrocarbons.
The effect of reaction temperature on the oxidation rate of methane, ethane and
propane was also investigated separately at constant partial pressures of oxygen and
hydrocarbons. Arrhenius type plots for the individual hydrocarbons (C 1-C3) are
shown in Figures 4.18-20 respectively. It can be seen that, over the test temperature
range. the relationships between ln(-rHc) and lff for the tested hydrocarbon are
linear. This indicates that the empirical power rate law equation can be used to
predict the kinetics of light hydrocarbon oxidation.
- 3
~-4 u
I.. I
't;'- 5
- 6
-7 4-------~--------------~------~~ 1.35 1.45 1.55 1.65 1. 7 5
1 000/T, 1 /K
Figure 4.18 Arrhenius plots for oxidation of methane over Pt/8-Al20 3 catalyst. Pc1=24.54 kPa, P02=8.49 kPa.
116
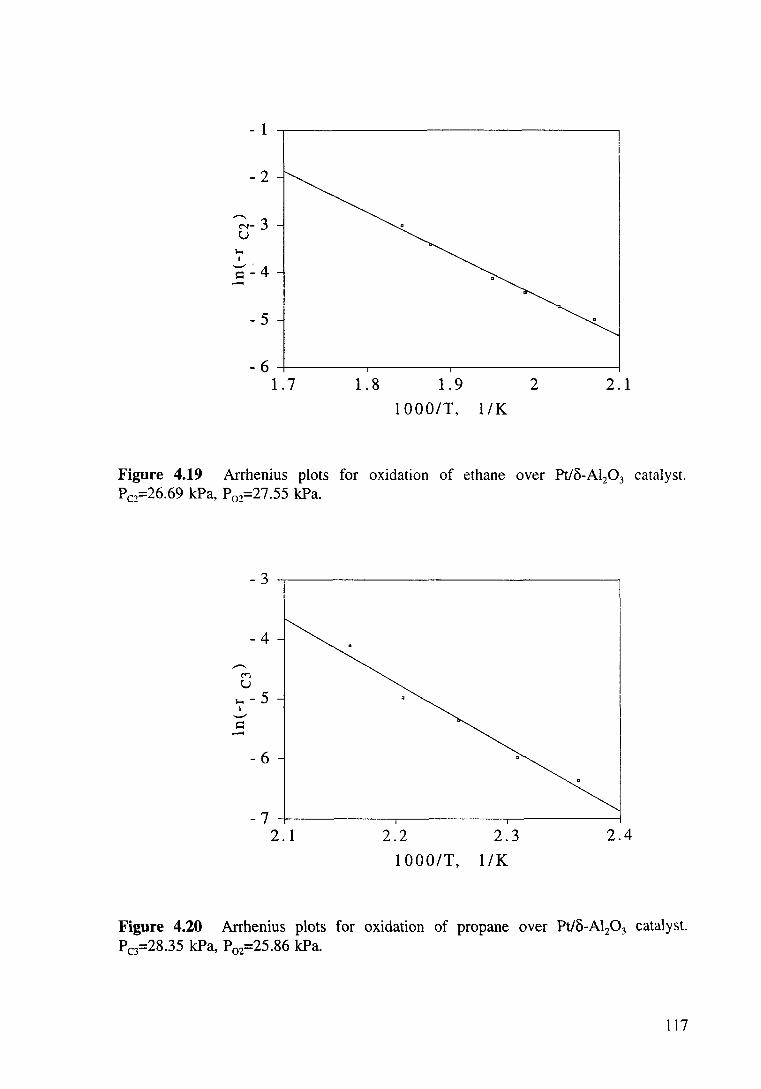
-2
~- 3 u
- 5
-6 ~------~--------~------~------~ 1.7 1.8 1.9
1000/T, 1/K
2 2.1
Figure 4.19 Arrhenius plots for oxidation of ethane over Pt/8-Al20 3 catalyst. P c=26.69 kPa, P 02=27 .55 kPa.
-4
-.. ("')
u ~-o-5 I
'-" 1::::: -
- 6
-7 ,_----------~----------~--------~ 2.1 2.2 2.3 2.4
1000/T, 1/K
Figure 4.20 Arrhenius plots for oxidation of propane over Pt/8-Al20 3 catalyst. Pc3=28.35 kPa, P02=25.86 kPa.
117

The above results were correlated using numerical methods. Equation (4-3) was
linearised by taking natural logarithms to give equation (4-6):
(4-6)
By using multiple linear least squares regressions to analyse all the experimental data
(see Appendix l) the kinetic parameters (i.e. Ea, a and ~) for the oxidation of
methane, ethane and propane over Pt/3-Al20 3 were obtained and are summarised in
Table 4.7.
Table 4.7 Kinetic parameters for the oxidation of methane. ethane and propane.
HC T.K Kinetic parameters
ko, Ea, a ~ mol/(m2hrkPa<HI3) kcal/mol
·Methane 633-733 1.20x10⁴ 21.07±0.2 0.95±0.5 -0.17±0.05
Ethane 473-543 3.49x10⁵ 19.14±0.2 1.1±0.1 -0.6±0.1
Propane 423-463 1.87xl09 24.93±0.1 1.1±0.05 -0.6±0.1
The apparent activation energies obtained for the hydrocarbons tested are reasonably
comparable with the results reported in the literature [67. 68, 74]. The regression
results indicated that the power-law models fit the oxidation low conversion data
very well (R>0.99). The good fit of the derived models is also shown in Figures
4.21-23 by comparing the predicted rate values with experimental results.
118

~ 0.1.---------------------------------------, ..c: -C"l
8>.08 -0
%.o6 Cl) ...... ::;!' ~
0.04 '"':) Cl) ...... . ::P .02 "0 Cl) ~
0.02 0.04 0.06 0.08
Observed rate, mol/nt /hr
Figure 4.21 Observed vs predicted reaction rate of oxidation of methane over a Pt/8-Al:P3 catalyst.
~ 0.06 ..c: -
r-:,_. 0.05
= -0 0 04 ,..... . = ~
Cl)
';,i 0.03 ~ ...
"0 0.02 Cl)
Ff'
~
:.;o.ot Cl) ~
0... 0.01 0.02 0.03 0.04 0.05
Observed rate, mol/m2 /hr
Figure 4.22 Observed vs predicted reaction rate of oxidation of ethane over a Pt/8-Al203 catalyst.
119
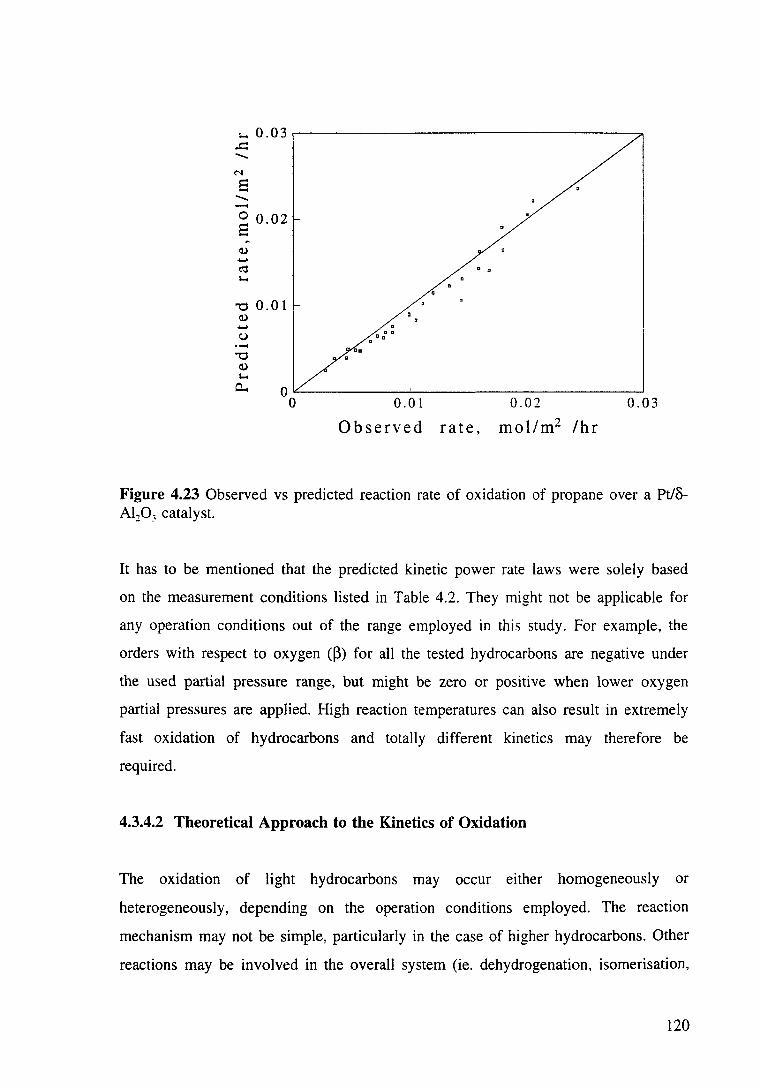
~ 0.03.-------------------------------------~ ...c:: -N
e --s 0.02
'"0 0.01 Cl) ..... u .....
'"0 Cl) ~
oa
0 0 0
0 0
0 0
c.. 0~----------~------------------------~ 0 0.01 0.02 0.03
Observed rate, mol/m2 /hr
Figure 4.23 Observed vs predicted reaction rate of oxidation of propane over a Pt/8-Al:P3 catalyst.
It has to be mentioned that the predicted kinetic power rate laws were solely based
on the measurement conditions listed in Table 4.2. They might not be applicable for
any operation conditions out of the range employed in this study. For example, the
orders with respect to oxygen (~) for all the tested hydrocarbons are negative under
the used partial pressure range, but might be zero or positive when lower oxygen
partial pressures are applied. High reaction temperatures can also result in extremely
fast oxidation of hydrocarbons and totally different kinetics may therefore be
required.
4.3.4.2 Theoretical Approach to the Kinetics of Oxidation
The oxidation of light hydrocarbons may occur either homogeneously or
heterogeneously, depending on the operation conditions employed. The reaction
mechanism may not be simple, particularly in the case of higher hydrocarbons. Other
reactions may be involved in the overall system (ie. dehydrogenation, isomerisation,
120
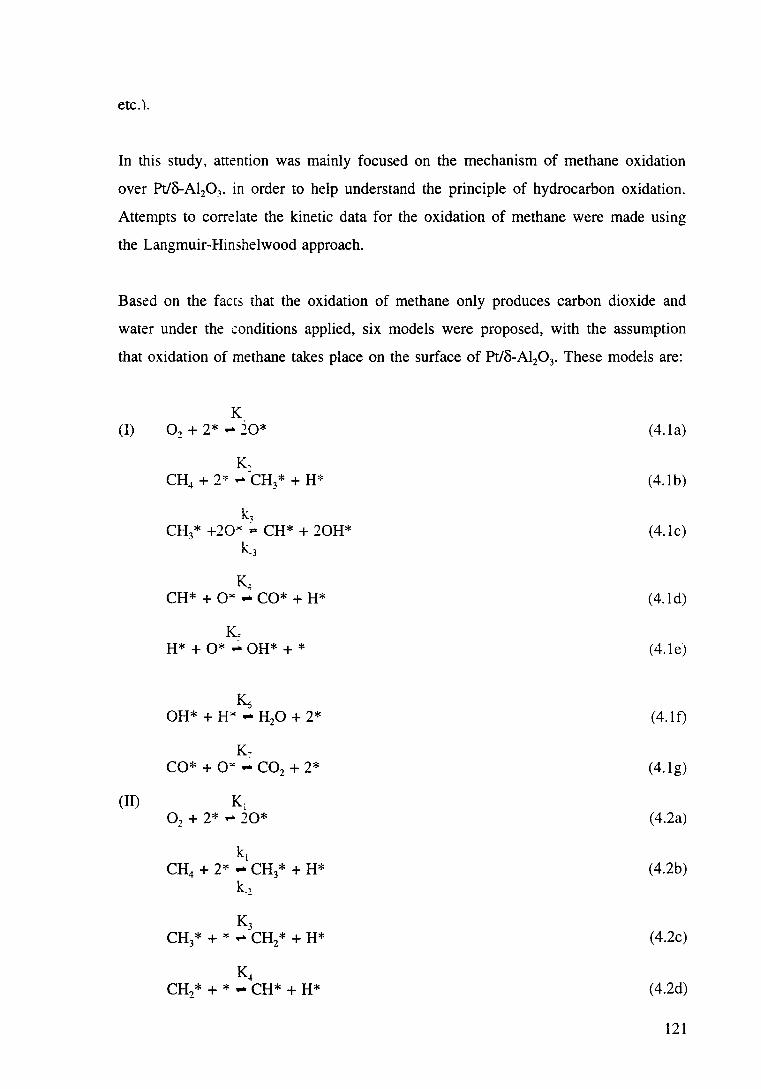
etc.).
In this study, attention was mainly focused on the mechanism of methane oxidation
over Pt/8-Al20~. in order to help understand the principle of hydrocarbon oxidation.
Attempts to correlate the kinetic data for the oxidation of methane were made using
the Langmuir-Hinshelwood approach.
Based on the facts that the oxidation of methane only produces carbon dioxide and
water under the conditions applied, six models were proposed, with the assumption
that oxidation of methane takes place on the surface of Pt18-Al20 3• These models are:
K (I) 02 + 2* ... 20* (4.1a)
K, CH4 + 2"' ... CH3 * + H* (4.1b)
k3 CH/ +20x 12 CH* + 20H* (4.lc)
k ·3
K.~ CH* + ox ... CO* + H* (4.1d)
K. H* + 0* ... OH* + * (4.1e)
~ OH* + Hx .. H20 + 2* (4.1 f)
K7 CO*+ ox ... C02 + 2* (4.1g)
(II) K. 1
02 + 2* ... 20* (4.2a)
kl CH + 2"' ... CH * + H* 4 3 (4.2b)
k.2
K3 CH3 * + "' ... CH2 * + H* (4.2c)
K.~ CH2 * + * ... CH* + H* (4.2d)
121
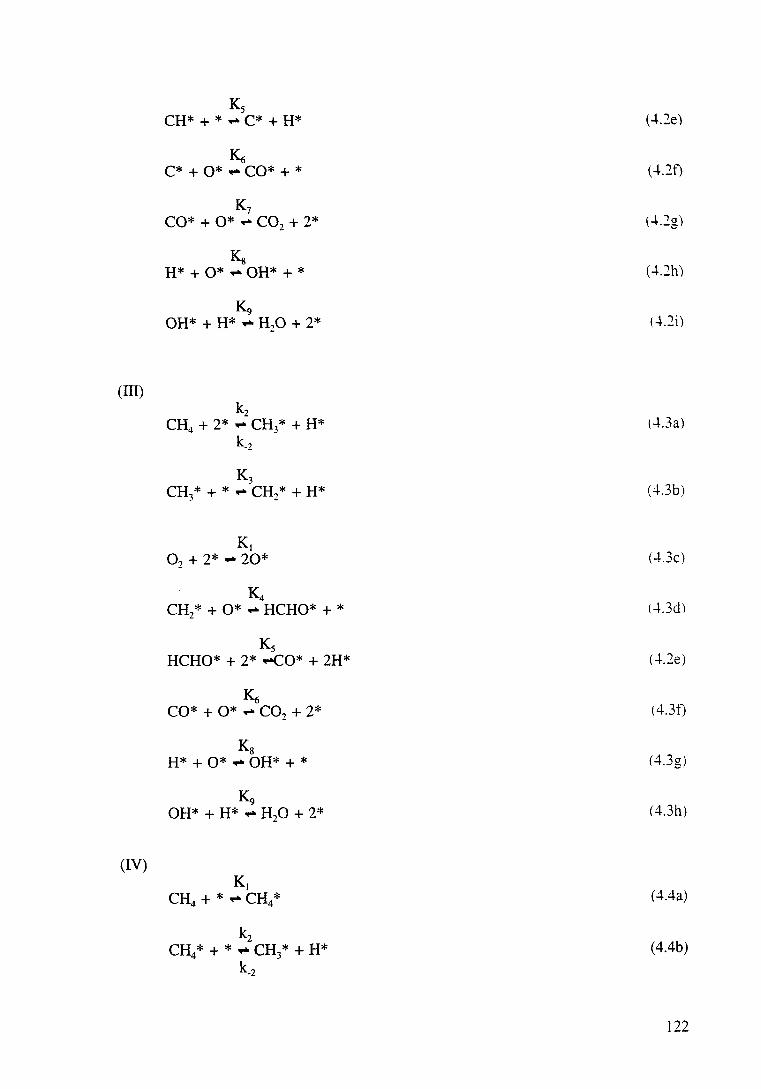
Ks CH* + * ...., C* + H* (4.2e)
~ C* + 0* ...., CO* + * ( 4.2f)
K7 CO*+ 0*...., C02 + 2* \4.2g)
Kg H* + 0* ...., OH* + * (4.2h)
(-L2i)
(Ill) k2
CH4 + 2* ..... CH3* + H* (4.3a) k_z
K3 CH3 * + * ...., CH2 * + H* (4.3b)
K, 02 + 2* ..... 20* (4.3c)
K4 CH2* + 0*...., HCHO* + * (..J..3d)
Ks HCHO* + 2* ...CO* + 2H* (4.2e)
~ CO*+ 0*...., C02 + 2* (4.3f)
Kg H* + 0* ...., OH* + * (4.3g)
~ OH* + H* ...., H20 + 2* (4.3h)
(IV) K,
CH4 + *...., CH4* ( 4.4a)
kz CH * + * ...., CH * + H* 4 3 (4.4b)
k_z
122
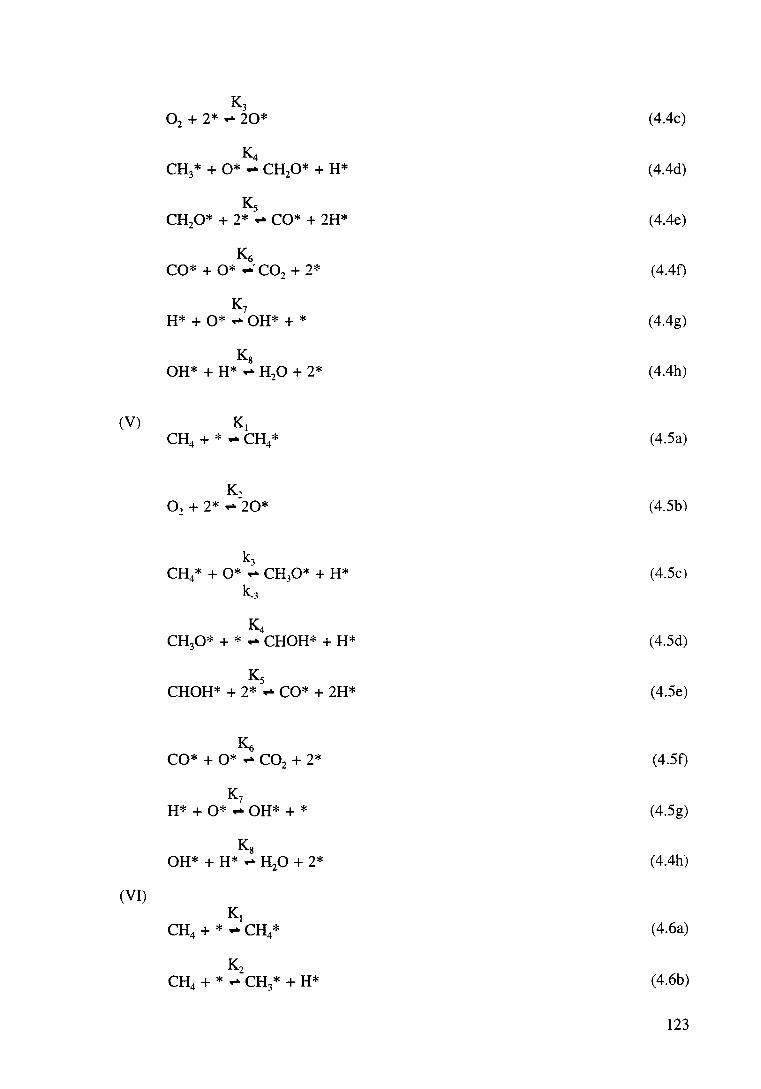
K3 02 + 2* ... 20* (4.4c)
~ CH3* + 0*.,. CH20* + H* (4.4d)
Ks CH20* + 2*.,. CO*+ 2H* (4.4e)
Kt; CO*+ 0* .,.C02 + 2* (4.4f)
K7 H* + 0* .,. OH* + * (4.4g)
Ks OH*+ H*.,. H20 + 2* (4.4h)
(V) Kt CH4 + *.,. CH4* (4.5a)
K, 02 + 2* ... 20* (4.5b)
k1 CH4* + 0*.;... CH30* + H* (4.5cl
k_3
K4 CH30* + * .,. CHOH* + H* (4.5d)
Ks CHOH* + 2*.,. CO*+ 2H* (4.5e)
K6 CO* + 0* .,. C02 + 2* (4.5f)
K7 H* + 0* .,. OH* + * (4.5g)
Ks OH* + H* .,. H20 + 2* ( 4.4h)
(VI) Kt
CH4 + *.,. CH4* (4.6a)
Kz CH4 + * .,. CH3* + H* (4.6b)
123

K3 02 + 2* .... 20* (4.6c)
k4 CH3* + 0*,... CHOH* + H* (4.6d)
k-4
Ks CHOH* + 2*,... CO*+ 2H* (4.6e)
~ CO* + 0* ,... C02 + 2* (4.6f)
K7 H* + 0* ,... OH* + * (4.6g)
Ks OH* + H* ,... H20 + 2* (4.6h)
Reactions 4.1c (model I), 4.2b (model II), 4.3a (model III), 4.4b (model IV) and
4.5c (model V) as well as 4.6d (model VI) were assumed to be the rate determining
steps. Based on these assumptions, rate equations were derived using Langmuir
Hinshelwood model:
MODI
4-7
MOD 11 and Ill
4-8
124
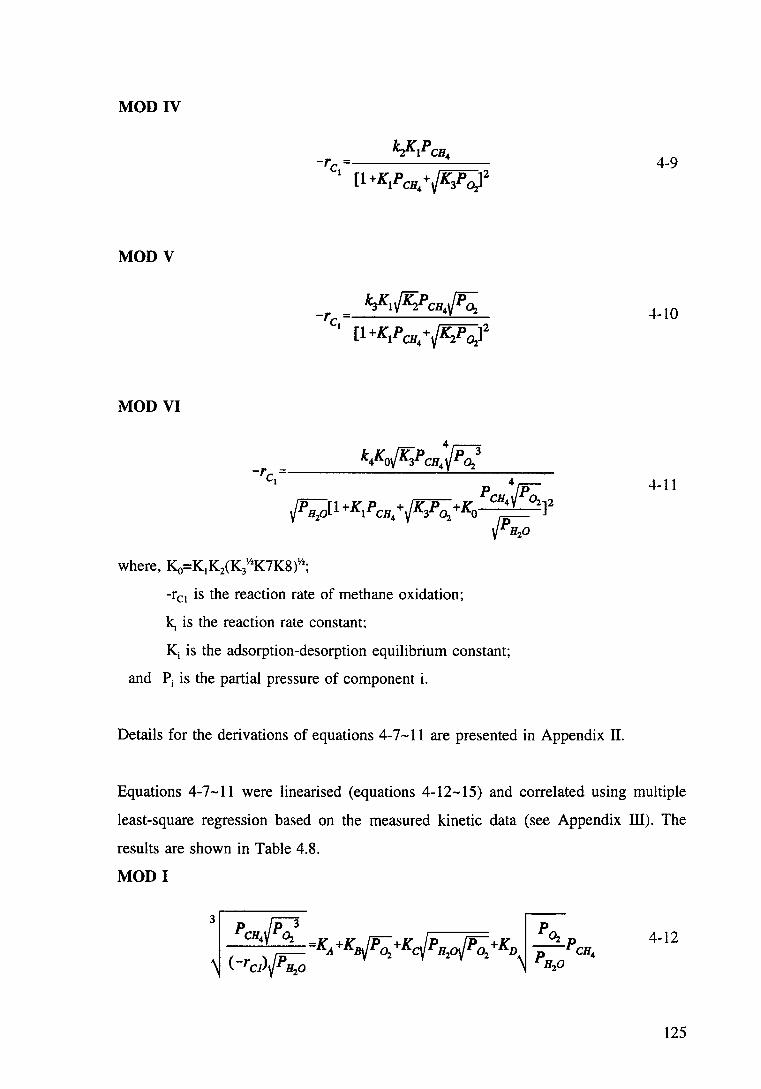
MOD IV
MODV
MOD VI
~Kl {K;.P CB4~ [1 +KlP CB4 +JKzP Oz]2
-rc1 is the reaction rate of methane oxidation;
k1 is the reaction rate constant:
K; is the adsorption-desorption equilibrium constant;
and Pi is the partial pressure of component i.
Details for the derivations of equations 4-7-11 are presented in Appendix II.
4-9
4-10
4-11
Equations 4-7-11 were linearised (equations 4-12-15) and correlated using multiple
least-square regression based on the measured kinetic data (see Appendix ill). The
results are shown in Table 4.8.
MODI
125
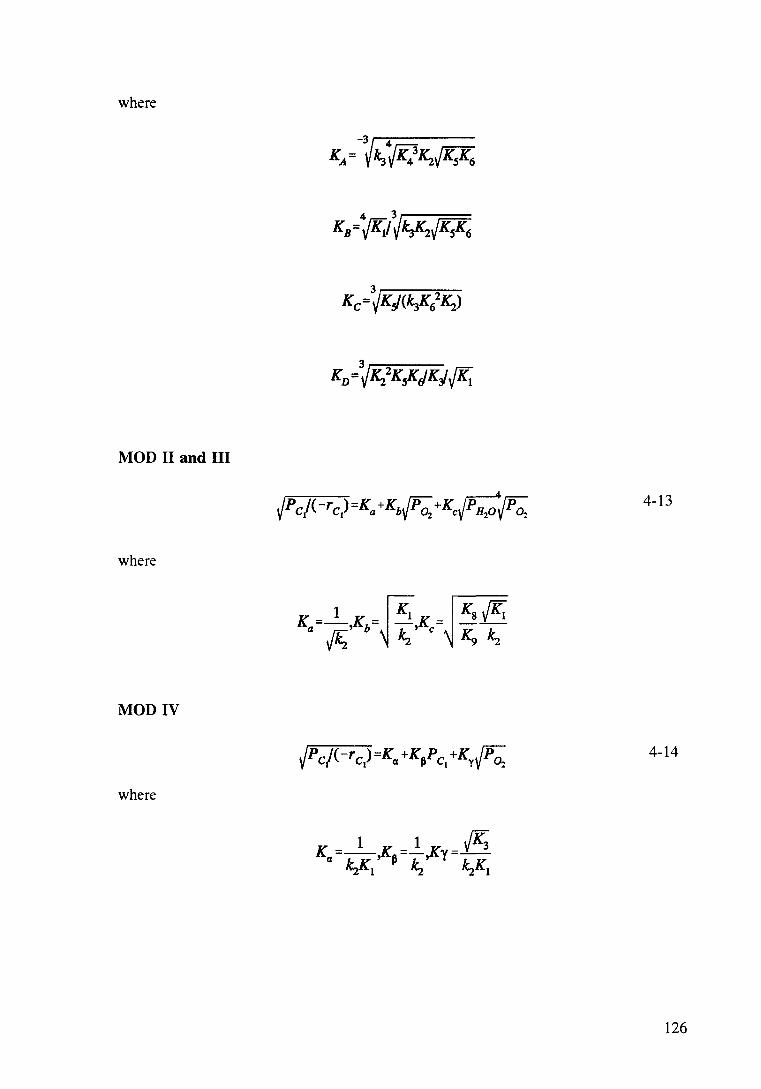
where
MOD 11 and Ill
4-13
where
K =-1- K = ~ K, K = K, .fK;. a w' b lr ' c K k
V '"2 '"2 9 2
MOD IV
4-14
where
126
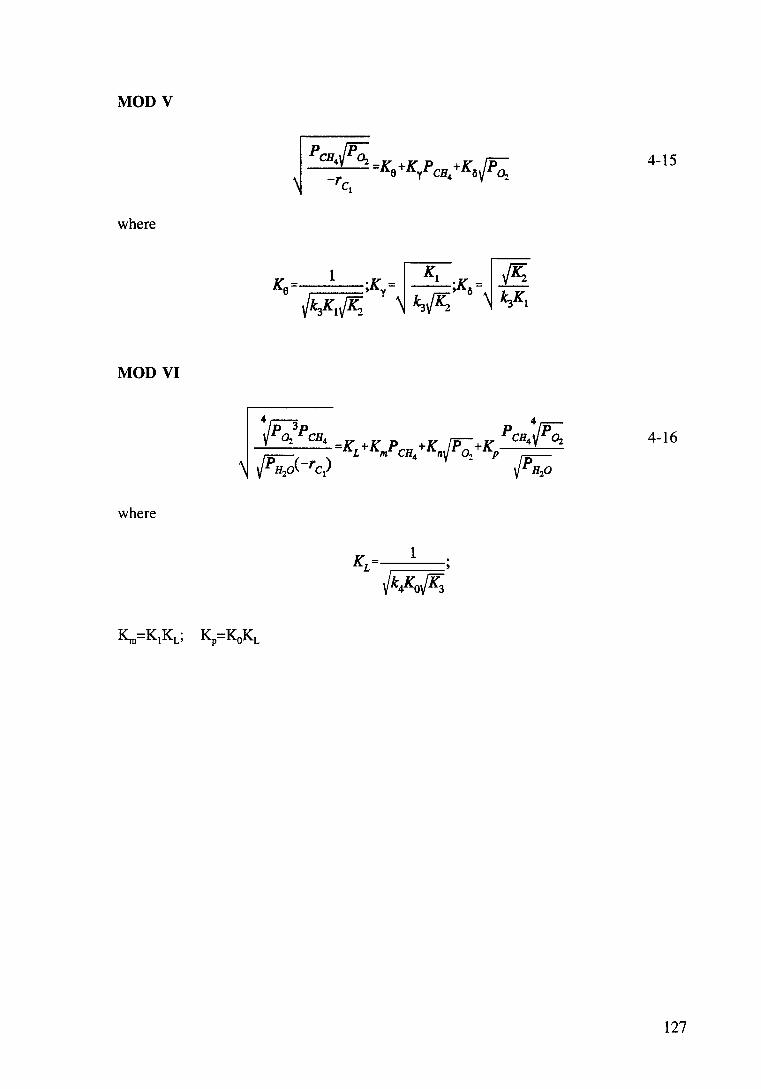
MODV
4-15
where
MOD VI
4-16
where
127
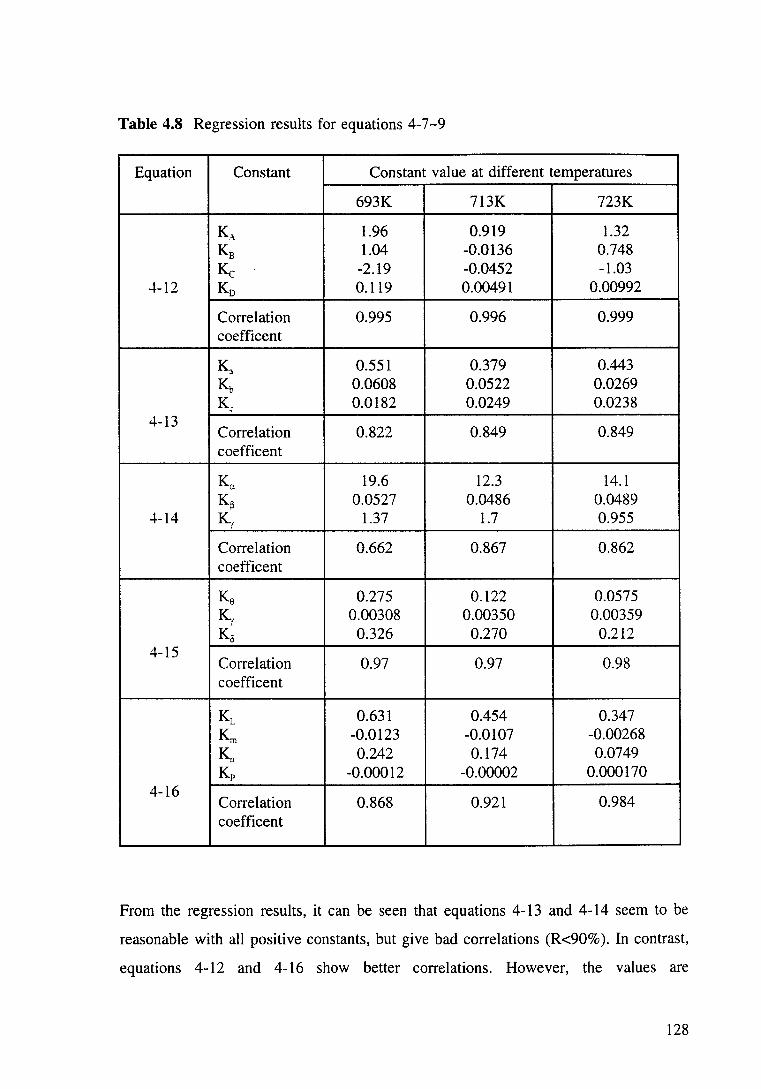
Table 4.8 Regression results for equations 4-7-9
Equation Constant Constant value at different temperatures
693K 713K 723K
K, 1.96 0.919 1.32 Ks 1.04 -0.0136 0.748
Kc -2.19 -0.0452 -1.03 -1--12 Ko 0.119 0.00491 0.00992
Correlation 0.995 0.996 0.999 coefficent
~ 0.551 0.379 0.443 Kb 0.0608 0.0522 0.0269 K. 0.0182 0.0249 0.0238
4-13 Correlation 0.822 0.849 0.849 coefficent
Ka 19.6 12.3 14.1 K~ 0.0527 0.0486 0.0489
-1--14 Kr 1.37 1.7 0.955
Correlation 0.662 0.867 0.862 coefficent
Ke 0.275 0.122 0.0575 Kr 0.00308 0.00350 0.00359 KO 0.326 0.270 0.212
4-15 Correlation 0.97 0.97 0.98 coefficent
KL 0.631 0.454 0.347
~ -0.0123 -0.0107 -0.00268 Kn 0.242 0.174 0.0749 Kp -0.00012 -0.00002 0.000170
4-16 Correlation 0.868 0.921 0.984 coefficent
From the regression results, it can be seen that equations 4-13 and 4-14 seem to be
reasonable with all positive constants, but give bad correlations (R<90% ). In contrast,
equations 4-12 and 4-16 show better correlations. However, the values are
128
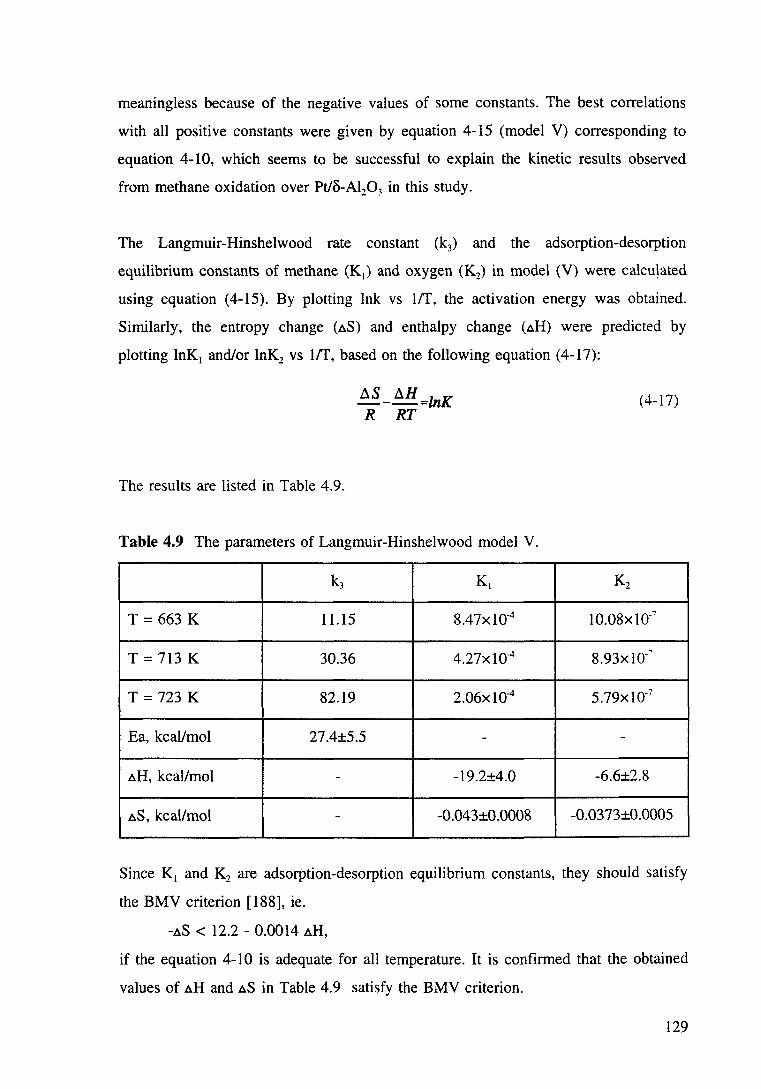
meaningless because of the negative values of some constants. The best correlations
with all positive constants were given by equation 4-15 (model V) corresponding to
equation 4-10, which seems to be successful to explain the kinetic results observed
from methane oxidation over Pt/O-Al20 3 in this study.
The Langmuir-Hinshelwood rate constant (k3) and the adsorption-desorption
equilibrium constants of methane (K1) and oxygen (K2) in model (V) were calculated
using equation (4-15). By plotting Ink vs 1ff, the activation energy was obtained.
Similarly, the entropy change (aS) and enthalpy change (aH) were predicted by
plotting lnK1 and/or lnK2 vs 1ff, based on the following equation (4-17):
The results are listed in Table 4.9.
ilS _ ilH =lnK R RT
Table 4.9 The parameters of Langmuir-Hinshelwood model V.
k3 K,
T = 663 K 11.15 8.47x10"4
T = 713 K 30.36 4.27x10⁴
T = 723 K 82.19 2.06x10"4
Ea, kcallmol 27.4±5.5 -
aH, kcal/mol - -19.2±4.0
aS, kcal/mol - -0.043±0.0008
(4-17)
K2
10.08xlo·7
8.93xl0.~
5.79xl0·7
-
-6.6±2.8
-0.0373±0.0005
Since K1 and K2 are adsorption-desorption equilibrium constants, they should satisfy
the BMV criterion [188], ie.
-aS < 12.2 - 0.0014 aH,
if the equation 4-10 is adequate for all temperature. It is confirmed that the obtained
values of aH and aS in Table 4.9 satisfy the BMV criterion.
129
The activation energy obtained from this correlation is 27 .4±5.5 kcaVmol, which is
comparable with the experimental result (ie. 21.07±0.2 kcal/mol).
The oxidation of methane on Pt metal involves competitive chemisorption of methane
and oxygen molecules on the metal active sites. The subsequent interaction of
adsorbed methane with oxygen radicals leads to the formation of chemisorbed
formaldehyde via methoxide, methyl peroxide, or methylene oxide intermediates. The
adsorbed formaldehyde intermediate, once formed, may rapidly decompose to CO*
and H* which has been confirmed by McCabe et al [ 168] and by Lapinski et al
[168], rather than desorb into the gas phase as formaldehyde molecules [66]. These
adsorbed CO and H atoms have been observed to either react with adsorbed oxygen
to produce C02 and H:O or to desorb as CO and H2, depending on the composition
of the reactant gas mixture and the properties of catalysts [ 168, 169]. The principal
reaction products of the methane oxidation under the conditions used in this study are
mainly carbon dioxide and water. Carbon monoxide and hydrogen in the products are
undetectable . Therefore. the interaction of CO* and H* with adsorbed oxygen to
C02 and H20 should be one of the steps in the mechanism of methane oxidation over
Pt/8-Al:03 catalyst.
4.3.4.3 Simulation of the Catalytic Reactor Bed for Hydrocarbon Oxidation
The proposed autothermic system for hydrogen production from light hydrocarbons
involves both oxidation and steam reforming reactions. The performance of such a
system will rely greatly on the energy balances involved. The source of energy (heat)
is the oxidation of hydrocarbons. In order to initiate and, finally, sustain the system,
an elaborate heat balance appears critical. In this section, attention will be focused on
a simulation of the catalytic oxidation bed by application of the empirical kinetic
models developed previously. The whole system will be dealt with in later chapters.
In the previous sections of this chapter, we have investigated the light off behaviour
and kinetics of the oxidation of methane, ethane and propane over a Pt/8-Al20 3
130
catalyst. Using these results, quantities of the catalyst required for the initiation of
oxidation of light hydrocarbons can be computed.
To simplify the calculation, a steady state plug flow reactor is considered. In this
reactor, a mass balance for component A in dV (volume of reactor) gives the
following relationship:
(4-18)
For the catalytic oxidation system, V can be considered as the amount of catalyst
packed in the reactor and -rA presents the moles of hydrocarbon consumed per gram
of catalyst per minute. Equation 4-17 can be changed into:
where, f'l He is the input flow rate of hydrocarbon in mol/min.,
XL is the conversion of hydrocarbon at the light off point,
-rHe is the reaction rate of hydrocarbon in mol/(g.min.) and
W is the quantity of the catalyst, in gram.
(4-19)
The reaction rate expressions ( -rHe) for the oxidation of methane, ethane and propane
can be obtained from section 4.3.4.1:
-rC!= 1.20x 1 0~e-210681RTp0·95 Clp-0.1? 02 molfm2(Pt)/hr
=0.72x1~e·2I068/Rrpo.9s Cip·O.I7 02 mol/(g.min)
-rC2=3.49x 1 05e-191441Rrpu c2P-0·602 mollm2(Pt)/hr
=2.094x10³e-191441RTpL2c2P-0·602 mol/(g.min)
-rC3= 1.87x 1 09e·24930/Rrpu cip·0.6 o2 mollm2(Pt)/hr
=1.122x107e·2493otRrpucip·0.6o2 mol/(g.min)
(4-20)
(4-21)
(4-22)
131

where R equals 1.987 cal.K/mol;
Assuming pure oxygen is used as the oxidant in feed, rate equations 4-20-22 can be
presented as a function of oxidation conversion (xci), i.e.
-r c =2640.6e 1
21068 (1-xcl)o.9s M --------~------
(1 +_!_ )0.78( _!_ -2x )0.17 R R et
1 1
(4-23)
_ 19144 (1-x )1.2
-r c =329667e M ________ c_z -------:z 1 1 0.6
[(1 +-+O.Sxr_)(--3.5xc )] ~ ""].~ z
(4-24)
-r c =1.111XJ08e 3 (4-25)
where R1,R2 and R3 are the molar ratios of methane, ethane and propane to oxygen in
feedstock respectively.
The detailed derivations are listed in Appendix IV.
By introducing equations 4-23-25 into equation 4-19, the required amount of oxidation
catalyst (W) can be computed by simple integrations. For example, if F> Hc=0.005
mol/rnin (113 ml(STP)/min), XL =0.1, the W values are calculated and listed in Table
4.10.
132
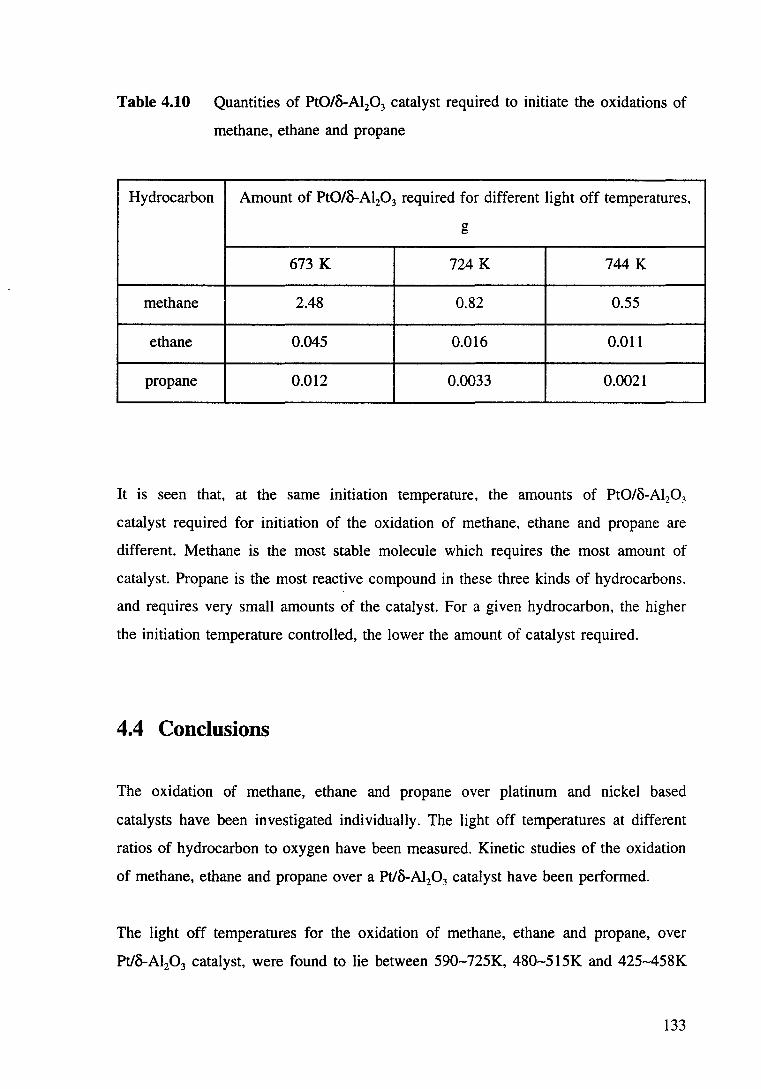
Table 4.10 Quantities of Pt0/o-Al20 3 catalyst required to initiate the oxidations of
methane, ethane and propane
Hydrocarbon Amount of Pt0/o-Al20 3 required for different light off temperatures,
g
673 K 724 K 744 K
methane 2.48 0.82 0.55
ethane 0.045 0.016 0.011
propane 0.012 0.0033 0.0021
It is seen that, at the same initiation temperature, the amounts of Pt0/8-Al20 3
catalyst required for initiation of the oxidation of methane, ethane and propane are
different. Methane is the most stable molecule which requires the most amount of
catalyst. Propane is the most reactive compound in these three kinds of hydrocarbons.
and requires very small amounts of the catalyst. For a given hydrocarbon, the higher
the initiation temperature controlled, the lower the amount of catalyst required.
4.4 Conclusions
The oxidation of methane, ethane and propane over platinum and nickel based
catalysts have been investigated individually. The light off temperatures at different
ratios of hydrocarbon to oxygen have been measured. Kinetic studies of the oxidation
of methane, ethane and propane over a Pt/8-Al20 3 catalyst have been performed.
The light off temperatures for the oxidation of methane, ethane and propane, over
Pt/8-Al20 3 catalyst, were found to lie between 590-725K, 480-515K and 425-458K
133
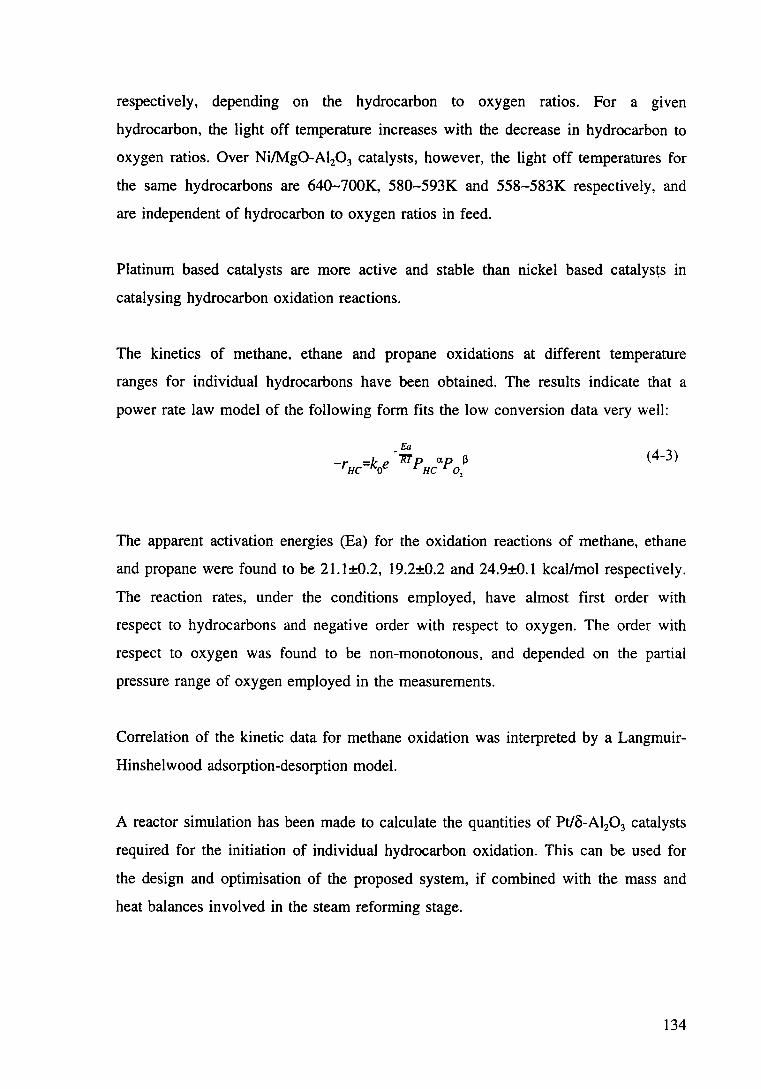
respectively, depending on the hydrocarbon to oxygen ratios. For a given
hydrocarbon, the light off temperature increases with the decrease in hydrocarbon to
oxygen ratios. Over Ni/Mg0-Al20 3 catalysts, however, the light off temperatures for
the same hydrocarbons are 640-700K, 580-593K and 558-583K respectively, and
are independent of hydrocarbon to oxygen ratios in feed.
Platinum based catalysts are more active and stable than nickel based catalysts in
catalysing hydrocarbon oxidation reactions.
The kinetics of methane, ethane and propane oxidations at different temperature
ranges for individual hydrocarbons have been obtained. The results indicate that a
power rate law model of the following form fits the low conversion data very well:
Ea
r -ke 7fTp ap (3 - HC- 0 HC 0
1
(4-3)
The apparent activation energies (Ea) for the oxidation reactions of methane, ethane
and propane were found to be 21.1±0.2, 19.2±0.2 and 24.9±0.1 kcal/mol respectively.
The reaction rates, under the conditions employed, have almost first order with
respect to hydrocarbons and negative order with respect to oxygen. The order with
respect to oxygen was found to be non-monotonous, and depended on the partial
pressure range of oxygen employed in the measurements.
Correlation of the kinetic data for methane oxidation was interpreted by a Langmuir
Hinshelwood adsorption-desorption model.
A reactor simulation has been made to calculate the quantities of Pt/B-Al20 3 catalysts
required for the initiation of individual hydrocarbon oxidation. This can be used for
the design and optimisation of the proposed system, if combined with the mass and
heat balances involved in the steam reforming stage.
134
Chapter 5 Steam Reforming of Methane, Ethane
and Propane
5.1 Introduction
Steam reforming of natural gas to produce hydrogen is a well established industrial
process [7,8]. The product is used as a synthesis gas for methanol [170] and
ammonia [171] and, depending on the hydrogen balance in a refinery. can be used to
hydrotreat heavy oils [ 171 ]. There is also increasing interest in the use of hydrogen
in fuel cells [2] or in internal combustion engines [ 19].
The overall reactions involved in steam reforming are strongly endotherrnic and can
only proceed at elevated temperatures [7,8]. The heat required is usually provided
externally [8], although recent interest has focused on autothermic systems in which
part of the feed hydrocarbon is combusted to produce the heat required by steam
reforming [ 11 ,49, 172].
The design of a reactor for such autothermic process is not simple. Due to the
complexity of the proposed system, in which both oxidation and steam reforming
reactions are involved and promoted by different catalysts, the design is actually an
optimisation process [20, 172]. Basic information, such as the kinetics of the
oxidation and the steam reforming reactions, heat and mass transfer in the system
and the effect of operating conditions on the oxidation and steam reforming, etc. is
required for reactor design.
Comprehensive investigations of the oxidation of light hydrocarbons have been
conducted and reported in Chapter 4. This chapter presents the results of studies of
steam reforming of light hydrocarbons, including activity comparisons of steam
reforming catalysts and the process as well as the kinetics of the steam reforming
reactions over these catalysts. Attention is also focused on application of the kinetic
models.
135
5.2 Experimental
5.2.1 Blank Test
Blank tests were performed in a reactor charged with a-Al;03 (diluent used in the
normal runs) under the steam reforming conditions for normal experiments. There
was no detectable activity either due to the reactor wall or to the catalyst diluent
used.
5.2.2 Steam Reforming of Light Hydrocarbons
Experiments for steam reforming of light hydrocarbons were carried out using a fixed
bed tubular reactor (see Figure 3-1) charged with 0.5 g of nickel or platinum based
catalysts (single bed, Figure 3-2a). The apparatus used for the studies is described
earlier (Section 3.3.3).
Effects of operating conditions (such as temperature. feedstock and space velocities,
etc.) on the steam reforming reactions were determined in this study. The influence
of reduction methods on reforming catalysts was also investigated.
The catalysts used in this study were either prepared in laboratory or supplied by
Haldor Tops0e NS. The catalyst specifications are shown in Tables 5.1 & 5.2
136
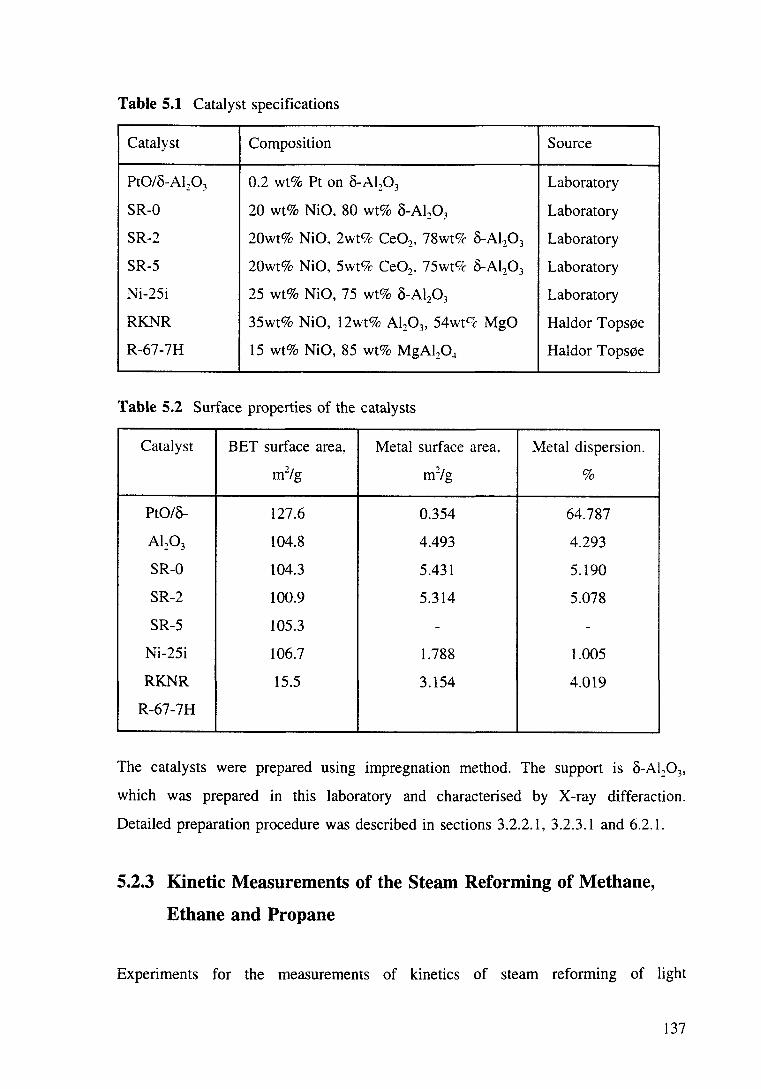
Table 5.1 Catalyst specifications
Catalyst Composition Source
Pt0/o-Al20 3 0.2 wt% Pt on O-Al20 3 Laboratory
SR-0 20 wt% NiO. 80 wt% o-Al:P3 Laboratory
SR-2 20wt% NiO. 2wt~ Ce02, 78wt9t:- o-Al20 3 Laboratory
SR-5 20wt% NiO, 5wt% Ce02• 75wto/c o-Al20 3 Laboratory
Ni-25i 25 wt% NiO, 75 wt% o-Al20 3 Laboratory
RKNR 35wt% NiO, 12wt% Al20 3, 54wtC:C MgO Haldor Tops~e
R-67-7H 15 wt% NiO, 85 wt% MgA120-l Haldor Tops~e
Table 5.2 Surface properties of the catalysts
Catalyst BET surface area, Metal surface area, Metal dispersion.
mzlg m2/u I:> %
PtO/o- 127.6 0.354 64.787
Al20 3 104.8 4.493 4.293
SR-0 104.3 5.431 5.190
SR-2 100.9 5.314 5.078
SR-5 105.3 - -
Ni-25i 106.7 1.788 1.005
RKNR 15.5 3.154 4.019
R-67-7H
The catalysts were prepared using impregnation method. The support is o-Al20 3,
which was prepared in this laboratory and characterised by X-ray differaction.
Detailed preparation procedure was described in sections 3.2.2.1, 3.2.3.1 and 6.2.1.
5.2.3 Kinetic Measurements of the Steam Reforming of Methane,
Ethane and Propane
Experiments for the measurements of kinetics of steam reforming of light
137
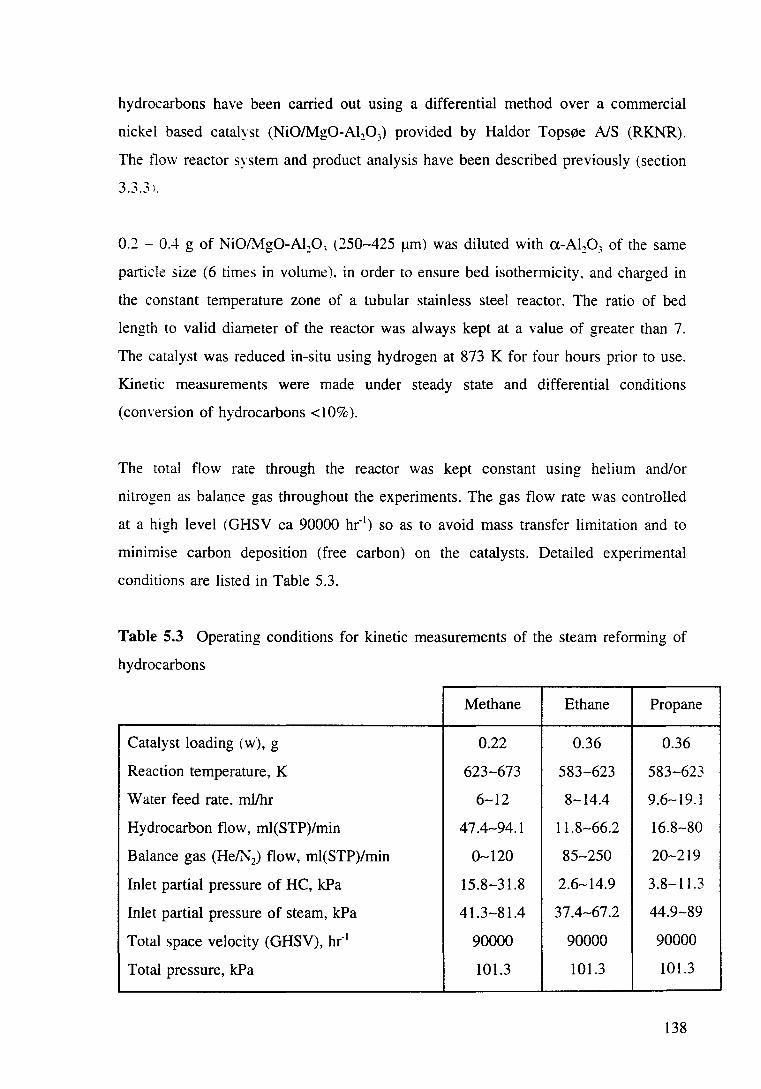
hydrocarbons have been carried out using a differential method over a commercial
nickel based catalyst (Ni0/Mg0-Al20 3) provided by Haldor Tops~e NS (RKNR).
The tlow reactor system and product analysis have been described previously (section
3.3.3 ).
0.2 - 0.4 g of NiO/MgO-Al:P~ (250-425 11m) was diluted with a-Al20 3 of the same
particle size (6 times in volume). in order to ensure bed isothermicity, and charged in
the constant temperature zone of a tubular stainless steel reactor. The ratio of bed
length to valid diameter of the reactor was always kept at a value of greater than 7.
The catalyst was reduced in-situ using hydrogen at 873 K for four hours prior to use.
Kinetic measurements were made under steady state and differential conditions
(conversion of hydrocarbons <10%).
The total flow rate through the reactor was kept constant usmg helium and/or
nitrogen as balance gas throughout the experiments. The gas flow rate was controlled
at a high level (GHSV ea 90000 hr- 1) so as to avoid mass transfer limitation and to
minimise carbon deposition (free carbon) on the catalysts. Detailed experimental
conditions are listed in Table 5.3.
Table 5.3 Operating conditions for kinetic measurements of the steam reforming of
hydrocarbons
Methane Ethane Propane
Catalyst loading ( w), g 0.22 0.36 0.36
Reaction temperature, K 623-673 583-623 583-623
Water feed rate. ml/hr 6-12 8-14.4 9.6-19.1
Hydrocarbon flow, ml(STP)/min 47.4-94.1 11.8-66.2 16.8-80
Balance gas (He/N2) flow, ml(STP)/min 0-120 85-250 20-219
Inlet partial pressure of HC, kPa 15.8-31.8 2.6-14.9 3.8-11.3
Inlet partial pressure of steam, kPa 41.3-81.4 37.4-67.2 44.9-89
Total space velocity (GHSV), hr" 1 90000 90000 90000
Total pressure, kPa 101.3 101.3 101.3
138
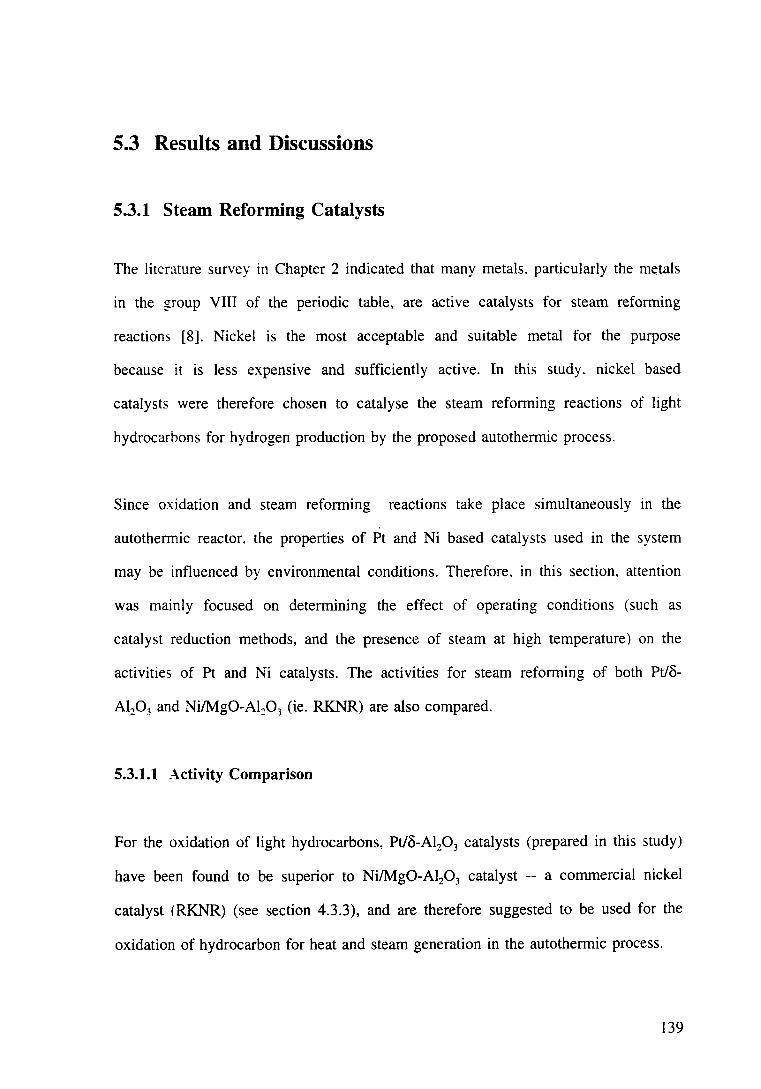
5.3 Results and Discussions
5.3.1 Steam Reforming Catalysts
The literature survey in Chapter 2 indicated that many metals. particularly the m~tals
in the group VIII of the periodic table, are active catalysts for steam reforming
reactions [8]. Nickel is the most acceptable and suitable metal for the purpose
because it is less expensive and sufficiently active. In this study. nickel based
catalysts were therefore chosen to catalyse the steam reforming reactions of light
hydrocarbons for hydrogen production by the proposed autothermic process.
Since oxidation and steam reforming reactions take place simultaneously in the
autothermic reactor. the properties of Pt and Ni based catalysts used in the system
may be influenced by environmental conditions. Therefore, in this section, attention
was mainly focused on determining the effect of operating conditions (such as
catalyst reduction methods, and the presence of steam at high temperature) on the
activities of Pt and Ni catalysts. The activities for steam reforming of both Pt/o
Al203 and Ni/Mg0-Al:P3 (ie. RK.NR) are also compared.
5.3.1.1 Activity Comparison
For the oxidation of light hydrocarbons, Pt/o-Al20 3 catalysts (prepared in this study)
have been found to be superior to Ni/Mg0-Al20 3 catalyst -- a commercial nickel
catalyst (RK.NR) (see section 4.3.3), and are therefore suggested to be used for the
oxidation of hydrocarbon for heat and steam generation in the autothermic process.
139
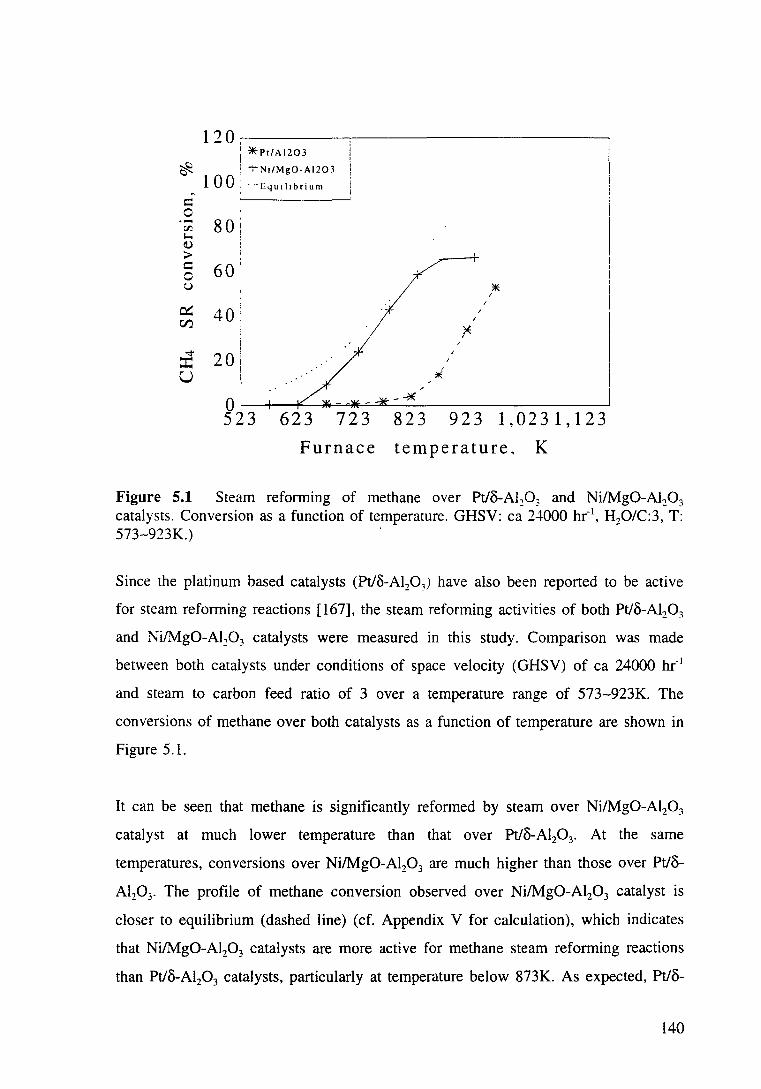
120
~ 100
~
c 0 ::r. SOl 1-o ! 0 > c 60: 0 u I
40! 0::: CZl
i 20 u
*Pt/AI203
+N•/Mg0-AI203
···Equilibrium
* /
I
/ ,. I
*
623 723 823 923 1,0231,123
Furnace temperature. K
Figure 5.1 Steam reforming of methane over Pt/8-Al20 3 and Ni/Mg0-Al:P3
catalysts. Conversion as a function of temperature. GHSV: ea 24000 hr·'. H20/C:3, T: 573-923K.) .
Since the platinum based catalysts (Pt/8-Al20 3) have also been reported to be active
for steam reforming reactions [167], the steam reforming activities of both Pt/8-Al20 3
and Ni/Mg0-Al20 3 catalysts were measured in this study. Comparison was made
between both catalysts under conditions of space velocity (GHSV) of ea 24000 hr·'
and steam to carbon feed ratio of 3 over a temperature range of 573-923K. The
conversions of methane over both catalysts as a function of temperature are shown in
Figure 5.1.
It can be seen that methane is significantly reformed by steam over Ni/Mg0-Al20 3
catalyst at much lower temperature than that over Pti8-Al20 3• At the same
temperatures, conversions over Ni/Mg0-Al20 3 are much higher than those over Pt/8-
Al203. The profile of methane conversion observed over Ni/Mg0-Al20 3 catalyst is
closer to equilibrium (dashed line) (cf. Appendix V for calculation), which indicates
that Ni/Mg0-Al20 3 catalysts are more active for methane steam reforming reactions
than Pt/8-Al20 3 catalysts, particularly at temperature below 873K. As expected, Pt/8-
140

Al:P~ catalysts indeed promote methane steam reforming reactions. However,
significant conversions require very high temperatures (above 873K). For converting
lOCk of methane. the temperature required by the reaction over Ni!Mg0-Al20 3 is ea
673K but over Pt/8-Al~03 is ea 870K.
The activity comparison suggests that, for the autothermic hydrogen generation
system. nickel based catalysts are the preferred candidates for the steam reforming
reactions.
5.2.1.2 Reduction of Nickel Based Catalysts
The nickel based catalysts can be activated by various reducing agents such as
hydrogen, ammonia, methanol, and hydrocarbons, etc. added to steam [8]. The
reduction conditions (ie. temperature, reducing agents, procedures, etc.) directly affect
the activities of nickel catalysts. Therefore. it is necessary to study the effect of
reduction conditions on the activity of the nickel catalysts.
5.3.1.2.1 TPR Profiles
The reduction of nickel based catalysts by hydrogen has been investigated and
reported by many researchers [ 173-177]. The pertinent reactions are:
NiO + H2 .,.. Ni + H20
Ni0/Mg0-Al20 3 + H2 .,.. Ni!Mg0-Al:03 + H20
NiA120 4 + H2 .,.. Ni + Al20 3 + H20
Ni0/Al20 3 + H2 .,.. Ni/Al20 3 + H20
(5.1)
(5.2)
(5.3)
(5.4)
The reduction reactions are limited by equilibrium. Nickel based catalysts may be
reduced over a temperature range of 470-870K depending on their preparation
conditions [8].
141
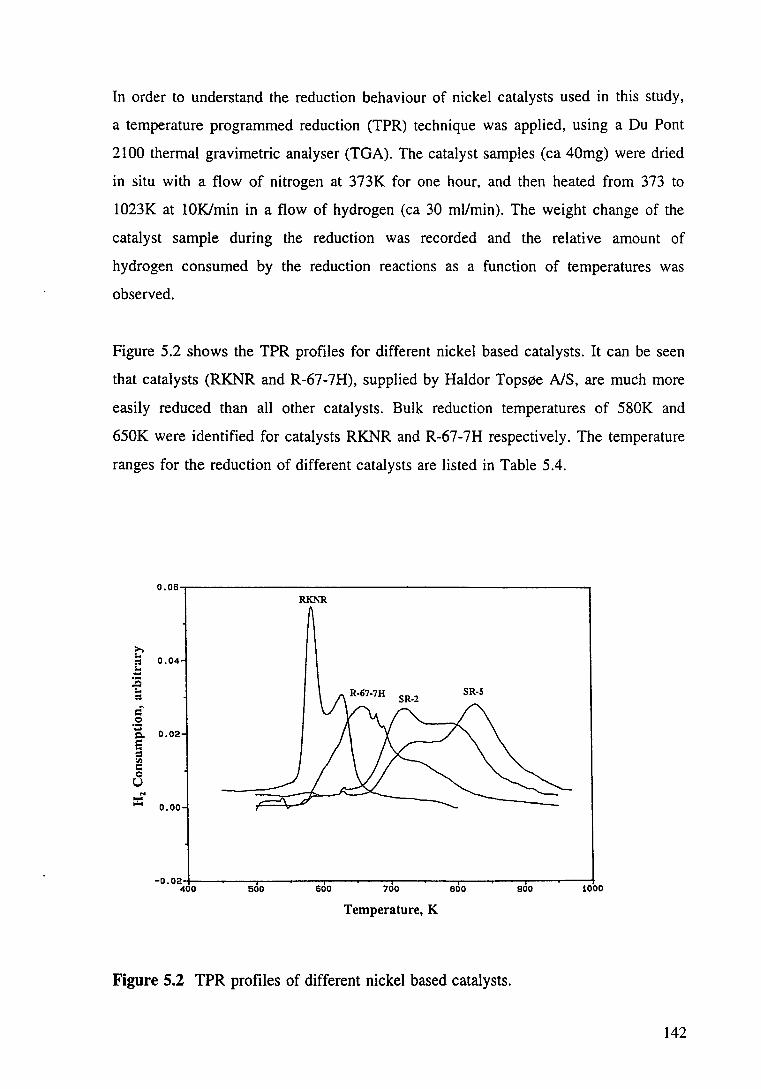
In order to understand the reduction behaviour of nickel catalysts used in this study,
a temperature programmed reduction (TPR) technique was applied, using a Du Pont
2100 thermal gravimetric analyser (TGA). The catalyst samples (ea 40mg) were dried
in situ with a flow of nitrogen at 373K for one hour, and then heated from 373 to
1023K at IOK/min in a flow of hydrogen (ea 30 ml/min). The weight change of the
catalyst sample during the reduction was recorded and the relative amount of
hydrogen consumed by the reduction reactions as a function of temperatures was
observed.
Figure 5.2 shows the TPR profiles for different nickel based catalysts. It can be seen
that catalysts (RKNR and R-67-7H), supplied by Haldor Tops0e A/S, are much more
easily reduced than all other catalysts. Bulk reduction temperatures of 580K and
650K were identified for catalysts RKNR and R-67-7H respectively. The temperature
ranges for the reduction of different catalysts are listed in Table 5.4.
o.os...,..-----------------------,
>. :.. 0.04 ~ :.. -:E
:.. ~
c .~ - 0.02 Q.
s = <ll c: 0 u .. = 0.00
-0.02+--~--r----~---.-~---,--~-.,--.....---.---.....---f: 400 500 600 700 BOO 900 !.000
Temperature, K
Figure 5.2 TPR profiles of different nickel based catalysts.
142
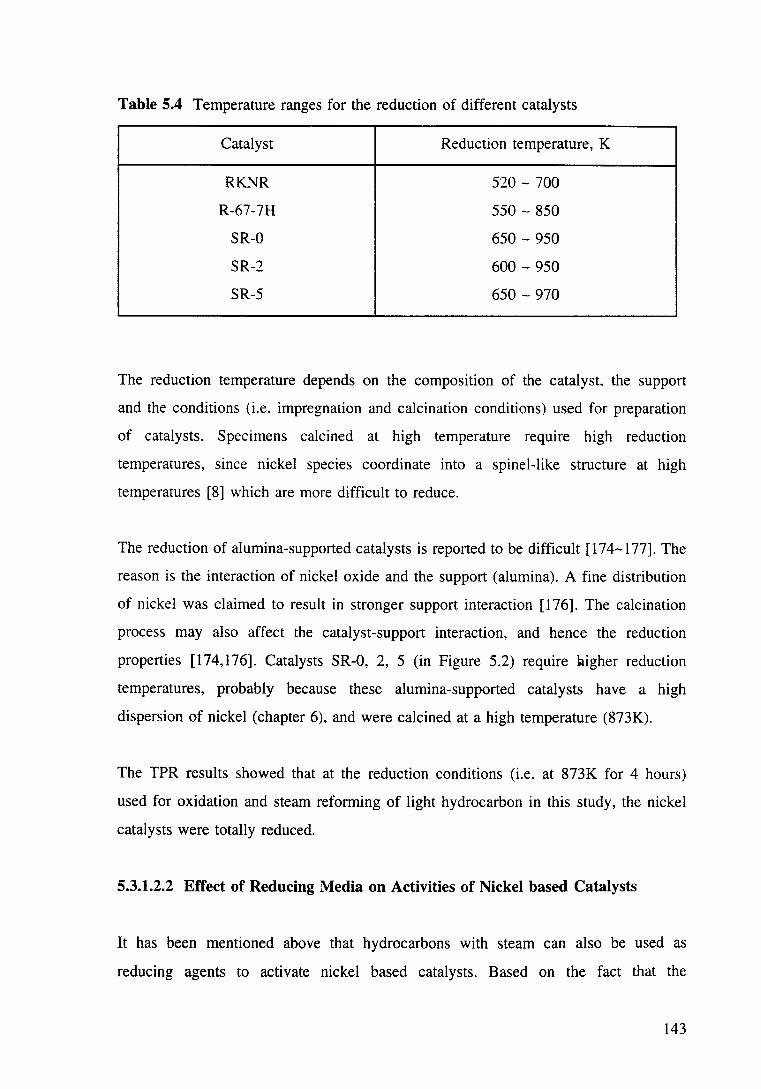
Table 5.4 Temperature ranges for the reduction of different catalysts
Catalyst Reduction temperature, K
RKl~R 520- 700
R-67-7H 550- 850
SR-0 650- 950
SR-2 600- 950
SR-5 650- 970
The reduction temperature depends on the composition of the catalyst, the support
and the conditions (i.e. impregnation and calcination conditions) used for preparation
of catalysts. Specimens calcined at high temperature require high reduction
temperatures, since nickel species coordinate into a spinel-like structure at high
temperatures [8] which are more difficult to reduce.
The reduction of alumina-supported catalysts is reported to be difficult [174-177]. The
reason is the interaction of nickel oxide and the support (alumina). A fine distribution
of nickel was claimed to result in stronger support interaction [176]. The calcination
process may also affect the catalyst-support interaction, and hence the reduction
properties [174, 176]. Catalysts SR-0, 2, 5 (in Figure 5.2) require 2igher reduction
temperatures, probably because these alumina-supported catalysts have a high
dispersion of nickel (chapter 6). and were calcined at a high temperature (873K).
The TPR results showed that at the reduction conditions (i.e. at 873K for 4 hours)
used for oxidation and steam reforming of light hydrocarbon in this study, the nickel
catalysts were totally reduced.
5.3.1.2.2 Effect of Reducing Media on Activities of Nickel based Catalysts
It has been mentioned above that hydrocarbons with steam can also be used as
reducing agents to activate nickel based catalysts. Based on the fact that the
143
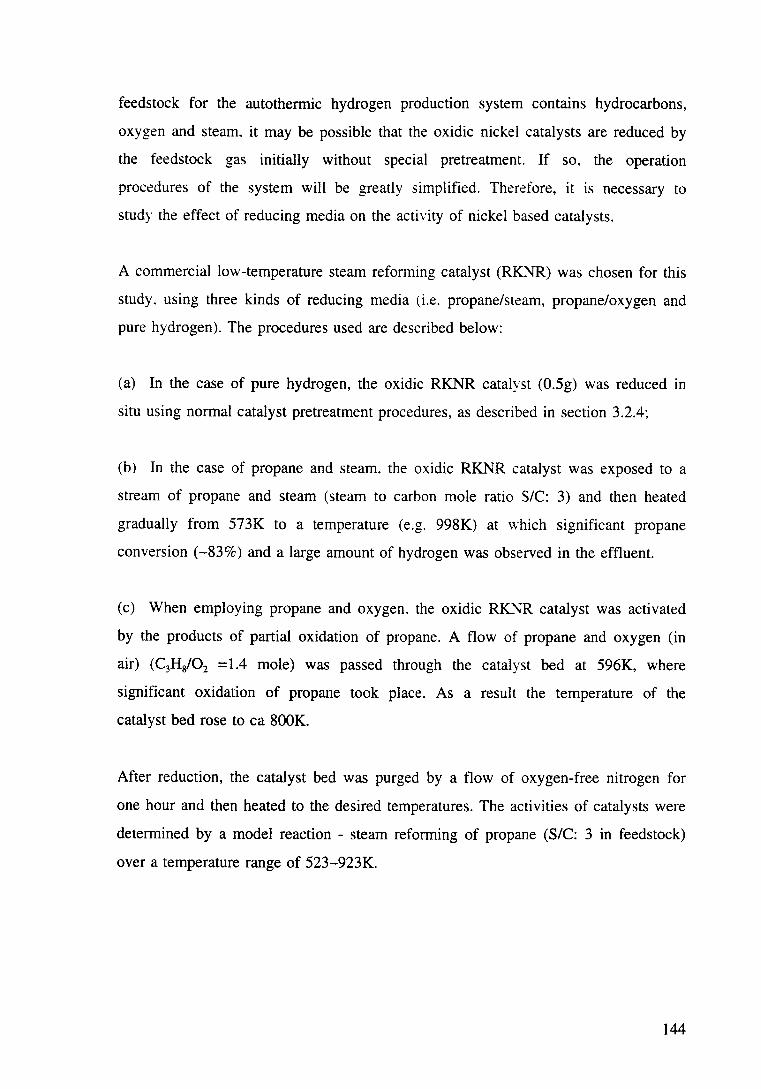
feedstock for the autothermic hydrogen production system contains hydrocarbons,
oxygen and steam. it may be possible that the oxidic nickel catalysts are reduced by
the feedstock gas initially without special pretreatment. If so. the operation
procedures of the system will be greatly simplified. Therefore, it is necessary to
study the effect of reducing media on the activity of nickel based catalysts.
A commercial low-temperature steam reforming catalyst (RK..\JR) was chosen for this
study. using three kinds of reducing media (i.e. propane/steam, propane/oxygen and
pure hydrogen). The procedures used are described below:
(a) In the case of pure hydrogen, the oxidic RKNR catalyst (0.5g) was reduced in
situ using normal catalyst pretreatment procedures, as described in section 3.2.4;
(b) In the case of propane and steam. the oxidic RKNR catalyst was exposed to a
stream of propane and steam (steam to carbon mole ratio S/C: 3) and then heated
gradually from 573K to a temperature (e.g. 998K) at which significant propane
conversion (-83%) and a large amount of hydrogen was observed in the effluent.
(c) When employing propane and oxygen, the oxidic RK."\;R catalyst was activated
by the products of partial oxidation of propane. A flow of propane and oxygen (in
air) (C3H8/02 =1.4 mole) was passed through the catalyst bed at 596K, where
significant oxidation of propane took place. As a result the temperature of the
catalyst bed rose to ea 800K.
After reduction, the catalyst bed was purged by a flow of oxygen-free nitrogen for
one hour and then heated to the desired temperatures. The activities of catalysts were
determined by a model reaction - steam reforming of propane (S/C: 3 in feedstock)
over a temperature range of 523-923K.
144
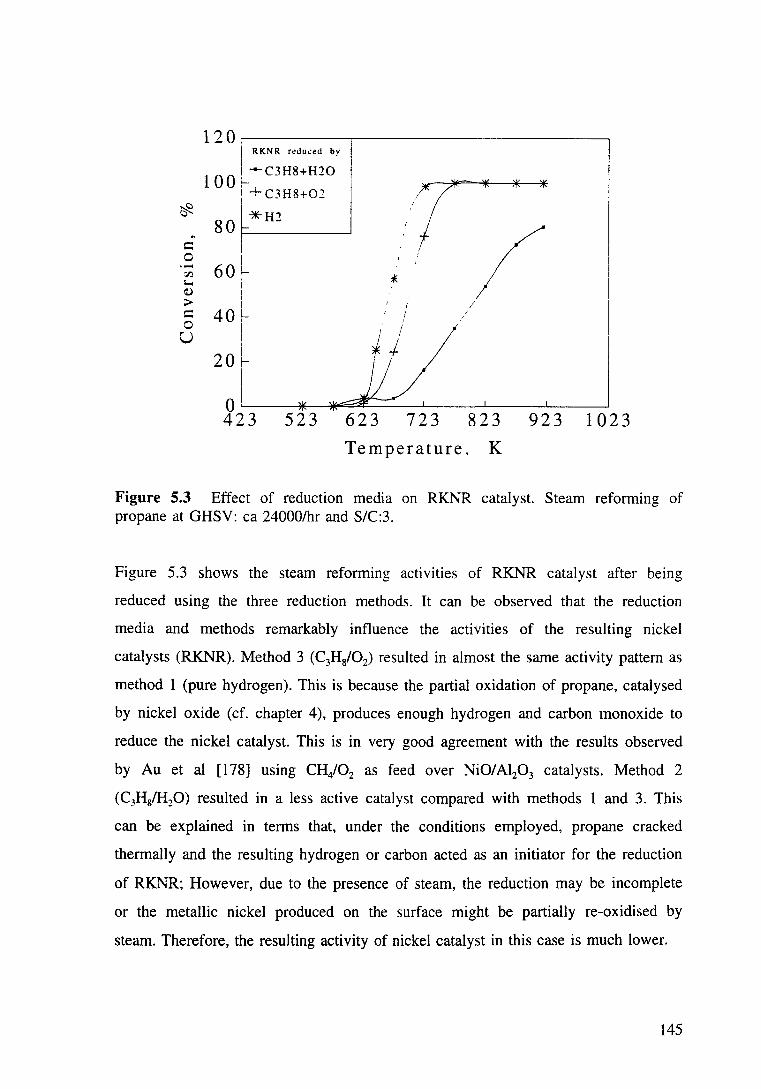
~
c 0 c:JJ 1-. Q)
> c 0 u
120,~------~--------------------~ I RKNR redu~ed by
1 0 0 L--- C3H8+H20
: +c3H8+02
I *H" 80 ~ -
i I
60 L i i
40 L
20
' ' ' ' I I
* -i
Temperature. K
923 1023
Figure 5.3 Effect of reduction media on RKNR catalyst. Steam reforming of propane at GHSV: ea 24000/hr and S/C:3.
Figure 5.3 shows the steam reforming activities of RKNR catalyst after being
reduced using the three reduction methods. It can be observed that the reduction
media and methods remarkably influence the activities of the resulting nickel
catalysts (RKNR). Method 3 (C3H8/02) resulted in almost the same activity pattern as
method 1 (pure hydrogen). This is because the partial oxidation of propane, catalysed
by nickel oxide (cf. chapter 4), produces enough hydrogen and carbon monoxide to
reduce the nickel catalyst. This is in very good agreement with the results observed
by Au et al [178] using CHi02 as feed over NiO/ Al20 3 catalysts. Method 2
(C3HsfH:P) resulted in a less active catalyst compared with methods 1 and 3. This
can be explained in terms that, under the conditions employed, propane cracked
thermally and the resulting hydrogen or carbon acted as an initiator for the reduction
of RKNR; However, due to the presence of steam, the reduction may be incomplete
or the metallic nickel produced on the surface might be partially re-oxidised by
steam. Therefore, the resulting activity of nickel catalyst in this case is much lower.
145
From Figure 5.3. it can be also seen that the nickel based catalysts can be directly
activated by the feedstock (ie. hydrocarbon-oxygen-steam) for the autothermic system
at the beginning of the operation. provided that the temperature of the bed can be
increased to 800K.
5.3.1.3 Effect of Steam Treatment on The Activity of Platinum Based Catalysts
at High Temperatures
The presence of steam at high temperatures may result in sintering of active catalyst
surfaces and, as a result, accelerate catalyst deactivation. Such effects have been
described by many researchers [ 10.97 ,98,119 .179]. In the process of steam reforming
of hydrocarbons, although carbon formation is the main reason for catalyst
deactivation, sintering may also occur. In order to study the influence of steam on the
catalyst activity, the effect of steam on both freshly reduced and used Pt/o-A120 3
catalysts has been studied.
A certain amount of freshly reduced or used Pt/o-Al20 3 was treated by steam (18
ml(water)/hr) at 8.23K and 973K for 3 hours. Activity was then measured for ethane
steam reforming under standard conditions and compared with untreated fresh
catalysts. Table 5.5 lists the results.
Table 5.5 Comparison of steam reforming activities of steam treated (at 823K) and
untreated freshly reduced catalysts
Reaction temperature Ethane conversion, mol%
K Fresh Pt/o-Al20 3 Steam treated Pt/o-Al20 3
623 0.47 0.34
673 0.94 0.70
723 1.18 1.54
773 3.17 2.98
823 10.43 5.78
146
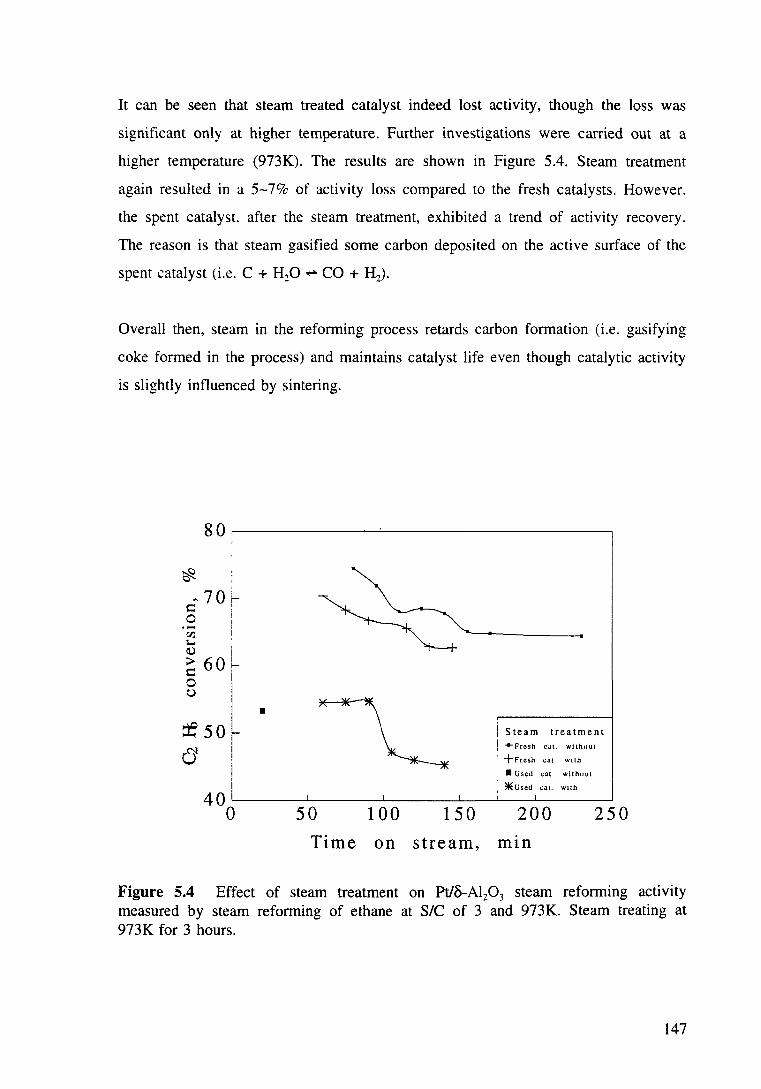
It can be seen that steam treated catalyst indeed lost activity, though the loss was
significant only at higher temperature. Further investigations were carried out at a
higher temperature (973K). The results are shown in Figure 5.4. Steam treatment
again resulted in a 5-7% of activity loss compared to the fresh catalysts. However.
the spent catalyst. after the steam treatment, exhibited a trend of activity recovery.
The reason is that steam gasified some carbon deposited on the active surface of the
spent catalyst (i.e. C + H20 """' CO + H2).
Overall then, steam in the reforming process retards carbon formation (i.e. gasifying
coke formed in the process) and maintains catalyst life even though catalytic activity
is slightly influenced by sintering.
80~. ----------~~----------------~
~ '
~ 70 ~ = i 0 : I
~ I
~ 6o L 0 ! u I
=e 50 l CJ I
I
• j Steam treatment I .... Fresh cat. without
' +Fresh cat wtth
• Used cat without
*Used car. wtth
40~----~----~------~~--~----~ 0 50 100 150 200 250
Time on stream, m1n
Figure 5.4 Effect of steam treatment on Pt/o-Al20 3 steam reforming activity measured by steam reforming of ethane at SIC of 3 and 973K. Steam treating at 973K for 3 hours.
147
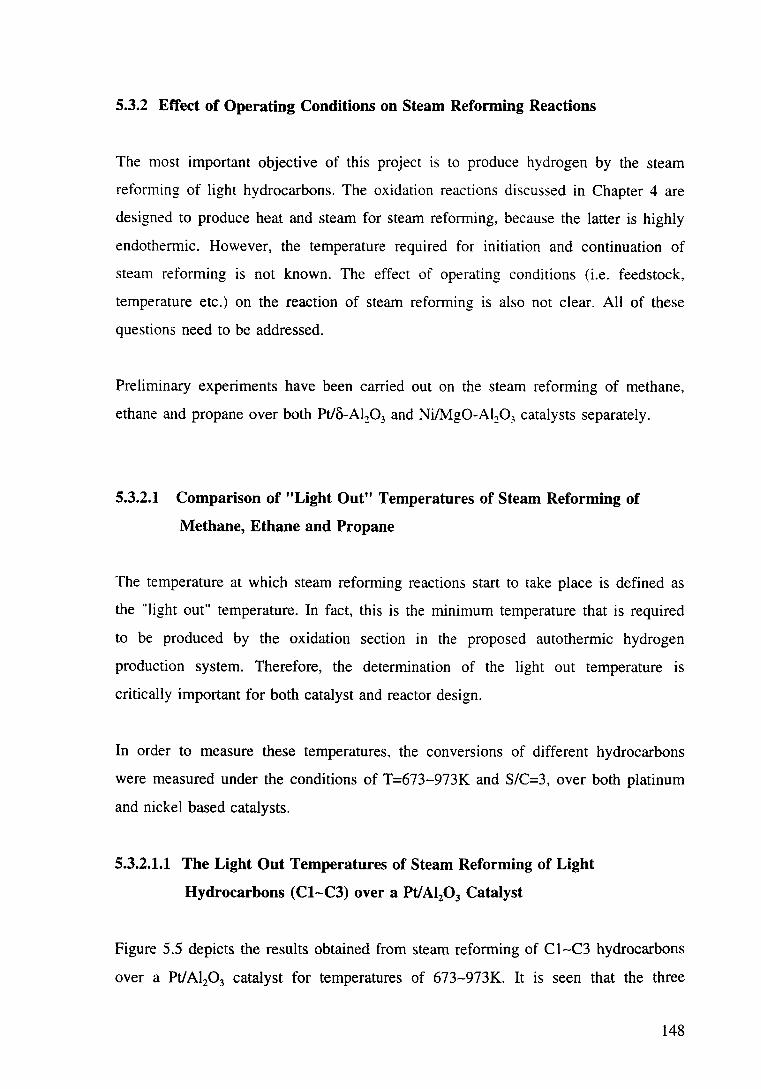
5.3.2 Effect of Operating Conditions on Steam Reforming Reactions
The most important objective of this project is to produce hydrogen by the steam
reforming of light hydrocarbons. The oxidation reactions discussed in Chapter 4 are
designed to produce heat and steam for steam refom1ing, because the latter is highly
endothermic. However, the temperature required for initiation and continuation of
steam reforming is not known. The effect of operating conditions (i.e. feedstock,
temperature etc.) on the reaction of steam reforming is also not clear. All of these
questions need to be addressed.
Preliminary experiments have been carried out on the steam reforming of methane,
ethane and propane over both Pt/<5-Al:P3 and Ni/Mg0-Al:P3 catalysts separately.
5.3.2.1 Comparison of "Light Out" Temperatures of Steam Reforming of
Methane, Ethane and Propane
The temperature at which steam reforming reactions start to take place is defined as
the "light out" temperature. In fact, this is the minimum temperature that is required
to be produced by the oxidation section in the proposed autothermic hydrogen
production system. Therefore, the determination of the light out temperature is
critically important for both catalyst and reactor design.
In order to measure these temperatures, the conversions of different hydrocarbons
were measured under the conditions of T=673-973K and S/C=3, over both platinum
and nickel based catalysts.
5.3.2.1.1 The Light Out Temperatures of Steam Reforming of Light
Hydrocarbons (Cl-C3) over a Pt/Al20 3 Catalyst
Figure 5.5 depicts the results obtained from steam reforming of Cl-C3 hydrocarbons
over a Pt/Al20 3 catalyst for temperatures of 673-973K. It is seen that the three
148
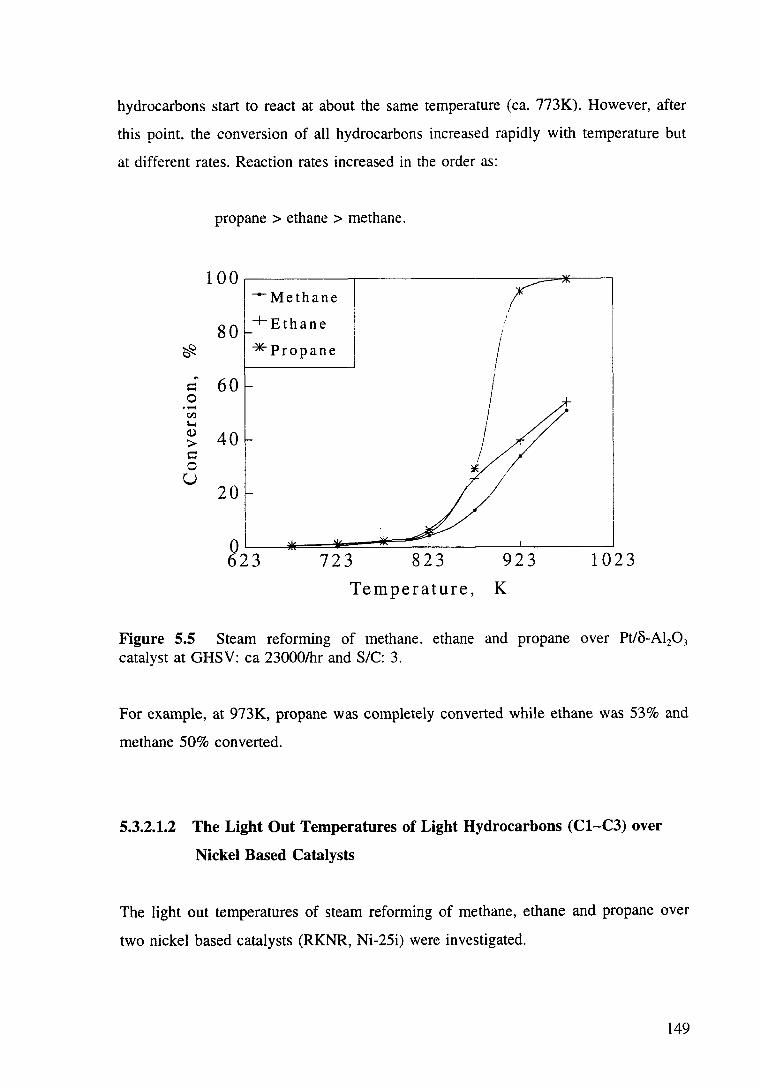
hydrocarbons start to react at about the same temperature (ea. 773K). However, after
this point, the conversion of all hydrocarbons increased rapidly with temperature but
at different rates. Reaction rates increased in the order as:
propane >ethane >methane.
100 ---Methane
+Ethane I
80 /
I ~ *Propane i
~
60 = 0 ·-CJ:)
1-o Cl)
40 r > = 0
20 ~ u
!
0 623 723 823 923 1023
Temperature, K
Figure 5.5 Steam reforming of methane. ethane and propane over Pt/o-Al20 3
catalyst at GHSV: ea 23000/hr and SIC: 3.
For example, at 973K, propane was completely converted while ethane was 53% and
methane 50% converted.
5.3.2.1.2 The Light Out Temperatures of Light Hydrocarbons (Cl-C3) over
Nickel Based Catalysts
The light out temperatures of steam reforming of methane, ethane and propane over
two nickel based catalysts (RKNR, Ni-25i) were investigated.
149
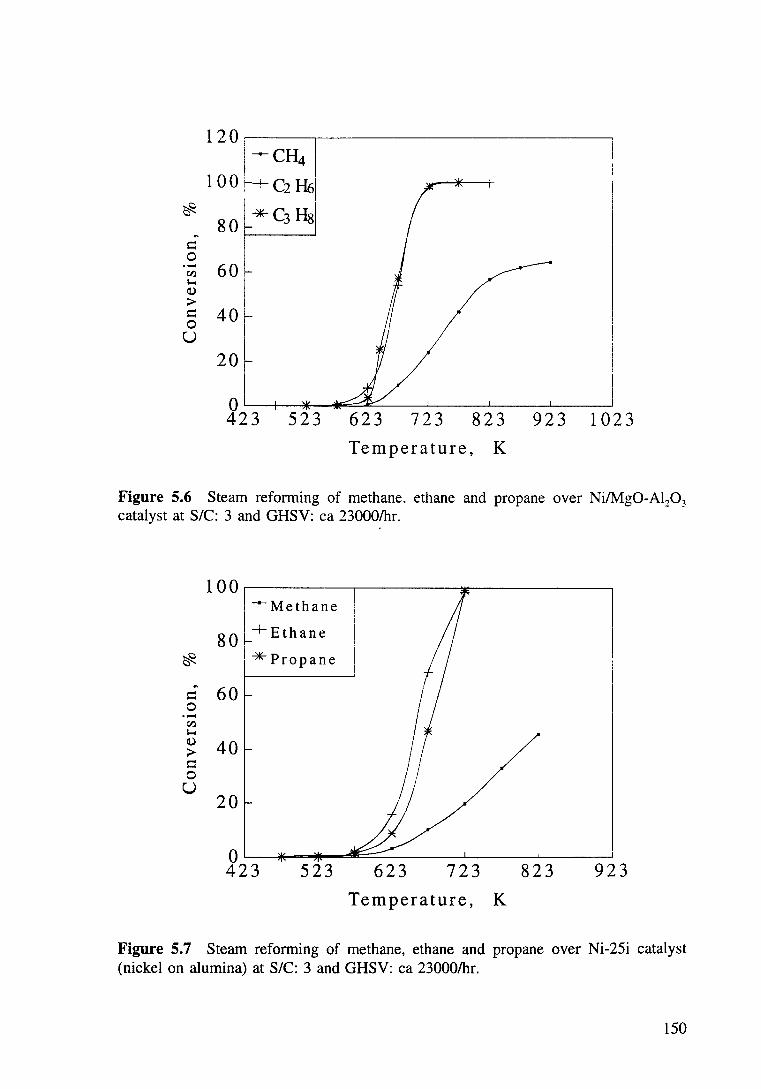
120, I I--CH4 I
1 oo ;+c2 &I ~
80 t *-C3 Hsl ~
= 0 c:ll 60. ;...,
I Q)
> = 40t 0 u
20, I I
0 423 523 623 723 823 923 1023
Temperature, K
Figure 5.6 Steam reforming of methane. ethane and propane over Ni/Mg0-Al20 3
catalyst at SIC: 3 and GHSV: ea 23000/hr.
100 ---Methane
80 +Ethane I
~ 1 *Propane
~
60 = 0 ·-c:ll ;..., Q) 40 > = 0 u
20
Temperature, K
Figure 5.7 Steam reforming of methane, ethane and propane over Ni-25i catalyst (nickel on alumina) at SIC: 3 and GHSV: ea 23000/hr.
150
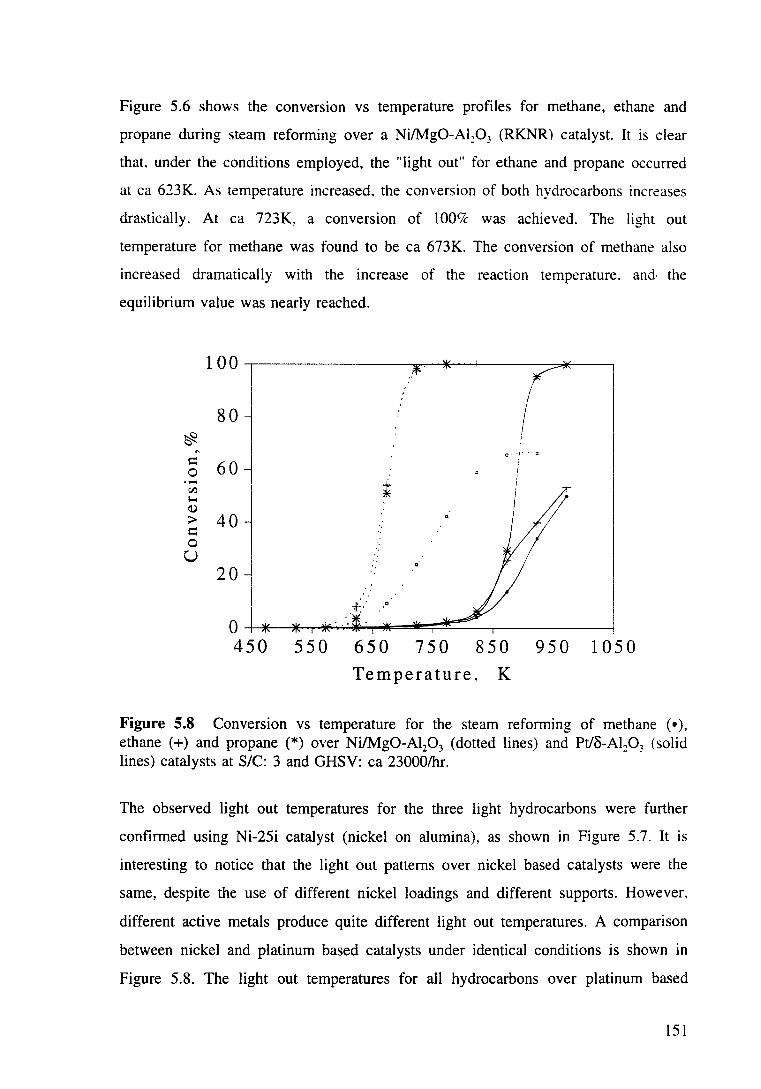
Figure 5.6 shows the conversion vs temperature profiles for methane, ethane and
propane during steam reforming over a Ni/Mg0-Al,:03 (RKNR) catalyst. It is clear
that. under the conditions employed, the "light out" for ethane and propane occurred
at ea 623K. As temperature increased. the conversion of both hydrocarbons increases
drastically. At ea 723K, a conversion of lOOCk was achieved. The light out
temperature for methane was found to be ea 673K. The conversion of methane also
increased dramatically with the increase of the reaction temperature. and· the
equilibrium value was nearly reached.
100 " ..
80 ~
~
= 60 0 ·- i 00 I 1-o
40 ~ Q)
;>
= 0 u I
20 ~ I
I 0 450 550 650 750 850 950 1050
Temperature, K
Figure 5.8 Conversion vs temperature for the steam reforming of methane ( • ), ethane (+) and propane (*) over Ni/Mg0-Al20 3 (dotted lines) and Pt/o-Al20 3 (solid lines) catalysts at S/C: 3 and GHSV: ea 23000/hr.
The observed light out temperatures for the three light hydrocarbons were further
confirmed using Ni-25i catalyst (nickel on alumina), as shown in Figure 5.7. It is
interesting to notice that the light out patterns over nickel based catalysts were the
same, despite the use of different nickel loadings and different supports. However,
different active metals produce quite different light out temperatures. A comparison
between nickel and platinum based catalysts under identical conditions is shown in
Figure 5.8. The light out temperatures for all hydrocarbons over platinum based
151
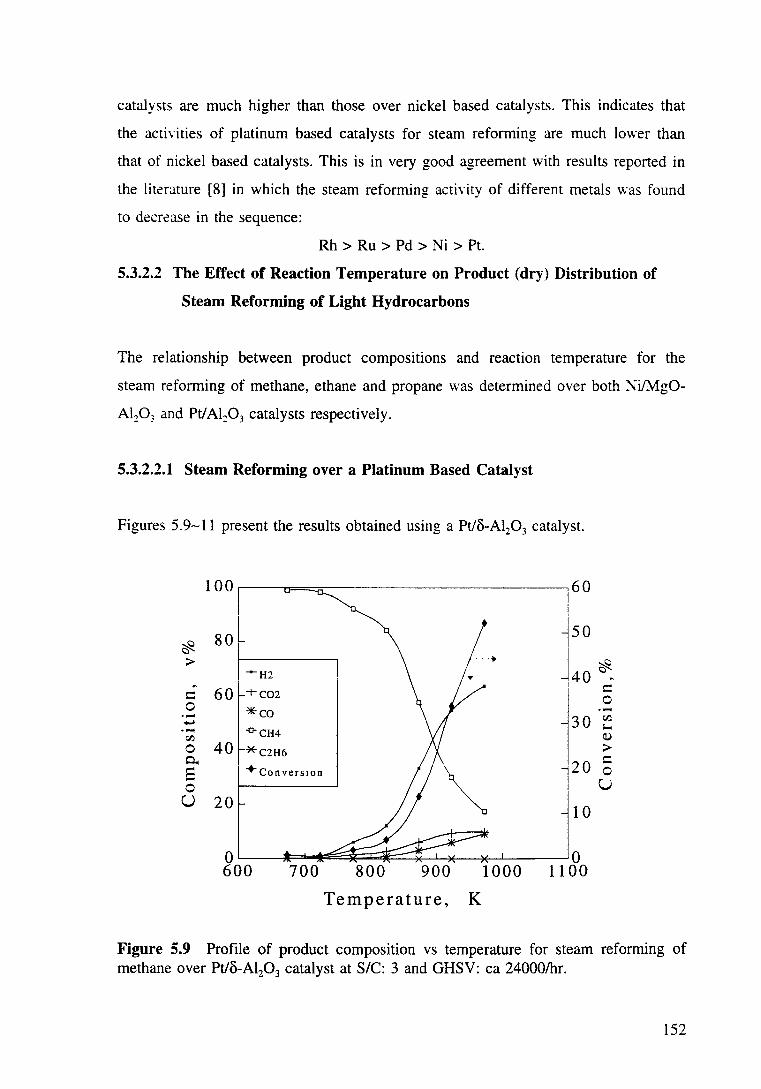
catalysts are much higher than those over nickel based catalysts. This indicates that
the activities of platinum based catalysts for steam reforming are much lower than
that of nickel based catalysts. This is in very good agreement with results reported in
the literature [8] in which the steam reforming activity of different metals was found
to decrease in the sequence:
Rh > Ru > Pd > Ni > Pt.
5.3.2.2 The Effect of Reaction Temperature on Product (dry) Distribution of
Steam Reforming of Light Hydrocarbons
The relationship between product compositions and reaction temperature for the
steam reforming of methane, ethane and propane was determined over both ~i/Mg0-
Al::P3 and Pt/Al20 3 catalysts respectively.
5.3.2.2.1 Steam Reforming over a Platinum Based Catalyst
Figures 5.9-11 present the results obtained using a Pt/o-Al20 3 catalyst.
100 160 i
I I
~ 801- l50
I
I ~ > I-H2
..... __j40 ~
~
60 I C
= -t-coz 0 0 *eo ·- 30 tZl ..... 1-o ·- -o-CH4
tZl ~
0 40 *c2H6 > 0.. 20 5 8 +converston
0 u u 20 10
0 0 600 700 800 900 1000 1100
Temperature, K
Figure 5.9 Profile of product composition vs temperature for steam reforming of methane over Pt/o-Al20 3 catalyst at S/C: 3 and GHSV: ea 24000/hr.
152
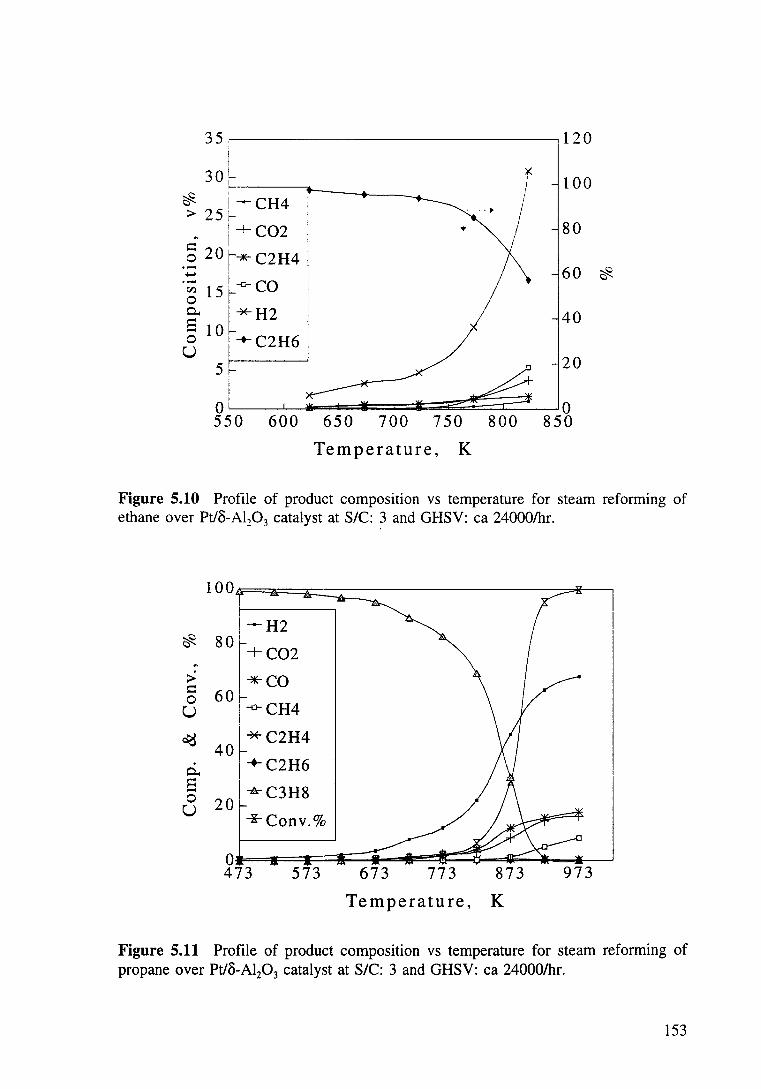
35~. -----------------------------~120 i I
30 L I
c ~~~~~~--~----~ ~ ! ---- CH4 I > 25 f-
!+C02 ~ I
s::: .g 20r*C2H4
. ~ 1 5 ~-fro CO
0.. I *"H2
§ 1 O k.._ C2H6 ' u:F 550 600
. . . ~
•
I
I I
650 700 750 800
Temperature, K
100
80
60 ~
40
20
0 850
Figure 5.10 Profile of product composition vs temperature for steam reforming of ethane over Pt/8-Al20 3 catalyst at S/C: 3 and GHSV: ea 24000/hr.
~ ~
> s::: 0 u
c<3
0.. E 0 u
100
I --H2
80 I +C02
*CO 60 f-
1-o- CH4
~ *C2H4 40 +C2H6
20 -l1r- C3H8
~Conv.%
573 673 773
Temperature,
873
K
973
Figure 5.11 Profile of product composition vs temperature for steam reforming of propane over Pt/8-Al20 3 catalyst at S/C: 3 and GHSV: ea 24000/hr.
153
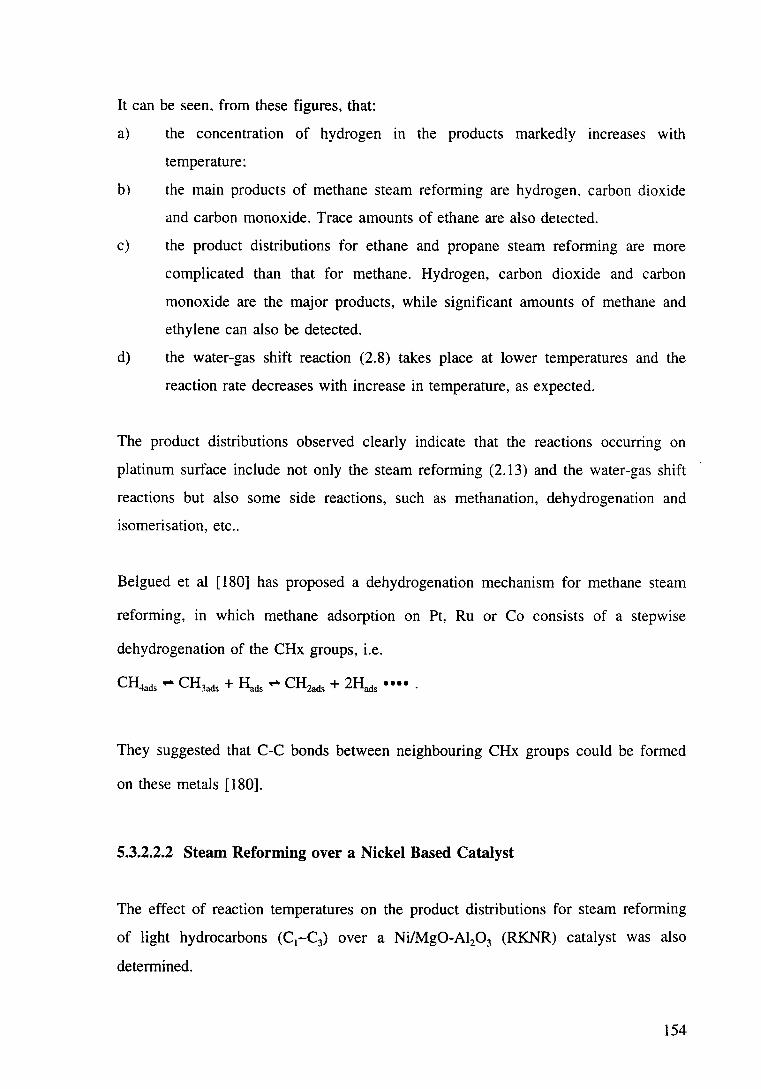
It can be seen. from these figures, that:
a) the concentration of hydrogen in the products markedly increases with
temperature:
b) the main products of methane steam reforming are hydrogen. carbon dioxide
and carbon monoxide. Trace amounts of ethane are also detected.
c) the product distributions for ethane and propane steam reforming are more
complicated than that for methane. Hydrogen, carbon dioxide and carbon
monoxide are the major products, while significant amounts of methane and
ethylene can also be detected.
d) the water-gas shift reaction (2.8) takes place at lower temperatures and the
reaction rate decreases with increase in temperature, as expected.
The product distributions observed clearly indicate that the reactions occurring on
platinum surface include not only the steam reforming (2.13) and the water-gas shift
reactions but also some side reactions, such as methanation, dehydrogenation and
isomerisation, etc ..
Belgued et al [180] has proposed a dehydrogenation mechanism for methane steam
reforming, in which methane adsorption on Pt, Ru or Co consists of a stepwise
dehydrogenation of the CHx groups, i.e.
CH4ads .. CH3ads + Hads .. CH2ads + 2Hads • • • • ·
They suggested that C-C bonds between neighbouring CHx groups could be formed
on these metals [180].
5.3.2.2.2 Steam Reforming over a Nickel Based Catalyst
The effect of reaction temperatures on the product distributions for steam reforming
of light hydrocarbons (C1-C3) over a Ni/Mg0-Al20 3 (RKNR) catalyst was also
determined.
154
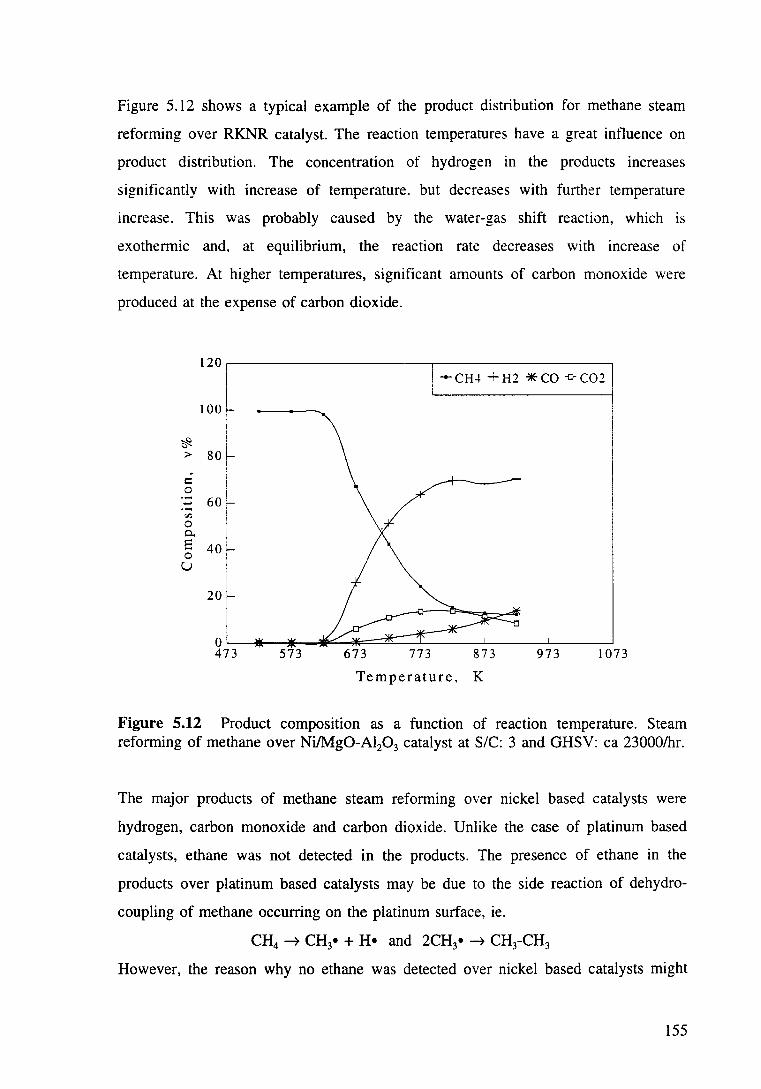
Figure 5.12 shows a typical example of the product distribution for methane steam
reforming over RKNR catalyst. The reaction temperatures have a great influence on
product distribution. The concentration of hydrogen in the products increases
significantly with increase of temperature. but decreases with further temperature
increase. This was probably caused by the water-gas shift reaction, which 1s
exothermic and. at equilibrium, the reaction rate decreases with increase of
temperature. At higher temperatures, significant amounts of carbon monoxide were
produced at the expense of carbon dioxide.
120 [
100 i
~ I > 80 ~ . c:
6+ 0
"' 0 0.. i E
40 r 0 u
I
20 ~
I 0 473 573
1--CH-l- +H2 '*-CO -o-co2J
673 773 873
Temperature, K
973 1073
Figure 5.12 Product composition as a function of reaction temperature. Steam reforming of methane over Ni/Mg0-Al20 3 catalyst at S/C: 3 and GHSV: ea 23000/hr.
The major products of methane steam reforming over nickel based catalysts were
hydrogen, carbon monoxide and carbon dioxide. Unlike the case of platinum based
catalysts, ethane was not detected in the products. The presence of ethane in the
products over platinum based catalysts may be due to the side reaction of dehydro
coupling of methane occurring on the platinum surface, ie.
CH4 ~ CH3• + H• and 2CH3•--? CH3-CH3
However, the reason why no ethane was detected over nickel based catalysts might
155
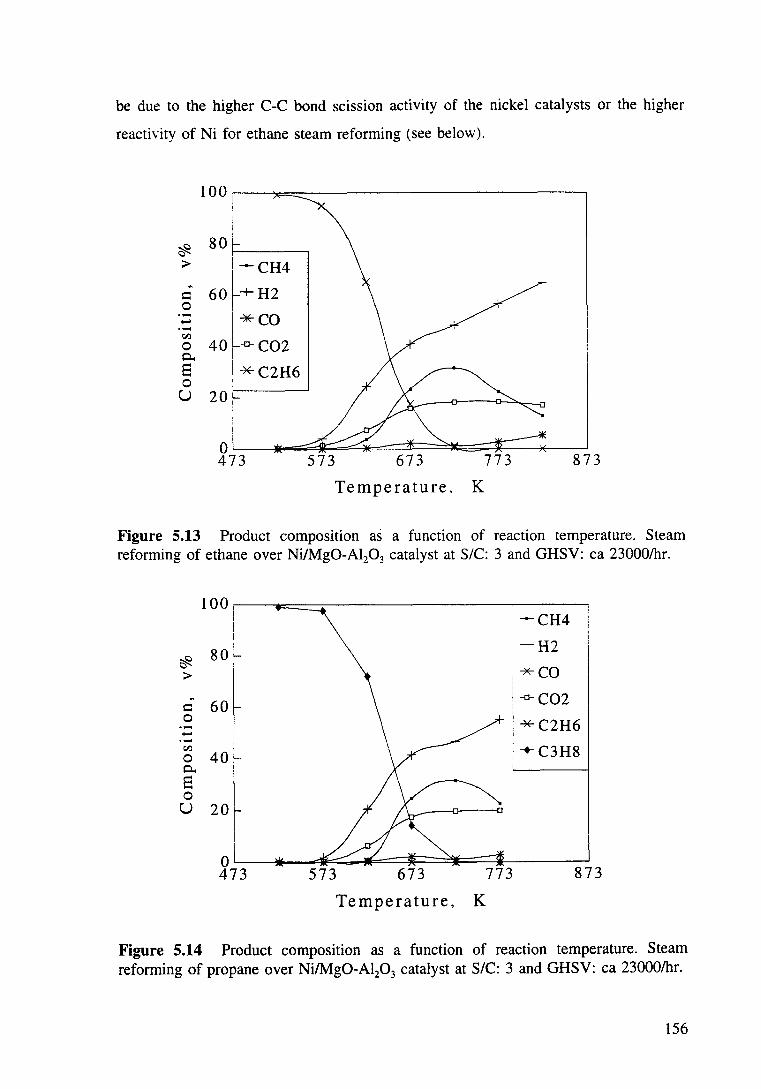
be due to the higher C-C bond scission activity of the nickel catalysts or the higher
reactivity of Ni for ethane steam reforming (see below).
100~1 ----~----------------------------~ ! ' i
80 1-------,
f --CH4
g 60~/ +H2 ...... *CO ·-r'-l o 40 ,.a- C02 0..
s I *C2H6 0 u 20
I I
i OIL_ __ *-~~~~==~~~~~~~-*--~ 473 573 673 773 873
Temperature. K
Figure 5.13 Product composition a5 a function of reaction temperature. Steam reforming of ethane over Ni/Mg0-Al20 3 catalyst at S/C: 3 and GHSV: ea 23000/hr.
100, I -CH4 I I I
i
80 ;___ -H2 ~
60~ *CO >
~ -o- C02 I: 0 , *C2H6 .... I I
r'-l :-+- C3H8 0 40 0.. '
8 0 u 20
0 473 573 673 773 873
Temperature, K
Figure 5.14 Product composition as a function of reaction temperature. Steam reforming of propane over Ni/Mg0-Al20 3 catalyst at S/C: 3 and GHSV: ea 23000/hr.
156
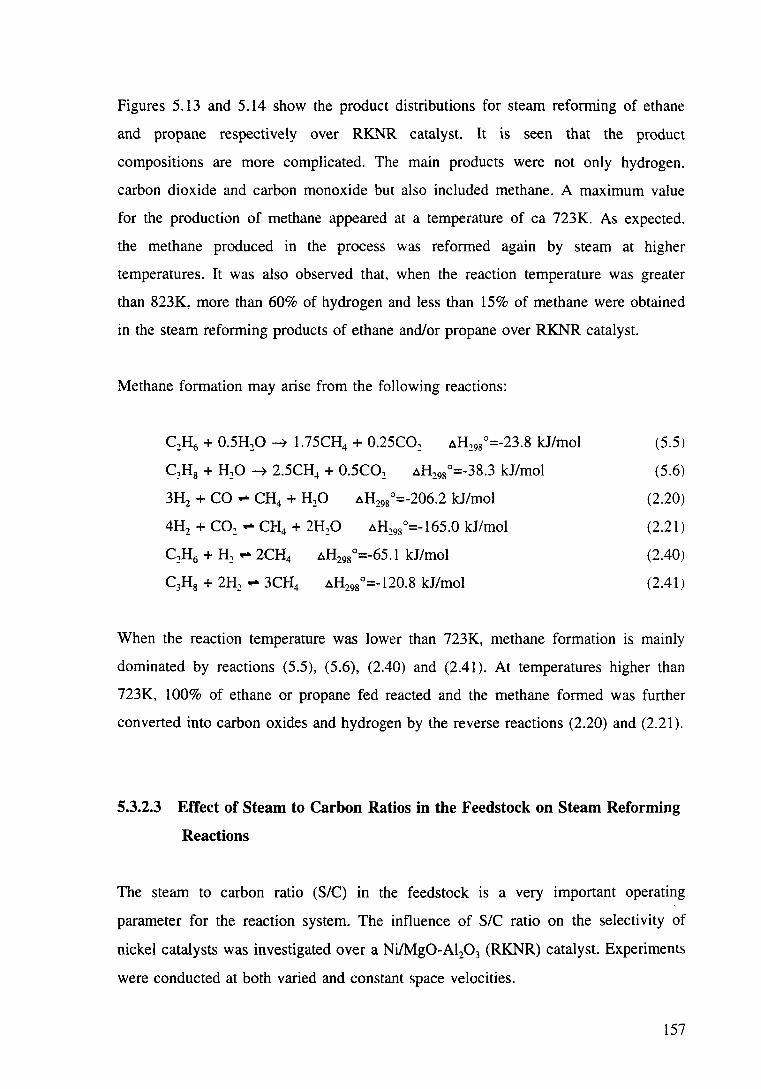
Figures 5.13 and 5.14 show the product distributions for steam reforming of ethane
and propane respectively over RKNR catalyst. It is seen that the product
compositions are more complicated. The main products were not only hydrogen.
carbon dioxide and carbon monoxide but also included methane. A maximum value
for the production of methane appeared at a temperature of ea 723K. As expected.
the methane produced in the process was reformed again by steam at higher
temperatures. It was also observed that, when the reaction temperature was greater
than 823K, more than 60% of hydrogen and less than 15% of methane were obtained
in the steam reforming products of ethane and/or propane over RKNR catalyst.
Methane formation may arise from the following reactions:
C~H6 + 0.5H:P ~ 1.75CH4 + 0.25C02 aH298 °=-23.8 kJ/mol
C3H8 + H20 ~ 2.5CH~ + 0.5C02 aH298 °=-38.3 kJ/mol
3H2 + CO .... CH4 + H20 aH298 °=-206.2 kJ/mol
C2H6 + H2 .... 2CH4 aH298 °=-65.1 kJ/mol
C3H8 + 2H2 .... 3CH4 aH298°=-120.8 kJ/mol
(5.5)
(5.6)
(2.20)
(2.21)
(2.40)
(2.41)
When the reaction temperature was lower than 723K, methane formation is mainly
dominated by reactions (5.5), (5.6), (2.40) and (2.41). At temperatures higher than
723K, 100% of ethane or propane fed reacted and the methane formed was further
converted into carbon oxides and hydrogen by the reverse reactions (2.20) and (2.21 ).
5.3.2.3 Effect of Steam to Carbon Ratios in the Feedstock on Steam Reforming
Reactions
The steam to carbon ratio (S/C) in the feedstock is a very important operating
parameter for the reaction system. The influence of SIC ratio on the selectivity of
nickel catalysts was investigated over a Ni/Mg0-Al20 3 (RKNR) catalyst. Experiments
were conducted at both varied and constant space velocities.
157
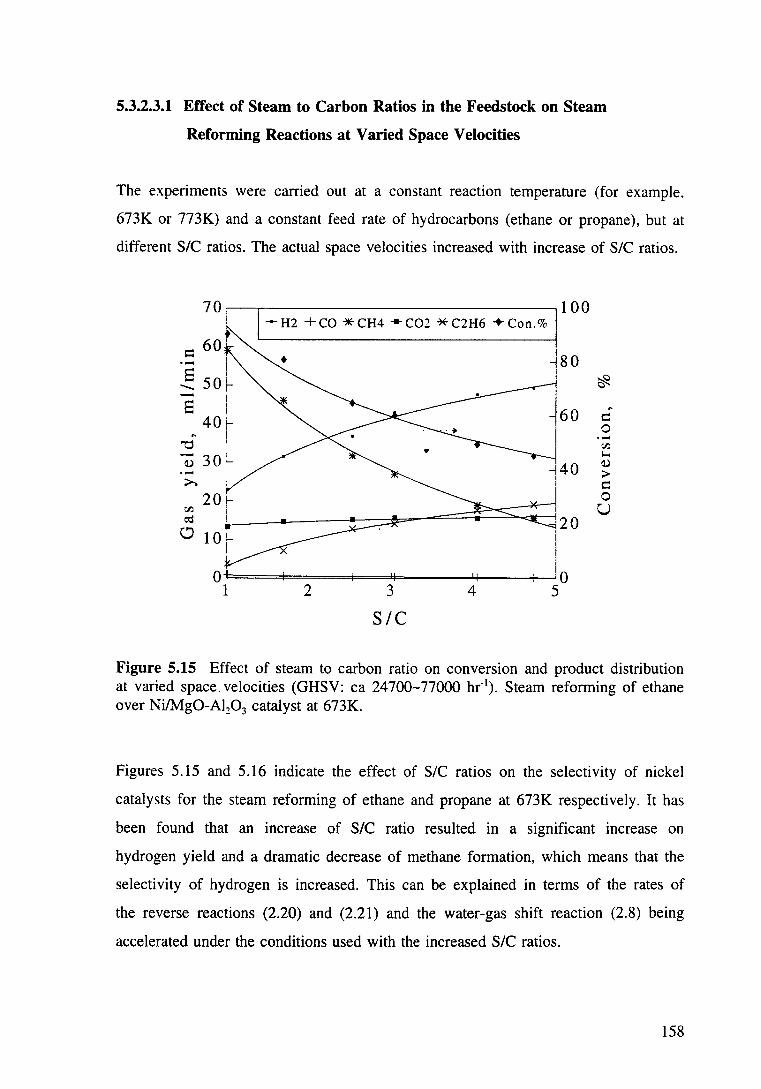
5.3.2.3.1 Effect of Steam to Carbon Ratios in the Feedstock on Steam
Reforming Reactions at Varied Space Velocities
The experiments were carried out at a constant reaction temperature (for example.
673K or 773K) and a constant feed rate of hydrocarbons (ethane or propane), but at
different SIC ratios. The actual space velocities increased with increase of SIC ratios.
70, 100 I --H2 +eo *CH4 -co2 *C2H6 +con.%
Q 60 1
..... ~50~ - ' s i
~ 4o I "'0 ' Q) 30 ~ .....
2 3
SIC
4
80
60
40
Figure 5.15 Effect of steam to carbon ratio on conversion and product distribution at varied space_ velocities (GHSV: ea 24700-77000 hr-1
). Steam reforming of ethane over Ni!Mg0-Al20 3 catalyst at 673K.
Figures 5.15 and 5.16 indicate the effect of SIC ratios on the selectivity of nickel
catalysts for the steam reforming of ethane and propane at 673K respectively. It has
been found that an increase of SIC ratio resulted in a significant increase on
hydrogen yield and a dramatic decrease of methane formation, which means that the
selectivity of hydrogen is increased. This can be explained in terms of the rates of
the reverse reactions (2.20) and (2.21) and the water-gas shift reaction (2.8) being
accelerated under the conditions used with the increased SIC ratios.
158

Expected page number 159 is not in the original print copy.
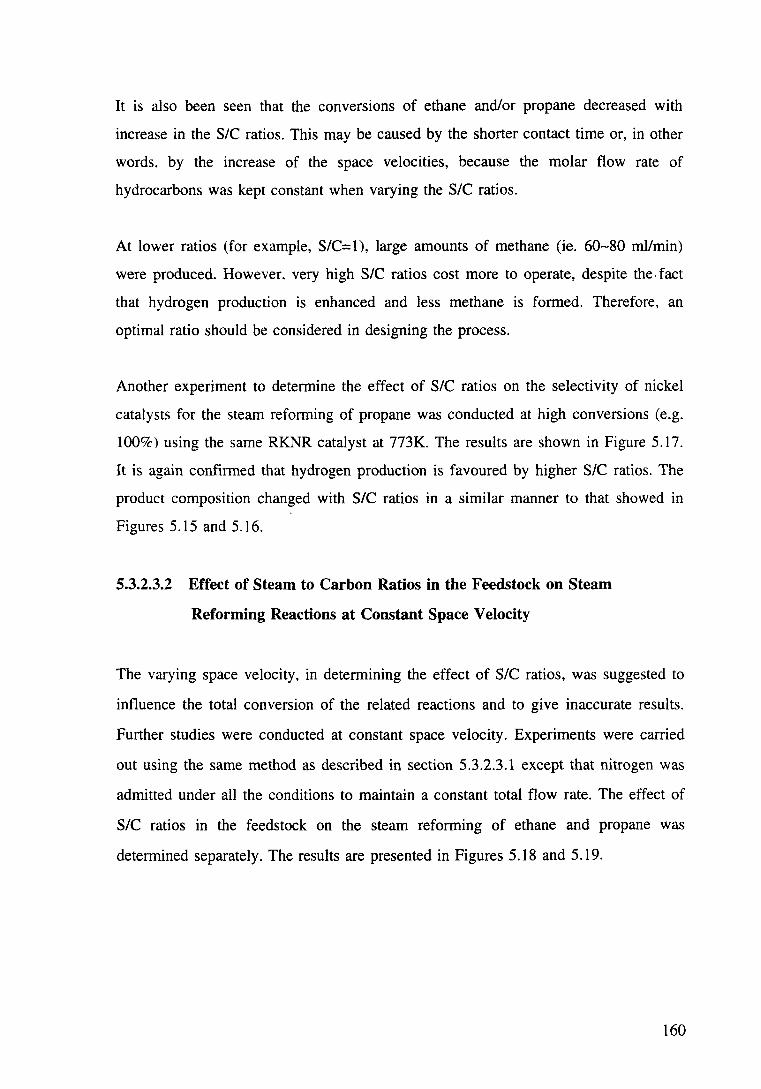
It is also been seen that the conversions of ethane and/or propane decreased with
increase in the SIC ratios. This may be caused by the shorter contact time or, in other
words. by the increase of the space velocities, because the molar flow rate of
hydrocarbons was kept constant when varying the SIC ratios.
At lower ratios (for example, SIC=l), large amounts of methane (ie. 60-80 mllmin)
were produced. However. very high SIC ratios cost more to operate, despite the. fact
that hydrogen production is enhanced and less methane is formed. Therefore, an
optimal ratio should be considered in designing the process.
Another experiment to determine the effect of SIC ratios on the selectivity of nickel
catalysts for the steam reforming of propane was conducted at high conversions (e.g.
100%) using the same RKl'l'R catalyst at 773K. The results are shown in Figure 5.17.
It is again confirmed that hydrogen production is favoured by higher SIC ratios. The
product composition changed with SIC ratios in a similar manner to that showed in
Figures 5.15 and 5.16.
5.3.2.3.2 Effect of Steam to Carbon Ratios in the Feedstock on Steam
Reforming Reactions at Constant Space Velocity
The varying space velocity, in determining the effect of SIC ratios, was suggested to
influence the total conversion of the related reactions and to give inaccurate results.
Further studies were conducted at constant space velocity. Experiments were carried
out using the same method as described in section 5.3.2.3.1 except that nitrogen was
admitted under all the conditions to maintain a constant total flow rate. The effect of
SIC ratios in the feedstock on the steam reforming of ethane and propane was
determined separately. The results are presented in Figures 5.18 and 5.19.
160
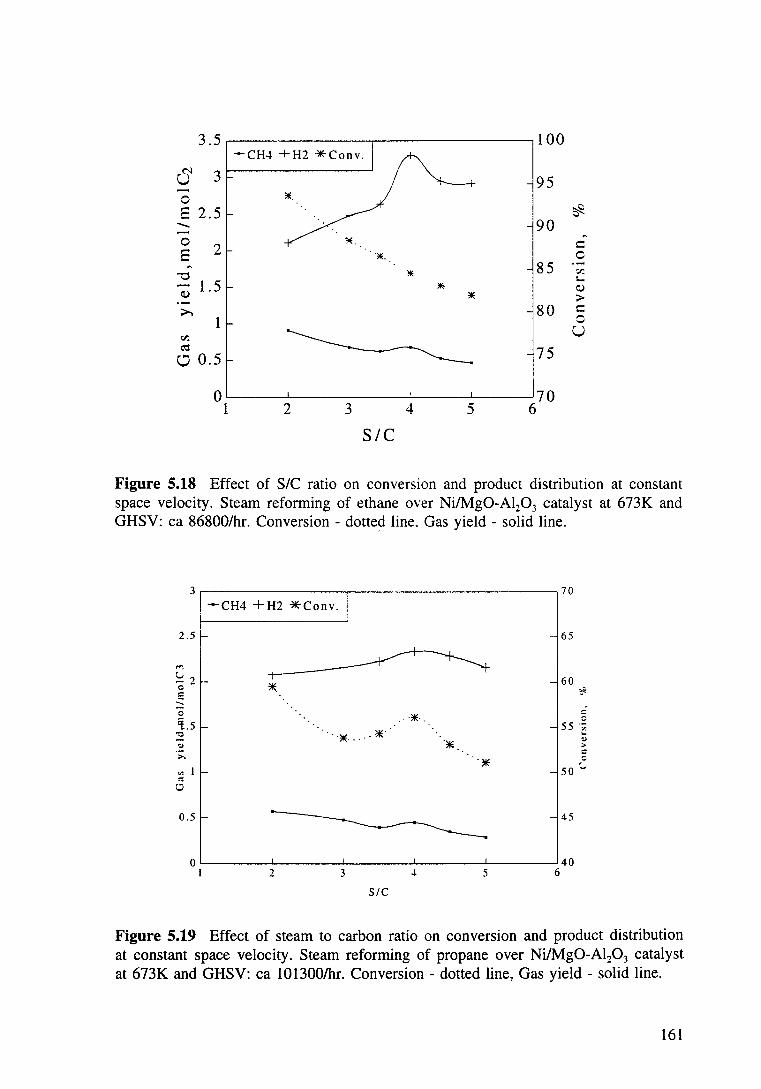
3.5 100 -CH4 +H2 ·liE-Conv.
u 3 95 0 8 2.5 ~ - 90 0
~
2 c: 8 "liE. 0 ~ 85 z "'0 * I-
Q) 1.5 * Q)
* > >-. 80 c:
1 0
z u C'\1 75 0 0.5
0 70 1 2 3 4 5 6
SIC
Figure 5.18 Effect of SIC ratio on conversion and product distribution at constant space velocity. Steam reforming of ethane over Ni/Mg0-Al20 3 catalyst at 673K and GHSV: ea 86800/hr. Conversion - dotted line. Gas yield - solid line.
3 70
1 -CH4 +H2 ·*Conv.
2.5 ~ 65 !
"" u 2 60 0 * ~ E --0 . *· .: 'i.5
0 55 ·;;;
~ . )lE- . - .. ~IC ... )lE " " >
::: >.
"* 0
"' I 50 u ::s 0
0.5 45
0 40 I 2 3 ~ 5 6
SIC
Figure 5.19 Effect of steam to carbon ratio on conversion and product distribution at constant space velocity. Steam reforming of propane over Ni/Mg0-Al20 3 catalyst at 673K and GHSV: ea 10 1300/hr. Conversion - dotted line, Gas yield - solid line.
161
As the ratio increased, the selectivity to hydrogen increased and to methane
decreased. This again indicates that an increase in the steam to carbon ratio (SIC) in
the feed accelerates the steam reforming reaction while retarding the methanation rate
during steam reforming of higher hydrocarbons. An optimal ratio, which resulted in a
maximum hydrogen yield, appeared at a SIC ratio of 4 in the steam reforming of
both ethane and propane. Below this point, ratio increases favoured hydrogen
production, because the significant increase of water inhibited the methanation
reaction; Above this point, hydrogen yield declined with further increase of the SIC
ratios due to the significant decrease of total conversion: the methanation rate was
still depressed.
The conversion of ethane dropped with the rise of SIC ratios, which is similar to the
result indicated in Figure 5.15. However, the extent is different. For example, when
the ratio was increased from 2 to 5, the loss of conversion in the case of varying
space velocity (Figure 5.15) is about 35%, compared to ea 13% in the case of
constant space velocity. The difference between the two operations mainly results
from the shortened contact time due to the increase of space velocities.
The effect of SIC ratios on conversion of propane seems to be different. At lower
ratios (ie. S/C=2), high conversion but low hydrogen selectivity were observed. The
reactions occurring under this condition might involve not only steam reforming but
also methanation. due to lack of steam. As the ratio increases, propane conversion
decreased from ea 60% to 54% and then increased slightly to ea 56%, initially
followed by further decrease in conversion. A peak value appeared at a SIC ratio of 4
corresponding to the maximum hydrogen yield. At this point, the steam reforming
rate seems to reach a maximum. The total conversion was mainly due to steam
reforming and the water-gas shift reactions, although small amounts of methane were
still observed. After this point, on continuously increasing the SIC ratio, excess of
steam might adsorb or cover catalyst active surface and result in a decrease of
conversion.
It is very clear that, when the SIC ratio m feedstock ts controlled at ea 4, the
162
maximum hydrogen yield can be obtained from steam reforming reactions. However,
the ratio of SIC employed in a commercial plant is usually lower than this value (ie.
2-3) because of the limitation of energy cost.
5.3.3 Kinetic Studies of Steam Reforming of Methane, Ethane and
Propane over Ni/Mg0-Al20 3 Catalyst
The kinetics of the steam reforming of light hydrocarbons have been the subject of
several studies [8,94,115,139,140-143,145,175.181-184]. The literature is replete with
kinetic equations for the steam reforming of methane [115, 139, 140-143, 145, 175,
180-184]. It is generally considered that the reaction is first order with respect to
methane. but the data are not conclusive on the role of steam on the reaction rate. On
the other hand, information on the kinetics of steam reforming of ethane and propane
is limited [94]. Even so, a theoretical rate expression for the steam reforming of
hydrocarbons has been recently advanced, although experimentally verification is yet
to emerge [8].
The present studies were intended to explore the kinetics of steam reforming of
methane. ethane and propane over a Ni/Mg0-Al20 3 catalyst. Attention is also focused
on comparisons between empirical (power rate law) models with the theoretical
(Langmuir-Hinshelwood) predictions.
5.3.3.1 Experimental Measurements
The influence of each reactant partial pressure on the reaction rate was explored by
keeping the partial pressure of the other eo-reactants constant during variation in the
former. Empirical power law expressions were used to model the reaction kinetics for
the steam reforming of the individual hydrocarbons (methane, ethane and propane).
Simple logarithmic transformation of the power law rate equation followed by a
linear regression analysis of the linearised expression was used to obtain estimates of
kinetic orders from the data collected (Appendix VI). The results are shown in
Figures 5.20, 21, 22. By repeating at different temperatures, the apparent activation
163
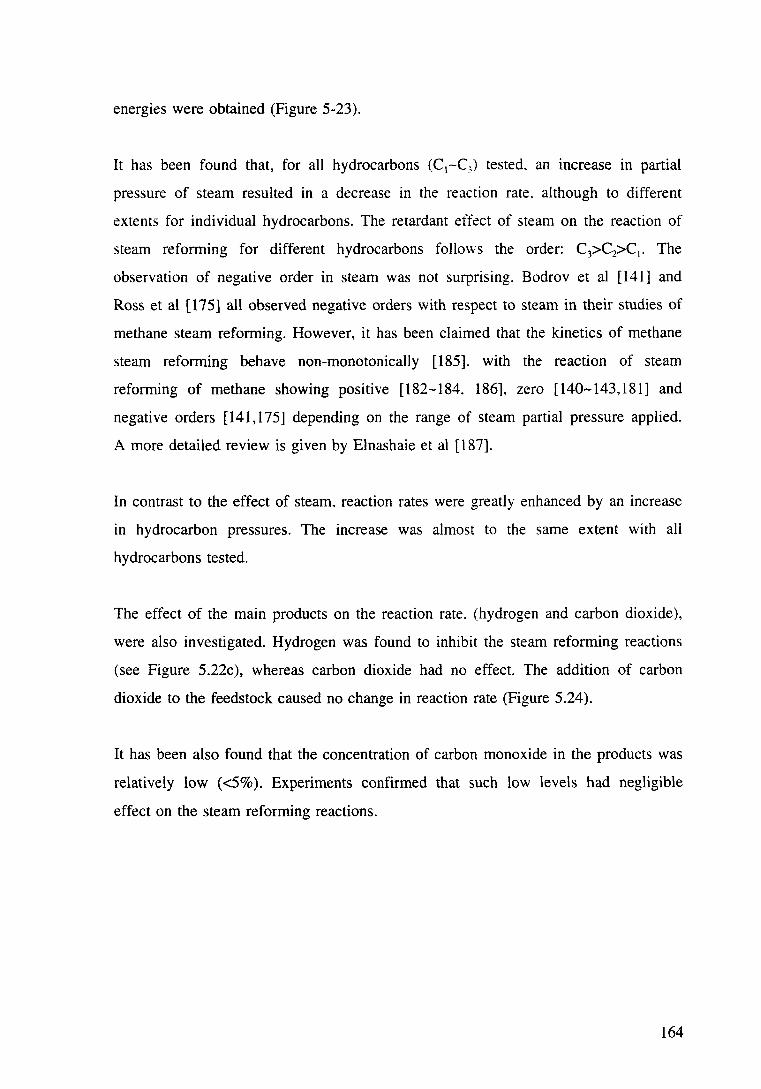
energies were obtained (Figure 5-23).
It has been found that, for all hydrocarbons (C 1-C3) tested, an increase in partial
pressure of steam resulted in a decrease in the reaction rate. although to different
extents for individual hydrocarbons. The retardant effect of steam on the reaction of
steam reforming for different hydrocarbons follo\vs the order: C3>C2>C1• The
observation of negative order in steam was not surprising. Bodrov et al [141] and
Ross et al [175] all observed negative orders with respect to steam in their studies of
methane steam reforming. However, it has been claimed that the kinetics of methane
steam reforming behave non-monotonically [185]. with the reaction of steam
reforming of methane showing positive [ 182-184. 186], zero [ 140-143,181] and
negative orders [141,175] depending on the range of steam partial pressure applied.
A more detailed review is given by Elnashaie et al [ 187).
In contrast to the effect of steam, reaction rates were greatly enhanced by an increase
in hydrocarbon pressures. The increase was almost to the same extent with all
hydrocarbons tested.
The effect of the main products on the reaction rate. (hydrogen and carbon dioxide),
were also investigated. Hydrogen was found to inhibit the steam reforming reactions
(see Figure 5.22c), whereas carbon dioxide had no effect. The addition of carbon
dioxide to the feedstock caused no change in reaction rate (Figure 5.24).
It has been also found that the concentration of carbon monoxide in the products was
relatively low ( <5% ). Experiments confirmed that such low levels had negligible
effect on the steam reforming reactions.
164
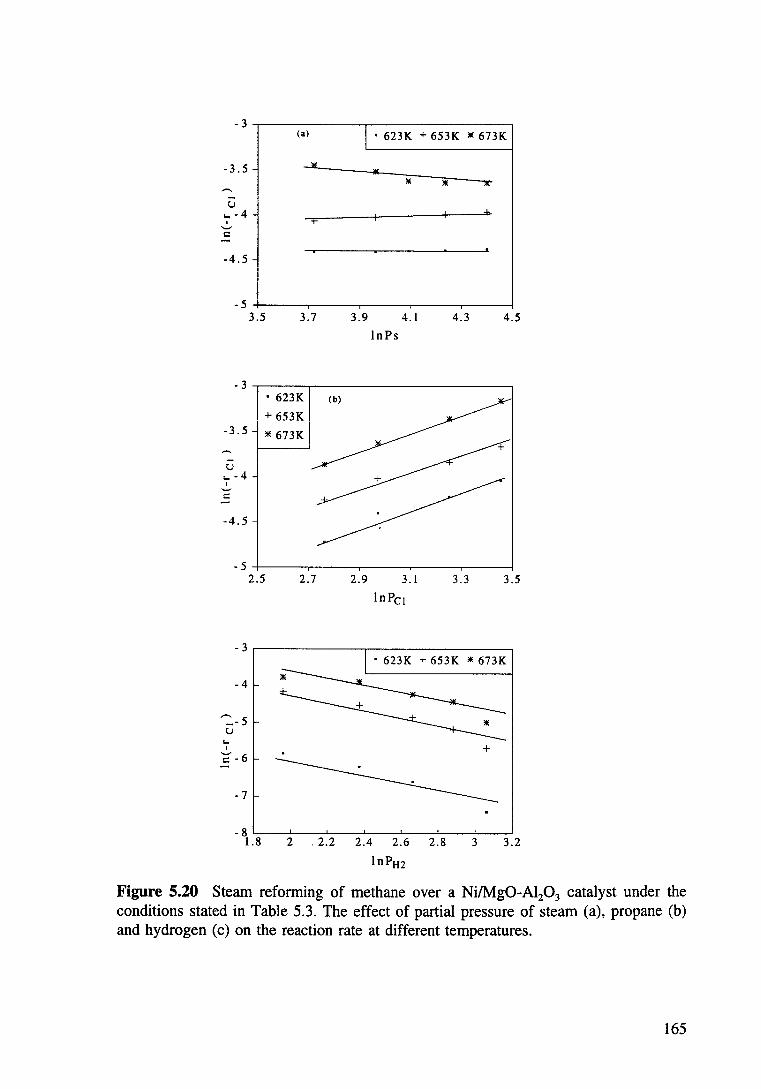
-3 (a) l • 623K + 653K * 673K
-3.5 -.llli
* liE T
u ... -4 _,b.
I
'-" c
-4.5
-5 3.5 3.7 3.9 4.1 4.3 4.5
lnPs
- 3 • 623K
+ 653K -3.5
liE 673K I -u
... -4 I
'-' c
-4.5
-5 2.5 2.7 2.9 3 .I 3.3 3.5
lnPc 1
-3.------------r--------------~
-4
~-5 u ... I
c -6
-7
• 623K T 653K liE 673K
+
-8~--L---~--~---L--~--~--~ 1.8 2 . 2.2 2.4 2.6 2.8 3 3.2
lnPH2
Figure 5.20 Steam reforming of methane over a Ni/Mg0-Al20 3 catalyst under the conditions stated in Table 5.3. The effect of partial pressure of steam (a), propane (b) and hydrogen (c) on the reaction rate at different temperatures.
165
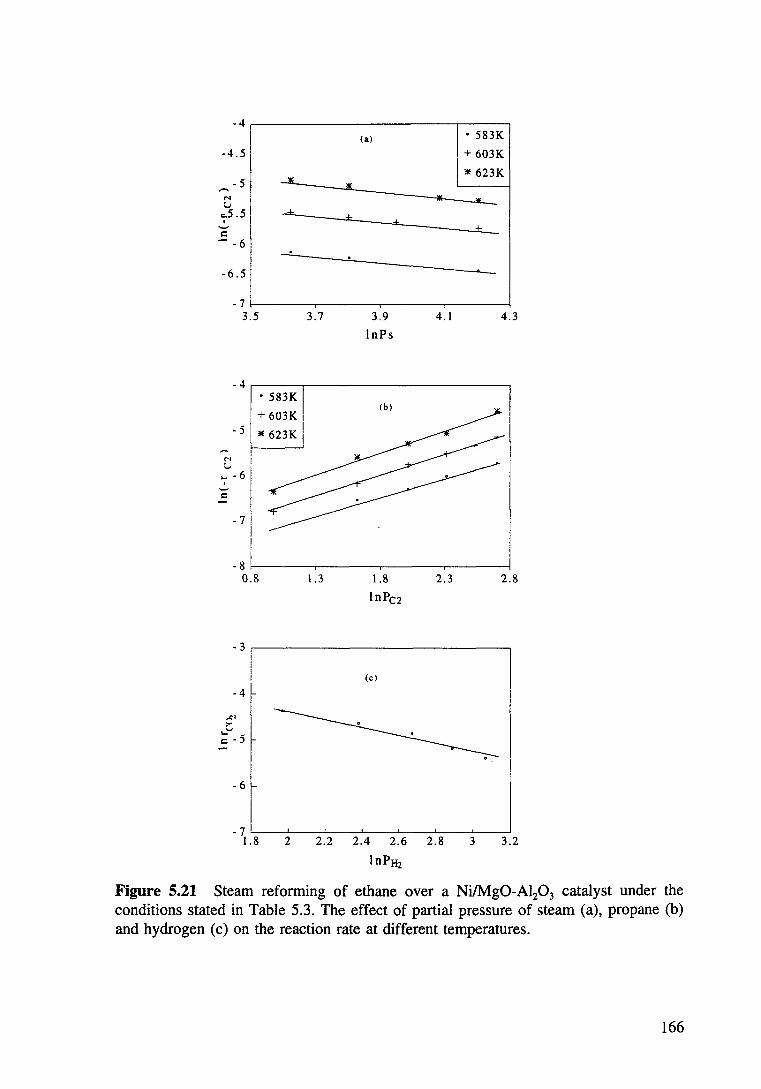
-4 (a) • 583K
-4.5 I+ 603K
* 623K - 5 _JI!
ll! M )I( liE u -.::.5.5 I
'-' c
-61
-6.51 i
- 7 3.5 3.7 3.9 4.1 4.3
lnPs
-4r-----r---------------------~ • 583K
_I + 603K
-' I * 623K I
;-·I I
- 7 : I I I
(b)
-8r-----~-------r------~----~ 0.8 1.3
- 3
! I
-4
c' 1:... ~- 5
-6
-7 1.8 2 2.2
1.8
lnPc2
(c)
2.4 2.6
lnPH2
2.3 2.8
2.8 3 3.2
Figure 5.21 Steam reforming of ethane over a Ni/Mg0-Al20 3 catalyst under the conditions stated in Table 5.3. The effect of partial pressure of steam (a), propane (b) and hydrogen (c) on the reaction rate at different temperatures.
166
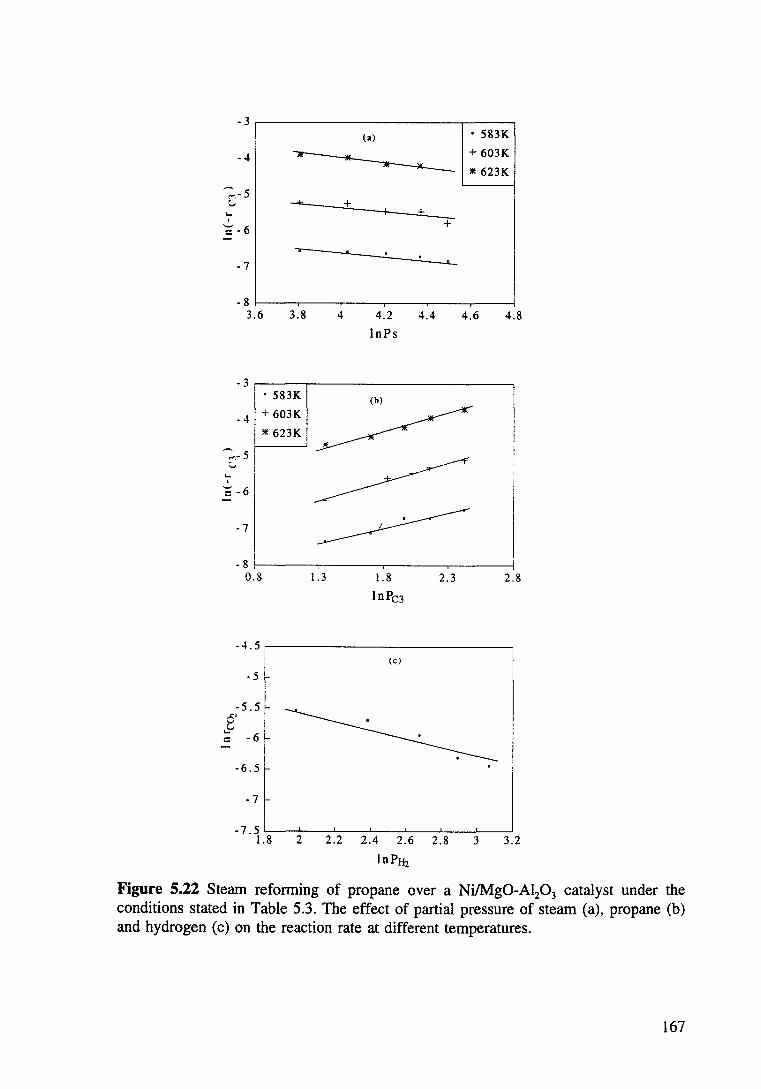
- 3 (a)
-4 ~ ~ .. 5
c.; -=1-.... . c -6
-7
-8 3.6 3.8
-3
I • 583K l _4 +603K
liE 623K
-;..,- 5 ....
+ +
+
...__
4 4.2 4.4 lnPs
(b)
• 583K I + 603K I liE 623K I
4.6 4.8
-7 ~ -8~----~------.-----~------~
0.8 1.3 1.8
lnPC3 2.3 2.8
-4.5,--------------------------, (c)
-5 ~ i
.t'f c -6 ~ - I
: :-:: t.____. . ._____.. __ ___.. __ ____.. __ ___,. __ ___,. __ __J
1.8 2 2.2 2.4 2.6 2.8 3 3.2
lnPfi2
Figure 5.22 Steam reforming of propane over a Ni/Mg0-Al20 3 catalyst under the conditions stated in Table 5.3. The effect of partial pressure of steam (a), propane (b) and hydrogen (c) on the reaction rate at different temperatures.
167
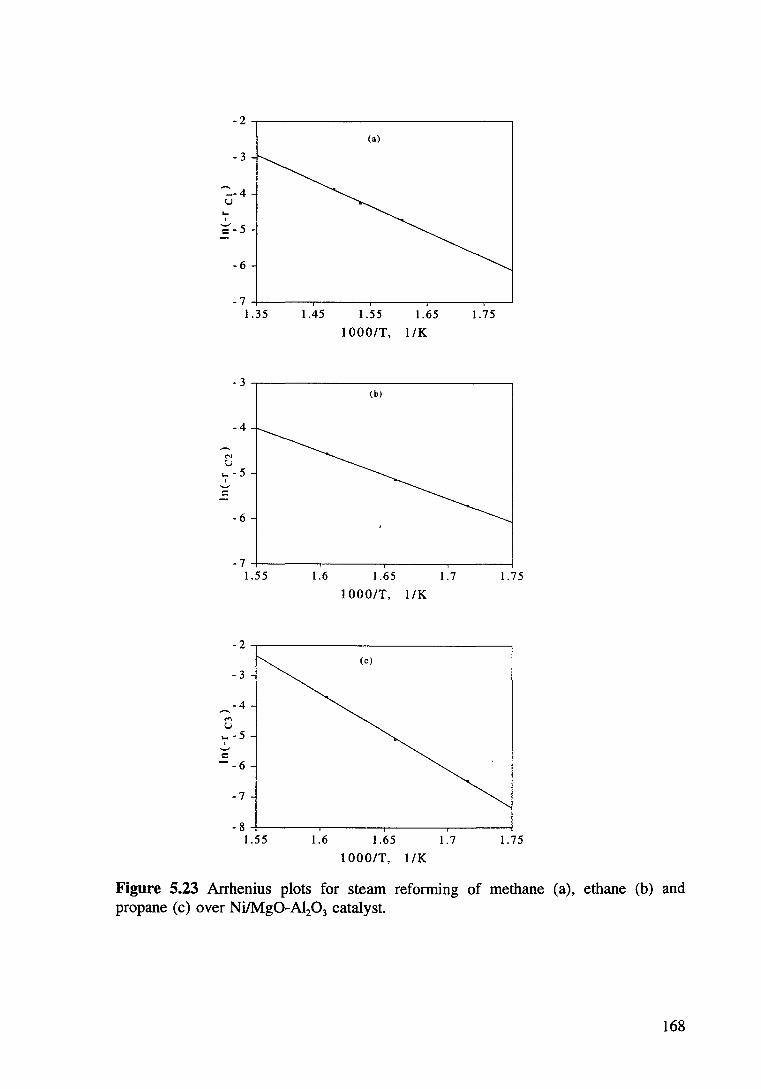
-2
(a)
-3
-:__ 4 u
... I
1:'-5
-6
-7 1.35 1.45 1.55 1.65 1.75
1 000/T, 1/K
-3 (b)
-4
"' ;:,; ... -5
I ._, =
-6
-7 1.55 1.6 1.65 1.7 1.75
1 000/T, 1/K
-2 (c)
- 3
-4 ,-.. M u
... -5 I ._, = --6
-7
-8 1.55 1.6 1.65 1.7 1.75
1 000/T, 1/K
Figure 5.23 Arrhenius plots for steam reforming of methane (a), ethane (b) and propane (c) over Ni/Mg0-Al20 3 catalyst.
168
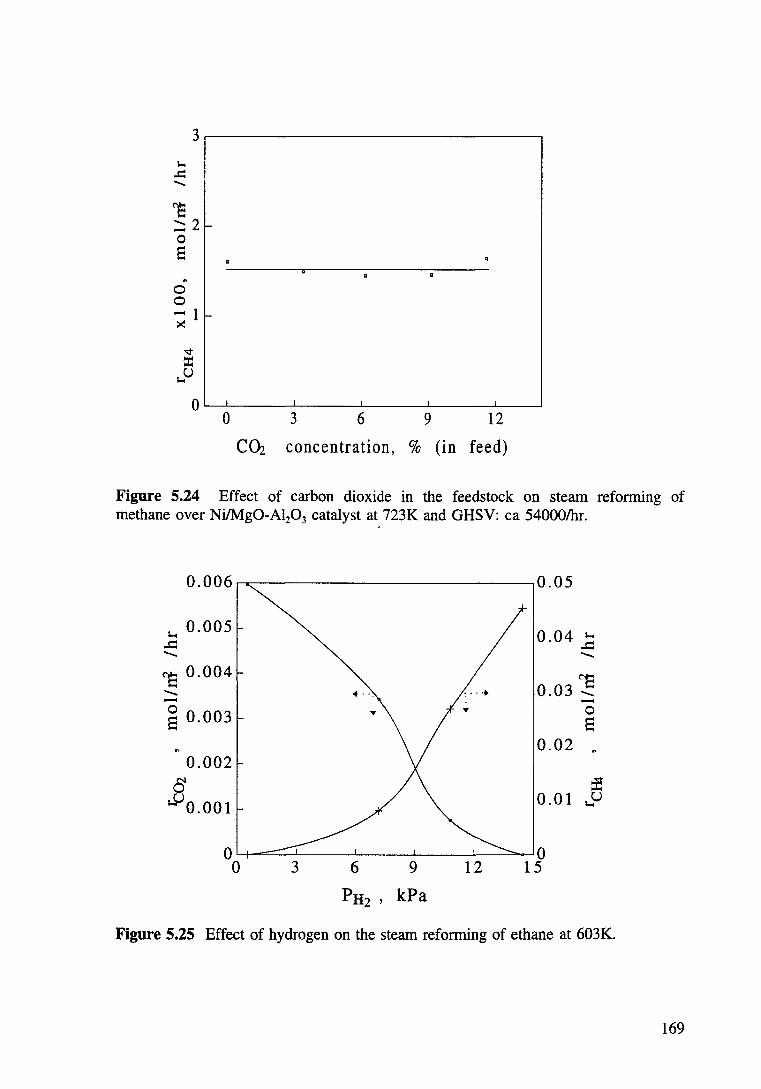
3
'"' .c .......
1: :::::2 0 8
" 0 0 ...... 1 >(
'V ::r:
'"'u 0
0 3 6 9 12
COz concentration, % (in feed)
Figure 5.24 Effect of carbon dioxide in the feedstock on steam reforming of methane over Ni!Mg0-Al20 3 catalyst at 723K and GHSV: ea 54000/hr.
0. 0 06 ,.--.;::------------------, 0. 0 5
s... 0.005 ..c:: -c-s 0.004 --0 8 0.003
0.002
8 ;.5.>0.001
0.04 ~ -13 0.03--0 8
0.02
Figure 5.25 Effect of hydrogen on the steam reforming of ethane at 603K.
169
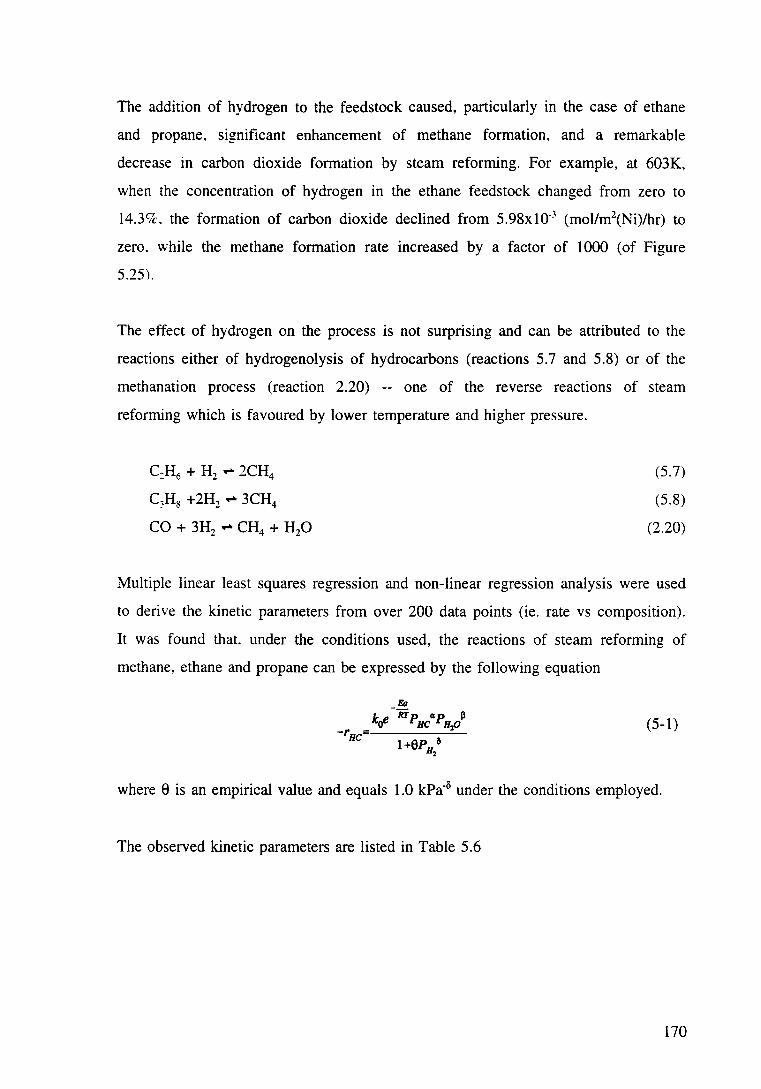
The addition of hydrogen to the feedstock caused, particularly in the case of ethane
and propane, significant enhancement of methane formation, and a remarkable
decrease in carbon dioxide formation by steam reforming. For example, at 603K,
when the concentration of hydrogen in the ethane feedstock changed from zero to
14.39c. the formation of carbon dioxide declined from 5.98x10'3 (mol/m2(Ni)lhr) to
zero. while the methane formation rate increased by a factor of 1000 (of Figure
5.25).
The effect of hydrogen on the process is not surprising and can be attributed to the
reactions either of hydrogenolysis of hydrocarbons (reactions 5.7 and 5.8) or of the
methanation process (reaction 2.20) -- one of the reverse reactions of steam
reforming which is favoured by lower temperature and higher pressure.
C:H6 + H2 .... 2CH4
C:H8 +2H2 .,.. 3CH4
CO + 3H2 .,.. CH4 + H20
(5.7)
(5.8)
(2.20)
Multiple linear least squares regression and non-linear regression analysis were used
to derive the kinetic parameters from over 200 data points (ie. rate vs composition).
It was found that. under the conditions used, the reactions of steam reforming of
methane, ethane and propane can be expressed by the following equation
(5-1)
where 8 is an empirical value and equals 1.0 kPa·~> under the conditions employed.
The observed kinetic parameters are listed in Table 5.6
170
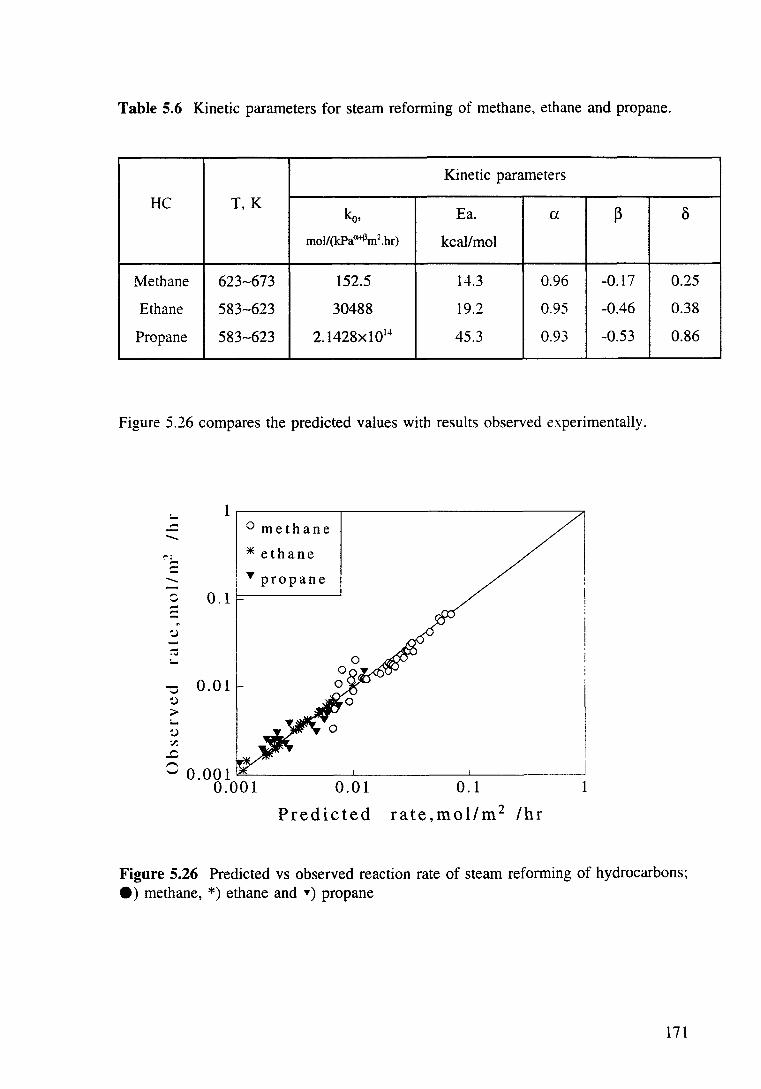
Table 5.6 Kinetic parameters for steam reforming of methane, ethane and propane.
Kinetic parameters
HC T,K ko, Ea. p 8 a
mol/(kPaa+Jlm2.hr) kcal/mol
Methane 623-673 152.5 14.3 0.96 -0.17 0.25
Ethane 583-623 30488 19.2 0.95 -0.46 0.38
Propane 583-623 2.1428x 10¹⁴ 45.3 0.93 -0.53 0.86
Figure 5.26 compares the predicted values with results observed experimentally.
:.... 1 ..::: 0 methane -('I *ethane -= I
T propane - i I
""' 0.1, _, -- I ~
I ~ --.... :....
0.01
0 0. 001 =--------......l----------'------0.001 0.01 0.1 1
Predicted rate,mol!m 2 /hr
Figure 5.26 Predicted vs observed reaction rate of steam reforming of hydrocarbons; e) methane, *) ethane and ") propane
l7l
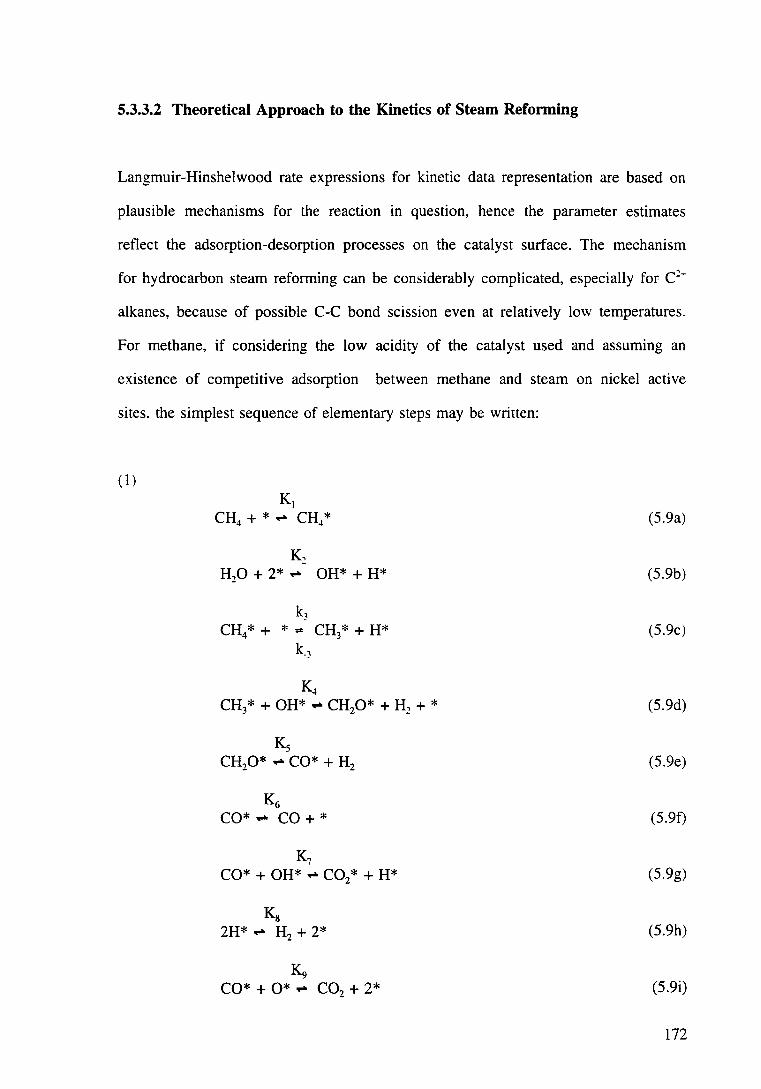
5.3.3.2 Theoretical Approach to the Kinetics of Steam Reforming
Langmuir-Hinshelwood rate expressions for kinetic data representation are based on
plausible mechanisms for the reaction in question, hence the parameter estimates
reflect the adsorption-desorption processes on the catalyst surface. The mechanism
for hydrocarbon steam reforming can be considerably complicated, especially for c>
alkanes, because of possible C-C bond scission even at relatively low temperatures.
For methane, if considering the low acidity of the catalyst used and assuming an
existence of competitive adsorption between methane and steam on nickel active
sites. the simplest sequence of elementary steps may be written:
(1)
KI CH4 + *..., CH4* (5.9a)
K, H,O + 2*..., OH*+ H* (5.9b)
k3 CH4* + *.., CH3* + H* (5.9c)
k.J
K4 CH3* +OH*..., CH20* + H1 + * (5.9d)
Ks CH20* ..., CO* + H2 (5.9e)
~ CO*..., CO+* (5.9f)
K? CO*+ OH*..., C02* + H* (5.9g)
Ks 2H*..., H2 + 2* (5.9h)
~ CO*+ 0*..., C02 + 2* (5.9i)
172
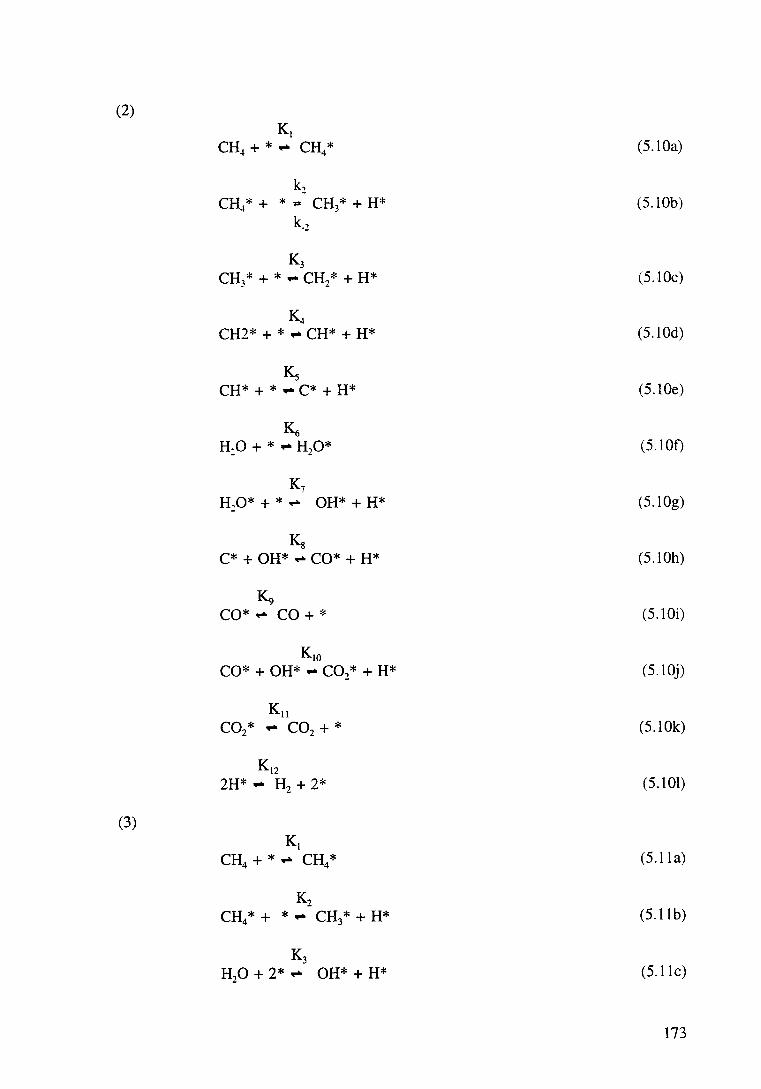
(2)
Kt CH + *,..,. CH*
~ 4 (5.10a)
k~
CH~*+ *.,. CH3* + H* (5.10b)
k.2
K3 CH3 * + * ,..,. CH2 * + H* (5.10c)
K~ CH2* + * ,..,. CH* + H* (5.10d)
Ks CH* + * ,..,. C* + H* (5.10e)
~ H:O + *,..,. H20* (5.10f)
K7 H,O* + *,..,. OH*+ H* (5.10g)
Ks C* + OH* ,..,. CO* + H* (5.10h)
~ CO*,..,. CO+* (5.10i)
Kw CO*+ OH*,..,. C02* + H* (5.10j)
Ku C02* ..... CO+* 2 (5.10k)
Ktz 2H*,..,. H + 2* 2 (5.101)
(3)
Kt CH4 + *,..,. CH4* (5.lla)
K2 CH4* + *,..,. CH3* + H* (5.llb)
K3 H20 + 2*,..,. OH*+ H* (5.llc)
173
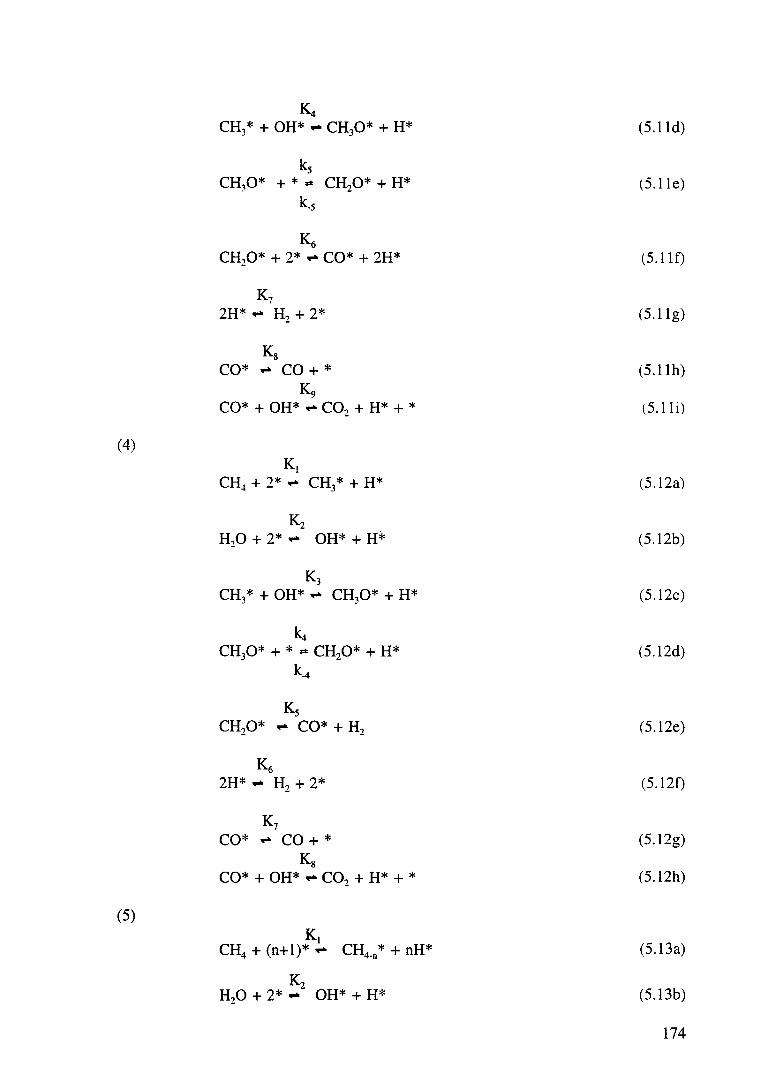
K4 CH3 * + OH* .,.. CH30* + H* (5.lld)
(5.lle)
K6 CH20* + 2* .,.. CO* + 2H* (5.llf)
(5.llg)
Ks CO* .,.. CO+* (5.llh)
~ CO* + OH* .,.. C02 + H* + * (5.lli)
(4) K,
CH~+ 2* .,.. CH3* + H* (5.12a)
K2 H20 + 2*.,.. OH*+ H* (5.12b)
K3 CH3 * + OH* .,.. CH30* + H* (5.12c)
k4 CH30* + * .,. CH20* + H* (5.12d)
k-4
(5.12e)
(5.12f)
K7 CO* .,.. CO+* (5.12g)
Ks CO* + OH* .,.. C02 + H* + * (5.12h)
(5) K,
CH4 + (n+l)*.,.. CH4_n* + nH* (5.13a)
K2 H20 + 2* .,.. OH* + H* (5.13b)
174
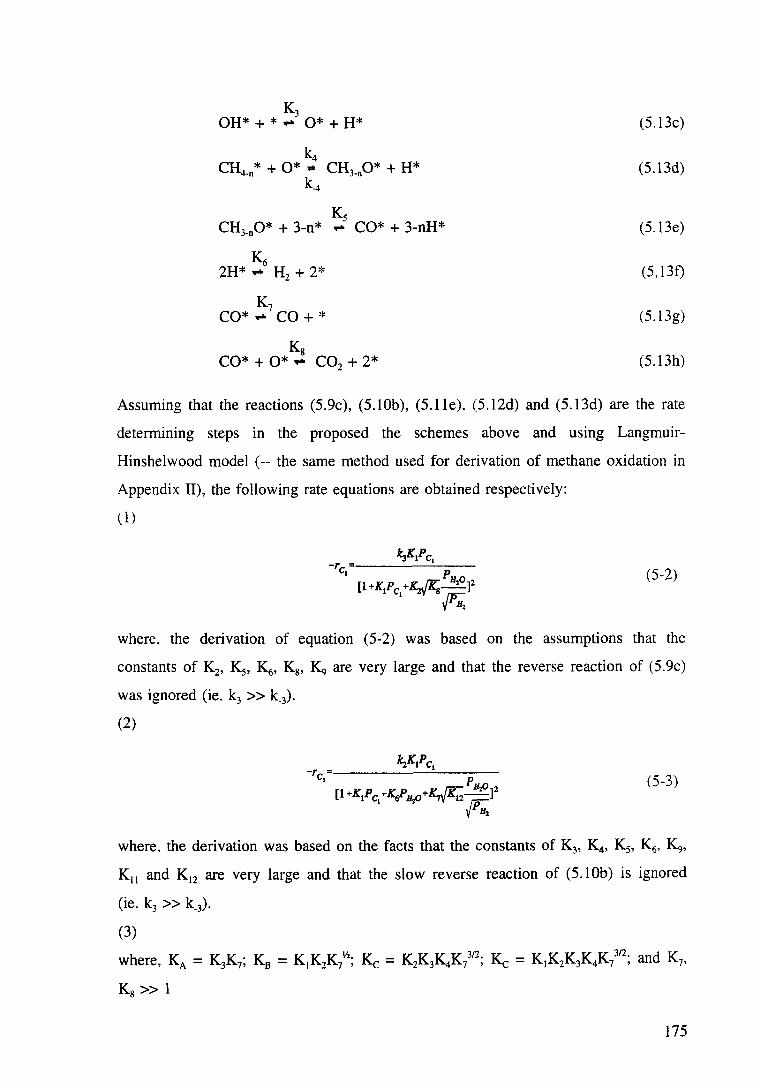
K3 OH* + * ... 0* + H*
Ks CH3_
00* + 3-n* ... CO* + 3-nH*
~ 2H* ... H2 + 2*
K7 CO* ... CO+*
Ks CO* + 0* ... CO + 2* 2
(5.13c)
(5.13d)
(5.13e)
(5, 13f)
(5.13g)
(5.13h)
Assuming that the reactions (5.9c), (5.10b), (5.lle). (5.12d) and (5.13d) are the rate
determining steps in the proposed the schemes above and using Langmuir
Hinshelwood model ( -- the same method used for derivation of methane oxidation in
Appendix II), the following rate equations are obtained respectively:
(1)
(5-2)
where. the derivation of equation (5-2) was based on the assumptions that the
constants of K2, K 5, K 6, K8, ~ are very large and that the reverse reaction of (5.9c)
was ignored (ie. k3 >> k_3).
(2)
(5-3)
where. the derivation was based on the facts that the constants of K3, K4, K 5, K6, K9,
K11 and K12 are very large and that the slow reverse reaction of (5.10b) is ignored
(ie. k3 >> k_3).
(3)
where, KA = K 3K7 ; K 8 = K 1K2K/'; Kc = K2K 3K4K/'2; Kc = K 1K 2K 3K4K/'2; and K7,
K8 >> 1
175
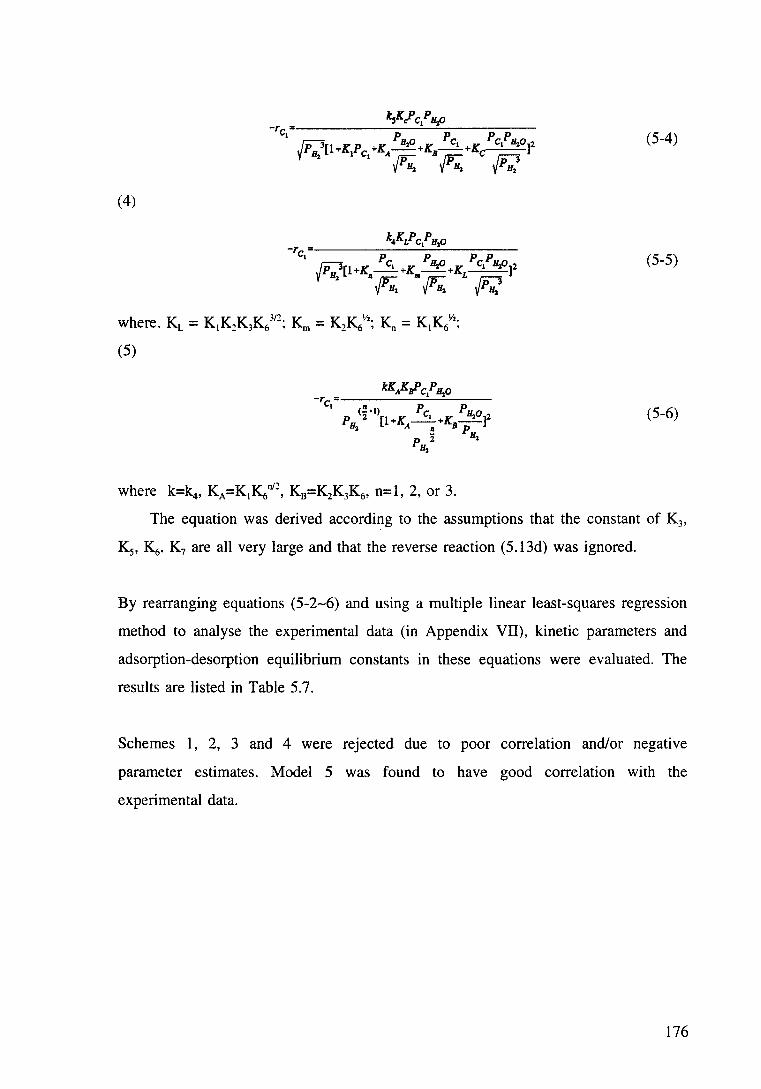
(5-4)
(4)
(5-5)
(5)
(5-6)
where k=k4, KA=K1~nt2 , KB=K2K3K6, n=l, 2, or 3.
The equation was derived according to the assumptions that the constant of K3,
K5, K6• K7 are all very large and that the reverse reaction (5.13d) was ignored.
By rearranging equations (5-2-6) and using a multiple linear least-squares regression
method to analyse the experimental data (in Appendix VII), kinetic parameters and
adsorption-desorption equilibrium constants in these equations were evaluated. The
results are listed in Table 5.7.
Schemes 1, 2, 3 and 4 were rejected due to poor correlation and/or negative
parameter estimates. Model 5 was found to have good correlation with the
experimental data.
176
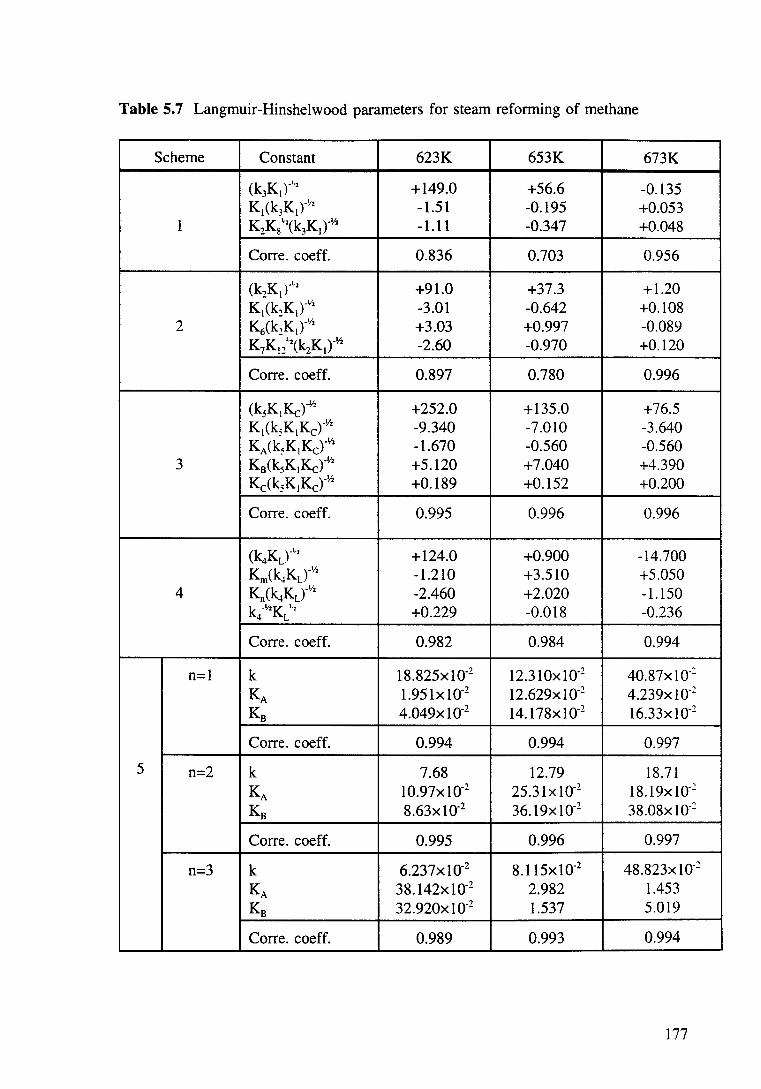
Table 5.7 Langmuir-Hinshelwood parameters for steam reforming of methane
Scheme Constant 623K 653K 673K
(k3Ktr'·z +149.0 +56.6 -0.135 Kt(k3Ktr•~z -1.51 -0.195 +0.053
1 KzK8 ~'(k3K1)'112 -1.11 -0.347 +0.048
Corre. coeff. 0.836 0.703 0.956
(k2K1r'·· +91.0 +37.3 +1.20 Kt(k:Kt)'v' -3.01 -0.642 +0.108
2 K6(k:KI)'lj' +3.03 +0.997 -0.089 K7Kt:'''(kzKt)-v' -2.60 -0.970 +0.120
Corre. coeff. 0.897 0.780 0.996
(ksKtKcrv, +252.0 +135.0 +76.5 Kt(ksKtKc)-v' -9.340 -7.010 -3.640 KA(k5K1Kcrv' -1.670 -0.560 -0.560
3 K8(k5K1 Kc)''12 +5.120 +7.040 +4.390 l<c(k5K1 Kc)-112 +0.189 +0.152 +0.200
Corre. coeff. 0.995 0.996 0.996
(k4KL)'''' +124.0 +0.900 -14.700 ~(k~KL)''1' -1.210 +3.510 +5.050
4 ~(k~KL)'v' -2.460 +2.020 -1.150 k/''KL'·• +0.229 -0.018 -0.236
Corre. coeff. 0.982 0.984 0.994
n=1 k 18.825x10'2 12.310x10·2 40.87x1o-:: KA 1.951x10·2 12.629x10'2 4.239xto·2
Ks 4.049xto·2 14.178x 10'2 16.33xt0·2
Corre. coeff. 0.994 0.994 0.997
5 n=2 k 7.68 12.79 18.71 KA 10.97x10'2 25.31x10·2 18.19x10·2
Ks 8.63x10·2 36.19x10'2 38.08x10·2
Corre. coeff. 0.995 0.996 0.997
n=3 k 6.237x10·2 8.115x10·2 48.823x 1 0'2
KA 38.142x10·2 2.982 1.453 Ks 32.920xto·2 1.537 5.019
Corre. coeff. 0.989 0.993 0.994
177
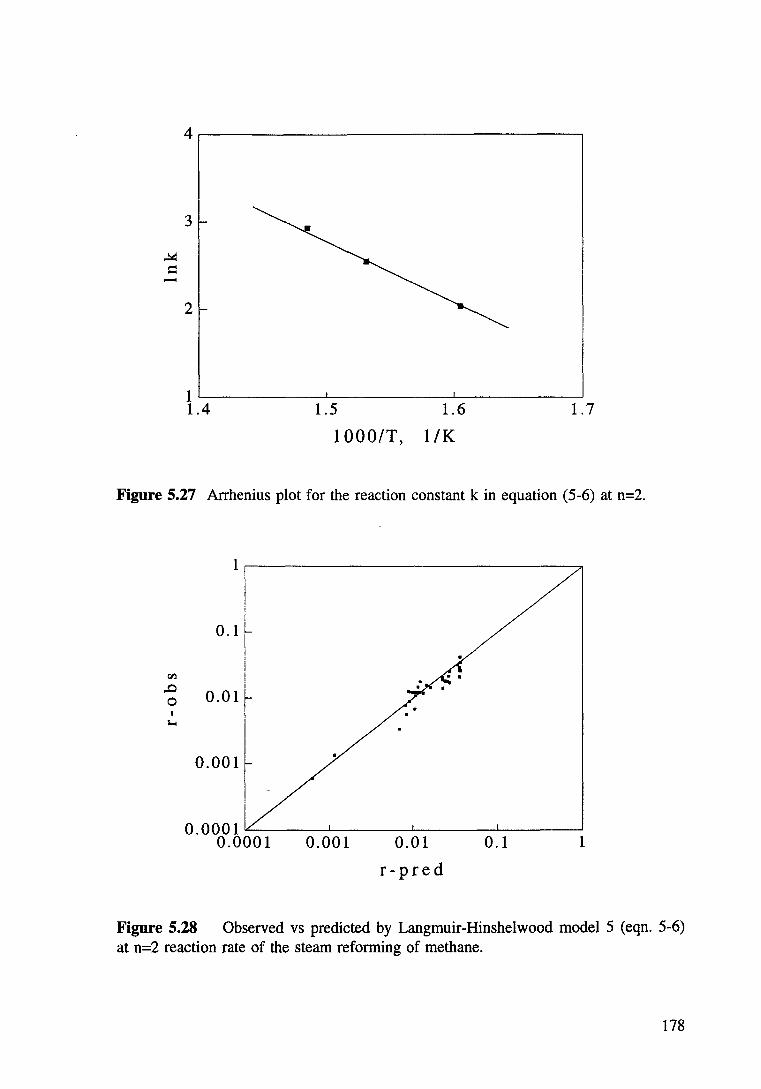
3
-2
1.5
1000/T,
1.6
1/K
1.7
Figure 5.27 Arrhenius plot for the reaction constant k in equation (5-6) at n=2.
00
..0 0 I
'""'
1 i
I I
0.1,
! i I .. I
0.01 ~
0.001
0.0001~----~------~------~------~ 0.0001 0.001 0.01
r-pred
0.1 1
Figure 5.28 Observed vs predicted by Langmuir-Hinshelwood model 5 (eqn. 5-6) at n=2 reaction rate of the steam reforming of methane.
178
The relatively high correlation coefficients indicate that the form of equation (5-6)
expressed the course of the studied reaction over the given experimental conditions.
Especially when the value of n equals 2, equation (5-6) can fit the experimental data
very well. The activation energy calculated by plotting Ink vs lff (at n=2) (Figure
5.27) is 14.73±0.05 kcallmol, which is very comparable with the value calculated
from the temperature dependence of the rate constant from equation (5-l) (14.30
kcallmol). Figure 5.28 indicates the fit of Langmuir-Hinshelwood model to the
experimental data.
5.3.3.3 Application of the Kinetic Models
In order to compare the applicability of the kinetic models, both equations (5-l) and
(5-6) (n=2) were employed to design a one-dimensional plug flow reactor for the
steam reforming of methane over the Ni/Mg0-Al20 3 catalyst. The governing
differential equations for heat and mass balances on the reactor are
dT (-rcl)P~c( -~H)-!lS(T-To)
dZ E(F1CpJ
where, Fc1° is the initial methane flow rate in mole/min;
X is the conversion of methane;
T0 is the temperature of inlet catalyst bed in K;
T is the temperature in catalyst bed at any point in K;
Z is the reactor bed length in cm;
-rc1 is the reaction rate in terms of moll(g.min);
pb is the bulk density of the catalyst bed;
~ is the reactor cross-sectional area, in cm2;
Fi is the component i flow rate, in mollmin;
(5-7)
(5-8)
179
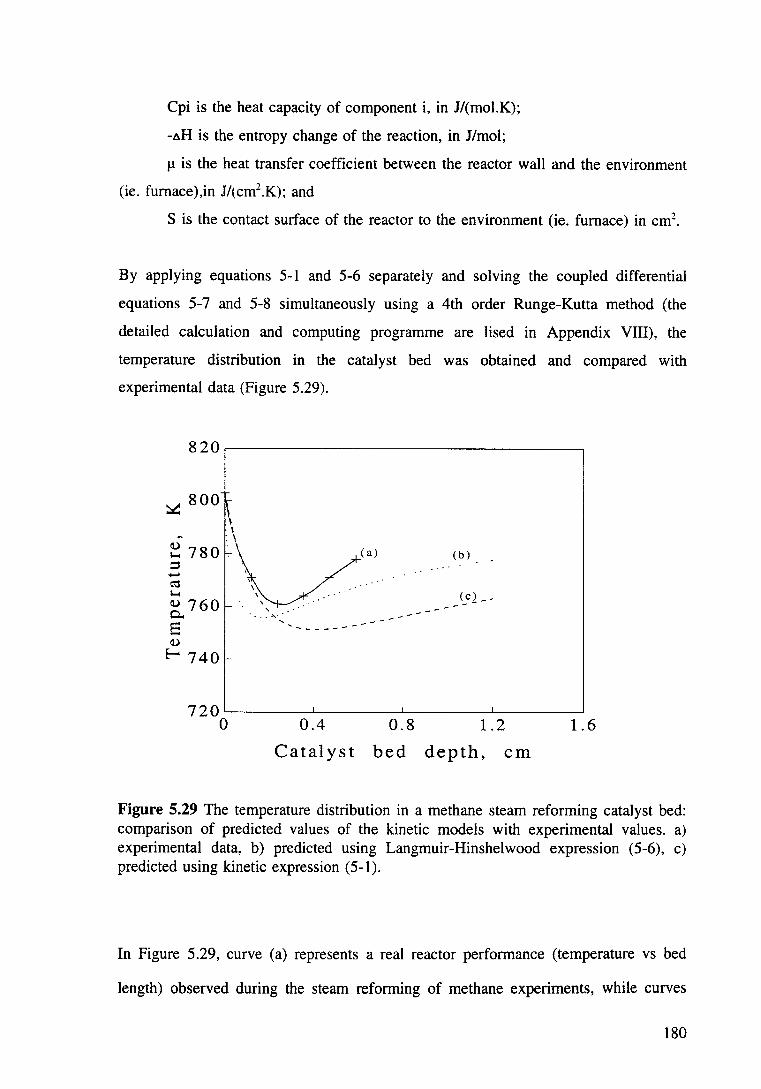
Cpi is the heat capacity of component i, in J/(mol.K);
-~H is the entropy change of the reaction, in J/mol;
Jl is the heat transfer coefficient between the reactor wall and the environment
(ie. fumace),in J/(cm2.K); and
S is the contact surface of the reactor to the environment (ie. furnace) in cm2•
By applying equations 5-l and 5-6 separately and solving the coupled differential
equations 5-7 and 5-8 simultaneously using a 4th order Runge-Kutta method (the
detailed calculation and computing programme are lised in Appendix VIII), the
temperature distribution in the catalyst bed was obtained and compared with
experimental data (Figure 5.29).
820~--------------------------------~
~ 800
I ~ : \ ~ 780 ·. ::s ...... ~ 1-o
Cl) 760 0.. E Cl)
E- 740
(a) (b)
(c 2--
---
720~------~------~------~------~ 0 0.4 0.8 1.2 1.6
Catalyst bed depth, cm
Figure 5.29 The temperature distribution in a methane steam reforming catalyst bed: comparison of predicted values of the kinetic models with experimental values. a) experimental data, b) predicted using Langmuir-Hinshelwood expression (5-6), c) predicted using kinetic expression (5-l).
In Figure 5.29, curve (a) represents a real reactor performance (temperature vs bed
length) observed during the steam reforming of methane experiments, while curves
180
(b) and (c) present models using kinetic equations 5-l and 5-6 respectively.
As expected, there exists a temperature drop at the inlet of the catalyst bed, which is
caused by the strong endothermic steam reforming reaction. However, due to the
continuous heat supply by a tubular furnace, the bed temperature, after dropping to
the lowest value. increased gradually along the bed.
Given the one-dimensional model used, the predicted reactor performance is found to
be almost comparable with that of a real reactor.
181
5.4 Conclusions
Activity comparisons of nickel and platinum based catalysts for steam reforming light
hydrocarbons have been made. The reduction characteristics of nickel based catalysts
and the effect of operation conditions on steam reforming reactions as well as the
kinetics of the steam reforming of light hydrocarbons have been studied.
Nickel based catalysts have been found to be more active for steam reforming
reactions than platinum based catalysts, and are suggested to be used for steam
reforming of light hydrocarbons in the proposed autothermic hydrogen production
system.
Investigation of reduction characteristics of different nickel based catalysts indicated
that the reduction temperature depends on the composition and preparation methods
of the catalysts. Nickel based catalysts can be reduced using either hydrogen or
mixtures of propane/oxygen or propane/steam. Reduction in a mixture of
propane/oxygen can result in almost the same reforming activity of nickel catalysts as
reduction in hydrogen.
The effect of steam on the Pt/Al:z03 catalyst at higher reforming temperatures was
investigated. Steam can sinter the catalyst at high temperatures but it also decreases
carbon formation on the catalyst active surface. This results from gasification of
carbon on the solid.
182
The steam reforming of methane, ethane and propane takes place initially over a
Pt/Al20 3 catalyst at ea 773K for all the hydrocarbons. Over nickel based catalysts,
the reaction became significant at ea 673K for methane and ea 623K for ethane and
propane. The light out patterns only depend on the metal loading and on the support
of the catalyst.
Hydrogen production from steam reforming of light hydrocarbons increases
significantly with reaction temperature. Methane is formed during steam reforming of
ethane and propane. The amount of methane formed has a maximum at temperatures
of ea 723K when steam reforming of ethane and propane is carried out at S/C=3 and
using a Ni/Mg0-Al20 3 (RKNR) catalyst.
Increase of the steam to carbon ratio favours hydrogen production and suppresses
methane formation.
Kinetic studies indicated that the steam reforming of light hydrocarbons (C1-C3) over
a Ni/Mg0-Al20 3 catalyst was almost first order with respect to the partial pressure of
hydrocarbons and negative order with respect to steam. Hydrogen was found to
inhibit the steam reforming reaction but to accelerate the methanation rate. Carbon
dioxide had no effect on the reaction rate under the conditions used for the kinetic
measurements.
A mechanism of methane steam reforming over a Ni/Mg0-Al20 3 catalyst has been
suggested, in which the surface reaction between the radicals of CH2 * and 0* was
183
assumed as the rate determining step. A kinetic expression based on the proposed
mechanism was derived using Langmuir-Hinshelwood argument. The results
indicated that the expression fits the experimental data very well.
Application of the kinetic models to a one-dimensional plug flow reactor design
indicated that the empirical kinetic expression obtained using differential methods can
be used for reactor design with only moderate predictive success.
184
Chapter 6 Ceria Promoted-nickel on Alumina
Catalysts For Steam Reforming of Light
Hydrocarbons
6.1 Introduction
Nickel based catalysts have been found to be suitable for the steam reforming of
light hydrocarbons in the proposed autothermic hydrogen production system (in
Chapter 5). However, there exists a real risk of carbon formation, which is known to
be affected by catalyst composition and operation conditions. The literature survey
(Chapter 2) has indicated that limitation of carbon formation can be realised either b~
maintaining a certain ratio of steam to carbon in the feedstock (ie. S/C>2) or by
improving the properties of the catalysts. Due to the high operational expenditure
associated with high SIC ratios, attention has been focused on improving catalysts.
Previous studies of modification of the catalyst in order to reduce carbon formation
include the addition of small amounts of elements such as S [130], Ur [135], Au, Sn.
Pb, Sb, Bi and As [97]), and/or metal oxides (ie. MgO and alkali salts [132] or
heavier rare earth oxides [133]) to nickel on alumina catalysts. Amongst these
additives, rare earth oxides appear to offer better perfomance, a result which has been
attributed to their abilities in improving the water adsorption and in increasing and
stabilising the dispersion of the metals [189-192] and metal oxides [193], as well as
in enhancing the water-gas shift reaction [96].
A literature survey has indicated that the most previous studies have mainly involved
using rare earth elements/oxides as promoters to improve the catalytic properties of
the catalyst for automotive emission control [ 190, 194-196] or the oxidative coupling
of methane [197-200]. However, not much has been done to study the effec_t of rare
earth oxides in steam reforming catalysts.
185
Attempts have been made in this study to improve the catalytic properties of nickel
based steam reforming catalysts by using ceria as a promoter.
This chapter reports a preliminary study of the preparation and characterisation of
several ceria promoted steam reforming catalysts and the effect of ceria on the
activity and stability of nickel on alumina catalysts. Comparisons have been made of
catalytic properties of ceria and non-ceria promoted catalysts, including some
commercial catalysts such as RKNR and R-67-7H.
6.2 Experimental
6.2.1 Catalyst Preparation
The ceria promoted catalysts were prepared using a two-step impregnation-calcination
technique. About 7.5-8 g of 8-Al20 3 \Yas first immersed in ea 0-0.1 M of cerium
nitrate aqueous solution and stirred at ambient temperature for three hours. The slurry
was filtered and then dried at ea 393K overnight and then calcined at 873K for four
hours. The resultant (Ce0zf8-Al20 3) was then impregnated by nickel nitrate aqueous
solution (ea 0.8 M) followed by the same drying and calcination procedure. For
comparison, a non-ceria promoted nickel on alumina catalyst (SR-0) was prepared
using the same procedures , except that the same volume of distilled water was used
instead of the cerium nitrate solution.
6.2.2 Catalyst Characterisation
X-ray diffraction (XRD) was employed to measure the status of Ce02 and NiO in the
catalysts. The BET surface area and pore size distribution of the catalysts were
characterised using an ASAP 2000 surface analysis system involving N2 adsorption
desorption at 77.5K. The metallic surface area and metal dispersion of the catalysts
was measured from CO chemisorption at 195K with an assumption of a
stoichiometry factor of unity (ie. CO:Ni=l: 1). Carbon formation on catalysts used in
186

experiments was quantified using thermogravimetric analysis (TGA) techniques.
6.2.3 Catalyst Evaluation
The catalytic activity of catalysts was determined using a flow reactor system (c.f.
section 3.3.3). About 0.5 g of catalyst was loaded in the constant temperature zone of
a tubular reactor, and reduced in-situ using H2 at 873K for 4 hours and then cooled
to room temperature prior to use. In the activity measurement, the reduced catalyst
was heated carefully, in a flow of oxygen-free nitrogen, to ea 623 K. Hydrocarbon
and steam were then admitted to the reactor. The ratio of steam to carbon (S/C) in
feedstock was adjusted by changing the flow rates of water (controlled by a syringe
pump) or hydrocarbons (controlled by a mass flow controller). The reaction
temperature was adjusted to a desired value. The flow rate of product gas was
measured by a bubble meter and analysed by two on-line gas chromatographs
(Chapter 3). Catalyst activities were measured in terms of total conversion of
hydrocarbons.
6.3 Results and Discussions
6.3.1 Physico-chemical Properties of the Catalysts
Table 6.1 lists the physico-chemical properties of catalysts determined by XRF and
surface area analysis (ASAP 2000). The results (Table 6.1) indicate that the catalysts
prepared possess much greater metallic surface area and higher nickel dispersion than
that of the commercial catalysts (RKNR & R-67-7H). RKNR catalyst has a higher
BET surface area but is associated with low metallic specific surface area and
dispersion. R -67 -7H catalyst shows excellent nickel dispersion and high metallic
surface area, but a low BET surface area.
187
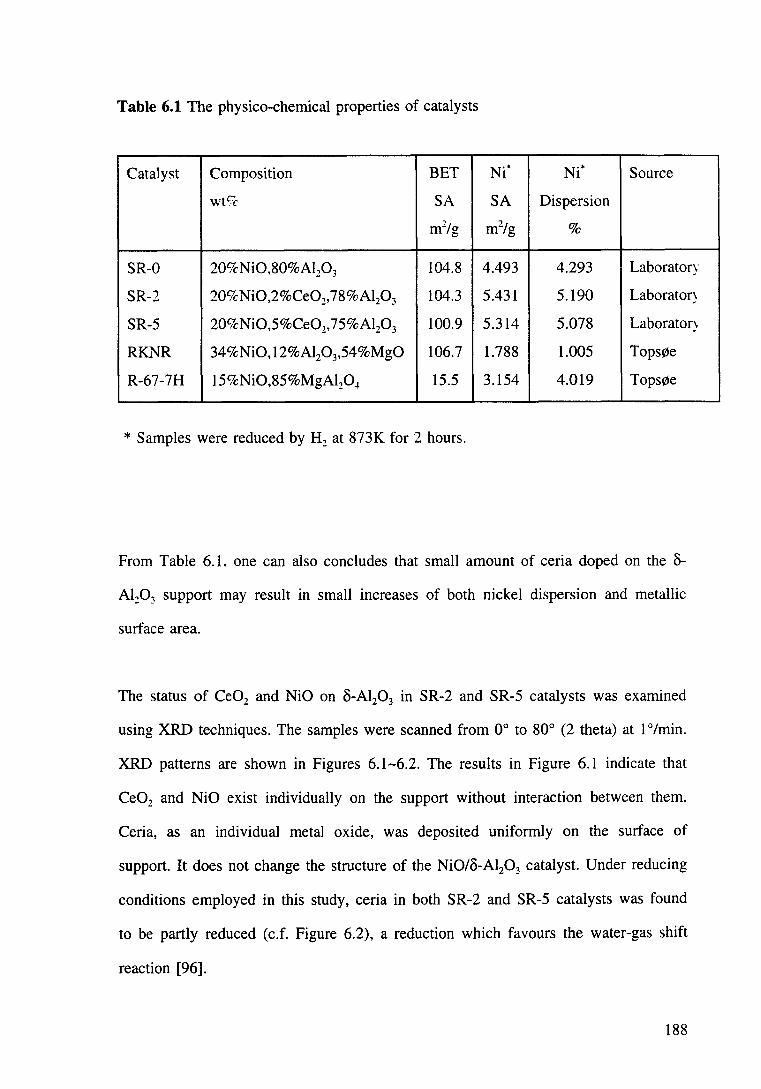
Table 6.1 The physico-chemical properties of catalysts
Catalyst Composition BET Ni* Ni* Source
wtst SA SA Dispersion
m2fa 1:>
m2/g %
SR-0 209C Ni0,80%Al20 3 104.8 4.493 4.293 Laboratory
SR-2 209CNi0,2%Ce02,78%Al20 3 104.3 5.431 5.190 Laborator~
SR-5 201kNi0,5%Ce02,75%Al20 3 100.9 5.314 5.078 Laboratory
RK.NR 34%Ni0, 12%Al20 3,54%Mg0 106.7 1.788 1.005 TopsiZSe
R-67-7H 15%Ni0,85%MgA120~ 15.5 3.154 4.019 TopsiZSe
* Samples were reduced by H2 at 873K for 2 hours.
From Table 6.1. one can also concludes that small amount of ceria doped on the 8-
Al:P3 support may result in small increases of both nickel dispersion and metallic
surface area.
The status of Ce02 and NiO on 8-Al20 3 in SR-2 and SR-5 catalysts was examined
using XRD techniques. The samples were scanned from oo to 80° (2 theta) at 1 a /min.
XRD patterns are shown in Figures 6.1-6.2. The results in Figure 6.1 indicate that
Ce02 and NiO exist individually on the support without interaction between them.
Ceria, as an individual metal oxide, was deposited uniformly on the surface of
support. It does not change the structure of the Ni0/8-Al20 3 catalyst. Under reducing
conditions employed in this study, ceria in both SR-2 and SR-5 catalysts was found
to be partly reduced (c.f. Figure 6.2), a reduction which favours the water-gas shift
reaction [96].
188
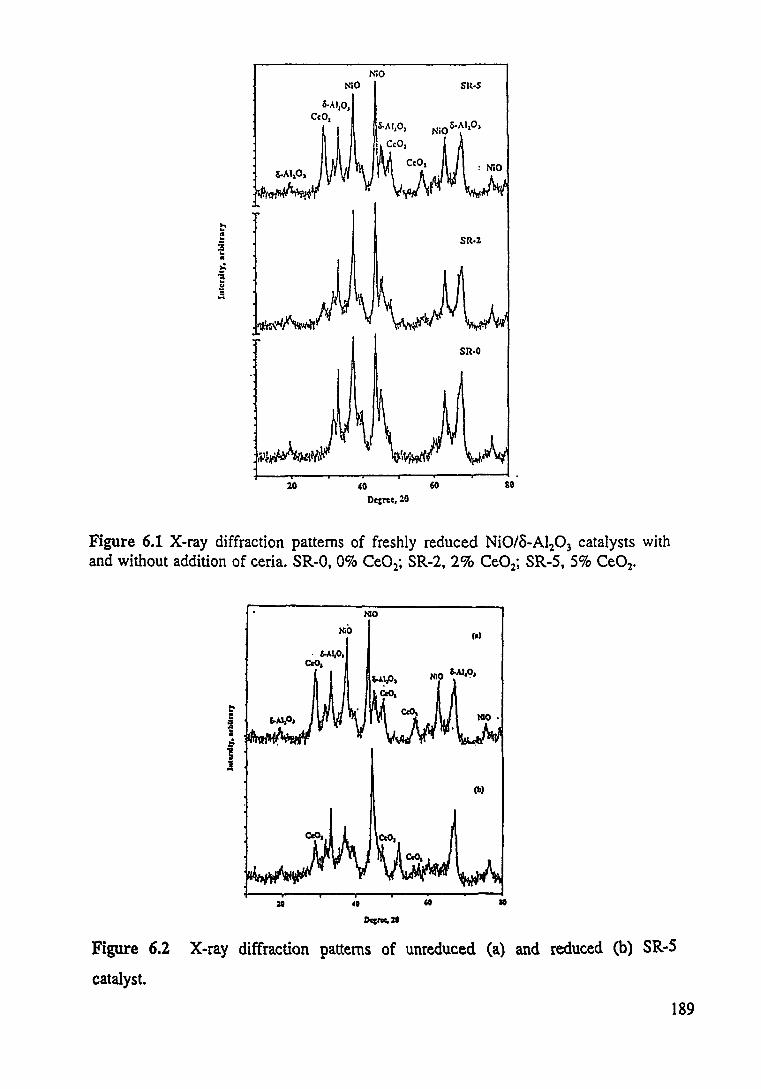
NiO NiO Slt·S
t:' ~ ~~ :a .. • ~ : ~ .S I
~~~~~" I
lO
SR·O
40 60 so
Figure 6.1 X-ray diffraction patterns of freshly reduced Ni0/o-Al20 3 catalysts with and without addition of ceria. SR-0, 0% Ce02; SR-2, 2% Ce02; SR-5, 5% Ce02 •
.NIO
. £.1.1,0,
JA· (lo)
Figure 6.2 X-ray diffraction patterns of unreduced (a) and reduced (b) SR-5
catalyst.
189
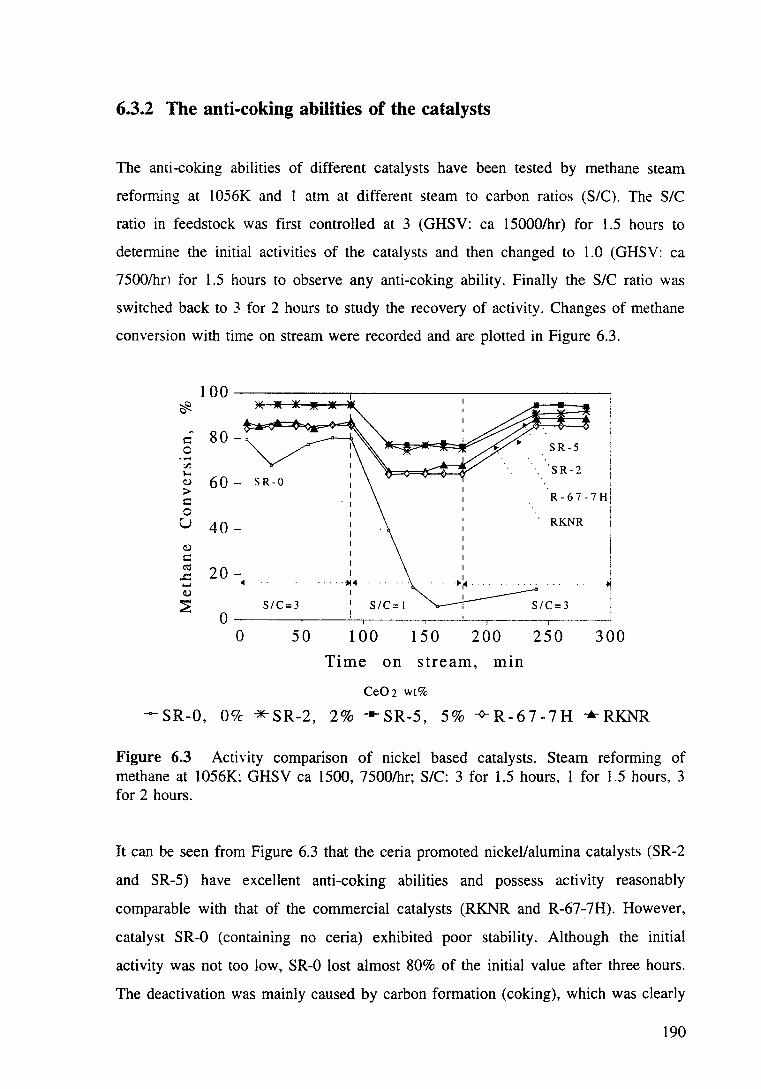
6.3.2 The anti-coking abilities of the catalysts
The anti-coking abilities of different catalysts have been tested by methane steam
reforming at l056K and l atm at different steam to carbon ratios (SIC). The SIC
ratio in feedstock was first controlled at 3 (GHSV: ea 15000/hr) for 1.5 hours to
determine the initial activities of the catalysts and then changed to 1.0 (GHSV: ea
7500/hr\ for 1.5 hours to observe any anti-coking ability. Finally the SIC ratio was
switched back to 3 for 2 hours to study the recovery of activity. Changes of methane
conversion with time on stream were recorded and are plotted in Figure 6.3.
~ 80-. s::: 0 SR-5 ·-"' ·. ·sR-2 1-< (!) 60- S R-0 :> R-67-7H s::: 0 u 40- RKNR
j (!)
s::: ~ 20-..c ...... 4 .... ·+14 .. .. . . . . . . . . . . . . .. (!)
:E SIC=3 SIC= 1 0 I
0 50 100 150 200 250 300
Time on stream, mm
CeOz wt%
---- SR-0, OCJc *' SR-2, 2% _.. SR-5, 5% + R- 6 7-7 H + RKNR
Figure 6.3 Activity comparison of nickel based catalysts. Steam reforming of methane at 1056K: GHSV ea 1500, 7500/hr; SIC: 3 for 1.5 hours, 1 for 1.5 hours, 3 for 2 hours.
It can be seen from Figure 6.3 that the ceria promoted nickellalumina catalysts (SR-2
and SR-5) have excellent anti-coking abilities and possess activity reasonably
comparable with that of the commercial catalysts (RKNR and R-67~7H). However,
catalyst SR-0 (containing no ceria) exhibited poor stability. Although the initial
activity was not too low, SR-0 lost almost 80% of the initial value after three hours.
The deactivation was mainly caused by carbon formation (coking), which was clearly
190
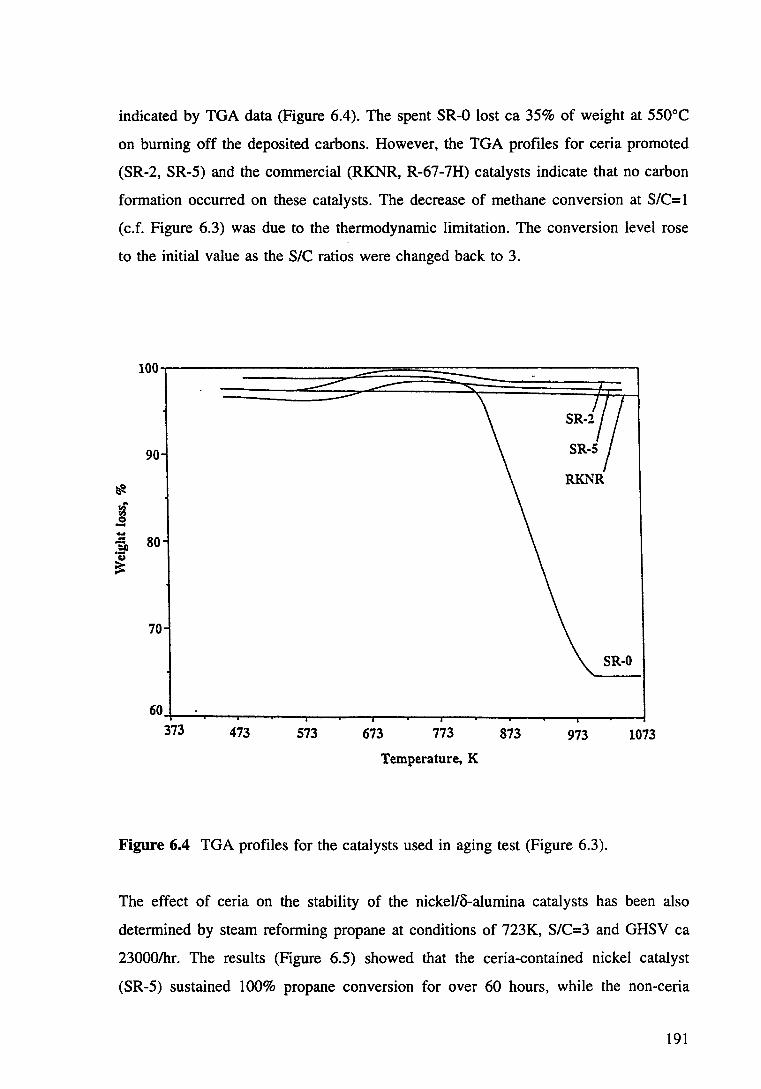
indicated by TGA data (Figure 6.4). The spent SR-0 lost ea 35% of weight at 550°C
on burning off the deposited carbons. However, the TGA profiles for ceria promoted
(SR-2, SR-5) and the commercial (RKNR, R-67-7H) catalysts indicate that no carbon
formation occurred on these catalysts. The decrease of methane conversion at SIC= 1
(c.f. Figure 6.3) was due to the thermodynamic limitation. The conversion level rose
to the initial value as the SIC ratios were changed back to 3.
90
~ RK."'iR
~ .,g ... - 80 'a ·a ~
373 473 573 673 773 873 973 1073
Temperature, K
Figure 6.4 TGA profiles for the catalysts used in aging test (Figure 6.3).
The effect of ceria on the stability of the nickeVB-alumina catalysts has been also
determined by steam reforming propane at conditions of 723K, SIC=3 and GHSV ea
23000/hr. The results (Figure 6.5) showed that the ceria-contained nickel catalyst
(SR-5) sustained 100% propane conversion for over 60 hours, while the non-ceria
191
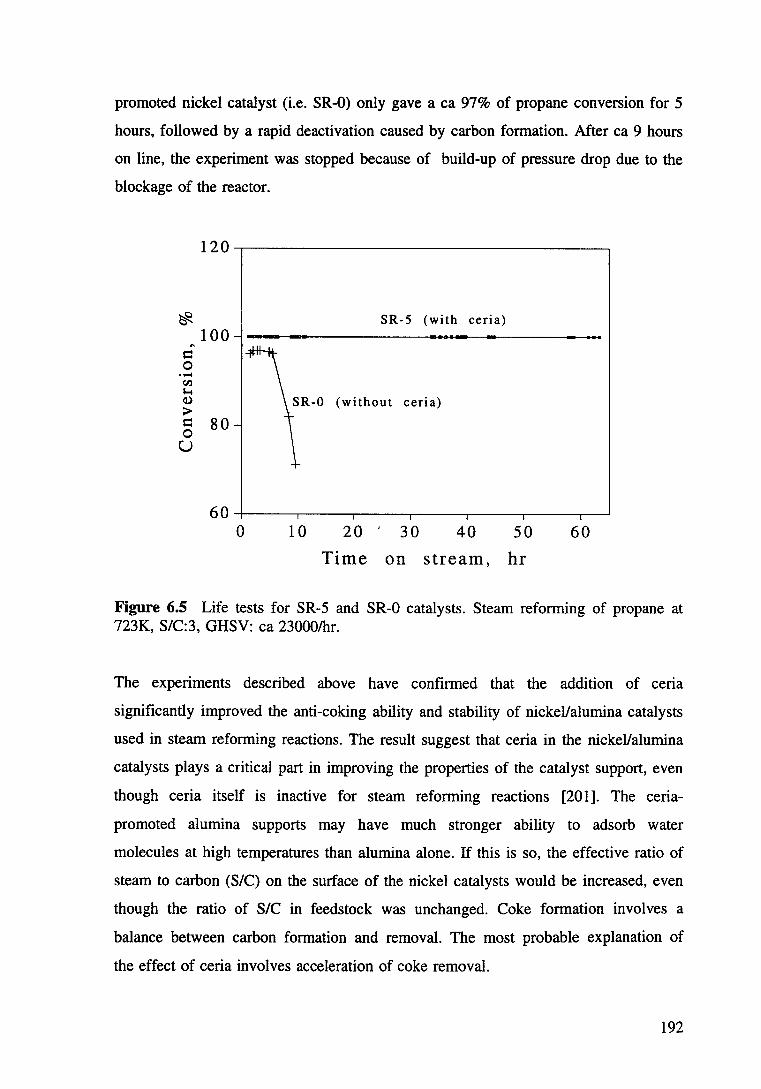
promoted nickel catalyst (i.e. SR-0) only gave a ea 97% of propane conversion for 5
hours, followed by a rapid deactivation caused by carbon formation. Mter ea 9 hours
on line, the experiment was stopped because of build-up of pressure drop due to the
blockage of the reactor.
120.---------------------------------.
~ ...
s:: 0 ..... tll ~ Q)
>
100
s:: 8 0 0 u
SR-5 (with ceria)
SR-0 (without ceria)
60~----~---.----.-----~--------~~ 0 10 20 ' 30 40 50 60
Time on stream, hr
Figure 6.5 Life tests for SR-5 and SR-0 catalysts. Steam reforming of propane at 723K, SIC:3, GHSV: ea 23000/hr.
The experiments described above have confirmed that the addition of ceria
significantly improved the anti-coking ability and stability of nickeValumina catalysts
used in steam reforming reactions. The result suggest that ceria in the nickeValumina
catalysts plays a critical part in improving the properties of the catalyst support, even
though ceria itself is inactive for steam reforming reactions [201]. The ceria
promoted alumina supports may have much stronger ability to adsorb water
molecules at high temperatures than alumina alone. If this is so, the effective ratio of
steam to carbon (SIC) on the surface of the nickel catalysts would be increased, even
though the ratio of SIC in feedstock was unchanged. Coke formation involves a
balance between carbon formation and removal. The most probable explanation of
the effect of ceria involves acceleration of coke removal.
192
Similar studies of the effect of heavier rare earth oxides (RE20 3) on methane
cracking and carbon gasification over nickel on a-Al10 3 catalysts has been reported
recently [133]. Lu et al determined the capacity of water adsorption and the rate of
methane cracking as well as the extent carbon gasification by steam on both RE::03-
doped and RE20 3-free nickel/a-alumina catalysts using the techniques of Temperature
Programmed Desorption of the adsorbed steam ~TPD), Temperature Programmed
Surface Cracking of methane (TPSC) and Temperature Programmed Surface Reaction
of deposited carbon with steam (TPSR) respectively. They observed that, after doping
RE:P3 on the alumina support, the amount of adsorbed water and the maximum rate
of carbon gasification by steam at 513K were increased by 35% and 192%
respectively, and the maximum cracking rate of methane at 803K increased by 14%.
The authors also reported that the addition of RE20 3 increased the dispersion of
nickel on a-alurnina and improved the catalytic properties of the catalysts [133]. No
increase of Ni dispersion was observed in the present studies (Table 6.1 ).
6.3.3 The Effect of Ceria added to NickeJ/alumina Catalysts on the
Product Selectivity of Methane Steam Reforming
Figures 6.6-6.8 present comparisons of the product selectivity of methane steam
reforming over both SR-0 and SR-5.
It is found that the selectivities of SR-5 to hydrogen and carbon dioxide at high
temperatures are much higher than that of SR-0, while the carbon monoxide
selectivity is lower than that of SR-0. In other words, the water-gas shift reaction
occurred on the surface of SR-5 much faster than that on SR-0, particularly when the
average temperatures of the catalyst bed were higher than 850K. This again indicates
that ceria enhances the ability of the catalysts for the adsorption of water. Due to the
equilibrium limitation of the water-gas shift reaction at different temperatures, there
is a peak value of C02 selectivity at a temperature range of 773-1073K for both SR-
0 and SR-5. Because SR-5 adsorbs more water than SR-0, the peak temperature in
the case of SR-5 is higher (ea 60K) than that of SR-0.
193
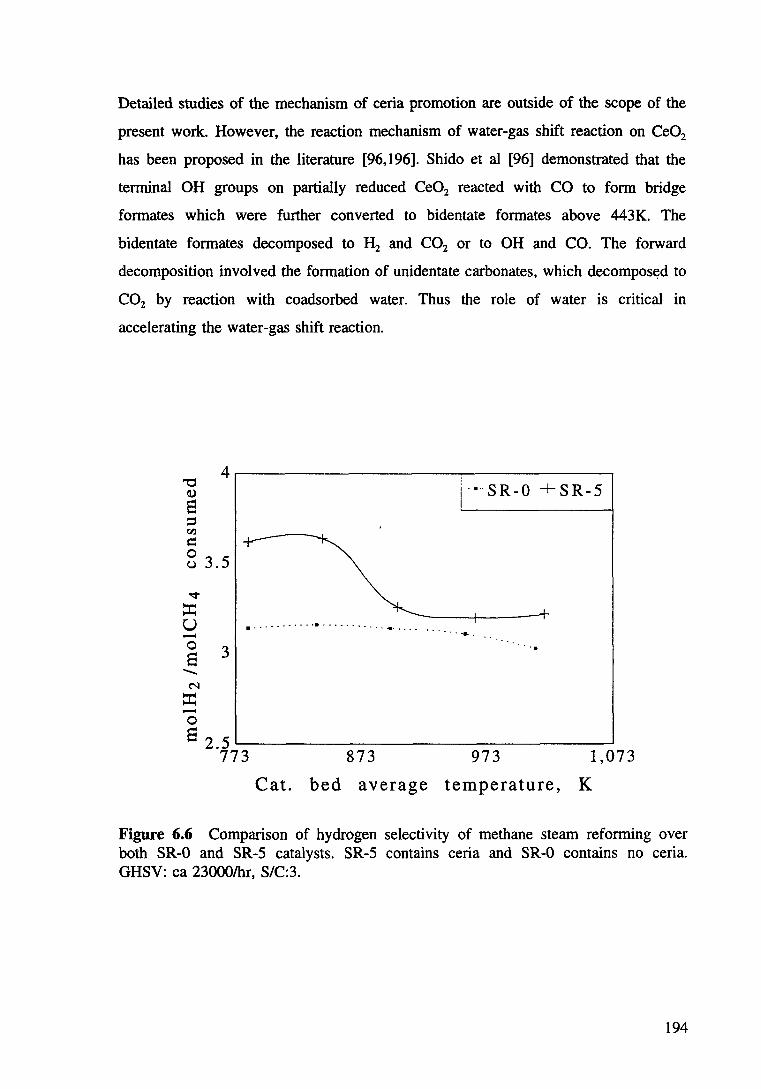
Detailed studies of the mechanism of ceria promotion are outside of the scope of the
present work. However, the reaction mechanism of water-gas shift reaction on Ce02
has been proposed in the literature [96.196]. Shido et al [96] demonstrated that the
terminal OH groups on partially reduced Ce02 reacted with CO to form bridge
formates which were further converted to bidentate formates above 443K. The
bidentate formates decomposed to H2 and C02 or to OH and CO. The forward
decomposition involved the formation of unidentate carbonates, which decompos~d to
C02 by reaction with coadsorbed water. Thus the role of water is critical in
accelerating the water-gas shift reaction.
4~----------------------~--------------~ ~ : ·•··SR-0 +SR-5 s ::s C"l.l
= 0 u 3.5
"V
:I: u - 3 0 s
.......... ("'
:I: -0
. -.-- .. - ......... - ... -.......... . . ..... ..
=2.5~------------------------------~ 773
Cat.
873 973
bed average temperature,
1,073
K
Figure 6.6 Comparison of hydrogen selectivity of methane steam reforming over both SR-0 and SR-5 catalysts. SR-5 contains ceria and SR-0 contains no ceria. GHSV: ea 23000/hr, S/C:3.
194
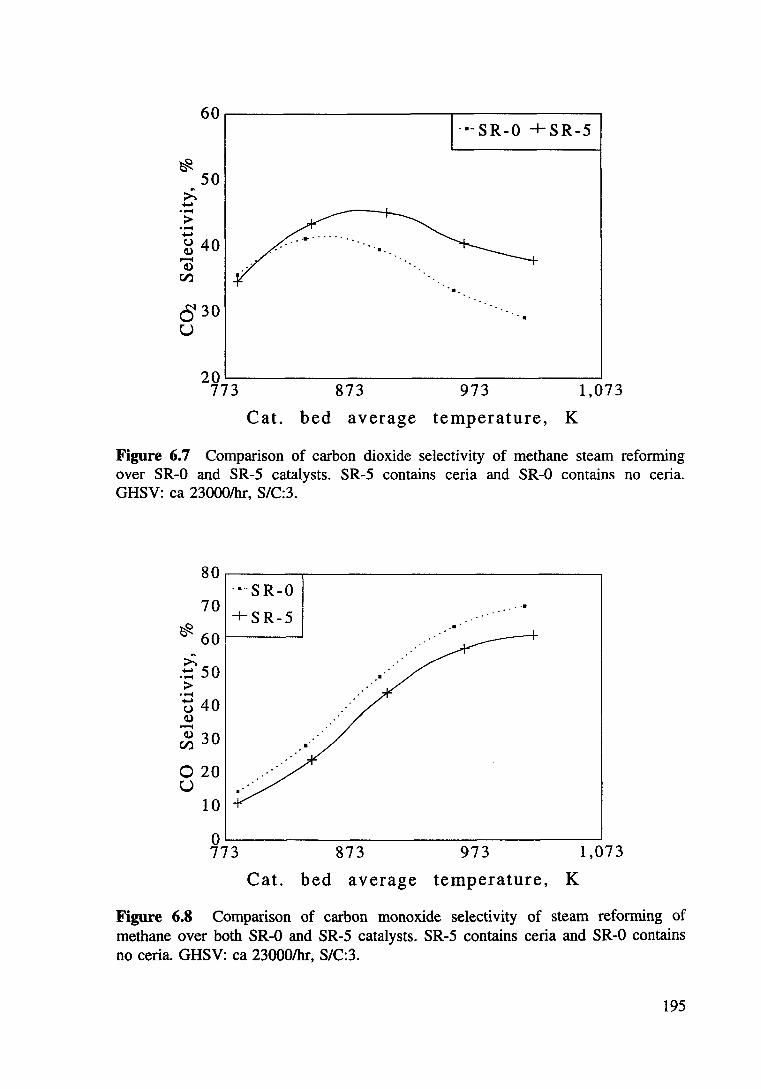
60~-------------------.-------------.
~
..... > ·.....
50
~ 40 -Cl.) rJ)
cS 30 u
··-SR-0 +SR-5
20~--------------------------------~ 773 873 973 1,073
Cat. bed average temperature, K
Figure 6.7 Comparison of carbon dioxide selectivity of methane steam reforming over SR-0 and SR-5 catalysts. SR-5 contains ceria and SR-0 contains no ceria. GHSV: ea 23000/hr, S/C:3.
80~----~----------------------------~ ····SR-0 ... 70 +SR-5
~ 60 1------~ ..
>. -~50 > ..... t) 40 Cl.) -~ 30
0 20 u
10
..
OL-------------------------------------~ 773 873 973 1,073
Cat. bed average temperature, K
Figure 6.8 Comparison of carbon monoxide selectivity of steam reforming of methane over both SR-0 and SR-5 catalysts. SR-5 contains ceria and SR-0 contains no ceria. GHSV: ea 23000/hr, S/C:3.
195
6.4 Conclusions
I. The ceria containing catalysts possess high BET and metallic surface areas.
Partial reduction of ceria was found under the operation conditions of
methane steam reforming.
2. The anti-coking ability of the ceria promoted nickel catalysts was almost
comparable with that of some excellent commercial steam reforming catalysts.
3. Addition of ceria to Ni/o-Al20 3 significantly increased the selectivities of
methane conversion to hydrogen and carbon dioxide, especially at high
temperatures. This indicated that water-gas shift reaction was accelerated by
ceria, probably due to the improved water adsorption ability.
196
Chapter 7 Hydrogen Production from Autothermic
Steam Reforming of Light Hydrocarbons
at Ambient Temperature
7.1 Introduction
Comprehensive studies of catalytic oxidation (Chapter 4) and steam reforming
(Chapter 5) of light hydrocarbons have indicated that a combination of both oxidation
and steam reforming reactions offers an optimal route for producing hydrogen from
light hydrocarbons economically and- efficiently. Previous studies with methanol
[ 10, 11] have shown that methanol oxidation over platinum based catalysts was
initiated at temperature as low as 273K and steam reforming of methanol promoted
by copper based catalysts took place at temperatures less than 573K. Hydrogen
production has been successfully achieved by combining the oxidation and steam
reforming of methanol. However, preliminary studies in Chapters 4 and 5 have
indicated that the catalytic oxidation of light hydrocarbons requires initiation
temperatures, which are much higher than the ambient temperature. In particular,
steam reforming of light hydrocarbons occurs at very high temperature (673-1073K).
It is more difficult to realise an autotherrnic hydrogen production system from light
hydrocarbons than from methanol.
Attempts have been made, in this chapter, to investigate the feasibility of initiating
the system of hydrogen production from light hydrocarbon at room temperature. In
this system, oxidation of light hydrocarbons is first initiated by catalytically
combusting an initiator, hydrogen or methanol, over a noble metal catalyst. This is
then followed by significant oxidation of light hydrocarbons over the same catalyst to
generate heat and steam. The heat so produced, brought by the steam and unreacted
hydrocarbon to the steam reforming bed of a nickel based catalyst, raises the
temperature of the bed to the "light out" value (or greater) where steam reforming
reactions occur and hydrogen is then produced by steam reforming the rest of
197
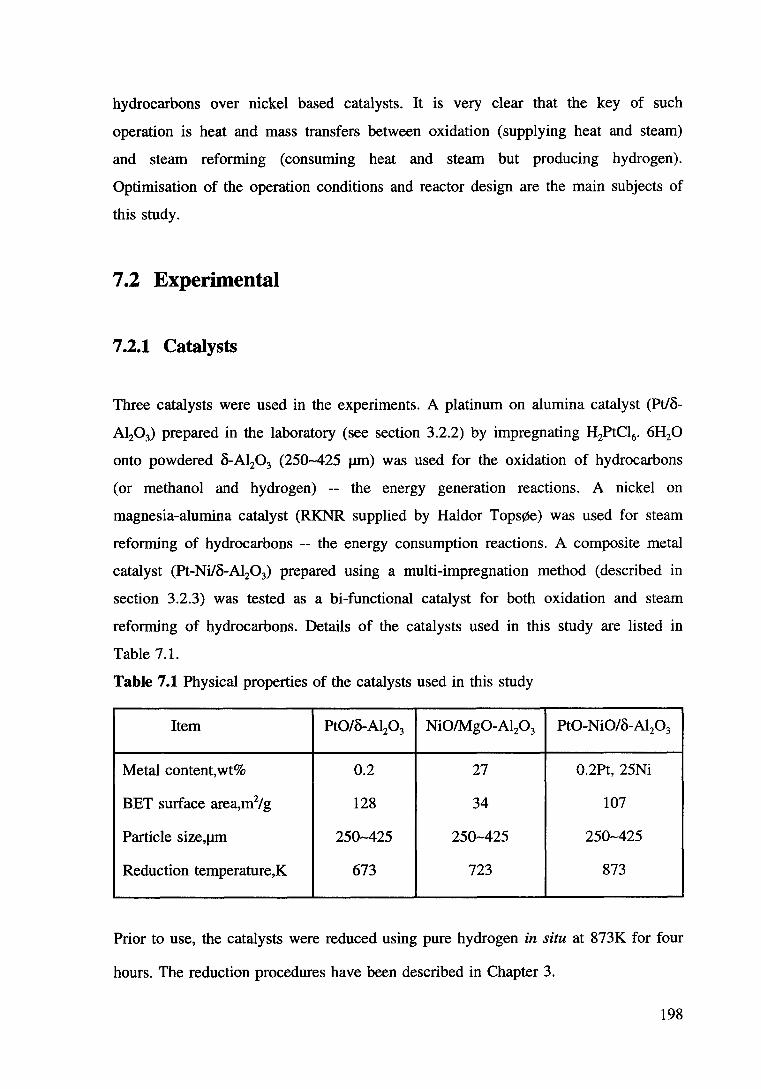
hydrocarbons over nickel based catalysts. It is very clear that the key of such
operation is heat and mass transfers between oxidation (supplying heat and steam)
and steam reforming (consuming heat and steam but producing hydrogen).
Optimisation of the operation conditions and reactor design are the main subjects of
this study.
7.2 Experimental
7 .2.1 Catalysts
Three catalysts were used in the experiments. A platinum on alumina catalyst (Pt/8-
Al203) prepared in the laboratory (see section 3.2.2) by impregnating H2PtC16• 6H20
onto powdered 8-Al20 3 (250-425 JliD) was used for the oxidation of hydrocarbons
(or methanol and hydrogen) -- the energy generation reactions. A nickel on
magnesia-alumina catalyst (RKNR supplied by Haldor Tops0e) was used for steam
reforming of hydrocarbons -- the energy consumption reactions. A composite metal
catalyst (Pt-Ni/8-A120 3) prepared using a multi-impregnation method (described in
section 3.2.3) was tested as a hi-functional catalyst for both oxidation and steam
reforming of hydrocarbons. Details of the catalysts used in this study are listed in
Table 7.1.
Table 7.1 Physical properties of the catalysts used in this study
Item Pt0/8-Al20 3 Ni0/Mg0-Al20 3 Pt0-Ni0/8-Al20 3
Metal content, wt% 0.2 27 0.2Pt, 25Ni
BET surface area,m2/g 128 34 107
Particle size,J.lm 250-425 250-425 250-425
Reduction temperature,K 673 723 873
Prior to use, the catalysts were reduced using pure hydrogen in situ at 873K for four
hours. The reduction procedures have been described in Chapter 3.
198
7 .2.2 Experimental Procedures
Both single bed and dual bed reactor configurations were involved in the experiments
using a tubular reactor fabricated from 13 mm O.D. stainless steel tube, as described
in section 3.3.1.1, and/or a bench-scale reactor described in section 3.3.1.2. A single
bed reactor system charged with Ptlo-A120 3 or Ni/Mg0-Al20 3 was used for the start
up test of the system or steam reforming of hydrocarbons respectively, while a
system charged with a composite metal catalyst or a mixture of Ptlo-Al20 3 and
Ni/Mg0-Al20 3 in one bed, or configured with a dual bed by oxidation catalyst
followed by a steam reforming catalyst was employed for the autothermic hydrogen
generation system (ie. the combination of oxidation and steam reforming of
hydrocarbons). About 0.5 g of catalyst was used for all experiments with either
single bed or dual bed. In the case of the dual bed, 0.2 g platinum based catalyst and
0.3 g nickel based catalyst were used for oxidation and steam reforming.
In start-up tests, a mixture of H/Air (H2:02=9) and/or CH30H/Air (CH30H:02= 0.8)
was introduced to the reactor charged with reduced Pt/o-AI20 3 catalyst at room
temperature and no external heat was supplied. The temperature in the catalyst bed
was monitored by a thermocouple and recorded by both a chart recorder and a
temperature indicator.
In steam reforming experiments, the reactor was heated electrically and the
temperature was adjusted to the desired values. A gas mixture of HCIN/COiH20
with various ratios of such as SIC, etc was admitted to the steam reforming catalyst.
The product flow rate was measured by a bubble meter and analysed by two on-line
gas chromatographs.
199
While in the combined configuration, where both oxidation and steam reforming
were affected, no external heat was supplied. Experiments were initiated from room
temperature by admission of hydrogen with air into the reaction system. Liquid feed
(water) was introduced by an ISCO LC-2600 syringe pump and gaseous feeds (such
as hydrocarbons and air) were metered individually through different lines, so that
the ratios of oxygen to hydrocarbons and water to hydrocarbons could be varied
independently. The reactor was insulated by Kaowool fibre and sealed in a Dewar
flask to minimise the heat loss. The bed temperature was monitored using a
thermocouple located in the centre of the reactor. Products were analysed by two on
line gas chromatographs.
7.3 Results and Discussions.
7 .3.1 Start-up of the System
Hydrogen or methanol is suggested as the initiator to start-up the_ proposed
autothermic hydrogen production system. Hydrogen is one of the products in this
process, which can be easily obtained from the previous operation. Methanol
oxidation over Pt/y-Al20 3 was reported [10] to take place at 273K and to produce
very high temperatures, so that it was considered as one of the candidates for
initiation of the system. Attempts were made to bum some of the reactive fuel (ie.
methanol or hydrogen) over Pt/8-Al20 3 in situ to heat the catalyst bed in the
autothermic system to the temperatures needed for the light off of light hydrocarbons.
200
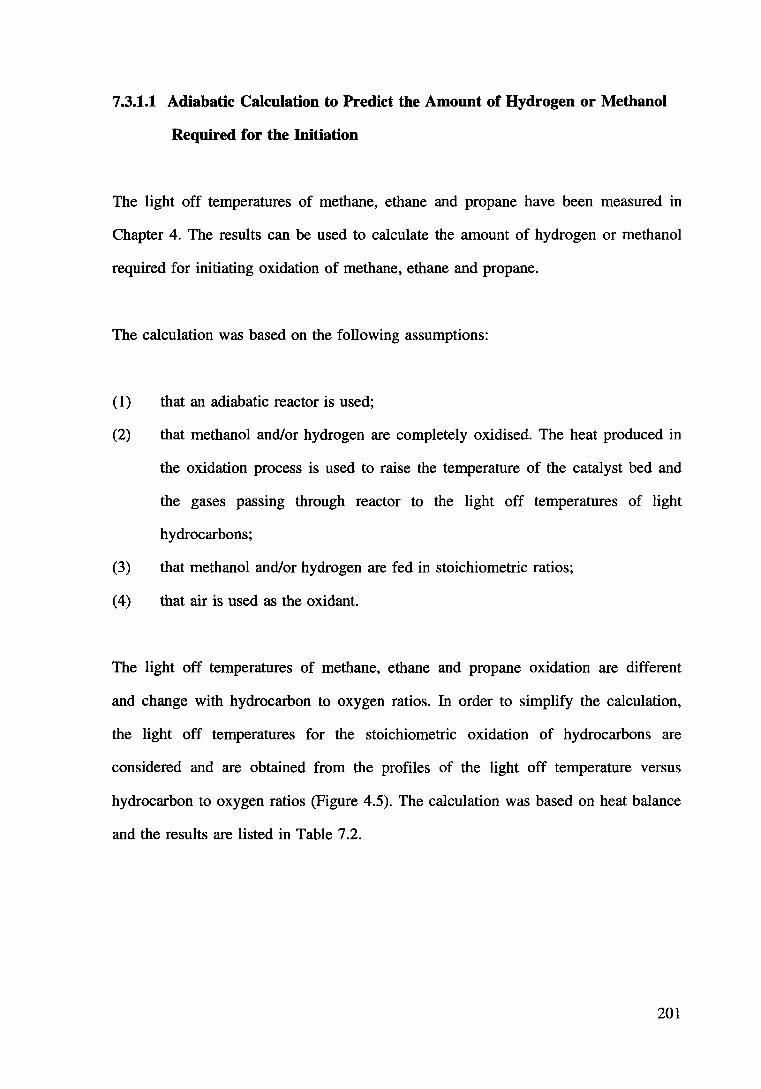
7 .3.1.1 Adiabatic Calculation to Predict the Amount of Hydrogen or Methanol
Required for the Initiation
The light off temperatures of methane, ethane and propane have been measured in
Chapter 4. The results can be used to calculate the amount of hydrogen or methanol
required for initiating oxidation of methane, ethane and propane.
The calculation was based on the following assumptions:
(1) that an adiabatic reactor is used;
(2) that methanol and/or hydrogen are completely oxidised. The heat produced in
the oxidation process is used to raise the temperature of the catalyst bed and
the gases passing through reactor to the light off temperatures of light
hydrocarbons;
(3) that methanol and/or hydrogen are fed in stoichiometric ratios;
(4) that air is used as the oxidant.
The light off temperatures of methane, ethane and propane oxidation are different
and change with hydrocarbon to oxygen ratios. In order to simplify the calculation,
the light off temperatures for the stoichiometric oxidation of hydrocarbons are
considered and are obtained from the profiles of the light off temperature versus
hydrocarbon to oxygen ratios (Figure 4.5). The calculation was based on heat balance
and the results are listed in Table 7 .2.
201
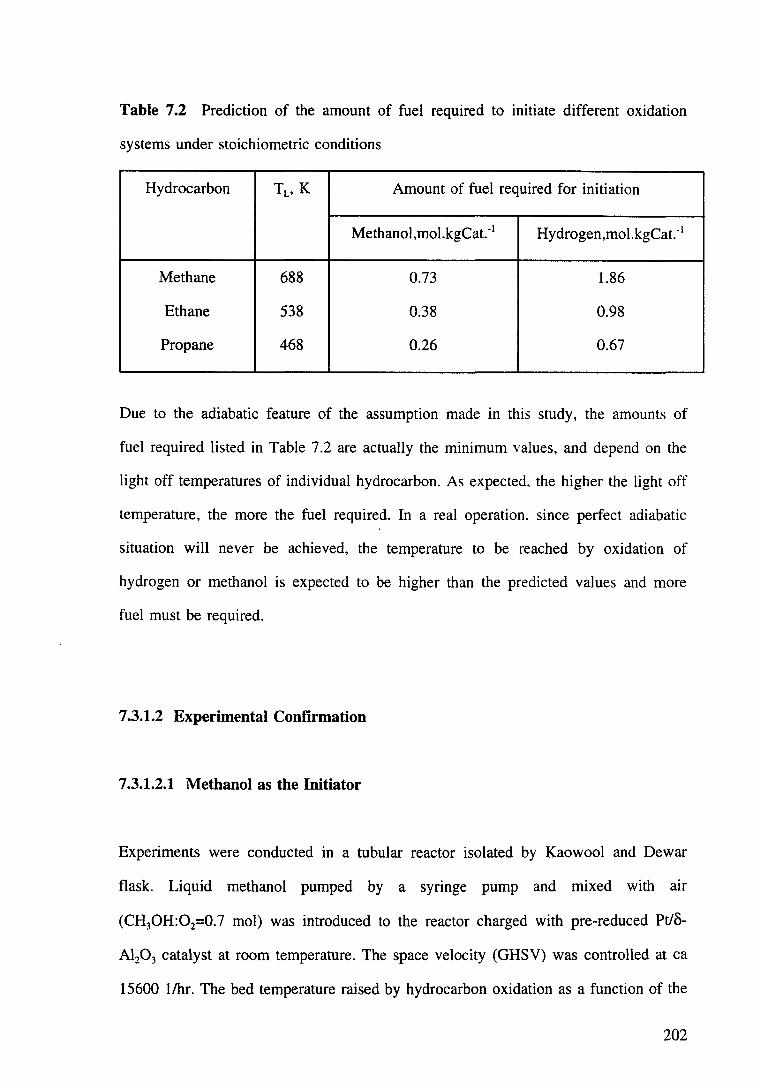
Table 7.2 Prediction of the amount of fuel required to initiate different oxidation
systems under stoichiometric conditions
Hydrocarbon TL, K Amount of fuel required for initiation
Methanol,mol.kgCat. -I Hydrogen,mol.kgCat. -I
Methane 688 0.73 1.86
Ethane 538 0.38 0.98
Propane 468 0.26 0.67
Due to the adiabatic feature of the assumption made in this study, the amounts of
fuel required listed in Table 7.2 are actually the minimum values, and depend on the
light off temperatures of individual hydrocarbon. As expected. the higher the light off
temperature, the more the fuel required. In a real operation. since perfect adiabatic
situation will never be achieved, the temperature to be reached by oxidation of
hydrogen or methanol is expected to be higher than the predicted values and more
fuel must be required.
7.3.1.2 Experimental Confirmation
7.3.1.2.1 Methanol as the Initiator
Experiments were conducted in a tubular reactor isolated by Kaowool and Dewar
flask. Liquid methanol pumped by a syringe pump and mixed with air
(CH30H:02=0.7 mol) was introduced to the reactor charged with pre-reduced Pt/o
Al203 catalyst at room temperature. The space velocity (GHSV) was controlled at ea
15600 1/hr. The bed temperature raised by hydrocarbon oxidation as a function of the
202
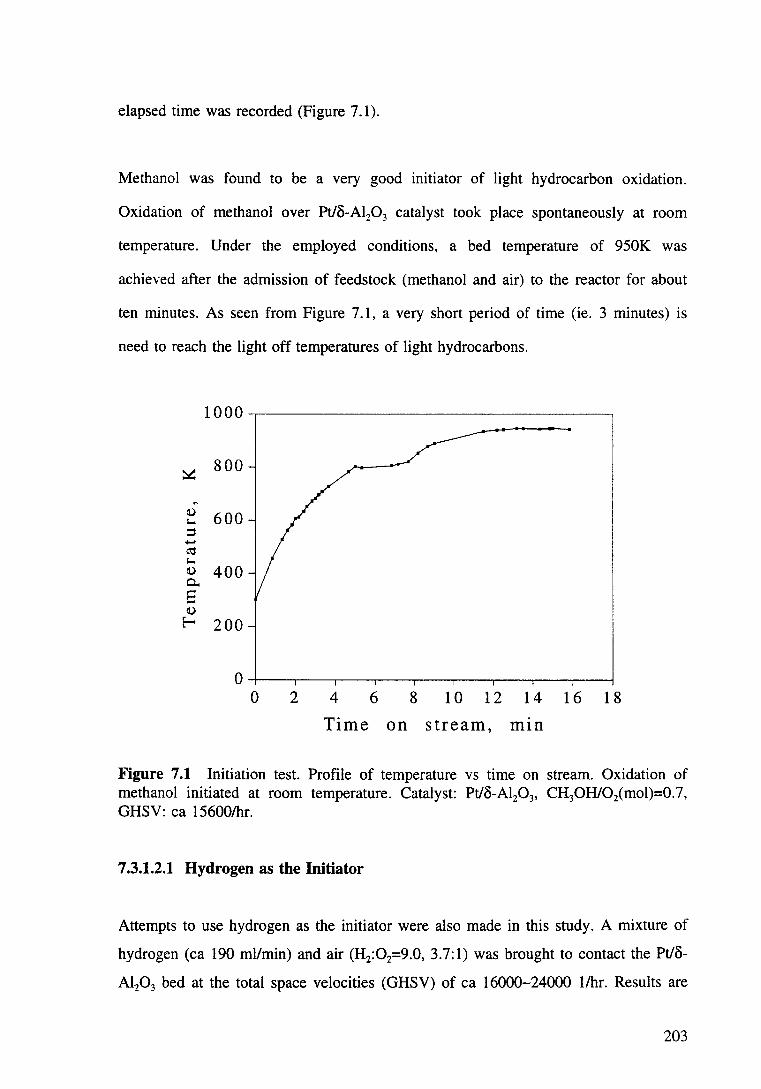
elapsed time was recorded (Figure 7.1).
Methanol was found to be a very good initiator of light hydrocarbon oxidation.
Oxidation of methanol over Pt/o-Al:P3 catalyst took place spontaneously at room
temperature. Under the employed conditions, a bed temperature of 950K was
achieved after the admission of feedstock (methanol and air) to the reactor for about
ten minutes. As seen from Figure 7.1, a very short period of time (ie. 3 minutes) is
need to reach the light off temperatures of light hydrocarbons.
~ 800
~
Q) 600 ~
= -~ ~ Q) 400 c.. 8 Q)
E-t 200
o,_--.---.---.---.---.---.---.---.---4
0 2 4 6 8 10 12 14 16 18
Time on stream, m1n
Figure 7.1 Initiation test. Profile of temperature vs time on stream. Oxidation of methanol initiated at room temperature. Catalyst: Pt/o-Al20 3, CH30H/Oimol)=0.7, GHSV: ea 15600/hr.
7.3.1.2.1 Hydrogen as the Initiator
Attempts to use hydrogen as the initiator were also made in this study. A mixture of
hydrogen (ea 190 mllmin) and air (H2:02=9.0, 3.7:1) was brought to contact the Pt/o
Al203 bed at the total space velocities (GHSV) of ea 16000-24000 1/hr. Results are
203
presented in Figure 7 .2.
Similar to the scenario of methanol oxidation over Pt/o-Al20 3, combustion of
hydrogen started at ambient temperature (ea 298K). The temperature of the catalyst
bed rose dramatically after introducing the feedstock and reached the light off values
required by the oxidation of all light hydrocarbons. The temperature achieved should
have been higher if there were no excess amount of hydrogen present in the feed.
Nevertheless, the resulting temperatures were still high enough to initiate the
oxidation of light hydrocarbons of interest. Compared with methanol, hydrogen is
more suited for the initiation of the proposed system, as it can be easily obtained
from the previous operation, although the risk of explosion must be remain a matter
of great concern.
673.-------------------------------~
0 573 1-4
= ..... t1:j
~ 473 ~
s 0
~ 373
273 0
l 0 I ml(S TP)/min •· .... · · · · · 'l90ml(STP)/min
3 6
Time on
250 ml(STP)/min air 190 ml(STP)/min hydrogen
air hydrogen
9 12 15
stream, mtn
Figure 7.2 Initiation test -- effect of flow rate of initiator. Temperature. vs time on stream. Oxidation of hydrogen initiated at room temperature. Catalyst: Pt/o-Al20 3•
The amount of methanol or hydrogen consumed to initiate the oxidation of individual
light hydrocarbons was obtained from the above experiments and the results are
shown in Table 7.3
204
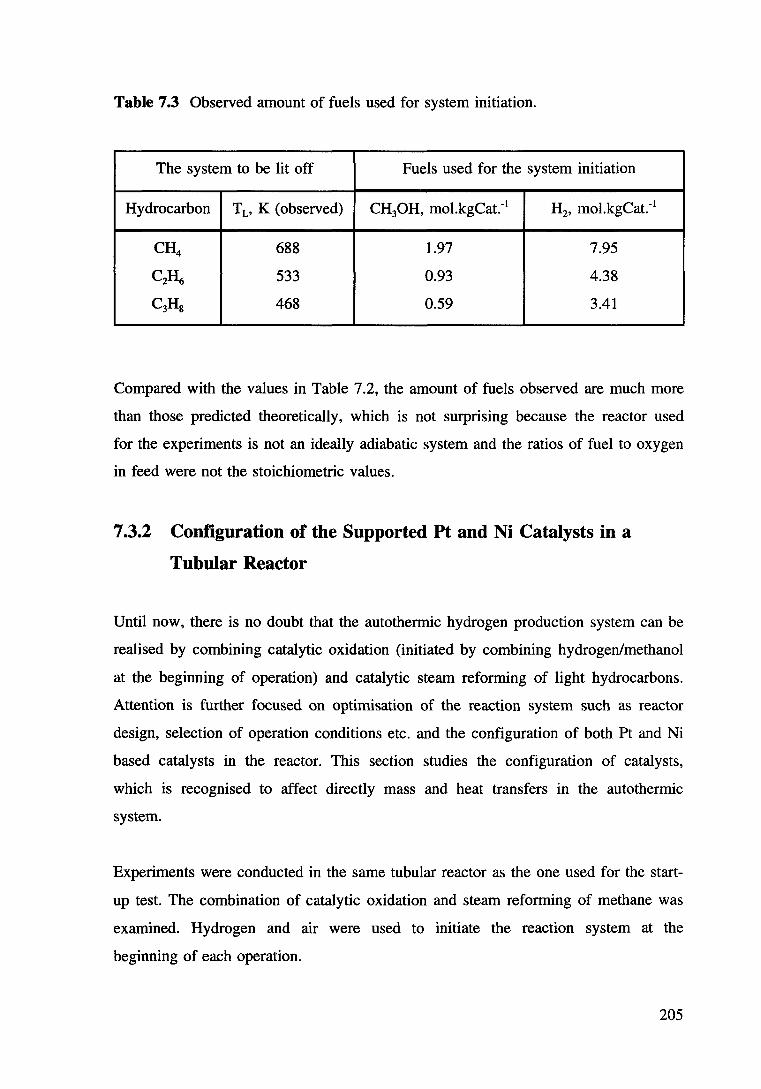
Table 7.3 Observed amount of fuels used for system initiation.
The system to be lit off Fuels used for the system initiation
Hydrocarbon T L• K (observed) CH30H, mol.kgCat.-1 H2, mol.kgCat.-1
CH4 688 1.97 7.95
C2H6 533 0.93 4.38
C3Hs 468 0.59 3.41
Compared with the values in Table 7 .2, the amount of fuels observed are much more
than those predicted theoretically, which is not surprising because the reactor used
for the experiments is not an ideally adiabatic system and the ratios of fuel to oxygen
in feed were not the stoichiometric values.
7 .3.2 Configuration of the Supported Pt and Ni Catalysts in a
Tubular Reactor
Until now, there is no doubt that the auto thermic hydrogen production system can be
realised by combining catalytic oxidation (initiated by combining hydrogen/methanol
at the beginning of operation) and catalytic steam reforming of light hydrocarbons.
Attention is further focused on optimisation of the reaction system such as reactor
design, selection of operation conditions etc. and the configuration of both Pt and Ni
based catalysts in the reactor. This section studies the configuration of catalysts,
which is recognised to affect directly mass and heat transfers in the autothermic
system.
Experiments were conducted in the same tubular reactor as the one used for the start
up test. The combination of catalytic oxidation and steam reforming of methane was
examined. Hydrogen and air were used to initiate the reaction system at the
beginning of each operation.
205
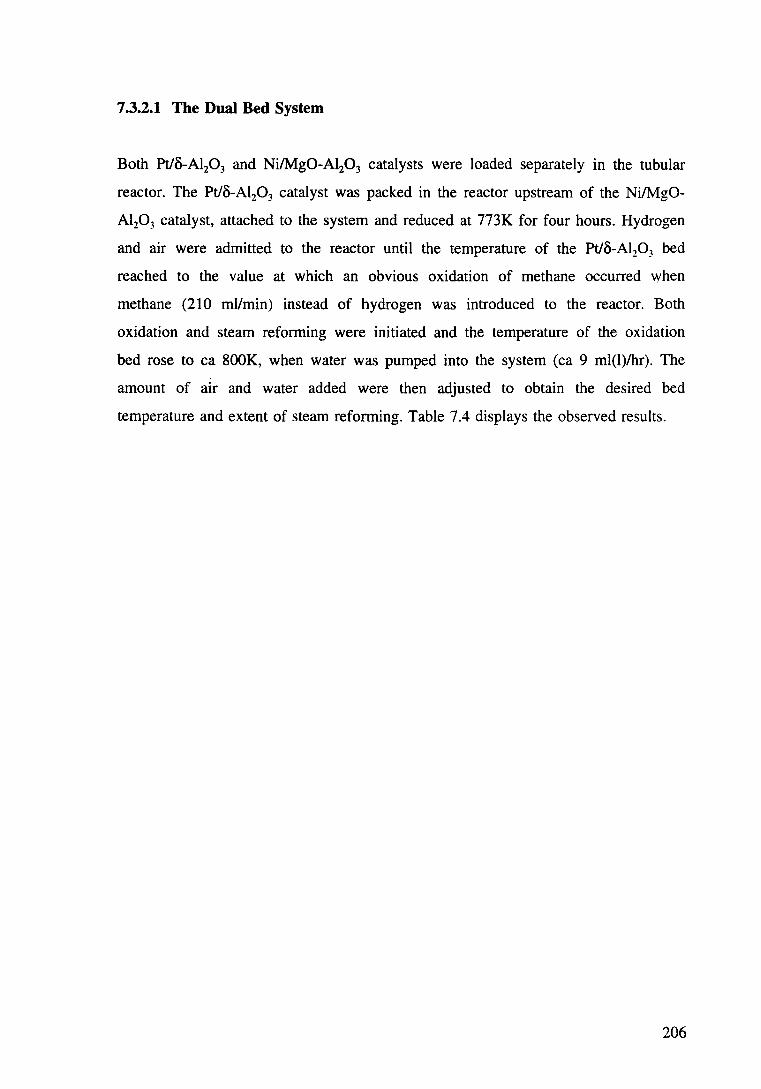
7.3.2.1 The Dual Bed System
Both Pt/o-Al20 3 and Ni/Mg0-Al20 3 catalysts were loaded separately in the tubular
reactor. The Pt/o-Al20 3 catalyst was packed in the reactor upstream of the Ni/Mg0-
Al203 catalyst, attached to the system and reduced at 773K for four hours. Hydrogen
and air were admitted to the reactor until the temperature of the Pt/o-Al20 3 bed
reached to the value at which an obvious oxidation of methane occurred when
methane (210 mllmin) instead of hydrogen was introduced to the reactor. Both
oxidation and steam reforming were initiated and the temperature of the oxidation
bed rose to ea 800K, when water was pumped into the system (ea 9 ml(l)lhr). The
amount of air and water added were then adjusted to obtain the desired bed
temperature and extent of steam reforming. Table 7.4 displays the observed results.
206
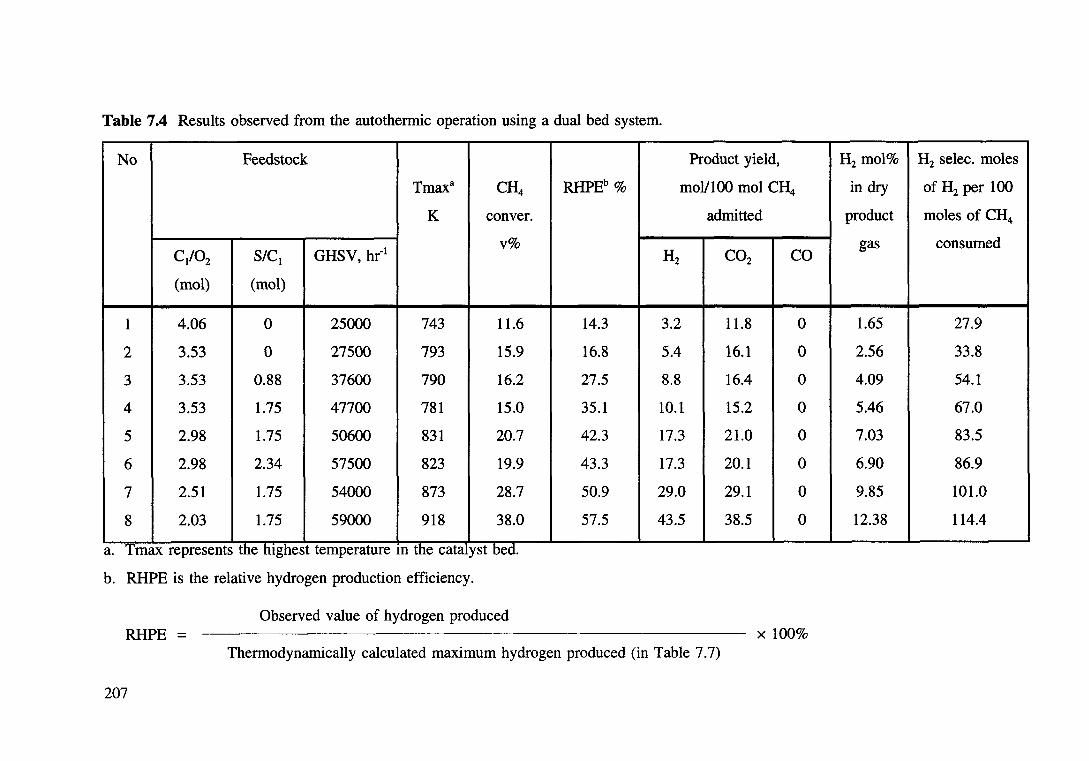
Table 7.4 Results observed from the autothermic operation using a dual bed system.
No Feedstock Product yield, H2 mol% H2 selec. moles
Tmaxa CH4 RHPEb% moV100 mol CH4 in dry of H2 per 100
K conver. admitted product moles of CH4
GHSV, hr-1 v% gas consumed
C/02 S/C1 H2 C02 CO
(mol) (mol)
1 4.06 0 25000 743 11.6 14.3 3.2 11.8 0 1.65 27.9
2 3.53 0 27500 793 15.9 16.8 5.4 16.1 0 2.56 33.8
3 3.53 0.88 37600 790 16.2 27.5 8.8 16.4 0 4.09 54.1
4 3.53 1.75 47700 781 15.0 35.1 10.1 15.2 0 5.46 67.0
5 2.98 1.75 50600 831 20.7 42.3 17.3 21.0 0 7.03 83.5
6 2.98 2.34 57500 823 19.9 43.3 17.3 20.1 0 6.90 86.9
7 2.51 1.75 54000 873 28.7 50.9 29.0 29.1 0 9.85 101.0
8 2.03 1.75 59000 918 38.0 57.5 43.5 38.5 0 12.38 114.4
a. Tmax re resents the hi hest tern erature in the cata p g p y st bed.
b. RHPE is the relative hydrogen production efficiency.
Observed value of hydrogen produced RHPE = X 100%
Thermodynamically calculated maximum hydrogen produced (in Table 7.7)
207

Comparisons at the same SIC1 ratio showed that, as the C/0: decreased, the amount
of methane converted increased, the maximum temperature increased and the
efficiency of conversion to hydrogen increased (runs 4, 5, 7. 8). In contrast, variation
of the SIC 1 ratio at constant CH./02 gave only small variations in conversions with
the efficiency to hydrogen increasing and the maximum temperature (Tmax)
decreasing with increasing SIC 1 ratios (runs 2, 3, 4). Given the dependence of the
rate of steam reforming on the partial pressure of steam (section 5.3.3), the latter
result is not surprising.
Although the use of two beds in the same reactor seemed produce hydrogen, its
selectivity is very low compared to carbon dioxide. Most methane was converted into
carbon monoxide and steam. High temperatures were observed in the oxidation ( the
Pt/8-Al:03) bed. However, the temperature in the steam reforming (the Ni/MgO
Al:P:) bed was much lower than the temperature in the Ptlo-Al20 3 bed because of
the limitation of heat transfer between the two beds, so that the steam reforming rate
was very low and small quantities of' hydrogen was produced. In the case of low
reforming conversion, the main products are hydrogen and carbon dioxide. Carbon
monoxide was undetectable. This is not surprising because, in this case, water gas
shift reaction occurred in the Ni/Mg0-Al20 3 bed converted nearly all the formed
carbon monoxide into carbon dioxide and hydrogen.
7 .3.2.2 A mixed bed system
In order to minimise the resistance to heat transfer between the oxidation and the
steam reforming beds, a mixed Pt/8-Al20 3 and Ni/Mg0-Al20 3 catalyst bed was used
for the autotherrnic hydrogen system. The amounts of Pt/8-Al20 3 and Ni/Mg0-Al20 3
used in this case are exactly the same as those used in the dual bed. Both catalysts
were mixed uniformly and charged as a single bed in the tubular reactor. The
reduction of catalysts and the operation of the reaction system were the same as
those described in Section 7 .3.2.1, except that the feed rates of methane and air were
changed to ea 160 ml(STP)Imin and 340 ml(STP)Imin respectively. Table 7.5
displays the results obtained from the experiments.
208
Table 7.5 Results observed from the autothermic operation using a mixed bed system.
No Feedstock Product yield, mol/1 00 mol H2 mol% H2 selec., mol
Tmax CH4 RHPE CH4 admitted in dry gas H2 per 100
GHSV, hr" 1 K conv. % mol CH4 C/02 S/C 1 H2 C02 CO
mol% converted (mol) (mol)
1 2.24 0 27500 855 38.1 50.4 37.9 25.7 12.1 12.59 99.48
2 2.24 1.17 37600 839 39.5 61.6 47.8 33.3 6.3 15.46 121.11
3 1.89 1.17 41100 888 53.3 71.3 74.9 41.6 11.7 20.17 140.45
4 1.89 1.56 44500 889 53.8 72.3 76.4 41.3 12.5 20.48 142.04
5 1.89 2.34 51300 851 54.9 76.9 82.9 45.0 9.9 21.38 151.06
6 1.55 1.56 49500 931 69.1 77.9 105.7 54.2 15.0 22.93 152.95
7 1.55 2.34 56000 908 70.1 78.0 107.1 50.5 19.6 23.03 152.82
8 1.35 2.34 60000 953 83.6 72.8 119.5 53.3 30.3 23.07 142.88
9 1.16 2.34 65000 1007 91.7 67.2 120.6 55.8 35.9 21.76 131.56
209
It is very clear that, under the conditions employed, high methane conversions (ea
38-92%) with excellent hydrogen product efficiencies (ea 50-80%) were obtained.
Hydrogen selectivity was greatly improved. For example, the ratios of H/(C02+C0)
in the products are ea l.0-1.4, compared with ea 0.3-l.l observed in the dual bed
system. Since both Pt/8-Al20 3 and Ni/Mg0-Al10 3 were mixed uniformly in one bed,
catalytic oxidation and steam reforming of methane perhaps took place at the same
time. Heat transfer between the two reactions was more efficient than in the dual bed
system. so that the temperatures for steam reforming reaction are much higher than
those in the dual bed system. Therefore, the reaction rates of steam reforming are
significantly enhanced and hydrogen yields are greatly improved. Since the steam
reforming reactions took place at high temperatures, significant amounts of carbon
monoxide were formed in the process.
The catalyst bed temperature, as controlled by the extent of the catalytic oxidation,
seem to be the most important variable in the system. However, too much oxygen (or
air) admitted to the reaction system can result in high bed temperature and high
conversion of methane but decreases the relative hydrogen production efficiencies
(RHPE) (see runs 7, 8, 9). There is a optimum condition (run 7) which presents the
highest RHPE. At this condition, RHPE was about 78% with 70% methane
conversion. The dry-basis H2 composition was about 23% and this is comparable to
the patented results from a Hot Spot reactor using methanol as feed [6].
7.3.2.3 An Uniform Bed System Using a Composite Metal (Pt-Ni) Catalyst
A further development to improve heat and mass transfers in the autothermic system
is to deposit both platinum and nickel metals on one support (8-Al20 3). In this case,
the reactions of heat generation (oxidation) and consumption (steam reforming) take
place on the same support.
Experiments were carried out using a Pto.2Ni2sf8-Al20 3 catalyst under the same
conditions as those used in the mixed bed system. The results are summarised in
Table 7.6
210
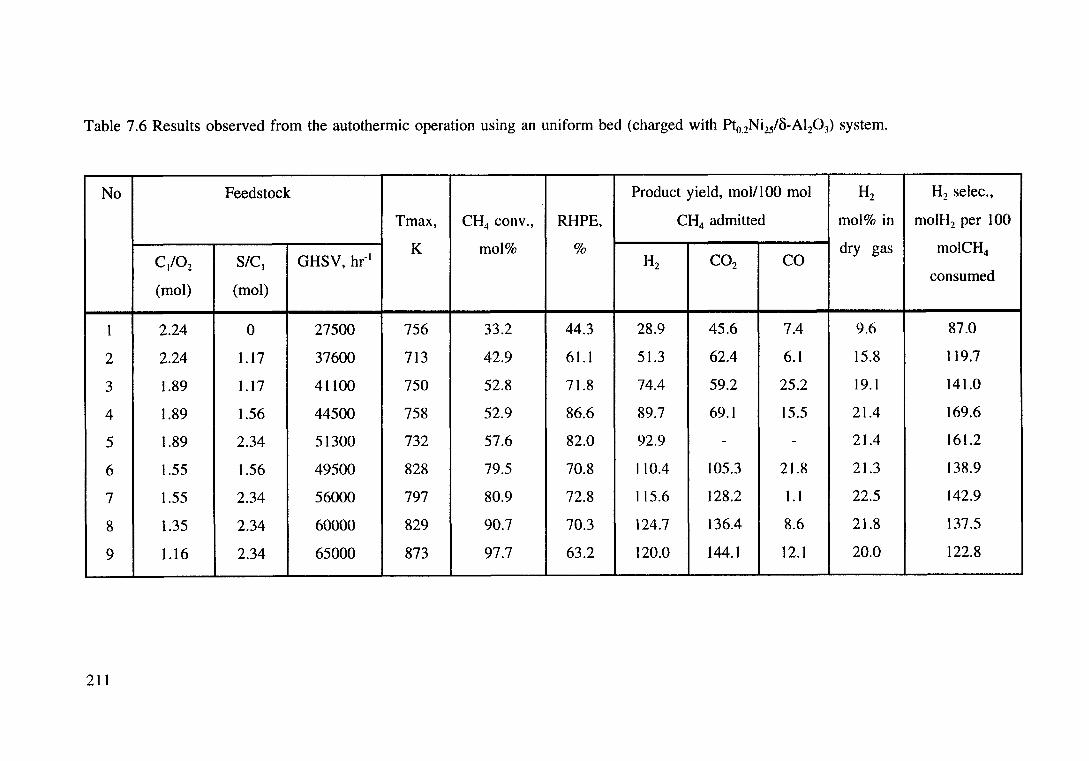
Table 7.6 Results observed from the autothermic operation using an uniform bed (charged with Pt0.2Ni2/<i-Al20 3) system.
No Feedstock Product yield, mol/1 00 mol Hz H2 selec.,
Tmax, CH4 conv., RHPE, CH4 admitted mol% in molH2 per 100
GHSV, hr-1 K mol% % dry gas molCH4
C/02 SIC) H2 C02 CO consumed
(mol) (mol)
1 2.24 0 27500 756 33.2 44.3 28.9 45.6 7.4 9.6 87.0
2 2.24 1.17 37600 713 42.9 61.1 51.3 62.4 6.1 15.8 119.7
3 1.89 1.17 41100 750 52.8 71.8 74.4 59.2 25.2 19.1 141.0
4 1.89 1.56 44500 758 52.9 86.6 89.7 69.1 15.5 21.4 169.6
5 1.89 2.34 51300 732 57.6 82.0 92.9 - - 21.4 161.2
6 1.55 1.56 49500 828 79.5 70.8 110.4 105.3 21.8 21.3 138.9
7 1.55 2.34 56000 797 80.9 72.8 115.6 128.2 1.1 22.5 142.9
8 1.35 2.34 60000 829 90.7 70.3 124.7 136.4 8.6 21.8 137.5
9 1.16 2.34 65000 873 97.7 63.2 120.0 144.1 12.1 20.0 122.8
211
From Table 7.6, it can be seen that hydrogen yields and methane conversions are
slightly higher, but the maximum temperatures (Tmax) in the catalyst bed at the
different conditions are much lower than those observed in the mixed bed system.
This means that the heat and mass transfers between oxidation and steam reforming
reactions in this case are better than the mixed bed or dual bed systems. Since both
platinum and nickel metals were supported on one alumina support, it can be
speculated that the exothermic oxidation and the endothermic steam reforming
reactions perhaps take place on the neighbouring active sites of platinum and nickel
respectively, and the heat and steam generated by the former reaction might be
directly utilised by the later reaction. The immediate heat and mass transfers result in
low bed temperatures and high hydrogen production efficiencies (ie. the maximum
value of RHPE ea 879'c) which are indicated in Table 7.6.
It is also found that the oxidation and steam reforming of methane over a composite
(ie. Pto_2Ni2sf8-Al20 3) catalyst produced less carbon monoxide than that over a
physical mixture of Pt/8-Al20 3 and Ni/Mg0-Al20 3 catalysts. This is explained in
terms of the relatively lower temperature in the uniform bed favouring the water-gas
shift reaction.
It is concluded that the composite metal (Pt-Ni) catalyst does catalyse oxidation and
steam reforming of light hydrocarbons simultaneously which may result in better
mass and heat transfers -- the most desired feature for the proposed system. More
work, however, has to be done to study and optimise the preparation techniques and
the characterisation of properties (ie. activity, selectivity and stability) before the
commercial use of the catalyst.
7.3.2.4 Comparison of the Working Efficiencies of the Different Catalyst Beds
From the results presented in Sections 7.3.2.1-7.3.2.3, it can be seen that the way of
combining platinum and nickel based catalysts is very important for the operation of
autothermic system. Production of hydrogen from this system highly depends on the
heat and mass transfers between the oxidation and steam reforming reactions. The
212
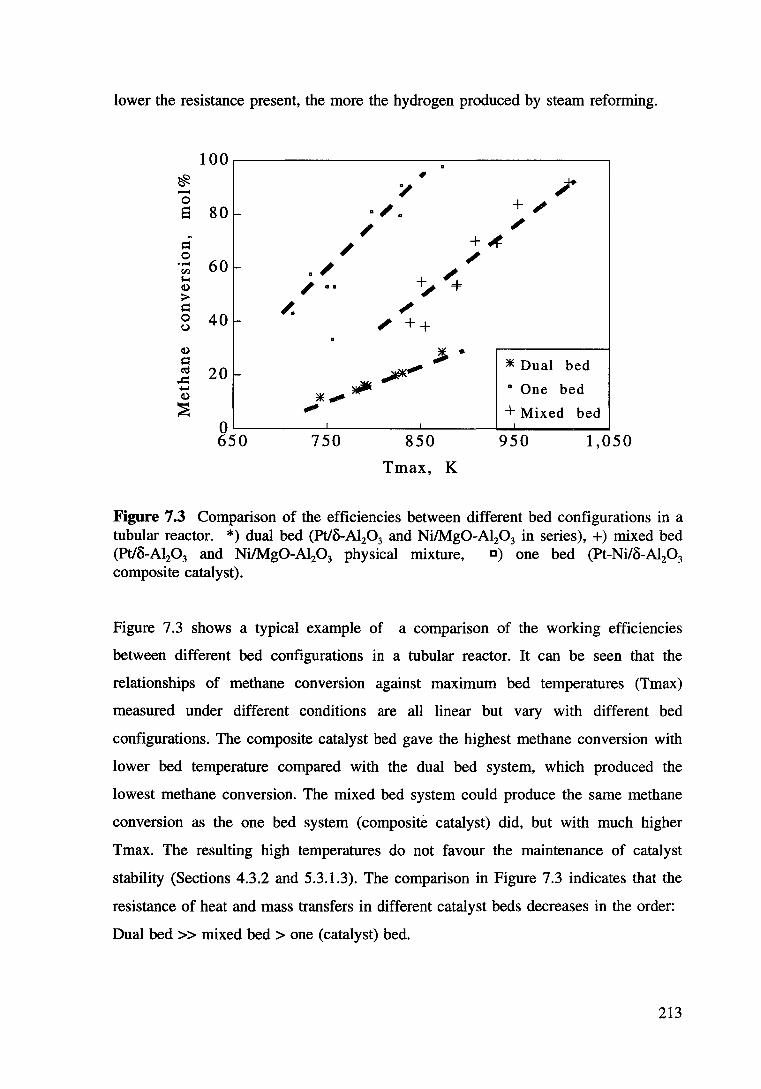
lower the resistance present, the more the hydrogen produced by steam reforming.
~ ....... 0 s
100~--------------------------------~
80- a~ a
60-
40-
*Dual bed
• One bed
+Mixed bed 0~------~------~------~~------~ 650 750 850 950 1,050
Tmax, K
Figure 7.3 Comparison of the efficiencies between different bed configurations in a tubular reactor. *) dual bed (Pt/o-Al20 3 and Ni/Mg0-Al20 3 in series), +) mixed bed (Pt/o-Al20 3 and Ni/Mg0-Al20 3 physical mixture, c) one bed (Pt-Ni/o-Al20 3
composite catalyst).
Figure 7.3 shows a typical example of a comparison of the working efficiencies
between different bed configurations in a tubular reactor. It can be seen that the
relationships of methane conversion against maximum bed temperatures (Tmax)
measured under different conditions are all linear but vary with different bed
configurations. The composite catalyst bed gave the highest methane conversion with
lower bed temperature compared with the dual bed system, which produced the
lowest methane conversion. The mixed bed system could produce the same methane
conversion as the one bed system (composite catalyst) did, but with much higher
Tmax. The resulting high temperatures do not favour the maintenance of catalyst
stability (Sections 4.3.2 and 5.3.1.3). The comparison in Figure 7.3 indicates that the
resistance of heat and mass transfers in different catalyst beds decreases in the order:
Dual bed >> mixed bed > one (catalyst) bed.
213
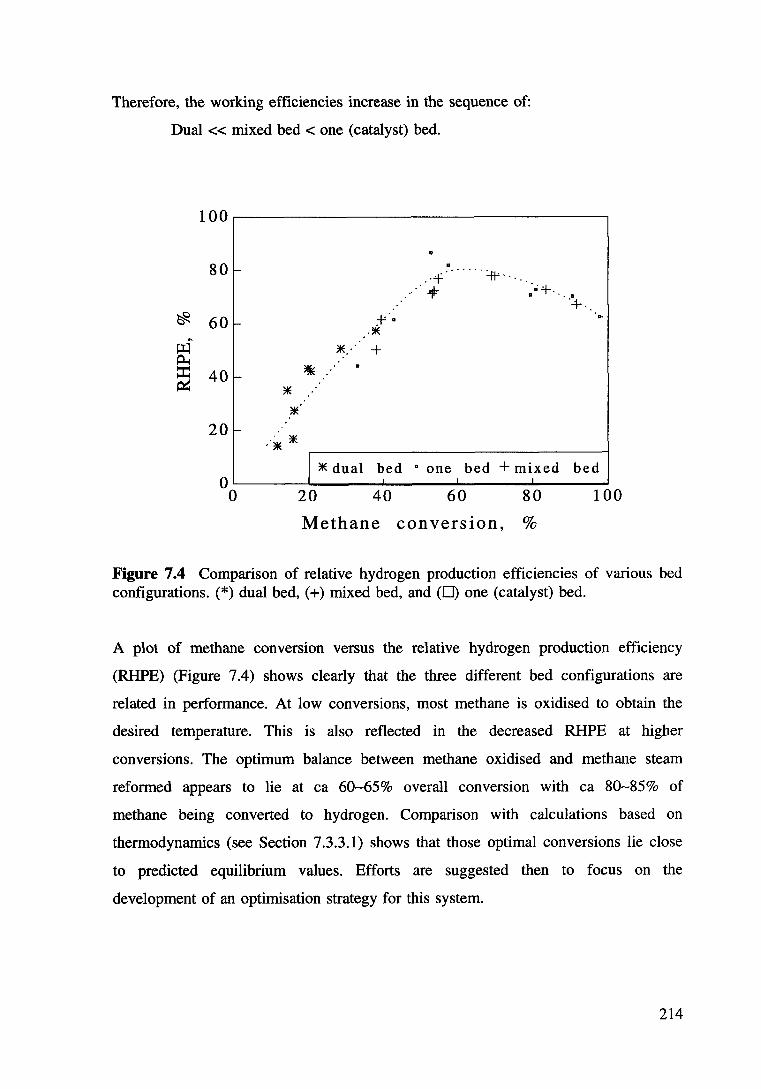
Therefore, the working efficiencies increase in the sequence of:
Dual<< mixed bed< one (catalyst) bed.
100~--------------------------------~
80 ,--
. -+ ······+·· .. .. ~·+· ... +. ~ 60 1- :+'·
·* ~
J::a *.·· + ~ ~ 40 - ~
~ *
* 20- .· * '*
j *dual bed • one bed +mixed bed 0 0 20 40 60 80 100
Methane conversion, %
Figure 7.4 Comparison of relative hydrogen production efficiencies of various bed configurations. (*)dual bed, (+)mixed bed, and (D) one (catalyst) bed.
A plot of methane conversion versus the relative hydrogen production efficiency
(RHPE) (Figure 7.4) shows clearly that the three different bed configurations are
related in performance. At low conversions, most methane is oxidised to obtain the
desired temperature. This is also reflected in the decreased RHPE at higher
conversions. The optimum balance between methane oxidised and methane steam
reformed appears to lie at ea 60-65% overall conversion with ea 80-85% of
methane being converted to hydrogen. Comparison with calculations based on
thermodynamics (see Section 7.3.3.1) shows that those optimal conversions lie close
to predicted equilibrium values. Efforts are suggested then to focus on the
development of an optimisation strategy for this system.
214
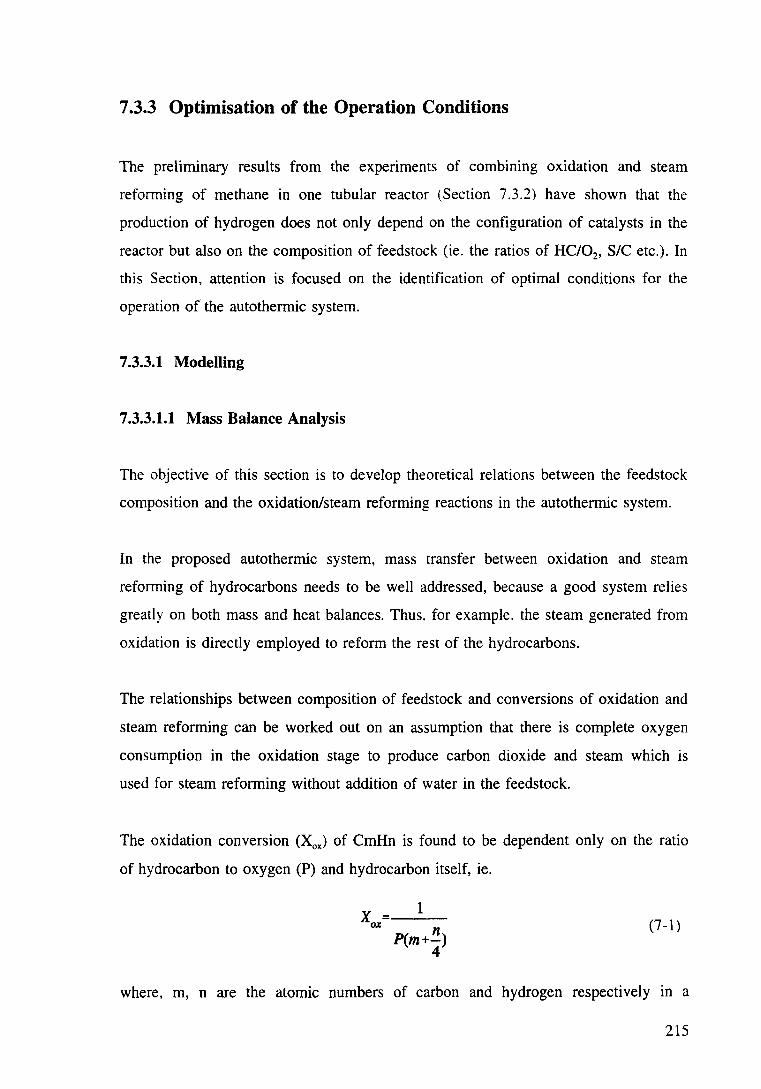
7 .3.3 Optimisation of the Operation Conditions
The preliminary results from the experiments of combining oxidation and steam
reforming of methane in one tubular reactor (Section 7.3.2) have shown that the
production of hydrogen does not only depend on the configuration of catalysts in the
reactor but also on the composition of feedstock (ie. the ratios of HC/02, SIC etc.). In
this Section, attention is focused on the identification of optimal conditions for the
operation of the autothermic system.
7 .3.3.1 Modelling
7.3.3.1.1 Mass Balance Analysis
The objective of this section is to develop theoretical relations between the feedstock
composition and the oxidation/steam reforming reactions in the autothermic system.
In the proposed autothermic system, mass transfer between oxidation and steam
reforming of hydrocarbons needs to be well addressed, because a good system relies
greatly on both mass and heat balances. Thus. for example. the steam generated from
oxidation is directly employed to reform the rest of the hydrocarbons.
The relationships between composition of feedstock and conversions of oxidation and
steam reforming can be worked out on an assumption that there is complete oxygen
consumption in the oxidation stage to produce carbon dioxide and steam which is
used for steam reforming without addition of water in the feedstock.
The oxidation conversion (X0x) of CmHn is found to be dependent only on the ratio
of hydrocarbon to oxygen (P) and hydrocarbon itself, ie.
1 n P(m+-) 4
(7-1)
where, m, n are the atomic numbers of carbon and hydrogen respectively m a
215
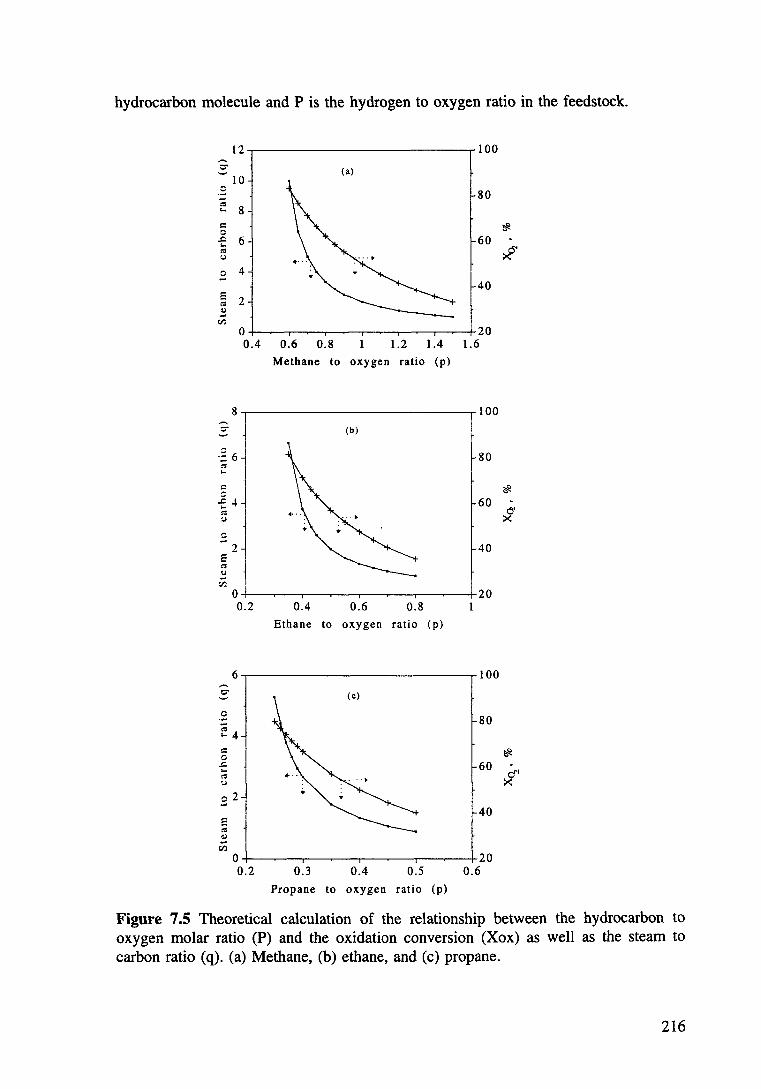
hydrocarbon molecule and P is the hydrogen to oxygen ratio in the feedstock.
12~------------------------~100
10
-:: 8 c _g 6 ... ~ u
0 4
~ 2 u -Cll
(a)
80
60
40
0+-~-.~~~-,--~r-~.-~-+20 0.4 0.6 0.8 1.2 1.4 1.6
Methane to oxygen ratio (p)
8~------------------------~100
.: 61 " ... c
~ 4j c -2 c ' - ~ " <.)
(b)
60
40
Cll I 0+-~--~--~--~~--~-----+20 0.2 0.4 0.6 0.8 1
Ethane to oxygen ratio (p)
0
~4
~2
80
~ 60 . er•
X
40
0+-----~--~--~~--~--~--+20 0.2 0.3 0.4 0.5 0.6
Propane to oxygen ratio (p)
Figure 7.5 Theoretical calculation of the relationship between the hydrocarbon to oxygen molar ratio (P) and the oxidation conversion (Xox) as well as the steam to carbon ratio (q). (a) Methane, (b) ethane, and (c) propane.
216
Similarly, the steam to carbon ratio (q) for the reforming reaction is shown to be a
function of these parameters (ie. P, m, n) as well, ie.
n q=------2m[P(m+n)-1]
4
(7-2)
For given hydrocarbon, Xox and q are only function of P. The profiles of q versus P
and Xox versus P for methane (a), ethane (b) and propane (c) are presented in Figure
7-5.
It can be seen from this figure that, if maintaining the steam to carbon ratio ( q) at 3
for the different hydrocarbon feedstocks, about 60% of methane or 67% of ethane or
70l:k of propane has to be oxidised in the assumed system to meet the need of steam
required for steam reforming. It seems that only 30-40% of hydrocarbons is left for
the steam reforming reaction to produce hydrogen. Thus, additional steam must be
supplied externally.
Assuming that N moles per minute of steam have to be added to the feedstock to
maintain an optimal value of steam to carbon ratio ( qopt) for the steam reforming
reaction, the following relationship can be established from a mass balance:
1 N=[q (P--) opt n
m+-4
F n ] C,H,
2(m+n) P 4
where, N is the moles per minute of steam to be added to feedstock.
FcmHn is the initial flow rate of hydrocarbon in feed, in mol/m.
(7-3)
The steam to carbon ratio (SIC) in feedstock should be controlled according to the
following equation:
217

(7-4)
or
(7-5)
where qopt can be considered as a constant (ie. qopt =3 or 4) which can be obtained
from the previous studies (Section 5.3.2.3);
The detailed derivation of the equations 7-1-5) is presented in Appendix IX.
The steam to carbon ratio (SIC) in the feedstock is also a function of the
hydrocarbon to oxygen molar ratios (P). Once an optimal value of P is found, the
values of SIC and Xox can be calculated using the equations 7-1 and 7-4.
The relationships between the molar ratio of hydrocarbon to oxygen (P) and the ratio
of steam to carbon (SIC) in the feedstock and/or the oxidation conversion have been
obtained. However, the optimum conditions are not known yet. Attention is further
focused on the optimisation of operation conditions.
7.3.3.1.2 Thermodynamic Calculations
This section aims at predicting the maximum hydrogen production and the optimum
operation conditions.
The oxidation of light hydrocarbons, after being initiated, produces steam and heat
which is consumed to elevate the temperature of the autothermic reaction system to a
new level (T) for the steam reforming reaction. The conversions of oxidation and
steam reforming are dependent on the composition of feedstock, particularly the ratio
of hydrocarbon to oxygen. Based on the mass and heat balances, a thermodynamic
calculation using methane as feed was carried out to predict the maximum hydrogen
218
production and the optimum composition of feedstock.
The calculations were based on the assumptions:
(1) that air and water are fed alone with methane;
(2) that 0 2 in the feedstock is completely consumed via total oxidation for
generation of heat and steam.
(3) that the heat generated in the oxidation stage is consumed to vaporise water
added to the feedstock and to heat the reaction system (including catalyst bed)
from the light off temperature of methane (ea. 673K) to the temperature (T)
required by steam reforming reaction and finally to sustain the endothermic
steam reforming reactions;
(4) that the heat loss between the reaction system and the environment is
negligible;
(5) that the amount of water added in the feedstock is controlled to maintain a
steam to carbon ratio of 3 for steam reforming reaction and can be calculated
using equation (7-3) to have the value of Fc~(3-5X0x) moles;
(6) that the equilibrium conversion of methane steam reforming is achieved.
According to these assumptions, the energy involved in the autothermic system
should be described by the equation (7 -6)
aH = aH1 + aH2 + aH3 + aHsR (7-6)
where, aH is the heat generated by total oxidation of methane at 673K, in J.
aH1 is the heat to be consumed by evaporating the water in feedstock from
298K toT K, in J.
aH2 is the heat to be consumed by heating the catalyst bed from 673K to T
K, in J.
aH3 is the heat to be consumed by elevating temperature of the gas mixture
after oxidation from 673K toT K, in J.
aHsR is the heat required by the steam reforming reaction, in J.
The values of AH, aH1, aH2, aH3 and aHsR can be calculated by the following
equations:
219
673
llH=Fc1(X0xllll 29Sox + J ll'Em;Cpp1)
298
T
llH1 =Fc1(3-5X0x)(llHLT+ J Cp
8n
2cfl1)
298
T
llH2=Mcatf CpcaflT 673
T
!lH3 =F c1 f EMiCppT
673
(7-7)
(7-8)
(7-9)
(7-10)
T (7-11) fl.HsR=FcP -Xox)(a.fl.H 298SR-~fl.H 29swo+ J (a.fl.En;Cpi+ ~fl.EniCpi)dT)
298
where, Fe1 is the moles of methane in inlet;
Xox is the oxidation conversion of methane;
.o.H29sox o, .o.H298sR o and .o.H298wG o are the standard reaction heats of methane
oxidation (2-6), steam reforming (2-15) the water-gas shift reaction (2-8) at 298K
respectively;
.o.EmiCpi = X0 x(2CpH20 +Cpc02)-(1-Xox)Cpc1, in J/(mol.K);
.o.HLT is the latent heat for vaporising water, in J/mol;
T is the temperature to be reached by the oxidation reaction, in K;
Meat is the amount of catalyst loaded in reactor, in mole;
EMiCpi=(l-X0 x)Cpc1+X0xCCpc02+2CpH2o(gJ)+7.524CpN2, in J/(mol.K);
a, ~ are the equilibrium conversions of reactions (2-15) and (2-8) respectively
at T K. The values of a, ~ at different temperatures can be obtained from Appendix
V;
220
.tJ:niCpi = 3CpH2 + Cpco- Cpc1 - CpH20, in J/(mol.K);
ALniCpi = CpH2 + CPcm- CPco- CpH20, in J/(mol.K);
Cpi is the heat capacity of i.
Cpi = ~ +biT+ ciT2• except Cpcar which is presented as:
Cpcat = 92.383 + 0.037547T- 2186140/T2, J/(mol.K) [151].
By numerically solving equation (7-6), the maximum values of hydrogen yield, the
conversions of oxidation and steam reforming as well as the temperature associated
with the reactions, at different compositions of feedstock can be calculated. The
calculation results are presented in Table 7. 7.
221

Table 7.7 Results of thermodynamic calculation of a combined methane oxidation and steam reforming system.
Feeds lock The maximum values could be achieved by the adiabatic process
Gas Yield, H20, No.
C/02 C/air SIC ·r X ox Xsu. mol/moiC 1 feed ml(l)/moiC 1 fed
(mol) (mol) (mol) K % % To be added in produced from
H2 C02 CO feed oxidation
1 2.97 0.62 2.12 673 17.53 16.35 0.65 0.004 0.335 38.22 6.31
2 2.19 0.46 1.77 773 24.70 35.60 1.34 0.051 0.552 31.77 8.89
3 1.68 0.35 1.36 873 32.79 57.12 1.95 0.222 0.677 24.49 11.80
4 1.45 0.31 l.ll 973 37.75 61.58 1.96 0.326 0.667 20.02 13.59
5 1.23 0.26 0.94 1073 41.13 58.83 1.77 0.347 0.652 16.98 14.81
222
From Table 7.7, it is obvious that decreasing the methane to oxygen ratio (ie.
increase of oxygen amount in feed) results in significant increase in the bed
temperature and the oxidation conversion. The hydrogen yield and steam reforming
conversion are also enhanced by decreasing the C/02 feed ratio. however, when the
value of C/02 is below 1.45. contrary results are obtained. This is not surprising
because. at a high C/02 ratio, less oxygen in the feed results in a low bed
temperature which is unfavourable for H2 production. When the C/02 value is less
than l.-t.5, the resulting oxidation conversion is higher than 37.8% which causes the
decrease in the steam reforming conversion because of less hydrocarbon (methane)
left for the steam reforming reaction.
It is also found that the ratio of SIC in the feedstock is proportional to the ratio of
methane to oxygen. As the C/02 ratio decreases. the amount of steam produced by
oxidation increases and the amount of water required to maintain the total SIC ratio
at unity for steam reforming reaction is correspondingly decreased. Consequently, the
ratio of steam to methane in feed decreases in the same manner as the_ ratio of
methane to oxygen.
Evidently, in order to obtain the maximum hydrogen production, the feed molar
ratios of air/methane and steain/methane should be controlled within the ranges of
2.86-3.33 and 1-1.4 respectively.
7.3.3.2 Experimental Confirmation
Thermodynamic analyses have indicated the relationship between feedstock
composition and oxidation/steam reforming reactions in the autothermic hydrogen
production system. The optimum feed conditions for maximum hydrogen production
(ie. ea 2 mol H/mol CH4) have been obtained.
In order to confirm the calculated results, simulation experiments were conducted.
To simplify the experiment, an assumption was made that, under the feedstock
compositions listed in Table 7. 7, the oxidation of methane to generate heat and steam
223
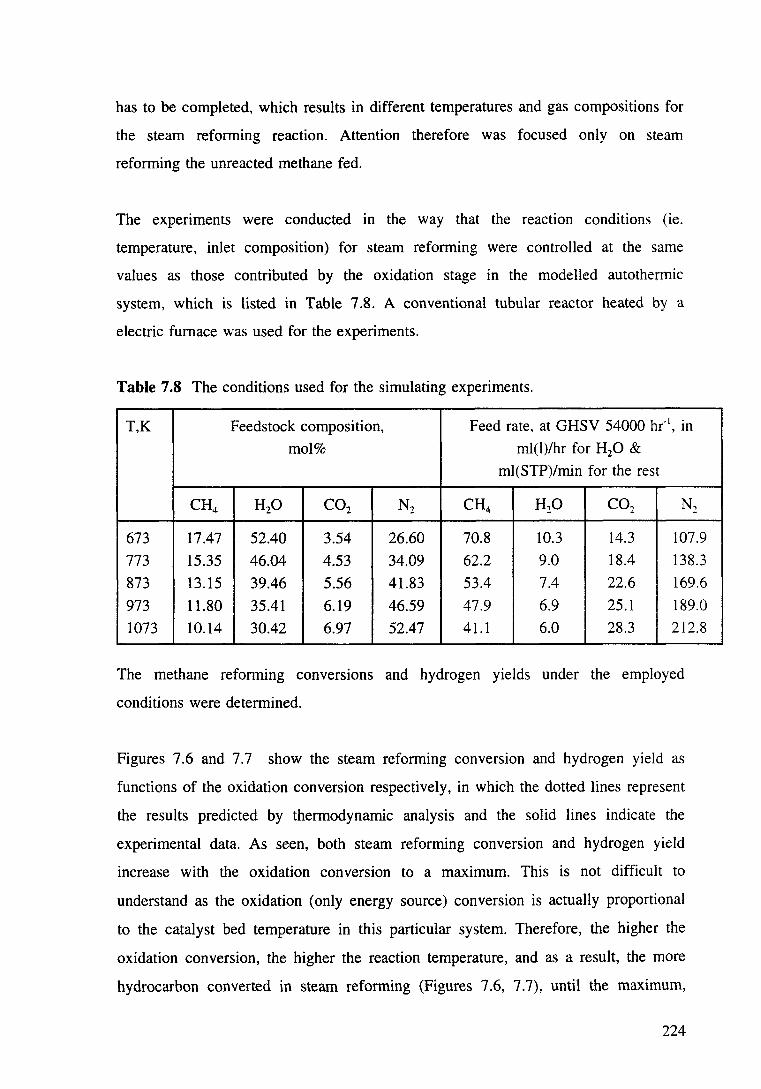
has to be completed, which results in different temperatures and gas compositions for
the steam reforming reaction. Attention therefore was focused only on steam
reforming the unreacted methane fed.
The experiments were conducted in the way that the reaction conditions (ie.
temperature, inlet composition) for steam reforming were controlled at the same
values as those contributed by the oxidation stage in the modelled autothennic
system, which is listed in Table 7 .8. A conventional tubular reactor heated by a
electric furnace was used for the experiments.
Table 7.8 The conditions used for the simulating experiments.
T,K Feedstock composition, Feed rate. at GHSV 54000 hr· 1, in
mol% ml(l)lhr for H20 &
ml(STP)/rnin for the rest
CH4 H20 C02 N2 CH4 H~O C02 N,
673 17.47 52.40 3.54 26.60 70.8 10.3 14.3 107.9
773 15.35 46.04 4.53 34.09 62.2 9.0 18.4 138.3
873 13.15 39.46 5.56 41.83 53.4 7.4 22.6 169.6
973 11.80 35.41 6.19 46.59 47.9 6.9 25.1 189.0
1073 10.14 30.42 6.97 52.47 41.1 6.0 28.3 212.8
The methane reforming conversions and hydrogen yields under the employed
conditions were determined.
Figures 7.6 and 7.7 show the steam reforming conversion and hydrogen yield as
functions of the oxidation conversion respectively, in which the dotted lines represent
the results predicted by thermodynamic analysis and the solid lines indicate the
experimental data. As seen, both steam reforming conversion and hydrogen yield
increase with the oxidation conversion to a maximum. This is not difficult to
understand as the oxidation (only energy source) conversion is actually proportional
to the catalyst bed temperature in this particular system. Therefore, the higher the
oxidation conversion, the higher the reaction temperature, and as a result, the more
hydrocarbon converted in steam reforming (Figures 7.6, 7.7), until the maximum,
224
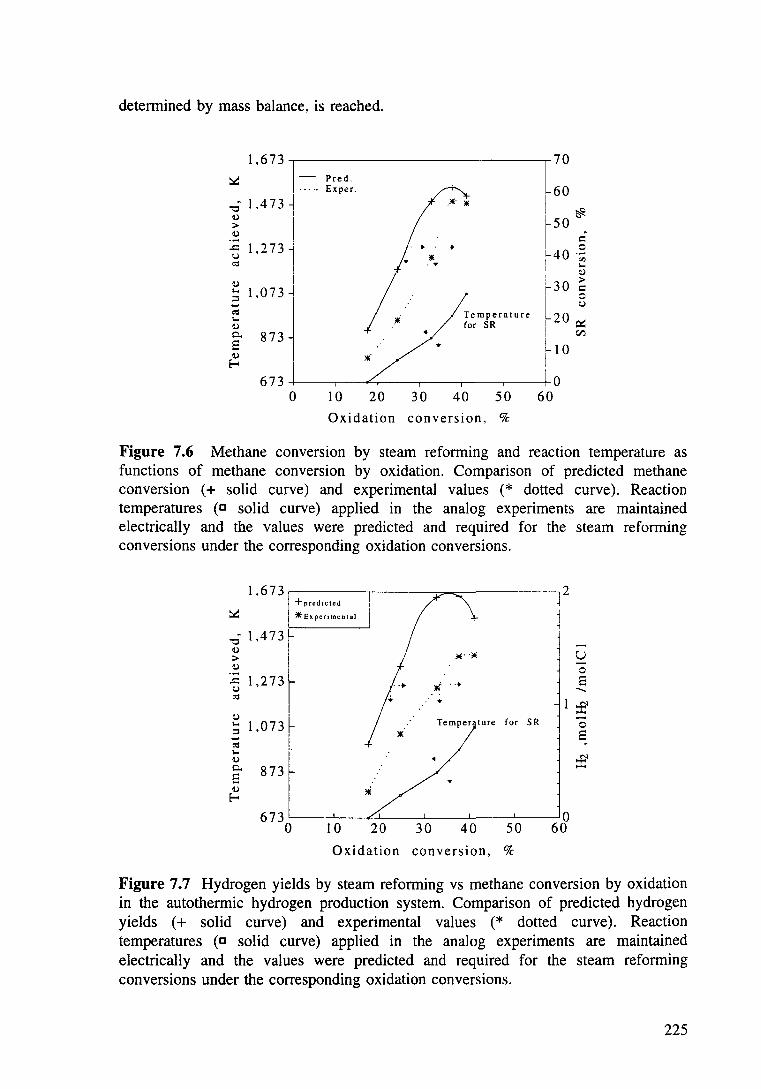
determined by mass balance, is reached.
1,673
1- [70 ~ Pred.
I ..... Exper. I 60 -o 1.473 ~ _liE· lK l I <;)
<Ll I ~50~ > I <Ll I I c:
..c: 1,2 73l + + 0 ()
• lK ~40 ·;;; ~ .... I '-I I <Ll
<Ll I ~30 ~ ... 1,0731 ;:! ' 0 .... ~20 ~ ~ Temperature ... ·* <Ll I for SR
c. 8731
.. ! en E •
t1o <Ll ll{ E-o
673 ,0 0 10 20 30 40 50 60
Oxidation conversion, %
Figure 7.6 Methane conversion by steam reforming and reaction temperature as functions of methane conversion by oxidation. Comparison of predicted methane conversion (+ solid curve) and experimental values (* dotted curve). Reaction temperatures (o solid curve) applied in the analog experiments are maintained electrically and the values were predicted and required for the steam reforming conversions under the corresponding oxidation conversions.
1.673 12 I +predicted ~
~ I *Expenmental
-Ql.473 j <Ll > liE""* I U ., -<Ll I 0
..c: 1,273 . ·+ ~ ··+ t; ()
~ ... .. •
<Ll Temperature for SR
J ~ ... 1,073 ;:! liE .... ~ ... <Ll £ c. 873 E <Ll lli
E-o
673 0 0 10 20 30 40 50 60
Oxidation conversion, %
Figure 7.7 Hydrogen yields by steam reforming vs methane conversion by oxidation in the autothermic hydrogen production system. Comparison of predicted hydrogen yields (+ solid curve) and experimental values (* dotted curve). Reaction temperatures (o solid curve) applied in the analog experiments are maintained electrically and the values were predicted and required for the steam reforming conversions under the corresponding oxidation conversions.
225
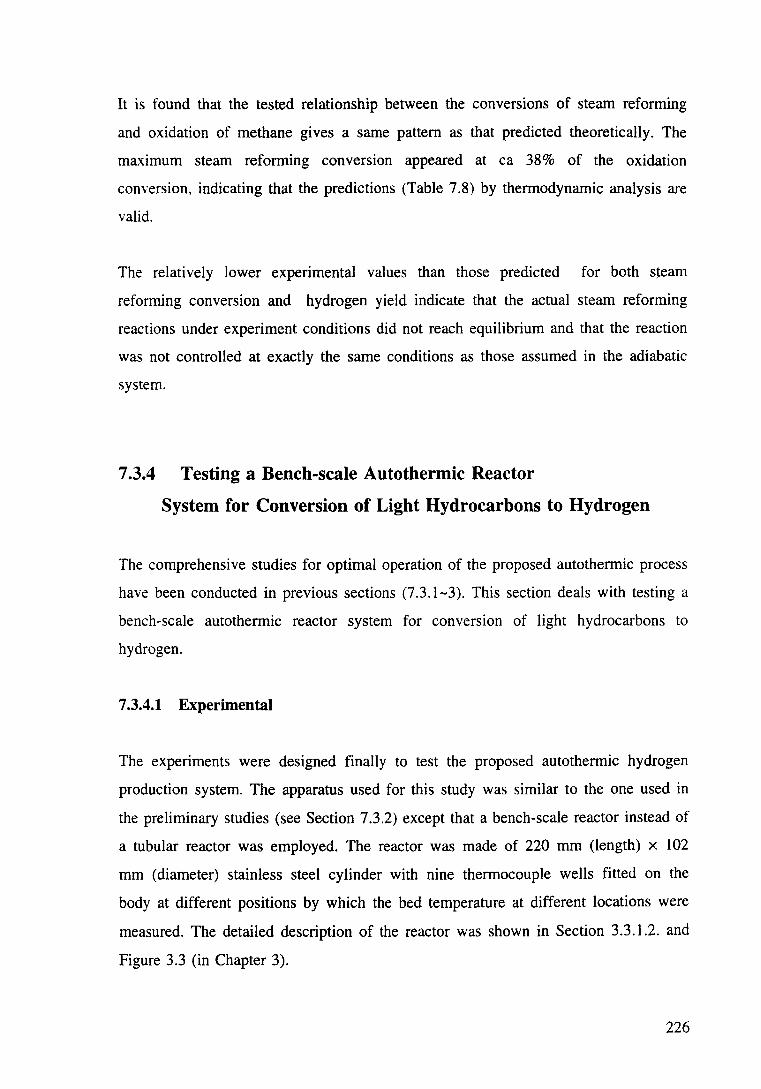
It is found that the tested relationship between the conversions of steam reforming
and oxidation of methane gives a same pattern as that predicted theoretically. The
maximum steam reforming conversion appeared at ea 38% of the oxidation
conversion, indicating that the predictions (Table 7 .8) by thermodynamic analysis are
valid.
The relatively lower experimental values than those predicted for both s~eam
reforming conversion and hydrogen yield indicate that the actual steam reforming
reactions under experiment conditions did not reach equilibrium and that the reaction
was not controlled at exactly the same conditions as those assumed in the adiabatic
system.
7 .3.4 Testing a Bench-scale Autothermic Reactor
System for Conversion of Light Hydrocarbons to Hydrogen
The comprehensive studies for optimal operation of the proposed autothermic process
have been conducted in previous sections (7 .3.1-3). This section deals with testing a
bench-scale autothermic reactor system for conversion of light hydrocarbons to
hydrogen.
7.3.4.1 Experimental
The experiments were designed finally to test the proposed autothermic hydrogen
production system. The apparatus used for this study was similar to the one used in
the preliminary studies (see Section 7.3.2) except that a bench-scale reactor instead of
a tubular reactor was employed. The reactor was made of 220 mm (length) x 102
mm (diameter) stainless steel cylinder with nine thermocouple wells fitted on the
body at different positions by which the bed temperature at different locations were
measured. The detailed description of the reactor was shown in Section 3.3.1.2. and
Figure 3.3 (in Chapter 3).
226
About 150 grams of RKNR catalyst mixed with ea 40 grams of PtO/ Al20 3 were used
for this study. Due to the limitation of heating facility for the bench-scale reactor in
the laboratory, the reduction of the catalyst was carried out off-line in a tubular
reactor at the same conditions as those described in Chapter 3. The reduced mixture
was immersed into liquid methanol at room temperature to prevent post-oxidation.
The wet mixture was then transfered to the sample holder in the reactor and dried
gradually under a temperature range of 333-623K with a flow of oxygen-Jree
nitrogen passing through overnight.
The charged reactor was insulated by Kaowool fibre to minimise heat loss between
the reactor wall and the environment and then connected to the flow system
(described in 3.3.3) at ambient temperature. Methanol was bubbled into the reactor
by passing air (180 ml(STP)/min) through a thermostatted methanol saturator (at
303K).
It was observed that, when methanol and air was admitted to the reactor, the
temperature of the inlet catalyst bed increased rapidly and, within a few minutes,
reached ea 723K. At this temperature, a flow of methane (240 ml(STP)/min) and air
(590 ml(STP)/min) instead of the mixture of methanol and air was introduced to the
reactor.
Continuous oxidation of part of methane further heated the inlet catalyst bed to
temperatures higher than 873K at which steam reforming of methane took place.
Composition of the feedstock (ie. air/methane, steam/methane) was varied by
changing the amount of air and steam, so that the gas velocity in the bed was
different. The temperature along the catalyst bed were monitored by nine
thermocouples located in the wells. The product compositions at various feeding
conditions were determined.
227
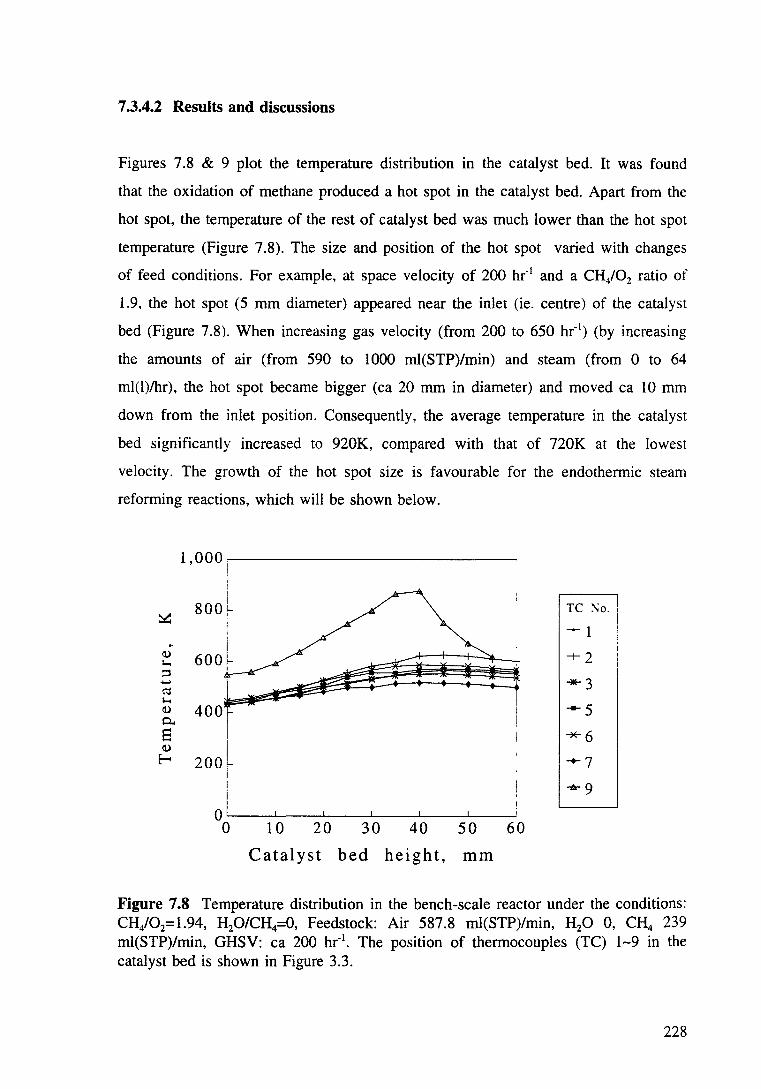
7 .3.4.2 Results and discussions
Figures 7.8 & 9 plot the temperature distribution in the catalyst bed. It was found
that the oxidation of methane produced a hot spot in the catalyst bed. Apart from the
hot spot, the temperature of the rest of catalyst bed was much lower than the hot spot
temperature (Figure 7.8). The size and position of the hot spot varied with changes
of feed conditions. For example, at space velocity of 200 hr- 1 and a CH/02 ratio of
1.9, the hot spot (5 mm diameter) appeared near the inlet (ie. centre) of the catalyst
bed (Figure 7.8). When increasing gas velocity (from 200 to 650 hr- 1) (by increasing
the amounts of air (from 590 to 1000 ml(STP)/min) and steam (from 0 to 64
ml(l)/hr), the hot spot became bigger (ea 20 mm in diameter) and moved ea 10 mm
down from the inlet position. Consequently, the average temperature in the catalyst
bed significantly increased to 920K, compared with that of 720K at the lowest
velocity. The growth of the hot spot size is favourable for the endothermic steam
reforming reactions, which will be shown below.
1,ooo I
l
800~ TC :-.;o. ~ ' I ~1
I ~
600~ V --+-2 1-o ::l I
....... "'*3 C'::l 1-o V 0..
400 ---5
8 *"6 V
E-< 200r -+--7
...... 9
0 0 10 20 30 40 50 60
Catalyst bed height, mm
Figure 7.8 Temperature distribution in the bench-scale reactor under the conditions: CH/02= 1.94, H20/CH4=0, Feedstock: Air 587.8 ml(STP)/min, H20 0, CH4 239 ml(STP)/min, GHSV: ea 200 hr-1
• The position of thermocouples (TC) 1-9 in the catalyst bed is shown in Figure 3.3.
228
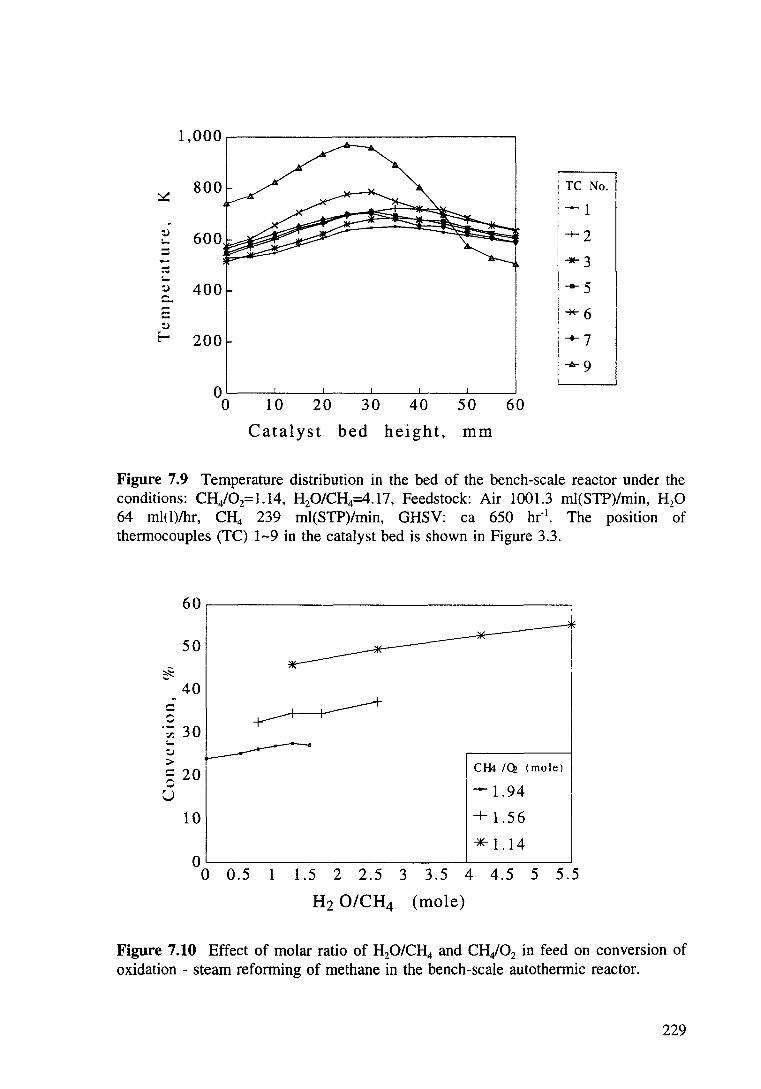
~
. !) :... :::::; --.,. !)
c.. .... :::: !)
E-
1,000
800
600
400
200
0~--~----~--~----~--~--~ 0 10 20 30 40 50 60
Catalyst bed height, mm
TC No.
---5 ! 1*"6
1~7 , ...... 9 I
Figure 7.9 Temperature distribution in the bed of the bench-scale reactor under the conditions: CH/02= 1.14, H20/CH4=4.17, Feedstock: Air 1001.3 rnl(STP)/min, H20 64 ml(})/hr, CH4 239 ml(STP)/min, GHSV: ea 650 hr-1
• The position of thermocouples (TC) 1-9 in the catalyst bed is shown in Figure 3.3.
60
50
* ..... 40 .
:::: ~
·:;; 30 :... !)
> ~ 20 ...,;
u 10
0 0 0.5 1
CH4 IQ. (mole)
--1.94
+ 1.56
* 1.14
1.5 2 2.5 3 3.5 4 4.5 5 5.5
H2 0/CH4 (mole)
Figure 7.10 Effect of molar ratio of H20/CH4 and CH/02 in feed on conversion of oxidation - steam reforming of methane in the bench-scale autothermic reactor.
229
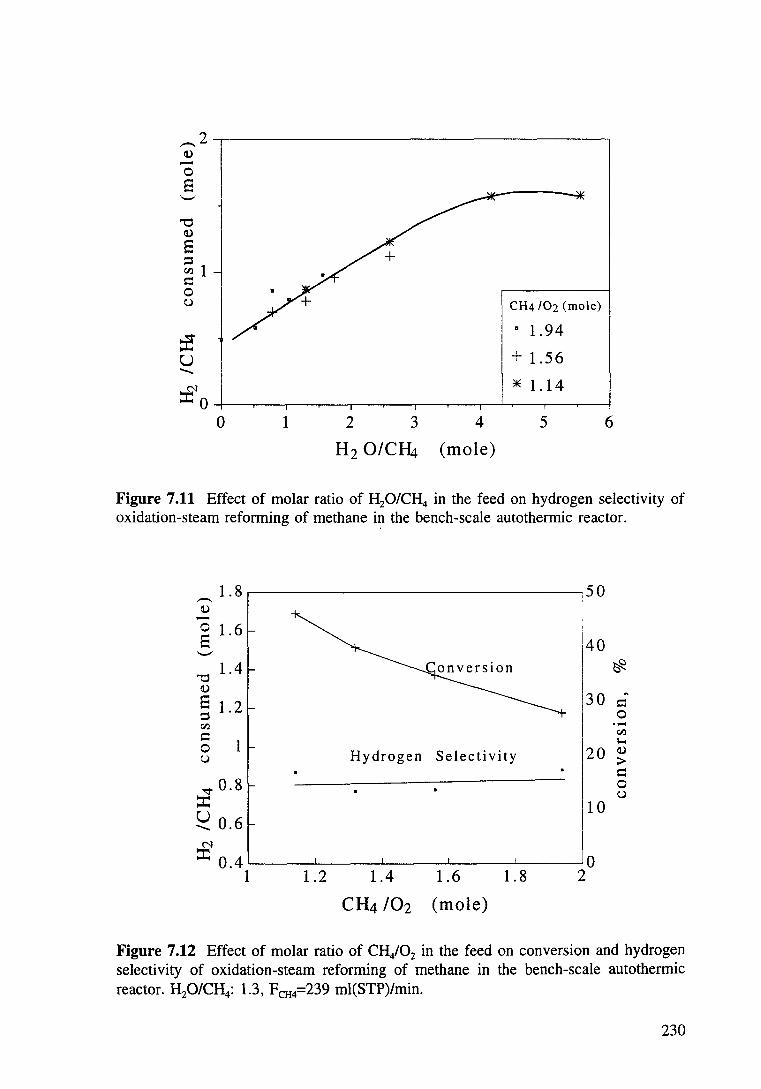
_2 Cl.) -0 E ,_,
"0 Cl.)
E ::s ell 1 c 0 u
£ u -£ 0
j !
0 1 2 3 4
H2 0/Cii+ (mole)
CH4/02 (mole)
I • 1. 94
+ 1.56
* 1.14
5 6
Figure 7.11 Effect of molar ratio of H20/CH4 in the feed on hydrogen selectivity of oxidation-steam reforming of methane i~ the bench-scale autothermic reactor.
-1.8.-----------------------------~,50 Cl.)
8 1.6 ,_,
"01.4 Cl.)
; 1.2 ell
§ 1 u
"""0.8 :I: u -0.6
C"'
Hydrogen Selectivity
30 d 0 ..... ell ;.....
20 Cl.) > Q 0 u
10
:I: 0 .4 '------'------'---------''-------''------' 0 1 1.2 1.4 1.6 1.8 2
CH4 /02 (mole)
Figure 7.12 Effect of molar ratio of CH/02 in the feed on conversion and hydrogen selectivity of oxidation-steam reforming of methane in the bench-scale autothermic reactor. H20/CH4: 1.3, FcH4=239 ml(STP)/min.
230
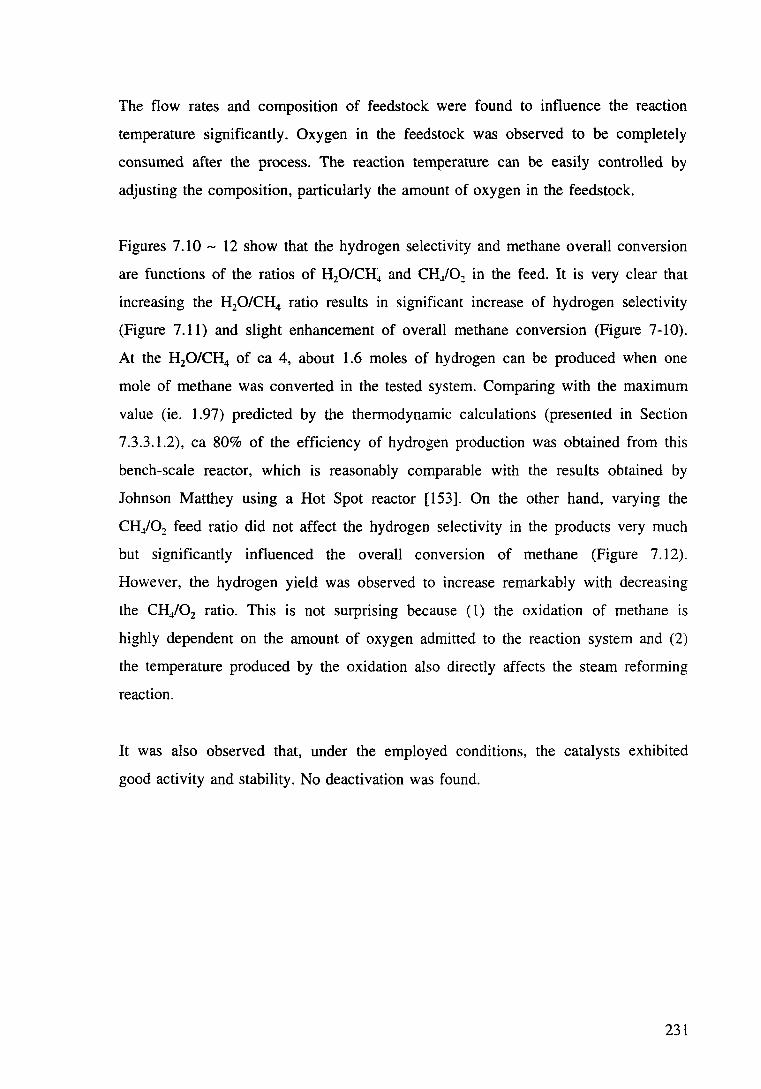
The flow rates and composition of feedstock were found to influence the reaction
temperature significantly. Oxygen in the feedstock was observed to be completely
consumed after the process. The reaction temperature can be easily controlled by
adjusting the composition, particularly the amount of oxygen in the feedstock.
Figures 7.10 - 12 show that the hydrogen selectivity and methane overall conversion
are functions of the ratios of H20/CH~ and CH./0~ in the feed. It is very clear that
increasing the H20/CH4 ratio results in significant increase of hydrogen selectivity
(Figure 7 .ll) and slight enhancement of overall methane conversion (Figure 7-1 0).
At the H20/CH4 of ea 4, about 1.6 moles of hydrogen can be produced when one
mole of methane was converted in the tested system. Comparing with the maximum
value (ie. 1.97) predicted by the thermodynamic calculations (presented in Section
7.3.3.1.2), ea 80% of the efficiency of hydrogen production was obtained from this
bench-scale reactor, which is reasonably comparable with the results obtained by
Johnson Matthey using a Hot Spot reactor [153]. On the other hand, varying the
CH./02 feed ratio did not affect the hydrogen selectivity in the products very much
but significantly influenced the overall conversion of methane (Figure 7 .12).
However, the hydrogen yield was observed to increase remarkably with decreasing
the CHi02 ratio. This is not surprising because ( 1) the oxidation of methane is
highly dependent on the amount of oxygen admitted to the reaction system and (2)
the temperature produced by the oxidation also directly affects the steam reforming
reaction.
It was also observed that, under the employed conditions, the catalysts exhibited
good activity and stability. No deactivation was found.
231
7.4 Conclusions
The feasibility of hydrogen production from light hydrocarbons in an autothermic
system has been investigated in this study.
It is confirmed that the proposed reaction system can start to produce hydrogen from
room temperature. Methanol and/or hydrogen are suggested to be used as· the
initiators to light off the reaction system at the beginning of operation. Amounts of
the initiators required by the system was thermodynamically calculated and
experimentally tested.
The manner of loading platinum (for oxidation) and nickel (for steam reforming)
based catalysts in the autothermic system directly influences efficiency of hydrogen
production. The results from comparison of different ways of loading (ie. Dual bed -
- a Ptlo-Al20 3 followed by a Ni/Mg0-Al20 3; Mixed bed -- mixing Ptlo-Al20 3 and
Ni/Mg0-Al20 3 uniformly in one bed;· One (catalyst) bed -- using a hi-functional
catalyst prepared by loading Pt and Ni on one o-Al20 3 support) indicated that the
working efficiencies follow the order of:
Dual bed<< Mixed bed< One (composite catalyst) bed
The hydrogen selectivity observed from both the mixed bed and the one bed in a
tubular reactor is comparable with the patented results claimed by Johnson Matthey
using a Hot Spot reactor [153].
The composition of feedstock for the autotherrnic system was found to be one of the
most important factors to affect hydrogen production. There is great potential to
maximise hydrogen production by optirnising the feed ratios of air/hydrocarbon and
of steam/hydrocarbon. Thermodynamic analyses and experimental confirmation
indicated that, at the feeding conditions of CH/02, 1.4-1.7 and of H20/CH4, 1.1-1.4,
the high yields of hydrogen can be produced.
Final testing of the proposed system was conducted using a bench scale reactor
232
charged with a mixture of Pt/B-Al20 3 and Ni/Mg0-Al20 3 catalysts. It has been shown
that the system started up at ambient temperature when a mixture of methanol with
air was admitted. Continuous oxidation of methane took place at 723K when methane
instead of methanol was introduced to the system. Oxygen fed was completely
oxidised in the process. Hydrogen was produced by steam reforming of methane
when the maximum temperature in the catalyst bed reached above ea 773K. The
hydrogen selectivity is much dependent on the H20/CH~ ratios, and however,
independent on the CH/01 ratios. 80% of efficiency of hydrogen production was
obtained from the tested system.
233
Chapter 8 Conclusions and Recommendations
8.1 Conclusions
A novel catalytic system for the production of hydrogen via conversion of light
hydrocarbon started at ambient temperature has been studied. The process generally
involves with two kinds of reactions -- oxidation and steam reforming. The
exthothermic oxidation supplies heat and steam for the endothermic steam reforming
reaction. Hydrogen is produced from this system. The process is autothermic without
the requirement of external energy.
Studies of the oxidation of light hydrocarbons over platinum and nickel based catalysts
showed that platinum based catalysts are more active and stable than nickel based
catalysts in catalysing the oxidation of light hydrocarbons. Significant oxidation of light
hydrocarbons does not occur at ambient temperature. The initiation temperatures for the
oxidation of methane, ethane and propane, over a Pt/o-Al20 3 catalyst (prepared in this
laboratory), were observed to lie in the range of 590-725K, 480-515K and 425-458K
respectively. depending on the hydrocarbon to oxygen ratios in the feedstock. Over a
Ni/Mg0-Al20 3 catalyst, however, initiation temperatures were found to be independent
of hydrocarbon to oxygen feed ratios.
Kinetic measurements for the studies of catalytic oxidation revealed that the following
power rate law equation describes well for the low conversion kinetic data of oxidation
of methane, ethane and propane:
Ea
-rox=koe RTp rt.p P HC 0 2
The reaction rates were found to be almost first order (ie. a=0.95, 1.2, 1.1 for methane,
ethane and propane respectively) in hydrocarbons and negative orders (ie. P=-0.17, -0.6,
and -0.6 for methane, ethane and propane respectively) with respect to oxygen. The
234
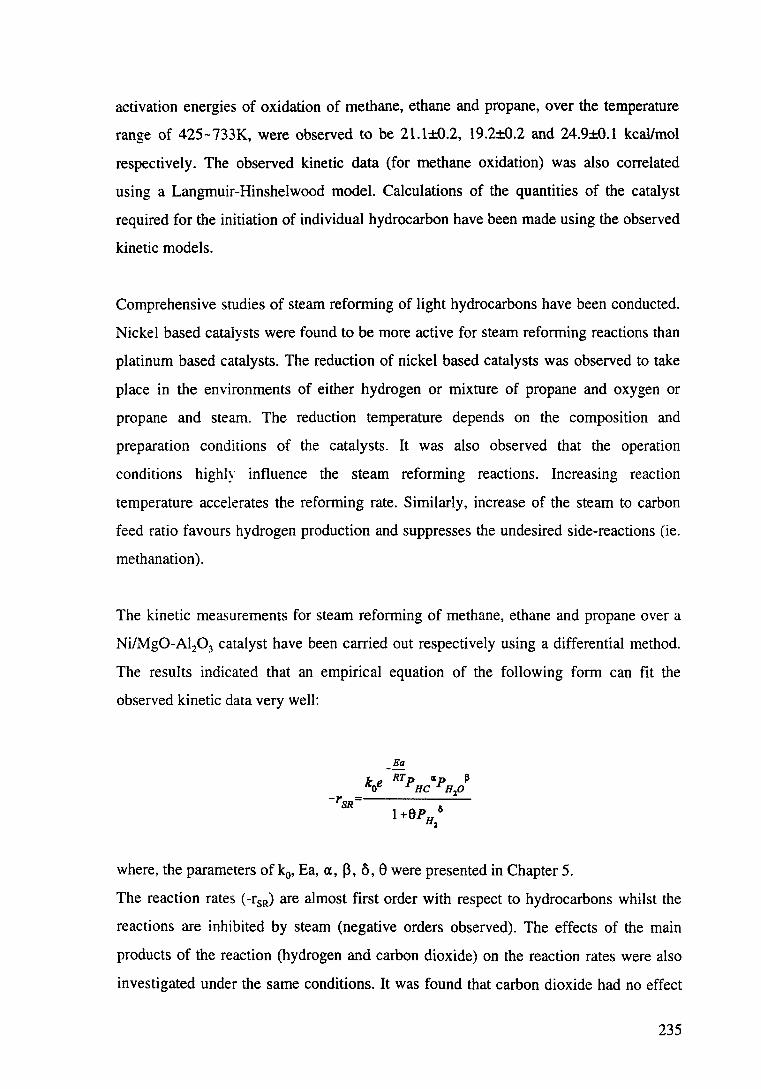
activation energies of oxidation of methane, ethane and propane, over the temperature
range of 425-733K, were observed to be 21.1±0.2, 19.2±0.2 and 24.9±0.1 kcallmol
respectively. The observed kinetic data (for methane oxidation) was also correlated
using a Langmuir-Hinshelwood model. Calculations of the quantities of the catalyst
required for the initiation of individual hydrocarbon have been made using the observed
kinetic models.
Comprehensive studies of steam reforming of light hydrocarbons have been conducted.
Nickel based catalysts were found to be more active for steam reforming reactions than
platinum based catalysts. The reduction of nickel based catalysts was observed to take
place in the environments of either hydrogen or mixture of propane and oxygen or
propane and steam. The reduction temperature depends on the composition and
preparation conditions of the catalysts. It was also observed that the operation
conditions highly influence the steam reforming reactions. Increasing reaction
temperature accelerates the reforming rate. Similarly, increase of the steam to carbon
feed ratio favours hydrogen production and suppresses the undesired side-reactions (ie.
methanation).
The kinetic measurements for steam reforming of methane, ethane and propane over a
Ni/Mg0-Al20 3 catalyst have been carried out respectively using a differential method.
The results indicated that an empirical equation of the following form can fit the
observed kinetic data very well:
where, the parameters of k0, Ea, a, p, 5, 13 were presented in Chapter 5.
The reaction rates ( -r5R) are almost first order with respect to hydrocarbons whilst the
reactions are inhibited by steam (negative orders observed). The effects of the main
products of the reaction (hydrogen and carbon dioxide) on the reaction rates were also
investigated under the same conditions. It was found that carbon dioxide had no effect
235
on the steam reforming reactions at low temperatures. However, hydrogen was found to
retard the reactions of steam reforming and to accelerate the methanation rate (the
reverse reaction of methane steam reforming). Langmuir-Hinshelwood kinetics were
employed to explain the kinetic data obtained from methane steam reforming. The
results shown that the surface reaction between CH2 * and 0* may be the rate
determining step. The kinetic parameters obtained by the Langmuir-Hinshelwood model
are very comparable with those measured by experiments. The kinetic models were used
to design a plug flow tubular steam reforming reactor. The bed temperature distribution
predicted by the kinetic models compared favourably with the results obtained from
experiments.
The activity and stability of nickel based catalysts were significantly improved by
doping ceria on the support. The selectivities of methane conversion to hydrogen and
carbon dioxide were found to be increased when the steam reforming reaction took
place over a ceria containing catalyst at high temperature. This indicated that the
water-gas shift reaction was enhanced by ceria, probably due to the improved water
adsorption ability.
Effects of operation conditions on hydrogen generation in the autothermic system
have been investigated. It was observed that depositing Pt and Ni on one support
and/or mixing both Pt/6-Al20 3 and Ni/Mg0-Al20 3 in one bed resulted in high working
efficiencies for hydrogen production. Composition of the feedstock was also found to be
one of the most important factors to affect the reactions. The results from
thermodynamic analysis and experimental confirmation showed that, at the feed
conditions of CH./02 1.4-1.7 and of H20/CH4 1.1-1.4, maximum hydrogen yield (2
molH/molCH4) can be obtained.
The proposed autothermic process for hydrogen production from light hydrocarbons (ie.
methane) was finally tested using both a laboratory-scale tubular reactor and a bench
scale reactor. The system was initiated by oxidation of hydrogen and/or methanol at
ambient temperature. Continuous oxidation of part of the hydrocarbon fed produced
heat for steam reforming reactions. The temperatures for both oxidation and steam
236
reforming were found to be easily controlled by adjusting air and/or water to
hydrocarbon ratios in feed. Oxygen fed was completely consumed in the process.
Hydrogen was produced efficiently.
8.2 Recommendations
The results obtained in this work suggest that several interesting investigations should
be carried out in future work, including:
( 1) Extension of application of the autothermic hydrogen production system
feedstock to liquid fuels, for example, gasoline. This could also involve kinetic
studies for both oxidation and steam reforming of liquid fuels as well as
simultaneous operation of these two kinds of reactions in a thermoneutral way to
produce hydrogen.
(2) Scaling-up the autotherrnic reaction system to meet the needs of the optimum
operation conditions.
(3) Computer modelling the autothermic system.
(4) Improvement of nickel based catalyst by doping rare earth elements or oxides.
(5) Development of a method to measure heat conductivity under the real conditions
of autothermic operation to get better understanding of heat transfer in the
system.
237
References
[ l] Sjostrom, K., Eriksson, S. and Linder, B., Proc. 1st International Automotive Fuel Economy Research Conference, Washington D.C. 31 Oct. - 2 Nov., \1979) 491.
[2] Prigent, M .. Dezael, C. and Breele, Y., 5th IECEC, (1970) 111.
[3] Voecks, G.E., Dawson, S. and Houseman, J .. Proc. 4th lnt. Symp. on Alcohol Fuels Technology, Guaruja, Brazil, Oct. (1980). B-9.
(4] Dixon, A.G., Houston, A.C., and Johnson, J.K., 7th IECEC Paper 729161, ( 1972) 1084.
[5] Butt, J.B., Joyal, C.L.M. and Megiris, C.E .. in "Catalyst Deactivation" (edited by Petersen, E.E. and Bell, AT.) p3, p39. (1987).
[6] Jenkins, J.W. and Shutt, E., Platinum Metals Rev., 33 (3), (1989) 118.
[7] Tv;igg, M.V., "Catalyst Handbook':, 2nd edn. Wolfe Publishing Ltd., (1989).
[8] Rostrup-Nielsen, J.R., in: "Catalysis, Science and Technology (Anderson, J.R. and Boudart, M., eds.)", Springer, Berlin Heidelberg, New York, .2_ (1984) 1
[9] Jenkins J.W., European Patent Application, P0217532, ( 1986).
[10] Jiang, C.J., PhD Thesis, The University of New South Wales, (1992).
[11] Jiang, C., Ul-Haque, 1., Trimm, D.L. and Wainwright, M.S., Proc. 19th Australian Chemical Engineering Conference, Chemeca '91, New Castle, 6_ (1991) 892.
[12] Brown, M.J. and Parkyns, N.D., Catalysis Today,~ (1991) 305-335.
[13] Shtem, V.YA> "The Gas-phase Oxidation of Hydrocarbon", Pergamon Press, Oxford, New York, (1964).
[14] .McCabe, R.W. and McCready, D.F., J. Phys. Chem., 90 (1986) 1428.
[15] Gentry, S.J., Jones, A. and Walsh, P.T., J.C.S. Faraday/, 76 (1980) 2084.
[16] McCabe, R.W. and Mitchell, P.J., Appl. Catal., 27, (1986) 83.
238
[17] McCabe, R.W. and Mitchell. P.J., J. Catal.. 103, (1987) 419.
[18] McCabe, R.W. and Mitchell. P.J., Appl. Catal., 44. (1988) 73.
[19] Firth, J.G., Trans. Faraday Sci., 67 (19711 1.
[20] Hedges, C.N. and Roseloar. L.C., J. Appl. Chem. Biotech., 25 (1975) 609.
[21] Dabill, D.W .. Gentry, S.J .. Holland, H.B. and Jones, A., J. Catal. 53 (1978) 164-167.
[22] Gentry, S.J.. Firth, J.G. and Jones, A.. J. Chem. Soc. Faraday Trans .. I 70, (1974) 600.
[23] Acres, G.J.K.. Platinum Metals Rec., 10 (1966) 60.
[24] Dus, R. and Tempkins, F.C.. Proc. Roy. Soc., Ser. A 343 (1975) 477.
[25] Fuchs, S. and Lintz, H.-G .. Appl. Catal. A.: General, 94 (1993) 85-90.
[26] Boulahouache. A., Kons. G., Lintz. H.-G. and Schalz. P., Appl. Catal. A: General, 91 (1992) 115-123.
[27] Sermon, P.A.. Self, V.A. and Barrett. E.P.S., J. Molecular Catal., 65 (1991) 377-384.
[28] Trimm, D.L.. Appl. Catal. 1 (1983) 249-282.
[29] Prasad, R., Kennedy, L.A. and Ruckenstein, E., Catal. Rev. Sci. Eng., 26(1) (1984) 1-58.
[30] Matsumura, Y., Hashimoto, K. and Moffat, J.B., Catal. Letters, .U. (1992) 283-288.
[31] Shishu, R.C.. D. En g. Thesis, Uni. Detroit (1972).
[32] Voltz, S.E., Morgan, C.R.. Leiderman. D. and Jacob, S.M., lnd. Eng. Chem. Prod. Res. Dev., 12 (1973) 294.
[33] Kuchaev, V.L., Nikitushina, L.M. and Temkin, M.I., Kui. Kat. U (1975) 1064.
[34] Pacia, N., Cassuto, A., Pentenero, A. and Weber, B., J. Catal., 41 (1970) 455.
[35] Close, J.S. and White, J.M., J. Catal., 36 (1975) 185.
239
[36] Sharma, C.S., Rarnachandran, P.A. and Hughes. R., J. Appl. Chem. Biotech., 26 (1976) 231.
[37] Lunsford, J.H .. Catal. Today, § (1990) 235.
[38] Hickrnan, D.A. and Schrnidt, L.D., J. Catal., 138 (1992) 267-282.
[39] Hickrnan, D.A. Haupfear, E.A. and Schrnidt, L.D .. Catal. Letters. 11 ( 1993) 223-237.
[40] Vernon, P.D.F., Green, M.L.H., Cheetharn, A.K. and Ashcroft, A.F.. Catal. Today, .U (1992) 417.
[41] Dissanayake, D., Rosynek, M.P., Kharas, K.C.C. and Lunsford, J.H., J. Catal., 132 (1991) 117.
[42] Dissanayake. D., Rosynek, M.P., and Lunsford, J.H., J. Phys. Chem., 97 (1993) 3644.
[43] Choudhary, V.R., Rajput, A.M. and Prabhaker, B., Catal. Letters, U (1992) 363.
[44] Choudhary, V.R., Rajput, A.M. and Ranc, V.H .. Catal. Letters, 16 (1992) 269.
[45] Hochrnuth, J.K., Appl. Catal. B: Environmental.l (1992) 89.
[46] Vernon, P.D.F., Green, M.L.H., Cheetharn, A.K. and Ashcroft, A.T .. Catal. Letters, § (1990) 181.
[47] Poirier, M.G., Trudel, J., Guay, D., Catal. Letters, f.l (1993) 99.
[48] Prettre, M., Eichner, Ch. and Perrin, M., Trans. Faraday Soc., 43 (1946) 335.
[49] Solbakken, A., in "Natural Gas Conversion" (edited by Holmen, A. et al), (1991) 447.
[50] Farrauto, RJ., Hobson, M.C., Kennelly, T., Waterrnan, E.M., Appl. Catal. A: General, M (1992) 227.
[51] Brockerhoff, P., Ernonts, B., in "Natural Gas Conversion" (edited by Holrnen, A. et al), (1991) 557.
[52] Spencer, N.D., Pereira, C.J. and Grasselli, R.K., J. Catal., 131 (1991) 243.
[53] Baldwin, T.R., Burch, R., Squire, G.D. and Tsang, S.C., Appl. Catal., 74 (1991) 137.
240
[54] Charlton, B.G., Foulds, G.A., Gray, B.F. and Walker, G.S., 20th Australasian Chemical Engineering Conference. Chemeca 92. l (1992) 137.
[55] Zhang, Z. and Baerns, M., Appl. Catal., 75 (1991) 299.
[56] Siriwardane. R.V .. J. Catal., 123 (1990) 496.
(57] Fujimoto, K.. Omata. K. and Y oshihara, J., Appl. Catal.. (1990) L2l.
[58] Choudhary, V.R.. Sansare, S.D .. Rajput, A.M. and Akolekar. D.B., Appl. Cat al. ( 1990) 187.
[59] Howe, R. and Curry-Hyde, H.E., ads., Program and Abstracts, 3rd International Natural Gas Conversion Symposium, Sydney, ( 1993).
[60] Trimm, D.L. and Lam, C.W., Chem. Eng. Sci. 35 (1980) 1405.
[61] Mouaddib, N., Feumi-Jantou, C., Garbowski, E. and Primet. NL Appl. Catal. A: General, 87 (1992) 129.
[62] Li. Y. and Armor, N .. Appl. Catal. B: Environmental, l ( 1994 J 275.
[63] Moro-oka, Y., and Ozaki, A., J. Catal., ~ (1966) 116.
[64] Moro-oka, Y., Morikawa, Y. and Ozaki, A., J. Catal., 1 (1967) 23.
[65] McCarty, J.G. and Wise, H., Catal. Today,~ (1990) 231.
[66] Oh, S.H., Mitchell, P.J. and Siewert, R.M., ACS Symposium Series 495, "Catalytic Control of Air Pollution" (ed. by Silver, R.G., Sawyer, J.E. and Summers, J.C.). 4th Chem. Congress of North America. New York, .f (1991) 12.
[67] Hicks, R.F., Qi, H., Young, M.L. and Lee, R.G., J. Catal., 122 (1990) 280.
[68] Otto, K., Andino, J.M. and Parks, C.L., J. Catal. 131 (1991) 243.
[69] Prasad, R., Kennedy, L.A. and Ruckenstein, E., Combust. Sci. Tech., 27 (5&6) (1982) 171.
[70] Marteney, P.J. and Kesten, A.S., "Kinetics of Swface Reactions in Catalytic Combustion", Presented at Eighteenth Symposium (International) on Combustion. The Combustion Institute, Waterloo, Canada, (1981 ).
[71] Rader, C.G. and Weller, S.W., "Ignition on Catalytic Wires: Kinetic Parameter Determination by the Heated Wire Technique", A/ChE J., 20(3)
241
(1974).
[72] Dracco, F.V.. Bruno, C.. Yaw, Y. and Walsh. P.M., "Compared and lvleasured Emissions from the Catalytic Combustion of Propane/Air Mixtures", presented at Fourth workshop on Catalytic Combustion, Cincinnati. Ohio, ll980).
[73] Turner, D.\V .. Andrews, R.L. and Siegmund, C.W., Combustion, 44 (1972) 21.
[74] Hiam, L., Wise, H. And Chaikin, S., J. Catal., .2. (1968) 279.
[75] Schwartz, A.. Holbrook, L.L. and Wise. H., J. Catal. .f.l (1971) 199.
[76] Patterson, W.R. and Kemball, C., J. Catal. £ (1963) 465.
[77] Ashcroft, A.T.. Cheetham. A.K., Foord. J.S., Green, M.L.H., Grey, C.P., Murrell, A.J.. Vemon, P.D.F., Nature, 344 (1990) 319.
[78] Marek, L.F.. and Hahn, D.A., "Catalytic Oxidation of Organic Compounds in the Vapour Phase". Chemical Catalogue Co., (1932) 101.
[79] Tessie, D.M .. M., Man!chal, M., Bull. Soc. Chim. France, .2. (1868) 334.
[80] Mond, L. and Langer, C., German Patent . .2.1 (1889) 572.
[81] Lang, J., Z. Plzys.Chem, £ (1888) 161.
[82] 1\eumann, B.. Jacob, K., Brennst. Chem .. J. (1928) 39.
[83] Byme, P.J., Gehr, R.J. and Haslam, RT .. lnd. Eng. Chem., 24 (1932) 1129.
[84] Ridler, D.E. and Twigg, M.V., in "Steam Reforming" in "Catalyst Handbook" (Twigg, M.V. eds), 2nd edn., Wolfe Publishing Ltd., U.K. (1989).
[85] Van H.J.P., Catal Rev. - Sci. Eng., .f.l (1) (1980) 1.
[86] Albright, L.F., Crynes, B.L., Corcoran, W.H., eds. "Pyrolysis, Theory and Practice", Academic Press, New York, (1983).
[87] Riensche, E. and Fedders, H., in "Natural Gas Conversion" (Holmen, A. et al eds), (1991).
[88] Rostrup-Nielsen, J.R., in "Methane Conversion" (Bibby D.M. et al eds), Elsevier Science Publishers B.V., Amsterdam, (1988).
[89] Mond, L. and Langer, C., British Patent, 11 (1888) 608.
242
[90] Rostrup-Nielsen, J.R. and Christiansen. L.J. "Tubular Steam Refonning", Haldor Topsoe A/S. Lyngby, Denmark. (To be published)
[91] The British Petroleum Company Limited. "Gas Making and Natural Gas". Ben Johnson & Co. Ltd, York, lQ ( 1972).
[92] Dieffenbach, C. and Moldenhauser, W., Gennan Patent, 229 (1909) 406.
[93] Bosch, C. and Wild, W., Canadian Patent, 153 (1914) 379.
[94] Rostrup-Nie1sen, J.R., J. Catal., J1 (1973) 173.
[95] Ross, J.R.H., in "Surface and Defect Properties of Solids" (Roberts, M.W. and Thomas, J.M. eds.) (Specialist Periodical Reports). The Chemical Society, London, 1 (1974) 34.
[96] Shido, T. and lwasawa, Y., J. Catal., 141 (1993) 71.
[97] Ul-Haque, I., PhD Thesis, The University of Ne>v South Wales, (1990).
[98] Trimm, D.L., Appl. Catal., ~ (1983) 263.
[99] Borowiecki, T., Appl. Catal. 31 (1987) 207.
[100] Trimm, D.L., in "Methane Conversion" (Bibby, D.M., Chang, C.D., Howe, R.F. and Yurchak, S., eds), Elsevier Science Publishers B.V., Amsterdam, ( 1988).
[101] Elnashaie, S.S.E.H., Al-Ubaid, A.S. and Soliman, M.A., in "Methane Conversion" (Bibby, D.M., Chang, C.D., Howe, R.F. and Yurchak, S., eds), Elsevier Science Publishers B.V., Amsterdam, (1988).
[102] Figueiredo, J.L., PhD Thesis, The University of London, (1974).
[103] Den Besten, I.E., Selwood, P.W., J. Catal., l (1962) 93.
[104] Tomita, A. and Tamai, Y., J. Catal. 27 (1972) 293.
[105] Tomita, A. and Tamai, Y., Carbon 12 (1974) 143.
[106] Tamai, Y., Watanabe, H. and Tomita, A., Carbon 15 (1977) 103.
[ 107] Figueiredo, J.L., Rivera-Utrilla, J., and Ferro-Garcia, M.A., Carbon 25, (1987) 703.
[108] Lund, C.R.F., Carbon 25, (1987) 337.
243

[109] Baker, R.T.K. and Sherwood. R.D., J. Catal.. 70 (1981) 198.
[110] Chen W.J .. Sheu, F.R. and Savage, R.L., Fuel Processing Technology, .l.Q ( 1987) 279-288
L112] Pour, V., Collect. Czech. Chem. Commun., 35 (1970) 2203.
[113] Sinfelt, J.H .. Catal. Rev .. ~ (1969) 175.
[114] Parmaliana. A .. Arena, F .. Frusteri, F., Coluccia, S., Marchese, L., Martra. G. and Chuvilin. A.L., J. Catal.. 141 (1993) 34.
[115] Al-Ubaid, A.S., Elnashaie. S.S.E.H., Abbashar, M.E.E., in "Methane Conversion". (Bibby, D.M .. Chang, C.D., Howe, R.F. and Yurchak, S. eds), Elsevier Science Publishers B.V., Amsterdam, (1988).
[116] Al-Ubaid, A.S. and Wolf. E.E., Appl. Catal., 34 (1987) 119.
[117] Lo Jacono. ~1.. Schiavello. ~ .. Cimino, A., J. Phys. Chem .. 75 (1971) 1044.
[118] Aleksic, B.R.. Stefanovic. M.M., Aleksic. B.D., Vujovic-Djordjevic, B.D., Arandjelovic. P.S., Jovanovic, N.N., Mihajlovic, L.M., Chem. Tech., 28 ( 1976) 89.
[119] Chinchen, G.C., in "Catalysis" (Jennings, J.R. eds), Critical Reports in Applied Chemistry, Society of Chemical Industry, London 12 (1985) 13.
[120] Wanke, S.E.. Szymura. J.A. and Yu, T.T., in "Catalyst Deactivation" (Petersen, E.E. and Bell, A.T. eds) (1987) 65.
[121] Den Besten, I.E., Selwood. P.W., J. Catal., 1 (1962) 93.
[122] Levenspiel, 0., J. Catal., 25 (1972) 265.
[123] Williams, A., Butler, G., Hammonds, J., J. Catal., 24 (1972) 352.
(124] ~oayeri, M .. PhD Thesis, London University (1974).
[125] Biswas, J., Bickle, G.M., Gray, P.G., Do, D.D. and Barbier, J., Catal. Rev. -Sci. Eng., 30 (1988) 161.
[126] ~oseley, F., Stephens, R.W., Stewart, K.D., Wood, J., J. Catal., 24 (1972) 18.
[127] Bhatta, K.S.M., Dixon, G.M., Trans. Far. Soc., 63 (1967) 2217.
[128] Voorhies, A., Ind. Eng. Chem., 37 (1945) 318.
244

[129] Bartholomew, C.H., Catal. Rev. - Sci. Eng .. 24 (1982) 67.
[130] Dibbern, H.C.. Olesen, P.. Rostrup-Nielsen. J.R.. Tottrup. P.B. and Udengaard. N.R., Hydrocarbon Processing. January (1986) 71.
[ 131] Rostrup-Nielsen. J.. J. Catal., 85 (1984) 31.
[132] Trimm, D.L.. Catal. Rev. - Sci. Eng .. !Q (1977) 155.
[ 133] Liu. G.M., Qiu. F.L., Guo. S.D., J. Catal. ( CHUI HUA XUE BAO ). ll (1990) 1.
[134] Andrew, S.P.S., Ind. Eng. Chem. Prod. Res. Dev., ~ (1969) 321.
[135] Bhatta, K.S.M. and Dixon, G.M., Ibid .. ~ (1969) 324.
[136] Shido, T. and lwasawa, Y., J. Catal., 136 (1992) 493.
[137] ~luraki, H. and Fujitani, Y., Appl. Catal., 47 (1989) 75.
[138] Agnelli, M.E.. Demicheli, M.C. and Ponzi, E.N., Ind. Eng. Chem. Res., 26 ( 1987) 1704.
[139] Agnelli, M.E., Ponzi, E.N., and Yerqmian, A.A., Ind. Eng. Chem. Res., 26 (1987) 1707.
[140] Akers, W.W. and Camp, D.P., AlChE l..l (1955) 471.
[141] Bodrov, N.M., Apel'baum, L.O. and Ternkin, M.I., Kinet. Katal., .2. (1964) 614.
[142] Bodrov, N.M., Apel'baum, L.O. and Ternkin, M.I., Kinet. Katal., ~ (1967) 379.
[143] Bodrov, N.M .. Apel'baum, L.O. and Ternkin, M.I., Kinet. Katal., 2 (1968) 1065.
[144] Ross, J.R.H., Steel, M.C.F., Zeini-lsfahani, A., in "Mechanisms of Hydrocarbon Reactions" (Marta, F., Kall6, D., eds), Budapest (1975).
[145] Boudart, M., AlChE J., .lli (1972) 465.
[146] Martin, G.A., Imelik, B., Surface Sci., 42 (1974) 157.
[147] Kikuchi, E., Tanaka, S., Yamazaki, Y. and Morita, Y., Bull. Japan Petrol. Inst., !Q (1974) 95.
245
[148] Moayeri, M. and Trimm, D.L., J. Appl. Chem. Biotech., 26 (1976) 419.
[ 149] Phillips, T.R., Mulhall, J., Turner, G., J. Catal.. J2 (1969) 233.
[150] Phillips, T.R., Yarwook, T.A., Mu1hall. L Turner. G.E., J. Catal., 11 (1970) 28.
[151] Perry, J., Perry, R.H .. Chilton, C.H. and Kirkpatric, S.D., "Chemical Engineers' Handbook", McGraw-Hill Book Company, (1963).
[152] Macak, J., Licka, S., Malecha, J., Chim. Ind. Genie. Chim., 105 (1972) 517.
[153] Jenkins, J.W., United States Patent, P4897253, (1987).
[154] Adler, S.T., Keavney, J.J., J. Phys. Chem., 64 (1960) 208.
[155] Andrew, S.P.S., CHEMTECH, (1979) 180.
[156] Ciapetta, G.M., Plank, C.J. and Emmett. P.H .. "Catalvsis" (edited Reinhold, N.Y.) l (1961) 317.
[157] Zelinsky, N. and Kommarewsky, W., Chem. Ber., 57 (1924) 667.
[158] Miiller, O.R., "Spectrochemical Analysis by X-ray Fluorescence", Plenum Press., New York (1972).
[159] Brunauer, Emmett and Teller, J. Am. Chem. Soc., 60 (1938) 309.
[160] Thomas, J.M. and Thomas, W.J., "Introduction To The Principles Of Heterogeneous Catalysis", Academic Press., London, New York, (1967) 98.
[161] Anderson, J.R. and Pratt, K.C., "Introduction to the Characterisation and Testing of Catalyst", Academic Press., London (1978).
[162] Liebhiafsky, H.A., Pfeiffer, H.G., Winslow, E.H. and Zemany, P.D., "X-ray, Electrons and Analytical Chemistry", Wiley-lnterscience, John Wiley & Sons, Inc., New York, London,§. (1972) 236.
[163] Cullity, B.D., "Elements of X-ray Diffraction", Addison-Wesley, Masschusetts, (1959).
[164] Spencer, M.S., in "Fundamental Principles" "Catalyst Handbook" (Twigg, M.V. eds), Wolfe Publishing Ltd., 2nd edn., (1989) 50.
[165] Margolis, L.Ya. and Todes, O.M., Zh. Obshch. Khim., li (1948) 1043 (Chem. Abstr., 42 (1948) 1794).
246
[166] Margolis, L.Ya .. Adv. Catalysis, 14 (1963) 476.
[167] Ma. L., Trimm, D.L., Jiang, C.J. and Cant, N., Proc. 6th Asian Pacific Confederation of Chemical Engineering Conference and 21st Australian and Ne•v Zealand Chemical Engineering Conference, APCCizE & CHEMECA '93, l (1993) 93.
[168] McCabe, R.W .. McCready, D.F., Chem. Plzys. Letts., ill (1984) 89.
[169] Lapinski, M.P .. Silver. R.C., Ekerdt. J.G., McCabe. R.W., J. Catal .. 105 (1987) 258.
[ 170] Bridger, G.W. and Spencer, M.S.. in "Methanol Synthesis" "Catalyst Handbook", 2nd edn., Wolfe Publ. Ltd .. U.K., (1989) 442.
[171] Jennings, J.R. and Ward, S.A., in "Ammonia Synthesis" "Catalyst Handbook", 2nd edn., Wolfe Publ. Ltd., U.K., (1989) 388.
[172] Ma. L., Jiang. C.J.. Adesina, A.A., Trimm, D.L. and Cant, N., Proc. 22nd Australian and New Zealand Chemical Engineering Conference, CHEMECA '94. Perth, 1 (1994) 86.
[173] Barlin, I., Knacke, 0.. in "Thermochemical Properties of Inorganic Substances". Springer, Berlin Geidelberg, New York (1977).
[174] AlzarmoraL LE., Ross, J.R.H., Kruissink, E.C., and Van Reijnen, L.L.. J. Chem. Soc. Faraday Trans., 177 (1981) 665.
[175] Ross, J.R.H .. Steel, M.C.F., J. Chem. Soc. Faraday Trans., 169, (1973) 10.
[176] Sen. S.P., Majumdar, D.S., Hazra, P.K., Prasad, R., Gosh, S.K., Bhattacharyya, N.B., Technol. 11 (1974) 149.
[177] Eischens, R.P., in "The Physical Basis for Heterogeneous Catalysis", (Pranglis, E. and Jaffee, R.E., eds), Plenum, New York, (1975) 485.
[178] Au, C.T., Hu, Y.H. and Wan, H.L., Catal. Letters, 27 (1994) 199.
[179] Bernardo, C.A.A., PhD Thesis, The University of London, (1977).
[180] Belgned, M., Amariglio, H., Pareja, P., Amarigio, A. and Saint-Just, J., Catal. Today, U (1992) 437.
[181] Munster, P. and Gabka, H.J., J. Catal., 72 (1981) 279.
[182] Quach, P.T. and Rouleau, U.D., J. Appl. Chem. Biotech, 25 (1975) 445.
247
[183] Atroshchenko. V.I., Raman, Sh. K. and Zryagintsev. G.l., J. Appl. Chem., USSR 42 (1969) 1496.
[184] Kopsel, R., Richter, A. and Meyer, B .. Chem. Tech .. 32 (1980) 460.
[185] Xu. J. and Froment. G.F.. A.l.Ch.E.J., 35 (1989) 88.
[186] De Deken, J.C., Devos. E.F. and Froment, G.F., Chem. React. Eng., ACS Symp. Ser. ( 1982) 196.
[187] Elnashaie, S.S.E.H., Adris. A.M., Al-Ubaid, A.S. and Soliman, M.A., Chem. Eng. Sci., 45 No. 2 (1990) 491
[188] Vannice, M.A., Hyum, S.H., Ka1packi, B. and Liauh, W.C., "Entropies of Adsorption in Heterogeneous Catalytic Reactions", J. Catal., 56 (1979) 356.
[189] Duplan, J.L. and Praliaud, H., Appl. Catal., 67 (1991) 325.
[190] Summers, J.C. and Ausen. S.A., J. Catal.. 58 (1979) 131.
[191] Schlatter. J.C. and Mitchell, P.J., Ind. Eng. Chem. Prod. Res. Dev., 19 (1980) 288.
[192] Harrison, B., Diwell. A.F. and Hallett, C., Platinum Metals Rev., 32 (2) (1988) 73.
[193] Lu, G.Z. and Wang, R., J. Catal. (Cui Hua Xue Bao), .!l (6), (1992) 466.
[194] Yao, H.C. and Yao, Y.F .. J. Catal., 86 (1984) 254.
[195] Shyu, J.Z., Otto, K., Watkins, W.L.H., Graham, G.W., Belitz, R.K. and Gandhi, H.S., J. Catal. 114 (1988) 23.
[196] Li, C., Sakata, Y., Arai, T., Demen, K. and Maruya, K.l., J. Chem. Sec. Faraday Trans. I, 85 (1989) 1451.
[197] Liu, Y.D., Lim, G.D., Zhang, H.B., Tsai, K.R., Proc. 3rd International Natural Gas Conversion Symposium, Sydney (1993).
[198] Rossin, S., Brandao, S.T., Lietti, L., Nalli, M., Santucci, A., Villa, P., Proc. 3rd International Natural Gas Conversion Symposium, Sydney, (1993).
[199] Tsaih, J.S., Weiss, A.H., Trarkova, M., Davidova, N., Proc. 3rd International Natural Gas Conversion Symposium, Sydney (1993).
[200] McCutohen, A.L., Nelson, P.F., Proc. 3rd International Natural Gas
248
Conversion Symposium, Sydney (1993).
[201] Whittington. B., Unpublished report: "Steam reforming and 1-vater gas shift reactions in car exhaust catalysts", The University of New South. Wales, ( 1993).
[202] Ma, L., Jiang, C.J., Adesina, A.A., Trimm, D.L. and Wainwright, M.S., Chem. Eng. Journal. (in press) (1995).
249
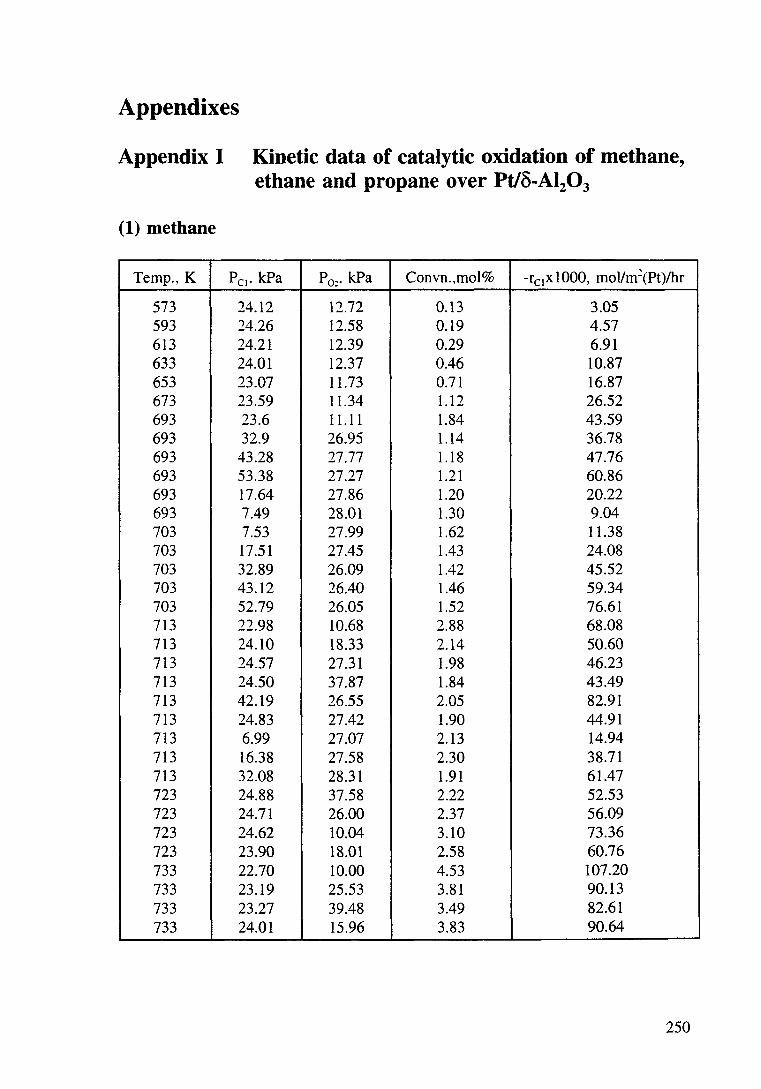
Appendixes
Appendix I Kinetic data of catalytic oxidation of methane, ethane and propane over Pt/8-AI20 3
(1) methane
Temp., K Pc1, kPa Po:· kPa Convn.,mol% -rCI x 1000, mol/m~(Pt)lhr
573 24.12 12.72 0.13 3.05 593 24.26 12.58 0.19 4.57 613 24.21 12.39 0.29 6.91 633 24.01 12.37 0.46 10.87 653 23.07 11.73 0.71 16.87 673 23.59 11.34 1.12 26.52 693 23.6 11.11 1.84 43.59 693 32.9 26.95 1.14 36.78 693 43.28 27.77 1.18 47.76 693 53.38 27.27 1.21 60.86 693 17.64 27.86 1.20 20.22 693 7.49 28.01 1.30 9.04 703 7.53 27.99 1.62 11.38 703 17.51 27.45 1.43 24.08 703 32.89 26.09 1.42 45.52 703 43.12 26.40 1.46 59.34 703 52.79 26.05 1.52 76.61 713 22.98 10.68 2.88 68.08 713 24.10 18.33 2.14 50.60 713 24.57 27.31 1.98 46.23 713 24.50 37.87 1.84 43.49 713 42.19 26.55 2.05 82.91 713 24.83 27.42 1.90 44.91 713 6.99 27.07 2.13 14.94 713 16.38 27.58 2.30 38.71 713 32.08 28.31 1.91 61.47 723 24.88 37.58 2.22 52.53 723 24.71 26.00 2.37 56.09 723 24.62 10.04 3.10 73.36 723 23.90 18.01 2.58 60.76 733 22.70 10.00 4.53 107.20 733 23.19 25.53 3.81 90.13 733 23.27 39.48 3.49 82.61 733 24.01 15.96 3.83 90.64
250
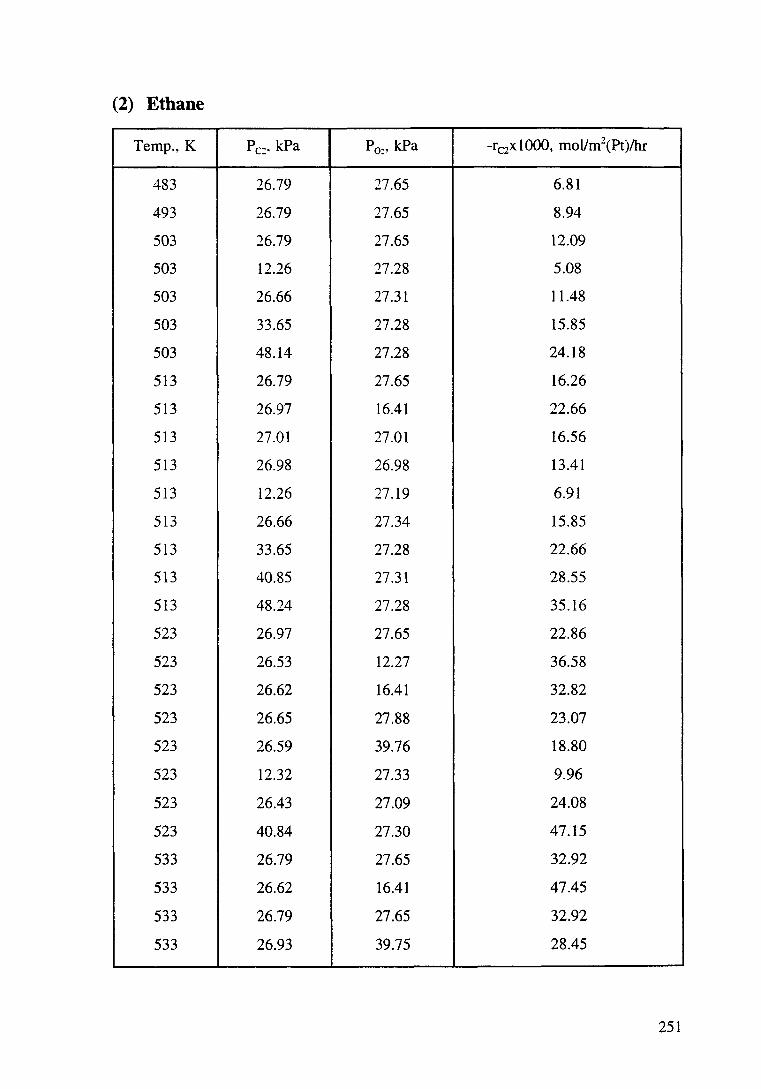
(2) Ethane
Temp., K Pc. kPa Po:• kPa -rc2X 1000, molfm2(Pt)/hr
483 26.79 27.65 6.81
493 26.79 27.65 8.94
503 26.79 27.65 12.09
503 12.26 27.28 5.08
503 26.66 27.31 11.48
503 33.65 27.28 15.85
503 48.14 27.28 24.18
513 26.79 27.65 16.26
513 26.97 16.41 22.66
513 27.01 27.01 16.56
513 26.98 26.98 13.41
513 12.26 27.19 6.91
513 26.66 27.34 15.85
513 33.65 27.28 22.66
513 40.85 27.31 28.55
513 48.24 27.28 35.16
523 26.97 27.65 22.86
523 26.53 12.27 36.58
523 26.62 16.41 32.82
523 26.65 27.88 23.07
523 26.59 39.76 18.80
523 12.32 27.33 9.96
523 26.43 27.09 24.08
523 40.84 27.30 47.15
533 26.79 27.65 32.92
533 26.62 16.41 47.45
533 26.79 27.65 32.92
533 26.93 39.75 28.45
251
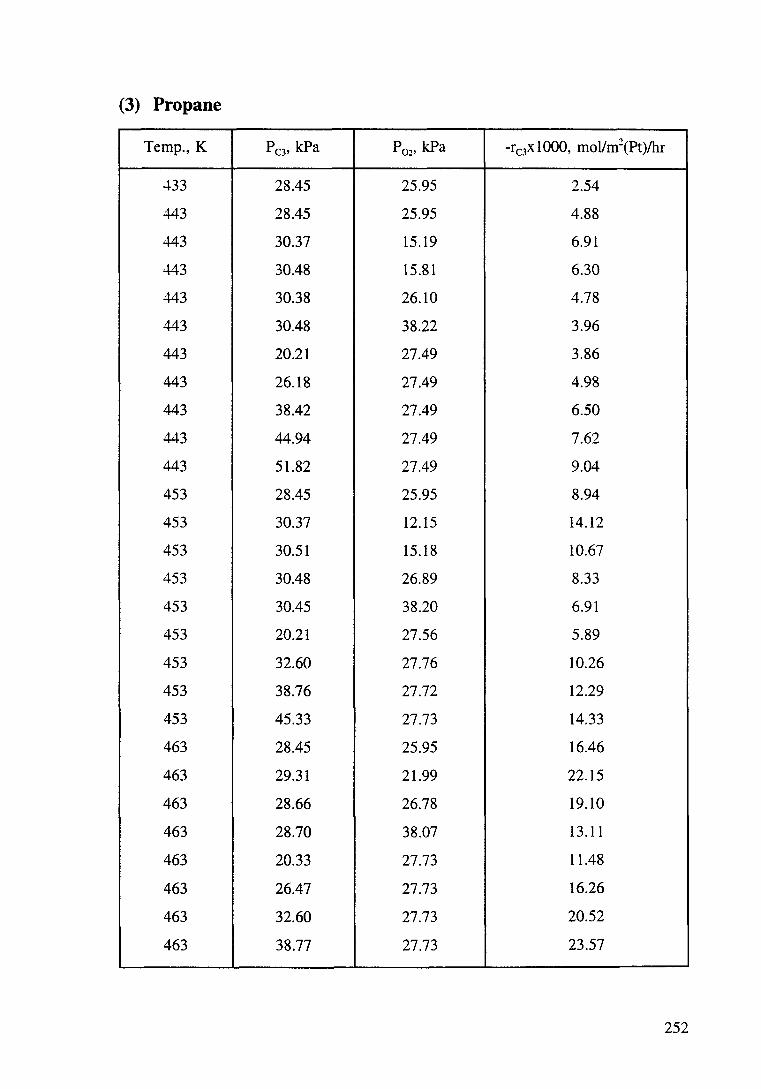
(3) Propane
Temp., K Pc3, kPa P02, kPa -re3x 1000, rnoVm\Pt)/hr
-t-33 28.45 25.95 2.54
443 28.45 25.95 4.88
443 30.37 15.19 6.91
443 30.48 15.81 6.30
443 30.38 26.10 4.78
443 30.48 38.22 3.96
443 20.21 27.49 3.86
443 26.18 27.49 4.98
443 38.42 27.49 6.50
443 44.94 27.49 7.62
443 51.82 27.49 9.04
453 28.45 25.95 8.94
453 30.37 12.15 14.12
453 30.51 15.18 10.67
453 30.48 26.89 8.33
453 30.45 38.20 6.91
453 20.21 27.56 5.89
453 32.60 27.76 10.26
453 38.76 27.72 12.29
453 45.33 27.73 14.33
463 28.45 25.95 16.46
463 29.31 21.99 22.15
463 28.66 26.78 19.10
463 28.70 38.07 13.11
463 20.33 27.73 11.48
463 26.47 27.73 16.26
463 32.60 27.73 20.52
463 38.77 27.73 23.57
252
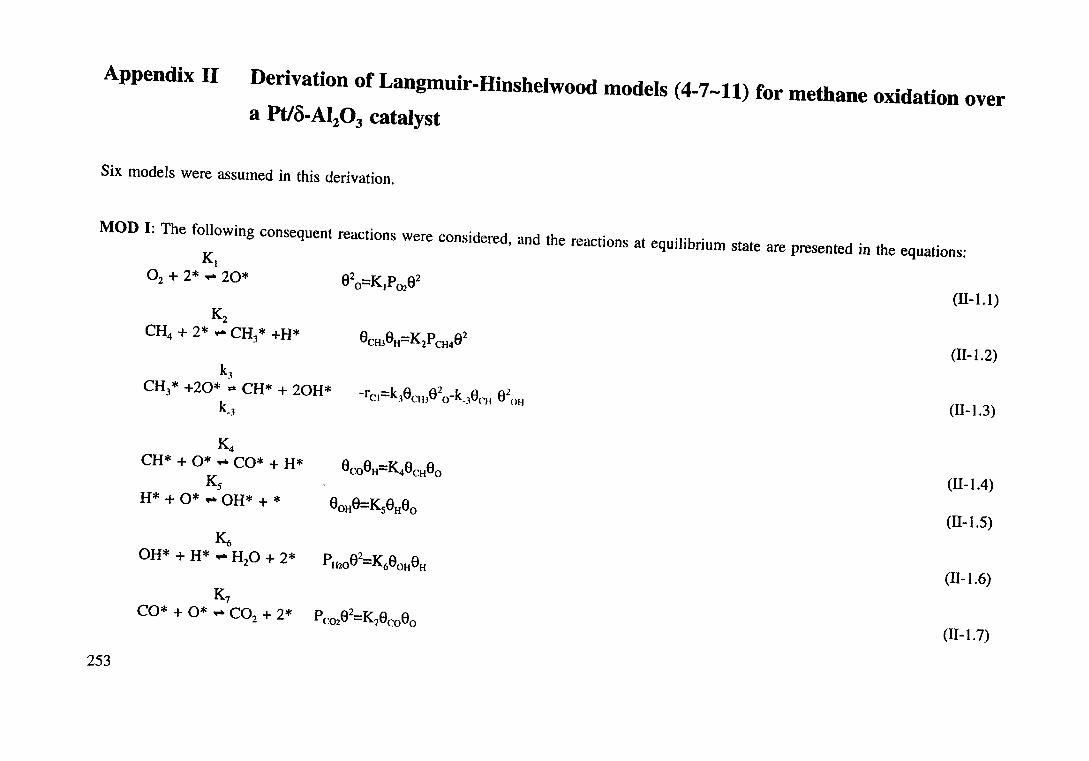
Appendix 11 Derivation of Langmuir-Hinshelwood models (4-7-11) for methane oxidation over a Pt/o-Al20 3 catalyst
Six models were assumed in this derivation.
MOD 1: The following consequent reactions were considered, and the reactions at equilibrium state are presented in the equations: Kt 02 + 2* .... 20* 82o=KJPo282
(11-1.1) K2
CH4 + 2* .,.. CH3* +H* 8CHJ6H=K2P CH482 (II-1.2)
k3 CH3* +20* "*CH*+ 20H* -rct=k38CH382 o-k-38CH 82
oH (11-1.3) k_3
K4 CH*+ 0* .,.CO*+ H* 8co8H=K48cH6o
(11-1.4) Ks H* + 0* .,.. OH* + * 80 H8=K58H8o
(ll-1.5) K6
OH* + H* .,.. H20 + 2* P 82-K 8 8 H20 - 6 OH H (11-1.6)
K7 CO* + 0* .... C02 + 2* P co28
2=K78c0 80 (11-1.7)
253
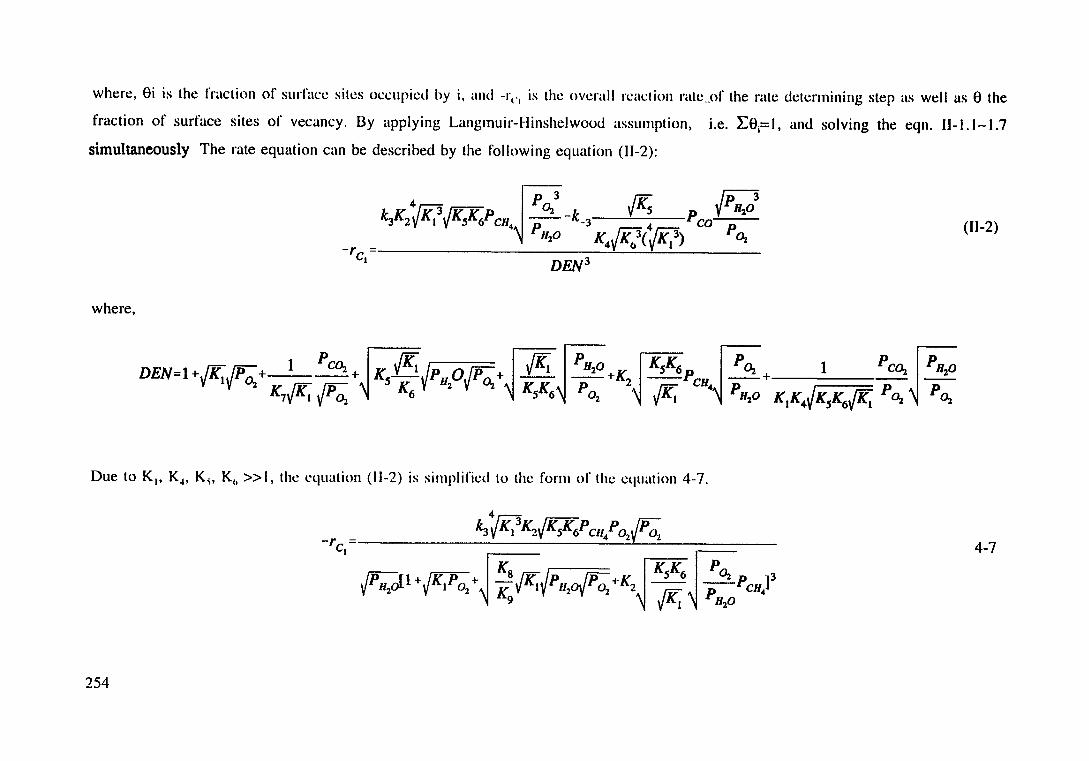
where, Si is the fraction of surfal·c sites occupied by i, and -rl.1 is the overall reaction mte_of the rate determining step as well as 8 the
fraction of surface sites of vecancy. By applying Langmuir-Hinshelwood assumption, i.e. :E8i= I, and solving the eqn. II-1.1-1.7
simultaneously The rate equation can be described by the following equation (11-2):
where,
Due to K 1, K4, K.;, K~> >>1, the equation (11-2) is simplified to the form of the equation 4-7.
254
-r c.
(11-2)
4-7
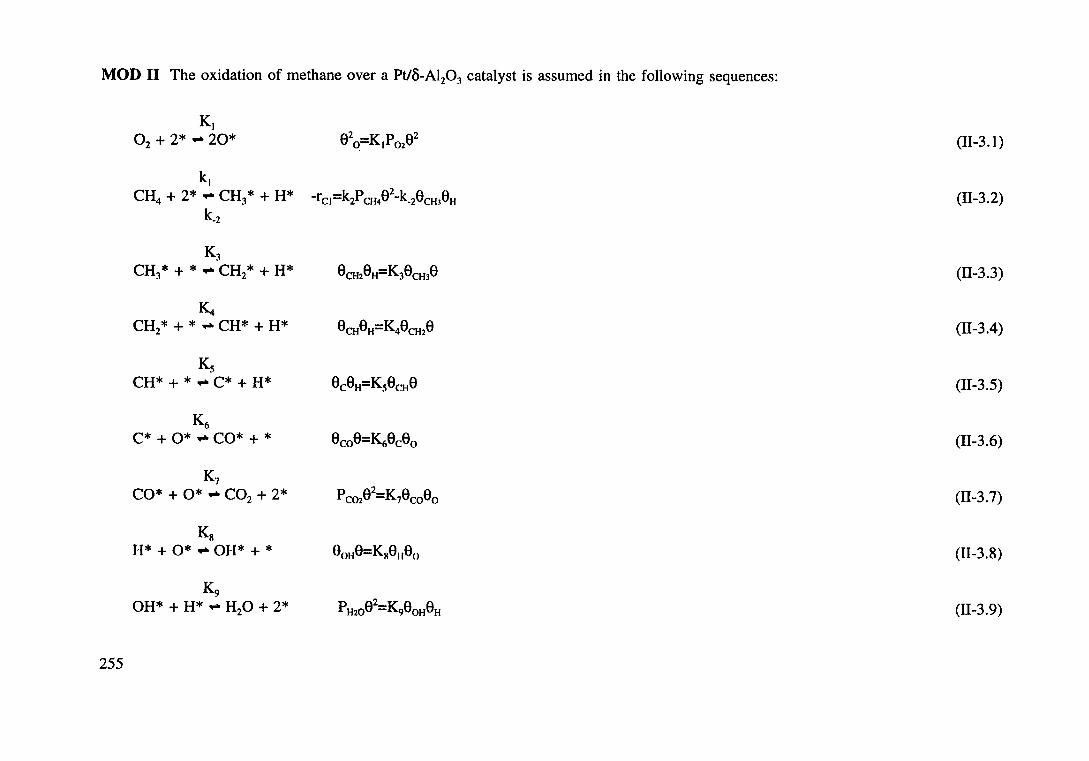
MOD 11 The oxidation of methane over a Pt/o-Al20 3 catalyst is assumed in the following sequences:
255
Kl 0 2 + 2* ,..... 20* 82
0 =K1P0282
kl CH4 + 2* ..... CH3* + H* -rc1=k2PcH48
2-k.28cH38H k_2
K3 CH3 * + * ..... CH2 * + H* ecHzeH=K3ecHJe
K4 CH2 * + * ..... CH* + H* eCHeH=K4eCH2e
Ks CH* + * ,..... C* + H* 8c8H=K58cH8
K6 C* + 0* ,..... CO* + * 8c0 8=K68c80
K1 CO* + 0* ,..... C02 + 2* P co28
2=K78c0 80
Ks H* + 0* ,..... OH* + * 8(m8=KK8u80
K9 OH* + H* ..... H20 + 2* PHza82=K9eaHeH
(11-3.1)
(11-3.2)
(11-3.3)
(11-3.4)
(11-3.5)
(11-3.6)
(11-3.7)
(11-3.8)
(11-3.9)
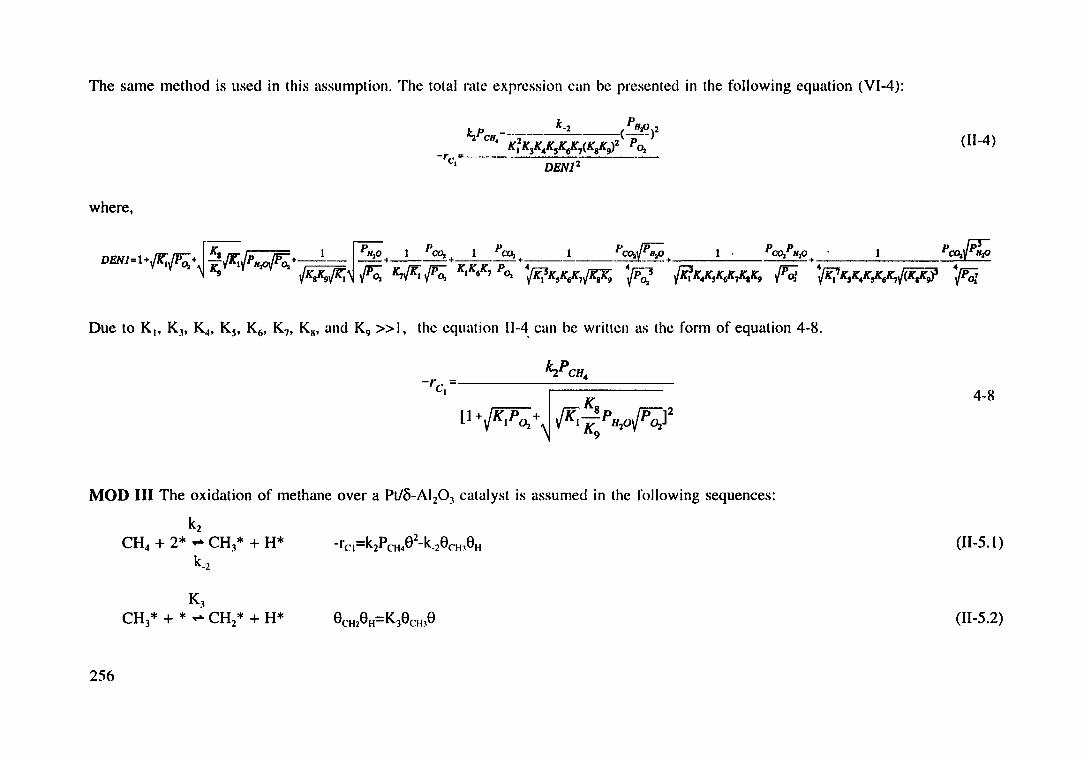
The same method is used in this assumption. The total rate expression can be presented in the following equation (VI-4):
(11-4)
where,
Due to K1, K3, K4, K 5, K6, K7, KK, and K9 >>I, the equation 11-4, can be written as the form of equation 4-8.
4-8
MOD Ill The oxidation of methane over a Ptlo-AI 20 3 catalyst is assumed in the following sequences:
k2 CH + 2* ..,.. CH * + H* 4 3 (11-5.1)
k_2
K3 CH3 * + * ..,.. CH2 * + H* (11-5.2)
256
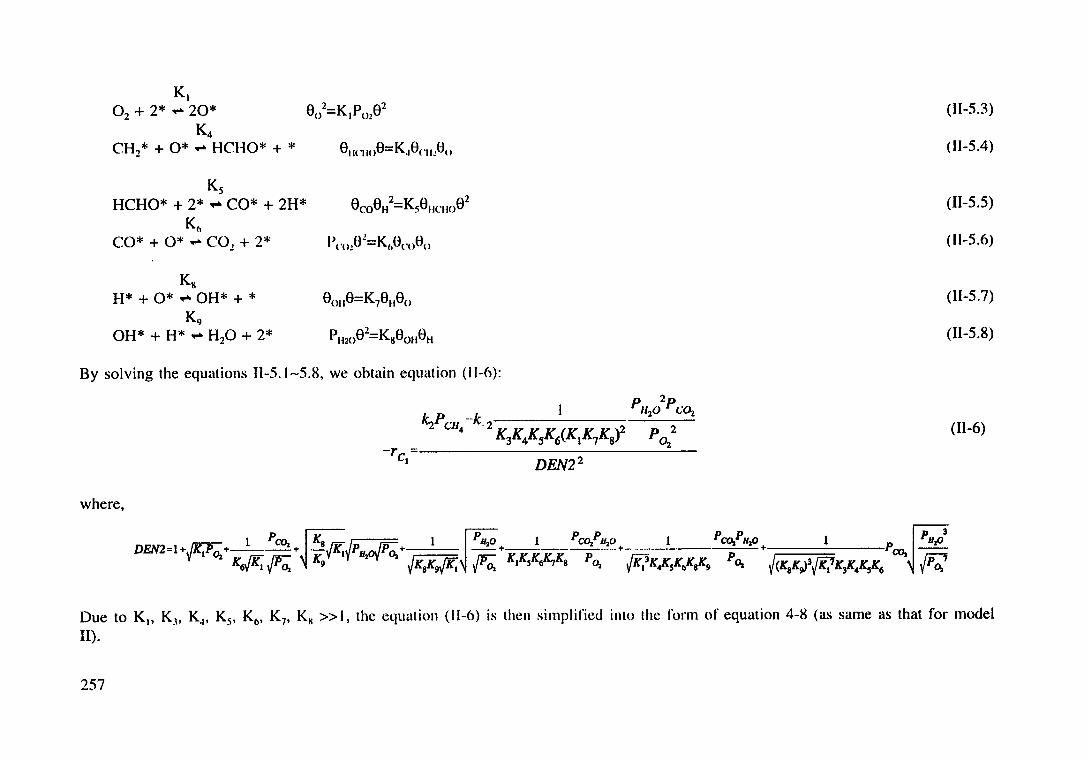
Kt 02 + 2* .... 20* (11-5.3)
K4 CH2* + 0* .,.. HCHO* + * (11-5.4)
Ks HCHO* + 2* .,.. CO* + 2H* (11-5.5)
Kh CO* + 0* .,.. CO.! + 2* (11-5.6)
Kl\ H* + 0* .,.. OH* + * (ll-5.7)
K9 OH* + H* .,.. H20 + 2* (Il-5.8)
By solving the equations Il-5.1-5.8, we obtain equation (11-6):
1 p/1 02pc.:n lr p -k _....;l __ "'l_
"'2 c114 . 2 K K K K (K K K )2 P 2
3456178 02 (11-6)
where,
Due to K1, K3, K"', K5, K6, K7, K11 >>I, the equation (11-6) is then simplified into the form of equation 4-8 (as same as that for model
11).
257
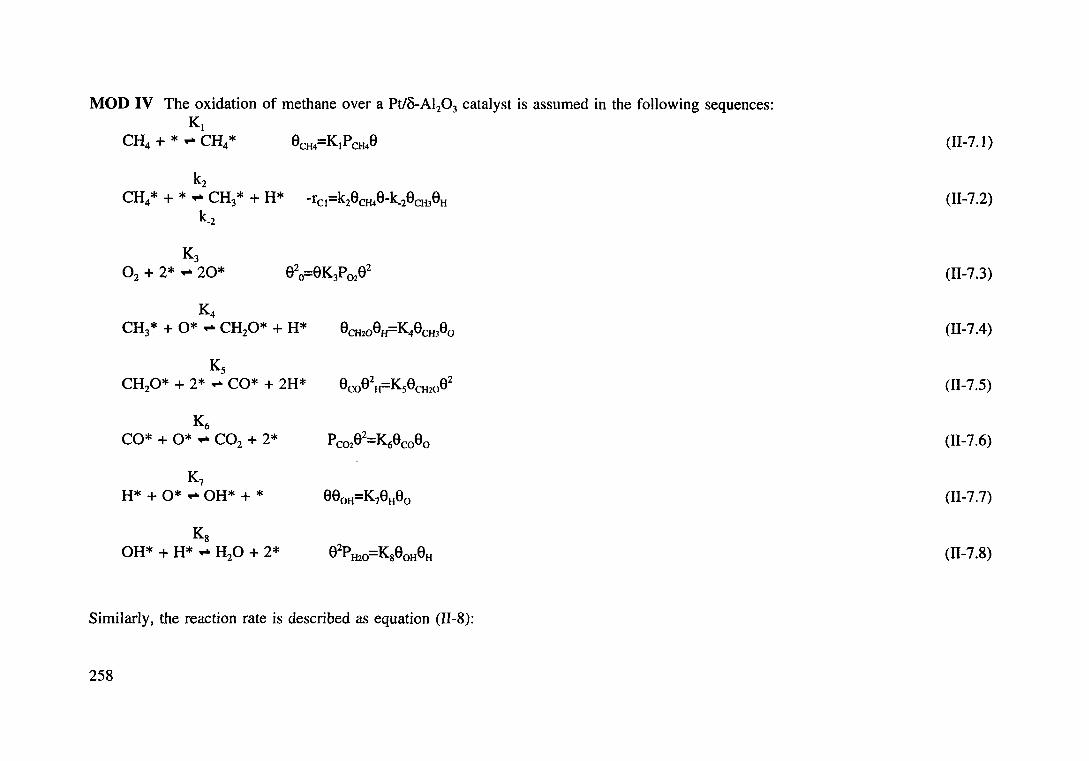
MOD IV The oxidation of methane over a Pt/o-AI20 3 catalyst is assumed in the following sequences: KI
CH4 + * .... CH4* ecH4=KIPcH4e (II-7.1)
k2 CH4* + * .,... CH3* + H* r -k e e k e e - Cl- 2 CH4 - -2 CHJ H (II-7 .2)
k_2
K3 0 2 + 2* .,... 20* 92
0=9K3P0292 (II-7.3)
K4 CH3 * + O* .... CH20* + H* eCH20eH=K4eCHJeo (II-7.4)
Ks CH20* + 2* .... CO* + 2H* Bco92H=Ks9cH20e2 (11-7.5)
K6 CO*+ 0*.,... C02 + 2* Pc029
2=K69c090 (11-7 .6)
K7 H* + 0* .... OH* + * eeoH=K7eHeO (11-7.7)
Ks OH* + H* .... H20 + 2* B2P -K e e H20- 8 OH H (11-7.8)
Similarly, the reaction rate is described as equation (II-8):
258
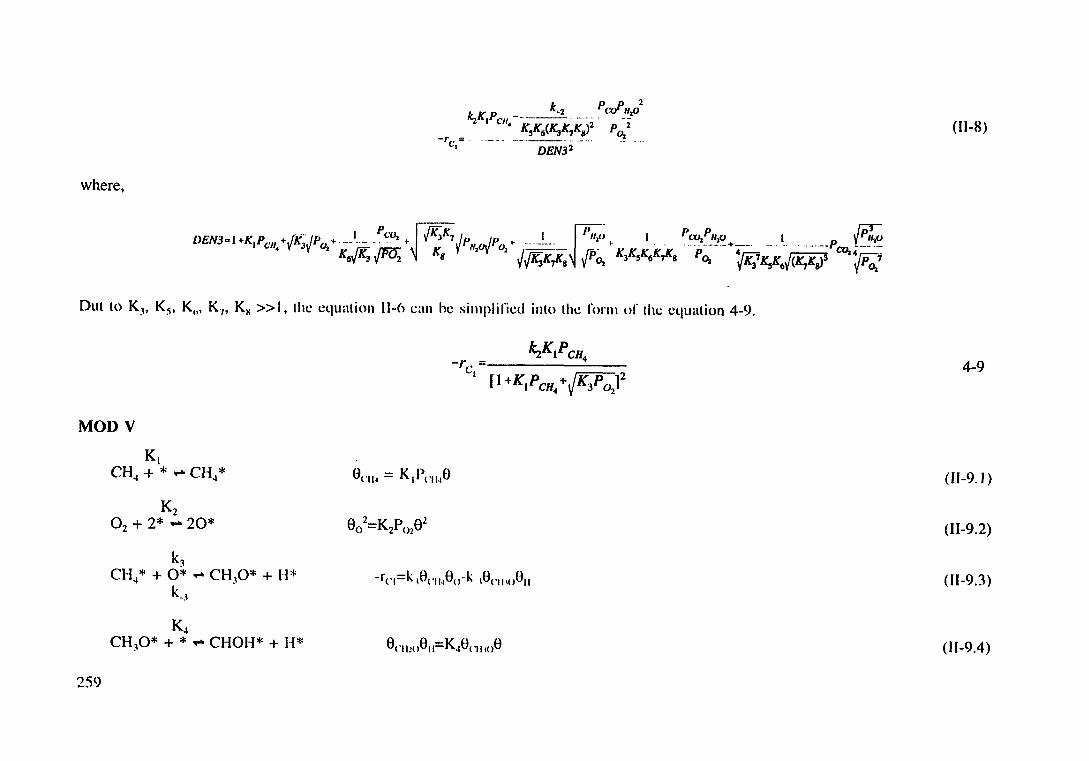
where,
Dut to K3, K5, Kh, K.1, K11 >>I, the equation 11-6 can he simplified into the form of the equation 4-9.
MODV
259
k~ CH4* + O* .,... CH30* + H*
k __ ,
K4 CH 0* + * .,... CHOH* + H* 3
(11-8)
4-9
(11-9. I)
(11-9.2)
(11-9.3)
(11-9.4)
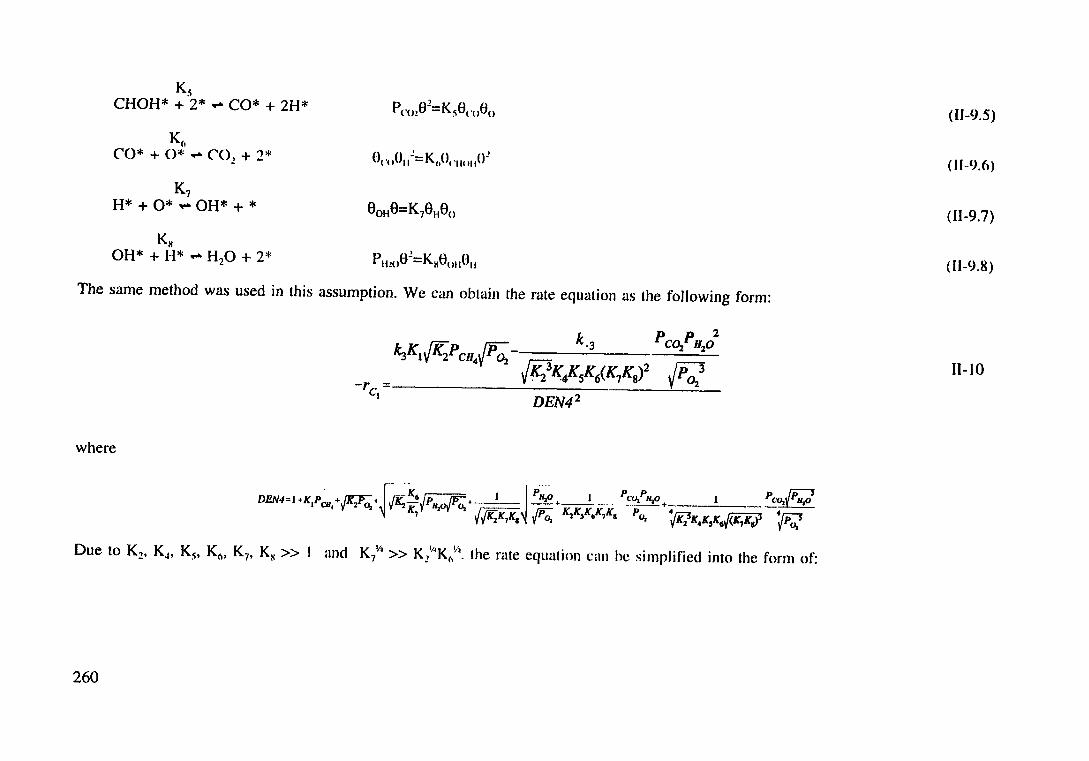
Ks CHOH* + 2*,... CO*+ 2H* Pco28
2=KsB< '()80 (11-9.5}
K(l (-)t 't1()11
2=K,()t 'lie HI()! CO* + 0* ,... C02 + 2* ( 11-·9.6)
K7 H* + 0* ,... OH* + * 80 H8=K78H8o (11-9.7)
Kx OH* + H* ,... H20 + 2* PuzoB2=KxBonHII (11-9.8)
The same method was used in this assumption. We can obtain the rate equation as the following form:
k_3 Pco,_PH2o2
{jflK_.KsK6(K1Ks)2 {P;;; 11-10 ------------------------
DEN42
where
Due to K2, K4, K5, K(\, K7, KM>> I and K/'' >> K/•K6~'. the rate equation can he simplified into the form of:
260
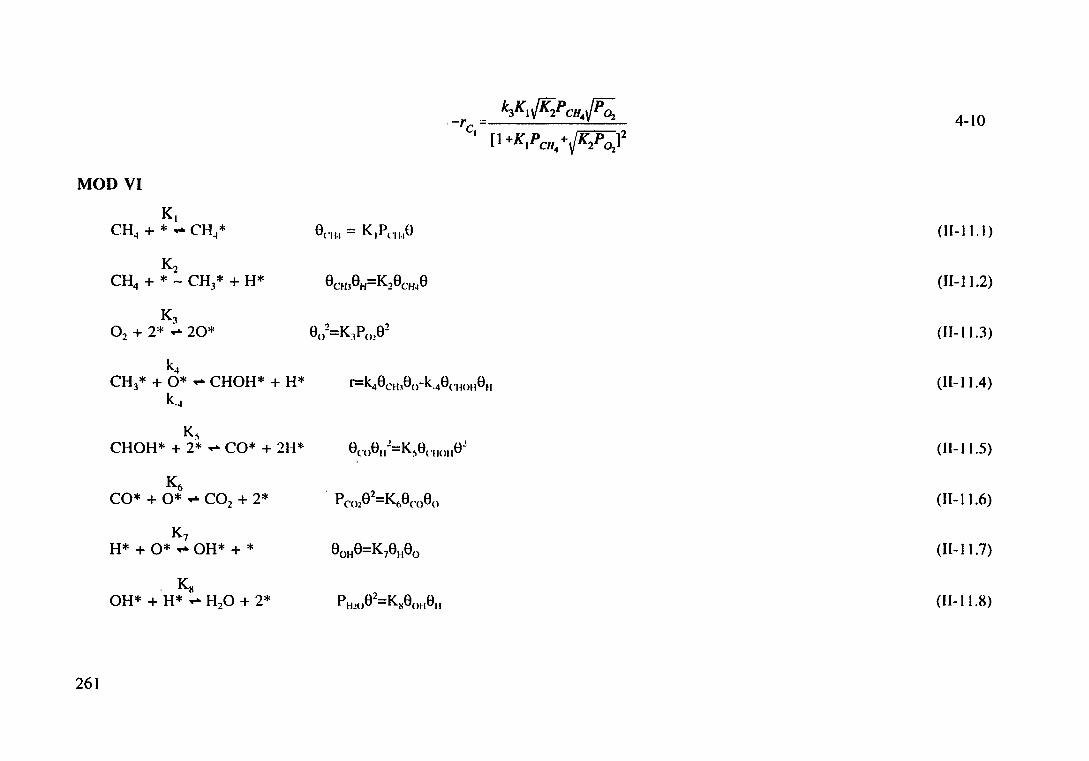
4-10
MOD VI
K, CH4 + * .. CHo~* e('ll.l = K I Pcu .• e (11-11.1)
K., CH4 + * ::.. CH3 * + H* 8CH18H=K28CH~8 (Il-11.2)
K3 80
2=K1P0 !82 02 + 2* .. 20* (11-11.3)
k.j CH3* + 0* .. CHOH* + H* r=k48CH~0o-k-40<.HOfi8H (ll-11.4)
k ...
K:\ 8co8ul=K~et ·••oue! CHOH* + 2* .. CO* + 21-1* (11-11.5)
K6 . 2
CO*+ 0* .. CO + 2* P co2e =K6emeo (11-11.6) 2
K7 H* + 0* .. OH* + * 80H8=K78H8o (11-11.7)
Ks p H!002=Kg0oH811 OH* + H* .. H20 + 2* (11-11.8)
261

By solving the equations (Il-11.1-1 1.8), the rate expression can be obtained, ie.
11-12
where
Due to K3, K5, K6, K7, K8 >>I and K8 >> K7Kt, the equation (Il-12) can be simplified into the form of (4-11):
4-11
262
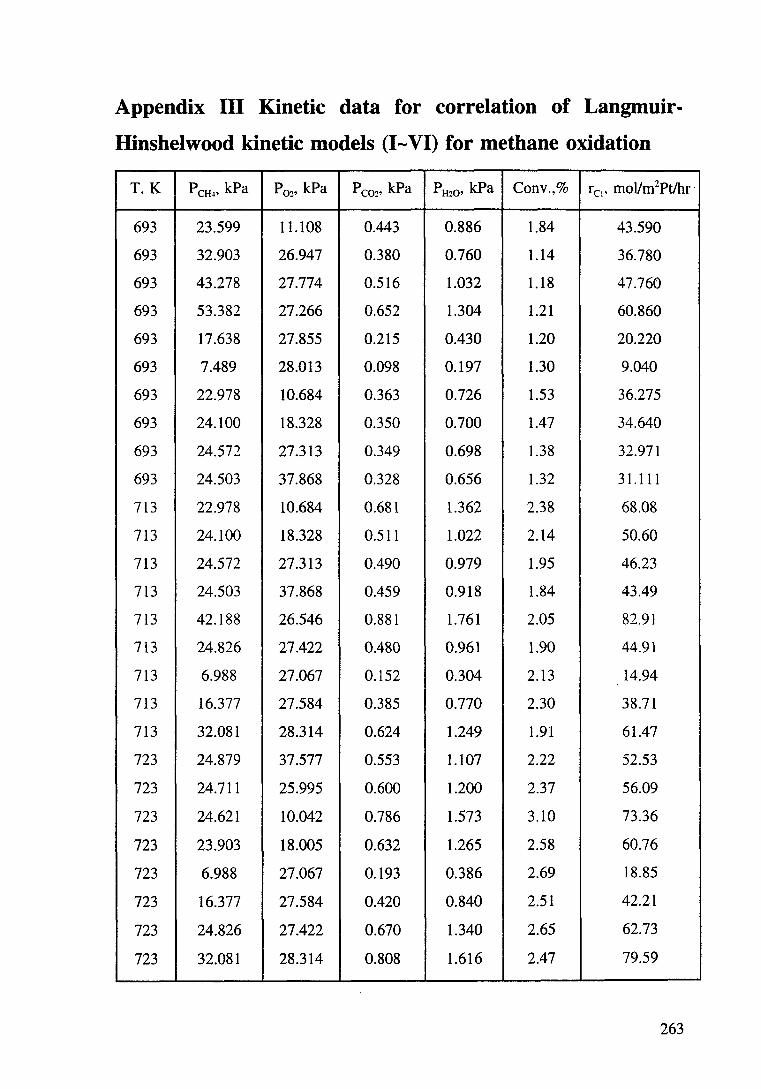
Appendix ID Kinetic data for correlation of Langmuir
Hinshelwood kinetic models (I-VI) for methane oxidation
T.K PcH4• kPa P02, kPa Pc02, kPa PHzo' kPa Conv.,% re:. mollm2Ptlhr ·
693 23.599 11.108 0.443 0.886 1.84 43.590
693 32.903 26.947 0.380 0.760 1.14 36.780
693 43.278 27.774 0.516 1.032 1.18 47.760
693 53.382 27.266 0.652 1.304 1.21 60.860
693 17.638 27.855 0.215 0.430 1.20 20.220
693 7.489 28.013 0.098 0.197 1.30 9.040
693 22.978 10.684 0.363 0.726 1.53 36.275
693 24.100 18.328 0.350 0.700 1.47 34.640
693 24.572 27.313 0.349 0.698 1.38 32.971
693 24.503 37.868 0.328 0.656 1.32 31.111
713 22.978 10.684 0.681 1.362 2.38 68.08
713 24.100 18.328 0.511 1.022 2.14 50.60
713 24.572 27.313 0.490 0.979 1.95 46.23
713 24.503 37.868 0.459 0.918 1.84 43.49
713 42.188 26.546 0.881 1.761 2.05 82.91
713 24.826 27.422 0.480 0.961 1.90 44.91
713 6.988 27.067 0.152 0.304 2.13 14.94
713 16.377 27.584 0.385 0.770 2.30 38.71
713 32.081 28.314 0.624 1.249 1.91 61.47
723 24.879 37.577 0.553 1.107 2.22 52.53
723 24.711 25.995 0.600 1.200 2.37 56.09
723 24.621 10.042 0.786 1.573 3.10 73.36
723 23.903 18.005 0.632 1.265 2.58 60.76
723 6.988 27.067 0.193 0.386 2.69 18.85
723 16.377 27.584 0.420 0.840 2.51 42.21
723 24.826 27.422 0.670 1.340 2.65 62.73
723 32.081 28.314 0.808 1.616 2.47 79.59
263

Appendix IV Derivation of Equations 4-23-4-25
The kinetic expressions for methane, ethane and propane oxidation obtained m
Chapter 4 (4.3.4.1) are as follows:
-re!= 1.20X 1 0~e-210681RT_p0.95 Clp-0.17 02
-rc=3.49x 1 ose-191441RTpL2 C2p-o.6 02
-rC3= 1.87x 1 09e-24930IRTpu ctp-o.6o2
wher.e, -re; is the reaction rate, in mollm2(Pt)lhr.
R equals 1.987 caLK/mol,
P e; is the partial pressure of hydrocarbon i, in kPa,
P 02 the partial pressure of oxygen, in kPa and
T is temperature, in Kervin.
(4-20)
(4-21)
(4-22)
Assuming that pure oxygen is used as the oxidant in feed and that Xci is the
conversion of hydrocarbon i and that Ri is the hydrocarbon to oxygen molar ratio, P 0
and P o:: in rate equations 4-17-19 can then be presented as a function of conversion
(X) by establishing the following relationships:
1) methane (initially 1 mole)
CH~ + 2 02 --+ C02 + 2 H20
initial 1 1/Rl 0 0
final I-XCI 1/R1-2XCI XCI 2XCI
Total number of moles= 1+1/R1 and partial pressures of methane and oxygen are:
PcH4=PT(l-Xc1)/(1+1/R1) and P02=PT(l/R1-2XC!)(l+l/R1) respectively, where PT=l01.3
kPa.
Rate equation 4-17 can then be rearranged as:
(1-X )o.9s -r c =2640.6e -2 l068JRT c.
1 (l +_!:.._ )o.1s( _!:.._ _2x )0.11 R R c.
1 1
264
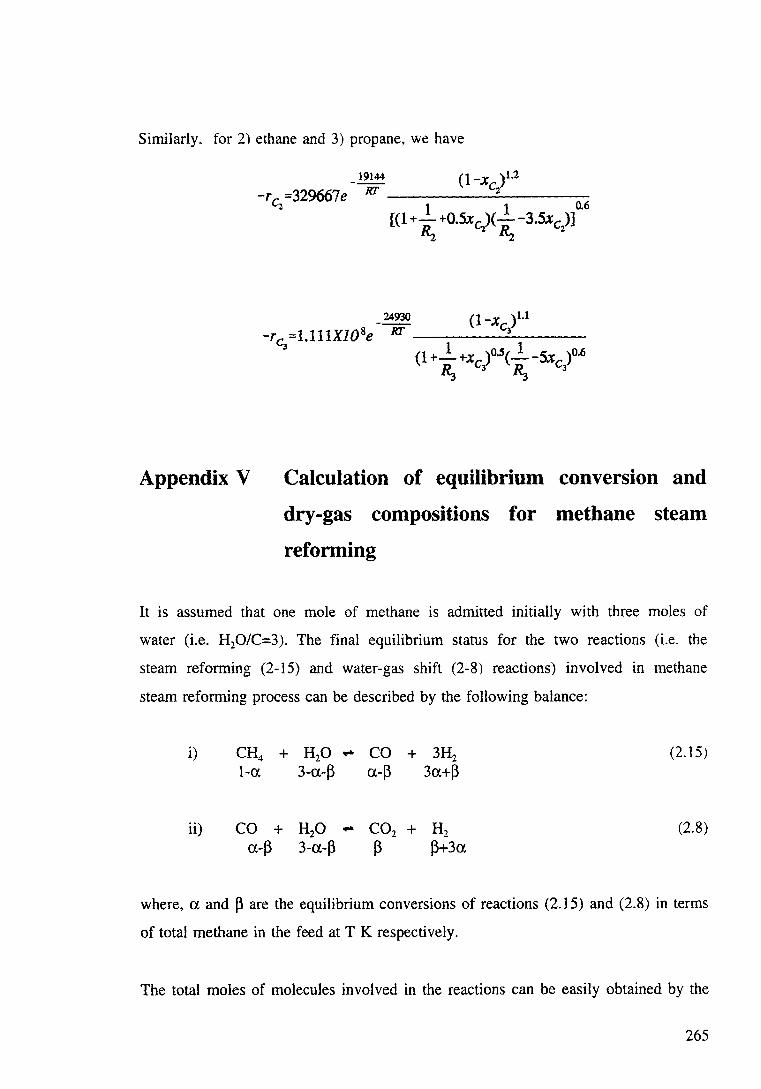
Similarly. for 2) ethane and 3) propane, we have
_ 19144 (1-x )1.2 RT Cz -rc
2=329667e ------=-----
1 1 ~6
[(1 +- +0.5xc )(--3.5xc )] Rz lRz 2
Appendix V Calculation of equilibrium conversion and
dry-gas compositions for methane steam
reforming
It is assumed that one mole of methane is admitted initially with three moles of
water (i.e. H20/C=3). The final equilibrium status for the two reactions (i.e. the
steam reforming (2-15) and water-gas shift (2-8) reactions) involved in methane
steam reforming process can be described by the following balance:
i)
ii)
CH4 + H20 .,.. CO + 3H2
1-a 3-a-~ a-~ 3a+~
CO + H20 .,.. C02 + H2
a-~ 3-a-~ ~ ~+3a
(2.15)
(2.8)
where, a and ~ are the equilibrium conversions of reactions (2.15) and (2.8) in terms
of total methane in the feed at T K respectively.
The total moles of molecules involved in the reactions can be easily obtained by the
265
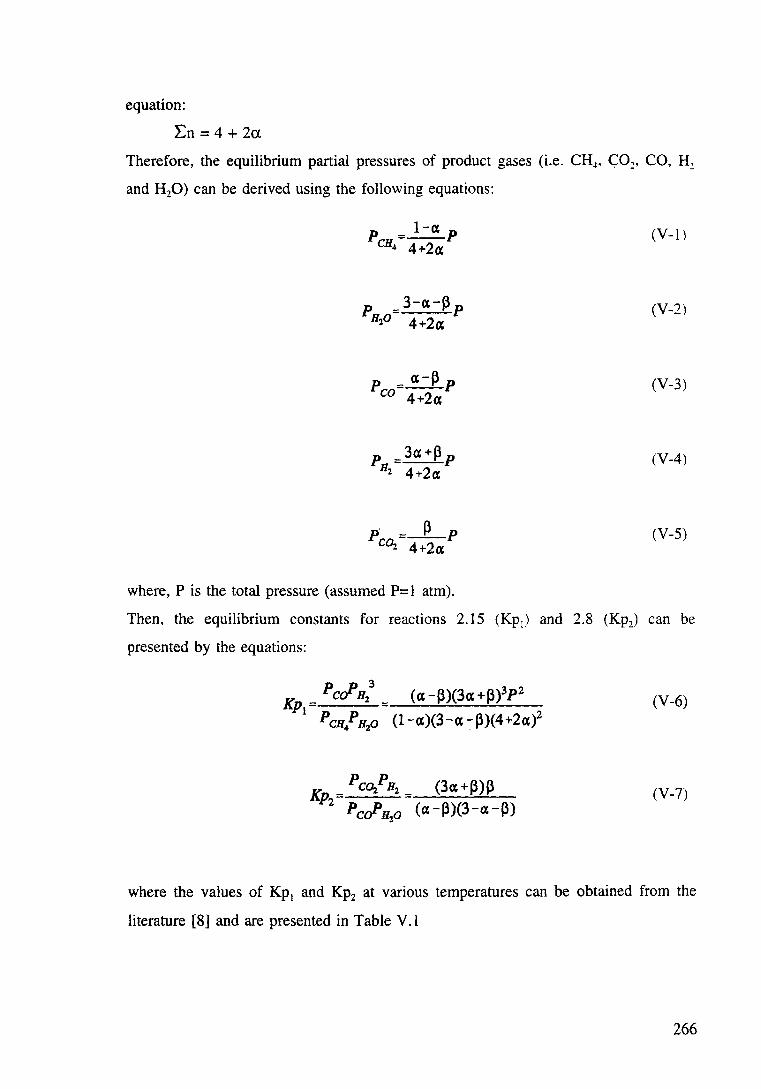
equation:
En= 4 + 2u
Therefore, the equilibrium partial pressures of product gases (i.e. CH-l. ~02 • CO, H~
and H20) can be derived using the following equations:
3-cx-P p PH.p 4+2«
p = «-Pp CO 4+2«
p· =_P_p eo,. 4+2«
where, P is the total pressure (assumed P=l atm).
(V-1 l
(V-2)
(V-3)
(V-4)
(V-5)
Then, the equilibrium constants for reactions 2.15 (Kp1) and 2.8 (Kp2) can be
presented by the equations:
Kp- Pcc?n23 == («-P)(3«+P)3pz 1
P cn4P n2o (1-«)(3-cx -:-P)(4+2ai
(V-6)
(V-7)
where the values of Kp1 and Kp2 at various temperatures can be obtained from the
literature [8] and are presented in Table V.l
266
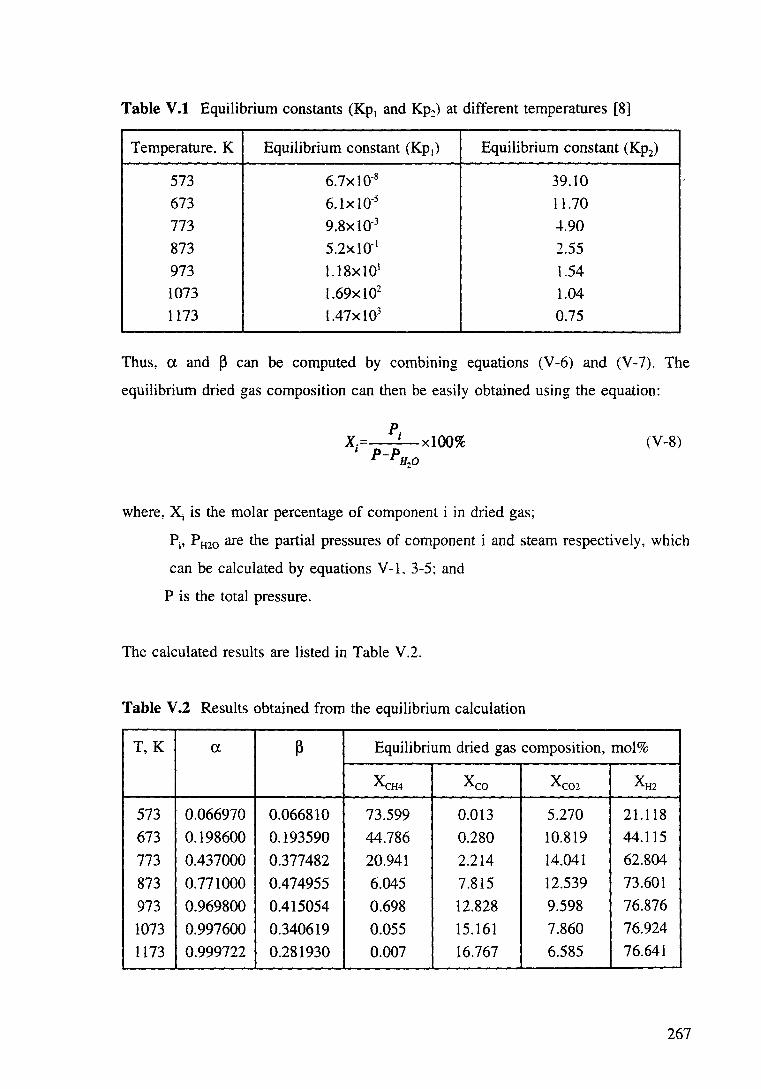
Table V .1 Equilibrium constants (Kp1 and Kp~) at different temperatures [8]
Temperature. K Equilibrium constant (Kp1) Equilibrium constant (Kp2)
573 6.7xl0·8 39.10
673 6.1X 10·5 11.70
773 9.8xl0-3 -1-.90
873 5.2xl0-1 2.55
973 l.18x101 1.54 1073 l.69x102 1.04 1173 l.47xl03 0.75
Thus, a and ~ can be computed by combining equations (V -6) and (V -7). The
equilibrium dried gas composition can then be easily obtained using the equation:
(V-8)
where, Xi is the molar percentage of component i in dried gas;
Pi, PH2o are the partial pressures of component i and steam respectively, which
can be calculated by equations V-1. 3-5: and
P is the total pressure.
The calculated results are listed in Table V.2.
Table V.2 Results obtained from the equilibrium calculation
T,K a ~ Equilibrium dried gas composition, mol%
XCH4 Xco Xco2 XH2
573 0.066970 0.066810 73.599 0.013 5.270 21.118
673 0.198600 0.193590 44.786 0.280 10.819 44.115
773 0.437000 0.377482 20.941 2.214 14.041 62.804
873 0.771000 0.474955 6.045 7.815 12.539 73.601
973 0.969800 0.415054 0.698 12.828 9.598 76.876
1073 0.997600 0.340619 0.055 15.161 7.860 76.924
1173 0.999722 0.281930 0.007 16.767 6.585 76.641
267
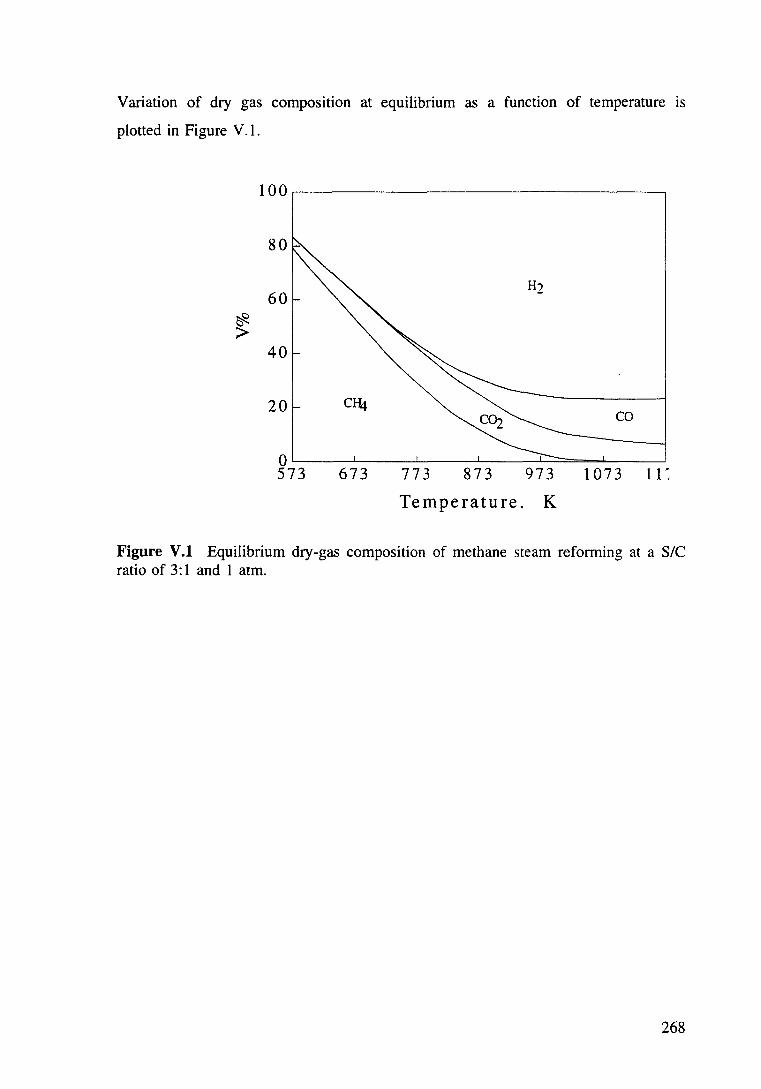
Variation of dry gas composition at equilibrium as a function of temperature IS
plotted in Figure V .1.
100~--------------------------------~
80
60 H2
~ >
40
20 CHl eo
0 573 673 773 873 973 1073 11 ~
Temperature. K
Figure V.l Equilibrium dry-gas composition of methane steam reforming at a S/C ratio of 3:1 and 1 atm.
268
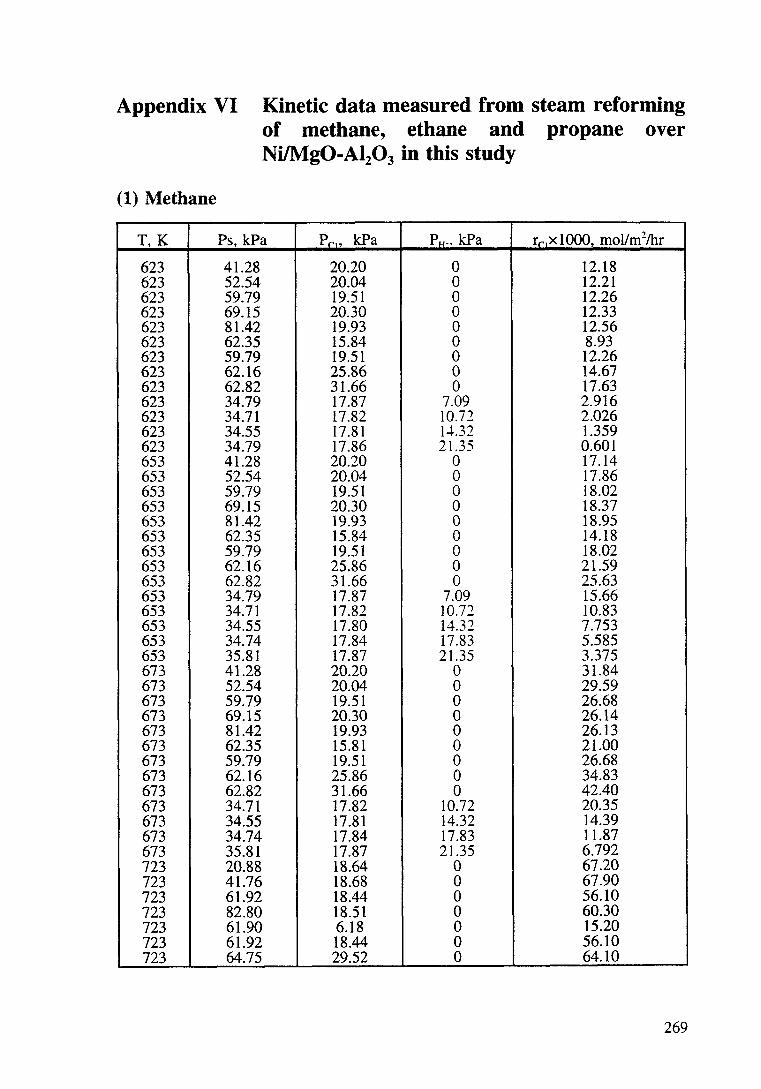
Appendix VI Kinetic data measured from steam reforming of methane, ethane and propane over Ni/Mg0-Al20 3 in this study
(1) Methane
T,K Ps, kPa Pr, kPa P~,. kPa rr,X 1000, mol/m2/hr
623 41.28 20.20 0 12.18 623 52.54 20.04 0 12.21 623 59.79 19.51 0 12.26 623 69.15 20.30 0 12.33 623 81.42 19.93 0 12.56 623 62.35 15.84 0 8.93 623 59.79 19.51 0 12.26 623 62.16 25.86 0 14.67 623 62.82 31.66 0 17.63 623 34.79 17.87 7.09 2.916 623 34.71 17.82 10.72 2.026 623 34.55 17.81 1-+.32 1.359 623 34.79 17.86 21.35 0.601 653 41.28 20.20 0 17.14 653 52.54 20.04 0 17.86 653 59.79 19.51 0 18.02 653 69.15 20.30 0 18.37 653 81.42 19.93 0 18.95 653 62.35 15.84 0 14.18 653 59.79 19.51 0 18.02 653 62.16 25.86 0 21.59 653 62.82 31.66 0 25.63 653 34.79 17.87 7.09 15.66 653 34.71 17.82 10.72 10.83 653 34.55 17.80 14.32 7.753 653 34.74 17.84 17.83 5.585 653 35.81 17.87 21.35 3.375 673 41.28 20.20 0 31.84 673 52.54 20.04 0 29.59 673 59.79 19.51 0 26.68 673 69.15 20.30 0 26.14 673 81.42 19.93 0 26.13 673 62.35 15.81 0 21.00 673 59.79 19.51 0 26.68 673 62.16 25.86 0 34.83 673 62.82 31.66 0 42.40 673 34.71 17.82 10.72 20.35 673 34.55 17.81 14.32 14.39 673 34.74 17.84 17.83 11.87 673 35.81 17.87 21.35 6.792 723 20.88 18.64 0 67.20 723 41.76 18.68 0 67.90 723 61.92 18.44 0 56.10 723 82.80 18.51 0 60.30 723 61.90 6.18 0 15.20 723 61.92 18.44 0 56.10 723 64.75 29.52 0 64.10
269
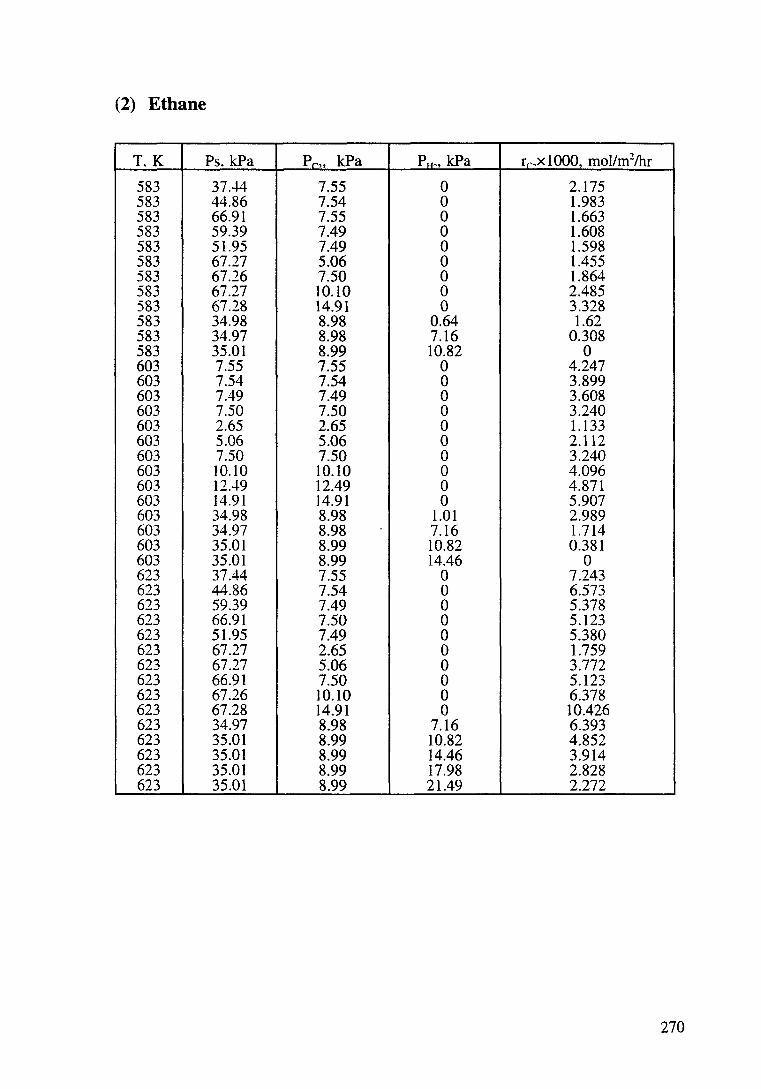
(2) Ethane
T.K Ps. kPa Pr, kPa P~,, kPa rr,X 1000, mol/m2/hr
583 37.-14 7.55 0 2.175 583 44.86 7.54 0 1.983 583 66.91 7.55 0 1.663 583 59.39 7.49 0 1.608 583 51.95 7.49 0 1.598 583 67.27 5.06 0 1.455 583 67.26 7.50 0 1.864 583 67.27 10.10 0 2.485 583 67.28 14.91 0 3.328 583 34.98 8.98 0.64 1.62 583 34.97 8.98 7.16 0.308 583 35.01 8.99 10.82 0 603 7.55 7.55 0 4.247 603 7.54 7.54 0 3.899 603 7.49 7.49 0 3.608 603 7.50 7.50 0 3.240 603 2.65 2.65 0 1.133 603 5.06 5.06 0 2.112 603 7.50 7.50 0 3.240 603 10.10 10.10 0 4.096 603 12.49 12.49 0 4.871 603 14.91 14.91 0 5.907 603 34.98 8.98 1.01 2.989 603 34.97 8.98 7.16 1.714 603 35.01 8.99 10.82 0.381 603 35.01 8.99 14.46 0 623 37.44 7.55 0 7.243 623 44.86 7.54 0 6.573 623 59.39 7.49 0 5.378 623 66.91 7.50 0 5.123 623 51.95 7.49 0 5.380 623 67.27 2.65 0 1.759 623 67.27 5.06 0 3.772 623 66.91 7.50 0 5.123 623 67.26 10.10 0 6.378 623 67.28 14.91 0 10.426 623 34.97 8.98 7.16 6.393 623 35.01 8.99 10.82 4.852 623 35.01 8.99 14.46 3.914 623 35.01 8.99 17.98 2.828 623 35.01 8.99 21.49 2.272
270
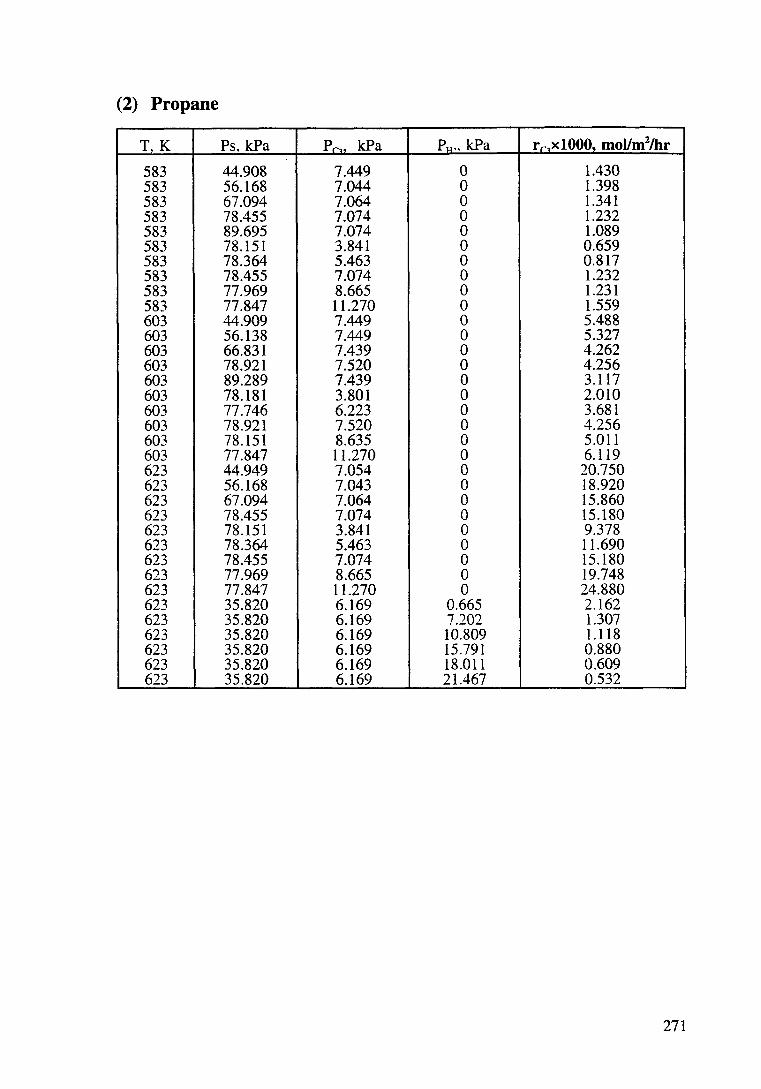
(2) Propane
T,K Ps. kPa Pru kPa P .. kPa rr,xlOOO, moJ/m2/hr
583 44.908 7.449 0 1.430 583 56.168 7.044 0 1.398 583 67.094 7.064 0 1.341 583 78.455 7.074 0 1.232 583 89.695 7.074 0 1.089 583 78.151 3.841 0 0.659 583 78.364 5.463 0 0.817 583 78.455 7.074 0 1.232 583 77.969 8.665 0 1.231 583 77.847 11.270 0 1.559 603 44.909 7.449 0 5.488 603 56.138 7.449 0 5.327 603 66.831 7.439 0 4.262 603 78.921 7.520 0 4.256 603 89.289 7.439 0 3.117 603 78.181 3.801 0 2.010 603 77.746 6.223 0 3.681 603 78.921 7.520 0 4.256 603 78.151 8.635 0 5.011 603 77.847 11.270 0 6.119 623 44.949 7.054 0 20.750 623 56.168 7.043 0 18.920 623 67.094 7.064 0 15.860 623 78.455 7.074 0 15.180 623 78.151 3.841 0 9.378 623 78.364 5.463 0 11.690 623 78.455 7.074 0 15.180 623 77.969 8.665 0 19.748 623 77.847 11.270 0 24.880 623 35.820 6.169 0.665 2.162 623 35.820 6.169 7.202 1.307 623 35.820 6.169 10.809 1.118 623 35.820 6.169 15.791 0.880 623 35.820 6.169 18.011 0.609 623 35.820 6.169 21.467 0.532
271

Appendix VII
T.K 623 623 623 623 623 623 623 623 623 623 623 623 623 653 653 653 653 653 653 653 653 653 653 653 653 653 653 673 673 673 673 673 673 673 673 673 673 673 673 673 723 723 723 723 723 723 723
Data used for correlation of LangmuirHinshelwood models (1-5) for steam reforming of methane over Ni/Mg0-AI20 3 catalyst
Pr, kPa P,.N)• kPa P..H., kPa r, mollm2/hr
20.199 41.280 0.816 0.01218 20.037 52.540 0.831 0.01221 19.510 59.786 0.816 0.01226 20.300 69.151 0.836 0.01233 19.925 81.425 0.820 0.01256 15.841 62.351 0.665 0.00893 19.510 59.786 0.816 0.01226 25.865 62.158 1.033 0.01467 31.662 62.817 1.260 0.01763 17.866 34.792 7.089 0.002916 17.820 34.705 10.719 0.002026 17.806 34.548 14.319 0.001359 17.864 34.794 21.345 0.000601 20.199 41.280 1.260 0.01714 20.037 52.540 1.306 0.01786 19.510 59.786 1.317 0.01802 20.300 69.151 1.323 0.01837 19.925 81.425 1.217 0.01895 15.841 62.351 1.042 0.01418 19.510 59.786 1.317 0.01802 25.865 62.158 1.528 0.02159 31.662 62.817 1.892 0.02563 17.866 34.7~)2 7.089 0.01566 17.820 34.705 10.719 0.01083 17.806 34.548 14.319 0.007753 17.836 34.736 17.827 0.005585 17.866 35.808 21.345 0.003375 20.199 41.280 2.624 0.03184 20.037 52.540 2.368 0.02959 19.510 59.786 3.091 0.02668 20.300 69.151 1.961 0.02614 19.925 81.425 1.848 0.02613 15.841 62.351 1.576 0.02100 19.510 59.786 2.091 0.02668 25.865 62.158 2~700 0.03483 31.662 62.817 3.282 0.04240 17.820 34.705 10.319 0.02035 17.806 34.548 14.319 0.01439 17.836 34.736 17.327 0.011868 17.866 35.808 21.345 0.006792 18.638 20.878 5.157 0.0672 18.679 41.756 4.877 0.0679 18.436 61.925 3.947 0.0561 18.507 82.803 3.501 0.0603 6.182 61.905 1.238 0.0152 18.436 61.925 3.947 0.0561 29.523 64.753 4.318 0.0641
272
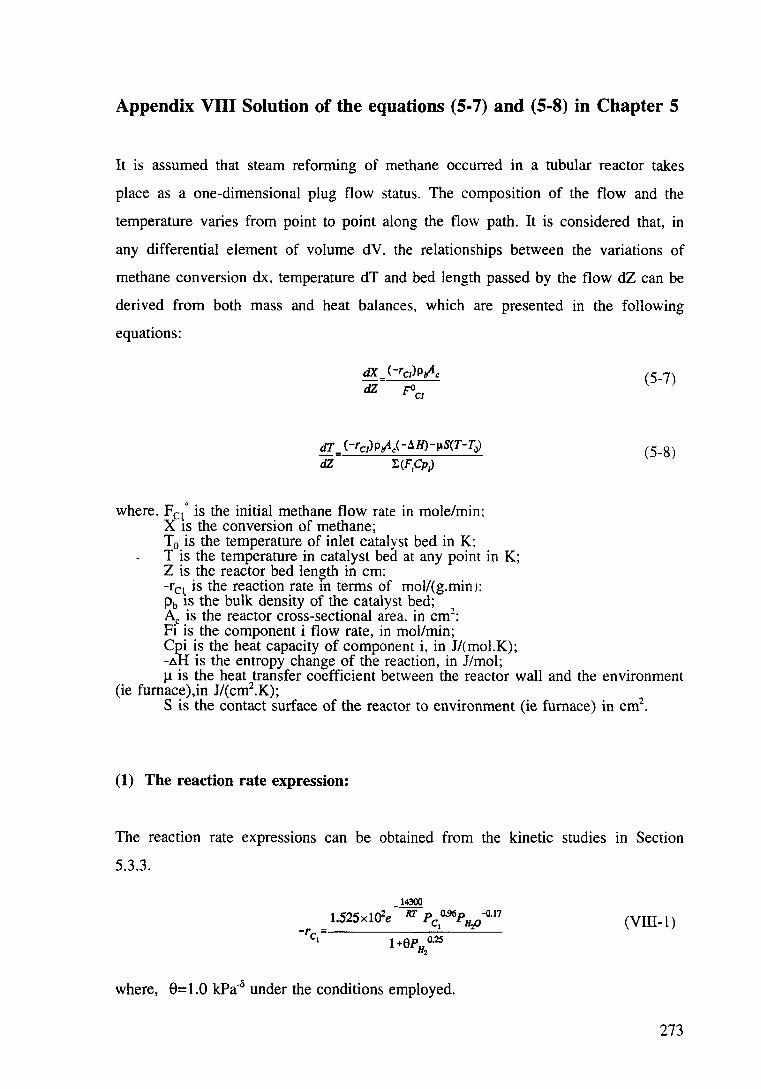
Appendix Vlll Solution of the equations (5-7) and (5-8) in Chapter 5
It is assumed that steam reforming of methane occurred in a tubular reactor takes
place as a one-dimensional plug flow status. The composition of the flow and the
temperature varies from point to point along the flow path. It is considered that, in
any differential element of volume dV. the relationships between the variations of
methane conversion dx, temperature dT and bed length passed by the flow dZ can be
derived from both mass and heat balances, which are presented in the following
equations:
dX = ( -r CI)p J!lc dZ FJCI
dT_ (-rci)PJ!lk.1H)-J.&S(T-T~
dZ T.(F,CpJ
where, Fq, is the initial methane flow rate in mole/min: X 1s the conversion of methane; T0 is the temperature of inlet catalyst bed in K: T is the temperature in catalyst bed at any point in K; Z is the reactor bed length in cm: -rc1 is the reaction rate in terms of mol/(g.minJ: ph is the bulk density of the catalyst bed; Ac is the reactor cross-sectional area. in cm2
:
Fi is the component i flow rate, in mol/min;
(5-7)
(5-8)
Cpi is the heat capacity of component i, in J/(mol.K); -.o.H is the entropy change of the reaction, in J/mol; J.l is the heat transfer coefficient between the reactor wall and the environment
(ie fumace),in J/(cm2.K); S is the contact surface of the reactor to environment (ie furnace) in cm2
•
(1) The reaction rate expression:
The reaction rate expressions can be obtained from the kinetic studies in Section
5.3.3.
(VIII-1)
where, 8= 1.0 kPa·0 under the conditions employed.
273
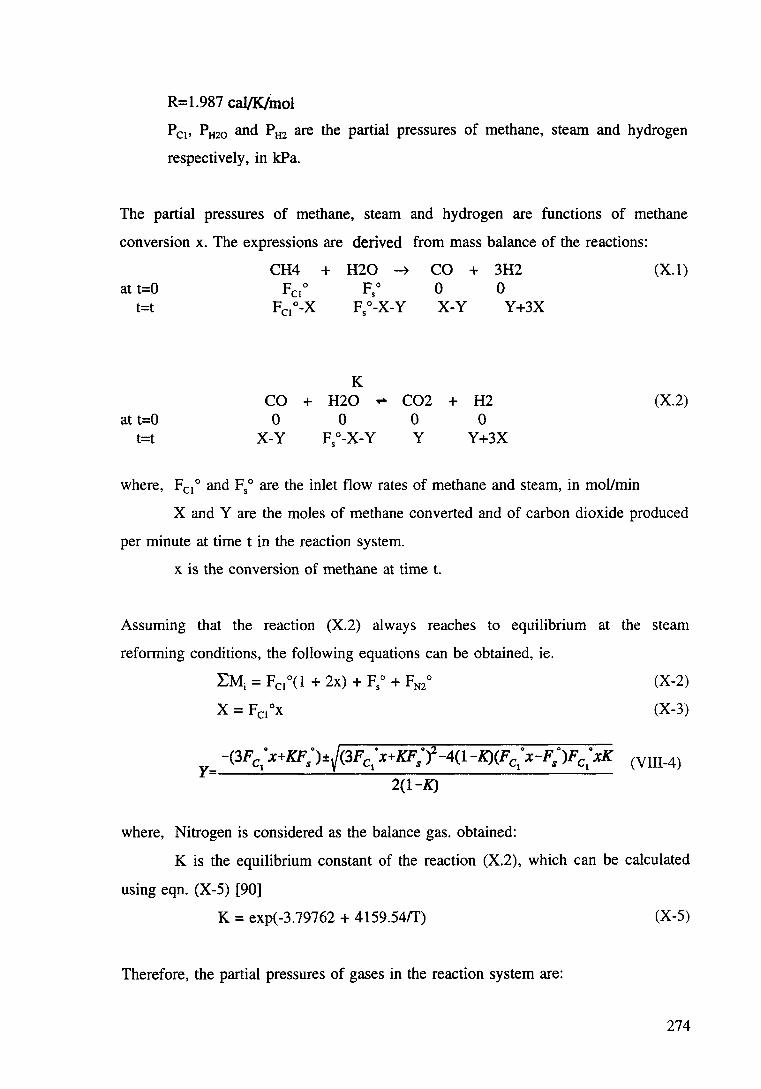
R=l.987 cal/K/inol
Pc1, PH2o and PH2 are the partial pressures of methane, steam and hydrogen
respectively, in kPa.
The partial pressures of methane, steam and hydrogen are functions of methane
conversion x. The expressions are derived from mass balance of the reactions:
at t=O t=t
at t=O t=t
CH4 + H20 ~ CO + 3H2 0 0 X-Y Y+3X
K CO + H20 .,.. C02 + H2 0 0 0 0
X-Y F5°-X-Y Y Y+3X
where, Fc1° and F5° are the inlet flow rates of methane and steam, in mollmin
(X.l)
(X.2)
X and Y are the moles of methane converted and of carbon dioxide produced
per minute at time t in the reaction system.
x is the conversion of methane at time t.
Assuming that the reaction (X.2) always reaches to equilibrium at the steam
reforming conditions, the following equations can be obtained, ie.
LMi = Fclo(l + 2x) + pso + FN2o
X= Fciox
(X-2)
(X-3)
Y -(3Fctox+KFl)±J(3Fctox+KFsoi-4(1-K)(Fctox-Fso)FctoxK (Vlll-4)
2(1-K)
where, Nitrogen is considered as the balance gas. obtained:
K is the equilibrium constant of the reaction (X.2), which can be calculated
using eqn. (X-5) [90]
K = exp(-3.79762 + 4159.54ff) (X-5)
Therefore, the partial pressures of gases in the reaction system are:
274
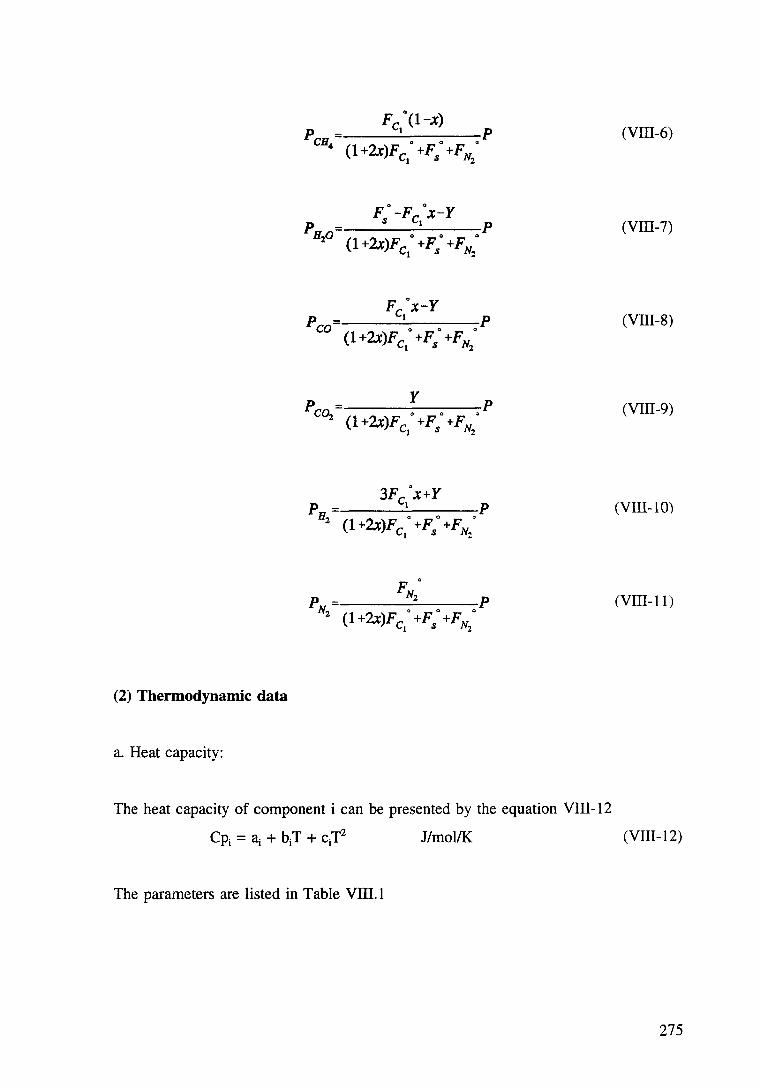
PCH Fc
1·(1-x)
p (VIII-6) 4 (1 +2x)Fc. +F. +FN..
1 8 z
F. -F ·x-Y
PH.p 8 c1 p (VIII-7)
(1 +2x)Fc1• +F8• +FN;
F ·x-Y Pco
c1 p (VID-8) (1 +2x)Fc. +F. +FN..
1 8 z
Pea, y p
(1+2x)Fc. +F. +FN., (VIII-9)
1 8 z
Pn 3Fc ·x+Y
p (VIII-10) 1 z (1 +2x)Fc1. +F8. +FNz.
PN FNz•
p (VIII-11) 2 (1+2x)Fc. +F. +FN..
1 s 2
(2) Thermodynamic data
a. Heat capacity:
The heat capacity of component i can be presented by the equation VIII-12
Cp. = a. + bT + cT2 1 1 I 1 J/mol/K (VIII-12)
The parameters are listed in Table VIII. 1
275

Table VIII.l The parameters of heat capacities [ 151]
Component ~
H2 26.88
N2 27.32
H20 29.16
CO 26.537
C02 26.75
CH4 14.15
b. Reaction enthalpy change
For reaction (X.l) .c.H298 o is 206.17 kJ/mol;
For reaction (X.2 ), .c.H298 o is -41 kJ/mol.
bi
-l.347xl0"3
6.226x10"3
14.49xl0·3
7.6831 x w-3
-l2.258x 1 0"3
75.496xl0·3
ci
-0.3265x 10"6
-0. 9502x 10"6
-2.022xl0·6
-1.172x 10"6
-14.25xl0·6
-17. 99x 10"6
All the information obtained above is employed to equations 5-4 and 5-5. Both
differential equations 5-4 and 5-5 can be solved using a 4th order Runge-Kutta
method. The computing program is listed as following:
c********This is a personal runge kutta program c developed to solve the governing equations for c steam reforming of methane in one-dimensional c plug flow reactor c homogenous model c the rate expression used is r=kCA**a*CB**b/(l+CH**c) c CA = hydrocarbon concn. CB = water concn and CH =h2 concn c a= order of hydrocarbon, b =order of water, c= order of h2 c c CpHq + pH20 = pCO + ( q/2 +p )H20 c for methane, p =1, q = 4 c
real zeta, zetai, zetaf, dez, therm common aO,ea,tinit,cons 1 ,faO,a,b,c,p,q,pt,cons
c
276
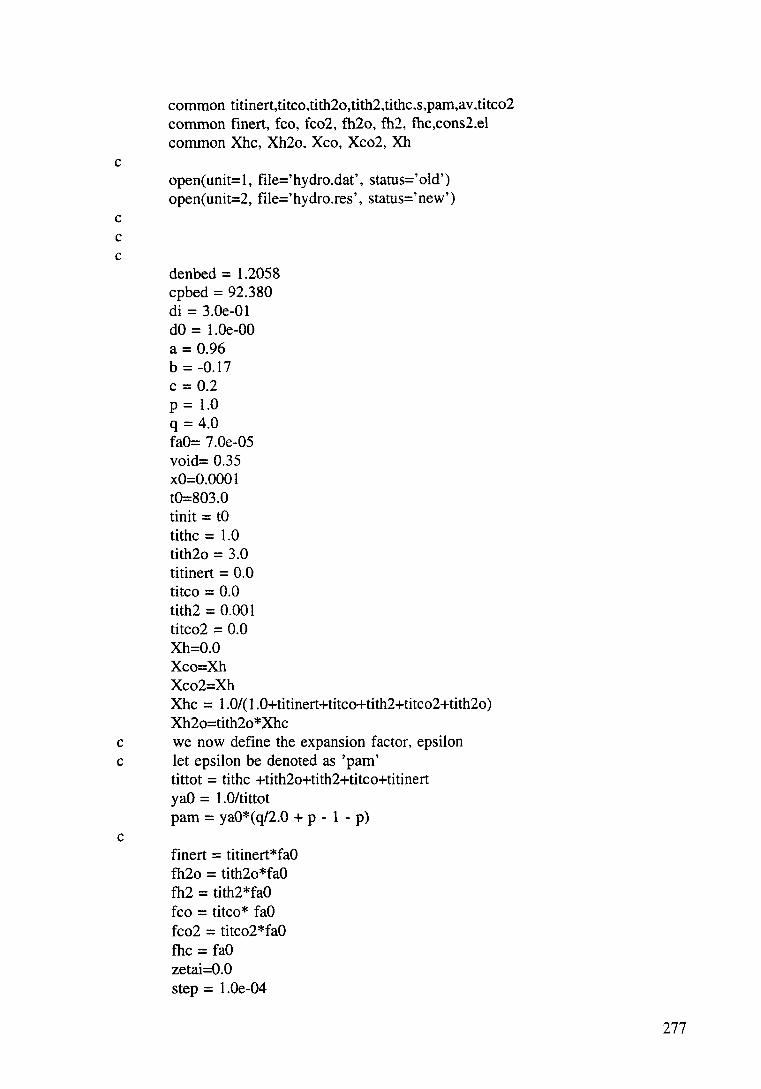
c
c c c
common titinert,titco,tith2o,tith2.tithc,s,pam,av.titco2 common finert, fco, fco2, fh2o, fh2, fhc,cons2.el common Xhc, Xh2o. Xco, Xco2, Xh
open( unit= 1, file='hydro.dat', status=' old') open(unit=2, file='hydro.res', status=' new')
denbed = 1.2058 cpbed = 92.380 di = 3.0e-01 dO= 1.0e-00 a= 0.96 b = -0.17 c = 0.2 p = 1.0 q = 4.0 faO= 7.0e-05 void= 0.35 x0=0.0001 t0=803.0 tinit =tO tithe = 1.0 tith2o = 3.0 titinert = 0.0 titco = 0.0 tith2 = 0.001 titco2 = 0.0 Xh=O.O Xco=Xh Xco2=Xh Xhc = 1.0/( 1.0+titinert+titco+tith2+titco2+tith2o) Xh2o=tith2o*Xhc
c we now define the expansion factor, epsilon c let epsilon be denoted as 'pam'
c
tittot = tithe +tith2o+tith2+titco+titinert yaO = 1.0/tittot pam = yaO*(q/2.0 + p- 1 - p)
finert = titinert*faO fh2o = tith2o*fa0 fh2 = tith2*fa0 fco = titco* faO fco2 = titco2*fa0 fhc = faO zetai=O.O step = l.Oe-04
277

nnstep = 10000 zeta=zetai
c step = -step aO = 1.5449e-0 1 ea=14338.0 ea=ea/1.987 pt =1.0 paO = yaO*pt tinit=tO u = 1.0e-02
c ca0=pa0/(8.205e-05*t0) c faO=qO*caO c
s=22.0*(d0**2.0- di**2.0)/28.0 c s = cross-sectional area, av = area per unit vol. of reactor
el=l.O
c c c
100
110 1 1 1 1
c 1 c 1 c c
200 1
av=3.142*dO*el cons2 = u*av cons1=a0*s*denbed cons=( 1.0-void)*denbed*s write( 6, *) 'cons 1 =', cons 1. ' cons2= ',cons2 v2 = 0.0 v3 = 0.9 v4 = 0.0 write(2, 1 00)
format(/,15x, 'DATA FOR THIS NUMERICAL EXPERIMENT') write(2, 11 0) tith2o,titinert,tO,dO,di,faO,cons2,u format(/,5x,'water:hc= 'J6.3,9x,'inert:hc= ',f6.3,//
3x,'inlet temp to SR reactor= ',f8.3,5x,' outer diameter= ', e 12.3, 1x,'cm' ,//, 5x,'inner diameter= ',e12.3, 1x,'cm' //,5x, 'original he molar rate to SR reactor= ',e12.3,1x,'mol/s.'// 5x,'cons2 = ',e12.3/,5x,'u = ', e12.3,2x,'W/cm"2 K '/) 5x, '.reactor length based on oxidation reactor reqmt= ',f8.3 ,1x,'m'/,)
write(2, 200) format(/, 1 x,' counter' ,2x, 'Cat. bed cm' ,4x,' conversion' ,4x,
'temperature' ,9x,'XH2' ,10x,'Xco2' ,11x,'Xco' ,//) k=O j=1 x=xO t=tO
c nnstep = 1000
c c
do while(x .le. 0.4)
c do 1000 j= 1 ,nnstep+ 1
278

c
kount = lj-1 )/50 if(kount .eq. k) then write(2, 300) kount, zeta, x,t, Xh, Xco2, Xco
300 format(/.1 x,i4,2x,e 1 0.4.2x,e 14.4,2x,e 14.4,2x,e 14.4,2x.e 14.4, 2x,e14.-UI)
c j = j+1 k=k+l else end if j=j+1 call runge(zeta,xO,tO,step,x,t)
c j=j+1
c
xO=x tO=t end do
c 1000 continue close( unit= 1) close(unit=2) stop
c c
end
c*******statement of subroutines c
subroutine runge(zeta,xO,tO,step,x,t) real zeta, xO,tO,step,x,t
c real y. y 1, y2, phc, ph2o, ph, pco c real pco2, pinert, cphc, cph2o, cpco c real cpco2, cpinert, p 11, p 12, pd, fcptot c
c
real fl. f2, dh, cpa, dcp real phc. pco, pco2,ph,ph2o real p11,p12,pd,pinert,fcptot,eqk real cpco.cphc,cph2o,cpinert,cpco2,cph2,cpcat real y,y1,y2 common aO,ea,tinit,cons 1 ,faO,a,b,c,p,q,pt,cons
common titinert,titco,tith2o,tith2,tithc,s,pam,av,titco2 common finert, fco, fco2, fh2o, fh2, fhc,cons2,el common Xhc, Xh2o, Xco, Xco2, Xh
c common Xco,Xco2,Xh,Xhc,Xh2o c all statement functions must come before the first executable c statement c
dh(t)=165000.0+67.95*(t-298.)-(14.4285e-3*(t**2.0 -298.0**2.0)) 1 -(0.17693e-06*(t**3.0-298.0**3.0))
279
cpinert(t)==27.32+(6.226e-3)*t-(0.9502e-06*(t**2.0)) cph2o(t)=29.16+( 14.49e-03)*t+(2.022e-06*(t**2.0)) cphc(t)=14.150+(75.496e-03)*t-(17.99e-06*(t**2.0)) cph2(t)=26.88+(4.347e-03)*t-(0.3265e-06*(t**2.0)) cpco(t)=26.537+(7.683le-03)*t-( 1.172e-06*(t**2.0)) cpco2( t)=26. 75+( 42.258e-03)*t -( l-+.25e-06*( t**2.0)) cpcat(t)=(92.383+0.037535*t-(2186140.0/t**2.0))11 01.96
c cptot(t)=titinert*cpinert(t)+tith2*cph2+tith2o*cph2o+ c titco*cpco(t)+cphc(t) c
eqk(t)=exp(4159.4/t -3.79762) p11(t)=3.0*fbc*x + eqk(t)*tb2o p 12(t)=p 11 (t)**2.0-( 4.0*(1.0-eqk(t))*(fbc*x-fb2o )*
1 fbc*x*eqk(t)) y 1(t)=( -p 11(t)+(p 12(t)**0.5))/(2.0*( 1.0-eqk(t))) y2(t)=(-p 11(t)-(p 12(t)**0.5))/(2.0*( 1.0-eqk(t))) pd(x,t)=ptl(( 1.0+2.0*x)*fbc+fb2o+finert) phc(x,t)=fbc*( 1.0-x)*pd(x,t) ph2o(x,t)=(fb2o-(fbc*x)-y 1 ( t) )*pd(x.t) pco(x,t) =(fbc*x-y 1 (t) )*pd(x,t) pco2(x.t)=y 1 (t)*pd(x.t)
c ph(x,t)=(y 1 (t)+3.0*fbc*x)*pd(x,t) ph(x,t)=(y 1 (t)+3.0*fbc*x)*pd(x,t)
c
pinert(x,t)=finert*pd(x.t) · fcptot( x, t )=file*( 1.0-x )*cphc( t )+finert*cpinert( t )+ (fbc*x-y 1 (t))*cpco(t)+y 1 (t)*cpco2(t)+(3.0*fbc*x-y 1 (t) )* cph2( t)+(fb2o-(fbc*x)-y 1 (t) )*cph2o( t) fl (x,t)=(cons 1 *(exp( -ealt))*(phc(x.t)**a)*ph2o(x,t)**b)
1 /( 1.0+ph(x,t)**c )/fbc f2(x,t)=(fbc*( -dh(t))*fl (x,t)+ (cons2*(tinit-t))) /fcptot(x,t)
Xhc=phc(x,t)* 100 Xh2o=ph2o(x,t)* 100 Xco=pco(x,t)* 100 Xco2=pco2(x,t)* 100 Xh=ph(x,t)* 100
if(p12(t) .It. 0.0) then write(6,2000) t write(2,2000) t
2000 format(//,5x, 'This is an impossible set of water:alkane 1 ratio for this temperature, t = ',f8.3//)
c p12(t)= -p12(t) else endif if(y 1 (t) .It. 0.0) then write(2, 2100) y 1 (t), y2(t)
2100 format(//,5x,'moles of co2 produced is negative ', 3x,
280
'yl = '.el2.3,4x, 'y2 = ',el2.3/) else
c if (yl(t) .ge. 0.0) then c y = yl(t) c else c y=y2(t) c endif
endif c
rkll = step*fl(xO,tO) rk12 = step*f2(x0,t0)
c rk13 = step*f3(vl,v2,v3,v4) c rk14 = step*f4(vl,v2,v3,v4) c
write(6.*) 'rkll= ',rkll, ' rk12= ',rk12 c 1 ' rk14 = '.rk14
vll = xO + rkll/2.0 v12 =tO+ rk12/2.0
c v13 = v3 + rk13/2.0 c v14 = v4 + rk14/2.0 c
rk21 = step*fl(vll,v12) rk22 = step*f2(vll,v12)
c rk23 = step*f3(vll,v12,vl3,vl4) c rk24 = step*f4(vll,v12,v13,v14) c
write(6,*) 'rk21= ',rk21, ' rk22= ',rk22 c 1 ' rk24 = · ,rk24 c
v21 =xO + rk21/2.0 v22 = tO + rk22/2.0
c v23 = v3 + rk23/2.0 c v24 = v4 + rk24/2.0 c
rk31 = step*fl(v2l,v22) rk32 = step*f2(v2l,v22)
c rk33 = step*f3(v21,v22,v23,v24) c rk34 = step*f4(v21,v22,v23,v24) c c
write(6,*) 'rk31= ',rk31,' rk32= ',rk32 c 1 ' rk34 = ',rk34 c
v31 = xO + rk31 v32 = tO + rk32
c v33 = v3 + rk33 c v34 = v4 + rk34 c
281
c rk41 = step*fl(v31,v32) rk42 = step*f2(v31,v32)
c rk43 = step*f3(v31,v32,v33,v34) c rk44 = step*f4(v31,v32,v33,v34) c
write(6,*) 'rk41= ',rk41, ' rk42= ',rk42 c 1 ' rk44 = ',rk44 c
x=xO+(rk 11 + 2.0*(rk21 +rk31 )+rk41 )/6.0 t = t0+(rk12+2.0*(rk22+rk32)+rk42)/6.0
c vn3=v3+(rk13+2.0*(rk23+rk33)+rk43)/6.0 c vn4=v4+(rk 14+ 2.0*(rk24+rk34 )+rk44 )/6.0
zeta=zeta+step c
c
return end
282
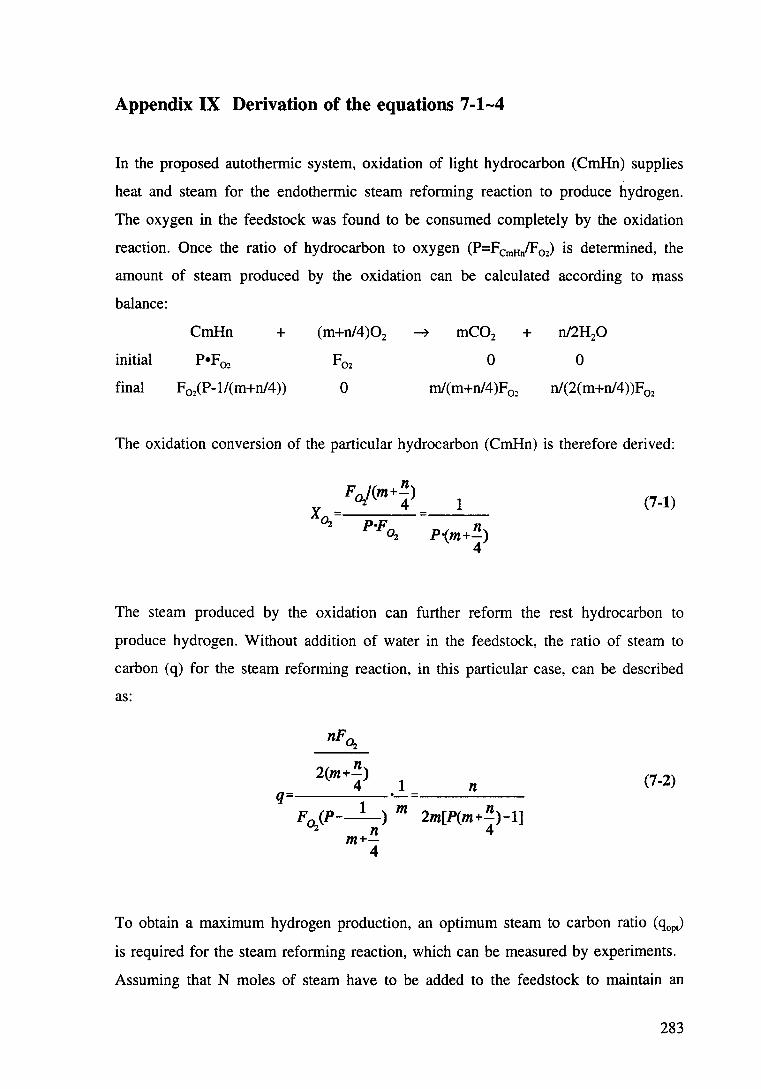
Appendix IX Derivation of the equations 7-1-4
In the proposed autothermic system, oxidation of light hydrocarbon (CmHn) supplies
heat and steam for the endothermic steam reforming reaction to produce hydrogen.
The oxygen in the feedstock was found to be consumed completely by the oxidation
reaction. Once the ratio of hydrocarbon to oxygen (P=FcmHn/F02) is determined, the
amount of steam produced by the oxidation can be calculated according to rn.ass
balance:
CmHn + (m+n/4)02
initial
final F0 iP-l/(m+nl4)) 0 n/(2(m+ni4))F02
The oxidation conversion of the particular hydrocarbon (CmHn) is therefore derived:
P·F Oz
1
n P-(m+-) 4
(7-1)
The steam produced by the oxidation can further reform the rest hydrocarbon to
produce hydrogen. Without addition of water in the feedstock, the ratio of steam to
carbon ( q) for the steam reforming reaction, in this particular case, can be described
as:
nFo,.
2(m+n) 4 1 (7-2)
To obtain a maximum hydrogen production, an optimum steam to carbon ratio (qopt)
is required for the steam reforming reaction, which can be measured by experiments.
Assuming that N moles of steam have to be added to the feedstock to maintain an
283
optimal value of steam to carbon ratio (qopt), the equation 7-2 is updated as:
nF~ ---+N 2(m+n)
4 qopt- 1
mF~(P---) n m+-4
where N can be solved to give:
1 N=[q. m(P--) opr- n m+-
4
F n ] c,u,.
2(m+n) P 4
Therefore, the steam to carbon ratio in feedstock (SIC) is:
N n 1 SJC- F =qopt -(qope +-2 )
m C,,l,. m (m+ n)P 4
or
(IX-1)
(7-3)
(7-4)
(7-5)
284