Testing of a Ni-Al2O3 Catalyst for Methane Steam Reforming Using Different Reaction Systems
9
Research Article Testing of a Ni-Al 2 O 3 Catalyst for Methane Steam Reforming Using Different Reaction Systems Ni-Al 2 O 3 catalyst activity was tested for methane steam reforming using two dif- ferent reaction systems: a catalyst particle bed (0.42–0.5 mm catalyst particles diluted in SiC) with a surface area-to-volume ratio SA/V of 910 m –1 and a poros- ity e of 52 % and a catalyst-coated metal monolith with an SA/V of 3300 m –1 and an e of 86 %. Under a steam-to-carbon ratio of 2.5 and at a temperature of 700 °C, the highest specific reaction rates were found for the catalyst-coated monolith. The high SA/V and e, together with the high rate of heat transfer of the metal monolith were found to be responsible of this optimum behavior. However, in both systems, the Ni-Al 2 O 3 catalyst suffered a catalyst deactivation during operation. Keywords: Catalyst-coated monolith, Catalyst particle bed, Ni-Al 2 O 3 catalyst, Methane steam reforming, Open volume fraction Received: July 04, 2011; revised: October 14, 2011; accepted: December 09, 2011 DOI: 10.1002/ceat.201100348 1 Introduction Steam reforming of methane is currently the most cost-effec- tive and highly developed method for hydrogen production, since natural gas is available at relatively low cost and the H 2 concentrations achieved in the product gas are high [1–3]. The industrial methane steam reforming process for hydrogen pro- duction, based on tubular packed-bed reactors loaded with pelleted catalysts, is well established [4–7] but may not be appropriate for small-scale applications such as residential fuel cells [8] as it suffers from several drawbacks, e.g., poor heat transfer coefficient of the catalyst bed, diffusion limitations, considerable pressure drop, and large volume size [9]. So, the goal of producing hydrogen in small-scale reactors is receiving increasing attention with the continued interest in the poten- tial prevalence of fuel cells [10]. Metal structured reactors have been the focus of recent researches on steam reformers due to their excellent performance in gas diffusion and heat transmis- sion and due to their compactness. Moreover, they can be easi- ly scaled to the desired production rate by increasing the num- ber of channels that form the reaction system [11–16]. One approach in structured reactors for hydrogen produc- tion has been to benefit from the experience that monolith cat- alyst manufacturers have earned in stationary environmental and automotive catalyst applications [17–19]. Another meth- odology has been the use of microchannel reactors [20–22]. The main difference between monoliths and microchannel reactors are the dimensions of the channels, from 0.5–4 mm in the monoliths to 0.01–1 mm in the microchannel reactors [23, 24] that will determine heat and mass transfer as well as residence time [22, 25]. This work focuses on methane steam reforming activity test- ing of a conventional Ni-Al 2 O 3 catalyst, which was previously prepared and activity-tested on a microchannel reactor [26], using two different reaction systems: (i) a catalyst particle bed and (ii) a catalyst-coated monolith. 2 Experimental Procedure 2.1 Experimental Plant Fig. 1 illustrates the test setup for the methane steam reforming activity tests. The tests were carried out in two different tubu- lar reactors where the reaction system, the catalyst particle bed, and the catalyst-coated monolith, respectively, were centered. Several temperatures were measured with thermocouples placed at different points of the test setup: along the pipe from the controlled evaporator and mixer (CEM, Bronkhorst B.V.) to the reactor (6–8), in the reactor (9–13), and at the reactor outlet (14). The dry product gases were analyzed by means of a gas chromatograph (lGC 4900, Varian Inc.). www.cet-journal.com © 2012 WILEY-VCH Verlag GmbH & Co. KGaA, Weinheim Chem. Eng. Technol. 2012, 35, No. 4, 720–728 Nerea de Miguel 1 Jaio Manzanedo 1 Pedro L. Arias 2 1 IKERLAN S. Coop, Alternative Generation Systems Area, Miñano (Álava), Spain. 2 University of the Basque Country, School of Engineering, Department of Chemical and Environmental Engineering, Bilbao, Spain. – Correspondence: N. de Miguel ([email protected]), IKERLAN S. Coop, Alternative Generation Systems Area, Juan de la Cierva, 1, Parque Tecnológico de Álava, 01510 Miñano (Álava), Spain. 720 N. de Miguel et al.
-
Upload
buenastareas -
Category
Documents
-
view
1 -
download
0
Transcript of Testing of a Ni-Al2O3 Catalyst for Methane Steam Reforming Using Different Reaction Systems
Research Article
Testing of a Ni-Al2O3 Catalyst for MethaneSteam Reforming Using Different ReactionSystems
Ni-Al2O3 catalyst activity was tested for methane steam reforming using two dif-ferent reaction systems: a catalyst particle bed (0.42–0.5 mm catalyst particlesdiluted in SiC) with a surface area-to-volume ratio SA/V of 910 m–1 and a poros-ity e of 52 % and a catalyst-coated metal monolith with an SA/V of 3300 m–1 andan e of 86 %. Under a steam-to-carbon ratio of 2.5 and at a temperature of700 °C, the highest specific reaction rates were found for the catalyst-coatedmonolith. The high SA/V and e, together with the high rate of heat transfer of themetal monolith were found to be responsible of this optimum behavior. However,in both systems, the Ni-Al2O3 catalyst suffered a catalyst deactivation duringoperation.
Keywords: Catalyst-coated monolith, Catalyst particle bed, Ni-Al2O3 catalyst, Methane steamreforming, Open volume fraction
Received: July 04, 2011; revised: October 14, 2011; accepted: December 09, 2011
DOI: 10.1002/ceat.201100348
1 Introduction
Steam reforming of methane is currently the most cost-effec-tive and highly developed method for hydrogen production,since natural gas is available at relatively low cost and the H2
concentrations achieved in the product gas are high [1–3]. Theindustrial methane steam reforming process for hydrogen pro-duction, based on tubular packed-bed reactors loaded withpelleted catalysts, is well established [4–7] but may not beappropriate for small-scale applications such as residential fuelcells [8] as it suffers from several drawbacks, e.g., poor heattransfer coefficient of the catalyst bed, diffusion limitations,considerable pressure drop, and large volume size [9]. So, thegoal of producing hydrogen in small-scale reactors is receivingincreasing attention with the continued interest in the poten-tial prevalence of fuel cells [10]. Metal structured reactors havebeen the focus of recent researches on steam reformers due totheir excellent performance in gas diffusion and heat transmis-sion and due to their compactness. Moreover, they can be easi-ly scaled to the desired production rate by increasing the num-ber of channels that form the reaction system [11–16].
One approach in structured reactors for hydrogen produc-tion has been to benefit from the experience that monolith cat-
alyst manufacturers have earned in stationary environmentaland automotive catalyst applications [17–19]. Another meth-odology has been the use of microchannel reactors [20–22].The main difference between monoliths and microchannelreactors are the dimensions of the channels, from 0.5–4 mm inthe monoliths to 0.01–1 mm in the microchannel reactors[23, 24] that will determine heat and mass transfer as well asresidence time [22, 25].
This work focuses on methane steam reforming activity test-ing of a conventional Ni-Al2O3 catalyst, which was previouslyprepared and activity-tested on a microchannel reactor [26],using two different reaction systems: (i) a catalyst particle bedand (ii) a catalyst-coated monolith.
2 Experimental Procedure
2.1 Experimental Plant
Fig. 1 illustrates the test setup for the methane steam reformingactivity tests. The tests were carried out in two different tubu-lar reactors where the reaction system, the catalyst particle bed,and the catalyst-coated monolith, respectively, were centered.Several temperatures were measured with thermocouplesplaced at different points of the test setup: along the pipe fromthe controlled evaporator and mixer (CEM, Bronkhorst B.V.)to the reactor (6–8), in the reactor (9–13), and at the reactoroutlet (14). The dry product gases were analyzed by means ofa gas chromatograph (lGC 4900, Varian Inc.).
www.cet-journal.com © 2012 WILEY-VCH Verlag GmbH & Co. KGaA, Weinheim Chem. Eng. Technol. 2012, 35, No. 4, 720–728
Nerea de Miguel1
Jaio Manzanedo1
Pedro L. Arias2
1 IKERLAN S. Coop, AlternativeGeneration Systems Area,Miñano (Álava), Spain.
2 University of the BasqueCountry, School ofEngineering, Department ofChemical and EnvironmentalEngineering, Bilbao, Spain.
–Correspondence: N. de Miguel ([email protected]), IKERLANS. Coop, Alternative Generation Systems Area, Juan de la Cierva, 1,Parque Tecnológico de Álava, 01510 Miñano (Álava), Spain.
720 N. de Miguel et al.

In the particle bed reactor, the temperature at the outlet ofthe catalyst bed (T, °C) was measured (Fig. 1 (9)). In themonolith reactor, the flow went in the opposite direction thanin the particle bed reactor. The inlet gases passed through atube coiled around the reactor and welded to a reactor wallbefore entering the reactor. The temperatures of the gases atthe monolith reactor inlet (T1, °C;Fig. 1 (10)), at the monolith inlet (T2,°C; Fig. 1 (11)), at the monolith outlet(T3, °C; Fig. 1 (12)), and of the mono-lith reactor outlet wall (T4, °C; Fig. 1(13)), were measured.
2.2 Reaction Systems
A Ni-Al2O3 catalyst prepared as de-scribed in a previous work [26] wastested using two different reaction sys-tems. In Fig. 2, a drawing and a crosssection of (a) catalyst-coated monolithand (b) catalyst particle bed reactionsystems are presented. Under each pic-ture, the surface area-to-volume ratio(SA/V [m–1]) and open volume frac-tion or porosity (e [%]) of each reac-tion system is given. In the monolithreactor, the channels have been ap-proximated as equilateral triangles andin the catalyst particle bed the particleshave been estimated as spheres.
To prepare the catalyst particle bed reaction system, theNi-Al2O3 catalyst was compacted to pellets, then crushed andsieved with two different aperture meshes: a 0.50-mm one onthe top and a 0.42-mm one on the bottom. A portion of 1.2 gof the particle fraction retained between both sieves wasdiluted 1:9 w/w with SiC particles of the same size range. The
Chem. Eng. Technol. 2012, 35, No. 4, 720–728 © 2012 WILEY-VCH Verlag GmbH & Co. KGaA, Weinheim www.cet-journal.com
Figure 1. Scheme of the test setup for methane steam reforming catalysts with flow lines and control and measurement signals.
a) b)
SA/V = 3300 m-1 SA/V = 910 m-1
ε = 86 % ε = 52 %
Figure 2. Drawings, cross sections, and SA/V (m–1) and e (%) values of a) catalyst-coatedmonolith and b) catalyst particle bed reaction systems.
Methane steam reforming 721
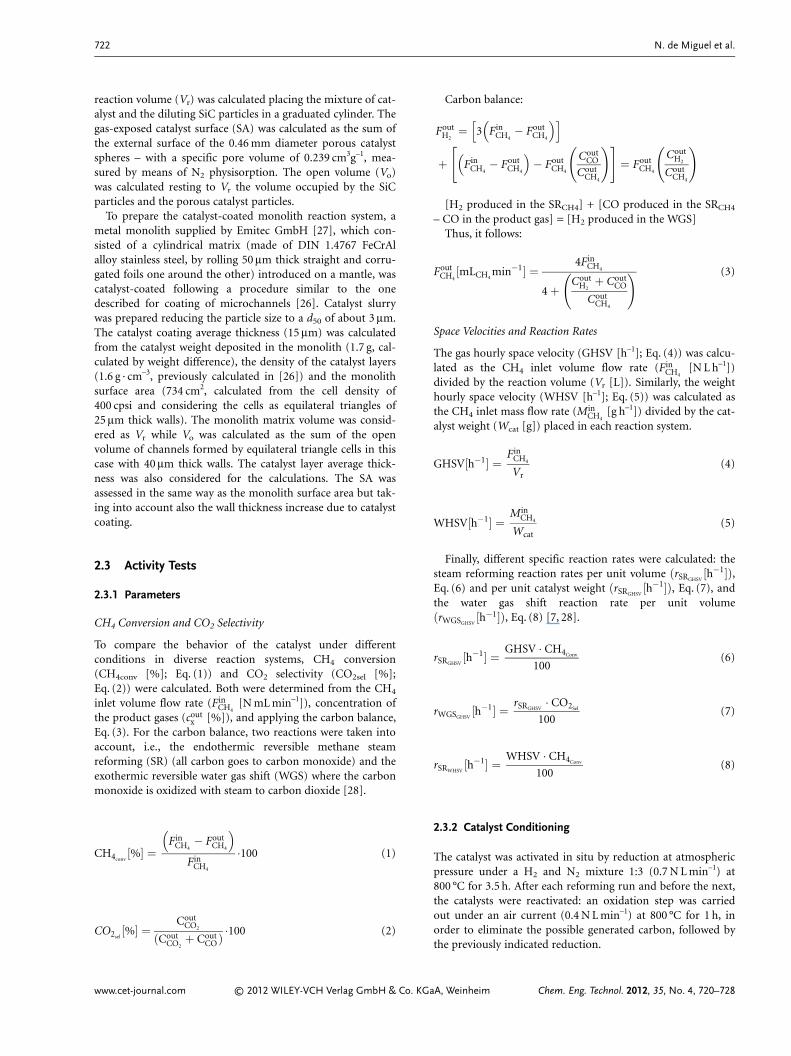
reaction volume (Vr) was calculated placing the mixture of cat-alyst and the diluting SiC particles in a graduated cylinder. Thegas-exposed catalyst surface (SA) was calculated as the sum ofthe external surface of the 0.46 mm diameter porous catalystspheres – with a specific pore volume of 0.239 cm3g–1, mea-sured by means of N2 physisorption. The open volume (Vo)was calculated resting to Vr the volume occupied by the SiCparticles and the porous catalyst particles.
To prepare the catalyst-coated monolith reaction system, ametal monolith supplied by Emitec GmbH [27], which con-sisted of a cylindrical matrix (made of DIN 1.4767 FeCrAlalloy stainless steel, by rolling 50 lm thick straight and corru-gated foils one around the other) introduced on a mantle, wascatalyst-coated following a procedure similar to the onedescribed for coating of microchannels [26]. Catalyst slurrywas prepared reducing the particle size to a d50 of about 3 lm.The catalyst coating average thickness (15 lm) was calculatedfrom the catalyst weight deposited in the monolith (1.7 g, cal-culated by weight difference), the density of the catalyst layers(1.6 g · cm–3, previously calculated in [26]) and the monolithsurface area (734 cm2, calculated from the cell density of400 cpsi and considering the cells as equilateral triangles of25 lm thick walls). The monolith matrix volume was consid-ered as Vr while Vo was calculated as the sum of the openvolume of channels formed by equilateral triangle cells in thiscase with 40 lm thick walls. The catalyst layer average thick-ness was also considered for the calculations. The SA wasassessed in the same way as the monolith surface area but tak-ing into account also the wall thickness increase due to catalystcoating.
2.3 Activity Tests
2.3.1 Parameters
CH4 Conversion and CO2 Selectivity
To compare the behavior of the catalyst under differentconditions in diverse reaction systems, CH4 conversion(CH4conv [%]; Eq. (1)) and CO2 selectivity (CO2sel [%];Eq. (2)) were calculated. Both were determined from the CH4
inlet volume flow rate (FinCH4
[N mL min–1]), concentration ofthe product gases (cout
x [%]), and applying the carbon balance,Eq. (3). For the carbon balance, two reactions were taken intoaccount, i.e., the endothermic reversible methane steamreforming (SR) (all carbon goes to carbon monoxide) and theexothermic reversible water gas shift (WGS) where the carbonmonoxide is oxidized with steam to carbon dioxide [28].
CH4conv�%� �
FinCH4
� FoutCH4
� �Fin
CH4
�100 (1)
CO2sel�%� � Cout
CO2
�CoutCO2
� CoutCO�
�100 (2)
Carbon balance:
FoutH2
� 3 FinCH4
� FoutCH4
� �� �
� FinCH4
� FoutCH4
� �� Fout
CH4
CoutCO
CoutCH4
� �� �� Fout
CH4
CoutH2
CoutCH4
� �
[H2 produced in the SRCH4] + [CO produced in the SRCH4
– CO in the product gas] = [H2 produced in the WGS]Thus, it follows:
FoutCH4
�mLCH4min�1� � 4Fin
CH4
4 � CoutH2
� CoutCO
CoutCH4
� � (3)
Space Velocities and Reaction Rates
The gas hourly space velocity (GHSV [h–1]; Eq. (4)) was calcu-lated as the CH4 inlet volume flow rate (Fin
CH4[N L h–1])
divided by the reaction volume (Vr [L]). Similarly, the weighthourly space velocity (WHSV [h–1]; Eq. (5)) was calculated asthe CH4 inlet mass flow rate (Min
CH4[g h–1]) divided by the cat-
alyst weight (Wcat [g]) placed in each reaction system.
GHSV�h�1� � FinCH4
Vr(4)
WHSV�h�1� � MinCH4
Wcat(5)
Finally, different specific reaction rates were calculated: thesteam reforming reaction rates per unit volume �rSRGHSV
�h�1��,Eq. (6) and per unit catalyst weight �rSRGHSV
�h�1��, Eq. (7), andthe water gas shift reaction rate per unit volume�rWGSGHSV
�h�1��, Eq. (8) [7, 28].
rSRGHSV�h�1� � GHSV � CH4Conv
100(6)
rWGSGHSV�h�1� � rSRGHSV
� CO2Sel
100(7)
rSRWHSV�h�1� � WHSV � CH4Conv
100(8)
2.3.2 Catalyst Conditioning
The catalyst was activated in situ by reduction at atmosphericpressure under a H2 and N2 mixture 1:3 (0.7 N L min–1) at800 °C for 3.5 h. After each reforming run and before the next,the catalysts were reactivated: an oxidation step was carriedout under an air current (0.4 N L min–1) at 800 °C for 1 h, inorder to eliminate the possible generated carbon, followed bythe previously indicated reduction.
www.cet-journal.com © 2012 WILEY-VCH Verlag GmbH & Co. KGaA, Weinheim Chem. Eng. Technol. 2012, 35, No. 4, 720–728
722 N. de Miguel et al.
2.3.3 Activity Test Conditions
Catalyst Particle Bed
Tab. 1 summarizes the test condi-tions for the catalyst particle bedreaction system. As a guide forcomparison, the correspondingequilibrium CH4 conversions andCO2 selectivities, obtained using achemical reaction and equilibriumsoftware (HSC Chemistry 5.1, Out-otec Research Oy), are also given.Two runs were performed with thecatalyst conditioning cycle in be-tween. In both cases, the reactionwas run under atmospheric pressure. The first run lasted 32 h,keeping the steam-to-carbon (S/C) ratio constant at 2.5 (sincestable conditions for the Ni-Al2O3 catalyst [28] were expected)while the space velocity was gradually increased (Fin
CH4was
increased up to 300 N mL min–1) to study the conversioncapacity of the system. After 25 h under constant S/C, it wasalternated between 1.5, 2.5, and 4.5 in order to check the effectof different S/C on the activity. The second run lasted 17 h,both S/C and Fin
CH4(and so the space velocity) were kept con-
stant, the first at 2.5 and the second at 300 N mL min–1. In bothruns, the reaction temperature was kept at about 700 °C asmeasured by the thermocouple placed at the outlet of the cata-lyst bed.
Catalyst-Coated Monolith
In Tab. 2, the test conditions for the catalyst-coated monolithreaction system activity and the corresponding equilibriumdata are provided. Two runs were performed both also underatmospheric pressure and in this case under a constant S/C of2.5. The first run lasted 45 h and Fin
CH4(and so the space veloci-
ty) was gradually increased starting from 300 to up to650 N mL min–1 (conditions 1 to 6) during the first 30 h, whileduring the next 15 h, the last space velocity was kept constant.The second run lasted 40 h and Fin
CH4was kept constant as
550 N mL min–1. From the different thermocouples inserted inthe reactor, the lowest of the measured temperatures was takenas reaction temperature and kept at 700 °C.
3 Results and Discussion
3.1 Catalyst Particle Bed
3.1.1 First Run
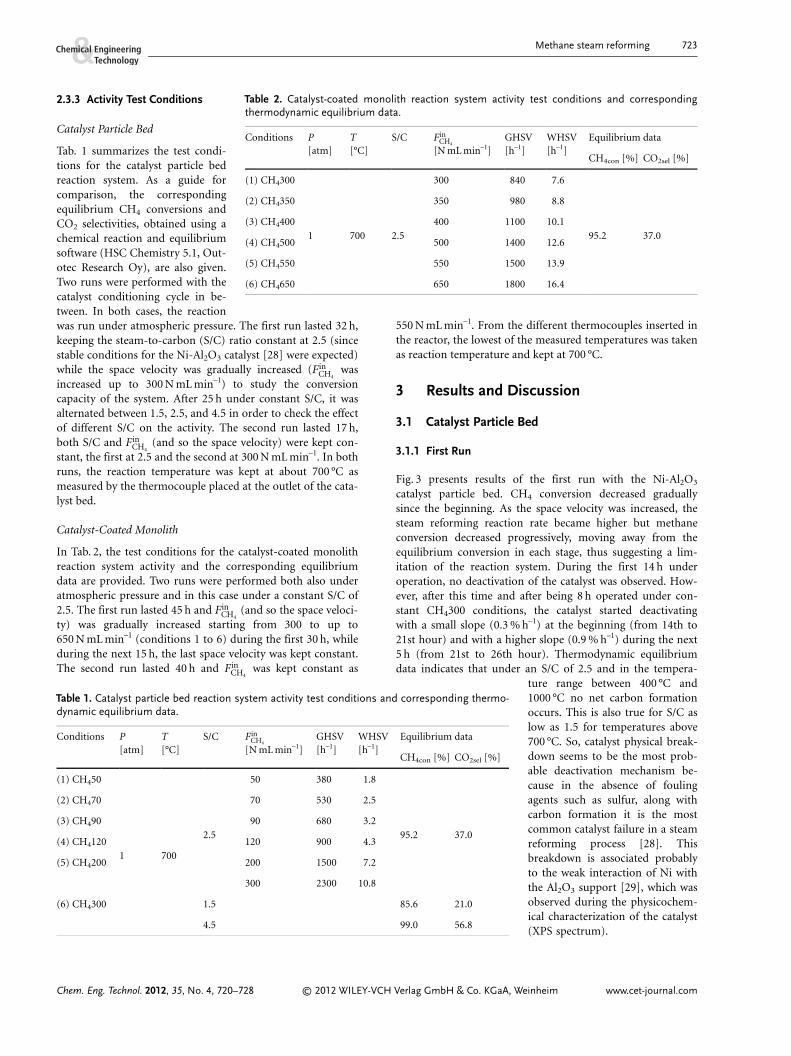
Fig. 3 presents results of the first run with the Ni-Al2O3
catalyst particle bed. CH4 conversion decreased graduallysince the beginning. As the space velocity was increased, thesteam reforming reaction rate became higher but methaneconversion decreased progressively, moving away from theequilibrium conversion in each stage, thus suggesting a lim-itation of the reaction system. During the first 14 h underoperation, no deactivation of the catalyst was observed. How-ever, after this time and after being 8 h operated under con-stant CH4300 conditions, the catalyst started deactivatingwith a small slope (0.3 % h–1) at the beginning (from 14th to21st hour) and with a higher slope (0.9 % h–1) during the next5 h (from 21st to 26th hour). Thermodynamic equilibriumdata indicates that under an S/C of 2.5 and in the tempera-
ture range between 400 °C and1000 °C no net carbon formationoccurs. This is also true for S/C aslow as 1.5 for temperatures above700 °C. So, catalyst physical break-down seems to be the most prob-able deactivation mechanism be-cause in the absence of foulingagents such as sulfur, along withcarbon formation it is the mostcommon catalyst failure in a steamreforming process [28]. Thisbreakdown is associated probablyto the weak interaction of Ni withthe Al2O3 support [29], which wasobserved during the physicochem-ical characterization of the catalyst(XPS spectrum).
Chem. Eng. Technol. 2012, 35, No. 4, 720–728 © 2012 WILEY-VCH Verlag GmbH & Co. KGaA, Weinheim www.cet-journal.com
Table 1. Catalyst particle bed reaction system activity test conditions and corresponding thermo-dynamic equilibrium data.
Conditions P[atm]
T[°C]
S/C FinCH4
[N mL min–1]GHSV[h–1]
WHSV[h–1]
Equilibrium data
CH4con [%] CO2sel [%]
(1) CH450
1 700
2.5
50 380 1.8
95.2 37.0
(2) CH470 70 530 2.5
(3) CH490 90 680 3.2
(4) CH4120 120 900 4.3
(5) CH4200 200 1500 7.2
300 2300 10.8
(6) CH4300 1.5 85.6 21.0
4.5 99.0 56.8
Table 2. Catalyst-coated monolith reaction system activity test conditions and correspondingthermodynamic equilibrium data.
Conditions P[atm]
T[°C]
S/C FinCH4
[N mL min–1]GHSV[h–1]
WHSV[h–1]
Equilibrium data
CH4con [%] CO2sel [%]
(1) CH4300
1 700 2.5
300 840 7.6
95.2 37.0
(2) CH4350 350 980 8.8
(3) CH4400 400 1100 10.1
(4) CH4500 500 1400 12.6
(5) CH4550 550 1500 13.9
(6) CH4650 650 1800 16.4
Methane steam reforming 723
When the S/C was reduced to 1.5, CH4 conversion andespecially CO2 selectivity indicated a significant decrease (asthermodynamics dictates) and moreover, the CH4 conversiondecrease in time was faster, which could be attributed to car-bon formation as it is thermodynamically feasible when thetemperature is < 700 °C. When the S/C was set back to 2.5,CH4 conversion and CO2 selectivity recovered and the evolu-tion of CH4 conversion in time exhibited the same tendency aspreviously observed. Finally, under an S/C of 4.5, CO2 selectiv-ity increased but CH4 conversion rather than increasing (asthermodynamics dictates) decreased and indicated a fastreduction in time, suggesting diffusion or contact time limita-tion.
3.1.2 Second Run
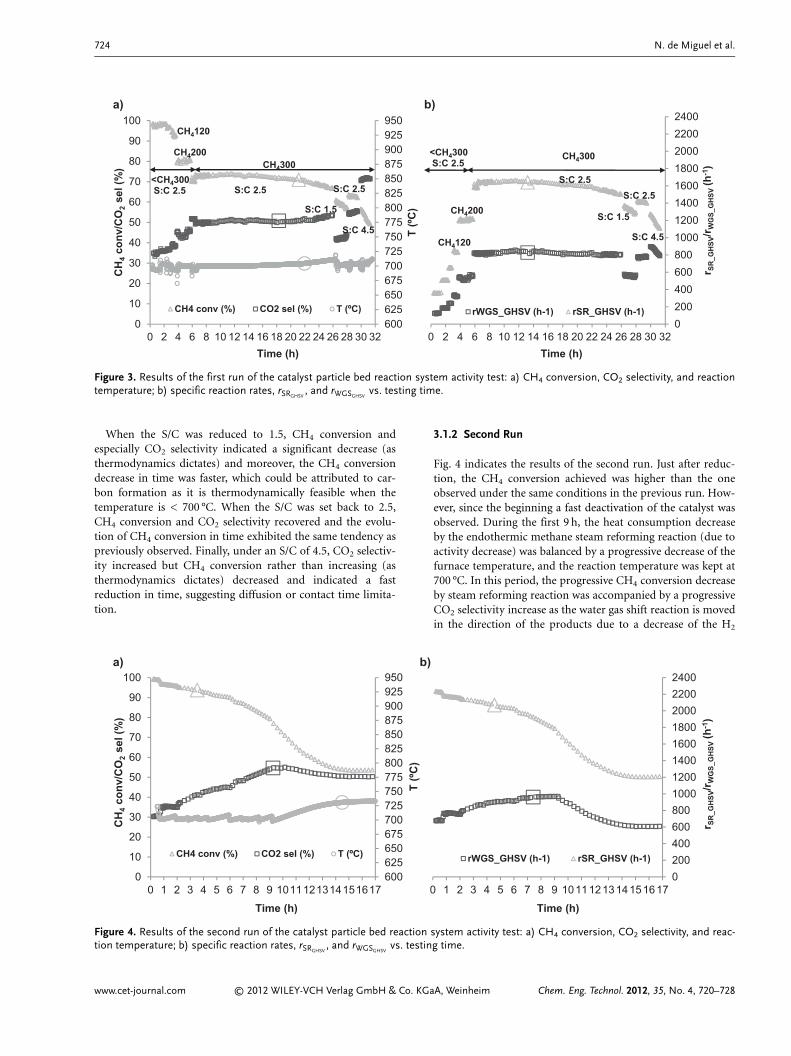
Fig. 4 indicates the results of the second run. Just after reduc-tion, the CH4 conversion achieved was higher than the oneobserved under the same conditions in the previous run. How-ever, since the beginning a fast deactivation of the catalyst wasobserved. During the first 9 h, the heat consumption decreaseby the endothermic methane steam reforming reaction (due toactivity decrease) was balanced by a progressive decrease of thefurnace temperature, and the reaction temperature was kept at700 °C. In this period, the progressive CH4 conversion decreaseby steam reforming reaction was accompanied by a progressiveCO2 selectivity increase as the water gas shift reaction is movedin the direction of the products due to a decrease of the H2
www.cet-journal.com © 2012 WILEY-VCH Verlag GmbH & Co. KGaA, Weinheim Chem. Eng. Technol. 2012, 35, No. 4, 720–728
600625650675700725750775800825850875900925950
0
10
20
30
40
50
60
70
80
90
100
0 2 4 6 8 10 12 14 16 18 20 22 24 26 28 30 32
T (º
C)
CH
4co
nv/C
O2
sel (
%)
Time (h)
a)
CH4 conv (%) CO2 sel (%) T (ºC)
S:C 2.5<CH4300S:C 2.5
S:C 1.5
S:C 2.5
S:C 4.5
CH4300
CH4120
CH4200
020040060080010001200140016001800200022002400
0 2 4 6 8 10 12 14 16 18 20 22 24 26 28 30 32
r SR
_GH
SV/r W
GS_
GH
SV (h
-1)
Time (h)
b)
rWGS_GHSV (h-1) rSR_GHSV (h-1)
S:C 2.5
S:C 1.5
S:C 2.5
S:C 4.5
<CH4300S:C 2.5
CH4300
CH4120
CH4200
Figure 3. Results of the first run of the catalyst particle bed reaction system activity test: a) CH4 conversion, CO2 selectivity, and reactiontemperature; b) specific reaction rates, rSRGHSV
, and rWGSGHSVvs. testing time.
600625650675700725750775800825850875900925950
0
10
20
30
40
50
60
70
80
90
100
0 1 2 3 4 5 6 7 8 9 1011121314151617
T (º
C)
CH
4co
nv/C
O2
sel (
%)
Time (h)
a)
CH4 conv (%) CO2 sel (%) T (ºC)
020040060080010001200140016001800200022002400
0 1 2 3 4 5 6 7 8 9 1011121314151617
r SR
_GH
SV/r W
GS_
GH
SV (h
-1)
Time (h)
b)
rWGS_GHSV (h-1) rSR_GHSV (h-1)
Figure 4. Results of the second run of the catalyst particle bed reaction system activity test: a) CH4 conversion, CO2 selectivity, and reac-tion temperature; b) specific reaction rates, rSRGHSV
, and rWGSGHSVvs. testing time.
724 N. de Miguel et al.
concentration. During the next period, the furnace tempera-ture was kept constant, and a decay of the CH4 conversion wasaccompanied by a progressive reaction temperature increaseuntil the steady state was reached at 735 °C and 54 % CH4 con-version. In this last period, the CO2 selectivity was affected bytwo opposite effects, i.e., the temperature increase that movesthe exothermic water gas shift reaction in the direction of thereactants and the H2 concentration decrease, until the men-tioned steady state was reached and it stabilized at 50 %.
Comparing with the previous run, it can be stated that thebehavior was worse in this second run. Although initially ahigh CH4 conversion was observed, the deactivation of the cat-alyst was very fast, thus suggesting that the physical breakdownmonitored in the first run had damaged the catalyst.
3.2 Catalyst-Coated Monolith
3.2.1 First Run
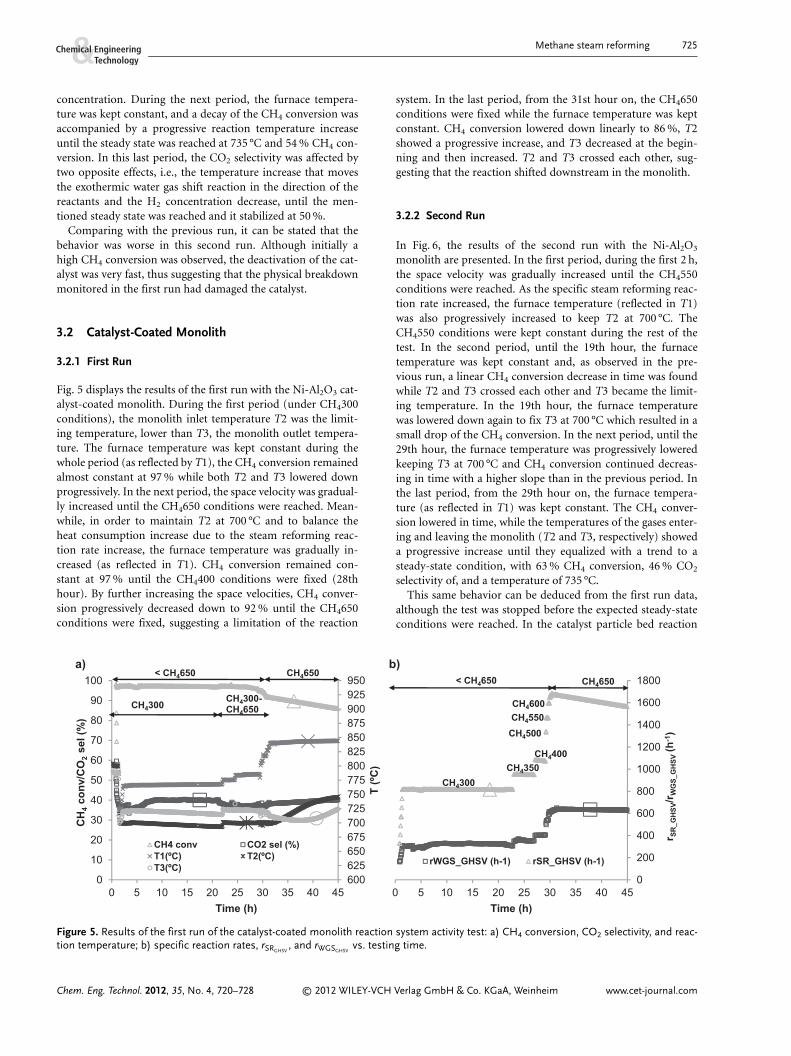
Fig. 5 displays the results of the first run with the Ni-Al2O3 cat-alyst-coated monolith. During the first period (under CH4300conditions), the monolith inlet temperature T2 was the limit-ing temperature, lower than T3, the monolith outlet tempera-ture. The furnace temperature was kept constant during thewhole period (as reflected by T1), the CH4 conversion remainedalmost constant at 97 % while both T2 and T3 lowered downprogressively. In the next period, the space velocity was gradual-ly increased until the CH4650 conditions were reached. Mean-while, in order to maintain T2 at 700 °C and to balance theheat consumption increase due to the steam reforming reac-tion rate increase, the furnace temperature was gradually in-creased (as reflected in T1). CH4 conversion remained con-stant at 97 % until the CH4400 conditions were fixed (28thhour). By further increasing the space velocities, CH4 conver-sion progressively decreased down to 92 % until the CH4650conditions were fixed, suggesting a limitation of the reaction
system. In the last period, from the 31st hour on, the CH4650conditions were fixed while the furnace temperature was keptconstant. CH4 conversion lowered down linearly to 86 %, T2showed a progressive increase, and T3 decreased at the begin-ning and then increased. T2 and T3 crossed each other, sug-gesting that the reaction shifted downstream in the monolith.
3.2.2 Second Run
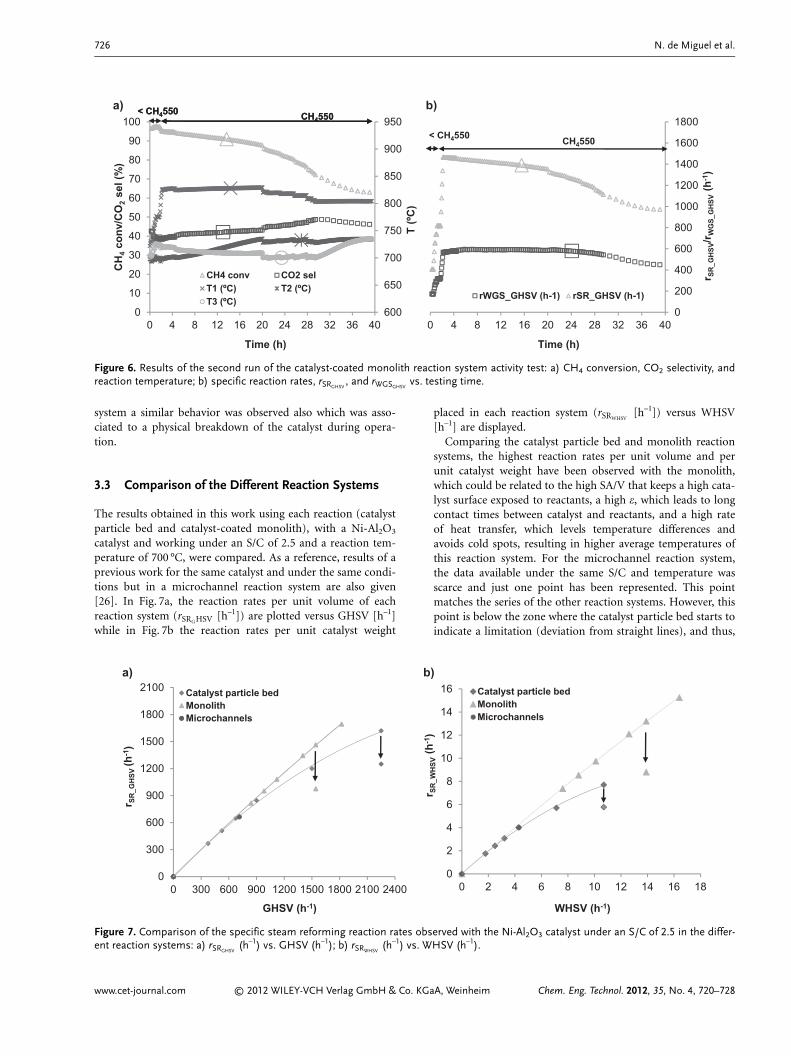
In Fig. 6, the results of the second run with the Ni-Al2O3
monolith are presented. In the first period, during the first 2 h,the space velocity was gradually increased until the CH4550conditions were reached. As the specific steam reforming reac-tion rate increased, the furnace temperature (reflected in T1)was also progressively increased to keep T2 at 700 °C. TheCH4550 conditions were kept constant during the rest of thetest. In the second period, until the 19th hour, the furnacetemperature was kept constant and, as observed in the pre-vious run, a linear CH4 conversion decrease in time was foundwhile T2 and T3 crossed each other and T3 became the limit-ing temperature. In the 19th hour, the furnace temperaturewas lowered down again to fix T3 at 700 °C which resulted in asmall drop of the CH4 conversion. In the next period, until the29th hour, the furnace temperature was progressively loweredkeeping T3 at 700 °C and CH4 conversion continued decreas-ing in time with a higher slope than in the previous period. Inthe last period, from the 29th hour on, the furnace tempera-ture (as reflected in T1) was kept constant. The CH4 conver-sion lowered in time, while the temperatures of the gases enter-ing and leaving the monolith (T2 and T3, respectively) showeda progressive increase until they equalized with a trend to asteady-state condition, with 63 % CH4 conversion, 46 % CO2
selectivity of, and a temperature of 735 °C.This same behavior can be deduced from the first run data,
although the test was stopped before the expected steady-stateconditions were reached. In the catalyst particle bed reaction
Chem. Eng. Technol. 2012, 35, No. 4, 720–728 © 2012 WILEY-VCH Verlag GmbH & Co. KGaA, Weinheim www.cet-journal.com
600625650675700725750775800825850875900925950
0
10
20
30
40
50
60
70
80
90
100
0 5 10 15 20 25 30 35 40 45
T (º
C)
CH
4co
nv/C
O2
sel (
%)
Time (h)
a)
CH4 conv CO2 sel (%)T1(ºC) T2(ºC)T3(ºC)
CH4300
CH4650
CH4300-CH4650
< CH4650
0
200
400
600
800
1000
1200
1400
1600
1800
0 5 10 15 20 25 30 35 40 45
r SR
_GH
SV/r W
GS_
GH
SV (h
-1)
Time (h)
b)
rWGS_GHSV (h-1) rSR_GHSV (h-1)
CH4350CH4300
CH4400
< CH4650 CH4650
CH4500CH4550CH4600
Figure 5. Results of the first run of the catalyst-coated monolith reaction system activity test: a) CH4 conversion, CO2 selectivity, and reac-tion temperature; b) specific reaction rates, rSRGHSV
, and rWGSGHSVvs. testing time.
Methane steam reforming 725
system a similar behavior was observed also which was asso-ciated to a physical breakdown of the catalyst during opera-tion.
3.3 Comparison of the Different Reaction Systems
The results obtained in this work using each reaction (catalystparticle bed and catalyst-coated monolith), with a Ni-Al2O3
catalyst and working under an S/C of 2.5 and a reaction tem-perature of 700 °C, were compared. As a reference, results of aprevious work for the same catalyst and under the same condi-tions but in a microchannel reaction system are also given[26]. In Fig. 7a, the reaction rates per unit volume of eachreaction system (rSRGHSV [h–1]) are plotted versus GHSV [h–1]while in Fig. 7b the reaction rates per unit catalyst weight
placed in each reaction system (rSRWHSV[h–1]) versus WHSV
[h–1] are displayed.Comparing the catalyst particle bed and monolith reaction
systems, the highest reaction rates per unit volume and perunit catalyst weight have been observed with the monolith,which could be related to the high SA/V that keeps a high cata-lyst surface exposed to reactants, a high e, which leads to longcontact times between catalyst and reactants, and a high rateof heat transfer, which levels temperature differences andavoids cold spots, resulting in higher average temperatures ofthis reaction system. For the microchannel reaction system,the data available under the same S/C and temperature wasscarce and just one point has been represented. This pointmatches the series of the other reaction systems. However, thispoint is below the zone where the catalyst particle bed starts toindicate a limitation (deviation from straight lines), and thus,
www.cet-journal.com © 2012 WILEY-VCH Verlag GmbH & Co. KGaA, Weinheim Chem. Eng. Technol. 2012, 35, No. 4, 720–728
600
650
700
750
800
850
900
950
0
10
20
30
40
50
60
70
80
90
100
0 4 8 12 16 20 24 28 32 36 40
T (º
C)
CH
4co
nv/C
O2
sel (
%)
Time (h)
CH4 conv CO2 selT1 (ºC) T2 (ºC)T3 (ºC)
< CH4550 CH4550< CH4550 CH4550
0
200
400
600
800
1000
1200
1400
1600
1800
0 4 8 12 16 20 24 28 32 36 40
r SR
_GH
SV/r W
GS_
GH
SV(h
-1)
Time (h)
rWGS_GHSV (h-1) rSR_GHSV (h-1)
< CH4550 CH4550
a) b)
Figure 6. Results of the second run of the catalyst-coated monolith reaction system activity test: a) CH4 conversion, CO2 selectivity, andreaction temperature; b) specific reaction rates, rSRGHSV
, and rWGSGHSVvs. testing time.
0
300
600
900
1200
1500
1800
2100
0 300 600 900 1200 1500 1800 2100 2400
r SR
_GH
SV(h
-1)
GHSV (h-1)
a)Catalyst particle bedMonolithMicrochannels
0
2
4
6
8
10
12
14
16
0 2 4 6 8 10 12 14 16 18
r SR
_WH
SV(h
-1)
WHSV (h-1)
b)Catalyst particle bedMonolithMicrochannels
Figure 7. Comparison of the specific steam reforming reaction rates observed with the Ni-Al2O3 catalyst under an S/C of 2.5 in the differ-ent reaction systems: a) rSRGHSV
(h–1) vs. GHSV (h–1); b) rSRWHSV(h–1) vs. WHSV (h–1).
726 N. de Miguel et al.
nothing can be concluded about the reforming capacity of themicrochannel reaction system.
4 Summary and Outlook
Between the different reaction systems compared, the highestreaction rates per unit volume and per unit catalyst weighthave been found with the catalyst-coated monolith, which isassociated to the high SA/V, the high open volume fraction,and the high rate of heat transfer of this reaction system. TheNi-Al2O3 catalyst used in this work has been found to be notoptimal for the methane steam reforming reaction: it suffereda physical breakdown during operation with a significantactivity decrease, associated to the weak interaction of Ni withthe Al2O3 support. Future work is in progress in order to testan alternative Ni-MgO catalyst, where the metal is stronglyinteracting with the basic support, forming NiO-MgO solidsolutions, which are reported to make the catalyst more resis-tant to sintering and coking, thus resulting in an improved sta-bility under methane steam reforming conditions [30, 31], andtaking advantage of the features of the monolith reaction sys-tem, as demonstrated in this paper.
The authors have declared no conflict of interest.
Symbols used
cx(g) [mol.-%] concentration of x; molar percent ofx in a gas mixture
CH4conv[%] CH4 conversion; percentage of CH4
moles that disappear in the reactorCO2sel
[%] CO2 selectivity; percentage of Cmoles that are transformed intoCO2 in the reactor
e [%] porosity or open volume fraction;ratio of Vo to Vr
Fx [N mL min–1, volume flow rate of x; unit volumeN L h–1] of x, under normal conditions of
temperature and pressure, per unitof time
GHSV [h–1] gas hourly space velocity; ratio ofFin
CH4to Vr
Mx [g h–1] mass flow rate of x; unit mass of xper unit of time
rSRGHSV[h–1] steam reforming reaction rate per
unit volume; CH4 disappearanceper unit time and reaction volume
rSRWHSV[h–1] steam reforming reaction rate per
unit catalyst weight; CH4
disappearance per unit time andcatalyst weight
rWGSGHSV[h–1] water gas shift reaction rate per unit
volume; CO2 appearance per unittime and reaction volume
SA [cm2] gas-exposed reactive surface;interface between catalyst andreactants in a reaction system
SA/V [m–1] surface area-to-volume ratio; ratioof SA to Vr
S/C [–] steam-to-carbon ratio; number ofwater molecules for every carbonatom in a gas mixture
T [°C] reaction temperature; temperatureat the outlet of the catalyst bed
T1 [°C] temperature of the gases at themonolith reactor inlet
T2 [°C] temperature at the monolith inletT3 [°C] temperature at the monolith outletT4 [°C] temperature at the monolith reactor
outlet wallVo [cm3] open volume; free volume of a
reaction system with no catalystand no catalyst supporting material
Vr [cm3] reaction volume; volume occupiedby the reaction system (part of thereactor where the catalyst is placed
Wcat [g] catalyst weightWHSV [h–1] weight hourly space velocity; ratio
of MinCH4
to Wcat
References
[1] J. Xu, C. M. Y. Yeung, J. Ni, F. Meunier, N. Acerbi, M. Fowles,S. C. Tsang, Appl. Catal., A 2008, 345 (2), 119.
[2] L. P. R. Profeti, E. A. Ticianelli, E. M. Assaf, Fuel 2008, 87(10–11), 2076.
[3] P. O. Sharma, M. A. Abraham, S. Chattopadhyay, Ind. Eng.Chem. Res. 2007, 46 (26), 9053.
[4] E. V. Kondratenko, M. Baerns, Encyclopedia of Catalysis, JohnWiley & Sons, New York 2003.
[5] J. N. Armor, Appl. Catal., A 1999, 176, 159.[6] R. J. Farrauto, C. H. Bartholomew, Fundamentals of Indus-
trial Catalytic Processes, Blackie Academic and Professional,London 1997.
[7] J. F. Le Page, Applied Heterogeneous Catalysis – Design, Man-ufacture and Use of Solid Catalysts, Editions Technip, Paris1987.
[8] S. Visco, C. Jacobson, L. C. de Jonghe, presented at SECAWorkshop, Pittsburgh, June 2002.
[9] L. Zhou, Y. Guo, Q. Zhang, M. Yagi, J. Hatakeyama, H. Li,J. Chen, M. Sakurai, H. Kameyama, Appl. Catal., A 2008, 347(2), 200.
[10] D. Stolten, Hydrogen and Fuel Cells: Fundamentals, Technolo-gies and Applications, Wiley-VCH, Weinheim 2010.
[11] A. Cybulski, J. A. Moulijn, Structured Catalyst and Reactors,Taylor & Francis Group, Boca Raton, FL 2006.
[12] P. Ferreira-Aparicio, M. J. Benito, J. L. Sanz, Catal. Rev. Sci.Eng. 2005, 47 (4), 491.
[13] A. Fuju, M. Ueda, T. Matsubayashi, S. Yoshida, Y. Fukami,SANYO Tech. Rev. 2005, 37, 69.
[14] R. D. Betta, C. Faz, A. Jimenez, H. Liu, Y. Liu, J. Nicole,D. Yee, Plate Based Fuel Processing System, Catalytica EnergySystems Inc., Tempe 2004.
[15] M. Echigo, N. Shinke, S. Takami, T. Tabata, J. Power Sources2004, 132 (1–2), 29.
Chem. Eng. Technol. 2012, 35, No. 4, 720–728 © 2012 WILEY-VCH Verlag GmbH & Co. KGaA, Weinheim www.cet-journal.com
Methane steam reforming 727
[16] J. C. Schouten, E. V. Rebrov, M. H. J. M. de Croon, Chimia2002, 56 (11), 627.
[17] P. Wu, X. Li, S. Ji, B. Lang, F. Habimana, C. Li, Catal. Today2009, 146 (1–2), 82.
[18] J. H. Ryu, K. Y. Lee, H. La, H. J. Kim, J. I. Yang, H. Jung,J. Power Sources 2007, 171, 499.
[19] T. Giroux, S. Hwang, Y. Liu, W. Ruettinger, L. Shore, Appl.Catal., B 2005, 56, 95.
[20] C. Cremers, A. Pelz, U. Stimming, K. Haas-Santo, O. Görke,P. Pfeifer, K. Schubert, Fuel Cells 2006, 7 (2), 91.
[21] C. Cao, Y. Wang, R. T. Rozmiarek, Catal. Today 2005, 110(1–2), 92.
[22] Y. Wang, Y. H. Chin, R. T. Rozmiarek, B. R. Johnson, Y. Gao,J. Watson, A. Y. L. Tonkovich, D. P. Vander Wiel, Catal.Today 2004, 98 (4), 575.
[23] M. G. Khan, A. Fartaj, Int. J. Energy Res. 2011, 35 (7), 553.[24] C. K. Joshi, P. A. Parikh, Indian J. Chem. Technol. 2008, 15,
572.[25] L. Kiwi-Minsker, A. Renken, Catal. Today 2005, 110 (1–2), 2.[26] N. de Miguel, J. Manzanedo, J. Thormann, P. Pfeifer, P. L.
Arias, Chem. Eng. Technol. 2010, 33 (1), 155.[27] P. Avila, M. Montes, E. Miro, Chem. Eng. J. 2005, 109 (1–3),
11.[28] P. V. Beurden, On the Catalytic Aspects of Steam Methane
Reforming, ECN’s Literature Survey, Petten 2004.[29] A. L. Wagner, R. S. Osborne, J. P. Wagner, Prepr. Pap. – Am.
Chem. Soc., Div. Fuel Chem. 2003, 48 (2), 74.[30] S. Wang, G. Q. Lu, Appl. Catal., B 1998, 16 (3), 269.[31] M. C. J. Bradford, M. A. Vannice, Appl. Catal., B 1996, 142,
73.
www.cet-journal.com © 2012 WILEY-VCH Verlag GmbH & Co. KGaA, Weinheim Chem. Eng. Technol. 2012, 35, No. 4, 720–728
728 N. de Miguel et al.