
Catalytic Reforming of Methylcyclopentane. - LSU Digital ...

i n t e rn a t i o n a l j o u r n a l o f h y d r o g e n en e r g y 3 5 ( 2 0 1 0 ) 1 1 5 1 4e1 1 5 2 4
Avai lab le at www.sc iencedi rect .com
journa l homepage : www.e lsev ie r . com/ loca te /he
H2 production by low pressure methane steam reforming ina PdeAg membrane reactor over a Ni-based catalyst:Experimental and modeling
A. Iulianelli a, G. Manzolini b, M. De Falco c, S. Campanari b, T. Longo a, S. Liguori a,d,A. Basile a,*a Institute on Membrane Technology of National Research Council (ITM-CNR), Via P. Bucci Cubo 17/C, c/o University of Calabria,
Rende (CS) 87036, ItalybDept. of Energy, Politecnico di Milano, via Lambruschini 4, Milano (MI) 20156, Italyc Faculty of Engineering, University Campus Bio-Medico of Rome, via Alvaro del Portillo 21, 00128 Rome, ItalydDept. of Modelling Engineering, via P. Bucci Cubo 39/C, c/o University of Calabria, Rende (CS) 87036, Italy
a r t i c l e i n f o
Article history:
Received 14 December 2009
Received in revised form
15 June 2010
Accepted 18 June 2010
Available online 27 July 2010
Keywords:
Palladium-based membrane reactor
Methane steam reforming
Hydrogen production
* Corresponding author. Tel.: þ39 0984 49201E-mail address: [email protected] (A. Ba
0360-3199/$ e see front matter ª 2010 Profedoi:10.1016/j.ijhydene.2010.06.049
a b s t r a c t
Nowadays, there is a growing interest towards pure hydrogen production for proton
exchange membrane fuel cell applications. Methane steam reforming reaction is one of the
most important industrial chemical processes for hydrogen production. This reaction is
usually carried out in fixed bed reactors at 30e40 bar and at temperatures above 850 �C. In
this work, a dense PdeAg membrane reactor packed with a Ni-based catalyst was used to
carry out the methane steam reforming reaction between 400 and 500 �C and at relatively
low pressure (1.0e3.0 bar) with the aim of obtaining higher methane conversion and
hydrogen yield than a fixed bed reactor, operated at the same conditions. Furthermore, the
PdeAg membrane reactor is able to produce a pure, or at least, a CO and CO2 free hydrogen
stream. A 50% methane conversion was experimentally achieved in the membrane reactor
at 450 �C and 3.0 bar whereas, at the same conditions, the fixed bed reactor reached a 6%
methane conversion. Moreover, 70% of high-purity hydrogen on total hydrogen produced
was collected with the sweep-gas in the permeate stream of the membrane reactor. From
a modeling point of view, the mathematical model realized for the simulation of both the
membrane and fixed bed reactors was satisfactorily validated with the experimental
results obtained in this work.
ª 2010 Professor T. Nejat Veziroglu. Published by Elsevier Ltd. All rights reserved.
1. Introduction exchange membrane fuel cells (PEMFCs) are electrochemical
Climate change and air pollution related to the emissions
caused by the use of fossil fuels, associated to the depletion of
them, drove the scientific efforts towards the use of alterna-
tive technologies and renewable energy sources in order to
mitigate the effects of the harmful emissions. The proton
3; fax: þ39 0984 402103.sile).ssor T. Nejat Veziroglu. P
devices producing electricity directly from hydrogen and
oxygen, without combustion, making the process clean and
non-polluting. PEMFCs present several advantages such as
low operative temperature (60e100 �C), sustained operation at
high current density, compactness, fast start-up and suit-
ability for discontinuous operation [1e5]. These featuresmake
ublished by Elsevier Ltd. All rights reserved.

i n t e r n a t i o n a l j o u r n a l o f h y d r o g e n en e r g y 3 5 ( 2 0 1 0 ) 1 1 5 1 4e1 1 5 2 4 11515
PEMFCs the most promising and attractive candidate for
a wide variety of power applications, ranging from portable/
micropower and transportation to larger stationary power
systems for buildings and distributed generation [6e12].
The full commercialization of PEMFC systems needs
a stable supply of high-purity hydrogen. Traditionally,
hydrogen is technologically produced by the steam reforming
of natural gas or by coal gasification [13]. In particular, the
reformed stream coming out from a fixed bed reactor (FBR)
contains a hydrogen-rich gas mixture. Therefore, in the
viewpoint of pure hydrogen production, it needs, at least,
three successive stages for separating hydrogen from the
reformed stream. These stages consist of two different reac-
tors for water gas shift reaction (HTS and LTS) followed by
a purification system (PSA or others) [13].
As an alternative to the FBR systems, the Pd-based
membrane reactors (MRs) are able to combine two different
processes (reaction and hydrogen separation) in the same
device. In particular, the use of a dense Pd-based MR allows
a CO and CO2 (COx) free hydrogen stream to be collected owing
to the infinite hydrogen perm-selectivity of the dense Pd-
based membranes with respect to the other gases [14e16].
Nevertheless, it is well known that dense palladium
membranes are susceptible to cracking because of the amount
of hydrogen absorbed that can cause the phase transition
from a to b palladium hydride [16]. This phenomenon is
known as hydrogen embrittlement, in which dissolved
hydrogen causes the elongation of the metallic film (that
produce the aeb hydride transformations), leading to frac-
tures after repeated pressure and thermal cycles. The
embrittlement can be avoided alloying the palladium with
metals such as silver, gold, etc. [14]. For example, in the case of
palladiumesilver alloys, the membrane lattice, expanded by
the silver atoms, is less influenced by the hydrogen perme-
ation and, thus, less brittle than the pure palladium [14e17].
Industrially,methanesteamreforming (MSR) reaction is the
most important process to produce hydrogen [18]. Metals of
Group 8e10 are used as catalysts, offering very high catalytic
activity for this reaction (RuzRh>Ni> Ir>PtzPd>>Coz Fe)
[19]. In particular, Ni-based catalysts represent a valid choice,
owing to the low cost and wide availability [20,21].
The MSR reaction is conventionally performed in FBRs at
high temperatures (>850 �C) owing to its endothermic char-
acter [22e30]. Moreover, thermodynamically it would be
preferable to conduct the MSR reaction under moderate
pressures. Nevertheless, as reported above the reformed
stream coming out from an FBR needs to be purified through
the aforementioned successive processes, all of them
requiring high operating pressures. Therefore, industrial MSR
reaction is generally performed at pressures >10 bar [28e30].
On the contrary, in the last years, many researchers
proposed to apply Pd-based MRs for MSR reaction operating at
milderoperative conditions than theFBRs [19e21,31e38]. To the
best of our knowledge, themajority of these papers are realized
at relatively high pressure, whereas the novelty of this work is
representedby the lowoperatingpressure (1e3bar)MRwith the
aim to reach highCOx-free hydrogen recovery. Operating at low
pressure, keeping interesting H2 conversion rates, allows to
project the applicationof theprocess to very small scale fuel cell
power generation units, using lowpressure natural gas as a fuel
source,where itwouldbetoodemandingto installhighpressure
fuel compression units [12].
Therefore, the effect of some operating parameters
(temperature, pressure and sweep-gas molar flow rate) on the
MR performances, in terms of methane conversion, COx-free
hydrogen recovery andCOx-free hydrogen yield is investigated
from both a modeling and an experimental point of view.
2. Theoretical model
The mathematical model is based on mass balance in both
reaction and permeation zones, Fig. 1a, with the following
assumptions:
� Only reactions ((1)e(3)) from Xu and Froment [39] are
considered (secondary reactions are neglected and between
them, Bouduard reaction was not considered due to the S/C
used in this work).
CH4 þ H2O $ CO þ 3H2 DH0298K ¼ 206 kJ/mol (1)
CO þ H2O ¼ CO2 þ H2 DH0298K ¼ �41 kJ/mol (2)
CH4 þ 2H2O $ CO2 þ 4H2 DDH0298K ¼ 165 kJ/mol (3)
� Steady-state conditions.
� Negligible axial dispersion and radial convective terms.
� Ideal gas behaviour.
� Pseudo-homogenous condition inside the reactor (pseudo-
homogeneous models make the assumption that the
reactor can be described as an entity consisting only of
a single phase. In other words, themodel assumption is that
the catalyst surface and the bulk fluid have the same
conditions and, as a consequence, the behaviour of both the
phases can be described by the same variables such as
concentrations, temperature and pressure).
� 100% hydrogen perm-selectivity of Pd-based membrane to
other gases.
� Isothermal and isobaric condition.
In the reaction zone a two-dimensional isothermal model,
able to calculate both axial and radial composition profiles, is
developed.
In the permeation zone, a one-dimensional model is devel-
opedsince radial profiles are considerednegligible. Equationsof
the MRmodel, together with boundary conditions, are:
� Mass balances
Reaction zone: i ¼ CH4, H2O, H2, CO, CO2
vðuz � ciÞv~z
¼ dP$L
Pemr$r2i;0� v2ðuz$ciÞ
v~r2þ 1
~r� vðuz$ciÞ
v~r
!þ rb$L$
X3j¼1
hj$Rj
(4)
where uz and ci are gas mixture velocity and mole concen-
tration of component i, ~z and ~rare dimensionless axial and
radial coordinates reactor length and the catalytic bed tube

THERMOCOUPLE
SWEEP-GAS
PERMEATE
STREAM
Pd- g DENSE
MEMBRANE LAYER
STAINLESS
STEEL TUBE
MEMBRANE
SUPPORT FEED LINE
MEMBRANE
MODULE
RETENTATE
STREAM
GRAPHITE
GASKET
GLASS
SPHERES
CATALYST
FEED STREAM
a
b
Fig. 1 e (a) Scheme of the PdeAg MR for the mathematical modeling. (b) Scheme of the experimental Pd-Ag MR.
i n t e rn a t i o n a l j o u r n a l o f h y d r o g e n en e r g y 3 5 ( 2 0 1 0 ) 1 1 5 1 4e1 1 5 2 411516
radius respectively, pb is the packed bed density, h and Rj are
the effectiveness factor and the intrinsic rate for component i,
expressed according to kinetics scheme, and Pemr is the mass
effective radial Peclet number.
Permeation zone:
dYH2
d~z¼ � Nm
H2$2p$r0;i
FinCH4
(5)
The signs þ and � relate to co-current and counter-current
configuration of the sweep-gas respectively.
� Boundary conditions
~z ¼ 0; c~r:uz$ci ¼ uin
z $cini
(6)
~z ¼ 1; c~r:YH2
¼ 0(7)
r ¼ ri;0; c~z:vðuz$ciÞ
v~r¼ 0
(8)
r ¼ r0;i; c~z:vðuz$ciÞ
v~r¼ 0
(9)
dp
Pemr$v�uz$cH2
�v~r
¼ NmH2:
In Eq. (4), the mass effective radial Peclet number (Pemr) is
calculated by the expression reported by Kulkarni and Dor-
aiswamy [40] and it is valid for Re > 1000; hj and Rj are calcu-
lated by XueFroment expressions [39].
Ice bath
H2O
N2
tank
Mass flow
Mass flow
controller
N2 carrier
N2 sweep-gas
Pre-heating
zone
Feed
Membrane
reactor
Permeate
stream
Retentate
stream
Lumen
pressure
manometer
Shell
pressure
manometer
Feed pressure
manometer
Gas-cromatograph
Back pressure
controller
Cold-trap
Temperature
controller
CH4
tank
CH4
HPLC Pump
Evaporator
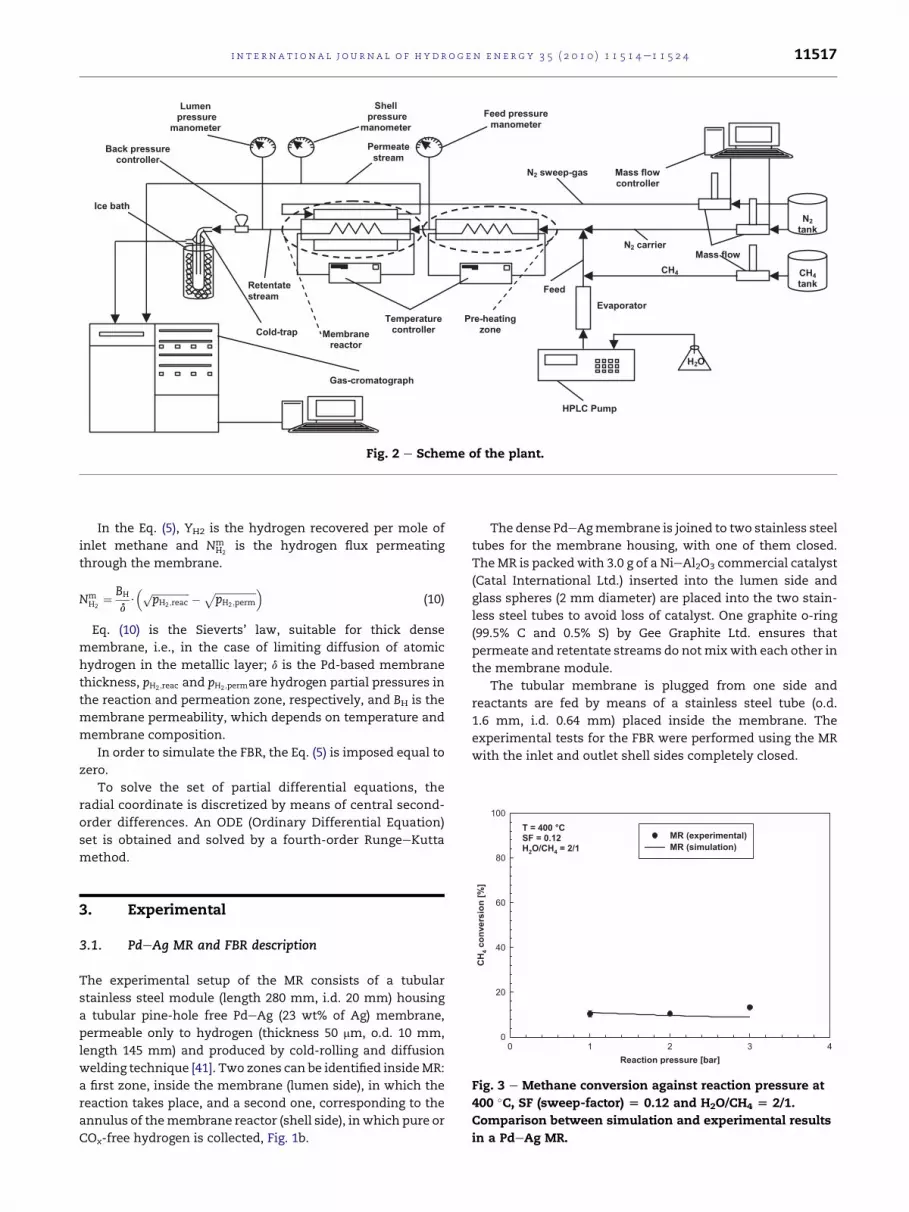
Fig. 2 e Scheme of the plant.
i n t e r n a t i o n a l j o u r n a l o f h y d r o g e n en e r g y 3 5 ( 2 0 1 0 ) 1 1 5 1 4e1 1 5 2 4 11517
In the Eq. (5), YH2 is the hydrogen recovered per mole of
inlet methane and NmH2
is the hydrogen flux permeating
through the membrane.
NmH2
¼ BH
d$� ffiffiffiffiffiffiffiffiffiffiffiffiffiffiffi
pH2 ;reacp � ffiffiffiffiffiffiffiffiffiffiffiffiffiffiffiffi
pH2 ;perm
p �(10)
Eq. (10) is the Sieverts’ law, suitable for thick dense
membrane, i.e., in the case of limiting diffusion of atomic
hydrogen in the metallic layer; d is the Pd-based membrane
thickness, pH2 ;reac and pH2 ;permare hydrogen partial pressures in
the reaction and permeation zone, respectively, and BH is the
membrane permeability, which depends on temperature and
membrane composition.
In order to simulate the FBR, the Eq. (5) is imposed equal to
zero.
To solve the set of partial differential equations, the
radial coordinate is discretized by means of central second-
order differences. An ODE (Ordinary Differential Equation)
set is obtained and solved by a fourth-order RungeeKutta
method.
Fig. 3 e Methane conversion against reaction pressure at
400 �C, SF (sweep-factor) [ 0.12 and H2O/CH4 [ 2/1.
Comparison between simulation and experimental results
in a PdeAg MR.
3. Experimental
3.1. PdeAg MR and FBR description
The experimental setup of the MR consists of a tubular
stainless steel module (length 280 mm, i.d. 20 mm) housing
a tubular pine-hole free PdeAg (23 wt% of Ag) membrane,
permeable only to hydrogen (thickness 50 mm, o.d. 10 mm,
length 145 mm) and produced by cold-rolling and diffusion
welding technique [41]. Two zones can be identified insideMR:
a first zone, inside the membrane (lumen side), in which the
reaction takes place, and a second one, corresponding to the
annulus of themembrane reactor (shell side), in which pure or
COx-free hydrogen is collected, Fig. 1b.
The dense PdeAgmembrane is joined to two stainless steel
tubes for the membrane housing, with one of them closed.
TheMR is packedwith 3.0 g of a NieAl2O3 commercial catalyst
(Catal International Ltd.) inserted into the lumen side and
glass spheres (2 mm diameter) are placed into the two stain-
less steel tubes to avoid loss of catalyst. One graphite o-ring
(99.5% C and 0.5% S) by Gee Graphite Ltd. ensures that
permeate and retentate streams do notmixwith each other in
the membrane module.
The tubular membrane is plugged from one side and
reactants are fed by means of a stainless steel tube (o.d.
1.6 mm, i.d. 0.64 mm) placed inside the membrane. The
experimental tests for the FBR were performed using the MR
with the inlet and outlet shell sides completely closed.

Fig. 4 e COx-free hydrogen recovery against reaction
pressure at 400 �C, SF (sweep-factor) [ 0.12 and H2O/
CH4 [ 2/1. Comparison between simulation and
experimental results in a PdeAg MR.
i n t e rn a t i o n a l j o u r n a l o f h y d r o g e n en e r g y 3 5 ( 2 0 1 0 ) 1 1 5 1 4e1 1 5 2 411518
3.2. Experimental details
The scheme of the plant is illustrated in Fig. 2. A P680 HPLC
pump (Dionex) was used for feeding liquid water. Afterwards,
it is vaporized, mixed with methane and fed into a preheating
zone and, thus, to the reaction side of the MR by means of
a tube in tube solution. The methane feed molar rate was
2.75 � 10�3 mol/min (GHSV ¼ w3700 h�1) and H2O/methane
feed molar ratio was kept constant at 2/1. Moreover,
a constant nitrogen molar flow rate (7.14 � 10�2 mol/min) as
internal standard gas was fed with the reactants into the
reaction side. The retentate streamwas directed to a cold-trap
in order to condensate the excess of water. Both permeate and
retentate stream compositions were analysed using
a temperature programmed HP 6890 GC with two thermal
conductivity detectors at 250 �C and Ar as a carrier gas. The GC
was equipped by three packed columns: Porapack R 50/80
(8 ft � 1/8 inch) and Carboxen� 1000 (15 ft � 1/8 inch) con-
nected in series, and a Molecular Sieve 5 A (6 ft � 1/8 inch).
The sweep-gas molar flow rate ranged between 0.019 mol/
h and 0.261 mol/h, corresponding to the sweep-factor (SF) (11)
(defined as the molar ratio between the sweep-gas (N2)
supplied into the shell side and methane as a feed) variation
from 0.12 to 1.6.
Being this work realized at lab-scale, nitrogen is used as
a sweep-gas for simplicity, while, industrially, steam is
preferred, separable readily from the permeate stream by
condensation. The sweep-gas is supplied in co-current
configuration with respect to the reactants by means of
a mass-flow controller (Brooks Instruments 5850S), driven by
a computer software furnished by Lira (Italy).
In all the experiments, the absolute MR shell side pressure
was kept constant at 1.0 bar.
Each experimental point obtained in this work represents
an average value of 6 experimental points taken in 90 min at
steady-state conditions. Before reaction, the catalytic bed was
reduced by using hydrogen (1.1 � 10�2 mol/min) at 450 �C for
2 h. A flat temperature profile along the reactor was confirmed
during the reaction by means of a three points thermocouple
placed into the reactor.
The following definitions are used for describing the MR/
FBR performances, starting from the sweep-factor (SF):
SF ¼ N2;sweep�gas
CH4�inð � Þ (11)
CH4 conversion ¼ CH4�in � CH4�out
CH4�in$100 ð%Þ (12)
where CH4-in is the methanemolar flow rate fed to the reactor
and CH4-out the methane molar flow rate going out from the
reactor,
COx � free hydrogen yield ¼ H2�permeate
4$CH4�in$100 ð%Þ (13)
COx � free hydrogen recovery ¼ H2�permeate
H2�TOT$100 ð%Þ (14)
where H2-permeate is the hydrogen molar flow rate permeating
through the membrane and collected in the permeate side,
while H2-TOT is the total hydrogen produced during the
reaction. Among the definitions, Eqs. 11, 12 and 14 hold only
for the MR. Additionally, the selectivity to a chemical species
Sx is defined as:
Sx ¼ XOUT
H2;OUT þ COOUT þ CO2;OUT þ CH4;OUT$100 ð%Þ (15)
where X can be H2, CO2, CH4 or CO.
The laws regulating the hydrogen flux permeating through
the dense PdeAg membrane are listed below:
JH2¼ Pe
d$� ffiffiffiffiffiffiffiffiffiffiffiffiffiffiffiffiffiffiffiffi
pH2�lumenp � ffiffiffiffiffiffiffiffiffiffiffiffiffiffiffiffiffi
pH2�shellp �
Fick�Sieverts law (16)
where JH2is the hydrogen flux permeating through the PdeAg
membrane, Pe the hydrogen permeability, d the PdeAg
membrane thickness (50 mm), pH2�lumen and pH2�shell the
hydrogen partial pressures in the lumen and shell sides,
respectively:
Pe ¼ Pe0 expð�Ea=RTÞ Arrhenius� like equation (17)
where Pe0 is the pre-exponential factor, Ea the apparent
activation energy, R the universal gas constant and T the
absolute temperature. The combination of Eqs. 16 and 17
gives:
JH2¼
Pe0$expð�EaRT
�$� ffiffiffiffiffiffiffiffiffiffiffiffiffiffiffiffiffiffi
pH2 ;lumenp � ffiffiffiffiffiffiffiffiffiffiffiffiffiffiffiffi
pH2 ;shellp �
dRichardson law
(18)
expressing the overall hydrogen flux permeating through the
PdeAg membrane.
4. Results and discussion
4.1. Validation of the model
The simulation tests on MSR in the membrane reactor were
realized on the basis of the model above reported and, then,
compared with the experimental results obtained in this
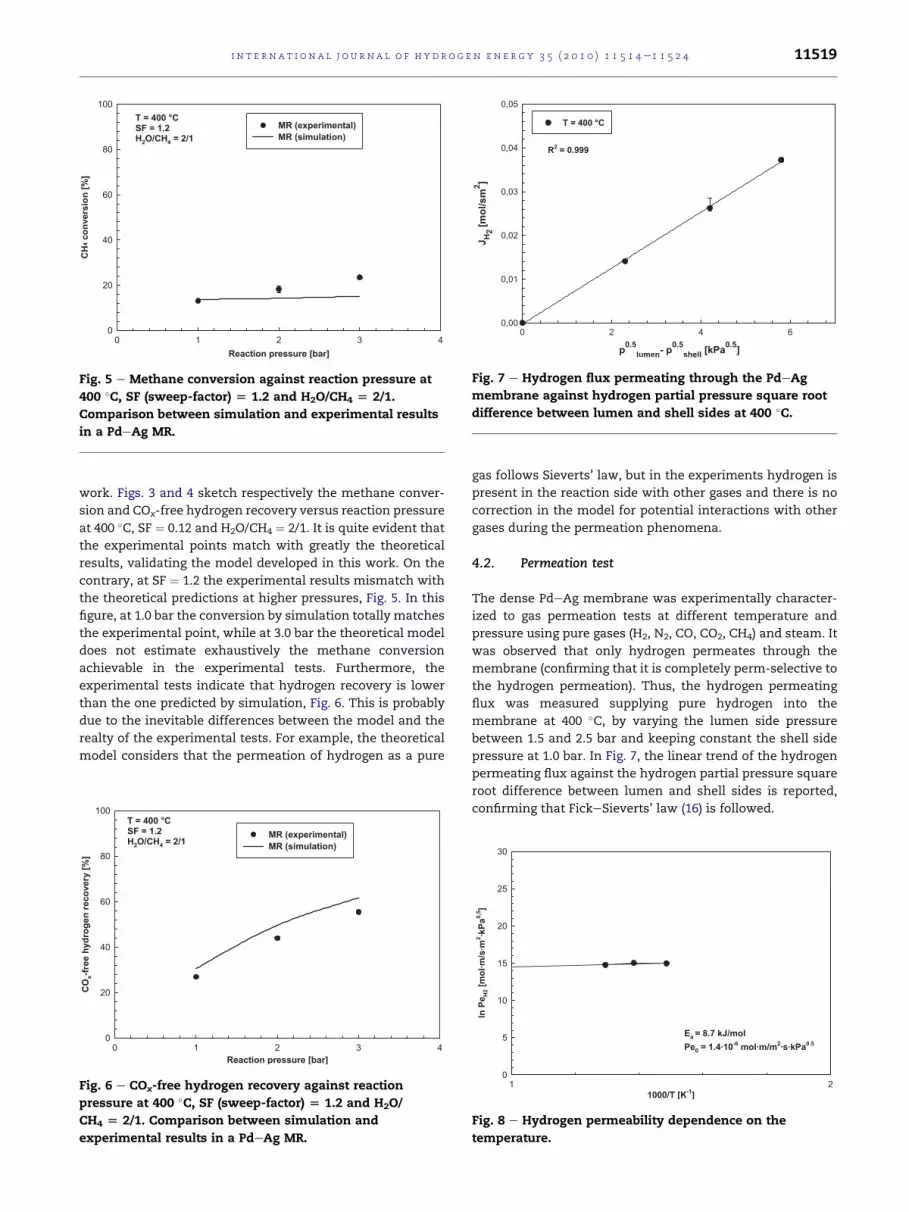
Fig. 7 e Hydrogen flux permeating through the PdeAg
membrane against hydrogen partial pressure square root
difference between lumen and shell sides at 400 �C.
Fig. 5 e Methane conversion against reaction pressure at
400 �C, SF (sweep-factor) [ 1.2 and H2O/CH4 [ 2/1.
Comparison between simulation and experimental results
in a PdeAg MR.
i n t e r n a t i o n a l j o u r n a l o f h y d r o g e n en e r g y 3 5 ( 2 0 1 0 ) 1 1 5 1 4e1 1 5 2 4 11519
work. Figs. 3 and 4 sketch respectively the methane conver-
sion and COx-free hydrogen recovery versus reaction pressure
at 400 �C, SF ¼ 0.12 and H2O/CH4 ¼ 2/1. It is quite evident that
the experimental points match with greatly the theoretical
results, validating the model developed in this work. On the
contrary, at SF ¼ 1.2 the experimental results mismatch with
the theoretical predictions at higher pressures, Fig. 5. In this
figure, at 1.0 bar the conversion by simulation totally matches
the experimental point, while at 3.0 bar the theoretical model
does not estimate exhaustively the methane conversion
achievable in the experimental tests. Furthermore, the
experimental tests indicate that hydrogen recovery is lower
than the one predicted by simulation, Fig. 6. This is probably
due to the inevitable differences between the model and the
realty of the experimental tests. For example, the theoretical
model considers that the permeation of hydrogen as a pure
Fig. 6 e COx-free hydrogen recovery against reaction
pressure at 400 �C, SF (sweep-factor) [ 1.2 and H2O/
CH4 [ 2/1. Comparison between simulation and
experimental results in a PdeAg MR.
gas follows Sieverts’ law, but in the experiments hydrogen is
present in the reaction side with other gases and there is no
correction in the model for potential interactions with other
gases during the permeation phenomena.
4.2. Permeation test
The dense PdeAg membrane was experimentally character-
ized to gas permeation tests at different temperature and
pressure using pure gases (H2, N2, CO, CO2, CH4) and steam. It
was observed that only hydrogen permeates through the
membrane (confirming that it is completely perm-selective to
the hydrogen permeation). Thus, the hydrogen permeating
flux was measured supplying pure hydrogen into the
membrane at 400 �C, by varying the lumen side pressure
between 1.5 and 2.5 bar and keeping constant the shell side
pressure at 1.0 bar. In Fig. 7, the linear trend of the hydrogen
permeating flux against the hydrogen partial pressure square
root difference between lumen and shell sides is reported,
confirming that FickeSieverts’ law (16) is followed.
1000/T [K ]
1 2
ln
P
e [m
ol·m
/s
·m
·k
Pa
]
0
5
10
15
20
25
30
E = 8.7 kJ/mol
Pe = 1.4·10 mol·m/m ·s·kPa
Fig. 8 e Hydrogen permeability dependence on the
temperature.
Reaction pressure [bar]
0 1 2 3 4
CO
x-free h
yd
ro
gen
yield
[%
]
0
5
10
15
20
25
30T = 400 °C
T = 450 °C
T = 500 °C
SF = 1.2
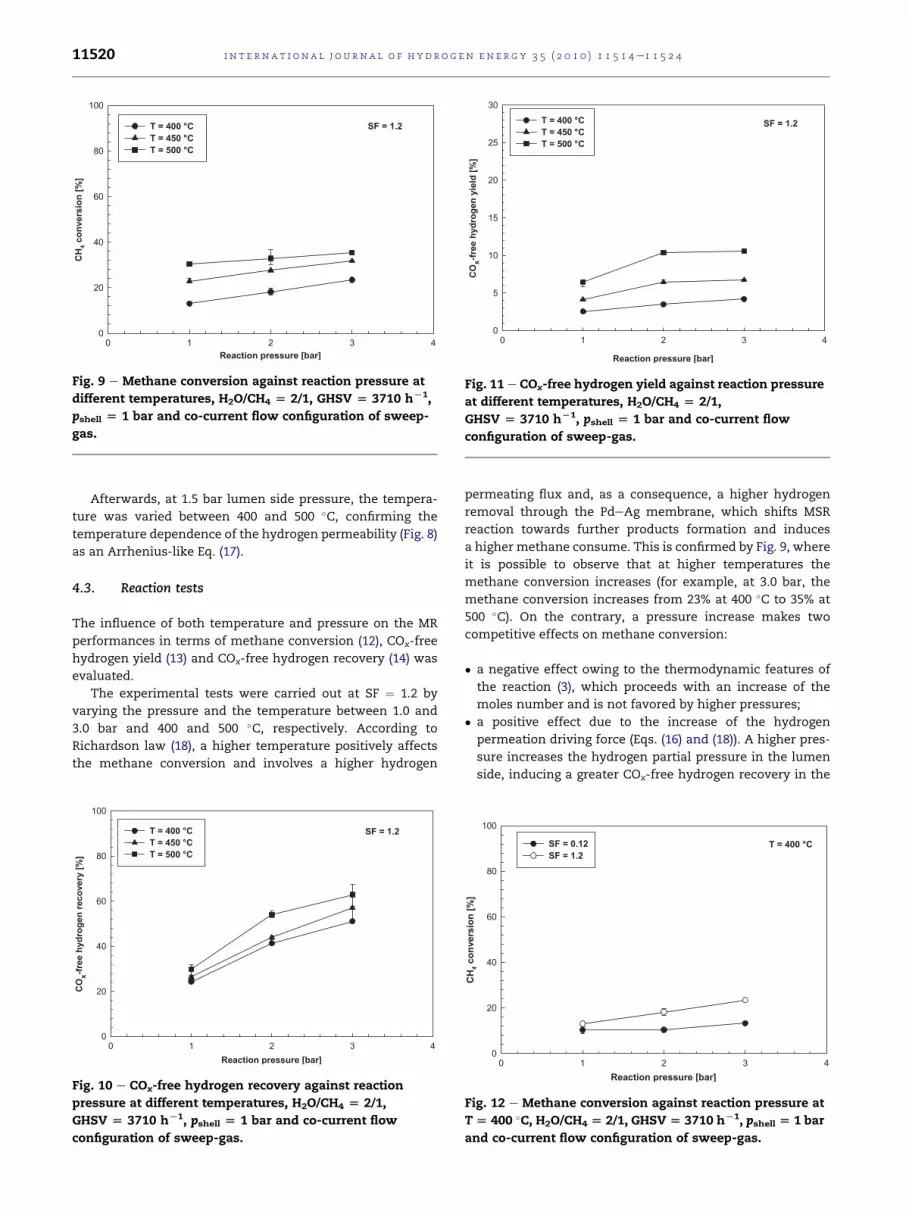
Fig. 11 e COx-free hydrogen yield against reaction pressure
at different temperatures, H2O/CH4 [ 2/1,
GHSV [ 3710 hL1, pshell [ 1 bar and co-current flow
configuration of sweep-gas.
Reaction pressure [bar]
0 1 2 3 4
CH
c
on
ve
rs
io
n [%
]
0
20
40
60
80
100
T = 400 °C
T = 450 °C
T = 500 °C
SF = 1.2
Fig. 9 e Methane conversion against reaction pressure at
different temperatures, H2O/CH4 [ 2/1, GHSV [ 3710 hL1,
pshell [ 1 bar and co-current flow configuration of sweep-
gas.
i n t e rn a t i o n a l j o u r n a l o f h y d r o g e n en e r g y 3 5 ( 2 0 1 0 ) 1 1 5 1 4e1 1 5 2 411520
Afterwards, at 1.5 bar lumen side pressure, the tempera-
ture was varied between 400 and 500 �C, confirming the
temperature dependence of the hydrogen permeability (Fig. 8)
as an Arrhenius-like Eq. (17).
4.3. Reaction tests
The influence of both temperature and pressure on the MR
performances in terms of methane conversion (12), COx-free
hydrogen yield (13) and COx-free hydrogen recovery (14) was
evaluated.
The experimental tests were carried out at SF ¼ 1.2 by
varying the pressure and the temperature between 1.0 and
3.0 bar and 400 and 500 �C, respectively. According to
Richardson law (18), a higher temperature positively affects
the methane conversion and involves a higher hydrogen
Reaction pressure [bar]
0 1 2 3 4
CO
x-fre
e h
yd
ro
ge
n rec
ove
ry [%
]
0
20
40
60
80
100
T = 400 °C
T = 450 °C
T = 500 °C
SF = 1.2
Fig. 10 e COx-free hydrogen recovery against reaction
pressure at different temperatures, H2O/CH4 [ 2/1,
GHSV [ 3710 hL1, pshell [ 1 bar and co-current flow
configuration of sweep-gas.
permeating flux and, as a consequence, a higher hydrogen
removal through the PdeAg membrane, which shifts MSR
reaction towards further products formation and induces
a higher methane consume. This is confirmed by Fig. 9, where
it is possible to observe that at higher temperatures the
methane conversion increases (for example, at 3.0 bar, the
methane conversion increases from 23% at 400 �C to 35% at
500 �C). On the contrary, a pressure increase makes two
competitive effects on methane conversion:
� a negative effect owing to the thermodynamic features of
the reaction (3), which proceeds with an increase of the
moles number and is not favored by higher pressures;
� a positive effect due to the increase of the hydrogen
permeation driving force (Eqs. (16) and (18)). A higher pres-
sure increases the hydrogen partial pressure in the lumen
side, inducing a greater COx-free hydrogen recovery in the
Fig. 12 e Methane conversion against reaction pressure at
T [ 400 �C, H2O/CH4 [ 2/1, GHSV [ 3710 hL1, pshell [ 1 bar
and co-current flow configuration of sweep-gas.

Reaction pressure [bar]
0 1 2 3 4
OC
x]
%[
yr
ev
oc
er
ne
go
rd
yh
ee
rf
-
0
20
40
60
80
100
SF = 0.6
SF = 1.2
SF = 1.6
T = 450 °C
Fig. 15 e COx-free hydrogen recovery against reaction
pressure at T [ 450 �C, H2O/CH4 [ 2/1, GHSV [ 3710 hL1,
pshell [ 1 bar and co-current flow configuration of sweep-
gas.
Fig. 13 e COx-free hydrogen recovery against reaction
pressure at T [ 400 �C, H2O/CH4 [ 2/1, GHSV [ 3710 hL1,
pshell [ 1 bar and co-current flow configuration of sweep-
gas.
i n t e r n a t i o n a l j o u r n a l o f h y d r o g e n en e r g y 3 5 ( 2 0 1 0 ) 1 1 5 1 4e1 1 5 2 4 11521
shell side. Moreover, as a consequence, the MSR reaction is
shifted towards further products formation and methane
conversion is improved (shift effect).
As shown in Fig. 9, the methane conversion enhancement
with the pressure is probably due to the prevalence of the
“shift effect” related to the selective removal of hydrogen over
the detrimental effect of the pressure increase induced on
reaction thermodynamics.
However, the low conversion values shown in Fig. 9 are
probably due to the low nickel content as catalyst metal phase
used in this work. Even Tong et al. [20,36] observed that, using
a Ni-based catalyst for MSR reaction with a relatively low
nickel content, the average pressure of hydrogen in the
reactor was lower than at the output, probably because of the
lower hydrogen production in the central part of the catalyst
Fig. 14 e Methane conversion against reaction pressure for
both MR and FBR at T [ 450 �C, H2O/CH4 [ 2/1,
GHSV [ 3710 hL1; MR: pshell [ 1 bar and co-current flow
configuration of sweep-gas.
layer than the amount removed by permeation. Therefore,
they concluded that the catalytic activity influences even the
hydrogen flow permeating through the membrane and, then,
the methane conversion. Probably, this scenario can be
proposed for explaining the low conversion achieved in the
present study.
Taking into account that the main scope of this work is to
produce pure (or at least COx-free) hydrogen, particular
attention was paid on both COx-free hydrogen recovery and
COx-free hydrogen yield. Fig. 10 sketches that the COx-free
hydrogen recovery increases as a function of temperature and
pressure. In fact, a higher temperature involves a higher
hydrogen permeating flux as well as a higher reaction pres-
sure maximizes the hydrogen partial pressure in the lumen
side improving the hydrogen permeation driving force. These
two effects induce a higher COx-free hydrogen recovery in the
permeate stream. At 3.0 bar and 500 �C, 63% COx-free
hydrogen recovery was reached. Similarly, as illustrated in
Fig. 11, the COx-free hydrogen yields increase with the
temperature and pressure. As already stated, the higher the
temperature and pressure the higher the hydrogen removal
through the membrane that causes an improvement of
methane conversion. As a consequence, the hydrogen
Table 1 e CO selectivity at different reaction pressuresand temperatures for both MR and FBR at H2O/CH4[ 2/1,GHSV[ 3710 hL1; MR: pshell[ 1 bar, co-current flowconfiguration of sweep-gas.
SCO [%]
MR at SF ¼ 1.2 FBR
p [bar] 400 �C 450 �C 500 �C 450 �C
1.0 0.1 0.5 1.4 1.1
2.0 0.1 0.4 1.1 1.1
3.0 e 0.2 1.0 1.3

Table
2e
Meth
aneco
nversionandhydro
genreco
very
inPd-b
ase
dm
em
bra
nereactors.Anexperim
entalco
mpariso
nbetw
eenth
iswork
andlitera
ture
data.
Membrane
Thickness
[mm
]T[�C]
preaction
[bar]
pshell
[bar]
Catalyst
H2O/C
H4
molarratio
GHSV
[h�1]
Sweep-gas
[ml/m
in]
Conversion
[%]
H2reco
very
[%]
Auth
ors
Pd/5.1%Ag
10.3
500
1.4
ae
Ni/Al 2O
33/1
1067
e50
eShuetal.[22]
Pd-PSS
11
527a
3.0
ae
47.2wt%
Ni/Al 2O
33/1
1120
482a(N
2)
100
eTongetal.[20]
3360
60
Pd-PSS
11
527a
3.0
ae
9.9wt%
Ni/Al 2O
33/1
1120
482a(N
2)
90
eTongetal.[20]
3360
50
e
Pd-base
d8
500a
1.0
eNi-base
d3/1
e(A
r)86.4
eKikuch
ietal.[33]
Pd-SSTubular
20
500
20.0
1.0
Ni-base
d3/1
e(N
2)
85
90
Lin
etal.[35]
Pd-SSTubular
20
500
9.0
1.0
Ni-base
d3/1
e(N
2)
40
30
Lin
etal.[35]
35
15
Pd/23%
AgTubular
100
500
6.1
0.5
NieMgO
base
d2.9/1
e160a(N
2)
50
eJorgense
n
etal.[37]
10.0
60
Pd/A
l 2O
34
550
9.0
eNie
La/M
geAl
3.5/1
e220
98,8
95
Chenetal.[38]
PdeAgTubular
50
450
3.0
1.0
Ni/Al 2O
32/1
3710
98(N
2)
50
70
This
work
aCalculatedvalue.
i n t e rn a t i o n a l j o u r n a l o f h y d r o g e n en e r g y 3 5 ( 2 0 1 0 ) 1 1 5 1 4e1 1 5 2 411522
production as well as the hydrogen stream collected in the
shell side is improved. Nevertheless, the low COx-free
hydrogen yield values of Fig. 11 are probably due to the rela-
tively low methane conversions, as reported in Fig. 9.
Having inmind tomaximize the COx-free hydrogen stream
collected in the shell side, the SF influence on the MR perfor-
mances was studied. A SF increase reduces the hydrogen
partial pressure in the shell side, favoring the hydrogen
permeation driving force and, consequently, the methane
conversion and COx-free hydrogen recovery enhancement,
Figs. 12 and 13.
In particular, at 400 �C, SF ¼ 1.2 and 3.0 bar, 23% methane
conversion and 55% COx-free hydrogen recovery were ach-
ieved with respect to SF ¼ 0.12, where 13% methane conver-
sion and 11% COx-free hydrogen recovery were reached.
The SF influence on MR performances was even studied at
higher temperatures. In particular, Figs. 14 and 15 show the
methane conversion and COx-free hydrogen recovery at 450 �Cand different SF. As best result of this work, 50% methane
conversion and 70% hydrogen recovery were obtained at
SF ¼ 1.6. Being the experimental campaign carried out at lab-
scale, a further increase of SF made an unacceptable increase
of the shell side pressure owing to the small volume of theMR.
Furthermore, the SF influence at 500 �C was not performed
because of the PdeAg membrane failure.
Fig. 14 shows a comparison with an FBR exercised at the
same MR conditions. The decreasing trend of methane
conversion in the FBR against the pressure is due to the
negative effect of pressure on the reaction thermodynamics.
On the contrary, theMR provides significantly highermethane
conversions than the FBR, owing to the selective removal of
hydrogen through the membrane. In particular, at 450 �C and
3.0 bar, themethane conversion obtained in the FBR is 6%with
respect to 50% obtained with the MR. When no sweep-gas is
used on the shell side of the membrane reactor (SF ¼ 0), the
conversion decreases, but remaining always higher (around
20% at 3 bar) than that of the FBR.
A further comparison between the MR and FBR is shown in
Table 1, where the CO selectivity values are reported as
a function of the reaction pressure and temperature. This
table shows the lower CO selectivity (corresponding to the
outlet retentate CO composition) with respect to the FBR
outlet composition at 450 �C. This result can be accounted for
the “shift effect”, which induces the shift of the WGS reaction
(2) towards the products, allowing a greater CO consumption
in the MR. Furthermore, the slight CO selectivity increase with
the temperature in the MR is probably caused by the WGS
reaction, which is exothermic and not favored at high
temperature [42].
In conclusion, many investigations were carried out on
MSR reaction using both conventional and membrane reac-
tors for different purposes. As a qualitative analysis, Table 2
summarizes some experimental results in terms of methane
conversion and hydrogen recovery obtained in this work,
compared to other investigations from literature in the field of
the Pd-based MRs. As shown in the table, it is evident that the
most important result of our work consists of the possibility to
reach methane conversion and, primarily, a relevant COx-free
hydrogen recovery. By this point of view, the MSR perfor-
mances are comparable with those obtained at more

i n t e r n a t i o n a l j o u r n a l o f h y d r o g e n en e r g y 3 5 ( 2 0 1 0 ) 1 1 5 1 4e1 1 5 2 4 11523
demanding operating conditions (i.e., the reaction pressure) in
literature, making interesting our application for producing
hydrogen for PEMFC applications.
5. Conclusions
In thiswork, theMSR reactionwas performed at low pressures
(1e3 bar) in a PdeAg membrane reactor with the purpose of
producing pure, or at least COx-free, hydrogen for PEMFCs.
The MR showed better methane conversions compared to
a FBR operated at the same conditions with the further
advantage of collecting a COx-free hydrogen stream in the
shell side. In particular, the best results of this work are ach-
ieved at 450 �C, 3.0 bar and SF equal to 1.6, consisting of 50%
methane conversion and around 70% COx-free hydrogen
recovery. Instead, at this conditions, 6% methane conversion
was reached in the FBR.
However, the limited conversion values obtained can be
probably explained by the low nickel content in the catalyst
metal phase used in this work. In fact, the catalytic activity
greatly affects the performance of the MR. As future devel-
opments, theMSR reactionwill be studied in PdeAgMRs using
industrial natural gas as fuel input, rather than puremethane.
Acronyms
FBR fixed bed reactor
GHSV gas hourly space velocity
HTS high temperature shift
LTS low temperature shift
MR membrane reactor
MSR methane steam reforming
PEMFC proton exchange membrane fuel cell
PSA pressure swing adsorption
SF sweep-factor
WGS water gas shift
ODE Ordinary Differential equation
Nomenclature
BH hydrogen permeability
cH2 hydrogen concentration
CH4-in methane molar flow rate fed to the reactor
CH4-out methane molar flow rate going out from the reactor
ci mole concentration of component i
cini inlet concentration of component i
dp catalytic bed tube radius
Ea apparent activation energy
FinCH4methane inlet flow rate
H2-permeate hydrogen molar flow rate permeating through the
membrane and collected in the permeate side
H2-TOT total hydrogen produced during the reaction
i.d. inside diameter
JH2 hydrogen flux permeating through the PdeAg
membrane
L reactor length
N2,sweep-gas sweep-gas molar flow rate
NmH2
hydrogen flux permeating through the membrane.
o.d. outside diameter
Pe hydrogen permeability
Pe0 pre-exponential factor
Pemr mass effective radial Peclet number.
pH2 ;perm hydrogen partial pressures in the permeation zone
pH2 ;reac hydrogen partial pressures in the reaction zone
pH2�lumen hydrogen partial pressures in the lumen side
pH2�shell hydrogen partial pressures in the shell side
R universal gas constant~r dimensionless radial coordinate
ri,0 internal radius external tube
Rj intrinsic rate for component j
Sx selectivity of component i
T absolute temperature
uinz inlet gas mixture velocity
uz gas mixture velocity
YH2 hydrogen recovered per mole of inlet methane
DH0298 K heat of reaction in standard conditions
d PdeAg membrane thickness
hj effectiveness factor for component j
rb packed bed density~z dimensionless axial coordinate
r e f e r e n c e s
[1] Chalk SG, Miller JF, Wagner FW. Challenges for fuel cells intransport applications. J Power Sources 2000;86:40e51.
[2] Chu D, Jiang R, Gardner K, Jacobs R, Schmidt J,Quakenbush T, et al. Polymer electrolyte membrane fuelcells for communication applications. J Power Sources 2001;96:174e8.
[3] Costamagna P, Srinivasan S. Quantum jumps in the PEMFCscience and technology from the 1960s to the year 2000 PartII. Engineering, technology, development and applicationaspects. J Power Sources 2001;102:253e69.
[4] Gamburzev S, Appleby AJ. Recent progress in performanceimprovement of the proton exchange membrane fuel cell(PEMFC). J Power Sources 2002;107:5e12.
[5] Mehta V, Cooper JS. Review and analysis of PEM fuel celldesign and manufacturing. J Power Sources 2003;114:32e53.
[6] Schaller KV, Gruber C. Fuel cell drive and high dynamicenergy storage systems e opportunities for the future citybus. Fuel Cells Bull 2000;3:9e13.
[7] Panik F. Fuel cells for vehicle applications in cars e bringingthe future closer. J Power Sources 1998;71:36e8.
[8] Kawatsu S. Advanced PEFC development for fuel cellpowered vehicles. J Power Sources 1998;71:150e5.
[9] Weiner SA. Fuel cell stationary power business development.J Power Sources 1998;71:61e4.
[10] Campanari S, Macchi E, Manzolini G. Membrane reformerPEMFC cogeneration systems for residential applications e
part A: full load and partial load simulation. Asia-Pac J ChemEng 2009;4(3):301e10.
[11] Campanari S, Macchi E, Manzolini G. Membrane reformerPEMFC cogeneration systems for residential applications e
part B: techno-economic analysis and system layout. Asia-Pac J Chem Eng 2009;4(3):311e21.
[12] Campanari S, Macchi E, Manzolini G. Innovativemembrane reformer for hydrogen production applied toPEM micro-cogeneration: simulation model andthermodynamic analysis. Int J Hydrogen Energy 2008;33:1361e73.

i n t e rn a t i o n a l j o u r n a l o f h y d r o g e n en e r g y 3 5 ( 2 0 1 0 ) 1 1 5 1 4e1 1 5 2 411524
[13] Barelli L, Bidini G, Gallorini F, Servili S. Hydrogen productionthrough sorption-enhanced steam methane reforming andmembrane technology: a review. Energy 2008;33:554e70.
[14] Shu J, Grandjean BPA, Van Neste A, Kaliaguine S. Catalyticpalladium-based membrane reactors: a review. Can J ChemEng 1991;69:1036e60.
[15] Amandusson H, Ekedahl LG, Dannetun H. Hydrogenpermeation through surface modified Pd and PdAgmembranes. J Memb Sci 2001;193:35e47.
[16] Li H, Xu H, Li W. Study of n value and a/b palladium hydridephase transition within the ultra-thin palladium compositemembrane. J Memb Sci 2008;324:44e9.
[17] Uemiya S, Matsuda T, Kikuchi E. Hydrogen permeablepalladiumesilver alloy membrane supported on porousceramics. J Memb Sci 1991;56:315e25.
[18] De Falco M, Di Paola L, Marrelli L. Heat transfer and hydrogenpermeability in modeling industrial membrane reactors formethane steam reforming. Int J Hydrogen Energy 2007;32:2902e13.
[19] Kikuchi E, Tanaka S, Yamazaki Y,Morita Y. Steam reforming ofhydrocarbonsonnoblemetalcatalystse1.Thecatalyticactivityin methane-steam reaction. Bull Jpn Pet Inst 1974;16:95e8.
[20] Tong J, Matsumura Y. Effect of catalytic activity on methanesteam reforming in hydrogen-permeable membrane reactor.Appl Catal A Gen 2005;286:226e31.
[21] Profeti LPR, Ticianelli EA, Assaf EM. Co/Al2O3 catalystspromoted with noble metals for production of hydrogen bymethane steam reforming. Fuel 2008;87:2076e81.
[22] Shu J, Grandjean BPA, Kaliaguine S. Asymmetric PdeAg/stainless steel catalytic membranes for methane steamreforming. Catal Today 1995;25:327e32.
[23] Pistonesi C, Juan A, Irigoyen B, Amadeo N. Theoretical andexperimental study of methane steam reforming reactionsover nickel catalyst. Appl Surf Sci 2007;253:4427e37.
[24] Castro Luna AE, Becerra AM. Kinetics of methane steamreforming on a Ni on aluminaetitania catalyst. React KinetCatal Lett 1997;61:369e74.
[25] Matsumura Y, Nakamori T. Steam reforming of methaneover nickel catalysts at low reaction temperature. Appl CatalA Gen 2004;258:107e14.
[26] Hou K, Hughes R. The kinetics of methane steam reformingover a Ni/aeAl2O3 catalyst. Chem Eng J 2001;82:311e28.
[27] Choudhary VR, Banerjee S, Rajput AM. Hydrogen from step-wise steam reforming of methane over Ni/ZrO2: factorsaffecting catalytic methane decomposition and gasificationby steam of carbon formed on the catalyst. Appl Catal A Gen2002;234:259e70.
[28] Chen L, Hong Q, Lin J, Dautzenberg FM. Hydrogen productionby coupled catalytic partial oxidation and steam methanereforming at elevated pressure and temperature. J PowerSources 2007;164:803e8.
[29] Bharadwaj SS, Schmidt LD. Catalytic partial oxidation ofnatural gas to syngas. Fuel Proc Technol 1995;42:109e27.
[30] Levent M, Gunn DJ, El-Bousi MA. Production of hydrogen-rich gases from steam reforming of methane in anautomatic catalytic microreactor. Int J Hydrogen Energy2003;28:945e59.
[31] Oertel M, Schmitz J, Weirich W, Jendryssek-Neumann D,Schulten R. Steam reforming of natural gas with integratedhydrogen separation for hydrogen production. Chem EngTechnol 1987;10:248e55.
[32] Kikuchi E, Nemoto Y, Kajiwara M, Uemiya S, Kojima T. Steamreforming of methane in membrane reactors: comparison ofelectroless-plating and CVD membranes and catalystpacking modes. Catal Today 2000;56:75e81.
[33] Kikuchi E. Membrane reactor application to hydrogenproduction. Catal Today 2000;56:97e101.
[34] Petersen KA, Nielsen CS, Jørgensen SL. Membrane reformingfor hydrogen. Catal Today 1998;46:193e201.
[35] Lin YM, Liu SL, Chuang CH, Chu YT. Effect of incipientremoval of hydrogen through palladium membrane on theconversion of methane steam reforming. Experimental andmodeling. Catal Today 2003;82:127e39.
[36] Tong J, Matsumura Y. Pure hydrogen production by methanesteam reforming with hydrogen-permeable membranereactor. Catal Today 2006;111:147e52.
[37] Jorgensen S, Nielsen PEH, Lehrmann P. Steam reformingof methane in membrane reactor. Catal Today 1995;25:303e7.
[38] Chen Y, Wang Y, Xu H, Xiong G. Efficient production ofhydrogen from natural gas steam reforming in palladiummembrane reactor. Appl Catal B Environ 2008;80:283e94.
[39] Xu J, Froment G. Methane steam reforming, methanationand wateregas shift: I. Intrinsic kinetics. AIChE J 1989;35:88e96.
[40] Kulkarni BD, Doraiswamy LK. Estimation of effectivetransport properties in packed bed reactors. Catal Rev Sci Eng1980;22:431e83.
[41] Tosti S, Bettinali L. Diffusion bonding of PdeAg membranes.J Mater Sci 2004;39:3041e6.
[42] Chen WH, Hsieh TC, Jiang TL. An experimental study oncarbon monoxide conversion and hydrogen generation fromwater gas shift reaction. Energ Convers Manag 2008;49:2801e8.
Copyright © 2022 FDOKUMEN