Chal, A Pd. - VTechWorks
108
The Effect of Training in Computer-Aided Design on the Spatial Visualization Ability in Selected Gifted Adolescents by Warren E. Mack B.S. State University of New York, College at Oswego M.S. Central Connecticut State University Dissertation submitted to the Faculty of the Virginia Polytechnic Institute and State University in partial fulfillment of the requirements for the degree of DOCTOR OF EDUCATION in Vocational and Technical Education Approved: Chal, A Pd. Dr. E. A. Bame, Co-chairman Dr. C. A. Pinder, Co-chairman Dr. J. E. LaPorte Dr. J. K. Burton Dr. S. B. Asselin March, 1992 Blacksburg, Virginia
-
Upload
khangminh22 -
Category
Documents
-
view
3 -
download
0
Transcript of Chal, A Pd. - VTechWorks
The Effect of Training in Computer-Aided Design on the
Spatial Visualization Ability in Selected Gifted Adolescents
by
Warren E. Mack
B.S. State University of New York, College at Oswego
M.S. Central Connecticut State University
Dissertation submitted to the Faculty of the Virginia Polytechnic Institute and
State University in partial fulfillment of the requirements for the degree of
DOCTOR OF EDUCATION
in
Vocational and Technical Education
Approved:
Chal, A Pd. Dr. E. A. Bame, Co-chairman Dr. C. A. Pinder, Co-chairman
Dr. J. E. LaPorte Dr. J. K. Burton
Dr. S. B. Asselin
March, 1992 Blacksburg, Virginia

Abstract
This research was undertaken to determine the effect that computer-
aided design (CAD) had on the spatial visualization abilities of selected gifted
adolescents. The following hypotheses was tested: Subjects receiving
instruction in CAD will show improvement in spatial visualization ability, as
measured by the Revised Minnesota Paper Form Board (RMPFB) test, when
compared to the subjects not receiving CAD instruction.
The experimental group consisted of 20 students enrolled in the CAD
course offered in the 1991 Virginia Governor's School of Technology. The
control group consisted of 20 Governor's School students not enrolled in the
CAD course. Both groups were pretested using the RMPFB test Form AA to
measure entry level spatial visualization. A treatment consisting of three weeks
of CAD instruction using CADKEY 3.5 was given to the experimental group.
Following the treatment both groups were posttested using the RMPFEB test
Form BB to determine their existing level of spatial visualization ability.
The nonequivalent control group design was used in this study since the
experimental group was an intact group and therefore not randomly assigned.
ANCOVA statistical analysis was used to determine if there was statistical
significance of the posttest scores.

Acknowledgements
The author would like to thank his committee for all their help and
encouragement throughout the writing and research process. He would
especially like to thank Dr. E. Allen Bame for recruiting him to pursue his degree
at Virginia Polytechnic Institute and State University. A special thank you goes
to Drs. Charles A. Pinder and Donald E. Elson for giving him flexibility in his
assistantships so he could concentrate on his studies.
All of this would not have been possible without his parents Ruth E. Mack
and the late Elmer W. Mack, who would have been proud.
Finally, the author is grateful to his wife, Darlene, who did the typing and
editing, and displayed continuous support, understanding, and patience
throughout this adventure.

Table of Contents
ADSUIACE..... cece cccecccccccenseceneeeeceeeeneeecesseeeceneeseeeeseneseeeeeeesegaeeeenaaeeenaeeeeaeceeneeeageetens il ACKNOWIECGEMENNS..............ccccseccccesescceecceenececesecceeccceeceeeeceseeceeeeeeceeeceseceeeesees ili
Figure and List Of Tables ............ ce ccccccccccccsccseesssseccceeeeeeeessecceseeeuneeeesssaeennesees vi
Chapter 1 INtrOCUCTION ..............cccccseseeeceseeecveccceccccececeeeeeeuseeenaasseeceseseeeeeueegees 1 BACKQPOUNG 000... eeeceeecceeeeecccceeeeeeceeeeeeaueeeessseseseeeeseeeeuaeeeesens 1 Gifted ECUCATION............cccccccccccsessseeettnesteesssseseeeeeceeceseseuaeasesseseeees 1 Spatial Abilities ........ ce ccccccccsescceeeseecceenececeecceeecceeesseucessnensees 3
Computer-Aided DeSIQN ..............cccccsssssscccceceessssssssseseeeeeceseeeceeees 5 Drawing Training and Spatial Visualization ..................ccececceceeeeees 7 Purpose of the Study.................cccccceessseeseccceeeeeeeesseseeeessseeeeeeeeeenuas 8 Research Hypothesis .............ccccccccccccssssssssscccessueuseseeseeseaesseceerseees 8 SIQNificance OF Stuy ....... ce ccccccccccesteeeeetsssseessseeseeeeseeeeeeeaeeesnees 9 Assumptions of the Stud y..................ccceccseeecccceeeeeseseesensseseeeeeeees 10 Limitation of the Stud y................cccccccccccccessseseeeccecessesseeeeeeaeegeeees 11 Delimitation of the Study .............c cc ccccscsscececeeeeeeceeeeeeeeeseeeeeeeeess 11 Definition Of TEMS ................ccccsssssseneneeceneceecececensesceeeseeesceeseesers 11
Chapter2 Review of Related Research and Literature...............cceeeees 13 IMtrOCUCTION 0.00... eeeceeseseesecccccnsesesccceccsaaeececeaauseeseeauneeeessueseesssaaees 13
The Gifted Child oo... cceccssssecrerrenensenenseseeeessseeeeeeeceeeeseeneas 13 Gifted Learning Styles..............cccccessssesscneeceeeeeeceeeeeeeeceeeeseeeeeeeess 22 Learning Style and Classroom Implications ................::cc0ceeeee 24 Functioning With and Against Type..........ccceceeseneeceeesestneeeeees 26 Right and Left Brain Dominance ............ 0. ceceee cee eeee ese eeceeeeeeeenes 28
Spatial VisualiZAtiON ...............cccccsseeeseeseeeeeeceeeeeeeceeeeeeeeceeenaaaaanaae 29 Computer-Aided DeSIQM ............cccccccccceeeceeeeeseseeceeeneneeeseaeaaeeneneees 39 SUIMIMALY .....cccsccccccccccesecceeeeeeeeeeeeeeeeeeeeeeeeeeeeceeeeeeeeeeeeeeeeeuaeeeeuuanenes 44
Chapter 3 Methnodology...........ccccccccccccccccccseeeeccesesesessnnnaeeeeeeeeeeeeeeeeeeeeeeeeeeees 46 Research DeSIQN............cceccccsseeeeecceseeeeecceeeseusesesessueeneeesssuneeresees 46 Selection Of SUBjECTS............ccccceccccccceeneeseeseeeeeeeseceaneaaneeeeeeeseeeaaas 47 INSTPUMEME ......... cece esssesecccceesaeeeescecceeaeeeeeeseaeaeeeessaaaeeeeseseaaaenesens 48 RNADIitY 00.0.0... ceeesessssesssssessssssessseeeeeesseeeeeceeeeeeeeeseeeeeeeeeeeeeeeaaas 52 VALIGitY . 2... cceescececececceeeeesceeseaeeeeaaeaaeasaeeseeseseseseteeeeteeeeeeeeees 52 Correlations with other TeSts..............ccccecscccecececeeseseeeeeeeeeeeeneaees 54 Test AGMINIStration.............cccccccccseeccceeeeeseecenseeceeseeceeeceeeceseeeeeuees 54
TTOATMEON 0... ccccccccsseeeecccecccssescceeseaeeseeeeesaeeeeseeseneeseeseesnaneesenae 55 Analysis Of Data ......... cc ceccccccccssssseeeseeeeeseeeceeceeeeseeeeesueeeeeeseneeeeenes 56 SUMIMALY 0... eecceccccccecceessseeeessssseeseeeeeeeeeeeeeeseeseeseeseeeeeeeeeeeeenenas 56
Chapter 4
Chapter 5
References
Appendix 1
Appendix 2
Vita
RESUIES o.oo... ee ceceeceececcecceccsceececeecusceccecescecsseecceeeceseeceseecusececeucess 57
INtFOGUCTION 0... ecccceceeeeeeeseeeeteeeesenteacueeeseeaaaaaeaaaaueuseeeees none 57 DeSCriptiVe Data ..............cccescceecccccccesesesseecceeeeseaueseceeeeaeeueeeesenseoes 58 Testing of the Hypothesis............ ccc eccccescesseeeeeeeeeeeseeseresessesenes 63 Correlation Matrix............ccccccccssseccecsssccccsnsceeaeeeensneecesneseeeeseeaaeees 66
SUMIMALY .......ccccccccecseceecececceeeccccceceeeeeseeeseesesaasauensseeeeseeeeeeenauaaenaes 66
Summary, Conclusions, and Recommendations ...................08 68 SUMIMALY ........ceseesesssecccccesssessssececeeesseeeseaeeeeeeeeeeseesseeeessaaaaaaeseeses 68 COMNCIUSIONS............c:ssccccccessssssseececeesecsessauseeeeeeeeseesuseeseetnsaaaaseess 71 FRRECOMMENALIONS ...... eee ececeeeeeececeeeceeeeceeeeeseaessassseeeeeeeseceesenas 72 DISCUSSION ...........ccssssssceccccessceccccneuueeeccssneseeeeeseuseesesensseesauaneeeesees 74
Leeeaeeaaaaeaaeaeee eae e ee esses EEEEEESOSEESSEEESEEEELEEEEEEEEEESECeeceeeauaaaaaaeas eee eeeeeenna’ 76
Course Objectives and Outline...............ccceeceeseseeeeeseeeeeeeeeeeeeees 90 DeESCIIPTION Of COUPSE.............cccccccccccscsessssecccceesseessceeceetaunesseeceess 91 Course Objectives for CAD using CADKEY 3.5...........cccceees 91 Learning Strategie .0.........cccccccsseecccessseceseeeeeeeeeessuseeeeueseeeeseens 92
Content Outline ...........cccccccccccccccccececeseeeeeeesaueuseeesseeseeeeeseseeeneaaas 92 Methods of Evaluation... cceeecccseseessseseeseeeessseseteeeeessseseees 92 PREFEPENCES 0... eee cccceccccceceeeeeeeseeeeeeeseneenaneaaaaaaensanaaaaaaaaaaeaaaeeaas 92
Virginia Governor's School Selection Process .............:ccsssseeeeees 95 Criteria for Nominating Subjects..............ccceesssssesccceeceseseeecenseees 96 NOMINGES ..........cssecccccesssecccueececcseeeecesseseceasseesaseasssoneeessesessanesenea 96
Steps in the Nomination Process. ...............ccccccssssseseeccceneeseeseeeees 97
acca eee aeaaaaaaesaaeaeseaeseaeeesesessesssseeeeeseseeeeeeeeeeteeeeeeeeeeeeeseeeensausauansnseeeers 99
Figure 1.
Table 1.
Table 2.
Table 3.
Table 4.
Table 5.
Table 6.
Table 7.
Figure and List of Tables
Sample RMPFB Test Question ..............ccccccccessecceeeeseceeeeeeseeeees 50
Number of Semesters of Computer Classes...............cccssscceseeees 98
Number of Semesters of Drafting Classes... eeeeeeeeeee 59
Subject Breakdown by Grade Level ...............:::cccsseeecccesereesseeeees 60
Number of Exercises Completed at the Time of the Posttest..... 61
Subject Breakdown by GPA (4.0 Scale)... eeecccsseeeeeeeeees 62
ANCOVA for Posttest Controlling for Pretest ................ccccceceeeee 64
Correlation Matrix ..........ccccccccccccccccescceccceceeeeeeenssseeseessseeseeeeeeeeeeas 65
vi

CHAPTER 1
Introduction
Spatial visualization ability has been recognized as a distinct and
important dimension of human abilities for more than half a century. Although
spatial ability has never attained the level of recognition afforded verbal and
numeric ability, it has long been recognized as important for success in many
occupations and school subjects, such as engineering, drafting, and art (Guay,
1980).
Blade (1949) found that visualization, or a person's ability to think in three
dimensions, can be improved through training and practice. Visualization is
developed through experience in relating what an individual sees to what is feit
with the sense muscles. Spatial visualization skills are important to doctors,
dentists, biochemists and mathematicians alike. This study will attempt to show
that through the use of computer-aided design training a student's visualization
skills can be improved.
Background
Gifted Education
Gifted and talented children are those identified by professionally qualified
persons as students who, by virtue of outstanding abilities, are capable of high
performance. These are children who need unique educational programs and

services beyond those normally provided to realize their contribution to self and
society. Children capable of high performance include those with demonstrated
achievement and/or potential ability in any of the following areas: (a) General
intellectual ability, (b) Specific academic aptitude, (c) Creative or productive
thinking, (d) Leadership ability, (e) Visual and performing arts.
Since the beginning of gifted education, there have been research studies
conducted to ascertain in which areas, and to what extent, gifted children are
superior to other children of the same age group. The results of these
investigations have contributed to the knowledge in the field of gifted education.
These studies have led to further research, and impacted on the definition of
giftedness. With the growing awareness that quality education is an
enhancement both for the individual and for society comes the realization that
there remains much to learn about the nature of giftedness (Wright, 1984).
During the researcher's review of literature it was found that the gifted and
talented student is often unchallenged in today's high school program. Many
teachers insist on giving the gifted student more work to complete rather than
giving the student quality assignments. These quality assignments should allow
the gifted students to dig deeper into the subject rather that give them more of
the same material.
The approach to gifted teaching models and curriculum was once limited
to acceleration, grouping, early admissions, or grade skipping. The current
emphasis is on how gifted students learn best and what goes on in the
classroom. More emphasis is placed upon skills, divergent thinking, and the
learning environment. Educators have become increasingly aware that the key
elements in planning for gifted children are: (a) a definition of giftedness that

includes a suitable procedure for identification, (b) an assessment of the
children's needs, (c) aclearly stated goal or purpose, (d) a means of achieving
the goal, (e) a plan of action that addresses teaching strategies, content and
skills, and (f) an evaluation plan (Johnson, 1987).
The gifted student is not always challenged. Even though they may have
highly developed abilities, like spatial visualization skills, they may never have
had the chance to put those abilities to work. In this study the researcher strived
to make the students reach for the outer boundaries and put their spatial
visualization skills to practice.
Spatial Abilities
Spatial Visualization -- is the ability to imagine the rotation of depicted
objects, the folding or unfolding of flat patterns, the relative changes in position
of an object in space, or the motion of machinery (Guilford & Lacey, 1947).
Spatial ability is discussed in psychometric factors and information-processing
research. Review of major psychometric studies suggests two major spatial
factors: spatial relations and spatial visualization ability. In this study, the
researcher will concentrate on spatial visualization skills.
The effective use of spatial information is one aspect of human cognition,
and is manifested in situations ranging from navigating through one's
environment to determining the trajectories of approaching objects. These skills
are also required in intellectual endeavors ranging from problem solving in
engineering and design to physics and mathematics. Some argue that the ability
to think in three dimensions is essential to be a successful engineer or scientist.
Others see the gradual implementation of computers taking over the three-
dimensional work and gradually phasing out the need for human intervention.
Still others see the ability to utilize three dimensions to be too difficult for many
working drafters and engineers.
Research has shown that spatial skills can be taught by formal
instructional processes. In high school geometry, one typically teaches two-
dimensional spatial relationships, and occasionally three-dimensional material is
used. Studies indicate that exposure to geometric relationships and concepts
improves the spatial skills of students (Brinkmann, 1966). Other studies have
shown that the teaching of spatial skills in other disciplines such as science
(Cohen, 1982) and mathematics (Anglin, 1982) improves the student's spatial
abilities. There appears to be a strong correlation between spatial skills and
success in science, mathematics, and problem solving (Fennama, 1983).
The research indicates that developing spatial skills is important to
students. Improving the instructional setting used to teach these skills is,
therefore, equally important. Two-dimensional representations of the world
abound in books, magazines, on television and computer screens. Teaching
students the spatial skills to move conceptually from the two-dimensional to the
three-dimensional world is important. Of equal importance is moving from the
three-dimensional world to its two-dimensional representation.
Bodner, McMillen & Greenbowe (1983) examined the relationship
between students' relative ability in visual-spatial tasks, their verbal and
numerical skills and to their performance in various phases of an introductory
college chemistry course. The findings suggest that visualization skills play a
positive role in chemistry achievement.

Spatial visualization is a critical ability that is latent in everyone. This
ability is essential for individuals desiring to enter the fields of engineering and
design, medicine and other occupations that require a person to visualize
spatially.
Computer-Aided Design
Computer-aided design (CAD) involves using computer hardware and
software to manipulate visual stimuli on the computer screen. CAD can refer to
any kind of activity that uses a computer to aid in the creation, modification,
presentation, and analysis of a design. Also, a CAD system is defined as a
design software/hardware package that uses interactive computer graphics
(Majchrzak, Chang, Barfield, Eberts & Salvendy, 1987). This manipulation was,
and still is done to some degree using traditional drafting equipment. With
traditional drafting it was nearly impossible for someone who was not a trained
drafter or engineer to visualize how an object might look if it was modified in
length or height. With the advent of CAD nearly everyone can look at a
computer generated image and get a better understanding of how the image
would look if it were modified in some way. CAD can help people gain a better
understanding of complex shapes through the use of dynamic rotation (spinning
the object about a center point), level management and attribute modification
(changing the entities color or line weight, etc.).
Before the development of modern 3-D CAD programs, a physical model
was difficult to make and to modify. The most effective way to convey the
designer's idea was through a drawing. Since a designer was limited to working

in 2-D, engineers developed drafting rules to represent details of 3-D objects on
paper by presenting three projected views. Long lead times for manual drawing
preparation were an accepted fact. Inevitably there was always the potential for
human error in conveying and interpreting the sketches and the final drawings
(Majchrzak et al., 1987).
One of the main advantages of a CAD system is to shorten the lead time
for drafting. It is much faster and easier for a draftsperson to enter, modify, and
plot a drawing with CAD. However, for CAD to be most effective, it must result in
improved performance, improved human interactive system design, improved
organizational factors, and reduced stress.
The way the CAD operator processes information can be summarized as
occurring in four steps: (a) attending to graphic stimuli and alphanumeric
information which appears on the screen. (b) recognizing familiar patterns such
as geometrical shapes, and acquiring and integrating new information. (c)
assessing the design with respect to the needed alterations. (d) deciding ona
response such to change or keep the design.
Not only has CAD cut the production time required to complete set of
drawings, it also has enabled draftsmen, designers and other individuals to
process visual information faster. By processing this visual information faster the
individual can decide on drawing modifications without having to modify the
existing paper copy each time a change is made.

Drawing Training and Spatial Visualization
In engineering and architectural education, formal drawing skills have
traditionally been taught-both for visual communication and to improve spatial
visualization. Also, design tasks are a more efficient and relevant way of
achieving the latter goal.
Studies have demonstrated improvement in spatial ability with training.
Training by routine offerings of mechanical drawing or solid geometry courses
does not have the desired effect on space visualization test scores. There has
been, however, no attempt to relate a specific training task to improvement in
one rather than another of the sub-factors of spatial ability. Only in one study
conducted in 1954 were two instructional procedures compared, in an attempt to
determine which would lead to the greatest improvement in spatial ability.
Brown (1954) conducted a study with the broad hypothesis that increases
in spatial ability test scores-associated with training in drawing skills are specific,
and closely related to test item and training content similarity. Subjects were
divided into experimental and comparison groups. The Experimental Group
followed a six-week drawing course, while the comparison group completed a
program of the analysis of architectural form. The two groups were compared
on their posttest scores for five levels of spatial ability. The reported results did
not indicate that a training exercise specifically intended to improve drawing
skills was superior for improving visualization and spatial orientation over a
conventional architectural design program-except in relation to material highly
specific to the training situation. There has been a tendency to imply that
because some spatial tests measure visualization and because visualization is a

highly desirable ability in engineers, architects and other designers, then any
method of training that produces increments in scores on these spatial tests also
produces improvements in powers of visualization. This is a broad inference
which only holds up if visualization is all that the spatial tests in question
measure.
Training and practice is crucial to developing the critical spatial
visualization skills a person needs to survive in today's technological society.
Training in specific spatial visualization exercises will help the students in this
study to picture and comprehend complex visual stimuli found in many of today's
jobs and occupations.
Purpose of the Stud
The purpose of this study was to determine the effect of training in
computer-aided design (CAD) on the spatial visualization abilities of selected
gifted adolescents. Previous research findings (Blade & Watson, 1955;
Brinkman, 1966; Carpenter, Brinkman & Lirones, 1965; Myers, 1951) have all
reported significant gains in test results when training for spatial visualization
ability.
Research Hypothesis
The following major research hypothesis was tested: Subjects receiving
instruction in Computer-Aided Design will show improvement in spatial

visualization skills, as measured by the Revised Minnesota Paper Form Board
(RMPFB) test, when compared to the subjects not receiving CAD instruction.
Significance of Study
Researchers have identified and studied spatial skills, and used this
information to predict job success. Spatial skills can also be correlated with
relative expertise in disciplines like mathematics and science. Spatial skills can
be improved, and these abilities have been correlated with problem-solving
abilities in other disciplines.
Studies have shown that lack of spatial abilities can hinder a person's
vocational pursuits and may hinder a subject's creative potential. Thus, spatial
skills are important to an individual's success at negotiating the world at both the
microspatial and macrospatial level. Because of their importance, further study
of spatial skills, particularly in the areas of their acquisition and refinement in an
educational setting, is of fundamental importance (Yates, 1988).
How well can one visualize solid objects from looking at flat paper plans?
How well can one think in three dimensions? Spatial visualization measures the
ability to "see" a finished object before it is built, just by looking at the drawings.
This ability makes some kinds of mathematics (solid geometry for example)
easier.
People who have limited spatial visualization ability, may view an
architect's plans for a house, or an engineer's plans for a bridge as nothing more
than several flat drawings. However, a person who does well in this area could
look at those same plans and "see" the finished house, bridge, or machine. He

or she could probably “walk" around the finished structure mentally, and "see" it
from various angles.
People who do well in spatial visualization will have an advantage in jobs
such as drafting, architecture, mechanical engineering, die-making, and building
construction. A good machinist, carpenter, dentist, or surgeon also needs this
Skill.
The utilization of visual imagery as an intellectual mode of thought
processing has been suggested as the most viable method of mental information
processing for dealing with spatially manipulated objects and events or
nonverbal modes of thought (Lolla, 1973). Many teachers, if not all, are unaware
of how to effectively teach spatial visualization skills. The field of education
abounds with information and activities relevant to the area of spatial
visualization and is an appropriate area to initiate a study of this type.
Assumptions of the Study
The following methodological assumptions are implicit to this study:
a) The instrument was reliable and valid for the purpose of this study.
b) The treatment had an equal effect on all subjects.
c) The pretest accounted for the differences in the subjects that existed
before the onset of the study.
d) The variability in time in which the students completed the exercises
did not have an effect on the outcome of this study.
10

Limitation of the Study
The following limitation must be considered for all data derived from this
study:
a) The length of the treatment was for two hours a day, five days per
week for three weeks.
Delimitation of the Study
The following delimitation imposes constraints upon the ability to
generalize from this study:
a) This study was delimited to the population of 50 males and females
students participating in the 1991 Virginia Governor's School of Technology at
Virginia Polytechnic Institute and State University.
Definition of Terms
The following terms were used in this study to assist the reader:
Gifted -- means children and, whenever applicable, youth who are
identified at the preschool, elementary or secondary level as possessing
demonstrated or potential abilities that give evidence of high performance
capabilities in areas such as intellectual, creative, specific academic, or
leadership ability, or in the performing or visual arts, or who by reason thereof,
require services or activities not ordinarily provided by the school (PL 95-561,
Section 902).
11

RMPEB -- is an aptitude test designed to measure mechanical aptitude
and the related spatial abilities generally required in mechanical oriented
vocations (The Psychological Corporation, 1970).
CAD -- Computer-aided design describes any system that uses a
computer to assist in the creation or modification of a design.
Three-Dimensional -- is an image or object which has height, width, and
depth.
Two-Dimensional -- is an image or object which has height and width.
Spatial Relations -- is the capacity to transform objects rapidly "in the
minds eye" as is required when one "mentally rotates" an object about its center
(Shepard & Cooper, 1982).
Spatial Visualization -- is the ability to imagine the rotation of depicted
objects, the folding or unfolding of flat patterns, the relative changes in position
of an object in space, or the motion of machinery (Guilford & Lacey, 1947).
Spatial Orientation -- is the comprehension of the arrangement elements
within a visual stimulus pattern, the aptitude to remain unconfused by the
changing orientations in which spatial configuration may be presented, and the
ability to determine spatial orientation with respect to one's body (McGee, 1979).
12

CHAPTER 2
Review of Related Research and Literature
Introduction
The three parts of this study are the gifted student, spatial visualization
ability, and computer-aided design. Each of these parts makes up an integral
and interrelated part of the study. Can computer-aided design improve spatial
visualization? Specifically, can it accomplish this in gifted students, who may
already have a high degree of spatial visualization ability? What is computer-
aided design? How important are spatial visualization skills?
In this chapter the researcher will relate the applicable literature pertaining
to these three components.
The Gifted Child
The gifted student is attracting an increasing amount of recognition as a
distinct student subpopulation (Porter, 1982). A 1971 report on the gifted and
talented by the U.S. Office of Education reviewed related research on the gifted
and talented. It documented the special needs of this group and offered a
conservative estimate that there were 1.5 to 2.5 million gifted and talented
children out of a total elementary and secondary population of 51.6 million. At
that time, fewer than 4 percent of those gifted were benefiting from then existent
school services (Correll, 1978). In the late 1980s, the gifted estimate was placed
13

at 300,000 to 450,000. The population was still without appropriate educational
identification and programming efforts (Davis & Rimm, 1985; Whitmore & Maker,
1985)
Students recognized as gifted display a number of traits indicative of high-
potential. Wright (1984) outlines some general characteristics associated with
gifted and talented students.
1. Shows superior reasoning powers and marked ability to handle ideas;
can generalize readily from specific facts and can see subtle relationships; has
outstanding problem-solving ability.
2. Shows persistent intellectual curiosity; asks searching questions;
shows exceptional interest in the nature of man and the universe.
3. Has a wide range of interests, often of an intellectual kind; develops
one or more interests to considerable depth.
4. Is markedly superior in quality and quantity of written and/or spoken
vocabulary; is interested in the subtleties of words and their uses.
5. Reads avidly and absorbs books well beyond his or her years.
6. Learns quickly and easily and retains what is learned; recalls important
details, concepts and principles; comprehends readily.
7. Shows insight into arithmetical problems that require careful reasoning
and grasps mathematical concepts readily.
| 8. Shows creative ability or imaginative expression in such things as
music, art, dance, drama; shows sensitivity and finesse in rhythm, movement,
and bodily control.
9. Sustains concentration for lengthy periods and shows outstanding
responsibility and independence in classroom work.
14
10. Sets realistically high standards for self; is self-critical in evaluating
and correcting his or her own efforts.
11. Shows initiative and originality in intellectual work; shows flexibility in
thinking and considers problems from a number of viewpoints.
12. Observes keenly and is responsive to new ideas.
13. Shows social poise and an ability to communicate with adults ina
mature way.
14. Gets excitement and pleasure from intellectual challenge; shows an
alert and subtle sense of humor.
Research on creative/productive individuals has shown consistently that
although no single criterion can be used to measure giftedness, persons who
have achieved recognition because of their unique accomplishments and
creative contributions possess a relatively well-defined set of three interlocking
clusters of traits. These clusters consist of general ability, creativity, and task
commitment (Renzulli, Reis & Smith, 1981). It is important to point out that,
according to Renzulli, Reis, and Smith, no single cluster makes giftedness - but it
is the interaction of the clusters that makes one gifted.
Giftedness is a biologically rooted concept, a label for a high level of
intelligence that results from the advanced and accelerated integration of
functions within the brain, including physical sensing, emotions, cognition, and
intuition. Such advanced and accelerated functions may be expressed through
abilities such as those involved in cognition, creativity, academic aptitude,
leadership, or the visual and performing arts. Therefore, with this definition of
intelligence, gifted individuals are those who are performing, or who show
promise of performing, at high levels of intelligence (Clark, 1983).
15

Giftedness has expanded in terms of skill, intellectual ability and talent.
There still remains a strong emphasis on IQ tests and some new emphasis on
the ability of the teacher to identify the gifted child. |Q tests are acceptable in all
circles because they are well-developed in terms of measurement and tap the
memory, association and reasoning abilities crucial to high performance in
school-related activities. Experts in the field such as Guilford (1968) and Getzels
and Jackson (1962) expressed concern about the use of IQ tests as the single
measure for identification of the gifted. Gallagher (1975) points out that |Q
scores actually yield two different kinds of measures, both of importance. First
they give some indication of the current mental level of the child in comparison
with the child's own age group; second, they make a prediction of the rate of the
child's mental growth in the future. The predictive power of the |Q score for
future academic attainment remains impressive and influential in educational
circles (Johnson, 1987). Thus, students identified as exceptionally gifted
intellectually, traditionally are evaluated by means of IQ or achievement tests.
Gifted and talented children are those identified by professionally qualified
persons who by virtue of outstanding abilities are capable of high performance.
These are children and youth who require differentiated educational programs
and services beyond those normally provided by the regular program in order to
realize their contribution to self and society. Children capable of high
performance include those with demonstrated achievement and/or potential
ability in any of the following areas:
1. General intellectual ability
2. Specific academic aptitude
3. Creative or productive thinking
16

4, Leadership ability
5. Visual and performing arts
6. Psychomotor ability (Marland Report 1972)
General intellectual ability or talent is defined in terms of a high
intelligence test score, usually two standard deviations above the mean, on
individual or group measures. Parents and teachers often recognize students
with general intellectual talent by their wide-ranging fund of general information
and high levels of vocabulary, memory, abstract word knowledge, and abstract
reasoning. Specific academic aptitude or talent is identified as outstanding
performance on an achievement or aptitude test in one area such as
mathematics or language arts.
Creative and productive thinking is the ability to produce new ideas by
bringing together elements usually thought of as independent or dissimilar, the
aptitude for developing new meanings that have social value. Characteristics of
creative and productive students include openness to experience, setting
personal standards for evaluation, ability to play with ideas, willingness to take
risks, preference for complexity, tolerance for ambiguity, positive self-image, and
the ability to become submerged in a task.
Leadership ability can be defined as the ability to direct individuals or
groups to a common decision or action. Students who demonstrate giftedness in
leadership ability use group skills and negotiate in difficult situations. Many
teachers recognize leadership through a student's keen interest and skill in
problem solving. Leadership characteristics include self-confidence,
responsibility, cooperation, a tendency to dominate, and the ability to adapt
readily to new situations.
17

Students gifted in the visual and performing arts demonstrate special
talents in visual art, music, dance, drama, or other related studies. Psychomotor
ability involves kinesthetic motor abilities such as practical, spatial, mechanical,
and physical skills. It is seldom used as a criterion in gifted programs.
There are many proponents who feel that a statistically exceptional |Q
score is in itself sufficient manifestation of giftedness (National Report on
Identification, [NRI], 1982). Many others, however, feel that there are restrictions
associated with the reliance on a single test score as a definition of giftedness.
In the National Report on Identification (1982), the authors stated that
"giftedness is not a single isolated phenomenon, but a complex interpretation of
many factors . . . Certainly it should not be reduced to merely a score on a test"
(p.22).
Guilford (1968, p.22) wrote that high IQ scores "select in" children but also
“select out" children. He further stated that IQ tests have led us into
complacency as they sample little more than routine mental operations and give
students little opportunity to show what they can do in creative ways. Guilford's
concern about the restrictive nature of IQ tests is echoed by Getzels and
Jackson (1962) who state there are three severe limitations to be kept in mind.
First, the common intelligence test does not sample the complete range of
cognitive abilities. In fact, the items on the intelligence test seem to represent a
rather narrow bank of intellectual tasks, relying chiefly on those tasks requiring
“convergent thinking" rather than those tasks requiring "divergent thinking."
Students must be able to recall and to recognize, perhaps even to solve; but
need not be able to invent or create.
18

Second, Getzels and Jackson state it is commonly observed that many
children who are very high in intelligence as measured by IQ, are not
concomitantly high in such other intellectual functions as creativity and many
children who are not concomitantly high in intelligence as measured by IQ, are
high in creativity.
Third, the |Q metric has been particularly immune to advancement in our
thinking and behavior. The conceptual base of the intelligence test is often
measured by its correlation with an old intelligence test. That is, "the new test
must measure the same mental processes as the old test" (p.3).
There is a more fundamental problem with the reliance on IQ scores to
define exceptional intellectual ability. There are those who believe that the
culturally different, disadvantaged, underachieving, and handicapped students
are screened out by this process (Hilliard, 1983; Richert, 1983). Studies of the
Stanford-Binet show that the test is weighted heavily with verbal reasoning ability
(Davis & Lesser, 1959; French, 1951). In practice, children who are selected for
admission to an intellectually gifted program are outstanding in regard to verbal
reasoning ability.
Smith (1965) in a research project for the U.S. Office of Education
investigated relationships of |Q, achievement, sex and race to socioeconomic
position and found that upper socioeconomic status children are more efficient
when a verbal product is expected. Lower socioeconomic status white children
are most effective when the product is nonverbal. Consultants convened for a
conference on identification procedures in May, 1981, stated that intelligence
tests represent an indication of ability to do academic work. They also stated
that the tests tend to be weighted toward verbal competence and as a result,
19
cultural and language backgrounds could negatively affect |Q scores (Wright,
1984).
Hallahan and Kauffman (1982) report that when IQ is used as the sole or
primary criterion for giftedness, it has been found that more gifted children will
come from homes of higher socio-economic status, have fewer siblings, and
have better educated parents. Although giftedness occurs in all socioeconomic
strata, it is clear that gifted children are not distributed equally across all social
classes, at least when IQ is the primary means of identification (p. 380).
Harrington (1982) wrote that approximately 95% of all children presently
identified as gifted can be subsumed under the category of "intellectually gifted"
or “children with specific academic abilities." In part, this may be due to the
efficiency of the definition. That is, children may be identified via this method
due to the relative accuracy of the instruments commonly used - the Stanford-
Binet and the WISC-R. As Hallahan and Kauffman (1982) relate, the individually
administered intelligence tests remain the most reliable, definable single means
of identifying the gifted. 1Q, too, seems to be a reliable indication of rate of
academic learning as found in the Talent Search conducted through John
Hopkins University.
The Scientific and Mathematically Precocious Youth (SMPY) program
allows students to proceed as fast as they wish. The rate of learning is highly
accelerated and students demonstrated continued high levels of academic
achievement (George, 1979). The rate of learning finding is collaborated by
Petzold (1959) who compared children of average musical ability with sixth
grade musically gifted children. Petzold found that the gifted students learn the
tasks at a superior rate. Osen (1973) conducted a study to determine if there
20

was a direct relationship between IQ and reading achievement and found that
reading achievement increased in direct relationship to IQ.
Yet another definition of giftedness is put forth by Robert Sternberg (1984)
suggests that giftedness is a kind of mental self-management. The mental
management of one's life in a constructive, purposeful way has three basic
elements: adapting to environments, selecting new environments, and shaping
environments. According to Sternberg, the key psychological basis of
intellectual giftedness resides in insight skills that include three main processes:
1) separating relevant from irrelevant information, 2) combining isolated pieces
of information into a unified whole, and 3) relating newly acquired information to
information acquired in the past.
Sternberg emphasized problem-solving abilities and viewed the gifted
student as one who processes information rapidly and uses insight abilities.
Howard Gardner (1983) also suggested a concept of multiple intelligences,
stating that there are several ways of viewing the world: linguistic,
logical/mathematical, spatial, musical, bodily-kinesthetic, interpersonal, and
intrapersonal intelligence. Joseph Renzulli (1980) stated that gifted behavior
reflects an interaction among three basic clusters of human traits: above-
average general and/or specific abilities, high levels of task commitment
(motivation), and high levels of creativity. According to Renzulli, gifted and
talented children are those who possess or are capable of developing this
composite of traits and applying them to any potentially valuable area of human
performance. Growing Up Gifted listed characteristics under five major
headings: cognitive (thinking), affective (feeling), physical, intuitive, and societal
(Clark, 1983).
21
With the new research in brain/mind function, a different definition for
giftedness becomes possible. Intelligence can no longer be confined to
cognitive function, but clearly must include all of the functions of the brain and
their efficient and integrated use.
Gifted Learning Styles
The improvement of learning and the educative process has been and still
is the focus of various theories, strategies, and research studies. Learning style
theories and approaches are among attempts for improvement that were
examined in the early 1980's (Alliotti, 1981; Cafferty, 1980; Dunn & Price, 1980;
Griggs & Price, 1980; Pizzo, 1981; Stewart, 1981; Wasson, 1980). The term
learning styles refers to the modes and/or environment(s) in which individuals
learn most effectively and efficiently.
Lewin's (1935) formula derived for behavior, B = f(P,E), states that
behavior is a function of the person and the environment. Hunt's (1971)
translation of this formula into educational terms is that the accomplishment of
the educational objective depends upon the effect of the educational approach
on the individual learner. The focus of the "educational approach" is viewed
differently in various theories. Kolb (1976) and Allliotti (1981), Olson (1978),
Torrance and Mourard (1979) among others consider learning styles as a
cognitive function. Renzulli and Smith (1978) and others consider learning styles
as an instructional strategy function.
The instructional strategy approach has appeal for teachers because of its
possible application in the classroom. Several research studies related to the
22

teaching strategy approach (Domino, 1971; Dowaliby & Schumer, 1973; Smith,
1976; Yando & Kagan, 1968) indicate that students do achieve significantly
better when taught in a manner consistent with their preferred learning styles.
Even though the learning style strategies used in these research studies were
varied and selective, the results are significant and show the need to select the
most effective strategies as the basis for learning style identification.
Stewart (1981) discovered that learning style preferences were influenced
by certain other factors - grade level, gender, favorite subject, |Q, and strongest
achievement area and that there was some preference among gifted children for
instructional methods which emphasized independence (independent study,
discussion).
With an increased national interest in education of the gifted (Passow,
1981) have brought changes not only in the definition and methods of
identification of the gifted but also in the planning of curriculum and instruction
(Treffinger, 1982). Since the current educational and social view tends to
emphasize the multifaceted dimensions of giftedness in interaction with the
environment and the learning process, the gifted are no longer viewed as a
single homogenous group. Thus, it has become necessary to view their needs
differently and relate indicators of behavior to educational planning (Feldhusen,
1982, Treffinger, 1982).
A study by Ricca (1984) investigated unique patterns in learning style
preferences among gifted students. The results of this study yielded significant
differences between gifted and general population students pertaining to
preferences for learning styles utilizing The Learning Style Inventory of Dunn,
Dunn, and Price (1981). The gifted students, more than the general population,
23

were found to be more highly motivated, persistent, responsible, adult and
teacher motivated, preferred learning alone and tactile learning. The general
population, as compared to the gifted students, demonstrated a greater
preference for structure, peer oriented learning, learning in several ways,
auditory learning, visual learning, mobility, and learning with authority figures
present. The general population also demonstrated a greater tolerance for late
morning learning and more neutrality to time needs than did gifted subjects.
Learning Style and Classroom Implications
Those who favor a learning style approach have found many specific
classroom applications for their work. One of the most noteworthy is Bernice
McCarthy (1980), who developed the 4Mat system of teaching based on the
work of David Kolb (1976). McCarthy recognized classroom reality by
acknowledging that no one teacher can accommodate the styles of all students
simultaneously. Instead, she developed an eight-step teaching sequence that
addressed Kolb's (1976) four quadrants and, additionally, right and left
hemispheric functioning. In 4Mat, the lesson is, like treatment, introduced
through an experiential activity that is designed to integrate the new material with
previous experience (the affective, personal application needs of Kolb's diverger
type are best served by this phase). Facts and concepts are then presented (the
lecture phase) to expand on the introduction and address the assimilator's
"watching" needs. The third phase consists of hands-on practice and
application, which best suit the converger. Finally, analyzing the concept and
applying it in new, more complex situations matches the strength of the
24

accommodator group. While persons in each style group are most comfortable
and like best those activities aimed at their group, they are able to function quite
well with the two adjacent styles. It is only when the activities of the opposite
styles (i.e., diverger-converger and assimilator-accommodator) are in progress,
that lack of interest or difficulty may arise. It is McCarthy's contention that
accommodating all of the people three-quarters of the time is preferable to
teaching primarily in and two one's own style and neglecting the needs of the
other three quadrant types.
Myers and McCaulley (1985) reporting on The Myers-Briggs Type
Indicator (MBTI) (Briggs & Myers, 1977) suggested that optimum classroom
learning can take place when teachers and students are aware of their own
types and when classroom options are developed for each. This was also
supported by Silver and Hanson (1980) in interpreting their own instrument, the
Learning Preference Inventory (LPI) (Silver & Hanson, 1978). Teachers can
accommodate type variations in the classroom by providing opportunities for
different working conditions and a variety of assignments or reporting methods.
Comparing introverts and extroverts, the former would tend to choose individual
projects and working alone, while the latter would prefer group-oriented tasks
and discussions. Sensors prefer practical, hands-on activities, while intuiters
want imaginative, open-ended, more complex challenges. Thinkers are
attracted by routine, logic, theories, and structure, while feelers need people-
oriented, interactive projects. Finally, judgers need structure, routine, and self-
control, while perceivers prefer spontaneity and many activities progressing at
once.
25

Functioning With and Aqainst Type
In addition to providing varying classroom opportunities, two other
questions arise when dealing with the gifted. First, to what extent should
children be required to function against type? Second, if teachers and students
are very different in style, is it possible that children are labeled as uncooperative
and unrealistic if they rebel when consistently confronted with "against type"
activities and assignments?
The former question was a concern after research revealed that the
predominant type for gifted children is NF (intuitive, feeling) (Hoehn & Bireley,
1988). Given the ST practical, precise nature of the basic skills curriculum and
the percentage of teachers who are sensors (nearly half of elementary and
about 42% of high school instructors, according to Myers & McCaulley, 1985), it
is little wonder that a frequent complaint about gifted students is that they resist
completing basic skill assignments. Indeed, releasing some students from
regular classes for attendance in gifted pullout programs causes dissension
because regular class teachers perceive these children as "lazy," resistive non-
workers, who could not possibly be "gifted." In the gifted classroom, these same
children often become highly creative dynamos. From a learning style
framework, the better match of the typical gifted child's style preferences and the
more open-ended, individualized curriculum of the pullout program are
understandable explanations for difference. Nevertheless, around 80% of the
typical gifted child's school time and much of adult life consists of against type
(that is, routine) action. Gifted children need to be counseled about this
phenomenon and the necessity for all of us to learn tolerance for "boring"
26

activities. On the other hand, denying such a child access to the gifted program
on the basis of non-productivity in the regular class should be considered
carefully and applied in only the most extreme cases.
Secondary students appear to be less at risk for the scenario described
above. Through a wider selection of courses and extracurricular activities, most
style differences can be accommodated, given reasonably good teaching.
However, if experiences in elementary school have been negative, attitudes
toward education and learning may continue to have implications during the high
school years. Turned-off underachievers may not develop the academic record
and knowledge base needed to pursue later career choices without remediation.
Others may continue to struggle against the system and go unrecognized as
gifted throughout their secondary school years.
While the general population is about 75% extraverted, the reverse is true
of gifted persons (Myers & McCaulley, 1985) Introverted gifted persons can,
predictably, become their own worst enemies. Similarly, the sensing
predominance of the general population (75%) contrasts with a similarly high
percentage of gifted intuiters. This practical, "now" orientation of the sensers
versus the possibility, future orientation of the intuiters can provide the basis for
a productive team effort or can be a significantly diverse force. The gifted
student who feels different or who can find few people who “understand what I'm
talking about" may be reflecting frustration associated with the rarity of intuitive
peers.
27

Right and Left Brain Dominance
Research on the right and left brain function began on animals with Dr.
Roger Sperry during the 1950s. Human brain operations were conducted in the
1960s by neurosurgeons Vogel and Bogen in cooperation with Sperry. A series
of subtle and ingenious tests were devised to attempt to find out what was going
on in the separate hemispheres. The results showed that the two hemispheres
process information differently. It has long been known that the functions of the
two hemispheres were different. Speech resides in the left brain and spatial
ability in the right (McCarthy, 1980). But what was not known was that in
processing information and stimuli, the left brain does a lineal type of processing,
a sequential type, while the right brain uses global process in which data is
perceived, absorbed, and processed even while it is in the process of changing.
As Bogen (1975) stated, these differences in how the two brains process
information are the most significant differences between the right and left
hemispheres. Another equally important finding was that in the split-brained
patient, there seems to be two different people up there, each with his or her
favorite ways of processing information, each with a different way of thinking.
That means that rather than being a half-brained species, we are two-brained
species, each having its special mind (Levy, 1980).
What we as educators need to do is develop teaching methodologies
which effectively teach to both modes (McCarthy, 1980). The brain dominance
researchers have pointed the way. Sperry (1973) stated that there appear to be
two modes of thinking, verbal and non-verbal, represented rather separately in
the left and right hemisphere. Our educational system, as well as science in
28

general, tends to neglect the nonverbal form of intellect. What it comes down to
is that modern society discriminates against right hemispheres (Sperry, 1973).
According to McCarthy (1980) school is for the left brain, schools do not teach to
the right brain.
Spatial Visualization
Spatial visualization is the ability to deal with complex visual problems that
require imaging the relative movements of internal parts of an image (Pellegrino,
Hunt, Abate, & Farr, 1987). What people "see" when they look at an external
object is dependent upon who they are and what they are interested in at the
moment. A layman "sees" a metal cube as a solid. This is one level of reality, a
reality based on sensory model. Experience in relating what an individual "sees"
to what he feels with this sense muscles, as well as training, and practice can all
improve visualization.
Visualization. We often hear this word in the descriptive geometry
classroom as well as in engineering work. What does it mean? We cannot ask
this question without also thinking of several others. Is the ability to visualize
subject to training or is it something unchangeable, like the length of your arm?
What relation exists between this ability and a course in descriptive geometry or
other engineering subjects? Finally, how is visualization ability measured? The
answers to these questions are necessary if our students are to get the greatest
possible benefit from their study of descriptive geometry, engineering drawing,
and computer-aided design (Blade, 1949).
29
Webster says that to visualize is to form a mental image of something not
before the eye; to picture mentally. To engineers the word means not only to
form a mental picture but also to manipulate these pictures mentally. Therefore,
visualization means a dynamic as well as a static mental picture.
The ability to rotate objects mentally and change their dimension and
scale requires a person to have developed some type of spatial schema. This
schema or framework, as described by Minsky (1975), would carry a data
structure based on a stereotyped situation including default assignments.
Adjustments, according to Piaget & Inhelder (1971), are either in the form of
accommodations (transformations induced in the subject's existing framework)
or assimilation (transformation of the object to correspond with the existing
framework).
Ekstrom, French and Harman (1979) defines spatial visualization as the
ability to manipulate or transform the image of spatial patterns into other
arrangements. It requires either the mental restructuring of a figure into
components for manipulation or the mental rotation of a spatial configuration in
short term memory. It also requires performance of serial operations, perhaps
involving an analytic strategy.
To prove this, a person is shown a two-dimensional representation of a
box, and each brace of the box has a figure on it. The subject is then asked to
fold mentally and rotate the box. This skill requires visualization abilities. Tests
used to evaluate this skill often require a person to mentally fold a two-
dimensional representation of a box and compare it to several other boxes that
are shown as three-dimensional representations.
30

French (1965) defines spatial orientation as an ability to perceive spatial
patterns accurately, to compare them with each other, and to remain unconfused
by the varying orientations in which a pattern may be presented. For example, a
person may be asked to compare the spatial orientation of a table in one picture
to that of the same table in another picture where the table is in a different
position. The person is asked to indicate the difference between the two
pictures. This requires the ability to see a change in the relative pattern or
orientation of objects in the two pictures.
Persons differ in their skill to manage spatial information. The level of
sophistication of a person's spatial skills, according to Piaget and Inhelder
(1971), depends on a person's ability to (a) think abstractly, (b) operate within
a coordinate (XYZ) system of reference, and (c) use Euclidean measurements.
Bruner, Oliver and Greenfield (1966) say it also requires an iconic mode of
mental representation.
The studies done by Piaget, involving his own children, indicate three
spatial stages during the development period: practical, subjective, and
objective (Piaget, 1971). Piaget believed that the child progressed from a
categorical to a relativistic concept of objects in space. In the Piagetian view, a
child at one stage recognizes "larger" and "smaller" as mutually exclusive
attributes. Therefore, the child cannot solve inference problems based upon the
constructs of larger and smaller. Only after children have entered a relativistic
stage can they solve such problems. However, Bryant and Trabasso (1971)
have shown that children at the categorical stage can solve problems thought
only to be solvable by children at the relativistic stage. Paris and Mahoney
(1977) have demonstrated that children derive inferred spatial relationships
31

among linguistically and pictorially presented objects and then integrate these
relationships into memory. At what age, however, they acquire such abilities is
not clear and the conflicting views expressed by Piaget (1971), Bryant and
Trabasso (1971), Paris and Mahoney (1977) and others have not been resolved
(Cohen, 1985).
Currently there are three general theories as to how the brain sees mental
representations of spatial relations (McNamara, 1986). The first general theory
is a “nonhierarchical theory." It proposes that networks or image-like formats
portray spatial representations. The essence of this view is that there is no
hierarchical structure to mental representations but that each image, however it
is stored, has the same representational value. This means that the
representational structure of mental images has the same priority in the visual
network.
The second general theory is the "strongly hierarchical theory." It
suggests that different representational levels exist in the propositional network
such that a lower level represents a finer grained representation than a higher
level. In this type of propositional network the spatial relations between images
stored in mental networks must be inferred from higher order spatial knowledge.
For example, the representation of spatial relations between two rooms ina
house is a subset of an image of the entire house. Stored are only the spatial
relations needed to represent the layout of the house. The specific details of the
locations of each room relative to other rooms are inferred and then
reconstructed.
The final spatial theory is a "partially hierarchical theory." It suggests a
redundancy in the representation such that many relationships analyzed or
32

inferred are also represented explicitly in the brain. According to this theory, the
rooms of the house may be inferred as in the strongly hierarchical theory or may
be stored as images and retrieved directly, without first needing to infer the
relative positions of the rooms (Yates, 1988).
Although a clear resolution concerning these three different views is not
yet forthcoming, the bulk of current research leans toward the partially
hierarchical theory (McNamara, 1986). This means that information is encoded
at nodes of a decision tree in explicit formats that are similar to external spatial
states. Information is also retrieved through inference. For example, imagine
taking a two-dimensional representation of a three-dimensional object and in the
mind's eye rotating it to a new spatial configuration. McNamara, however,
cautions that while the theoretical problems are important, much more work
needs to be done to determine the organization of general problem knowledge in
many different domains, and how it is integrated in our cognitive network.
Additional research will help clarify the complex interconnections associated with
spatial abilities and other representational schemas.
Engineers especially need to visualize because they must solve problems
about objects which they do not have actually before them or in their hands. To
solve their problems, engineers must produce and interpret abstract symbols. It
is not enough, however, for engineers simply to visualize their problems. They
also have to communicate their solutions and to understand the solutions of
others. The means of communication is the language of graphic symbols that is,
drawing. Thus, engineers must visualize (form mental pictures), draw pictures of
objects in space according to a conventional system they learn, and understand
the pictures of other engineers in this conventional language.
33

Can a student learn to visualize? In engineering and architectural
education formal drawing skills have traditionally been taught, both as a measure
of visual communication and in order to improve spatial visualization (Blade,
1949). It is also claimed that design tasks are a more efficient and relevant way
of achieving the latter goal (Stringer, 1975).
In four previous studies which demonstrate improvement of spatial ability
with training (Blade & Watson, 1955; Brinkmann, 1966; Churchill, Combs &
Harrell, 1942; Van Voorhis, 1941) specificity in training, in relation to the criterion
task, appears to be crucial. Training by routing offerings of mechanical drawing
(Faubion, Cleveland & Harrelll, 1942; Mendicino, 1958; Myers, 1958) or solid
geometry (Ranucci, 1952; Brown, 1954) does not have the desired effect on
space visualization test scores.
Other research has shown that students can learn spatial skills by formal
instructional processes. Studies show that exposure to geometric relationships
and concepts improves the spatial skills of students (Brinkmann, 1966). Other
studies have shown that the teaching of spatial skills in other disciplines such as
science (Cohen, 1982) and mathematics (Anglin, 1982) improves the students
spatial abilities. Fennama (1983) and others have shown a strong correlation
between spatial skills and success in science, mathematics, and problem
solving.
Piaget and Inhelder (1971) suggested that daily experiences cause
accommodations in visualization ability to occur. Theoretically, therefore,
planned spatial experiences could induce changes in a person's spatial ability.
Specifically, research in both environmental and cognitive psychology has
reported improvements in spatial skills after training. Brinkmann (1966)
34

maintained that while genetics may influence some aspects of perceptual
organization, other factors, such as discrimination and judgment, are influenced
by learning. He found that college students who had participated in a three-
week programmed instruction course on spatial skills scored significantly higher
on a test of spatial relations than a Control Group. Others (Evans, Marrero, &
Butler, 1981; Evans & Pezdek, 1980; Gibson, 1953; Lord, 1985; Siegel &
Schadler, 1977) have found similar results. There is some indication that
persons at the formal operational level may benefit more from training than those
at a concrete level (Baltista, Talsm & Wheatley, 1973; Hill & Ovenauf, 1979).
In using spatial skills in large-scale environments, Evans and Pezdek
(1980) found that multiple experiences in an environment led to more flexible
use of spatial relations and more accurate placement of objects within an
environment. The mobile experience as explained by Spencer and Darvizeh
(1981) could be by (a) active movement in the environment, (b) object
manipulation, or (c) film.
Earlier studies reported that active movement was the most effective
means of gaining spatial information. Mandler (1962) reported that actions and
movements repeated endlessly become transformed into spatial images.
However, Salomon (1979) more recently found that film could simulate the
multiview experience, and therefore is a good instructional medium for spatial
cognition.
Olson and Bialystok (1983), using objects similar to those in a mental
rotation test developed by Vandenberg and Kuse (1978), found that partial
rotations were nearly as effective in teaching mental rotations as experiences. In
35

their study, subjects viewed film of objects rotating. The researchers then asked
the subjects to identify views of those same objects on paper.
Recent concerns in the areas of brain hemisphere specialization, male
and female differences in math-related fields of study, and various aspects of
computer programming have brought the study of spatial cognition to the
forefront. However, as pointed out by Arnheim (1974), public educators have
overlooked spatial skills for a long time. Although standardized tests often
contain a spatial skills section, there is little formal training in this area. Zavotka
(1987) noted a lack of spatial training while teaching interior design to college
students. Many of the students lacked the spatial skills necessary to design and
analyze simple orthographic drawings.
Wood and Beck (1976) demonstrated that these skills are susceptible to
instruction and change developmentally. The study also showed a correlation
between mapping ability and spatial ability. Lord (1985) also undertook a study
to see if spatial skills could be taught. The results suggest that the intervention
has a positive effect on spatial awareness. The ability to teach spatial skills is
also demonstrated in geometry (Brinkmann, 1966), and science (Cohen, 1983).
In the Cohen (1983) study, fifth grade science students were randomly
assigned to two groups. Each group was given activities from Science
Curriculum Improvement Study and received the same content instruction. The
Experimental Group was encouraged to move around and manipulate the
apparatus and materials provided in the different lessons. The Control Group
was not given similar encouragement. Instead they were directed not to move
around or manipulate the apparatus. The results show that the Experimental
Group did statistically better on a test of spatial skills. This research, coupled
36

with the research described above, adds strong support to the claim that spatial
skills can be taught and can improve problem-solving skills.
According to Stea and Blaunt (1973), to draw or fully interpret
orthographic views, the student must perform three tasks mentally: (a) rotate
the object to another plane, (b) change the object from two to three dimensions,
and (c) change the object's size. An interest in three-dimensional computer-
animated graphics leads us to question if they can improve one's ability to
perform these tasks and, if so, which visual stimuli would be more effective.
There is also a significant difference in spatial abilities between the sexes.
When the results of spatial tests are taken together, a difference appears
between the scores for boys and girls. The higher scores attained by the boys'
group may be due to the radical difference between the games, hobbies,
outlook, and training of the boys, as distinguished from the girls. The difference
is significant because it may indicate that spatial ability can be organized and
developed through training. Linn (1985) in her meta-analysis concluded that the
sex differences in spatial ability for mental rotation are large (one-quarter to one
standard deviation). However, less of a sex difference exists for spatial
perception and spatial visualization. Why such a wide variation in ability exists is
unclear, but the gender gap appears to widen during puberty (Best & Rabinowitz,
1982). There are, however, a few studies indicating a possibility of narrowing
the differences in spatial abilities between the sexes (Brinkmann, 1966).
Using computers to teach spatial skills is another way to improve
instruction. A study done by McClurg and Chaille (1987) indicates that the
computer can be used to improve spatial skills. This study, conducted over an
eight week period, involved computer games. It showed that students made
37
significant improvement in their spatial abilities. This study used a Control Group
that was given no direct instruction in spatial skill development. By contrast, a
study done by Yates (1988) examined an alternative method of teaching spatial
skills. The study investigated the use of paper and pencil and commercially
available materials, with a computer program called Super Factory. Super
Factory uses a strong problem-solving format to teach two and three-
dimensional spatial problem-solving skills. In this study, the use of the computer
in an instruction setting contrasted directly with an alternative method of
instruction to determine which method led to the greatest improvement in the
student's spatial abilities.
The playing of video games is also associated with improvement of spatial
skills. McClurg and Chaille (1987) found that tracking objects, along with skill in
compensating for the movement of the object in space, improves when using
Atari's Air Combat video game. Scores on video games correlated with scores
on spatial visualization tests and visual pursuit tests. That same study also
showed that using computer games could improve the spatial ability of fifth,
seventh, and ninth grade students.
Spatial skills have been identified, studied, used to predict success on
jobs, and correlated with relative expertise in disciplines like mathematics and
science. Spatial skills can be improved, and these abilities have been correlated
with problem-solving abilities in other disciplines. Lack of spatial abilities can
hinder a person's vocational pursuits and may even hinder a subject's creative
potential (Paivio, 1970). Thus spatial skills are important to an individual's
success at negotiating the world. Because of their importance, further study of
38

spatial skills, particularly in the areas of their acquisition and refinement in an
educational setting, is of fundamental importance.
There are several different theories on how spatial visualization skills are
best learned. Some think training and practice will improve the ability (Blade,
1949). Others believe that repeated visual stimuli will accomplish it (Stea &
Blaunt, 1973). Finally, still others believe a computer can be used to teach
spatial skills (McClurg & Chaille, 1987).
Computer-Aided Design
Computer-Aided Design (CAD) systems allow the user or designer (the
terms will be used interchangeably) to use the capabilities of the computer to aid
in the process of design. CAD, together with computer-aided manufacturing
(CAM) commonly called CAD-CAM is revolutionizing the way we design and
manufacture products. More and more CAD systems are implemented as
industry makes a concerted effort to raise the quality of products and the cost
effectiveness of the manufacturing process.
The CAD system consists of a user and a CAD workstation which typically
includes a color graphics display terminal, a digitizing tablet, an input device, a
printer/plotter, and a local graphics processor. The CAD workstation provides
the user with the option to perform several transformations on the figure
displayed on the CAD graphics screen (Majchrzak et al., 1987).
A frequently-used CAD option is the rotation transformation. The CAD
designer uses rotation transformation primarily to assist in visualizing the figure
being designed. Typically, a designer will rotate a figure to perform a visual
39
interference check or to evaluate the overall aesthetic qualities of the design.
The task of rotating a figure and making inferences based on that rotation
requires the processing of visual information and decisions based on how the
processed information is represented (Majchrzak et al., 1987). Spatial
reasoning, the ability to make inferences based on the information contained
within a spatial representation (Perricone, 1983), is an important aspect of the
visual information processing task for CAD.
Many everyday problem-solving tasks depend on knowledge of spatial
structures and relationships, either explicitly or implicitly. Perceptual and
cognitive processing skills are especially important for CAD tasks. This is
because the interaction between the designer and CAD system is primarily
visual and cognitive. That is, the designer must look at a figure appearing on the
CAD screen, process the information within the figure and make design
decisions based on how the figure is represented. The importance of spatial
reasoning abilities for CAD, and manufacturing in general, are noted by several
researchers (Nau, 1983; Reggia, 1983). One characteristic of good designers is
that they can think in three-dimensions and manipulate objects in their mind.
The term "computer-aided design" describes any system that uses a
computer to aid in the creation or modification of a design. In general, a CAD
workstation consists of a color graphics display terminal, a digitizing tablet, a key
board, a printer/plotter, and a local graphics processor. A user can design a
part, build an assembly, and conduct an engineering analysis directly and
interactively on the CAD system (Majchrzak et al., 1987).
Although the use of CAD systems can save up to about 70 percent of the
total manual design time the real benefits of using CAD is a reduction in product

lead time, better product quality and design documentation, and reported
increases in the creativity and productivity of the designer.
A CAD system integrates the functions of drafting and analysis by storing
a design in the computer electronically. The results of the engineering analysis
can be shown graphically by displaying the design on the CAD terminal, thus,
providing immediate visual feedback to the designer. Also, the use of CAD
allows the designer to go through many design iterations in a reasonably short
time. The quality of the final product is usually much higher and the lead time
much shorter when using CAD.
Another advantage of using CAD systems is the ability to interface CAD
with computer aided manufacturing (CAM). When CAD is interfaced with CAM,
the total design-production cycle is shortened. CAD becomes not only a tool to
save costs, but more importantly, a means to survive in the high competition
marketplace of manufacturing. Today there are more than ten thousand CAD
workstations delivered for use each year. With the price of these systems
decreasing and the performance improving, we will see increasing numbers of
CAD workstations being used by industry (Barfield, Chang, Majchrzak, Ebert &
Salvendy, 1987).
For CAD to be effectively used it must result in improved performance
(Salvendy, 1982), improved human interactive system design (Salvendy, 1984,
1987), improved organizational factors (Dunnette, 1976) and reduced stress
(Salvendy, 1982). Although the use of CAD systems can save up to about 70
percent of the total manual design time, the real benefit of using CAD is a
reduction in product lead time, better product quality and design documentation,
and reported increases in the creativity and productivity of the designer. It is
41

much faster and easier for a draftsperson to enter, modify, and plot a drawing
with CAD (Majchrzak et al., 1987).
The way the CAD operator processes information is summarized as
occurring in four steps. First, attending to graphic stimuli and alphanumeric
information which appears on the screen. Second, recognizing familiar patterns
such as geometrical shapes, and acquiring and integrating new information.
Third, assessing the design with respect to the needed alternations. Fourth,
deciding on a response such to change or keep the design.
There are many human factors issues involved in the design and use of
CAD systems. The primary goal of designing the human-CAD interface is to
create a system which increases the designer's creativity and decision-making
abilities, both cognitive and visual. To accomplish this objective, the hardware
and software components of the CAD system should be compatible with the
designer's cognitive and perceptual processes and physical requirements for
interacting with the system. Such a system should result in an increase in
design creativity and productivity, an increase in the quality of design decision
making and greater job satisfaction (Barfield & Salvendy, 1985).
The human-CAD system is called a hybrid intelligent system because the
creative and decision-making abilities of the human are coupled with the
information processing capabilities of the computer. The resulting system
exceeds the capabilities of either system component when the interaction
between the two is synergistic (Majchrzak et al., 1987).
Groover and Zimmers (1984) and Pao (1984) have discussed several
reasons for implementing CAD. These include the following:
42

1. CAD may result in significant productivity increases. The graphic
features of a CAD system offer the designer the capabilities to visualize the
product and to synthesize, analyze, and document the design interactively.
Productivity improvements for CAD, in comparison to manual design, are
reported to range from 3:1 (Gold, 1983), and 4:1 (Krouse, 1982; Sheldon, 1983)
to 10:1 (Rosenbaum, 1983). Productivity improvements largely depend on the
complexity of the drawing, level of design detail required, and repetitiveness of
the designed parts (Groover & Zimmers, 1984; Krouse, 1981). In a survey of 33
current CAD users by Datapro (1984) the following results were noted. Seventy-
eight percent of the respondents reported increased productivity, and 76 percent
reported shortened cycle time. Seventy percent of the respondents said that the
CAD system did what they expected it to do. Finally, 75 percent stated that they
would recommend the particular system they were using to a colleague.
2. The use of CAD may lead to an improvement in design quality and
accuracy. The survey by Datapro indicated that 85 percent of the designers
reported an improvement in the accuracy of their drawings.
3. CAD may improve the communication among designers due to use of
a common database, standardization, usage of common graphic symbols, and
greater legibility of drawings (Groover & Zimmers, 1984).
4. CAD may aid the manufacturing process. For example, a CAD user
can define a part shape, analyze stresses and deflections for the part, and check
its mechanical action. Furthermore, the geometric description of the part
provided by the CAD user can generate CNC tapes, instruct robots, and manage
plant operations (Krouse, 1980).
43

As improvements continue in the areas of software, hardware, and the
human-CAD interface, further benefits can be expected to occur from the use of
CAD. The use of a CAD system has changed the range of skills required to
perform design. The most obvious change is they require a certain amount of
knowledge about computers and how to interact with them. A human-factored
system, however, should minimize the need for computer knowledge. The
introduction of CAD into the work place may also affect the skill requirements for
performing design. Computer-based systems are well suited for performing
analytical work, especially when algorithmic solutions are necessary. They are,
at present, ill-suited for creative decision making, though. For example, CAD
may aid designers whose work requires geometric modeling and an engineering
analysis. However, these designers may experience more stress as a result of
increased levels of computer-paced decision making (Cooley, 1981). On the
other hand, there may be a reduced need for designers performing tasks which
require routine drawing skills, rather than engineering skills, as CAD systems
proliferate into the design work place (Arnold & Senker, 1982).
Summary
As this research was undertaken, the three aspects of the study merged
together. Spatial visualization skills, the gifted student, and computer-aided
design are each equally important. Spatial visualization skills are important to
everyone as we wind our way through life. Without spatial visualization skills,
how would we hit a softball or make a left-hand turn in traffic? As our country
moves more and more away from an industrialized economy and more and more

towards an information-based economy, we will need our best and brightest to
keep us at the forefront of technology and the world. It's possible that our best
and brightest of today will have to work to regain that status, already lost to
Japan. Computer-aided design is just one key to our future success.
45
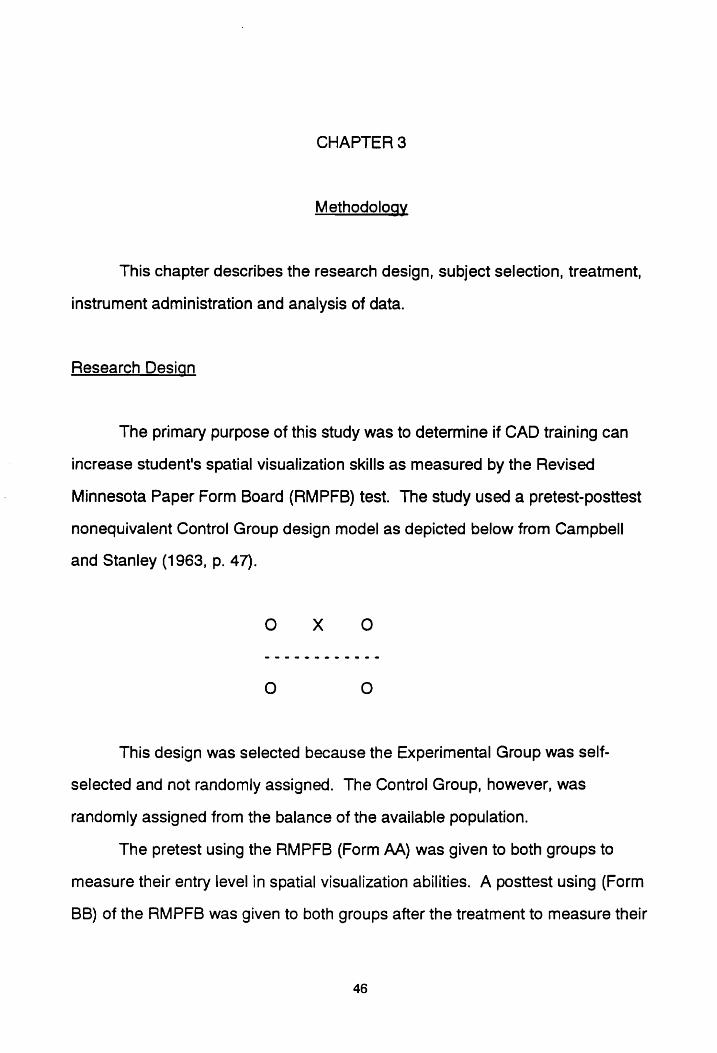
CHAPTER 3
Methodology
This chapter describes the research design, subject selection, treatment,
instrument administration and analysis of data.
Research Desian
The primary purpose of this study was to determine if CAD training can
increase student's spatial visualization skills as measured by the Revised
Minnesota Paper Form Board (RMPFB) test. The study used a pretest-posttest
nonequivalent Control Group design model as depicted below from Campbell
and Stanley (1963, p. 47).
This design was selected because the Experimental Group was self-
selected and not randomly assigned. The Control Group, however, was
randomly assigned from the balance of the available population.
The pretest using the RMPFB (Form AA) was given to both groups to
measure their entry level in spatial visualization abilities. A posttest using (Form
BB) of the RMPFB was given to both groups after the treatment to measure their
46
level of spatial abilities after the treatment. The alpha was set at the .05 level of
significance for the study.
Selection of Subjects
The Experimental and Control groups were comprised of participants in
the 1991 Governor's School of Technology program at Virginia Polytechnic
Institute and State University. The Governor's School was an intense three
week summer program for students currently in the 10th or 11th grades. The
students had the opportunity for acceleration in pace and level of curriculum,
exploration of a theme in depth and breadth, enrichment in learning and career
direction and enlightenment. These opportunities were completed in three
phases. Phase 1, the residential program, is where the students were involved
in the development of process skills through problem solving activities in
informational technology, biotechnology, physical technology, and the future
impact of technology. During Phase 2, at their home schools, the students had
the opportunity for completion of self-initiated problem solving activities,
interdisciplinary involvement, support and participation of business and industry,
regional presentation and discussion of student work and finally evaluation of
student work. During Phase 3 a small group from the original students had the
chance to pursue further experiences which included national and international
activities.
A selection committee selected students to participate in the program
based on a composite score system. The composite scores (maximum total of
1000 points) were derived from the following categories: Extra curricular and
47

personal activities (360), Student interest essay (200), Teacher ratings (200),
GPA (60), PSAT/SAT and DAT test scores (180). A Likert scale was used in
each category to determine each nominees score. The scores were compiled
and the nominees were ranked in order of their scores. Fifty students were
selected to participate in the 1991 Virginia Governor's School of Technology
program.
The Experimental Group consisted of twenty students enrolled in the CAD
class. These students elected to be in this class, and therefore were not
randomly assigned to the Experimental Group. A Control Group was comprised
of twenty students randomly selected from the remaining thirty students of the
Governor's School population. In order to achieve statistical equality the Control
group was designed to have the same ratio of males and females.
The average student participating in the 1991 Virginia Governor's School
of Technology program was one who had completed the 11th grade with a GPA
of approximately 3.5. The average student had taken both Algebra | and II along
with a mixture of technology courses such as drafting and computer application
or programming courses.
Instrument
Based upon careful review of instruments designed to measure spatial
ability, the researcher chose the RMPFB because it is normed for the high
school student and for working adults. The test has a higher level of difficulty
and the researcher expects the subjects in this study to receive a more accurate
and sensitive score in relation to their ability thus giving the study a lower starting
48

benchmark and a larger area of measure in which to show improvement in
scores. Previous research into how gifted students score on the DAT showed
that the students were scoring at the extreme high end of the scale. This
indicated that the DAT was not an appropriate test to measure the change in the
subjects spatial visualization abilities.
The DAT measures for spatial relations ability whereas the RMPFB
measures for spatial visualization ability. According to Pellegrino, Alderton, and
Shute (1984) spatial relations problems, although varying among themselves in
complexity, involve less complex stimuli than spatial visualization problems. In
terms of cognitive processing complexity or effort, an intuitive analysis suggests
that more mental operations and coordination are required to solve spatial
visualization problems. The spatial visualization ability is measured by tests that
are relatively speeded and complex. Such tasks frequently require a
manipulation in which there is movement among the internal parts of a complex
configuration and/or the folding and unfolding of flat patterns.
The differences between spatial relations and visualization tasks seem to
represent two correlated dimensions of performance. One of these is a speed-
power dimension. Individual spatial relation problems are solved more rapidly
than spatial visualization problems, and the tests themselves are administered in
a format that emphasizes speed in the former case and both speed and
accuracy in the latter case.
The original Minnesota Paper Form Board Test (MPFB) was developed in
the late 1920's by Paterson, Elliott, Anderson, Toops, and Heidbreder (1930) as
part of their extensive study of the measurement of mechanical ability. This test
proved to be one of the most valid of the tests developed and was the most valid
49

tests employing only paper and pencil. However, in spite of its relatively high
validity, it had serious limitation and needed improvement (The Psychological
Corporation, 1970).
The Revised Minnesota Paper Form Board Test (RMPFB) was a revision
by Likert and Quasha of the original paper form board test. This revision, first
published in 1934, was designed to refine the test and make it more practical.
The directions and scoring were simplified, practice problems were added, and
items were arranged in order of difficulty. Two alternate forms of the original test
were constructed. These are called Series AA and Series BB, each consisting of
a booklet that is marked by the subjects and cannot be used again.
The RMPFB is a 20-minute speeded test consisting of 64 two-dimensional
diagrams cut into separate parts. For each diagram there are five figures with
lines indicating the different shapes out of which they are made. From these, the
subject chooses the one figure which is composed of the exact parts that are
shown in the original diagram.
Figure 1. Sample RMPFB Test Question.
50

Figure 1 shows two parts in the upper left-hand corner. By looking at the
five figures labeled A, B, C, D, and E, the subject is to decide which figure
shows how these parts can fit together. Looking at figure A one will notice that it
does not look like the parts in the upper left-hand corner would look when fitted
together. Neither do figures B, C, D. Figure E does look like the parts in the
upper left-hand corner would look when fitted together. Therefore, E would be
the correct response.
There were considerable individual differences in the ability or abilities
measured by this test. The nature of these differences and the specific kinds of
abilities measured are discussed more fully in the section on validity. In brief,
the test seems to measure those aspects of mechanical ability requiring the
capacity to visualize and manipulate objects in space.
The test has a long history of effective prediction in many academic and
industrial fields, particularly those with a mechanical orientation. The studies
summarized in the validity section of the test manual (Likert, 1934; Paterson, et
al, 1930; Quasha, 1935; Quasha & Likert, 1937) strongly suggest that the test is
a valuable tool for use in educational and vocational guidance and in employee
selection. Equivalence of forms AA and BB were constructed as part of the
revision of the original Minnesota Paper Form Board Test. A pool of 128 items
was administered to college and high school students. The items were then
ranked in order of difficulty and systematically assigned to Series AA or BB
(Quasha & Likert, 1937). Logically, therefore, the forms are equivalent, and the
authors of the test have observed that norms for Series AA and BB are almost
identical when the two forms are administered to comparable groups.
51

Reliability
There is no one statistic that can be said to be a measure of the reliability
of this particular test. Estimates of reliability coefficients are dependent on both
the range and the level of ability within a sample being tested. For example, a
sample with a wide range of ability will generally yield a higher reliability
coefficient than a sample with limited range (Likert & Quasha, 1970). However,
good estimates of a test's reliability can be obtained by evaluating the results of
a number of reliability studies using a variety of samples.
In their developmental work with the Revised Minnesota Paper Form
Board Test, Quasha and Likert (1937) found the interform reliability of Series AA
and BB was .85, based on the results of 290 high school seniors applying for
admission to New York University. The reliability coefficient and standard error
of measurement for several groups of students (high school and college
freshmen), who were administered alternate equivalent forms of the RMPFB in
1969, were found to be .75 with 3 to 4 raw score points as the margin of error
(The Psychological Corporation, 1970).
Validity
The validation of the Minnesota Paper Form Board Test goes back to the
original studies by Paterson, et al. (1930), and the development of the RMPFB
as reported by Likert (1934), Quasha (1935), and Quasha and Likert (1937).
The original Minnesota Paper Form Board Test was the most valid paper and
pencil test of the criterion of mechanical ability developed in the study. Ina
52
series of studies, the Revised Edition correlated .75 or better with the original
test. When corrected for attenuation, these correlation coefficients became .94
or better. In addition to validating the revised test against the original, Quasha
and Likert found that their first revision correlated .49 with grades in mechanical
drawing and .32 with grades in descriptive geometry. These grades were
semester grades for freshman engineering courses.
Research from the 1940's on, pertaining to the validity of the test, are
presented below in support of its usefulness as a measure of mechanical-spatial
ability. One type of evidence of validity is afforded by the comparison of the
mean test scores of groups who are logically and psychologically expected to
differ in mechanical-spatial ability. For example, one would expect engineers
and draftsmen to obtain higher mean scores than factory workers. Moore (1941)
presents data for different groups in the form of graphs. That study showed that
the average score of adult men to be 34 points; engineering school freshmen
scored 43 points; and of 7,844 enrollees in engineering defense training (EDT)
evening classes at Pennsylvania State College the average score was 41 points.
In the same study mechanical draftsmen who were in the EDT group, had
considerably higher rankings, approximately 75 percent were above the 90th
percentile.
An examination of the normative groups presented in the manual also
confirms the validity of the MPFB in differentiating between groups that logically
should differ in spatial and mechanical ability. For example, the manual shows
mean scores of two groups of engineering students exceeding the means of the
other educational groups by about 4-8 raw score points. This is to be expected,
since the engineering students in this study were older, at a higher educational
53

level, and more highly selected than the other groups. This is because,
according to the literature as a person increases in age and is exposed to new
spatial experiences, their ability to perceive objects spatially also increases.
Correlations with other Tests
The manual summarizes the studies in which scores on the MPFB have
been correlated with scores on various measures of general intelligence and
specific aptitudes. Spatial ability tests had a range of coefficients from .38 to .70,
with the mean coefficient being .58. The coefficient of correlation in the manual
offered strong support that the test is (1) a valid measure of mechanical-spatial
ability, and (2) clearly related to general intelligence.
Test Administration
The RMPFB test was used in this study to measure the students spatial
visualization skills before and after the treatment. Both forms of the RMPFB (AA
and BB) were administered to both of the groups, each of these tests were
administered in their unaltered format. After a brief explanation of the test,
subjects were given test booklets to review the sample questions. After all
subjects have read the introductory information, they were given 20 minutes to
complete as many problems as possible on each test.
The subjects were reminded that it is a speed test, and a test for accuracy
as described in the test administrator's handbook. The researcher stayed in the
54

classroom with the subjects to answer questions. This procedure was followed
for both administrations of the tests.
All materials (test booklets and answer sheets) were collected after the
pretest and posttest, and evaluated using the RMPFB scoring sheet. The
pretest was administered to the Experimental Group during the first twenty-five
minutes of the first class meeting (July 8, 1991) and the posttest was
administered on the second to the last class meeting (July 25, 1991). The
Control Group was administered the pretest during the first day of the Governor's
School program and they were administered the posttest during the second to
the last day of the program.
Treatment
The treatment consisted of CAD instruction using CADKEY 3.5 software.
The instructional time was two hours per day, five days per week for three
weeks. The instructional methods were lecture, demonstration, and self-paced
learning exercises. The eighteen exercises were taken from the Basic
Mechanical Design Training Manual by CADKEY, Inc. This instructional manual
was selected for two reasons. First, the manual has been used successfully for
five years as a training manual in industry. Second, the manual is graduated in
level of difficulty. Therefore, as the student's knowledge increases, the level of
difficulty of the exercises also increases.
55

Analysis of Data
ANCOVA was used to determine if there was a difference in gain scores
from pretest to posttest on the RMPFB between the Experimental and Control
Groups and to adjust group means of the posttest for the two groups for any
preexisting differences in the pretest scores. ANCOVA was also used to account
for initial differences between groups on the pretest scores using the pretest as
the covariate.
Summary
This chapter delineated the design and methods of this study, including
the population composition, research methodology, general procedures,
hypothesis testing, and analysis of data. This study used a population of 40
gifted high school students (from a total population of 50) from the Governor's
School for Technology at Virginia Polytechnic Institute and State University. A
nonequivalent Control Group design employing pretest and posttest was used.
Students were tested using multiple forms of the Revised Minnesota Paper Form
Board test. The hypothesis in this study was tested using ANCOVA.
56
CHAPTER 4
Results
Introduction
This chapter is divided into two parts. In the first part, descriptive
Statistics are presented which describe the demographic characteristics of the
Experimental and Control Groups. In the second part, data pertaining to the
testing of the hypothesis are presented. To conclude the chapter, there is a
summary of the findings.
The research hypothesis for this study was: subjects receiving instruction
in computer-aided design (CAD) will show improvement in spatial visualization
skills, as measured by the Revised Minnesota Paper Form Board (RMPFB) test,
when compared to the subjects not receiving CAD instruction.
In this study two different groups were contrasted to determine if the
Experimental Group, the group taking the computer-aided design course, hada
different demographic makeup than the Control Group (the ones not enrolled in
the CAD class).
Six demographic variables were analyzed: gender, grade level, number
of exercises completed, GPA, semesters of computer courses, and semesters of
drafting courses. This information was then processed using t-Tests for
independent samples and ANCOVA to determine if any significant statistical
differences existed between the groups.
57

Descriptive Data
A majority of both the Control Group (70%) and the Experimental Group
(55%) had no previous course work in computers. Ten percent of the
Experimental Group and 5% of the Control Group had a maximum of two
semesters of course work in computers. No significant difference was found
between the Experimental and Control groups with respect to the number of
semesters of computer courses. These data are reported in Table 1.
Table 1
Number of Semesters of Computer Courses
Experimental Control Semesters Group Group
n (%) n (%)
0 11 (55) 14 (70) 1 7 (35) 5 (25) 2 2 (10) 1 (5)
Total Sample 20 (100) 20 (100)
MEAN 55 35 SD .69 59 t Value - Prob. 33
58

A majority of the Experimental Group (60%) and the Control Group (80%)
had never received formal drafting training. Twenty percent of the Experimental
Group as compared to 5% of the Control Group had three to five semesters of
formal drafting training. No significant difference was found between the
Experimental and Control groups with respect to the number of semesters of
drafting courses. These data are reported in Table 2.
Table 2
Number of Semesters of Drafting Courses
Experimental Control Semesters Group Group
n (%) n (%)
0 12 (60) 16 (80) 1 3 (15) 3 (15) 2 1 (5) - 3 3 (15) 1 (5) 5 1 (5) -
Total Sample 20 (100) 20 (100)
MEAN 95 30 SD 1.46 73 t Value - Prob. 09
59

Both groups were very similar in their grade level composition. Between
25 - 30% were Juniors and 70 - 75% were Seniors. The Seniors were
represented by approximately three times the amount of the subjects than the
Juniors. No significant difference was found between the Experimental and
Control groups with respect to grade level. These data are reported in Table 3.
Table 3
Subject Breakdown by Grade Level
Experimental Control Grade Level Group Group
n (%) n (%)
11th 6 (30) 5 (25) 12th 14 (70) 15 (75)
Total Sample 20 (100) 20 (100)
t Value - Prob. 13
60

A majority of the subjects in the Experimental Group (85%) completed
fourteen exercises before the posttest was administered. Only 3 (15%) of the
students completed fifteen or more exercises. These data are reported in
Table 4.
Table 4
Number of Exercises Completed at the Time of the Posttest
Exercise Number Experimental Group
n (%)
12 7 (35) 13 1 (5) 14 9 (45) 15 1 (5) 16 1 (5) 18 1 (5)
Total Sample 20 (100)
X = (MEAN) 13.6 SD 1.6
61

Twelve (60%) of the Experimental Group and 13 (65%) of the Control
Group had a GPA between 3.7 and 4.0. Conversely 4 (20%) of the Experimental
Group and only 2 (10%) of the Control Group had a GPA of less than 3.4. No
significant difference as found between the Experimental and Control groups
with respect to their grade point averages. These data are reported in Table 5.
Table 5
Subject Breakdown of GPA (4.0 Scale)
Experimental Control GPA Group Group
n (%) n (%)
3.0 to 3.4 4 (20) 2 (10)
3.5 to 3.7 4 (20) 5 (25)
3.8 to 4.0 12 (5) 13 (25)
Total Sample 20 (100) 20 (100)
X = (MEAN) 3.74 3.63 SD 25 .26 t Value - Prob. 91
62

Testing of the Hypothesis
Using ANCOVA (Analysis of Covariance), and combining the
Experimental and Control Group pretest scores on the Revised Minnesota Paper
Form Board test (RMPFB), posttest scores on the RMPFB were analyzed. One
ANCOVA was applied testing the significance of the group's scores on the
posttest covarying for the pretest scores. The results from this ANCOVA
revealed that there was no significant difference in the posttest scores between
the groups ( F = 1.79, df = 1,37, p = .19) indicating the Experimental and Control
Groups were equivalent in spatial visualization ability at the onset and at the
completion of this study.
Using ANCOVA (Analysis of Covariance), it was determined that there
was no statistical significance related to which group, Experimental or Control,
that the students were in. ANCOVA showed that the scores of both groups
increased from the pretest to the posttest. The ANCOVA technique was also
used to assess the individual contributions attributed to group membership
(Control vs. Experimental), and to the interaction between group membership
and the pretest spatial visualization ability, after controlling for pretest spatial
visualization ability. In examining the results of the ANCOVA, it was determined
that the two groups did not have additional unexplained variations in their pretest
spatial visualization scores.
The next step in analyzing the results from ANCOVA was to consider the
contribution of group membership to the statistical equation, after controlling for
the pretest spatial visualization ability. The hypothesis of this study was that
group membership would contribute significantly to the statistical equation,
63

indicating that the CAD training improved spatial visualization ability. The results
of the ANCOVA did not support the hypothesis of this study, causing the
researcher to accept the null hypothesis. These data are reported in Table 6.
Table 6
ANCOVA for Posttest, Controlling for Pretest
Source Sumof Degrees of Mean F Ratio F Prob. Squares Freedom Squares
Pretest 1078.9 1 1078.9 76.7 .0000
Group 25.1 1 25.1 1.8 .1896
Error 520.6 37 14.1
Total 1603.1 39
64

co’ <d,
jsoysod
«18° }S9}Olq
JOAd]
OL’ ez’
UO 1}ONJ}SU|
62 '0- 81'0-
92° Wd5
x6" Le
v0’ ¢0'0-
Epes
bh SO’
aly’ 00'0-
v0'0 Bureig
ZO’ 90°
ce'0- 90°
00'0- LL‘O-
Jayndwoy
ZL‘O- St'O-
LZ '0-
SO'0- 60'0
20° vl'0O-
Jepuary
SO’ OL'0-
00'0 ZO’
90'0- 82°
QI" 00'0-
dnoJ
Ob =u
Ob =u
Og =u
Ov=U
Obv=U Obv=uU
Op =u
Ov=U
Ov=uU [aAQ|
OeYSOd
jSe}siq UONONJsuU|
Vd5
epely
Buyeyg
Jseyndwoy sapuey
dnoly
xe] Uojel(sog
Lage
65

Correlation Matrix
The researcher wanted to determine if any correlation existed between
the six demographic variables in the study. The cutoff point for significance in
the correlation matrix was .05. This value was determined before the onset of
the study. Anything under the value of .05 was determined to be significant.
Anything over the value of .05 was determined to be not significant. Correlation
coefficient analysis was used to determine correlation and the results were set
into a correlation matrix (see Table 7). Correlations are ranged on a scale from
positive 1 to negative 1, with positive one being a strong positive correlation and
negative one being a strong negative correlation. A positive correlation means
that the variables analyzed were correlated (related) to each other and negative
correlation suggests that the variables are not related to each other. The
correlation of drafting (number of semesters of drafting) to instruction level
(number of completed exercises) was found to be significant (.47). The two
significant correlations existed between grade level and pretest (.37) and grade
level and posttest (.33). A significant correlation also existed between the
pretest and the posttest (.81).
Summary
There were both similarities and dissimilarities between the Control Group
and the Experimental Group. As pointed out at the beginning of this chapter,
demographic data were analyzed to determine the extent of the differences
between the two groups.
66

In terms of similarities, the two groups were similar in the number of
semesters of computer courses, gender, grade level, and GPA. As for their
dissimilarities, the groups differed in the number of semesters of drafting courses
(although not statistically significant).
The Control Group's posttest mean increased 2.75 to a mean of 52.55,
and the skewness of the distribution went to -.11 from -.80. The posttest scores
for the Experimental Group had a mean of 53.15 (up 4.9 from the pretest) and a
skew to the negative of -1.15, showing the improvement expected in the
hypothesis. Using ANCOVA, the combined groups were viewed for variables
which might affect the combined pretest scores. No significant differences were
found in any of the variables.
The results of the ANCOVA revealed that group membership did not
predict additional variance in posttest spatial visualization scores. Thus the
Experimental Group did not improve more than the Control Group in spatial
visualization ability.
67

CHAPTER 5
Summary, Conclusions, and Recommendations
Summary
This study reviewed spatial visualization skills and its importance in many
occupational and school subjects. The literature reviewed showed that without
proper spatial visualization training a person's vocational pursuits can be
hindered.
In particular, the focus was on improving gifted adolescents' spatial
visualization ability through the use of computer-aided design (CAD). CAD isa
natural medium to teach spatial visualization skills. In CAD, students must be
able to visualize objects on the computer screen and "mentally rotate" those
objects. This study assessed whether training in CAD had any effect on the
spatial visualization ability of selected gifted students. The instrument chosen to
measure this effectiveness was the Revised Minnesota Paper Form Board
(RMPFB) test.
Two groups were participants in a three week Governor's School program
for the Gifted in Technology. The Experimental Group, consisted of 20 students
who were enrolled in the CAD class offered by the Governor's School. The
Control Group consisted of 20 students not enrolled in the CAD class. Both
groups were given a pretest and a posttest using the RMPFB test, with the
results compared following the end of the three week program.
68

The results of the study showed that both groups were influenced by the
RMPFB test. Both groups had higher posttest scores than pretest scores.
However, the Experimental Group did not improve significantly more in spatial
visualization ability than did the Control Group.
It was expected that the Control Group would have shown no change in
spatial visualization ability because they had no exposure to any spatial
visualization training other than the RMPFB test. However, this group showed a
growth in spatial visualization ability similar to that of the Experimental Group.
Since the Control Group showed improvement comparable to that of the
Experimental Group this would suggest that exposure to the RMPFB test itself
provided a training experience from which the Control Group profited. If this
conclusion is sound, one inference that may be drawn is that a three week long
training class in CAD may be insufficient and that a longer training period would
be necessary.
Of the six demographic variables (gender, grade level, number of
exercises completed, GPA, semesters of computer courses, and semesters of
drafting courses) none were found to have any statistical significance on spatial
visualization ability. The demographic variable gender showed that males
increased by 4.15 points from the pretest to the posttest while the females
increased by only 3.08 points. This is in contrast to the research by Sherman
(1977), Benbow and Stanley (1980), and Meehan (1984) The finding is,
however supported by Fennama and Tartare (1985) and Weiner (1986). The
demographic variable gender would most likely yield a significant effect if the
number of males and females were considerably larger. The review of literature
on the effect of gender on spatial visualization ability is significant in terms of
69

studies conducted. In the studies conducted by Sherman (1977), Benbow and
Stanley (1980), and Meehan, (1984) it is suggested that spatial visualization
ability skills in females might influence their achievement in math and science.
While others have refuted claims that spatial visualization contributes to
differences in mathematics performance (Armstrong, 1981; Fennama &
Sherman, 1977; Fennama & Tartare, 1985; Weiner, 1986). All of those studies
used larger numbers of subjects therefore no inferences can be made from this
study about gender since the population consisted of only 40 subjects (12
females). The demographic variable grade level did not have any statistical
significance with spatial visualization ability. Yates (1988) states that as people
mature they develop spatial visualization ability. If a more heterogeneous
population were selected, a more diverse variation in grade level as it related to
spatial visualization could likely be found. Looking at the demographic variable
of the number of exercises completed before the posttest, it was found that the
more semesters of drafting experience a subject had the greater the number of
training exercises completed. Sixty percent of the Experimental Group had no
high school drafting experience, however the subjects still completed 85% of the
exercises during the treatment period.
The demographic variable of grade point average (GPA) did not have
statistical significance with spatial visualization. The researcher believes that
since the study's population was composed of highly gifted high school students,
GPA would have very little effect of spatial visualization ability. Since the
subjects were gifted and one of the selection criteria for acceptance into the
Governor's School program was GPA, it is understandable that a majority of the
subjects would have GPA's of 3.5 or higher. Conversely, if a more
70
heterogeneous population was selected the researcher believes that GPA could
be more correlated with spatial visualization. Jones (1990) states that the gifted
student that use computers develop higher level thinking skills and work smarter.
This refutes the findings of the study since no correlation existed between the
number of computer courses a student had and spatial visualization. The study
found that there was no significant correlation between spatial visualization
ability and drafting experience. This is in contrast to the findings by Yates
(1988), Brinkmann (1966), and Blade (1949). However, these findings were
supported by Faubion, Cleveland, and Harrell (1942), Mendicino (1958), and
Myers, (1958).
Conclusions
While generalizations from the findings of this study must be tempered by
the inherent limitations of the study, the following conclusions could be inferred:
1. The results obtained in this study suggest that the CAD instruction did
not improve the spatial visualization ability of the gifted students.
2. Students spatial visualization ability was not related to gender, grade
level, number of exercises completed, GPA, semesters of computer courses,
and semesters of drafting courses.
3. Learning occurred as an result from taking of the pretest and
subsequent taking of the posttest.
71

Recommendations
Continued investigation into this area is both warranted and needed. On
the basis of the findings of this study and the review of the relevant literature, the
following suggestions for further research concerning the effect of spatial
visualization instruction using CAD are offered, if further research is to be
replicated:
1. The treatment should be extended beyond the three week period. The
rationale of the researcher was that the intensity of the training would have
invalidated any chances of the test subjects remembering test items or
strategies. Because of the closeness of the pre- and posttests, caution is urged
in using these data as collected unless similar studies produce results which
appear to support this study's findings that exposure to the RMPFEB test is, in
itself, sufficient experience to trigger improvement in latent spatial visualization
ability.
2. Amore homogeneous mix between gifted and non-gifted students
should be used in subsequent studies. This mix was not possible given that the
program was for selected gifted students. A study designed for average high
school students would, most likely, produce a higher significance between the
experimental and control groups.
3. A study to determine the correlation between spatial visualization and
problem solving skills is warranted. Since spatial visualization skills have been
associated with certain problem solving skills, this study could be conducted and
the students tested for enhanced problem solving skills. The study could be
done in a similar problem solving environment, such as in a geometry class.
72

4. A“time series" experiment (Campbell and Stanley, 1963, p. 37) re-
examining the spatial visualization abilities of each experimental student is
suggested. This type of design could determine if the initial exposure and
training of this study created a lasting awareness and desire in the treated
students to further develop and utilize their spatial visualization ability.
5. Spatial visualization is a multidimensional ability and therefore should
be measured by more than one instrument. The RMPFB measures the subjects
ability mentally rotate the images on a flat two- dimensional surface. By
developing an instrument to measure a subjects’ ability to dynamically rotate an
image on a computer screen, one might be better able to determine a subjects’
three-dimensional spatial ability.
6. According to the RMPFB test manual, this test should be administered
to a wider range of subjects to obtain a higher reliability coefficient. As according
to Likert & Quasha (1970) a sample with a wide range of ability will generally
yield a higher reliability coefficient than a sample with limited range.
7. This study looked at the demographic variable computer experience as
a group of experiences. Subsequent studies should break down computer
experience into specific experiences. If a student has one or more semesters of
computer word processing courses will he or she have more developed spatial
visualization ability than a student who has one or more semesters of computer
graphics courses?
8. A treatment of a different type could reveal different results than the
treatment used in this study. A treatment consisting of subject manipulation of
three dimensional images on the computer screen or hands-on manipulation of
an object while testing for spatial ability before and after the treatment.
73
9. Since the pretest and posttest were two dimensional in nature, that is
paper and pencil, a system of computer-based three dimensional measurement
should be evaluated.
Discussion
The McCarthy (1980) states that people can be right brained, left brained
or integrated (equally facile with both hemispheres). Further research should be
conducted in determining the learning needs of gifted adolescents in each
teachers classroom. By meeting the learning needs of the individual gifted
student, that is attending to their right/left brain needs, teachers will keep them
interested and challenged in their subjects. The range of applications of learning
style and personality type information is wide and meaningful. Sharing the
information on learning styles and personality types with the gifted adolescent is
critical during their quest for self-understanding (Bireley & Genshaft, 1991). This
indicates that teachers should be more attentive to teaching to the right brain
needs of gifted adolescents.
Computer use in the school setting has been steadily increasing over the
past two decades. Many gifted students have access to computers in their
classrooms, and many have computers in their homes. Business, industry, and
educational leaders as well as the general population believe our most able
students must be computer literate for our nation to be competitive in the next
generation. Only recently, with the gulf between promises and achievements
widening, have voices of concern been raised. The disparity between theory
and practice is attributed to many causes, ranging from a lack of educational
74

focus to a shortage of funding. Even those individuals who are reporting these
problems have found evidence that students are working "smarter". Whether
they are learning and using information, understanding key concepts and
relationships better, or developing higher level thinking skills. Gifted students
are benefiting from increased use of computers because their special needs are
being met through informed use of technology.
75

REFERENCES
Alliotti, N. C. (1981). Intelligence, handedness, and cerebral hemispheric preference in gifted adolescents. Gifted Child Quarterly, 25(1), 36-41.
Anglin, G. (1982). The interaction of learner aptitudes with instructional treatment in quadratic inequalities, Educational Communication and
Technology, 30 (3), 131-140.
Arnheim, R. (1974). Art and visual perception. Berkeley: University of California Press.
Armstrong, J. (1981). Achievement and participation of women in mathematics: Results of two national surveys. Journal for Research in Mathematics
Education, 12, 356-372.
Arnold, E. & Senker, P. (1982, July 6-9). The effects of computer-aided design on manpower and skills in the U.K., Engineering Industry, International Conference on Man/Machine Systems, pp. 209-212.
Baltista, M., Talsm, G., & Wheatley, G. (1973). The importance of spatial visualization and cognitive development for geometry learning in preservice elementary teachers., Developmental Psycholoay, 9, 166-177.
Barfield, W., Chang, T. C., Majchrzak, A., Eberts, R., & Salvendy, G. (1987). Technical and human aspects of computer-aided design, Handbook of
Human Factors. G. Salvendy (Ed.). London: Taylor and Francis.
Barfield, W. & Salvendy, G. (1985). Perceptual and cognitive aspects of three- dimensional figure rotations for computer-aided design (CAD) systems, Proceedings of the Human Factors Society, 29th Annual Meeting (pp.
897-901). Baltimore, Maryland.
Benbow, C. & Stanley, J. (1980). Sex differences in mathematical ability: Fact or artifact. Science, 210, 1262-1264
Best, J. & Rabinowitz, W. (1982). Encyclopedia of education research, 5th edition. In H. E. Mitzel (Associate Ed.) New York: Free Press.
Bireley, M. & Genshaft, J. (Eds.) (1991). Understanding the gifted adolescent: Educational, developmental, and multicultural issues. New York:
Teacher's College Press.
76

Blade, M. F. (1949). Experiment in visualization, Journal of Engineering Drawing, 13, 20-21, 29.
Blade, M. F. & Watson, S. S. (1955). Increase in spatial visualization test scores during engineering study, Psychological Monographs, 69 (12).
Bodner, G. M., McMillen, T. L. B., & Greenbowe, T. J. (1983). Verbal numerical, and perceptual skills, related to chemistry achievement, Paper presented at the Annual Convention of the American Psychological Association (91st, Anaheim, California, August 1983).
Bogen, J. E. (1975). Some educational aspects of hemispheric specialization,
UCLA Educator, 17, 24-32.
Briggs, K. C. & Myers, |. B. (1977). Myers-Briggs Type Indicator. Palo Alto, California: Consulting Psychologists Press.
Brinkmann, E. H. (1966). Programmed instruction as a technique for improving spatial visualization, Journal of Applied Psychology, 50 (2), 179-184.
Brown, R. F. The effects of an experimental course in Geometry on ability to visualize in three-dimensions, (Doctoral Dissertation, University of Illinois at Urbana-Champlain, 1954). Dissertation Abstracts International, 15, 83.
Bruner, J. S., Oliver, R. R., & Greenfield, P. M. (1966). Studies in cognitive growth. New York: Wiley.
Bryant, P. E. & Trabasso, T. (1971). Transitive inferences and memory in young children. Nature, 232, 456-458/
CADKEY Basic Training Manual, Version 3.5 (1989). CADKEY, INC., Manchester, Connecticut.
CADKEY, Version 3.5 [computer program] (1989). CADKEY, INC., Manchester, Connecticut.
Cafferty, E. |. (1980). An analysis of student performance based upon the deaqree of match between the educational cognitive style of the teacher
and the educational cognitive style of the students. Unpublished doctoral dissertation. University of Nebraska-Lincoln.
77

Campbell, D. T. & Stanley, J. C. (1963). Experimental and quasi-experimental designs for research. Boston: Houghton Mifflin Co.
Carpenter, F., Brinkman, E. H., & Lirones, D. S. (1965). Educability of students in the visualization of objects in space. The University of Michigan: Cooperative Research Project No. 1474.
Churchill, J. M., Combs, C. H., & Harrell, T. W. (1942). Effect of engineering
school training in the surface development test, Educational and Psychological Measurement, 2, 279-280.
Clark, B. (1983). Growing up gifted. Columbus: Charles E. Merrill Publishing Co.
Cohen, H. (1982). Relationship between locus of control and the development of spatial conceptual abilities, Science Education, 4, 635-642.
Cohen, H. (1983). A comparison of the effect of two types of student behavior with manipulatives on the development of projective spatial structures, Journal of Research in Science Teaching, 20 (9), 875-883.
Cohen, R. (1985). The development of spatial cognition. London: L. Erlbaum Associates.
Cooley, M. J. E. (1981). Some social aspects of CAD, Computers in Industry, 2, 209-215.
Correll, M. M. (1978). Teaching the gifted and talented. Bloomington, Indiana: The Phi Delta Kappa Educational Foundation.
Datapro Research Corporation (1984). CAD/CAM user survey evaluation, IEE Computer Graphics and Application, 4, (2), 21-24.
Davis, F. B. & Lesser, G. S. (1959). The identification and classroom behavior of elementary school children gifted in five different mental characteristics.
New York: Hunter College.
Davis, G. A. & Rimm, S. B. (1985). Education of the gifted and talented. Englewood Cliffs, N. J.: Prentice-Hall
Domino, G. (1971). Interactive effects of achievement orientation and teaching style on academic achievement. Journal of Ecuational Psychology, 62
(5), 427-431.
78
Dowaliby, F. J. & Shumer, H. (1973). Teacher-centered versus student- centered mode of college classroom instrucation as related to manifest anxiety. Journal of Educational Psychology, 64 (2), 125-132.
Dunn, R., Dunn, K. & Price, G. E. (1981). Learning style inventory. Lawrence, Kansas: Price Systems.
Dunn, S. & Price,. G. E. (1980). The learning style characteristics of gifted students. Gifted Child Quarterly, 24 (1), 33-36.
Dunnette, M. D. (1976). Handbook of industrial and organizational psychology Rand McNally.
Ekstrom, R. B., French, J. W., & Harman, H. H. (1979). Cognitive factors: Their identification and replication. Austin, Texas: Society of Multivariate Experimental Psychology.
Eliot, J. & Salkind, N. J. (Ed.). (1975). Childrens spatial development. Springfield, Illinois: Charles C. Thomas Publishers.
Evans, G., Marrero, D., & Butler. (1981). Environmental learning and cognitive mapping, Environment and Behavior, 13, 83-104.
Evans, G. & Pezdek, K. (1980). Cognitive mapping: Knowledge of real-world distance and location information., Journal of Experimental Psychology: Human Learning and Memory, 6, 13-24.
Faubion, R. W., Cleveland, E. A., & Harrell, T. W. (1942). The influence of training on mechanical aptitude test scores, Educational And Psychological Measurement, 2, 91-94.
Feldhusen, J. (1982). Myth: Gifted education means having a program. 62, 1, 37-41.
Fennama, E. (1983). Research on relationship on spatial visualization and confidence to male/female mathematics achievement in grades 6-8, Final
Report to National Science Foundation, Washington, D. C. FG@K5722955
ED232853.
Fennama, E. & Sherman, J. (1977). Sex-related differences in mathematics and achievement, spatial visualization and afffective factors. American
Educational Research Journal, 14, 41-71.
79
Fennama, E. & Tartare, L. (1985). The use of spatial visualization in mathematics by boys and girls. Journal for Research in Mathematics Education, 16, 184-206.
French, J. (1951). The description of aptitude and achievement tests in terms of
related factors. Psychometric Monograph No. 5.
French, J. (1965). The relationship of problem-solving styles to the factor composition of tests. Educational and Psychological Measurement,
25, 9-28.
Gallagher, J. J. (1975). Teaching the gifted child, 2nd ed. Boston: Allyn and Bacon.
Gardner, H. (1983). Frames of mind: The theory of multiple intelligences. New York: Basic Books.
George, W. C. (1979). The talent search concept: An identification strategy for the intellectually gifted, Journal of Special Education, 13, 221-237.
Getzels, J. W. & Jackson, P. W. (1962). Creativity and intelligence - Explorations with gifted students. New York: Wiley & Sons.
Gibson, E.J. (1953). Improvements in perceptual judgments as a function of
controlled practice and training, Psychological Bulletin, 50, 401-431.
Gold, R. (1983, February). CAD/CAM - The key to higher productivity, Precision Metal, pp. 7-12.
Griggs, S. & Price, G. E. (1980). Learning styles of gifted versus average junior high school students. Kappan, (January), 61, 361. (a)
Griggs, S. & Price, G. E. (1980). A comparison between the learning styles of gifted versus average suburban junion high school students. Roeper Review, (September/October), 3 (1), 7-9. (b)
Groover, M. P. & Zimmers, E. W. (1984). CAD/CAM: Computer-aided design and manufacturing. Prentice-Hall, Inc., Englewood Cliffs, New Jersey.
80

Guay, R. B. (1980). Spatial ability measurement: A critique and an alternative. Paper presented at the Annual Meeting of the American Educational Research Association (64th, Boston, Massachusetts, April 7-11). (Eric Document Reproduction Service No. TM 800 339)
Guilford, J. P. (1968). Intelligence, creativity, and their educational implications. San Diego: Robert R. Knapp.
Guilford, J. P. & Lacey, J. |. (1947). Printed classification tests. FAA aviation psychology research program reports (No. 5). Wasington, D. C.: General Printing Office.
Hallahan, D. & Kauffman, J. H. (1982). Exceptional children. Englewood Cliffs, New Jersey: Prentice-Hall.
Harrington, R. C. (1982). Caution: Standardized testing may be hazardous to the education program of the intellectually gifted children, Education, 103, 112-117.
Hermann, N. (1988). The creative brain. Lake Lure, North Carolina: Brain Books.
Hill, D. M. & Obenauf, P. A. (1979). Spatial visualization, problem solving and cognitive development in freshman education students, Science Education, 63, 665-676.
Hilliard, A. (November 15, 1983). Equity issues in special education/gifted talented education, Guest Lecturer, Pennsylvania Department of Education. Harrisburg, Pennsylvania.
Hoehn, L. & Bireley, M. K. (1988). Mental processing preferences of gifted children. Illinois Council for the Gifted Journal, 7, 28-31.
Hunt, D. E. (1971). Matching models in education: The coordination of teaching methods with student characteristics. Toronto: Ontario
Institute for Studies in Education.
Johnson, P. A. An investigation of differences in selected curriculum and student characteristics in regular and gifted English classes in Area | Fairfax County Public Schools, Fairfax County, Virginia. (Doctoral Dissertation, Virginia Polytechnic Institute and State University, 1987). Dissertation Abstracts International, 48/09, 1901A.
81

Jones, G. (1990). Personal computers help gifted students work smart. Reston, Virginia: Council for Exceptional Children. (Eric Document Reproduction Service No. EC 231 809)
Kolb, D. A. (1976). Learning style inventory technical manual. Boston: McBer and Company.
Kolb, D. A., Rubin, |. M. & Mcintyre, J. M. (1984). Organizational psychology: An experimental approach to organizational behavior (4th edition). Englewood Cliffs, New Jersey: Prentice-Hall.
Krouse, J. K. (1980, June 12). Bridging the gap from design to production, Machine Design, pp. 117-125.
Krouse, J. K. (1981, May 21). Automated drafting: The first step to CAD/CAM, Machine Design, pp. 50-55.
Krouse, J. K. (1982). What every engineer should know about computer-aided design and computer-aided manufacturing. New York: Marcel Dekker,
Inc.
Levy, J. (1980). Cerebral Asymmetry and the phsychology of Man. The Brain and Psychology. M. Wittock, Editor. New York: Academic Press.
Lewin, K. (1935). A dynamic theory of personality: Selected papers. Translated by D. K. Adams & K. E. Zaner. New York: McGraw-Hill.
Likert, R. A. (1934). A multiple-choice revision of the Minnesota Paper Form Board, Psychological Bulletin, 31, 674.
Likert, R. & Quasha, W. H. (1970). Manual for the revised Minnesota paper form board test. New York: The Psychological Corporation.
Linn, M. C. (1985). Gender equality in computer learning environments. Computers and the School Sciences, 1(1).
Lolla, R. S. The effect of selected instruction in tactual-visual perception on ninth-grade male and female visual imagery, mechanical reasoning, and spatial relations abilities, (Doctoral Dissertation, Purdue University, 1973). Dissertation Abstracts International, 34/09, 5678A.
Lord, T. R. (1985). Enhancing the visual-spatial aptitude of students, Journal of Research in Science Teaching, 22 (5), 395-405.
82

Majchrzak, A., Barfield, W., Chang, T-C., Eberts, R., & Salvendy, G. (1987). Human aspects of computer-aided design. Philadelphia: Taylor & Francis.
Mandler, G. (1962). From association to structure, Psychological Review, 69, 415-427.
Marland, S. P. (1971). Education of the gifted and talented (two volumes). Washington, D. C.: U. S. Government Printing Office.
Marland, S. P. (Submitter). (1972). Education of the gifted and talented: Report to the Congress of the United States by the U. S. Commissioner of
Education. Washington, D. C.: U. S. Government Printing Office.
McCarthy, B. (1980). The 4mat system. Arlington Heights, Illinois: EXCEL.
McClurg, P. A. & Chaille, C. (1987). Computer games: Environments for developing spatial cognition?, Journal of Educational Computing Research, 3 (1), 95-111.
McGee, M. G. (1979). Human spatial abilities: Psychometric studies and environmental, genetic, hormonal, and neurological influences, Psychological Bulletin, 86 (5), 889-918.
McNamara, T. P. (1986). Mental representations of spatial relations, Cognitive Psychology, 18, 87-121.
Meehan, A. (1984). A meta-analysis of sex differences in formation operational thought. Child Development, 55, 1110-1124.
Mendicino, L. (1958). Mechanical reasoning and space perception: Native capacity or experience. Personal Guidance Journal, 36, 335-338.
Minsky, M. (1975). A framework for representing knowledge. In H. Winston (Ed.), Thepsychology of computer vision (pp. 211-227). New York: McGraw-Hill.
Moore, B. V. (1941). Analysis of results of tests administered to men in engineering defense training courses., Journal of Social Psychology, 25, 619-635.
83

Myers, C. T. (1951). The effect of training or practice, or both, on scores on CEEB spatial relations test, form VACI. ETS Research Bulletin, March 16.
Myers, C. T. (1958 a). The effects of training on mechanical drawing on spatial relations test scores as predictors of engineering drawing grades. Research Bulletin, RB-58-4. Princeton: Educational Testing Service.
Myers, C. T. (1958 b). Some observations of problem solving on spatial relations tests. Research Bulletin, RB-58-16. Princeton: Educational Testing Service.
Myers, |. B. & McCaulley, M. H. (1985). Manual: A guide to the development and use of the Myers-Briggs type indicator. Palo Alto, California:
Consulting Psychologists Press.
Nau, D. S. (1983, May). Issues in spatial reasoning and representation for automated process planning, Computer Science Technical Report Series, TR-1275. University of Maryland.
New Jersey Department of Education. (1982). National Report on Identification: Assessment and Recommendations for Comprehensive Identification of Gifted and Talented Youth, A report prepared by the Educational Improvement Center South. Sewall, New Jersey.
Olson, D. R. & Bialystok, E. (1983). Spatial cognition: The structure and development of mental representations. Hillsdale, New Jersey: Lawrence Erlbaum Associates.
Olson, M. (1978). Visual field usage as an indicator of right or left hemispheric
information processing of gifted students. Gifted Child Quarterly, 22(2), 243-247.
Osen, D. K. (1973, March 2-3). Predicting reading achievement for the gifted upper grade student, Paper presented at the California Association for the Gifted Conference. San Francisco, California.
Paivio, A. (1970). On the functional significance of imagery. Psychological Bulletin, 73 (6), 385-392.
Pao, Y.C. (1984). Elements of computer-aided design and manufacturing. New York: John Wiley & Sons, Inc.
84

Paris, S. G. & Mahoney, G. J. (1977). Cognitive integration in children's memory for sentences and pictures, Child Development, 45, 633-642.
Passow, A. H. (1981). The nature of giftedness and talent, Gifted Child Quarterly, 25, 5-10.
Paterson, D. G., Elliott, R. M., Anderson, L. D., Toops, H. A., & Heidbreder, E. (1930). Minnesota mechanical ability tests. Minneapolis: University of Minnesota Press.
Pellegrino, J.W., Hunt, E. B., Abate, R., & Farr, S. A. (1987). Computer-based
test battery for assessment of static and dynamic spatial reasoning abilities, Behavior Research Methods, Instruments, and Computers, 19
(2), 231-236.
Pellegrino, J. W., Alderton, D. L., & Shute, V. J. (1984). Understanding spatial ability, Educational Psychologist, 19 (3), 239-253.
Perricone, B. T. (1983, May). Spatial representation and reasoning: A critical survey and proposal, Computer Science Technical Report Series, TR- 1275. University of Maryland.
Petzold, R. C. (1959). The perception of music symbols in music reading by normal children and by children gifted musically. Madison, Wisconsin:
University of Wisconsin, School of Education.
Piaget, J. (1971). The construction of reality in the child. New York: Ballantine.
Piaget, J. & Inhelder, B. (1971). Mental imagery and the child: A study of the development of imaginal representation. London: Routledge and Kegan Paul.
Pizzo, J. (1981). An investigation of the relationship between selected acoustic environments and sound, an element of learning style, as they affect
sixth-grade students reading achievement and attitudes. Unpublished doctoral dissertation. St. John's University.
Porter, R. M. (1982). The gifted handicapped: A status report. Roeper Review, 4(3), 24-25.
Quasha, W. H. (1935). The revised Minnesota paper form board test, Unpublished master's thesis, New York University.
85

Quasha, W. H. & Likert, R. (1937). The revised Minnesota paper form board test, Journal of Educational Psychology, 28, 197-204.
Ranucci, E.R. (1952). The effects of the study of solid geometry on certain aspects of space perception abilities. Unpublished doctoral dissertation,
Teacher's College, Columbia University.
Reggia, J. A. (1983, May). The role of spatial knowledge in expert systems, Computer Science Technical Report Series, TR-1275. University of Maryland.
Renzulli, J. S. (1980). Will the gifted child movement be alive and well in 1990, Gifted Child Quarterly, 24 (1), 3-9.
Renzulli, J. S., Reis, M. S., & Smith, L. H. (1981). The revolving door identification model. Wethersfield, Connecticut: Creative Learning Press, Inc.
Renzulli, J. S. & Smith, L.H. (1978). Learning styles inventory: A measure of student preference for instructional techniques. Mansfield Center,
Connecticut: Creative Learning Press.
Ricca, J. (1984). Learning styles and preferred instructional strategies of gifted students. Gifted Child Quarterly, 28, 121-126.
Richert, S. (1983, April 13). Equity issues in gifted education, Presented at Mid- Atlantic Conference on Equity Issues in Gifted Education. Richmond, Virginia.
Rosenbaum, J. D. (1983, May). A propitious marriage: CAD and manufacturing, IEEE Spectrum, pp. 49-52.
Salomon, G. (1979). Interaction of media, cognition and learning. San Francisco: Jossey-Bass.
Salvendy, G. (Ed.) (1982). Handbook of industrial engineering. New York: Wiley.
Salvendy, G. (1984). Human-computer interaction: proceedings of the First U.S.A.-Japan conference on human-computer interaction. New York:
Elsevier.
86

Salvendy, G. (1987). Cognitive engineering in the design of human-computer interaction and expert systems. Oxford: Elsevier Science.
Sheldon, D. F. (1983, June). The present state of the art on computer-aided draughting and design, IEEE Proceedings, (pp. 130, 173-179).
Shepard, R. N. & Cooper, L. A. (1982). Mental images and their transformations. Cambridge, Massachusetts: Massachusetts Institute of Technology Press.
Sherman, J. (1977). Predicting mathematics performance in high school girls and boys. Journal of Educational Psychology, 71, 242-249.
Siegel, A. & Schadler, M. (1977). Young children's cognitive maps of their classroom, Child Development, 48, 88-94.
Silver, H. F. & Hanson, J. R. (1978). Learning preference inventory. Moorestown, New Jersey: Institute for Cognitive and Behavorial Studies.
Silver, H. F. & Hanson, J. R. (1980). User's manual: The TLC learning preference inventory. Moorestown, New Jersey: Institute for Cognitive and Behavorial Studies.
Smith, L. H. (1976). Learning styles: Measurement and educational significance. Unpublished doctoral dissertation. The University of Connecticut.
Smith, R. M. (1965). The relationship of creativity to social class, Contract No. Q0E.10.070, Pittsburgh: University of Pittsburgh.
Spencer, C. & Darvizeh, Z. (1981). The case for developing a cognitive environmental psychology that does not underestimate the abilities of young children, Journal of Environmental Psychology, 1, 21-31.
Sperry, R.W. (1973). Lateral specialization of cerebral fuction in the surgically separated hemispheres. The Psychophysiology of Thinking. F.J. McGuigan and R.A. Schoonover, editors. New York: Academic Press.
Stea, D. & Blaunt, M. (1973). Notes toward the development theory of spatial learning. In R. Downs and D. Stea (Ed.), Image and environment. Chicago: Aldine Press.
87

Sternberg, R. J. (1984). Toward a triarchic theory of human intelligence. Behavioral and Brain Sciences, 7, 269-315.
Stewart, E. D. (1981). Learning styles among gifted/talented students: Instructional technique preferences. Exceptional Children, 48 (2), 134-138.
Stringer, P. (1975). Drawing training and spatial ability, Ergonomics, 18 (1), 101-108.
The Psychological Corporation, (1970). Revised Minnesota Paper Form Board Test Manual. San Antonio, Texas: Psychological Corporation.
Torrance, E. P. & Mourad, S. (1979). Role of hemisphericity in performance on selected measures of creativity. Gifted Child Quarterly, 23 (1), 44-45.
Treffinger, D. J. (1975). Teaching for self-directed learning. Gifted Child Quarterly, 19, 46-59.
Treffinger, D. J. (1982). Editorial: Demythologizing gifted education. Gifted Child Quarterly, 26, (1), 3-8.
Van Voorhis, W. R. The improvement of spatial perception ability by training, (Doctoral Dissertation, Pennsylvania State College, 1941). Dissertation Abstracts International, 04, 229.
Vandenberg, S. G. & Kuse, A. R. (1978). Mental rotations: A group test of three dimensional spatial visualization, Perceptual and Motor Skills, 47, 499-604.
Wasson, F. R. (1980). A comparative analysis of learning styles and personality characteristics of achieveing and underachieving gifted elementary students. Unpublished doctoral dissertation. Florida State University. Reported in Learning Styles Network Newsletter, 1981, 2 (3), 3.
Weiner, B. (1986). An attribution theory of motivation and emotion. New York: Springer-Verlag.
Whitmore, J. R. & Maker, C. J. (1985). Intellectual giftedness in disabled persons. Rockville, MD: Aspen.
88

Wood, C. S. & Beck, R. (1976). Talking with environmental A, in experimental mapping language. In G. T. Moore (Ed.), Environmental Knowing: Theories, Research, and Methods. Dowden: Hutchinson and Ross.
Wright, D. K. An investigation of differences between intellectually gifted sixth grade students in regular education programs on selected variables, (Doctoral Dissertation, Virginia Polytechnic Institute and State University, 1984). Dissertation Abstracts International, 45/05, 1265A.
Yando, R. M. & Kagan, J. (1968). The effect of teacher tempo on the child. Child Development, 39, 27-34.
Yates, B. C. The computer as an instructional aid and problem solving tool: An experimental analysis of two instructional methods for teaching spatial skills to junior high school students, (Doctoral Dissertation, University of Oregon, 1988). Dissertation Abstracts International, 49/12, 3612A.
Zavotka, S.L. (1987, Fall). Three dimensional computer animated graphics: A tool for spatial skill development, Educational Communications and Technology Journal, 35 (3), 133-144.
89

APPENDIX 1
Course Objectives and Outline
90

1991 Virginia Governor's School of Technology Course Outline for Computer-Aided Design
I. Description of Course
In this three week course the students will explore in detail the use of microcomputers in computer-aided design (CAD). Emphasis will be placed on the use of hardware and software for automating the design process. Concepts and skills learned in this course will be used to document research and development activities in other courses.
li. Course Objectives for CAD using CADKEY 3.5
1. 2.
3.
o>
—k OO
ODNO
D
11. 12.
13. 14. 15.
16.
17.
18.
19. 20.
To become familiar with the CADKEY 3.5 screen. To understand the functions of the History Line, the Prompt Line, the Status Window, and the Cursor Tracking Window. To learn how to use the Immediate Mode Commands to delete,
scale, redraw, and save drawings.
To learn how to Save and Retrieve drawing using the Files menu. To learn how to use the Polar and Delta options of the Position Menu. To learn how create Circles, Arcs, Fillets, and Chamfers.
To learn how to use the L-Limits (line limits) toggles. To learn how to use the various options of the Delete Menu.
To learn how to make changes in the drawing using the Edit Menu. To learn how to control the Attributes of entities.
To learn how to use different Levels in a drawing. To learn how to use the Grid and Snap commands.
To learn how to combine several drawings using Pattern Files. To learn how to obtain a copy of a drawing using a Plotter. To learn how to move, rotate, scale, mirror, and make copies of
selected entities using the X-Form Menu. To learn how to create drawing of objects that have symmetry and/or repetitive features. TO acquire an understanding of many of the three-dimensional capabilities. To learn how to create a 3D wireframe drawing by extruding a 2D drawing in a direction perpendicular to the screen.
To learn how to create a multi-view drawing. To understand the effects of the 2D/3D construction switch and the depth setting; to be able to use the system controls in the creation of 3D drawings.
91

21.
22.
To learn how to use the 3D capabilities of CADKEY to create assembly drawings. To develop skills further by working an more complicated wireframe models.
lil. Learning Strategies
NOOR
ON
> Student lead discussions. Instructor lead discussions. Extensive hands on learning through the use of prepared exercises. Demonstrations by the instructor. Demonstrations by the students. Out of class assignments (readings, homework). Quizzes to access learning extent.
IV. Content Outline (following pages)
V. Methods of Evaluation
All classroom activities and exercises will be assessed to determine the students progress. This assessment will be used to determine the students mastery of the course objectives.
Vi. References
CADKEY, Inc., CADKEY 3.5 Basic Mechanical Design Training Manual
Manchester, Connecticut, 1990
Reichard, David C., Exploring CADKEY 3, Englewood Cliffs, New Jersey,
1990: Prentice Hall, Inc.
92

1991 Governor's School of Technology Computer-Aided Design Course Schedule
Week Objectives Time
Week 1
Monday 1. Pretest - RMPFB 25 min. 2. Introduction to Class, Computers 20 min. 3. Introduction to CADKEY - (System Layout, Entity 45 min.
types, Immediate mode commands, Saving files) 4. Work on Exercise 1 25 min.
Tuesday 1. Review Previous Lesson 10 min. 2. Creating a Blank Part File 15 min. 3. Creating Lines, Arcs, Circles, Points 20 min. 4. Universal Position Menu 15 min. 5. Exercise 2&3 60 min.
Wednesday 1. Angular Representation 15 min.
2. Universal Selection Menu 15 min. 3. Fillets & Chamfers 10 min. 4. Coordinate System (View) 20 min. 5. Exercise 4,5 60 min
Thursday 1. Trim & Extend 20 min. 2. Views (Rotate Views) 15 min. 3. Exercise 4,5 (Continued) 90 min.
Friday 1. Levels 20 min. 2. 2D vs. 3D 20 min. 3. Exercise 6,7 75 min.
Week 2
Monday 1. X-Form 45 min.
2. Part and Pattern Files 15 min. 3. Exercise 6,7 60 min.
Tuesday 1. Plotting a Drawing 20 min. 2. Construction Planes 20 min. 3. Exercise 8,9 80 min.
Wednesday 1. Macro's 30 min. 2. Work on Exercises 8-11 90 min.
Thursday 1. Calculator Function 20 min. 2. Work on Exercises 9-12 110 min.
Friday 1. Working from a 3D Drawing 30 min. 2. 3D Exercises (Toolpost, Finger Guide) 90 min.
93

Week 3
Monday 1. Detailing 30 min. 2. Work on Exercises 90 min.
Tuesday 1. Demo on CNC with Mike D. 120 min. Wednesday 1. Work on Exercises 120 min.
Thursday 1. Posttest - RMPFB 25 min.
Friday 1. Work on Exercises 60 min. 2. Wrap up class & Evaluations 60 min.
94

APPENDIX 2
Virginia Governor's School Selection Process
95

Criteria for Nominating Students
Nominees
1. Must be qualified and genuinely interested in attending the Governor's
School. It is looking for the student who enjoys creating solutions to technical
problems.
2. Must be enrolled during the school year in a public or private high
school in Virginia or eligible to attend public school in Virginia tuition-free.
3. Should be sophomores and juniors, but may be mature freshmen
during the current school year.
4. Must be residents of the Commonwealth of Virginia.
5. Must be selected by a local school nomination committee.
6. Must not be a former participant in a state-wide Residential Governor's
School.
7. Must be willing to work on and complete a research project during the
school year and report findings at a regional site and other appropriate state,
national, or international event.
Nominees in technology must be designated by technology teachers,
administrators of gifted programs, or other professionals who know their
capabilities. Standardized test scores should remain reasonably high because
these students will take other classes and seminars.
96

Steps in the Nomination Process
High schools are encouraged, but not required, to submit a student
nomination at the local level for this new Governor's School of Technology. The
administrators of gifted programs will expect a nomination from each high school
in the division unless they are notified by the principal or guidance department
that such a nomination will not be forthcoming.
1. Each high school, regardless of enrollment, will nominate one student
from either the ninth, tenth, or eleventh grade as a divisions candidate for the
Governor's School of Technology
2. Names of nominees and any additional information required are
forwarded to the division administrator of gifted education. The local committee
may not need a completed application; if that is true in a division, only nominees
to the state would be required to have a complete application.
3. Under the direction of the division administrator of gifted programs, a
school division committee is formed to select candidates to submit to the Virginia
Department of Education which will select 50 statewide participants.
4. The committee should consist of the gifted program administrator and
representatives of some of the following groups: local directors of vocational
education, persons with expertise/experience in technology, science and/or
mathematics, and interested representatives of business and industry. The
members of the school division committee should represent as many of the
schools as possible.
5. The schools division committee will consider the pool of local
nominees and select one nominee for every 5,000 students or portion thereof
97

enrolled in grades 9, 10, and 11 from the division. Depending on the local
membership in grades 9, 10, and 11, the local gifted coordinator will submit at
least one complete student application from each division.
6. Private schools which have nominees should submit applications
directly to the Virginia Department of Education. The number of private school
participants in the Governor's School of Technology will be based on
membership in grades 9 - 11 of the private schools submitting applications.
98

VITA
WARREN E. MACK
HOME ADDRESS BUSINESS ADDRESS 260 Briarwood Drive Virginia Tech Christiansburg, Virginia 24073 Technology Education Department 703-381-0557 144 Smyth Hall
Blacksburg, Virginia 24061 703-231-6480
EDUCATION
1992 Doctor of Education in Vocational Education with a concentration in Technology Education, Virginia Polytechnic Institute and State University, Blacksburg, Virginia
1989 Master of Science in Industrial Arts, Central Connecticut State University, New Britain, Connecticut
1979 Bachelor of Science in Industrial Arts, State University of New York College at Oswego, Oswego, New York
WORK EXPERIENCE
1991 - Present
1990 - Present
1987 - 1989
ADJUNCT FACULTY - New River Community College, Dublin, Virginia. Instruct classes in Introduction to Microcomputers, desktop publishing. Designed and developed curriculum materials for use in a microcomputer laboratory. Responsible
for some computer lab maintenance, including updating hardware and software.
GRADUATE PROJECT ASSISTANT - Virginia Governor's School for Technology, Virginia Tech. Assist Director of Virginia Governor's School for Technology. Assist the Director in organizing and administration of students and personnel involved with the Governor's School. Other duties include development and instruction of a three week intensive computer-aided design curriculum. Responsible for follow up evaluation of students after their completion of Phase I.
TRAINING AND DEVELOPMENT SPECIALIST - CADKEY INC., Manchester, Connecticut. Developed a nationwide network of 65 approved training centers, certified to offer instruction on CADKEY software products. Other responsibilities include conducting formal and informal training, seminars and workshops. Knowledge of principles of in-service training, adult learning techniques, business and organizational dynamics, and staff development. Knowledge of educational methods and techniques. Experienced with the full range of training materials, resources and research techniques. Ability to analyze and identify training needs; determine objectives of training programs; to develop, organize and conduct training
99

1986 - 1987
1984 - 1986
1981 - 1984
1980 - 1981
1979 - 1980
1979 - 1979
programs in accordance with prescribed objectives both long and short term. Considerable ability to develop curriculum and prepare training materials in written, computer-based or audiovisual formats. Ability to prepare and present clear and comprehensive written and oral reports.
INDUSTRIAL ARTS INSTRUCTOR - South Windsor High School, South Windsor, Connecticut. Taught Graphic Arts and Aviation/Aerospace Education. Designed and developed a new Aerospace curriculum. Assisted in streamlining the Graphic Arts curriculum. Advisor to National Honor Society and R/C Model Airplane and Car Club.
TERRITORY MANAGER - Larsen of Connecticut, East Hartford, Connecticut. Train
outside salespersons in the graphic arts equipment field; proposal writing; bid quotation; payroll administration; purchasing and cost efficiency. Knowledge of printing equipment, negotiate vendor contracts, purchase printing equipment, inventory control. Responsible for forecasting sales and setting accurate goals.
RETAIL STORE MANAGER AND TRAINING DEVELOPMENT SPECIALIST - Radio Shack. Retail store manager; 52% overall sales gain for last fiscal year worked. Supervised 15 full and part time employees. Created a district wide sales and management training program. This included video tape and slide productions and presentations. Conducted training classes for managers and manager-trainees. Supervise and train new managers on purchasing, inventory control, sales, management techniques and customer service.
ASSISTANT PRODUCTION MANAGER IN CHARGE OF PRODUCTION PLANNING - K & R Printers, Ellington, Connecticut. Prepare job orders; assign work; coordinate with other departments; keep work on schedule. Purchase paper, inks and supplies, negotiate and contract with outside vendor orders.
INDUSTRIAL ARTS INSTRUCTOR - East Windsor High School, East Windsor, Connecticut. Developed photography and graphic arts curriculum for grades 9 - 12. Responsible for purchasing supplies and equipment. Advisor to the yearbook staff and the freshman class, and an assistant soccer coach.
INDUSTRIAL ARTS INSTRUCTOR - Indian Lake Central School, Indian Lake, New York. Taught general Industrial Arts courses for grades 6 - 12. Specialized courses included photography, graphic arts and alternate energy forms.
SPECIAL COMPETENCIES
Computers Ten years of experience with IBM PC, UNIX, and Macintosh computers. This experience encompasses setup, administration, maintenance, and networking computers in business, educational, and personal settings. Extensive experience in many software packages for both DOS-based and Macintosh computers including CADKEY, AutoCAD, MasterCAM, SmartCAM, Microsoft Windows, Word, and Excel, Aldus PageMaker, Persuasion, and FreeHand, Novell NetWare and TOPS networking software, communication software such as PROCOMM PLUS, Ashton- Tate dBase IV and MultiMate, and many others. Excellent working knowledge of PC/MS-DOS and Macintosh System 7 operating systems. Excellent analytical and
100

debugging skills. Experienced with peripherals including laser printers, plotters, scanners, and modems.
Training Ability to determine training needs, priorities, and performance objectives. Knowledge of training methodologies including teaching, instructional systems, testing and evaluating programs, and curriculum development. Ability to design, develop, and administer training courses and programs, analyze needs and effectiveness, and create and edit training literature. Knowledge of staff development objectives, principles and practices of training, and instructional design. Excellent interpersonal and oral presentation skills.
AWARDS and HONORS
President's Club, CADKEY Inc., 1989 Student Exhibitor, VPI&SU, Juried Student Photography Exhibit, 1992
MEMBERSHIPS IN PROFESSIONAL ASSOCIATIONS
Council on Technology Teacher Education Epsilon Pi Tau International Technology Education Association Phi Delta Kappa National Association of Industrial and Technical Teacher Educators International Graphic Arts Education Association Southeastern Technology Education Conference
PRESENTATIONS
“Virginia Governor's School for the Gifted in Technology” given at the ITEA Conference, Salt Lake City, March, 1991.
COMMUNITY SERVICE ACTIVITIES
National Eagle Scout Association - Life member Merit Badge Counselor, Blue Ridge Chapter, Boy Scouts of America
LEISURE ACTIVITIES
Photography and computers Licensed private pilot
SPOUSE'S WORK
Computer programmer, programmer/analyst, local area network specialist
101

SPECIAL RESEARCH INTERESTS
Gifted and talented Computer-Aided Design
DISSERTATION
Mack, Warren E., “The Effect of Training in Computer-Aided Design on the Spatial Visualization Ability in Selected Gifted Adolescents" Virginia Polytechnic Institute and State University, 1992
REFERENCES
Dr. E. Allen Bame VPI&SU 144 Smyth Hall Blacksburg, Virginia 24061 703-231-6480
Dr. James E. LaPorte VPI&SU 144 Smyth Hall Blacksburg, Virginia 24061 703-231-6480
Mr. Sanford E. Rich Central Connecticut State University Industrial Technology Department Copemicus Hall New Britian, Connecticut 06050 203-827-7414
Dr. William E. Dugger, Jr. VPI&SU 144 Smyth Hall Blacksburg, Virginia 24061 703-231-6480
‘Dr. Charles A. Pinder VPI&SU
144 Smyth Hall
Blacksburg, Virginia 24061
703-231-3056
Mr. Jeffery D. Clark Central Connecticut State University Graduate Teaching Assistant Industrial Technology Department
Copernicus Hall New Britian, Connecticut 06050
203-827-7414