Dewatering \Vith A Plate And Frame Filter Press ... - VTechWorks
106
I1 II I The Effect Of Polymer Dose and Mixing Intensity On Sludge I Dewatering \Vith A Plate And Frame Filter Press I by ‘ Daniel P. Lynch Thesis submitted to the Faculty of the Virginia Polytechnic Institute and State University in partial fulfillment of the requirements for the degree of Master of Science in Environmental Engineering APPROVED: \o T. Novak, an William R. Knocke Clifford W. RandallFebruary 1989Blacksburg, VirginiaI I I
-
Upload
khangminh22 -
Category
Documents
-
view
0 -
download
0
Transcript of Dewatering \Vith A Plate And Frame Filter Press ... - VTechWorks
I1III The Effect Of Polymer Dose and Mixing Intensity On Sludge I
Dewatering \Vith A Plate And Frame Filter Press Iby
‘ Daniel P. Lynch
Thesis submitted to the Faculty of the
Virginia Polytechnic Institute and State University
in partial fulfillment of the requirements for the degree ofMaster of Science
inEnvironmental Engineering
APPROVED:
\oT. Novak, an
William R. Knocke Clifford W.RandallFebruary
1989Blacksburg,VirginiaI
II
V1
The Effect Of Polymer Dose and Mixing Intensity On Sludge
Dewatering \Vith A Plate And Frame Filter Press
byDaniel P. Lynch
John T. Novak, Chairman
Environmental Engineering
(ABSTRACT)
Experiments were performed with anaerobically digested sludge and a plate and frame filter pressto determine filter press performance over a range of polymer doses and under a variety of sludge
and polymer mixing conditions. In addition, bench·scale polymer dosing and mixing experiments
were conducted with the same sludge samples to determine the relationship between the bench·scale
tests and actual plate and frame filter press performance. Dewatering rate was measured in bench-s scale experiments with a Capillary Suction Time (CST) device and dewatering rate in pilot-scale
experiments was quantiiied by measuring the volume of frltrate from the plate and frame press._ The dirnensionless quantity, Gt, was used to measure total mixing intensity input where G was theli
mean velocity gradient and t was the mixing time for the sludge and polymer.
The performance of the plate and frame filter press was optimized by predicting polymer dose with
a bench·scale mixing device. For the plate and frame filter press used in this study, the polymer
dose was selected by fmding the optirnum polymer dose for the bench-scale mixing system set at a
Gt value of 30,000. The sludge and polymer were mixed with a Gt value of 5000 prior to intro-
duction to the filter press. The polymer dosing and mixing scheme that was developed for the filterpress in this study indicates that the filter press imparts some shear (G) on the sludge and that
polymer must be provided to reagglomerate fractured sludge particles. An estimate of the Gt value
for the filter press that was used in this study is 15,000 to 40,000.
Acknowledgements
Acknowledgements iii
Table of ContentsIntroduction ............................................................ 1
Literature Review ........................................................ 3i
Polyelectrolyte Conditioning of Sludge .........................................I 3
The Effects of Mixing and Polymer Dose ....................................... 5The Plate and Frame Filter Press ............................................ 12
Methods and Materials ................................................... 15Sludge Samples ....,.................................................... 15
Polymer Selection and Preparation .......................................... 16
Bench—Scale Mixing Device ...........................,.................... 18
Bench—Sca1e Dewatering Tests .............................................. 19
Pilot-Scale Mixing Device ...........................................,..... 21
Pilot-Scale Sludge Dewatering .............................................. 22
Results and Discussion ................................................... 28Polymer Dose and Mixing Intensity .......................................... 28
Table of Contents iv
EA
Bench-Scale Polymer Dosing And Mixing Intensity Tests ........................29Pilot-ScalePolymer Dosing and Mixing Intensity Tests .......................... 43
Relationship Between Bench-Scale and Pilot-Scale Tests ......................... 50Effect Of Varying G and t On Filter Press Performance ........................... 57
Effect Of Mixing Intensity and Dose With Two Polymers .......................... 60Selection Of Doses .................................................... 60Characterization With CST Versus Gt Curves ................................. 64Pilot-Scale Experiments With Polymer 52E#l ................................. 64
Pilot Scale Experiments With Polymer 52I ................................... 70
Proposed Filter Press Polymer Dosing and Mixing Scheme ....................... 84
Sludge Cake Dry Solids Concentration ........................................ 85
Summary and Conclusions ................................................. 92
Bibliography ........................................................... 95
Vita ................................................................. 97
Table of Contents vl _
11
List of Illustrations
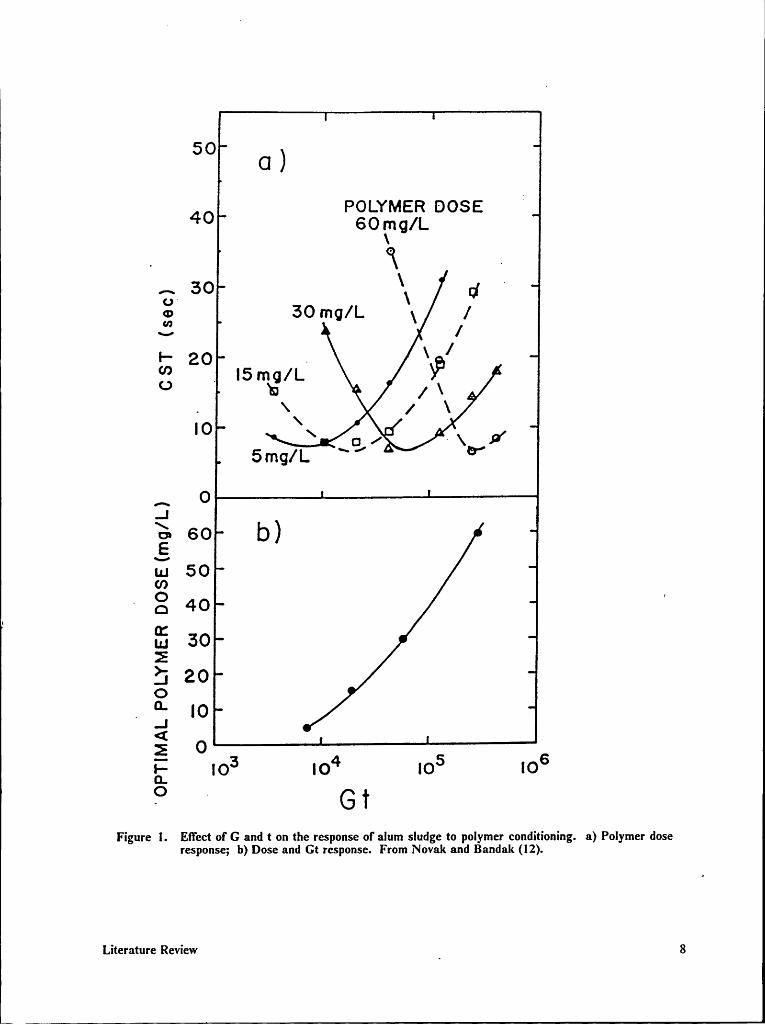
Figure 1. Effect of G and t on the response of alum sludge to polymer conditioning. a) Polymerdose response; b) Dose and Gt response. From Novak and Bandak (12). ..... 8
Figure 2. Data showing lack of correlation between CST and Gt for unconditioned sludges.From Novak and Bandak (12). .................................... 10
Figure 3. Data showing the correlation between CST and GM! for unconditioned sludges.From Novak and Bandak (12). .................................... 11
Figure 4. Plate and frame filter press schematic. (JWI Inc., Holland, Michigan) ........ 25
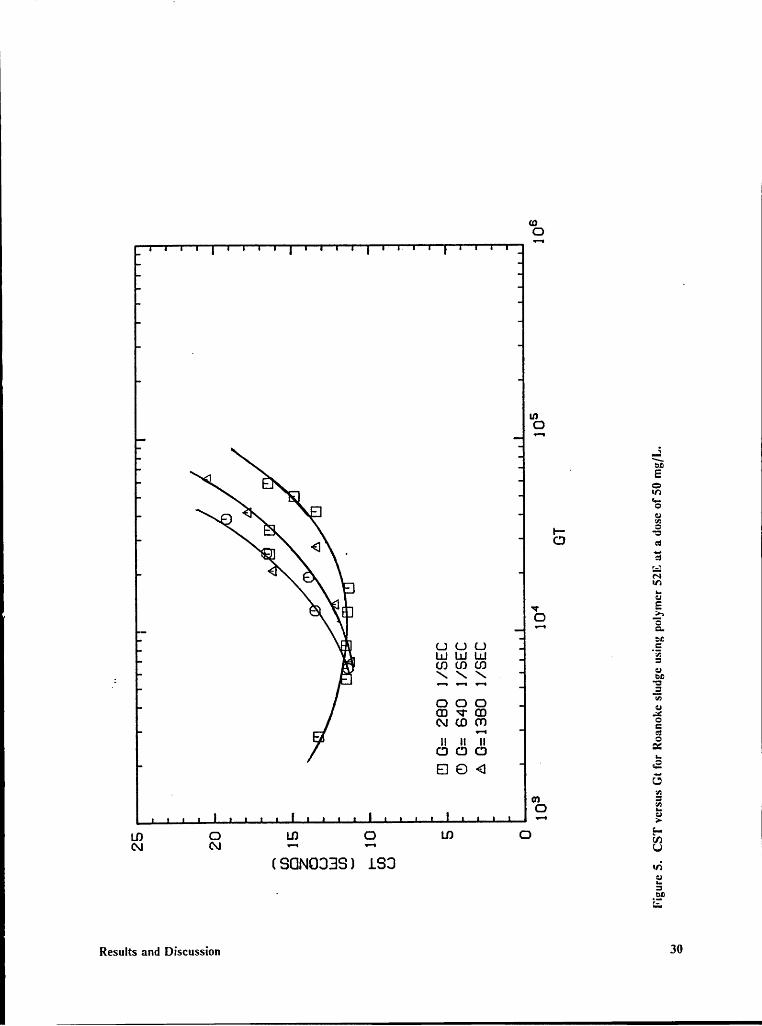
Figure 5. CST versus Gt for Roanoke sludge using polymer 52E at a dose of 50 mg/L. . . . 30
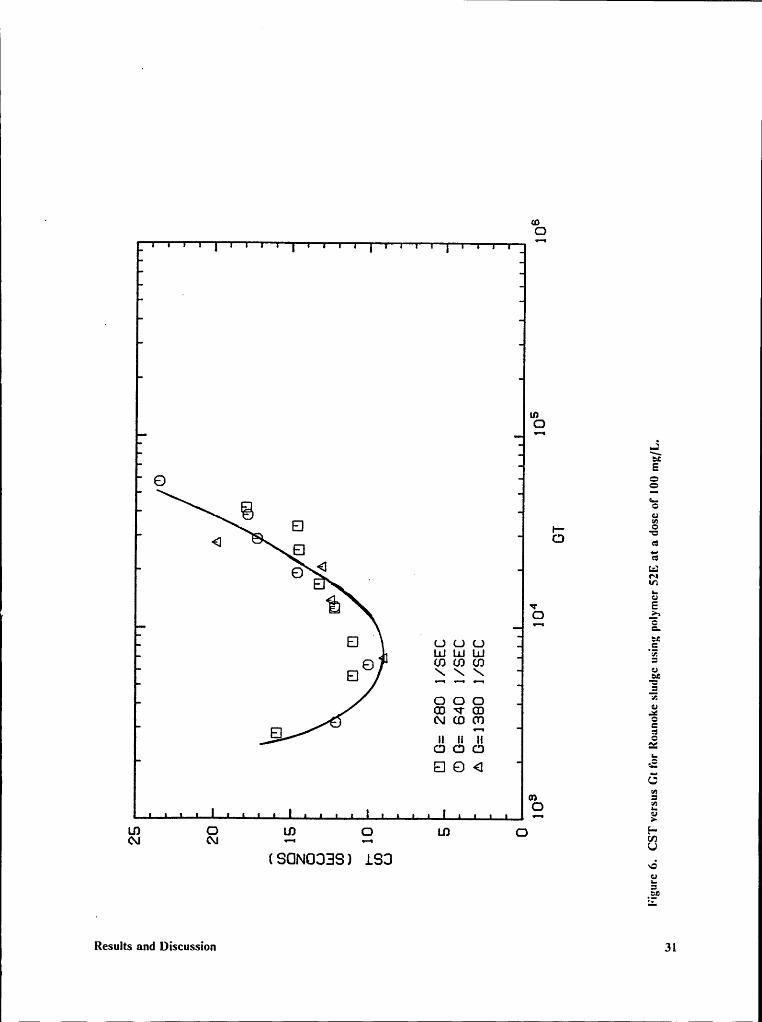
Figure 6. CST versus Gt for Roanoke sludge using polymer 52E at a dose of 100 mg/L. . . 31
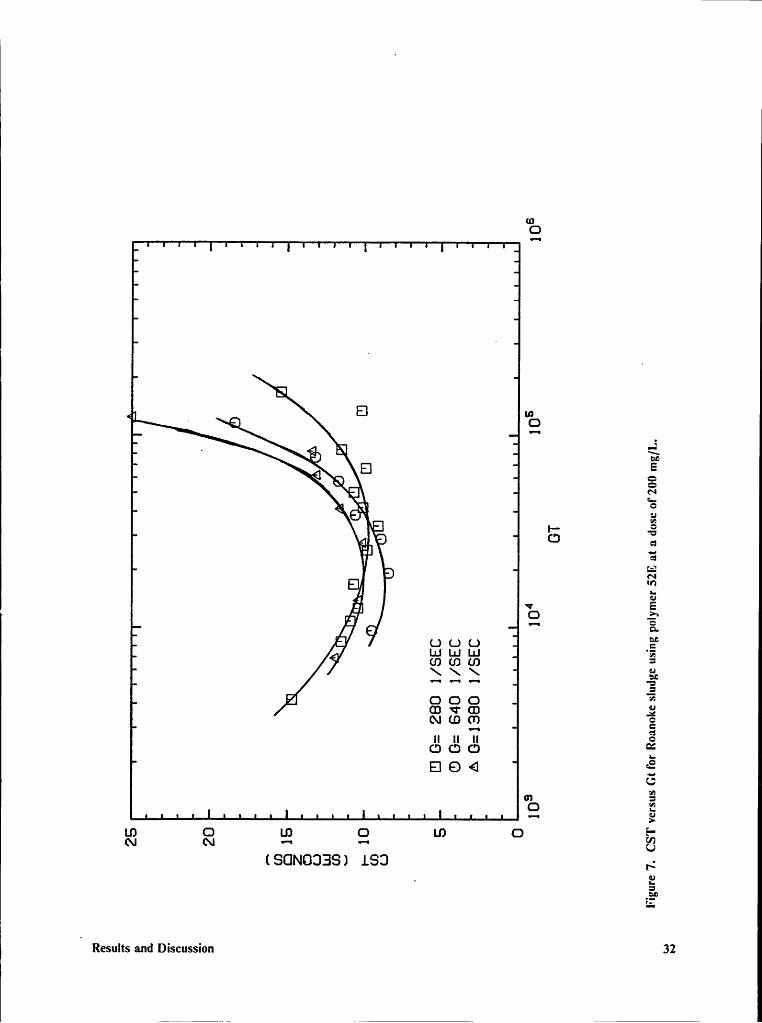
Figure 7. CST versus Gt for Roanoke sludge using polymer 52E at a dose of 200 mg/L. . . 32
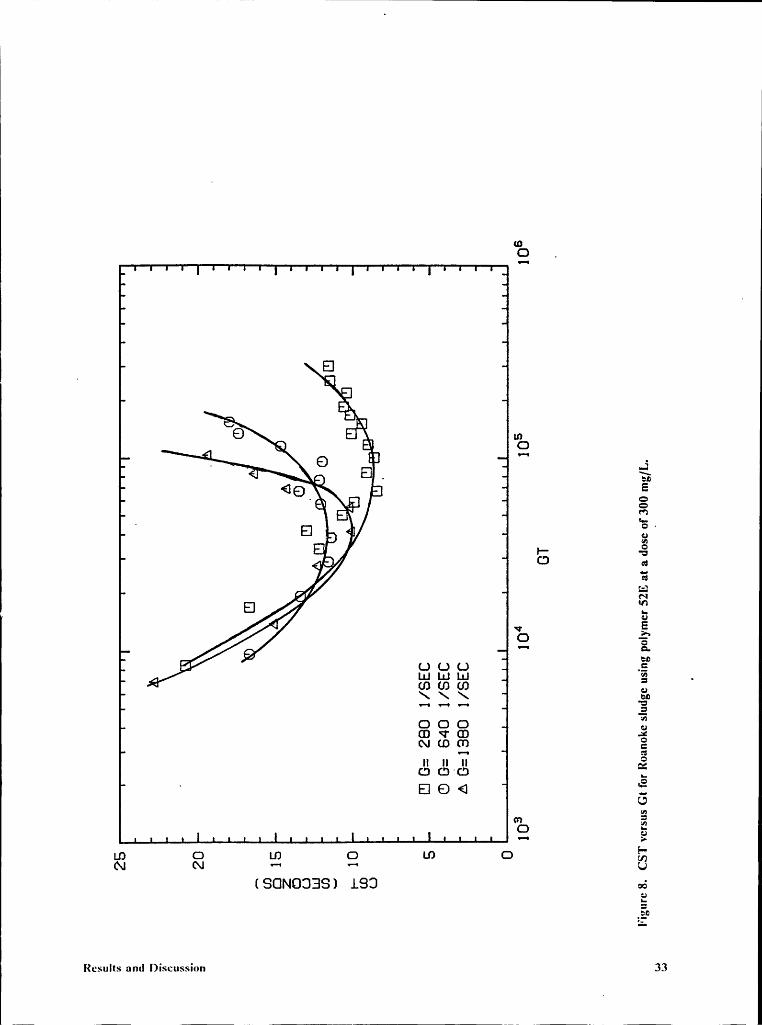
Figure 8. CST versus Gt for Roanoke sludge using polymer ·52E at a dose of 300 mg/L. . . 33
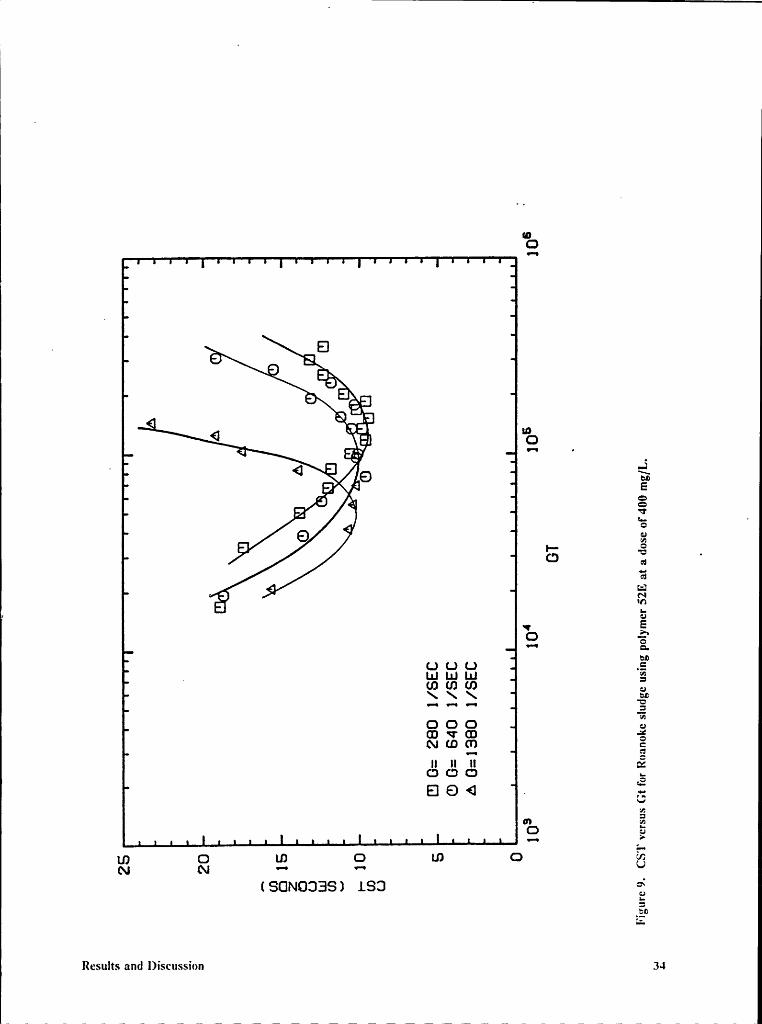
Figure 9. CST versus Gt for Roanoke sludge using polymer 52E at a dose of 400 mg/L. . . 34
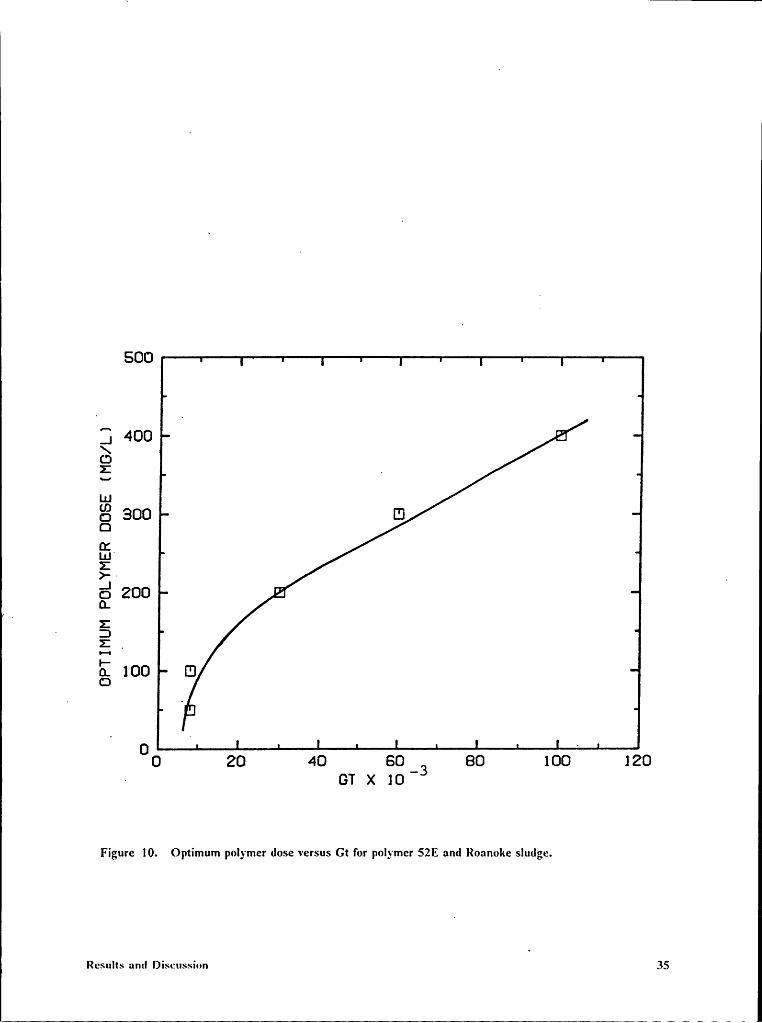
Figure 10. Optimum polymer dose versus Gt for polymer 52E and Roanoke sludge. ...... 35
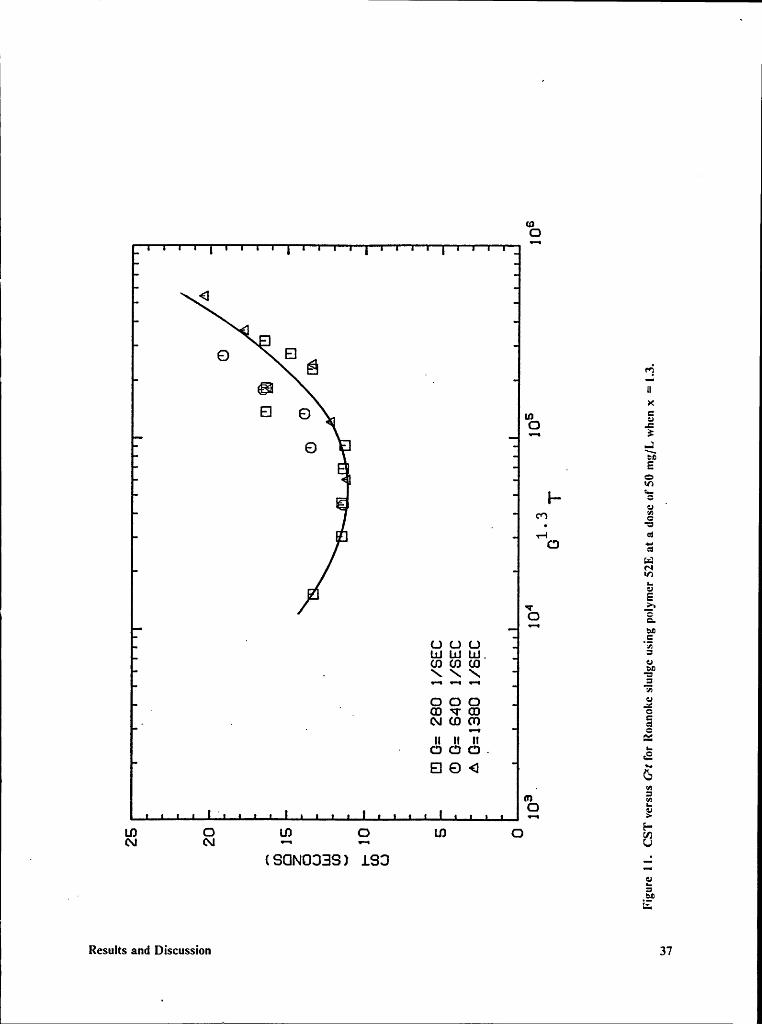
Figure 11. CST versus G*t for Roanoke sludge using polymer 52E at a dose of 50 mg/L whenx = 1.3. .................................................... 37
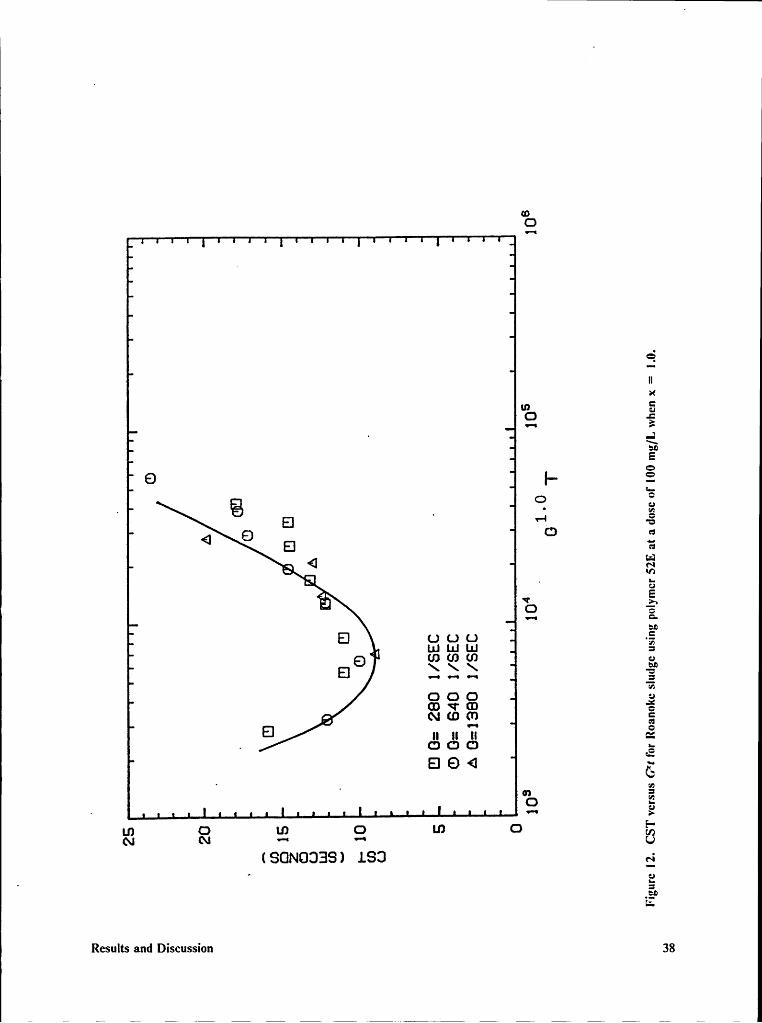
Figure 12. CST versus G*t for Roanoke sludge using polymer 52E at a dose of 100 mg/L whenx = 1.0. .................................................... 38
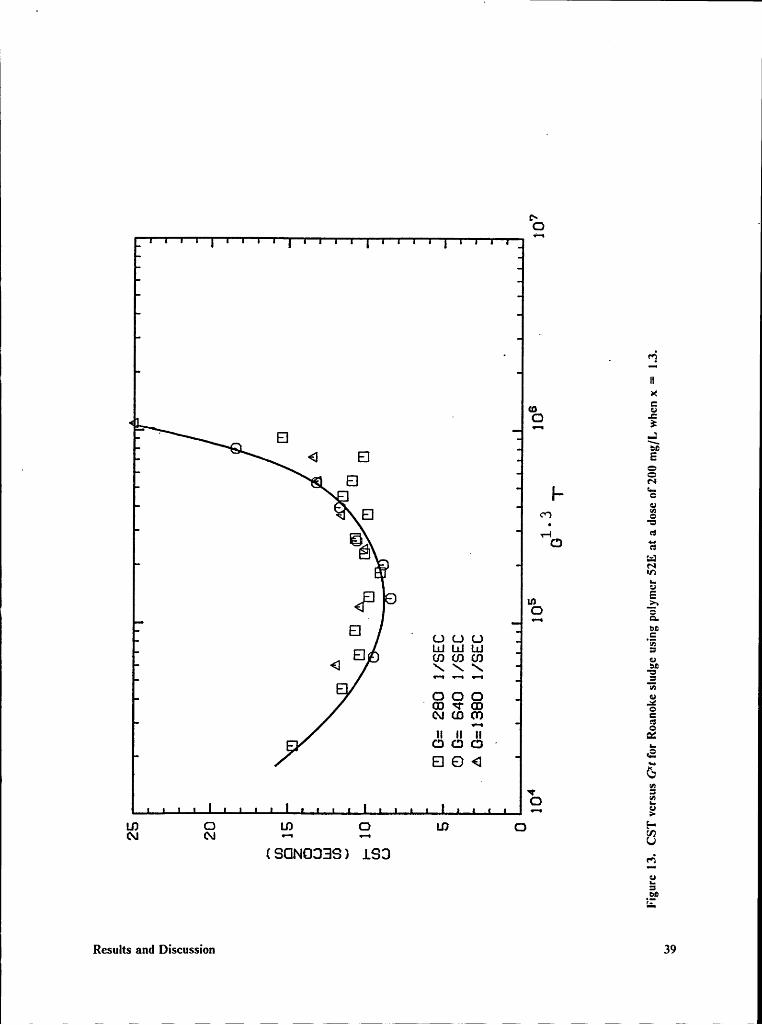
Figure 13. CST versus G*t for Roanoke sludge using polymer 52E at a dose of 200 mg/L whenx = 1.3. .................................................... 39
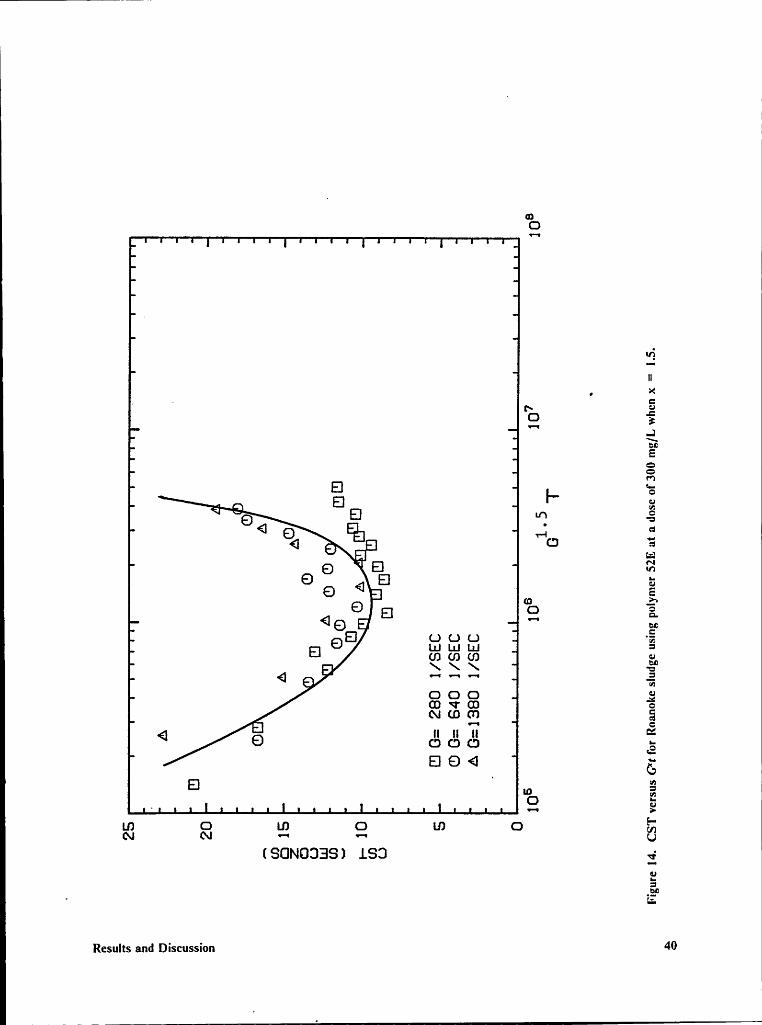
Figure 14. CST versus G*t for Roanoke sludge using polymer 52E at a dose of 300 mg/L whenx = 1.5. .................................................... 40
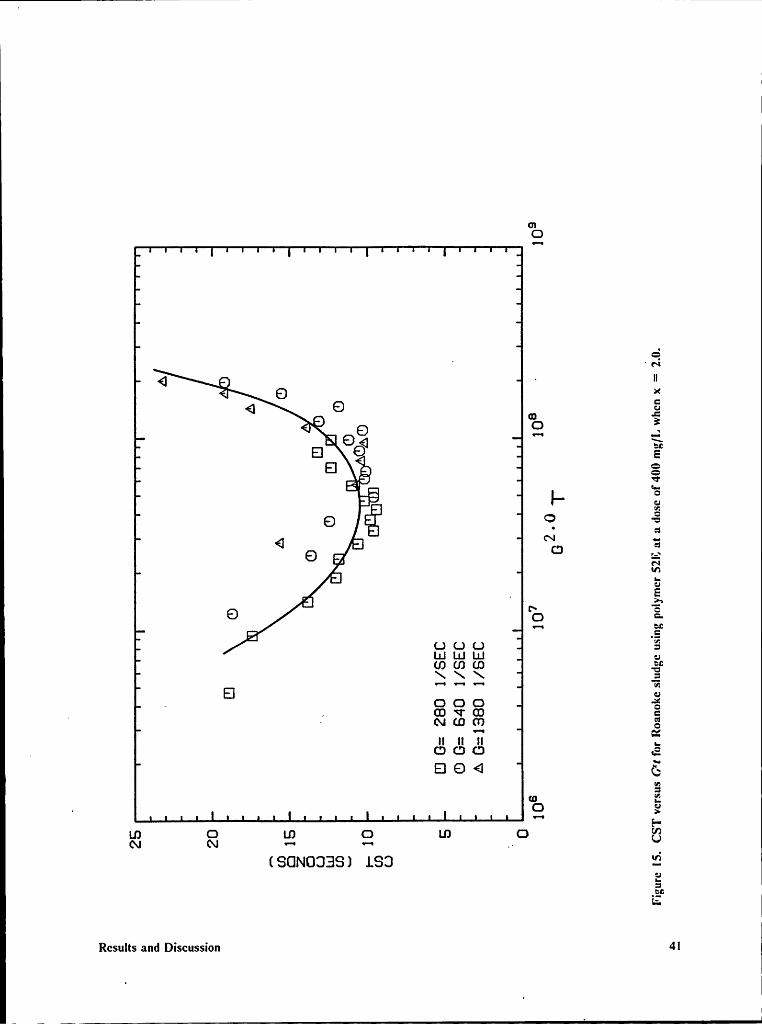
Figure 15. CST versus G*t for Roanoke sludge using polymer 52E at a dose of 400 mg/L whenx = 2.0. .................................................... 41
Figure 16. Exponent of G versus polymer dose for Roanoke sludge using polymer 52E. . . . 42
List of Illustrations ‘ vi
Figure 17. Cumulative tiltrate volume versus time for four polymer doses of polymer 52E withRoanoke sludge and Gt= 5000. .................................... 44
Figure 18. Cumulative frltrate volume versus time for four polymer doses of polymer 52E withRoanoke sludge and Gt= 10,000. .................................. 45
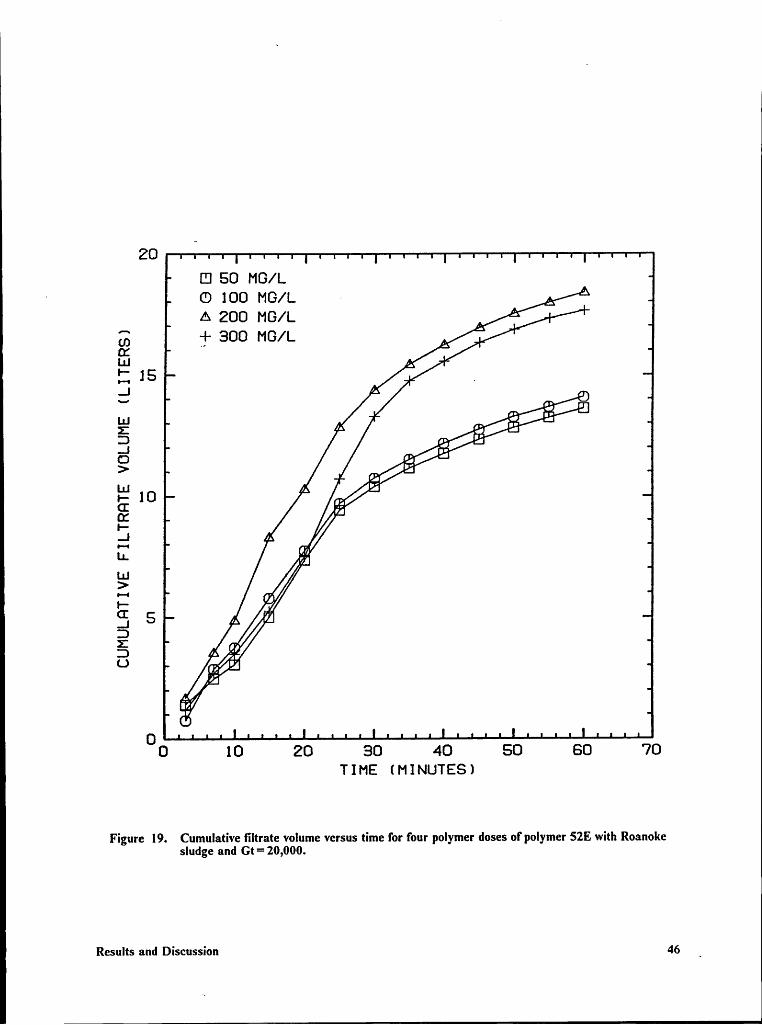
Figure 19. Cumulative frltrate volume versus time for four polymer doses of polymer 52E withRoanoke sludge and Gt = 20,000. .................................. 46
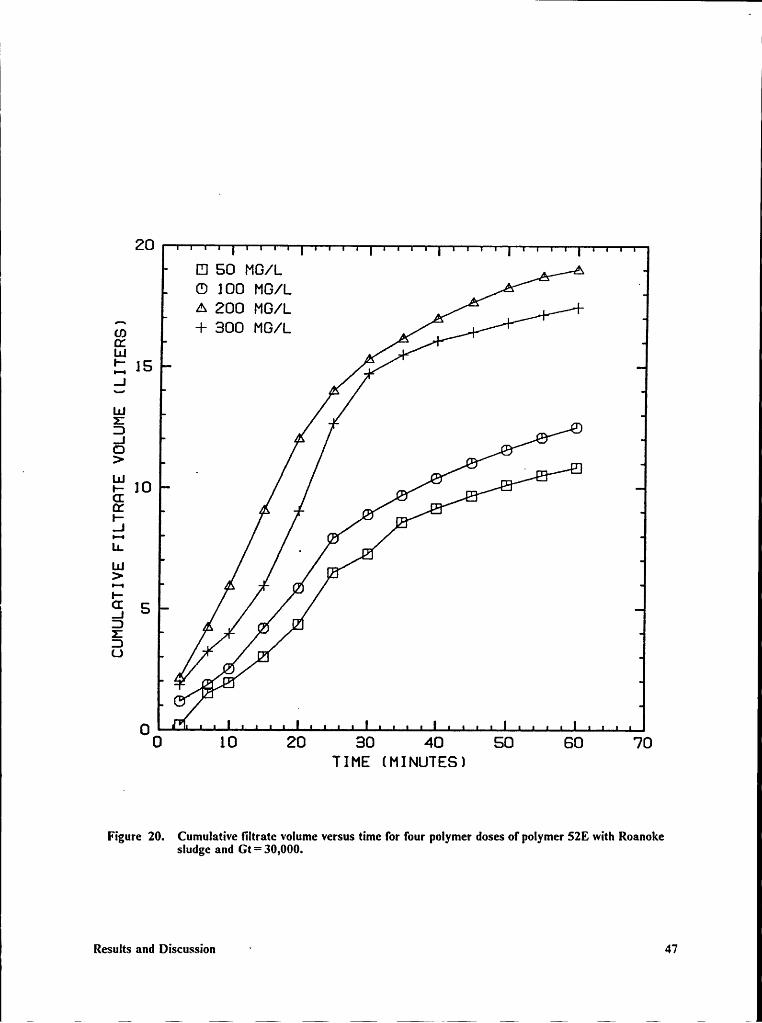
Figure 20. Cumulative frltrate volume versus time for four polymer doses of polymer 52E withRoanoke sludge and Gt = 30,000. .................................. 47
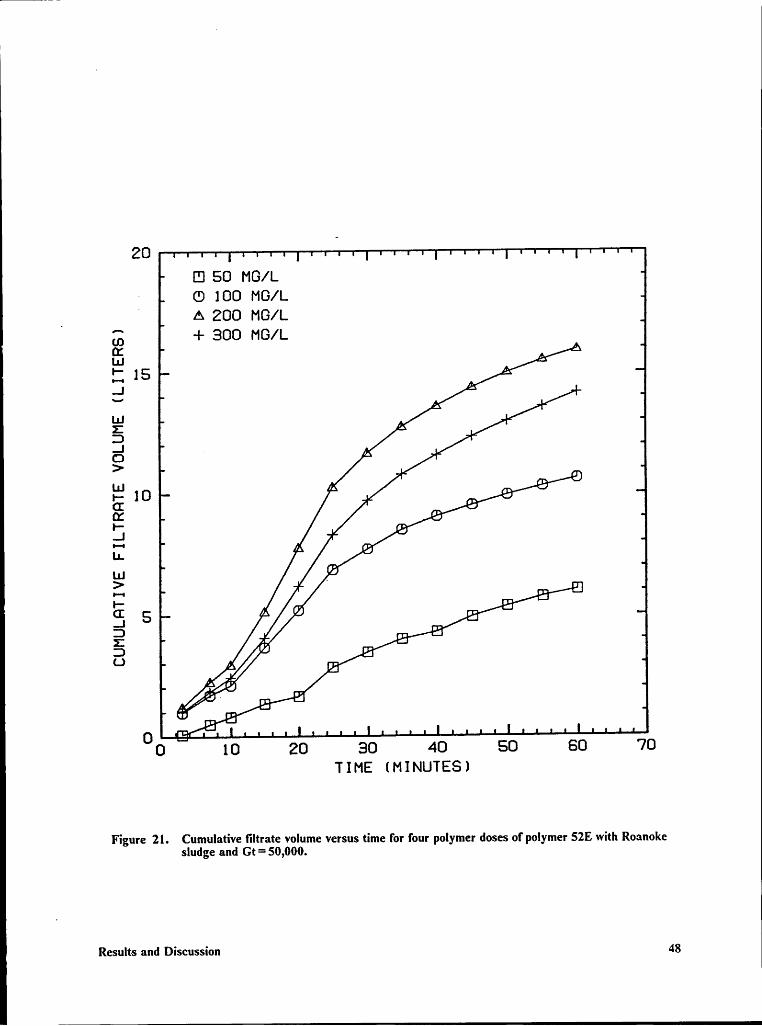
Figure 21. Cumulative tiltrate volume versus time for four polymer doses of polymer 52E withRoanoke sludge and Gt = 50,000. .................................. 48
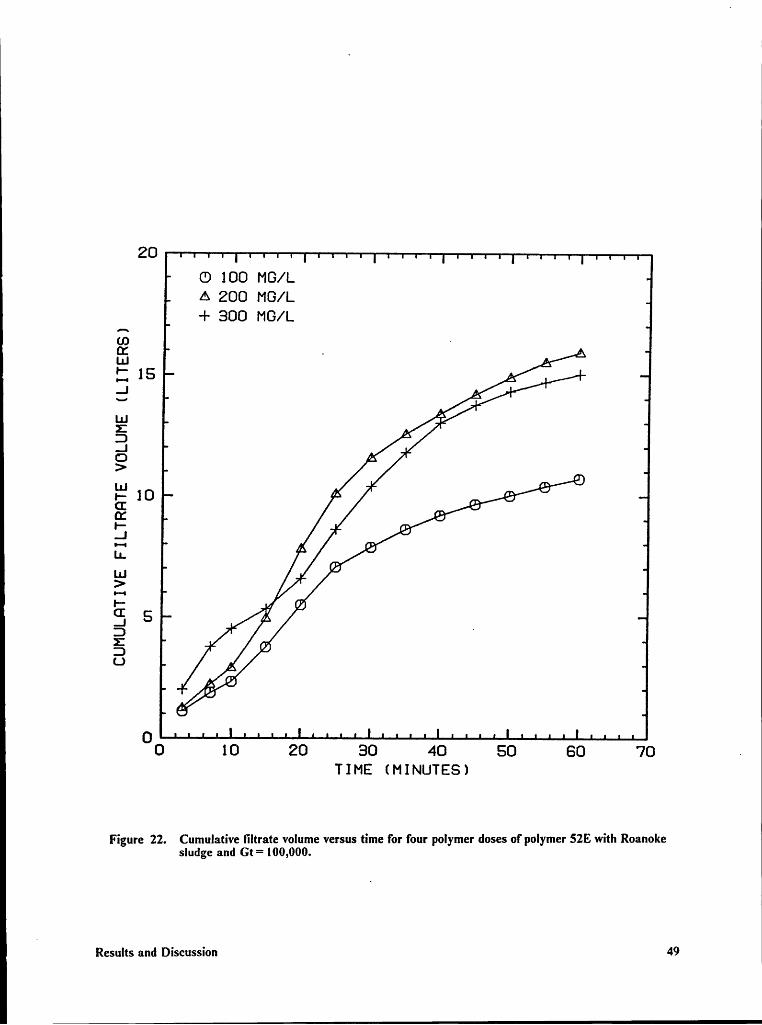
Figure 22. Cumulative filtrate volume versus time for four polymer doses of polymer 521-3 withRoanoke sludge and Gt= 100,000. ........................._........ 49
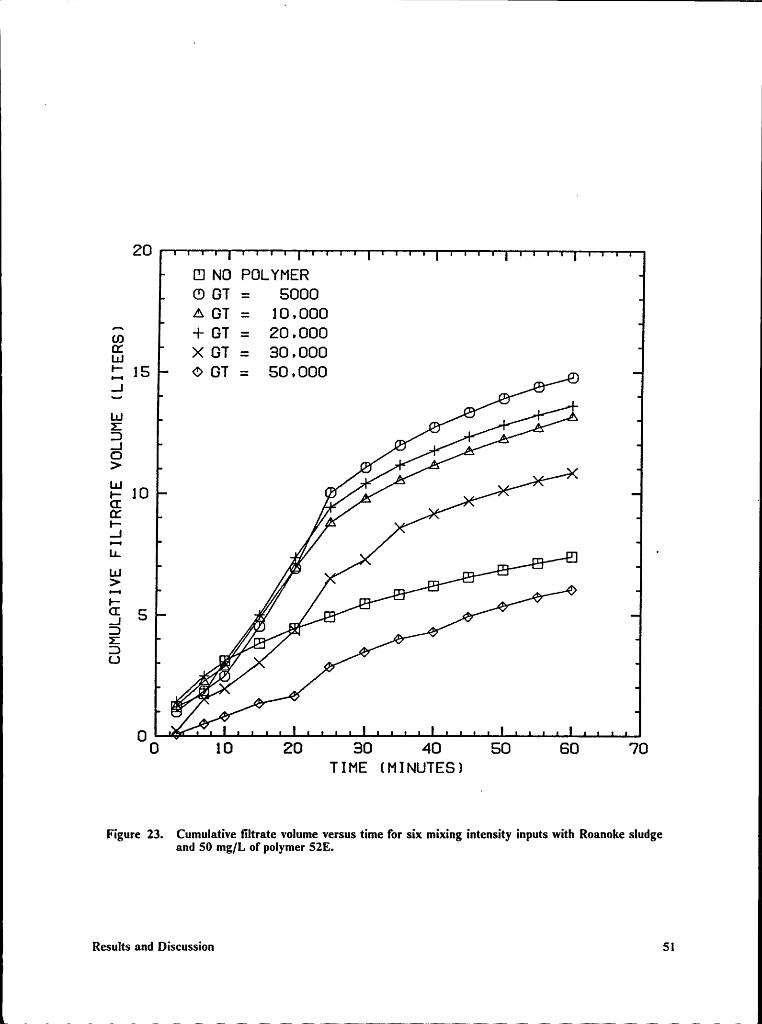
Figure 23. Cumulative filtrate volume versus time for six intensity inputs with Roanokesludge and 50 mg/L of polymer 52E. ................................ 51
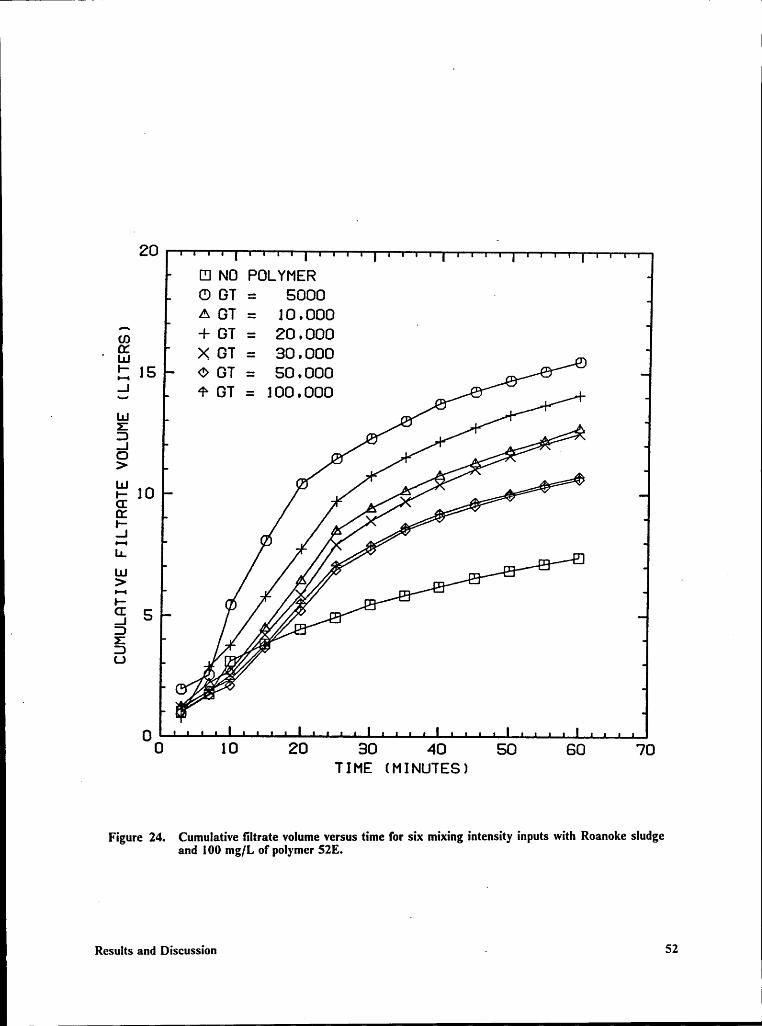
Figure 24. Cumulative frltrate volume versus time for six mixing intensity inputs with Roanokesludge and 100 mg/L of polymer 52E. ............................... 52
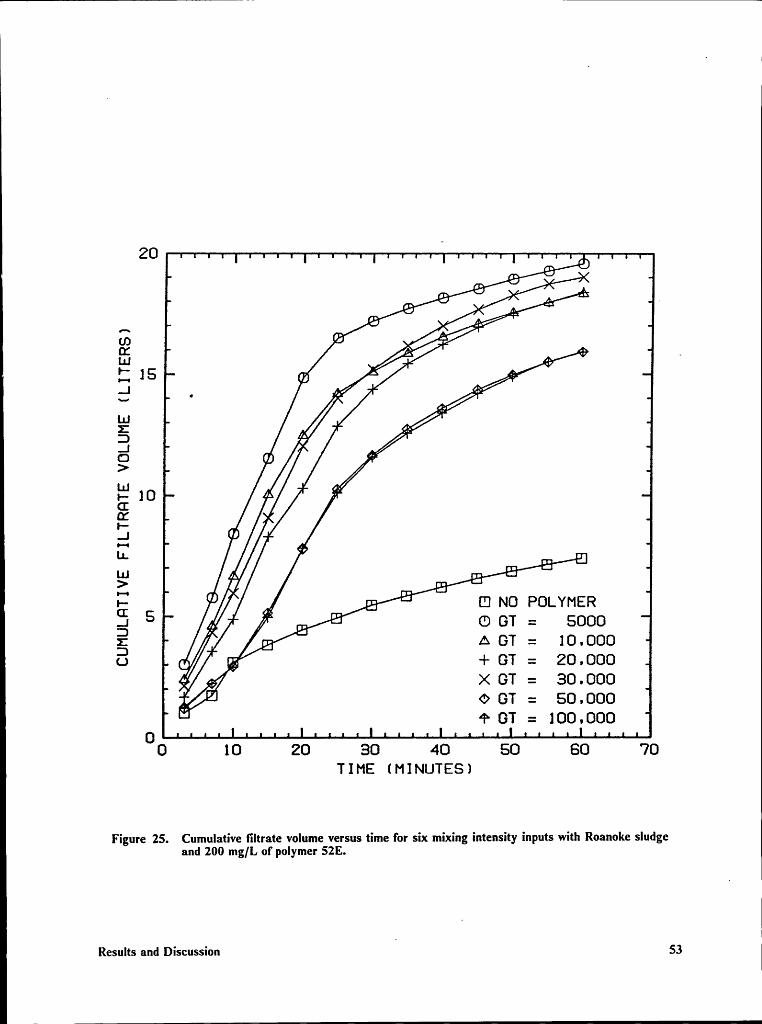
Figure 25. Cumulative frltrate volume versus time for six mixing intensity inputs with Roanokesludge and 200 mg/L of polymer 5213. ............................... 53
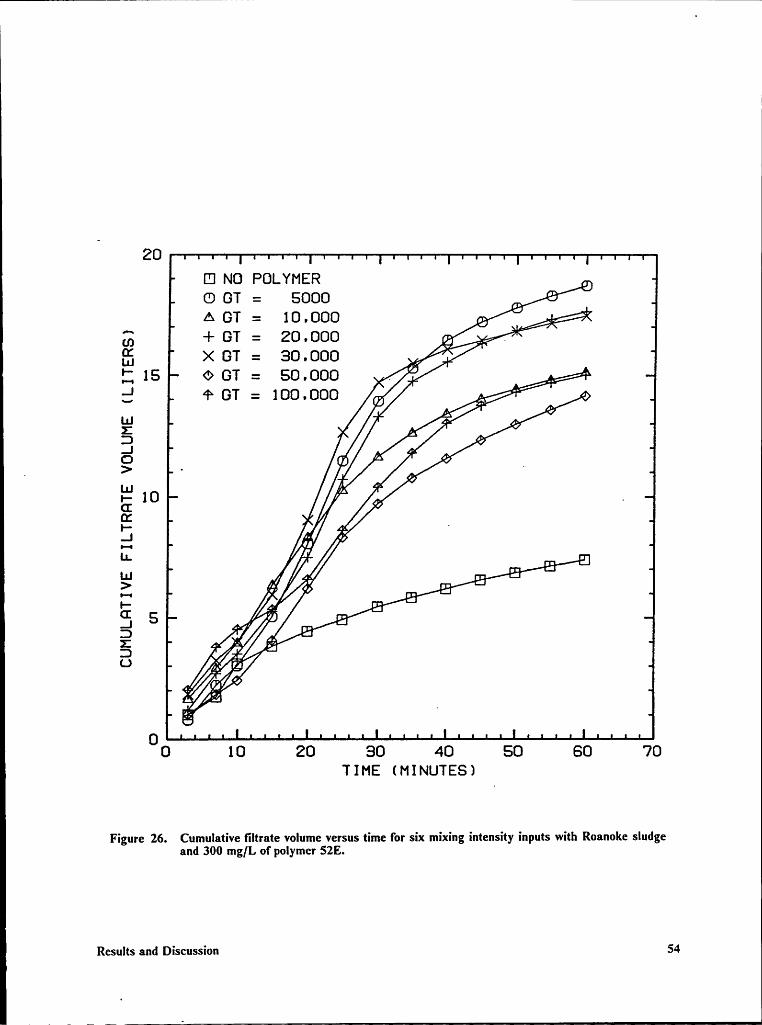
Figure 26. Cumulative tiltrate volume versus time for six mixing intensity inputs with Roanokesludge and 300 mg/L of polymer 52E. ............................... 54
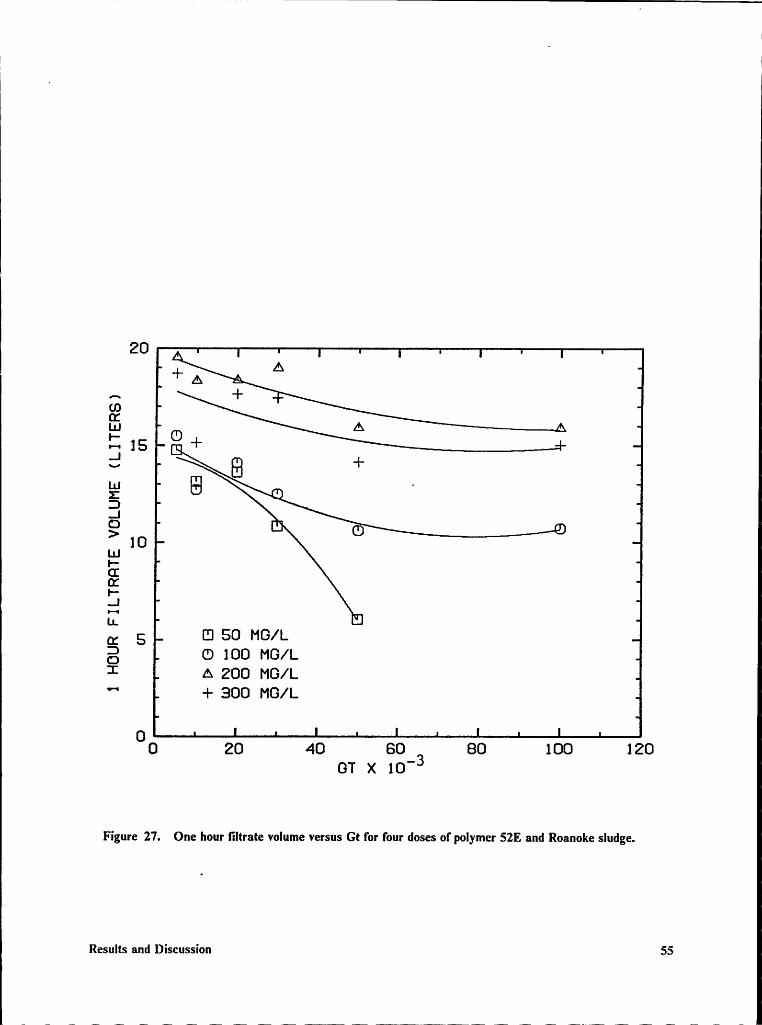
Figure 27. One hour tiltrate volume versus Gt for four doses of polymer 52E and Roanokesludge. ...................................................... S5
Figure 28. CST versus polymer dose for two Gt values with Pepper’s Ferry 1 sludge andpolymer 52E. ................................................. 58
Figure 29. CST versus polymer dose for Gt = 100,000 with Pepper’s Ferry 2 sludge andpolymer 52E#1. ............................................... 59
Figure 30. Cumulative frltrate versus time for Pepper’s Ferry 1 sludge at a dose of 650 mg/Lof polymer 52E where Gt= 5000. .................................. 61
Figure 31. Cumulative filtrate versus time for Pepper’s Ferry 1 sludge at a dose of 800 mg/Lof polymer 52E where Gt= 30,000. ................................. 62
Figure 32. Cumulative frltrate versus time for Pepper’s Ferry 2 sludge at a dose of 600 mg/Lof polymer 52E#1 where Gt= 100,000. .............................. 63
Figure 33. Optimum dose curves for live Gt values using Pepper’s Ferry 3 sludge and polymer52E#l. ..................................................... 65
Figure 34. Optimum dose curves for five Gt values using Pepper’s Ferry 3 sludge and polymer521. ........................................................ 66
Figure 35. CST versus Gt for Pepper’s Ferry 2 sludge using polymer 52E#1 at a dose of 800mg/L. ...................................................... 67
List of lllustrations vii
11
1Figure 36. CST versus Gt for Pepper’s Ferry 2 sludge using polymer 52E#1 at a dose of 900
mg/L. ...................................................... 68
Figure 37. CST versus Gt for Pepper’s Ferry 2 sludge using polymer 52E#l at a dose of 1000mg/L. ...................................................... 69
Figure 38. Cumulative filtrate volume versus time for three polymer doses of polymer 52E#1with Pepper’s Ferry 3 sludge and Gt = 5000. .......................... 71
Figure 39. Cumulative fltrate volume versus time for three polymer doses of polymer 52E#1with Pepper’s Ferry 3 sludge and Gt= 30,000. .......................... 72
Figure 40. Cumulative filtrate volume versus time for three polymer doses of polymer 52E#lwith Pepper’s Ferry 3 sludge and Gt= 60,000. ......................... 73
Figure 41. Cumulative filtrate volume versus time for three Gt values using 800 mg/L ofpolymer 52E#1 and Pepper’s Ferry 3 sludge. .......................... 74
Figure 42. Cumulative filtrate volume versus time for three Gt values using 900 mg!L ofpolymer 52E#l and Pepper’s Ferry 3 sludge. .......................... 75
Figure 43. Cumulative filtrate volume versus time for three Gt values using 1000 mg/L of, polymer 52E#1 and Pepper’s Ferry 3 sludge. .......................... 76
_ Figure 44. Cumulative filtrate volume versus time for three doses of polymer 521 with Pepper’sFerry 3 sludge and Gt= 5000. ..................................... 78
Figure 45. Cumulative filtrate volume versus time for three doses of polymer 521 with Pepper’sFerry 3 sludge and Gt= 30,000. .................................... 79
Figure 46. Cumulative filtrate volume versus time for three doses of polymer 521 with Pepper’sFerry 3 sludge and Gt = 60,000. .................................... 80
Figure 47. Cumulative filtrate volume versus time for three Gt values using 750mg/L ofpolymer 521 and Pepper’s Ferry 3 sludge. ............................ 81
Figure 48. Cumulative filtrate volume versus time for three Gt values using 850 mg/L ofpolymer 521 and Pepper’s Feny 3 sludge. ............................ 82
Figure 49. Cumulative frltrate volume versus time for three Gt values using 950 mg/L ofpolymer 521 and Pepper’s Ferry 3 sludge. ............................ 83
Figure 50. Optimum dose curves for three Gt values using Pepper’s Ferry 4 sludge andpolymer 521. ................................................. 86
Figure 51. Final cake solids and cumulative filtrate versus time for three doses of polymer 521with Pepper’s Ferry 4 sludge and Gt= 5000. .......................... 87
1Figure 52. Final cake solids and cumulative filtrate versus time for three doses of polymer 521
with Pepper’s Ferry 4 sludge and Gt = 30,000. ......................... 88
Figure 53. Final cake solids and cumulative filtrate versus time for three doses of polymer 521 1with Pepper’s Ferry 4 sludge and Gt= 60,000. ......................... 89 1
Figure 54. One hour filtrate volume versus final sludge cake dry solids concentration forninefilterpress experirnents. A least squares fit is shown. .................... 91 1
1
List of Illustrations viii 11
— 1
P
List of Tables
Table 1. Polymer Characteristics Supplied By the Nalco Chemical Company. .......... 17Table 2. Calibration of Bench Scale Mixing Device. ............................. 20Table 3. Estimated G Values For The Pilot-Scale Mixing Device. From Zoccola (20). . . . 23
Table 4. Comparison of Cumulative Filtrate Volumes For Two Polymers Using Pepper'sFerry 3 Sludge. ................................................ 77
List of Tables ix
Introduction
Sludge dewatering is an important component of any water or wastewater treatment system. The
major treatment processes in a system cormnonly produce residual materials that contain incorpo- ·rated water. This water may amount to up to 99% of the total sludge volume. Thus, the primary
purpose of a sludge dewatering system is to remove water, thereby reducing the quantity of materialto be handled. In this manner, costs for both transportation and final disposal can be reduced.
Dewatering of sludge from municipal and industrial processes is usually accomplished using me-chanical dewatering devices. To encourage dewatering, organic polymers are often used with thesemechanical devices to improve dewatering rates and increase solids capture.
In order to use organic polymers and mechanical dewatering equipment to their maximum poten-tial, the proper polymer and polymer dose must be determined. In addition, research has shown
that the intensity with which the sludge and polymer are mixed may also play an important rolein dewatering. In general, adequate information about polymer selection is available from field and
laboratory investigations and from manufacturers’ bulletins. In addition, the relationship betweenpolymer dose and mixing intensity has been explored using bench-scale mixing equipment. How-
ever, the information obtained from bench studies has not been transferred to actual sludge dewa-
tering equipment. This investigation was an attempt to apply these bench-scale mixing intensity
principles to a plate and frame filter press. The study was undertaken with two proposed objectives:
IntroductionV
l
»1. Evaluate plate and frame filter press performance over a range of polymer doses and under a
variety of polymer mixing conditions.
· 2. Determine the relationship between bench-scale polymer mixing intensity and dosing tests andactual plate and frame filter press performance.
{ .{ Introduction Z
l
Literature Review
This chapter will review literature in three areas. First, polyelectrolyte conditioning of sludges will
be discussed. This will entail a review of articles pertaining to sludge characteristics and the se-° lection of polymers. Secondly, the effect of mixing intensity on the selection of polymer type and
dose will be discussed. This work considers the results of bench scale studies performed to try andl
Lbetter understand and predict polymer dosing requirements. The final area discussed will be theoperation of plate and frame filter presses. A brief description of the machine will be followed by
a review of previous filter press research. This work primarily involves attempts to better predictand optimize press performance.
Polyelectrolyte Conditioning of Sludge
Sludge is conditioned prior to mechanical dewatering to improve water removal and solids capture.
The _three most common conditioning systems use inorganic chemicals such as lime and ferric
chloiide, organic polyelectrolytes, or thermal processing. Most commercial polyelectrolytes are
long chain, water soluble organic chemicals. The use of these organic polyelectrolytes has become
Literature Review 3
I1
common in sludge dewatering systems within the last ten years. Organic polymers are often selectedover inorganic chemicals because they produce little additional sludge mass, material handling is
cleaner, and they will not reduce the fuel value of the sludge if it is to be incinerated. Polymers are
supplied in both liquid and powder form, may be either cationic, nonionic, or anionic, and aremanufactured in a variety of molecular weights, structural configurations and charge densities. The
primary objective of conditioning is to increase particle size by combining smaller sludge particles
into larger flocs. Polymers in solution perforrn this task by several possible mechanisms, includingthrough neutralization of the particles and by agglomerating small particles through interparticlebridging (1).
One objective of research in this area has been to identify various sludge characteristics on whichpolymer selection can be based. Sludge characteristics include type (chemical or biological), pHand particle size. Polymers are generally described by monomeric structure, charge type, charge
density and molecular weight. Some general guidelines utilizing both polymer and sludge charac-
- teristics have been developed to aid in polymer selection and dosing. Novak and O’Brien (2) in-
vestigated the effect of polymer and sludge characteristics in the selection and dosing requirementsof polymers for chemical sludges. They considered six different sludge characteristics and four
polymer characteristics. They found that for the selection of the best polymer for chemical sludges
that sludge pH and polymer molecular weight were the most important. Additionally, they con-
cluded that polymer molecular weights above l million were required for effective conditioning.
Finally, they observed that polymer dose requirements decreased as the molecular weight of the
polymer was increased.
In 1977, O’Brien and Novak (3) further investigated polymer and sludge characteristics and their
impact on polymer selection. They once again used chemical sludges and focused on pH. They
developed some general criteria involving pH and polymer charge and stated that sludge pH and
the charge density of the polymer appeared to be key parameters in obtaining good dewatering.Novak and Piroozfard (4) continued the investigation of the conditioning of water treatment
‘ Literature Review 4
sludges. They identified sludge particle size as an important criteria and reported that the average
particle size is maximized at the optimum polymer dose. °
In 1985 Cole and Singer (5) investigated the conditioning of anaerobically digested sludge. Theyset out to determine the most effective type of polymer for dewatering with a particular interest in
the effects of charge. They tested a variety of commercially available polymers and reported that
· high molecular weight (greater than 1 million) cationic polymers were most effective for
anaerobically digested sludge. Additionally, effective dewatering could be achieved with these
polymers in both high and low charge density varieties. By examining the surface charge on the
flocculated sludge particles, they were able to conclude that charge neutralization was not neces-i
sarily required in order to achieve good dewatering.
The Eßfects of Mixing and Polymer Dose
A reasonable amount of information is available regarding polymer selection for a particular sludge.
Some general rules have been developed by researchers and these may be applied by examining
some basic characteristics of the sludge to be dewatered. Research has also indicated that once the
polymer has been selected, two other parameters will greatly effect the_ performance of the dewa-
tering system. These two parameters are polymer dose and the mixing intensity to which the sludge
and polymer are subjected. Total mixing energy is expressed by the product of mean velocity gra-
dient, G, (V1) and time, (t). Thus, the mixing energy input, Gt, is a dimensionless quantity. Some
information based on sludge characteristics and machinery type is available but achieving maximum
performance from a dewatering system still requires a trial and error approach. Based on infor-
mation from bench·scale experiments, mixing energy input (Gt) may provide a way of reliably
predicting polymer dose for a particular dewatering device.
Literature Review 5
l
n
Early polyelectrolyte research indicated that mixing intensity might play a role in sludge dewatering. lBirkner and Morgan (6) reported in 1968 that an increase in the intensity of the mixing process ltended to break up polymer conditioned particles in a colloidal suspension. Bugg et al. (7) found
that the dewatering rate of polymer conditioned alum sludge decreased with increased mixing time.In an investigation into the dewatering of chemical sludges, it was reported that over or undermixing tended to reduce the effectiveness of the polymer as a conditioner (3). In a 1979 study of
polymers for use in direct water filtration, Stump and Novak (8) concluded that mixing intensity
was critical in determining the performance of the polymer. The optimum mean velocity gradientwas reported as being in the range of 300 to 600 sec·‘.
In 1980, Novak and Haugan (9) sought to investigate the mechanisms by which cationic polymers ·condition activated sludges. They reached a. number of conclusions related to mixing. They re-ported that polymer requirements increase with an increase in mixing intensity and that polymers
will improve the performance of a bench scale filter press, but only with the correct polymer dose
and mixing. They also concluded that using jar testing to obtain an optirnum polymer dose
underpredicted actual polymer requirements. They went on to state that laboratory tests to select
a polymer, dose and mixing scheme for a dewatering process should be the same as those of the
dewatering process. Since a jar test apparatus mixes all of the sample jars at the same relatively low
mixing intensity, it would not provide good information for a high mixing intensity dewatering
process.
Similar conclusions were reached in 1981 by Novak and Piroozfard for certain chemical sludges (4).
In experiments with polyelectrolytes and chemical sludges, jar testing was found to under predict
polymer dose when the rnixing process was actually more intense. Additionally, for both lime and
alum sludges polymer requirements increased as mixing increased. Fina.lly, for the lime sludge ex-
cess mixing deteriorated the sludge while this did not occur for the alum sludge.
\Verle et al. (10) used a bench·scale, high-intensity mixing device to continue the ir1vestigation of 1
mixing intensity effects with water and wastewater sludges. They used a Capillary Suction Time ilLiterature Review 6 l
- ——
l
. (CST) device to measure dewatering and investigated the effects of mixing energy input (Gt) on
dewatering rate for a variety of sludges. A calibrated bench-scale mixing device was used to impart
a variety of mixing conditions to several types of conditioned sludges. A number of conclusions
regarding the importance of mixing were reached. They found that polymer dose and Gt were the
most important parameters governing high·stress sludge conditioning and that low mixing intensity
devices tended to under predict polymer dose requirements. Additionally, optimum polymer doses
increased as Gt increased for alum, activated and primary sludges. They also reported that once
an optimum Gt was established for a sludge and a polymer dose, any combination of G and t
within a reasonable range would still result in optimum dewatering. The dewatering rate decreased
with over mixing for primary sludges and to a lesser extent with activated and alum sludges. The
concept of increased chemical conditioning doses required with increased mixing is an important
one. Figure l shows that as polymer dose was increased, the mixing energy input also had to be
increased in order to achieve a similar minimum CST. The mechanism of disaggregation is thought
to be fracturing of aggregated sludge solids after the polymer bond sites have already been occupied.”
Once formed, the polymer sludge bonds will not break. Thus, for any given dose, enough mixing
must be provided to bring sludge particles in contact with all the available polymer bond sites. This
is the point at which the best dewatering occurs. Any additional mixing will only break apart the9
solids particles and dewatering will deteriorate. An underdose that does not provide suflicient
polymer for the sludge solids present will also result in poor dewatering.
Novak et al. (1 1) extended the work of Werle et al. and used several polymers to determine if (
polymer selection was based on mixing intensity. Alum and activated sludges were each condi-
tioned with three different polymers under a variety of mixing conditions. Polymer requirements
increased as Gt increased for both sludges and all polymers. Also, polymer selection was
moreimportantat high G than at low G. Both the alum and activated sludges could be effectively con- E
ditioned for good dewatering under intense mixing conditions. Finally, the alum sludge was
sus-ceptibleto polymer overdosing while the activated sludge was not.
Literature Review 7 (
5 O 0 )40 POLYMER DOSE T
6 O an 9/L
A 30 \ d ‘-
<¤ 30 mq/L \ /3 1s- gg.“’
. I5 m g/L0 ln / \. \ \ 1 \IO \ 9/ / · \ 9/
6 mg11. ‘· °’
,_ 0B{I 60 b )Ezu 50m· 2 40 ’Ü 3025 20oP °— noa'E O 6 6vi :03 ¤0‘* no IO
°E GT
Figure l. Effect of G and t on the response of alum sludge to polymer conditioning. a) Polymer doseresponse; b) Dose and Gt response. From Novak and Bandak (12).
Literature Review _ 8
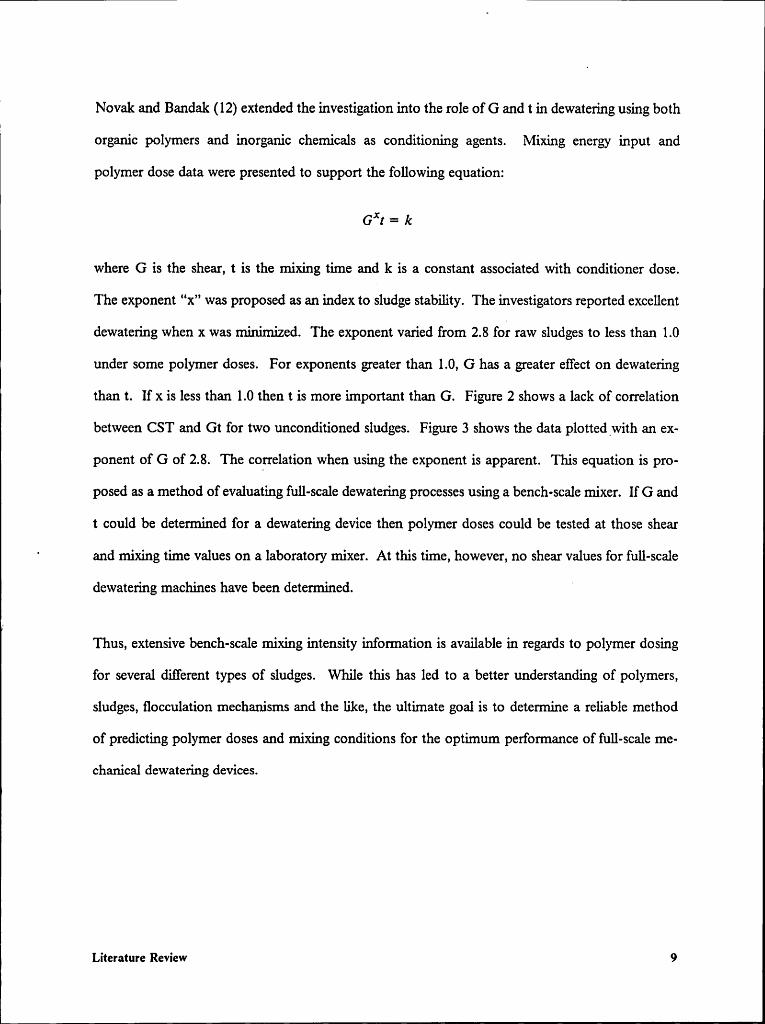
L Novak and Bandak (12) extended the investigation into the role of G and t in dewatering using bothP
organic polymers and inorganic chemicals as conditioning agents. Mixing energy input and
polymer dose data were presented to support the following equation:
Gx: = k
where G is the shear, t is the mixing time and k is a constant associated with conditioner dose.The exponent "x" was proposed as an index to sludge stability. The investigators reported excellent
dewatering when x was minimized. The exponent varied from 2.8 for raw sludges to less than 1.0
under some polymer doses. For exponents greater than 1.0, G has a greater effect on dewatering
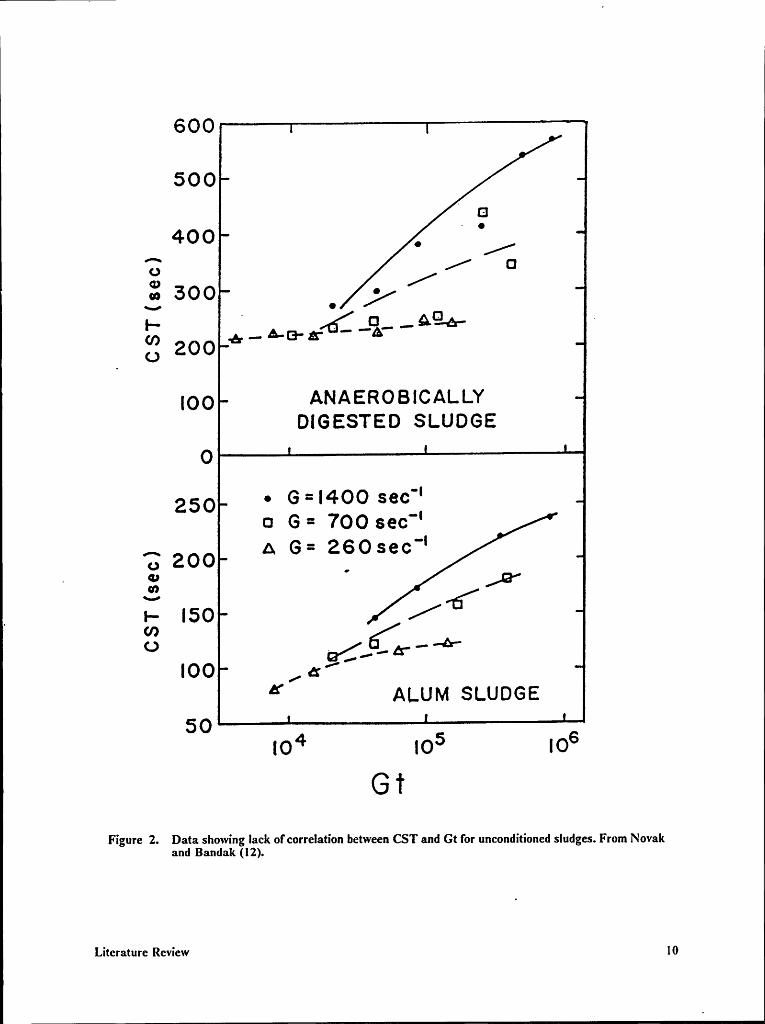
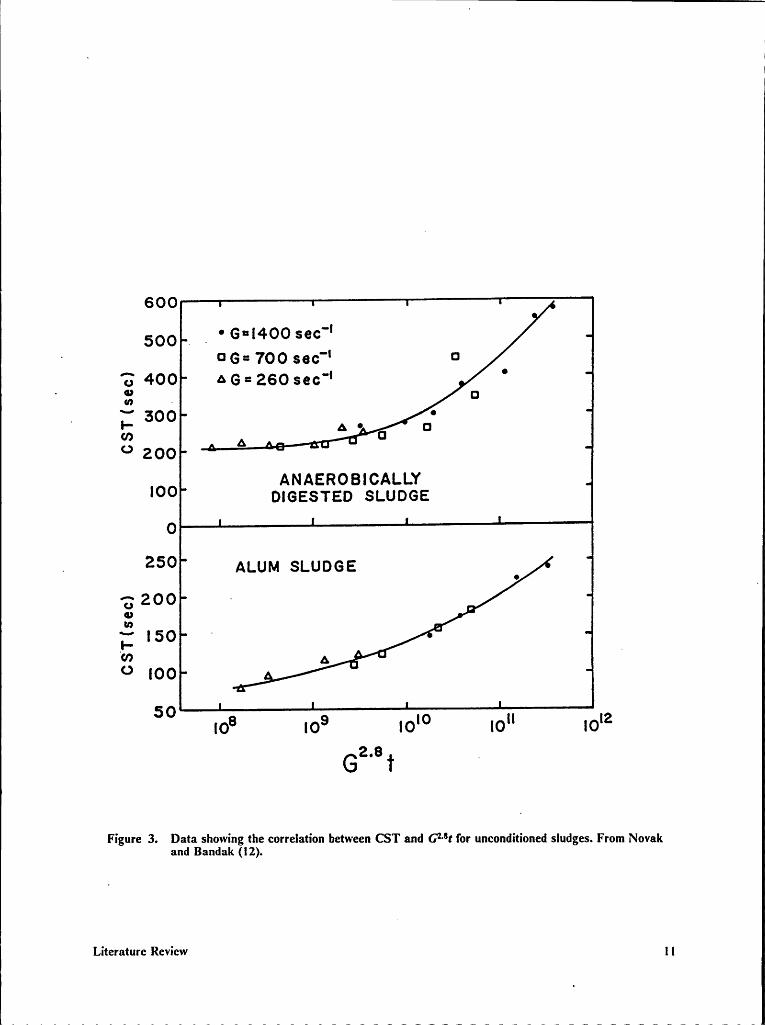
than t. lf x is less than 1.0 then t is more important than G. Figure 2 shows a lack of correlation
between CST and Gt for two unconditioned sludges. Figure 3 shows the data plotted_with an ex-
ponent of G of 2.8. The correlation when using the exponent is apparent. This equation is pro-
posed as a method of evaluating full-scale dewatering processes using a bench·scale mixer. If G and
t could be determined for a dewatering device then polymer doses could be tested at those shear‘ and mixing time values on a laboratory mixer. At this time, however, no shear values for full-scale
dewatering machines have been determined. ”
ÄThus, extensive bench-scale mixing intensity information is available in regards to polymer dosing
for several different types of sludges. While this has led to a better understanding of polymers,
sludges, flocculation mechanisms and the like, the ultimate goal is to determine a reliable method
of predicting polymer doses and mixing conditions for the optimum performance of full-scale me-
chanical dewatering devices.
Literature Review 9
600
500 ‘ ¤400 _ ° °A /
3 300 _ y5 ” ,£__%_____,Ag-A- ‘Q 200 *" °'°”‘
[gg ANAEROBICALLYDIGESTED SLUDGE
0• G=i4ÜÜ SBC-.¤ G = 700 sec"
=j',3 ZOG A G 260 sec
5 E {Ä!
_g lg I50I006’^’ A1.u11„1 SLUDGE
50 6104 105 I0G T
Figure 2. Data showing lack ofcorrelation between CST and Gt for unconditioned sludges. From Novakand Bandak (I2).
Literature Review 10
’ Z>
600
500 _ _ • G¤I400 sec"· ¤ 6= 700 $66** ¤’J 400 AG=2.60 sec" °
. Q.
. ‘_ 300 A _ Drn A 0° 200
ANAEROBICALLY'°° onsasrso s¤.u06s
0
A 25° A1.uM SLUDGE _3 200 ·uE .··__ ISO _W A<> ¤00
SO ¤0° ¤0° ¤0'° no" ¤0'2_G I
Figure 3. Data showing the correlation between CST and GM! for unconditioned sludges. From Novakand Bandak (I2).
Literature Review Il
The Plate and Frame Filter Press
The filter press is one of several mechanical dewatering devices commonly used today. Filterpresses for slurry dewatering were first developed for industrial applications and were then modifiedfor municipal sludge use; There are two primary types of filter presses in use at present. The
fixed-volume, recessed plate and frame press was the original machine type while the diaphragrnfilter press has been developed within the past ten years. Filter presses must be operated in a batchmode and, therefore, require more operator time than some other dewatering systems. Thus, they
are often seen at small to mid-sized (less than 50 MGD) wastewater treatment_ plants. However,
filter presses can produce the driest cake of any conventional mechanical dewatering system (1).
The recessed plate and frame filter press consists of a series of plates, each with a recessed section
that forms an area for sludge to collect. A filter cloth is placed over each plate. Sludge is pumpedi
into the center of the plates and solids collect as a cake in each recessed area. Filtrate migrates
through the cloth to the outside edges of the plate where it gravity drains to a common discharge
point. The devices are categorized as either low pressure (up to 100 psi) or high pressure (up to
250 psi). The press is operated by pumping conditioned sludge into the plates under pressure until
filtrate flow decreases to an unacceptable rate. The pumping is then stopped and the plates are
separated. The sludge cake is collected in a hopper below the plates. The plates can then be closed
and another cycle started (1).
The diaphragm press is a relatively new device that operates the same way as a recessed plate press.
The difference is that the plates are of variable volume and when flled, pressure can be applied on
the opposite side of the plate to allow for additional dewatering.
There are a number of variables involved in filter press operation. Some of these variables, such
as pressure, rate of pressure application, filter cloth type, and conditioner type and dose can be
controlled by the operator. Other variables, including sludge type, solids concentration and the age
Literature Review I2 i. 1
of the sludge cannot be controlled by the operator. The performance of a filter press can primarilyl be characterized by three parameters: 1) final cake solids concentration 2) sludge throughput rate
and 3) filtrate quality, that is , solids that pass through the filter cloth and exit the machine in they filtrate (1).
Research with filter presses has been prirnarily in the area of first mathematical and, more recentlyI computer modelling to predict performance. In 1956, Jones (13) modelled press performance by _
developing an equation for a cumulative filtrate versus time curve. He reported that the rate offiltrate flow could be described by a parabolic function. In 1968, Gale et al. (14) reported that theparabolic function was valid, but only for the initial compression period. In his study it was a pe-riod of 40 minutes. He concluded that because of the restricted filtration taking place that filterpresses would be difficult to model mathematically. One year later, Gale (15) reported the forma-tion of compressible cakes as a three-stage process. He termed these the frlling, growth and com-
pression phases.u
Hoyland and Day (16) developed a computer model designed to operate a filter press for a specific
period of time to achieve a specific final cake solids. Filter presses are commonly operated for a
specified cycle time based on operator trial and error. Because of the inconsistencies in sludges, thecakes produced by operating a press in this manner are often of variable quality. Their model wasintended to provide consistent press operation and can also be used to aid in the design of new fa-
cilities. Mininni et al. (17) developed an empirical computer model from 50 filter press experiments
to predict filtrate flow rate. The model was intended as a design aid and a method by which op-erating parameters can be selected.
Baskerville et al. (18) assessed the importance of eight variables related to filter press operation andused a cumulative filtrate versus time curve to characterize press performance. These variables were
all sludge or machine related. Conditioners were used but were not considered as a variable. In
1974 White et al. (19) reported on the results of full-scale press experirnents using polyelectrolytes.
At the time, polyelectrolyte performance with filter presses had been disappointirrg and a wide range
Literature Review 13
i
° Eof experiments were performed to fmd out how polymers could best be used. A number of factorswere investigated including polymer/sludge mixing, filter cloth blinding, type of polymer and rateof application of feed pressure. Three polymers were tested at two to four different doses for each.
In addition, three mixing schemes were attempted which involved adding polymer at three differentlocations in the process flow train. Good dewatering could be achieved with the correct polymerat the correct dose and by using only the sludge feed pump to mix the polymer and the sludge.
The conditioner mixing tank was bypassed. However, a limited number of full-scale experirnents
were performed and while mixing appeared to effect performance, White et al. could not draw any
firm conclusions about the nature of the mixing nor could they quantify the magnitude of the op-tirnum mixing intensity required. In addition, there was no method to predict the best polymer
dose.
Research with bench-scale mixingdevices and a variety of sludges has indicated that mixing ir1ten·
sity and dose play a significant role in dewatering. White ez al. recognized the need for proper
mixing and dosing but the most pertinent bench-scale data were not yet available. Zoccola (20)explored this link to dewatering machinery with a pilot scale plate and frame press and several types
of sludges. He was able to characterize a plate and frame press and perform some experirnents withregards to mixing. Zoccola’s primary objective was to [identify a Gt that could be attributed to the
dewatering machine. If this Gt could be identified, then a bench scale mixing device set for that
Gt could be used to find an optimum dose. Full-scale testing would not be necessary to determine
dosing and mixing conditions. Zoccola concluded that polymer dose requirements for the press
increased as polymer mixing intensity increased, but his attempt to identify a specific machine Gt
was inconclusive. More research is needed in order to understand how the important concept of
polymer dosing and mixing relates to the performance of actual dewatering equipment.
Literature Review ' 14
Methods and Materials
This investigation was undertaken to determine the effects of mixing and polymer dose on the
performance of a plate and frame filter press. Both bench scale and pilot scale experiments wereperformed in the course of this study. This chapter describes the materials, equipment and proce-dures used to perform these experiments.
Sludge Samples ~
Sludge samples were obtained from two wastewater treatment facilities in Southwest Virginia. The
entire study was performed with anaerobically digested sludge. One batch of sludge was collected
from the Roanoke Wastewater Treatment Plant in Roanoke, Virginia; four batches were collected
from the Pepper’s Ferry Regional Wastewater Treatment Plant in Radford, Virgina. The sludge
dry solids concentration was measured in the laboratory by using the method described in the 16th
Edition of Standard Methods For the Examination of Water and Wastewater (20).
Methods and Materials I5
Anaerobically digested sludge from the Roanoke plant was obtained from a sludge storage lagoon.The sludge was collected by throwing a plastic bucket with a rope ir1to the lagoon. The bucketwas then hauled in and used to fill five·gallon carboys. The sludge ranged in dry solids concen-tration from 8% to 12%. A11 experiments were performed with sludge that was diluted with tapwater to 2% solids. This single batch of sludge was used over a six week period. Because of di-gestion and long storage time, the sludge was presumed to be stable over this period. .
Anaerobically digested sludge from the Pepper’s Ferry Regional Wastewater Treatment Facilitywas obtained from a sampling valve on a pipe that carried sludge from the anaerobic digester to a
belt filter press. The sludge was collected in five·gallon carboys. Four different batches were col-_ lected and will subsequently be referred to as Pepper’s Ferry 1, 2, 3 and 4. Solids content varied
slightly from batch to batch, ranging from 3.0% to 3.4%. Each batch consisted of up to twenty
carboys and was used within ten days of collection.
Polymer Selection and Preparation
Two Nalco polymers were used in this study. Both were liquid, cationic, high molecular weightpolymers and were coded 52E and 521 for this study. Two lots of 52E with slightly different char-
acteristics were used and will be referred to as 52E and 52E#l. The polymer characteristics for each
polymer as determined by the Nalco Chemical Company are provided in Table 1.
Stock polymer solutions were prepared on the day they were used for sludge conditioning. Ac- _cording to manufacturers’ specifications, a 1% solution of polymer in water was equal to 10,000
mg/L. Thus, 10,000 mg/L stock solutions were prepared in 1 liter, round, plastic stirring jars. The
solution was stirred with a Nalco caged impeller mixing paddle powered by a Cole·Palrner variablespeed motor mounted on a ring stand. Tap water was used to prepare the 10,000 mg/L stock sol-
I Methods and Materials 16I
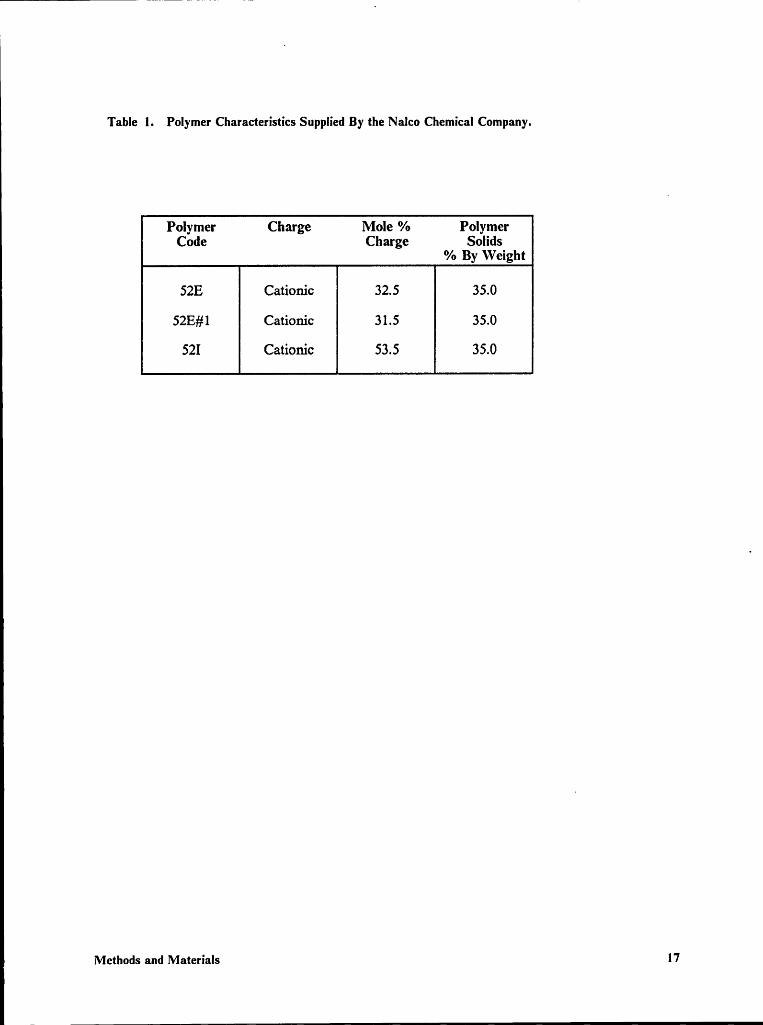
Table 1. Polymer Characteristics Supplied By the Nalco ChemicalCompany.Polymer
Charge Mole % PolymerCode Charge Solids
% By \Veight
52E Cationic 32.5 35.052E#l Cationic 31.5 35.0
52I Cationic 53.5 35.0
Methods and Materials 17 ,
n
i utions. Stock polymer solutions were prepared by measuring the appropriate volume of water withÄ
a graduated cylinder and pouring the water into a stirring jar. The mixer was then switched on andthe mixing paddle speed was increased until a vortex had been created in the jar. The polymercontainer was vigorously shaken to insure the polymer solids were well mixed. Polymer was theninjected into the vortex with a l mL plastic syringe. The stock solutions were allowed to mix for30 minutes prior to use as specified by Nalco personnel.
Ü‘ Bench-Scale Mixing Device ·
Bench-scale mixing experiments were perfonned with a high energy mixer calibrated to specifiedG values according to rotational frequency (rpm). The device consisted of a baffled mixing cham-
ber with a top mounted Eastman Model 3 variable speed stirring motor. The motor rotated a 2inch by 0.5 inch metal paddle. The coupling between the motor and the paddle was fitted with a
magnet which signaled a Hewlett Packard Model 3734A electronic counter. The counter was setto display revolutions per second. The motor speed was controlled by a l16B Powerstat Variable
Auto Transformer connected directly to the motor. The cylindrical mixing chamber was 9.4 cm in
diarneter and 21.7 cm high. Four 1.2 cm baffles set 90 degrees apart were located lengthwise in thecylinder.
The mixer was calibrated so that paddle rotational frequency could be converted to mean velocitygradient, G. The equation for the velocity gradient was given by Stump and Novak (8):
G = [2(3.l43)gNT/60Vvp]·$ [1]
where:
G = mean velocity gradient, sec"
Methods and Materials V 18
Üg = acceleration of gravity, in/sec i1N = paddle rotational speed, rpm
T = net torque on the paddle, in-oz
. V = sample volume, in°
v = kinematic viscosity, inz/sec
p = density of water, oz/ini
Torque was measured by a Power Instruments Model 783 torque meter mounted between the
motor and the paddle. A General Radio 1531-AB Strobotac strobe light was used to read the
torque meter. The volume of the sludge sample was 0.5 liters. A value of 0.576 oz/ini, from Werle
et al. (10), was used for the density of water at 20 degrees C. The viscosity of the sludge, also fromWerle et al. (10), was assumed to be 5.68 x 10*3 ing/sec. If these substitutions are made, Equation
[1] reduces to:
G = 20.l4(N’I)-‘ [2]
The calibration data are presented in Table 2. As shown in the table, mean velocity gradient values
can be directly correlated to the rotational frequency of the paddle.
Bench-Scale Dewatering Tests
Bench-scale dewatering tests were perfonned with the bench-scale mixing device and a Triton Type
1165 Capillary Suction Time (CST) apparatus. A CST apparatus measures the time it takes for
filtrate from a sludge sample to travel a fixed distance through filter paper. Whatman #17
chromatography paper and a 1.0 cm diameter cylindrical sludge sample receptacle were used with
the CST device. Samples were withdrawn from the mixing devices with plastic 10 mL pipettes with
Methods and Materials 19
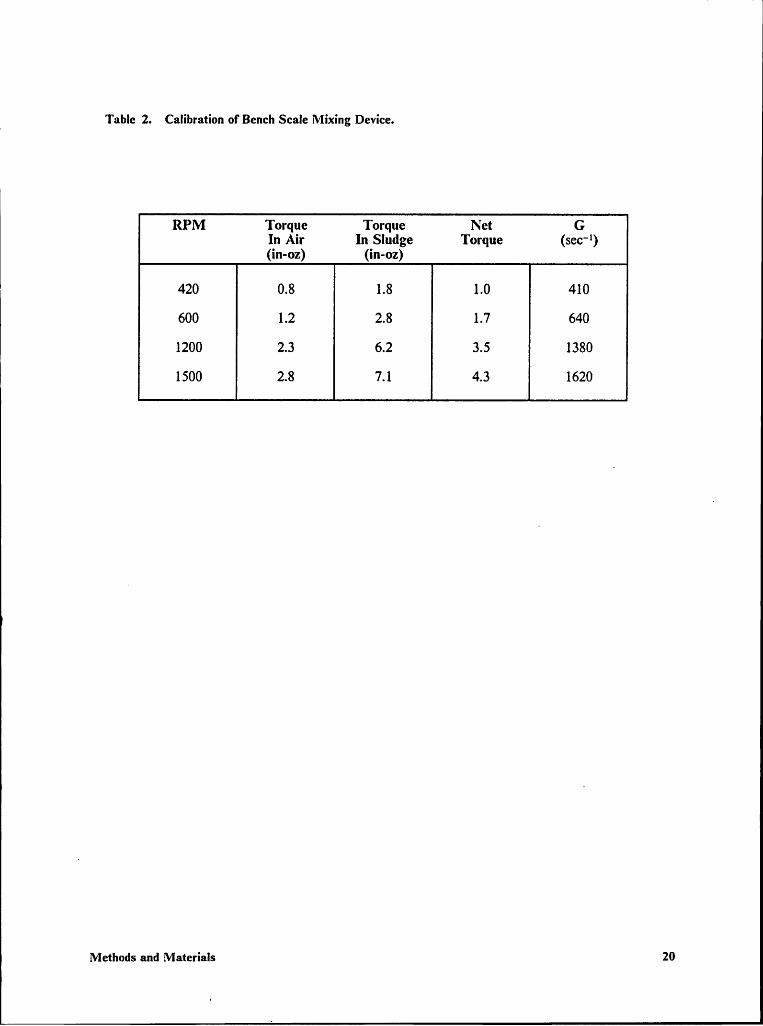
, Table 2. Calibration of Bench Scale Mixing Device.
RPM Torque Torque Net GIn Air In Sludge Torque (sec")(in-oz) (in-oz)
420 0.8 1.8 1.0 410
600 1.2 2.8 1.7 640
1200 2.3 6.2 3.5 1380
I 1500 2.8 7.1 4.3 1620
Methods and Materials 20
II
cutoff tips. This provided a wide opening so as not to break the sludge flocs during transfer to theCST device.
Two types of bench scale experiments were performed. The first type was performed to show the
effect of varying mixing intensity on dewatering rate with a specific polymer dose. Each polymer
dose was mixed at three G values, 280 sec·‘, 640 sec" and 1380 sec". Mixing time was varied to
provide a wide range of Gt values. Each test was performed by adding the appropriate amount ofpolymer and closing the mixing device. The mixer was turned on to a preset speed and operated
for the appropriate amount of time. The mixer was then stopped and a sample was withdrawn and
placed in the CST device. Once the CST test was completed the mixer was tumed on, held at the
same G and tumed off when the next sample was to be withdrawn. Thus, each polymer dose re-
quired the mixer to be operated through one set of trials for each of the three G values.
The second use of the bench-scale mixing device was to determine optimum dose at a given Gt.
In this case, a G and t were selected that would yield the desired Gt value. The mixing device was
set for the appropriate G. The polymer dose was varied in order to fmd the dose ofminimum CST.
After the mixer was operated for the correct amount of time and a sample withdrawn, the mixerwas cleaned and a new sludge sample and polymer dose were added. This process was continuedover a range of doses until a minimum CST could be clearly identified. The dose that corresponded
to this minimum CST was the optimum dose for the Gt value being tested. I
Pilot-Scale Mixing Device
Sludge and polymer mixing for the pilot·scale plate and frame press was performed in 10 liter
batches. A 10 liter plexiglass, cylindrical chamber was used to hold the sludge and polymer. The
vessel was 50.0 cm in height, 19.5 cm in diameter and had two baffles, 180 degrees apart, on the
‘ Metlmds and Materials 21
{inside wall. Ten liters of sludge and an appropriate volume of 10,000 mg/L stock polymer solution
were placed in the container. Mixing was accomplished with a Sears Craftsman l3·inch, 5-speed
drill press. The drill press operated at speeds of 400, 800, 1200 and 1800 rpm. The highest drill press
speed of 2800 rpm was not used for sludge conditioning. A rnixing speed of 200 rpm was obtained
with a Co1e·Palmer 0.5 Amp variable speed Model 4555H motor with a Model 4555-30 speed
controller. A strobe light was used to control the speed at 200 rpm. Drill press speed settings wereverified with a strobe light by Zoccola (20).
The same mixing paddle was used for all conditioning studies. The paddle consisted of a 0.25 inch
diameter steel shaft with upper and lower paddle arrangements. The four lower blades were 3.2 cm
by 2.6 cm plexiglass paddles, equally spaced and rotated 45 degrees to horizontal. The 6 upperblades were 2.8 cm by 1.2 cm steel paddles spaced equally aroundithe shaft and also rotated 45
degrees. The upper paddle arrangement was 20.0 cm from the lower one. The rnixing paddle was
mounted on the drill press so as to be 1.0 cm above the bottom of the 10 liter rnixing chamber.
This rnixing system was identical to the arrangement used and calibrated by Zaccola (20). Table
3 shows the estirnated G values for each of the five rnixing speeds. The values were obtained by
correlating dewatering tests performed on the small and large rnixing devices. Zoccola was able to
verify the correlation by performing the tests with two different sludges. A variety of rnixing in-
tensities were obtained by using the five known G values in Table 3 in combination with any de-
sired rnixing time.
Pilot-Scale Sludge Dewaterirzg{
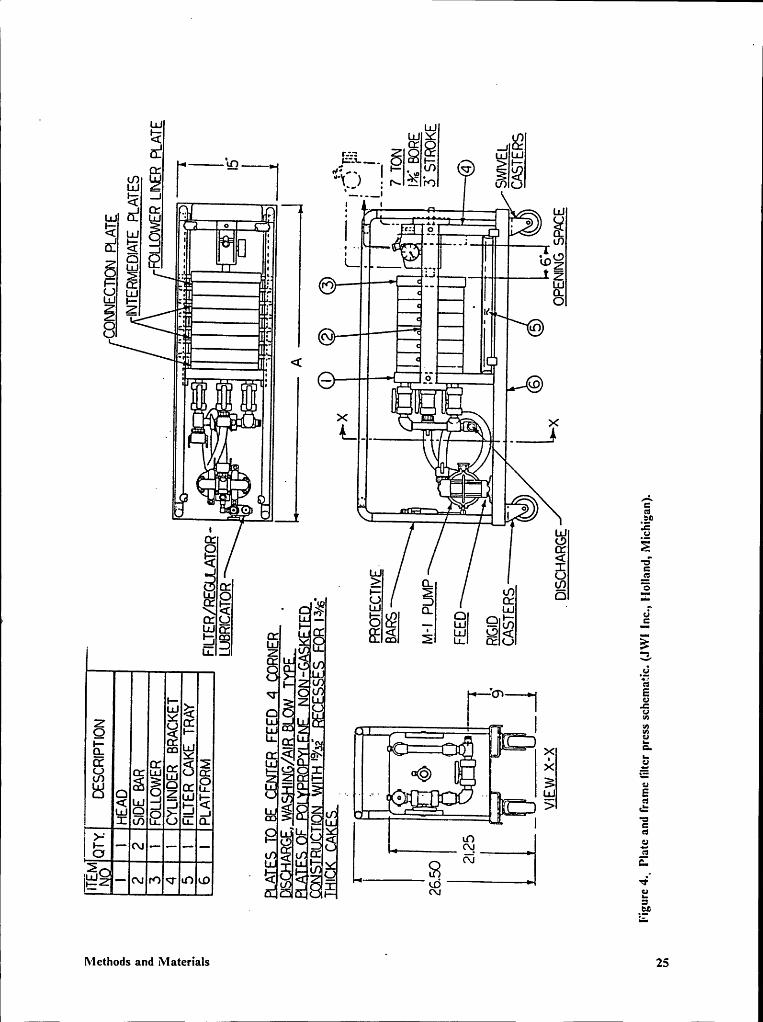
Pilot scale dewatering experirnents were performed with a JW 250N30-5-.15MN pilot scale plateI
and frame "J" filter press manufactured by JWI, Inc. of Holland, Michigan. The press was man- {{
Methods and Materials 22 E
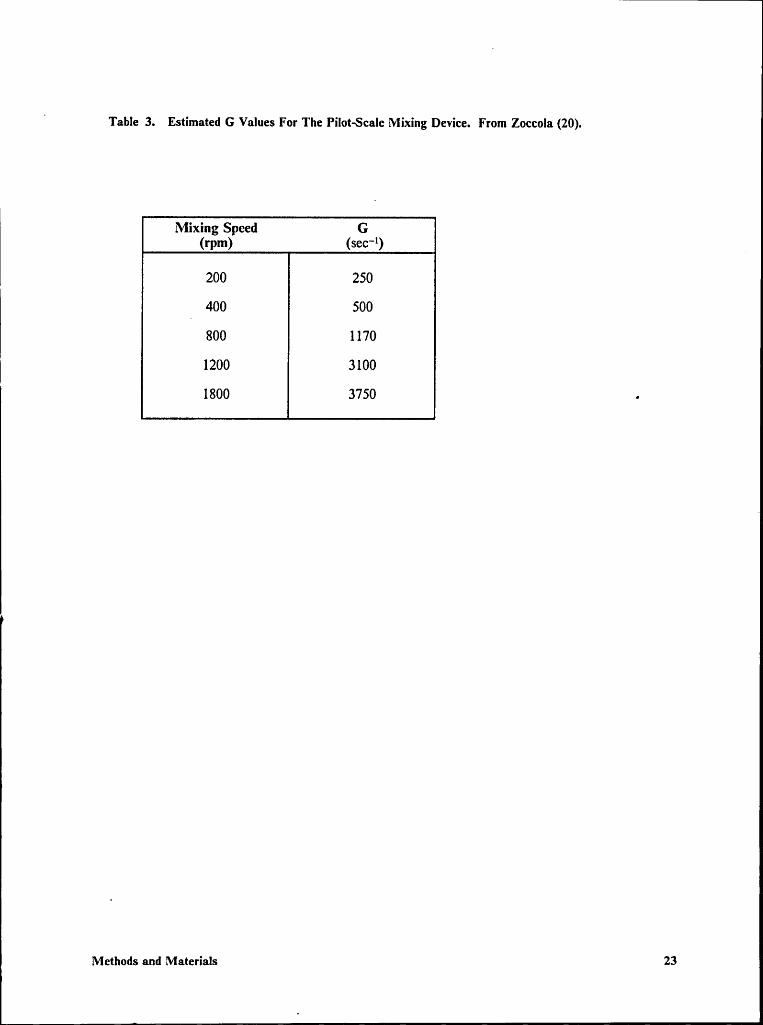
' Table 3. Estimated G Values For The Pilot-Scale Mixing Device. From Zoccola (20).
Mixing Speed G(rpm) (S¤¤")200 250400 500800 11701200 3100
E1800 3750 .
Methods and Materials 23
I
ually closed with a JHA-73 Enerpac hydraulic pump. The press contained an air driven pump and
six 250 mm square, non·gasketed plates. Bottled compressed air regulated to 100 psi was used topower the sludge pump. Series 7100 filter cloths were used on the plates. A manufacturer’s sche-matic is provided in Figure 4.
Experiments were performed with conditioned sludge using the plate and frame press. Sludge
samples conditioned at the desired mixing intensity input and polymer dose were introduced into
the press. In the frst set of experiments, the press was operated for 60 minutes and the frltratedvolume was continuously measured. Conditioned sludge was placed in a galvanized bucket on the
lab bench. A plastic tube from the suction side of the pump was placed in this bucket. The bucket
of conditioned sludge was stirred continuously with a double-bladed paddle at a slow speed to keep
the ilocculated sludge suspended in solution. A slow mixing speed was used so as not to break up
any ilocs or impart a signiiicant amount of additional mixing energy to the mixture.
Although the press had six plates, only two of the plates were used. This resulted in the formationof one and a half cakes of sludge. This was necessary because of the large sludge volume required
in order to fill all six chambers. The plates were closed and the hydraulic pressure was applied to
6000 psi. The inlet valve from the pump to the plates was then closed. Conditioned sludge fromthe bucket was used to fill the suction tube and pump chamber prior to starting the pump. Each
experiment was started in the samemanner.Air
pressure to the pump was controlled by a regulator. At start-up, the air was turned up to 20
psi, the inlet valve to the plates was opened, and the stopwatch was tumed on. The air pressure
was·increased in 20 psi increments over the first 20 minutes until 100 psi was reached. The gradual
application of pressure was suggested by the press manufacturer and veriiied as the best method
by Zoccola (20). The press was operated for 60 minutes and the frltrate volume was recorded every5 minutes through the length of the experiment.
Methods and Materials 24
2* ...—.„. 6 6? ·;·’2-Q: T-
li: " I I- ° *2§ggMg \___> I N ä U) U) U
LU LU I II • POEÄgi LTU, Q—Q
ITT-° ° LUG} .. ggw rn U)
·= @ "L " ä2% U @@32 "L * I %E Z3 =3 Q 3 — @IE2€“ g..-.-..2 < ‘ .72I2 ¤IlI¤ In- I*¤ I2-mä- >< 'ä ><-. ' P J' —L
-äILL}22 6< . < ·=?w 5 EIg_I K ° 2;m@5. 2 E3 2 EE - nK L-2 “ O Ü — u.• Q tn Eää g E gl é E äI€5 E;IT. ..l ä < 3
| •é
Q UE >- Q I 5•I TI“'
LL am _ n ''TTT(I
T 1 3L- - -@ ·!. I;,6 ;„ 3 gr > ;·=U) L) L1. CL ... · —-‘- | c
>=I TLL I-
4 LÜ T¤-·lllllEO2 < E 8 <Y¤ ‘ EIi;IC\l I"‘°)L!°) l < * '*"'lkÖ 6*
. ggb
Methods and Materials T25
lConditioned sludge was added to the bucket in 10 liter batches when necessary during the l hourtest. Thus, different Volumes of sludge were used for each test. This test resulted in a cumulativefiltrate versus time curve used to measure filtrate performance. Zoccola (20) reported that the cu-mulative filtrate curve was reproducible within i 10%. The Variations are due to slight differencesin sludge, polymer, pressure and mixing with each batch. Increased filtrate production is an indi·cation of better press performance because it means that the throughput volume of sludge is greater.A greater throughput volume decreases·the filter press cycle time and increases the capacity of themachine. However, cake solids concentration is a parameter of greater interest to operators and agreater volume of filtrate flow does not necessarily indicate that the final cake solids will be greater.
A second type of test that included the collection of sludge cake dry solids concentration data wasalso performed. In these tests, the press was operated until filtrate flow decreased below 20mL/min. This filtrate flow level was considered to be press failure and took approximately 2 hours
· to reach. Once again, filtrate flow rate was quantified every five minutes. When the fltrate flowdecreased to below 20 mL/min, the pumping was stopped. The press blow-down fitting was at-tached according to the manufacturers’ directions and 40 psi air was blown through the press fortwo minutes. This blow-down procedure removed excess water and sludge from the pipes and re-moved some water from the cake as well. The press was then opened by releasing the hydraulic
pressure and solids samples were obtained from the full cake. Because the solids concentrationthroughout the cake differed, large composite samples were used to determine the average solidscontent. The cake from a plate and frame filter press generally becomes drier nearer the outsideedge. The sludge in the center of the cake has entered the press near the end of the cycle and
contains more water. Thus, pie-shaped slices of approximately 100 grams were collected and weredried in 5 inch x 3 1/2 inch x 4 1/2 inch aluminum foil baking pans. This large sample volume of
sludge cake resulted in more accurate cake solids data.
When either test was completed, the filter press was thoroughly flushed with tap water to insure that
all piping was clear. The filter cloths were scrubbed and rinsed with water to remove all sludge.Each filter press experiment was started with a completely clean press.
Methods and Materials 26
1One problem encountered in the pilot scale dewatering experiments was that of filtrate leakage be-
tween the plates, particularly as the sludge pump was started at the beginning of each experiment.
The plates on the JWI plate and frame press were non-gasketed and the manufacturers’ instructions
state that some leakage from non-gasketed plates will occur. Several attempts were made during .
the course of the research to minimize the volume of leakage. All filtrate leakage was collected in
the metal sludge collection pan below the plates. The volume of leakage from each test was
measured and recorded to insure that this was not effecting the experimental results. During the
course of the initial experiments with Roanoke sludge, it was observed that the amount of leakage
increased as the final cumulative filtrate volume increased. That is, the better the dewatering, the
higher the rate of leakage. For Roanoke sludge, the volume of leakage was relatively small reaching
about 800 mL when a total of 15 liters of filtrate was collected in one hour. With the Pepper’s
Ferry sludge the problem was somewhat greater in that leakage reached about 10% of the total
volume of fxltrate collected for the experiments with the highest final filtrate volume totals.
Since the leakage volume increased with the final filtrate volume, it was determined that the plate
leakage did not impact on the results, but instead made them more conservative. In spite of this,
several attempts to minirnize leakage were made. In two batches of sludge the hydraulic pressuren
was increased from 6000 psi, first to 7000 psi, and then to 8000 psi. This did not have any impact
on the volume of leakage. In the final set of experiments with Pepper’s Ferry sludge the filter cloths
were replaced with new ones. Similar values of leakage were recorded in these experiments. The
new filter cloths had no effect on the amount of leakage.
Methods and Materials 27
1» 1
PWK
i Results and Discussion
This chapter is divided into four sections. The first section will present an investigation into therelationship between bench·scale experiments and pilot-scale dewatering with sludge from the \
Roanoke Wastewater Treatment Plant (Roanoke sludge). The second part will present experiments
with regard to the effect of G and t in pilot-scale dewatering experiments. The third section will
consist of pilot-scale studies with anaerobically digested sludge from the Pepper’s Ferry plant
(Pepper’s Ferry sludge) a.nd two polymers. Finally, a pilot-scale dewatering study using Pepper’s
Ferry sludge and involving the collection of sludge cake dry solids concentration data will be pre-
sented.U
Polymer Dose and Mixing Intensity
Anaerobically digested sludge from Roanoke, Virginia was used to investigate the relationship be-
_ tween bench-scale tests and the performance of a plate and frame filter press. Nalco polymer 52Eand one batch of sludge were used for the study.
i Results and Discussion 28) .
VBench—Scale Polymer Dosing And Mixing Intensity Tests
Experiments were conducted with the bench·scale mixing device using Roanoke sludge and
polymer 52E. Polymer doses of 50 mg/L, 100 mg/L, 200 mg/L, 300 mg/L and 400 mg/L were used
to perform five sets of tests. At each dose, three Gt versus CST curves were generated. Approxi-mate G values of 280 secrl, 640 sec" and 1380 sec*‘ were used. The mixing time was varied to yield
a range of mixing intensity inputs and the tests were conducted until a clear minimum for each G
could be discemed. Figures 5 through 9 show the results of these mixing intensity experirnents.
The general trend of increased polymer dose required for increased mixing is shown in Figure 10.This was the expected result that was reported by Werle et al. (10). The Gt input required to reach
the minimum CST increases from about 8000 at 50 mg/L ofpolymer to about 100,000 at a polymer
dose of 400 mg/L. It is expected that this trend will have some relationship to the polymer dose
required for sludge dewatering with mechanical devices. If the machine processes impart any shear
forces on the sludge, the polymer dose should be varied to optimize press performance.
Several other trends can be observed from the data in Figures 5 through 10. Similar minimum CSTvalues of approximately 8 to ll seconds were reached at each of the five doses. However, there is
a difference between the shape of the curve in Figure 6 and the shape ir1 the other data for remainingfour polymer doses. The data in Figure 6 at a dose of 100 mg/L show a very narrow range of Gt
values over which there is good dewatering. Figures 5, 7, 8, and 9 at 50 mg/L, 200 mg/L, 300 mg/L
and 400 mg/L respectively, show a much broader Gt range over which good dewatering is obtained.
It is also evident that the CST versus Gt relationship described by Werle et al. (10) does not exist
at all G values. Different combinations of G and t to produce the same Gt value yield different
CST’s, except for the 100 mg/L dose. It is apparent that a G of 280 sec", the lowest mean velocity
gradient used, gives the broadest range over which good dewatering occurs. It appears difficult to
obtain an over-mix condition for this G at any of the doses, except 100 mg/L.
Results and Discussion 29 ·
coC)
anO
ä' E3B-o3c
6 Ü ENin
B ä."" E.
0 00L1JLu L1.! ~ gU') U) (01 \ x x 1 *6*11
„ •-• •-• •-• {
0 0 0 ECD <1' (D .zN (0 (T) Q··• esll ll ll Ü0 0 0 f
E1 0 6 E 32CJ
Ü ä"" >
um 0 LD 0 ua 0 fg};(SGNOIIBSI LSI) ,,;
U
· .§¤I;
Results and Discussion 30
· zuO
IDO.5EE
F;Q
El p- éi
<l E Ü cd(I 25'
0 .(ä
E ä··· T2.El l Q Q Q ä‘°
Lu Lu LU EQ (D U) UJ 3El E E. E gc:> c>c:>®
V (D ,;gN (.0 (Ü 3El ··· äll II Il ,3CD O CD I0 0 <1 äL7
cn 5}O E··· ä'
LD O LD O E-N N •-• •- LD C) Ü(SGNOZIBS) LSI) 6uE.2**
Results and Discussion 3l
(.0OE
‘ 3 O
· N ä “ é1
E9 Sl N
< +\‘ ,53 · g¤ •— -äj°‘i‘I ,5l ¤ IEI
1 ääl E §_F ... EQ 1:..
0 0 0 ä°1 LU LU l.U 71U) Ü U) =\ \ \ ¤
I'-I O'! O"! ät
:n 0 0 0 7Ü W Ü §N (D (T) 2"" cill ll ll <=O CJCJE]
E) <l §U
m SO E•·· 2LD C) LD C) LD C) E-
(3ClN0333) 1.33 I;, eu*5
.2:°
L Results and Discussion 32
(00 .
E]· s :Q.
= gg3 SJ O
. _ O“ F. __5
4 s E]_<l@3 E
aw 9 S¤ EIn Ö' Q1* ··:
N0/ ä
Y;) :·S2 "' °‘0 0 0 0 E, L1J 111 1.11 g .· :0 10 10 „\ \ \ gz7*1 1*lF*\0
0 0 ZCO sr CD -==ax: 0 cn QIl II II Ö0 0·0 {
S· E1 0 <1 2:LDM ä9 2
ua 0 1.0 0 1.0 0 QN N ··· ··· U(9ClN0339) 1.93 ¤6
U
E?
Rcsults and Discussion 33
Ä”
tnF‘lO
— El9 z3 :33 aa;
‘ $15:<1 ‘ •-I *2)’ "‘ ‘
. =_;Q 0 u
3 ‘ E3 :1 gZ 1 35 _
9 azS p- S
Q•
Ei· a ° äI '^
QO ·E’"" ¤.
0 0 0 E. Lu Lu Lu gU) U') (D U\ \ \ JänFl 3*1 C?
=0 0 0 Z(D V (D -=gN (D (D E3n n u °0 0 0 éE1 0 6 . $5
E!Il}
73 äC)
,.., >
ua 0 ua 0 ua0(SCINOOBSILSI]E
.’i°
Rcsults and Discussion 3,;
· P
500
Q, 400\C')Z .
ä0 300 IIIC3CZ,LuZE 4 .0 200(L
lZ“ DZ ,
E 100 ElO
0 20 40 60 3 80 100 120· GT X 10 -
Figure 10. Optimum polymer dose versus Gt for polymer SZE and Roanoke sludgc.
Results and Discussionl
35
lThus, theidata were examined to determine if the relationship between G, t, and the dewatering rateas described by Novak and Bandak (12) could be applied. They plotted CST against G*t where xwas obtained by trial and error to produce the best fit of the data.
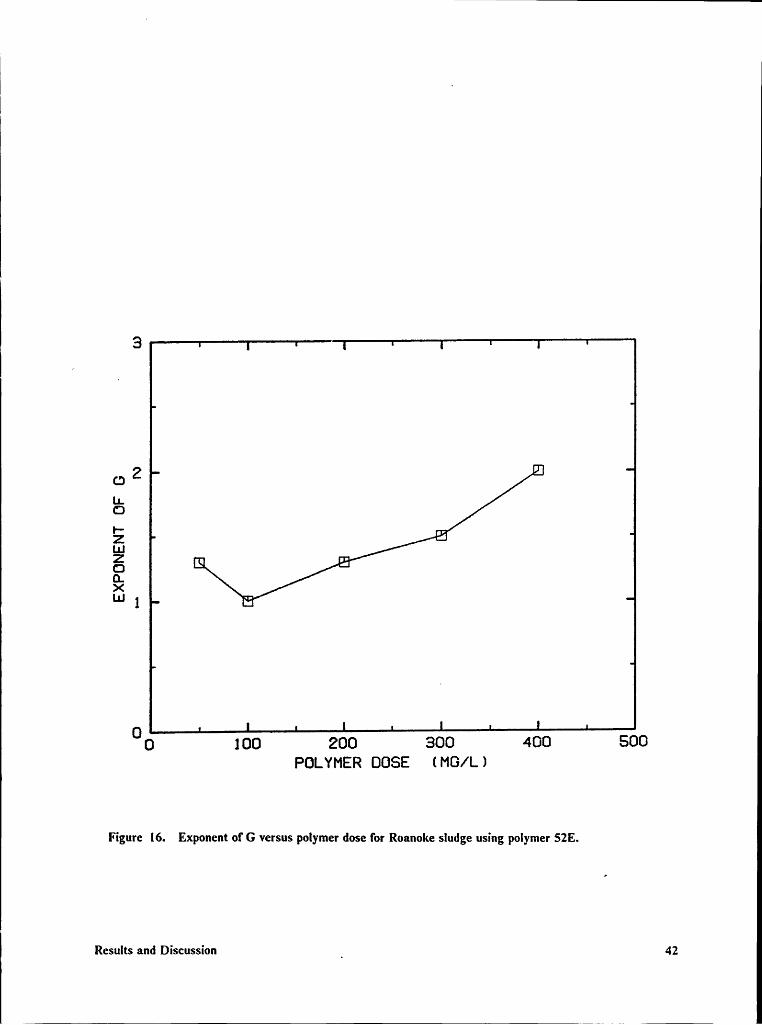
Figures ll through 15 show the results when the exponent of G is varied to obtain the best fit ofthe data for each of the five doses. The exponent "x" was determined by trial and error in each case,thus, it can be more appropriately considered to be an approximation rather than a specific value.As can be seen in the figures, an exponent from 1.0 to 2.0 can be used to describe each of the doses.According to Novak and Bandak (12), this exponent can be used as an index of the sensitivity of .
the sludge to shear. As·such, the exponent is an indication of sludge physical stability. When thesludge becomes more stable, as indicated by an exponent of G at 1.0 or less, the sludge becomes
more resistant to the effects of shear. In this case, the sludge was most stable at a polymer doseof 100 mg/L as indicated by an exponent of 1.0 at that dose.
The determination of the exponent is not exact and each exponent could more properly be de-
scribed as being within a range of several tenths. Nevertheless, the pattem is apparent. Figure 16
shows the relationship between the exponent of G and the polymer dose. If Novak and Bandak
(20) are correct, the Roanoke sludge should change least under various mixing intensities at a
polymer dose of 100 mg/L. At either higher of lower doses, G has a greater effect on dewatering
rate than t.
The bench-scale data provide information about Roanoke sludge and polymer 5213. Good dewa-
tering rates as measured by the CST test could be obtained for each of the five doses. Data included
in Figure 10 show the trend of increasing mixing input requiring an increase in polymer dose. The
relationship between the exponent of G and polymer dose is shown in Figure 16. This information
can be compared to the results of pilot·scale dewatering studies to help determine the best polymerdose for the plate and frame filter press.
Results and Discussioni
36
coO<l
9 E1 é . ··s@
” uE xÜ uö §.:V*I9
ä. é"3B-cl- 3 .
V7 o_ • ä,-4 esO ·a::13E.W ..
Q 2ua‘ Q u <.> ·§
Lu LU LU. S(D (D (D gg
E_ O O O §· „ (D W (D ¤. . n N (D (T) §
u n u =· 0 O CJ . EEl 9 4 5- mm :. 0 §_
E-L0 O L0 O LD O cn· (SGNOGEISI LSG ;-_¤
US
'
Results and Discussion 37
I
(0O
=EIlx:“<ä> Q' QE
O I. äQ Q Q
. . ¤„ H g9 Ü O -c
esQ 0 Q<l änn
vQ€’
1**E10 00LULL] LL] :E) U] U) (D o\ \ \ gb
1* 1** 1*1 :
0 0 0 SCD ¤’ CD {N (D (U gs
El u u u §- CJ O 0 E0 0 <1 T_ C:
O EIan! g ua 0 ua 0 5
1**(SGNOIJHS) LS3 ,„;-
l =*5EResults and Discussion 38
1~
IIX
. Q, ätl”
El i3 bb<l E] E. ¢
13 E1 ?·¤ I- °'öÜ E <~*1•
"¤
ä H0 3S · "4- §*.1
QB ‘$ nö FE,. ___ ä
bbE ° 0 0 0 ·§LU LLl LJJ ::'UC7! 7'O 7'U=¤ M 0 0 0 Z$8 28 $8 ‘§
,,„ C3ll ll ll §E1 61 <1 E
O E"‘ >1.0 0 1.0 0 1.0 0 [-·(SÜNOIJHS] LSI] „;
ä.2**
Results and Discussion 39
1111
anO
viIl
E 1 _ · lfC)**1 E22(*1E1 2
E l"' 30 E “‘ -‘äQ ' esQ1 Eä H0 1-1
9 E1 äO El 59 Q Ü ;_
Q 9 El Q ä9 2SE.! 0 00EILL] L1.! UJ =(0 (0 (.0 gnQ E E >. 271O CJ O
Z5 $91 '髤"" Oll ll ll =Q 9 0 0 0 äE1 O Q n E;
El 21‘Ü2LD0 ua 0 ua 0 5,(SClNOG3S) LSG 6
ä.P.°· u.
Results and Discussion 40
“ x
)
mO
6
Q - II9 E6 9 0 _g0 O äO ”° l'EI 6] ’é'°
E! S6·__ “5UO ä °• es6 °" 6(D ,_,O 6*3. b ä
Ü Q E•-• bb¢
0 0 0 äLL] LL! LIJ u(D (D (D .g°\ \ \ E•-Q Q-U
0 0 0 fg_ „ G T G c:
· (\I (D 07 ä"‘ 2II II II 6.„ CD O C) EE1 9 6 5,
ä"ö 5* >"° 6-1.0 0 ua 0 ua0(SGNÜZJBSILSI] E
EL;
Rcsults and Discussion41___
3
LLOI-ZuJZCJ0.><“* 1
0 0 1 00 200 300 400 500POLYMER 00SE ( MG/L J
Figure I6. Exponent ol' G versus polymer dose for Roanoke sludge using polymer 52E.
Results and Discussion _ 42
Pilot-Scale Polymer Dosing and Mixing Intensity Tests
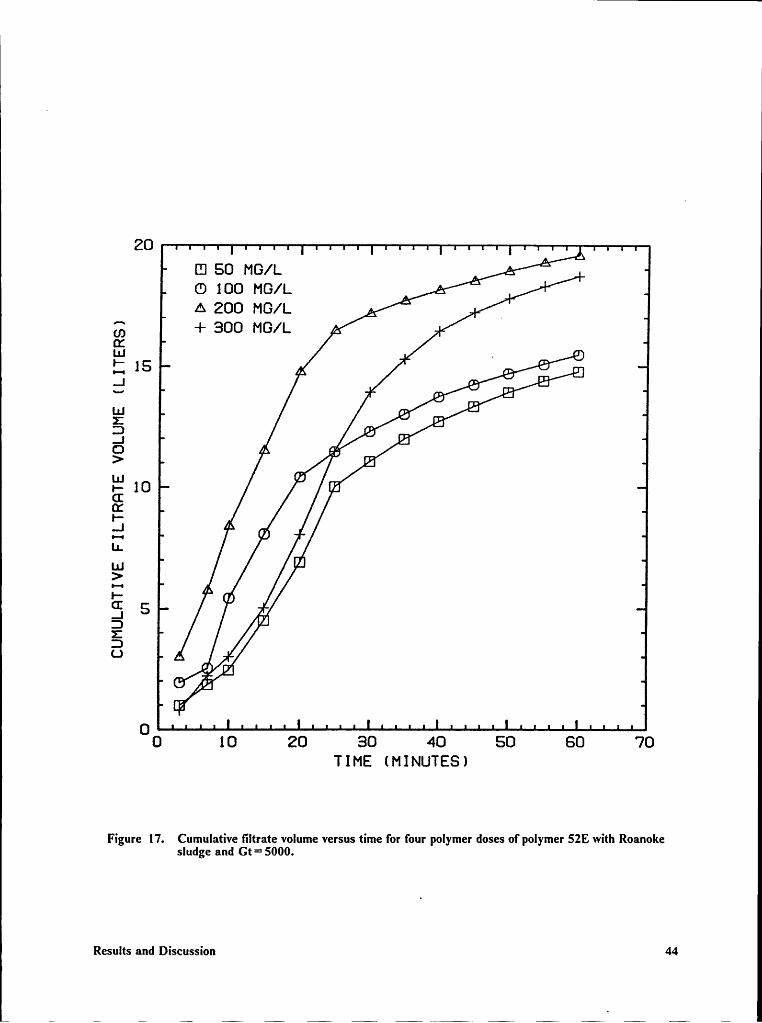
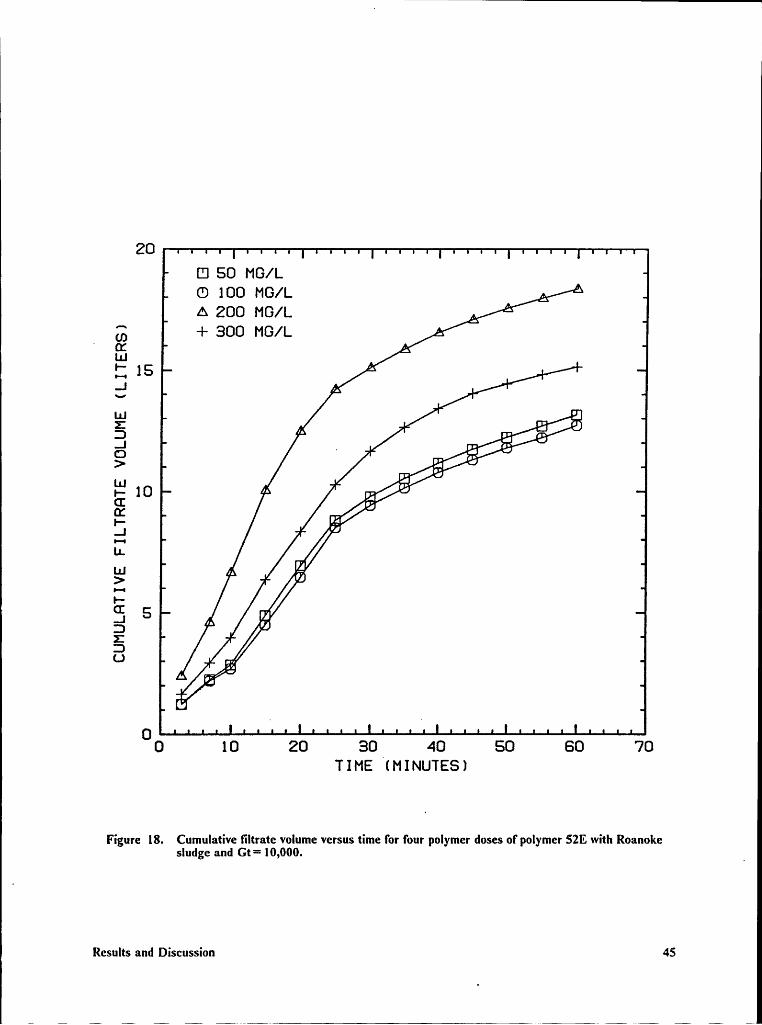
Pilot-scale dewatering experiments were performed with the plate and frame filter press to determinethe relationship between the bench-scale tests and an actual dewatering process. Four polymerdoses that were used to perform the bench-scale experiments were used to perform pilot-scale de-
watering experiments. In addition, six different Gt mixing inputs from 5000 to 100,000 were ob-tained with the pilot-scale conditioning apparatus. These mixing inputs used to mix the sludge andpolymer were provided prior to feeding the conditioned sludge into the press. Each Gt used a Gof 500 sec" and the mixing time was varied to achieve the desired Gt. Cumulative frltrate volumeversus time was used as a measure of press performance. If the frltrate curves are plotted for the
varying polymer dose but with the same mixing intensity, it can be seen. that a polymer dose of 200mg/L is the best polymer dose for each Gt. This is shown in Figures 17 through 22. In fact, eachfof these figures shows a similar trend. A dose of 200 mg/L gives the best performance, 300 mg/L
gives slightly less filtrate, and the 50 mg!L doses and 100 mg/L doses result in the worst perform-
ance. At each of the mixing intensity inputs, 200 mg/L is the optimum dose, 300 mg/L is an
over-dose, and 50 mg/L and 100 mg/L represent under-dose conditions.
The same set of filtrate curves can also be grouped by polymer dose. Figures 23 through 26 show
various mixing intensity inputs at polymer doses of 50 mg/L, 100 mg/L, 200 mg/L and 300 mg/L._ In addition, a cumulative filtrate curve with no polymer added to the sludge was included on each
graph to use as a reference. From this set of figures one can see that the lowest mixing intensity
(Gt of 5000) was best at all four polymer doses. Although a Gt of 5000 gives the best press per-formance at each dose, there is not a significant difference in cumulative fltrate Volumes between
the mixing intensity inputs from 5000 to 20,000. However, a significant difference between the ef-
fect of low mixing intensity inputs (5000 to 20,000) and high mixing intensity inputs ( 30,000 to
100,000) can be seen at every polymer dose. A mixing intensity input in excess of 20,000 signif-
icantly decreased filter press performance.
Results and Discussion 43
l
20111 60 MG/1. V A “(D 100 MG/L P A ‘A 200 MG/L ,
‘_
ZB + 300 MG/L IA35 - 0l" 01 " ä H
'ä ¤ A ‘ZD 0 ,.1 Z4O IA gg> ‘ uli' 10 ° vaCECC·I—
IA:.' 0L1.lu MZ.gl-. IA 0 UD IAZD(J A
0 /gIZ
0 0 10 20 30 40 50 60 70TIME (MINUTES)
Figure I7. Cumulative liltrate volume versus time for four polymer doses of polymer 52E with Roanokesludge and Gt= 5000.
Results and Discussion 44
1
20[Il S0 M0/LC) IÜÜ MG/LA 200 MG/L
QB + 300 M0/L’ OCL1.!ff, 15..I
Iii •' ä3 aß0 ‘ §}°) ElaL., 10 E/·5EE na!.1 "E /;· äE /E1 5 ==Z /DU gga;/L
5
0 0 10 20 30 n 40 50 60 70TIME (MINUTES)
Figure 18. Cumulative liltrate volume versus time for four polymer doses of polymer 52E with Roanokesludge and Gt= I0,000. I
Results and Discussion 45
” l
20_E] 50 M0/L‘ ‘ CD IÜÜ MG/L I Ä
“A 200 MG/L V Ä
6 ·l·· 300 MG/L [_ A0: ‘LU Z
L; 15 .S " 0
. Ei N
äI._„ 2/·2 2/‘LU „ /2/
10 Il•— /LJ 1.¤» Z2UJ>:5 6 ,.
I.,&
@70
0 0 10 20 80 40 50 60 70TIME (MINUTES)
Figure I9. Cumulative liltrate volume versus time for four polymer doses of polymer 52E with Roanokesludge and Gt= 20,000.
Results and Discussion 46 _
Q1
i 20E1 50 M0/LC) 100 MG/L 'A 200 MG/1.
E5 + BÜÜ MG/LCCLL!Q; 15.1
$63 0__| 2;O 9> es. Lu
_ '_ · 2 H1- 10 ,, ‘ __ =Q 1 a(I ,. 5P 4 ,l-1 AP-I [BL1. . HE raE "CI6 S
u3U u
Uu EE
° .0 II
0 10 20 30 40 S0 60 70TIME (MINUTES 1
Figure 20. Cumulative liltrate volume versus time for four polymer doses of polymer 52E with Roanokesludge and Gt= 30,000.
Results and Discussion · 47
20El 50 MG/L
· C) 100 MG/L_ ’ A 200 MG/L6 + 300 MG/LE AU-I AQ; 15 Ä.-1 ik
Lu Ag AD..| ,C3 ">LU 6 9r- 10
” G(I 6M 6*' 6...1LT /4 QLu Ü
Z ' .. ¤/4 Ü ’• =
—
_] 4D „ 6D ü E
‘LJ
Zi
0 5* E0 10 20 30 40 50 60 70
TIME (MINUTES)
Figure 21. Cumulative filtrate volume versus time for four polymer doses of polymer 52E with Roanokesludge and Gt = 50,000.
Results and Discussion 48 $
20C) 100 MG/LA 200 MG/L—l- 300 MG/L
J, .* A*-U 4
'J
,.4..I@ 6>I*lf10 '· 6 'CK 9ß 9*3 6
/4 Üua °ZI-
5 ,.
§ 6U 2
/9
0 0 10 20 30 40 50 60 70 -TIME (MINUTES)
Figure 22. Cumulative liltrate volume versus time for four polymer doses of polymer 521:1 with Roanokesludge and Gt= 100,000.
QResults and Discussion 49
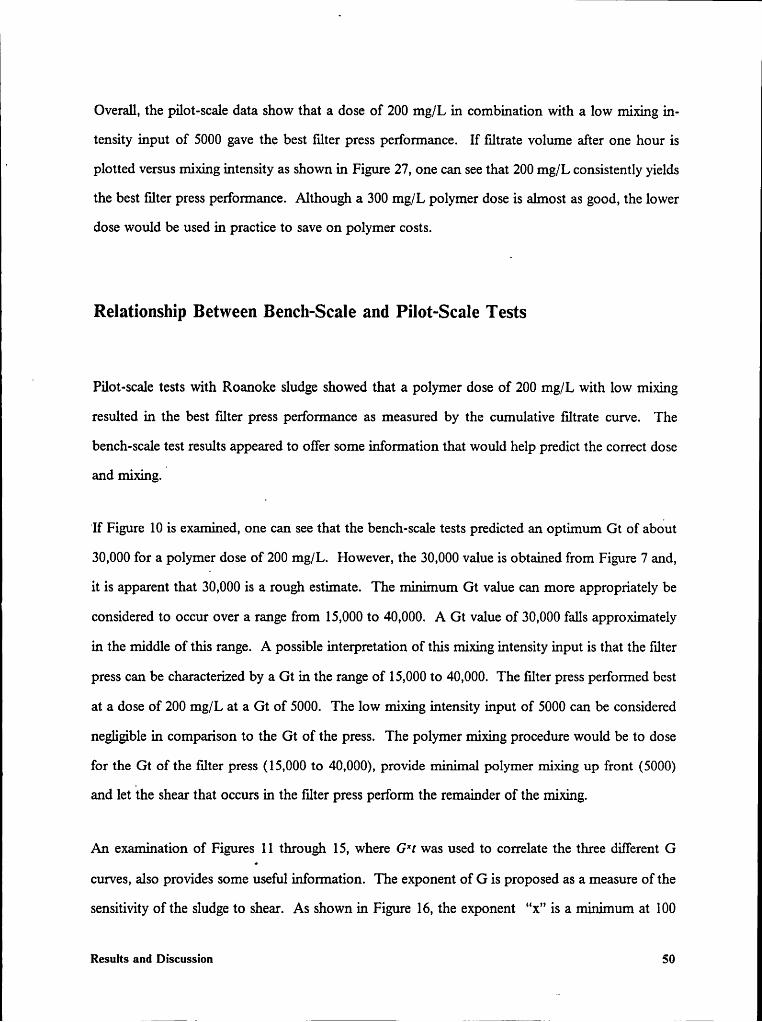
Overall, the pilot·scale data show that a dose of 200 mg/L in combination with a low mixing in-tensity input of 5000 gave the best filter press performance. If f1ltrate volume after one hour is
' plotted versus mixing intensity as shown in Figure 27, one can see that 200 mg/L consistently yieldsthe best filter press performance. Although a 300 mg/L polymer dose is almost as good, the lowerdose would be used in practice to save on polymer costs.
Relationship Between Bench-Scale and Pilot—Scale Tests
l Pilot-scale tests with Roanoke sludge showed that a polymer dose of 200 mg/L with low mixingresulted in the best filter press performance as measured by the cumulative frltrate curve. Thebench-scale test results appeared to offer some information that would help predict the correct doseand mixing.
l
‘If Figure 10 is examined, one can see that the bench-scale tests predicted an optimum Gt of about
30,000 for a polymer dose of 200 mg/L. However, the 30,000 value is obtained from Figure 7 and,
it is apparent that 30,000 is a rough estirnate. The minimum Gt value can more appropriately be
considered to occur over a range from 15,000 to 40,000. A Gt value of 30,000 falls approximately
in the middle of this range. A possible interpretation of this mixing intensity input is that the filterpress can be characterized by a Gt in the range of 15,000 to 40,000. The filter press performed best
at a dose of 200 mg/L at a Gt of 5000. The low mixing intensity input of 5000 can be considered
negligible in comparison to the Gt of the press. The polymer mixing procedure would be to dosefor the Gt of the filter press (15,000 to 40,000), provide minimal polymer mixing up front (5000)
and let the shear that occurs in the filter press perform the remainder of the mixing.
An examination of Figures ll through 15, where G"t was used to correlate the three different G
curves, also provides some useful information. The exponent of G is proposed as a measure of the
sensitivity of the sludge to shear. As shown in Figure 16, the exponent "x" is a minimum at 100
Results and Discussion 50
e u1
20[I1 NO PGLYMERC) GT = 5000A GT = 10 „ 000
QB + GT = 20 „ 000{-E X GT = 30 „ 000[Z, 15 G GT : 50 „ 000 9..1 ß 6LIJ Q AX Ü AD 4..16>
9 A
§ 10 •> . i _.JLL ./ .. ¤ °u.: *5 ,. ä ‘> ¤• ‘
E “ 5 '‘
0 L- °0 10 20 30 40 50 60 70
TIME (MINUTES)
Figure 23. Cumulative tiltrate volume versus time for six mixing intensity inputs with Roanoke sludgeand S0 mg/L of polymer 52E.
Results and Discussion Sl
1
20 IEl N0 POLYMERO GT .·:.· 5000 ·A GT = 10 .000 Y
ff, + GT = 20 . 000- ff, >< GT = 30 .000 9L', 15 0 GT : 50.000 __ 9
:1 4* GT = 100 .000 ‘_ 9'
‘
Z ‘3
-:3 üQ vz I
Lg,] li äf ;:/’ö
CE , :=ZII ‘ x?JP- TÄ u 9/L" J
= =luJ "
„91*-
‘ ·; =ä 5 u { ED ^.:LJ_.
_//¤««.0 0 10 20 30 40 50 60 70
TIME (MINUTES)
Figure 24. Cumulative liltrate volume versus time for six mixing intensity inputs with Roanoke sludgeand 100 mg/L of polymer 52E.
Results and Discussion — 52
1—
— I
20I
g 0
A 96 16/Ä -
SE ‘/ ·r _..1 _,,/“
$7/76>E
10»-0:0:•—_J 0u. " __ uLL. IA |•
_
> I :: ‘g; L III N0 POLYMER
51 5 f, V,/“E
“ 0 GT = 5000ä g A GT = 10.000U g g; + GT = 20.000
«· X GT = 30.000;_ “ <> GT 6 60.000“ 4* GT = 100.0000 0 10 20 30 40 50 60 70
TIME IMINUTESI
Figure 25. Cumulative filtrate volume versus time for six mixing intensity inputs with Roanoke sludgeand 200 mg/L of polymcr 52E.
Results and Discussion I 53I
P
T20
II] N0 PGLYMER 9C) GT = 5000 2_ 9A GT = 10,000 2; 2,,-f'
Q + GT = 20,000 9 ,6 . T35 >< GT 6 60.000 __Q /ff, 15 <'> GT = 50,000°·;'
4* GT = 100,000 ,2 6u.1Q.D
6-J , [A
l~ ’•. Q , “ 5 · .E 10 /^ QT .G I(II- ·J 4/ I)
"' I/ .. 2lg-' gz 25 __ _ 2 ä
°ls /2 V
0 0 10 20 30 40 50 60 70TIME (MINUTES)
Figure 26. Cumulative liltrate volume versus time for six mixing intensity inputs with Roanoke sludgeand 300 mg/L of polymer 52E.
Results and Discussion 54
1n
f} .
} 20+ A A
.„ +
3 15 +1.; F9 13E 0101.111-cr0:1-..11.1.0: 5 Ü SU l‘1G/L3 0 100 110/LI A 200 MG/1."‘ + 300 MG/L
0 0 20 40 60 3 80 100 120GT X 10"
Figure 27. One hour liltrate volume versus Gt for four doses of polymer 52E and Roanoke sludge.
Results and Discussion 55
P
mg/L. According to Novak and Bandak (I2), the sludge should be most resistant to change due
to shear at this polymer dose. However, this dose appeared to be too low to provide good dewa-
tering with the plate and frame press. Doses of 200 mg/L and 300 mg/L resulted in better filter
press performance with 200 mg/L being considered the optimum dose. At 200 mg/L, the exponent
of G was relatively low at a value of 1.3 and, the best dewatering as indicated by the CST valuei
occurred at this dose. At 300 mg/L, the exponent was somewhat higher at a value of 2.0. It appears
that both the exponent and dewatering rate are needed to predict equipment performance. As long
as the exponent is below 1.5, change due to shear may not be a problem. At the higher polymer
dose of 300 mg/L, dewatering may be excellent at some shear levels but, at this polymer dose de-
terioration due to shear could occur.
The experiments with Roanoke sludge provide some useful information about the polymer dose
and mixing intensity input required to optimize the performance of dewatering machinery. It is
apparent that a substantial amount of mixing due to shear takes place within the filter press. Be-
cause of this shear, additional polymer must be included to coagulate deflocculated sludge particles.
n For the filter press used in this study, a Gt value between 15,000 and 40,000 appears appropriate
to characterize the additional mixing intensity input of the machine. This shear is not excessive
compared to some mixing values that have been observed in laboratory studies; however, it is much
greater than the mixing intensity input of a jar test device. The Gt of a jar test apparatus would
normally be 111 a range from 4000 to 8000 with G usually less than 100 sec". Thus, the use of a
jar test apparatus would result in the selection of a polymer dose lower than the dose that would
provide optimum filter press performance. ·
Results and Discussion 56
l
Ejfect Of Vargying G and t On Filter Press Performance
The first set of filter press experirnents were performed using a pilot-scale G of 500 sec*‘. Timewas varied to provide Gt values from 5000 to 100,000. Before conducting additional pilot·scalemixing experiments, a determination of the effect of variations in G on filter press performance wasmade. Five different G inputs were available on the pilot-scale mixing device. Three values of Gt
were selected. For each of these Gt values, three to five combinations of G and t were used to
generate cumulative frltrate curves. Two different batches of Pepper’s Ferry sludge and polymers
52E and 52E#l were used.
In order to exarnine filter press performance over a wide range of mixing intensity inputs, Gt valuesof 5000, 30,000 and 100,000 were selected to use in the experirnents. Doses for each of these threemixing conditions were selected by performing bench-scale dose tests. A series of doses were tested
with the CST device at each of the three mixing intensity inputs. From the resulting curves, a
minimum CST was identified for each Gt and a corresponding polymer dose was selected. It
should be noted that this polymer dose was the optimum dose for the bench-scale mixing device
but, not necessarily for the plate and frame press. This experiment was not intended to optimizepress performance; instead, it was performed to show, for a constant Gt, the effect of changing G
on press performance at a given dose. Polymer 52E was used with Pepper’s Ferry 1 sludge and
mixing intensity inputs of 5000 and 30,000, as shown in Figure 28. Polymer 52E#1 was used with
Pepper’s Ferry 2 sludge and a mixing intensity input of 100,000 as shown ir1 Figure 29. Optimum
doses of 650 mg/L, 800 mg/L and 600 mg/L were selected for the Gt values of 5,000, 30,000 and
100,000 respectively. lt should be noted that the polymer dose for a Gt of 100,000 was lower be-‘cause a different batch of sludge was used for this mixing intensity input.
° After the polymer doses were selected, pilot·scale filter press experirnents were performed. For aGt value of 5000, three different combinations of G and t were used. For a Gt value of 30,000, four
Results and Discussion 57
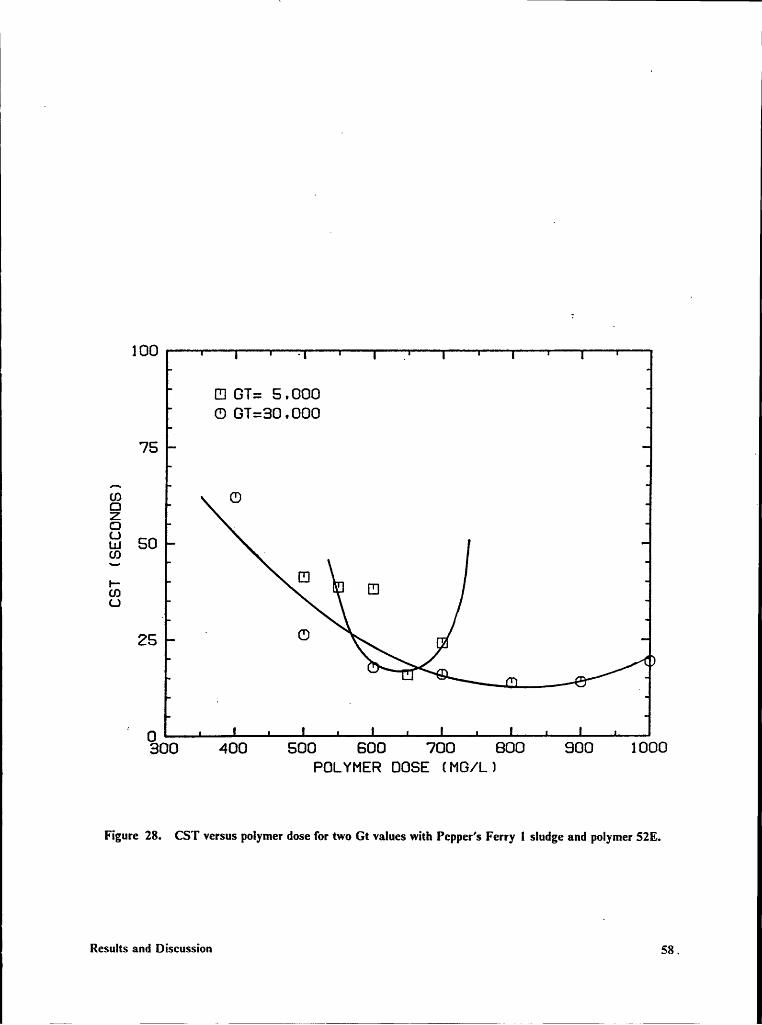
’V
100 . _
E] GT: 5 , 000C) GT:30 ,000
75 .
Q <¤ QZ3Lu 50
E]ill [Q
<.>
25 ‘ O \~ ,¤l0
" 9 u 2.
i 0300 400 500 800 700 800 800 1 000POLYMER DOSE (MG/L)
Figure 28. CST versus polymer dose for two Gt values with Pepper’s Ferry l sludge and polymer 52E.
Results and Discussion 58 „
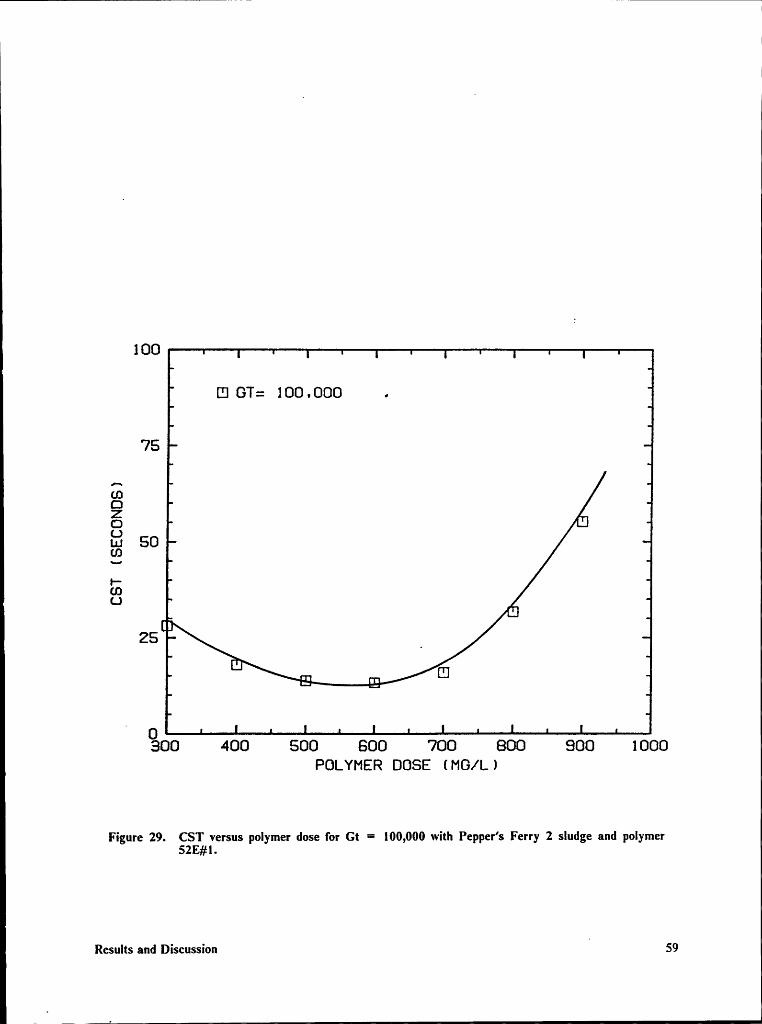
I I
I
100
[II GT: 1OÜ•ÜÜU .
75
ZBCJZ IlLu 50UJ•—U.)L.)
IIII25 _
uE u Ü
I 0300 400 500 600 700 600 900 1 000POLYMER DOSE (MG/L. )
Figure 29. CST versus polymer dose for Gt = l00,000 with Pepper’s Ferry 2 sludge and polymer52E#I.
Results and DiscussionI
59
III different combinations were used and five different combinations were used for a Gt of 100,000.
Figures 30, 31 and 32 show the results of these experiments. These three graphs show that differentcombinations of G and t yield about the same filter press performance. No significant differencesare apparent in the cumulative filtrate curves. Shear inputs up to 3750 sec" and mixing times asshort as 4 seconds were used in the various mixing intensity inputs. One would think that extremevalues for both G and t exist but, they were not identified in this experiment. A change in shearcan effect the results of bench-scale mixing intensity tests; however, for this sludge and the plate and
‘
frame press, a change in G did not effect performance.
Ejfect OfMixing Intensity and Dose With Two Polymers
This set of experiments was conducted with Pepper’s Ferry 3 sludge to try to confirm that apolymer dose selected at a Gt of 30,000 on the bench-scale mixing device, used in conjunction witha sludge and polymer mixing at a Gt of 5000, would result in optimum filter press performance.One batch of sludge was used and two sets of experirnents were performed. One set of experimentswere performed with polymer 52E#l and one set was performed using polymer 521. Experimentswere performed at Gt values of 5000, 30,000 and 60,000. These Gt values were selected based onthe findings of the experirnents with Roanoke sludge and represented a reasonable range over whichgood dewatering could be expected to occur.
Selection Of Doses .
Doses were selected from the optimum dose curves shown in Figures 33 and 34. A separate figureis shown for each polymer. From these figures the dose corresponding to mixing intensity inputsof 5000, 30,000 3.Ild 60,000 were selected. It was anticipated that the dose for a Gt of 5000 would
Results and Discussion 60
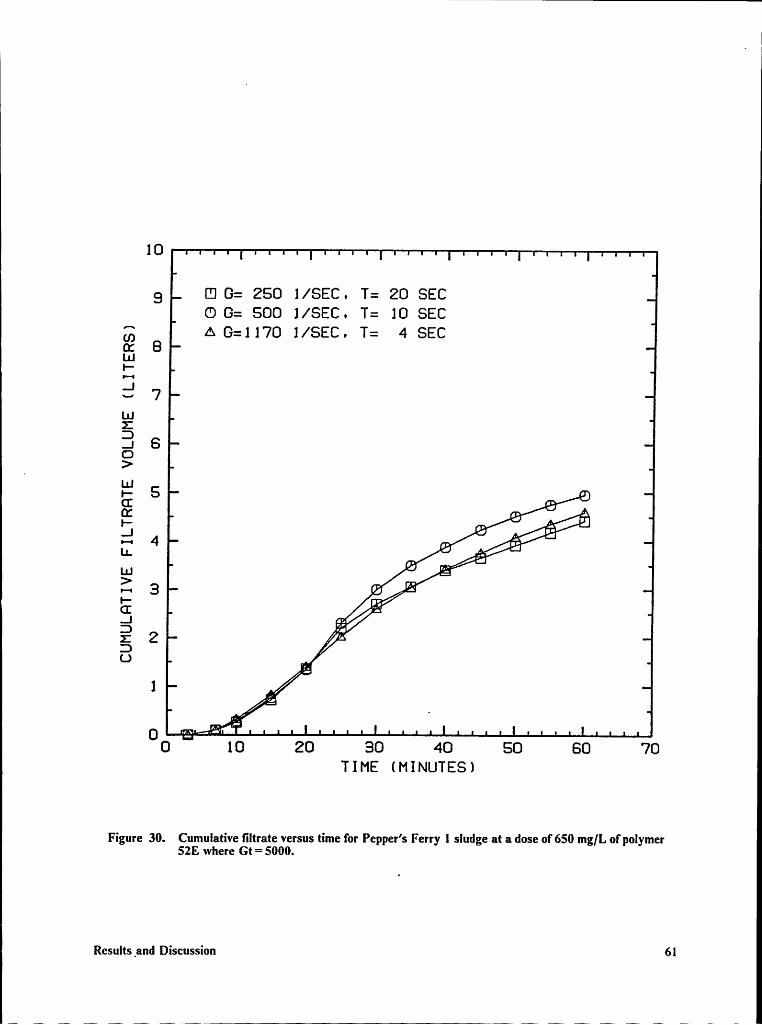
1
10
9 El G: 250 1/SEC „ T: 20 SECO G: 500 1/SEC „ T: 10 SECL'; A G:1170 1/SEC. T: 4 SECoc 8L1JEI.:' *2
1.1.15.1 6Oy >
ä 1 = 1. Q A aE46 ,.-/‘
L$1 22;1äD01Ü0
10 20 30 40 50 S0 70TIME (MINUTES)
Figure 30. Cumulative filtrate versus time for Pepper’s Ferry 1 sludge at a dose of 650 mg/L of polymer52E where Gt = 5000.
Results _and Discussion 6l
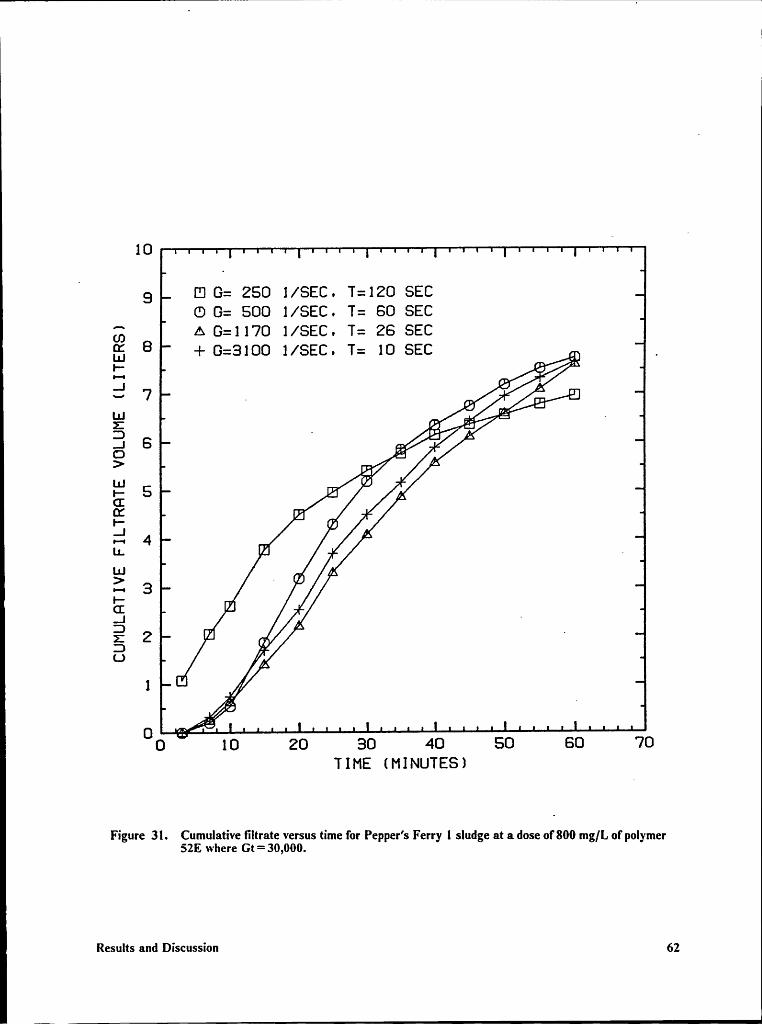
i
10I
I9 El G: 250 1/SEC. T:120 SEC
O G: 500 1/SEC . T: S0 SECZB A G:1170 1/SEC. T: 2S SECS5 8 + G:3100 1/SEC. T: 10 SEC „ .
9 ,ZI 7 _ g9 ·•
Lu __ =- ·..1SO>
5 9 I „,§ ,*5 “ *· 1O-‘•I 4 ru_ I4 .
ä /4E I1Ö1 “ u
ä 2 I1 9‘
¤ C,1 “
/0 0
2:10 20 30 40 50 60 70
TIME (MINUTES)
Figure 31. Cumulative liltrate versus time for Pepper’s Ferry l sludge at a dose of800 mg/L of polymer52E where Gt= 30,000.
Results and Discussion 62
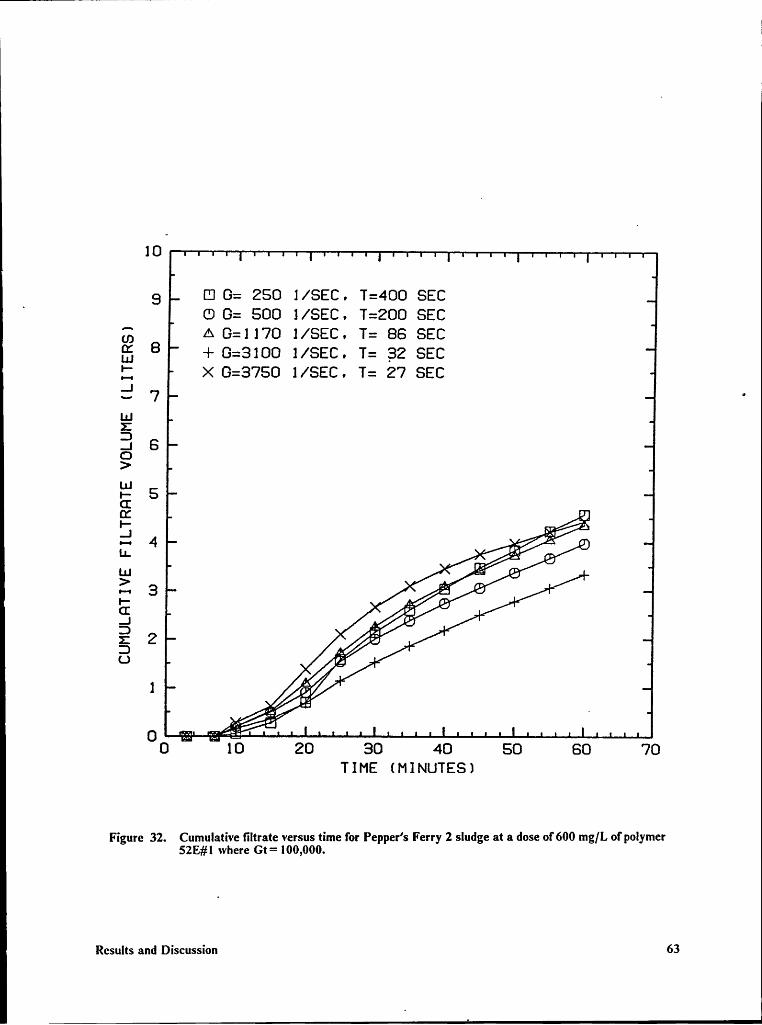
10
9 {I1 G: 250 1/SEC. T:400 SEC_CD G: 500 1/SEC. T:200 SEC
ZB A G:1170 1/SEC, T: 86 SEC{5 8 -1- G:3100 1/SEC. T: 32 SECZ >< G:3750 1/SEC. T: 27 SEC.1„.„ 7 ·1.1.1ä.1 S0>E 6G;E
4°2
3 4
B10
10 20 30 40 50 60 70TIME (MINUTES)
Figure 32. Cumulative liltrate versus time for Pepper’s Ferry 2 sludge at a dose of 600 mg]L of polymer5ZE#l where Gt= l00,000.
Results and Discussion 63
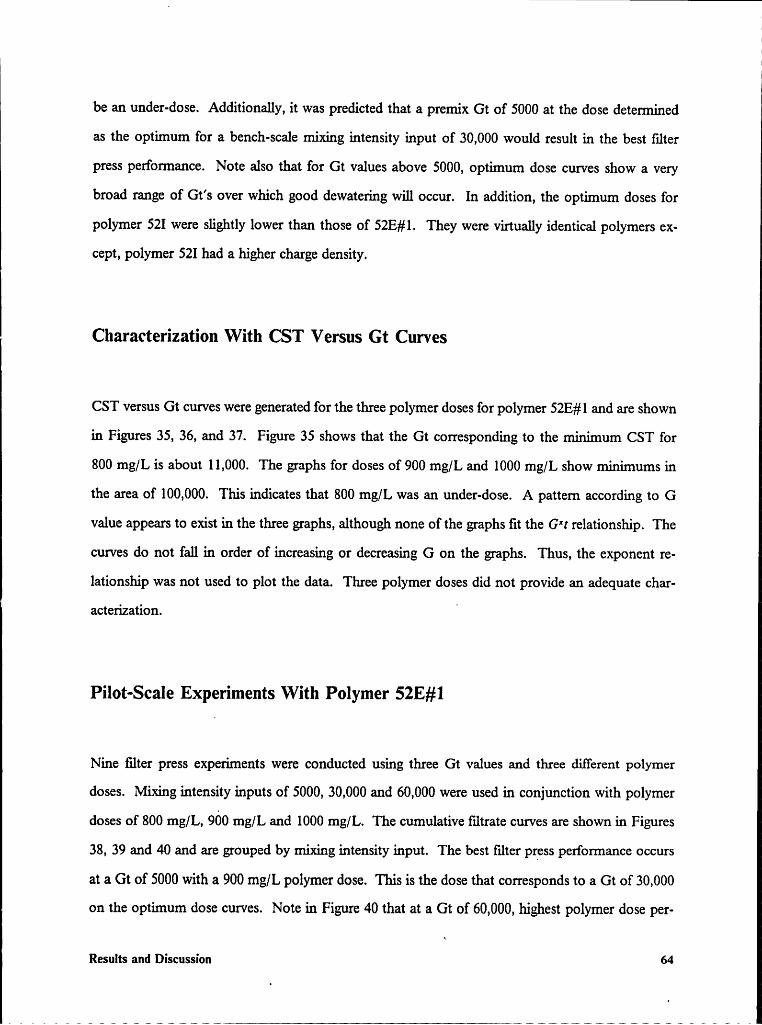
ibe an under-dose. Additionally, it was predicted that a premix Gt of 5000 at the dose determinedas the optimum for a bench-scale mixing intensity input of 30,000 would result in the best flterpress performance. Note also that for Gt values above 5000, optimum dose curves show a verybroad range of Gt’s over which good dewatering will occur. In addition, the optimum doses forpolymer 521 were slightly lower than those of 52E#1. They were virtually identical polymers ex-cept, polymer 521 had a higher charge density.
Characterization With CST Versus Gt Curves
CST versus Gt curves were generated for the three polymer doses for polymer 52E#l and are shownin Figures 35, 36, and 37. Figure 35 shows that the Gt corresponding to the minimum CST for800 mg/L is about 11,000. The graphs for doses of 900 mg/L and 1000 mg/L show minimums inthe area of 100,000. This indicates that 800 mg/L was an under·dose. A pattern according to Gvalue appears to exist in the three graphs, although none of the graphs fit the G*t relationship. Thecurves do not fall in order of increasing or decreasing G on the graphs. Thus, the exponent re-lationship was not used to plot the data. Three polymer doses did not provide an .adequate char-
I acterization. i
Pilot-Scale Experiments With Polymer 52E#1
Nine filter press experiments were conducted using three Gt values and three different polymerdoses. Mixing intensity inputs of 5000, 30,000 and 60,000 were used ir1 conjunction with polymerdoses of 800 mg/L, 900 mglL and 1000 mg/L. The cumulative filtrate curves are shown in Figures38, 39 and 40 and are grouped by mixing intensity input. The best filter press performance occursat a Gt of 5000 with a 900 mg/L polymer dose. This is the dose that corresponds to a Gt of 30,000on the optimum dose curves. Note in Figure 40 that at a Gt of 60,000, highest polymer dose per-
Results and Discussion 64
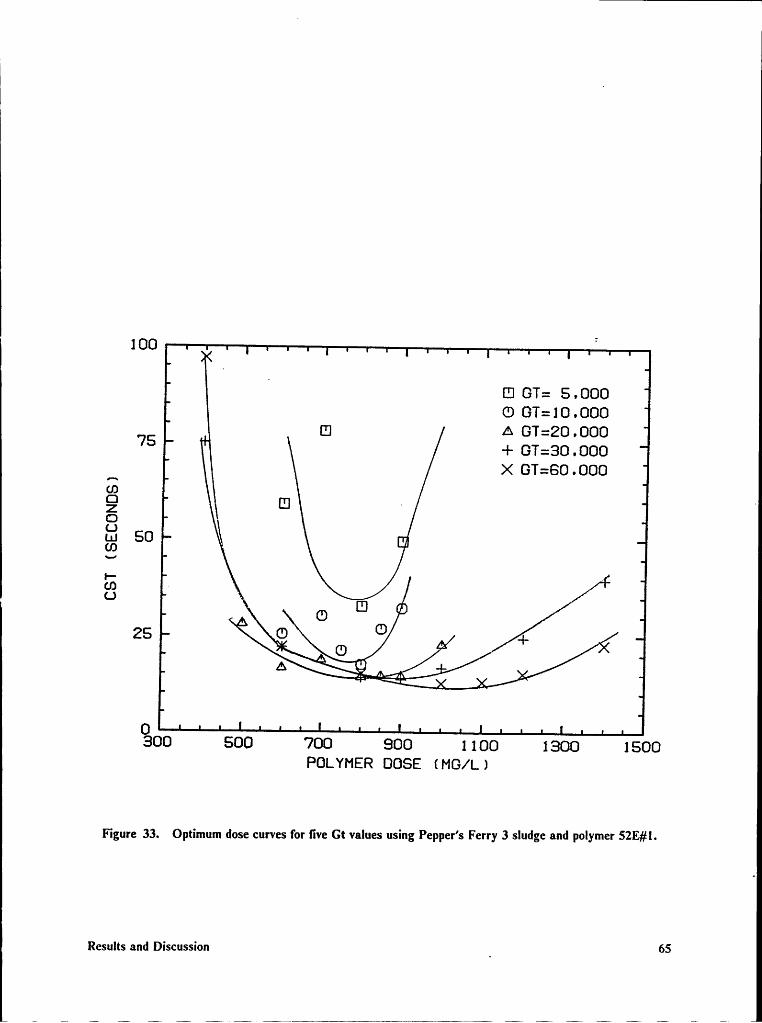
L 1L
L 100 °
EJ GT: 5 . 000C) GT: 10 • ÜÜÜ
,75 E1 A GT:20 . 000+ GT:30 .000_ >< GT:60 . 000
3z Ü ‘ °3u.: 502E II] 025 +
A90
300 500 700 900 1 1 00 1300 1 500POLYMER DGSE (MG/1. 1
Figure 33. Optimum dose curves for live Gt values using Pepper’s Ferry 3 sludge and polymer 52E#l.
Results and Discussion _ 65
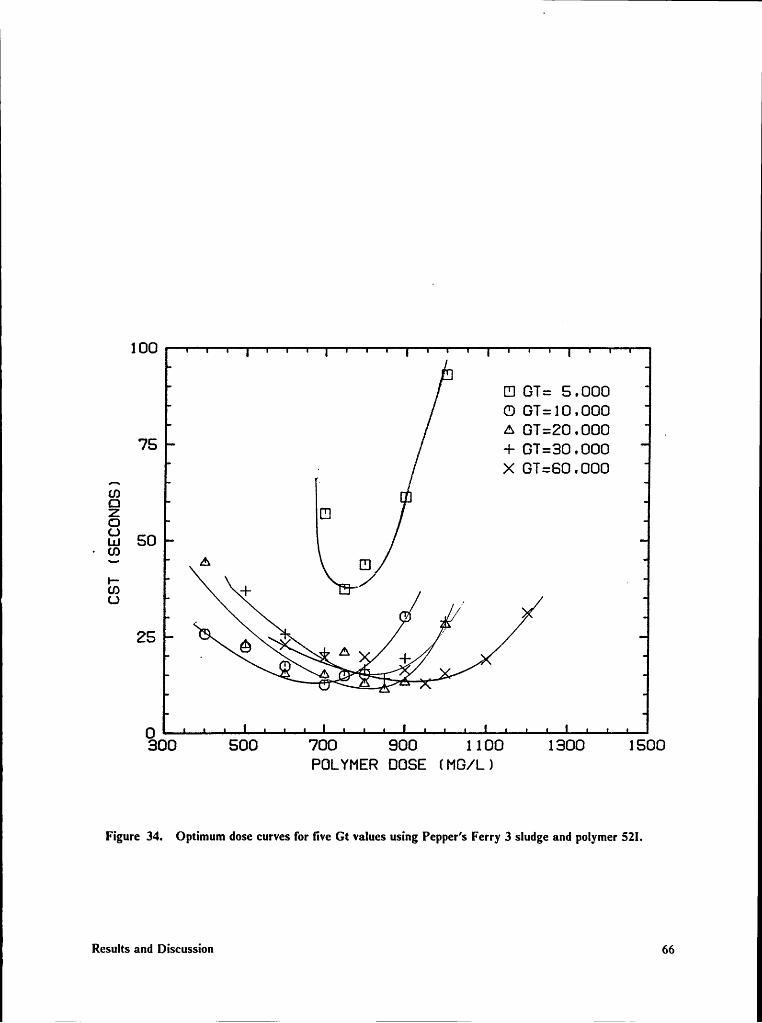
100
El GT: 5 . 000(D GT:10 .000A GT=20 .000 .75 + 0T=a0 .000
· X GT:60 .000}
um8LU S0· tn
i- / .8 + „z259
0300 500 700 900 1 1 00 1900 l 500PÜLYMER 00SE (MG/L )
Figure 34. Optimum dose curves for live Gt values using Pepper’s Ferry 3 sludge and polymer 52l.
Results and Discussion 66
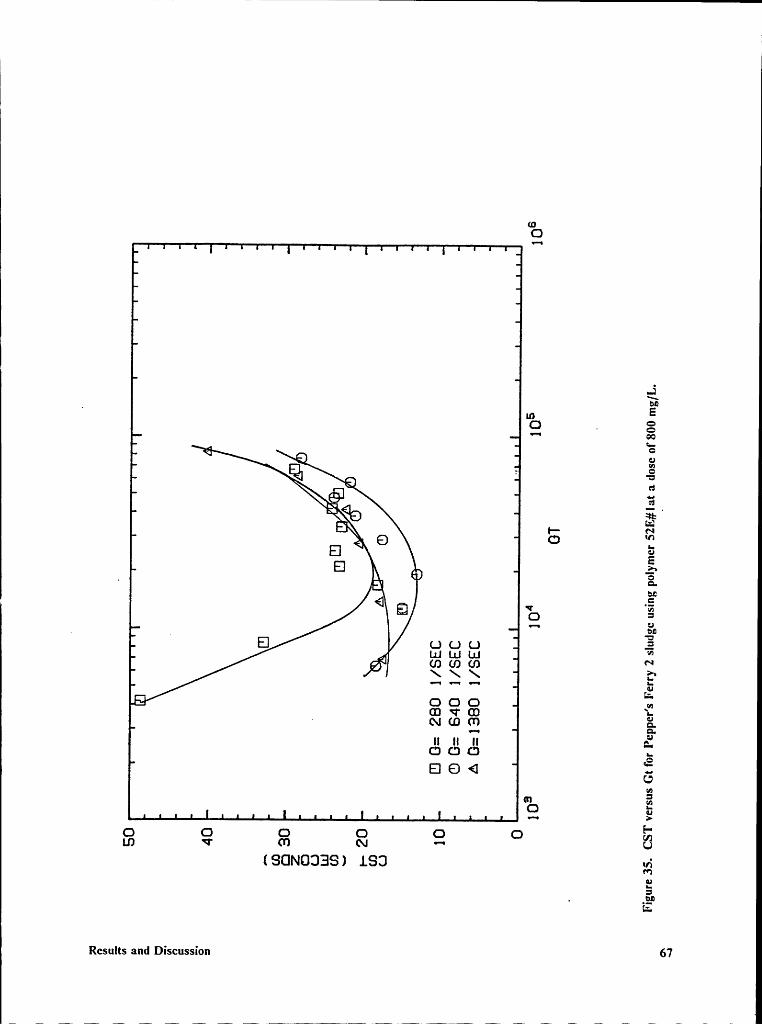
1
esC).5“ö 1 2ä
T *"=• E\•u ee1. :4 9 G '2zuEÜ x Q 3*1 O
4gc
EGL_ coEl 0 0 0 E. Lu Lu Lu ”’
4 co co ua N\ \ \ ä•-1
-1..0 0 0 EG W G ‘¤—· cx: co m än II u EÜ CJ C) .6E1 0 6 2:U
m 2¤ E~·-•>0 0 0 0 0 0 QLD W (0 N ··· U
(9C1N0339) 1.93E. ähE
Rcsults and Discussion 67
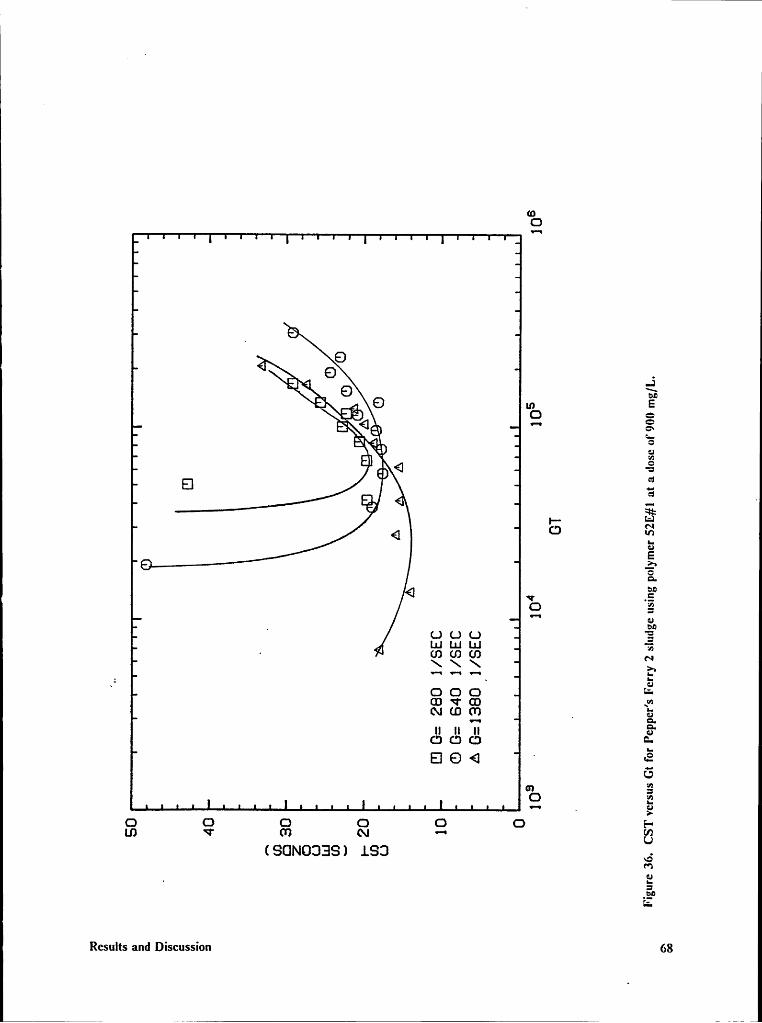
toO
9O .0Ü
ua EO =Q ··• S¢•-
7El 3:.1g ät
Q '2QE.ä.Q _ä°3°-t ut (J L) L) ät
Lu LU L1J 7;° *3 *3 *3 ~9*N P'! V*! tt‘t 0 0 0 ÄG sr G „v=N (.0 ('0 _ gg-u u n 3*
CD (D O ¤-El O Q ‘ =2
L')$°2¤C)
C) C) C) O C) PLD <I‘ 07 N ·-• g(9ClN0339) 1.93 6eo· Ego
E
Results and Discussion 68
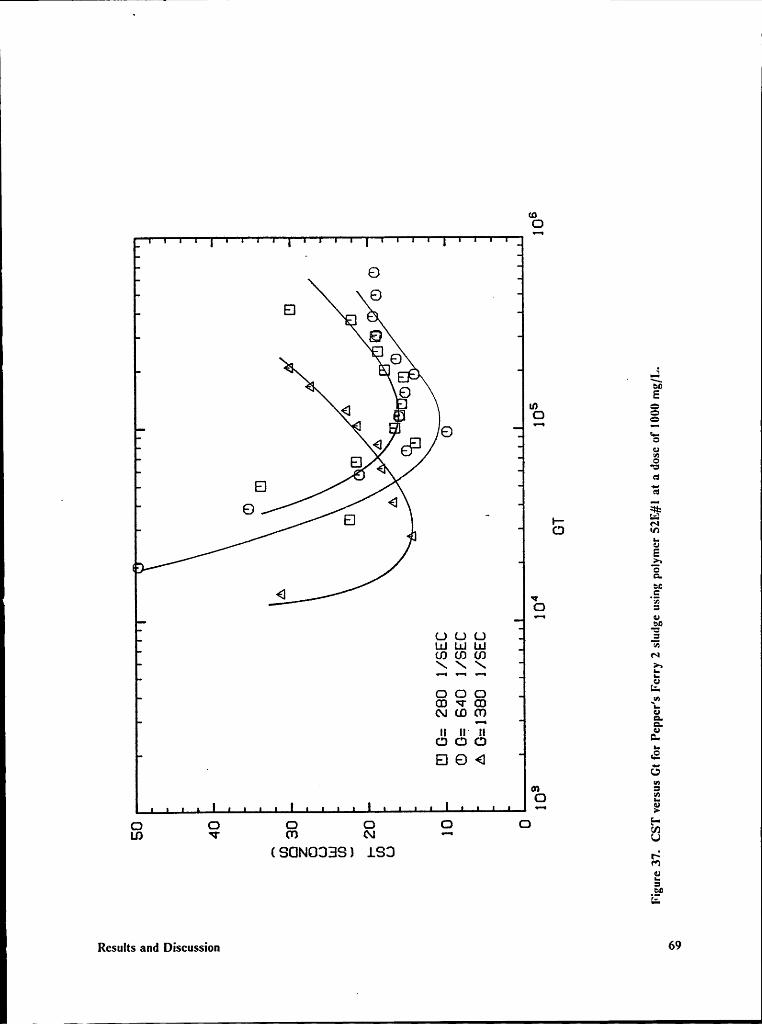
I
(0O
OQ .El = SE5
S ¤‘ „. ‘
=° ~ dS cnO 6_, In ¢1 Z; Oä ä
0 ° °’*50 E " _ gg:
l-*6E.
Z} EQ ¤6 ,, E0 3•—·• 0so
0 0 0 ELu L1..l Lu w(D (D (D N\ \ \ I,I•I Y*l ••¤I ‘-
00 0 0 QO W O ~,_(\J (.0 (*0 ¤=·—· EII ll' Il °0 0 0 {0 0 6 gi
' Om(D¤"">
0 0 0 0 0 0 Q(SUNOIEIS) LSI) „;
Y':0äßE
Results and Discussion 69
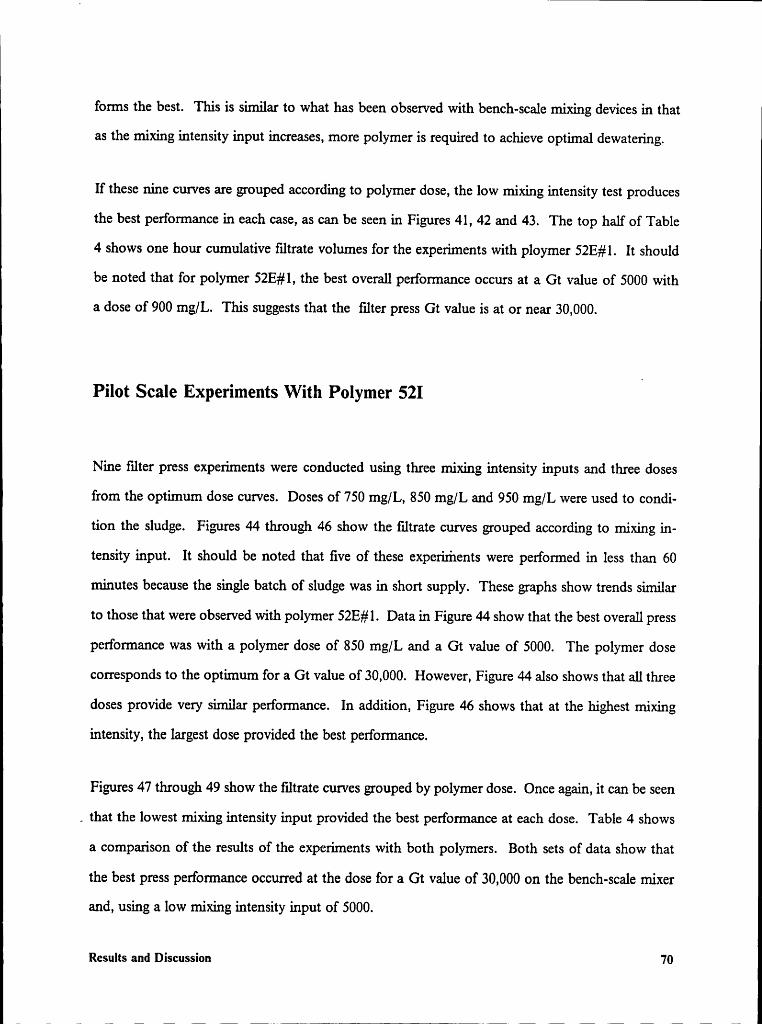
l
forms the best. This is similar to what has been observed with bench-scale mixing devices in thatas the mixing intensity input increases, more polymer is required to achieve optimal dewatering.
If these nine curves are grouped according to polymer dose, the low mixing intensity test producesthe best performance in each case, as can be seen in Figures 41, 42 and 43. The top half of Table4 shows one hour cumulative filtrate volumes for the experirnents with ploymer 52E#l. It shouldbe noted that for polymer 52E#l, the best overall performance occurs at a Gt value of 5000 witha dose of 900 mg/L. This suggests that the filter press Gt value is at or near 30,000.
Pilot Scale Experiments With Polymer 521i
Nine flter press experiments were conducted using three mixing intensity inputs and three dosesfrom the optimum dose curves. Doses of 750 mg/L, 850 mg/L and 950 mg/L were used to condi-tion the sludge. Figures 44 through 46 show the filtrate curves grouped according to mixing in-tensity input. It should be noted that five of these experiments were performed in less than 60minutes because the single batch of sludge was in short supply. These graphs show trends similarto those that were observed with polymer 52E#l. Data in Figure 44 show that the best overall pressperformance was with a polymer dose of 850 mg/L and a Gt value of 5000. The polymer dosecorresponds to the optimum for a Gt value of 30,000. However, Figure 44 also shows that all threedoses provide very similar performance. In addition, Figure 46 shows that at the highest mixingintensity, the largest dose provided the best performance.
Figures 47 through 49 show the filtrate curves grouped by polymer dose. Once again, it can be seen, that the lowest mixing intensity input provided the best performance at each dose. Table 4 shows
a comparison of the results of the experiments with both polymers. Both sets of data show thatthe best press performance occurred at the dose for a Gt value of 30,000 on the bench·scale mixerand, using a low mixing intensity input of 5000.
Results and Discussion 70
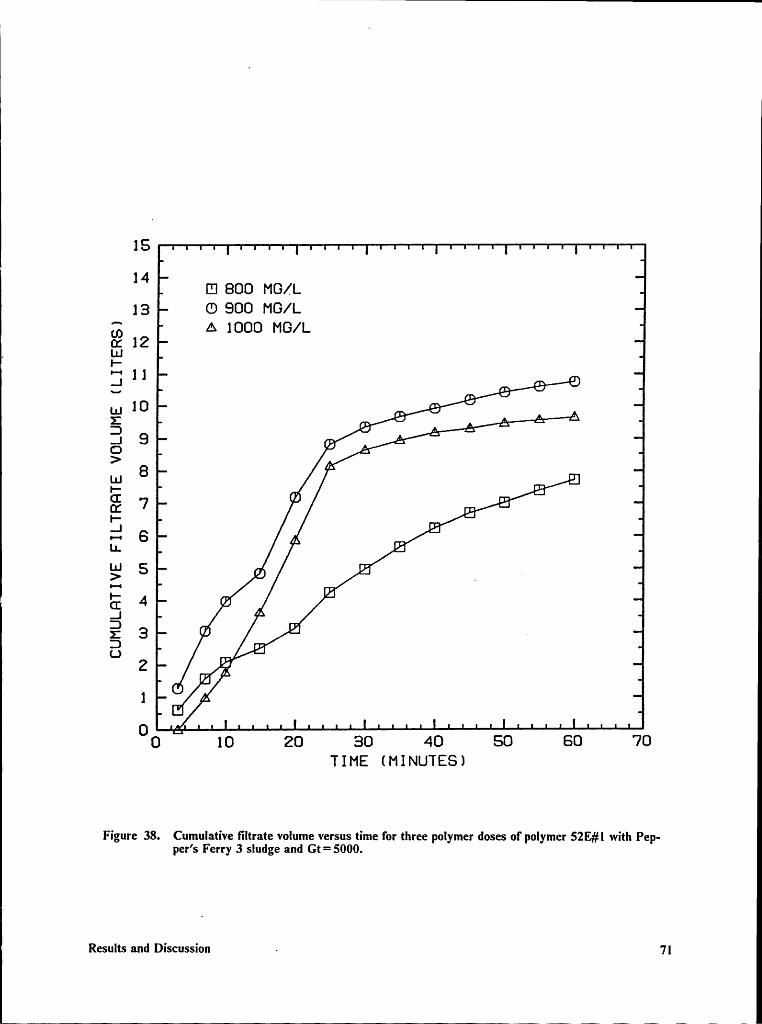
V .
1514 III 800 MG/L13 O 900 MG/L
E A 1000 MG/L0: 12_ LuE; 1 1..I
§ .. . A ‘.J 9 A -Q a> ALu 8 HEE •· 2OC 7 g
‘
E 6“
LL In ü‘;' 5 “E 4 I
“ä4u
2 gv EIA
1 /4II
0 0Ä
1 0 20 30 40 50 60 70TIME (MINUTES)
Figure 38. Cumulative liltrate volume versus time for three polymer doses of polymer 52E#l with Pep-per’s Ferry 3 sludge and Gt=5000.
Results and Discussion — 7l
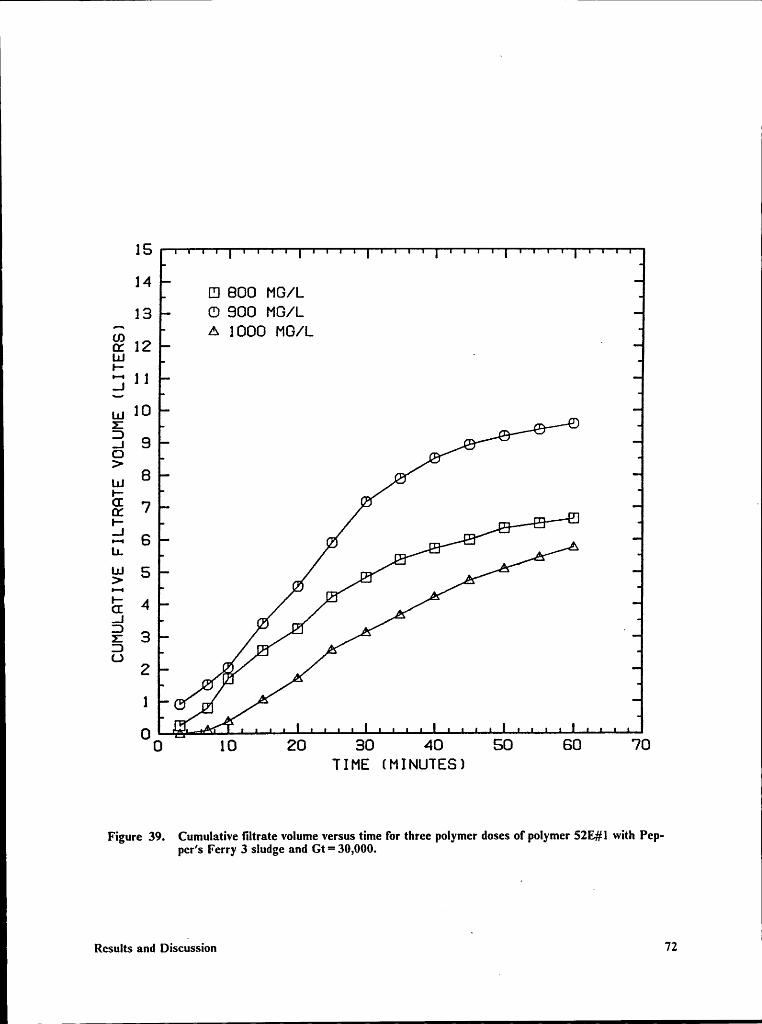
Ä
151 4 E] BUG MG/L13 C') SGU MG/L,3 A IUGU MG/L
0: 12 ‘’
+-zl 1 1ä .- == °.1 S 9 'O 6>u1 8
°7 6 .
=“ “
E B agE 2 5
Ä AäJ 5 Ü 6 . “E 4 “ , “J r
4
E 2 “ — ‘8 “2?Q I4 «
1 9 H“
-.;•*‘k0 10 20 30 40 50 60 70
TIME (MINUTES)
Figure 39. Cumulative filtrate volume versus time for three polymer doses of polymer 52E#l with Pep-per’s Ferry 3 sludge and Gt= 30,000.
Results and DiscussionI
72
—
1
E I S A r14 Ü 800 MG/L13 (D 900 MG/LA 1000 MG/L1:1: 12L1..I1-
J I 1 .
E..1 9O> .LU 8EE 7 ‘
5 tu 6 “
L1.p E; __ 9gl 5 ä - 9 6
E 4 T 6 75] 6 9ä 3 -L.: H Q
2 ÜE1 „ °0 1 0 20 30 40 S0 60 70
TIME (MINUTES) .
Figure 40. Cumulative liltrate volume versus time for three polymer doses of polymer 52E#l with Pep-per’s Ferry 3 sludge and Gt= 60,000.
Results and Discussion 73
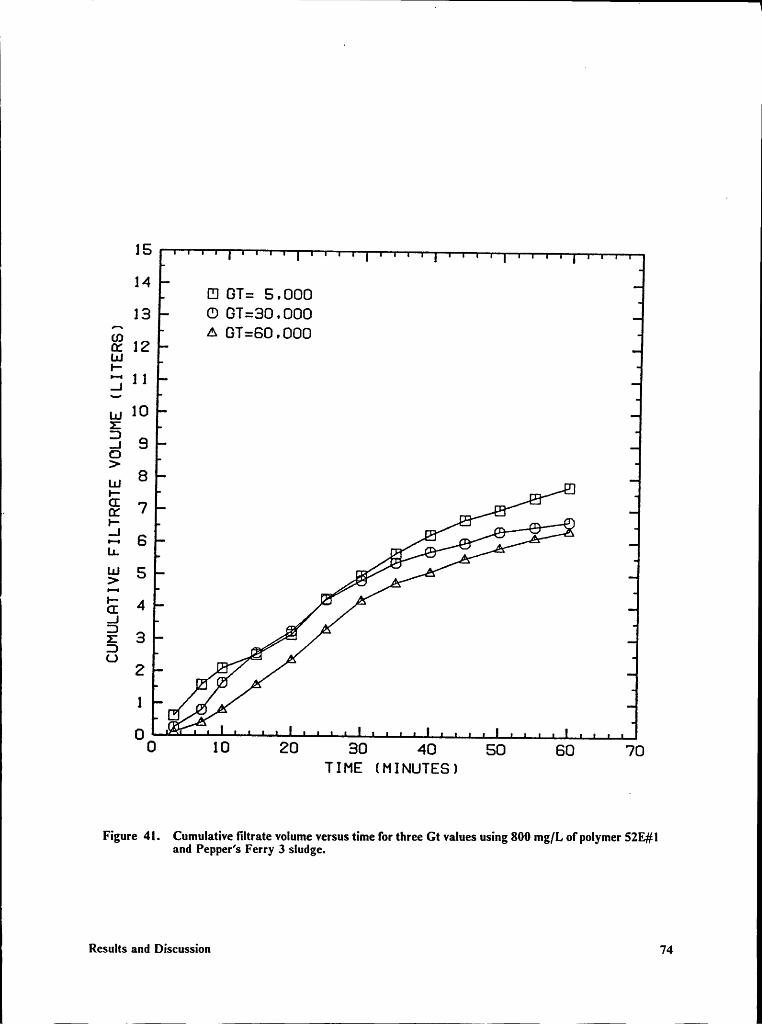
1514 III GT: 5 , 00013 (D GT=30 ,000
[5 A GT=60 ,0001x 121.11E: 1 1..1
E..1 90>E 8 „ =•
. g 7 __ 2" " ,. 2 ?d B E „ ° 2 AL1. E 9 “L;15i: A0: 4 ‘öl ‘:/3 6;/··L) *5 n
2 2ü Ü 2
0 Ä0 1 0 20 30 40 50 60 70
TIME IMINUTESI
Figure 4l. Cumulative filtrate volume versus time for three Gt values using 800 mg/L ol' polymer 52E,#land Pepper’s Ferry 3 sludge.
Results and Discussion 74
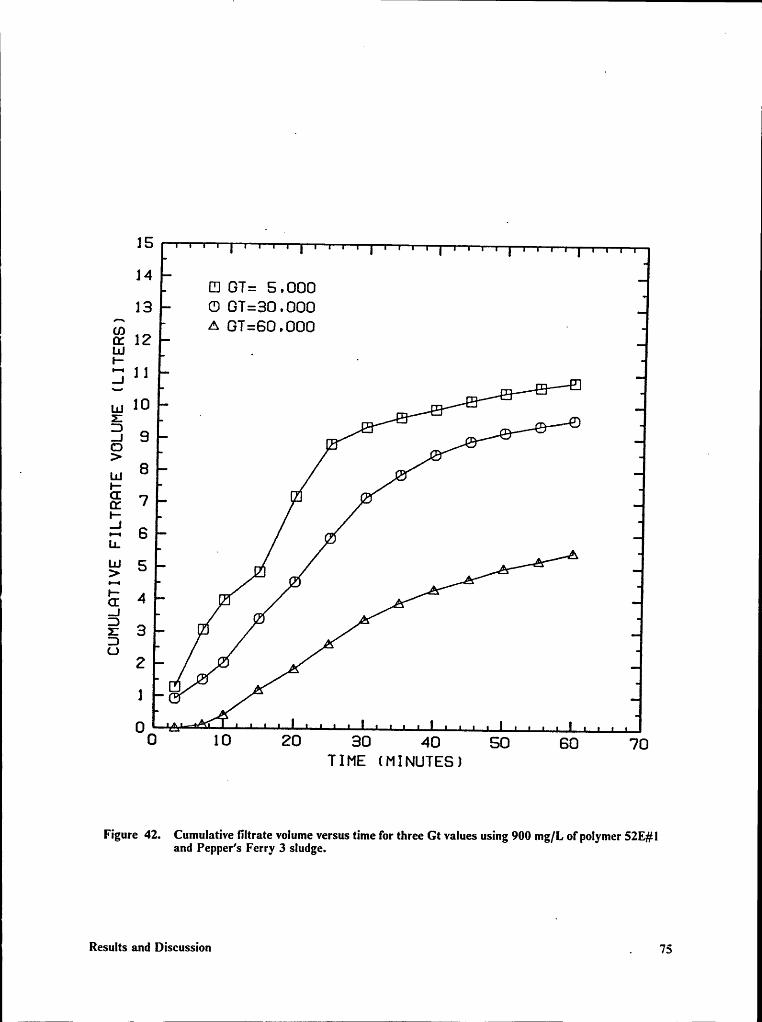
15_ M
14 Ü] GT: S ,ÜÜÜ13 CD GT=30 ,000
Q} A GT=60 ,000 ·‘ oc 12LIJ . ~_, 1 1Lu 10
..1 9O „>. Lu 8I-& 7'I1•-• SLL ”
3gl 5 L .; T
E 4 “öl Qz 3D a(.)
2 a
1 A
0 Ä ...;•1A0 10 20 30 40 50 60 70
TIME (MINUTES)
Figure 42. Cumulative liltrate volume versus time for three Gt values using 900 mg/L ofpolymer 52E#land Pepper’s Ferry 3 sludge.
Results and Discussion , 75
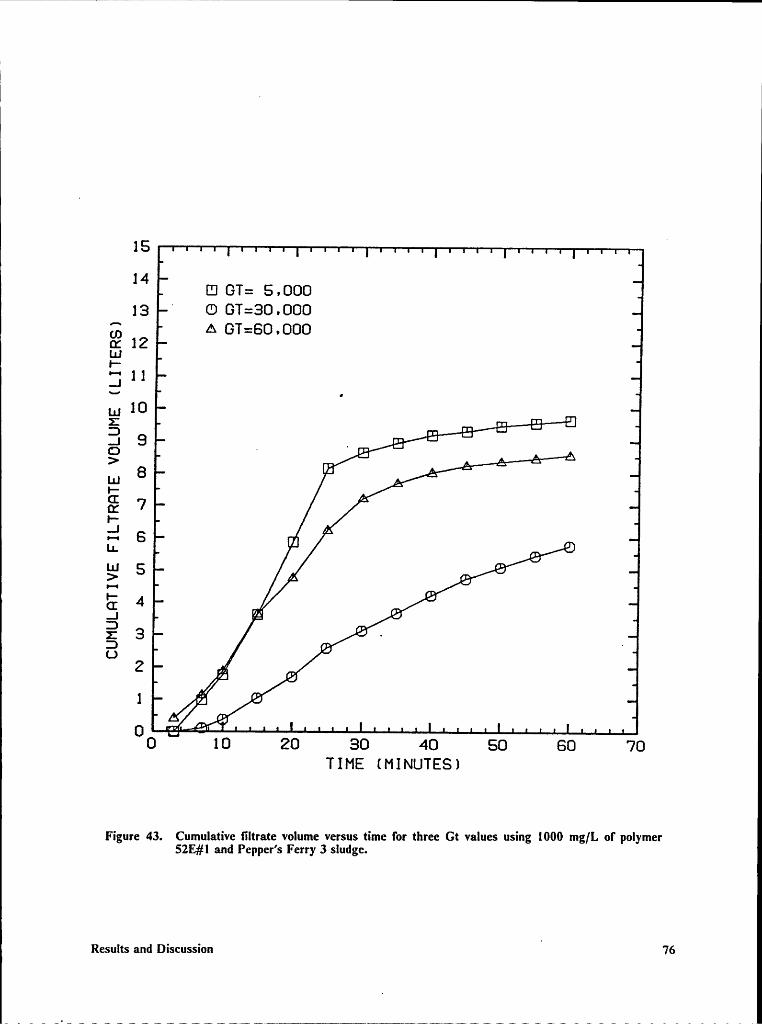
« LII .
15 I
1 4 II] GT: 5,00013 ” C) GT=30 , 000
(T, A GT=50 ,0000: 12LU*.2-1 ll
§ ., 2 2 “-1 9 . s 2O · 5 A> 8 IB .. * 7 Ä
Qt•-
Ag 7'Z,E 6 u v „gl 5 /4QE
4 _ ”51 E 9
6 „D g ·0 .21
20 ,.:2:;;
0 l 0 20 30 40 50 60 70TIME (MINUTES)
Figure 43. Cumulative filtrate volume versus time for three Gt values using 1000 mg/L ol' polymer52E#l and Peppcr’s Ferry 3 sludge.
Results and Discussion I 76
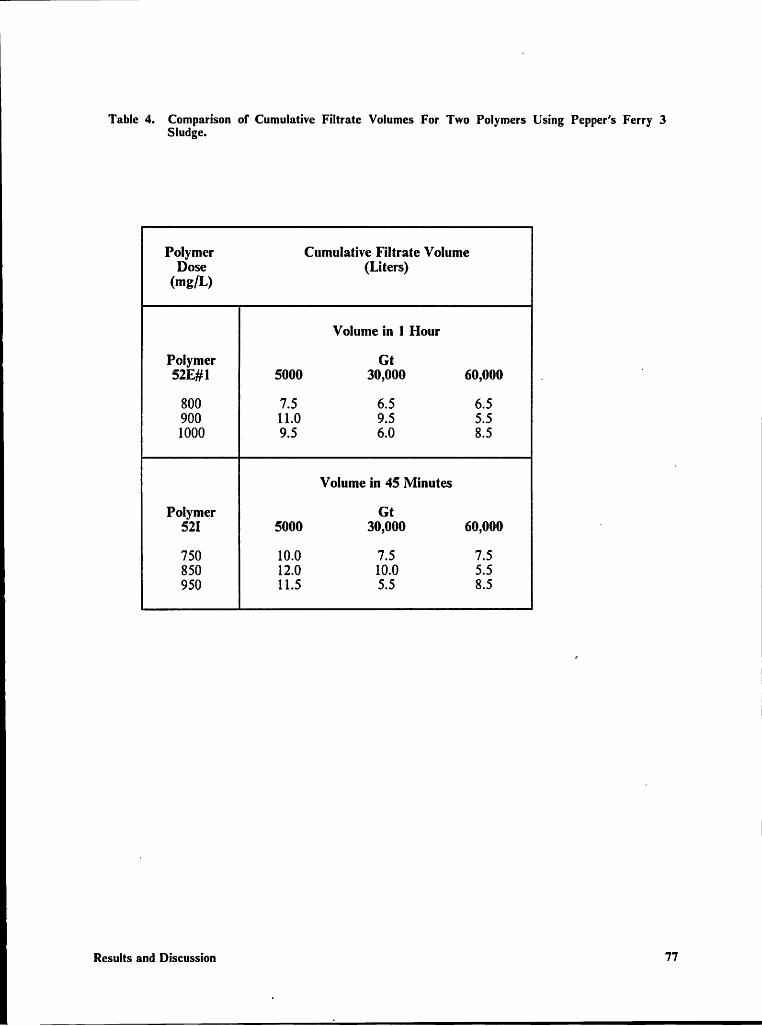
Table 4. Comparison of Cumulative Filtrate Volumes For Two Polymers Using Pepper's Ferry 3Sludge.
Polymer Cumulative Filtrate VolumeDose (Liters)(mg/L)
Volume in 1 Hour
Polymer Gt52E#1 5000 30,000 60,000 .
‘
800 7.5 6.5 6.5900 11.0 9.5 5.51000 9.5 6.0 8.5
Volume in 45 Minutes
Polymer Gt521 5000 30,000 60,000 ‘
750 10.0 7.5 7.5850 12.0 10.0 5.5950 11.5 5.5 8.5
Results and Discussion 77
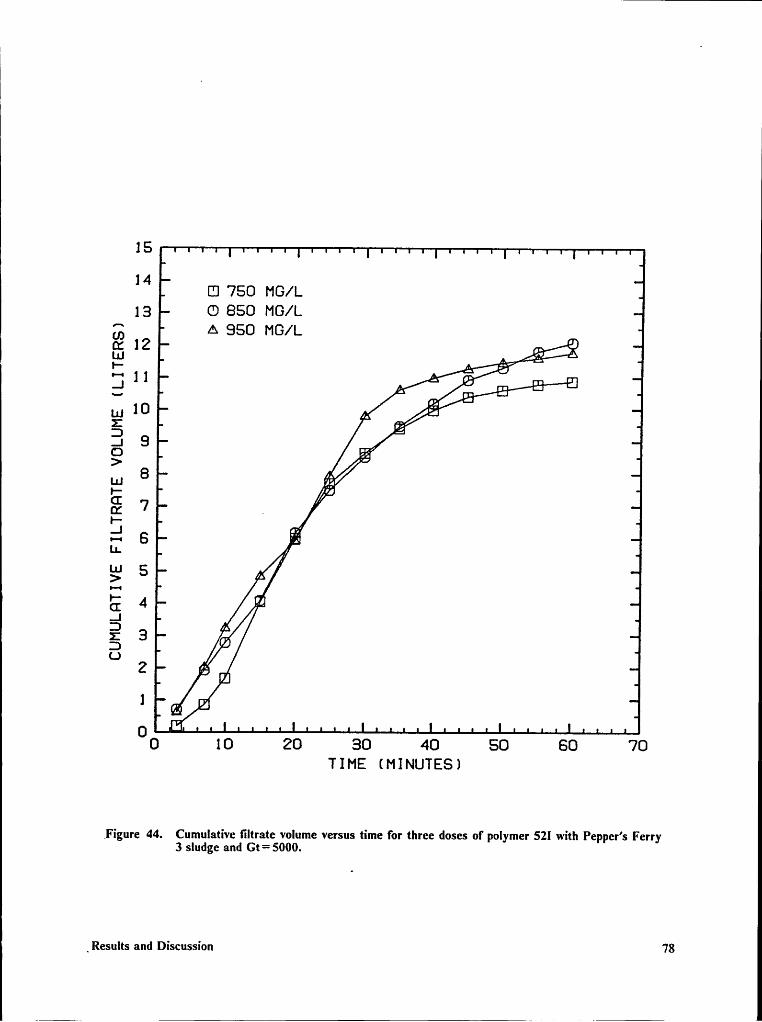
1514 II1 750 MG/L13 0 850 MG/L
6 A 950 MG/L 0Ii 1 1 ,. “ E 2 ¤T
10 , L
..1 9 „Q 8
7 1’
LI./4
i
E 4 94ä /4§ 3 aß1.1 2 l°' u
1 I'• Ü —
0 10 20 30 40 50 60 70TIME (MINUTES)
Figure 44. Cumulative liltrate volume versus time for three doses of polymer 52l with Peppcr’s Ferry3 sludge and Gt=5000.
_Results and Discussion 78
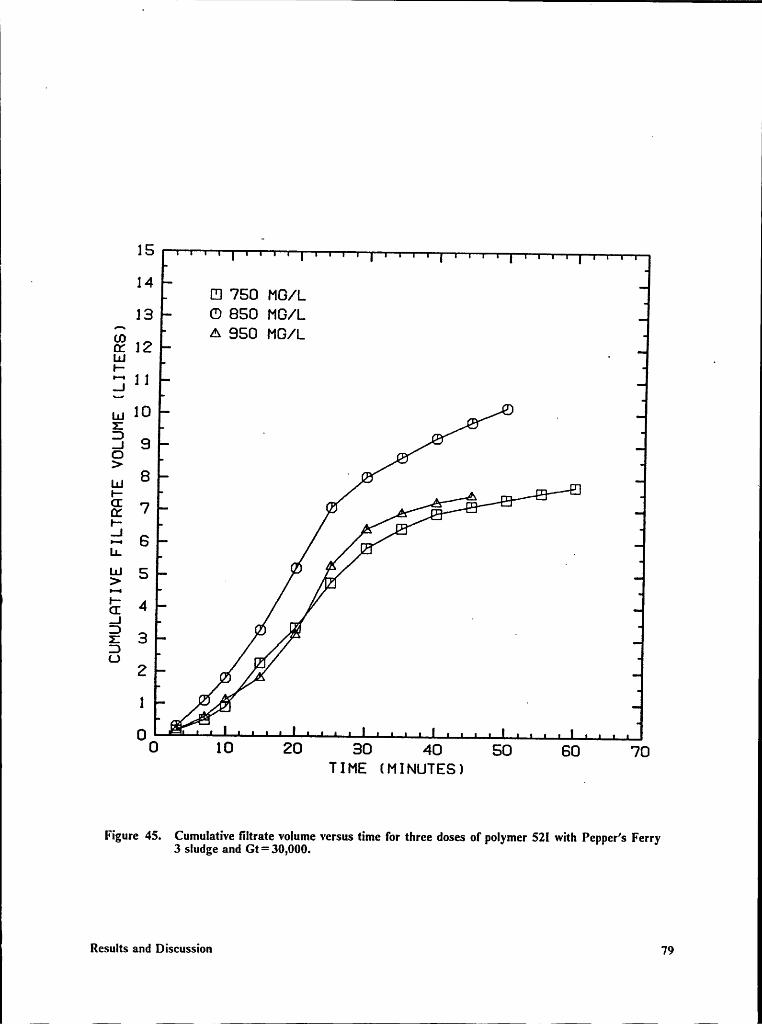
I 15 U· 14 [El 750 MG/L
13 O 850 MG/Lgg A 950 MG/Lcz 12 _Lu .r-.3 1],„ 10 __
° .5 « „ ‘..1 9 ‘§’
8 °E 1
I ,, 2 “ ig 7 va 2 ‘*3 ·. 2L': 6 2
/A l
E 4 1ä 3 u 55 .
r12„1/§“ ‘
0 E0 10 20 30 40 50 60 70
TIME (MINUTES)
Figure 45. Cumulative filtrate volume versus time for three doses of polymer S2! with Pepper’s Ferry3 sludge and Gt=30,000.
Results and Discussion 79
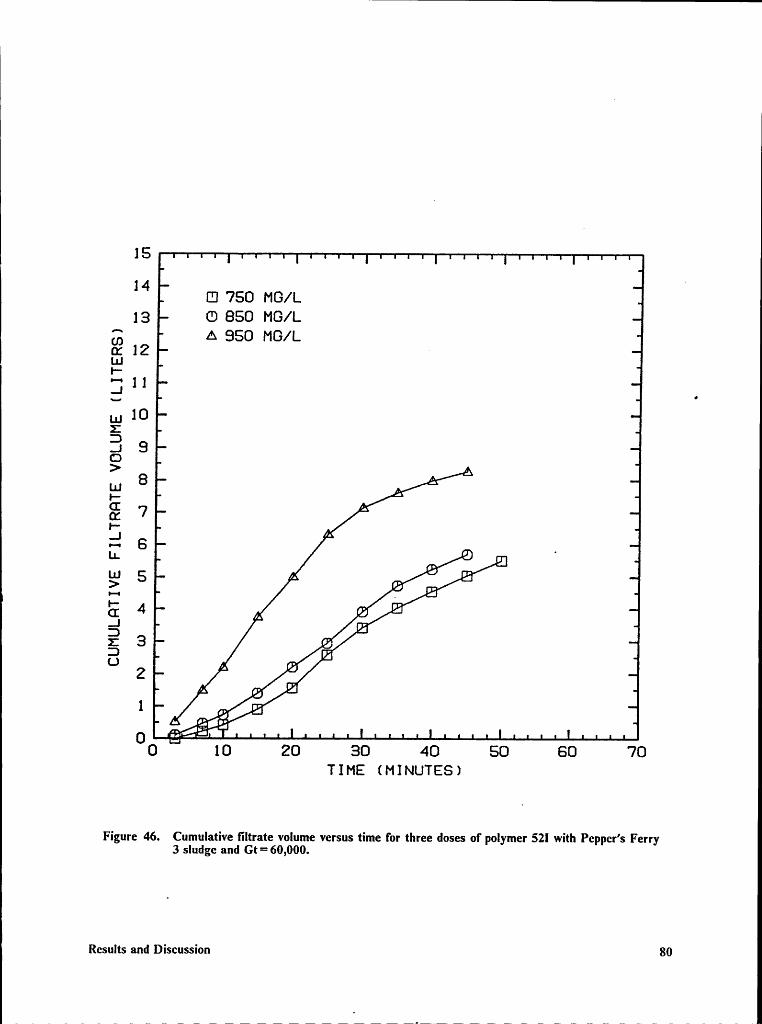
15
14 iE] 750 M0/L
13 (D 850 MG/LQ; A 850 MG/Lo: 12Lu*3.J 11 ·ä.1 3O>Lu 8EE 7
*3E S 0 . ·Lu 5 ß ,. J> 9 E
‘
E 4 » 4—' u3 02 ü ‘
9 H1 ,. 0
· 30 10 20 30 40 50 60 70
TIME (MINUTES)
Figure 46. Cumulative liltrate volume versus time for three doses of polymer 52l with Peppcr’s Ferry3 sludge and Gt=60,000.
Results and Discussion 80
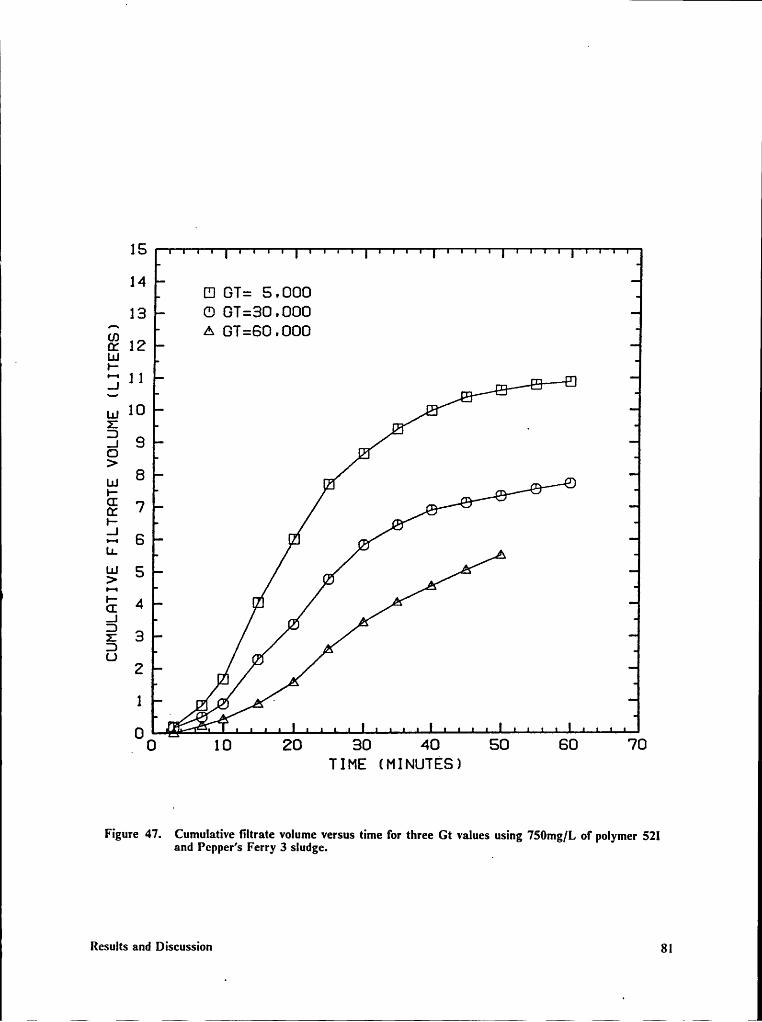
I
E 151 4 [I1 GT: 5 . 00013 C) GT=30 .000
EB A GT=60 .0000: 124 LUe-3 11 u 2 9 HZ V .3 6 A0 6>LU 8 ra „ 9I- __ 9 "E 7 6 '13 6
E 4 u =J
"E6 I:> I ».L) 2 lg
1 Q] Q A '
0_0 10 20 30 40 50 60 70
TIME (MINUTESJ
Figure 47. Cumulative filtrate volume versus time for three Gt values using 750mg/L of polymer 52land Pcpper’s Ferry 3 sludge. I
Results and Discussion 8l
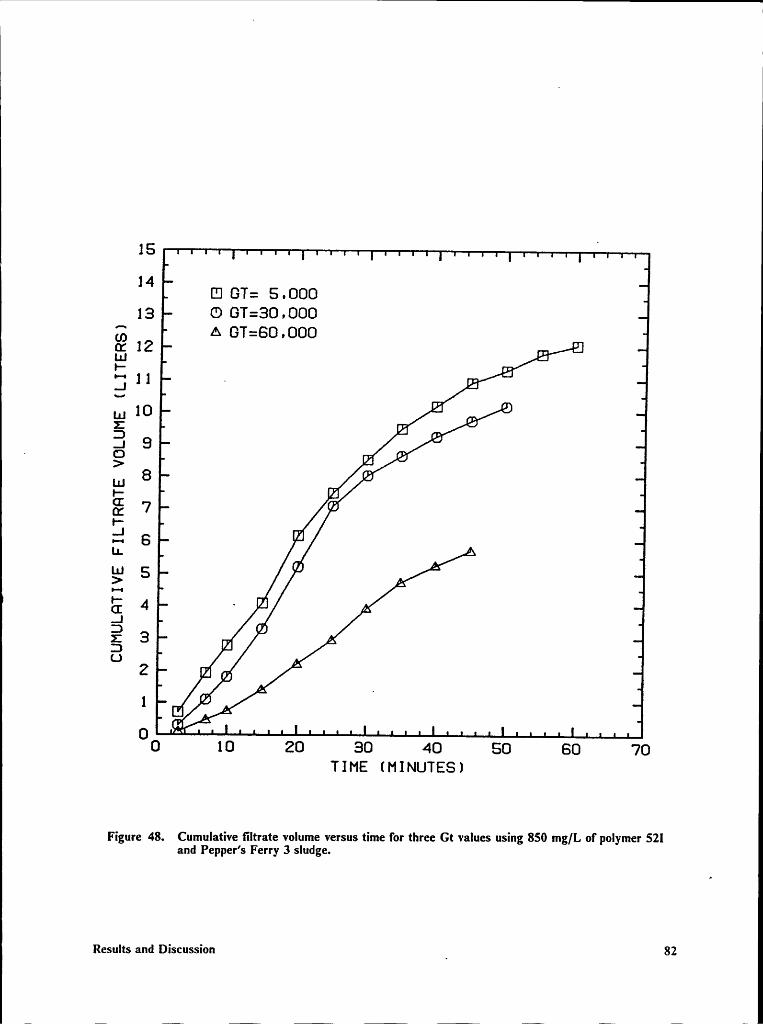
15 E
14 [El GT: 5 , 00013 0 GT:30 ,000
(T) A GT=60 ,0000: 12L1.1E_, 1 1 -,_„ 10 ,_
°•·‘
..1 9 _ ‘
Lu 8 Ü1-2% 7 ··5•—• SLL, A
2 5 "“
5 4 - ,,Ö1 0Z 3 ADU £•
1L• .
0 Q1 Ä A
0 10 20 30 40 50 60 70TIME (MINUTES)
Figure 48. Cumulative filtrate volume versus time for three Gt values using 850 mg/L of polymer 52land Pepper’s Ferry 3 sludge.
Results and Discussion _ 82
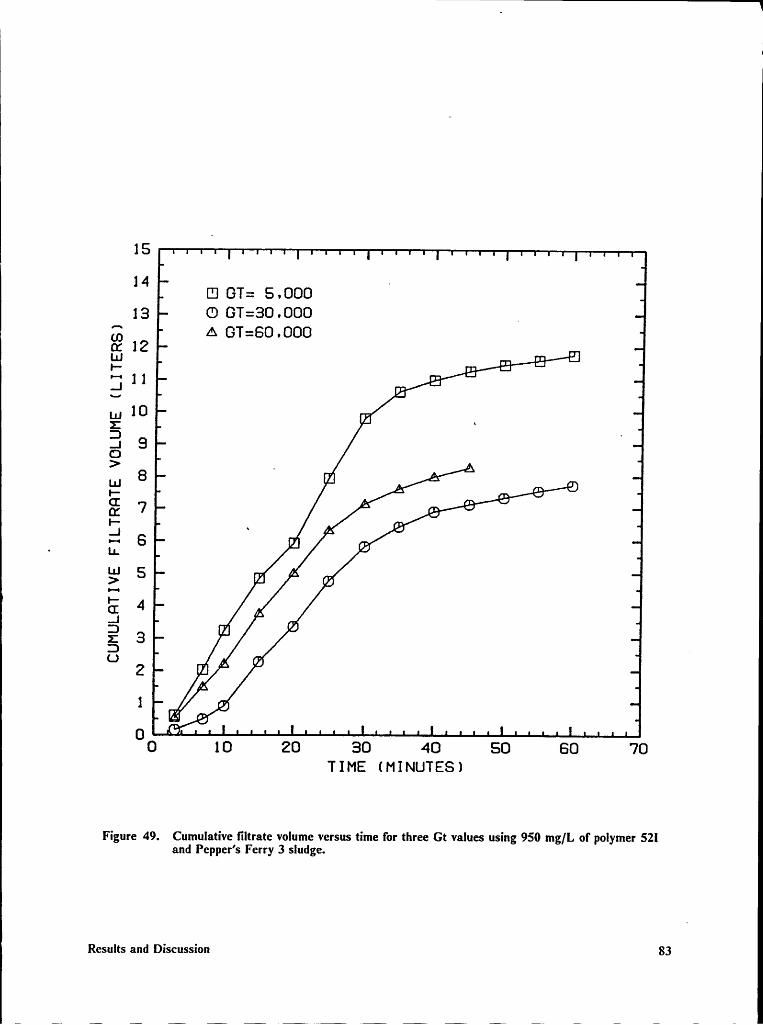
u
15_
14 ~[Il GT: S ,00013 CD GT;-30 ,000 _
Q; A GT=60 ,000cz 12 _U-! „ :.: Jl"
= *cl 1 1 E -gg! 10 ra „ l..1 9CJ> · . . ALu 8 u Ä =- ß 9Ü" _ ‘· =
Ö7 “ c '*3 — »- Al E 6 H 6
g 5 'Z ”‘ vz/121 3 rz °3 .4 U
U 50 .6
0 1 0 20 30 40 S0 60 70TIME (MINUTES)
Figure 49. Cumulative filtrate volume versus time for three Gt values using 950 mg/L ol' polymer 52land Pepper’s Ferry 3 sludge.
Results and Discussion 83
IIIIII
Proposed Filter Press Polymer Dosing and Mixing Scheme
It appears from the results of the experiments with both Pepper’s Ferry and Roanoke sludge sam-ples that mixing intensity input provides a method by which a polymer dose can be selected inorder to optimize plate and frame flter press performance. Bench-scale mixing has been shown torelate to the actual performance of a dewatering system. This means that the shear produced withinthe machine is a major factor in the performance of dewatering systems and dictates both the choice
I of polymer and polymer dose. _
From the filter press experiments performed in this section it appears that a simple filter press op-erational scheme can be developed for the press used in this study. The first step would be to de-velop an optimum dose curve based on a Gt of 30,000. If the dose corresponding to the minimumCST is selected from this curve and used in conjunction with a mixing intensity input of 5000, goodfilter press performance should result. If this method is correct, it indicates that the filter press isproviding some mixing and that polymer must be added to account for this additional shear. It alsoIseems that mixing prior to introduction to the dewatering machine should be kept to a minimum.If the sludge and polymer are over-mixed, more polymer would be needed to obtain the same per-
forrnance. The estimated value of 30,000 for a filter press Gt is an approximation. It would be
more accurate to report it as a range from 15,000 to 40,000. This would indicate that the pilot press
is a relatively low shear device. Larger filter presses may have much higher shear values. Higherpump pressures, longer pipes and more travel time for the sludge would all contribute to an increasein shear in a larger dewatering machine. These factors would, in turn, increase polymer require-ments. Therefore, each press type probably requires a separate Gt characterization.
Results and Discussion 84
I~ II
Sludge Cake Dry Solids Concentratiorz
Filter press performance up to this point in the study was based solely on the cumulative volumeof filtrate produced by the press in one hour. While a greater filtrate flow allows for a larger volumeof sludge to pass through the press, increased water removal as indicated by sludge cake dry solidsconcentration is the primary objective of mechanical dewatering. Thus, a set of experiments wereperformed to correlate cumulative filtrate volume and sludge cake dry solids concentration. In ad-
_ dition, because the previous filter press experiments were stopped after one hour, filter press fltrateflow could be evaluated until press failure to determine if the filtrate curve characteristics changedfrom the one hour point until test completion.
Nine plate and frame filter press experiments were perfonned. Doses were determined in the samemanner as previously described for mixing intensity inputs of 5000, 30,000, and 60,000 as shownin Figure 50. The doses of 600 mg/L, 700 mg/L, and 900 mg/L and the three Gt values were usedto generate nine filtrate curves. The press was operated until the filtrate flow rate decreased below20 mL/min. Then, the filter press was shutdown and the sludge cake was analyzed for dry solidsconcentration.
The nine filter press experiments grouped by mixing intensity input are shown in Figures 51through 53. These figures show a larger filtrate volume yielding a higher dry solids concentration.For the data for polymer doses of 600 mg/L and 900 mg/L in Figure 5.1, the dry solids concen-tration of the two sludge cakes and the respective total fltrate Volumes are nearly the same, eventhough the times of the experiments differed by 40 minutes. In addition, there are no changes inthe relative relationships of any of the curves after 60 minutes. This appears to validate the use ofa 60 minute test to evaluate filter press performance in terms of throughput Volume.
In Figure 54, filtrate volume after one hour was plotted against final sludge cake dry solids con-centration for each of the nine experiments. A line was fitted using the method of least squares.
Results and Discussion 85
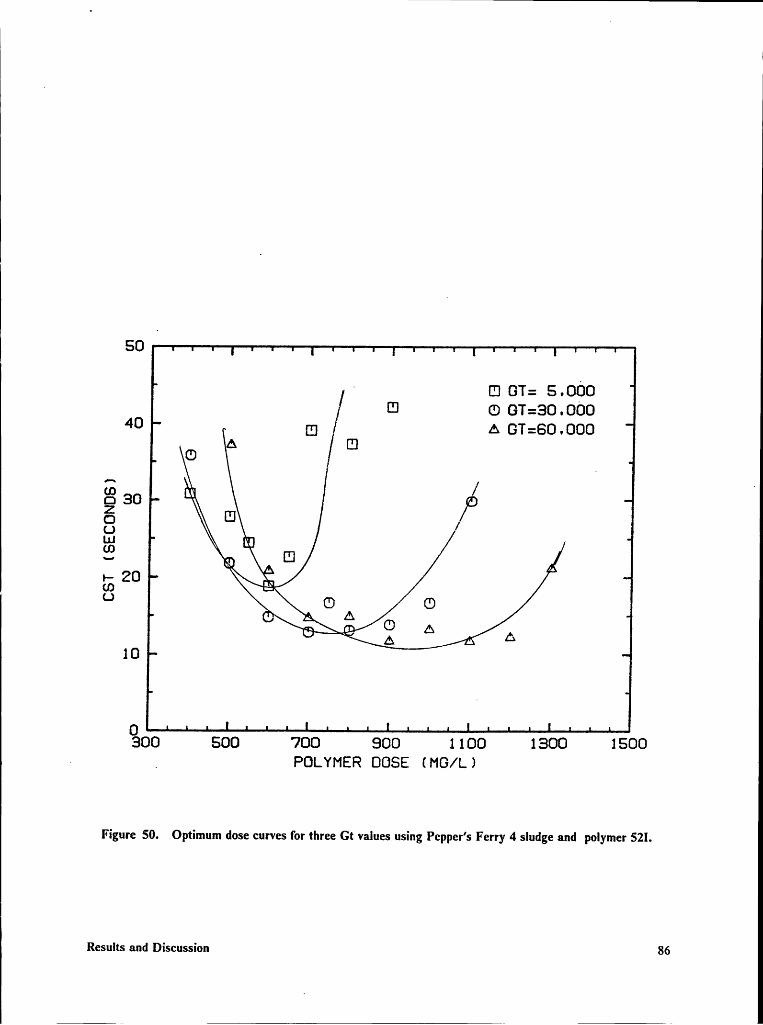
50· 0 61: 6 .000
/ H1 0 61:30 .00040 Ü A 61:60 .000/ 00
ä 30 /00 Ü ,(JäA. El1- 20uaU 0 A 0
E A A10
0300 500 700 900 1 100 1300 1 500. _ POLYMER DOSE (M6/L1
Figure 50. Optimum dose curves for three Gt values using Pepper’s Ferry 4 sludge and polymer S2!.
Results and Discussion 86
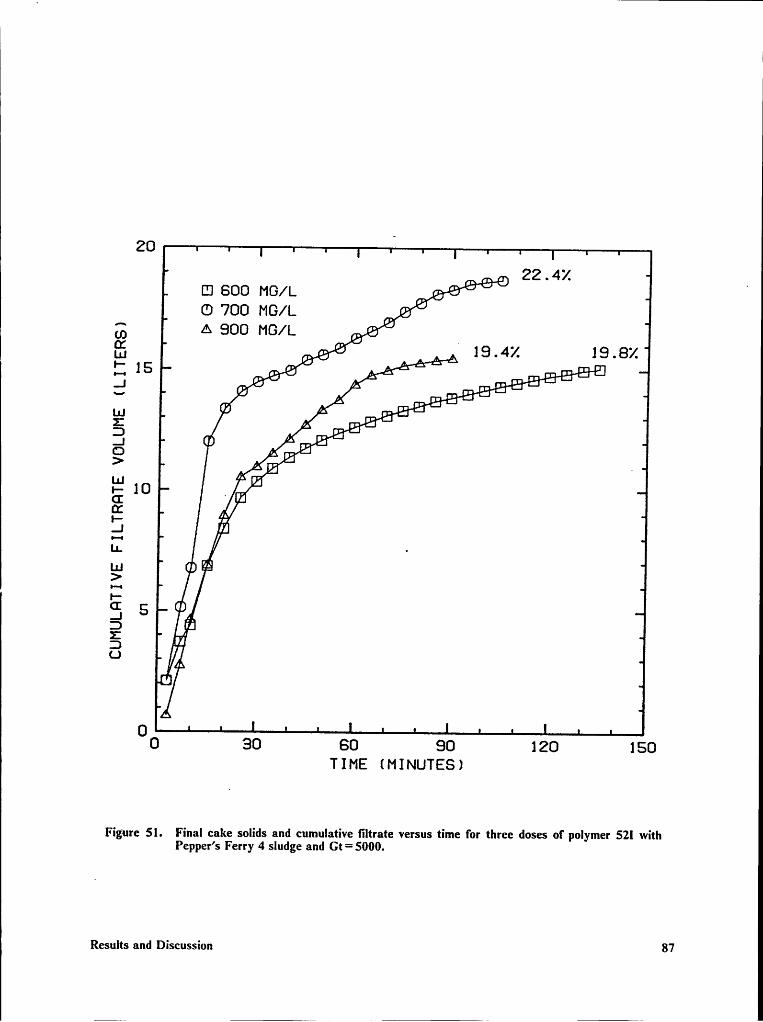
20_
__ „ 0 22.42 nEJ 600 MG/L Q_ 5 ä °0 700 M0/1. __ 6 ‘gg A 900 M0/1. ,. 6 ‘
4 .Ef, Q „ ¤ M H _ 19.42 19.82P': Q Ä Ä Ä —
_
gn=
=·•l- 2 1L] 6 I A Q- = =e
AA
Q- ß„ ,. 5 ‘
ä “ “„=“‘> Q „ „ “ .in " 0E 10 „
Inl- !.| Il
zu 0 FS>
E 0•-I 5
J.
0
0 0 30 60 90 120 150TIME (MINUTES)
Fi ure Sl. Final cake solids and cumulative liltrate versus time for three doses of polymer 52l withepper S 8I’l‘y S ll gt! all = •
gP ' F 4 Id dGt 5000
Results and Discussion 87
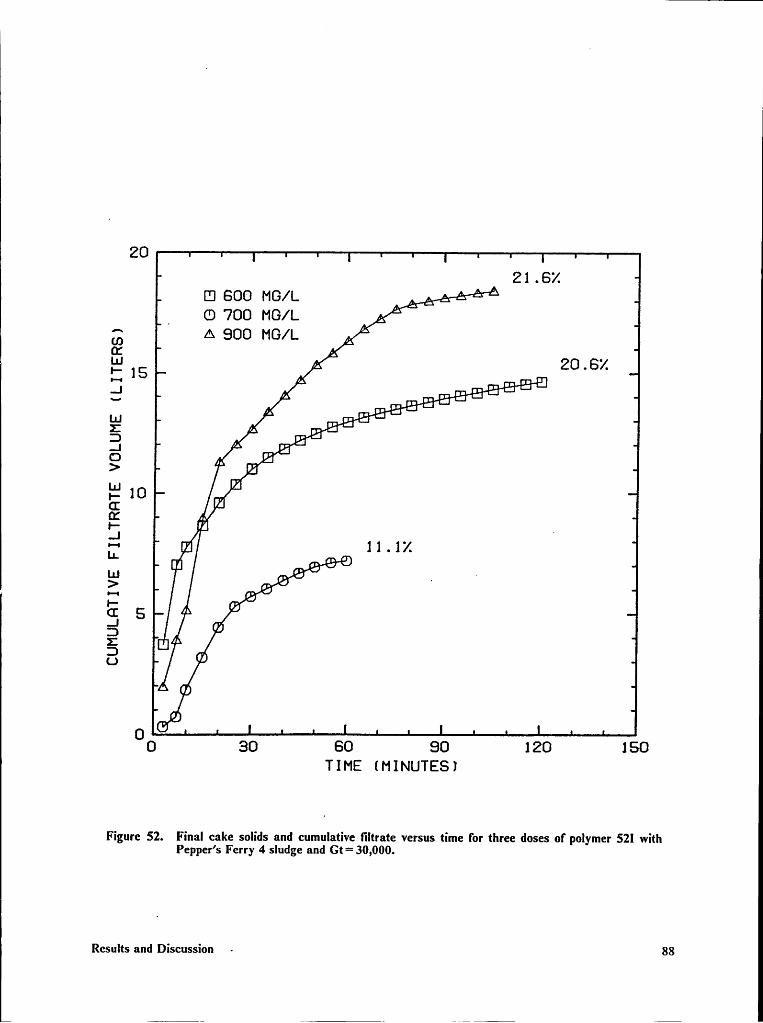
2021 .6%
El600MG/L äÄAä““_ 0 700 M6/L . “
A 900 M0/L Q ‘LU A A 2 .6%il;
/4 •• Q0
__|A
··u.1li ,. s ä 2 2 T
E " fi ¤ ‘..1 ’^
uO [_ E> ELu IZE ,2
lk1- ll ,J , .LL 14 1 1 . 1%uLu _ ·>
..1llD II
U
0 0 90 60 90 120 150TIME (MINUTESI
Figure 52. Final cake solids and eumulative tiltrate versus time for three doses of polymer 52l withPepper’s Ferry 4 sludge and Gt=30,000.
Results and Discussion ~ 88
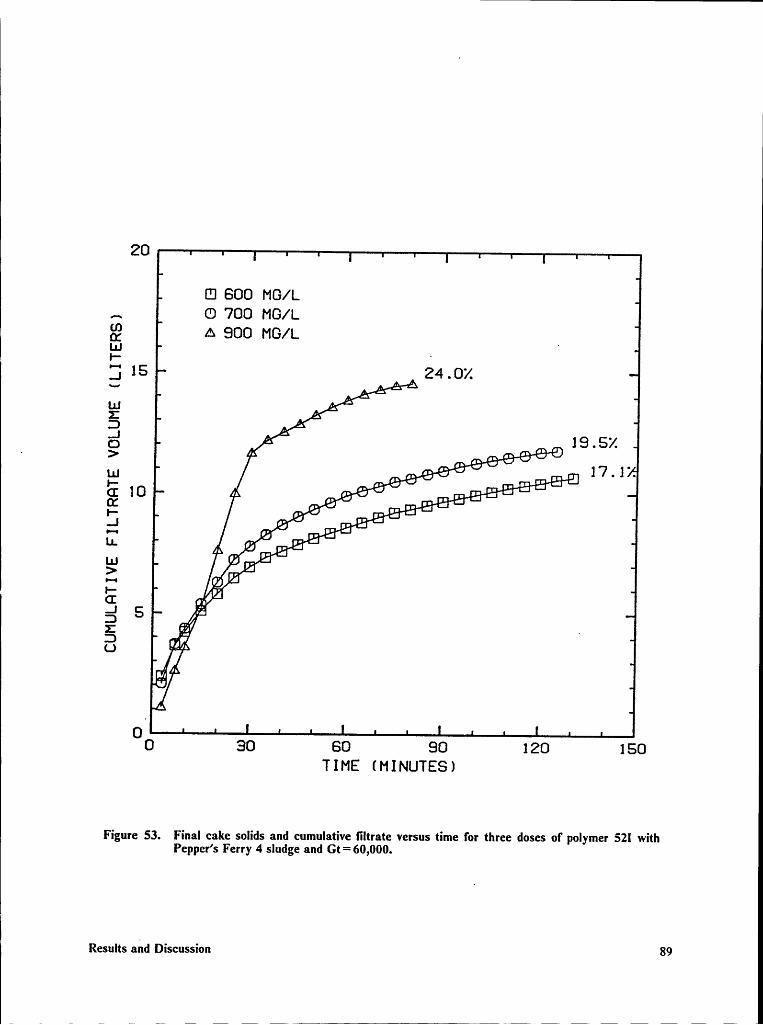
Pl
20
(Il 600 MG/L,„ 0 700 MG/1.A 90015 N Ä 24 .0%
I.1J z 3 Ä -ä
3 9 “¤ 19 . 5%
- IA
{Ä.·:ä£x_
, G 9 g 2 2 -..J Ü 9 •· 2 Lg-4 '•
.I,L'-„ v ” .- ¤ “ ‘E ”¤”‘.·: ·@ “S, zfu2 5 .,./'Z rg .3 vgl!
U
A
0 0 30 60 90 120 150TIME (MINUTES)
Figure 53. Final cake solids and cumulative filtrate versus time for three doses of polymer 52l withPcpper’s Ferry 4 sludge and Gt=60,000.
| Results and Discussion 89
The linear relationship is shown with R equal to 0.82. This indicates that an increase in one hourfrltrate flow correlates reasonably well with an increase in dry solids concentration of the sludgecakes. Most of the variability was caused by changes in solids removal from the sludge containerwhile the frlter press was operating. Better control over this aspect of the experiment could improvethis correlation.
I In summary, the cake solids data show that an increase in one hour frltrate volume results in a
I better sludge cake dry solids concentration. Additionally, frltrate curve characteristics in the nineexperiments validated the use of one hour cumulative frltrate volume experiment to measure filterpress performance. Thus, the one hour cumulative frltrate volume was an adequate measure ofpress performance in terms of both sludge throughput volume and sludge cake dry solids concen-tration.
Results and Discussion 90
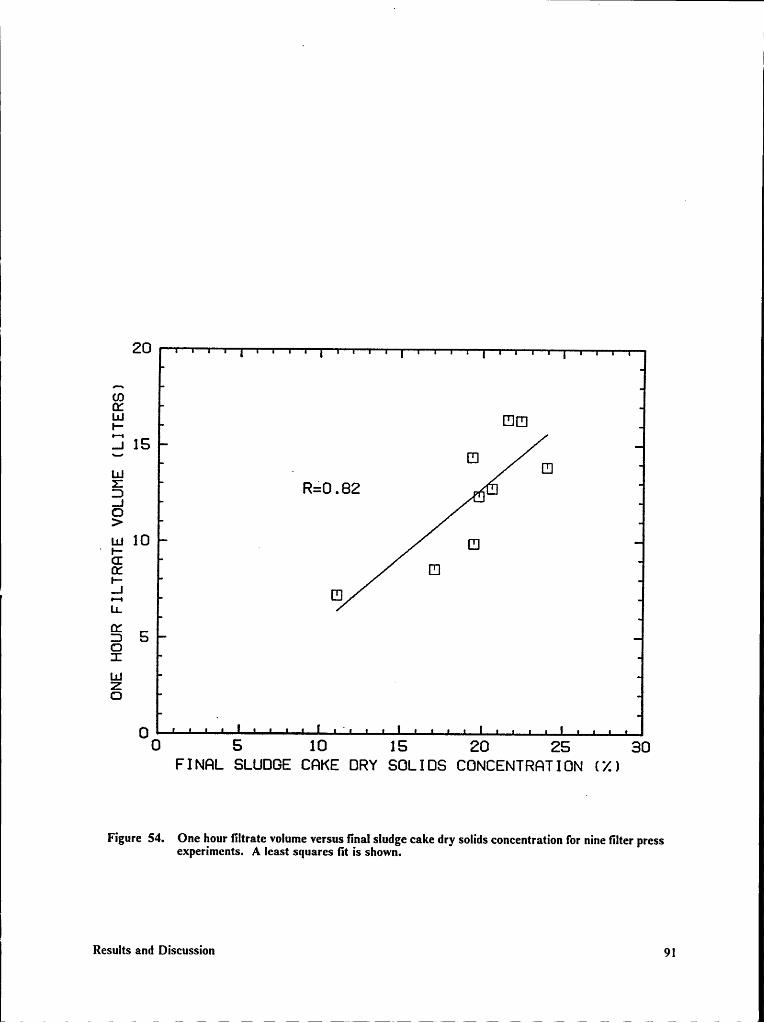
| 20ZB{5|_ [EHI].1 15 Elg . b III.10>_ *1.11 10 5 [5]E 1:11-5 m1.ä 602:I.1J 1Z0
.0 5 10 1 5 20 25 30
F I NGL SLUDGE CGKE DRY SDL I DS CDNCENTRGT IDN ( X )
Figure S4. One hour filtrate volume versus final sludgc cake dry solids concentration for nine filter pressexperiments. A least squares fit is shown.
Results and Discussion 9l
Summary and Conclusions
1 I .
Currently, there is not a reliable and simple method for predicting polymer requirements for me-chanical dewatering systems. Operators often rely on standard doses available from tables or onexperience from operator trial and error. This investigation was an attempt to develop a methodof predicting polymer dose for a plate and frame frlter press by using information from bench-scalepolymer dosing and mixing intensity experiments. Extensive bench·scale experiments have beenconducted with variety of sludges and with different types of polymers. Information from theseexperiments suggests that the mixing intensity with which the sludge and polymer are mixed hasMan impact on dewatering rate. At a given polymer dose, one combination of shear (G), and mixingtime (t), provide the best dewatering rate. In addition, the shear force imparted on the sludge in amechanical dewatering device may also have an impact on polymer requirements. The investigationwas undertaken with these concepts from bench·scale studies in mind.
The first set of experirnents were perforrned with Roanoke anaerobically digested sludge. Bench-scale information was collected at four polymer doses. The plate and frame filter press was operatedwith these same polymer doses over a variety of polymer mixing intensity inputs from 5000 to100,000. An optimum dose and mixing intensity input for the plate and frame press were developedfrom these filter press experiments. In addition, the bench·scale data were analyzed to determinetheir relationship to the results of the pilot-scale tests. The experiments with Roanoke sludge
Summary and Conclusions V92
,
ishowed that there was an optirnum polymer dose and mixing scheme for the filter press and thatboth of these could be predicted from the bench-scale data.
I The second part of the investigation examined the effect of changing G, while holding polymer doseand Gt constant, on the performance of the plate and frame press. At three different Gt's from 5000to 100,000 no change was observed in filter press performance.
,The third part of the investigation was performed to verify what was learned about polymer dose
t and mixing for the plate and frame press in the first set of experiments with Roanoke sludge.V Specifically, that the polymer dose could be predicted from a bench-scale mixing intensity test at a
Gt of 30,000 and, that this dose should be mixed at a low mixing intensity input of approxirnately5000. This polymer dosing and mixing scheme was verified by conducting plate and frame filterpress experiments with two different polymers. The results of these experiments indicate that thefilter press imparts some shear force on the flocculated sludge and, that polymer must be includedin the polymer dose to reagglomerate fractured sludge particles. The amount of shear is relativelylow compared to what may exist in larger, full·scale dewatering devices; however, it is significantwhen compared to the shear produced by a jar test device. If a jar test apparatus were used to select
. the polymer dose for the plate and frame press in this study, performance would not be optimized.
The final set of experirnents were performed to determine if increased filtrate flow from the filterpress resulted in a better sludge cake dry solids concentration. Earlier filter press performance wasbased only on a one hour cumulative filtrate volume curve. Increased filtrate flow is important inthat it reduces filter press cycle time, however, sludge cake dry solids concentration is a parameterthat directly measures total water removal from the sludge. Nine filter press experirnents wereperformed to press failure while recording the filtrate flow volume. The dry solids concentrationof each sludge cake was measured and plotted against filtrate volume after one hour. This plotshowed that in general, an increase in one hour filtrate volume results in an increase in sludge cakedry solids concentration. Additionally, a one hour test was shown to adequately reflect press per·
Iformance over its entire operational time period.
Summary and Conclusions 93
i1
Based on the results of this study, the following conclusions are made:
1. The performance of a plate and frame filter press was optimized by predicting polymer dosewith a bench-scale mixing device.
2. For the plate and frame filter press that was used in this study, the polymer dose was selected' by fmding the optimum polymer dose for the bench-scale mixing system set at a Gt value of
}30,000. The sludge and polymer were mixed with a mixing intensity input of 5000 prior to
_ introduction to the filter press.
3. The polymer dosing and mixing scheme that was developed for the plate and frame filter pressused in this study indicates that the filter press imparts some shear on the sludge and thatpolymer must be provided to reagglomerate fractured sludge particles. An estimate of the Gtvalue for the filter press that was used ir1 this study is 15,000 to 40,000. ·
1
Summary and Conclusions 94
lBibliography
1. United States Environmental Protection Agency, Dewatering Municqoal Wastewater Sludge.EPA /625/1-87/014, Office of Research and Development, Cir1cinnati, Ohio (1987).
2. Novak, J.T. and O’Brien, J.H., "Po1ymer Conditioning of Chemical Sludges." Journal WaterPollution Control Federation, 47(10), 2397-2410 (1975).
3. O’Brien, J.H. and Novak, J.T., "Effects of pH and Mixing On Polymer Conditioning ofChemical S1udges." Journal American Water Works Association, 69(l 1), 601-604 (1975).
4. Novak, J.T. and Piroozfard, M., "App1ication of Polymers For Water Plant Sludge Condi-tioning." Proceedings /98/ Annual Conference American Water Works Association, Part 1,145-166 (1981).
5. Cole, A.I. and Singer, P.C., "Conditioning of Anaerobically Digested S1udge." Journal Envi-ronmental Engineering Division American Sociegz of Civil Engineers, 1l1(4), 501-510 (1985).
6. Birkner, F.E. and Morgan, J.J., "Po1ymer Flocculation Kinetics of Dilute Colloidal Suspen-sions." Journal American Water Works Association, 60(2), 175-191 (1968).
7. Bugg, H.M., King, P.H. and Randall, C.W., "Polye1ectro1yte Conditioning of Alum S1udge."Journal American Water Works Association, 62(l2), 792-795 (1970).8. Stump, V.L. and Novak, .l.T., "Po1ye1ectrolyte Selection For Direct Filtration." Journal
American Water Works Association, 71(6), 338-342 (1979).9. Novak, J.T. and Haugan, B., "Mechanisms and Methods For Polymer Conditioning of Acti-
vated Sludge." Journal Water Pollution Control Federation, 52(10), 2571-2580 (1980).10. Werle, C.P., Novak, J.T., Knocke, W.R. and Sherrard, J.H., "Mixing Intensity and Polymer
Sludge Conditioning? Journal Environmental Engineering Division American Society of CivilEngineers, 110(5), 919-934 (1984).
ll. Novak, J.T., Prendeville, J.F . and Sherrard, J.H., "Mixing Intensity and Polymer PerformanceIn Sludge Dewatering." Journal Environmental Engineering Division American Society of CivilEngineers, l14(1), 190-198 (1988).
{
° Bibliography 95
i 12. Novak, J.T. and Bandak, N.,"Chernical Conditioning and the Resistance of Sludges To1 Shear." Manuscript accepted for publication, Journal Water Pollution Control Federation, Tobe published in (1989). ”
13. Jones, B.R.S., "Vacuum Sludge Filtration - Prediction of Filter Performance." Sewage andIndustrial Wastes, 28(9), 1103-1115 (1956).I
14. Gale, R.S., Baskerville, R.C. and Swanwich, J.D., "Investigations of Pressure Filtration ofI Raw Sewage Sludge." Water Pollution Control, 66(6), 553-567 (1967).I 15. Gale, R.S., "Some Aspects of the Mechanical Dewatering of Sewage S1udges." Filtration and‘
Separation, 5(2), 133 (1968).16. Hoyland, G. and Day, M., "Derivation and Application of a Mathematical Model For theFilter Plate Pressing of Sewage Sludge." Filtration and Separation, 20(4), 303-310 (1983).
, 17. Mininni, G., Spinosa, L. and Misiti, A., "Eva1uation of Filter Press Performance for Sludge, Dewatering." Journal Water Pollution Control Federation, 56(4), 331-336 (1984).18. Baskerville, R.C., Komorck, J.A. and Gale, R.S., "Effect of Operating variables On FilterPress Performance." Water Pollution Control, 70(4), 400-418 (1971).19. White, M.F.D. and Baskerville, R.C., "Fu1l·Sca1e Trials of Polyelectrolyte For Conditioningof Sewage Sludges For Filter Pressing." Water Pollution Control, 73(5), 486-497 (1974).20. Zoccola, G., "Ei°fect of Conditioning On the Performance Of a Plate and Frame Filter_ Press." Masters Thesis, Virginia Polyteclmic Institute and State University, (1988).21. Standard Methods For the Examination of Water and Wastewater, 16th Edition, AmericanPublic Health Association, (1986).
Bibliography 96