Keaprma Wer | eokial Yates - VTechWorks
169
THE USE OF TUNED MASS DAMPERS TO CONTROL ANNOYING FLOOR VIBRATIONS by Cheryl E. Rottmann Thesis submitted to the faculty of the Virginia Polytechnic Institute and State University in partial fulfillment of the requirements for the degree of MASTER OF SCIENCE in Civil Engineering APPROVED: KeaprmaWer | eokial Yates Raymond H. Plaut Siegfried M. Holzer April, 1996 Blacksburg, Virginia Keywords: tuned mass damper, floor vibration
-
Upload
khangminh22 -
Category
Documents
-
view
1 -
download
0
Transcript of Keaprma Wer | eokial Yates - VTechWorks
THE USE OF TUNED MASS DAMPERS TO CONTROL ANNOYING FLOOR
VIBRATIONS
by
Cheryl E. Rottmann
Thesis submitted to the faculty of the
Virginia Polytechnic Institute and State University
in partial fulfillment of the requirements for the degree of
MASTER OF SCIENCE
in
Civil Engineering
APPROVED:
Keaprma Wer | eokial Yates Raymond H. Plaut Siegfried M. Holzer
April, 1996
Blacksburg, Virginia
Keywords: tuned mass damper, floor vibration

LO
5055 V85S \IS4 le ROoBs Q.ok

THE USE OF TUNED MASS DAMPERS TO CONTROL ANNOYING FLOOR
VIBRATIONS
by
Cheryl E. Rottmann
Dr. Thomas M. Murray, Chairman
(ABSTRACT)
Floor vibrations due to occupancy activities on a floor are sometimes annoying to the
occupants. Correcting floor vibrations is difficult and can be expensive. The use of tuned mass
dampers to control annoying floor vibrations is sometimes a viable solution.
Tuned mass dampers (TMDs) have been used primarily to control only one or two modes
of vibration of a floor. Experimental research was performed using prototype TMDs to control
one, two, and three modes of vibration of various floors. Results from this research are presented
in this thesis. Analytical research, performed to obtain information about floor vibration
characteristics, is presented and used for the initial design of TMDs and placement of TMDs on a
floor. Also, computer models of the floors with TMDs to control one, two, and three modes of
vibration were analyzed to obtain further information about changes in floor response and vibration
characteristics. This research was performed to provide further insight on the effectiveness of
TMDs to control one, two, and three modes of floor vibration and the effects of TMDs on floor
vibration characteristics.

ACKNOWLEDGMENTS
I would like to thank Dr. Thomas M. Murray for his support, guidance, and
encouragement throughout my studies at Virginia Tech. I cannot thank him enough. I would also
like to thank Dr. Plaut and Dr. Holzer for their suggestions and assistance with my research.
I am grateful to the Department of Civil Engineering for the Charles E. Via Scholarship
awarded me. Without this financial support, starting my master’s studies at Virginia Tech would
not have been possible. I am also grateful to those that provided funding and assistance for my
research. I would especially like to thank the 3M Company of St. Paul, Minnesota and two of its
engineers, Ming-Lai Lai and H. S. Gopal. Additional support was provided by the National
Science Foundation (NSF) Grant No. MSS-9201944 and by a grant from NUCOR Research and
Development, Norfolk, Nebraska. I want to thank the building owner and engineers who provided
access to a problem floor studied in this research.
My thanks are also extended to my professors and mentors for their guidance and
encouragement through the years. I would also like to thank my fellow graduate students, the lab
technicians, and the secretaries for their assistance and friendship. I would especially like to thank
Barry Band for his support and friendship as we learned about floor vibrations together.
Finally, I would like to thank my family and friends for their love, support, encouragement,
and prayers. Mom and Dad, thanks for telling me to “go for it”, and letting me “go for it”.
ill
TABLE OF CONTENTS
Page
CHAPTER 1 INTRODUCTION AND LITERATURE REVIEW ..0000.0.......ccccccccccccceccceecesessnaseeeesssssesesenssnaeeees 1
LV Tmtroduction 2.0.0.0... ccccceecccccceccsssnneeceeeceeesscessaeeeeeeceeesessnneeeeeeeeeseneeeeececenseeeeeaaeaeeeseeseseenensaeas l
1.2 Literature REVIOW ........0...cc cc ccccccccececceesessenssneeeeeeceeeseseaeeeeeeesessecteeeeeeeeesesensaaaaeetesesesseeennteas 2
1.2.1 Floor Vibrations - background information .............00.000.ccccccccecesceeecceeseeeteeceesseeeeeeneees 2
1.2.2 Methods for Controlling Annoying Vibrations............0.....cccccccccesccccceeessseeecescessseteeeeesas 4 1.2.2.1 The Use of Tuned Mass Dampers to Control Annoying Floor Vibrations............... 4
1.2.2.2 The Use of Tuned Mass Dampers to Control Vibrations on Other Structures....... 10 1.2.2.3 The Use of People to Control Annoying Floor Vibrations .................:.0::cccceeeeees 13
1.2.3 Summary 00... cece ccc cecseceeeeceeeesseceeesenececsnaeeeeeaeeeeaeeeeeaeeeseeeceseaseessueeeeeeseeesenneeenss 17
CHAPTER 2 PRELIMINARY STEPS FOR THE USE OF TUNED MASS DAMPERS TO CONTROL ANNOYING FLOOR VIBRATIONS 00000. .0000ccccccccceccccecsececeseeessseseenssateeeaes 20
2.1 Determination of Floor Vibration Characteristics ........0.......cccccccceecsscecsssseeesseeeeeseeceesseeeeens 20 2.1.1 Determination of Floor Frequency .........000..cccccccceceeescececeessneeeeeessseaeesetssaeeeessnsseeteeeaes 21
2.1.2 Determination of Floor Damping Ratio......... ee ecccceeeeeseneeseeseneeeeeeseseaeeseeseeeecesenseeeeess 22 2.1.3 Modeling a Floor Area Using a Structural Analysis Program ...............00....ccccssceeeenees 26
2.2 Designing a Tuned Mass Damper ...............0.cccccccecsccceeeseecececeseeeeceeeseeeecessseeeeeesniaseceeennaaes 26
2.2.1 Single Degree of Freedom System ...............cccccccecccsccceessscceeesssseeeeeeesteeeeeeesseeesesensaes 28
2.2.2 Design Equations ........00...cccccccccccscsscceceeseceeeeeneeeeseseeeeceeesseeeeeseseeeecnsssseeesensssseeeeeens 28
2.2.3 Tuned Mass Damper Design .0000.....0...cecccceccccceceeeeceeeceeeneeecetaeecesanesessieeseseseesssseeeeens 33
CHAPTER 3 EXPERIMENTAL USE OF TUNED MASS DAMPERS ON A LABORATORY FLOOR....000000...0occccccccccccccccssececceeseeeesesssseecesseseeeeeseesseesesessseeesessneeeess 35
3.1 Description of Laboratory Test FIOOr ...00.... eee ec cee eens ceseeesceeseeteneeeeeeeressneenaeeeneeseneeeas 35 3.1.1 Physical Characteristics .....0000.00cccccccccccscccecessecceeeeeeeccsesseeeessssaeeceeseseeeeeessssseeeeseaes 35 3.1.2 Vibration Characteristics ............cccccccccecccccecesececeeesnneeeeseesaceecesenaeeeseseneeeseessteseeeeseises 37
3.1.2.1 Floor Frequency .............cccccccccceecsennnnceceecesceeeeneeeeesevensnaneeeeeeeeesestatececeeeessenssnnaaes 37
3.1.2.2 Floor Damping Ratio .............cccccceccccccesecceessceeeseecesaesseeesesessseseeseeeessueeenseeeeees 37 3.1.2.3 Other Vibration Characteristics Determined Using SAP90 ....000.0.. 0. 38
3.2 Design of Tuned Mass Dampers................c:ccccccccceecceeseceecteeeessnsneeeeeeeesseststeeeseceseeessssasaees 43
3.3 Installation of Tuned Mass Dampers ..................0.ccccccsceecstetececeeeeeceeeeeeeeeeceeeeeeeeeeeeeeseeeneeess 43
3.4 Evaluation of Tuned Mass Damper Effectiveness ..0......0.....cccccccceeeeccesesseeseneeteeseeecessaeees 47 3.4.1 Heel Drop Excitation. ................ccccccceeeeeecceccceneenenceeeeeeeeeeeeeeeeeeeeeesessseeceeeestesteeseetiaaaes 47
3.4.2 Walking Excitation .....0.....0cceccceeccceseeecesceesseecenseesceeseneersnesesseeceneeseseessaeessatecstaeetenees 47
CHAPTER 4 EXPERIMENTAL USE OF TUNED MASS DAMPERS ON AN OFFICE FLOOR. ..0000..0..0cccccccccecccceeeeeeseeceeeeeeeeseeceeenseeesesaeeessaeesesaeserseseeeesteeeeesnseseneas 52
4.1 Description of Office FOOL 2.2.0.0... ccc cceceeceeceeee eects anne e eee e eee eeeeeeeeeeeeeeeeeeeeeeeeteseeenenses 52
4.2 Modification of Tuned Mass Dampers.................0.cccccccccccceeeeneeceeeeeeeeeeeeceeeeseseeeeeessseaees 53
43 Bay Lincccccccccccccccecccccccccsecceesssceeecsecaeeeeseesseceeeesssaeesesessisececseesscecesseseeeseeeneeeescceesaeeeeessntaaes 55 4.3.1 Vibration Characteristics ..............cccccccccccccceccctecceeeesseteescessaceeessssseeeeeessssseeeesseaeeseeeias 55
4.3.1.1 Measured Vibration Characteristics ...............cccccceececceccsseessneeecececseeesssseeeeeseeeesees 57
4.3.1.2 Analytically Determined Vibration Characteristics ..............0.ccccccccceesesessseeeeeesecees 57
4.3.2 Installation of Tuned Mass Dampers ..0.....00..0...:ccccccceeeeeeeeeeeceeeeeeeeesesenssaeeeeeeesesennaas 64
4.3.3 Evaluation of Tuned Mass Damper Effectiveness .......0........cceccccscccceeceeesesseeseeeeceeeenes 68
WA Bay 2 oo cece cece cenneeeeessneceeeecesseeeeeeeesseeeeeeeenseeeeesseueeeecnsasesseseesseeessesaeceseessaseeeeseneas 68 4.4.1 Vibration Characteristics ............0.ccccccccccccsccccceceeeeessteeeeeeecesssseeseeeesesessssseeeeeeseseeeeias 70
4.4.1.1 Measured Vibration Characteristics ........000....cccccccccccccceceesesscceeeeeeceessteseeeecesenens 70
4.4.1.2 Analytically Determined Vibration Characteristics ..............00ccccccececesssttsceceeeeeeeees 70
4.4.2 Installation of Tuned Mass Dampers .....0..........00cccccccecccecesscteeeeeseecsesesseseesesssseeeceenaas 71
4 4.3 Evaluation of TMD Effectiveness ..............cccccccccccceccseseeeecescessseaeeseeecesssseaseeeeeeeseeenas 75
AS Bay 3c cecccccccscccesscseeseeeecneeeeesaeeeeseeeeeeseeescscesesesseecssseeceeaceceseesesaeeesssesssustecensseessnaaes 78 4.5.1 Vibration Characteristics ......00....cccccccccecssccscceeeeesceceecneeeeeeseeeeesesssseeesecsseeesesesteeeeees 78
4.5.1.1 Measured Vibration Characteristics .......00000..0cccccccccccceceeeessseceeeeeeeesensteeeeseeeeeeeens 78
4.5.1.2 Analytically Determined Vibration Characteristics .........0......0.cccccccsssceeeseeeeesseeees 80 4.5.2 Installation of Tuned Mass Dampers ..................:cccccccccceceeessceeeesssseeseesssseseeessseeeessas 82 4.5.3 Evaluation of TMD Effectiveness ......0........cccceccscccseccesecesseteeseeeeseeesssecesseecsseeseseeeessees 86
4.5.3.1 Analytical Measure of Effectiveness ...0....0....00cccceececcecseseeeseessteeeceessateesersnseeeeees 86
4.5.3.2 Occupant Evaluation of TMD Effectiveness....0...........ccccccscccccceeeeesseeeeeeeeeeeesenaes 89
4.6 Summary of Results .........00.c cc cccccccccccceceeccestsssceeeeseecsesssseeseeeescessseaeeeeseetenssaeseeeeeseneeteaas 90
CHAPTER 5 COMPUTER ANALYSIS OF FLOOR RESPONSE WITH TUNED MASS DAMPERS AS PART OF THE FLOOR MODEL..........0.....ccccccceesseeseesteees 93
5.1 Tuned Mass Damper Model ............... cc cccccccccccccceeccsscceeeeesecessaeaeeseeeeecesssssseseceeeestssssseeess 93
5.2 Analysis Method .........0....cccccseccccccceeeesesseeeeeeecenessnaeeecceeeeseeaseeeeeeeeenssseteseseseesesssseeseeeeess 95
5.3 Laboratory Floor Model ..........00.00.ccccceecsecccceeeeeenenenneeeeeesseneenaeeeeeeseenensaeeeeseesseessseeeeeesenes 96
5.3.1 Determination of “Optimum” TMD Mass.................00ccccccsccccssseeeceessseeeseesseeessessaees 96 SBD TMD 1 ooo ccccccccccccccccccccnneececenseeeeeecesaeeeesessaeeesseseseseesssseeeeecsseseeeesssiteeeeensnaaes 98 5.3.0.2 TMD 2... ccc cccccccccccccccccccetneeceeecsseeeeeeesseeeecensaeeesceaceesesessesecsssaeeeseesceeeeeenes 103
5.4 Bay 2 Model of the Office Floor 2.0.0.0... ee cccceecceeeceecneeeceeenneecesenaceeeesesneeeeceesaaeseeeneeseeees 108 5.4.1 Determination of “Optimum” TMD Mass.................00cccceesscceseseeteeetssssaeeceesnseeeeseens 108
SALAD TMD 1a. cece cc ccccccececccnseeeecseeseeeeessssseseesnaeesesssseeseecssseeeeseestseeeseneas 108 5.4.1.2 TMDID 2.0. ccc cc ccecccceceeeneeeeeecnssaeeeecsaeeeeeceseesesestsseeeesssseeseeentaeeesees 111

5.5 Bay 1 Model of the Office FOOL ...........ccccccccccccceccecceeeseeeeesseeceeaeeecssceeessaeeeessseeeensaseeenens 114
5.5.1 Determination of “Optimum” TMD Mas..............:.ccccccccsccccccceeeeeeeeseeeesesesettseeeeeeeees 114
SSD TMD ooo ccc cccccccccccecccsccneceeeeeseeeeeeeeeeceeeeseesseseeseeeessssassasssaaeeaaeaseeeaeeeeeenees 118
5.5.1.2 TMD 2.00. c cc cccccc cece ccc ceeeceeeeesesceceeececececeeeessesasaaauassssesesseeeeeseeeeeseneuaas 118
eae OS | De eee 121
5.6 Summary and Discussion of Results ........00.0.00ccccccccccccccccccceceeceseeesessseeessssssessssseeeaeeeeneeess 123
CHAPTER 6
SUMMARY, CONCLUSIONS, AND RECOMMENDATIONS .......0..00.00 cc ccceceeeeseeeeeeeee 127
6.1 SUMMALY 20. c ccc ccensestceceeeceesceseseeaseseescesssaaeeescsescceessseseeeeeeeeeeetsissseeeeeecesenenaes 127
6.1.1 Expermmental Study .............c cc cccccccccccseecncceeececeesesseceeeeeecseecsseeececeeenssssseeeeeseseeseneaaes 128
6.1.2 Analytical Study 00.0.0... ccc c ccc ccecscsscceeecececeesuseeeseceessusasseeeeeereenssssaaaeeeeeeeseeenaas 128
6.2 COMCIUSIONS 00.0.0... cccccccccccccceseeceeeesscesee ee seseessseetessessaasseeesseeeeeeseseceeesseseeseeteeseseeeereees 130
6.3 Recommendations for Further Research ...0..........00cccccc cece cccceeeececceceseueeeecsceeeuneseeeecessuueees 131
REFERENCES oou..000cccccccccccccscccccsceesnsseeseececcceeeessecsecceceeseessssssceuseseessscsscesesessssssssseseeteseeseees 132
APPENDIX A
DETERMINATION OF LABORATORY FLOOR
SECTION PROPERTIES USED IN SAP90.000000000icccecccccceccccssesseeeccecesessssseeseccesseessereneneeeens 134
APPENDIX B
SAP90 vy. 6.0 INPUT FOR THE LABORATORY FLOOR MODEL ............0.ccleeeeceeeseeeeees 137
APPENDIX C
DETERMINATION OF INITIAL AND FINAL PROPERTIES
FOR LABORATORY FLOOR TMD) ....00......0000ccccccccccccccccccsccesnenecteaesseeeeeeeseeescecceeseecseeeseeeee 140
APPENDIX D
SAP90 v. 6.0 INPUT FOR THE OFFICE FLOOR MODELS ...........0....cleeeeeececcessessecesereeeees 143
APPENDIX E
SAP90 v. 6.0 INPUT FOR THE LABORATORY FLOOR WITH TMD1.......000000 154
VITA oii cecceeccccceeeccecccsssssceseesececceceseestpssseesssseeessssesssssseeeeeeeeeeesesecesesseenesessetensssssttssssnsaeeaes 157

LIST OF FIGURES
Figure Page
1.1 Laboratory Floor Mode Shapes One and TW .000.0......0.ccccccccecccceeeseeeeeeeneeeeeeestaeeesetseneeeeeees 15
1.2 Acceleration Time Histories and Frequency Transforms ..............0..0:cccccccccsescececeeeesssrseeeeees 16
1.3 Walking Acceleration Traces With and Without People in Place ...0.......0..eccccccceceeeeesteees 18
2.1 Acceleration Time Histories and Frequency Transforms .................0ccccccccesssseeesssteeeceetsssseeees 23
2.2 Half Power Method (Meirovitch 1986) ............. 0. cccceccccceeeescccseessseeeceeecccecessesenseeseeseesteneeseees 25
2.3. Two Degree of Freedom System: Floor and TMD ..00....00.ccceccccccecccceseeseesseteeenseeeeeseeees 27
2.4 Tuned Mass Dampet..............0ccccccccccccsecceeesceeccecescseeeeecseesessaeeessseeecssseeeeeseesesseeeesessesensasees 34
3.1 Plan and Section of the Laboratory Test FIOOG ..0.0....0.0....000cccccccscccccessscecesesscceeesessesecsessttseeeeens 36
3.2 SAP90 Model of the Laboratory FIOOr ...........0..cccccccccccccccccscceeeeeseseeeeeerseseeseessseseesssseeeeeenes 39
3.3 First Six Mode Shapes From SAP90 Analysis of the Laboratory Floor ..............000..cccccceees 4]
3.4 Heel Drop Performed and Acceleration Measured at the Center of the Laboratory Floor....... 46
3.5 Heel Drop Performed and Acceleration Measured at the Center
of an Edge Joist on the Laboratory FIOOr ............0....cccccccccesssceeeseeeeeeeeeeeeeecesseneessesennentsssstaas 48
3.6 Walk Parallel and Walk Perpendicular to Joists with Acceleration Measured
at the Center of the Laboratory FIOOr .....0.....0cccccccccccccceccsscceeceseseeeessssseeeesssseeecsesssteeeeenaas 50
4.1 Plan View of Bay 1o......c.cccccccccccccccccceseececessecessseeeeseeeecsaeceeseeeecesseeecssesccasesesasesseeeeens 56
4.2 Response and FFT of the Response at the Center of the Edge Joist due to a Heel Drop at the Center of the Bay 1 ooo... ccc ecceccecceeceeeetsssseeeeeeesentstsaeeees 58
4.3 SAP90 Model of Bay — eeaeceeeeeeeeceseeeeeeeecetenteeeeeneaas be eeaaesceeeceeeceeeeceeececeetesesettseteessttnanaaas 59
4.4 First Four Mode Shapes From SAP90 Analysis of Bay 1.......0.00..ccc ccc cccescccceesseceesensteeeeseen 62
4.5 Heel Drop Performed and Acceleration Measured at the Center of Bay 1.0.0.0... eee 66
4.6 Walk Perpendicular to Joists with Acceleration Measured at the Center of Bay 1 ................. 67

4.7 Plan View of Bay 2.........cccccccccccccccccececccecececeeceeceeeeeeeessseseeeaeaaasaeacaeaceaaaeeeeeeeeeeeeeseeeeeeeeeeeeeees 69
4.8 SAP90 Model of Bay 2......0..occ cc ccccecccccsssceceeessteeeeeseeseaeesessaeecensaseseceseaeeeecesaeeeessessagees 72
4.9 First Two Mode Shapes From SAP90 Analysis of Bay 2 .0.............cccccccccceeesesesteceeeeeeeseeensnaes 73
4.10 Heel Drop Performed and Acceleration Measured at the Center of Bay 2 .........0......c0c. 76
4.11 Walk Parallel and Walk Perpendicular to Joists with Acceleration
Measured at the Center of Bay 2.0.0.0... ccccccecccccceceeeesenseeceseesereessaseeeeeeeeeesensesseeeeeesenes 77
4.12 Plan View of Bay 3.0.0.0... ccccccccceccccecceesseeeeeeeseseeeeeeseeeecssseeeeseseseeeeseessseeeesenneeeseeesssneess 79
4.13 SAP90 Model of Bay 3 ooo... ccc cceccccesseccsseneeeeseeeesaeecneseeessceeeeneeeessseeceeseeeeneaeeseeaesens 81
4.14 First Four Mode Shapes From SAP90 Analysis of Bay 3.0............cccceccecsccccesseesstteeeeeeeeeeees 83
4.15 Heel Drop Performed and Acceleration Measured
at the Center of the Main Portion of Bay 3 .............ccccceceeeecesesseeeeeetenaaceaaeeeeeeseeeeeseeeeeeeeens 87
4.16 Walk Parallel and Walk Perpendicular to Joists with Acceleration
Measured at the Center of the Main Portion of Bay 3..............ccccccccccccccccceseccseccceseseeseessseeees 88
5.1 Elevation View of a SAP90 TMD Model o.00..00.0.o cc cccccccccccseneeeecnsseeeeesseeeessaeeeseeeesenseeees 94
5.2 SAP90 Layout of the Laboratory Floor and Important Locations .................00cccccccssceseeesseeee 97
5.3 Heel Drop Located and Acceleration Calculated at the Floor Center.................ee 99
5.4 Heel Drop Located at a Quarter Point and Acceleration Calculated at an Edge Joist........... 100
5.5 Variance in RMS Acceleration with respect to Laboratory TMD 1-to-Floor Mass Ratio ..... 102
5.6 First Four Mode Shapes From SAP90 Analysis of the Laboratory Floor With TMD] tn Place .000......0 cece ccc ccececetecesecceeenneecessceeeesseeeensaeesensseeeessateeensaeees 104
5.7 Variance in RMS Acceleration with respect to Laboratory TMD2-to-Floor Mass Ratio ..... 107
5.8 SAP90 Layout of Office Floor Bay 2 and Important Locations .............0.0:: cece 109
5.9 Heel Drop Placed at the Center of Bay 2 & Acceleration Calculated at Node 76 ................ 110
5.10 Variance in RMS Acceleration with respect to Bay 2 TMD 1a-to-Floor Mass Ratio.......... 112
5.11 Variance in RMS Acceleration with respect to Bay 2 TMD 1b-to-Floor Mass Ratio ......... 113
Vill

5.12 SAP90 Layout of Bay 1 and Important Locations.......0.0.0.00...cccccccccccccceeeeeeeeceeeeetteeeeeeeenees 115
5.13 Heel Drop Placed and Acceleration Calculated at the Center of Bay 1..........00.000 ee 116
5.14 Heel Drop Placed at Node 83 and Acceleration Measured at Node 94 of Bay 1................ 117
5.15 Variance in RMS Acceleration with respect to Bay 1 TMD1-to-Floor Mass Ratio ........... 119
5.16 Variance in RMS Acceleration with respect to Bay 1 TMD2-to-Floor Mass Ratio ........... 120
5.17 Variance in RMS Acceleration with respect to Bay 1 TMD3-to-Floor Mass Ratio ........... 122
1X
LIST OF TABLES
Table Page
1.1 Summary of Data and Results from the Use of TMDs to Control Floor Vibrations............... 1]
3.1 Laboratory Floor and Initial TMD Parameters ...........00.0.0ccceeccccccccccceeeseensscceeeecesessssstsnseeaes 44
3.2 Laboratory Floor and Final TMD Parameters.......00......0.0.cccccccceeeesecceeeesteeceeeessssceeeeessssseeees 44
3.3 RMS Acceleration and Ratios of Uncontrolled vs. Controlled for the Laboratory FIOOL...........0...c.ccccceccccesesssecescessecetecsesseesecesssseecesssssseeeseees 51
4.1 Initial TMD Parameters .00...........ccccccecccceeeceeeeeeeeseeeeceensaeeesceseeeeesesseeesseesseeeeenssssseeecensaaes 54
4.2 TMD Spring and Damping Element Parameters ...............0.00ccccccscscececsnececeessneeeesesssesesseenanes 54
4.3 Frequencies of Bay 1 Model Variations ..0.........00...ccccccccccceescscecesseeeeecensaeeeccessssesecessseeeseesaas 60
4.4 Final TMD Parameters of Bay 1] TMDS.............000ccccccccccccccsccccceeecesssseeeeeeeecesesstssaseeeeeeeeeneeas 65
4.5 Final TMD Parameters of Bay 2 TMDS .........00...0ccccccccccsccceecesssssceeeecesesessseseeseceeseessnnatees 74
4.6 Final TMD Parameters of Bay 3 TMDS 00000000000...cccccccccccccccccsceeseeeeseseesesereceesecceesecssessaauauannes 85
4.7 RMS Acceleration and Ratios of Uncontrolled vs. Controlled for the Three Office Bays .............0..ccccccccccssccececcesenstseeeeceeeseesssseeeeeescesserstssanees 9]
4.8 Calculated TMD Frequencies and Measured Floor Frequencies of the Three Office Bays ..0....0...0....cccccccccccceeescnneeeeeeeseseessnseeeecceetersntsaaes 91
5.1 Data Pertaining to the Determination of the “Optimum” Laboratory Floor TMD1.............. 102
5.2 Data Pertaining to the Determination of the “Optimum” Laboratory Floor TMD?............. 107
5.3 Data Pertaining to the Determination of the “Optimum” Bay 2 TMDla..........0.00.......0. 112
5.4 Data Pertaining to the Determination of the “Optimum” Bay 2 TMD 1D... ees 113
5.5 Data Pertaining to the Determination of the “Optimum” Bay 1 TMD1.............. ee 119
5.6 Data Pertaining to the Determination of the “Optimum” Bay 1 TMD2.........0..00..ee 120
5.7 Data Pertaining to the Determination of the “Optimum” Bay 1 TMD3 cevonneeennnnececnnnecensenens 122

5.8 Calculated TMD Frequencies and Analytically Determined Floor Frequencies
of the Laboratory Floor, and Bay 2 and Bay 1 of the Office Floor...........0...ccccccceeeeeeeeeees
5.9 Experimental and Analytical TMD and Bare Floor Frequencies for the
Laboratory Floor, and Bay 2 and Bay | of the Office Floor ...........0.cceececsceeeceeeeeeeentees
CHAPTER 1
INTRODUCTION AND LITERATURE REVIEW
1.1 Introduction
With our increasing understanding of material behavior, and the increasing strength of
materials, the optimization of building design continues. One product of the optimization process
is lightweight floor systems. The strength of these floor systems has not been compromised;
however, in some instances, floor serviceability has been compromised. Over the past few decades,
as floors span greater distances and floor slabs decrease in thickness and weight, annoying floor
vibrations have gained increasing attention as a serviceability concern.
The Load and Resistance Factor Design Specification for Structural Steel Buildings
(1993) states in Chapter L,
vibration shall be considered in designing beams and girders supporting large
areas free of partitions or other sources of damping where excessive vibration due
to pedestrian traffic or other sources within the building is not acceptable.
It is up to the designer to decide if floor vibrations should be considered in the design of floor slabs
and their supporting members. In the design of office buildings, floor vibrations usually are not
considered. Office environments usually have fixed and/or movable partitions and other furniture
which are considered to provide adequate damping. However, this furniture does not always
provide enough damping to keep floor vibrations at an acceptable level. If an in-use floor has
annoying levels of floor vibration, several methods can be used to control the vibrations.. One
particular method of vibration control, which has been used to control floor vibrations and other

structural vibrations, is the use of tuned mass dampers. The use of tuned mass dampers to control
annoying floor vibrations is the focus of this research.
1.2 Literature Review
1.2.1 Floor Vibrations - background information
Every floor has certain frequencies at which it vibrates. These frequencies are the floor’s
natural frequencies of vibration, and are dependent on the mass, stiffness, and damping of the floor
system. The first frequency of vibration is the fundamental mode of vibration, and is referred to
as the dominant mode of vibration. Many who have studied floor vibrations have focused on the
fundamental mode of vibration (e.g. Allen and Murray 1993; Murray 1991); however, there have
been instances in which two or more modes of vibration have annoyed the occupants of a building
and have had to be dealt with (e.g. Setareh and Hanson 1992a, b, and c; Shope and Murray 1994).
Floor vibrations are usually not annoying to humans unless they fall within a specific
range of frequencies. From automobile and aircraft studies it has been determined that frequencies
in the range of 5-8 Hz are most annoying to humans (Hanes 1970); however, it should be noted
that frequencies outside this range can also be annoying to humans. Within this range, most of the
internal organs resonate. Ifa floor has one or more natural frequencies within or near this range,
and the frequencies are a harmonic of a forcing frequency, floor vibration can be very annoying to
humans.
Annoying floor vibrations can result from various sources. The vibrations can be steady-
state or transient. Steady-state vibrations are, as their name implies, steady or constant over a
period of time. Steady-state vibrations are usually caused by in-use equipment or machinery. The

most effective method for controlling steady-state vibrations is the isolation of the equipment or
machinery from the main structure, so that it no longer excites floor motion (Lenzen 1966).
Transient vibrations are caused by an impact and die out after a period of time. The
amount of time it takes for a vibration to diminish depends on the amount of damping in the
system. In 1966 Lenzen reported that damping plays a very important role in floor vibration. The
greater the damping in the floor system, the sooner the vibration oscillations are diminished, and
the less perceptible the floor vibration to the occupant. Lenzen found that vibrations are definitely
perceptible if the amplitude of the vibration after 5 cycles is greater than 0.4 of the initial
amplitude. If after 5 cycles of vibration, the amplitude is between 0.2 and 0.4 of the initial
amplitude, the vibration is between perceptible and barely perceptible. After 5 cycles if the
amplitude is less than 0.2 of the initial amplitude, the vibration is considered barely or not
perceptible. He found that vibrations which lasted for less than five cycles are generally not
annoying to building occupants.
The most common sources of annoying, transient vibrations on floors are the occupants of
a building. The human footfall creates the impact needed to initiate a vibration in a floor. Most
human motions across or on a floor (e.g. walking, running, jumping) fall within a frequency range
of 2-4 Hz (Ellingwood and Tallin 1984). These forcing frequencies can excite a floor’s natural
frequencies, and as a result, floor vibrations occur. The human impacting the floor can not be
isolated from the floor, so some other method of controlling the floor’s reaction to a human footfall
needs to be employed.
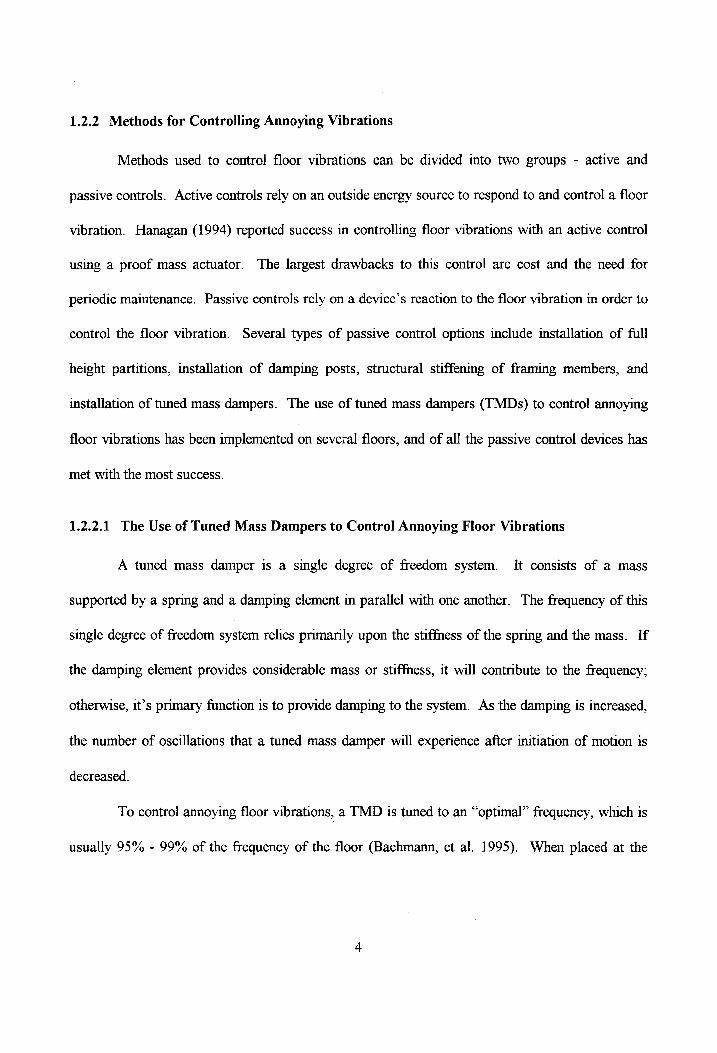
1.2.2 Methods for Controlling Annoying Vibrations
Methods used to control floor vibrations can be divided into two groups - active and
passive controls. Active controls rely on an outside energy source to respond to and control a floor
vibration. Hanagan (1994) reported success in controlling floor vibrations with an active control
using a proof mass actuator. The largest drawbacks to this control are cost and the need for
periodic maintenance. Passive controls rely on a device’s reaction to the floor vibration in order to
control the floor vibration. Several types of passive control options include installation of full
height partitions, installation of damping posts, structural stiffenimg of framing members, and
installation of tuned mass dampers. The use of tuned mass dampers (TMDs) to control annoying
floor vibrations has been implemented on sevexal floors, and of all the passive control devices has
met with the most success.
1.2.2.1 The Use of Tuned Mass Dampers to Control Annoying Floor Vibrations
A tuned mass damper is a single degree of freedom system. It consists of a mass
supported by a spring and a damping element in parallel with one another. The frequency of this
single degree of freedom system relies primarily upon the stiffness of the spring and the mass. If
the damping element provides considerable mass or stiffness, it will contribute to the frequency;
otherwise, it’s primary function is to provide damping to the system. As the damping is increased,
the number of oscillations that a tuned mass damper will experience after initiation of motion is
decreased.
To control annoying floor vibrations, a TMD is tuned to an “optimal” frequency, which is
usually 95% - 99% of the frequency of the floor (Bachmann, et al. 1995). When placed at the
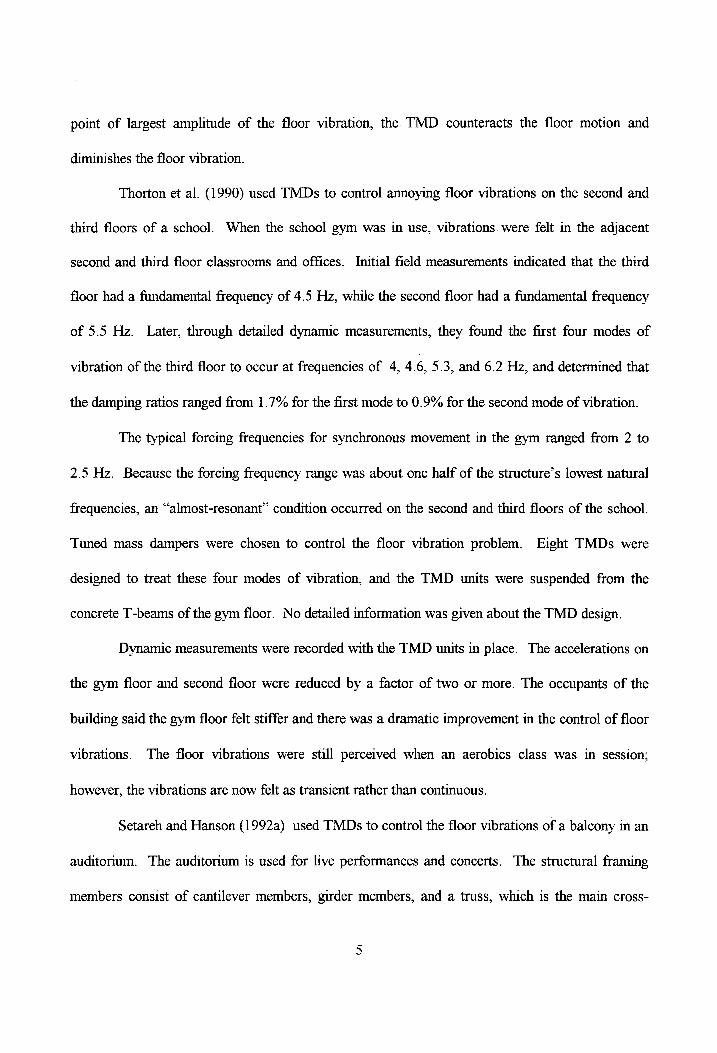
point of largest amplitude of the floor vibration, the TMD counteracts the floor motion and
diminishes the floor vibration.
Thorton et al. (1990) used TMDs to control annoying floor vibrations on the second and
third floors of a school. When the school gym was in use, vibrations were felt in the adjacent
second and third floor classrooms and offices. Initial field measurements indicated that the third
floor had a fundamental frequency of 4.5 Hz, while the second floor had a fundamental frequency
of 5.5 Hz. Later, through detailed dynamic measurements, they found the first four modes of
vibration of the third floor to occur at frequencies of 4, 4.6, 5.3, and 6.2 Hz, and determined that
the damping ratios ranged from 1.7% for the first mode to 0.9% for the second mode of vibration.
The typical forcing frequencies for synchronous movement in the gym ranged from 2 to
2.5 Hz. Because the forcing frequency range was about one half of the structure’s lowest natural
frequencies, an “almost-resonant” condition occurred on the second and third floors of the school.
Tuned mass dampers were chosen to control the floor vibration problem. Eight TMDs were
designed to treat these four modes of vibration, and the TMD units were suspended from the
concrete T-beams of the gym floor. No detailed information was given about the TMD design.
Dynamic measurements were recorded with the TMD units in place. The accelerations on
the gym floor and second floor were reduced by a factor of two or more. The occupants of the
building said the gym floor felt stiffer and there was a dramatic improvement in the control of floor
vibrations. The floor vibrations were still perceived when an aerobics class was in session;
however, the vibrations are now felt as transient rather than continuous.
Setareh and Hanson (1992a) used TMDs to control the floor vibrations of a balcony in an
auditorium. The auditorium is used for live performances and concerts. The structural framing
members consist of cantilever members, girder members, and a truss, which is the main cross-
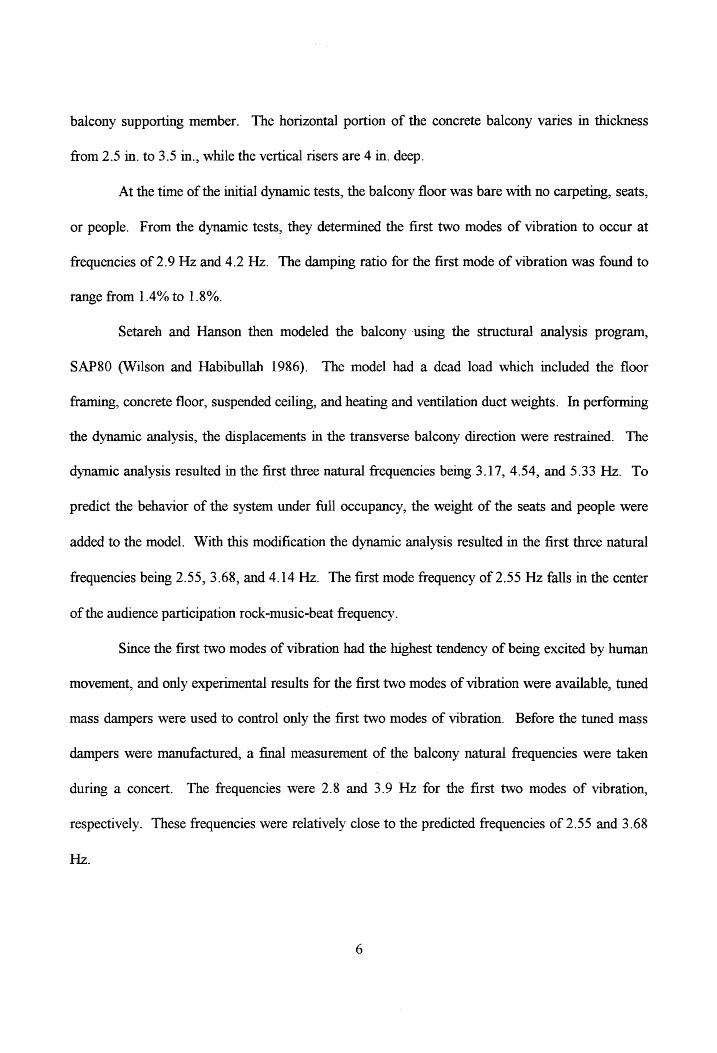
balcony supporting member. The horizontal portion of the concrete balcony varies in thickness
from 2.5 in. to 3.5 in., while the vertical risers are 4 in. deep.
At the time of the initial dynamic tests, the balcony floor was bare with no carpeting, seats,
or people. From the dynamic tests, they determined the first two modes of vibration to occur at
frequencies of 2.9 Hz and 4.2 Hz. The damping ratio for the first mode of vibration was found to
range from 1.4% to 1.8%.
Setareh and Hanson then modeled the balcony using the structural analysis program,
SAP80 (Wilson and Habibullah 1986). The model had a dead load which included the floor
framing, concrete floor, suspended ceiling, and heating and ventilation duct weights. In performing
the dynamic analysis, the displacements in the transverse balcony direction were restrained. The
dynamic analysis resulted in the first three natural frequencies being 3.17, 4.54, and 5.33 Hz. To
predict the behavior of the system under full occupancy, the weight of the seats and people were
added to the model. With this modification the dynamic analysis resulted in the first three natural
frequencies being 2.55, 3.68, and 4.14 Hz. The first mode frequency of 2.55 Hz falls in the center
of the audience participation rock-music-beat frequency.
Since the first two modes of vibration had the highest tendency of being excited by human
movement, and only experimental results for the first two modes of vibration were available, tuned
mass dampers were used to control only the first two modes of vibration. Before the tuned mass
dampers were manufactured, a final measurement of the balcony natural frequencies were taken
during a concert. The frequencies were 2.8 and 3.9 Hz for the first two modes of vibration,
respectively. These frequencies were relatively close to the predicted frequencies of 2.55 and 3.68
Hz.

Three TMDs weighing 4000 pounds each and two TMDs weighing 2000 pounds each
were designed for the first and second modes of vibration, respectively. The corresponding mass
ratios for modes one and two were determined to be 0.0307 and 0.01234, respectively. In general,
the higher the mass ratio, the more effective the TMDs (Bachmann, et al. 1995). Bachmann et al.
(1995) suggest a mass ratio of 0.02 to 0.0667 for the design of TMDs. All five units were placed
as close to the balcony edge as possible and at locations of highest vibration amplitudes for the
respective modes of vibration.
With the TMDs in place, the recorded acceleration varied from 0.02g to 0.10g, depending
on the type of auditorium activity taking place. According to Setareh and Hanson (1992a), 0.10g
is considered to be an acceptable acceleration for concert halls. The displacements ranged from 0.1
in. to 0.2 in. The largest accelerations and displacements occurred when a rock concert was in
progress. With the TMDs in place, the amplitudes of vibration were reduced to about 22% of the
amplitudes that occurred without TMDs in place.
Webster and Vaicaitis (1992) used tuned mass dampers to control the floor vibrations of a
longspan, cantilevered, composite floor system. This particular floor has a unique layout. Four
columns support a cross-shaped pattern of floor girders and an elliptical ring girder. The
floorbeams span between the cross-shaped girders and ring girder, and are cantilevered from the
elliptical ring girder out to the rectangular face of the building. The floor is a “reinforced concrete
deck-formed slab resting on top of and periodically welded to the floor-beams.”
This floor was used asa dining and dancing area, with the dining taking place near the
center of the floor area and the dancing on the cantilevered portion of the structure. Guests
complained about the floor vibrations. Accelerations reached 0.07g and displacements were
measured to be as high as 0.13 inches. An acceleration of 0.025g to 0.03g is considered to be an
acceptable acceleration for a dining/dancing environment according to Allen (1990). Prelimmary
vibration tests found the first natural frequency to be 2.3 Hz, which corresponds to the forcing
frequency of many dances (NBCC 1985). Using the half power method (Meirovitch 1986), the
damping ratio for the first mode of vibration was determined to range from 2.8% to 3.6%.
Due to the large amplitudes of floor motion, light structural damping, and the fact that the
floor was primarily excited in its first mode of vibration, they decided to use@# tuned mass dampers
to control the floor vibration. The tuned mass dampers consist of springs and a viscous dashpot in
parallel and supporting the mass. Above the mass and connecting the mass to the upper portion of
the frame is another viscous dashpot. The TMDs were located at the four corners of the building,
as close to the cantilevered ends as possible. The TMD used in one quadrant of the building
weighs 18,400 pounds. This results in a mass ratio of about 0.046. With the TMDs in place, the
floor accelerations during dance events were reduced by at least 60%. Since the installation of
tuned mass dampers, no complaints of floor vibration have been reported.
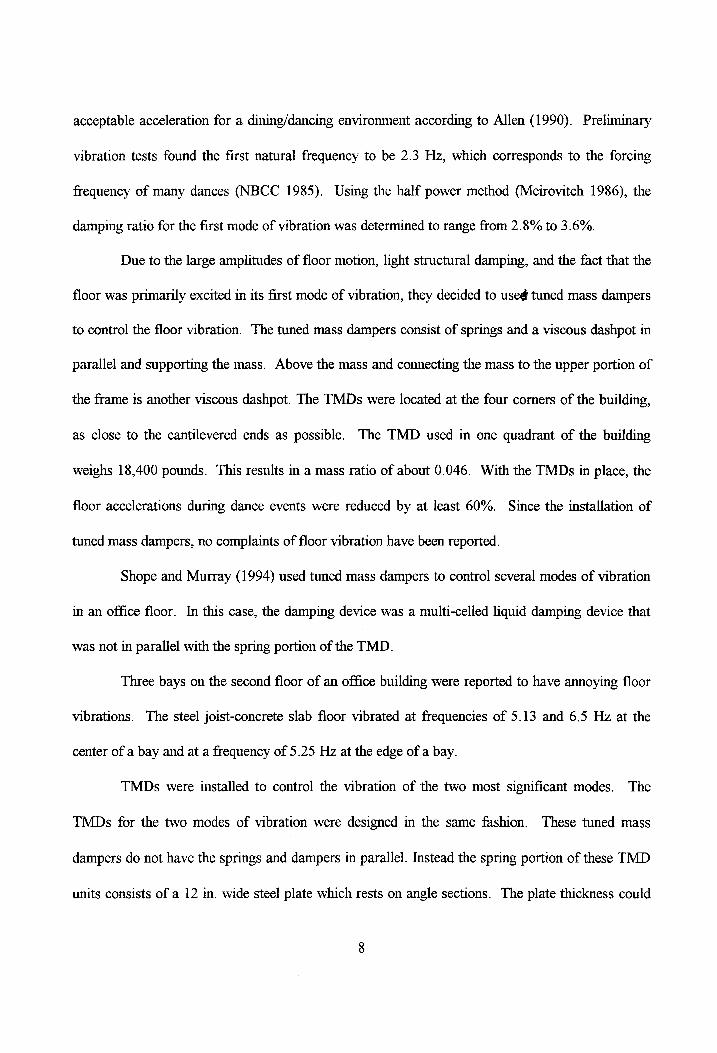
Shope and Murray (1994) used tuned mass dampers to control several modes of vibration
in an office floor. In this case, the damping device was a multi-celled liquid damping device that
was not in parallel with the spring portion of the TMD.
Three bays on the second floor of an office building were reported to have annoying floor
vibrations. The steel joist-concrete slab floor vibrated at frequencies of 5.13 and 6.5 Hz at the
center of a bay and at a frequency of 5.25 Hz at the edge of a bay.
TMDs were installed to control the vibration of the two most significant modes. The
TMDs for the two modes of vibration were designed mm the same fashion. These tuned mass
dampers do not have the springs and dampers in parallel. Instead the spring portion of these TMD
units consists of a 12 im. wide steel plate which rests on angle sections. The plate thickness could

be varied between 5/8 in. and 1 in. in order to vary the stiffness. The span of the plate between
supports was adjusted in order to change the stiffness in the field. The weights (i.e. mass) and
multi-celled liquid dampers are supported by the plate. The damper is no longer in parallel with
the spring, but is supported by the spring. This made fine-tuning of the TMD difficult, since
changing the number of liquid damping cells also changed the mass of the TMD, and therefore the
TMD’s frequency.
The TMDs were placed so that a TMD support is located at a point of maximum
amplitude for a particular mode of vibration. A total of fourteen TMDs were placed on the three
bays. Significant improvement in floor response was shown in the acceleration time histories of the
uncontrolled versus controlled floor vibrations. The occupants indicated their satisfaction in the
reduction of floor vibrations.
Bell (1994) used a tuned mass damper to control vibrations on a museum floor. This
particular portion of the floor is a “bridge slab” which has openings on either side to permit natural
light from above to penetrate the floors below. The floor framing consists of two dissimilar length
girders and floor beams that span between the girders. No information was given about the floor
slab.
Prior to the completion of this museum space, the owner complained of excessive floor
vibrations on this portion of the floor. Initial floor measurements indicated a floor vibration of 3.7
Hz, and the damping ratio was determined to be 1%.
The tuned mass damper used to control the floor vibrations weighs 1925 pounds, and this
results in a mass ratio of 0.0378. The TMD uses fluid dashpots for damping. No further
information was given about the design of the tuned mass damper. The TMD was suspended

below the floor at the center of the span. The installation of the TMD increased the damping by
580%. No complaints associated with floor vibration have been reported by museum patrons.
Each floor, on which TMDs were used to control annoying vibrations, had its own unique
response characteristics. Only one of the floors was reported as having more than two modes of
vibration that required control, and not many details were given concerning the TMD design or
placement. The other floors were reported as having only one or two modes of vibration to control,
and more details were given on the design and placement of these TMDs. This indicates that the
complexity of controlling annoying floor vibrations increases as the number of modes that require
control increases. Table 1.1 summarizes the response of these floors before and after the
placement of TMDs, and some of the TMD characteristics.
1.2.2.2 The Use of Tuned Mass Dampers to Control Vibrations on Other Structures
Tuned mass dampers have also been used to control annoying vibrations of footbridges
and a diving platform. Each of these structures required that only the fundamental mode of
vibration be controlled, and each structure initially had a relatively small damping ratio.
Bachmann and Weber (1995) reported the use of tuned mass dampers on a four span
girder footbridge. The bridge is constructed of concrete slab resting on two steel girders. The
bridge was reported to have excessive vibration under normal use. Bachmann and Weber
measured the fundamental frequency of the footbridge to be 2.46 Hz. The damping ratio in the
footbridge was determined to be only 0.2-0.4%.
Two identical tuned mass dampers were designed to control the fundamental mode of
vibration. The two dampers were located across from each other, one suspended from each girder,
near the center of the longest span of the footbridge. The mass of the TMD is supported by four
10

‘quaWIAIDNp So]
Aq pourLUId}op
sem Oe
Suldurep sy,
(¢
‘aarnd Avoop
& Aq
pouTULIs}ap sem
orjer Suldurep
oy], (Z
‘IOO]J puosas
pue WAT
94} UISOUOD
S}[NSOI dy}
IN ‘JOOYDS
dy} JO 1OOTF
PING} dU}
JOF oIe
Soe Surdwep
pue Aousnbay
oy], ([
:sojou
surdwep MO]AQ
SIOOT 0}
IoUMO JO
suoTjed UT
OSBOIOUT sjodysep]
(¢ a}0U
90s) ssuiusdo
WIM] =
#66
Woy syuTe;dus0S
ou %O8BS}
8C0'0 ping
8500 100
Le I
Ioo[F WInesnUT
Med
SUOTJBIQIA JO [OUD
sJoppeyq 7661
SUTUIINUS SyuRdNI5D0
POY
S7S Z
/ABLINIAT
wo
asuodsas sarjisod
-pmbiy] C9O/T'S
I JOOTF
SOYJO} ~=—. a
adoys
,sjodysep
% 09
ISed] uonedissip
7661 SUOTBIQIA
JO UTe[du0D]
ye Aq
poonpaz AS19000
SLE (Z)
JOog] /SmTRoIeA
Jasuo] OU
s}sond SuOTIeIGIA]
L+0'0 dIQULvA,,
1€0'0>2>870'0 |
€7 I
souep/surUrp] 2
Id}sqoM
%0T
Ajayeurxoidde (Z
3}0U 99S)
7661
Aq psonpal}
€710'0 6'€
Z Auooyeq]
= /uosueH
SUOTJEIQIA! L0C0'0
rodysep 800°0
— 910'0
87 I
UNHOypne] 2
YoIe}s
snonuruos uey}
Z JO 10}9RJ
LIO' O>2>60001
79 v
SIOO]J WIOOISSE]O]
(T s}0U
99S)
Joupel yuotsuey
se] eB Aq
poonpal L10'0>2>600'°0 |
€'¢ €
/OWO] =
066T poalooiad
suoneIqiAl = -Jad9B
IOOTT ,Juauoduros
600'0 oF
t SUIOgYystIou
yye 3
~ JUOWIOAOIdUIT ONeWeIp|
§=— puz 4
WAS OSTSOOSIA,,
L100 P
I Wy 1OOY
WAS] = “UoOyL,
yuowoaoidwuy |
oney SOIAD]
oney oney
(ZH) [poyfonuep|
= uonduosaq
ayeq
syuswU0,) joomseay |
ssepy | suidweq | suidweq
jeutz| suidureg
jenmy| ‘bor
| (spo;
100, /(s)s0yny
SUOBAQGIA 1OOLY
[01907 03
SQIALL JO
2S( 94)
WO
szNSay puB
vyEq jo
AreMUINS [°T
3qUy
\1

springs and two damping devices, which consist of a rod submerged in viscous fluid. The optimum
damping ratio was determined to be 6.5%. The mass ratio with the combined TMDs is 0.0115.
The TMDs were successful in controlling the vibrations on the bridge. Accelerations due
to a person jumping were reduced by a factor of 19, while accelerations due to walking were
reduced by a factor of 5, and accelerations due to running by a factor of 2.9.
Bachmann and Weber (1995) also controlled annoying vibrations on a cable-stayed
footbridge. Before this bridge was constructed it was planned that a TMD would be installed to
control vibrations. Through finite element analysis, the first mode of vibration was determined to
be 1.98 Hz, and a TMD was designed to control this frequency of vibration. A damping ratio of
0.5% was assumed in the design.
After construction of the bridge, the fundamental frequency was measured as 2.12 Hz.
This was very close to the calculated frequency, so very little modification was required of the
TMD. Through measurements, the damping ratio was determined to range from 0.5% to 1%,
depending on acceleration amplitudes. The TMD has a design similar to the TMDs designed for
the girder footbridge described previously. It has a mass ratio of 0.044. To gain optimum control
of the vibrations, the TMD was placed at the location of peak amplitude for the fundamental mode
of vibration.
This TMD reduced jumping accelerations on this footbridge by factor of 2.4 and running
accelerations by a factor of 1.5. These reductions in acceleration were not as dramatic as the
reductions in acceleration for the previous case because this structure initially had a larger
damping ratio, and the influence of higher modes of vibration were no longer negligible.
Bachmann and Weber (1995) used a TMD to control the vibration of a two-tiered diving
platform. The diving platform is concrete and has a platform at 3 m and another at 5 m. The
12

diving platform had a fundamental frequency that ranged between 2.6 and 2.7 Hz, and had a
damping ratio ranging from 1.5% to 2.0%.
The motion of the platform was oblique with the larger component of motion in the
horizontal direction. This required a unique design for the TMD. The TMD moves horizontally,
and consists of the mass hanging from steel plates, which act as the springs for the TMD. The
damping device is once again a rod submerged in a viscous fluid. The final design resulted in a
mass ratio of 0.03. The TMD was placed on the 5 m platform, where the largest amplitudes of
vibration were taking place. |
The TMD was able to diminish the vibrations on the diving platform. The TMD reduced
accelerations due to jumping by a factor of 4.3, and accelerations due to shaking on the railing by a
factor of 6.4.
1.2.2.3 The Use of People to Control Annoying Floor Vibrations
Humans are excellent damping mechanisms. Because our bodies are composed mostly of
water in individual membranes (e.g. cells), the human body is excellent for absorbing and damping
vibrations. A laboratory floor at Virginia Tech was utilized to demonstrate the effectiveness of
humans as damping mechanisms.
This laboratory test floor was designed to simulate a typical office floor. The single bay
floor measures 15 ft by 25 ft, and has a 3% in. concrete floor resting on 1.0C metal deck. The
floor rests on 16K3 open web joists, which span between roller-supported W14x22 hot-rolled steel
girders. The joists span 25 ft, and are placed 30 in. on center.
Acceleration measurements of the bare floor resulted in dominant natural frequencies of
7.375, 9.375, and 16.75 Hz. Using the half power method (Meirovitch 1986), the damping ratio of
13

the first mode of vibration for the bare floor was determined to be 1.6%, while the damping ratio
for the second mode of vibration was determined to be 2.3%.
People were placed on the floor to control the first and second mode of vibration. The first
mode of vibration has a bowl shape with the peak displacement occurring at the center of the floor.
The second mode of vibration is a torsional mode of vibration. The second mode of vibration
peaks at two locations in such a way that while one location is at its absolute maximum
displacement, the other is at its absolute minimum displacement, These peaks are located at the
midspans of the exterior joists. Figure 1.1 shows the mode shapes for the first and second modes
of vibration.
Two people were placed at the center of the floor to control the first mode of vibration.
Two people, one at each location of peak amplitude, were placed at opposite edges of the floor to
control the second mode of vibration. The combination of two people to control the first mode of
vibration resulted in a mass ratio of 0.076. The combination of two people to control the second
mode of vibration resulted in a mass ratio of 0.130, which was a relatively large mass ratio. If
taken individually, the mass ratio of one human damper for the second mode of vibration was
approximately 0.065.
Figure 1.2 shows the floor acceleration response to heel drops at the center of the floor and
at the center of an edge joist with and without the people in place. With the four people in place,
the damping ratio for the first mode of vibration increased by more than a factor of three. The
people had only a slight effect on the floor frequency. The first mode frequency peak moved about
0.25 Hz while the second mode frequency peak didn’t move, it only decreased in amplitude. The
change in frequency was most likely due to the change in mass of the system.
14

i
ee CS
Pes
WY WX
KY Or“ OM).
3 BE
KRY”
OY
OY Ys ‘
MODE
Figure 1.1 Laboratory Floor Mode Shapes One and Two
15

Floor Response Without People
ACCELERATION (IN/S*2} 100
-50 + -100
TIME (S)}
FREQUENCY SPECTRUM AMPLITUDE
7000
6000 +
5000 +
4000 +
3000 +
2000 +
1000 + o + f : +
0 5 10 15
FREQUENCY (Hz)
20
Floor Response With People
ACCELERATION (IN/S‘2}
100
50 4
5 { | MW anrennanen a 4
-100
0 1 2 3 4
TIME (S)
FREQUENCY SPECTRUM AMPLITUDE
7000
6000 + 5000 + 4000 + 3000 + 2000 + 1000 +
FREQUENCY (Hz)
a - Heel drop and response at the center of the floor
ACCELERATION (IN/S*2)
200
150 +
100 +
TIME (S)
FREQUENCY SPECTRUCM AMPLITUDE
8000
7000 +
6000 +
5000 +
4000 +
3000 +
2000 +
1000 + 0 , + +
0 5 10 15
FREQUENCY (Hz)
20
ACCELERATION (IN/S*2)
200 150 +
100 +
0 1 2 3 4
TIME (S)
FREQUENCY SPECTRUM AMPLITUDE 8000 + 7000 £ 6000 {
4000 + 3000 + 2000 + 1000 +
FREQUENCY (Hz)
b - Heel drop at the center of an edge joist and response at the opposite edge joist
Figure 1.2 Acceleration Time Histories and Frequency Transforms
16

Walking acceleration data was recorded at the center of the floor with a person walking
parallel to the joist length along the center of the floor. The root mean square (RMS) of the
acceleration data with and without people on the floor was determined. RMS acceleration was
reduced by a factor of 1.6 with the people in place. Walking acceleration data was also recorded at
the center of one of the edge joists with a person walking perpendicular to the joists along the
center of the floor. With people in place, RMS acceleration was reduced by a factor of 2.8.
Figure 1.3 shows the walking acceleration traces in the parallel and perpendicular to joist
directions, with and without people on the floor.
Walking in the perpendicular direction especially excited the second mode of vibration; the
larger RMS acceleration reduction factor is most likely due to the larger mass ratio for the second
mode of vibration. Even though the acceleration reduction factor may not seem significant, the
increase in damping was significant enough so that the floor vibrations were much improved with
people at “key” locations on the floor.
1.2.3 Summary
Annoying floor vibrations will continue to be a problem as long as vibration serviceability
criteria are not checked by the structural engineer. A number of methods, both active and passive,
are available for the control of annoying floor vibrations. A passive control mechanism, such as a
tuned mass damper, can be used to diminish floor vibrations, and has been used in the past with
some success.
Tuned mass dampers have been used to control vibrations on a variety of structures.
When a structure’s damping ratio is initially relatively high (1.e. = 3%) the success of a TMD is
usually minimal. The success of TMDs is also usually minimal when more than one mode of
17

Floor Response Without People Floor Response With People
ACCELERATION (IN/S42) ACCELERATION (IN/S“2) 10 10 B+ 8+
6 + 6 +
{Ahi | > lait 2 2+ 0 ! | 0 iM HM Wy | WM in| Nin A 4 Ft S| | SHOEI 4r 4+
6 + et
-8 + 8 +
10 10 0 4 2 3 4 0 1 2 3 4
TIME (S) . TIME (S}
a- Walk parallel to joists
ACCELERATION (IN/S42) ACCELERATION (IN/S*2)
20 20
15 + 15 +
10 +
>|
CHA
be
-10 4
-15 + | -15 +
-20 -20 0 1 2 3 4 0 1 2 3 4
TIME (S) TIME (S)
b - Walk perpendicular to joists
Figure 1.3 Walking Acceleration Traces With and Without People in Place
18

vibration needs to be controlled, and the frequencies of those modes of vibration are closely spaced.
Bachmann, et al. (1995) and Setareh and Hanson (1992b) have also noted that vibrations on floors
with closely spaced natural frequencies are difficult to control usmg TMDs. The greatest success
in the use of TMDs has occurred when the structure initially has a small damping ratio (i.e. < 1%)
and/or only the structure’s fundamental mode of vibration needs to be controlled.
1.3 Research Objectives
The purpose of this research is to perform experimental and analytical studies on the use
tuned mass dampers to control one, two, and three modes of floor vibration. The results of these
studies will be presented in Chapters 3, 4, and 5.
Experimental studies will be performed using prototype TMDs on a laboratory floor and
several bays of an office floor. Tuned mass damper effectiveness will be determined by performing
a visual comparison of acceleration traces and Fast Fourier Transforms (FFTs) of the acceleration
data, and by comparing the root mean square (RMS) of acceleration due to a person walking.
Analytical studies will be performed using models of several of the experimental test
floors. The analytical results will be compared with the experimental results, and the changes in
floor response and vibration characteristics resulting from TMDs in the model will be presented.
19
CHAPTER 2
PRELIMINARY STEPS FOR THE USE OF TUNED MASS DAMPERS TO
CONTROL ANNOYING FLOOR VIBRATIONS
2.1 Determination of Floor Vibration Characteristics
Once a floor vibration problem is identified, the vibration characteristics of the floor need
to be studied. To best control a floor’s vibration, the dominant and annoying frequencies and
modes of vibration need to be determined and controlled as best as possible.
The natural frequencies of a floor can be determined by floor vibration measurements.
Vibration measurements allow one to see at which frequencies the natural modes of vibration
occur. Tuned mass dampers are designed to control specific frequencies, and because of this the
natural frequencies of the floor must be known.
In addition, computer modeling of the floor can be a useful tool. Through an eigenvalue
analysis performed using SAP90 v. 6.0 (Wilson and Habibullah 1995), for instance, mode shapes
for the natural modes of vibration can be determined. The mode shapes are useful in determining
the locations at which tuned mass dampers should be placed to control each mode of vibration.
The nodal displacements of each mode shape make up the $“? matrix, where i = a single mode of
vibration. Information from the °? matrix is utilized in determining the equivalent single degree of
freedom floor mass for a particular mode of vibration. This effective floor mass is used in
determining the TMD-to-floor mass ratio.
20

2.1.1 Determination of Floor Frequency
To design tuned mass dampers, the floor vibration frequencies which need to be controlled
must be determined. These frequencies are the frequencies to which the TMDs will be tuned.
First the areas of a floor with vibration problems must be determined. In most cases, floor
vibrations occur in individual bays of a floor (i.e. movement in one bay does not cause considerable
vibration in another bay). In that case, vibration measurements can be confined to the individual
bay(s) with vibration problems. In some instances floor vibration measurements cannot be
confined to an individual bay. Murray (1991) reported the occurrence of floor vibrations that can
move from one bay to the next in a wave-like motion transverse to the supporting members. This
wave-like motion was found to be prevalent in buildings where the floor was free of fixed
partitions, the bays were rectangular, and the supporting members were equally spaced and of the
same stiffness throughout the bays. When this wave-like motion occurs, vibration measurements
may be taken in one bay while motion is initiated in that bay or in neighboring bays.
To take floor vibration measurements, the proper equipment and a source to initiate the
vibration are needed. Heel drop impacts are generally used to initiate floor vibration. A person
performs a heel drop by standing on their toes with their knees straight and with the heels of their
feet about 2’ in. above the floor. They then relax, allowing the weight of their body to fall freely
onto the heels of their feet, resulting in an impact (Murray, 1979). An accelerometer is used to
collect floor acceleration data. The data is sent to a spectral analyzer where it is recorded and
shown as acceleration over a period of time. The spectral analyzer then takes the acceleration data,
which is in the time domain, and performs a Fast Fourier Transform (FFT) to convert the
acceleration data to the frequency domain. The plot i the frequency domain shows frequency
versus frequency spectrum amplitude. The frequency spectrum amplitude scale is used to measure
21
the relative change in frequency power of FFTs of acceleration resulting with and without TMDs
on a floor. The frequencies at which the frequency spectrum amplitude peaks are the natural
frequencies of the floor. Figure 2.la shows the acceleration of a floor due to a heel drop impact,
and Figure 2.1b shows the corresponding frequency transform. When there are several peaks in
amplitude, this indicates several natural frequencies of floor vibration.
To determine all of the possible annoying modes of vibration, measurements should be
taken at several locations on a floor. A floor vibrates differently for each mode of vibration;
therefore, floor response may be zero at one location for a particular mode of vibration, while floor
response may be at its maximum for another mode of vibration. When floor response for a
particular mode is zero at a location, its natural frequency does not appear on a plot in the
frequency domain. This needs to be taken into consideration so that all annoying frequencies are
identified and TMDs can be designed to control the vibration.
2.1.2 Determination of Floor Damping Ratio
From collected acceleration data, information concerning the damping ratio of the floor can
be determined. As stated in Chapter 1, Lenzen (1966) reports that damping plays a very important
role in occupant response to floor vibration. The greater the damping in the floor system, the less
perceptible the vibration is to the occupant. The damping ratio can be helpful in determining the
effectiveness of TMDs by comparing damping before and after placement of TMDs.
The damping in the floor can be “seen” in the acceleration graph. The greater the
damping, the sooner the acceleration decreases. The floor response before and after installation of
TMDs can be compared to see the relative increase in damping with TMDs in place. As can be
22

ACCELERATION (IN/S“2) FREQUENCY SPECTRUM AMPLITUDE
200 1207 150+
400 100+ | 504 80
01 60
50} 40 |
wo erry EEE YT -150+ B Wy ALS | | wy NS
-200 0 0 5 4 6 3 0 5 10 15 20
FREQUENCY (Hz) TIME (S)
a - Acceleration on a bare floor due to b -Acceleration in the frequency domain heel drop impact
FREQUENCY weakened, SPECTRUM\ damped vibration
ACCELERATION (IN/S“2) AMPLITUDE perceptible
200+ 120
S0F 100 100+ {fh
i 501 80
0 60
-50 TT 40
-1 00 +
20 -150+ .
-200 + 0
0 2 4 6 8 0 5 10 15 20
FREQUENCY (Hz) TIME (S)
wet eee floor without TMDs floor with TMDs
c - Acceleration on floor with and without d -Acceleration in the frequency domain TMDs due to a heel drop impact with and without TMDs
Figure 2.1 Acceleration Time Histories and Frequency Transforms
23

seen in Figure 2.1c, the acceleration with TMDs in place diminishes sooner than the acceleration of
the floor without TMDs, showing increased damping.
From the plot in the frequency domain, the relative energy of each mode of vibration can
be seen. The area under the curve is related to the energy for that particular mode of vibration.
Looking to Figure 2.1d, if the peak is relatively sharp with a large amplitude, that mode of
vibration is very strong and has very little damping. If the peak is rounded with a relatively small
amplitude, that mode of vibration is not very strong and is well damped.
Using the plot in the frequency domain, the floor damping can be determined analytically
using the half power method (Meirovitch 1986). This method of calculating the damping ratio of a
floor can only be used when there are no TMDs on the floor. To determine the damping ratio, the
frequency at the peak amplitude must be determined along with the frequencies on either side of the
peak amplitude located at amplitude values 1 / V2 times the peak amplitude value. Figure 2.2
shows a graph in the frequency domain, and the location of the frequencies required to determine
the damping ratio. The frequency at the peak amplitude is called f,, while the frequencies on either
side of f, are called f; and f;. The graphs in the frequency domain are in terms of cyclic frequency,
f. The damping ratio, €, can be determined as follows:
1(£, - f, Et an The half power method is not very effective when frequencies are closely spaced because energy
from one mode of vibration overlaps the energy from a neighboring mode of vibration, distorting
the true shape of the individual frequency peaks. 6“ //¢-#'" “f **
24

AMPLITUDE
2500 TT
td maximum amplitude
Mi 20007 i i
| (1/./2)(maximum amplitude)
1500 +
id
1000+ Hd
i
HI 500+ lid
Hd
Hd
0 ! Lit. 4 a ! _.. 0 5 4s, 10 15
FREQUENCY (Hz)
Figure 2.2 Half Power Method (Meirovitch 1986)
25

2.1.3 Modeling a Floor Area Using a Structural Analysis Program
The structural analysis program SAP90 vy. 6.0 (Wilson and Habibullah 1995) is used in
this study for the analysis of all floor models. The updated version will be commercially available
at a date later this year. This program can be used to perform an eigenvalue analysis of the floors
with vibration problems. The eigenvalue analysis can output frequencies, mode shapes, and other
useful information which can be used in the design of tuned mass dampers.
This program shows how a floor can move in each of its modes of vibration. This
information is helpful in determining where to place TMDs for each mode of vibration. To most
effectively diminish floor vibration, a TMD should be placed at the location of peak displacement
for a particular mode of vibration.
Using results from the eigenvalue analysis, the effective mass for each mode of vibration
can be determined. This information is used in the design of a TMD, as will be seen in the
following section.
2.2 Designing a Tuned Mass Damper
Once the frequencies and modes of vibration to be controlled have been determined, tuned
mass dampers can be designed to control the floor vibration. Theoretically, a tuned mass damper
will eliminate all vibration resulting from an impact on the floor. An actual TMD cannot do this;
however, a well-designed TMD will control and diminish the floor vibration(s) considerably.
26

-—TMD
Force(t) ky |-- Cy |
5 4 k. --lc, -— Floor
ITITIVITITTTT T7777 =
=
SDOF floor system parameters: SDOF TMD system parameters: My, = mass my = mass k; = stiffness k; = stiffness
Cr = damping coefficient Cr = damping coefficient ur = displacement Uy = displacement
f; = natural frequency f; = natural frequency
Figure 2.3 Two Degree of Freedom System: Floor and TMD
27

2.2.1 Single Degree of Freedom System
A tuned mass damper is a single degree of freedom (SDOF) system. To simplify the
design of a tuned mass damper, the floor is modeled as a single degree of freedom system as well,
so that together they form a two degree of freedom system as seen in Figure 2.3. A floor has
numerous degrees of freedom, and is actually a multiple degree of freedom system. However,
modeling the floor as a SDOF system simplifies the floor vibration and constrains the floor
vibration to only one mode of vibration. This allows floor vibration to be controlled one natural
frequency, or mode of vibration, at a time. A separate TMD is needed to control each annoying
mode of vibration of the floor.
2.2.2 Design Equations
The notations used for the equations to follow can be found in Figure 2.3. The equations
used for the design of a tuned mass damper assume that the floor and tuned mass damper are both
single degree of freedom systems. To model the floor as a SDOF system, the frequency of the
floor for the particular mode of vibration must be known, along with the effective, or equivalent
SDOF, floor mass, mer.
Using the 6” > matrix, where i = a single mode of vibration, the equivalent SDOF floor
mass can be determined for a mode of vibration (Setareh and Hanson 1992b). According to
Setareh and Hanson (1992b), the equivalent SDOF floor mass, mp, is:
oe mr > [6 Mg" (2.2)
28

where ¢ equals the modal amplitude of the floor at the location where a TMD is located, and M
equals the floor mass matrix. In most cases, @ will equal the maximum modal amplitude for a
particular mode of vibration.
For the design of the tuned mass damper, Bachmann, et al. (1995) suggest that the mass
ratio be m the range of 1/50 to 1/15, but suggest that the larger the TMD mass, the better. The
mass ratio, |, 1s defined as:
p= (2.3)
Knowing the floor mass and a desired mass ratio, an initial estimate for the TMD mass can be
made.
The remainder of the equations used to design TMDs are derived from the differential
equations of motion of SDOF and two DOF systems. The SDOF equations are simpler and will be
introduced first; however, in the design process, equations resulting from the two DOF system are
utilized first in determining the required foptimar aNd Goptima- The SDOF equations are utilized later
to design the TMD. The parameters, foptima aNd optimal, Will be defined in a following section.
Single Degree of Freedom Equations
The SDOF equations are derived from the differential equations of motion of a SDOF
system (Chopra 1995). The equation of motion for undamped free vibration is as follows:
mii + ku = 0 (2.4)
The notation, ii, is the second derivative of the displacement, i.e. the acceleration of the system.
The notation, u , is the first derivative of the displacement, i.e. the velocity of the system, and will
be used in a later equation. From Equation 2.4 the following equation, which relates the natural,
undamped frequency of a system to the mass and stiffness of a system, can be derived:
29
On = |e (2.5) m
@ = 2nf (2.6)
where
Circular frequency, @, and cyclic frequency, f, are both referred to as frequency, and are used
interchangeably.
The equation of motion for viscously damped, free vibration of a SDOF system is as
follows:
mi + ci + ku = 0 (2.7)
Dividing this equation by m gives
i+ 20,0 + @,*u =0 (2.8)
where @, 1s as defined in Equation 2.6 and
c G=— (2.9)
Cor
where
Cy = 2M, (2.10)
The damping ratio, C, is the ratio of the system damping coefficient, c, to the critical damping
coefficient, c.,, of the system. The critical damping coefficient is defined as the smallest value of c
that stops oscillation completely (Chopra 1995). With damping in the system, the natural
frequency of damped vibration, @p, can be related to the natural frequency of the system without
damping, @,, in the following manner:
Op = Onl -C? (2.11)
30

If damping in a SDOF system is insignificant, then @p can be equated to @,.
Using equations derived from the differential equations of motion for a two DOF system,
which will be introduced in the next section, f and Gy will be determined. The value of f; can be
converted to a circular frequency and equated to , for a SDOF system. The value of Gr can be
converted to ¢ for a SDOF system. Knowing the desired mass and @, of a TMD, an acceptable
damping coefficient, cr, can be determined using Equations 2.9 and 2.10. This desired damping
coefficient can then be utilized in the design of the damping element. The value of mp can be
determined using Equation 2.11. If damping 1s significant and @p varies greatly from @,, @p can
replace ©, in Equation 2.6, and the desired TMD stiffness, kr, can be determined.
Once the desired parameters are determined, the TMD can be designed and built. If the
actual TMD parameters differ from the desired parameters, Equations 2.6 and 2.11 can be utilized
to “tune” the TMD. For example, if the stiffness and damping coefficient are constant, the mass
can be varied so that the TMD frequency will equal f;. To control floor vibrations it is very
important that the TMD be “tuned” to the proper frequency. Slight variations in frequency can be
critical, whereas slight variations in damping are not as critical (Bachmann and Weber 1995).
Two Degree of Freedom Equations
The equations of motion for a two DOF system are as follows (Bachmann et al. 1995):
m,l,; + cpu, - ¢;(u,-u,) + kpu, - k,;(u,;-u,) = FeosQt (2.12)
m,l;, + c,(u,-u,;) + k;(@u,-u,) = 0 (2.13)
where Fcos((2t) represents harmonic excitation of the floor.
From these equations an equation for the “optimum” frequency of the TMD can be derived
(Bachmann et al. 1995; Den Hartog 1934):
31

Exam = [ l }e (2.14) l+p
This frequency, foptima, 18 used in the SDOF equations to design the TMD. The value of foptimai
usually ranges from 95% to 99% of f- (Bachmann et al. 1995). When a TMD is “tuned” to foptimal
and placed on a floor vibrating at a frequency of ff, the plot in the frequency domain will no longer
have one peak at fp. With the TMD in place, the plot in the frequency domain will show two
peaks, one slightly lower and one slightly higher than fs. The TMD, one of the two degrees of
freedom, 1s tuned to the optimal frequency and will be slightly lower than fp. The frequency of the
floor, the second degree of freedom, becomes slightly higher than fy. This increase in floor
frequency occurs because the effective mass of the floor decreases with a properly tuned TMD in
place. Ideally, a TMD counteracts the motion of the floor, and this should result in a smaller
displacement of floor mass. A smaller displaced floor mass results in a smaller effective floor
mass, which in turn will cause an increase in floor frequency. Now the plot in the frequency
domain will show a split with the first frequency peak corresponding to the TMD frequency and
the second frequency peak corresponding to the floor frequency.
Optimal damping of the TMD can be determined by the following equation (Bachmann et
f 3p = [oe 15 C optimal 8(1+p)3 (2 ] )
This equation is only valid for floors with no damping; however, Bachmann and Weber (1995)
al. 1995; Den Hartog 1934):
found that Equations 2.14 and 2.15 are sufficiently accurate for lightly damped structures.
Concerning the use of TMDs, Bachmann, et al. (1995) states that a TMD is more effective
the smaller the damping of the floor system, and that TMDs do not work satisfactorily on a floor
32
with closely spaced natural frequencies. Setareh and Hanson (1992b) state that if the modes which
create annoying vibration are within 20% of each other, the use of a tuned mass damper can move
the locations of the peak amplitudes (i.e. change the frequencies of the other modes of vibration).
These observations will be discussed further in later chapters.
2.2.3 Tuned Mass Damper Design
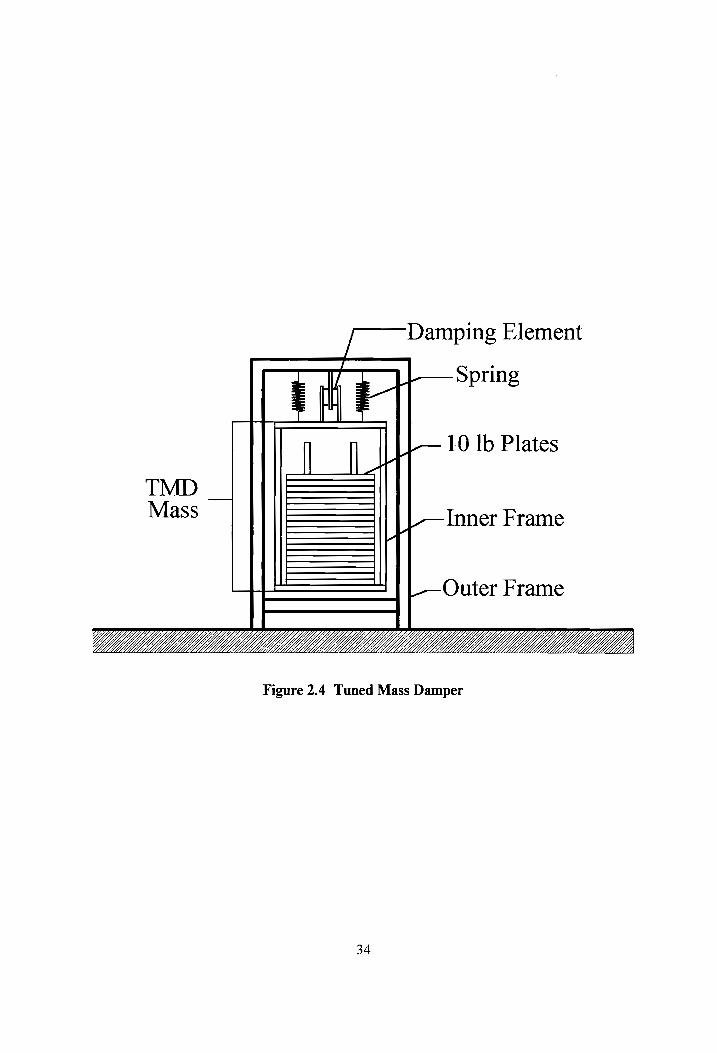
The tuned mass dampers used in this research were designed by the 3M Company, St.
Paul, Minnesota. Figure 2.4 shows an elevation view of the prototype TMD. The TMD stands
approximately 3 ft tall, and is 2 ft wide by 2 ft deep. As can be seen, the TMD consists of an outer
frame which rests on the floor, connecting elements, and an inner frame. Four springs and a
damping element, which were designed by the 3M Company, connect the outer frame to the inner,
mass carrying frame. The inner frame can hold a number of 10 Ib steel plates which provide the
mass for the TMD. Three of these prototype TMDs were provided and used in the research, which
is described in following chapters.
33
TMD Mass
Damping Element
Spring
10 lb Plates
Inner Frame
Outer Frame
Figure 2.4 Tuned Mass Damper
34

CHAPTER 3
EXPERIMENTAL USE OF TUNED MASS DAMPERS ON A
LABORATORY FLOOR
3.1 Description of Laboratory Test Floor
A laboratory test floor at the Virginia Tech Structures Laboratory was utilized for initial
testing of the performance of the prototype tuned mass dampers. This floor was designed to
simulate floor vibrations of light-weight office floors. The following sections will describe the
floor’s physical and vibrational characteristics.
3.1.1 Physical Characteristics
The laboratory floor is a single bay supported at four corners by 8 in. diameter steel pipe.
The floor measures 25 ft by 15 ft with W14x22 girders spanning 15 ft. The 16K4 joists span 25 ft
between the girders and are spaced 30 im. on center. The lightweight concrete slab, which is
supported by 1.0C metal deck, has a total thickness of 3% in. Figure 3.1 shows a plan and section
view of the floor.
Hanagan (1994) designed and built the laboratory floor. Hanagan determined actual
member and material properties, and detailed this in her dissertation. From load tests of the joists,
the actual moment of inertia was determined to be 80.1 in’. This moment of inertia is used in all
calculations of this study. The average concrete weight was determined to be 115.7 pcf, and the
concrete’s average strength to be 4100 psi at 10 days. Through static load tests, Hanagan
35

16K4 Joists @ 30" O.C. 15'- oO" W 14x22
Girder (typ)
Ay | VA a
J 8 in. Pipe (typ 25'- 0" 4
Plan - Laboratory Floor
Lightweight Concrete
1.0C Metal Deck
16K4 Steel Joist
2 1/2" 1"
2 1/2"
W 14x22 Girder
Roller Support
8" Pipe Column
\ a Concrete Anchor
Section A-A
Figure 3.1 Plan and Section of the Laboratory Test Floor
36
determined that the girders acted non-compositely. This information was utilized when modeling
the floor for the computer structural analysis program, SAP90 v. 6.0 (Wilson and Habibullah
1995).
3.1.2 Vibration Characteristics
Vibration characteristics of the floor were determined by floor acceleration measurements,
and by results from finite element analysis using the computer program, SAP90.
3.1.2.1 Floor Frequency
Floor frequency was measured at several locations on the floor. At the center of the floor,
the fundamental mode of vibration dominated at a frequency of 7.375 Hz. At the center of an
exterior joist, the second mode of vibration dominated at a frequency of 9.375 Hz. A third mode of
vibration occurred at a frequency of 16.75 Hz.
The 16.75 Hz frequency is above the frequency range that is considered annoying to
humans; however, since the amplitude of the 16.75 Hz mode of vibration is relatively strong as
compared with the first mode of vibration, 1t was decided that a TMD would be designed to control
this mode of vibration, as well as the first and second modes of vibration. It was also desired to
determine whether two or three modes of vibration could be effectively controlled by TMDs.
3.1.2.2 Floor Damping Ratio
Heel drops were performed on the laboratory floor before placement of the TMDs. FFTs
of the acceleration data from the heel drops on the bare floor provided plots in the frequency
domain. With information from the frequency domain plots, Equation 2.2 was used to determine
the damping ratio of the floor.
37

With the heel drop located at the center of the floor and the acceleration measured at the
center of the floor, the damping ratio was calculated to be 1.6% for the first mode of vibration.
The damping contributed by the person performing the heel drop was considered negligible. With
the heel drop performed and acceleration measured at the center of an exterior joist, the damping
ratio for the second mode of vibration was determined to be 2.3%. From the same acceleration
data, the damping ratio for the third mode of vibration was determined to be 1.3%.
3.1.2.3 Other Vibration Characteristics Determined Using SAP90
The structural analysis program, SAP90, was used to determine the mode shapes and the
effective SDOF system mass for the modes of vibration. The SAP90 model used frame elements to
model the joists and girders, and plate elements to model the concrete floor. All of the model
elements were placed in a single plane. Appendix A contains calculations performed to determine
the section properties used in the model. Plate elements have dimensions of 30 in. by 30 in. This
resulted in 77 spatial coordinates, which gives the model the appearance of a grid. Details of the
model can be seen in Figure 3.2. The input for the model can be found in Appendix B.
Hanagan (1994) reported vertical motion of the corner supports of the laboratory floor.
She determined that in order to have a more realistic model of the floor, the corners of the floor
needed to have vertical spring supports. Spring stiffness was adjusted so that the frequency of the
first mode of vibration was approximately 7.3 Hz. With vertical motion restrained at the corners
of the model, the first natural frequency was 8.47 Hz. With vertical springs added to the support,
the first natural frequency was 7.35 Hz, which compares well with the actual measured frequency
of 7.375 Hz.
38

> girder
71
64 exterior
57 joist
50
43 La interior
joist
36
29
plate
22 aan element
30"x30" 15 ( )
8 Frame Elements | _Iy (in*)_ _Area (in?)__ Weight (b/in?) E (psi)
Girder 199 6.49 0.2825 29E10° Exterior Joist 166 1.218 0.4789 29E10° Interior Joist 171.8 1.218 0.4789 29E10°
Plate Elements_|_ Bending Thickness (in) _ Weight (Ib/in*) E (psi)
3 0.08332296 2.63E10° Figure 3.2 SAP90 Model of the Laboratory Floor
39

mode shapes
An eigenvalue analysis of the floor using SAP90 resulted in the natural frequencies of the
floor and the corresponding mode shapes. The first six mode shapes and the corresponding natural
frequencies are shown in Figure 3.3. The three measured frequencies correlated well with the
SAP90 frequencies for the first, second, and fourth modes of vibration. It should be noted that
when the SAP90 model had the four corners restrained, the shapes for modes 3 and 4 were
reversed (i.e. Figure 3.3 mode 4 became the mode 3 shape, and Figure 3.3 mode 3 became the
mode 4 shape). The reason for the vertical corner springs in the model was to gain a better
reflection of actual conditions and match the first natural frequency with the measured first
frequency of the floor. The mode shapes corresponding with measured frequencies were verified
by floor vibration measurements. The frequencies of 7.375 Hz and 9.375 Hz correspond with
Figure 3.3 mode | shape and mode 2 shape, respectively. The frequency of 16.75 Hz corresponds
with the mode 4 shape of Figure 3.3.
Measuring acceleration at several locations on the floor, and looking at FFTs of
acceleration traces, gave an indication of which mode shapes correspond to each frequency. When
acceleration measurements were recorded at a mode shape node (i.e. no vertical displacement), a
FFT of the data showed a small or zero peak amplitude at the frequency corresponding with that
mode of vibration. Where the mode 4 shape has nodes, FFTs of actual acceleration at those
locations showed little or no peak amplitude at a frequency of 16.75 Hz. When acceleration
measurements were recorded at locations of peak displacement for a mode of vibration, a FFT of
the data resulted in the largest peak amplitude for the frequency corresponding, with the particular
mode of vibration. At locations of peak displacement for the mode 4 shape, the frequency
amplitude for 16.75 Hz was at its peak. Other floor acceleration measurements did not indicate a
40
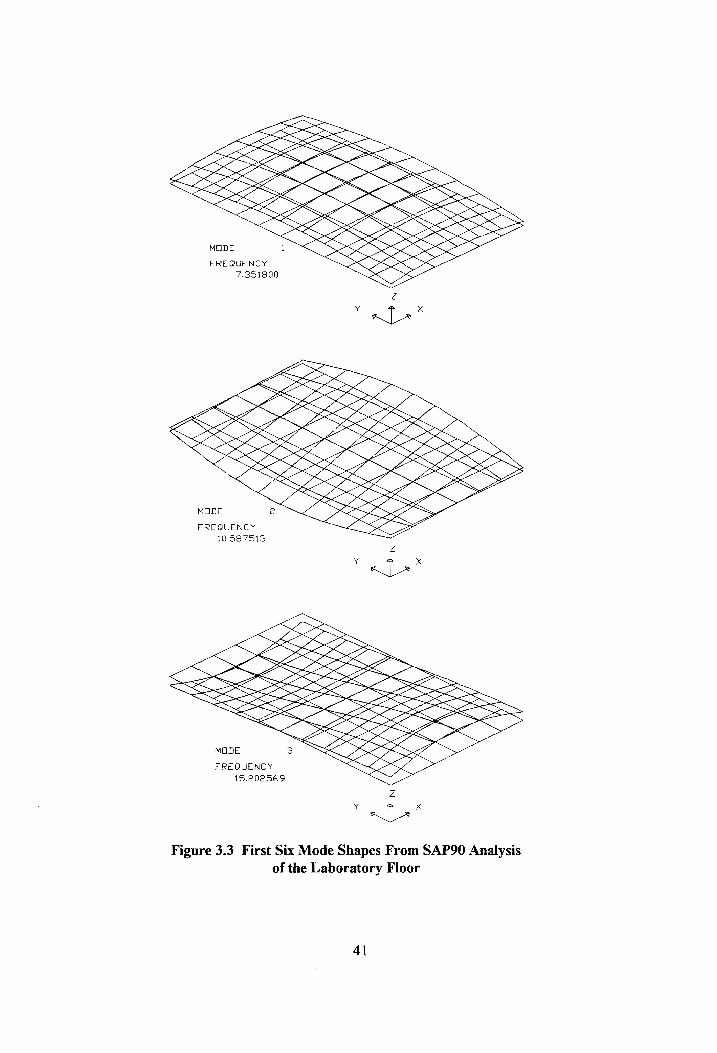

Q (\
JNA AY
(YW) Af
AK AXA
JANN AN
WR CY”
OOK
* RMI
AYN
oc AANR
NNIYAAN SMARIMAY
AKA ANY
SRR
VOR
AIR OU
MARA? -
AR
AND
NO) NY
Aa AY
AWA NOW.
ANY.
hy. IY
8 VAXAY
"LF Wry
. YO
zs WY
a8 Wy y
26 WV
ae Woe
WAS gee
Wo y
aa
42
Figure 3.3 First Six Mode Shapes of the Laboratory
Floor, continued

strongly perceptible frequency that corresponded with the mode 3 shape of Figure 3.3. From this
point forward, the first three modes of vibration will refer to the frequencies of 7.375, 9.375, and
16.75 Hz and their respective vibrational mode shapes 1, 2, and 4 from Figure 3.3.
3.2 Design of Tuned Mass Dampers
Three TMDs, one for each of the first three modes of vibration, were designed by the 3M
Company. Using the design equations given in Chapter 2, the required mass, stiffness, and
damping coefficient were determined. Appendix C contains calculations of TMD1 properties for
the laboratory floor. These calculations are similar for each initial TMD design. Table 3.1
summarizes the input and results of the required TMD properties for the first three modes of
vibration.
3.3. Installation of Tuned Mass Dampers
The tuned mass dampers were located at peaks of maximum displacement for their
respective modes of vibration. TMD1 was located at the center of the floor to control the first
mode of vibration. TMD2, to control the second mode of vibration, was placed at the center of one
of the edge joists, and TMD3, to control the third mode of vibration, was placed at the center of the
opposite edge joist.
To determine changes in floor vibration frequency and behavior using a TMD, heel drops
were performed on the floor before and after a TMD was in place. The force of the heel drop was
considered constant, and acceleration and frequency graphs were compared in order to determine if
a TMD was optimally tuned for a particular floor frequency.
TMD1, the first TMD to be placed on the floor, was initially placed on a stiff surface and
tuned to the proper frequency before placing it on the floor. To tune the TMD, stiffness and
43

Table 3.1 Laboratory Floor and Initial TMD Parameters
Mode ] 2 3 Remarks
f (Hz) 7.375 9.375 16.75 measured
Wr (Ib) 6398 2641 1809 analysis via SAP90
wr (Ib) 365 235 145 __|chosen by 3M - gives acceptable wu
LL 0.0570 | 0.0890 | 0.0802 Equation 2.3
foptimal (Hz) 6.98 8.6] 15.51 Equation 2.14
Coptimal (Yo) | 9.1346 | 0.1607 | 0.1544 Equation 2.15
fp (Hz) 6.91 8.50 15.32 Equation 2.11
k (Ib/in) 1782 1733 3477 Eqns. 2.11 and 2.6
Cc 11.14 10.58 11.29 Egns. 2.9 and 2.10
Table 3.2 Laboratory Floor and Final TMD Parameters
Tuned Mass Dampers Remarks
TMD1 TMD2 | TMD3 | TMDla
f(Hz) 7.375 9.375 16.75 7.375
wr (Ib) 6398 2641 1809 6398
Wr (Ib) 365 315 165 445 (plates x 10)+75Ib
plates 29 24 9 37
UL 0.0570 } 0.1193 0.0912 || 0.0696 Equation 2.3
ks (Ib/in) 1164 1892 2916 1164
kd (Ib/in) 414 885 1496 414 (G'A)/t
ks+kd = ky 1578 2777 4412 1578
fitwp (Hz) 6.50 9.29 16.18 5.89 Equation 2.5
Cr 10.13 15.16 14.72 11.18 ka/@ntTwp
Cr (%) 0.1312 | 0.1593 0.1695 0.1312 | Egns. 2.8 and 2.9
fora (Hz) 6.45 9.17 15.94 5.84 Equation 2.10
G' (psi) 46 59 68 46
eta 1 ] ] 1
t (in) 0.5 0.5 0.15 0.5
A (in’2) 4.5 75 3.3 4.5
note: any property in bold was measured or constant
44
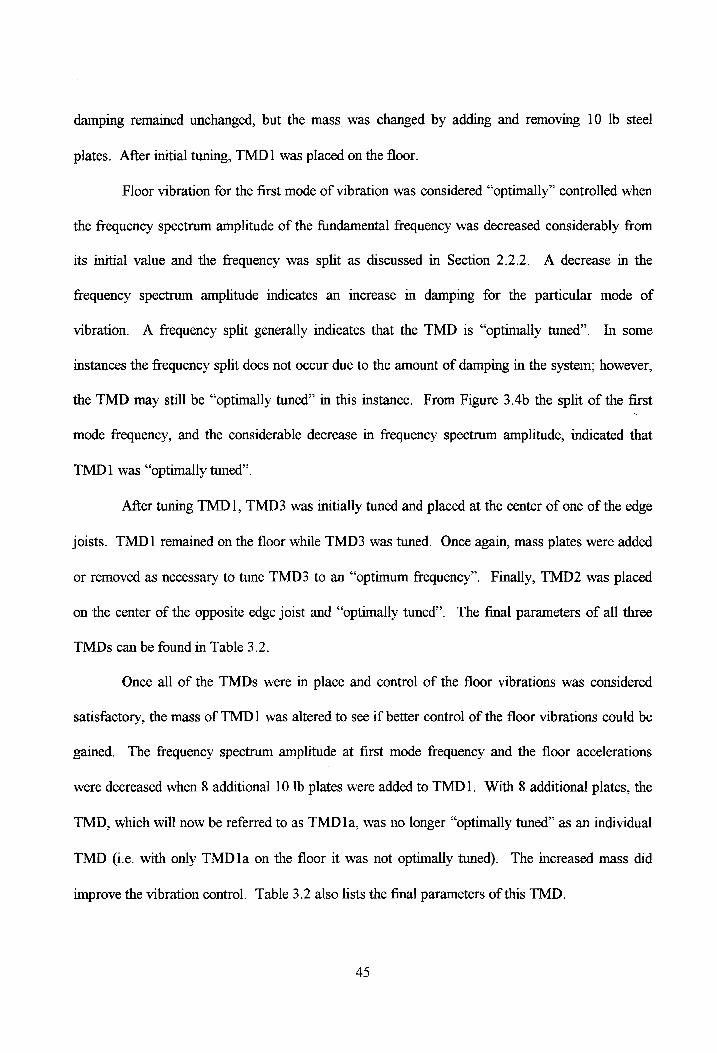
damping remained unchanged, but the mass was changed by adding and removing 10 Ib steel
plates. After initial tuning, TMD1 was placed on the floor.
Floor vibration for the first mode of vibration was considered “optimally” controlled when
the frequency spectrum amplitude of the fundamental frequency was decreased considerably from
its initial value and the frequency was split as discussed in Section 2.2.2. A decrease in the
frequency spectrum amplitude indicates an increase m damping for the particular mode of
vibration. A frequency split generally indicates that the TMD is “optimally tuned”. In some
instances the frequency split does not occur due to the amount of damping in the system; however,
the TMD may still be “optimally tuned” in this instance. From Figure 3.4b the split of the first
mode frequency, and the considerable decrease in frequency spectrum amplitude, indicated that
TMD1 was “optimally tuned”.
After tuning TMD1, TMD3 was initially tuned and placed at the center of one of the edge
joists. TMD1 remained on the floor while TMD3 was tuned. Once again, mass plates were added
or removed as necessary to tune TMD3 to an “optimum frequency”. Finally, TMD2 was placed
on the center of the opposite edge joist and “optimally tuned”. The final parameters of all three
TMDs can be found in Table 3.2.
Once all of the TMDs were in place and control of the floor vibrations was considered
satisfactory, the mass of TMD1 was altered to see if better control of the floor vibrations could be
gained. The frequency spectrum amplitude at first mode frequency and the floor accelerations
were decreased when 8 additional 10 lb plates were added to TMD1. With 8 additional plates, the
TMD, which will now be referred to as TMD 1a, was no longer “optimally tuned” as an individual
TMD (ic. with only TMD 1a on the floor it was not optimally tuned). The imcreased mass did
improve the vibration control. Table 3.2 also lists the final parameters of this TMD.
45
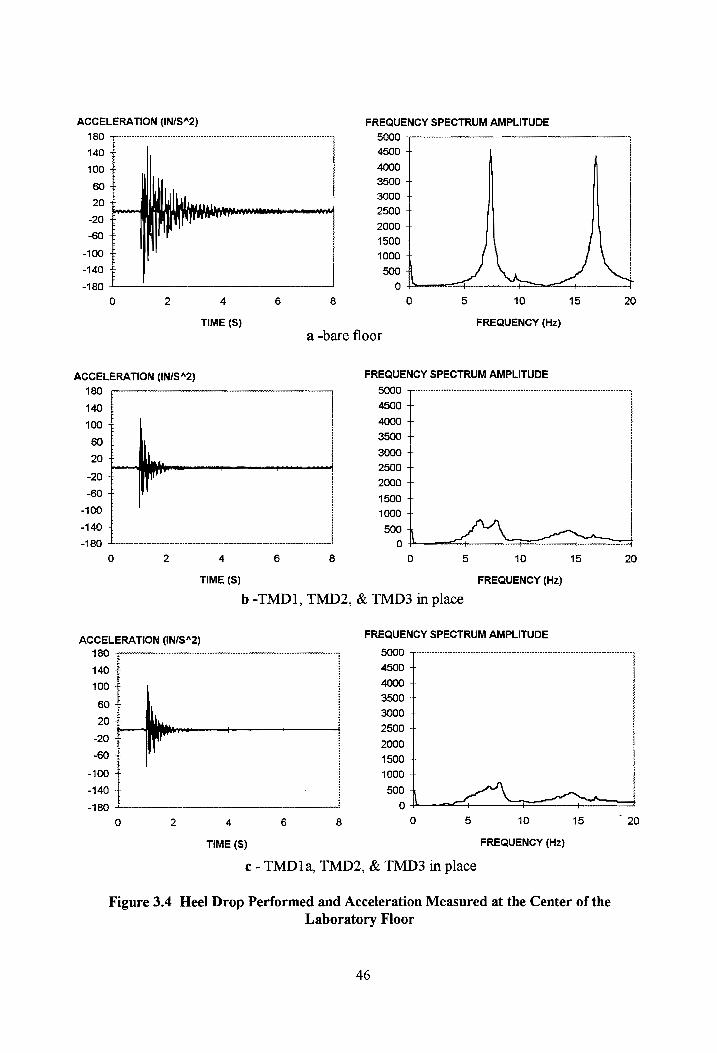
ACCELERATION (IN/S“2) FREQUENCY SPECTRUM AMPLITUDE
180 + 5000 140 + 4500 +
100 4000 +
60 + 3500 + 20 + 3000 +
p 2500 + 20 2000 + 60 + 41500 +
-100 + 1000 + -140 + 500 1 -180 + 0 + +-— 7
0 2 4 6 8 0 5 10 15 20
TIME (S) FREQUENCY (Hz) a -bare floor
ACCELERATION (IN/S42) FREQUENCY SPECTRUM AMPLITUDE 180 + 5000 140 + 4500 +
400 £ 4000 + 60 + 3500 + 20 + 3000 +
| f 2500 + 20 + 2000 + “60 I 1500 +
-100 + 4000 |
“140 t $00 4 OPN A -180 0 \ + ;
0 2 4 6 8 0 5 10 15 20
TIME (S) FREQUENCY (Hz)
b -TMD1, TMD2, & TMD3 in place
ACCELERATION (IN/S*2) FREQUENCY SPECTRUM AMPLITUDE
180 + 5000 140 + 4500 + 100 + 4000 + 60 + 3500
f 3000 +
20 ‘ a t 2500 +
“20 2000 + “60 + 1500 +
-100 + 1000 + -140 + 500 ON -180 + 0 é' : al
0 2 4 6 8 0 5 10 15 20
TIME (S) FREQUENCY (Hz)
c- TMD1a, TMD2, & TMD3 in place
Figure 3.4 Heel Drop Performed and Acceleration Measured at the Center of the
Laboratory Floor
46
3.4 Evaluation of Tuned Mass Damper Effectiveness
To evaluate TMD effectiveness, acceleration data from heel drops and a person walking
parallel or perpendicular to the joists were compared. Frequency plots resulting from heel drops
reflected the decrease in amplitude and any frequency splits that might have occurred.
3.4.1 Heel Drop Excitation
In Figure 3.4 the first and third modes of vibration were excited by a heel drop impact. In
Figure 3.5 the first three modes of vibration were excited; however, the second and third
frequencies were of major concern when looking at these graphs.
With TMD1, TMD2, and TMD3 in place, the increase in damping and control of the floor
vibrations can be seen from Figure 3.4a and b, and Figure 3.5a and b. In Figure 3.4 the frequency
split can be seen for the first frequency; indicating optimum control of that mode of vibration.
With additional mass added to TMD1, i.e. TMD1la, improved control of the floor
vibrations appears to have occurred. This was not apparent from the heel drop acceleration data or
frequency plots of Figures 3.4c and 3.5c; however, walking acceleration data reflected improved
control of the floor vibrations with the added mass of TMD 1a.
3.4.2, Walking Excitation
Figure 3.6 shows walking acceleration plots of the floor with and without the TMDs in
place. The root mean square (RMS) of the data over the total time interval was determined and
was used to compare the change in overall acceleration from one floor condition to another. The
47
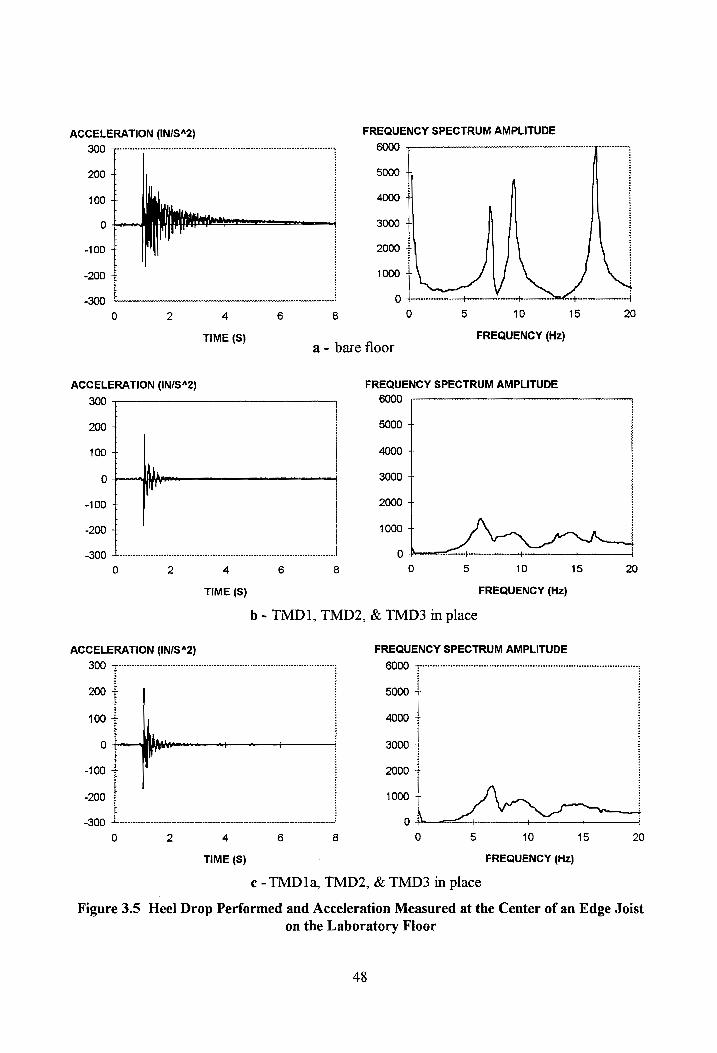
ACCELERATION (IN/S“2) FREQUENCY SPECTRUM AMPLITUDE
300 + : 6000
200 + 5000 |
100 4000 +
0 | 3000 +
-100 2000 -
-200 i 1000 -
-300 0 + +
0 2 4 6 8 0 5 10 15 20
TIME (S) FREQUENCY (Hz) a- bare floor
ACCELERATION (IN/S“2) FREQUENCY SPECTRUM AMPLITUDE 300 6000
200 { 5000 4
100 + 4000 +
0 , aaa 3000 +
-100 i 2000 +
200 + 1000 + DNA IO
-300 Oo} + 4 , 0 2 4 6 8 0 5 10 15 20
TIME (S) FREQUENCY (Hz)
b- TMD1, TMD2, & TMD3 in place
ACCELERATION (IN/S“2) FREQUENCY SPECTRUM AMPLITUDE 300 6000
200 + : 5000 +
100 + 4000 +
0 + wt = 3000 +
-100 + 3 2000 +
my 100 Noe -300 + : o A —+ 4 j
0 2 4 6 8 0 5 10 15 20
TIME (S) FREQUENCY (Hz)
¢-TMD1a, TMD2, & TMD3 in place
Figure 3.5 Heel Drop Performed and Acceleration Measured at the Center of an Edge Joist on the Laboratory Floor
48
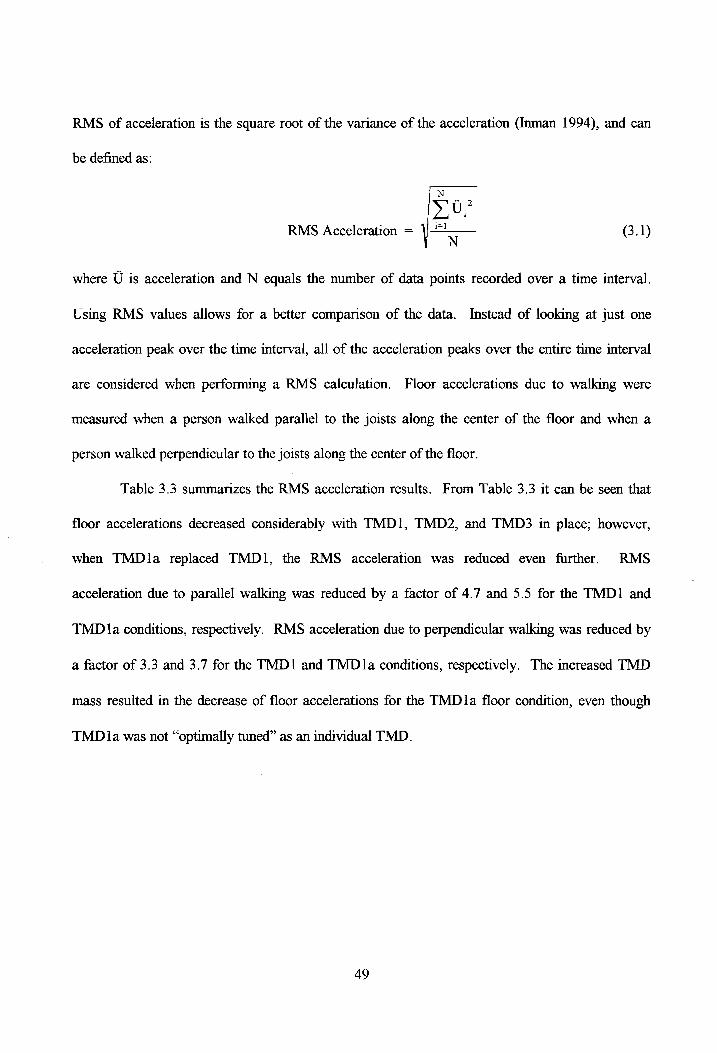
RMS of acceleration is the square root of the variance of the acceleration (Inman 1994), and can
be defined as:
RMS Acceleration = (3.1)
where U is acceleration and N equals the number of data points recorded over a time interval.
Using RMS values allows for a better comparison of the data. Instead of looking at just one
acceleration peak over the time interval, all of the acceleration peaks over the entire time interval
are considered when performing a RMS calculation. Floor accelerations due to walking were
measured when a person walked parallel to the joists along the center of the floor and when a
person walked perpendicular to the joists along the center of the floor.
Table 3.3 summarizes the RMS acceleration results. From Table 3.3 it can be seen that
floor accelerations decreased considerably with TMD1, TMD2, and TMD3 in place; however,
when TMD1ia replaced TMD1, the RMS acceleration was reduced even further. RMS
acceleration due to parallel walking was reduced by a factor of 4.7 and 5.5 for the TMD] and
TMD tla conditions, respectively. RMS acceleration due to perpendicular walking was reduced by
a factor of 3.3 and 3.7 for the TMD1 and TMD 1a conditions, respectively. The increased TMD
mass resulted in the decrease of floor accelerations for the TMD 1a floor condition, even though
TMD 1a was not “optimally tuned” as an individual TMD.
49
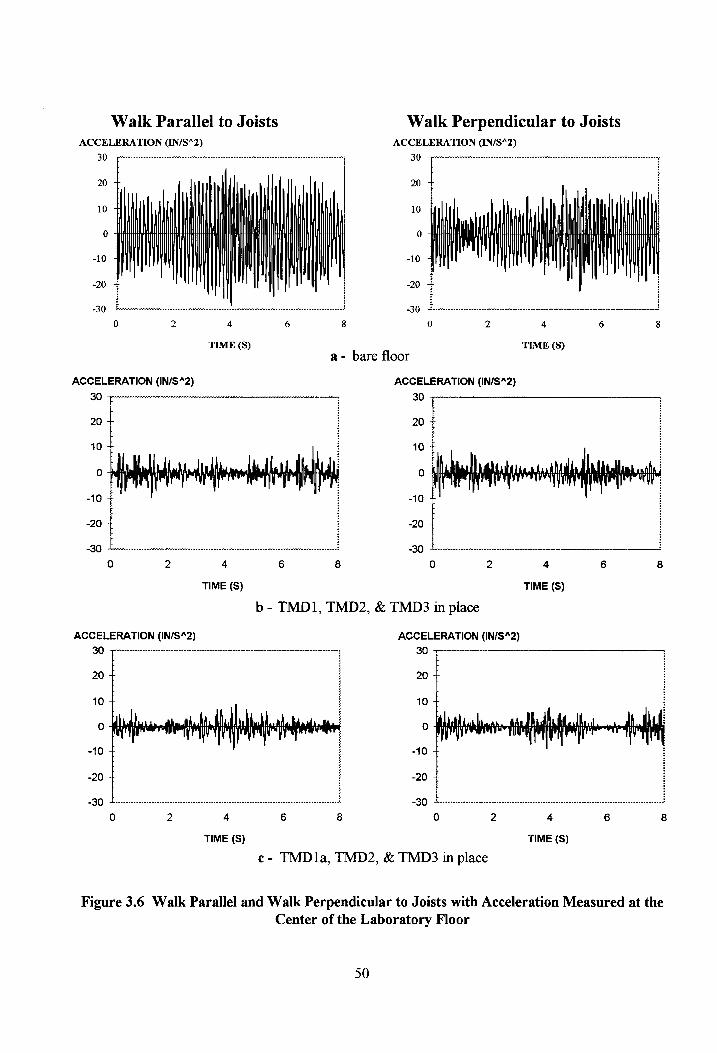
Walk Parallel to Joists
Walk Perpendicular to Joists
ACCELERATION (IN/S*2) ACCELERATION (IN/S*2)
30 4 30 +
20 20 +
; HME ‘ | SA eh MI BL MTA TATU PAE PTA NE DE A -10 -10 -
-20 -20 +
-30 -30 +
0 2 4 6 8 0 2 4 6 8
TIME (S) TIME (S) a- bare floor
ACCELERATION (IN/S“2)
ACCELERATION (IN/S*%2)
30 + 30
20 t 20
10
0
-10
-20 + -20
-30 -30
0 2 4 6 8 0 2 4 6 8
TIME (S) TIME (S)
b- TMD1, TMD2, & TMD3 in place
ACCELERATION (IN/S“2) ACCELERATION (IN/S*2)
30 + 30
20 + 20
410 + 10
-10 t -10
-20 + -20
-30 -30
0 2 4 6 8 0 2 4 6 8
TIME (S) TIME (S)
c- TMDl1la, TMD2, & TMD3 in place
Figure 3.6 Walk Parallel and Walk Perpendicular to Joists with Acceleration Measured at the Center of the Laboratory Floor
50

Table 3.3 RMS Acceleration and Ratios of Uncontrolled vs. Controlled
for the Laboratory Floor
Walking Direction Bare Floor | TMD1,2,3 |Ratio || TMD 1a,2,3 |Ratio
RMS RMS RMS
Parallel to Joists 12.24 in/s”|| 2.61 in/s’ | 4.69 | 2.24 in/s’ | 5.46 Perpendicular to Joists | 8:23 -in/s” | 2.50 in/s’ | 3.29 | 2.22 in/s’ | 3.71
5]

CHAPTER 4
EXPERIMENTAL USE OF TUNED MASS DAMPERS ON AN OFFICE FLOOR
4.1 Description of Office Floor
Several bays on the second floor of an occupied two-story office building were reported to
have annoying levels of floor vibration. Experimental tests to control the vibrations using the
previously described tuned mass dampers were performed on three of the bays. Engineers from the
3M Company participated in the testing.
The three bays have measured fundamental frequencies between 4 and 5 Hz, which is
about twice the excitation frequency of a person walking or running. Using the half power method
on FFTs of acceleration data, the damping ratio for the fundamental mode of vibration for each
bay was found to be approximately 5%. Because the higher frequencies were close to one another
and the floor had a relatively high damping ratio, it was not possible to calculate the damping ratio
of the second and third modes of vibration of the bays. Comparing the 5% damping ratio with
damping ratios of other floors on which TMDs have been used (see Table 1.1), a damping ratio of
5% is relatively high. According to Bachmann, et al. (1995), a TMD is more effective if the
damping ratio of the floor is relatively small. TMDs were used to control vibrations on three of the
bays, and TMDs were left in place for one week on the third bay to gain occupant feedback
concernng TMD performance. The test results are presented in the following sections, and
summarized in Section 4.6.
Each of the bays varies in size and configuration. Only the floor slab properties are the
same for each bay. The normal-weight concrete slab is supported by 0.6C metal deck and has a
52

total thickness of 2% in. The physical characteristics of each bay will be further described in the
following sections.
4.2 Modification of Tuned Mass Dampers
The 3M Company engineers used a fundamental frequency of 4.8 Hz and a secondary
frequency of 7.2 Hz to determine the initial design parameters for the prototype TMDs (see Section
2.2.2). Their analysis of the bays resulted in initial equivalent SDOF floor weights of 19,090 lbs
and 13,632 lbs for the 4.8 Hz and 7.2 Hz frequencies, respectively. Table 4.1 summarizes the
input and initial TMD parameter results. TMD1-+ represents two prototype TMDs, sitting side-by-
side, used to control the first mode of vibration.
Table 4.2 summarizes the spring and damping element configurations used on the TMDs.
Two of the three laboratory TMDs were modified to control the office floor vibrations.
Modifications were made to the damping elements and springs, so that the TMDs could be tuned to
the various floor fundamental frequencies. Configurations A, B, and C in Table 4.2 were used in
TMDs to control the first mode of vibration of the office floor bays. Configuration D was used to
control a second or third mode of vibration of a bay. Configurations A, B, C, and D could be
implemented in either one of the two TMDs to suit the specific needs of each bay. Configuration E
is the TMD1 configuration used for the laboratory floor. The springs and damping element of the
laboratory floor TMD1, which was originally tuned to a frequency of approximately 7 Hz, were
left unchanged. The laboratory TMD1 was used to control the higher modes of vibration of the
office floors.
53

Table 4.1 Initial TMD Parameters
TMD1 | TMD1+ | TMD2 Remarks
f (Hz) 4.8 48 7.2 measured
We (Ib) 19090 19090 13632 determined by 3M
wr (Ib) 365 775 445 __ {chosen by 3M - gives acceptable p
UL 0.0191 0.0406 | 0.0326 Equation 2.3
footimal (Hz) 4.71 461 6.97 Equation 2.14
Coptimal (%) 0.0823 0.1162 | 0.1054 Equation 2.15
fp (Hz) 4.69 4.58 6.93 Equation 2.11
k (Ib/in) 822 1662 2186 Eqns. 2.11 and 2.5
c 4.60 13.51 10.64 Eqns. 2.9 and 2.10
f = frequency foptimal = Optimal TMD frequency
We = floor weight Coptimal = Optimal TMD damping ratio wr = TMD weight fp = damped frequency
cm = TMD-to-floor mass ratio k = stiffness AC i c = damping coefficient
Table 4.2 TMD Spring and Damping Element Parameters
Configuration
A B C D E
ks (Ib/in) 720 788 788 1182 1164
kd ([b/in) 138 420 138 420 414
ks+kd = ky 856 1208 926 1602 1578
G' (psi) 40 40 40 40 46
eta ] ] ] ] 1
t (in) 0.5 0.5 0.5 0.5 0.5
A (in’2) 1.72 5.25 1.72 5.25 4.5
ks = spring stiffness eta = loss factor for viscoelastic material kd = damper stiffness t = damping element thickness
G’ = shear storage modulus A = X-sectional area of damping element
54

4.3 Bay 1
This bay borders an exterior wall and is not adjacent to any other bay in which annoying
floor vibrations were reported. Located in this bay are several cubicles separated by movable
partitions. Main walkways through this bay run adjacent to the exterior wall, in a north-south
direction, and perpendicular to the joists along the centerline of the bay, in an east-west direction.
Figure 4.1 shows a plan view of Bay 1 and some of the adjacent floor area. Framing for Bay 1
consists of 20H6 joists spaced 3 ft on center. The joists span 30 ft between W24x76 girders,
which also span 30 ft.
4.3.1 Vibration Characteristics
To determine the vibration characteristics of this bay, motion was initiated in neighboring
bays as well as in the bay itself. The strongest floor response occurred when motion was initiated
in the bay itself. Motion initiated in bays to the north and south of Bay 1 was barely perceptible in
Bay 1; however, motion initiated in the bay just west of Bay 1 resulted in perceptible vibrations in
Bay 1. It should be noted that the three bays directly west of Bay 1 have exactly the same type of
joists and joist spacing. Without a variance in joist stiffness or spacing, this floor plan contributes
to floor vibrations occurring in a wave-like motion transverse to the supporting members, as
described in Chapter 2. This wave-like motion occurred in Bay 1, but wave-like motion was
diminished by a full-height partition transverse to the joists and located in the bay adjacent to Bay
1. As a result, the reported floor measurements and computer analysis focus on Bay 1, and not on
the neighboring bays and their effects on Bay 1.
55

, 30'-0" |
1 A indicates main
walking aisle
20H6 Joists
W24x76
Girder (typ)
W24x76 Girder (typ) 30'-0"
Exterior Wall
Figure 4.1 Plan View of Bay 1
56

4.3.1.1 Measured Vibration Characteristics
Fast Fourier Transforms of heel drop acceleration data were used to determine the natural
frequencies of the bay. At the center of the bay, the fundamental mode of vibration dominates at a
frequency of 5 Hz. The damping ratio for the fundamental mode of vibration is approximately 5%.
Other dominant frequencies, determined at various locations in the bay, are 5.75 Hz, 6 Hz, and 8
Hz. The location at which the largest response corresponding with these frequencies occurs is at
the center of the edge joist bordering the bay west of Bay 1. Figure 4.2 shows the acceleration and
FFT of the acceleration response at the center of the edge joist when a heel drop was performed at
the center of the bay. From the figure, it can be seen that the system has significant damping, but
there is still considerable energy in the higher modes, i.e. 5.75 Hz to 8 Hz.
4.3.1.2 Analytically Determined Vibration Characteristics
To analytically determine the vibration characteristics of this bay, SAP90 was utilized.
The bay model was prepared in a manner similar to the laboratory floor model described in
Chapter 3. The model consists of frame and plate elements in a single plane and has 121 spatial
coordinates. The plate elements have dimensions of 36 in. by 36 in. Figure 4.3 shows the model
layout and properties of the frame and plate elements used in the final variation of the model. The
SAP90 input for the final variation of the model is found in Appendix D.
Several variations of the model were studied to determine which model best reflected the
actual floor vibration characteristics. Table 4.3 summarizes the variations of the models and the
first four natural frequencies resulting from each model. Model NC, the most basic model,
considered only the mass of the bay and the mass of neighboring bays, which is carried by the
girders and edge joist. Model NC used a non-composite joist and girder moments of inertia.
37

ACCELERATION (IN/S“2) 50 40 4 30 +
TIME (S)
FREQUENCY SPECTRUM AMPLITUDE
400
350 +
0 5 10 15 20
FREQUENCY (Hz)
Figure 4.2 Response and FFT of the Response at
the Center of the Edge Joist due to a Heel Drop
at the Center of the Bay 1
58
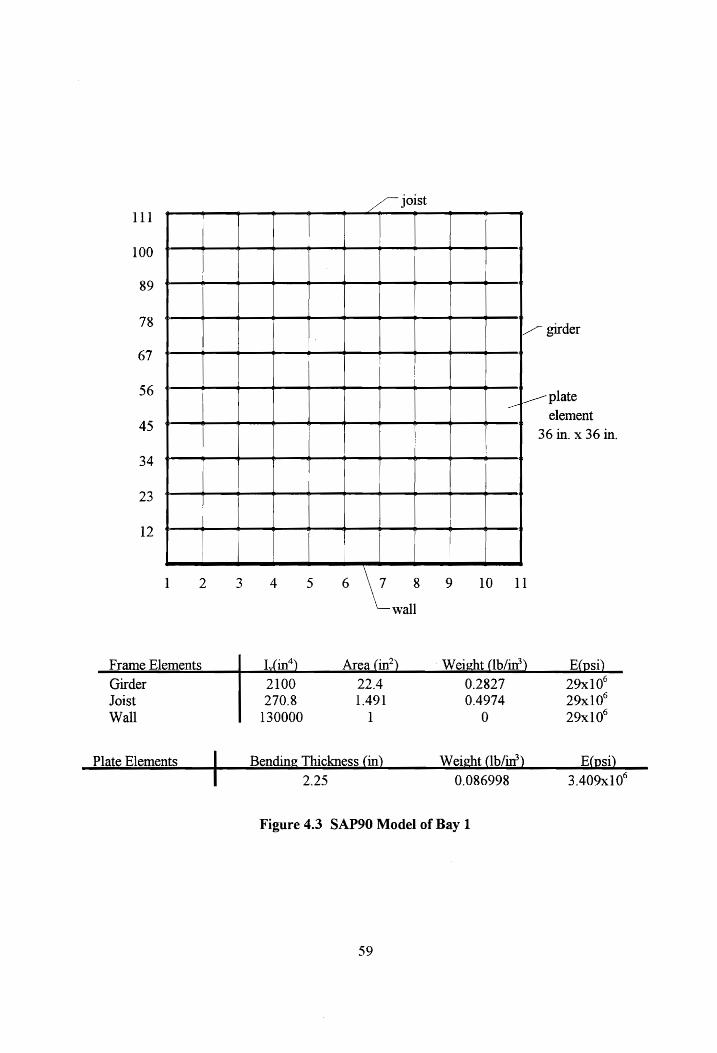
joist 111
100
89
78 La girder
67
56 _|- plate
element
36 in. x 36 in. 45
34
23
12 Ef | ba 3 4s 6 \7 8 9 wo
wall
Frame Elements _| _L fin’) Area (in?) Weight (Ib/in’) __E(psi) Girder 2100 22.4 0.2827 29x10° Joist 270.8 1.491 0.4974 29x10° Wall 130000 1 0 29x10°
Plate Elements | Bending Thickness (in) Weight (Ib/in’) E(psi)
2.25 0.086998 3.409x10°
Figure 4.3 SAP90 Model of Bay 1
59
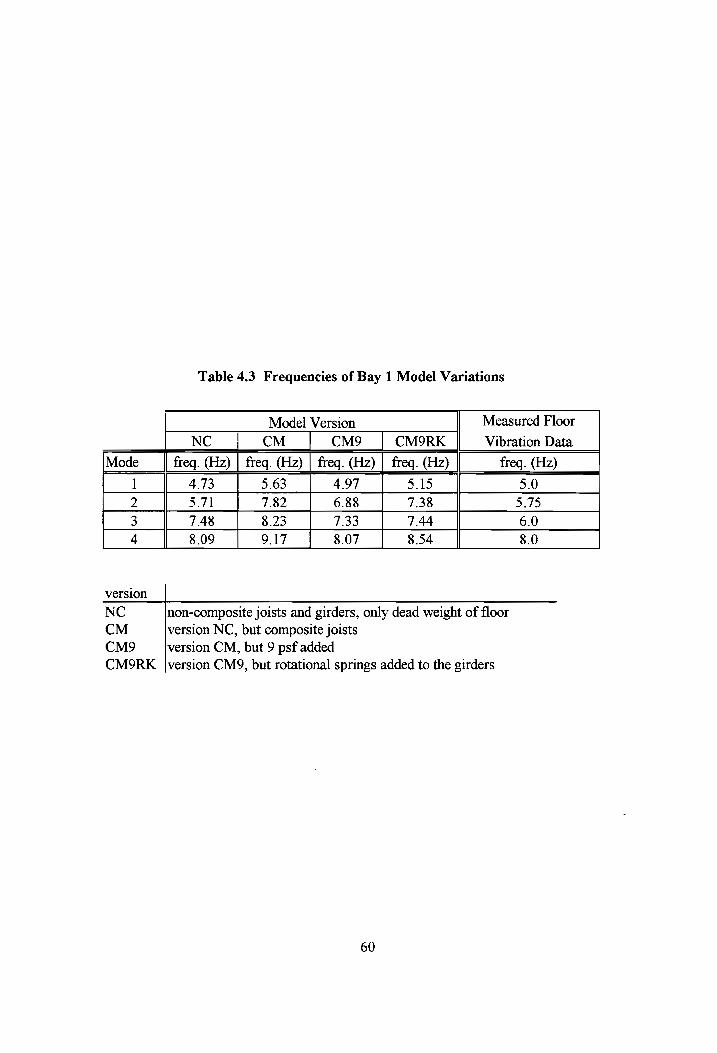
Table 4.3 Frequencies of Bay 1 Model Variations
Model Version Measured Floor
NC CM CM9 CM9ORK Vibration Data
Mode freq. (Hz) | freq. (Hz) | freq. (Hz) | freq. (Hz) freq. (Hz)
1 4.73 5.63 4.97 5.15 5.0
2 5.71 7.82 6.88 7.38 5.75
3 7.48 8.23 7.33 7.44 6.0
4 8.09 9.17 8.07 8.54 8.0
version
NC non-composite joists and girders, only dead weight of floor
CM version NC, but composite joists CM9 version CM, but 9 psf added
CMORK |version CM9, but rotational springs added to the girders
60
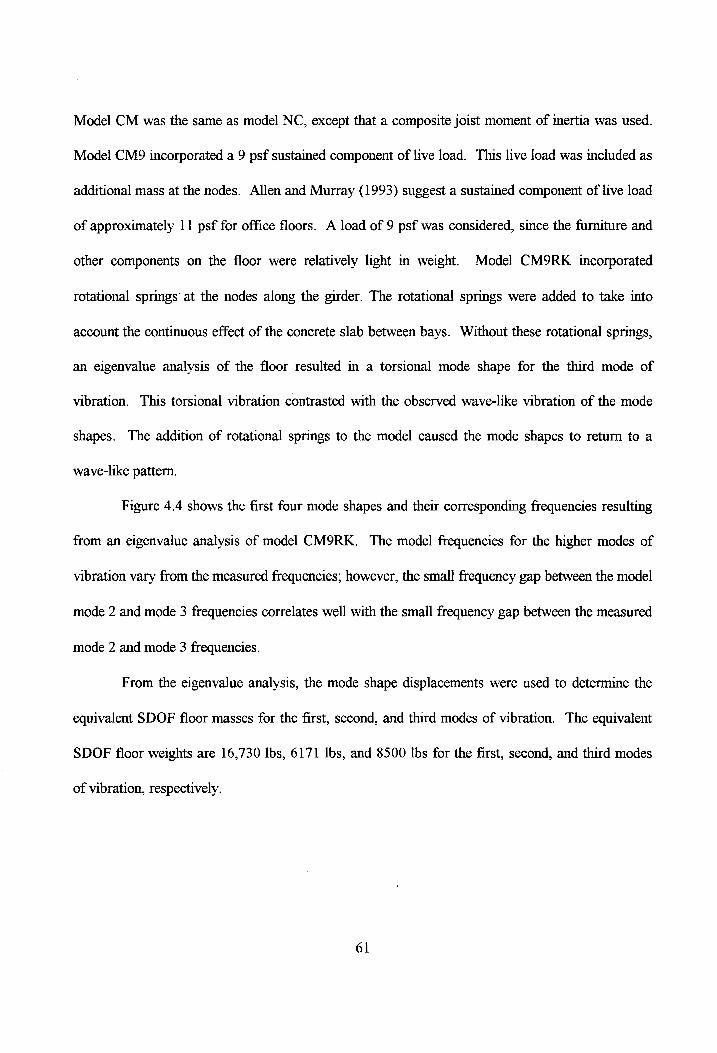
Model CM was the same as model NC, except that a composite joist moment of inertia was used.
Model CM9 incorporated a 9 psf sustained component of live load. This live load was included as
additional mass at the nodes. Allen and Murray (1993) suggest a sustained component of live load
of approximately 11 psf for office floors. A load of 9 psf was considered, since the furniture and
other components on the floor were relatively light in weight. Model CM9RK incorporated
rotational springs at the nodes along the girder. The rotational springs were added to take into
account the continuous effect of the concrete slab between bays. Without these rotational springs,
an eigenvalue analysis of the floor resulted in a torsional mode shape for the third mode of
vibration. This torsional vibration contrasted with the observed wave-like vibration of the mode
shapes. The addition of rotational springs to the model caused the mode shapes to return to a
wave-like pattern.
Figure 4.4 shows the first four mode shapes and their corresponding frequencies resulting
from an eigenvalue analysis of model CM9RK. The model frequencies for the higher modes of
vibration vary from the measured frequencies; however, the small frequency gap between the model
mode 2 and mode 3 frequencies correlates well with the small frequency gap between the measured
mode 2 and mode 3 frequencies.
From the eigenvalue analysis, the mode shape displacements were used to determine the
equivalent SDOF floor masses for the first, second, and third modes of vibration. The equivalent
SDOF floor weights are 16,730 lbs, 6171 lbs, and 8500 Ibs for the first, second, and third modes
of vibration, respectively.
61
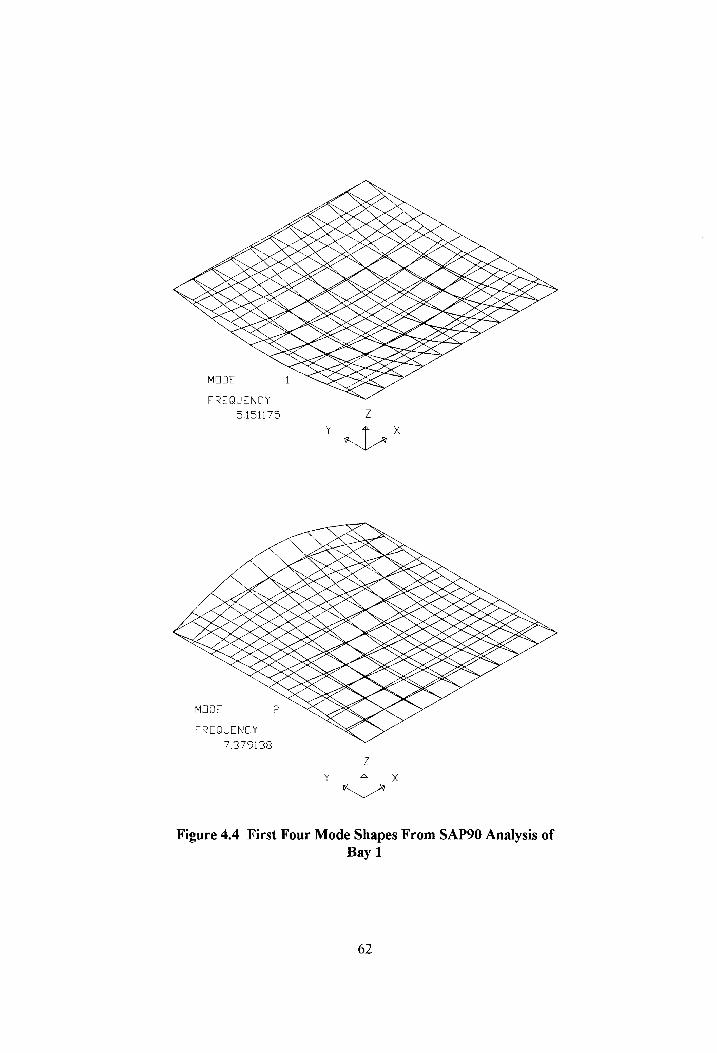
x YY)
NX \
OOK.
A, COON
Couns
OSEAN
SARs
3 LOMA
Wy A MAKAAMAA,
By
My
eis LAK
x) aR
ORO”
SOY
LIM
CEO
2 OOK
OKNOWY aE
CRAY
58 ONY
#6 YOY
EE VKY
ok YOY
og Ee v\
Ky
2 &
62
Figure 4.4 First Four Mode Shapes From SAP90 Analysis of Bay 1
%
i) ee
HANK KAO
ARKO
AWSD
Lay
ANYWAY
RIERA
ARN,
ory AMIR
> EOE
JIRA
«6S ASIA
0 OLR ay
YEA ANAC
ERY
PAEDPIRROY- ONO”
IY
OUR KAY
8 FREQUENCY
Yl Ky) \)
MODE
MODE
/
Figure 4.4 First Four Mode Shapes of Bay 1, continued
63

4.3.2 Installation of Tuned Mass Dampers
Before a TMD was put in place, the TMD was placed near a column, where the floor is
relatively stiff, and tuned to the desired frequency. Once in place, plates were added or removed
until “optimum” control of the floor vibration was gained. Vibrations were considered “optimally”
controlled when the acceleration amplitudes, and frequency spectrum amplitude of the frequency of
concern were reduced as low as possible with the TMD(s).
Several TMD configurations were tested on this bay. One configuration had two TMDs
located at the center of the bay to control the fundamental mode of vibration and a third TMD
located about 8 ft directly north of the other two TMDs. This configuration reduced the
acceleration and appropriate frequency amplitudes; however, another TMD configuration reduced
the walking acceleration amplitudes by approximately 25% when comparing RMS accelerations
resulting from floor responses with the two configurations.
The final configuration used on Bay | had one TMD, TMD1, placed at the center to
control the fundamental mode of vibration and two TMDs, TMD2 and TMD3, located at the
center of the edge joist bordering the bay west of Bay 1. The final parameters of all three TMDs
are in Table 4.4. TMD1 controlled the fundamental mode of vibration, while TMD2 and TMD3
controlled the higher modes of vibration. Due to the high system damping and closely spaced
frequencies of this bay, final “tuning” of the TMDs in place was difficult. The final TMD
frequencies of TMD2 and TMD3 fell between the frequencies of 6 Hz and 8 Hz, and not near an
“optimum” frequency for either mode of vibration.
64
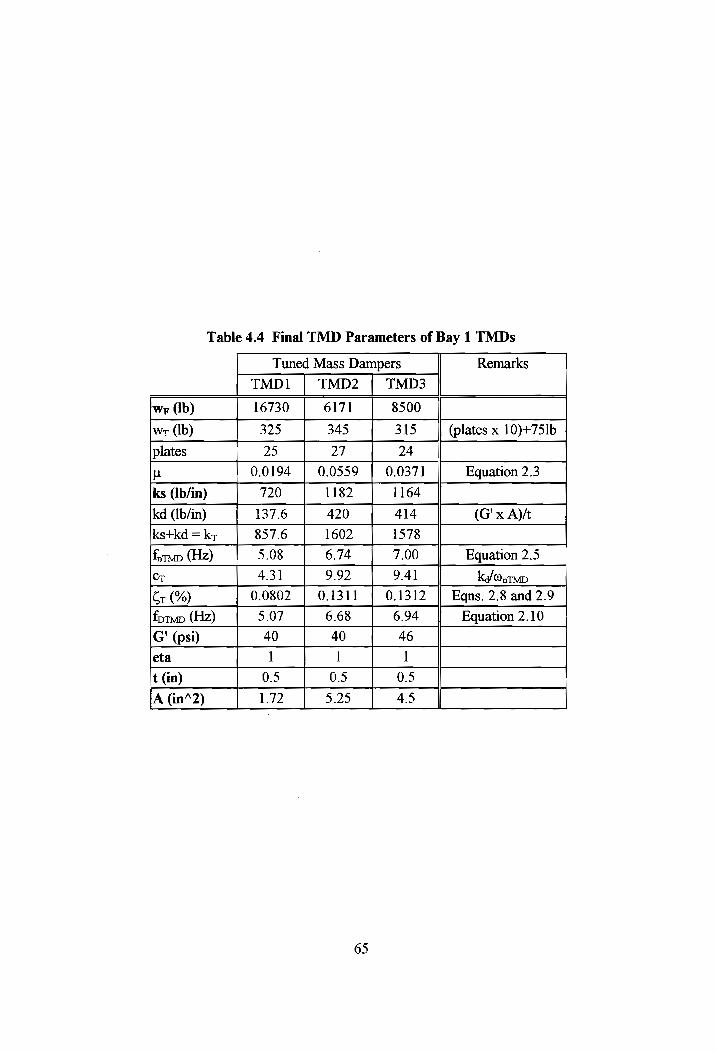
Table 4.4 Final TMD Parameters of Bay 1 TMDs
Tuned Mass Dampers Remarks
TMD 1 TMD2 TMD3
wr (Ib) 16730 | 6171 8500
wr (Ib) 325 345 315 (plates x 10)+751b
plates 25 27 24
Ll 0.0194 | 0.0559 | 0.0371 Equation 2.3
ks (Ib/in) 720 1182 1164 kd (b/in) 137.6 420 414 (G'x Att
ks+kd = ky 857.6 1602 1578
finn (Hz) 5.08 6.74 7.00 Equation 2.5
Cr 431 9.92 9.4] ka/@ amv
Cr (%) 0.0802 { 0.1311 { 0.1312 || Eqns. 2.8 and 2.9 form (Hz) 5.07 6.68 6.94 Equation 2.10
G' (psi) 40 40 46 eta ] ] ]
t (in) 0.5 0.5 0.5
A (in*2) 5.25 45
1.72
65

FREQUENCY SPECTRUM AMPLITUDE
ACCELERATION (IN/S“2) 200 1000 +
150 + 900 + 800 +
100 + 700 + SO + 600 + 0 Ba pen . 500 +
400 + -50 +
300 + -100 + 200 4
-150 + 100 + -200 - 0 * damn nme ——t fa
0 4 2 3 4 0 5 10 15 20
TIME (S) FREQUENCY (Hz)
a - bare floor
ACCELERATION (IN/S*2) FREQUENCY SPECTRUM AMPLITUDE 200 1000 +
+ 150 4 900 + 800 +
100 + 700 4
50 +
0 Pom +
so + -100 +
~150 4
-200 0 ‘ 2 3 4
b - three TMDs in place
Figure 4.5 Heel Drop Performed and Acceleration Measured at the Center of Bay 1
66
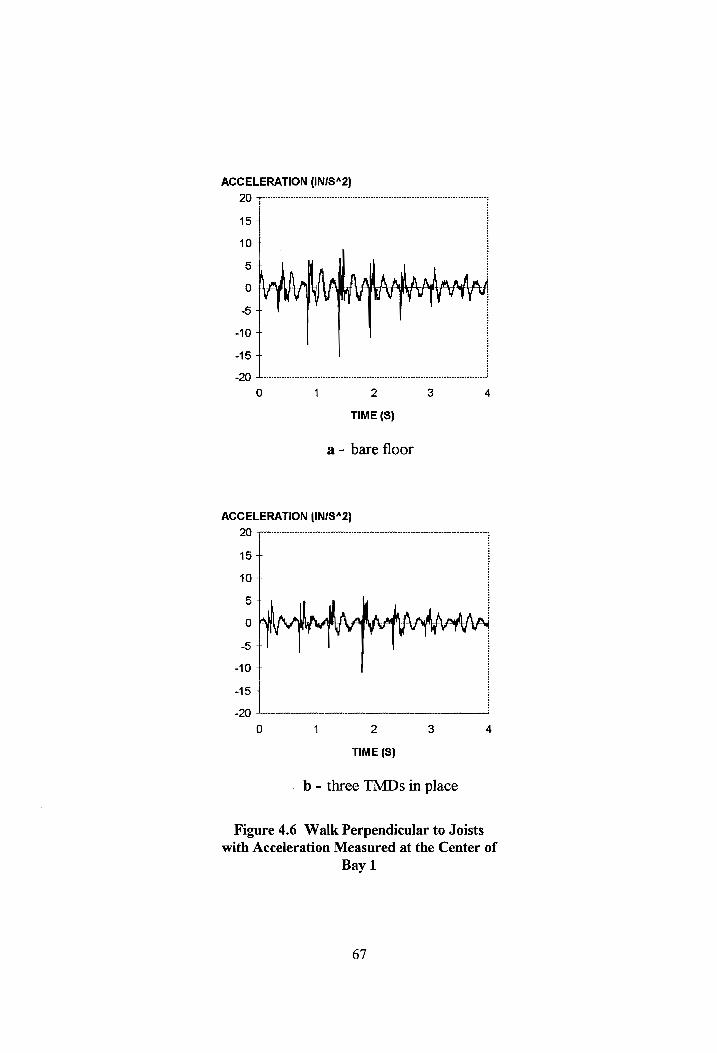
ACCELERATION (IN/S42)
20
TIME (S)
a - bare floor
ACCELERATION (IN/S42)
20
15 +
TIME (S)
b - three TMDs in place
Figure 4.6 Walk Perpendicular to Joists with Acceleration Measured at the Center of
Bay 1
67
4.3.3 Evaluation of Tuned Mass Damper Effectiveness
Figure 4.5 shows acceleration traces at the center of Bay 1 caused by heel drops at the
center of the bay. Also shown are the resulting plots in the frequency domain. Figure 4.5a is for
the bare floor, and 4.5b is with one TMD at the center and two TMDs at the center of the edge
joist of the bay. With the TMDs im place, damping was increased and control of the first mode of
vibration was improved.
Figure 4.6 shows acceleration traces due to walking im an east-west direction,
perpendicular to the joists and near the mid-span of the joists. Figure 4.6a is for the bare floor, and
4.6b is with one TMD at the center and two TMDs at the center of the edge joist of the bay.
Walking perpendicular to the joists excited the fundamental and higher modes of vibration.
Considering the RMS of the acceleration data, acceleration due to walking was reduced by a factor
of 1.4 with the three TMDs in place.
4.4 Bay 2
Bay 2 is an interior bay of the building. This bay, which is rectangular in shape, also had
cubicles separated by movable partitions. In addition to the movable partitions, a full-height
partition is located along the entire length of one of the edge joists of the bay. The main walkway
through this bay runs parallel with the joists in the east-west direction. Figure 4.7 shows a plan
view of Bay 2 and some of the adjacent floor area. Bay 2 consists of 24H8 joists spaced at 3 ft on
center. The joists span 40 ft between W27x84 girders, which span 30 ft.
68

L 30'-O" |
| | | | indicates main
W27x84 Girden_ __Wwalking aisle ] T. 4
partition—. ! ly
DN Ly 24H8 Joist @ 3'-0} 40'-0"
| W27x84 Girden |
rT y Ly | sf
North Column (typ)
Figure 4.7 Plan View of Bay 2
69

4.4.1 Vibration Characteristics
Unlike Bay 1, the main walkway for this bay, and bays to the north and south, runs
parallel to the joists. In addition, a full-height partition runs the entire length of one of the edge
joists of this bay. For these reasons, the wave-like motions which were strong in Bay 1 are not
strong in this bay. Walking between cubicles in the north-south direction excited the wave-like
higher modes of vibration. Walking along the main walkway primarily excited the fundamental
mode of vibration.
4.4.1.1 Measured Vibration Characteristics
Fast Fourier Transforms of heel drop acceleration data were used to determine the natural
frequencies of the bay. The fundamental mode of vibration dominated the floor vibrations of this
bay, and was excited when a person walked in the east-west direction. The fundamental mode of
vibration occurs at a frequency of 4.75 Hz, and is strongest at the center of the bay. The damping
ratio for this mode of vibration is approximately 5%.
4.4.1.2 Analytically Determined Vibration Characteristics
This bay was also modeled and analyzed using SAP90. Like the Bay 1 model, rotational
springs were placed at the nodes of the girder so that the bay vibrated in a manner that reflected
actual floor conditions. Because a full-height partition was located along an exterior joist,
additional mass and stiffness were added to this joist to reflect the effects of the partition on the
bay. As with Bay 1, a 9 psf sustained live load was added to the model as mass at the nodes. The
SAP90 input for this model is in Appendix D. Figure 4.8 shows the grid layout for the model and
70

properties of the frame and plate elements used in the model. The plate elements in this model are
rectangular with dimensions of 36 in. by 40 mn.
The SAP90 analysis of this model predicted a fundamental frequency of 4.81 Hz. The
measured floor fundamental frequency is 4.75 Hz. Figure 4.9 shows the first two mode shapes and
their corresponding frequencies resulting from the eigenvalue analysis. Only the first mode of
vibration was of major concern in this bay, so only the equivalent SDOF mass for the first mode of
vibration was determined for this bay. Because of the partition on one side of the bay, the
maximum displacement for the first mode did not occur at the center of the bay, but rather about 9
ft north of the center of the bay. At this location the equivalent SDOF floor weight is 17,300 Ibs.
However, the TMDs were located at the center of the bay so that they would be in the main
walking aisle. When TMDs are located at the center of the bay, the equivalent SDOF floor weight
is 21,520 lbs.
4.4.2 Installation of Tuned Mass Dampers
Several TMD configurations were tried on Bay 2 to control the fundamental mode of
vibration. The first configuration used one TMD at the center of the bay. The second
configuration used two TMDs at the center of the bay. The third configuration had the two TMDs
spaced 6 ft apart, on an east-west centerline of the bay.
The second configuration was the most successful in controlling the floor vibrations. The
parameters of these two TMDs are found in Table 4.5. Using two TMDs versus one TMD has the
added advantage of a higher mass ratio. In general, the higher the mass ratio, the greater the
control of the floor vibrations. The total TMD-to-floor mass ratio with this configuration is
0.0372.
71
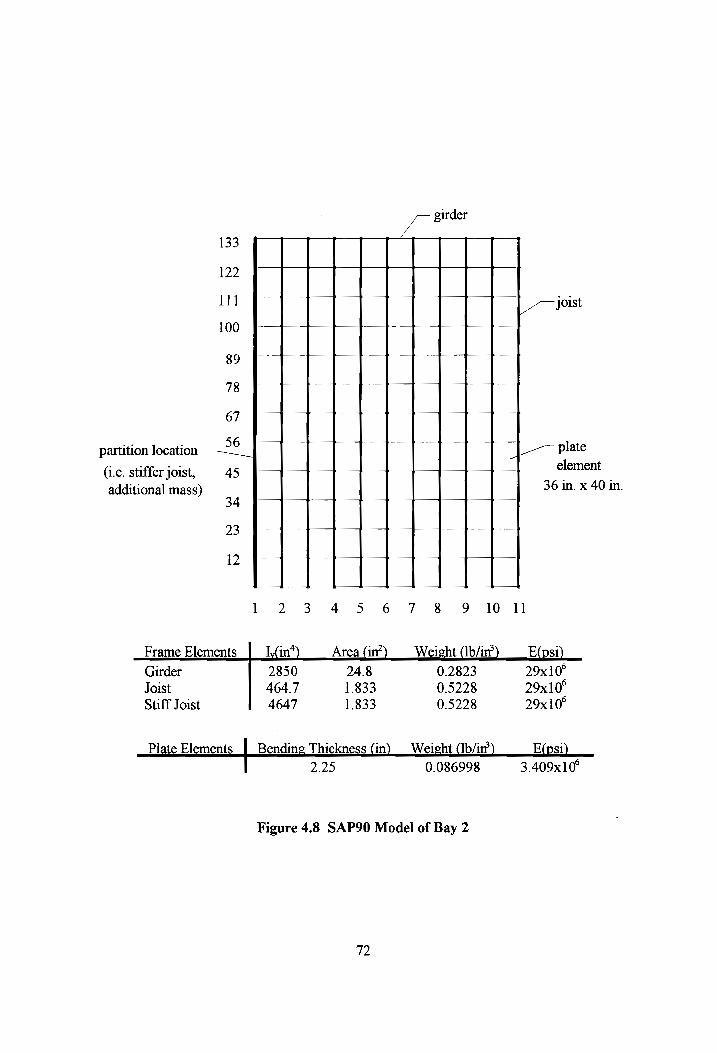
/ girder
133
122
11] joist
100
89
78
67
partition location 26 | plate
(i.e. stiffer joist, 45 element
additional mass) 34 36 in. x 40 in.
\
23
12
123 4 5 6 7 8 9 10 11
Frame Elements_|_I{in*) ___Area (in?) __ Weight (Ib/in’) __E(psi)
Girder 2850 24.8 0.2823 29x10° Joist 464.7 1.833 0.5228 29x10° Stiff Joist 4647 1.833 0.5228 29x10°
Plate Elements Bending Thickness (in) _ Weight (Ib/in’) E(psi)
| 2.25 0.086998 3.409x10°
Figure 4.8 SAP90 Model of Bay 2
72

MODE
FREQUENCY
4.815158
MODE
FREQUENCY
9.115626
Figure 4.9 First Two Mode Shapes From SAP90 Analysis of Bay 2
73

Table 4.5 Final TMD Parameters of Bay 2 TMDs
Tuned Mass Dampers Remarks
TMDia | TMDI1b
wr (Ib) 21520 21520
wr (Ib) 325 475 (plates x 10)+751b
plates 25 40
Lu 0.0151 0.0221 Equation 2.3
ks (Ib/in) 720 788
kd (Ib/in) 137.6 420 (G'x A)At
kstkd =k; | 857.6 1208
firm (Hz) 5.08 4,99 Equation 2.5
Cr 4.31 13.40 k@/@nTwp
Cr (%) 0.0802 0.1738 || Eqns. 2.8 and 2.9
form (Hz) 5.07 4.9] Equation 2.10
G' (psi) 40 40
eta l
t (in) 0.5 0.5
A (in’2) 1.72 5.25
74

4.4.3 Evaluation of TMD Effectiveness
Figure 4.10 shows acceleration traces due to heel drops and the resulting plots in the
frequency domain. Figure 4.10a is for the bare floor and 4.10b is with two TMDs at the center of
the floor. With the two TMDs in place, it can be seen that the TMDs increased the damping and
decreased the response to an impact on the floor.
Figure 4.11 shows acceleration traces due to walking parallel to the joists in an east-west
direction, and acceleration traces due to walking perpendicular to the joists in a north-south
direction. Walking perpendicular to the joists required that the person walk in and out of two
cubicles that were located across from one another, on either side of the main walkway. The
perpendicular walk was located about 3 ft east of the bay centerline. The parallel walk, down the
main walkway, was about 3 ft south of the bay centerline. The RMS of the acceleration due to
walking parallel to the joists was reduced by a factor of 1.75, while RMS of the acceleration due to
walking perpendicular to the joists was reduced by a-factor of 1.23. The acceleration reduction
factor for walking perpendicular to the joists was not as great as the parallel walking reduction
factor because walking perpendicular to the joists excited the higher modes of vibration more than
walking parallel to the joists. Since the main walkway runs parallel to the joists, control of the
floor vibrations was considered sufficient with TMDs controlling only the fundamental mode of
vibration.
75

ACCELERATION (IN/S“2) FREQUENCY SPECTRUM AMPLITUDE 200
150 +
100 +
50 +
0 Parr ne 400 £
800 +
700 +
600 + 500 +
-50 + 300
“100 7 200 + -150 4 100 ¢
-200 0 tt pa 4 0 2 4 0 5 10 15 20
TIME (S) FREQUENCY (Hz)
a- bare floor
ACCELERATION (IN/S42) FREQUENCY SPECTRUM AMPLITUDE 200 800
150 + 700 +
100 + 600 + 50 + 500 +
0 iv
-50 +
-100 4
-150 +
-200 0 2 4
TIME (S) FREQUENCY (Hz)
b- two TMDs at the center
Figure 4.10 Heel Drop Performed and Acceleration Measured at the Center of Bay 2
76
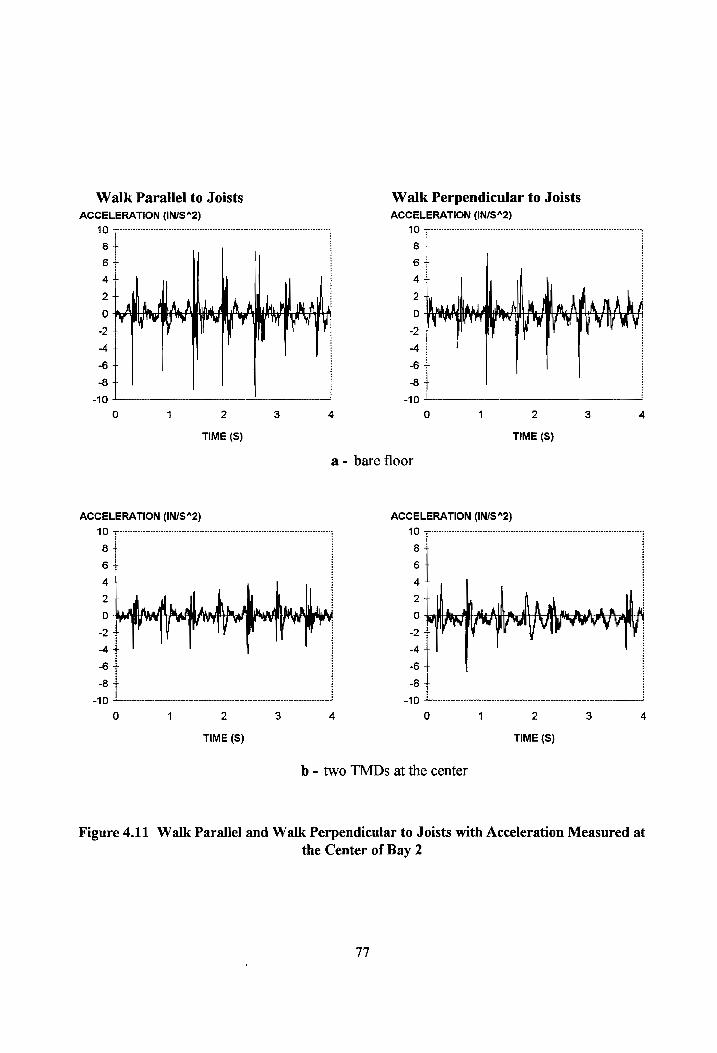
Walk Parallel to Joists Walk Perpendicular to Joists
ACCELERATION (IN/S“%2) ACCELERATION (IN/S“2)
10 10 7 oT 6+ 6
47+ 4
2+ 2
04 0
2+ -2
-4 4 -4 6 T -&
8 | 8 -10 -10
Oo 1 2 3 4 0 1 2 3 4
TIME (S) TIME (S)
a- bare floor
ACCELERATION (IN/S*2) ACCELERATION (IN/S“2)
10 10
8 + 8+ 6+ 6 + 4+ 4+
2 + 2+ 04 0 +
2+ 2+
44 -4 + 6 6 T
8 8 4
-10 -10 0 1 2 3 4 0 1 2 3 4
TIME (S) TIME (S)
b - two TMDs at the center
Figure 4.11 Walk Parallel and Walk Perpendicular to Joists with Acceleration Measured at
the Center of Bay 2
77

4.5 Bay3
This bay borders an exterior wall, and is adjacent to Bay 2. Bay 2 is directly east of the
main portion of Bay 3. The main portion of this bay has dimensions of 35 ft by 30 ft. Figure 4.12
shows a plan view of the bay; note that the 35 ft by 30 ft area does not have a column at one
comer. This particular bay has the most complex plan of the three bays on which TMDs were
tested.
4.5.1 Vibration Characteristics
The main walking aisle in this bay runs perpendicular to the joists, and due to that fact, the
higher modes of vibration are excited when people walk through the bay in the north-south
direction. Two full-height partitions are located on edge members of this bay, as shown in Figure
4.12. The step shape edge of the north portion of the bay and the locations of full-height partitions
complicate the bay behavior. For this reason, correcting a mode of vibration other than the
fundamental mode of vibration was found to be very difficult.
4.5.1.1 Measured Vibration Characteristics
Fast Fourier Transforms of heel drop acceleration data were used to determine the bay
frequencies. The first mode of vibration occurs at a frequency of 4.25 Hz, and is strongest near the
center of the bay. A second frequency of about 6.25 Hz is also prominent at this location. The
damping ratio for the first mode of vibration is about 5%.
78

20'-0"
North 10'-Q"
W27x84 Girder (typ)
indicates main walking aisles
——— r
10 spaces @ 3'.0" = 30'-9"
24H9 Joists
Column (typ)
| 35'-0" l
Figure 4.12 Plan View of Bay 3
79

4.5.1.2 Analytically Determined Vibration Characteristics
This bay was also modeled using SAP90. The model, Figure 4.13, did not include the
entire step portion of the exterior portion of the bay. The model measures 35 ft by 39 ft - 2 in.
with one of the girders extending beyond the rectangular grid a to connect with a column in the
actual structure. For the girder extension, a modified moment of inertia 1s used to account for the
concrete supported by the girder. In addition, the girder extension is loaded with the pertinent
tributary mass. The mass of a full-height partition was added to the members which directly
support a partition. The moment of inertia of the joist supporting a partition was increased by a
factor of about ten to account for the added stiffness created by the partition. The joist which
directly supported a partition in the Bay Two model also had a moment of inertia about ten times
its original moment of inertia. Increasing the joist moment of inertia by greater factors had little
effect on the natural frequencies or mode shapes of the bay. The moment of inertia of the girder
supporting the partition was left unchanged; the girder moment of inertia is of the same order of
magnitude as the “stiffened” joist moment of inertia. To account for the effect of the exterior wall,
nodes of the W18x35 frame elements along the exterior wall were fixed in all directions.
The plate elements for this model were not uniform in size. The 35 in. width remained the
same for all of the plate elements; however, the lengths of the elements were 25 in., 30 in., or 36 in.
depending on the spacing between the joists.
Figure 4.13 shows the grid layout for this model, and lists the properties of the frame and
plate elements. The joist properties listed in Figure 4.13 are an average of all the joist properties
used in the model. The joist composite moment of inertia changed when the joist spacing changed.
As with the other models, a 9 psf sustained live load was added as additional nodal mass. The
SAP90 input for this model is in Appendix D.
80

203 7
202
201
W27x84 (G1)—_ 200
(typ) 199 8 spaces @ 2'-6" = 20'-0" fixed nodes (wall) 198
W18x35 197 * 196 183 FA
170 plate elements 35 in. x 30 in.
157 yy
144 plate elements 35 in. x 25 in. 131
118
105
92 W27x84 79
W24x68, — 66 voist plate elements partition location 53 J 35 in. x 36 in.
(i.e. more mass)
40
27
14
12\3 45 6 7 8 9 10 11 12 13
stiff joist, partition location (i.e. more mass)
Frame Elements | {,(in*) Area (in?) Weight (Ib/in?) _E(psi)
W27x84 Girder 2850 24.8 0.2823 29x10°
W27x84 Gl 2866 24.8 0.2823 29x10° W24x68 Girder 1830 20.1 0.2819 29x10°
20H8 Joist 295.6 1.053 0.8705 29x10°
Stiff Joist 2950 1.137 0.8795 29x10° W18x35 Beam 960 10.3 0.2832 29x10°
Plate Elements | Bending Thickness (in) Weight (Ib/in?) E(psi)
2.25 0.086998 3.409x10°
Figure 4.13 SAP90 Model of Bay 3
81
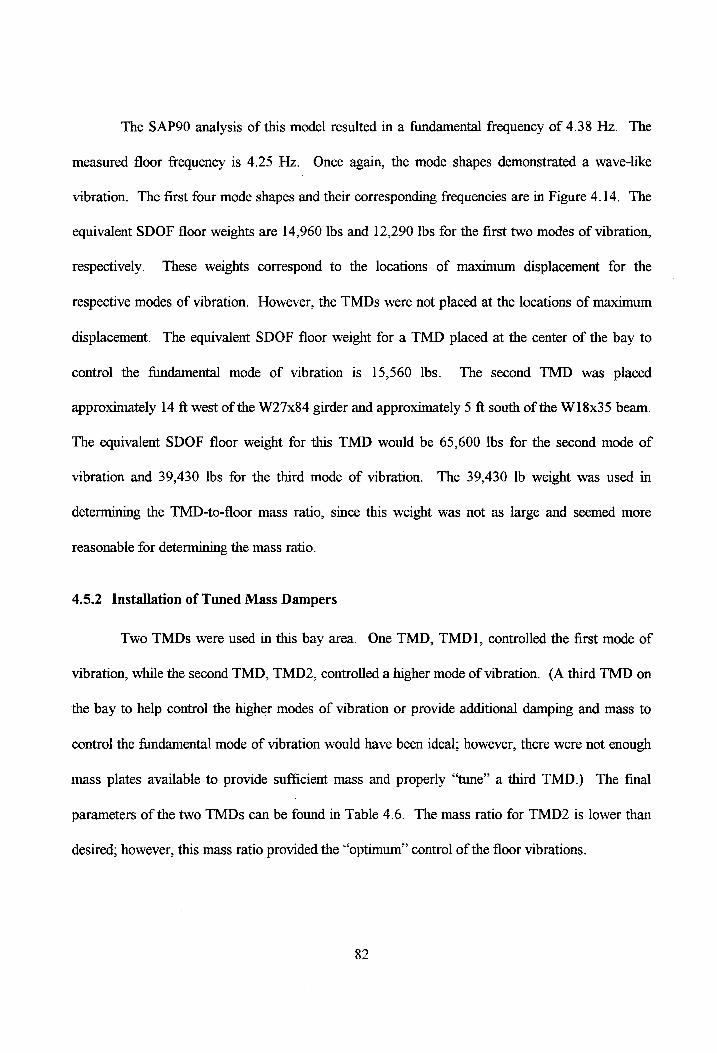
The SAP90 analysis of this model resulted in a fundamental frequency of 4.38 Hz. The
measured floor frequency is 4.25 Hz. Once again, the mode shapes demonstrated a wave-like
vibration. The first four mode shapes and their corresponding frequencies are in Figure 4.14. The
equivalent SDOF floor weights are 14,960 lbs and 12,290 Ibs for the first two modes of vibration,
respectively. These weights correspond to the locations of maximum displacement for the
respective modes of vibration. However, the TMDs were not placed at the locations of maximum
displacement. The equivalent SDOF floor weight for a TMD placed at the center of the bay to
control the fundamental mode of vibration is 15,560 lbs. The second TMD was placed
approximately 14 ft west of the W27x84 girder and approximately 5 ft south of the W18x35 beam.
The equivalent SDOF floor weight for this TMD would be 65,600 Ibs for the second mode of
vibration and 39,430 Ibs for the third mode of vibration. The 39,430 Ib weight was used in
determining the TMD-to-floor mass ratio, since this weight was not as large and seemed more
reasonable for determining the mass ratio.
4.5.2 Installation of Tuned Mass Dampers
Two TMDs were used in this bay area. One TMD, TMD1, controlled the first mode of
vibration, while the second TMD, TMD2, controlled a higher mode of vibration. (A third TMD on
the bay to help control the higher modes of vibration or provide additional damping and mass to
control the fundamental mode of vibration would have been ideal; however, there were not enough
mass plates available to provide sufficient mass and properly “tune” a third TMD.) The final
parameters of the two TMDs can be found in Table 4.6. The mass ratio for TMD2 is lower than
desired; however, this mass ratio provided the “optimum” control of the floor vibrations.
82

V
LSU SQQKYAN
W\
AIA ARAN
ASRS
BANA
/ ~
\ ,
J\ x
OOK
YOOROR RY
N Ai
() XK)
OAM,
RESON
AN AER
OER ACK R
IK
ORR
SPY OOO
VN
MSY. RYN
ALALA
AX
YY os
XX 5
4.382821
FREQUENCY
FREQUENCY
MODE
83
Figure 4.14 First Four Mode Shapes From SAP90
Analysis of Bay 3
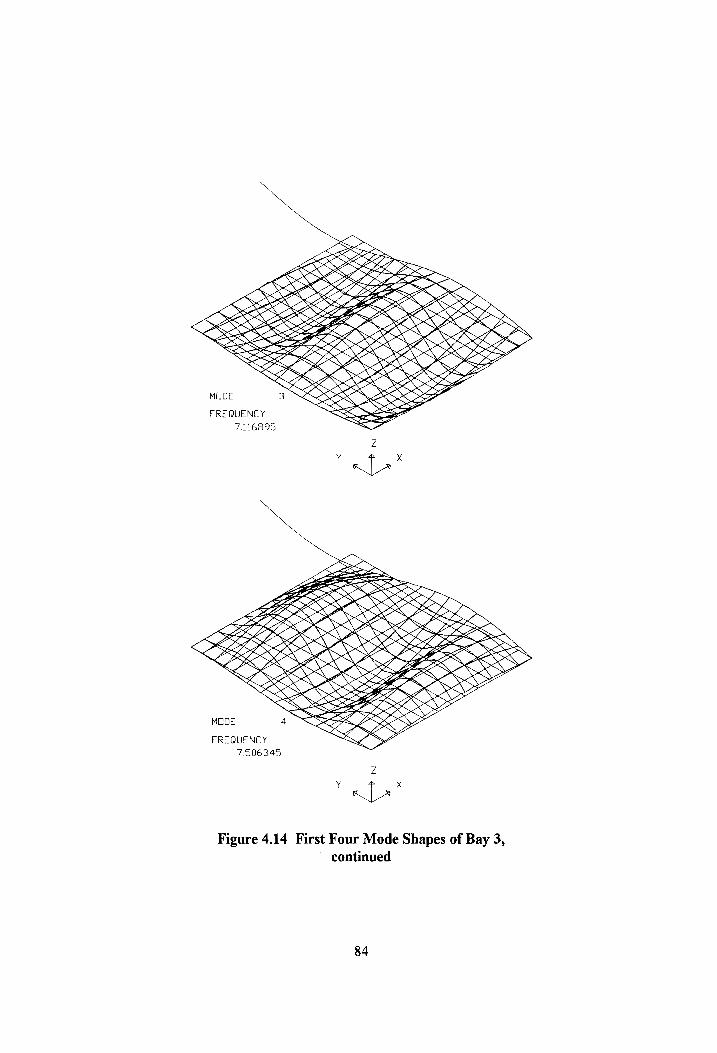
SoA ,
MEA
. AK A
E
Sd
LIMOS KK
MN PRINS
MORN,
LOND.
KYOCERA
PONY
AAA PARAM
HK PARANA
ONO
OSS OI
KSC ISH
KORO)
RAORVASOOL
OO. Ws
(WALA RAALOQW
ALY DOI
OK KAY
AK SOC
OOORNR I DIRK
IS SCO
WX SOOOCORNOY
OY Co
ROKK
D\ AW
OMSK SAKA? aN
A) ( RRO?
REY >
ANS SOK
ROF
VARS NIOG?
WOOK)
SY.
RY
K\ XK
a) YY
Ox
~
Ya!
WKY
ORDA GE
WRK
SE OY
1 Ay
w S
Figure 4.14 First Four Mode Shapes of Bay 3,
continued
84
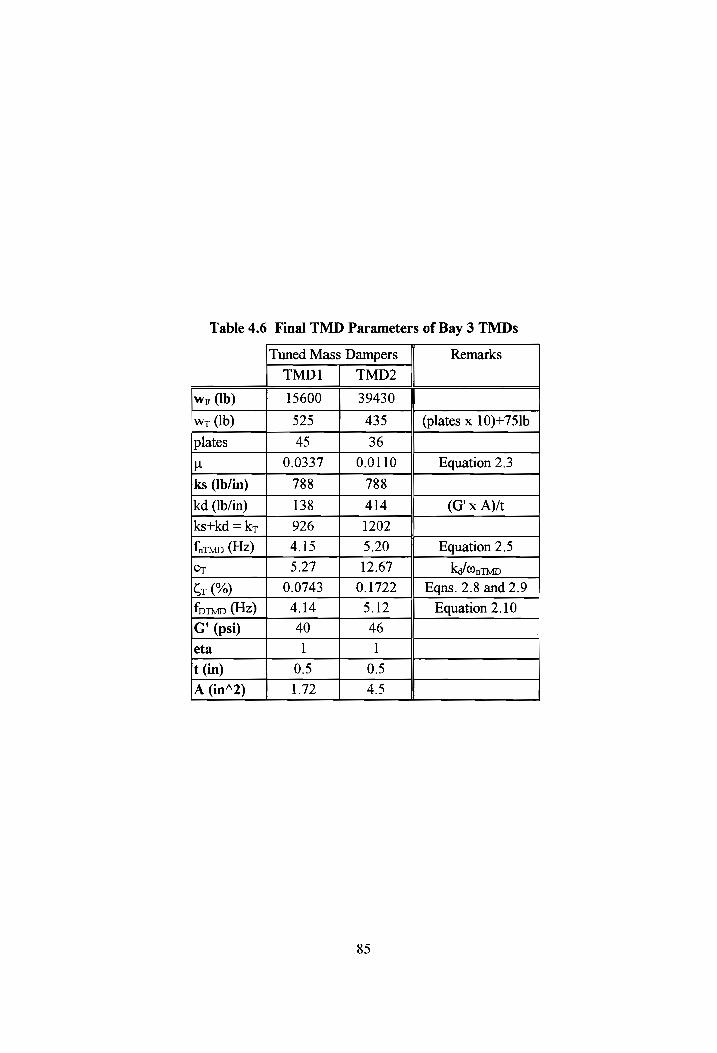
Table 4.6 Final TMD Parameters of Bay 3 TMDs
Tuned Mass Dampers Remarks
TMD1 TMD2
wr (Ib) 15600 39430
wr (Ib) 325 435 (plates x 10)+75lb
plates 45 36
LL 0.0337 0.0110 Equation 2.3
ks (Ib/in) 788 788
kd (Ib/in) 138 414 (G'x A)tt
ks+kd = ky 926 1202
fitmp (Hz) 4.15 5.20 Equation 2.5
CT 5.27 12.67 k/@arvp
Cr (%) 0.0743 0.1722 Eqns. 2.8 and 2.9
forwp (Hz) 4.14 5.12 Equation 2.10
G' (psi) 40 46
eta 1 1
t (in) 0.5 0.5
A (in’2) 1.72 4.5
85
4.5.3 Evaluation of TMD Effectiveness
Tuned mass damper effectiveness was measured analytically, as with the previous bays;
however, TMD effectiveness was measured by the occupants as well. This TMD configuration
was left in place for one week, and the occupants were then asked how well they thought the TMDs
controlled the floor vibrations.
4.5.3.1 Analytical Measure of Effectiveness
Heel drops and walks for this bay were performed by a person weighing 135 Ibs. Heel
drops and walks for the previous office floor bays and the laboratory floor were performed by a
person weighing 210 Ibs. Because of the difference in weight, the initial acceleration peaks
resulting from heel drops are no longer of the same magnitude, but this only reduces the amplitude
of the acceleration in the frequency domain, and does not change its shape. The magnitude of
accelerations due to walking are also lower, but since the ratio of the RMS accelerations with and
without TMDs on the floor is used as a measure of TMD effectiveness, this is not a problem.
Figure 4.15 shows acceleration traces due to a heel drop at the center of the main portion
of the bay. Figure 4.15a is for the bare floor and 4.15b is for one TMD, TMD1, at the center and
the other TMD, TMD2, just outside the main bay area. Damping was increased for the first mode
of vibration with the addition of the two TMDs. Comparing the plot in the frequency domain of
Figure 4.15b to the plot in the frequency domain of Figure 4.15a, a split of the 4.25 Hz frequency
is now visible.
Figure 4.16 shows the acceleration trace due to walking parallel to the joists and the
acceleration trace due to walking perpendicular to the joists. Walking parallel to the joists involved
walking down a portion of a main walking aisle and continuing between several cubicles. This
86
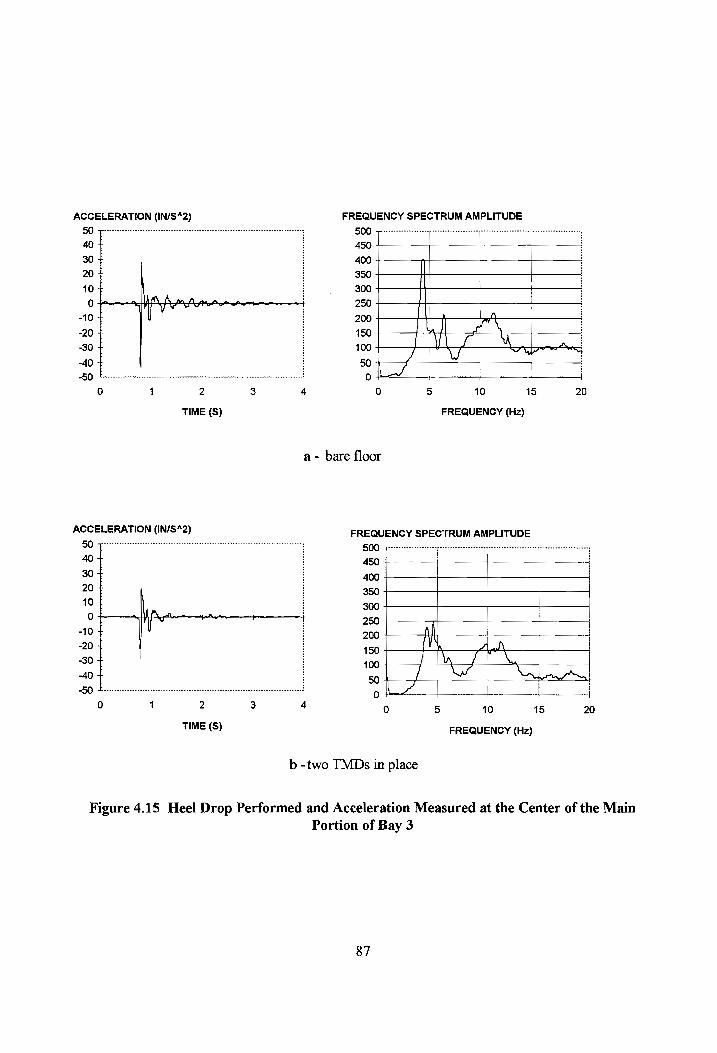
ACCELERATION (IN/S*2) FREQUENCY SPECTRUM AMPLITUDE
500
450
400
350
300
250
200
150
100
50
0
0 1 2 3 4 0 5 10 15 20
TIME (S) FREQUENCY (Hz)
a - bare floor
ACCELERATION (IN/S“2) FREQUENCY SPECTRUM AMPLITUDE 50 - 500
40 + 450 30 F 400 oO ¥ 350
ot hee pt con Pg bom , 300 t l v r ' 250
“10 5 200 -20 + 150 “30 + 400 -40 + 50
-50 : 0
0 1 2 3 4 0 5 10 45 20 TIME (S) FREQUENCY (Hz)
b -two TMDs in place
Figure 4.15 Heel Drop Performed and Acceleration Measured at the Center of the Main
Portion of Bay 3
$7

Walk Parallel to Joists Walk Perpendicular to Joists
ACCELERATION (IN/S“2) ACCELERATION (IN/S“2)
TIME (S) TIME (S)
a- bare floor
ACCELERATION (IN/S“2) ACCELERATION (IN/S“2)
TIME (S) TIME (S)
b - two TMDs in place
Figure 4.16 Walk Parallel and Walk Perpendicular to Joists with Acceleration Measured at the Center of the Main Portion of Bay 3
88
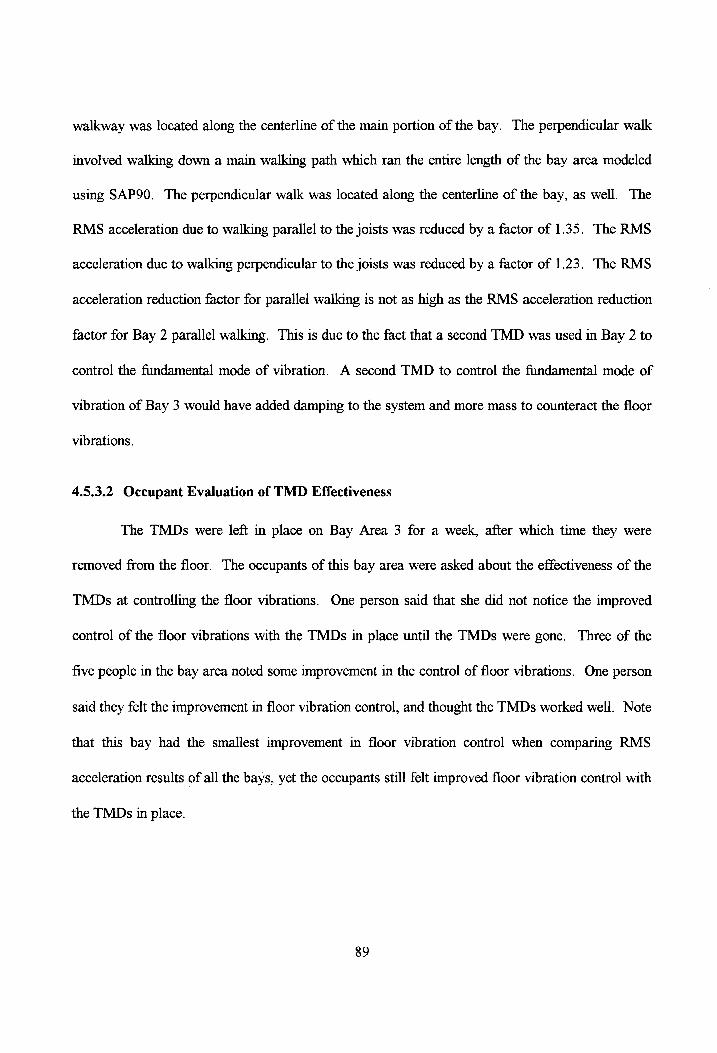
walkway was located along the centerline of the main portion of the bay. The perpendicular walk
involved walking down a main walking path which ran the entire length of the bay area modeled
using SAP90. The perpendicular walk was located along the centerline of the bay, as well. The
RMS acceleration due to walking parallel to the joists was reduced by a factor of 1.35. The RMS
acceleration due to walking perpendicular to the joists was reduced by a factor of 1.23. The RMS
acceleration reduction factor for parallel walking is not as high as the RMS acceleration reduction
factor for Bay 2 parallel walking. This is due to the fact that a second TMD was used in Bay 2 to
control the fundamental mode of vibration. A second TMD to control the fundamental mode of
vibration of Bay 3 would have added damping to the system and more mass to counteract the floor
vibrations.
4.5.3.2 Occupant Evaluation of TMD Effectiveness
The TMDs were left in place on Bay Area 3 for a week, after which time they were
removed from the floor. The occupants of this bay area were asked about the effectiveness of the
TMDs at controlling the floor vibrations. One person said that she did not notice the improved
control of the floor vibrations with the TMDs in place until the TMDs were gone. Three of the
five people in the bay area noted some improvement in the control of floor vibrations. One person
said they felt the improvement in floor vibration control, and thought the TMDs worked well. Note
that this bay had the smallest improvement in floor vibration control when comparing RMS
acceleration results of all the bays, yet the occupants still felt improved floor vibration control with
the TMDs in place.
89

4.6 Summary of Results
Experimental tests using tuned mass dampers to control floor vibrations were performed
on three bays on the second floor of a two-story office building. The bays have fundamental
frequencies ranging from 4 to 5 Hz. The damping ratio for the fundamental mode of vibration 1s
approximately 5% for all three bays. This damping ratio is relatively high. According to
Bachmann, et al. (1995), a TMD its more effective if the damping ratio of the floor is relatively
small.
Each bay is unique in it’s configuration. The direction of the main walking aisle through
the bay has a significant effect on the floor vibrations. Table 4.7 summarizes the RMS
accelerations due to walking in the bays with and without TMDs in place. Comparing the
acceleration reduction factors of each bay, the TMDs in Bay 1 were the most effective. Bay 1 was
the smallest bay and had the most TMDs in place No acceleration measurements for walking
parallel to the joists were recorded for Bay 1, but observing the parallel vs. perpendicular walking
RMS acceleration ratios of Bay 2 and Bay 3, the perpendicular RMS acceleration ratios are lower
than the corresponding parallel RMS acceleration ratios. Based on the RMS acceleration ratios
due to parallel walking, Bay 1 TMDs were the most effective at controlling more than one mode of
vibration.
As seen in Table 4.8, the frequencies of the TMDs designed to control the fundamental
modes of vibration are higher than the actual floor fundamental frequencies for Bay 1 and Bay 2.
In theory, the optimum frequency for a TMD should be slightly less than the floor frequency which
it is designed to control (Bachmann et al. 1995). Most of the bays have a second natural
frequency within 2 Hz of the fundamental frequency. Because of the close proximity of adjacent
90
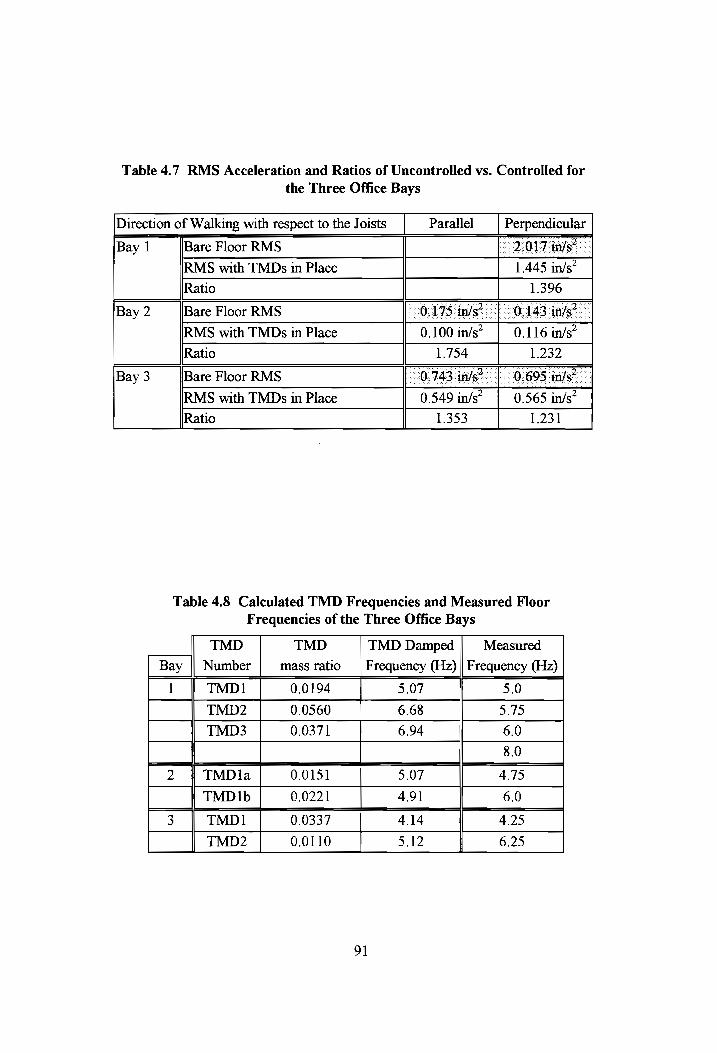
Table 4.7 RMS Acceleration and Ratios of Uncontrolled vs. Controlled for
the Three Office Bays
Direction of Walking with respect to the Joists Parallel Perpendicular
Bay 1 Bare Floor RMS 2017 in/s”
RMS with TMDs in Place 1.445 in/s’
Ratio 1.396
Bay 2 ||/Bare Floor RMS 0.175 in/s” | :0.143 in/s? RMS with TMDs in Place 0.100 in/s* | 0.116 in/s?
Ratio 1.754 1.232
Bay 3 Bare Floor RMS 0.743 in/s*.| 0.695 in/s”.
RMS with TMDs in Place 0.549 in/s? | 0.565 in/s” Ratio 1.353 1.231
Table 4.8 Calculated TMD Frequencies and Measured Floor
Frequencies of the Three Office Bays
TMD TMD TMD Damped Measured
Bay |) Number mass ratio | Frequency (Hz) || Frequency (Hz)
1 TMD1 0.0194 5.07 5.0
TMD2 0.0560 6.68 5.75
TMD3 0.0371 6.94 6.0
8.0
2 TMD la 0.0151 5.07 4.75
TMD 1b 0.0221 4.91 6.0
3 TMD1 0.0337 4.14 4.25
TMD2 0.0110 5.12 6.25
9]

natural frequencies, the optimum TMD frequency may no longer be near a single natural
frequency, but between natural frequencies. This may explain why some of the TMD frequencies
are between the frequencies of two natural modes of vibration of the bays. In further reviewing the
actual TMD parameters, it should be noted that the TMD-to-floor mass ratios of TMD2 and
TMD3 for Bay | are larger than the mass ratios of similar TMDs on the other two bays. Bay 2
has no TMDs to control the higher modes of vibration. The higher modes of vibration have a
significant effect on the floor vibration, and in order to gain significant control of the floor
vibrations, modes other than the fundamental mode of vibration need to be controlled.
92

CHAPTER 5
COMPUTER ANALYSIS OF FLOOR RESPONSE WITH TUNED MASS
DAMPERS AS PART OF THE FLOOR MODEL
The floors on which the tuned mass dampers were tested were modeled and analyzed using
SAP90 v. 6.0 (Wilson and Habibullah 1995). These floor models were introduced in Chapters 3
and 4. Eigenvalue analysis of the models gave information concerning vibrational mode shapes,
and equivalent SDOF floor mass for each mode of vibration of the floors. SAP90 was used further
to determine floor response with TMDs in place.
5.1 Tuned Mass Damper Model
TMD models were added to the floor models. These models shall be referred to as
analytical TMDs from this point forward. Figure 5.1 shows the configuration for the analytical
TMD. The analytical TMD was designed so that it attaches to a single node of the floor. It has
the spring in parallel with the damping element to support the mass. The support members are
modeled as stiff elements of no weight. The spring stiffness, ks, damping element stiffness, kd, and
damping coefficient, c, values are the values of their respective final TMD parameters. The mass
of the mass plate was varied in the models. As with the prototype TMDs, the mass was changed to
“optimally tune” an analytical TMD.
Before placing a TMD model on a floor model, a TMD model was analyzed using
SAP90. The nodes of the TMD were restrained so that they could only move vertically, and
constraints were placed on the nodes at either end of the mass plate. These constraints ensured that
the mass plate had the same vertical displacement along its entire length. Without this constraint,
93

mass plate 1 model node (typ)
| TMD model
floor model node support members
Sot framing member and/or plate boundary
Figure 5.1 Elevation View of a SAP90 TMD Model
94
the dissimilarity between the members supporting either end of the mass plate resulted in
unequal displacement of the ends of the TMD mass plate. The calculated TMD natural
frequency of 4.73 Hz, determined using Equation 2.5, was compared with the natural frequency
determined using SAP90, 4.73 Hz. The TMD model performed as expected, with the calculated
frequency agreeing with the frequency determined using SAP90.
5.2 Analysis Method
Damping had to be included in the analysis of the floor with TMDs. The damping ratios
for each mode of vibration were not individually added to the computer model. A damping ratio of
1.5% was assumed for all of the modes of vibration of the laboratory floor. This is slightly less
than the average damping ratio of the first three modes of vibration (see Section 3.1.2.2). A
damping ratio value less than average was used because Hanagan (1994) found the damping ratios
of the laboratory floor to be less than the damping ratios reported in Section 3.1.2.2, and this was
considered when choosing the damping ratio for the laboratory floor model. For the office floor
bays, only the damping ratios for the fundamental modes of vibration were determined. The higher
frequencies were so closely spaced and the damping ratio so high, that use of the half power
method to calculate damping ratios was not possible. The average damping ratio for the
fundamental frequencies is approximately 5%. A damping ratio of 5% was applied to all of the
modes of vibration of the SAP90 models of the office floor bays.
Because damping now had to be included in the floor and TMD models, an eigenvalue
analysis of the floor would no longer suffice. A dynamic time history analysis of the floor was
performed using SAP90. To initiate this dynamic time history analysis, a dynamic impact was
imparted on the model. This dynamic impact was a decreasing ramp function, which was similar
95

to the actual forcing function produced by a heel drop (Murray 1975). The heel drop ramp
function decreased linearly from a 600 Ib force to a 0 Ib force in a space of 50 milliseconds. The
time history analysis was made to span 8 seconds with 1024 data points recorded in the 8 second
span.
The RMS of the acceleration data resulting from this dynamic analysis was calculated, and
used to determine the optimum TMD parameters. Taking the RMS of the data takes into account
the effect of damping on the structure over the 8 second time period. The greater the damping in a
system, the sooner the acceleration decreases, and the smaller the resulting RMS of the acceleration
data. A series of models, in which only the TMD mass changed, was analyzed. The minimum
RMS acceleration in the series of models was chosen as the analytical TMD with “optimum”
mass.
5.3. Laboratory Floor Model
Two analytical TMDs were placed on this floor model to simulate the prototype TMDs
used to control the first and second modes of vibration of the laboratory floor.
5.3.1 Determination of “Optimum” TMD Mass
TMD1 was first placed on the floor model, and its “optimum” mass determined. After the
“optimum” mass of TMD 1 was determined, it remained in the model, and TMD2 was placed on
the floor model, so its “optimum” mass could be determined.
Figure 5.2 shows the grid of the SAP90 laboratory floor model and locations at which heel
drops were placed and acceleration time history data was calculated by SAP90. Acceleration
traces from the three locations, which result from heel drops at their three specified locations, were
recorded and studied for the bare floor condition. Plots in the frequency domam of the acceleration
96
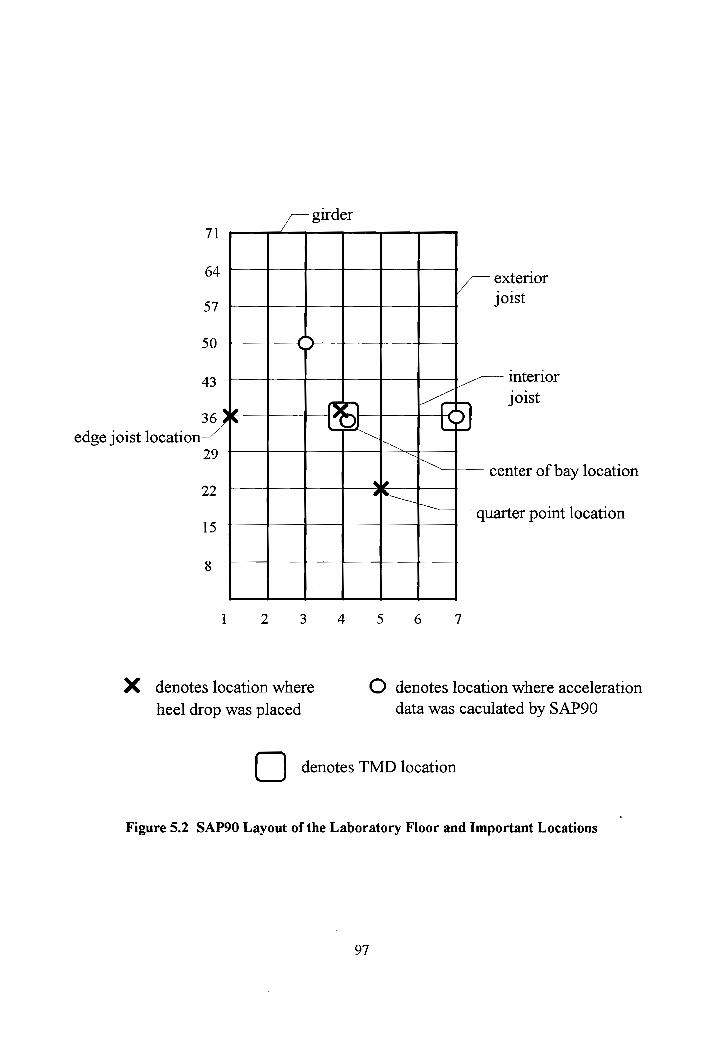
71
64 / exterior
57 joist
50 O-
43 mterior
- joist 36 XK 7
edge joist location“ 7 29
BY | center of bay location
22 | . |
-— quarter point location 15
8
X= denotes location where © denotes location where acceleration
heel drop was placed data was caculated by SAP90
denotes TMD location
Figure 5.2 SAP90 Layout of the Laboratory Floor and Important Locations
97

traces were studied to determine which heel drop location and acceleration data calculation point
would be the best for determining the “optimum” mass of the TMD. After examining the
frequency domain data, tt was decided that a heel drop at the center of the bay and a record of the
acceleration at that point was the best for determining the “optimum” mass of TMD1. To
determine the “optimum” mass for TMD2, acceleration data resulting from a heel drop at a quarter
point and recorded at an edge joist was studied. This combination was chosen for TMD2
optimization because the plot in the frequency domain resulting from a heel drop on the bare floor
shows peaks for the first and second modes of vibration of similar magnitude. Some of the other
plots in the frequency domain resulting from a heel drop on the bare floor show a frequency
spectrum amplitude for only one of the floor’s natural frequencies, or a frequency spectrum
amplitude of one natural frequency much greater in magnitude than the frequency spectrum
amplitude of another natural frequency. Figures 5.3a and 5.4a show the bare floor acceleration
trace and corresponding frequency plots used in comparing the bare floor response with the
response resulting from “optimum” TMD1 and “optimum” TMD1 and TMD2 in place,
respectively.
5.3.1.1 TMD1
Analytical TMD1, designed to control the first mode of vibration, was located at the center
of the floor, where the maximum displacement for the first mode of vibration occurs. The
prototype TMD1 for the laboratory floor was also placed at the floor center to control the first
mode of vibration. The stiffness and damping parameters used for the analytical TMD were the
same stiffness and damping parameters used in the laboratory floor prototype TMD1. These
98

ACCELERATION {IN/S*2) FREQUENCY SPECTRUM AMPLITUDE
400 3500 + 80 + 60 t 3000
40 - 2500 + 20 + :
2000 0 4
20 - 1500 + h
-40 1000 + : ht 500 -80 + wy N\
~100 . 0 L= een nN
0 1 2 3 4 0 5 10 15 20
TIME (S) FREQUENCY (Hz)
a- bare floor
ACCELERATION (IN/S“*2) FREQUENCY SPECTRUM AMPLITUDE
100 3500
80 +
, ,
3000 +
2500 +
2000 +
1500 +
| ) 1000 +
soo | }\ 0 : = dete bnrenince ra
0 { 2 3 4 0 5 10 15 20
TIME (S) FREQUENCY (Hz)
b- TMD1 in place
Figure 5.3. Heel Drop Located and Acceleration Calculated at the Floor Center
99
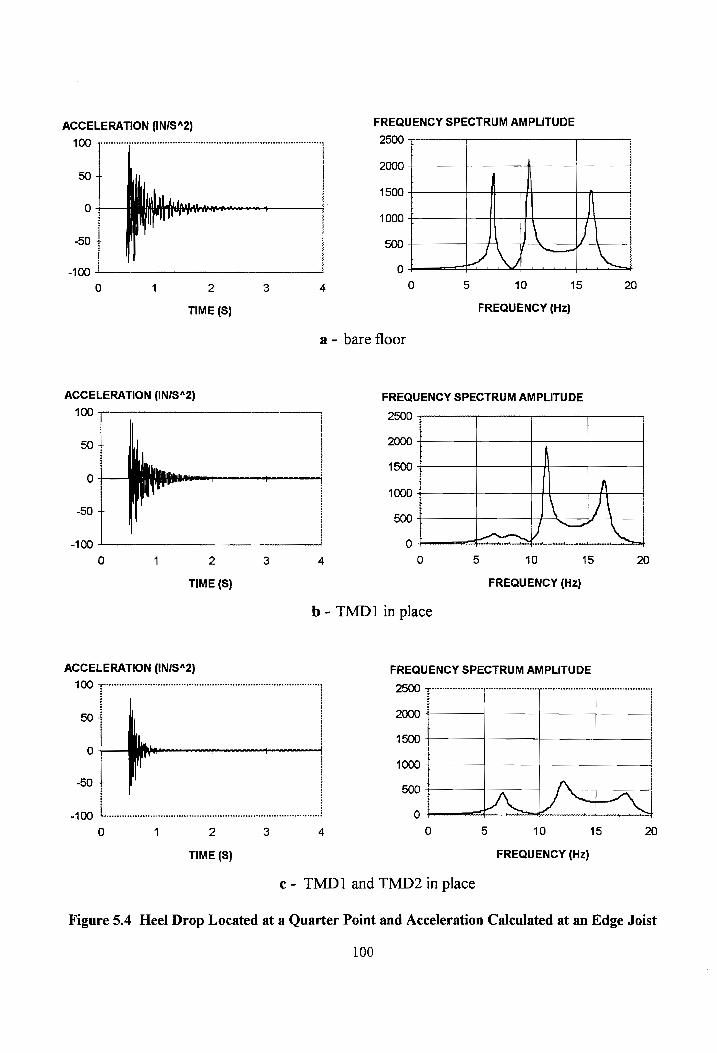
ACCELERATION (IN/S“2) FREQUENCY SPECTRUM AMPLITUDE
100 2500
2000 + 50 +
1500 + ,
0 + \ 1000 + |
al amy, U —T 100 0 te eb ened ewedeeeedy———b po
0 1 > 3 4 ) 5 10 15 20
TIME (S) FREQUENCY (Hz)
a- bare floor
ACCELERATION (IN/S“2) FREQUENCY SPECTRUM AMPLITUDE
100 2500
50 + 2000
1500 + 0 ' i |
1000 + tt
| -100 0 r pe cewek $s
0 1 2 3 4 0 5 10 15 20
TIME (S) FREQUENCY (Hz)
b - TMD1 in place
ACCELERATION ({IN/S“2)} FREQUENCY SPECTRUM AMPLITUDE
100 2500
50 + 2000
1500
0 * : 1000
“50 + 500
-100 0
0 1 2 3 4 0 5 10 15 20
TIME (S) FREQUENCY (Hz)
c- TMD1 and TMD? in place
Figure 5.4 Heel Drop Located at a Quarter Point and Acceleration Calculated at an Edge Joist
100
parameters are found in Table 3.2. The SAP90 input for the laboratory floor with analytical
TMD1 is in Appendix E.
To determine the “optimum” TMD mass, the RMS of the floor acceleration at the center of
the bay resulting from a heel drop at the center of the bay was determined for models with various
TMD mass. Figure 5.5 shows a graph of RMS acceleration versus the TMD 1-to-floor mass ratio.
Table 5.1 shows the data used in creating this plot and the TMD frequencies associated with each
TMD mass. To calculate the final frequency of the TMD model, Equation 2.11, which takes into
account the system damping ratio, was used. The TMD damping ratio is based on the spring and
damper stiffness, the damping coefficient, and the TMD mass. This damping ratio is determined
using Equations 2.9 and 2.10. The TMD mass is not shown in Table 5.1; rather, the number of 10
lb mass plates placed on the TMD model and the corresponding TMD weight are shown.
The optimal TMD was determined by observing the trend of the RMS of the acceleration
time history versus the TMD-to-floor mass ratio. The mass ratio resulting in the lowest RMS
acceleration was determined to be the “optimum” mass ratio. The “optimum” TMD1 has a weight
of 285 lbs, resulting in a mass ratio of 0.0445 and a floor RMS acceleration of 6.61 in/s’. The
RMS acceleration of the bare floor was 10.13 in/s’. The frequency of this TMD is 7.30 Hz,
slightly less than the floor fundamental frequency of 7.35 Hz. The 7.30 Hz frequency is
reasonable and expected; a calculated optimal TMD frequency is generally 95% - 99% of the floor
frequency which it is meant to control (Bachmann et al. 1995).
101]

RMS ACCELERATION (IN/S“2) 7.40
7.30 +
7.20 7
7.10 4
7.00 +
6.90 +
6.80 7
6.70 +
6.60 +
6.50 + 6.40
0.02
Figure 5.5 Variance in RMS Acceleration with
0.03 0.04 0.05 0.06
MASS RATIO (mT/mF)
respect to Laboratory TMD1-to-Floor Mass Ratio
Table 5.1 Data Pertaining to the Determination of the “Optimum”
Laboratory Floor TMD1
Number | TMD Wt.| Floor Wt. | Mass Ratio | RMS Accel. | TMD1
of Plates | (Ibs) (Ibs) (m7/mr) (in/s*) | Freq. (Hz)
13 205 6398 0.0320 7.287 8.60
18 255 6398 0.0399 6.695 7.72
19 265 6398 0.0414 6.650 7.57
20 275 6398 0.0430 6.620 7.43
21 285 6398 0.0445 6.609 7.30
22 295 6398 0.0461 6.610 7.18
23 305 6398 0.0477 6.623 7.05
24 315 6398 0.0492 6.645 6.94
25 325 6398 0.0508 6.674 6.83
30 375 6398 0.0586 6.881 6.36
102

TMD I effects on floor vibration characteristics
An eigenvalue analysis was performed on the laboratory floor with the “optimum” TMD 1
included in the model. TMD1 caused a shift in the natural frequencies of the floor system. Two
eigenfrequencies, one below and one above 7.35 Hz, replaced the bare floor fundamental
frequency. These frequencies, 6.60 Hz and 8.13 Hz, are the split frequencies resulting from the
placement of the TMD to control the first mode of vibration. The bare floor second natural
frequency shifted from 10.59 Hz to 11.19 Hz. The shift of the second bare floor frequency can be
MY of F
seen by comparing the plots in the frequency domain of Figures 5.3a and 5,3b. Figure 5.3a shows
the bare floor response, and Figure 5.3b shows the floor response with TMD 1 im place.
Figure 5.6 shows the first four modes of vibration with the “optimum” TMD1 on the floor.
These modes of vibration can be compared with the bare floor mode shapes of Figure 3.3 to see
how the TMD affects the floor response. With TMD1 in place, there are two mode | shapes, so to
speak. The bare floor mode 2 and 4 shapes correspond with the modes 3 and 4 shapes of the floor
with TMD1.
5.3.1.2 TMD2
Analytical TMD2, designed to control the second mode of vibration, was located at the
center of one of the edge joists of the bay. The prototype TMD2 for the laboratory floor was also
placed at the center of one of the edge joists. The stiffness and damping parameters used for this
model were the same parameters used in the prototype laboratory TMD2. These parameters are
found in Table 3.2.
The RMS of the floor acceleration was determined for models with various TMD2 mass.
The TMD1 mass was held constant while the TMD2 mass was varied. To determine the minimum
103
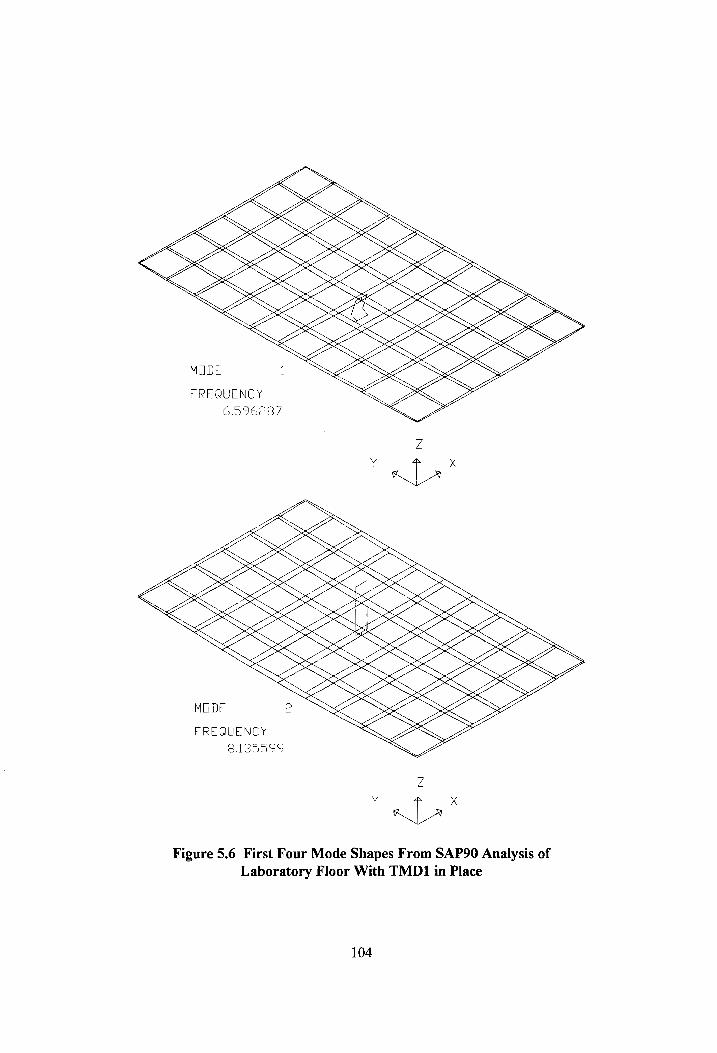
MODE
FREQUENCY
6.596287
MODE
FREQUENCY
8.13559
Figure 5.6 First Four Mode Shapes From SAP90 Analysis of
Laboratory Floor With TMD1 in Place
104

i h
OWS ve x y
“)
oN
“Hi am
a ey OK
KY
a
11192491
16.411333
KX Py \
“
wy
FREQUENCY
FREQUENCY
MODE
MODE
105
Figure 5.6 First Four Mode Shapes of Laboratory Floor with TMD1 in
Place, continued

RMS acceleration, acceleration data resulting from a quarter pot heel drop and calculated at an
edge joist was recorded. Figure 5.7 shows a plot of RMS acceleration versus the TMD2-to-floor
mass ratio. Table 5.2 shows the data used in creating this plot, and the TMD frequencies
associated with each mass.
The “optimal” TMD has a mass ratio of 0.1420, and RMS acceleration of 6.76 in/s’. This
mass ratio is larger than the suggested mass ratio of 0.02 - 0.0667 (Bachmann et al. 1995). To
study the effect of spring stiffness on “optimum” mass ratio, a series of models was studied with a
spring and damper stiffness half that of the prototype TMD2 spring and damper stiffness. With
the stiffness reduced by a factor of two, the mass ratio was reduced to 0.0852. With this smaller
mass, the RMS acceleration was higher at a value of 6.82 in/s’. This “optimum” analytical TMD2
model resulted in a frequency similar to the other analytical TMD2 frequency; therefore TMD
frequency controlled the optimum TMD design, and not the mass or stiffness of the TMD.
The “optimum” TMD2 with prototype laboratory TMD2 parameters (i.e. a mass ratio of
0.1420) has a frequency of 8.40 Hz. This frequency is much lower than the frequency of the floor
which it is meant to control. The analytical second mode floor frequency is 10.59 Hz on a bare
floor and 11.19 Hz on a floor with TMD 1 in place. A frequency above 9 Hz was expected. As
can be seen by comparing Figures 5.4a, 5.4b, and 5.4c, TMD2 does reduce the energy in the
frequencies related to the second and third modes of vibration. RMS acceleration at this location
was reduced from 10.91 in/s* to 9.55 in/s’ with TMD1 in place, and finally reduced to 6.76 in/s’
with TMD1 and TMD? in place.
106
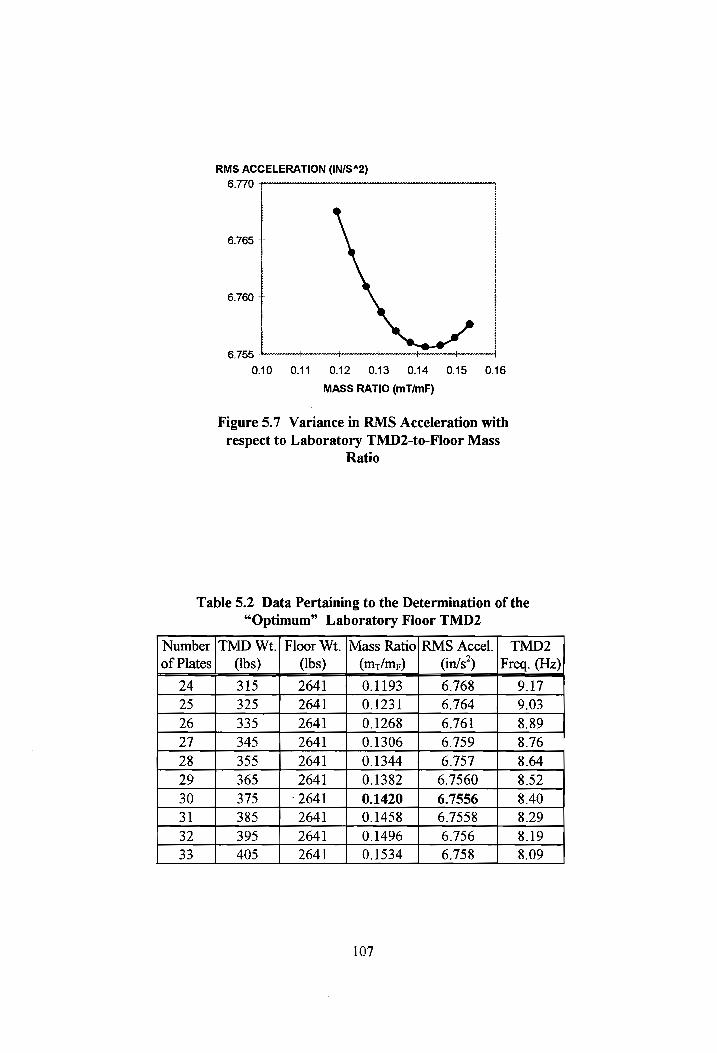
RMS ACCELERATION (IN/S“2)
6.770
6.765 +
6.760 +
6.755 ‘ + + t +
0.10 011 O12 O13 O14 O15 0.16
MASS RATIO (mT/mF)
Figure 5.7 Variance in RMS Acceleration with respect to Laboratory TMD2-to-Floor Mass
Ratio
Table 5.2 Data Pertaining to the Determination of the
“Optimum” Laboratory Floor TMD2
Number | TMD Wt.| Floor Wt. |Mass Ratio} RMS Accel.| TMD2
of Plates} (Ibs) (Ibs) (m;/me) (in/s’) _|Freq. (Hz)
24 315 2641 0.1193 6.768 9.17
25 325 2641 0.1231 6.764 9.03
26 335 2641 0.1268 6.761 8.89
27 345 2641 0.1306 6.759 8.76
28 355 2641 0.1344 6.757 8.64
29 365 2641 0.1382 6.7560 8.52
30 375 - 2641 0.1420 6.7556 8.40
31 385 2641 0.1458 6.7558 8.29
32 395 2641 0.1496 6.756 8.19
33 405 2641 0.1534 6.758 8.09 107

5.4 Bay 2 Model of the Office Floor
Two TMDs were modeled to simulate the two prototype TMDs placed on Bay 2 to control
the first mode of vibration. This floor was the first of two office bay floors to be studied due to the
fact that only one mode of vibration was controlled in this bay.
5.4.1 Determination of “Optimum” TMD Mass
Analytical TMD 1a was first included in the Bay 2 floor model, and its “optimum” mass
determined. Then TMD 1b was added to the model and its “optimum” mass was determined.
Figure 5.8 shows the grid of the SAP90 Bay 2 floor model and locations at which heel
drops were placed and acceleration time histories calculated. By looking at the various bare floor
acceleration traces and their respective frequency plots, it was decided that acceleration data
resulting from a heel drop at the center of the bay should be calculated at a node 12 feet north of
the center of the bay, node 76. The resulting acceleration trace and plot in the frequency domain
clearly show the fundamental frequency of 4.82 Hz, as seen in Figure 5.9a.
5.4.1.1 TMDia
TMD 1a was located at the center of the floor. The maximum displacement for the mode 1
vibration of the model does not occur at the center of the floor, but at a point 9 ft north of the
center of the bay, node 75. Analytical TMD1la was located at the center of the Bay 2 model
because the prototype TMD 1a was located at the center of the bay during the experiments on the
in-situ floor. The stiffness and damping parameters used for this TMD model were the same
stiffness and damping parameters used in the prototype Bay 2 TMDla. These parameters are
found in Table 4.5.
108

/~ girder
133
122
111 | joist
100
89
78
67
partition location 26 |
45
34
23
12
|—— node 76
North ~ 123 4 5 6 7 8 9 1011
XM denotes location where © denotes location where acceleration
heel drop was placed data was recorded
| } denotes TMD location
Figure 5.8 SAP90 Layout of Office Floor Bay 2 and Important Locations
109

ACCELERATION (IN/S“2) FREQUENCY SPECTRUM AMPLITUDE
30 350 20 + 300 10 + 250
O +r T —— 200
-10 + 150
-20 + 100
-30 + 50
-40 0
TIME (S) FREQUENCY (Hz)
ACCELERATION (IN/S“2)
30
a- bare floor
FREQUENCY SPECTRUM AMPLITUDE
350
20 + 300
107 250
0 ae —— 200 -10 + 150
-20 + 100
-30 + 50
-40 0
0 1 2 3 4 0 5 10 15 20
TIME (8S) FREQUENCY (Hz)
ACCELERATION (IN/S*2)
b- TMD 1a in place
FREQUENCY SPECTRUM AMPLITUDE 30
400 20 + 350 10 + 300 0 Neher }e— —+— + 250
10 + 200
150 20 7 4100 -30 + 50
-40 0
0 1 2 3 4 0 5 10 15 20
TIME (S) FREQUENCY (Hz)
c- TMDl1laand TMD1b in place
Figure 5.9 Heel Drop Placed at the Center of Bay 2 and Acceleration Calculated at Node 76
110
Figure 5.10 shows the RMS of the acceleration versus the TMD1a-to-floor mass ratio.
Table 5.3 shows the data corresponding with the plot and the TMD frequencies associated with
each TMD mass. The “optimal” TMD has a mass ratio of 0.0160, and RMS acceleration of 1.53
in/s’, which is reduced from the bare floor RMS acceleration of 2.23 in/s’. The TMD frequency of
4.92 Hz is higher than the floor frequency, but only by 0.10 Hz.
Analytical TMD 1a affected the Bay 2 model vibration characteristics in the same way
analytical TMD1 affected the Laboratory Floor model vibration characteristics. With TMD1la in
place, the fundamental natural frequency of 4.82 Hz was replaced by frequencies of 4.50 and 5.00
Hz. The bare floor second natural frequency shifted from 5.12 Hz to 5.39 Hz.
5.4.1.2 TMD1b
This TMD was located 3 ft west of the center of the floor at node 83. This is the
approximate location at which the prototype Bay 2 TMD1b was placed. The stiffness and
damping parameters used for this TMD model were the same stiffness and damping parameters
used in prototype Bay 2 TMD1b. These parameters are shown in Table 4.5.
Figure 5.11 shows the RMS of the acceleration versus the TMD1b-to-floor mass ratio.
Table 5.4 shows the data corresponding with the plot, and the TMD frequencies associated with
each mass. The “optimal” TMD has a mass ratio of 0.0211, and RMS acceleration of 1.34 in/s’.
The frequency of this TMD is 5.02 Hz, which is higher than the bare floor fundamental frequency
or the TMD 1a frequency.
lll
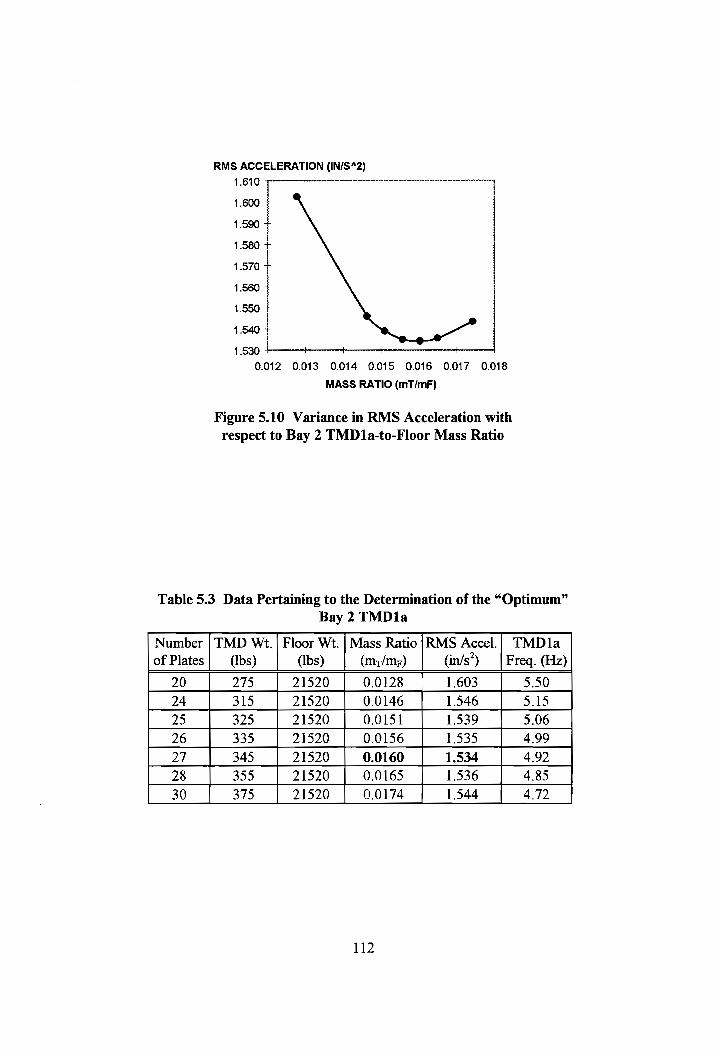
RMS ACCELERATION (IN/S“2)
1.610
1.600 +
1.590 +
1.580 +
1.570 +
1.560 +
1.550 +
1.540 +
1.530 + t + +
0.012 0.013 0.014 0.015 0.016 0.017 0.018
MASS RATIO (mT/mF)
Figure 5.10 Variance in RMS Acceleration with
respect to Bay 2 TMD1a-to-Floor Mass Ratio
Table 5.3 Data Pertaining to the Determination of the “Optimum”
Bay 2 TMD1a
Number } TMD Wt. | Floor Wt. | Mass Ratio} RMS Accel.| TMD1la
of Plates| (Ibs) (Ibs) (my/ms) (in/s*) | Freq. (Hz)
20 275 21520 0.0128 1.603 5.50
24 315 21520 0.0146 1.546 5.15
25 325 21520 0.0151 1.539 5.06
26 335 21520 0.0156 1.535 4.99
27 345 21520 0.0160 1.534 4.92
28 355 21520 0.0165 1.536 4.85
30 375 21520 0.0174 1.544 4.72
112
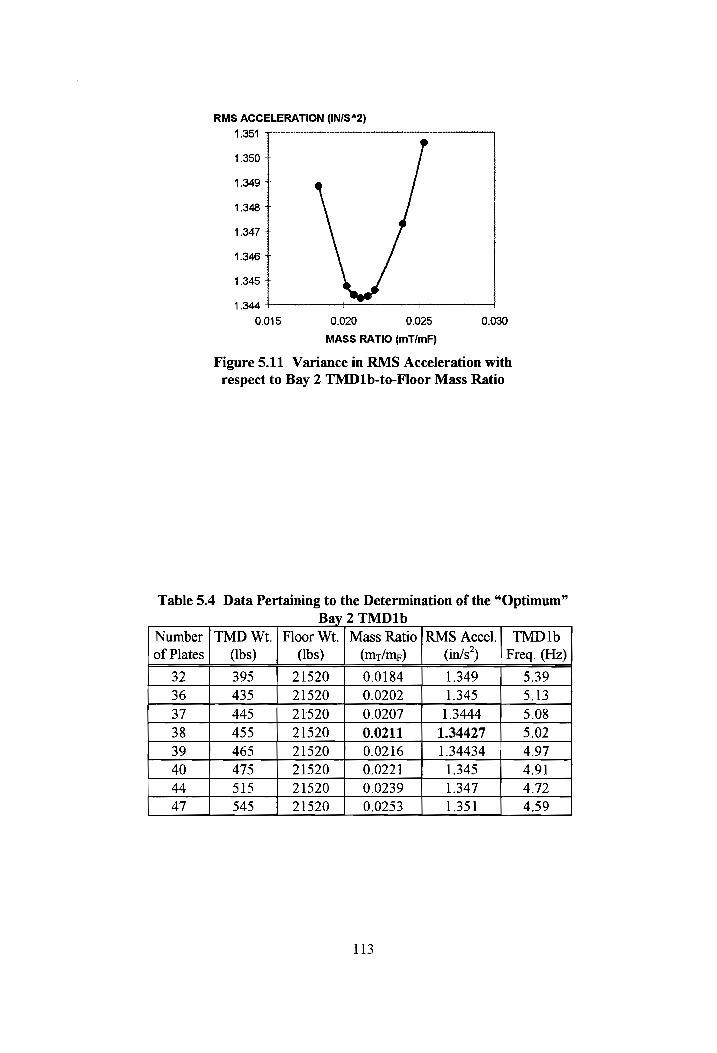
RMS ACCELERATION (IN/S“2) 1.351
1.350 +
1.349 +
1.348 +
1.347 +
1.346 +
1.345 + 1.344
0.015 0.020 0.025
MASS RATIO (mT/mF)
0.030
Figure 5.11 Variance in RMS Acceleration with
respect to Bay 2 TMD1b-to-Floor Mass Ratio
Table 5.4 Data Pertaining to the Determination of the “Optimum”
Bay 2 TMD1b Number | TMD Wt. | Floor Wt. | Mass Ratio|RMS Accel.| TMD1b
of Plates| (Ibs) (Ibs) (m+/mp) (in/s’) _| Freq. (Hz)
32 395 21520 0.0184 1.349 5.39 36 435 21520 0.0202 1.345 5.13 37 445 21520 0.0207 1.3444 5.08 38 455 21520 0.0211 1.34427 5.02 39 465 21520 0.0216 1.34434 4.97 40 475 21520 0.0221 1.345 4.91 44 515 21520 0.0239 1.347 4.72 47 545 21520 0.0253 1.351 4.59
113

5.5 Bay 1 Model of the Office Floor
Three TMDs were modeled to simulate the three prototype TMDs placed on the floor to
control the first, second, and third modes of vibration. The model bare floor first, second, and third
modes of vibration occur at frequencies of 5.15 Hz, 7.38 Hz, and 7.44 Hz, respectively.
5.5.1 Determination of “Optimum” TMD Mass
TMD1 was entered into the model, and its “optimum” mass determined. Figure 5.12
shows the grid layout of the SAP90 Bay 1 floor model and locations at which heel drops were
placed and acceleration time histories calculated. After looking at the various bare floor
acceleration traces and their respective frequency plots, 1t was decided that acceleration data
resulting from a heel drop at the center of the bay and calculated at the center of the bay would be
used to determine the “optimum” TMD1 mass. The resulting acceleration trace and plot in the
frequency domain of the bare floor condition is shown in Figure 5.13a.
To determine the “optimum” mass of TMD2 and TMD3, acceleration data resulting from
a heel drop placed at node 83 and calculated at node 94 was recorded. This combination was used
because the plot in the frequency domain of the bare floor condition shows several frequency peaks
below 10 Hz (see Figure 5.14a). TMD2 and TMD3 were designed to control the frequencies of
7.38 Hz and 7.44 Hz.
114

111
100 | -+--+~ node 94
89 oO | —+— node 83
78 — _- girder 67 a
56
45
34 *
23
12 North =>
123 4 5 6\7 8 9 0 11 wall
XM = denotes location where © denotes location where acceleration
heel drop was placed data was recorded
| denotes TMD location
Figure 5.12 SAP90 Layout of Bay 1 and Important Locations
115
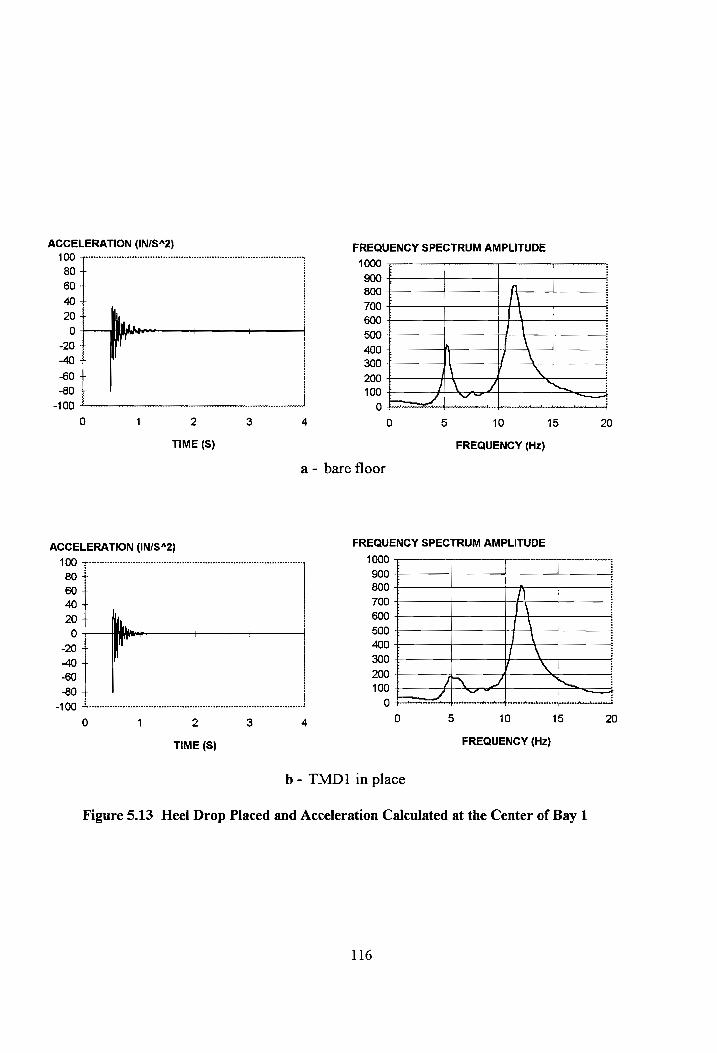
ACCELERATION (IN/S42) FREQUENCY SPECTRUM AMPLITUDE
100 1000 80 + 900
60 | 800 40 + 700 20 + . 600
0 ' + 500 -20 + 400 -40 + 300 -60 + 200 -80 + 100
-100 0
0 1 2 4 0 5 10 15 20
TIME (S) FREQUENCY (Hz)
a - bare floor
ACCELERATION (IN/S“2) FREQUENCY SPECTRUM AMPLITUDE
100 1000
0 4 900 60 4 800 40 + 700 20 + 600
0 ae — 300 -20 + 400 49 + 300
-60 + 200
-80 + 100
-100 0 0 ‘ 5 4 0 5 10 15 20
TIME (S) FREQUENCY (Hz)
b - TMD1 in place
Figure 5.13 Heel Drop Placed and Acceleration Calculated at the Center of Bay 1
116

ACCELERATION (IN/S*2) FREQUENCY SPECTRUM AMPLITUDE
50 500 30 + 400 10 + 1. _, _ 300
-10 + 200
-30 + 100 -50 0
0 1 2 3 4 0 5 10 15 20
TIME (S) FREQUENCY Hz
a- bare floor
ACCELERATION (IN/S*2) FREQUENCY SPECTRUM AMPLITUDE
50 : 500
30 + 400
OT Ae — + 300 -10 + 200
-30 + 100
-50 0 0 1 2 3 4 0 5 10 15 20
TIME (S) FREQUENCY (Hz)
b- TMD! im place
ACCELERATION (IN/S“2) FREQUENCY SPECTRUM AMPLITUDE
50 : 500 30 + . 400 10 + - . 300
-10 + 200
-30 + 100
-50 0 0 4 2 3 4 0 5 10 15 20
TIME (S) FREQUENCY (Hz)
c- TMD1 and TMD? in place
ACCELERATION (IN/S“2) FREQUENCY SPECTRUM AMPLITUDE 50 500
30 + 400 10 + oo . 300
“10 | 200
-30 + 400 -50 0
0 1 2 3 4 0 5 10 15 20
TIME (S) FREQUENCY (Hz)
d- TMD1, TMD2, and TMD3 in place
Figure 5.14 Heel Drop Placed at Node 83 and Acceleration Measured at Node 94 of Bay 1
117

3.5.1.1 TMD1
The analytical TMD1 was located at the center of the floor, where the maximum
displacement for mode | vibration occurs. The stiffness and damping parameters used for this
TMD were the same stiffness and damping parameters used in the prototype Bay 1 TMD1, and are
found in Table 4.4.
Figure 5.15 shows the RMS acceleration versus the TMD 1-to-floor mass ratio. Table 5.5
shows the data corresponding with the plot, and the TMD frequencies associated with each TMD
mass.
The “optimal” TMD1 has a mass ratio of 0.0188 and results in a RMS acceleration of
4.89 in/s, which is reduced from the bare floor RMS acceleration of 5.08 in/s*. This mass ratio is
just slightly lower than the suggested TMD-to-floor mass ratio range of 0.02 to 0.0667 (Bachmann
etal. 1995). This TMD has a frequency of 5.146 Hz, which is just slightly less than the bare floor
fundamental frequency of 5.15 Hz.
5.5.1.2 TMD2
Analytical TMD2 was located at node 116, the point of maximum displacement for the
second and third modes of vibration. The stiffness and damping parameters used in this TMD are
in Table 4.4, and are the same stiffness and damping parameters used in prototype Bay 1 TMD2.
The RMS of acceleration data was calculated at node 94 for a heel drop at node 83.
Looking at the RMS versus mass ratio plot of Figure 5.16, an “optimum” TMD mass could not be
determined. Several other heel drop location and acceleration data calculation location
combinations were tried, but they also did not result in an “optimum” TMD mass. The data
corresponding with the plot of Figure 5.16 are in Table 5.6. A plot in the frequency domain of
118

RMS ACCELERATION (IN/S“2)
4.95
4.94 +
4.93 +
4.92 +
4.91 +
4.90 +
4.89 +
4.88
0.010
Figure 5.15 Variance in RMS Acceleration with
0.015
MASS RATIO (mT/mF) 0.020
0.025
respect to Bay 1 TMD1-to-Floor Mass Ratio
Table 5.5 Data Pertaining to the Determination of the “Optimum”
Bay 1 TMD1
Number | TMD Wt. | Floor Wt. | Mass Ratio | RMS Accel. | TMD1
of Plates (Ibs) (Ibs) (m/mp) (in/s’) | freq. (Hz)
14 215 16730 0.0129 4.942 6.23
18 255 16730 0.0152 4.919 5.72
22 295 16730 0.0176 4.893 5.32
23 305 16730 0.0182 4.890 5.23
24 315 16730 0.0188 4.88866 5.15
25 325 16730 0.0194 4.88873 5.07
26 335 16730 0.0200 4.890 4.99
30 375 16730 0.0224 4.902 4.72
34 415 16730 0.0248 4.918 4.48
119
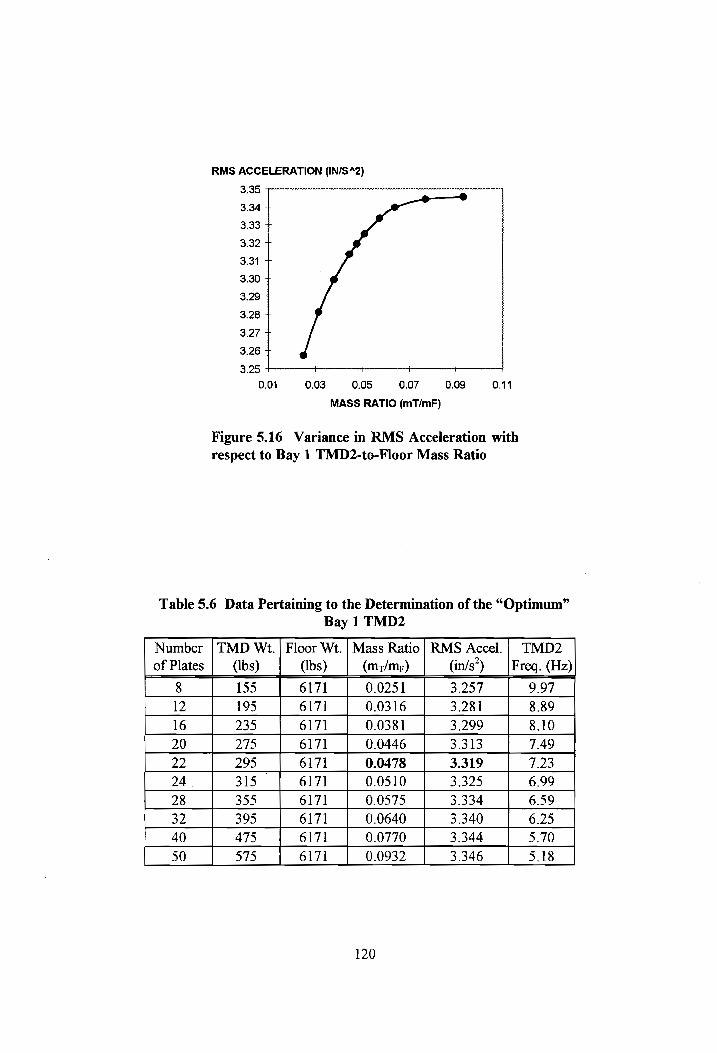
RMS ACCELERATION (IN/S“%2)
3.35
3.34 +
3.33 +
3.32 +
3.31 +
3.30 +
3.29 +
3.28 +
3.27 +
3.26 +
3.25 q r 7 qT
0.01 0.03 0.05 0.07 0.09 0.14
MASS RATIO (mT/mF)
Figure 5.16 Variance in RMS Acceleration with respect to Bay 1 TMD2-to-Floor Mass Ratio
Table 5.6 Data Pertaining to the Determination of the “Optimum” Bay 1 TMD2
Number | TMD Wt. | Floor Wt. | Mass Ratio | RMS Accel. | TMD2
of Plates (Ibs) (Ibs) (m+/mr) (in/s’) Freq. (Hz)
8 155 6171 0.0251 3.257 9.97
12 195 6171 0.0316 3.281 8.89
16 235 6171 0.0381 3.299 8.10
20 275 6171 0.0446 3.313 7.49
22 295 6171 0.0478 3.319 7.23
24 315 | 6171 0.0510 3.325 6.99 28 355 6171 0.0575 3.334 6.59
32 395 6171 0.0640 3.340 6.25
40 475 6171 0.0770 3.344 5.70
50 575 6171 0.0932 3.346 5.18
120

acceleration based on a TMD2 with 22 mass plates is in Figure 5.14c. Comparing Figure 5.14c
with Figures 5.14a and 5.14b, TMD2 seems to have dampened the frequency peak just to the left
of 10 Hz. With 22 mass plates, TMD2 has a mass ratio of 0.0478 and a frequency of 7.23 Hz.
The RMS acceleration calculated at node 94 increased with the placement of TMD1 and
TMD2. The bare floor RMS acceleration at node 94 resulting from heel drop at node 83 was 3.30
in/s’. With TMD1 in place, the RMS acceleration increased to 3.35 in/s*. With TMD2 in place
the RMS acceleration decreased to 3.32 in/s’, which is still not below the bare floor RMS
acceleration. The TMDs could cause a larger response in the higher modes of vibration (i.e.
frequencies larger than 10 Hz); if this is the case, then the floor acceleration would increase, rather
than decrease.
5.5.1.3 TMD3
A third TMD was modeled to determine if it could help control the floor vibrations. This
TMD was placed at node 115, 3 ft south of TMD2. This TMD has the same damping and
stiffness parameters of the prototype Bay 1 TMD3, and the parameters can be found in Table 4.4.
As with TMD2, an “optimum” TMD mass could not be determined for TMD3. Figure
5.17 shows the RMS acceleration versus TMD3-to-floor mass ratio, and Table 5.7 shows the
corresponding data and frequencies. The TMD3 model with 16 mass plates was chosen because of
its low RMS acceleration, and the mass ratio was comparable with the actual TMD3 mass ratio of
0.03706. The model TMD3 has a mass ratio of 0.0381 and a frequency of 8.04 Hz. The RMS
acceleration was reduced to 3.22 in/s?, which is less than the bare floor RMS acceleration of 3.30
in/s’.
12]
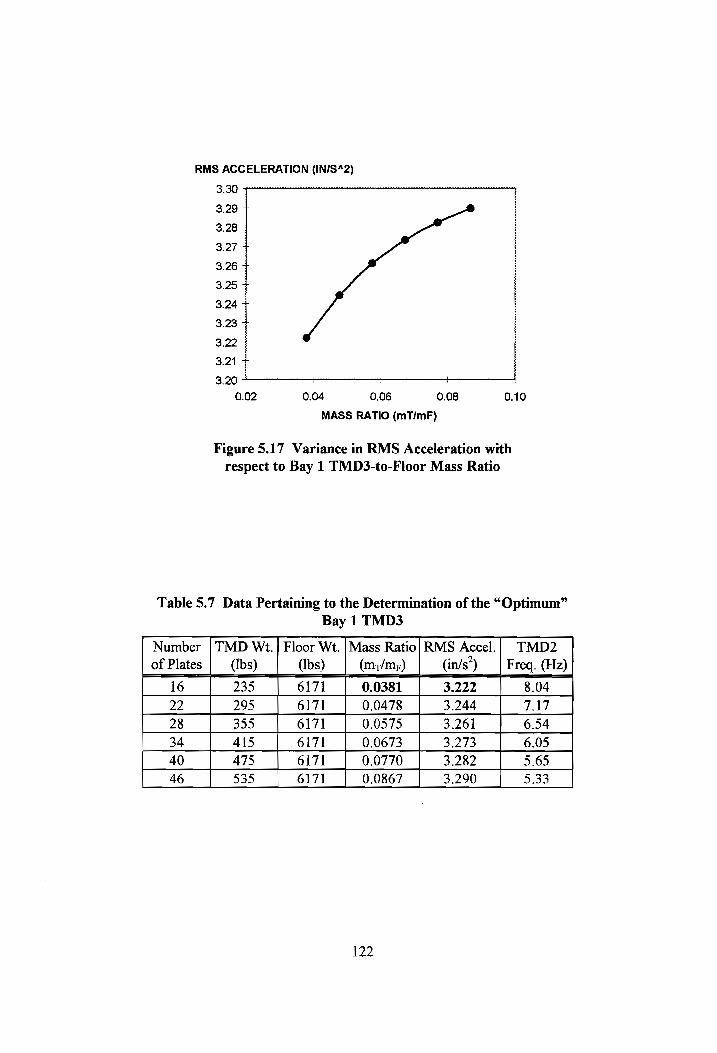
RMS ACCELERATION (IN/S42)
3.30
3.29 +
3.28 +
3.27 +
3.26 +
3.25 +
3.24 +
3.23 +
3.22 +
3.21 + 3.20
0.02 0.04
4 ,
0.06 0.08
MASS RATIO (mT/mF)
0.10
Figure 5.17 Variance in RMS Acceleration with
respect to Bay 1 TMD3-to-Floor Mass Ratio
Table 5.7 Data Pertaining to the Determination of the “Optimum”
Bay 1 TMD3
Number | TMD Wt. | Floor Wt. | Mass Ratio] RMS Accel.| TMD2
of Plates | (Ibs) (Ibs) (m+/mr) (in/s’) | Freq. (Hz)
16 235 6171 0.0381 3.222 8.04 22 295 6171 0.0478 3.244 7.17 28 355 6171 0.0575 3.261 6.54 34 415 6171 0.0673 3.273 6.05 40 475 6171 0.0770 3.282 5.65 46 535 6171 0.0867 3.290 5.33
122

5.6 Summary and Discussion of Results
SAP90 was used to analytically determine the vibration characteristics of the Laboratory
Floor and Bay 1 and Bay 2 of the Office Floor with TMDs in place. The goals of these computer
studies were to determine if TMDs could be analytically “optimized” and to examine how their
placement would affect the floor response and vibration characteristics.
The proposed TMDs for a floor were “optimized” one at a trme. A series of models with a
varying TMD mass was analyzed and the model which resulted in the lowest RMS acceleration
response was chosen as the “optimum” TMD for a floor. After one “optimal” TMD was
determined for a floor, the next TMD was placed on the floor and its mass varied while the
“optimum” TMD remained in place. Once all of the proposed TMDs were placed on the floor and
their “optimum” mass determined, traces of the calculated acceleration data and _ their
corresponding frequency plots were studied to see the improvement made with the TMDs in place.
For each floor model, locations of heel drops and locations for acceleration data
calculation differed. The locations were chosen based on what was shown im the plots in the
frequency domain resulting from acceleration calculations and heel drop placement at these various
locations. If for the frequencies of concern relatively strong frequency peaks were shown in the
plots in the frequency domain, the heel drop and acceleration locations which resulted in the
acceleration that was transformed to this frequency plot were chosen. For all three floors studied,
the RMS acceleration at the point of calculation was reduced when all of the TMDs were in place.
As the number of TMDs increased, the RMS acceleration at the point of calculation
decreased for the Laboratory Floor. Only two TMDs were placed on this floor model. A third
TMD was not placed on the model to control the third natural frequency of 15.20 Hz, as was done
on the experimental floor. Controlling frequencies below 10 Hz was of main concern; however, the
123

two TMDs did result in a decreased vibration response for the third mode of vibration, as well.
The RMS acceleration at an edge joist decreased from 10.91 in/s’ for the bare floor to 6.76 in/s”
with TMD1 and TMD2 tn place.
The RMS acceleration at the point of calculation decreased steadily as TMDs were added
to the Office Floor Bay 2 model. Two TMDs were placed on the floor model to simulate the two
prototype TMDs used to control the first mode of vibration. Together these TMDs reduced the
RMS acceleration from 2.23 in/s’ for the bare floor to 1.34 in/s” with both TMDs in place.
Three TMDs were placed on the Office Floor Bay 1 model to simulate the three prototype
TMDs used experimentally on Bay 1. With TMD1 in place on Bay 1, the calculated RMS
acceleration decreased at the center of the bay, but increased at the node 94 location, which is 6 ft
west of the center of the bay. RMS acceleration was calculated at node 94 because the plot in the
frequency domain for the acceleration response at node 94 shows the fundamental frequency and
other higher mode frequencies of concern. It was desired that these frequencies be controlled. The
RMS acceleration at the center of the bay decreased with the placement of TMD1, but the RMS
acceleration at node 94 increased with the placement of TMD1. From this maximum RMS
acceleration at node 94 with TMD 1 in place, the RMS acceleration decreased with the placement
of TMD2 and TMD3. However, the RMS acceleration at node 94 was not below the bare floor
RMS acceleration at node 94 until all three TMDs were in place. The RMS Acceleration at node
94 decreased from 3.30 in/s* to 3.22 in/s” with three TMDs in place. An “optimum” mass for
TMD2 and TMD3 could not be determined based on the criteria used to determine the other
“optimum” TMDs.
The frequencies of the analytical, “optimal” TMDs and calculated floor frequencies
(SAP90 frequencies) are shown in Table 5.8. As can be seen, frequencies of the first TMD placed
124
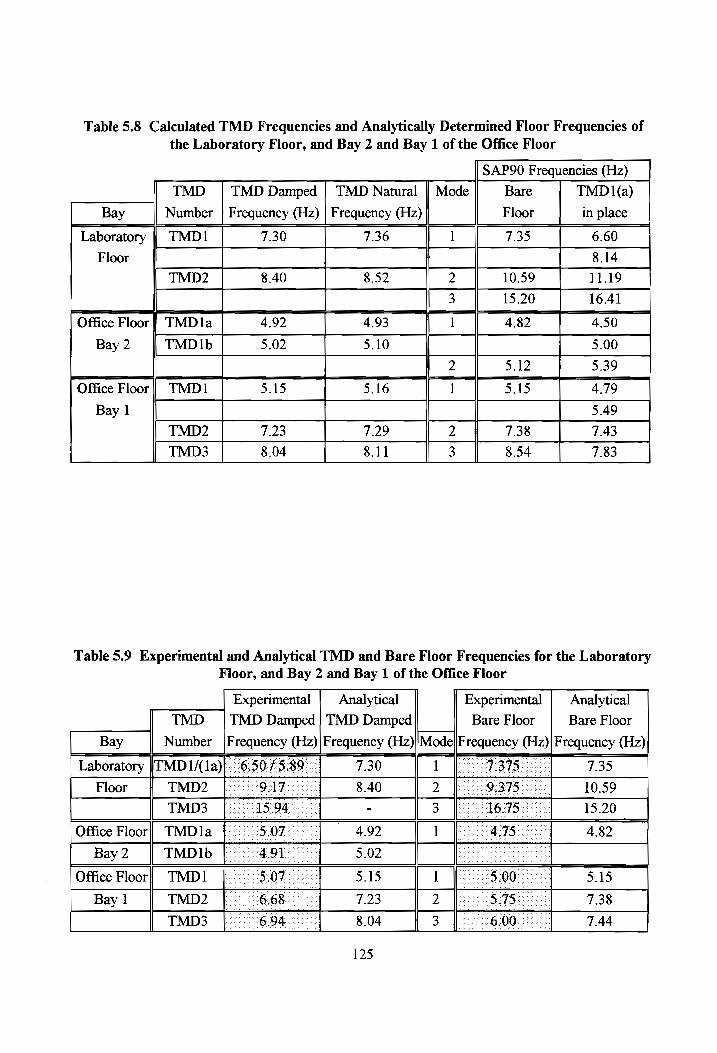
Table 5.8 Calculated TMD Frequencies and Analytically Determined Floor Frequencies of the Laboratory Floor, and Bay 2 and Bay 1 of the Office Floor
SAP90 Frequencies (Hz)
TMD | TMD Damped | TMD Natural || Mode Bare TMD 1 (a)
Bay Number | Frequency (Hz) | Frequency (Hz) Floor in place
Laboratory | TMD1 7.30 7.36 7.35 6.60
Floor 8.14
TMD2 8.40 8.52 10.59 11.19
15.20 16.41
Office Floor | TMD1la 4.92 4.93 4.82 4.50
Bay 2 TMDIb 5.02 5.10 5.00
5.12 5.39
Office Floor || TMD1 5.15 5.16 5.15 4.79
Bay 1 5.49
TMD2 7.23 7.29 7.38 7.43
TMD3 8.04 8.11 8.54 7.83
Table 5.9 Experimental and Analytical TMD and Bare Floor Frequencies for the Laboratory
Floor, and Bay 2 and Bay 1 of the Office Floor
Experimental Analytical Experimental] Analytical
TMD | TMD Damped | TMD Damped Bare Floor Bare Floor
Bay Number |Frequency (Hz)| Frequency (Hz)|Mode||Frequency (Hz)| Frequency (Hz)
Laboratory |TMD1/(1a)|:-°6.50 75:89 7.30 ] 9375 7.35
Floor TMD2 OAT 8.40 2. .9375 - 10.59
TMD3 |. 15.94 - 3 16.75." 15.20 |
Office Floor] TMDla | ~° 5.07 4.92 1 ft. 4,75 © 4.82
Bay 2 TMD1b 491 5.02 ee
Office Floor} TMD1 - 5,07 5.15 ] 5:00" 5.15
Bay 1 TMD2 6.68 7.23 2 5.75: 7.38
TMD3 6.94 °° 8.04 3 6.00 — 7.44
125
on a floor (i.e. TMD1 or TMD 1a) are almost identical to the bare floor natural frequency that it is
meant to control.
The Laboratory Floor TMD2 has a frequency close to the second natural frequency which
resulted with TMD1 in place. When trying to obtain a TMD2 frequency that was closer to the
second natural frequency of 10.59 Hz, the RMS acceleration only continued to increase. For the
prototype TMD2, the frequency was nearer the floor’s second natural frequency; however, there
was also a third prototype TMD on the actual floor, and this could have had an effect on the
prototype TMD2 frequency. Table 5.9 shows the experimental and analytical TMD frequencies
and the experimental and analytical floor frequencies.
For Bay 2, TMD 1b has a frequency similar to the second natural frequency which resulted
with the placement of TMD1a. These TMD frequencies are also similar to the frequencies of the
actual Bay 2 TMDs. These analytical results compare well with the experimental results.
The Bay 1 TMD2 and TMD3 frequencies were close to the third and fourth natural
frequencies of the floor with TMD1 in place. As with the experimental work, controlling the
higher modes of vibration of this office floor bay was difficult.
126

CHAPTER 6
SUMMARY, CONCLUSIONS, AND RECOMMENDATIONS
6.1 Summary
Tuned mass dampers (TMDs) have been used with success when a floor or other structure
has only one mode of vibration that requires control (Bell 1994, Webster and Vaicaitis 1992,
Bachmann and Weber 1995). When two or more modes of vibration require control, effectively
controlling the modes of vibration with multiple TMDs can be challenging. Floor modes of
vibration that are found annoying to humans usually have a frequency below 10 Hz. Only a few
cases concerning the use of TMDs to control two modes of floor vibration have been documented
(Setareh and Hanson 1992a, Webster and Vaicaitis 1992). Only one case concerning the use of
TMDs to control more than two modes of floor vibration has been documented (Thorton et al..
1992), and not many details were given about the design or placement of TMDs to control more
than two modes of vibration. Setareh and Hanson (1992b) have stated that 1f modes which create
annoying vibration have frequencies within 20% of each other, the use of a tuned mass damper can
move the location of peak amplitudes (i.e. change the frequency of other modes of vibration).
Bachmann et al. (1995) have stated that tuned mass dampers do not work well on floors with
relatively high damping ratios and/or closely spaced natural frequencies.
The goal of this research was to perform experimental and analytical studies using TMDs
to control more than one mode of vibration for a floor exhibiting annoying floor vibrations. Tuned
mass dampers can be used to control more than one mode of vibration with success. However, the
amount of success greatly depends on the vibrational characteristics of the floor.
127

6.1.1 Experimental Study
Three prototype TMDs using viscoelastic damping elements were placed on a Laboratory
Floor to control modes of vibration occurring at frequencies of 7.375 Hz, 9.375 Hz, and 16.75 Hz.
The prototype TMDs decreased RMS accelerations due to walking on the Laboratory Floor by a
factor of 3.7 when walking perpendicular to the joists. RMS accelerations due to walking parallel
to the joists were reduced by a factor of 5.5. Well spaced natural frequencies (i.e. at least 2 Hz
between adjacent frequencies) and relatively small damping in this floor made it possible for the
TMDs to greatly improve vibration response.
Prototype TMDs were used to control anywhere from one to three modes of vibration on
three different bays of an office floor. The frequencies which were of concern on these bays ranged
from 4.25 Hz to 8 Hz. TMDs decreased RMS accelerations due to walking by factors ranging
from 1.23 to 1.75. Closely spaced natural frequencies (i.e. usually less than 2 Hz between adjacent
frequencies) and an initial mode 1 damping ratio of approximately 5% made it difficult for the
TMDs to control the floor vibrations as effectively as they did on the Laboratory Floor. The
greatest vibration control was gained for the bay with the smallest area and the most TMDs in
place. For this bay, one TMD was used to control the fundamental mode of vibration and two
TMDs were used to control two higher modes of vibration. TMDs used to control the higher
modes of vibration had “optimum” frequencies which fell between two floor natural frequencies,
and not near a frequency they were designed to control.
6.1.2 Analytical Study
Analytical models of TMDs were placed in the floor models to study control of floor model
frequencies less than 10 Hz. The analytical TMDs were similar to the experimental TMDs, in that
128

they had the same spring stiffness, damping stiffness, and damping coefficient as the experimental
TMDs. Analytical studies were performed for the Laboratory Floor and Bay 1 and Bay 2 of the
office floor.
The “optimum” analytical TMDs were chosen on the basis of which TMD-to-floor mass
ratio resulted in the smallest RMS acceleration response to an analytical heel drop impact. The
mass ratio corresponding to the smallest RMS acceleration response was chosen as the “optimum”
mass ratio. Knowing the “optimum” mass ratio, the “optimum” mass and frequency of the
analytical TMD was determined. The “optimal” analytical TMDs for the first mode of vibration of
all floor models had a calculated frequency near the first mode frequency of the bare floor model.
This was expected based on theoretical calculations introduced in Chapter 2.
The Laboratory Floor TMD2 had a lower than expected frequency of 8.52 Hz. This
frequency was not near the bare floor mode 2 frequency of 10.59 Hz, but near the mode 2
frequency of the floor resulting from the placement of analytical TMD1 in the model; this mode 2
frequency occurred at 8.14 Hz. An optimum TMD could not be determined for TMD2 and TMD3
of Bay 1, but masses for these TMDs were chosen and the RMS acceleration decreased. Only one
mode of vibration was controlled in Bay 2. The analytical TMDs for Bay 2 performed as
expected.
The analytical work had some results similar to the experimental work. Correlations
between the TMD1, TMD1a, and TMD 1b frequencies and the bare floor first mode frequencies
were similar for the analytical and experimental work for the office floor Bay 1 and Bay 2. Also,
the analytical TMD3 for Bay 1 had a frequency higher than the analytical floor frequency that it
was designed to control; this similar trend also occurred in the experimental work with TMD3.
Had a smaller mass been chosen for the analytical TMD2 of Bay 1, this same trend might have
129

occurred, and it would have been similar to the experimental TMD2 trend (i.e. a TMD frequency
higher than the frequency of the floor mode of vibration which it was designed to control). Results
of analytical and experimental work on the Laboratory Floor were not similar; this is most likely
due to the fact that a third TMD, TMD3, was used experimentally to control floor vibrations and
was “optimized” before the experimental TMD2 was placed on the floor and “optimized”.
6.2 Conclusions
The floor vibrations of a floor with relatively low damping (e.g. ranging from 1.3% to
2.3%) and well-spaced frequencies (e.g. the Laboratory Floor) can be successfully controlled with
tuned mass dampers. When more than one mode of vibration needs to be controlled on a floor with
relatively high damping (e.g. 5%) and closely-spaced frequencies (e.g. the office floor Bays 1, 2,
and 3), gaiming control of floor vibration with tuned mass dampers can be difficult, but it is
possible.
Tuned mass dampers are able to control more than one mode of vibration with success.
The RMS acceleration due to walking on a floor decreases as more TMDs are placed on a floor to
control more modes of vibration. This was demonstrated in Bay 1 of the office floor. This bay
had three TMDs to control three modes of vibration. The other bays of the office floor only had
one or two TMDs to control one or two modes of vibration. The RMS acceleration was reduced
by the greatest factor in the bay with the most TMDs and, consequently, the largest cumulative
TMD-to-floor mass ratio.
Reduction in acceleration reflects improved control of floor vibration; however, if a floor
has relatively high damping and closely spaced natural frequencies, a subjective evaluation of
130

TMD effectiveness should also be performed by the occupants. If the occupants are not satisfied
by the reduction in floor vibrations with the placement of TMDs, the TMDs will not be of value.
6.3 Reccommendations for Further Research
It is recommended that further experimental and analytical testing be performed using
tuned mass dampers to control more than one mode of vibration. Further experimental testing
should be performed with more than three TMDs available. With more TMDs available, more
TMD mass can be provided for larger bay areas and more modes of vibration can be controlled.
Also, further experimental testing should be performed on other occupied office floors to verify the
ability of TMDs to control two or more modes of vibration.
Using the calculated acceleration response to an analytical heel drop impact, the optimum
TMD2 and TMD3 models of Bay 1 of the office floor could not be determined. Analytical tests
should be performed to see if a dynamic impact representing a person walking is better suited to
determining the “optimum” TMD.
Usually the TMD to control the fundamental mode of vibration is first placed on a floor
and tuned. Once this TMD is tuned, it is left on the floor and the next TMD is placed on the floor
and tuned. Further study should be done using analytical models to determine the best order of
TMD placement, and to study the effects of this TMD placement order on a floor’s vibration
characteristics.
131

REFERENCES
Abbas, H., and Kelly J. M. (1993). “A Methodology for Design of Viscoelastic Dampers in
Earthquake-Resistant Structures.” Report No. UCB/EERC-93/09. Earthquake Engineering
Research Center, University of California at Berkeley.
Allen, D. E. (1990). “Building Vibrations from Human Activities.” Concrete International:
Design and Construction, American Concrete Institute, vol. 12, no. 6. 66-73.
Allen, D. E., and Murray, T. M. (1993). “Design Criterion for Vibrations Due to Walking.”
AISC Engineering Journal, 4th qtr. 117-129.
Allen, D. L. (1974). “Vibrational Behavior of Long-Span Floor Slabs.” Canadian Journal of Civil Engineering, vol. 1, no. 1. 108-115.
Bachmann, Hugo, et al. (1995). Vibration Problems In Structures: Practical Guidelines,
Birkhauser Verlag. Basel; Boston; Berlin.
Bachmann, H., and Weber, B. (1995). “Tuned Vibration Absorbers for ‘Lively’ Structures.”
Structural Engineering International, January. 31-36.
Bell, D. H. (1994). “A Tuned Mass Damper to Control Occupant Induced Floor Vibration.”
Proceedings of the Eighteenth Annual Meeting of the Vibration Institute, Willowbrook, Illinois, June 21-23. 181-185.
Chopra, A. K. (1995). Dynamics of Structures: Theory and Applications to Earthquake
Engineering, Prentice-Hall, Inc. Englewood Cliffs, New Jersey.
Den Hartog, J. P. (1934). Mechanical Vibrations, McGraw-Hill Book Company, Inc. New York
and London.
Ellingwood, B., and Tallin, A. (1984). “Structural Serviceability: Floor Vibrations.” Journal of
Structural Engineering, ASCE, vol. 110, no. 2. 401-419.
Hanagan, L. M. (1994). “Active Control of Floor Vibrations.” Ph.D. dissertation, Virginia
Polytechnic Institute and State University, Blacksburg, Virginia.
Hanes, R. M. (1970). “Human Sensitivity to Whole-Body Vibration in Urban Transportation
Systems: A Literature Review.” Applied Physics Laboratory, The John Hopkins University, Silver Springs, Maryland.
Inman, D. J. (1994). Engineering Vibration, Prentice-Hall, Inc. Englewood Cliffs, New Jersey.
Lenzen, K. H. (1966). “Vibration of Steel Joist - Concrete Slab Floors.” AJSC Engineering
Journal, vol. 3, 3rd qtr. 133-136.
132
Load and Resistance Factor Design Specification for Structural Steel Buildings (1993),
American Institute of Steel Construction, Inc. Chicago, IL.
Meirovitch, L. (1986). Elements of Vibration Analysis, McGraw Hill, Inc. New York, NY.
Murray, T. M. (1991). “Building Floor Vibrations.” AISC Engineering Journal, vol. 28, 3rd qtr.
102-109.
Murray, T. M. (1979). “Acceptability Criteria for Occupant-Induced Floor Vibrations.” Sound
and Vibration, November, 24-30.
Murray, T. M. (1975). “Design to Prevent Floor Vibrations.” AJSC Engineering Journal, vol.
12, 3rd qtr. 82-87
National Building Code of Canada (1985). “Commentary A.” The Supplement to the National
Building Code of Canada, Ottawa, Ontario. 146-152.
Setareh, M., and Hanson, R. D. (1992a). “Tuned Mass Dampers for Balcony Vibration Control.”
Journal of Structural Engineering, ASCE, vol. 118, no. 3. 723-740.
Setareh, M., and Hanson, R. D. (1992b). “Tuned Mass Dampers to Control Floor Vibration from
Humans.” Journal of Structural Engineering, ASCE, vol. 118, no. 3. 741-762.
Setareh, M., Hanson, R. D., and Peek, R. (1992). “Using Component Mode Synthesis and Static
Shapes for Tuning TMDs.” Journal of Structural Engineering, ASCE, vol. 118, no. 3. 763-782.
Shope, R.L., and Murray, T. M. (1994). “Using Tuned Mass Dampers to Eliminate Annoying Floor Vibrations.” Proceedings of Structures Congress XHf, ASCE, vol. 1. 339-348.
Thorton, C. H., Cuoco, D. A., and Velivasakis, E. E. (1990). “Taming Structural Vibrations.”
Civil Engineering, November. 57-59.
Webster, A. C., and Vaicaitis, R. (1992). “Application of Tuned Mass Dampers to Control
Vibrations of Composite Floor Systems.” AJSC Engineering Journal, 3rd gtr. 116-124.
Wilson, E. L., and Habibullah, A. (1986). “SAP80, Structural Analysis Programs - a series of
computer programs for the static and dynamic finite element analysis of structures.” Computers & Structures, Inc., Berkeley, CA.
Wilson, E. L., and Habibullah, A. (1995). SAP90° v. 6.0 Beta Release User's Manual,
Computers & Structures, Inc., Berkeley, CA.
133

APPENDIX A
Concrete Properties:
from tests (Hanagan 1994): f,, = 4100 psi & w= 115.7 pef
E, = 33w,'° Jf! =33(115.7)' ¥4100 = 2,630,000 psi
- E,/ _ 29,000 _
Determination of Laboratory Floor Section Properties Used in SAP90 Model
average thickness = 3 in. 21/2" 1"
weight/volume = W = concrete + steel deck
= 115.7 pef + C1 psf)/(0.25 ft) = 119.7 pef
= 0.06927083 Ib/in’
mass/volume = M = W/g
= 0.06927083/(386.4in/s’) = 0.00017927 lb-s’/in*
Joist Properties:
The joists are assumed to act compositely with the concrete.
16K4: Acg= 1.218 in? d= 16” weight = 7 pif Lege= 67.3 in® ¥ = 7.168"
from tests (Hanagan 1994): I; = 80.1 in’
weight/volume = W = a / 1.218 in* = 0.4789272 Ib/in’
mass/volume = M = W/g = 0.4789272/386.4 = 0.00123946 Ib-s’/in*
interior joist -
effective width (Allen & Murray 1993),b = s < 0.4L,
134

b = 30" 0.4(25x12") = 120"
30"
A, = (25 x30") =6818 in’
2 1/2" 1"
7. 168", We
N.A. of Joist
y, = 1.25" | IL
6.818(1.25) + 1.218(3.5 + 7.168)
6.818 + 1.218 = 2.677"
y=
Jit, = moment of inertia of composite section - moment of inertia of concrete
1 43 = I, “ ers bd ) concrete
note: SAP90 takes into account the moment of mertia of the concrete plate
element; therefore it can be neglected in the calculation of Ij, for the interior and exterior joist.
I, = 80.1in* + 1.218in?(3.5" + 7.168" - 2.677")* + 6.818in?(2.677" - 1.25")?
I, = 171.8 in*
exterior joist -
effective width, b = 5 Pie join + OVerhang
b= 15"+ 6” 51"
, 6" ,
A, = L(25"x2I") =4.773in? ft 11 21/2" 1
1"
7. 168" | as
N.A. of Joist
¥, = 1.25" aL
135
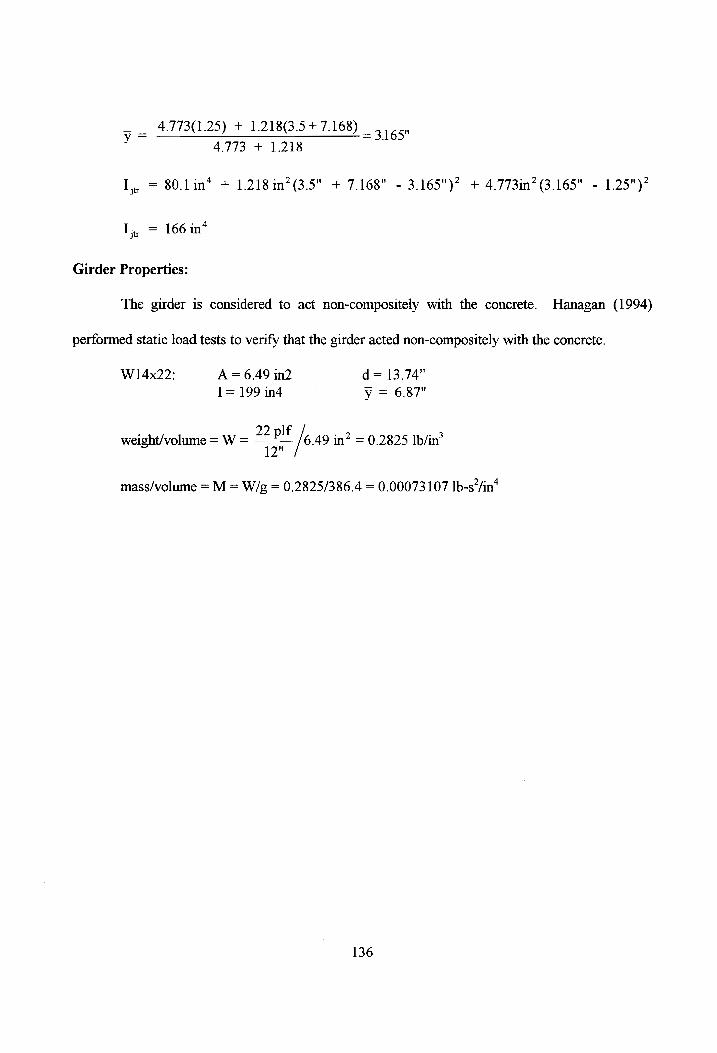
4.773(1.25) + 1.218(3.5 + 7.168)
4.773 + 1.218 = 3.165" y =
I, = 80.lin* + 1.218in?(3.5" + 7.168" - 3.165")? + 4.773in?(3.165" - 1.25")? jtr
166 in*
Girder Properties:
The girder is considered to act non-compositely with the concrete. Hanagan (1994)
performed static load tests to verify that the girder acted non-compositely with the concrete.
W 14x22: A= 6.49 in2 d= 13.74” I = 199 in4 y = 6.87"
_ 22 pif weight/volume = W / 6.49 in? = 0.2825 Ib/in’
12"
mass/volume = M = W/g = 0.2825/386.4 = 0.00073107 Ib-s’/in*
136
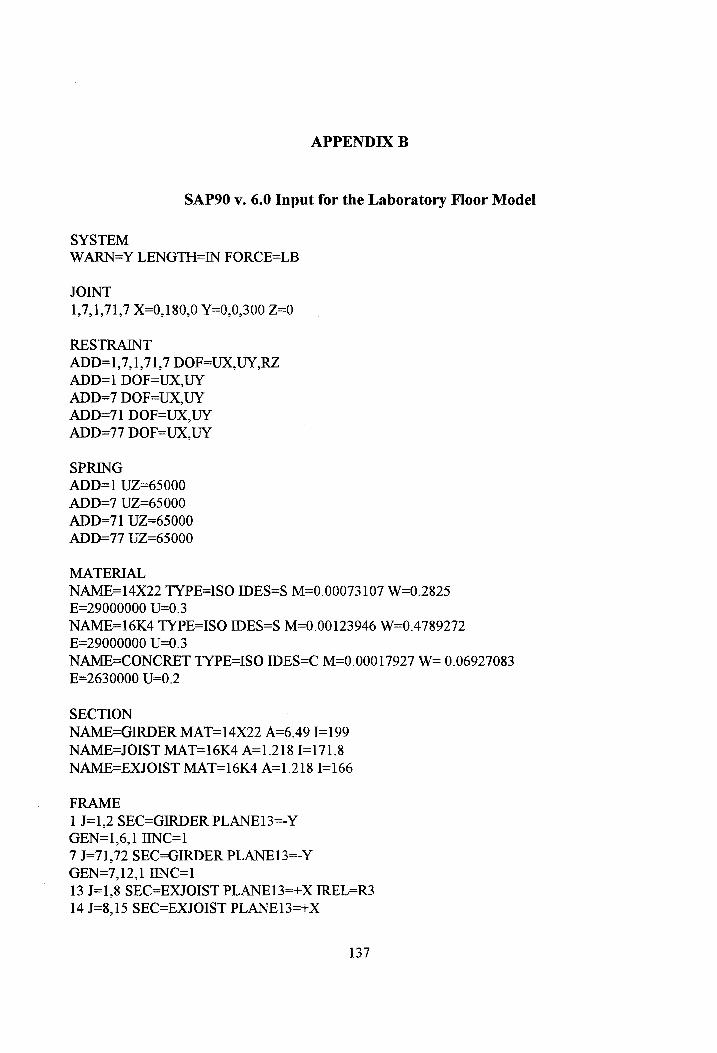
APPENDIX B
SAP90 v. 6.0 Input for the Laboratory Floor Model
SYSTEM
WARN=Y LENGTH=IN FORCE=LB
JOINT
1,7,1,71,7 X=0,180,0 Y=0,0,300 Z=0
RESTRAINT ADD=1,7,1,71,7 DOF=UX,UY,RZ ADD=1 DOF=UX,UY ADD=7 DOF=UX,UY ADD=71 DOF=UX,UY ADD=77 DOF=UX,UY
SPRING
ADD=1 UZ=65000
ADD=7 UZ=65000
ADD=71 UZ=65000
ADD=77 UZ=65000
MATERIAL
NAME=14X22 TYPE=ISO IDES=S M=0.00073107 W=0.2825
E=29000000 U=0.3
NAME=16K4 TYPE=ISO IDES=S M=0.00123946 W=0.4789272
E=29000000 U=0.3
NAME=CONCRET TYPE=ISO IDES=C M=0.00017927 W= 0.06927083
E=2630000 U=0.2
SECTION NAME=GIRDER MAT=14X22 A=6.49 J=199 NAME=JOIST MAT=16K4 A=1.218 I=171.8 NAME=EXJOIST MAT=16K4 A=1.218 I=166
FRAME 1 J=1,2 SEC=GIRDER PLANE13=-Y GEN=1,6,1 IINC=1 7 J=71,72 SEC=GIRDER PLANE13=-Y GEN=7,12,1 IINC=1 13 J=1,8 SEC=EXJOIST PLANE13=+X IREL=R3 14 J=8,15 SEC=EXJOIST PLANE13=+X
137

GEN=14,21,1 IINC=7 JINC=7 22 J=64,71 SEC=EXJOIST PLANE13=+X JREL=R3 23 J=2,9 SEC=JOIST PLANE13=+X IREL=R3 24 J=9,16 SEC=JOIST PLANE13=+X GEN=24,31,] IINC=7 JINC=7 32 J=65,72 SEC=JOIST PLANE13=+X JREL=R3 33 J=3,10 SEC=JOIST PLANE13=+X IREL=R3 34 J=10,17 SEC=JOIST PLANE13=+X GEN=34,41,1 IINC=7 JINC=7 42 J=66,73 SEC=JOIST PLANE13=+X JREL=R3 43 J=4,11 SEC=JOIST PLANE13=+X IREL=R3 44 J=11,18 SEC=JOIST PLANE13=+X GEN=44,51,1 IINC=7 JINC=7 52 J=67,74 SEC=JOIST PLANE13=+X JREL=R3 53 J=5,12 SEC=JOIST PLANE13=+X IREL=R3 54 J=12,19 SEC=JOIST PLANE13=+X GEN=54,61,1 IINC=7 JINC=7 62 J=68,75 SEC=JOIST PLANE13=+X JREL=R3 63 J=6,13 SEC=JOIST PLANE13=+X IREL=R3 64 J=13,20 SEC=JOIST PLANE13=+X GEN=64,71,1 IINC=7 JINC=7 72 J=69,76 SEC=JOIST PLANE13=+X JREL=R3 73 J=7,14 SEC=EXJOIST PLANE13=+X IREL=R3 74 J=14,21 SEC=EXJOIST PLANE13=+X GEN=74,81,1 IINC=7 JINC=7 82 J=70,77 SEC=EXJOIST PLANE13=+X JREL=R3
SHELL
1 J=1,2,8,9 TYPE=P MAT=CONCRET TH=3 PLANE3 1=0
GEN=1,6,1,55,6 JINC=1,7
_ LOAD NAME=HD TYPE=FORCE ADD=26 UZ=-600
MODES TYPE=EIGEN N=10
FUNCTION NAME=HDRAMP DT=0.005 NPL=11 1.9.8.7.6.5.4.3.2.10
HISTORY
NAME=TIME TYPE=LIN NSTEP=1024 DT=1/128 NMODE=10 DAMP=0.015
LOAD=HD FUNC=HDRAMP AT=1
138

OUTPUT ELEM=JOINT OUT=DISP,REAC LOAD=HD MODE=1,2,3,4 ADD=*
END
139

APPENDIX C
Determination of Initial and Final Properties for Laboratory Floor TMD1
Initial Properties:
from floor vibrations measurements: f; = 7.375 Hz
from SAP90 eigenvalue analysis: wr; = 6398 Ibs
chosen by 3M Corporation: wr = 365 lbs
note: the imner frame of the TMD weighs 75 pounds. This results in a required
plate weight of 290 pounds, which means 29 plates are required for the TMD.
from Equation 2.3, p = 369 = 0.057049 6398
—__ 7.375Hz = 6.98Hz 1 + 0.057049
from Equation 2.15, Gostimal = _ sone = 0.134585 8(1 + 0.057049)
from Equation 2.11 and 2.6, f, = 7.375Hz,/1-(0.134585)* =691Hz
from Equation 2.14, foosimal = (
note: Since the damping ratio has a minimal effect on the TMD frequency, the
damped frequency will not be determined using actual TMD properties.
; [k from Equations 2.11 and 2.5,0, = J/—> >k, =m,0, = “T y (2m)?
My g
k, = 2028 _ (2mx6.91Hz)? = 1783.4 1b/in 386.4 in/s
140

from Equations 2.9 and 2.10, ¢ = 5 © 36 = C optimal (2M 7@ , ) mo
n
WwW
c= C optimal! (2 S x2nf ptimal ) Oo
365 Ibs 3864in/S x2mx6 98H] = 11.146
41n/S c = 0. 134585x{ 22
Final Properties:
number of 10 Ib plates = 29: wy = (29 x 10 lbs) + 75 Ibs = 365 Ibs
from Equation 2.3, p= 369. = 0.057049 6398
manufactured springs: ks = 1164 Ib/in
damping element properties, as designed by 3M Corporation, (Abbas and Kelly 1993):
G’ = shear storage modulus = 46 psi
eta = 1 (not used in these calculations, but used by 3M Corporation to determine other viscoelastic damping element properties)
t = thickness = 0.5”
A=area=45 in’
G'A _ (46psi)x(4.5in’ ) — 414Ib /in kd = damping element stiffness =
0.5"
ky = ks + kd = 1164 Ib/in + 414 Ib/in = 1578 Ib/in
from Equation 2.5, firm = J [kr 1 Kr 2m \ m, 2% \w, /g
f 1 / 1578 Ib/in pcos uy ~ 2n \ 365 1b/386.4 in/s?
damping coefficient (Abbas and Kelly 1993):
141

Cr = damping coefficient = kd = kd 414 Ib/in = = 10.12919
@amp 2% 2 26.505 Hz)
142

APPENDIX D
SAP90 v. 6.0 Input for the Office Floor Models
SAP90 Input for Bay 1
SYSTEM
WARN=Y LENGTH=IN FORCE=LB
JOINT
1,11,1,111,11 X=0,360,0 Y=0,0,360 Z=0
RESTRAINT ADD=1,11,1,221,11 DOF=UX,UY,RZ ADD=1 DOF=UX,UY,UZ,RZ ADD=11 DOF=UX,UY,UZ,RZ ADD=111 DOF=UX,UY,UZ,RZ ADD=121 DOF=UX,UY,UZ,RZ
SPRING
ADD=1,111,11 RY=1000000000000
ADD=11,121,11 RY=1000000000000
MASS ADD=1 UZ=9*9.75/386.4+0.579 ADD=12,23,11 UZ=9*19.5/386.4+1.158 ADD=34 UZ=9*19.5/386.4+0.864 ADD=45 UZ=9*34.5/386.4+1.462 ADD=56,67,11 UZ=9*34.5/386.44+2.355 ADD=78 UZ=9*49.5/386.4+4.236 ADD=89,100,11 UZ=9*49,5/386.4+3.6065 ADD=111 UZ=9*454.5/386.44+3.74428 ADD=11 UZ=9*24.75/386.4+1.786 ADD=22,110,11 UZ=9*49.5/386.4+3.572 ADD=121 UZ=9*454.5/386.4+3.72728 ADD=112,120,1 UZ=9*9/386.4+0.31056 ADD=2,10,1 UZ=9*4.5/386.4 ADD=13,21,1 UZ=9*9/386.4 ADD=24,32,1 UZ=9*9/386.4 ADD=35,43,1 UZ=9*9/386.4 ADD=46,54,1 UZ=9*9/386.4 ADD=57,65,1 UZ=9*9/386.4 ADD=68,76,1 UZ=9*9/386.4
143
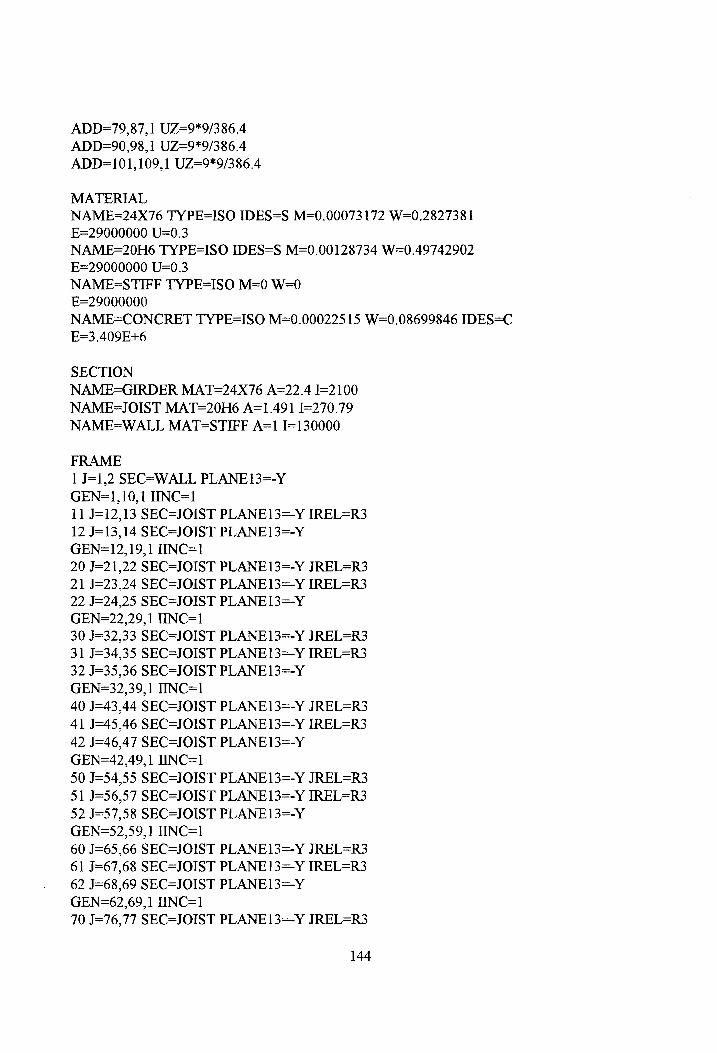
ADD=79,87, 1 UZ=9*9/386.4 ADD=90,98, 1 UZ=9*9/386.4 ADD=101,109,1 UZ=9*9/386.4
MATERIAL
NAME=24X76 TYPE=ISO IDES=S M=0.00073172 W=0.2827381
E=29000000 U=0.3
NAME=20H6 TYPE=ISO IDES=S M=0.00128734 W=0.49742902
E=29000000 U=0.3
NAME=STIFF TYPE=ISO M=0 W=0
E=29000000
NAME=CONCRET TYPE=ISO M=0.00022515 W=0.08699846 IDES=C
E=3.409E+6
SECTION NAME=GIRDER MAT=24X76 A=22.4 J=2100 NAME=JOIST MAT=20H6 A=1.491 J=270.79 NAME=WALL MAT=STIFF A=1 I=130000
FRAME
1 J=1,2 SEC=WALL PLANE13=-Y
GEN=1,10,1 IINC=1
11 J=12,13 SEC=JOIST PLANE13=-Y IREL=R3
12 J=13,14 SEC=JOIST PLANE13=-Y
GEN=12,19,1 IINC=1
20 J=21,22 SEC=JOIST PLANE13=-Y JREL=R3
21 J=23,24 SEC=JOIST PLANE13=-Y IREL=R3
22 J=24,25 SEC=JOIST PLANEI3=-Y
GEN=22,29,1 TINC=1
30 J=32,33 SEC=JOIST PLANE13=-Y JREL=R3
31 J=34,35 SEC=JOIST PLANE13=-Y IREL=R3
32 J=35,36 SEC=JOIST PLANE13=-Y
GEN=32,39,1 IINC=1
40 J=43,44 SEC=JOIST PLANE13=-Y JREL=R3
41 J=45,46 SEC=JOIST PLANE13=-Y IREL=R3
42 J=46,47 SEC=JOIST PLANE13=-Y
GEN=42,49, 1 TINC=1
50 J=54,55 SEC=JOIST PLANE13=-Y JREL=R3
51 J=56,57 SEC=JOIST PLANE13=-Y IREL=R3
52 J=57,58 SEC=JOIST PLANE13=-Y
GEN=52,59,1 IINC=1
60 J=65,66 SEC=JOIST PLANE13=-Y JREL=R3
61 J=67,68 SEC=JOIST PLANE13=-Y IREL=R3
62 J=68,69 SEC=JOIST PLANE13=-Y
GEN=62,69,1 IINC=1
70 J=76,77 SEC=JOIST PLANE13=-Y JREL=R3
144

71 J=78,79 SEC=JOIST PLANE13=-Y IREL=R3 72 J=79,80 SEC=JOIST PLANE13=-Y GEN=72,79,1 IINC=1 80 J=87,88 SEC=JOIST PLANE13=-Y JREL=R3 81 J=89,90 SEC=JOIST PLANE13=-Y IREL=R3 82 J=90,91 SEC=JOIST PLANE13=-Y GEN=82,89,1 IINC=1 90 J=98,99 SEC=JOIST PLANE13=-Y JREL=R3 91 J=100,101 SEC=JOIST PLANE13=-Y IREL=R3 92 J=101,102 SEC=JOIST PLANE13=-Y GEN=92,99,1 IINC=1 100 J=109,110 SEC=JOIST PLANE13=-Y JREL=R3 101 J=111,112 SEC=JOIST PLANE13=-Y IREL=R3 102 J=112,113 SEC=JOIST PLANE13=-Y GEN=102,109,1 IINC=1 110 J=120,121 SEC=JOIST PLANE13=-Y JREL=R3 111 J=1,12 SEC=GIRDER PLANE13=+X IREL=R3 112 J=12,23 SEC=GIRDER PLANE13=+X GEN=112,119,1 IINC=11 JINC=11 120 J=100,111 SEC=GIRDER PLANE13=+X JREL=R3 121 J=11,22 SEC=GIRDER PLANE13=+X IREL=R3 122 J=22,33 SEC=GIRDER PLANE13=+X GEN=122,129,1 IINC=11 JINC=11 130 J=110,121 SEC=GIRDER PLANE13=+X JREL=R3
SHELL 1 J=1,2,12,13 TYPE=P MAT=CONCRET TH=2.25 PLANE31=0 GEN=1,10,1,91,10 JINC=1,11
LOAD NAME=HD TYPE=FORCE ADD=61 UZ=-600
MODES TYPE=EIGEN N=10
FUNCTION
NAME=HDRAMP DT=0.005 NPL=11
1.9.8.7.6.5.4.3.2.10
HISTORY
NAME=TIME TYPE=LIN NSTEP=1024 DT=1/128 NMODE=10 DAMP=0.05
LOAD=HD FUNC=HDRAMP AT=1
OUTPUT
145

ELEM=JOINT OUT=DISP,REAC LOAD=HD MODE=1,2,3,4 ADD=*
END
146
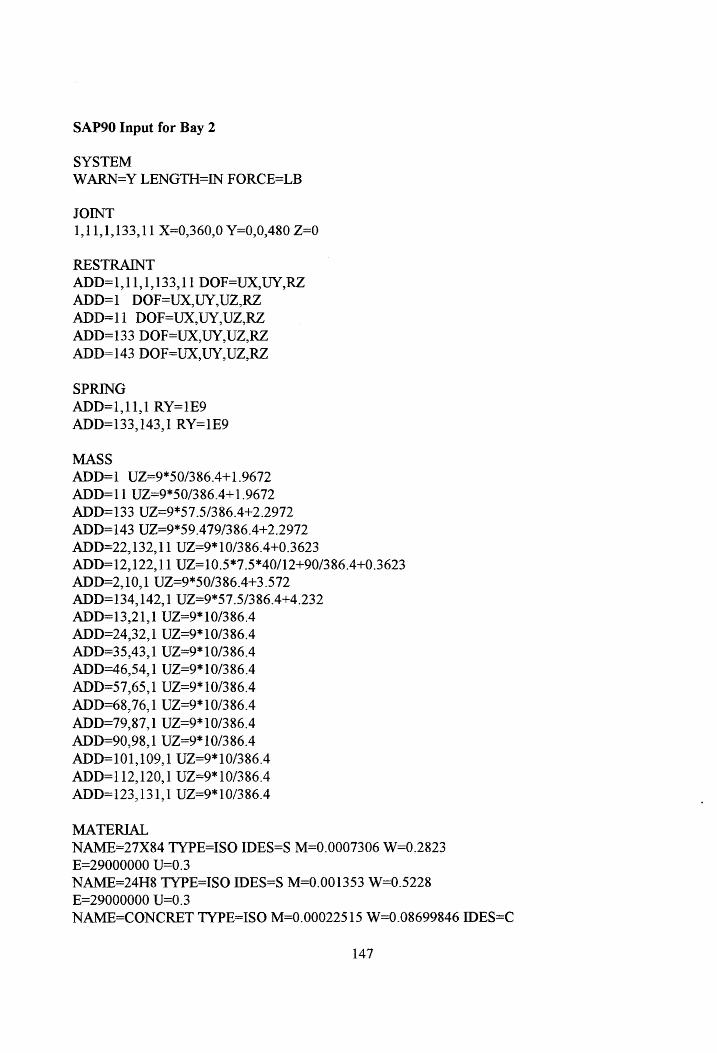
SAP90 Input for Bay 2
SYSTEM
WARN=Y LENGTH=IN FORCE=LB
JOINT
1,11,1,133,11 X=0,360,0 Y=0,0,480 Z=0
RESTRAINT ADD=1,11,1,133,11 DOF=UX,UY,RZ ADD=1 DOF=UX,UY,UZ,RZ ADD=11 DOF=UX,UY,UZ,RZ ADD=133 DOF=UX,UY,UZ,RZ ADD=143 DOF=UX,UY,UZ,RZ
SPRING ADD=1,11,1 RY=1E9 ADD=133,143,1 RY=1E9
MASS ADD=1 UZ=9*50/386.4+1.9672 ADD=11 UZ=9*50/386.4+1.9672 ADD=133 UZ=9*57.5/386.4+2.2972 ADD=143 UZ=9*59.479/386.4+2.2972 ADD=22,132,11 UZ=9*10/386.4+0.3623 ADD=12, 122,11 UZ=10.5*7.5*40/12+90/386.4+0.3623 ADD=2,10,1 UZ=9*50/386.44+3.572 ADD=134,142,1 UZ=9*57.5/386.4+4.232 ADD=13,21,1 UZ=9*10/386.4 ADD=24,32,1 UZ=9*10/386.4 ADD=35,43,1 UZ=9*10/386.4 ADD=46,54,1 UZ=9*10/386.4 ADD=57,65,1 UZ=9*10/386.4 ADD=68,76,1 UZ=9*10/386.4 ADD=79,87,1 UZ=9*10/386.4 ADD=90,98,1 UZ=9*10/386.4 ADD=101,109,1 UZ=9*10/386.4 ADD=112,120,1 UZ=9*10/386.4 ADD=123,131,1 UZ=9*10/386.4
MATERIAL
NAME=27X84 TYPE=ISO IDES=S M=0.0007306 W=0.2823
E=29000000 U=0.3
NAME=24H8 TYPE=ISO IDES=S M=0.001353 W=0.5228
E=29000000 U=0.3
NAME=CONCRET TYPE=ISO M=0.00022515 W=0.08699846 IDES=C
147

E=3 .409E+6
SECTION
NAME=GIRDER MAT=27X84 A=24.8 J=2850
NAME=JOIST MAT=24H8 A=1.833 I=464.72
NAME=STIFJST MAT=24H8 A=1.833 1=4647.20
FRAME
1 J=1,2 SEC=GIRDER PLANE13=-Y
GEN=1,10,1 IINC=1
1] J=133,134 SEC=GIRDER PLANE13=-Y
GEN=11,20,1 IINC=1
21 J=1,12 SEC=STIFIST PLANE13=+X IREL=R3
22 J=12,23 SEC=STIFJST PLANE13=+X
GEN=22,31,1 WNC=11 JINC=11
32 J=122,133 SEC=STIFIST PLANE13=+X JREL=R3
33 J=2,13 SEC=JOIST PLANE13=+X IREL=R3
34 J=13,24 SEC=JOIST PLANE13=+X
GEN=34,43,1 IINC=11 JINC=11
44 J=123,134 SEC=JOIST PLANE13=+X JREL=R3
45 J=3,14 SEC=JOIST PLANE13=+X IREL=R3
46 J=14,25 SEC=JOIST PLANE13=+X
GEN=46,55,1 IINC=11 JINC=11
56 J=124,135 SEC=JOIST PLANE13=+X JREL=R3
57 J=4,15 SEC=JOIST PLANE13=+X IREL=R3
58 J=15,26 SEC=JOIST PLANE13=+X
GEN=58,67,1 IINC=11 JINC=11
68 J=125,136 SEC=JOIST PLANE13=+X JREL=R3
69 J=5,16 SEC=JOIST PLANE13=+X IREL=R3
70 J=16,27 SEC=JOIST PLANE13=+X
GEN=70,79, 1 IINC=11 JINC=11
80 J=126,137 SEC=JOIST PLANE13=+X JREL=R3
81 J=6,17 SEC=JOIST PLANE13=+X IREL=R3
82 J=17,28 SEC=JOIST PLANE13=+X
GEN=872,91,1 IINC=11 JINC=11
92 J=127,138 SEC=JOIST PLANE13=+X JREL=R3
93 J=7,18 SEC=JOIST PLANE13=+X IREL=R3
94 J=18,29 SEC=JOIST PLANE13=+X
GEN=94,103,1 IINC=11 JINC=11
104 J=128,139 SEC=JOIST PLANE13=+X JREL=R3
105 J=8,19 SEC=JOIST PLANE13=+X IREL=R3
106 J=19,30 SEC=JOIST PLANE13=+X
GEN=106,115,1 IINC=11 JINC=11
116 J=129,140 SEC=JOIST PLANE13=+X JREL=R3
117 J=9,20 SEC=JOIST PLANE13=+X IREL=R3
118 J=20,31 SEC=JOIST PLANE13=+X
148

GEN=118,127,1 IINC=11 JINC=11
128 J=130,141 SEC=JOIST PLANE13=+X JREL=R3
129 J=10,21 SEC=JOIST PLANE13=+X IREL=R3
130 J=21,32 SEC=JOIST PLANE13=+X
GEN=130,139,1 IINC=11 JINC=11
140 J=131,142 SEC=JOIST PLANE13=+X JREL=R3
141 J=11,22 SEC=JOIST PLANE13=+X IREL=R3
142 J=22,33 SEC=JOIST PLANE13=+X
GEN=142,151,1 IINC=11 JINC=11
152 J=132,143 SEC=JOIST PLANE13=+X JREL=R3
SHELL 1 J=1,2,12,13 TYPE=P MAT=CONCRET TH=2.25 PANE31=0 GEN=1,10,1,111,10 JINC=1,11
LOAD NAME= TYPE=FORCE ADD=72 UZ=-600
MODES
TYPE=RITZ N=10
LOAD=HD
FUNCTION
NAME=HDRAMP DT=0.005 NPL=11
1.9.8.7.6.5 4.3.2 .10
HISTORY NAME=TIME TYPE=LIN NSTEP=1024 DT=1/128 NMODE=10 DAMP=0.05 LOAD=HD FUNC=HDRAMP
OUTPUT ELEM-JOINT OUT=DISP,REAC LOAD=HD MODE=1,2,3,4 ADD=*
END
149

SAP90 Input for Bay 3
SYSTEM
WARN=Y LENGTH=IN FORCE=LB
JOINT 1,13,1,131,13 X=0,420,0 Y=0,0,360 Z=0 144,156,1,157,13 K=0,420,0 Y=385,385,410 Z=0 170,182,1,183,13 X=0,420,0 Y=440,440,470 Z=0 196,203,1 X=420,420 Y=500,710 Z=0
RESTRAINT ADD=1,13,1,183,13 DOF=UX,UY,RZ ADD=196,202,1 DOF=UX,UY,RY,RZ ADD=1 DOF=UX,UY,UZ,RZ ADD=13 DOF=UX,UY,UZ,RZ ADD=143 DOF=UX,UY,UZ,RZ ADD=183 DOF=UX,UY,UZ,RX,RY,RZ ADD=184,188,1 DOF=UX,UY,UZ,RX,RY,RZ ADD=203 DOF=UX,UY,UZ,RY,RZ
SPRING
ADD=196,202,1 RY=1
MASS ADD=1 UZ=9*4.375/386.4+0.4642 ADD=14,118,13 UZ=9*4.375/386.4+0.6114 ADD=131 UZ=9*3.707/386.4+0.489 ADD=144 UZ=9*3.038/386.4+0.489 ADD=157 UZ=9*3.342/386.4+0.489 ADD=170 UZ=9*3.646/386.4+0.489 ADD=183 UZ=9*1.823/386.4+0.489 ADD=2, 12,1 UZ=9*8.75/386.4+0.317 ADD=15,25,1 UZ=9*8.75/386.4 ADD=28,38,1 UZ=9*8.75/386.4 ADD=41,51,1 UZ=9*8.75/386.4 ADD=54,64,1 UZ=9*8.75/386.4 ADD=67,77,1 UZ=9*8.75/386.4 ADD=80,90,1 UZ=9*8.75/386.4 ADD=93,103,1 UZ=9*8.75/386.4 ADD=106,116,1 UZ=9*8.75/386.4 ADD=119,129,1 UZ=9*8.75/386.4 ADD=132,142,1 UZ=9*7.413/386.4 ADD=145,155,1 UZ=9*6.076/386.4 ADD=158,168,1 UZ=9*6.68/386.4 ADD=171,181,1 UZ=9*7.2917/386.4
150
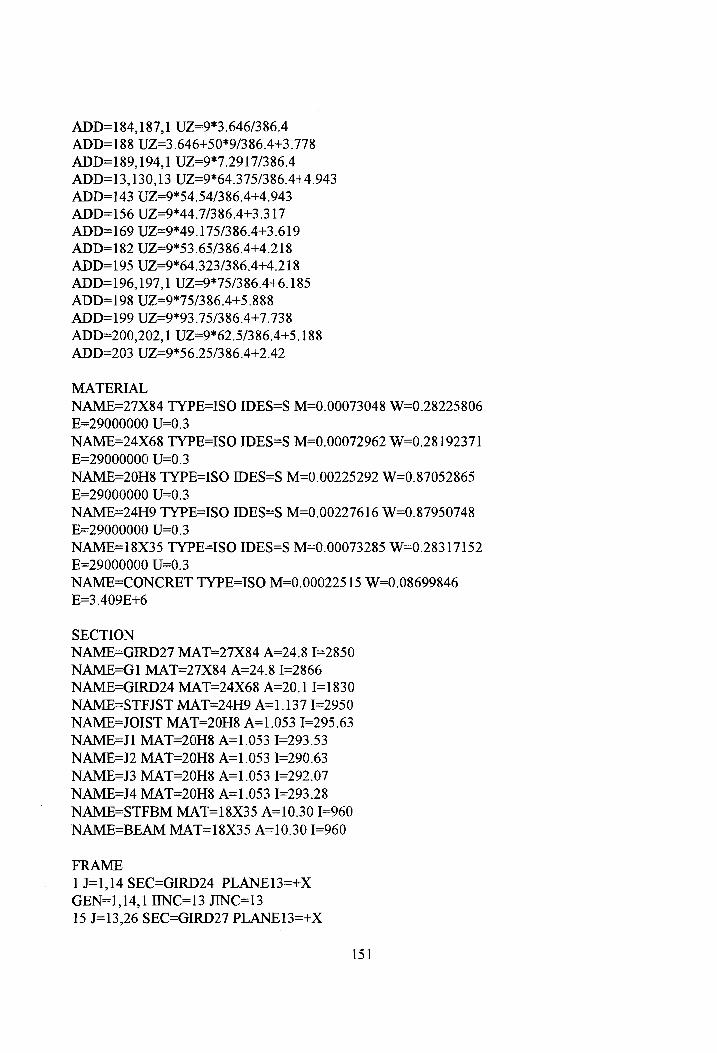
ADD=184,187,1 UZ=9*3.646/386.4
ADD=188 UZ=3.646+50*9/386.4+3.778
ADD=189,194,1 UZ=9*7.2917/386.4
ADD=13, 130,13 UZ=9*64.375/386.4+4.943
ADD=143 UZ=9*54.54/386.4+4.943
ADD=156 UZ=9*44.7/386.4+3.317
ADD=169 UZ=9*49.175/386.4+3.619
ADD=182 UZ=9*53.65/386.4+4.218
ADD=195 UZ=9*64.323/386.4+4.218
ADD=196,197,1 UZ=9*75/386.4+6.185
ADD=198 UZ=9*75/386.4+5 888
ADD=199 UZ=9*93.75/386.4+7.738
ADD=200,202, 1 UZ=9*62.5/386.4+5.188
ADD=203 UZ=9*56.25/386.44+2.42
MATERIAL
NAME=27X84 TYPE=ISO IDES=S M=0.00073048 W=0.28225806
E=29000000 U=0.3
NAME=24X68 TYPE=ISO IDES=S M=0.00072962 W=0.28192371
E=29000000 D=0.3
NAME=20H8 TYPE=ISO IDES=S M=0.00225292 W=0.87052865
E=29000000 U=0.3
NAME=24H9 TYPE=ISO IDES=S M=0.00227616 W=0.87950748
E=29000000 U=0.3
NAME=18X35 TYPE=ISO IDES=S M=0.00073285 W=0.28317152
E=29000000 U=0.3
NAME=CONCRET TYPE=ISO M=0.000225 15 W=0.08699846
E=3.409E+6
SECTION
NAME=GIRD27 MAT=27X84 A=24.8 I=2850
NAME=G1 MAT=27X84 A=24.8 I=2866
NAME=GIRD24 MAT=24X68 A=20.1 I=1830
NAME=STFJST MAT=24H9 A=1.137 J=2950
NAME=JOIST MAT=20H8 A=1.053 I=295.63
NAME=J1 MAT=20H8 A=1.053 I=293.53
NAME=J2 MAT=20H8 A=1.053 I=290.63
NAME=J3 MAT=20H8 A=1.053 I=292.07
NAME=J4 MAT=20H8 A=1.053 I=293.28
NAME=STFBM MAT=18X35 A=10.30 I=960
NAME=BEAM MAT=18X35 A=10.30 I=960
FRAME
1] J=1,14 SEC=GIRD24 PLANE13=+X
GEN=1,14,1 IINC=13 JINC=13
15 J=13,26 SEC=GIRD27 PLANE13=+X
151

GEN=15,28,1 IINC=13 JINC=13 29 J=195,196 SEC=G1 PLANE13=+X GEN=29,36,1 IINC=1 37 J=1,2 SEC=STFJST PLANE13=-Y IREL=R3 38 J=2,3 SEC=STFJST PLANE13=-Y GEN=38,47,1 IINC=1 48 J=12,13 SEC=STFJST PLANE13=-Y JREL=R3 49 J=14,15 SEC=JOIST PLANE13=-Y IREL=R3 50 J=15,16 SEC=JOIST PLANE13=-Y GEN=50,59,1 IINC=1 60 J=25,26 SEC=JOIST PLANE13=-Y JREL=R3 61 J=27,28 SEC=JOIST PLANE13=-Y IREL=R3 62 J=28,29 SEC=JOIST PLANE13=-Y GEN=62,71,1 IINC=1 72 J=38,39 SEC=JOIST PLANE13=-Y JREL=R3 73 J=40,41 SEC=JOIST PLANE13=-Y IREL=R3 74 J=41,42 SEC=JOIST PLANE13=-Y GEN=74,83,1 IINC=1 84 J=51,52 SEC=JOIST PLANE13=-Y JREL=R3 85 J=53,54 SEC=JOIST PLANE13=-Y IREL=R3 86 J=54,55 SEC=JOIST PLANE13=-Y GEN=86,95,1 IINC=1 96 J=64,65 SEC=JOIST PLANE13=-Y JREL=R3 97 J=66,67 SEC=JOIST PLANE13=-Y IREL=R3 98 J=67,68 SEC=JOIST PLANE13=-Y GEN=98,107,1 IINC=1 108 J=77,78 SEC=JOIST PLANE13=-Y JREL=R3 109 J=79,80 SEC=JOIST PLANE13=-Y IREL=R3 110 J=80,81 SEC=JOIST PLANE13=-Y GEN=110,119,1 IINC=1 120 J=90,91 SEC=JOIST PLANE13=-Y JREL=R3 121 J=92,93 SEC=JOIST PLANE13=-Y IREL=R3 122 J=93,94 SEC=JOIST PLANE13=-Y GEN=122,131,1 IINC=1 132 J=103,104 SEC=JOIST PLANE13=-Y JREL=R3 133 J=105,106 SEC=JOIST PLANE13=-Y IREL=R3 134 J=106,107 SEC=JOIST PLANE13=-Y GEN=134,143,1 IINC=1 144 J=116,117 SEC=JOIST PLANE13=-Y JREL=R3 145 J=118,119 SEC=JOIST PLANE13=-Y IREL=R3 146 J=119,120 SEC=JOIST PLANE13=-Y GEN=146,155,1 IINC=1 156 J=129,130 SEC=JOIST PLANE13=-Y JREL=R3 157 J=131,132 SEC=J1 PLANE13=-Y IREL=R3 158 J=132,133 SEC=J1 PLANE13=-Y GEN=158,167,1 IINC=1
152
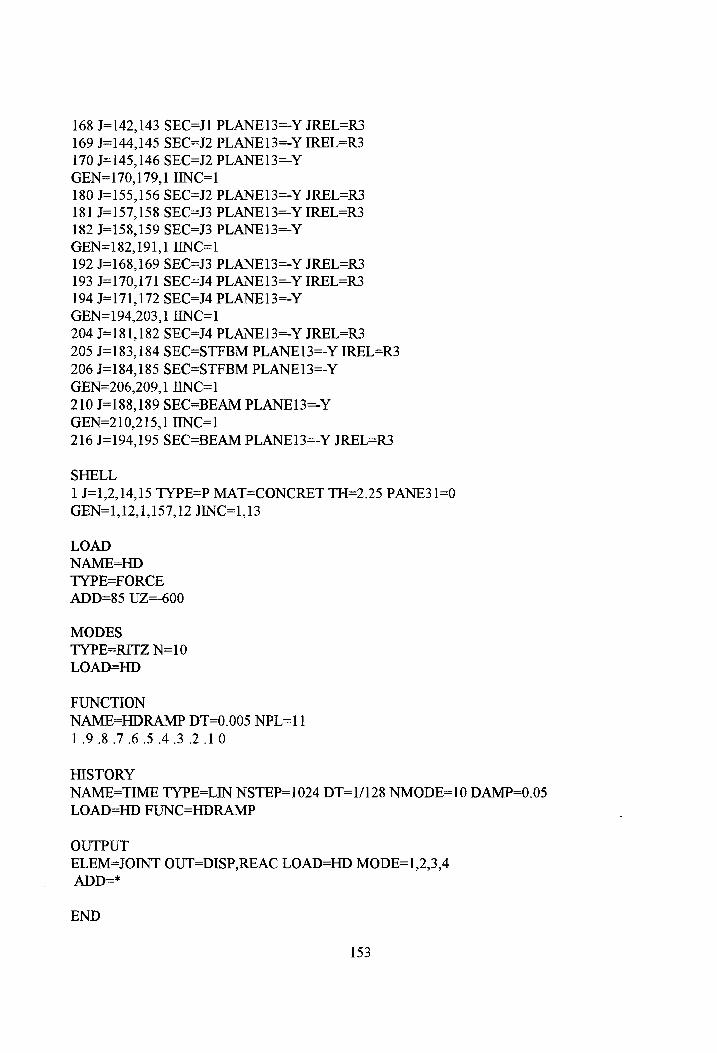
168 J=142,143 SEC=J] PLANE13=-Y JREL=R3 169 J=144,145 SEC=J2 PLANE13=-Y IREL=R3 170 J=145,146 SEC=J2 PLANE13=-Y GEN=170,179,1 IINC=1 180 J=155,156 SEC=J2 PLANE13=-Y JREL=R3 181 J=157,158 SEC=J3 PLANE13=-Y IREL=R3 182 J=158,159 SEC=J3 PLANE13=-Y GEN=182,191,1 IINC=1 192 J=168,169 SEC=J3 PLANE13=-Y JREL=R3 193 J=170,171 SEC=J4 PLANE13=-Y IREL=R3 194 J=171,172 SEC=J4 PLANE13=-Y GEN=194,203,1 IINC=1 204 J=181,182 SEC=J4 PLANE13=-Y JREL=R3 205 J=183,184 SEC=STFBM PLANE13=-Y IREL=R3 206 J=184,185 SEC=STFBM PLANE13=-Y GEN=206,209,1 IINC=1 210 J=188,189 SEC=BEAM PLANE13=-Y GEN=210,215,1 IINC=1 216 J=194,195 SEC=BEAM PLANE13=-Y JREL=R3
SHELL
1 J=1,2,14,15 TYPE=P MAT=CONCRET TH=2.25 PANE31=0
GEN=1,12,1,157,12 JINC=1,13
LOAD
NAME=HD
TYPE=FORCE
ADD=85 UZ=-600
MODES
TYPE=RITZ N=10
LOAD=HD
FUNCTION NAME=HDRAMP DT=0.005 NPL=11 1.9.8.7.6.5.4 3.2.10
HISTORY NAME=TIME TYPE=LIN NSTEP=1024 DT=1/128 NMODE=10 DAMP=0.05 LOAD=HD FUNC=HDRAMP
OUTPUT ELEM=JOINT OUT=DISP,REAC LOAD=HD MODE=1,2,3,4 ADD=*
END
153
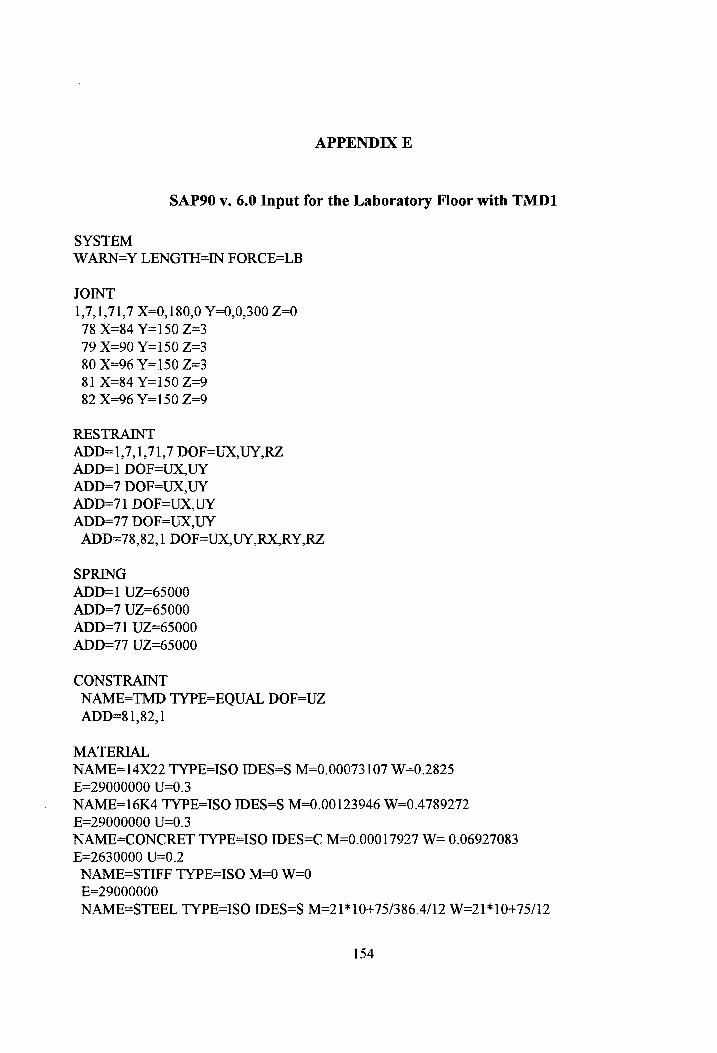
APPENDIX E
SAP90 v. 6.0 Input for the Laboratory Floor with TMD1
SYSTEM
WARN=Y LENGTH=IN FORCE=LB
JOINT
1,7,1,71,7 X=0,180,0 Y=0,0,300 Z=0
78 X=84 Y=150 Z=3
79 X=90 Y=150 Z=3
80 X=96 Y=150 Z=3
81 X=84 Y=150 Z=9
82 X=96 Y=150 Z=9
RESTRAINT
ADD=1,7,1,71,7 DOF=UX,UY,RZ
ADD=1 DOF=UX,UY
ADD=7 DOF=UX,UY
ADD=71 DOF=UX,UY
ADD=77 DOF=UX,UY
ADD=78,82,1 DOF=UX,UY,RX,RY,RZ
SPRING ADD=1 UZ=65000 ADD=7 UZ=65000 ADD=71 UZ=65000 ADD=77 UZ=65000
CONSTRAINT NAME=TMD TYPE=EQUAL DOF=UZ ADD=81,82, 1
MATERIAL
NAME=14X22 TYPE=ISO IDES=S M=0.00073 107 W=0.2825
E=29000000 U=0.3
NAME=16K4 TYPE=ISO IDES=S M=0.00123946 W=0.4789272
E=29000000 U=0.3
NAME=CONCRET TYPE=ISO IDES=C M=0.00017927 W= 0.06927083
E=2630000 U=0.2
NAMESSTIFF TYPE=ISO M=0 W=0
E=29000000
NAME=STEEL TYPE=ISO IDES=S M=21*10+75/386.4/12 W=21*10+75/12
154

E=29000000
SECTION
NAME=GIRDER MAT=14X22 A=6.49 I=199
NAME=JOIST MAT=16K4 A=1.218 I=171.8
NAME=EXJOIST MAT=16K4 A=1.218 I=166
NAME=SUPPORT MATS=STIFF A=10000 J=0 I=100000, 100000 AS=50000/6,50000/6 \
SH=R T=100,100
NAME=MASSPL MAT=STEEL A=1 J=0 I=100000,100000 AS=5/6,5/6 SH=R T=1,1
NLPROP NAME=SPRING TYPE=DAMPER M=0 W=0 DOF=U1 KE=1164 NAME=DAMPEL TYPE=DAMPER M=0 W=0 DOF=U1 KE=414 CE=10.13
FRAME 1 J=1,2 SEC=GIRDER PLANE13=-Y GEN=1,6,1 IINC=1 7 J=71,72 SEC=GIRDER PLANE13=-Y GEN=7, 12,1 IINC=1 13 J=1,8 SEC=EXJOIST PLANE13=+X IREL=R3 14 J=8,15 SEC=EXJOIST PLANE13=+X GEN=14,21,] IINC=7 JINC=7 22 J=64,71 SEC=EXJOIST PLANE13=+X JREL=R3 23 J=2,9 SEC=JOIST PLANE13=+X IREL=R3 24 J=9,16 SEC=JOIST PLANE13=+X GEN=24,31,1 IINC=7 JINC=7 32 J=65,72 SEC=JOIST PLANE13=+X JREL=R3 33 J=3,10 SEC=JOIST PLANE13=+X IREL=R3 34 J=10,17 SEC=JOIST PLANE13=+X GEN=34,41,1 IINC=7 JINC=7 42 J=66,73 SEC=JOIST PLANE13=+X JREL=R3 43 J=4,11 SEC=JOIST PLANE13=+X IREL=R3 44 J=11,18 SEC=JOIST PLANE13=+X GEN=44,51,] IINC=7 JINC=7 52 J=67,74 SEC=JOIST PLANE13=+X JREL=R3 53 J=5,12 SEC=JOIST PLANE13=+X IREL=R3 54 J=12,19 SEC=JOIST PLANE13=+X GEN=54,61,1 IINC=7 JINC=7 62 J=68,75 SEC=JOIST PLANE13=+X JREL=R3 63 J=6,13 SEC=JOIST PLANE13=+X IREL=R3 64 J=13,20 SEC=JOIST PLANE13=+X GEN=64,71,1 IINC=7 JINC=7 72 J=69,76 SEC=JOIST PLANE13=+X JREL=R3 73 J=7,14 SEC=EXJOIST PLANE13=+X IREL=R3
155

74 J=14,21 SEC=EXJOIST PLANE13=+X
GEN=74,81,1 IINC=7 JINC=7
82 J=70,77 SEC=EXJOIST PLANE13=+X JREL=R3
83 J=39,79 SEC=SUPPORT PLANE13=+X
84 J=78,79 SEC=SUPPORT PLANE13=-Y
85 J=79,80 SEC=SUPPORT PLANE13=-Y
86 J=81,82 SEC=MASSPL PLANE13=-Y
SHELL
1 J=1,2,8,9 TYPE=P MAT=CONCRET TH=3 PLANE31=0
GEN=1,6,1,55,6 JINC=1,7
NLLINK 1 J=78,81 NLP=SPRING AXIS 1=-Z PLANE13=+X 2 J=80,82 NLP=DAMPEL AXIS 1=-Z PLANE13=+X
LOAD NAME=HD TYPE=FORCE ADD=39 UZ=-600
MODES TYPE=EIGEN N=10
FUNCTION
NAME=HDRAMP DT=0.005 NPL=11
1.9.8.7.6.5.4.3.2.10
HISTORY
NAME=TIME TYPE=LIN NSTEP=1024 DT=1/128 NMODE=10 DAMP=0.015
LOAD=HD FUNC=HDRAMP AT=1
OUTPUT
ELEM=JOINT OUT=DISP,REAC LOAD=HD MODE=1,2,3,4
ADD=*
END
156

VITA
Cheryl E. Rottmann was born in Mt. Vernon, IL on November 20, 1971. She graduated from
Highland High School in Highland, IL. While pursuing her Bachelor of Science degree she worked
as a civil engineering co-op student with Virginia Power. In 1994 she received her Bachelor of
Science degree in civil engineering, with High Honors, from the University of Illinois at Urbana-
Champaign. Since August of 1994 she has been pursuing her master’s degree in the Structures
Division of the Civil Engineering Department at Virginia Tech.
157