Bad Ni Bege - VTechWorks
267
p24? if THE EFFECTS OF A NUTRITION PROGRAM WITH AND WITHOUT AEROBIC EXERCISE ON BODY WEIGHT AND COMPOSITION, PLASMA VARIABLES AND NUTRIENT INTAKE IN OBESE BLACK WOMEN by Katherine Marie Williamson Thesis submitted to the Graduate Faculty of the Virginia Polytechnic Institute and State University in partial fulfillment of the requirements for the degree of MASTER OF SCIENCE in Human Nutrition and Foods Bad Ni Bege F.W. Thye, Chairperson APPROVED: R!H. Humphrey 7 $.J. ae hey July, 1990 Biacksburg, VA
-
Upload
khangminh22 -
Category
Documents
-
view
0 -
download
0
Transcript of Bad Ni Bege - VTechWorks

p24?
if
THE EFFECTS OF A NUTRITION PROGRAM WITH AND WITHOUT AEROBIC EXERCISE ON BODY WEIGHT AND COMPOSITION, PLASMA VARIABLES
AND NUTRIENT INTAKE IN OBESE BLACK WOMEN
by
Katherine Marie Williamson
Thesis submitted to the Graduate Faculty of the Virginia Polytechnic Institute and State University
in partial fulfillment of the requirements for the degree of
MASTER OF SCIENCE
in
Human Nutrition and Foods
Bad Ni Bege F.W. Thye, Chairperson
APPROVED:
R!H. Humphrey 7 $.J. ae hey
July, 1990
Biacksburg, VA

LD
5055
G55 \940
W553
Cob

THE EFFECTS OF A NUTRITION PROGRAM WITH AND WITHOUT AEROBIC EXERCISE ON BODY WEIGHT AND COMPOSITION, PLASMA VARIABLES
AND NUTRIENT INTAKE IN OBESE BLACK WOMEN.
by Katherine Marie Williamson
Committee Chairman: Forrest W. Thye
Human Nutrition and Foods
(ABSTRACT )
The effects of a multifaceted weight loss program on
the body weight, body composition, plasma variables, and
nutrient intakes of 50 obese black women were investigated.
Subjects were between 20 and 51 years of age, with an
average BMI of 34.5 (range = 23.6 - 57.3). Subjects
attended nutrition education/behavior modification classes
once per week for three months. Thirty-five of the women
attended 80% or more of the classes (NU). Twenty-eight
women attended 30% or more of the low-impact aerobic
exercise classes that were offered three days per week, for
six months. An average 2.2 kg weight loss was observed for
the whole study group, as body fat fell, and lean body mass
increased by 2.1% of total body weight. Slightly greater
changes were observed in the group that exercised
consistently, as well as those who regularly attended
nutrition classes, but not in either of the groups which
more sporadically attended exercise or nutrition classes.
Significant reductions in plasma total cholesterol, HDL-
Cholesterol, HDL,-Cholesterol, and insulin were observed for
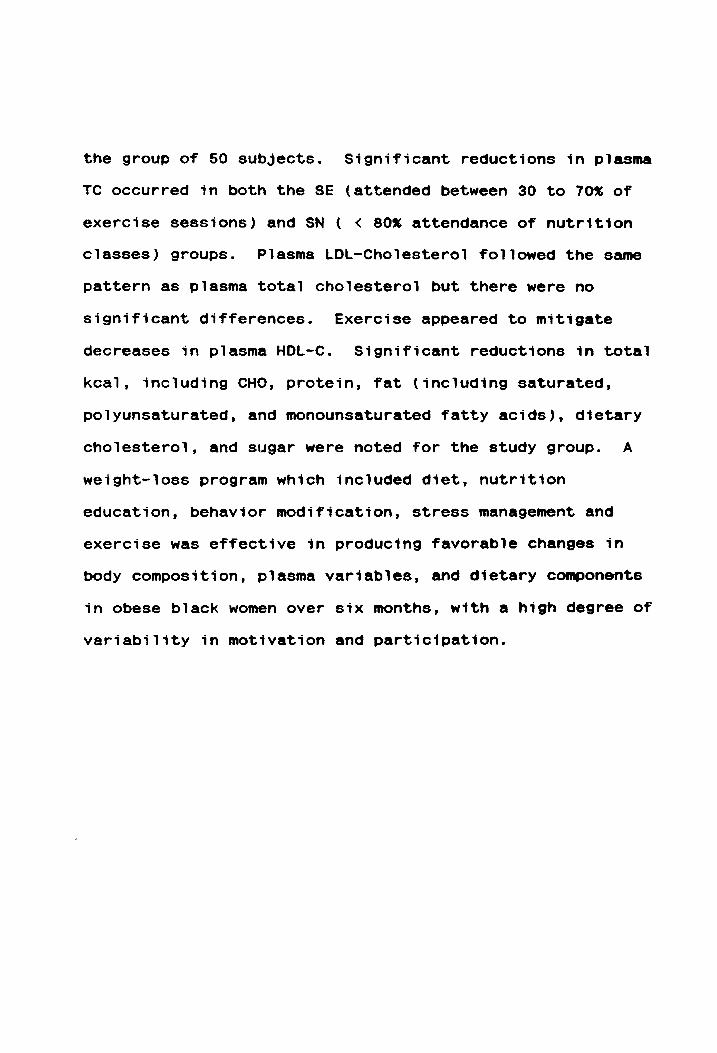
the group of 50 subjects. Significant reductions in plasma
TC occurred in both the SE (attended between 30 to 70% of
exercise sessions) and SN ( < 80% attendance of nutrition
classes) groups. Plasma LDL-Cholesterol followed the same
pattern as plasma total cholesterol but there were no
significant differences. Exercise appeared to mitigate
decreases in plasma HDL-C. Significant reductions in total
Kcal, including CHO, protein, fat (including saturated,
polyunsaturated, and monounsaturated fatty acids), dietary
cholesterol, and sugar were noted for the study group. A
weight-loss program which included diet, nutrition
education, behavior modification, stress management and
exercise was effective in producing favorable changes in
body composition, plasma variables, and dietary components
in obese black women over six months, with a high degree of
variability in motivation and participation.

Acknowledgements
The author would like to express her gratitude to Dr.
Forrest Thye, her major professor, for his role in the
initiation of the author’s involvement in this project, and
for his guidance, advise and support throughout the research
project, and for his attention to detail during the write-
up. The author would also like to give her sincere thanks
to the following individuals:
im memory of:
Soon Moak, principle investigator, for her knowledge
in the area of public health, and for her
concern and caring, from which the project was
born.
and:
Leslie Reynolds, for her invaluable laboratory work and
assistance with the project.
Dr. Reed Humphrey, for his expertise and advise in the area
of fitness and exercise physiology, as well as his
ready availability for questions and concerns.
Dr. Sanford Ritchey, for his role in the coordination of the
research project between VA Tech and VA State
University, and for his continued support throughout
the author’s graduate program.
Naomi Pearson, for her insight and helpful recommendations
regarding social aspects of this project.
lV

Sungsue Rheem for his statistical proficiency, and concern
for detail in statistical interpretation.
Jay Baik, for his statistical assistance.
Dr. Janette Taper, extension specialist, for her role in the
adaptation of nutrition education materials for the
specific population.
Mark Hunter and his staff at the self-instructional
curriculum laboratory, for their skill? and continued
assistance with word processing.
Mary Crawley, for her valuable organizational skills, and
for her moral support and friendship.
Kathy Peccatiello, for her moral support and exemplary role
in this project.
Finally, particular appreciation is extended to the
author’s parents, Karla and Tom Williamson, for their
unfaltering love and support throughout the author’s
graduate program.
TABLE OF CONTENTS
Acknowledgements... cre ccecvercacere eee mew eee eee ware Vv
List of Tables wee wwe tw ett wr ewe ew wet ee eet tte et tte tes viii
LISt OF FIQUFES. .. cee ce eee w ete ete te te eee cere ee eet e ee 1x
List Of Appendices... .. ccc een n crac nee ncccees eee e nee x
Introduction... ...cecaaces weet te ee te et te et ew ee te ee 1
Review of Literature... .. ccc cw cen cece ener cenee wc ee nae 14
Definition and Measurement of Obesity....... ee cae 14
Etiology... ccc ccc eee crv c cree ers c ccc tceeneae wee neces 20
Treatment... ..2 e200. ee twee cee eee ecw twee tw ee eee ees 27
Walking and Aerobic Dance..... ccc cece esa n en secccace 33
The Effects of Exercise-with-Diet versus caloric
restriction alone on Body Composition...... wee e ane 40
The Effects of Exercise and/or Dietary Restriction
on Serum Lipoprotein Cholesterol and Triglycerides 42
Caloric Restriction.....cce-e ee eee ee eee ee eee teas 45
EXErCiS@.. ccc eee ce ren eter nace tree ees enee ee ee ene 46
Exercise with Caloric Restriction versus
Caloric Restriction alone......eee-. eee nee tee eee 48
Exercise with Caloric Restriction versus
Caloric Restriction versus Exercise..... eee teee 49
The Effects of Dietary Restriction and/or Exercise
on Glucose and Insulin Metabolism... ...cceevcaeceves 52
The Effects of Food Components on Serum Cholesterol,
Lipoprotein Cholesterol, Glucose and Insulin...... » 55
The Effects of Dietary Fat and Cholesterol on Serum Cholesterol and Lipoproteins..........ee0. » 55
Polyunsaturated Fats... ... ccc ecennvcccrcvceseces 58
Monounsaturated FatsS.... ccc cece aren nees vee ewes 59
Carbohydrates... cee erence nee n ress sereene ce eee 60
Simple Carbohydrates, particularly Sucrose 62
FIDE... we wwe we ewe ee tte te es oe neers eee eae en ee 64
PrOovtetni ccc ccc ceca cern en sseeesnee wet wee ten ace e. 67
Project ODJECTIVES.... ce cee eee weer te ewe tee tee ewes 70
Journal Article... . cee ee wee twee we ce we te ett et eee eee . 73
Title Page... . ce enn ne nner veer escens see eee nee nee 74
Abstract and Key WordS....ccccccrcnces cece eter aee : 75 INCPOdUCTION. ... ee wen ee een me ene e ner ees eeenene ewes 77 METhOdS... ce ee eee reer manner net e erect eres eee ete eaves 80
SUDJECTS... weer ween ners een veeee cece eee wet ee cons 80
Nutritional Education Program.......ccccarcvecce 80
Exercise Program.....cseesesccnccves eee eee wee 84
Diet ANAlyYSiS.... cer wee eee veer cern tenet een sceas 87
Vi

Piasma Lipids, Glucose and Insulin.. en ecne cee ee
Body Weight and CompoSition......cccencccccneans Statistical AnalyS1S.......cceercccececns sa ececee
RESuItS... ccc cee n nen ccc vnccsncesesesnesecevevces eeee
Nutrition Education/Behavior Modification Class ATTENdANCE... cece cane anc ncceenssncscce cece neces
Exercise Participation... .. cece cece nc ence ccance
Body Weight and ComposSition......cceee- eevee ves Piasma Total Cholesterol, Lipoprotein
Cholesterol, Triglyceride and Insulin........e. Nutrient IntakeS... cee ec cw cere een een c een ereaene
COrrelationS... cere vce er cccernercesscessveveecers
Recovery Heart RateS....c.cccccrersccscvesccnvecce DISCUSSION... ep ween ance enn eenncesecceses eee eee .
REFEFeENCeS.. wee eer cence en nes anne nesevennsssssen
Summary and COnNcluSionS.... cece nvcccannannesvscccnas
References... ccccccerenccenece we cence nec ccc ees stee eeae
88 89 90
vii

Table No.
LIST OF TABLES
Characteristics of 50 Obese Black Female
SUBJECTS... ce ew ecw ee eee cea see eee te tt a
Body Weight and Composition of All Subjects, and Divided into Nutrition and
Exercise Participation at Pre- and Post TTEATMENE. . 2c ccc eee ween nnn rere sens ccceae
Plasma Lipids, Lipoprotein Cholesterol, Triglycerides and Insulin of Al] Subjects, and Divided into Nutrition and
Exercise Participation at Pre- and Post TrEaAtMEent. .. cece enn cc rn rcccsevecevavees
Energy and Nutrient Intakes of All
Subjects, and Divided into Nutrition and Exercise Participation at Pre- and Post Treatment... 2... car vccncccces cence eaes see
One- and Two-minute Recovery Heart Rates, as a Percentage of the Immediate Post- exercise Heart Rate, at Pre- and Post
Treatment for all Exercising Subjects, and Divided into Exercise Groups........
Differences in One- and Two-Minute
Recovery Heart Rates, as a Percentage of
Immediate Post-exercise Heart Rate,
between Pre- and Post Treatment for
all Subjects, and Divided into Exercise
GrOUPS. wc wee cee eee een te ee teen tee ee eee eee
94
98
105
V114

Figure No.
fo
LIST OF FIGURES
Overweight persons aged 25 to 74 years, by race and sex: United States, 1960-1962, 1971-
1974, and 1976-1980... .. cc ecw ee ew te et wees 2
Percent of nonpregnant females severely overweight, by age: 1960-1962, 1971, ANd 1976-1980... cc creer cree ect e eee een e ena a eee 4
Percent of females overweight, by poverty
Status and age: 1976-1980....... cece ncaces 6
Standardized incidence ratio for first major
coronary event by quintile of relative weight
In six Pooling Project cohorts... eee nneeas 7
Relative risk of diabetes, high-risk serum
cholesterol level, and hypertension for
overweigt persons (relative to not
overweight persons), by age: 1976-80........ 8
Relationship of body mass index to overall!
Mortality Tisk...ccvccresseeseccecessttvceces 10
Experimental Procedure..... cece enn nncee ete eee 81
1X

LIST OF APPENDICES
Appendix
A Individual Pretreatment Body Weight and
Composition For 50 Obese Black Women........... 195
Individual Post-treatment Body Weight and Composition For 50 Obese Black Women........... 197
One- and Two-Minute Recovery Heart Rates as a
Percentage of Immediate Post-Exercise Heart
Rate at Pre- and Post-Treatment for Exercising
SUDJECES. cc ccc cee weer cee rence reer esac asa nceaes 199
Individual PreTreatment Values of Total Choltesterol(mg/d1), Lipoprotein Cholesterol!
(mg/di), Triglyceride (mg/dl), and Insulin (uIU/m1) for 50 Subjects... ... cece ewe nee nc cee 200
Individual Post-Treatment Values of Total Cholesterol (mg/dl), Lipoprotein Cholestero]
(mg/d1), Triglyceride (mg/dl), and Insulin {ulU/m1) for 50 Subjects..... cee eee ne eee eeseeee L202
Individual PreTreatment Nutrient Intakes for 50
SubjectS......cee-. cet ete tt tc tee sete wr ec c ee rates 204
Individual Post-Treatment Nutrient Intakes for
50 Subjects... .ceaece weer ee cee et wee te eet ewe ee cee 210
Individual Height, and Exercise and Nutrition
Group Designation for 50 Subjects..........8. ~- 216
Pre-Treatment Mean Values of Body Weight and
Composition for All Subjects, and Divided
into Nutrition and Exercise Groups......... eeee 218

Pre-Treatment One- and Two-Minute Mean Recovery
Heart Rate Values, as a Percentage of Immediate
Post-Exercise Heart Rate for All Exercising
Subjects, and Divided into Exercise Groups..... 219
Pre-Treatment Mean Values of Total Cholesterol (mg/dl), Lipoprotein Cholesterol(mg/dl),
Trigtyceride (mg/dl), and Insulin (ulU/m1) for All Subjects, and Divided into Nutrition and
ExerciSe GroupS....ccevrcccavecccnneces eee ceee «ee 220
Pre-Treatment Nutrient Intake Mean Values for
All Subjects, and Divided into Nutrition and Exercise Groups..... ener center ee ew ene cece ee wee 221
Socio-Demographic Information, Form No. 1...... 224
Medical History of Subject and Family,
Form No. 2..... we cee eect ees wet ew ett ee ee rece see 226
Physical Examination/Medical Approval,
Form NO. 11... 2 eee cence c ncn eee eas cee ec eens wee 228
Anthropometric Measurements, Form No 3....... -. 229
Biochemical Data, Form No. 4........ eee ew neerae§ 231
Bioimpedance Questionnaire... ....4. enc eerceons 232
Physical Activity Form, Form No. 5.......22cee 233
Exercise Activity LevelS..... cc cee rer n nn cnccevce 236
Activity Record.......... cee wt e ete ee meee weveee 238
Food Recall #2, Form NO. QQ... ccc n ec cn er encncaes 239
x1
W
X
24-Hour Dietary Recall
Behavioral and Eating Patterns, Form No. 7.....
x11

INTRODUCTION
Despite the increasing awareness about health,
nutrition, fitness, and weight loss (1), a 20 billion
dollar-a-year diet and exercise industry (2), and a
pervading prejudice against obesity in America (3), the
American populace continues to become more overweight (4)
(Figure 1). According to the most recent National Health
and Nutrition Examination Survey (NHANES II, 1976-1980)
Fully 28% of the adult American populace, or 34 million
people aged 25~74, were overweight (5), up from 25.4% in the
period 1960-1962, and from 26.7% between 1971 and 1974 (4).
Overweight was defined as a body mass index (BMI, kg/m*) of
27.3 for women, and 27.8 for men (6). Tnese cutoff points
were based on the sex-specific 85™ percentiles of
individuals in the 20-to-29 year old range in that survey.
This age group was used because young adults are relatively
lean, and an increase in body weight with age is generally
due to fat accumulation (5). The BMI is commonly used to
determine both overweight and obesity, because it is a
convenient measure which has been correlated highly with
body fat as determined by hydrodensitometry (7). The
percentage of the population that was defined as severely
overweight during this period was approximately 10%, or 12.4
1

Race and Period
Total* White Black
1960- 1971- 1976- 1960- 1971- 1976- 1960- 1971- 1976-
1962 1974 1980 1962 1974 1980 1962 1974 1980
Percent of population
Sex
Both
sexes 25.4 26.7 27.0 24.2 25.7 25.9 35.1 38.0 40.0
‘Males 23.1 24.8 25.3 23.3 24.8 25.2 22.5 27.0 30.0
Females 27.4 28.4 28.6 24.9 26.4 26.3 47.1 46.8 48.1
Figure 1. Overweight persons aged 25 to 74 years, by race and sex: United States,
1960-1962, 1971-1974, and 1976-1980. Overweight is defined as body mass index
greater than or equal to 28 kg/m? and 35 kg/m!-5 for men and women, respectively.
*includes all other races not shown separately.
From: Gillum RF. Overweight and obesity in black women: a review of published data
from the National Center for Health Statistics. Journal of the National Medical
Association 1987;79: 865-71.
fo

million individuals (6). This was greater than during 1971i-
74, in which 8.4 million people were severely overweight
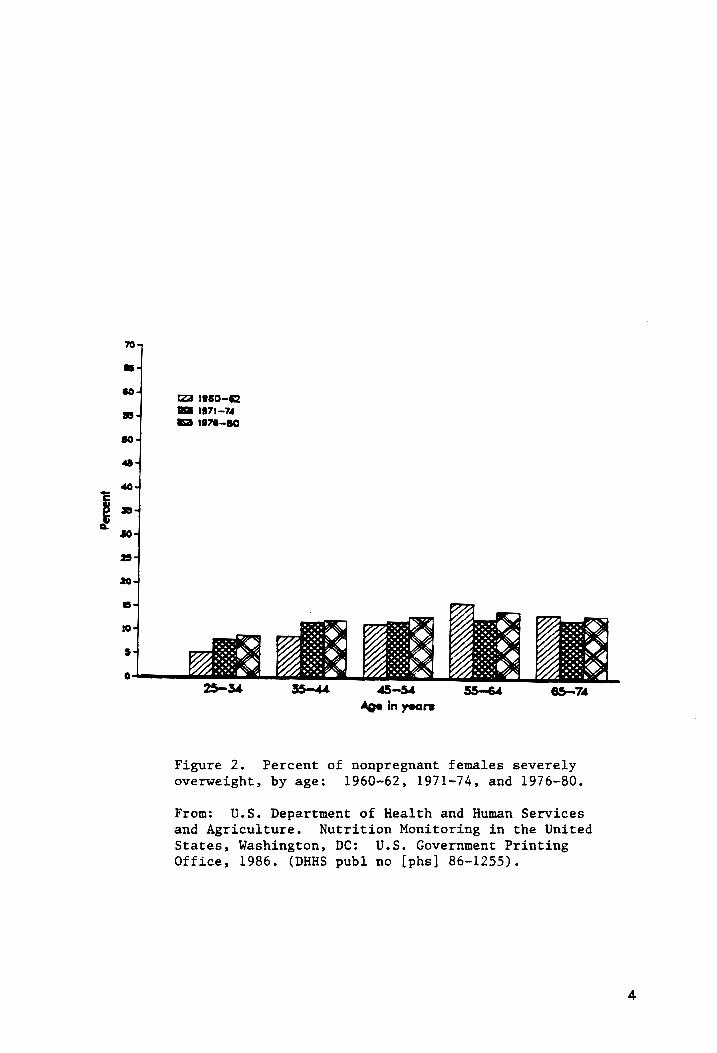
(6). For females, by age groups, the trends in the
prevalence of severely overweight for three time periods
between 1960 and 1980 can be seen in figure 2. Severely
overweight in NHANES II was defined as a BMI equal to or
greater than 32.3 and 31.1 for women, and men, respectively,
which represented the sex-specific 95% percentiles of the
20-to-29 year old NHANES II population (5). Often, the
population of severely overweight individuals is included in
the group that is reported to be overweight. In this most
recent national survey, NHANES II, the overweight condition
was more prevalent in women (29.69) of females) than in men
(26.3% of males) (5), and in blacks (40.0% of blacks) than
in whites (25.9% of whites) (4). Black women accounted for
substantially more of the higher prevalence in the Diack
population than their male counterparts (48.1% of black
females vs 30.0% of black males), and the discrepancies
between black females and either sex of the white race were
even greater (26.3% of white females, 25.2% of white males)
(4) (Figure 1). This trend was true for three time periods
from 1960 to 1980 (Figure 1). A closer look at the
occurrence of overweight among black women revealed that
such individuals living in rural and southern areas were
more overweight than their urban, northern and western
counterparts, and that overweight was inversely related to
Percent
os
& &$
# 8
&§ 8
# Baa
t2a 1960--62
Ce 1971-74
1976-BO
25—34 35—44 45-54 S5—64 6S—74 Age in years
Figure 2. Percent of nonpregnant females severely overweight, by age: 1960-62, 1971-74, and 1976-80.
From: U.S. Department of Health and Human Services
and Agriculture. Nutrition Monitoring in the United States, Washington, DC: U.S. Government Printing
Office, 1986. (DHHS publ no [phs] 86-1255).

family income (Figure 3) and education. These relationships
were found to be stronger for biack than for white women
(4). Socioeconomic status has also been found by many
researchers to have a strong inverse relationship with
obesity in women (8). In addition, the stigmatization of
obesity in women is recognized to be greater than that for
men (9, 10, 11). Despite these statistics, there is a
paucity of information relating to attempts to address the
problem of obesity in low-income women (12) or low-income
black women (13, 14).
Wk The obese condition carries with it numerous
associations with other health complications, and is
considered a risk factor in coronary heart disease (CHD)
(Figure 4). Hypercholesterolemia, a major risk factor in
CHD, is 1.5 times more common in overweight versus normal-
weight persons (6) (Figure 5). Being overweight has been
positively associated with several risk factors for CHD,
including total cholesterol (TC), (15, 16), and negatively
with high-density lipoprotein cholesterol! (HDL-C) (17, 18,
15, 16). The association between obesity and hypertension
has been well-established for some time (19, 17, 20), and it
has recently been estimated that the risk for hypertension
is 2.9 times greater for overweight than non-overweight
individuais (6) (Figure 5). | Furthermore, for all age
groups, there is a greater percentage of blacks than whites
with hypertension, as well as for those below the poverty

Percent
o38sk
& #€8
& S$ Read”
(2a Below poverty
WA Above poverty
10
5
° 25-34 35-44 45-54 35—64 65—-74
Age in years
Figure 3. Percent of females overweight, by poverty status
and age: 1976-80.
From: U.S. Department of Health and Human Services and Agriculture. Nutrition Monitoring in the United States,
Washington, DC: U.S. Government Printing Office, 1986.
(DHHS publ no [phs] 86-1255).

POOLING PROJECT DATA
ALB —_— a = lOO
CH-GAS ~~ 100
CH-WE fog, 100
FRAM a 100
La ed ig
MIN-RR a 100
Quintile I 0 0 Ww X
“ \deal weight <103 103-112 2-19 9-129 5129
STANDARDIZED
INCIDENCE
RATIO
Figure 4. Standardized incidence ratio for first major
coronary event by quintile of relative weight in six
Pooling Project cohorts. ALB=Albany; CH-GAS=Chicago
People's Gas Company; CH-WE=Chicago Western Electric;
FRAM=Framingham; LA=Los Angeles Heart Study; MINN-RR=
Minnesota Railroad Workers Study.
From: Barrett-Connor EL. Obesity, atherosclerosis, and
coronary heart disease. Annals of Internal Medicine 1985; 103(6 pt 2):1010-19.
FIRST
MAJOR CORONARY EVENT

Relative
risk
GO 25-44 years WB 45-74 years
3.5 total = 2.9
25
total = 1.5
Diabetes High-risk cholesterot = Hypertension Health condition or disease
Figure 5. Relative risk of diabetes, high-risk serum cholesterol
level, and hypertension for overweight persons (relative to not
overweight persons), by age: 1976-80.
From: U.S. Department of Health and Human Services and Agriculture. Nutrition Monitoring in the United States,
Washington, DC: U.S. Government Printing Office, 1986. (DHHS publ no [phs] 86-1255).

level, as compared to those above it (5). Obesity has not
only been associated with these risk factors for CHD, but
has atso been found to be an independent risk factor (21)
for cardiovascular disease (CVD). The term CVD pertains to
conditions affecting the heart and blood vessels and
includes CHD (5). While CHD is the number one killer in
both blacks and whites (5), it appears that the rate for
biack women is higher than that for white women (22), and
that Virginia ranks among the top two quartiles among the
states in terms of CHD mortality in blacks.(23).
The relative risk of diabetes in overweight adults has
also been estimated to be 2.9 times that of non-overweight
persons (6) (Figure 5), white betng black, female or below
poverty level are all associated with further risk (5). The
incidence of various cancers increase with obesity (24), as
do several other conditions such as ventilatory disorders,
circulatory impairment, digestive diseases, various
endocrine abnormalities, obstetric complications, and trauma
to weight-bearing joints (25, 26). Therefore, a higher
mortality ratio for obese individuals should not be
surprising (27, 28, 29). That there is a curvilinear
relationship between this mortality ratio and overweight
and/or obesity suggests that lower levels of overweight or
obesity may not be associated with the same degree of risk
for various health complications (27) (Figure 6). Indeed,
there is some evidence which suggests that this may be true

2.5-
Digestive & Cardiovascular Pulmonary Gallbladder S Disease Diabetes Mefitus &
2.0- Y
2 I
oc
= = 1.5- = So =
1.0-
Mod
0 Body Mass Index, kg/m’
Figure 6. Relationship of body mass index to overall
mortality risk. At a body mass index below 20 kg per m2 and above 30 kg per m2, there is an increase in relative mortality. The major causes for this increased mortality are listed, along with a division of body mass
index groupings into various levels of risk.
From: Bray GA, Gray DS. Obesity. Part I-Pathogenesis. West J Med 19883;149:429-41.
10

(30, 25, 31, 32), and that weight loss can lead to
improvements in many of these complications (33), including
blood variables which are considered risks for CHD (34, 35,
36, 37).
Knowledge of etiological factors in obesity has
increased significantly in the past several decades. We
have progressed from a time when ‘a personality disorder,
causing one to overeat and be lazy’ was believed to be the
cause of all individuals being overweight (8). It is now
recognized that there are a variety of causes of obesity,
that some of these are interrelated, and that they probably
have a genetic component (38). The idea that obese people
eat more has been proven erroneous by numerous
investigations (39, 40, 41, 42, 43), and data from the first
NHANES indicated that black women consumed slightly fewer
calories than white women, even when expressed per kilogram
of body weight (44). Studies of activity patterns within
this decade indicated that obese individuals may be
generally less active than their normal-weight peers (45,
46, 38); however, since obese persons expend more energy for
a given movement (47), and have a higher RMR (48) than non-
obese persons, the question of total energy expenditure has
remained unanswered.
Efforts aimed at treatment of the obese condition can
be classified under one of five general headings: diet,
behavior modification, exercise, pharmacotherapy and
11

Surgery. Conservative treatments, (which are discussed more
fully in a later section), initially focused on dietary
restriction until behavior modification therapy began to
emerge in the early 1970’s. The use of exercise in weight
management has become prevalent more recently (49). These
therapies have been traditionally employed separately, with
varying degrees of success. Dietary interventions were not
found to result in substantial weight reductions in the
majority of participants, and attrition rates were found to
be high (50, 51). Behavior modification triais have also
resulted in only moderate weight loss, but attrition rates
have been considerably tower than other programs (52).
Exercise alone may not be very effective in the short-—
term reduction of body weight in obese individuals, (53);
however, several studies have indicated that long-term
results may be improved by including exercise in a weight
control program (31, 54). Moreover, exercise may offset the
diet-induced decrease in metabolic rate as wel) as preserve
or increase lean body mass (53). Exercise can lead to
decreased levels of insulin and triglycerides (TG),
increased levels of plasma HDL-C, and improvements in
glucose tolerance and insulin sensitivity (53). In
addition, psychological benefits such as enhanced mood,
self-image and self-esteem may occur with exercise, and this
may serve to promote adherence to a program of weight
control (55). These effects are in contrast to the adverse
12

psychological reactions sometimes seen in response to
dieting (3). In recent years, these therapies have been
combined in various ways. Programs emphasizing nutrition
education to attain weight loss in conjunction with exercise
have begun to incorporate a behavioral management component
(56), while behavioral modification therapy has shifted its
emphasis from an individual to a group format (57).
Recently, numerous investigators who had reviewed various
aspects of the different treatments of obesity recommended a
multi-faceted approach (53, 56, 57, 58, 59, 60). In 1984 a
panel organized under the auspices of the International
Congress of Obesity stated that three components of therapy
-diet, exercise, and psychological support- are
“interrelated, interdependent and mutually supportive, and
thus should be prescribed together’ (60). A more recent
statment included the idea that nutrition education was
important in the attainment of the dietary component of a
comprehensive weight loss program (53). The results of
several studies which have included nutrition education,
behavior modification and exercise in comprehensive weight
loss programs supported recommendations for their use with
obese individuals (12, 13, 61). Limited data indicated that
such therapies could be of use in black populations as well
(13, 14).
13

REVIEW OF LITERATURE
Definition and Measurement of Obesity
The term overweight is defined as a body weight which
is above a standard according to height, while the term
obesity is defined as an excess of body fat. However, since
convenient measures of body fat are often not available, and
the correlation of body weight-for-height with body fat as
determined by hydrodensitometry is rather high, (.7 to .8)
(7), body weight-for-height is generally used to determine
obesity. Overweight indicates an excess weight-for-height
of 10-20% while the term obesity is often used to indicate
an excess weight-for-height of 20% or more (53). Mild,
moderate and morbid obesities are defined as 20-40%, 40-
100% and more than 100% above desirable weight, respectively
(53). The Metropolitan Life Insurance tables of ‘desirabie
weight’ have most commonly been used as the standard;
however, the designations of ‘small’, ‘medium’, and ‘large’
frame sizes are not based on specific measurements, and thus
allow some subjectivity with its use. The measure of
weight-for-height that is most frequently used in the
assessment of obesity or overweight is known as the Quetelet
or body mass index (BMI). This has units of kilogram per
14

meter squared (kg/m*). For women, overweight is defined as
a BMI of 27.3 or greater, and for men, as 27.8 or greater
(5). A BMI of 31.1 is considered obese for women, while for
men this value is 32.3 (5). Between the ages of 20 and 50,
the fat content in men approximately doubles, while in women
it increases by about 50 %. Total body weight does not
increase proportionally, hnowever, reflecting a reduction in
Jean body mass.
Obesity has been classified according to at least three
different schemes: 1) anatomic characteristics and regional
distribution of adipose tissue 2) the age at onset 3)
etiological factors (38). The scheme involving anatomic
characteristics pertains primarily to the suggestion of
distinguishing between those mainly with enlarged fat cells
(hypertrophic obesity) and those mainly with an increased
number of fat cells (hyperplastic obesity) (62). The
regional distribution scheme of classification deals with
comparing the amounts of fat on different areas of the body,
based on the idea that different patterns are associated
with a greater risk of complications (63). It was found
that when fat was stored predominantly in the gluteal or
femoral area (gynoid obesity) (most prevalent in females),
there were fewer complications than when it was stored
primarily in the abdominal area (android obesity, typical of
fat deposition in males). The waist-to-hip ratio has been
used as a measure of regional fat distribution and
15

associated risk (63). The classification of obesity by age-
at-onset distinguishes between childhood-onset and adult-
onset, and are usually synonomous with the classifications
of hyperplastic and hypertrophic obesity, respectively. It
1s recognized that there may be different sets of
complications depending on when obesity is acquired (38).
The human body can be discussed in terms of two
components, the fat and fat-free masses. In men, adipose
tissue accounts for approximately 28% of the body weight,
while in women, this comprises roughly 40% of total weight
(64).
Fat has a density of .9 g/ml and the fat-free mass
for most individuals has a density of 1.10 g/ml; therefore
the ratio of fat to fat-free mass can be estimated by
determining the density of the whole body. This procedure
is called hydrodensitometry, and is considered the most
accurate method for the determination of body composition.
However, because it is costly, cumbersome, and time
consuming, it is impractical for routine use. More
conventional methods used to estimate body fatness include
skinfold measurements and body or limb circumferences.
Accurate determination of fatness in obese individuals is
difficult with these methods, due to natural variations in
adipose tissue compressibility, and site-specific
accumulation of adipose tissue (65, 66). The impracticality
of hydrodensitometry in field situations illuminates the
16

need for a rapid, precise, and relatively inexpensive method
to determine body composition. In the assessment of change
in body composition, a method need not necessarily be
accurate, but precision over time within the population is
essential. One method which can be used to accomplish this,
and which measures water content, is easy to use and
provides reasonably accurate results, is the bioelectrical
impedance analyzer (31).
Its use in the assessment of body composition rests on
the finding by Pace and Rathburn that water is not stored in
adipose tissue and that fat-free mass contains a rather
constant percentage (73.2%) of water (67). Its two
underlying principles are: that the conduction of an
electrical impulse through a body is via the water and
electrolytes contained in the fat-free component, while the
fat acts as an insulator to this current; and that the
impedance of a geometrical system is related to conductor
length and configuration, its cross-sectional area, and
Signal frequency. Glassford has developed the technique so
that both body density and lean body mass are utilized in
the prediction of body fat. It is reported that this
approach yields better results on both lean and obese
subjects, which had previously been overestimated, and
underestimated in fat content, respectively (68, 69, 70).
This probtem is reported to have been overcome by the
development of regression equations from the particular
17

population of subjects under consideration (71, 72). In the
further refinement of such formulas, the incorporation of
weight into the regression equation has been found to
improve the correlation of BlA-determined TBW with that
determined by deuterium isotope dilution (73), while
integration of age into the regression formula has enhanced
correlations between per cent body fat predicted by BIA and
that determined by hydrostatic weighing (72). Several ferret
investigators have found that the use of the variables: Ne eee waneary nena nett MMENE A rte ey mene . ae eer te ECAR
height, weight, gender and age in regression equations which
predict body fat have yielded high correlations with values
determined by each of the ‘gold standard’ methods, hydro-
densitometry or deuterium isotope dilution (70, 71, 72, 74).
Several factors which may affect the outcome of the
bioelectrical impedance analyzer have been identified; they
are: the stage of the menstrual cycle, excessive sweating,
breath-holding, improper electrode placement and body
temperature changes (75). However, Hoffer, in 1969 (76),
found a correlation of .91 between TBW determined by
tritiated water and by impedance, for 34 patients with
varying degrees of hydration. This correlation was improved
to .93 when the subjects’ height was included: (TBW vs
ht*/R) in the regression analysis.
Another problem with the use of the bioelectrical
impedance analyzer is that it has been found to
underestimate body fat (68, 69, 70) as well as
18

overestimate TBW (70) in obese individuals. However,
through the incorporation of height, weight, and gender into
regression equations, high correlations between
hydrodensitometrically- and BIlA-determined LBM have been
found. For example, Segal et al found this correlation to
be .96 for a group of males and females who ranged from five
to thirty-five per cent body fat (71). Lukaski et al (77)
reported corretations of .98 and .95 for men and women,
respectively, between densitometrically-determined fat-free
mass and BlIA-determined fat-free mass, in subjects ranging
from four to forty-one per cent body fat. Kushner and
Schoeller (73) found that equations incorporating ht*/R,
weight and sex used with the BIA method were effective in
predicting deuterium-determined TBW (.98 and .95 for obese
and non-obese female subjects, respectively). Segal et al
(78) conducted a study which involved 1567 subjects, ranging
from three to fifty-six per cent body fat, found that
fatness-specific equations -which also incorporated height,
resistance, weight and age- considerably improved previous
correlations for both LBM and per cent fat determined by
bioelectrical impedance with values determined by
densitometry. Furthermore, in women, the correlation of
lean body mass between the two methods was greater for the
obese than the normal subjects (.95 vs. .91). Still another
study has yielded a correlation of .98 between body fat
determined by bioelectrical impedance analysis and that
19

determined by hydrodensitometry for 56 adult males and
Females (79).
In addition to accuracy, the precision, or reliability,
of an instrument should be considered, especially where the
intent is to assess change over time. Reliability with the
BIA has been reported by Lawlor et al to be .991 and .996
for measurements made one and twenty-four hours apart,
respectively (72), while values ranging from .990 to .999
for single and double measurements have been reported by
other investigators (74, 80, 81). Estimates of variation
for individual replicate measurements have been reported as
1.3% (with a range of .3 to 1.9%) for same-day testing, with
week-to-week variability slightly larger (2.2%) (70, 73).
Therefore, if one is careful in the screening
procedures to assure norma} Fluid balance, stage of the
menstrual cycle and proper electrode placement, one should
be comfortable in the use of the BIA in the assessment of
changes in body composition in individuals within a
population.
Etiology
The etiology of obesity is now recognized as a heterogenous
disorder (29) for which genetic components may play
important roles (82). The various factors which have been
implicated in the etiology of obesity include alterations in

food intake as well as deviations in the components of
energy expenditure: resting or basal metabolic rate (RMR or
BMR), the thermic effects of food (TEF), physical activity,
and possibly the thermic effects of exercise (TEE).
Regarding food intake in the obese, several authors, in
their reviews of the literature, have reported that obese
persons in fact consumed less calories on average than lean
persons (31, 42, 55), and this had also been reported for
infants and animals (41). There has been some concern,
however, with the reliability of these estimates when based
on self-reports, since at least two investigators found an
under-reporting of caloric intake in obese individuals (83,
84). The fact that there was a wide variation in the
ability of people (85, 86,) and animals (87) to gain weight,
which has been found to be unrelated to body weight or fat
content, duration of overfeeding or the amount or type of
Food consumed (86), has suggested that overconsumption may
well be atypical for many obese individuals. Two other
aspects of dietary intake which have received attention in
the pathogenesis of obesity are the composition of the diet,
mainly considering the amount or proportion of dietary fat
and sugar, and the size and frequency of meals. Experiments
in rodents have found that when the diet is high in fat or
Sugar, more calories are ingested than with regular diets,
and obesity develops (88, 89). An inability to compensate
for changes in caloric density has been noted in obese
21

persons, and was found to be of greater magnitude than in
normal-weight counterparts (90). Recent evidence has
indicated a positive correlation between fat intake,
especially saturated fat, and BMI in middle-aged women (43).
It has been observed that obese individuals eat fewer
(91) and larger (92) meals than non-obese persons. There
are several implications for the development of obesity and
its complications with this type of meal pattern. Bray (93)
has demonstrated enzymatic changes which promote lipogenesis
in women consuming a single large meal per day compared to
those consuming several smaller meals. LeBlanc and Diamond
($4) have demonstrated in dogs that the thermic effect of a
single large meal as a percentage of total kcal was less
than when an equal amount of food was divided into four
smaller meals. Furthermore, the metabolism of glucose (93)
and cholesterol (95) in humans have been shown to improve
upon consumption of smaller, more frequent meals in humans.
Energy expenditure can be partitioned into the RMR,
TEF, physical activity, and the TEE (31, 55). The basal, or
resting metabolic rate (BMR or RMR) is the energy needed to
maintain the body in physiological equilibrium in an
unstressed state. This accounts for the majority of energy
expedniture; estimates range form 60 to 70 (31), and to 75%
(96) of the total. The total RMR of obese persons is
typically higher than that of the non-obese, but this has
generally been accounted for by the increased fat-free mass
22

of the obese (97, 98, 99). That a low RMR, on a per-kg of
lean body weight basis, may be a factor in the development
of obesity (100, 101), or at least for a subgroup of
individuals (96), has been postulated. It was first
documented 70 years ago that, following caloric restriction,
there was a decline in RMR, and hence a limitation to weight
loss (102). Since then, this has also been documented in
non-obese individuals (97), but most notably in obese
persons (97, 103, 104, 105, 106). Several researchers have
found that the percentage decrease in RMR or 24-hour energy
expenditure for obese subjects who have lost weight was
greater than would be expected from the decrease in weight
(97, 103, 104) or lean body mass (96, 106, 107). This
reduction in RMR following weight loss has been observed to
be sustained for up to six years (107).
The thermic effect of food, or thermic effect of a meal
(TEF or TEM), is the increase in energy expenditure which
occurs when nutrients are consumed. Part of this is due to
the energy required for digestion, absorption and storage,
and part is the loss of metabolizable energy as heat. There
is a body of evidence (96, 108, 109, 110, 111) which
indicates that, at least in some people, a lower thermogenic
response to food may be a factor leading to increased
Storage of energy, and thus obesity. A lower TEF in post-
obese persons compared to lean controls has been
demonstrated in response to both a carbohydrate (111, 112,
23

113), and a mixed meal (114). <A closer look at the
occurrence of a blunted thermogenic response to food in the
obese has shown that there is an inverse relationship with
the degree of insulin resistance or glucose intolerance
(55), suggesting a physiological mechanism for a lowered
TEF.
Physical activity, as mentioned previously, has been
observed to be lower in some obese persons compared to lean
controls (38, 45, 46, 115, 116, 117). That this may be an
important factor in the pathogenesis of obesity has been
suggested by more than one author (38, 55). However, since
an obese person must expend more energy for a given movement
than a ltean individual (55), and, as noted previously, the
BMR of the obese is typically greater than that of their
lean counterparts, comparisons of total energy expenditure
are pertinent, but frought with difficulties.
Deviin and Horton (118) have shown that the increase
in energy expenditure following exercise in lean individuals
was not present in their obese counterparts, while evidence
from another study indicated that exercise may have
potentiated the thermic effect of food in lean, but not
obese individuals (119).
There is now abundant evidence for the role of genetics
in the etiology of obesity (31, 82). In evolutionary terms,
obesity has been argued by several authors to be a result of
what was once an adaptive set of mechanisms: the storage of
24

nutrients during brief times of food plentitude, the ability
to subsist on food of poor nutritional quality, and a
decrease in energy expenditure when food was scarce (55, 97,
120). Beyond the identification of a number of rare genetic
forms of obesity (38), genetic factors have been implicated
in all of the plausible etiological factors of obesity which
have been discussed here (82).
Some of the first evidence that there may be a genetic
component to obesity came from adoption and twin studies.
Adoption studies have found a strong relationship between
the weight of adoptees and their biological parents, and the
Tack of such a relatioship between adoptees and their
adoptive parents (121, 122). This relationship has also
been found to exist between adoptees and their biological
siblings, but not between adoptees and their siblings by
adoption (123). Furthermore, an adoption study which
considered both full and half siblings of adoptees found
that there was a stronger correlation between the BMI values
of adoptees and their full biological siblings (124), than
between adoptees and their biological half siblings.
Data from twin studies have provided further definitive
information on the role of genetics in human obesity. The
rationale is that identical twins (monozygotic) twins have
the same genetic makeup, whereas fraternal (dizygotic) twins
have only half of their gene pool in common. The largest
such study thus far considered 1974 monozygotic and 2097
25

dizygotic male twins (125). When ranked by percent
overweight, beginning with 15% overweight and grouped into
increments of five per cent, up to 40% overweight, the
concordance rates for all degrees of overweight were found
to be twice as high for monozygotic as dizygotic twins.
This greater concordance of obesity in monozygotic versus
dizygotic twins has been supported by other studies (126,
127). An increase in correlation with an increase in
genetic relatedness was shown for BMI in various pairs of
relatives in a recent study (123). Twin studies have also
indicated that there were strong intrapair correlations in
the responses of: body weight, skinfolds, fat mass and body
fat distribution to experimental overfeeding (120, 128).
Such information has made possible the estimation of the
heritability of various measures of obesity (8, 123), as
well as obesity itself (8). Furthermore, there was evidence
for a genetic contribution to the various components of
energy expenditure implicated in the etiology of obesity.
Genetic components have been recognized for: RMR (82, 100),
TEE and TEM (82), as well as physical activity (129) and
possibly some components of energy intake (130). Studies
have also revealed genetic contributions to the responses in
RMR, TEE and TEM to overfeeding (82, 128). Such information
has led researchers to speculate on the precise mode of
inheritance of obesity, or factors contributing to its
development (120). Several models have been discussed (8).
26

It would appear that the current thinking regarding the
interaction between the genetic and environmental
contributions to obesity is that one inherits a certain
predisposition to become overweight, and that the
environment influences its manifestation (8, 82).
Given the range of phenomena which have been
implicated to have a rote in the pathogenesis of obesity, it
is clear that obesity is of multifactorial origin. At
present, the relative importance of the various mechanisms
in the etiology of obesity is unclear. It is likely that
the etiology, or etiologies, of obesity vary widely from
individual to individual, so that treatment efforts should
be of a multidimensional approach (at least until it may
become possible to determine pathogenecity on an individual
basis).
Treatment
The treatment of obesity now encompasses a variety of
therapeutic approaches. Most methods can be classified
under one of five general headings: diet, behavior
modification, exercise, pharmacotherapy and surgery.
Conservative treatments are those other than invasive
methods such as surgical procedures, or more radical methods
such as pharmacotherapy or very low-calorie diets which
serve to take the locus of control away from the overweight
27

individual (56). The conservative treatments will be the
focus here, although it is recognized that less conservative
approaches may have their place in the treatment of certain
obesities, or perhaps most appropriately, when combined with
more conservative treatments.
As obesity was for a long while considered to be the
result of overeating, initial treatment efforts logically
focused on restricting caloric intake. Early reports by
Stunkard et al, and Wing et al, indicated that such efforts
had met with little success (50, 51). Evidence since then
has indicated some success with balanced low-calorie diets
(49, 131). However, several authors, in their reviews of
the literature, have cited low overall weight losses and
poor long-term adherence to be typical of such programs (52,
53, 132). Atkinson (133) has identified several
difficulties with such diets: the abundance of highly
palatable foods in the U.S., combined with the stimuli to
eat produced by environmental cues, habits, and social
pressures: the tendency of obese individuals to undergo
mechanisms to maintain a higher body weight; and the
typically high level of fat consumed which facilitates the
ingestion of a high number of calories, while fat is
calorically less costly to store. Perhaps these, as well as
other dificulties, have contributed to the relatively low
efficacy of most low-calorie diets.
During the past 20 years or more, behavioral
28
modification programs have become the most widely used
therapies for the treatment of mild obesity (134).
Following the concepts and techniques as originally put
forth by Fester and colleagues (135), Stuart (136), in 1971,
reported a study which demonstrated the efficacy of this
method. The core procedures utilized in early behavior
modification trials were self-monitoring and stimulus
control (134), primarily as pertaining to eating behavior.
Later, reinforcement techniques were frequently
incorporated. Currently, behavioral management programs
typically emphasize nutrition education, exercise, social
support and cognitive restructuring in addition to the
original three components (134). Such amatgamation has
taken place gradually, incorporating measures from the
various types of programs (56). The idea behind behavioral
treatment of obesity is that of changing habits or
behaviors. Originally this dealt almost exclusively with
eating behaviors; today most programs apply behavioral
principles to a variety of areas in order to affect a
reduction in weight. Several authors have reported summary
statements based on reviews of the literature regarding
behavioral programs (49, 52, 137,). They have concluded
that: there is a wide individual variation in weight loss;
group results are consistently better than those for other
treatments; weight loss is moderate, averaging one pound per
week or 10-12 pounds for the duration of the program; there
29

is little additional weight lost after treatment; attrition
rates are considerably less than other programs, (15% versus
25-75); and there are no negative side effects (49, 52,
137). Long-term weight maintenance has been reported to be
better than other programs (49), and to be sustained for up
to a year and a half following treatment (137). Since their
inception, the short-term results of behavioral programs
have improved (134). This was believed to be due to the
comprehensiveness and refinement of programs, as well as the
increase in their duration (134). Brownell and Jeffery
(138) have compiled results from several studies, and the
long-term results at one and two years look promising.
Beyond this however, a trend toward weight regain was
obvious. This trend was also evident in several other
investigations (87, 139, 140). There has been some research
into understanding and preventing relapse (141, 142, 143,
144), which is important as there is some indication that
previous attempts at weight loss have a poor prognosis for
subsequent weight loss (145), and that there can be
detrimental effects of repeated weight loss and regain
(146). It has been found that increasing treatment length
and incorporating aerobic exercise may be of some value
(134). Other approaches to behavior modification have
included psychoanalysis, work-site programs, and various
commmercial and noncommercial self-help programs (49).
Attrition has been cited as a major drawback to these latter
30

two approaches, although programs have varied widely, and
studies on their effectiveness is limited. An interesting
twist to the work-site approach is the weight loss
competition. In contrast to behavioral-based work-site
programs, weight loss competitions have been found to have
high participation rates, low attrition rates, and to result
in moderate weight loss as well as improvements in morale
and social functioning. They were also the most cost
effective of various programs (147).
Physical activity has also been investigated as a
treatment for obesity. Weight loss has been found to occur
with exercise alone in obese individuals (148, 149, 150),
although the opposite effect has also been observed (151).
It may be that there is a certain level of frequency,
intensity, or duration which is necessary to achieve an
effect, while caloric intake is certainly an important
factor (119). Overall, it would appear that exercise alone
has produced only modest decreases in body weight (53), but
has been frequently associated with beneficial changes in
body composition (52). This has been especially true when
combined with caloric restriction. Exercise has been shown
to offset the diet-induced declines in resting metabolic
rate (53, 59) and lean body mass (49).
The effects of the addition of physical activity to
caloric restriction on body weight are not clear; greater
weight loss (53) as well as no change in weight loss (31)
31

have been reported. However, when exercise was combined
with behavior modification, Dahlkoetter and colleagues
observed a greater weight loss than with either therapy
alone (152). Exercise has been cited as the best predictor
of success in a comprehensive weight loss program (54), and
to be an important factor in long-term weight maintenance
(49, 153). It has been found that exercise can increase the
thermic effect of a meal, although this may be blunted in
some obese individuals (59, 119). It has been reported that
caloric compensation in response to exercise may be
incomplete in obese persons, such that a negative energy
balance results (154). Improvements in glucose tolerance
and insulin sensitivity (155), as well as plasma TG and
Tipoprotein-cholesterol levels have often occurred in
response to exercise (156, 157). Moreover, exercise may
serve to promote a sense of well-being and self-esteem,
which could be an important stimulus to adherence in a
weight control program (55).
These various treatments for obestiy have traditionally
been administered independently, and have been assessed
based on their relative cost, risk, and short- and long-
term efficacies (49). The amalgamation of nutrition
education and aerobic exercise has proven to be a successful
approach to weight loss (14, 158). Recently, several
researchers have suggested that a comprehensive program,
which incorporates nutrition education, behavior
32

modification and exercise is most likely to produce the most fn,
effective long-term control of weight (53, 57, 59) This
has been substantiated by severel recent studies (12, 13,
61). Although information is limited, a few investigations
have indicated that such conservative treatments can be of
Value in black populations (13, 14). Given the heterogenous
nature of the pathogenesis of obesity, it would seem logical
that the best treatment approach would be comprehensive in
nature, encompassing nutrition education, behaviour
modification, and aerobic exercise in a manner which
promotes permanent changes in habits.
Walking and Aerobic Dance
There are several modes of endurance exercise which are
typically recommended for obese individuals in a weight loss
program, and Sheldahl has discussed some of these (159).
The American College of Sports Medicine (ACSM) recommennds
that when exercise is prescribed for the primary purpose of
promoting weight loss, a minimum of 300 kcal be expended per
session. “Regarding the obese patient, the ACSM states that
exercise prescription should emphasize caloric expenditure,
and that intensity should be prescribed at approximately 50%
of functional capacity, with the duration adjusted,
dependent upon body weight, in order to elicit a caloric
33

deficit of 1750 calories, or .25 kg, per week (160).
Several studies have examined the impact of walking
programs on cardiorespiratory and body composition
parameters (148, 161, 162, 163). Leon et al (148) found
that 16 weeks of vigorous walking for 90 minutes, five days
per week on a treadmill, in which an average of 1100 kcals
were expended per session, resulted in improvements in
cardiovascular parameters, work capacity, and body
composition, as well as HDL levels and the insulin-to-
glucose ratio in obese sedentary men. Shoenfeld et al (162)
found significant improvements in aerobic capacity in all
three groups of subjects who walked for three or four weeks
with loads of either: three kilograms, six Kilograms; or a
combination of the two, for 30 minutes per session, five
days per week. Lewis and colleagues (164) in 1976 found
that overweight women who participated in a
walk/jog/calisthenic program and self-determined caloric
restriction, significantly reduced their relative body fat
and weight, while increasing their lean body mass. At least
two investigations by Pollock and coworkers (161, 163) have
shown that walking programs resulted improvements in:
aerobic capacity, as measured by VO, max and resting heart
rate; body composition, as measured by body weight and
skinfold thickness; and working capacity as measured by mile
walk time. Furthermore, the effects of a walking program on
aerobic capacity and body composition has been compared to
34

those of running and cycling programs. Pollock (161) found
similar improvements when frequency, intensity and duration
were held constant.
Although beneficial effects can be realized with a
walking program, exercise compliance must be achieved.
Probably the greatest drawback to a program solely involving
walking is that it can become boring to many individuals.
This was epitomized by Kenrick, who stated that “...monotony
was the biggest problem” with their treadmill protocol
(165). Therefore, the need to recognize and counteract such
boredom in an exercise program may be tantamount to
participant continuation, since this is often cited as a
factor in attrition from exercise programs (159).
Alternative activities can be important elements in various
Fitness programs. Games are social, which can provide an
opportunity for competition, comraderie and group
interaction. They can also be effective in maintaining
participant interest, improving fiexibility and
coordination, and in teaching activities and skills which
can be enjoyed and perpetuated throughout life. Moody and
coworkers noted that when potentially monotonous endurance
activities are performed with a group, and individuals are
allowed a choice of daily routines that ‘the group
participation motive and mutual moral support was an
important element in exercise adherence’, which was
instrumental in the attainment of weight and body fat loss
35
for a group of overweight women (166). More recently,
results obtained by the addition of a structured aerobic
exercise program to a dietary weight loss program for obese
women suggest that the exercise program served to increase
group cohesiveness, as well as communication and information
exchange among participants, which contributed to greater
weight loss and nutrition class attendance for exercising
individuals (167).
Aerobic dance is another form of exercise that may be
recommended for overweight persons. Commonly referred to as
‘aerobics’, this was first introduced by Jacki Sorensen in
1972 as a means of improving cardiorespiratory endurance
(168). A real advantage and appeal of this form of exercise
lies in its diversity. It can be performed at the commonly
designated intensities of low, medium and high, or any
combination in between, as best suits the needs of the class
or the individual. Additionally, participants can be taught
to alter their movements to attain a prescribed intensity,
which can be self-monitored by taking the heart rate. In
1986 it was estimated that 23 million people regularly
engage in some form of aerobic dance, and that the lowest
intensity form of aerobics was becoming increasingly popular
(169). The designation as low-impact indicates that al}
movements are performed with at least one foot on the ground
at all times is generally recommended for overweight, low-
fit, or those individuals with skeletal problems, as it
36
decreases the chance of injuries.
The results of several other investigations have
provided evidence that aerobic dance is capable of producing
a training effect, as evidenced through increased
cardiorespiratory capacities such as: VE max (1/min); VO,
max (l/min), or (m1i/kg/min); decreased submaximal or resting
heart rate (170, 171, 172, 173, 174, 175, 176); and/or
improvement in performance measured by maximal work capacity
(171), or max work time (175, 177).
Investigation specifically into the physiological
effects of low-impact aerobics indicates that it, too, can
be an effective exercise modality. A study which compared
the effects of aerobic dance at intensities of 65-70% of
maximal heart rate vs. 80-90% of maximal heart rate
suggested that those working at the lower intensity can burn
fat as effectively as those working at the higher intensity,
if the activity is performed long enough (169). And an
unpublished study found that a ten~-week program of low-
impact aerobics produced a significant decline in resting
heart rate, systolic and diastolic blood pressure, increased
stroke volume, and decreased body fat in 15 women aged 15 to
34 (169).
The work of Cearly and Moffatt (172) suggested the
existence of a threshold level for the frequency of aerobic
exercise which must be attained before improvements in
cardiorespiratory function become manifest. They found
37
increases in VO, max and VE max in the group of college
students that participated in the two-hour aerobic dance
program three times per week, but not in the group
participating two times per week, both groups for ten weeks.
Improvements in exercise tolerance, as measured by treadmill
time to exhaustion, corresponded to the amounts of time
spent in the aerobic dance program; the 3-day/wk group made
greater improvements than the 2-day/wk group, which improved
significantly more than the control group.
Most of these investigations have not yielded
encouraging results regarding the effect of such aerobic
dance programs on body weight (171-175, 177). However,
neither did any of these studies consider the interaction of
diet. Body composition changes during aerobic exercise
programs have been less frequently evaluated than body
weight. At least three studies have found no change in body
composition (173-175) while two other studies resulted in
reductions in body fat, as measured by changes in skinfold
thicknesses (170, 176). An unpublished study found that a
ten-week program of low-impact aerobics resulted in a
decline of 2.5% bodyfat (169). The few studies which have
investigated the interaction of dietary restriction with
aerobic dance nave reported beneficial changes in body
composition. Zuti and Golding used equal energy deficits to
compare the effects of either: exercise alone (one hour per
day, five days per week for 16 weeks); dietary restriction
38

alone; or the combination of these two protocols (178).
They found that although similar amounts of weight were lost
among the three groups of subjects, that both of the
exercising groups lost a greater amount of fat than the
diet-only group, and that the exercisers had increases in
lean body mass, whereas the diet-only group lost lean body
mass, as determined by underwater weighing. The subjects
were 25 women, aged 25 to 42, and were overweight by 20 to
40 pounds. Sikand et al (167) have examined the effects of a
structured aerobic exercise program twice weekly for 16
weeks to the addition of a very-low-caiorie diet in thirty
obese women, aged 21 to 60. Both exercising and non-
exercising groups lost significant amounts of weight and
body fat. The exercisers lost a greater proportion of their
weight in fat compared to the non-exercisers, although
differences between groups were not significant.
Significant differences were noted, however, in the tatter
half of the treatment period for weight loss, with the
exercise group continuing to lose weight, while the non-
exercising group exhibited a decline in the rate of weight
Tost.
These investigations support idea that aerobic dance,
at least when in conjunction with dietary restriction, as
well as a program of walking, could prove to be an
acceptable means of decreasing weight and improving body
composition and physical fitness in overweight or obese
39

individuals. Observations suggest that the socia}
interaction and group structure of aerobic dance may be
important elements in its effectiveness.
The effects of exercise-with-diet versus caloric
restriction alone on body composition
In contrast to the relatively small amount of research
into the effects of aerobic dance on cardiovascular or body
composition parameters among participants, there has been
more research conducted regarding such effects of more
traditional forms of aerobic exercise. Exercise has been
shown in a number of studies, to elict body weight, and
particularly body fat, losses (179). However, some research
suggests that exercise alone may not produce a significant
decrease in total body weight, which is due to an increase
in lean body mass concommitant to a decrease in body fat
(150). Other investigations have found no change in body
fat, but an increase in body weight (180, 181), due to an
increase in lean tissue, following exercise programs.
The combination of exercise with dietary restriction
has been found by more than one investigator to result in
greater losses of both body fat and body weight. In 1985,
Lennon and coworkers considered changes in body weight and
per cent body fat resulting from either: self-selected, or
prescribed exercise with diet, or diet alone in overweight
40

individuals (182). The regimen of prescribed exercise with
diet resulted in the greatest decrements in body weight and
per cent body weight, as well as per cent body fat. And in
1987, Wirth et al found that the addition of physical
training to a very-low-calorie diet resulted in greater
declines in: body weight, per cent body weight, body fat,
and per cent body fat than a hypocaloric diet alone (183).
However,the results of a study reported in 1984 suggest that
the addition of exercise to dietary control! enhances fat,
but not total body weight toss (184). This apparent lack of
effect of exercise on total body weight may be more
appropriately evaluated by considering changes in lean body
mass.
In 1985, Sopko and coworkers provided equal energy
deficits, which were based on individual requirements, as
well as fixed nutrient composition of the diet for all
groups in their study of the effects of exercise, diet, or
diet-with-exercise in 21 sedentary men (185). They found
that although dietary weight loss produced the greatest
decrements in total body weight, that exercise-with-diet
produced the greatest decrements in per cent body fat, as
determined by hydrostatic weighing. Neither the exercise-
only nor the control group exhibited significant decrements
in either body weight or body fat. Although it is not
readily apparent from the authors’ reported results,
calculation reveals that the exercise with dietary regimen
41
further improved body composition by increasing lean body
mass, whereas the diet-only group experienced a decrease of
lean body mass.
In 1987, Belko and coworkers employed equal energy
deficits and equal dietary compositions between diet-only
and diet-with-exercise groups. They found that diet alone
produced a greater weight loss, but that fat losses did not
differ from the diet-with-exercise group, such that a
greater proportion of weight loss was due to fat loss and
less from the loss of lean tissue, in the exercising group
(186). At least three other studies, published between 1985
and 1987, which compared the effects of diet-with-exercise
vs. diet found that weight losses were similar between the
two protocols, but that the addition of exercise improved
the proportion of weight lost as fat, while either
decreasing the proportion lost from fat-free mass (187,
188), or increasing the fat-free mass (189) in obese
individuals.
The Effects of Exercise and/or Dietary Restriction on
Serum Lipoprotein Cholesterol and Triglycerides
Obesity has been associated with increased levels of
triglyceride (18, 190, 191, 192, 193), and total cholestero!l
(190, 194, 195), as well as decreased levels of HDL-C (18,
196): a profile that is condidered predictive of CHD (34,
42

197). Elevated total cholesterol (TC) levels have long been
recognized as an increased risk for the development of
atherosclerosis and subsequent coronary event (197, 198,
199, 200). However, the distinction has since been made
between subfractions of cholesterol which are based upon
various densities (201, 202). The four different classes
which are recognized are termed: low-density lipoprotein
cholesterol (LDL-C), very-low-density lipoprotein
cholesterol (VLDL-C), intermediate-low-density lipoprotein
cholesterol (IDL-C), and high-density lipoprotein
cholesterol (HDL-C). Even more recently, two major classes
of HDL have been identified, called HDL,; and HDL, (203).
HDL-C is believed to be involved in the transport mechanism
of cholesterol from tissues, (including arterial walls), to
the liver for degradation and excretion (204, 205, 206),
while LDL and its precursor, VLDL, have been shown to be
involved in the transport of cholesterol to the arterial
intima (206), thus leading to the development of
atherosclerotic plaque. Support for this concept comes from
angiographic studies which have shown the severity of
coronary artery disease to be positively associated with
LDL-C concentration and negatively associated with HDL-C
concentration (207, 208, 209, 210), as well as
epidemiological data which reveal that populations with a
lower incidence of coronary artery disease also have higher
levels of HDL cholesterol and/or lower levels of LDL
43

cholesterol] (34, 211, 212, 213, 214). Furthermore, several
studies have found HDL-C to be a better predictor of CHD
than LDL-C (34, 211, 212). The roles of HDL,-C and HDL,-C
In the atherogenic process are not as well-established. It
is betieved that they undergo different metabolisms (215,
216), and that HDL, contributes a greater part of the
variability in HDL (217).
Based on such evidence, it has been proposed that HDL
and its HDL, subfraction should be used to predict the risk
of CHD (210, 214), and it has therefore been suggested that
increasing HDL levels (and/or decreasing LDL levels -such
that the HDL/LDL ratio is increased,) rather than the non-
specific reduction of total cholesterol may be the most
appropriate approach in the prevention of athersclerosis and
subsequent myocardial infarction (204, 212). In fact,
measurements of angiographic changes made over a five-year
period have indicated that changes in the ratios of HDL-
C/TC and HDL-C/LDL-C were better predictors of angiographic
dynamics than either variable alone (218). Furthermore, the
American College of Sports Medicine (ASCM) recognizes a
ratio of TC/HDL of greater than 5 to be a major coronary
risk factor (160).
Like TC and LDL levels, triglyceride (TG) levels have
also been found to be positively associated with coronary
artery disease (CAD) (219, 220). Although the association
has not typically been as strong or as consistent as for

those of cholesterol (211), studies have shown that 20-30%
of individuals with CHD also have hypertriglyceridemia (221,
222, 223, 224). This would suggest that a high level of TG
1s associated with the atherogenic process, even if it is
not an independent risk factor.
The effects of caloric restriction on serum lipoprotein
cholesterol and triglycerides
The effects of caloric restriction alone on lipoprotein
profiles have been widely studied. Improvements have
frequently been observed in TC, LDL, and/or VLDL fractions
tn obese individuals following hypocaloric diets (225, 226,
227, 228, 229). Triglyceride levels have also been found to
be decreased following caloric restriction (225, 226, 230),
while the effects on HDL-C have been more variable:
increases (226, 229, 231), decreases (225-227, 230, 232,
233), as well as no change (228, 234) have been observed in
obese subjects. Studies which have conducted follow-up
evaluations, however, have often found subsequent changes in
the magnitude and/or direction of one or more lipid
parameters (227, 230, 235, 236, 237), particularly HDL-C.
HDL-C levels have been found to be increased above post-
treatment levels at follow-up evaluations conducted between
two and eight months after treatment (228, 230, 233). The
frequency of this occurrence has led to the suggestion that
45

the mechanisms affecting lipoprotein levels, particularly
HDL, may be different during active, versus stable weight
loss (227, 232). Where measured, changes in the HDL,
subfraction have been found to be primarily responsible for
changes in HDL-C during diet-only protocols (238).
The effects of exercise on serum lipoprotein
cholesterol] and triglycerides
Substantial information also exists regarding the
effects of exercise upon serum lipoprotein cholesterol and
triglyceride. At least as early 1973, there was evidence
which suggested that exercise could produce favorable
changes in blood lipid profiles (239), and by 1981 it was
generally believed that regular physical activity would
reduce TC, LDL cholesterol, and TG, but elevate HDL
cholestero! (156, 157, 240). In 1983, an analysis which
considered the results of 66 training studies conducted over
the 26 years prior to December 1981, was published (241).
It was found that, across all types of subjects, treatments,
sources, and research designs, exercising subjects underwent
significant reductions in TC, TG, LDL, and the TC/HDL ratio,
as well as a non-significant increase in HDL, while none of
these changes for the control groups were significant. The
analysis also revealed that initial levels of TC, TG, HDL,
and the TC/HDL ratio were strongly correlated with their
46
respective changes following training.
Work since this analysis has leant further espousai to
its results. Wood and coworkers, in 1985 (242), reported
significant decreases in total cholesterol and LDL-C, and a
significant increase in HDL-C among fourteen middle-aged,
sedentary men who participated in a progressive running
program over a two-year period.
The effects of physical exercise on the blood lipids of
healthy young men were investigated by Danner and coworkers
in 1984 (243). After seven months of training, significant
decreases in TC and TG and significant increases in HDL-C
were found in 15 oursmen compared to 21 sedentary controls
who were matched for age, as well as smoking and drinking
habits.
Studies which have compared individuals based on their
habitual activity levels have found better better
lipoprotein profiles, especially higher HDL levels, in those
persons who exercise regularly (244, 245, 246, 247, 248,
249, 250, 251, 252). When measured, the HDL, subfraction
has also been found to be elevated (253, 254, 255). Lower
levels of LDL-C (249, 251, 252, 256), VLDL (252), TG (249,
251, 252) and TC (249) have also been found to be typical of
routinely active individuals.
One study by Adner and Castelli found that although TC
Jevels were similar in active and sedentary individuals,
that the HDL-C level was significantly higher, and thus the
47

TC/HDL-C ratio significantly lower, in the active, compared
to the sedentary group (244). Furthermore, levels of HDL-
C, TC, and the HDL-C/TC ratio have been found to be
correlated to the amount of activity, as measured by the
number of miles run per week in a group of marathon runners
(249). Another study found that when runners ceased
running, there were significant decreases in both HDL and
HDL,, concomitant to a significant increase in LDL (257).
The effects of exercise with caloric restriction,
versus caloric restriction alone on serum lipoprotein
cholesterol and triglycerides
Several studies have compared the effects of exercise-
with-diet versus diet alone on plasma variables. Saldivar
et al (258), and Hil] and coworkers (188) have found similar
effects on lipid parameters resulting from caloric
restriction, either with, or without exercise. Two other
investigations have shown the addition of exercise to
caloric restriction to be more effective in eliciting a
beneficial lipoprotein profile than caloric restriction
alone. Lampman et al (259) evaluated the effects of the
addition of an exercise program to a hypocaloric diet in
severely obese individuals for six months. The exercise
program consisted of fast walking and siow jogging for 45
minutes, three times per week, at an intensity of 75% of
48

maximal heart rate; the hypocaloric diet was described only
as consisting of 600 kcal per day. It was found that TC
decreased significantly only in the-diet-with exercise
group, while triglycerides were not observed to change
significantly in either group. LDL and HDL were not
measured. Thompson and colleagues (257) took the reverse of
this approach by implementing exercise cessation for the
diet-only group, rather than initiating exercise for the
exercise-with-diet group. All subjects consumed a baseline
diet composed of 15% protein, 32% fat, and 53% carbohydrate;
all ran 16 km daily during this baseline period. For a ten
day experimental period, the control group continued running
and consumed the same isocaloric baseline diet. The other
two groups consumed 20% fewer calories of this same diet and
either continued running, or ceased their training regimen.
Significant atherogenic changes in HDL-C and HDL, were found
upon exercise cessation, while continued training combined
with caloric restriction was found to result in significant
beneficial changes in HDL-C, HDL,, and LDL-C.
The effects of exercise with caloric restriction,
versus caloric restriction alone, versus exercise alone, on
serum lipoprotein cholesterol and triglycerides
Although a substantial amount of research has been
conducted on the effects of diet alone or exercise alone,
49

and a fair amount has been conducted on the combination of
exercise with diet vs diet alone, there have been few wel}-
controlled studies which have concomitantly examined the
independent and interrelated effects of exercise and diet on
changes in lipoprotein patterns. One such study was
reported by Sopko in 1985 (185). Twenty-one obese sedentary
male subjects were divided into four groups: inactive and
constant weight (control); exercise and constant weight;
inactive and weight loss; and exercise with weight loss.
All consumed the same dietary composition, fixed at 45%
complex carbohydrates, 15% protein, and 40% fat (p/s ratio =
2). The exercise protocol, treadmill walking, was designed
to produce an energy deficit of 3500 kcal per week for each
individual, while dietary restriction was set at 3500 kcal
per week below individual isocaloric requirements. It was
found that 12 week periods of either diet or exercise were
equally effective in inducing increments in HDL-C, but that
there was an additive effect for the combination of the two
protocols in obese men. This synergistic effect of diet and
exercise was also observed for levels of the TC/HDL ratio
which were significantly decreased in the exercise-with-
weight-loss group compared to inactive-with-weight- loss or
exercise-and-constant-weight groups. The slight increases
seen in TC, LDL-C and TG seen both with exercise and with
diet were not significantly different, but significant
decrements occurred in the group which combined diet with
50

exercise.
In 1986, Hagan et al (260) examined the independent and
interrelated effects of exercise and a dietary protocol.
Forty-eight males and 48 females, who were 120-140% of ideal
body weight, were randomly assigned to groups (N = 12) of
either: diet-exercise (DE), diet (0D), exercise (E), or
sedentary control. The exercise regimen consisted of a
walk/run program five days per week for 30 minutes per
session, while the dietary regimen was a 1200 kcal per day
diet. No significant differences in any of the plasma
variables were found among women. However, in males,
significant decrements in TG and TC occurred in those who
were dieting while exercising compared to diet-only,
exercise-only, and control groups. It should be noted,
however, that because the three protocols were not based on
equal energy deficits, that both male and female groups of
(DE) lost a significantly greater amount of body weight and
percentage of body fat than either respective (D) or (E)
groups. These factors could have affected the observed
changes in plasma variables.
51
The Effects of Dietary Restriction and/or Exercise on
Glucose and Insulin Metabolism
Obesity, and glucose and insulin levels
The association between obesity and high plasma insulin
levels has been recognized at least since 1963 (261), and is
often concomitant to some degree of insulin insensitivity
(262, 263,264 ). This decreased insulin sensitivity is
manifest in several ways: decreased peripheral glucose
uptake, excessive hepatic glucose production in the basal
State, and/or inadequate suppression of hepatic glucose
output by exogenous insulin (262). Such associations
between overweight and alterations in carbohydrate
metabolism have been emphasized by demonstrated improvements
and decrements in glucose tolerance or insulin resistance
with weight loss (265, 266) and regain (266), respectively.
Weight loss, both by dieting alone (267), as well as
exercise alone (148), has been shown to be associated with
improvements in carbohydrate metabolism in obese
individuals. Exercise, however, even in the absence of
weight loss (268), or even concomitant to weight and body
fat gain (151), has resulted in improvements in glucose
tolerance and insulin sensitivity.
52

The effects of exercise in conjunction with dietary
restriction on glucose and insulin metabolism
Since both physical training and various forms of food
intake modifications have been documented to be instrumental
in the enhancement of insulin sensitivity in obesity, it
should be of interest whether the combination of these two
treatments results in an even more pronounced improvement in
insulin sensitivity. At least four groups of investigators
have found this to be true. Schteingart et al, in 1983
(269) investigated the effects of physical training in
conjunction with dietary weight loss compared to dietary
weight loss with occupational therapy in 16 severely obese
(150-300% of ideal body weight) subjects for six months.
Exercise consisted of fast walking and jogging for 45
minutes, three times a week at 75% of maximal neart rate.
Diet was a uniform 600 kcal per day diet for all subjects;
dietary compostion was not detailed. All subjects also
received psychotherapy. At six months, both groups showed
an improved sensitivity to insulin, but there was a 41%
greater increase in response to insulin in the diet-plus-
exercise group. The change in insulin sensitivity was
closely associated with the improvement itn aerobic capacity,
only in the diet-plus-exercise group.
Lampman et al, in 1980 (270), investigated the effects
of the addition of exercise to a calorically restricted type
§3

IV hyperlipoproteinemia diet, for nine weeks, in 27 middie-
aged men with type IV hyperlipoproteinemia. The diet
consisted of: 20% protein; 40% fat; and 40% carbohydrate,
of which 70% was starch, and 30% sugars. The p/s ratio was
1:1, and dietary cholesterol! less than 350 mg per day.
Intake was adjusted individually in each group to maintain a
weight loss of one pound per week. The exercise regimen was
reported to be based on walking/jogging for 30 minutes per
day, three days per week, at 85% of maximum heart rate.
Aerobic capacity increased by 12% in the exercising group,
and although this did not reach statistical significance,
the increase in total performance time did, and was
significantly greater than for the non-exericising group.
Only the exercise-plus-diet group displayed a significant
reduction in fasting plasma insulin values. There was a
strong correlation between the decline in fasting insulin
and increases in aerobic capacity, only in the physically
trained group.
Two other investigations, conducted in 1981 and 1987,
(183, 271) examined the effects of the addition of a very-
low-calorie diet to regular exercise on giucose and insulin
metabolism in obese persons. Krotkiewski et al found that
glucose tolerance deteriorated in the diet-only group, but
was unchanged in the group which combined diet with
exercise. Wirth and coworkers reported that fasting insulin
levels decreased with the duration of both treatments, but
54

that this was more pronounced in the exercising group.
Collectively, these studies suggest that a balanced,
calorically-limited diet in conjunction with physical
exercise, iS a better approach than diet alone for the
improvement of insulin and glucose levels, and insulin
sensitivity, in obese as well as hypertriglyceridemic
patients. The beneficial effects of these protocols have
also been observed in diabetic individuals and would suggest
that they could conceivably act as preventive measures in
obese individuals, given that such individuais appear to be
at an increased risk for developing diabetes.
Effects of Food Components on Serum Cholesterol,
Lipoprotein Cholesterol, Glucose, and Insulin
The effects of dietary fat and cholesterol on serum
cholesterol and lipoproteins
The individual effects of dietary fat and cholesterol
upon serum cholesterol have been recognized for at least 30
years (272). In fact, numerous studies by various
researchers in the 1960’s led to the development of
prediction equations for the change in serum cholesterol
based upon the percentage changes in dietary saturated,
monounsaturated and polyunsaturated fatty acids, as weil as
the (absolute) change in dietary cholestero! (273, 274).
55

The contribution of the monounsaturates had later been found
to contribute little to the overall regression equation, and
so this coefficient was consequently dropped. Such
equations indicated that both dietary cholesterol! and
saturated fat increased serum cholesterol, but that dietary
cholesterol! was about three times more effective than
saturated fats, while polyunsaturated fats decreased serum
cholesterol, but were about three-fourths as effective as
saturated fats. Subsequent research has generally supported
these findings (275, 276, 277, 278, 279, 280, 281).
However, monounsaturates have since been found to have a
more beneficial effect than previously believed (282). A
diet high in monounsaturated fats has been found to be at
least as effective as a low-fat, high carbohydrate diet in
lowering plasma cholesterol (283) and monounsaturated fats
have been found to be as effective as polyunsaturated fatty
acids (PUFA) in lowering LDL-cholesterol, while apparently
reducing HDL-C less frequently than polyunsaturates (281).
Investigation into the specific effects of monunsaturates on
plasma cholesterol parameters: has stemmed from concerns
regarding the safety of polyunsaturated fats which have been
shown to cause carcinogenesis in rats (284), and to alter
the composition of cell membranes (285). They have also
been implicated in the lowering of HDL levels (286, 287,
288, 289). Conversely, diets with a low p/s ratio (low in
PUFA, high in saturated fat) have been associated with
56

higher TC levels, but also higher HDL levels (290, 291). In
view of the currently accepted roles of HDL- and LDL-
cholesterol in the etiology of CHD (34), such findings
highlight the importance of distinguishing between the
effects of dietary fats and cholesterol on specific
parameters of cholesterol metabolism.
Observational studies of populations consuming
traditionally low-fat diets (292, 293) as well as such diets
which were administered experimentally (286, 294), have
exhibited lower levels of total and LDL-cholesterol, as well
as lower levels of HDL and the HDL,/HDL, ratio.
A study by Hulley et al, in 1977, which was designed to
assesss the effect of an intervention program aimed at
lowering conventional CHD risk factors (295) through
decreased fat and cholesterol intake, found that HDL rose
slightly compared to the control group. Changes in neither
LDL-C nor TC were reported.
Many studies have indicated that most of the rise in
serum cholesterol upon dietary cholesterol supplementation
is due to LDL-cholesterol (290, 296, 297, 298, 299,300, 301,
302, 303). HDL-C concentrations have been unaffected (290,
296, 299, 300, 302, 304) and increased (297, 301, 305) upon
cholesterol supplementation, as well as decreased upon
cessation of egg consumption (306).
These positive relationships between both dietary
cholesterol and saturated fat with serum cholesterol have
57

been found to be predictive of the risk of dying from CHD.
The Western Electric Study in Chicago followed 1900 men for
20 years. It was found that the risk of dying from CHD was
significantly related to the diet score (the sum of dietary
cholesterol plus saturated fat minus polyunsaturated fat)
(307). Similar conclusions were drawn in 1985 by Kushi and
coworkers from a 20-year study of 1000 men from three
different cohorts (308). The correlations between dietary
scores and death from CHD were found to remain significant
even after adjustment for other CHD risk factors.
Polyunsaturated fats
Although it was generally accepted by 1965 (273) that
polyunsaturated fats were capable of lowering total serum
cholesterol concentrations in man (309, 310, 311, 312), less
was known about their effects on the cholesterol
specifically associated with lipoproteins of various
densities. Since then, the majority of published research
has supported the role of polyunsaturated fats in lowering
both LDL-C and HDL-C in their decretional effect upon total
serum cholesterol (279, 286, 289, 313, 314, 315, 316, 317),
while changing from a high to a low p/s ratio diet has been
observed to result in increases of both LDL-C and HDL-C
(318).
However, more recently published work by Weisweiler et
58

al, and Judd et al, has suggested that at least under some
circumstances, diets rich in polyunsaturated fats can result
in lower total cholesterol] and LDL-C levels, while HDL-C
levels remain unaffected (319, 320). Moreover, a population
study has found a positive correlation coefficient between
the dietary p/s ratio and HDL-cholesterol levels (321).
Irrespective of individual changes in LDL- and HDL-
cholesterol levels, an improvement in the LDL/HDL
cholesterol ratio has been found by many investigators to be
a major advantage to diets high in polyunsaturated fat (279,
289, 316, 318, 319, 320). Several researchers have reported
that high p/s ratio diets resulted in significantly
decreased TG levels (279, 286, 289, 319), while increased
levels following diets with a low p/s ratio have also been
reported (317, 318). Where HDL,-cholesterol levels have
been measured, polyunsaturated fat diets have been found to
lower (286), or not affect initial levels (320).
Monounsaturated fats
Investigation into the consequences of substituting
monounsaturated fat for polyunsaturated fats was was born
out of an incidental finding: in 1970 Keys reported that in
Mediterranean countries, despite a rather high (40% of total
calories) average fat intake, plasma cholesterol levels and
CHD rates were relatively low (322). The typical diet in
59

these countries is high in olive oil, which consists
primarily (77%) of monounsaturated fatty acids (primarily
oleic acid). From the research into the effects of
monounsaturated fatty acids on plasma lipids has emerged a
rather consistent pattern: monounsaturated fats lower total
cholestero! and LDL-C at least as much as polyunsaturates,
while they also increase or maintain HDL-C levels, or
decrease them less than polyunsaturates (281, 317, 323).
This has also been found to be true when monounsaturated
fats were compared with low-fat, high-carbohydrate diets in
normal volunteers (283, 324, 325), and in diabetics (326).
Plasma glucose levels have been found to be significantly
lower on an olive- versus a corn-oil or baseline diet (317).
Triglyceride levels have been found to be improved
(decreased) by olive vs corn-oi1 (323). Perhaps one
explanation for their typical improvement of lipoprotein-
cholesterol! is related to cholesterol metabolism; a positive
correlation has been reported between monounsaturated fatty
acid intake and the fractional catabolic rate (FCR) of LDL-
C (327).
Carbohydrates
Dietary carbohydrates are perhaps most recognized for
their roles in glucose and insulin metabolism. At least as
early as 1935, Himsworth showed that isocaloric reduction of
60

carbohydrate (CHO) impaired, while increased CHO improved,
oral glucose tolerance (328). Evidence of improvements in
oral glucose tolerance as well in insulin sensitivity have
been reported with high CHO diets in normal (329, 330, 331),
obese (331, 332, 333, 334, 335), and those individuals with
Impaired glucose metabolism (331, 332). Following such
diets, fasting glucose as well as insulin levels have been
reported to decrease in the face of an unchanged insulin
response to oral glucose, thus suggesting increased tissue
sensitivity to insulin (332).
As long ago as 1930, evidence was presented which
indicated that dietary carbohydrates could attenuate the
hyperlipemic effects of fats in the diet (336). When
compared to usual diets, high-carbohydrate diets have been
observed to have beneficial effects on total cholesterol
levels in normal individuals (337), those with type III
hyper lipoproteinemia (338), as well as those with maturity-
onset diabetes (339).
Where LDL-C and HDL-C have been measured, both have
been found to contribute to the decrease in total
cholesterol upon application of a high CHO diet (283, 294,
337-339, 340). This decrease in HDL-C is purported to be
one of two major arguments against a recommendation to
greatly increase the CHO content of the diet (341). The
other major argument against greatly increasing
carbohydrates in the diet is their hypertriglyceridemic
61

effect (341). This has been established in numerous studies
(283, 331, 337, 342, 343, 344, 345, 346, 347, 348, 349), and
has been shown to occur in a range of subjects: obese, with
and without impaired glucose tolerance (331);
hyperlipoproteinemics (347, 349); individuals with varying
degrees of atherosclerosis (344, 346); diabetics (346); as
well as normal individuals (283, 331, 337, 342, 343, 345,
347-349).
Simple carbohydrates, particularly sucrose
Carbohydrates can be seperated on the basis of their
abilities to undergo digestion and absorption. Simple
carbohydrates, or sugars, have fewer chemical bonds, and are
digested more easily and absorbed more rapidly than complex
carbohydrates.
In 1978, Macdonald reported the effects of a high sucrose
diet (6 g/kg/day) for 19 days in nine healthy young
volunteers. Following the dietary period, total cholesterol
and TGs were found to be significantly elevated, and HDL-C
and the HDL-C/TC ratio significantly lower, than initial
values (350).
In 1979 Reiser et al compared the effects of six weeks
of two natural-food diets differing only in that 30% of the
calories were from either sucrose or cooked starch (351).
For the group of 19 subjects, TG and TC levels were
62

significantly higher on the sucrose diet than on the starch
diet.
In 1983, the consequences of switching from a diet in
which 25-30% of the calories came from sucrose, to a 10%
Sucrose diet was reported (352). It was found that serum
TGs decreased by 33% during the lower-sucrose period. This
effect was more pronounced in obese than non-obese
subjects.
Simple, vs more complex CHOs, have also been shown to
elicit greater insulin responses, which ts beleived to
stimulate VLDL-C synthesis, and thus result in increased TG
levels (353). Fujita et al found that glucose, when
combined with gelatin (.6 gm per kg bodyweight of each),
resulted in much higher insulin levels than did an
equivalent amount of gelatin alone (345).
Crapo and coworkers, in 1976, studied the effects of
glucose, sucrose, and various starches on postprandial
glucose and insulin responses in 19 normal volunteers.
Among the findings were: a) that the ingestion of raw
starch resulted in 35-65 per cent lower insulin response,
and a 44% lower plasma glucose response than did either
glucose or sucrose ingestion; 6b) that glucose and sucrose
elicted equivalent glucose responses, but that sucrose
elicited a 20% greater insulin response; c) that different
cooked starches differed in their elicitation of glucose and
insulin responses; d) and that glucose responses were (40-
63

60%) lower, while insulin responses gererally similar, when
the CHO was given as a meal versus a drink -this being true
for all CHOs examined (354). Thus, the form of a diet, as
well as constituent dietary variables are likely to affect
glycemic responses. The credence of such work is further
borne out by numerous epidemiological surveys which have
found negative associations between sucrose intake and HDL-
cholesterol (355, 356, 357, 358), and in particular its HDL,
mass (359), as well as positive associations between sucrose
intake and LDL-cholesterol (355) as well as TG levels (358).
Fiber
The consumption of a fibrous-type diet had been
recognized at least thirty-five years ago to be associated
with lower serum lipid concentrations (360). It has been
suggested that the low cholesterol! levels (361) and rates of
CHD in African populations may be due to their high intakes
of complex carbohydrates and fiber (362, 363). Burkitt and
Trowell have observed that in Western countries, grain and
cereal consumption has declined markedly during the past two
centuries, while atherosclerosis, diabetes, hypertension,
and cancer have increased (364). Moreover, severa}
epidemiological studies have found an inverse correlation
between dietary fiber intake and CHD (308, 365, 366, 367,
368). This has included the measurement of CHD by mortality
64

rates (308, 366, 368), symptomatic CHD (365), as well as
coronary lesion growth (367). Such findings have incited
further investigation into the effects of complex~
carbohydrate, fibre-supplemented diets.
In 1876 Albrink et al examined the effect of a high-
CHO diet given as high fiber food in seven young adults
(369). They were fed alternatively in random order
isocaloric high- and tow-fiber diets for one week each in a
double cross-over study. Both diets consisted of 70% CHO,
15% fat and 15% protein. In the high-fiber diet, whole
foods such as baked beans, rice, and wheat bread were
provided. In the other, the CHO consisted of glucose and
dextrins in a liquid formula. This diet produced
significant increases in both TC and TG from baseline, while
the high-fiber diet resulted in significant decreases.
The effects of dietary fiber supplementation to both a
fat- and CHO-modified diet as well] as a ‘typical US diet’
were assessed by Lewis et al in 1981 (370). A ‘Western”
reference diet (diet A = 46% of energy from CHO, 40% from
fat, 14% from protein) was compared with: a fat-modified
diet (diet B = 59% of energy from CHO, 27% from fat, 14%
from protein); with a fiber-supplemented, fat-modified diet
(diet C = 59% of energy from CHO, 27% from fat, 14% from
protein, fiber in the form of fruits, vegetables, and cereal
fiber); and with a fiber-supplemented ‘Western’ diet (diet D
= 47% of energy from CHO, 40% from fat, 14% from protein).
65

Subjects were 12 healthy monks living in a confined
dwelling. Al? diets were fed for five weeks and all
participants consumed all four diets. Compared to diet B,
both fiber-supplemented diets C and D produced greater
decrements in TC and LDL-C. These fiber-supplemented diets
also resulted in significant decreases in both serum TG and
VLDL-TG, whereas diet B (containing only 20, vs an average
in diets C and D of 51 g fiber/2500 kcal per day) produced
no change in serum TG and a slight (4.8%) increase in VLDL-
TG. The two fibre-supplemented diets also produced less
deleterious effects on HDL-C and HDL, than did diet B.
Work with particular types of soluble fibers has
shown some to be more effective than others in the
improvement of lipoprotein parameters. Pectin, for example,
is a soluble fiber found in high concentrations in citrus
fruits, as well as other fruits and vegetables that has
proven to be of particular beneficience. A review published
in 1987 considered studies which examined the effects of
pectin or pectin-containing foods on the metabolism of
cholesterol, lipoproteins and carbohydrate (371). The
summary of 18 studies stated that in 14 of them, there were
significant decreases in total cholesterol, which ranged
from four to thirty-one per cent. Two of the studies
reported insignificant decreases of three and eight per
cent, while two studies reported no change in serum
cholesterol. In none of the (five) studies in which it was
66

considered, did a reduction in HDL-C occur. This would
suggest that the pectin-induced decrement in TC is largely
accounted for by declines in LDL- or VLDL-C. It was found
that TG levels were unaffected by pectin, and while there
were decreases in insulin responses, they were usually less
marked. The analysis of these studies has led Reiser to
conclude that there is some evidence that the cholesterol-
Towering effect of pectin is dose-dependent, and that there
is a greater effect in those with higher cholesterol levels.
Protein
The National Research Council’s recommendation for
dietary protein of .8 g per kg of body wieght has remained
little changed since 1953 (372, 373, 374). Perhaps because
we recognize a distinct role for protein, as that of forming
the structural integrity of all body cells, as wel! as
constituting hormones, enzymes, and antibodies for life’s
processes, inquiry into the specific effects of protein on
aspects of obesity, CHD or other metabolic abnormalities has
been a more latent area of investigation. Some research
into the effects of protein has been conducted, however, at
least as early as 1967 (375). Since World War I, when
soybean use developed as an alternative source of protein
and vegetable oil] (376) epidemiological studies have shown
animal protein in the diet to be positively, and pliant
67

protein to be negatively correlated with: the percentage of
atherosclerotic lesions present on the aorta and coronary
arteries (377), mortality from CHD (378, 379, 380), as well
as serum levels of: triglycerides, VLDL mass (381), and
total cholesterol] (293). Work by numerous researchers in
the 1970’s and ’80’s established with little uncertainty
that soy protein, which was becoming the standard for
vegetable protein, when substituted for, or compared to,
diets in which the protein was primarily of animal origin,
produced beneficial changes in TC, LOL-C, VLDL-C, HDL-C and
TG (382, 383, 384, 385, 386, 387, 388, 389. 390.) or smaller
decrements in HDL-C (390, 391) in healthy,
hypercholesteroltemic, and/or obese individuals.
Protein is recognized to potentiate insulin secretion,
although generally tess effectively than carbohydrates
(392), and the effect in normocholesterolemic individuals is
typically less than that in hypercholesterolemics or
diabetics (393). The differing effects of various protein
sources on insulin response observed by Gannon and coworkers
(394) and the lower insulin values observed by Sanchez and
colleagues (395) in response to arginine and lysine has
suggested that individual amino acids may be important in
the effect of a protein on insulin response. And since
insulin and glucagon play such leading roles in cholesterol
metabolism, the authors suggested that these two amino acids
may be tantamount to a protein’s effect on lipoprotein
68

cholesterol levels. Whatever the cause, there is sufficient
evidence which suggests that plant protein affects total
cholesterol] and lipoprotein cholesterol levels differently
than animal protein, and it appears that the effects of soy
protein are most marked.
Consideration of the data amassed in the past four
decades suggests that a wise dietary approach to a healthy
1ipoprotein profile is one which restricts the daily intake
of cholesterol and sataurated fats, while replacing, or
partially replacing, these with complex carbohydrates and
Fibrous foods. The American Heart Association recommends a
diet with a limit of 300 mg of cholesterol per day, and a
limit of 30% of calories as fat, in which not more than 10%
are in the form of saturated fats and at least 10% are
polyunsaturated fats. In view of some of the deleterious
effects of polyunsaturated fats, perhaps a greater
proportion of monounsaturated fats should be advised. While
maintaining one’s weight in the ideal range, such a diet is,
to the best of scientific research thus far, the most ideal
one to maintain acceptable levels of TC, the ratio of LDIL-
to HDL-cholesterol, TG, glucose and most likely the levels
of VLDL-C, HDL,-C, HDL;, and insulin.
69

Project Objectives
1. To assess the effects of a multifaceted weight loss
program on body weight and composition, plasma variables,
and nutrient intake in obese black women for six months.
The weight loss program encompassed:
a. 1200 Kcal exchange diet
b. nutrition education
c. behavior modification
d. aerobic exercise for able subjects
2. To determine the effects of the addition of aerobic
exercise to a program that included a 1200 Kcal exchange
diet, nutrition education, and behavior modification on:
a. Body Composition ae
1) weight
ii) % body fat
i111) % lean body mass
iv) % body water
b. Plasma Variables
1) TC
17) LDL-C
133) HDL-C
70

iv) HDL-C
v) TC/HDL-C
vi) TG
vii) Insulin
c. Nutrient Intake
3. To compare the effect of the level of compliance to
nutrition education/behavior modification classes on body
composition, plasma variables, and nutrient intake.
4. To evaluate the effects of the level of exercise
participation on body composition, plasma variables and
nutrient intake.
5. To identify meaningful correlations among changes in
body composition, plasma variables, and nutrient intake
following a comprehensive weight loss program in obese black
femate subjects.
6. To identify meaningful correlations between changes in
body composition, plasma variables, and nutrient intake
components resulting from different levels of exercise
participation, and different levels of compliance to
nutrition education/behavior modification classes.
71

7. To determine whether changes resulting from a
comprehensive weight loss program were dependent on initial
levels of selected body composition, plasma, and nutrient
variables.
8. To determine, for different levels of exercise
participation and nutrition education/behavior modification
compliance, whether changes in selected variables were
dependent on their initial levets.
9. To subjectively observe characteristics, attributes or
other factors which may be helpful in the planning or
implementation of future weight loss programs for obese
black women.
72

JOURNAL ARTICLE
73
The effects of a nutrition program with and without
aerobic exercise on body weight and composition, plasma
variables and nutrient intake in obese black women.
Katherine M. Williamson MS, Forrest W. Thye PhD, Soon W.
Moak MS, Leslie K. Reynotds MS, Reed H. Humphrey PhD,
Lillian J. Taper PhD, and Sanford J. Ritchey PhD.
Department of Human Nutrition and Foods (KMW, FWT, LKR, LJT,
SJR), and Department of Health and Physical Education (RHH).
Virginia Polytechnic Institute and State University.
Blacksburg, VA.
Department of Human Ecology and Nutrition Research (SWM).
Virginia State University. Petersburg, VA.
Send correspondence to:
Dr. Forrest W. Thye Department of Human Nutrition and Foods
Virginia Polytechnic Institute and State University Blacksburg, VA 24060
Send request to:
Dr. Forrest W. Thye
Department of Human Nutrition and Foods
Virginia Polytechnic Institute and State University
Blacksburg, VA 24060
Supported by USDA grant number VA X-521247.
Footline: Metabolic effects of weight reduction.
74

Abstract
The effects of a multifaceted weight loss program on
the body weight, body composition, plasma variables, and
nutrient intakes of 50 obese black women were investigated.
Subjects were between 20 and 51 years of age, with an
average BMI of 34.5 (range = 23.6 - 57.3). Subjects
attended nutrition education/behavior modification classes
once per week for three months. Thirty-five of the women
attended 80% or more of the classes (NU). Twenty-eight
women attended 30% or more of the low-impact aerobic
exercise classes that were offered three days per week, for
six months. An average 2.2 kg weight loss was observed for
the whole study group, as body fat fell, and lean body mass
increased by 2.1% of total body weight. Slightly greater
changes were observed in the group that exercised
consistently, as well as those who regularly attended
nutrition classes, but not in either of the groups which
more sporadically attended exercise or nutrition classes.
Significant reductions in plasma total cholesterol, HDL-
Cholesterol, HDL,-Cholesterol, and insulin were observed for
the group of 50 subjects. Significant reductions in plasma
TC occurred in both the SE (attended between 30 to 70% of
exercise sessions) and SN ( < 80% attendance of nutrition
classes) groups. Plasma LDL-Cholestero! followed the same
pattern as plasma total cholestero! but there were no
Significant differences. Exercise appeared to mitigate
76

decreases in plasma HDL-C. Significant reductions in total
kcal, including CHO, protein, fat (including saturated,
polyunsaturated, and monounsaturated fatty acids), dtetary
cholesterol, and sugar were noted for the study group. A
weight-loss program which included diet, nutrition
education, behavior modification, stress management and
exercise was effective in producing favorable changes in
body composition, plasma variables, and dietary components
jin obese black women over six months, with a high degree of
variability in motivation and participation.
Key words: Obesity, body composition, bioelectrical
impedance analyzer, lipids, lipoproteins, tnsulin, behavior
therapy, food habits
76

Introduction
Despite an increasing awareness about health,
nutrition, and fitness ('), the American populace has
continued to become more overweight (7). That the obese
condition carries with it numerous other health
complications has been recognized. Obesity has been
identified as an independent risk factor for coronary heart
disease (CHD) (*), and has also been associated with other
CHD risk factors. The condition has been positively
associated with total cholesterol (TC) (*, °), and
negatively with high-density lipoprotein cholesterol (HDL-
C) (4, 5, °, 7). It has been estimated that both the risk
for hypertension (°), and the risk for diabetes (8) are 2.9
times greater for overweight versus non-overweight
individuals. Additionally, the incidence of several cancers
(°), as well as other ventilatory, circulatory, digestive,
and endocrinological disorders ('°, *') increase with
obesity. Not surprisingly, then, a higher mortality ratio
among obese individuals has been observed (1, 19, ')
In the United States, the prevalence of obesity in
black women is higher than for either sex of either the
black or white race (2). This prevalence in black women has
been found to be inversely related to income and education
(2). As determined by the second National Health and
77

Nutrition Examination Survey (15), the obese black woman is
also at a greater risk for several of the health
complications associated with obesity. Diabetes and
hypertension are more prevalent in blacks, as well as those
below the poverty level, while being female is a further
risk for diabetes. There is also evidence which suggests
that the rate of CHD in black women is greater than for
white women (15).
Despite these statistics, there is a paucity of
information related to attempts to address the obese
condition, particularly in black females. Among the white
population, treatment has typically focused on caloric
restriction, behavior modification and exercise. Applied
separately, there has been some success with each of these
methods. However, various drawbacks to these individual
methods has led several investigators to recommend a multi-
17. 18 19 20 21 C's faceted approach to a weight-loss program
22), In 1984, a panel organized by the International}
Congress of Obesity stated that: ‘diet, exercise and
psychological support are three components of therapy which
are interrelated, interdependent, and mutually supportive,
and thus should be prescribed together (22) ’. The results
of several studies which have used such a combined approach
support recommendations for their use with obese individuals
(23, 24 25), timited data further suggest that this type of
treatment approach can be of use in black (#78), and black
78

female populations (24). This article reports the effects
of the integration of diet, nutrition education, behavior
modification, and exercise on weight loss and body
composition, plasma variables, and nutrient intakes in 50
healthy, bliack women, aged 20-51 years.
79

METHODS
Subjects
Through notices and pamphiets posted throughout the
campus of Virginia State University, local public bulletin
boards, as well as word-of-mouth, 150 black women between
the ages of 20 and 51 years, at least 20% above the
desirable weight for age according to the Metropolitan Life
Insurance Co. tables, and who were considered sedentary
according to a questionnaire, were identified. Those with
diabetes mellitus, uncontrolled hypertension, or other.
identified diseases or metabolic disorders were excluded
from this cross-sectional population. Potential subjects
were interviewed regarding their personal motivation and
committment towards weight loss and completion of the
intervention program. Ninety-eight women who met all
criteria were identified and began the intervention program
(Figure 7). A 20 dollar stipend was offered as compensation
for successful complietion of all data collection.
Nutritional Education Program
Comprehensive nutrition education sessions were held
once a week, for approximately two hours each. Four
different times were offered each week to accommodate the
80

Recruitment of cross-sectional population
(150 subjects)
Screenings: diabetes mellitus
uncontrolted hypertension
other diseases or
metabolic disorders
(98 subjects )
| $20 Stipend Offered]
Month 0 NUTRITION INTERVENTION EXERCISE (98 Subjects) (65)
—
Month 3 NU SN
(35) (15)
Month 6 EX SE NE
(12) (16) (22)
NU Attended 80% or more of nutrition classes
SN = ° less than 80%
EX = Participated in 70% or more of exercise sessions
SE = ™ 30 to 69%
NE = Jess than 30%
FIGURE 7. EXPERIMENTAL PROCEDURE
84

Table 1
Characteristics of 50 Obese Black Female Subjects
Mean + SEM Range
Age in years 36.5 + 1.1 22 - 51
Height in cm 161.6 + .82 148.5 - 179.1
Weight in kg 90.0 + 2.3 60.8 - 144.6
BMI (kg/m2) 34.5 + .91 23.6 - 57.3
Years of Formal 14.1 + 4 5 - 20 Education
Total Family Income 28,025 + 3348 4,500 - 163,000 (per year)
Total Family Income + 11,1381 + 1039 1,182 - 40,750 Number in Family
82

varied schedules of the participants. The duration of this
intervention was 11 weeks (Figure 7). These sessions
encompassed nutrition education, behavior modification of
eating habits, as well as discussions of stress management.
The basic material used for the instruction of these
classes, except for the section on stress management, was
from the Virginia Cooperative Extension Service (VCES), in
the publication titled: Diet, Exercise, and Behavior
Modification (DEB) Program (*’), which was designed
specifically for overweight women. However, additional
information from various sources was provided as deemed
appropriate, or where interest was expressed by
participants.
Nutrition education provided information on dietary
nutrients and their functions, the concept of energy
balance, and the caloric content of foods. Subjects were
asked to choose their desired rate of weight loss, not to
exceed two pounds per week, and to select foods which were
grouped into six categories based on their nutrient
composition and caloric values, such that the individual ly-
determined caloric intakes be maintained concomitant to a
proper nutrient balance. If subjects acknowledged excessive
intakes or strong desires for particular foods, it was not
advised that they eliminate these items from their diets
entirely, but moderation and individual control of the diet
was emphasized. Fasting, fad diets, and very-low-calorie
83

diets were discouraged. Information was provided regarding
fast foods, prepared foods and dining out, as well as their
associations with behavior modification. Identification of
sources of fat in the diet, and various means of reducing
dietary fat were emphasized.
Behavior modification involved recognition of
inappropriate eating behaviors, cues which triggered such
responses, and methods to counteract this phenomenon.
Stress management dealt with daily life stresses, how to
recognize stress and its associated outcomes, as well as
methods to avert such stress. Additionally, individual
counseling and/or support groups were encouraged for all
subjects following the termination of the more structured
classes.
Exercise Program
Pending a physicians’ approval, subjects were allowed
to self-select for the exercise regimen, but were told that
they would have to adhere to a minimum of two exercise
sessions per week, or would not be allowed to continue in
the exercise program. This resulted in an initial
enrollment of 65 out of 98 persons in the exercise program
(Figure 7). Exercise classes were held three times per
week, for an hour each session, at the YMCA of Southside
Virginia, located in Petersburg, Virginia. The first ten
84

minutes of each session was designated for walking; subjects
walked in the indoor gymnasium, a room, or on an indoor or
outdoor track. Subjects were encouraged to maintain a
strong pace, and conversation was encouraged to reduce
boredom and develop interest and peer support. The exercise
sessions were conducted by YMCA staff, and were designated
as low-impact aerobics. As subjects improved their stamina,
sessions were increased in tempo, and/or number or degree of
movements. Each session included five to ten minutes of
warm-up, 20-25 minutes of exercise, and at least ten minutes
Of cool-down activities, which included various stretching
and calisthenics. Subjects were initially encouraged to
work at 60 to 70% of their age-adjusted maximum heart rate.
After two weeks, this was increased to 65 to 75%, and three
weeks after this, subjects were encouraged to work at a
range of 70 to 85% of maximum heart rate. A chart
indicating the suggested target heart rates was kept visible
during exercise classes until the subjects became familiar
with their particular target range. Individuals were taught
to take their own pulse, for ten-second counts. During each
session, pulses were taken after 10 minutes of walking,
after warm-up activities, several times during the routine,
and again at cool-down. These were recorded next to each
subjects’ target range, so that exercise leaders could
immediately suggest appropriate alterations of activities,
if necessary, in order to achieve an appropriate exercise
85

heart rate. The pulse rate as assessed by the subject was
verified periodically throughout the six month training
program by an exercise leader. Individuals consistently
worked at or above their designated target heart rates,
except in cases where it was recommended that a particular
individual not over-exert herself, such as those few with
high blood pressure, or several recovering from surgeries
which were unrelated to the intervention program.
As a measure of fitness, recovery heart rates were
taken at the start of the exercise program in January, and
again at the conclusion of the program in June. One-and
two-minute recovery heart rates were taken by the subjects
themselves following 10 minutes of walking for which they
were instructed to walk as far as they could at a strong
pace, for the full 10 minutes.
Those subjects who did not participate in the exercise
protocol] offered in this study (the non-exercising group)
attended one or two additional one-hour sessions during the
intervention period. The benefits of regular exercise were
explained, printed information was distributed, exercise
demonstrations were given, and instructions provided for an
at-home aerobic/stretching program to be followed in
conjunction with a complimentary cassette tape. The ease
and benefits of various methods for increasing daily living
energy expenditures were also provided. Walking was
proposed as a most convenient mode of exercise, and the
86

formation of groups for this purpose was encouraged. An
exercise/activity questionnaire was completed by these
individuals so that levels of unsupervised exercise could be
assessed.
Diet Analysis
Diet analysis was performed both at the beginning and crertettn
cee
end of the study, Goineidiny with blood sampling. At each rman 1 csantrey rete
time, two 24-hour recalls were obtained; one at the doctor’s
office, and another within two weeks before or after this
(approximately 90% were obtained prior to blood samplings).
These were then coded and analyzed using the computer data
bank maintained by the Nutritional Analysis System
(Department of Experimental Statistics, Louisiana State
University, Baton Rouge, LA), and average values for the two
recalls, both at the beginning and at the end of the
intervention period for each subject, were obtained. The
recall which was obtained at the doctor’s office included
part of a 14-hour fast in preparation for the blood drawing.
Therefore, nutrient intake values were likely to be lower
than might otherwise be expected, but the changes between
pre- and post-treatment should not have been affected.
87

Plasma Lipids, Glucose and Insulin
Biood samples were drawn by a registered nurse, and a
doctor performed a general physical exam for each subject,
both at the start of the study period, and again at the end
of the six-month treatment period. A 15 ml venous blood
sample for each subject was drawn into vacutainers
containing EDTA, and held on ice until centrifuged at 3000
rpm for 20 min. Analysis of triglyceride (TG), total
cholesterol (TC), high-density lipoprotein cholesterol (HDL-
C), HDL,-C, glucose, and insulin were performed on the
plasma. Plasma TG were determined according to the Stanbio
Enzymatic Triglycerides Procedure No. 2000 (Stanbio
Laboratory Inc., San Antonio, TX), which follows the
enzymatic method of Wahlefeld (*8).
Plasma TC was determined by a colorimetric reaction
which is based on the classical Liebermann-Burchard reaction
involving the C5-c® double bond in the sterol molecule (*9).
Plasma HDL-C was determined in the supernatant after
precipitation of non-HDL apo-B associated lipoproteins by a
hepar in-manganese-chtioride solution (5°). Plasma HDL,-C
values were determined by dextran sulfate (15,000 MW)
precipitation of HDL,-C (°1), which allowed quantitation of
HDL,-C in the supernate. Plasma HDL,-C was then subtracted
from the plasma total HDL-C concentration to obtain the
value for HDL,-C. Plasma LDL-C values were calculated
88
according to the equation: LDL-C = TC - (HDL-C + TG/5)
(5*). Plasma glucose was determined using the Stanbio
Direct Glucose Procedure No. 0270 (Stanbio Laboratory, Inc.,
San Antonio, TX). This 3s a direct quantitative
colorimetric procedure based on the works of previous
investigators (**, %4). In this procedure, O-toluidine is
the reactive reagent which condenses with the aldehyde group
Of glucose to form a colored mixture of glycosamine and the
corresponding Schiff base (PF). Plasma insulin values were
obtained by using a radioimmunoassay analysis (Diagnostic
Products Corporation, Los Angeles, CA).
Body Weight and Composition
Body weight were determined at the beginning of the
study, and at the end of the six-month treatment period,
using a kg scale. Body composition was determined by
bioelectrical impedance, using the BES 200Z model
(Bioelectrical Sciences, La Jolla, CA). This relatively new
method of body composition analysis has the advantage of
being a rapid and non-invasive technique. Bioelectrical
impedance is based on the electrical conductivity of water;
since the lean body mass contains the majority of the body’s
water (73.2%), a current will flow through this portion of
the body tissues. Adipose tissue, however, iS a poor
conductor, and acts as an insulator. An individual’s
89

height, weight, gender and impedance reading are utilized in
an equation, developed by E. J. Glassford, of Biolectrical
Sciences, which yields body composition vatues. Since
variations in body hydration affect body composition
analysis by bioimpedance, subjects were asked to refrain
from alcohol for 12 hours prior to analysis, and to maintain
normal intakes of fluids for 24 hours before analysis.
Subjects were not tested if their fluid intake was abnormal
or they were within two days of menstruation; in these few
circumstances individuals were asked to return at a later
date. To obtain the impedance reading, subjects were ina
supine position on a non-conductive surface of a cot, with
arms and legs positioned so that no contact existed between
the limbs and/or body; electrodes were placed according to
instruction: one each at the proper sites on a toe, ankle,
finger and wrist. Bioimpedance determinations were
performed a month after the start of the intervention period
(as the BES 2002 was not obtained by the research group
until then), and again following the six-month intervention.
Two- and three-month values for these individuals have been
reported elsewhere (38).
Statistical Analysis
Pre-treatment mean values were statistically analyzed
for differences by Duncan’s Multiple Range Test, with the
90

significance level set at alpha = .05. Differences between
pre- and post-treatment least-squares mean values within
groups, as well as differences in post-treatment least-—
squares mean values between nutrition, or among exercise
groups were analyzed by t-test, using alpha levels of .05,
-01, and .001. To obtain the critical p-values, alpha
levels were divided by the number of comparisons made, which
maintained the overall experiment-wise error rate at each
alpha level. This is the conservative Scheffe method, which
is recommended when sample sizes are unequal. Additional
analyses of recovery heart rates included: 1) analysis of
the differences in one- and two-minute recovery heart rates
between pre- and post-treatment for all exercising groups,
by paired t-test 2) analysis of the differences between
one- and two-minute recovery heart rates at both pre- and
post-treatment, for all groups of exercising subjects, by
paired t-test 3) a t-test of whether one-minute recovery
heart rates, at both pre- and post-treatment, for all groups
of exercising subjects, are equal to the immediate-post—
exercise heart rate. Correlations for all variables were
determined by Pearson Correlation Coefficients, with
statistical significance reported for p < .05, p < .01, and
p < .001.
91

RESULTS
Nutrition Education/Behavior Modification Class Attendance
Subjects were divided into two groups based on their
attendance at the nutrition education/behavior modification
classes. Thirty-five subjects who attended 80% or more of
the sessions were placed in the group designated as
Nutrition (NU). The value of 80% was subjectively chosen in
an effort to evaluate differences in body composition,
plasma variables, and nutrient intake components between
those who consistently attended nutrition classes, and those
who attended less consistently. The remaining 15 subjects
attended less than 80% of the nutrition classes, and fell
into the group designated as Some Nutrition (SN) (Figure 7).
Exercise Participation
Subjects were divided into three different exercise groups,
based on the number of exercise sessions in which they
participated. This was done in order to evaluate the
effects of the amount of exercise on body composition,
plasma variables, and nutrient intake components. Twelve
subjects participated in 70% or more of the aerobic exercise
92
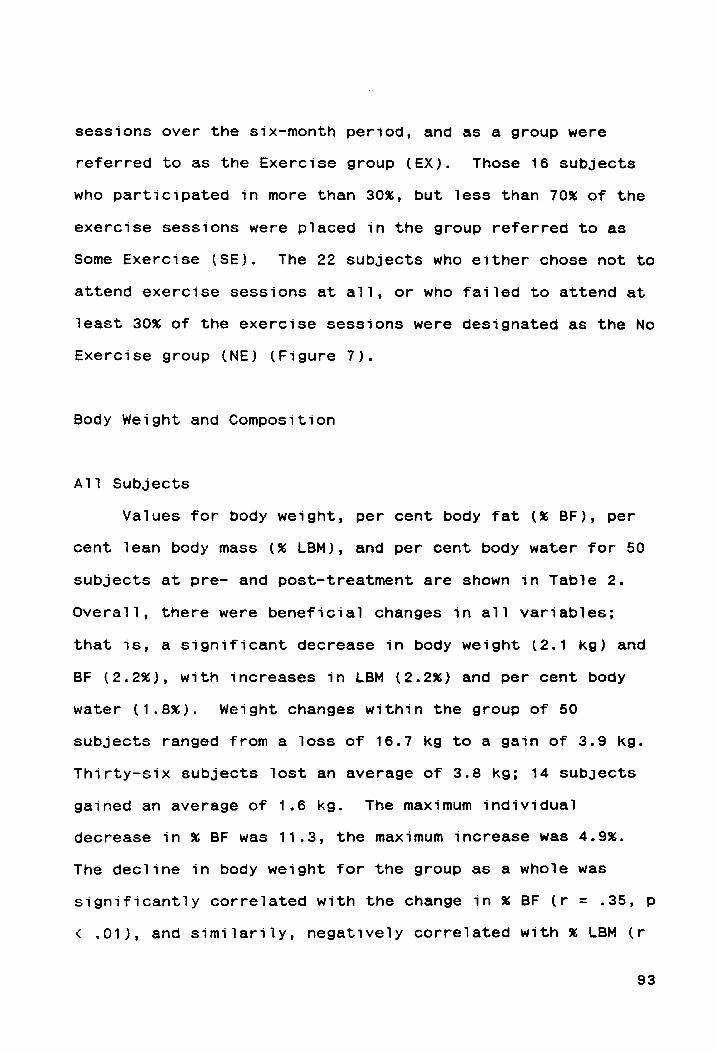
sessions over the six-month period, and as a group were
referred to as the Exercise group (EX). Those 16 subjects
who participated in more than 30%, but less than 70% of the
exercise sessions were placed in the group referred to as
some Exercise (SE). The 22 subjects who either chose not to
attend exercise sessions at all, or who failed to attend at
least 30% of the exercise sessions were designated as the No
Exercise group (NE) (Figure 7).
Body Weight and Composition
All Subjects
Values for body weight, per cent body fat (% BF), per
cent lean body mass (% LBM), and per cent body water for 50
subjects at pre- and post-treatment are shown in Table 2.
Overall, there were beneficial changes in all variables;
that is, a significant decrease in body weight (2.1 kg) and
BF (2.2%), with increases in LBM (2.2%) and per cent body
water (1.8%). Weight changes within the group of 50
subjects ranged from a loss of 16.7 kg to a gain of 3.9 kg.
Thirty-six subjects lost an average of 3.8 kg; 14 subjects
gained an average of 1.6 kg. The maximum individual
decrease in % BF was 11.3, the maximum increase was 4.9%.
The decline in body weight for the group as a whole was
significantly correlated with the change in % BF (r = .35, p
< .01), and similarily, negatively correlated with % LBM (r
93

"HOES AN
'%69 - OF
AS ‘SUOISSeS
OSTOIAXE %O/
= XA
'%08 >
NS ‘Sassepo
uONINU %OB
Zz ON
‘:suEpuse Noy)
JO adejUsoId
oI] UO
paseq
Sdnoss OVI
Ppoplalp azam
syoofqng ‘sonyjea
juouneenaid Aue
Joy sdnow8
astoJaxe Buowr
10 ‘sdnoz3
UONLANU UZEMJOQ
SODUDIIJJIP JUBIIJIUBIS
OU SIM
aJOY} ‘SONJA
ULIUI MEI
UO poseg
JOYIO yea
WO
JUBUaJIP APUSIFIUTIS
JOU BIE
VUBIIJIUBIS JO
STO] IWATAIP
OM) Juasoidal
yep syduossodns
juasoyJIp
UNM SONfeA
*TOQ" = M-s ‘IO’
=4-W ‘CQ’
= [-3
“SMOTIOJ SB
SI DOURDIFIUIS
JO [OAZ]
OY) JIOYM
‘JOyIO YOR
WO] JUDIOJJIP
APUedTJIUsIS ore
sydiosrodns IUDIJIP
YM SUNOS
UTUIM sonyea
‘sdnosd astosoxo
Suowe JO
sdnois uonLNu us9MIOg
“100'=% I0'
= #
SO'=V
SMOT[OJ SB
SI QOUBdTJIUTIS
JO JOAd]
OY SOY “uoWHeaN
Isod 04
-ord WO
dnoid Jeyp
10} aTueY>d
JuBdTJTUIS B SEM
OJOY] Jey)
BJBOIPUL SaNyeA
JuoUNeEN Sod
Joy s}diossodng
vuly + O
P
09 +6 C
6
LS vulS
FC 19
C9€ vulS
+L8e Isod
7 =N)
Iv $+ L'8€
09° +
7'S6 9°9¢
IS #
€'6S L'8€
IS #90p
ad ‘asioraxg
ON
yeS’ F
OOP 18L'
F £78
y'0S yl9
FETS STE
yl9 FORE
sod (91
= N) ES
FOE
8L’ +
7'€8 v'6P
LO F¥'6S
9'€€ LY
FVOp wd
‘asiorexy oWOg
y3C9'F PCP
yi06" +
9°08 81S
guaLll’ +
€79 L'8%
ywall #9'SE
sod (71
=N) 79'¥
0°0P 06°
¥ $'r8
61S LL
¥v'I9 y'Ze
LL.FysE _—_—aad
‘astolaxy
CS’ F
7'6E u9l'
+ ¥'v8 L'0S
189° $
1°09 9'EE
199 F86E
sod (ST=N)
7S F HE
OL F
€°S8 p'0s
69 F
16S 8'VE
$9 F80p
aud ‘uontmnyy
aug
sce +
9 wot
8°98 6'S¢
0b
F 79
8°0€ 0b FSSE
sod (S€
= N) TE
F 8°6E
Ov" ¥
1°06 o'ss
Or F019
OSE Ov’
+ 68E
aid ‘UOnLONN
x0 +6 0
P
#py +9°S8
CES ¥80
+E C9 vce
¥80 +9 L
E
sod (OS=N)
O€ +
1'6E ty
F L'L8
L'7S ea)
6'vE 86
F86¢ ed
‘sioalqngs ITV
IOC
(34) (34)
ssejy Sse
(34)
Apog %
Ista Apog
Apog ueay]
Apog uv]
% wey
Apog —- JB. Apog
%
WS
F Suva ST
JUSWVOI], ISOg
pure -aIg
ye uotedionieg
aslo1oxq pUe
UONLINY OU
papraiq pure
‘syalqng [Ty
Jo uoTtsodulo7
pur WSIeyy
Apog
¢ S198 L
94
= -.35, p < .01). Body weight change also correlated
negatively with the change in % body water (r = -—.32, p <
-05). For all groups, due to the principles of the
bioelectrical impedance analyzer and the nature of body
composition, there was a correlation of -1.0 between % BF
and % LBM, as well as a high correlation (r > .96) between %
body water and % LBM, with the same corresponding negative
correlation between % body water and % BF.
Nutrition Groups
There were no differences between Nutrition groups for
body weight or composition at pre- treatment (see Appendix
I). Body weight and composition of subjects divided into
nutrition groups can be seen in Table 2. The beneficial
changes seen in body weight and body composition variables
for the group as a whole were reflected onty in the group
that attended nutrition classes 80% or more of the time
(NU). Those who attended nutrition classes jtess than 80% of
the time (SN) showed no significant change in any of these
four variables. Values for all four variables were
significantly different between the groups at post-
treatment. The NU group lost a significant per cent of
their original body weight (3.5%, p = .0001), while the
group that received Some Nutrition (SN) tost a non-
significant 1.2%. Within the NU group, there was a positive
correlation between the change in body weight and the change
95

in *% BF of r = .33 (p < .05).
Exercise Groups
Pre- and post-treatment LS Mean values for body weight
and composition among groups of subjects based on exercise
attendance can be seen in Table 2. There were no
significant differences in pre-treatment mean levels among
groups (see Appendix I). Only the EX group displayed a
significant decrease in body weight between pre- and post-
treatment (-3.9 kg, p < .05). The group of subjects who
participated in Some Exercise (SE) showed no significant
change from pre- to post-treatment in any variable. Both of
the EX and NE groups underwent significant (p < .05)
declines in ®* BF (2.8 and 1.9 kg, respectively) and
corresponding increases in % LBM, as well as increases in %&
body water (2.4 and 1.5, respectively). At post-treatment,
there were significant differences between the EX group and
both of the SE and NE groups for all three body composition
variables; the EX group had less fat, correspondingly more
lean, and had a higher percentage of body water than either
of the SE or the NE groups. The body weight of the NE group
at post-treatment was significantly (p < .001) higher than
both the EX and SE groups.
For the EX group, there was a significant positive
correlation of change in body weight with change in % BF (r
= .69, p < .05), and a corresponding negative correlation of
96
change in body weight with change in %& LBM and % body water
(r = ~.69, p < .05 and r = -.66, p < .05, respectively).
The change in body weight for the EX group was the only
significant correlation with pre-treatment levels (r = .65,
p < .05). For neither the SE or the NE group were there any
Significant correlations among body composition variables,
or their pretreatment levels.
Plasma Total Cholesterol, Lipoprotein Cholesterol,
Triglyceride and Insulin
All Subjects
The effects of combined treatments on plasma parameters
in all 50 subjects are presented in Table 3. There were
declines (some non-significant) in all variables, excepting
the TC/HDL-C ratio, in which a slight (non-significant)
increase occurred, which was due to a greater proportional
decrease in plasma HDL-C (10.1%) than plasma TC (7.2%). The
post-treatment values of plasma TC and ptasma HDL-C were
Significantly different from their respective pre-treatment
values at the p < .01, and p < .001 levels, respectively.
Significant (p < .001) decrements in plasma insulin and
HDL,-C also occurred, while no significant change was
observed in plasma LDL-C. The decline in plasma TG
approached significance (p = .0581).
For the group of 50 subjects, there were significant
97

"O0OE > AN
‘%69 - OF
AS ‘SuOIssas
astoIoxs %OL
< XA
*%08 >
NS ‘Sesse[d
uoN Nu
%08< NN
:durpuone noyy
jo o8equsosed
oyp uO
paseq sdnosd
OVI PaplAIp
asam syoofqns
‘sonjea UeAW
MBI UO
Paseq SedUdIAJJIP
JOJ pozAyeue
ssa
Sonjea JUOUNeANAg
“[Q' =U-W
‘CQ’ =
Yy-3 :SMOTJOJ
SE SI
DOUBdTFIUSIS JO
[aAd] OY]
DIOYM ‘JOYIO
YORa Woy
yuUaIOTJIP A[UBIJIUsIS
ore s}disossodns
JUDIOJJIP YIM
SUUIN]OD UTYIIM
SonyeA ‘sdnoyZ
asioJaxa Suowe
Jo ‘sdnoy3
uonunu usaMiog
“100' =
‘10° =
# ‘SO’
=V_ ‘SMO]JO]
Se Si
DOURdIIUZIS
98
JO JOAzq]
Olp aJayM
“uguNneeN sod
07 -asd
Woy dno
yey JOJ
aBuLYd JURdIFIUBIS
B SEM JIOYI
IY) NedIpUl
Sanjea JusWeeN
sod Joy
sidudssodng
SU E6LY
uP LESH
PLE 106
gol ¥
S02 88
FET OSFrPEL
MPFL PEI
Is0d (=
N)
SU F6Uy
yO FTE
VLFS O00!
yl Fes
"9° SL
OSFLET
OFFLIGT wd
‘astolaxg ON
OC Fh
CL FOLI
66 +
LSL yo
l F
602 CL
ESSp LOFLOEL
,OOF HOGI
Od (1=N)
OV FLED
ECFLEBI 9°6
+ 616
91 F
SLZ Ul
+ OES
VI9FOLYL OFOFOGIZ
wd ‘astoroxg
oulOg
CT FI r
VIZELTI
STII %
S69 81
+ £€7
Cl+o Sp
SLFEELZL
6CIFSSBI
180d (71
=N)
ETF Bhp
=
g 'TF OBI
VIL +
688 Sl
F 6SZ
CLFELY
QLFITPEL 69F766I
ad ‘asiosaxy
6 F99r
VSI FSSI
v6 +
6 EL ysl
F £61
ll
FStp vO
FS8ZL y8S F
BSBT
ysod (ST
=N) 6
Ftry TEIN;
v6 ¥
L'b8 91
F9LZ lL
¥96p pOFBIPL
BSFEROT wd
‘uONLNNN oulog
te +Orpy
= yVL + £61
yoo F O'€8
846 FOEC
yyOl FE9
THFOLEL MEFS
PEI I0d
(Se= N) TF
rep 860
L FT
8°S = Ol
76 F
U'SZ 89°
+ 7 6P
6EFSIEL VETO
cd ‘uOnLANN
I esrr
«ler 96
F PBL
88 FITZ
29 Frbp
SEFROEL yVE
FZO06I Is0d
(OS = ND
IU F8er
CLF PvE
CS + 86
76° ¥ £97
69 F
¥'6P L'€ F
S9EL
vEFOSOT wd
‘syoefqns [IV
(1w/n 7) (Ip/8u)
(1p/sur) (1p/su)
(ip/3ur) (jp/dur)
STAHL Sul
OL O° ¢1dH
-1dH 107
OL
WAS
+ suo
S'T JUSUNIBALT,
ISOg pure
-alg ye
UOTEdIONIeg QSINIOX
puke UONLYNN
OUT paplatq]
pue ‘syoalqnsg
[[y Jo
ulNnsuy pue
sapusdd]
ZU, ‘foaysooyD urajoidodry
‘spidry euseyd
€ 21481

correlations between the change in plasma TC and the changes
in plasma HDL-C (r = .29, p < .05), plasma LDL-C (r = .94, p
= .0001), and the TC/HDL-C ratio (r = .62, p = .0001). The
change in plasma HDL-C corresponded to the change in its
HDL.-C component (r = .41, p < .01) and to the change in the
TC/HDL-C ratio (r = -.45, p < .01). There were aiso
significant correlations between the change in plasma TG and
the change in plasma LDL-C (r = -.46, p < .001), as well as
between the change in plasma LDL-C and the change in the
TC/HDL-C ratio (r = .75, p = .0001).
There were significant correlations between the
initial (pre-treatment) levels of TG and lipoprotein
Variables and their own subsequent (absolute) changes.
These correlations ranged from .43 for the TC/HDL-C ratio to
-84 for TG. The correlation (r = .30) between pre-treatment
insulin levels and subsequent (absolute) change in insulin
approached significance (p = .0505).
Nutrition Groups
Changes in plasma variables between nutrition groups
are shown in Table 3. There were no differences between the
groups at pre-treatment for any variables as determined by
an analysis of variance (ANOVA) using raw means (see
appendix K). There was a significant decline in plasma TC
for the SN group, while no change occurred in the NU group.
No changes in LDL-C were observed for either group.
39

Both nutrition groups exhibited Significant differences
between their pre- and post-treatment plasma HDL-C values.
However, this was more pronounced in the SN group, which
experienced an absolute decline of 7.1 mg/di (p < .001),
compared to an absolute decline of only 2.8 mg/di (p < .01)
in the NU group. The post-treatment values of plasma HDL-C
(Table 3) were significantly different between nutrition
groups (p < .01). <A similar trend was observed for plasma
HDL,-C.
No changes occurred in the TC/HDL-C ratio for either
group. Both the NU group and the SN group displayed
declines in fasting plasma insulin (p < .01 and p < .05,
respectively). Only the NU group underwent a significant (p
< .05) decline in plasma TG.
For the NU group, correlations among plasma variables,
and between plasma variables and body weight or composition
were assessed. There were significant correlations between |
the change in plasma TC and the changes in both plasma LDL-
C (r = .93, p < .001), and the TC/HDL-C ratio (r = .66).
The change in plasma LDL-C was significantly correlated with
the changes in both the TC/HDL-C ratio (r = .79) and plasma
TG (r = -.50). The change in the TC/HDL-C ratio was
significantly correlated with the change in the plasma HDL-
C (r = -.50), the change in plasma TG (r = -.38).
Pre-treatment levels of all plasma variables, except
insulin, were significantly correlated with their respective
100

absolute changes within the NU group .
Within the SN group, which was similar to the NU group,
there were significant, positive correlations between the
change in plasma TC and the changes in both the plasma LDL-
C (r = .96, p < .001), and the TC/HDL-C ratio (r = .70, p <
.01), but a negative correlation with the change in insulin
(r = -.61, p < .05). The change in plasma LDL-C correlated
significantly with the change in the TC/HDL-C ratio (r =
-79, p ¢ .001). The change in body weight for this group
corresponded to the change in TG (r = .56, p < .05).
Within the SN group, initial levels of plasma HDL-C,
TG, and insulin were significatly correlated with their
absolute (r= .79, r= .53, r= .83, respectively) changes.
Unlike the NU group, in the SN group initial levels of
plasma TC, LDL, and the TC/HDL-C ratio were not
significantly correlated with their subsequent absolute
changes. The correlation between initial plasma HDL-C
levels and the subsequent absolute change approached
Significance (r= .54, p = .0562).
Exercise Groups
Plasma lipid changes among exercise groups are
presented in Table 3. As determined by a t-test which used
raw means, there were no differences in pre-treatment values
among exercise groups for any of the variables except plasma
insulin; the raw mean value of 31.5 uIU/mi for the NE group
101

was significantly (p < .05) higher than the raw mean value
of 18.7 uIU/ml for the EX group (see Appendix K). All
groups experienced declines in plasma TC, but this was
significant only for the SE group (-28.6 mg/dl, p < .01).
No significant changes were seen in plasma LDL-C for any
group, although both groups who exercised more than 30% of
the time exhibited declines (NS) in plasma LDL-C, white the
NE subjects showed a slight, but non-significant increase.
All three exercise groups experienced declines in
plasma HDL-C and its subfraction, plasma HDL-C; however,
these decreases were more pronounced and were significant
for the SE and NE groups, but not for the EX group.
Although there were no significant changes in the TC/HDL-C
ratio for any group, close examination of the data reveated
that the EX group was the only group to undergo a non-
significant reduction in the TC/HDL-C ratio, while the other
two exercise groups showed increases in this ratio, which
approached significance (p < .10) for the NE group.
All three exercise groups showed non-significant
declines in plasma TG from pre- to post-treatment, but
apparently due to a large SEM, none were significant. The
NE group was the only group in which a significant (p <
.001) drop in the fasting plasma insulin value occurred.
Since insulin values at pre-treatment for the EX and NE
groups were significantly different at the p < .05 level
(see Appendix K), absolute changes were considered. The
102

absolute decreases in plasma insulin levels for both the EX
(6.2 +/- 3.0) and the NE (9.9 +/- 2.4) groups were
Significant at the p < .05 and p < .001 levels,
respectively. No significant change occurred for the SE
group. None of these (absolute) decreases were
Significantly different among groups.
As with the NU and SN groups, within the EX group there
were significant correlations between the change in plasma
TC and the changes in both plasma LDL-C (r = .99, p < .001),
and the TC/HDL-C ratio (r = .90), as well as between the
change in plasma LDL-C and the TC/HDL-C ratio (r = .94).
There were no significant correlations between body
composition and plasma variables for the EX group.
Initial levels of plasma TC, LDL-C, HDL-C, and the
TC/HDL-C ratio were all significantly correlated with their
respective changes (r = .60, r= .70, r= .63, r= .75,
respectively).
For the SE group, the change in plasma TC was
significantly correlated with changes in plasma LDL-C (r =
.92) and the TC/HDL-C ratio (r = .54). The change in the
LDL-C was significantly correlated with the TC/HDL-C ratio
(r = .70) and with plasma TG (r = -.57). The change in
plasma HDL-C was significantly correlated with the change in
the TC/HDL-C ratio (r = -.56). Correlations between changes
in *% BF (as well as opposite correlations for % LBM) and
both plasma TC (r = —-.48) and HDL-C (r = -.53) approached
103

significance (p < .059).
Pre-treatment levels of five of the seven blood
variables were significantly correlated with their
respective changes and correlations approached significance
(p < .10) for plasma HDL,-C and LDL-C for the SE group.
For the NE group the change in plasma TC was
significantly correlated with changes in plasma LDL-C (r =
-89), the TC/HDL-C ratio (r = .48) and HDL-C (r = .49). The
change in plasma LDL-C was significantly correlated with the
change in the TC/HDL-C ratio (r = .67) and the change in
plasma TG (r = -.72). Changes in plasma HDL-C and HDL,-C
were significantly correlated (r = .47), which might be
expected, but was not seen in any of the other groups.
Correlations between body weight or composition and plasma
variables included a significant correlation between the
change in body weight and the change in plasma TG (r = .43).
Initial levels of the plasma variables HDL-C, HDL-C,
and TG were correlated with their subsequent change (r =
-81, r= .87, r = .91, respectively) in the NE group.
Nutrient Intakes
All Subjects
Pre- and post-treatment daily nutrient intakes for
50 subjects are presented in Table 4. There was a
significant decline of 580 total kcals consumed by al}
104

“HOE S AN
“%69 - O€
AS ‘suolssas
astosaxa %OL
< XA
:%08 >
NS ‘sassejo
UONnIQNU %0g
= AN
:eouRpuare say
Jo a8ejuac1ed
ay) uo
paseq sdnoiZ
oyu paptarp
oJam syselqng
‘sanjeA UBIU
MEL UO
paseq SaoualajjIp
10} pozAfeue
vlan
Sonfea JuauNeeHaAg
“[00' >d=
a-s ‘Io
>d=
iw ‘So’
>
d
=
[3
SSMO[[O} SB
SI QOUBIIFIUSIS
Jo [aAaT
OY) B1aYM
‘JaYIO YoRs
Woy Wolajjip
Apuedilusis
om s\duosiadns
qualayyip yim
suumyoo uM
sanyea ‘sdnosd
asiosexa Suowre
Jo sdnoiZ
uoninnu usemieg
‘100 =*
‘10 >d
= #
‘so >d=V
SSMOT]OJ
SB St
FOUBTJIUIS JO
[IAI] OY}
aIIYM JUsUNeEN
3sod oO
-oid wo
dnoid ey)
Joy aBuBYD
yURIUSIS B
SUM JAY)
IVY] aBOIpUI
Sanjea JUSUVAN
1SOd Joy
sydisosiodng
SIFT
,O1 F
O81 US
F 98S
40'b ¥
€'8S yl CL
F 9981
916 F
VL8Pl isod
ySl FL91
61 ¥
L'6Z US
¥ $68
OrFrLl
LZ F
€9p7 916
F TRSIZ
aid ‘9SIdJOXy
ON
v7 FOEI
C7 FTO
99 #79
ES F 6S
yl
F TEI
yeoll FLO6EI
180d
yr
F 8ST
SCZFLLZ 99
#968 ES
FEL
9°91 F
8'Z0Z C'6IL
+ 98981
aid ‘asioroxg
Owlos
SZ7FL rl
yOC FEO
yl L
F 8'vS
l'9 +709
161 +
9LEI yl lel
FPO6eI 380d
38 FCP
67% F767
LL FT
19 $6149
L'61 + L' P61
LLELFSO88t
aad ‘9STOIOXy
€7 FSF
prt F861
v9
F V'E9
'S $979
gh Ol
F971
yOSII F
V8EbI isod
ETFS SI
r'Z F
0°62 r9
F716 VS
$9°9L L9l
F 98IZ
6SIL F LLEOT
aid ‘UONLNNN
awOS
yvl FOI
Sl Fool
,0'v ¥
6'vS yl € FOES
48°6 F
0'6SI OL
¥ vOvEl
ysod
pIFceél Cl
F887 O'r
+ 8°98
l'€ =
0°69 86
$9 0IZ
OIL +S0061
oad ‘uOnLINN
gv Feel
ViFesl
Be
F 76S
OE
F ELS
V6
F 8'Ssi
,0'89 F
v'68el isod
piFtesi vl
$682 8'€
+068 O'€
FBT
v6 F9 F
IZ
O89 F
16961 wd
‘sysofqns ITV
(8) wey (8)
184 (8)
wey (3)
(3) yesund]Og
poremes [PIO],
UID}I0Ig ayespAyoqie;)
[ey [e1OL,
WAS
+ Sue
ST jUoUNval]-jsOg
pue -alg
1 UOnEdIONIeY
aSIdJaxq puke
UODLANN Oj!
papal
pure ‘sjoafqns
[Ty JO
Saye] JUSLNNN,
pue AZs9uq
y 10kL,
105
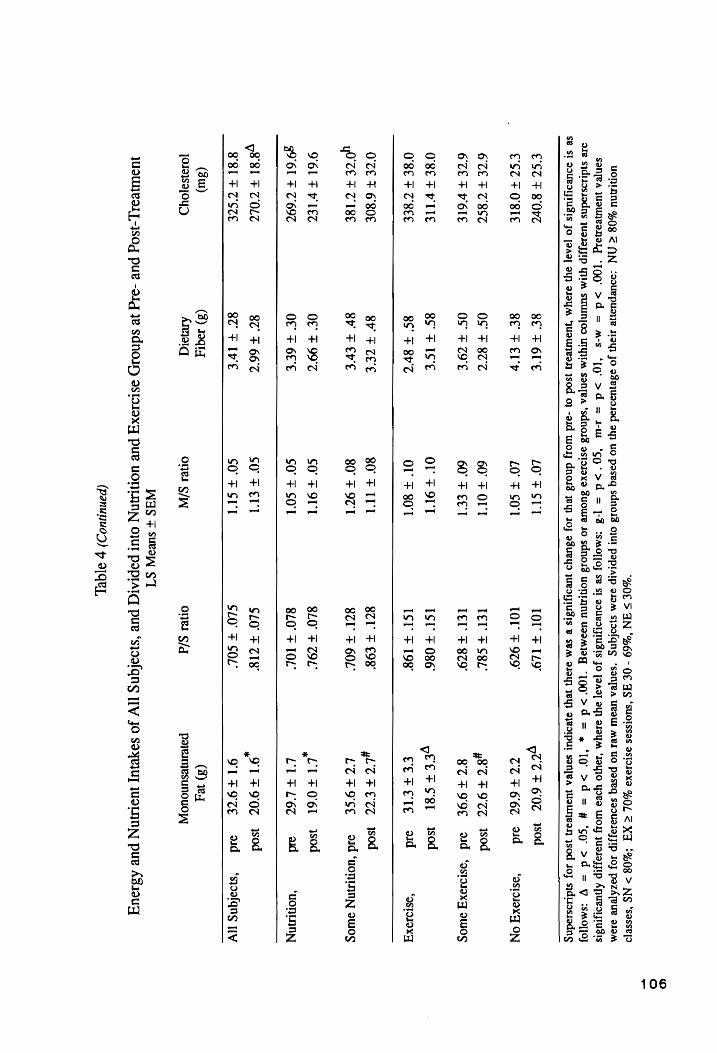
"OE
> AN
'%69 - O€
AS ‘SUolssas
astolaxd %O/
< XA
*%08 >
NS ‘sasselo
UONLANU %Og
= YN
:s0Uepuane May
Jo asejuaoiad
ayy uo
paseq sdnoid
out pepraip
aJaMm sjoalqng
‘san[ea URW!
MBI UO
pase SaduUalasjIp
10 pezATeue
alam sonea
juouneanalg ‘199°
>d =
m-s ‘[g°
>d =
rw ‘cg’
>d =
]-3 csmojjoj
se st
souBoIyIUBIS Jo
JIA] ayy
Day
‘JoyIO YORo
WoY yuasozIp
APUBdIUsIS are
s}dizosiodns juasajjIp
YIM suUUN{OO
UTYIIM sanyea
‘sdnold asiosoxa
Buowe Jo
sdnoi3 uontAnu
usemieg “[Q90'>d
= «
‘10’ >d
= #
‘so >d
= VY
csmojfoy
SB SI
QOUBSIJTUTIS JO
[2A] BI
VJOYM UdUNVIN sod
oO} -oid
Woy dnos8
yep JO}
BsuEYD JUdTIUSIS
B SBM
JI9Y) IVY]
BBOIPUT saN|ea
Woureay ysod
JoJ sydisosiedng
€°SZ ¥ 807
8f F
6I'E LO +
SUT 1Ol
F1L9 you F
6:07
sod
CCU F OBIE
8f FEl'b
LO’ ¥ SO'T
IOI’ +
979" TTF
66C Bd
= ‘astoIOX”
ON
6ZE F 78ST
OS F
877 60°
+ OIL
LEl F
S8L y8C
97
80d
67E F PLE
OS’ ¥
Z9'E 60°
+ ELI
LEU F
879" STFIOE
sd ‘oslooxg
oWwOog
O'8E FHTIE
8S ¥
IS'€ Ol
FOr IST’
$ 086" yeeFS
st sod
O'8E FZ B
EE
85° F 8r'Z
Ol +
80'1 ISt
+ 198°
EEFEIE
ad ‘astoraxg
O'CE ¥
6'80E 8r
FILE 80
FIT
87° =
£98" yl TFET
sod
yO'CE F
TI8E 8h
F EYE
80° + 971
87
+ 60L’
LUF9SE
aid ‘uONLNN
oWIog
961 F FIZ
O€ F
99°7 CO’
+ OTT
8L0° ¥
Z9OL’ ,LL
FO6I sod
39'61 F 7697
Of F
6E'E SO’
¥ SO'l
8L0° +
TOL’ LIFL6t
ad ‘UOnINN
y8'8l ¥ Z0LZ
87 F
667 SO
FE CLO’
+ ZI"
,IT F907
3s0d
8'8l FUSE
87 FIVE
co FS
SLO’ +
SOL’ QL
F9%E wd
‘sioafqns tiv
(3w) (3)
10q1J (8)
wey JOJISBFOYD
Areyaiq onel
S/N onel
S/d poiemjesunouoj]
WaS
+ Suva
ST JUSUNRIIL-ISOg
pue -d1g
Je sdnory ssloJoxy
pue UONLANN
OjUT popraiqy
pure ‘syoalqnsg
[Ty Jo
SoyejUy JUOLNNN
pue ABI0uq
(panunjuo)) p
3]QeL
106

ULOUI MBI
UO pase
SdUdIaJJIP JOJ
pozATeue 919M
Sonyea JWoUNBaNIYg
°CQ’ >
d YIM
SUNOS UY
sanzea ‘sdno3
astoroxa Juowe
10 sdnod uOTNU
UsEMIDg “100°
> d=
"%O0E S AN
“%69-0E AS
‘Suolssas QSINIIX9
YL
= XA
'%08 > NS
‘SaSSe]d uONLNNU
%08 = NN
‘eouepuone say)
Jo oseyUIII0d
oy] UO
poseq sdnosd
OWT PoprAIp
aJam syoefqng
‘sonjea
‘Joyo Yea
WOT JUaIayjIp
ApuKorIusIs ae
siduossodns jussojJIp
» ‘10
>d=#
‘so >d=V
‘SMo[jO] se
st souedtjIUaIS
JO [Ad]
Oyp oY
“JUQUNeAN Isod
oO} -asd WoIy
dnosd ey
JOF aBuLYD
JUBdITZTUsIS B sem
JJOyI JY)
AeoIpul Sanjea
jusWIeeN sod
J0J sidiassodng
91+
PSE 80
+ £9!
g6'1 +
9'6P 8S
+ 90'T
6L +
V6L 88+
P7001 Isod
91 +
0'8E 80
+941
61+
LSP 8S
+ ITt
6L +
688 S8FOSTI
sd ‘asioraxg
ON
OTFTIP
OT +
6ST yo
cS TP
9L +
860 Ol
+ TSS
SILFO7L
sod
0'C +
8 0P OT
FLST
CC+
BECP OL
+ vO'T
£Ol +
9°99 Cl
+ 068
eid ‘astoJexg
Owog
VTFTRE
yl Il
+68!
ST +
ECP 88°
+ OTC
STI+ 6 LS
Ctl +6Pr
isod
ve +OSP
VL +9
P¢rI 87
+9 0P
88° +
771 STIF
SLL Ctl
Fe 6 oad
“9StOIaxq
07 +
L'6E OTFSLI
VC+
VCP bl
+ 9ST
OO! +
699 CI
+ 868
isod OCT+HIP
OT+7S1
vo+
VCH vl
+ TV
OOI +
PLL TIL
FOOL
cd ‘uonLnNN
owog
yol +
69E 9
+991
Cl +9°9p
Sy +
Stl V9FT19
yo9 +
008 isod
CU+OTP
9 FL bl
CL+¢ bp
Sv +
Srl 19+ BL
69 +
6S0I oad
“UOnLINN
CI +E BE
y?
*ULI VLtS
bh
ty +
OVr'l 8S +0
v7 2
+ HB
isod
CLETCIP
9° +
0ST vIFtPrey
ty +
6ll 8S
+ 8LL
99 +
6COl ad
= ‘syoafqns
IV
1B] uIJIOIg
ayempAyoqie.) (8)
undeg (8)
asorong (3)
sesns SB
[Boy JO
% SB
[Boy JO
% SB
[BOq JO
%
WAS
+ Sues]
$’T JUSUNVIL]-JSOg
puv -aIg
3e Sdnosy
astolaxy pue
UONLNN
OjUl popraiq
pure ‘syalqns
[Ty Jo
Saye] yon
pue ABIouq
(panuijuo)) p aqeL
107

subjects. Individual changes ranged from a decrease of 2166
kcal, to an increase of 462 kcal consumed per day. The
overall drop in caloric consumption was accompanied by
significant decreases in grams of carbohydrate, protein and
total fat. The change in total fat included significantly
lowered intakes of saturated, polyunsaturated and
monounsaturated fatty acids. Daily intakes of cholesterol!
and sugar also decreased significantly, by 55 mg and 21.5 g,
respectively (p < .05), while the percentage of kcal as
protein in the diet increased 2.1% (p < .05).
Nutrition Groups
Nutrient intakes before and after treatment for both
Nutrition groups are shown in table 4. Both the NU and SN
groups significantly (p < .001, p < .01, respectively)
reduced their total caloric intake; for both groups this
encompassed significant reductions in carbohydrate and total
fat, and for the NU group, a significant (p < .05) drop in
the percentage of kcal derived from fat, as well as a
significant decline in the grams of protein consumed (p <
.0O1). For both groups, the decrease in total fat intake
included significant declines in both saturated and
monounsaturated fats; for the NU group, polyunsaturated fat
intake dropped as well. There was no change for either
group in: dietary fiber, pectin, sucrose or the P/S or M/S
ratios. There was a significant (p < .05) decrease in sugar
108

intake for the NU group, while the SN group displayed no
significant change.
The pre-treatment cholesterol! intake level of the SN
group was significantiy (p < .05) higher than that of the NU
group (see Appendix L). This was the only nutrient for
which there was a significant difference in initial values
between nutrition groups. For neither group were the post-
treatment values significantly different from their
respective pre-treatment values; neither were the absolute
changes significantly different from zero for either group.
Exercise Groups
The effects of different exercise class attendance on
nutrient intakes are presented in Table 4. At pre-
treatment, the intake of polyunsaturated fats was
significantly (p < .05) higher for the EX group than both
the SE and NE groups (see Appendix L). No other intake
variables were significantly different among exercise groups
at pre-treatment.
All three exercise groups exhibited significant
deciines in total kcal consumed. However, the
macronutrients which also underwent significant decreases in
consumption varied among the groups. The EX group exhibited
a significant (p < .05) decrease only in total fat. The SE
group showed a significant (p < .05) reduction in
carbohydrate consumption, while total fat and protein intake
109

approached a significant (p < .10) decrease. The NE group
displayed a significant drop in total fat (p < .001) as wel}
as both carbohydrate and protein (p < .01).
Ali exercise groups significantly reduced their intakes
of monounsaturated fats, while significant reductions in
saturated fat intake occurred for both the EX and NE groups,
but not for the SE group. For the EX group, there was also
a significant (p < .05) increase in the percentage of kcals
as protein in the diet.
The absolute decline in polyunsaturated fat intake for
the EX group (-9.5 +/- 4.0 g) was significantly (p < .05)
different from zero.
Correlations Between Changes in Energy Intake and Nutrients
Correlations between the change in kcal consumed and
the changes in other nutrient components were assessed. For
the whole study group, as well as for all nutrition and
exercise groups, this included significant correlations for
all three macronutrients: total fat (r = .76 to .90), CHO
(r = .68 to .93) and protein (r = .61 to .86), as well as
saturated fat (r = .44 to .86). The significant correlation
with polyunsaturated fat observed for the whole group (r=
.31) was reflected only in the NU group (r= .58). The
significant correlation with monounsaturated fatty acids (r
= .58) in the study group was reflected in all except the SN
110

group (r = .56 to .76). The significant correlation with
the change in fiber and/or that observed for pectin in the
study group (r = .43 and .38, respectively) were evident in
the SN, SE, and NE groups (r = .44 to .73). The
significant, but rather low, correlation with the change in
sugar intake seen in the group of 50 subjects (r = .39) was
evident only in the NU group (r = .83), while significant
correlations existed for the change in sucrose intake within
the EX and SE groups (r = .70 and .65, respectively).
Correlations Between Changes in Body Weight or Composition
and Nutrients
For the study group, there were significant
correlations between the changes in body weight or
composition and the changes in kcal, CHO, sugar, sucrose and
% of kcal as fat; however, they tended to be low (r = .30 to
-.39). In contrast, for both the SN and EX groups,
significant correlations between the change in body weight
and the changes in total kcal (r = .53 and .67,
respectively), CHO (r = .74 and .80, respectively) and sugar
(r = .64 and .69, respectively) were higher. Other
significant correlations with the changes in body weight
included, within the SN group: total fat (r = .53) and
pectin (r = .66) and within the EX group, fiber (r = .66).
Within the NU group, correlations between the change in % BF
111

and the changes in all types of fat: total, * of kcal as
fat, saturated, polyunsaturated, and monounsaturated fatty
acids were low (r < .48) and negative, which is not easily
explained, because both % BF and total fat intake decreased.
The positive correlation between the change in % BF and the
change in sugar intake for this group was positive, but also
low (r = .35), while that for the EX group was higher (r =
-57), but only approached significance (p = .0543).
Correlations Between Changes in Plasma Variables and
Nutrients
There were significant correlations between changes in
nutrient intake components and changes in plasma variables
for the group of 50 subjects. However, these also tended to
be low (r = .28 to .36) and inconsistent. For both the SN
and NE groups, however, there were higher, significant,
negative correlations between changes in plasma TC, LDL-C
and HDL-C with nutrient components. For plasma TC and LDL-
C among these groups, these significant negative
correlations with nutrient components included: total kcal
(r = -.52), CHO (r = -.48 to ~.58), polyunsaturated fats (r
= -.42) and the P/S ratio (r = -.53), dietary cholesterol (r
= -~.45), fiber (r = -.52), and pectin (r = -.51 to -.77).
For the SN group, the change in HDL-C was associated with
the change in the percentage of kcal derived from fat (r= -
112

-56).
Within the SE group, the change in TG correlated with
the change in both polyunsaturated fats (r = -—.64) and the
P/S ratio (r = -.58).
For the whole group, there were significant
correlations between the change in insulin and the changes
in: total kcal, total fat, saturated fat, monounsaturated
Fat, protein, dietary cholesterol, and % CHO (r = .51, .51,
48, .45, .43, .35 and -.42, respectively). Except for
dietary cholesterol in the NE group, these correlations were
all reflected in the NU and NE groups. The correlation
between the change in insulin and the change in total fat
was present in all groups (r = .45 to .67). Additionally,
the SN group exhibited significant correlations between the
change tn insulin and the changes in both total kcal and
total fat (r = .61 and .67, respectively), while the EX
group also showed a significant correlation with the change
in monounsaturated fats (r = .70).
Of the 17 nutrient variables considered, only total
kcal and total fat were assessed regarding the degree that
the initial level might affect subsequent changes. For al]
groups of subjects, pre-treatment levels of both of these
Variables were significantly (p < .05) correlated with their
subsequent changes (r = .54 to .90). Interestingly, for
total kcal, this was lowest in the NU group, and for total
fat, lowest in the EX group, indicating that in these
113

groups, more than in other groups, it was not necessarily
those who had the highest intake of kcal or fat that
subsequently reduced their intake most dramatically. This
suggests that there was some other factor involved.
Possibly the level of motivation was more important for
individuals in these two groups.
Recovery Heart Rates
One- and two-minute recovery heart rates were
calculated as percentages of an individuals’ immediate-
post-exercise (IPE) heart rate, following a ten-minute walk,
at both pre- and post-treatment. These are presented in
Table 5 for each exercising group (the EX and SE groups), as
well as all exercising subjects (both exercise groups
combined). There were no significant differences between
any pre-treatment value and its respective post-treatment
Value for any group. There were no significant differences
between exercise groups for either pre- or post-treatment
values.
Presented in Table 5 are the results of a test of the
hypothesis that one-minute recovery heart rates are equal to
100%; that is, equal to the IPE heart rate. At pre-
treatment, the one-minute recovery heart rate for the SE
group was not different from its IPE heart rate; the one-
minute recovery heart rate of the EX group at pre-
114

‘YH BAOQE
UONE|NED ay)
u}] pasn
sanjea yep
jo yaquinu
ay} ayeolpul
sasayjuaied ul
sl|aquNN “100°
5 d
:0 ‘10°
S d
:q ‘Go’
sd :e
:smojoJ Se
payeoipul Ss}
BoURdYIUBIS Jo
JaAa] BY}
OJOYM ‘O18Z
Wl) JUdIAayIP
AjueoyiUBIS ae
sjduossadns YIM
SadUaJaJIP JO
SENjBA ‘ayes
Weay Bsio1axa-jsod
ayeipawui a@anoadsas
ay) JO
%OO} Woy
Juasayip AjyueoyuBis
ase sydiosuadns
uM
Sayes eay
Ai@Aodes ajnuiw-aUO
jo SsanjeA
(6) (6)
(6) (e4)
(eb) (St)
e8cdFtO09 BEFECL
8
EF 682
8SrFOL
L649 76
ZS FvS6
9ssidJexy Swos
(O41) (OL)
(OF) (6)
(6) (04)
qv +c8
€ce+V8lL
500+
998
eOS+S8ll
GS +889
qo v
+0 ¢8
9SlO18XF
(64) (64)
(64) (yz)
($2) (82)
sjoaiqns
o8t
FCL
CGeFBSGL
on¢¢ +
OCB
pve
+ 6S
6S
+ €°€8
qo e
* G68
Bulsinsaxy
|IV
BOUdIO}JIP aduaJaIP
9]ey 91eH
9]eyH a]ey
BINUIW-OM|
es}NUl|W-8uUO SINUIW-OM|
s}NUIW-8UO
}SOqd Q1d
WS3S
+ ues
sdnoiry L
@S1NJ8X9-]SOq eyeipewiw)
ay} Jo
eHbejusdeq e
se ‘sa}ey
WeeayH AJSAOD8Y
s}nulwW-OM, PUe
-8uUO
G 9jgel
115

treatment was significantly different from its IPE heart
rate at the p < .01 level. At post-treatment, both exercise
groups exhibited one-minute recovery heart rates which were
significantly different (p < .001) from their respective IPE
heart rates.
The combined group of all exercising subjects exhibited
Significant differences between their one-minute heart rates
and IPE heart rates at both pre- and post-treatment.
A test of the hypothesis that differences between one-
and two-minute recovery heart rates at both pre- and post-
treatment are equal to zero is also shown in Table 5. Both
the combined group of all exercising subjects and the EX
group exhibited significant differences between one- and
two-minute rates at both pre- and post-treatment. There was
no significant difference between the one- and two-minute
rates for the SE group at pre-treatment, but there was a
significant (p < .05) difference at post-treatment.
Differences in both one-minute and two-minute recovery
heart rates between pre- and post-treatment for exercise
groups and all exercising subjects are presented in Table 6.
As a combined group, all exercising subjects experienced a
significant (p < .05) decline in the one-minute recovery
heart rate, when expressed as a percentage of the IPE heart
rate; the two-minute rate, expressed in the same manner, did
not change. The EX group did not exhibit a significant
change in either the one-minute or the two-minute recovery
116
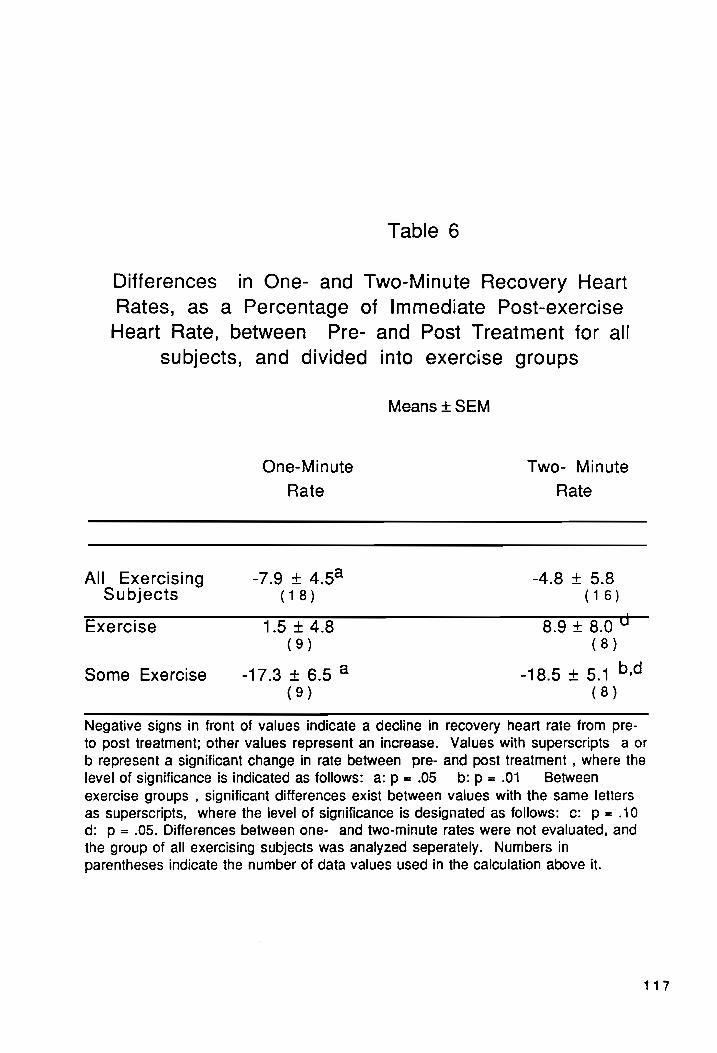
Table 6
Differences in One- and Two-Minute Recovery Heart
Rates, as a Percentage of Immediate Post-exercise
Heart Rate, between Pre- and Post Treatment for all
subjects, and divided into exercise groups
Means + SEM
One-Minute Two- Minute
Rate Rate
All. Exercising -7.9 + 4.54 -48+5.8 Subjects (18) (16)
Exercise 15 +428 8948.04 (9) (8)
Some Exercise -17.3+6.5 2 -18.5 + 5.1 b,d
(9) (8)
Negative signs in front of values indicate a decline in recovery heart rate from pre-
to post treatment; other values represent an increase. Values with superscripts a or
b represent a significant change in rate between pre- and post treatment , where the
level of significance is indicated as follows: a:p=.05 b:p=.01 Between exercise groups , significant differences exist between values with the same letters as superscripts, where the level of significance is designated as follows: c: p = .10 d: p = .05. Differences between one- and two-minute rates were not evaluated, and
the group of all exercising subjects was analyzed seperately. Numbers in
parentheses indicate the number of data values used in the calculation above it.
117

heart rate 2 between pre- and post-treatment. The SE group
experienced significant decreases in both the one-minute (p
< .05) and two-minute (p < .01) recovery heart rates. The
change between pre- and post-treatment in the two-minute
recovery heart rate for the SE group was significantly
larger than the non-significant change for the EX group.

DISCUSSION
The amalgamation of nutrition education and aerobic
exercise has proven to be a successful approach to weight
loss (26, 37). Several researchers have suggested that a
comprehensive program, which incorporates diet with
nutrition education, behavior modification, and exercise is
most likely to produce the most effective long-term control
of weight (19, 20). In this study, all 50 subjects lost an
average of 2.1 kg (p < .01) which resulted from a loss of
2.7 kg (p < .001) of body fat (BF) and a gain of .6 kg (p <
-001) lean body mass (LBM).
It has been reported that behavior modification, in
conjunction with nutrition education in a weight loss
program will produce moderate weight loss, averaging one
pound per week, or 10-12 pounds for the duration of a
program (38-40). Those women who attended more than 80% of
the classes (NU) lost an average of 3.3 kg, or 7.3 pounds
(lb) (p < .001), which was significantly (p < .01) more than
the .9 kg (2 1b) weight loss (NS) by those who attended less
than 80% of the nutrition sessions (SN) (Table 2). However,
even the 3.3 kg weight loss by the more consistent NU group
was considerably less than the average loss of one pound per
week as observed with other behavior modification programs
(38-40). It should be noted, however, that the nutrition
119

education/behavior modification intervention in this study
was for a three month period, and the post-treatment weights
presented here were taken three months after the last
scheduled nutrition session. A trend toward regaining
weight has been cited as a drawback to behavior modification
programs, although this had not been reported until one to
two years post-treatment (41).
The use of bioelectrical impedance analysis in the
estimation of body composition in obese subjects has
previously been critized due to a tendency to overestimate
TBW, and thus underestimate body fat, in such individuals
(42-44). However, through the use of regression equations
incorporating height, weight, and gender, strong
correlations between BIA-determined body composition
parameters, and those determined both by hydrodensitometry
and deuterium-isotope dilution have been repoerted. In
1986, Lukaski et al reported a correlation of .95 between
the fat-free mass determined by BIA and that determined by
hydrodensitometry in women who ranged from four to forty-
one per cent body fat (45). Kushner and Schoeller (46),
found a correlation of .98 for TBW determined by BIA and
that determined by deuterium-isotope dilution in obese
female subjects. Two years later, in a study which involved
1567 subjects who ranged from three to fifty-six per cent
body fat, Segal and coworkers (47) found that the
120

correlation between LBM as determined by BIA and that
determined by densitometry was greater for the obese than
the normal subjects (.95 vs. .91).
As mentioned previously, another problem that has been
identified in the use of bioelectric impedance in the
analysis of body composition is the state of hydration of
the subject (48). Hydration can bee affected by body
temperature changes and excessive sweating. Although Hoffer
(49) has reported a correlation of .91 between TBW
determined by tritiated water and by impedance in patients
with varying degrees of hydration, the environmental
conditions of this study should be kept in mind as one
considers the subsequent changes in body composition. It is
possible that the hotter, more humid weather in June (post
treatment) versus January (pre-treatment) in this study had
an effect on water retention in these obese subjects. This
could cause an overestimation of TBW and thus LBM, and an
underestimation of body fat at post treatment.
Like the changes in body weight, changes in body
composition also appeared to be favorably affected by more
consistent attendance to the nutrition education/behavior
modification classes. Those who attended 80% or more of the
nutrition classes (NU) decreased their *% BF, and increased
their LBM by 3.4% (P < .001). These changes in body
composition, when expressed as total fat and lean weight
121

changes, represented a loss of 4.2 kg of body fat, and a
gain of .9 kg of LBM. Those who were less consistent in
their attendance (SN) experienced only a 1% decrease in BF,
with a similar increase in % LBM, which represented a loss
of only 1.2 kg of body fat and a gain of .3 kg of LBM.
Other studies of behavior modification/weight loss programs
have not typically considered the effect of the frequency of
attendance on body weight or body composition changes,
although Bray and Gray have identified both the frequency
and regularity of attendance (to a nutritional weight loss
program) as possible indicators for determining those who
are likely to succeed (39). Whether this is an effect of
the nutrition classes, or perhaps a reflection of greater
motivation to lose weight by those who attended a greater
number of sessions is unclear.
Several investigators (Kennrick et al, Lennon et
al, Wirth et al) found that the addition of exercise to
dietary restriction improved the amount of weight lost by
dietary means alone (50-52). Sikand (53) found that the
addition of exercise to a dietary weight loss program for
obese women improved group cohesiveness, communication, and
information exchange among participants which contributed to
greater weight loss and nutrition class attendance. In the
present study, those who participated most frequently in
exercise, (EX) ( >» 70% of the time), lost more weight (3.9
122

Kg, p < .01) (-3.7 Kg fat, -.1 kg LBM) than both those who
participated less consistently (SE) (1.0 kg, NS) (-1.8 kg
fat, +1.0 kg LBM) and those who did not exercise or attended
less than 30% of the sessions (NE) (1.4 kg, NS) (-2.4 kg
fat, +.9 Kg LBM) (Table 2). As with the nutrition classes,
the degree that a greater weight loss was due to the role of
exercise, versus perhaps a greater level of motivation
toward weight loss or greater fitness, can only be
speculated upon in the present study.
Although some investigators have found the addition of
exercise to a dietary weight loss program not to produce any
further weight toss than that by dietary means alone, it has
been consistently shown to enhance the loss of fat weight,
while preserving, or increasing lean body mass (54-59). In
the present study, both the EX and NE groups experienced
decreases in their percentages of body fat (2.8 and 1.9,
respectively, p < .05, or -3.7 and -2.4 kg of body fat,
respectively) and corresponding increases in their
percentages of lean body mass (2.8 and 1.9, respectively).
Interestingly, this increase in lean body mass was mirrored
by a comparable increase in absolute lean body mass only for
the NE group (+.9 kg lbm); the EX group remained essentially
unchanged (-.1 kg lbm). There were no significant changes
in % body fat or % lean body mass (1.8%) for those who less
consistently exercised (SE group). However, like the NE
123

group, there was a similar increase in absolute Ibm (+1.0
kg), and a smaller decline in body fat weight (-1.8 kg).
This 18 unlike the study by Zuti and Golding (60) in which
the effects of exercise, dietary restriction or their
combination on body composition were compared. These
researchers found that both groups of exerciSing subjects
lost a greater amount of fat weight than the diet-only
group, and that exercisers had increases in lean body mass,
while the diet-only group lost Ibm. It is unclear why the
NE group in this study experienced an increase in Ibm, while
the EX group experienced no change (or a slight decrease) in
this parameter. The effects on body weight and body fat in
the EX group in this study are similar to the findings of
Lennon and coworkers (51) that the regimen of prescribed
exercise-with-diet resulted in greater decrements in: body
weight, % body weight, body fat and % body fat than either
regimens of self-selected exercise-with-diet or diet alone
in overweight individuals.
Thus, in this study it would appear that, when
compared both to less consistent, and no exercise,
consistent exercise was an important element in overall
weight loss, and enhanced the amount lost as fat, while
preserving -although not increasing, LBM. This 1s supported
by a stronger correlation of the change in body weight with
the change in % BF for the EX group (r = .69, p < .05), than
124

for the group as a whole (r = .35, p < .05), a correlation
that was not present in any other group.
Interestingly, however, less consistent exercise (SE)
had less of an effect on body weight and fat loss than
dietary means alone (NE). This suggests that consistent
exercise may play a valuable role in reducing fat and body
weight. However, the effects of caloric restriction and
less consistent exercise on body weight and composition are
not as readily apparent.
Plasma Variables
Obesity has been associated with a poor plasma lipid
profile (4, 7, 61). In particular, elevated levels of
plasma total cholesterol (TC) and triglycerides (TG) (5, 61-
63), and reduced levels of plasma high density lipoprotein
cholesterol (HDL-C) (4-7, 64) have been observed in obese
individuals. Such a lipoprotein-cholestero! pattern is
considered predictive of the risk of CHD (65). High levels
of plasma LDL-C have also been associated with both a higher
incidence (65-67) and an increased severity (68-70) of CHD.
Some research has suggested that low levels of plasma HDL-C
may be the best predictor of subsequent CHD (65-67). The
subjects in the present study, however, had mean
lipoprotein-cholesterol levels which were within normal
ranges.
125

Caloric restriction and resulting weight toss have
often been found to lower plasma TC (slightly), and LDL-C
(more so) in obese individuals (71-75), while the effect on
plasma HDL-C has been more variable (72, 76). In the
present study, there was no effect on plasma TC or LDL-C
despite a 3.3 kg weight loss, for those in the NU group
(Table 3). The significant decline in plasma HDL-C (2.8
mg/dl, p < .05) for this group would not be atypical;
several researchers have reported decreased plasma HDL-C
levels following a hypocaloric diet (71, 73, 77, 78) in
obese subjects, which has occurred in conjunction with
decreases (71, 79), as wel? as with no change in plasma TC
levels (78). This depression of plasma HDL-C levels has
been reported to be a temporary phenomenon, increasing above
baseline between two and eight months after treatment (74,
78, 79).
Interestingly, for those in the present study who
attended nutrition classes less than 80% of the time (SN)
and lost only .9 kg of body weight, there was a significant
decline in plasma TC (22.5 mg/d1i) (Table 3), which was
accompanied by a significant decline in plasma HDL-C (7.1
mg/d1l p < .001}). This decline in plasma HDL-C was
concomitant to a significant (p < .001) decline in the
plasma HDL-C component as well. Schwartz (80) has found
that changes in plasma HDL,-C are primarily responsible for
126

changes in plasma HDL-C. Post-treatment values of plasma
HDL-C and HDL,-C for the SN group were significantly lower
than for the group who consistently attended nutrition
classes (42.5 vs 46.3 mg/dl, and 19.3 vs 23.9 mg/dl),
suggesting that the greater decrease in plasma TC resulted
in a greater decrease in plasma HDL-C.
Exercise, whether it resulted in weight loss or not,
has been found to decrease levels of plasma TC (slightly)
and LDL-C (81), and increase plasma HDL-C (82-84), as well
as the ratio of TC to HDL-C (81). Among exercise groups in
this study, only those who inconsistently participated in
exercise (SE) experienced a significant (p < .01) decrease
in plasma TC (Table 3). This was interesting, as
correlations have been found between the amount of exercise
and subsequent tipid changes (85-88). However, the recovery
heart rate analyses suggested that there was a greater
conditioning effect in the SE group, which was probably due
to their apparentty lower initial level of fitness. Tran et
al (81) have found that a lower initial level of
cardiovascular fitness (VO, max), was associated with larger
decreases in lipids and lipoproteins in exercising subjects.
Furthermore, correlations have been found between initial
levels of lipoprotein-cholesterol levels and subsequent
changes (81). While there were no initial differences among
exercise groups based on raw mean values of plasma
127

lipoprotein-cholesterol, the plasma TC value of 219 mg/dl
for the SE group was 19.8 mg/dl higher than that of the EX
group, and 22.3 mg/dl higher than that of the NE group.
Furthermore, there were strong correlations in both the EX
and the SE groups between initial plasma TC levels and
subsequent change (r = .60 and .52, respectively). These
factors may partially explain the significant decline seen
only in the SE group. Therefore, one might expect the
changes in lipoprotein-cholesterol variables to be more
pronounced in this group.
Schwartz (80) has suggested that exercise has its
primary effects on lipoprotein-cholesterol through the
plasma HDL-C mediated reverse transport system. In his
review of 66 training studies, Tran (81) found that
exercising subjects experienced a non-significant increase
in plasma HDL-C. That a larger increase did not occur may
be related to the subsequent finding that larger increases
in HDL-C were associated both with more hours of training
and lower training intensities. Although the more
consistent participation in exercise (EX) in this study did
not result in increased plasma HDL-C levels, it did appear
to mitigate significant declines in plasma HDL-C and HDL,-C
seen in both groups that exercised less (Table 3). The
trends in plasma HDL-C within all exercise groups were
accompanied by similar changes in plasma HDL.-C, as Schwartz
128
(80) has previously observed. Atthough exercise has been
shown to decrease the ratio of plasma TC to HDL-C, in
subjects who exercised only, as well as those who combined
exercising with caloric restriction (58, 89), there were no
significant changes in the plasma TC/HDL-C ratio for any
group in this study.
Plasma TG levels have been found to be significantly
related to BMI (90) and other measures of overweight or body
fat distribution (91). They nave also been associated with
coronary artery disease (92, 93). Caloric restriction has
been shown to result in lowered plasma TG levels in obese
individuals (71, 72, 78). In this study, the group that
most consistently attended nutrition classes experienced a
decrease in plasma TG of 19.8 mg/dl (p < .05). This was
similar to the finding by Schwartz (80) that plasma TG
decreased in a group of subjects who were dieting only.
However, all groups of subjects in this study did
significantly reduce their caloric intake, yet there were no
significant changes in plasma TG for any other groups,
although there was a consistent trend to lower plasma TG for
all groups.
Although exercise training has been found to result in
Towered plasma TG levels (81), exercise in this study had no
significant effect on levels of plasma TG. Similar to the
results of this study, Lampman et al (94), and Hill et.al
129

(58) both found no change in plasma TG levels in obese
individuals who reduced their caloric intake and either
exercised or remained sedentary. Perhaps the initial level
of plasma TG (normal levels for all groups) and the greater
Variability of plasma TG levels were limiting factors within
which the effects of nutrition or exercise would not be
statistically significant.
The association between obesity and high plasma insulin
has been recognized (95), and high plasma insulin values
have been found in one study to be independently predictive
of CHD (96). Weight loss, through caloric restriction (97)
has been associated with improvements in carbohydrate
metabolism in obese individuals. In the present study, both
nutrition groups (NU and SN) experienced significant
reductions (4.8 and 7.1 uIU/ml, respectively) in fasting
plasma insulin (Table 3). In the SN group, this occurred
despite the lack of a significant loss of weight (Table 2).
For both groups, however, there were significant
correlations between the changes in insulin and changes in
total kcal, total fat and saturated fat, suggesting the
importance of specific dietary changes on plasma insulin.
Weight loss through exercise has also been associated
with improvements in carbohydrate metabolism tn obese
individuals (98). Furthermore, physical training which did
not result in weight loss in obese subjects has previously
130

been reported to result in decreased insulin values (99).
In this study, both the EX and NE groups experienced
significant declines in fasting insulin, while the decrease
for the SE group was not significant. However, Lampman
(100) nas suggested that exercise may have differing effects
on insulin, dependent on the degree of glucose impairment
and/or obesity. Indeed, the initial insulin value of the SE
group was lower that any other group. However, it was
simitar to the EX group, which did undergo a significant
decline in fasting insulin, suggesting that more consistent
exercise may be necessary to reduce normal levels of
insulin.
For alt groups, there were significant correlations
between the change in plasma TC and the change in plasma
LDL-C (r = .89 to .99) as would be expected. For the group
of 50 subjects, there was a significant correlation (r =
-41, p < .01) between the change in plasma HDL-C and the
change in plasma HDL-C. Although this correlation is
relatively low it still supported the finding by Schwartz
(80) that changes in plasma HDL-C account for the majority
of variability in plasma HDL-C levels
Nutrient Intake
All groups of subjects in this study were able to
achieve significant (p < .05) reductions in total caloric
131

intake. All groups except the SE group, that inconsistently
attended exercise, significantly (p < .05) reduced their
intake of fat and saturated fat. There were no changes in
the M/S or P/S ratios. The study group as a whole (n = 50)
Significantly (p < .05) decreased its intake of both dietary
cholesterol] and sugar, while the sugar intake of the NU
group also declined significantly (p < .05).
For the whole study group, there were significant
negative correlations for both CHO and pectin with the
plasma TC/HDL-C ratio (r = -.33, r= -.35, respectively).
For both nutrition groups (NU and SN), as well as the NE
group, there were significant negative correlations (ranging
From r = -.34 to r = -.77) between the changes in CHO or
pectin and either the TC/HDL-C ratio or LDL-C. High-
carbohydrate diets have previously been found to improve
plasma TC levels in normal (101), hyperlipoproteinemic
(102), and (maturity-onset) diabetic subjects (103).
Decreases in plasma TC are accompanied by decrements in both
plasma LDL-C and HDL-C for individuals on high-carbohydrate
diets (101-106). Pectin, a soluble fiber, has been found by
numerous investigators to result in lower plasma TC levels,
while no reduction in plasma HDL-C was reported (107).
Although decrements in plasma TC and LDL-C have
frequently been reported in obese individuals following a
hypocaloric diet (71-75), in this study there were low, but
132

significant negative correlations between total kcal
consumed and both plasma TC and LDL-C for the whole study
group, and for both nutrition groups (r = -.35 to -.52).
The positive association found in the present study between
total kcal consumed and fasting plasma insulin (r = .51) for
the whole group, as well as for the NU (r = .47), SN (r =
-61), and NE (r = .57) groups, has been reported by others
(108-110).
In this study, significant correlations which existed
for all subjects between dietary fat intakes and plasma
variables were relatively low (r = -.28 to -.34), and were
inconsistent, thus extrapolation and interpretation were
difficult. Total fat intake was found to be positively
correlated in this study, for all 50 subjects, to fasting
plasma insulin (r = .51). Similar correlations, ranging
from r = .45 to r = .67, existed for other groups of
subjects. Protein was also significantly and positively
correlated to insulin for the whole group (r = .43) as well
as the NE group (r= .82). Protein had previously been
found to be insulinogenic (111). The negative correlation
observed between the change in the percentage of CHO in the
diet and fasting plasma insulin (r = -.42) for the study
group was in agreement with data published by Himsworth at
least 55 years ago (112).
That hypertriglyceridemia often occurs in conjunction
133
with high CHO diets has been cited as a major drawback to
their use (113). In the present study, for the group as a
whole, the correlation between the change in the percentage
of kcal from CHO in the diet and the change in plasma TG (r
= .36, p < .05) was relatively low, but present. Although
there was no significant correlation, the decrease in plasma
TG could perhaps be partially due to the significant drop in
Sugar intake (103) (23.5 9g, p < .05).
Previous researchers have found various measures of
overweight to be positively correlated with plasma TC, TG,
LDL-C and insulin, and negatively with plasma HDL-C, HDL,-
C, and the HDL-C/TC ratio (5, 91, 114, 115). For both the
SN and the NE groups in this study, there were significant
correlations (r = .56, r= .43, respectively) between the
change in body weight and the change in plasma TG. For none
of the other groups were there any significant correlations
between changes in body composition and changes in plasma
variables. Perhaps the lack of correlation between changes
in such variables in this study suggests that the static
correlations observed by others may not be a cause-and-
effect relationship, or that such associations are not
stable during active weight loss.
Both dietary fat and dietary sugar, especially sucrose,
have been implicated as having a causal role in the
development and/or maintenance of obesity, at least in rats
134
(116, 117). For all groups except the SE and NE groups,
there existed a significant positive relationship (ranging
from r = .32 to r = .69, p < .05) between the change in body
weight and the change in sugar and/or sucrose intake. The
NU group, also had a significant correlation (r = .35)
between the change in % BF and the change in sugar consumed,
while the EX group approached significance (r = .57, p <
-06). This supported previous work which found a high-
sugar diet to lead to increased to body fat (117). There
were, however, negative correlations (r = -.32 and -.48,
respectively) between the change in % BF and the change in
the per cent of calories derived from fat, for both the
total group (n = 50) and the NU group, which cannot be
explained.
While comparisons and contrasts have been made between
the changes in nutrient intake components observed in the
present study and those observed in other studies, it should
be kept in mind that since subjects here were on ad 11b
diets, the correlations must be viewed with caution. That
is, since nutrient composition of the diet was based on
dietary recall, observed dietary changes may not accurately
reflect long-term dietary patterns. Certainly, cause-and-
effect relationships between variables cannot not be
assumed. Additionally, other feeding studies, to which the
results of the present study were compared, were controlled
135

for at least some other variables such as exercise, diet,
weight loss, fat loss and dietary constituents. As the
population in the present study was a free-living one, it
was difficult or impossible to control such confounding
Variables.
Recovery Heart Rates
Exercise, performed at sufficient frequency, duration,
and intensity, is likely to result in improvements in
cardiovascular parameters, as well as work capacity.
Several investigators (90, 118, 119) have shown walking to
be an effective modality for the achievement of such
physical improvements. Aerobic dance has also been proven
to be capable of producing beneficial changes in work
capacity, ventilatory exchange, as well as resting and
exercising heart rates (40, 120-128). In the present study,
there were no significant differences among recovery heart
rates, expressed as a percentage of the immediate post-
exercise (IPE) heart rates, among groups (Table 5). More
detailed analysis, however, showed that the one-minute
recovery heart rate of the EX group at pre-treatment was
significantly different from its respective IPE heart rate,
but that of the SE group was not (Table 5). This suggested
that there was some degree of self-selection; that is, that
those who were more fit (had a lower one-minute recovery
136

heart rate) were also those who attended exercise most
Frequently. At post-treatment, however, the one-minute
recovery heart rates of both groups were significantly lower
than their respective IPE values, indicating that exercise
had a beneficial effect for the SE group, white it served to
maintain the fitness of the EX group.
This effect of exercise on recovery heart rates between
groups is also evident through the analysis of differences
between heart rates one and two at both pre- and post-
treatment (also Table 5). Again, for the EX group, the two-
minute recovery heart rate was significantly lower than the
one-minute recovery rate at pre-treatment, but this was not
true for the SE group. At post-treatment, the two-minute
rate was significantly lower than the one-minute rate, for
both exercise groups. This again indicated a beneficial
effect of exercise on recovery heart rates for the
apparently ltess-fit SE group, while maintaining
cardiovascular status in the EX group.
This apparent conditioning effect is further evident in
Table 6. Those in the SE group, who appeared to be less fit
initially, experienced significant declines in both one- and
two-minute recovery heart rates between pre- and post-
treatment (17.3% and 18.5% of IPE, respectively). The EX
group, however, experienced (non-significant) increases in
both heart rates, indicating no change in cardiovascular
137

conditioning. Moreover, the slight increase in the two-
minute heart rate for the EX group was significantly
different from the significant decline for the SE group
(Table 6).
These results suggest that even moderate exercise may
elicit more pronounced improvements in those who are less
Fit initially, while consistent exercise serves to maintain
cardiovascular functioning in more fit individuals. Perhaps
this greater conditioning effect in the SE group was a
factor in the significant derease in plasma TC observed in
the SE, but not the EX group. However, in considering these
changes in recovery heart rate values, the possible role of
differing environmental conditions should be kept in mind.
Pre-treatment values were collected in January, but post-
treatment at the end of June, in south-central Virginia.
The greater heat at post treatment may have resulted in
higher IPE heart rates, and the humidity in less evaporative
cooling, and thus higher recovery heart rates at post-
treatment. Indeed, non-significant tncreases in both one-
and two-minute recovery heart rates were evident in the EX
group. Moreover, the heat and humidity as well as the
duration of the study may have had an effect on the
motivation and effort of the participants during the post-
treatment 10-minute walk, resulting in a lower IPE heart
rate than otherwise might be achieved, but likely a higher
138

recovery heart rate.
This study has provided evidence that participation in
a nutrition education/behavior modification program aimed at
weight loss can produce modest weight loss. The addition of
aerobic exercise on a consistent basis may also aid in the
loss of both body weight and body fat, while preserving LBM.
Additionally, exercise may enhance changes in lipoprotein
patterns by mitigating declines in plasma HDL-C and HDL,-C.
General participation in nutrition education/behavior
modification classes proved to be an effective modality to
elicit beneficial changes in nutrient intakes in obese black
women, even when measured three months after the end of the
nutrition intervention program. However, it would appear
that more consistent attendance was necessary to effect
significant declines in dietary sugar and the percentage of
calories derived from fat, as the declines in these
Variables were significant for those who attended more than
80% of the nutrition classes, but not for those who attended
less than this.
139

REFERENCES
1. Barsky AJ. The paradox of health. New Engl J Med 1988;318:414-8.
2. Gillum RF. Overweight and obesity in black women: A review of published data from the National Center for Health Statistics. J Natl Med Assoc 1987;79(8):865-71.
3. Hubert HB, Feinleib N, McNamara P, Castelli W. Obesity as an independent risk factor for cardiovascular disease: a
26-year follow-up of participants in the Framingham Heart
Study. Circulation 1983;67(5):968-77.
4. Kannel WB, Gordon T, Castelli WP. Obesity, lipids and
glucose intolerance: The Framingham Study. Am J Clin Nutr 1979;32:1238-45.
5. Berry EM, Hirsch J, Most J, Thornton J. The role of
dietary fat in human obesity. Int J Obes 1986;10:123-31.
6. Berchtold P, Berger M, Jorgens V, Daweke C, Chantelau €£,
Gries FA, Zimmerman H. Cardiovascular risk factors and HDL-
cholesterol levels in obesity. Int J Obes 1981;5:1-10.
7. ‘Foster CJ, Weinsier RL, Birch R, Norris DJ, Bernstein RS, Wang J, Pierson RN, Van Itallie TB. Obesity and serum
Tipids: an evaluation of the relatvie contribution of body
fat and fat distribution to lipid levels. Int J Obes 1987;11:151-61.
8. Van Itallie TB. Health implications of overweight and
obesity itn the United States. Ann Intern Med 1985;103(6 pt
2):983-8.
9. Garfinkel L. Overweight and cancer. Ann Intern Med
1985;103(6 pt 2):1034-6.
10. Kral JG. Morbid obesity and related health risks. Ann Intern Med 1985;103(6 pt 2):1043-7.
11. Bray GA. Complications of obesity. Ann Intern Med
1985;103(6 pt 2):1052-62.
12. Lew EA, Garfinkel L. Variations in mortality by weight
among 750,000 men and women. J Chronic Dis 1979;32:563-7.
13. Feinleib M. Epidemiology of obesity in relation to
health hazards. Ann Intern Med 1985;103(6 pt 2):1019-24.
14. Bray GA. Obesity: basic considerations and clinical
140

approaches. Disease-a-month 1989;18(7):449-540.
15. U.S. Department of Health and Human Services and
Agriculture. Nutrition Monitoring in the United States,
Washington, DC: U.S. Governmant Printing Office, 1986. (DHHS
publ no {phsjJ 86-1255).
16. Gillum RF. The epidemiology of coronary heart disease
in blacks. J Natl Med Assoc 1985;77(4):281-4.
17. Malcolm R, Von JM, O’Neil PM, Curey HS, Sexauer JD,
Riddie E. Update on the management of obesity. Southern Med
J 1988;81(5):632-9.
18. Jequier E. Panel summary statements. Energy, obesity, and body weight standards. Am J Clin Nutr 1987;45:1035-47.
19. Lerman RH, Cave DR. Medical and surgical management of
obesity. Adv Intern Med 1989;34:127-64.
20. Council on Scientific Affairs. Council report.
Treatment of obesity in adults. JAMA 1988;260(17):2547-51.
21. Stunkard AJ. Conservative treatments for obesity. Am J
Clin Nutr 1987;45:1142-54.,
22. Weinsier RL, Wadden TA, Ritenbaugh C, Harrison GG, Johnson FS, Wilmore JH. Recommended therapeutic guidelines
for professional weight control] programs. Am J Clin Nutr 1984;40:865-72.
23. Daniel EL. A multi-intervention weight management
program for low-income rural women. J Am Diet Assoc
1989;89(9):1310-11.
24. Fardan L, Tyson Y. DREW program for obesity treatment.
J Natl Med Assoc 1985;77(9):737-41.
25. Stevens VJ, Rossner J, Greenlick M, Stevens M, Frankel HM, Craddick S. Freedom from fat: A contemporary multi-
component weight loss program for the general population of obese adults. J Am Diet Assoc 1989;89(9):1254-8.
26. Sullivan J, Carter JP. A nutrition-physical fitness
intervention program for low-income black parents. J Natl Med Assoc 1985;77(1):39-43.
27. Aycock JE, Taper LT. DEB Program. Virginia Cooperative
Extension Service, Virginia Polytechnic Institute and State University, Blacksburg, VA, 1978.
28. Wahlefeld AW. Triglyceride determination after
141

enzymatic hydrolysis. In: H.V. Bergmeyer (Ed.), Methods of
Enzymatic Analysis, New York Academic Press, New York, 1974,
p. 1831-5.
29. Schoenhemier R, Warren TS. A micromethod for the determination of free and combined cholesterol. J Biol Chem
1934;106:745-60.
30. Albers JJ, Warnick GR, Chenng MC. Quantitation of high density lipoproteins. Lipids 1978;13(12):926-32.
31. Gidez LI, Miller GJ, Burstein M, Slagle S, Eder HA. Separation and quantitation of subclasses of human high density lipoproteins by a simple precipitation procedure. J
Lipid Res 1982;23:1206-23.
32. Friedewald WT, Levy RI, Fredrickson D.S. Estimation of
plasma tow density lipoprotein cholesterol concentration
without use of the preparature ultracentrifuge. Clin Chem 1972;18:499-502.
33. Hyvarinen A, Nikkila E. Specific determination of blood
glucose with o-toluidine. Clin Chim Acta 1962;7(1):140-3.
34. Feteris WA. A serum glucose method without protein
precipitation. Am J Med Technol 1965;21:17-21.
25. Stanbio Direct Glucose Procedure No. 0270; Stanbio
Laboratory, Inc., San Antonio, TX.
36. Peccatiello, KL. Effect of a comprehensive weight
reduction program on blood variables, body composition, and
nutrient intake in obese black women. Master’s Thesis.
VPI&SU, Blacksburg, VA. 1987.
327. Sedltock DA, Melby CL, Hyner GC, Corrigan DL, Duda JL.
Effects of a comprehensive weight toss program on body
composition, blood lipids, nutritional intake and urinary
ketone excretion. J Obes Wt Reg 1988;7(1):34-42.
38. Paulsen BK. Lifesteps: weight management program: A
response from a behavioral perspective. J Am Diet Assoc
1987; (Supp1)9:S33-S35.
39. Bray GA, Gray DS. Obesity. Part II -Treatment. West J
Med 1988;149:555-571.
40. Holmes MD, Zysow B, Delbanco TL. An analytic review of current therapies for obesity. J Fam Pract 1989;28(5):610-6
41. Kramer FM, Jeffery RW, Forster JL, Snell MK. Long-term
follow-up of behavioral treatment for obesity: patterns of
142

weight regain among men and women. Int J Obes 1989;13:123-
36.
42. Bioelectrical Sciences. BES 2002 Manual. 5580 L Jolla
Bivd., Suite 417, La Jolla, CA. 92037.
43. Miles DS, Stevens AG. Body composition measured by
bioelectrical impedance and hydrostatic weighing. Med Sci
Sports Ex 1985;17(2):272-3.
44. Kushner RF, Schoeller DA, Bowman BB. Comparison of total body water determination by bioelectrical impedance
analysis, anthropometry, and deuterium-dilution. Am J Clin
Nutr 1984;39(4):LabstrJjJ658.
45, Lukaski HC, Lukaski HC, Botonchuk WW, Hall CB, Siders
WA. Validation of tetrapolar bioelectrical impedance method
to assess human body composition. J Appl Physiol
1986;60(4):1327-32.
46. Kushner RF, Schoeller DA. Estimation of total body water by boielectrical impedance analysis. Am J Clin Nutr
1986;44:417-24.
47. Segal KR, Van Loan M, Fitzgerald PI, Hodgdon JA, Van Itallie TB. Lean body mass estimation by bioelectrical
Impedance analysis: a four-Ssite cross-validation study. Am J
Clin Nutr 1988;47;7-14.
48. Solomons NW. How valid are bioelectric impedance
measurements in body composition studies? Am J Clin Nutr
44;306-7.
49. Hoffer EC, Meador CK, Simpson DC. Correlation of whole-
body impedance with total body volume. J Appl Physiol 1969;27:531-4.
50. Kenrick KM, Ball MF, Canary JJ. Exercise and weight
reduction in obesity. Arch Phys Med Rehab 1972;53:323-7.
51. Lennon D, Nagle F, Stratman F, Shrago E, Dennis S. Diet and exercise training effects on resting metabolic rate. Int
J Obes 1985;9:39-47.
52. Wirth A, Vogel I, Schomig A, Schlierf G. Metabolic
effects and body fat mass changes itn obese subjects on a
very-low-calorie diet with and without physical training.
Ann Nutr Metab 1987;31:378-86.
53. Sikand G, Kondo A, Foreyt J, Jones PH, Gotto AM. Two-
year follow-up of patients treated with a very-low-calorie diet and exercise training. J Am Diet Assoc 1988;4:487-88.
143

54. Walberg JL, Reed CE, Hinkle DE. The effects of light
versus moderate exercise added to diet control! in a weight
reduction program for overweight college women. Med Sci Sports Ex 1984;16(1):135.
55. Sopko G, Leon AS, Jacobs DR, Foster N, Moy J, Kubak,
Anderson JT, Casal D, NcNally C, Frantz I. The effects of
exercise and weight loss on plasma lipids in young obese
men. Metabolism 1985;34(3):227-36.
56. Belko AZ, VanLoan M, Barbieri TF, Mayctin P. Diet,
exercise, weight loss, and energy expenditure in moderately
overweight women. Int J Obes 1987;11:93-104.
57. Konstantin NP, Steffee WP, Lerman RH, Burrows BA.
Effects of dieting and exercise on lean body mass, oxygen
uptake, and strength. Med Sci Sports Ex 1985;17(4):466-71.
58. Hill JO, Sparling PB, Shields TW, Heller PA. Effects of
exercise and food restriction on body composition and
metabolic rate in obese women. Am J Clin Nutr 1987;46:622- 30.
59. Henson LC, Poole DC, Donahoe CP, Heber D. Effects of
exercise training on resting energy expenditure during
caloric restriction Am J Clin Nutr 1987;46:893-9.
60. Zuti WB, Golding LA. Comparing diet and exercise as
weight reduction tools. Phys Sports Med 1976;4:49-53.
61. Matter S, Weltman A, Stamford BA. Body fat content and serum lipid levels. J Am Diet Assoc 1980;77:149-52.
62. Montoye HJ, Epstein FH, Kjielsberg MO. Relationship
between serum cholesterol and body fatness. Am J Clin Nutr 1966;18:397-406.
63. Rifkind BM, Berg T. Relationship between relative body
weight and serum lipid levels. Br Med J 1966;2:208-16.
64. Carlson LA, Ericsson M. Quantitative and qualitative serum lipoprotein analysis. Pt. 1. Studies in healthy men
and women. Atherosclerosis 1975;21:417-33.
65. Castelli WP, Doyle JT, Gordon T, Hames CG, Hjortland
MC, Hulley SB, Kagan A, Zukel WJ. HDL cholesterol! and other lipids in coronary heart disease. The cooperative
lipoprotein phenotyping study. Circulation 1977;55(5):767-
72.
66. Gordon T, Castelli WP, Hjortland MC, Kannel WB, Dawber
144

TR. High density lipoptotein as a protective factor against
coronary heart disease. The Framingham Study. Am J Med
1977;62:707-14.
67. Miller NE, Forde OH, Thelle DS, Mjos OD. The Tromso
Heart Study. High-density lipoprotein and coronary heart-
disease: a prospective case-control study. Lancet 1977;1:965-7.
6é8.Jenkins PJ, Harper RW, Nestel PJ. Severity of coronary atherosclerosis related to lipoprotein concentration. Br Med
J 1978;31 388-91.
69. Tan MH, Macintosh W, Weldon KL, Kapoor A, Chandler BM,
Hindmarsh TJ. Serum high density lipoprotein cholesterol in
patients with abnormal coronary arteries. Atherosclerosis
1980;37:187-938
70. Miller NE, Hammett F, Saltissi S, Rao S, Van Zeller H, Coltart J, Lewis B. Relation of angiographically defined coronary artery disease to plasma lipoprotein subfractions
and apolipoproteins. Br Med J 1981;282:1741-4.
71. Nelius SJ, Heyden S, Hansen JP, Muhlbaier LH, Morris M. Lipoprotein and btood pressure changes during weight
reduction at Duke’s Dietary Rehabilitation Clinic. Ann Nutr Metab 1982;26:384-92.
72. Brownell KD, Stunkard AJ. Differential changes itn
plasma high-density lipoprotein-cholestero! levels in obese men and women during weight reduction. Arch Intern Med
1981;141:1142-6.
73. Rossner S, Bjorvell H. Early and late effects of weight loss on lipoprotein metabolism in severe obesity.
Atherosclerosis 1987;64:125-30.
74. Follick MJ, Abrams DB, Smith TW, Henderson O, Herbert PN. Contrasting short~- and long-term effects of weight loss
on lipoprotein levels. Arch Intern Med 1984;1571-4.
75. Contaldo F, Strazzulo P, Postiglione A, Riccardi G, Patti L, DiBiase G, Mancini M. Plasma high density
lipoprotein in severe obesity after stable weight loss. Athero 1980;37:163-7.
76. Rabkin SW, Boyko E, Streja DA. Relationship of wieght
loss and cigarette smoking to changes in high-density lipoprotein cholesterol. Am J Clin Nutr 1981;34:1764-8.
77. Weisweiller P. Plasma lipoproteins and lipase and
lecithin: cholesterol acyltransferase activities in obese
145

subjects before and after weight reduction. J Clin
Endocrinol Metab 1987;65(5):969-78.
78. Thompson PD, Jeffery RW, Wing RR, Wood PD. Unexpected
decrease in plasma high density lipoprotein cholesterol with
weight loss. Am J Clin Nutr 1979;32:2016-21.
79. Tokanuga K, Ishikawa K, Matsuzawa Y. Lipids and
lipoproteins during a very-low-calorie diet. Lletter] Int J Obes 1982;6:416.
80. Schwartz R. The independent effects of dietary weight
loss and aerobic training on high denstiy lipoproteins and apolipoprotein A-1 concentrations in obese men. Metabolism
1987;36(2):165-71.
81. Tran ZV, Weltman A, Glass GV, Mood DP. The effects of exercise on blood lipids and lipoproteins: a meta-analysis
of studies. Med Sci Sports Ex 1983;15(5):393-402.
82. Lopez-S A, Vial R, Balart L, Arroyave G. Effects of exercise and physical fitness on serum lipids and
lipoproteins. Atherosclerosis 1974;20:1-9.
83. Peltonen P, Marniemi J, Hietanen E, Vuori I, Ehnolm C. Changes in serum lipids, lipoproteins and heparin releasable
lipolytic enzymes during moderate physical training in man: a longitudinal study. Metabolism 1981;30:518-26.
84. Sutherland WHF, Woodhouse SP. Physical activity and
plasma lipoptotein lipid concentrations in men.
Atherosclerosis 1980;37:285-92.
85. Hagan RD, Upton JS, Wong L, Whittam J. The effects of aerobic conditioning and/or caloric restriction in
overweight men and women. Med Sci Sports Ex 1986;18:87-94.
86. Hartung GH, Foreyt JP, Mitchell RE, Vliased F, Gotto AM. Relation of diet to high-density-lipoprotein cholesterol in
middle-aged marathon runners, joggers and inactive men. New
Engl J Med 1980;302;357-61.
87. Williams PT, Wood PD, Haskell WL, Vranizan K. The
effects of running mileage and duration on plasma
lipoprotein levels JAMA 1982;247(19):2674-79.
88. Wood PD, Haskell WL, Blair SN, Williams PT, Krauss RM,
Lindgren FT, Albers JJ, Ho PH, Farquhar JW. Increased exercise level and plasma lipoprotein concentrations: A one-
year, randomized, controlled study in sedentary, middle-
aged men. Metabolism 1983;32(1):31-9.
146

89. Saldivar MA, Roe H, Hartung GH, Pullin D. Lipid,
lipoprotein, and body composition changes during diet only
and diet plus exercise weight reduction programs for eight
weeks. Med Sci Sports Ex 1984;16(1):Labstr]135-6.
90. Barr EM, Hirsch J, Most J, Thornton J. The role of
dietary fat in human obesity. Int J Obes 1986;10:123-31.
91. Kissebah AH, Freedman DS, Peiris AN. Health risks of
obesity. Med Clin North Am 1989;73(1):111-139.
92. Carlson LA, Bottiger LE, Ahfeldt PE. Risk factors for myocardial infarction in the Stockholm prospective study. Acta Med Scand 1979;206:351-?7??
93. Hultley SB, Rosenman RH, Bawol RD, Brand RJ.
Epidemiology as a guide to clinical decisions: the association between triglyceride and coronary heart disease.
New Engl J Med 1980;302:1383-9.
94. Lampman RM, Schteingart DE, Foss ML. Exercise as a partial therapy for the extremely obese. Med Sci Sports Ex
1986;18(1):19-24.
95. Karam JH, Grodsky GM, Forsham PH. Excessive insulin
response to glucose in obese subjects measured by
Immunochemical assay. Diabetes 1963;12:197-204.
96. Pyorala K, Savolainen E, Kaukola S, Haapakoski J. Plasma insulin as coronary heart disease risk factor: Relationship to other risk factors and predictive value
during 91/2 year follow-up of the Helsinki policeman study
population. Acta Med Scand (Suppl) 1985;701:38-52.
97. Genuth S. Supplemented fasting in the treatment of obesity and diabetes. Am J Clin Nutr 1979;32:2579-86.
98. Leon AS, Conrad J, Hunninghake DB, Serfass R. Effects of a vigorous walking program on body composition, and carbohydrate and lipid metabolism of obese young men. Am J Ciin Nutr 1979;32:1776-87.
99. Bjorntorp P, DeJounge K, Krotkiewski M, Sullivan L,
Sjostrom L, Stenberg J. Physical training in human obesity.
II. Effects of long-term physical training on body composition. Metabolism 1973;22(12):1467-75
100. Lampman RM, Santinga JT, Savage PJ, Bassett DR, Hydrick
CR, Flora JD, Block WD. Effect of exercise training on glucose tolerance, in vivo insulin sensitivity, lipid and
lipoprotein concentrations in middle-aged men with mild hypertriglyceridemia. Metabolism 1985;34(3):205-11.
147

101. Fatko JM, Schonfeld G, Witztum JL, Kolar JB, Salmon P.
Effects of short-term high carbohydrate, fat-free diet on
plasma levels of apo C~II and apo C-III and on the apo Cc
subspecies in human plasma lipoproteins. Metabolism
1980;29(7):654-61.
102. Vessby B, Carlson LA. Conversion of type III
hyperlipoproteinemia to type IV hyperlipoproteinemia by a fat-free, carbohydrate-rich diet. Eur J Clin Invest
1975;5:359-63.
103. Simpson RW, Mann JI, Eaton J, Moore RA, Carter R,
Hockaday TD. Improved glucose control in maturity-onset
diabetes treated with high-carbohydrate-modified diet. Br Med J 1979;1:1753-9.
104. Gonen B, Patsch W, Kuisk I, Schonfeld G. The effect of
short-term feeding of a high carbohydrate diet on HDL subclasses in normal subjects. Metab Clin Exp 1981;30:1125-
9.
105. Schonfeld G, Weidman SW, Witztum JL, Bowen RM
Alterations in levels and interrelations of plasma
apopipoproteins induced by diet. Metabolism 1976;25(3):261- 75.
106. Grundy SM. Comparison of monunsaturated fatty acids and
carbohydrate for lowering plasma cholesterol. New Engl J Med 1986;314:745-8.
107. Reiser S. Metabolic effects of dietary pectin related
to human health. Food Technology 1987;Feb:91-9.
108. Parenti M, Palareti G, Babini AC, Poggi M, Torricelli P, Melchionda N. Effect of slimming on metabolic and
haemorheologic patterns in a group of obese subjects. Int J
Obes 1988;12:179-84
109. Coiro V, Chiodera P. Effect of obesity and weight loss
on the arginine vasopressin response to insulin-induced
hypoglycaemia. Clin Endocrinol! 1987;27:253-8.
110. Schteingart DE, Lampman RM, Savage PJ, Edwards GJ,
Starkman MN, Foss M, Morales P, Valiquette S, Mitchell R.
The effect of physical exercise during weight reduction in
severe obesity. Clin Res 1983;31(4):760A.
111. Hol? MG, Allen LH. Comparative effects of meals high in protein, sucrose or starch on human mineral metabolism and
insulin secretion. Am J Clin Nutr 1988;48:1219-25.
148

112. Himsworth HP. The dietetic factor determining the
glucose tolerance and sensitivity to insulin of healthy men.
Clin Sci 1935:2:67-94.
113. Mann J. Complex carbohydrates: replacement energy for
fat or useful in their own right? Am J Clin Nutr 1987;45:1202-6.
114. Golay A, Swislocki ALM, Chen Y-D I, Jaspan JB, Reaven
GM. Effect of obesity on ambient plasma glucose, free fatty
acid, insulin, growth hormone, and glucagon concentrations.
J Clin Endocrinol Metab 1986;63(2):481-4.
115. Diehl AK, Fuller JH, Mattock MB, Salter AM, E&1-Gohar?i
R, Keen H. The relationship of high density lipoprotein
subfractions to alcohol consumption, other lifestyle
factors, and coronary heart disease. Atherosclerosis
1988;69:145-53.
116. Oscai LB, Miller WC. Dietary-induced severe obesity:
exercise implications. Med Sci Sports Ex 1986;18(1):6-9.
117. Oscai LB, Miller WC, Arnal DA. Effects of dietary sugar
and of dietary fat on food intake and body fat content in rats. Growth 1987;51:64-73.
118. Schoenfeld Y, Keren G, Shimoni T, Birnfeld C, Sohar E. Walking. A method for rapid improvement of physical fitness.
JAMA 1980;243(20):2062-3.
119. Lewis S, Haskell WL, Wood PD, Manoogian N, Bailey JA,
Pereira M. Effects of physical activity on weight reduction in obese middie-aged women. Am J Clin Nutr 1976;29:151-6.
120. Milburn S, Butts NK. A comparison of the training responses to aerobic dance and jogging in college females.
Med Sci Sports Ex 1983;15(6):510-3.
121. Nelson DJ, Pets AE, Geenen DL, White TP. Heart rate response during aerobic dance. Med Sci Sports Ex 1984;16:Labstrj126.
122. Eickhoff J, Thorland W, Ansorge C. Selected
physiological and psychological effects of aerobic dancing among young adult women. J Sports Med Phys Fitness
1983;23:273-80.
423. Rockefeller KA, Burke EJ. Psycho-physiological analysis of an aerobic dance programme for women. Br J Sports Med
1979;13:77-80.
124. Cearly ML, Moffatt JR, Knutzen KM. The effects of two-
149

and three-day-per-week aerobic dance programs on maximal
oxygen uptake. Res Quarterly Ex Sport 1984; 55(2):172-4.
125. Blessing DL, Wilson GD, Puckett JR, Ford HT. The
physiologic effects of eight weeks of aerobic dance with and
without hand-held weights. Am J Sports Med 1987;15(5):508-10.
126. Vaccaro P, Clinton M. The effects of aerobic dance conditioning on the body composition and maximal oxygen
uptake of college women. J Sports Med Phys Fitness
1981;21:291-4.
127. Dowdy DB, Cureton KJ, DuVal HP, Ouzts HG. Effects of
aerobic dance on physical work capacity, cardiovascular
function and body composition of middle-aged women. Res
Quarterly Ex Sport 1985;56(3):227-3323.
128. Pollock ML, Foster C, Salisbury R, Smith R. Effects of a YMCA starter fitness program. Phys Sports Med
1982;10(1):89-100.
150

Summary and Conclusions
This study was conducted in order to evaluate the
effects of a multi-factorial weight loss program on body
weight and composition, plasma lipoprotein-cholesterol,
triglycerides, insulin, and nutrient intake in obese black
women. Fifty healthy females, between 20 and 51 years of
age, who were at least 20% above the desirable weight-for-
age based on the Metropolitan Life Insurance Co. tables, and
who were considered sedentary according to a questionnaire
participated in the study. Thirty-five subjects met once
per week for two hours each, and attended 80% or more of the
nutrition classes (NU group) which emphasized caloric
reduction through nutrition education, behavior
modification, and stress management. The fifteen subjects
who participated in less than 80% of these classes (SN
group) were considered as a separate group for comparison.
The duration of this aspect of the program was 11 weeks.
The low-impact aerobic exercise program, however, continued
beyond this, and lasted a full six months. Twelve subjects
participated consistently in these supervised exercise
sessions, and attended more than 70% of the one-hour,
thrice-per-week classes (EX group). Sixteen subjects
participated inconsistently (30% to 70% of the sessions) (SE
group), and 22 subjects participated in less than 30%, or
did not attend exercise at all (NE group). Body weight and
151
composition were determined both at the beginning and the
end of the six-month intervention period, as were plasma
lipoprotein-cholesterol, plasma TG and plasma insulin. Two
twenty-four hour dietary recalls were used to determine
energy and nutrient intake both at the start and end of the
six-month treatment period.
For all subjects (n = 50), there was an average weight
loss of 2.1 Kg, which was accompanied by a decrease in
percent body fat (%BF) (2.2%), and an increase in percent
lean body mass (% LBM) (2.2%). Among nutrition groups,
these changes were accounted for primarily by the NU group;
those subjects in the SN group experienced no significant
change in either body weight or composition. Among exercise
groups, the beneficial changes in ® BF and ® LBM observed
for the whole group were accounted for by the EX and NE
groups. A significant decrease in body weight occurred only
in the EX group. Subjects in the SE group experienced no
Significant change in either body weight or body
composition.
Post-treatment values of % BF and % LBM for the EX
group were significantly lower and higher, respectively,
than the corresponding values for either the SE or NE
groups. This corresponded to the greater changes observed
in these variables for the EX group |-2.8% BF, +2.8% LBM,
which resulted in 3.7 kg BF lost and left the total LBM
essentially unchanged (-.1 kg)], compared to either the SE
152

group (-1.8% BF, +1.9% LBM, or 1.8 kg BF lost and 1.0 kg LBM
gained), or the NE group (-1.9% BF, +1.9% LBM, or 2.4 kg BF
lost and .9 Kg LBM gained).
For the total group of 50 subjects, there was a
significant positive correlation between the change in body
weight and the change in body fat (r = .35). There was a
similar correlation among those who consistently attended
nutrition classes (NU) (r = .33, p < .05), while this
correlation was much stronger for those who consistently
participated in exercise (EX) (r = .69).
Significant reductions in plasma TC, HDL-C, HDL,-C and
insulin were observed for all subjects. Within nutrition
groups, there was a significant decrease in plasma TC (22.5
mg/di) for the SN group, which was accompanied by
significant declines in both plasma HDL-C (7.1 mg/di) and
HDL.-C (8.3 mg/d1). The NU group experienced no significant
decline in plasma TC, yet there was a significant decline in
plasma HDL-C (2.9 mg/d1i). However, post-treatment values of
both plasma HDL-C and HDL,-C for the NU group (46.3 and 23.9
mg/d1i, respectively) were significantly higher than those
for the SE group (42.5 and 19.3 mg/dl, respectively). Both
groups experienced significant declines in fasting plasma
insulin, white plasma TG values decreased significantly only
in the NU group.
Within exercise groups, only the SE group experienced a
significant decline in plasma TC (18.6 mg/dl). Significant
153

declines in both plasma HDL-C and HDL,-C were observed in
both the SE and NE groups, while no significant change in
either of these variables occurred in the group that
exercised consistently. This suggested that more consistent
exercise may preserve plasma HDL-C and HDL,-C levels,
although this may be concomitant to the absence of a
decrease in plasma TC. Similarily, no significant changes
occurred in the TC/HDL-C ratio for any exercise group, yet
the EX group was the only one for which a (non-significant)
decrease occurred, white the levels for the SE and NE groups
went up (NS). No signficant changes were seen for any
exercise group in LDL-C, suggesting that during exercise,
more of the variability in plasma TC is due to changes in
the plasma HDL-C subfraction. However, both groups of
exercising subjects experienced non-significant declines in
LDL-C, while the NE group underwent a (non-significant)
increase in this parameter. The declines in TG were not
significant for any exercise group. The pre-treatment
insulin value for the NE group was significantly higher than
that for the EX group, which likely was related to the
higher initial body weight in the NE group. Significant
(absolute) declines in fasting plasma insulin occurred for
both the EX and NE groups, while no change occurred for the
SE group.
For the group of 50 subjects, as well as the No
Exercise group, there was a significant correlation between
154

the changes in plasma HDL-C and its HDL2.C component. There
were also signficant correlations for initial levets of
various ltipoprotein-cholesterol, TG, and/or insulin with
their respective subsequent changes, for all groups of
subjects. For both the SN group, and the NE group, there
was a significant correlation between the change in body
weight and the change in TG (r = .56, r= .43,
respectively).
For all subjects, a significant reduction of 580 kcal
per day was reported. This was accompanied by significant
declines in all three macronutrients; carbohydrate, protein,
and total fat as well as all three types of fat: saturated,
polyunsaturated, and monounsaturated. Significant declines
in dietary cholesterol and sugar, as well as a significant
increase in the percentage of calories derived from protein
were also reported. Compared to the SN group, the NU group
at pre-treatment consumed significantly less dietary
cholesterol (112.0 mg) per day, and significantly reduced
their intake of dietary sugar and the percentage of calories
derived from fat. Compared to both the EX and NE groups,
the SE group did not significantly reduce its intake of
either total or saturated fat.
Significant correlations between changes in nutrient
intake components and changes in body composition for the
group of 50 subjects included a rather weak relationship of
r = .32 for dietary fat and body fat. The changes in
155

caloric intake, sugar, and sucrose were all significantly
correlated with the change in body weight (r = .30, .36, and
.32, respectively).
Correlations (p < .05) between the change in nutrient
intake components and the change in plasma variables
included negative correlations for both carbohydrate and
pectin with the TC/HDL-C ratio (r = -.33, -.35,
respectively), and a positive correlation for the per cent
of kcal as carbohydrate with plasma TG (r = .36). There
were positive correlations between the change in total kcal
and the change in plasma insulin (r = .51), and between the
change in dietary saturated fat and the change in plasma
insulin (r = .48). Negative correlations existed for both
the changes in polyunsaturated fat and the P/S ratio with
the change in plasma TC (r = -.29 and -.30, respectively).
Many obese persons have made several attempts at weight
loss. The majority of programs for this purpose have
typically focused on one, or perhaps two, treatment methods.
Such programs have often been concomitant to high attrition
rates and minimal-to-moderate weight losses, while the
regaining of weight has been a major drawback to their use.
In this study, 98 subjects began the intervention program;
65 of these began the exercise sessions. 50 subjects
completed the six-month intervention program; 28 of these
subjects had participated in more than 30% of the exercise
sessions, while only 12 had participated in more than 70%.
156

Thus, the overall attrition rate was nearly 50%, and the
exercise attrition rate 57%. These values are within the
ranges reported by previous investigators.
Few reports of weight loss programs for obese
individuals have considered the degree of individual
participation on weight loss outcomes. Fewer have
considered the level of motivation or psychosocial
characteristics of the subjects and how these relate to the
level of participation. Furthermore, psychosocial, ethnic,
or cultural characteristics which may impinge upon weight
loss nave frequently not been considered. In this study,
although there were no statistically significant differences
among pre-treatment body weight mean values, the pre-
treatment weight of the NE group was considerably higher
than either the EX or the SE group (differences of 10.9 and
12.2 kg, respectively). Furthermore, the pre-treatment
insulin value of the NE group (32.4 ulIU/ml) was
significantly higher than that of the EX group (18.9
ulU/m1), while the value for the SE group (18.7 uIU/ml) was
Similar to that of the EX group. This suggested that some
degree of self-selection may be have been operable in this
study. That is, the heaviest subjects, which were those
with the highest insulin levels, and therefore those most in
need of exercise for the promotion of decreased insulin and
body weight values, were the same subjects who failed to
attend 30% or more of exercise sessions. Perhaps the larger
157

size of these women contributed to a greater negative self-
image, and thus the decision not to participate in organized
exercise. As was observed with several subjects who did not
complete the study, a larger body size presented a physical
hindrance to movements required for land-based exercise.
For some of these same women who also lacked personal
transportation, their physical size presented a further
hindrance to the use of public transportation.
Although it was not measured, it appeared that there
were differences in motivation among groups of subjects.
Those who consistently attended exercise and/or nutrition
classes appeared outwardly motivated. Those who attended
exercise or nutrition less consistently seemed not to be as
strongly motivated. There was an expectation among these
latter individuals that the program would accomplish their
weight loss goals, without their having to work too hard
themselves.
A factor in this study which appeared to impinge upon
an individual’s attitude and motivation, and thus the
subsequent success or failure of weight loss, was the degree
of support from family or friends. Several women who
experienced particularly successful weight loss outcomes had
become friends, and frequently talked and provided
encouragement to each other during the exercise sessions,
and exchanged information gained during nutrition classes.
Several women reported making beneficial changes in the
158

diets of their families, and that the support of their
families or spouses helped them to maintain suggested
dietary changes. On the other hand, some women reported a
lack of acceptance by their families to recommended dietary
changes, white a few women reported rather strong negative
attitudes by their husbands to their weight loss efforts.
Single women sometimes reported that eating alone, as well
as their busy schedules, often contributed to unhealthy food
choices.
This study was conducted in an area of the state known
as Southside, Virginia. The pork industry has long been a
large part of the economy of this region, and many subjects
reported that pork and pork products have been an integral
part of their diet for generations. Thus, a high intake of
fat and saturated fat was typical for many subjects, while
efforts to decrease these levels in the diet were reported
to be difficult for many subjects.
Although difficult to measure or control, attempts
should be made in future weight loss programs to identify
attitudes, customs, and social or psychological factors,
which may be specific within an ethnically or culturally
defined population, that may impinge upon an individual’s
motivation, attitude, and/or subsequent success in a
comprehensive weight loss program.
159

References
1. Barsky AJ. The paradox of health. New Engl] J Med
1988;318:414-8.
2. Larkin JE, Pines HA. No fat persons need apply.
Sociology of Work and Occupations 1979;6:312-27.
3. Wadden TA, Stunkard AJ. Social and psychological
consequences of obesity. Ann Intern Med 1985;103(6 pt
2):1062-7.
4. Giltum RF. Overweight and obesity in black women: A review of published data from the National Center for Health
Statistics. J Natl Med Assoc 1987;79(8):865-71.
5. U.S. Department of Health and Human Services and
Agriculture. Nutrition Monitoring in the United States,
Washington, DC: U.S. Government Printing Office, 1986.
(DHHS publ no Lphsj 86-1255).
6. Van Itallie TB. Health implications of overweight and
obesity in the United States. Ann Intern Med 1985;103(6 pt
2):983-8.
7. Keys A, Fidanza F, Karvonen MJ, Kimyra N, Taylor HL.
Indices of relative wieght and obesity. J Chronic Dis 1972;25:329-43.
8. Stunkard AJ. The Salmon lecture. Some perspectives on
human obesity: its causes. Bull N Y Acad Med 1988;64(8):902-
23.
9. Allon N. The stigma of overweight in everyday life. In:
Wolman B (ed.)}. Psychological aspects of obesity: A
handbook. New York: Van Nostrand Reinhold Co. ;1982:130-74.
10. Wooley SC, Wooley OW. Obesity and women: I. A closer
look at the facts. Women’s Studies Int Quart 1979;2:69-79.
11. Wooley SC, Wooley OW, Dyrenforth SR. Obesity and women:
II. A neglected feminist topic. Women’s Studies Int Quart
1979;21:81-92.
12. Daniel EL. A multi-intervention weight management
program for low-income rural women. J Am Diet Assoc
1989;89(9):1310-11.
160
13. Fardan L, Tyson Y. DREW program for obesity treatment. J Natl Med Assoc 1985;77(9):737-41.
14. Sullivan J, Carter JP. A nutrition-physical fitness
intervention program for low-income black parents. J Natl
Med Assoc 1985;77(1):39-43.
15. Kannel WB, Gordon T, Castelli WP. Obesity, lipids and
glucose intolerance: The Framingham Study. Am J Clin Nutr 1979;32:1238-45.
16. Berry EM, Hirsch J, Most J, Thornton J. The role of
dietary fat in human obesity. Int J Obes 1986;10:123-31.
17. Berchtold P, Berger M, Jorgens V, Daweke C, Chantelau E, Gries FA, Zimmerman H. Cardiovascular risk factors and
HDL-cholesterol levels in obesity. Int J Obes 1981;5:1-10.
Y18. Foster CJ, Weinsier RL, Birch R, Norris DJ, Bernstein RS, Wang J, Pierson RN, Van Itallie TB. Obesity and serum
lipids: an evaluation of the relative contribution of body fat and fat distribution to lipid levels. Int J Obes
1987;11:151-61.
19. Report of the Hypertension task force: 1979 Vol 9,
Washington DC. US Dept of Health, Education and Welfare. NIH
publication no. 79-1631:59-77
20. Sawata S, Sato R, Hidaka H, Yasuda H, Tomomatsu K, Oka
H. Retationship between alcohol consumption, body weight,
family history of hypertension and blood pressure in young
adults. Clin Exp Hyperten. Part A, theory and practice
1986;A8(1):21-35.
21. Hubert HB, Feinleib N, McNamara P, Castelli W. Obesity as an independent risk factor for cardiovascular disease: a
26-year follow-up of participants in the Framingham Heart Study. Circulation 1983;67(5):968-77.
22. Gillum RF. The epidemiology of coronary heart disease
in blacks. J Natl Med Assoc 1985;77(4):281-4.
23. LLeaverton PE, Feinleib M, Thom T. Coronary heart
disease mortality rates in United States blacks, 1968-1978: Interstate variation. Am Heart J 1984;108:732-7.
24. Garfinkel L. Overweight and cancer. Ann Intern Med
1985;103(6 pt 2):1034-6.
25. Kral JG. Morbid obesity and related health risks. Ann
Intern Med 1985;103(6 pt 2):1043-7.
161

26. Bray GA. Complications of obesity. Ann Intern Med
1985;103(6pt 2):1052-62.
27. Lew EA, Garfinkel L. Variations in mortality by weight among 750,000 men and women. J Chronic Dis 1979;32:563-7.
28. Feinleib M. Epidemiology of obesity in relation to
health hazards. Ann Intern Med 1985;103(6 pt 2):1019-24.
29. Bray GA. Obesity: basic considerations and clinical
approaches. Disease-a-month 1989;18(7):449-540 (p. 476).
30. Kissebah AH, Freedman DS, Peiris AN. Health risks of
obesity. Med Clin North Am 1989;73(1):111-38.
31. Bray GA, Gray DS. Obesity. Part I -Pathogenesis. West J
Med 1988;149:429-41.
32. National Institutes of Health. Consensus conference
statement. Health implications of obesity. Ann Intern Med 1985;103(6 pt 2):1073-7.
33. Blackburn GL, Kanders BS. Medical evaluation and
treatment of the obese patient. Am J Cardiol 1987;60:55G-
58G.
34. Castelli WP, Doyle JT, Gordon T, Hames CC, Hjortland
MC, Hulley SB, Kagan A, Zukel WJ. HDL-cholesterol and other
lipids in coronary heart disease: the cooperative
Tipoprotein phenotyping study. Circulation 1977;55:767-72.
35. Hubert HB, Castelli WP, Garrison RJ. Longitudinal study
of coronary heart disease risk factors in young adults: the
Framingham offspring study. Am J Epidemiol 1983;118:443.
36. Glueck CJ, Gordon DJ, Nelson JJ, Davis CE, Tyroler HA.
Dietary and other correlates of changes in total and low
density lipoprotein cholesterol in hypercholesterolimic men: the lipid research clinics coronary primary prevention
trial. Am J Clin Nutr 1986;44:489-500.
37. Ashley FW, Kannel WB. Relation of weight change to
changes in atherogenic traits: The Framingham study. J
Chronic Dis 1974;27:103-14.
38. Bray GA. Classification and evaluation of the
obesities. Med Clin North Am 1989;73(1):161-84.
29. Baecke JAH, Van Staveren WA, Burema J. Food
consumption, habitual activity, and body fatness in young
Dutch adults. Am J Clin Nutr 1983;37:278-86.
162
40. Spitzer L, Rodin J. Human eating behaviour: a critical
review of studies in normal weight and overweight
individuals. Appetite 1981;2:292-330.
41. Bradiey PJ. Food intake in the obese. Int J Obes
1983;7:287-8.
42. Rolland-Cachera MF, Bellisle F. No correlation between
adiposity and food intake: why are working class children fatter? Am J Clin Nutr 1986;44:779-87.
43. Romieu I, Willett WC, Stampfer MJ, Colditz GA, Sampson
L, Rosner B, Hennekens CH, Speizer FE. Energy intake and
other determinants of relative weight. Am J Clin Nutr 1988:47:406-12.
44. National Center for Health Statistics. Dietary intake findings, United States, 1971-1974. Vital and health
statistics, series 11, no. 202. DHEW publication (HRA) 77- 1647. Government printing office, 1977.
45. Brownell KD, Stunkard AJ, Albaum JM. Evaluation and
modification of exercise patterns in the natural
environment. Am J Psychiatry 1980;137:1540-5.
46. Deitz WH, Gortmaker SL. Do we fatten our children at
the television set? Obesity and television viewing in children and adolescents. Pediatrics 1985;75:807-12.
47. Bray GA. The energetics of obesity. Med Sci Sports Ex 1983;15:32-40.
48. James WPT, Davies HL, Bailes J, Dauncey MJ. Elevated
metabolic rates in obesity. Lancet 1978;1:1122-5.
49. Bray GA, Gray DS. Obesity. Part II -Treatment. West J
Med 1988;149:555-71.
50. Stunkard A, McLaren-Hume M. The results of treatment of
obesity. Arch Intern Med 1959;103:79-85.
51. Wing RR, Jeffery RW. Outpatient treatments of obesity:
A comparison of methodological and clinical results. Int J
Obes 1979;3:261-79.
52. Holmes MD, Zysow B, Delbanco TL. An analytic review of
current therapies for obesity. J Fam Pract 1989;28(5):610-
6.
53. Lerman RH, Cave DR. Medical and surgical management of
obesity. Adv Intern Med 1989;34:127-64.
163

54. Miller PM, Sims KL. Evaluation and component analysis
of a comprehensive weight control program. Int J Obes
1981;5:57-66.
55. Sims EAH. Storage and expenditure of energy in obesity
and their implications for management. Med Clin North Am
1989;73(1):97-110.
56. Stunkard AJ. Conservative treatments for obesity. Am J
Clin Nutr 1987;45:1142-54.
57. Malcolm R, Von JM, O’neil PM, Curey HS, Sexauer JD,
Riddie E. Update on the management of obesity. Southern Med
J 1988;81(5):632-9.
58. Jequier E. Panel summary statements. Energy, obesity,
and body weight standards. Am J Clin Nutr 1987;45:1035-47.
59. Council on Scientific Affairs. Council report.
Treatment of obesity in adults. JAMA 1988;260(17):2547-51.
60. Weinsier RL, Wadden TA, Ritenbaugh C, Harrison GG,
Johnson FS, Wilmore JH. Recommended therapeutic guidelines
for professional weight control programs. Am J Clin Nutr
1984;40:865-72.
61. Stevens VJ, Rossner J, Greenlick M, Stevens M, Frankel
HM, Craddick S. Freedom from fat: A contemporary multi-
component weight loss program for the general population of
cbese adults. J Am Diet Assoc 1989;89(9):1254-8.
62. Bjorntorp P. Morphological classifications of obesity: What they tell us, what they don’t. Int J Obes 1984;8:525-
32.
63. Bjorntorp P. Regional patterns of fat distribution. Ann
Intern Med 1985;103(6 pt 2):994-5
64. Clarys JP, Martin AD, Drinkwater DT. Gross tissue
weights in the human body ny cadaver dissection. Hum Biol
1984;56:459-72.
65. Lukaski HC. Methods for the assessment of human body
composition: traditional and new. Am J Clin Nutr 1987;46:537-56.
66. Jackson AS, Pollock ML. Factor analysis and
multivariate scaling of anthropometric variables for the
assessment of body composition. Med Sci Sports 1976;8:196-
203.
164
67.Pace N, Rathburn EN. Studies on body composition. III The
body water and chemically combined nitrogen content in
relation to fat content. J Biol Chem 1945;158:685-91.
68. Biocelectrical Sciences. BES 200Z Manual. 5580 La Jolla
Bivd., Suite 417, La Jolla, CA. 92037.
69.Miles DS, Stevens AG. Body composition measured by
bicelectrical impedance and hydrostatic weighing. Med Sci
Sports Ex 1985;17(2):272-3.
70.Kushner RF, Schoeller DA, Bowman BB. Comparison of total
body water determination by bioelectrical impedance
analysis, anthropometry, and deuterium-dilution. Am J Clin
Nutr 1984;39(4):lLabstrJ658.
71. Segal KR, Gutin B, Presta E, Wang J, Van Itallie TB. stimation of human body composition by electrical impedance
methods: a comparative study. J Appl Physiol 1985;58(5):1565-71.
72. Lawlor MR, Crisman RP, Hodgdon JA. Bioelectrical
impedance analysis as a method to assess body composition.
Med Sci Sports Ex 1985;17(2):Labstr]J 271-2.
73. Kushner RF, Schoeller DA. Estimation of total body
water by bioelectrical impedance analysis. Am J Clin Nutr
1986 ;44:417-24.,
74.Keller B, Katch FI. Validity of bioelectrical resistive
impedance for estimation of body fat in lean males. Med Sci
Sports Ex 1985;17(2):271-2.
75.Solomons NW. How valid are bioelectric impedance
measurements in body composition studies? Am J Clin Nutr
1986;44:306-7.
76. Hoffer EC, Meador CK, Simpson DC. Correlation of whole- body impedance with total body volume. J Appl Physiol
1969;27:531-4.
77.Lukaski HC. Lukaski HC, Bolonchuk WW, Hall CB, Siders WA. Validation of tetrapolar bioelectrical impedance method to
assess human body composition. J Appl Physiol
1986;60(4):1327-32.
78. Segal KR, Van Loan M, Fitzgerald PI, Hodgdon JA, Van
Itallie TB. Lean body mass estimation by bioelectrical impedance analysis: a four-site cross-validation study. Am J
Clin Nutr 1988;47:7-14.
165

793. Khaled MA, McCutcheon MJ, Reddy S, Pearman PL, Hunter
GR, Weinsier RL. Electrical impedance in assessing human
body composition: the BIA method. Am J Clin Nutr
1988;47:789-92.
80. Lukaski HC, Johnson PE, Bolonchuk WW, Lykken GI, Sandstead HH. Assessment of fat-free mass using
bioelectrical impedance measurements of the human body. Am J
Clin Nutr 1985;41:810-7.
81. Katch FI, Solomon RT, Shayevitz M, Shayevitz B. Validity of bioelectrical impedance to estimate body
composition in cardiac and pulmonary patients. Am J Clin
Nutr 1986;43:972-3.
82. Bouchard C. Genetic factors in obesity. Med Clin North
Am 1989;73(1):67-81.
83. Beaudoin R, Mayer J. Food intakes of obese and non- obese women. J Am Diet Assoc 1953;29:29-83.
84. Bray GA, Zachary B, Dahms WT, Atkinson RL, Oddie TH.
Eating patterns of the massively obese individual J Am Diet
Assoc 1978;72:24-7.
85. Sims EAH. Experimental obesity, dietary induced
thermogenesis and their clinical implications. Clinics Endocrinol Metab 1976;5:377-95.
86. Forbes GB, Brown MR, Welle SL, Lipinski BA. Deliberate
overfeeding in women and men. Energy cost and composition of
the weight gain. Br J Nutr 1986;56:1-9.
87. Bennet W. Dietary treatments of obesity. Ann N Y Acad
Sci 1987;499:250-63.
88. Schemmel R, Michelson O, Molawi P. Conversion of
dietary to body energy in rats as affected by strains, sex,
and ration. J Nutr 1972;102:1187-97.
89. Kanarek RB, Hirsch E. Dietary-induced overeating in experimental animals. Fed Proc 1977;36:154-8.
SO. Garrow JS. Energy balance and obesity in man. Second
edition. New York, Elsevier/North Holland, 1978
91. Fabry P, Hejl Z, Fodor J, Braun T, Zvolanko K. The frequency of meals: Its relationship to overweight,
hypercholesterolemia, and decreased glucose tolerance.
lancet 1964;2:614-5.
166

92. Stunkard AJ, Kaplan D. Eating in public places: A
review of reports of the direct observation of eating
behavior. Int J Obes 1977;1:89-101.
93. Bray GA. Lipogenesis in human adipose tissue: Some
effects of nibbling and gorging. J Clin Invest 1972;51:537- 48.
$4. LeBlanc J, Diamond P. Effect of meal size and frequency on postprandial thermogenesis in dogs. Am J Physiol
1986;250:E144-E147,
95. Young CM, Hutter LF, Scanlan SS. Metabolic effects of
meal frequency in normal young men. J Am Diet Assoc
1972;61:391-8.
96. strup A. Reduced-enersgy expedniture contributes to
obesity in predisposed individuals: implications for
treatment with thermogenic agents. J Ob Wt Reg 1987;6(1):3- 20.
97. Garrow JS. Energy balance in man -an overview. Am J Clin Nutr 1987;45:1114-9.
98. Schutz Y, Bessard T, Jequier E. Diet-induced
thermogenesis measured over a whole day in obese and non
obese women. Am J Clin Nutr 1984:40:542-52.
99. Bogardus C, Lillioja S$, Ravussin E, Abbott W, Zawadski JK, Young A, Knowler WC, Jacobowitz R, Moll PP. Familial dependence of the resting metabolic rate. New Engl J Med
1986;315:96-100.
100. Ravussin E, Lillioja S, Knowler WC, Christin L, Freymond D, Abbott WGH, Boyce V, Howard BY, Bogardus C.
Reduced rate of energy expenditure as a risk for body weight gain. New Eng! J Med 1988;318:467-72.
101. James WPT, Trayhurn P. Thermogenesis and obesity. Br
Med Bull 1981;37:43-8.
102. Benedict FG, Miles WR, Roth P, Smith M. Human vitality
and efficiency under prolonged restricted diet. Washington,
DC: Carnegie Institution, 1919 (Publication 280).
103. Keys A, Brozek J, Henschel A. The biology of human
starvation. Minneapolis, University of Minneapolis Press,
1950.
104. Bray GA. Effect of caloric restriction on energy expenditure in obese patients. Lancet 1969;2:397-8.
167

105. Leibel RL, Hirsch J. Diminished energy requirements in reduced-obese patients. Metabolism 1984;33:164-70.
106. deBoer JO, van Es AJH, Roovers LA, van Raaij JMA,
Hautvast JGAJ. Adaptation of energy metabolism of overweight
women to low-energy intake studied with whole body calorimeters. Am J Clin Nutr 1986;44:585-95.
107. Geissler CA, Miller DS, Shah M. The daily metabolic
rate of the post-obese and the lean. Am J Clin Nutr 1987;45:914-20.
108. Felber JP, Meyer HV, Curchod B, Iselin HU, Rouselle J, Maeder E, Pahud P, Jequier E. Glucose storgae and oxidation in different degrees of human obesity measured by indirect calorimetry. Diabetologia 1981;20:39-44.
109. Golay A, Schutz Y, Meyer HU, Thiebaud D, Curchod B, Maeder £—, Felber JP, Jequier E—. Glucose-induced
thermogenesis in nondiabetic and diabetic obese subjects.
Diabetes 1982;31:1023-8.
110. Segal KR, Gutin 8B. Thermic effects of food and
exercise in lean and obese women. Metabolism 1983;32:581-9.
111. Astrup, Andersen, Christensen et al. Abstracts 5th Int
Congress on Obesity Jerusalem 33:1986.
112. Bessard T, Schutz Y, Jequier E. Energy expenditure and postprandial thermogenesis in obese women before and after
weight loss. Am J Clin Nutr 1983;38:680-93.
113. Schutz Y, Golay A, Felber J-P, Jequier E. Decreased
glucose-induced thermogenesis after weight loss in obese
subjects: a predisposing factor for relapse of obesity? Am J
Clin Nutr 1984;39:380-7.
114. Dolloo AG, Miller DS. The thermogenic properties of
ephedrine/methy lxanthine mixtures: human studies. Int J Obes
1986;10:467-81.
115. Chirico AM, Stunkard AJ. Physical activity and human obesity. New Engl J Med 1960;263;935-40.
116. Bullen BA, Reed RB, Mayer J. Physical activity of
obese and nonobese adolescent girls appraised by motion
picture sampling. Am J Clin Nutr 1964;14:211-23.
117. Thompson JK, Jarvie GJ, Lahey BB. Exercise and
obesity: etiology, physiology and intervention. Psychol Bull
1982;91:55-79.
168

118. Devlin JT, Horton ES. Potentiation of the thermic
effect of insulin by exercise: differences between lean,
obese, and noninsulin-dependent diabetic men. Am J Clin Nutr
1986;43:884-930.
119. Segal KR, Pi-Sunyer FX. Exercise and obesity. Med Clin
North Am 1989;73(1):217-36.
120. Poehliman ET, Tremblay A, Despres J-P, Fontaine E, Perusse L, Theriault G, Bouchard C. Genotype-controlled
changes in body composition and fat morphology following overfeeding in twins. Am J Clin Nutr 1986;43:723-31.
121. Price RA, Cadoret RJ, Stunkard AJ, Troughton E. Genetic contributions to human fatness: an adoption study.
Am J Psychiatry 1987;144:1003-8.
122. Stunkard AJ, Sorensen TIA, Harris C, Teasdale TW, Chakraborty R, Schull WJ, Schulsinger F. An adoption study
of human obesity. New Engl J Med 1986;314:193-8.
123. Bouchard C, Perusse L, LeBlanc C, Tremblay A,
Theriault G. Inheritance of the amount and distribution of
human body fat. Int J Obes 1988;12:205-15.
124. Sorensen TIA, Price RA, Stunkard AJ, Schulsinger F. Genetics of obesity in adult adotees and their biological siblings. Br Med J 1989;298(6666):87-90.
125. Stunkard AJ, Foch TT, Hurbec Z. A twin study of human
obestiy. JAMA 1986;256:51-4.
126. Borjeson M. The aetiology of obesity in children. Acta
Paediatr Scand 1976;65:279-87.
127. Medlund P, Cederlof R, Floderus-~Myrhed B, Friberg L, Sorensen S. A new Swedish twin registry. Acta Med Scand 1976; (Supp1)600:5-107.
128. Bouchard C, Tremblay A, Despres J, Theriaul G, Nadeau
A, Lupien P, Dussault J, Moorjani S. Role of the genotype in
adaptation to long-term overfeeding. FASEB J
1988;2(4):Labstr]J A630.
129. Perusse L, Tremblay A, LeBlanc C, Bouchard C. Genetic
and environmental influences on level of habitual physical
activity and exercise participation. Am J Epidemiol
1989;129(5):1012-22.
130. Perusse L, Tremblay A, LeBlanc C, Cloninger CR, Reich
T, Rice J, Bouchard C. Familial resemblance in energy
169

intake: contribution of genetic and environmental factors. Am J Clin Nutr 1988;47:629-35.,
131. Stamler J, Farinaro —E, Mojonnier LM, Hall Y, Moss D,
Stamier R. Prevention and control of hypertension by nutritional-hygienic means -Long-term experience of the
Chicago Coronary Prevention Evaluation Program. JAMA
1980;243:1819-23.
132. Hall A, Stewart R. Obesity: time for sanity and humanity. New Z Med J 1989;102:134-6.
133. Atkinson RL. Low and very low calorie diets. Med Clin
North Am 1989;73(1);203-15.
134. Brownell KD, Kramer M. Behavioral management of
obesity. Med Clin North Am 1989;73(1):185-201.
135. Fester CB, Nurnberger JI, Levitt EE. The control of
eating. J Mathetics 1962;1:87-109.
136. Stuart RB. A three-dimensional program for the treatment of obesity. Behav Res Ther 1971;9:177-86.
137. Paulsen BK. Lifesteps: weight management program: A response from a behavioral perspective. J Am Diet Assoc 1987; ( Supp] )9:833-S35.
138. Brownell KD, Jeffery RW. Improving long-term weight loss: Pushing the limits of treatment. Behav Ther
1987;18:353-74.
139. Lavery MA, Loewy, JW, Kapadia AS, Nichaman MZ, Foreyt
JP, Gee M. Long-term follow-up of weight status of subjects in a behavioral weight control program. J Am Diet Assoc
1989;89(9):1259-64.
140. Kramer FM, Jeffery RW, Forster JL, Snel? MK. Long- term follow-up of behavioral treatment for obesity: patterns of weight regain among men and women. Int J Obes
1989;13:123-36.
141. Brownell KD, Marlatt GA, Lichtenstein —E, Wilson GT.
Understanding and preventing relapse. Am Psychol
1986;41:765-82.
142. Marlatt GA, Gordon JR (eds). Relapse prevention: maintenance strategies in addictive behavior. New York,
Guilford Press 1985.
170

143. Schliundt DG, Sbrocco T, Bell C. Identification of high-risk situations in a behavioral weight loss program:
application of the relapse prevention model. Int J Obes 198913:223-34.
144. Peri MG, Nezu AM, Patti ET, McCann KL. Effect of
length of treatment on weight loss. J Consult Clin Psychol 1989;57(3):450-2.
145. Adams SO, Grady KE, Wolk CH, Mukaida C. Weight loss: a comparison of group and individual interventions. J Am Diet
Assoc 1986;86:485-90.
146. Blackburn G, Kanders B, Brownell K, Wilson T, Alder J, Stein L, Greenber I. The effect of weight cycling(wc) on the rate of weight toss in man. Int J Obes 1987;11:labstr] 448A.
147. Stunkard AJ. Bull N Y Acad Med 1988;64(8):924-40.
148. Leon AS, Conrad J, Hunninghake DB, Serfass R. Effects
of a vigorous walking program on body composition and carbohydrate and lipid metabolism of obese young men. Am J
Clin Nutr 1979;33:1776-87.
149. Gwinup G. Effect of exercise alone on the weight of
obese women. Arch Intern Med 1975;135:676-80.
150. Bjorntorp P. Exercise in the treatment of obesity. Clinics Endocrinol Metab 1976;5:431-53.
151. Bjorntorp P, DeJounge K, Sjostrom L, Sullivan L. The effect of physical training on insulin production in
obesity. Metab Clin Exp 1970;19:631-8.
152. Dahlkoetter JA, Callahan EJ, Linton J. Obesity and the
unbalanced energy equation: Exercise versus eating habit
change. J Consult Clin Psychol 1979;47:898-905.
153. Marston AR, Criss J. Maintenance of successful weight
loss: incidence and prediction. Int J Obes 1984;8:435-9.
154. Pi-Sunyer FX. Exercise effects on calorie intake. Ann
N Y Acad Sci 1987;499:94-103.
155. Koivisto VA, Yki-Jarvinen H, DeFronzo RA. Physica} training and insulin sensitivity. Diabetes/Metab Reviews
1986;1(4):445-81.
156. Peltonen P, Marniemi J, Hietanen E, Vuori I, Ehnolm C. Changes in serum lipids, lipoproteins, and heparin
releasable lipolytic enzymes during moderate physical
171

training in man: a longitudinal study. Metabolism 1981;30:518-26.
157. Sutherland WHF, Woodhouse SP. Physical activity and
plasma lipoprotein lipid concentrations in men.
Atherosclerosis 1980;37:285-92.
158. Sedlock DA, Melby CL, Hyner GC, Corrigan DL, Duda JL.
Effects of a comprehensive weight loss program on body
composition, blood lipids, nutritional intake and urinary
Ketone excretion. J Obes Wt Reg 1988;7(1):34-42.
159. Sheldah!] LM. Special ergometric techniques and weight
reduction. Med Sci Sports Ex 1985;18(1):25-30.
160. American College of Sports Medicine. Guidelines for
exercise testing and prescription. Third ed. Lea & Febiger.
Philadelphia, 1986.
161. Pollock ML. How much exercise is enough? Phys Sports
Med 1978;6:50-64.
162. Shoenfeld Y, Keren G, Shimoni T, Birnfeld C, Sohar E. Walking. A method for rapid improvement of physical fitness.
JAMA 1980;243(20):2062-3.
163. Pollock ML, Miller HS, Janeway R, Linnerud AC, Robertson B, Valentino R. Effects of walking on body
composition and cardiovascular function of middle-aged men.
J Appl Physiol 1971;30(1):126-30.
164. Lewis S, Haskell WL, Wood PD, Manoogian N, Bailey JA,
Pereira M. Effects of physical activity on weight reduction in obese middle-aged women. Am J Clin Nutr 1976;29:151-6.
165. Kenrick M. Exercise and weight reduction in obesity.
Arch Phys Med Rehab 1972;53:323-7.
166. Moody DL, Kollias J, Buskirk ER. The effect of a moderate exercise program on body weight and skinfold
thickness in overweight college women. Med Sci Sports 1969;1(2):75-80.
167. Sikand G, Kondo A, Foreyt J, Jones PH, Gotto AM. Two-
year follow-up of patients treated with a very-low-calorie
diet and exercise training. J Am Diet Assoc 1988;4:487-88.
168. Sorensen J. Jackie’s aerobic dancing. Dallas: Scott,
Foresman and Co. Dallas, 1972.
172
169. Koszuta LE. Low-impact aerobics: Better than traditional aerobic dance? Phys Sports Med 1986;14(7):156-
61.
170. Eickhoff J, Thorland W, Ansorge C. Selected physiological and psychological effects of aerobic dancing
among young adult women. J Sports Med Phys Fitness 1983;23:273-80.
171. Rockefeller KA, Burke EJ. Psycho-physiological analysis of an aerobic dance programme for women. Br J
Sports Med 1979;:13:77-80.
172. Cearly ML, Moffatt JR, Knutzen KM. The effects of two-
and three-day-per-week aerobic dance programs on maximal oxygen uptake. Res Quarterly Ex Sport 1984; 55(2):172-4.
173. Blessing DL, Wilson GD, Puckett JR, Ford HT. The physiologic effects of eight weeks of aerobic dance with and
without hand-held weights. Am J Sports Med 1987;15(5):508- 10.
174. Vaccaro P, Clinton M. The effects of aerobic dance conditioning on the body composition and maximal oxygen
uptake of college women. J Sports Med Phys Fitness 1981;21:291-4.
175. Dowdy DB, Cureton KJ, DuVal HP, Ouzts HG. Effects of aerobic dance on physical work capacity, cardiovascular function and body composition of middle-aged women. Res
Quarterly Ex Sport 1985;56(3):227-33.
176. Pollock ML, Foster C, Salisbury R, Smith R. Effects of
a YMCA starter fitness program. Phys Sports Med
1982;10(1):89-100.
177. Milburn S, Butts NK. A comparison of the training
responses to aerobic dance and jogging in college females.
Med Sci Sports Ex 1983;15(6):510-13.
178. Zuti WB, Golding LA. Comparing diet and exercise as weight reduction tools. Phys Sports Med 1976;4:49-53.
179. Epstein LH, Wing RR. Aerobic exercise and weight. Addictive Behaviors 1980;5:371-88.
180. Smith DP, Stransky FW. The effect of training and detraining on the body composition and cardiovascular response of young women to exercise. J Sports Med 1976;16:112-20.
173

181. Gwinup G. Weight loss without dietary restriction:
Efficiency of different forms of aerobic exercise. Am J
Sports Med 1987;15(3):275-9.
182. Lennon D, Nagle F, Stratman F, Shrago E, Dennis S.
Diet and exercise training effects on resting metabolic
rate. Int J Obes 1985;9:39-47.
183. Wirth A, Vogel I, Schomig A, Schlierf G. Metabolic
effects and body fat mass changes in obese subjects on a very-low-calorie diet with and without physical training.
Ann Nutr Metab 1987;31:378-86.
184, Walberg JL, Reed CE, Hinkle DE. The effects of light versus moderate exercise added to diet control in a weight
reduction program for overweight college women. Med Sci Sports Ex 1984;16(1):135.
185. Sopko G, Leon AS, Jacobs DR, Foster N, Moy J, Kubak,
Anderson JT, Casal D, McNally C, Frantz I. The effects of
exercise and weight loss on plasma lipids in young obese
men. Metabolism 1985;34(3):227-36.
186. Belko AZ, VanLoan M, Barbieri TF, Mayclin P. Int J
Obes 1987;11:93-104
187. Konstantin NP, Steffee WP, Lerman RH, Burrows BA.
Effects of dieting and exercise on lean body mass, oxygen
uptake, and strength. Med Sci Sports Ex 1985;17(4):466-71.
188. Hill JO, Sparling PB, Shields TW, Heller PA. Effects
of exercise and food restriction on body composition and
metabolic rate in obese women. Am J Clin Nutr 1987;46:622-
30.
189. Henson LC, Poote DC, Donahoe CP, Heber D. Effects of exercise training on resting energy expenditure during caloric restriction. Am J Clin Nutr 1987;46:893-9.
190. Matter S, Weltman A, Stamford BA. Body fat content and
serum lipid levels. J Am Diet Assoc 1980;77:149-52.
191. Albrink MJ, Meigs JW. Interrelationship between skinfold thickness, serum lipids and blood sugar in normal
men. Am J Clin Nutr 1964;15:255-61.
192. Harlan WR, Oberman A, Mitchel? RE, Graybiel A.
Constitutional and environmental factors related to serum
lipid and lipoprotein levels. Ann Intern Med 1967;66:540-
55.
174

193. Mendoza ?G, Zerpa A, Velazquez E, Schwarzenberg A,
Hynd B, Kashyap ML, Laskarzewski P, Glueck CJ. Sex hormones,
lipids, lipoprotein cholesterols, and apolipoproteins in normal and obese subjects: atherogenic relationships. Int J
Obes 1986;10:427-41.
194. Montoye HJ, Epstein FH, Kjielsberg MO. Relationship between serum cholesterol] and body fatness. Am J Clin Nutr 1966;18:397-406.
195. Rifkind BM, Berg T. Relationship between relative body
weight and serum lipid ltevels. Br Med J 1966;2:208-16.
196. Carlson LA, Ericsson M. Quantitative and qualitative
serum lipoprotein analysis. Pt. 1. Studies in healthy men
and women. Atherosclerosis 1975;21:417-33.
197. Hayes D, Neill DW. Serum cholesterol and triglycerides
in ischemic heart disease. Clin Sci 1964;26:185-9.
198. Bjorntorp P, Malmcroma R. Serum cholesterol in patients with myocardial infarction in younger ages. Acta
Med Scand 1960;168:151-6.
199. Chapman JM, Massey FJ. The interrelationship of serum cholesterol, hypertension, body weight and risk of coronary
heart disease. J Chronic Dis 1964;17:933-49.
200. Nikkila EA, Pelkonen R. Serum tocopherol, cholesterol,
and triglycerides in coronary heart disease. Circulation 1963;27:919-26.
201. Hatch FT. The serum lipoproteins. In: Serum proteins
and the dysproteinemias. Sunderman FW and Sunderman FW Jr,
(Eds.). JB Lippincott Co. Philadelphia 1964, p. 223-?
202. Smith EB. Lipoprotein patterns in myocardial
infarction. Lancet 1957;2:910-14.
203. Eder HA. The rationale for measurement of HDL subclasses. In: K Lippel (Ed.)}, Report of the high density lipoprotein methodology workshop (NIH publication No. 79-
1661), National Institutes of Health, Betheseda MD, 1979,
pp. 279-87.
204. Miller GJ, Miller NE. Plasma-high-density-1!ipoprotein
concentration and development of ischaemic heart disease.
Lancet 1975;1:16-19
175

205. Carew TE, Koschinsky T, Hayes SB, Steinberg B. A
mechanism by which high-density lipoproteins may slow the
atherogenic process. Lancet 1976;1:1315-17.
206. Grundy SM. Cholesterol and coronary heart disease. A
new era. JAMA 1986;256:(20):2849-58.
207. Pearson TA, Bulkley BH, Achuff SC, Kwiterovich Po,
Gordis L. The association of low levels of HDL cholesterol and arteriographically defined coronary artery disease. Am J
Epidemiol 1979;109:285-95.
208. Jenkins PJ, Harper RW, Nestel PJ. Severity of coronary
atherosclerosis related to lipoprotein concentration. Br Med
J 1978;11 388-91.
209. Tan MH, Macintosh W, Weldon KL, Kapoor A, Chandler BM,
Hindmarsh TJ. Serum high density lipoprotein cholesterol? in patients with abnormal coronary arteries. Atherosclerosis
1980;37:187-98
210. Miller NE, Hammett F, Saltissi S, Rao S, Van Zeller
H, Coltart J, Lewis B. Relation of angiographically defined
coronary artery disease to plasma lipoprotein subfractions
and apolipoproteins. Br Med J 1981;282:1741-4.
211. Gordon T, Castelli WP, Hjortland MC, Kannel WB, Dawber TR. High dessity lipoptotein as a protective factor against
coronary heart disease. The Framingham Study. Am J Med 1977;62:707-14.
212. Miller NE, Forde OH, Thelle DS, Mjos OD. The Tromso
Heart Study. High-density lipoprotein and coronary heart-
disease: a prospective case-control study. Lancet 1977;1:965-7.
213. Rhoads GG, Gulbrandsen CL, Kagan A. Serum lipoptoteins
and coronary heart disease in a populataion study of Hawaii
Japanese men. New Engl J Med 1976:294:293-8.
214. Goldbourt U, Medalie JH. High density lipoprotein cholesterol and incidence of coronary heart disease -the
Israeli Ischaemic Heart Disease Study. Am J Epidemiol 1979;109:296-308.
215. Patsch JR, Gotto AM, Olivecrona T, Eisenberg S.
Formation of high-density lipoprotein,-like particles during lipolysis of very low density lipoprotein in vitro. Proc
Natl Acad Sci USA 1978;75(9):4519-23.
176

216. Taskinen MR, Nikkila EA. High-density lipoprotein
subfractions in relation to lipoptotein lipase activity of
tissues in man -evidence for reciprocal regulation of HDL. and HDL, levels by lipoprotein lipase. Clin Chim Acta
1981;112:325.
217. Anderson DW, Nichols AV, Pan SS, Lindgren FT. High density lipoprotein distribution: resolution and
determination of three major components in a normal
population sample. Atherosclerosis 1978;29:161.
218. Levy RI, Brensike JF, Epstein SE, Kelsey SF, Passamani
ER, Richardson JM, Loh IK, Stone NJ, Aldrich RF, Battaglini JW, Moriarty DJ, Fisher ML, Friedman L, Friedewald W, Detre
KM. The influence of changes in lipid values induced by cholestyramine and diet on progression of coronary artery
disease: results of the NHLBI Type II Coronary Intervention Study. Circulation 1984;69(2):325-37.
219. Carlson LA, Bottiger LE, Ahfeldt PE. Risk factors for
myocardial infarction in the Stockholm prospective study.
Acta Med Scand 1979;206:351-60.
220. Hulley SB, Rosenman RH, Bawol RD, Brand RJ. Epidemiology as a guide to clinical decisions: the
association between triglyceride and coronary heart disease.
New Engl J Med 1980;302:1383-9.
221. Goldstein JL, Hazzard WR, Schrott HG, Bierman EL, Motulsky AG: Hyperlipidemia in coronary heart disease. I.
Lipid levels in 500 survivors of myocardial infarction. J Clin Invest 1973;52:1533-43.
222. Albrink MJ, Man EB: Serum triglycerides in coronary
artery disease. Arch Intern Med 1959;103(1):4-8.
223. Albrink MJ, Meigs JW, Man EB: Serum lipids, hypertension and coronary heart disease. Am J Med 1961:31:4-
23.
224. Gotto AM, Gorry A, Thompson JR, Cole JS, Trost R,
Yeshurun D, DeBakey ME: Relationship between plasma lipid concentrations and coronary artery disease in 496 patients.
Circulation 1977;56:875-83.
225. Nelius SJ, Heyden S, Hansen JP, MuhlIbaier LH, Morris
M. Lipoprotein and blood pressure changes during weight
reduction at Duke’s Dietary Rehabilitation Clinic. Ann Nutr
Metab 1982;26:384-92.
177

226. Brownell KD, Stunkard AJ. Differential changes in plasma high-density lipoprotein-cholesterol levels in obese
men and women during weight reduction. Arch Intern Med 1981;141:1142-6.
227. Rossner S, Bjorvell H. Early and late effects of
weight loss on lipoprotein metabolism in severe obesity. Atherosclerosis 1987;64:125-30.
228. Follick MJ, Abrams DB, Smith TW, Henderson O, Herbert
PN. Contrasting short- and long-term effects of weight loss on lipoprotein levels. Arch Intern Med 1984;144:1571-4.
229. Contaldo F, Strazzulo P, Postigltione A, Riccardi G,
Patti L, DiBiase G, Mancini M. Plasma high density lipoprotein in severe obesity after stable weight loss.
Atherosclerosis 1980;37:163-7.
230. Thompson PD, Jeffery RW, Wing RR, Wood PD. Unexpected decrease in plasma high denstiy lipoprotein cholesterol with
weight toss. Am J Clin Nutr 1979;32:2016-21.
231. Carmena R, Ascaso JF, Tebar J, Soriano J. Changes in plasma high-density lipoproteins after body weight reduction
in obese women. Int J Obes 1984;8:135-40.
232. Weisweiler P. Plasma lipoproteins and lipase and
lecithin: cholesterol acyltransferase activities in obese
subjects before and after weight reduction.J Clin Endocrinol Metab 1987;65:969-73.
233. Tokunaga K, Ishikawa K, Matsuzawa Y. Lipids and
lipoproteins during a very-low-calorie diet. Lletter] Int J
Obes 1982;6:416.
234. Rabkin SW, Boyko E, Strejga DA. Relationship of weight loss and cigarette smoking to changes in high-density
lipoprotein cholesterol. Am J Clin Nutr 1981;34:1764-8.
235. Amaral JF, Thompson WR, Caldwell MD, Martin HF,
Randall HT. Prospective metabolic evaluation of 150
consecutive patients who underwent gastric exclusion. Am J
Surgery 1984;147:468-76.
236. Friedman CI, Falko JM, Patel ST, Kim MH, Newman H, Barrows H. Serum lipoprotein responses during active and
stable weight reduction in reproductive obese females. J
Clin Endocrinol Metab 1982;55:258-62.
237. Ellis RW, Darga LL, Lucas CP. The short- and jong-
term effects of a low-fat, cholesterol-free, nypocaloric
178
diet on serum triglyceride and cholesterol distribution in
severely obese humans. Int J Obes 1987;11:29-40
238. Schwartz R. The independent effects of dietary weight
loss and aerobic training on high denstiy lipoproteins and apolipoprotein A-1 concentrations in obese men. Metabolism
1987;36(2):165-71.
239. Altekruse EG, Wilmore JH. Changes in blood chemistries
following a controlled exercise program. J Occup Med
1973;15:110-13.
240. Lopez-S A, Vial R, Balart L, Arroyave G. Effects of
exercise and physical fitness on serum lipids and
lipoproteins. Atherosclerosis 1974;20:1-9.
241. Tran ZV, Weltman A, Glass GV, Mood DP. The effects of exercise on blood lipids and lipoproteins: a meta-analysis
of studies. Med Sci Sports Ex 1983;15(5):393-402.
242. Wood PD, Terry RB, Haskell WL. Metabolism of substrates:diet, lipoprotein metabolism, and exercise. Fed
Proc 1985;44:358-63.
243. Danner SA, Wieling W, Havekes L, Leuven JG, Smit EM, Dunning AJ. Effect of physical exercise on blood lipids and
adipose tissue composition in young health men.
Atherosclerosis 1984;53:83-90.
244. Adner MM, Castelli WP. Elevated high-density
lipoprotein levels in marathon runners. JAMA
1980; 243(6):534-6.
245. Martin R, Haskell W, Wood P. Blood chemistry and jipid profiles of elite distance runners. Ann N.Y. Acad Sci
1977;301:346-60.
246. Wood PD, Haskell WL, Stern MP, Lewis S, Perry C.
Plasma lipoprotien distribution in male and female runners.
Ann N.Y. Acad Sci 1977;301:748-63.
247. Hagan R, Geffman L. Maximal aerobic power, body fat and serum lipoproteins in male distance runners. J Cardiac
Rehab 1983;3:331-7.
248. Miller NE, Rao S, Lewis 8B, Bjorsvik G, Myhre K, Mjos
OD. High-density lipoprotein and physical activity. Lancet
1979;1:111.
249. Hartung G, Foreyt J, Mitchell RE, Viasek I Gotto AM.
Relation of diet to high-density lipoprotein cholesterol in
179

middle-aged marathon runners, joggers, and inactive men. New Engl J Med 1980;302:357-61.
250. Nakamura N, Uzawa H, Maeda H, Inomoto T. Physical
fitness. Its contribution to serum high density lipoprotein.
Atherosclerosis 1983;48:173-83.
251. Thompson PD, Lazarus B, Cullinane E, Henderson LO, Musliiner T, Eshleman R, Herbert PN. Exercise, diet or
physical characteristics as determinants of HDL-levels in endurance athletes. Atherosclerosis 1983;46:333-9.
252. Wood PD, Haskell WL. The effect of exercise on plasma
high density lipoproteins. Lipids 1979;14:417-27.
253. Krauss RM, Lindgren FT, Wood PD, Haskell WL, Albers JJ, Cheung MC. Differential increases in plasma high-density
lipoproteing subfractions and apolipoproteins in runners. Circulation 1977;(Suppl1 III) 56:4 Labstr].
254. Wood PD, Haskell WL, Blair SN, Williams PT, Krauss RM, Lindgren FT, Albers JJ, Ho PH, Farquhar JW. Increased
exercise level and plasma lipoprotein concentrations: A one-
year, randomized, controlled study in sedentary, middlie-
aged men. Metabolism 1983;32(1):31-9.
255. Williams PT, Wood PD, Krauss RM, Haskell WL, Vranizan
KM, Blair SN, Terry R, Farquhar JW. Does weight loss cause
the exercise-induced increase in piasma high density
lipoproteins? Atherosclerosis 1983;4:173-85.
256. Vodak PA, Wood PD, Haskell WL, Williams PT. HDL- cholesterol and other plasma lipid and lipoprotein
concentrations in middle-aged male and female tennis players. Metabolism 1980;29:745-52.
257. Thompson PD, Cullinane EM, Eshleman R, Sady SP, Herbert PN. The effects of caloric restriction or exercise
cessation on the serum lipid and lipoprotein concentrations
of endurance athletes. Metabolism 1984;33(10):943-50.
258. Saldivar MA, Roe H, Hartung GH, Pullin D. Lipid, lipoprotein, and body composition changes during diet only
and diet plus exercise wieght reduction programs for eight
weeks. Med Sci Sports Ex 1984;16(1):135-6 [abstr].
259. Lampman RM, Schteingart DE, Foss ML. Exercise as a
partial therapy for the extremely obese. Med Sci Sports Ex
1986;18(1):19-24.
180

260. Hagan RD, Upton JS, Wong L, Whittam J. The effects of
aerobic conditioning and/or caloric restriction in
overweight men and women. Med Sci Sports Ex 1986;18(1):87-
94.
261. Karam JH, Grodsky GM, Forsham PH. Excessive insulin
response to glucose in obese subjects measured by
Immunochemical assay. Diabetes 1963;12:197-204.
262. Defronzo RA. Insulin secretion, insulin resistance,
and obesity. Int J Obes 1982;6(Supp! 1):73-82.
263. Kolterman OG, Insel J, Seakow M, Olefsky JM.
Mechanisms of insulin resistance in human obesity: evidence for receptor and post-receptor defects. J Clin Invest
1980;65:1272-84.
264. Reaven GM, Moore J, Greenfield M. Quanfification of
insulin secretion and in vivo insulin action in nonobese and
moderately obese individuals with normal glucose tolerance. Diabetes 1983;32:600-4.
265. Toeller M, Gries FA, Dannehl K. Natural history of
glucose intolerance in obesity: A ten-year observation. Int
J Obes 1982;6(Suppl1 1):145-9.
266. Denrick EJ, Brickman AS, Gold EM. Dissociation of the obesity-hyperinsulinism relationship following dietary restriction and hyperalimentation. Am J Clin Nutr 1972;25:746-55.
267.Genuth S. Supplemented fasting in the treatment of
obesity and diabetes. Am J Clin Nutr 1979;32:2579-86.
268. Bylund AC, Bjuro T, Cederblad G, Holm J, Lundholm K,
Sjostrom M, Angquist KA, Schersten T. Physical training in man -Skeletal muscle metabolism in relation to muscle morphology and running ability. Eur J Appl Physiol 1977;36:151-69.
269. Schteingart DE, Lampman RM, Savage PJ, Edwards GJ,
Starkman MN, Foss M, Morales P, Valiquette S, Mitchell R. The effect of physical exercise during weight reduction in
severe obesity. Clin Res 1983;31(4): 760A.
270. Lampman RM, Santinga JT, Bassett DR, Biock WD, Mercer
N, Hook DA, Flora JD, Foss ML. Type IV hyperlipoproteinemia:
effects of a caloric restricted type IV diet versus physical training plus isocaloric type IV diet. Am J Clin Nutr
1980; 33:1233-43.
181

271. Krotkiewski M, Toss L, Bjorntorp P, Holm G. The effect Of a very-low-calorie diet with and without chronic exercise on thyroid and sex hormones, plasma proteins, oxygen uptake,
insulin and c-peptide concentrations in obese women. Int J
Obes 1981;5:287-93.
272. Keys A, Anderson JT, Grande F. Prediction of serum-
cholesterol responses of man to changes in fats in the diet.
Lancet 1957;2:959-66.
273. Hegsted DM, McGandy RB, Myers ML, Stare FJ.
Quantitative effects of dietary fat on serum cholesterol in
man. Am J Clin Nutr 1965;17:281-95.
274. Thomasson HJ, DeBoer J, Delongh H. Influence of
dietary fats on plasma lipids. Path Microbiol 1967;30:629-
47.
275. Quintao ECR, Brumer S, Stechhahn K. Tissue storage and
control of cholesterol metabolism in man on high cholesterol
diets. Atherosclerosis 1977;26:297-310.
276. Maranhao RC, Quintao ECR. Long term steroid metabolism balance studies in subjects on cholesterol-free and
cholesterol-rich diets: comparison between normal and
hypercholesterolemic individuals. J Lipid Res
1983:24(2):167-73.
277. Grundy SM, Ahrens EH. The effects of unsaturated dietary fats on absorption, excretion, synthesis, and
distribution of cholesterol in man. J Clin Invest
1970:49:1135-52.
278. Nestel PJ, Havenstein N, Scott TW, Cook LJ.
Polyunsaturated ruminant fats and cholesterol metabolism in
man. Aust N Z J Med 1974;4:497-501.
279. Shepherd J, Packard CJ, Grundy SM, Yeshurun D, Gotto AM, Taunton OD. Effects of saturated and polyunsaturated fat
diets on the chemical composition and metabolism of (low density lipoproteins) in man. J Lipid Res 1980;21:91-9.
280. Fisher EA, Blum CB, Zannis VI, Breslow JL. Independent
effects of dietary saturated fat and cholesterol on plasma lipids, lipoproteins and apolipoprotein E. J Lipid Res
1983;24:1039-48.
281. Mattson FH, Grundy SM. AComparison of effects of
dietary saturated, monounsaturated, and polyunsaturated
fatty acids on plasma lipids and lipoproteins in man. J
Lipid Res 1985:26:194-202.
182

282. Grundy SM, Vega GL. Plasma cholesterol responsiveness
to saturated fatty acids Am J Clin Nutr 1988;47:822-4,
283. Grundy SM. Comparison of monounsaturated fatty acids
and carbohydreate for lowering plasma cholesterol. N Engl J
Med 1986:314:745-8.
284. Gammal EB, Carroll KK, Plunkett ER. Effects of dietary fat on mammary carcinogenesis be 7,12
dimethy lbenz(alpha)anthracene in rats. Cancer Res
1967;27:1737-42.
285. King ME, Spector AA. Effect of specific fatty acy] enrichments on membrabe physical properties detected with a
spin label probe. J Biol Chem 1978;253:6493-6501.
286. Shepherd J, Packard CJ, Patsch JR, Gotto AM. Effects
of dietary polyunsaturated and saturated fat on the
properties of high density lipoproteins and the metabolism of apolipoprotein A-1. J Clin Invest 1978;61:1582-92.
287. Shepherd J, Packard CJ, Taunton D, Gotto AM. Effects
of dietary-fat saturation on the composition of very low-
density lipoproteins and on the metabolism of their major
apoprotein, apolipoprotein B. Biochem Soc Trans 1978;6779- 81.
288. Vessby B, Gustafasson B, Boberg J, Karlstrom B,
Lithell] H, Werner I. Substituting polyunsaturated for Saturated fat as a single change in a Swedish diet:effects
on serun lipoprotein metabolism and glucose tolerance in
patients with hyperlipoproteinemia. Eur J Clin Invest
1980;10:193-202.
289. Vega G:, Groszek E, Wolf R, Grundy SM. Influence of
polyunsaturated fats on composition of plasma lipoproteins
and apolipoproteins. J Lipid Res 1982;23:811-22.
290. Schonfeld G, Patsch W, Rudel L, Nelson C. Effects of dietary cholesterol and fatty acids on plasma lipoproteins. J Clin Invest 1982;69:1072-80.
291. Zanni E, Zannis V, Blum C, Herbert P, Breslow J.
Effect of egg cholesterol] and dietary fats on plasma lipids, lipoproteins, and apoproteins of normal women consuming
natural diets. J Lipid Res 1987;28:518-27.
292. Witztum J, Schonfeld G. High density lipoproteins.
Diabetes 1979;28:326-36.
183

293. Connor WE, Cerqueira MT, Connor RW, Wallace RB,
Malinow MR, Casdorph HR. The plasma lipids, lipoproteins,
and diet of the Tarahumara Indians of Mexico. Am J Clin Nutr
1978;31:1131-42.
294.Schonfeld G, Weidman SW, Witztum JL, Bowen RM.
Alterations in levels and interrelations of plasma
apolipoprtoeins induced by diet. Metabolism 1976;25(3):261-
75.
295. Hulley SB, Cohen R, Widdowson G. Plasma high-density
lipoprotein cholesterol level. JAMA 1977:238(21):2269-71.
296. Applebaum-Bowden D, Hazzard WR, Cain J, Cheung MC, Kushwaha RS, Albers JJ. Short-term egg yolk feeding in
humans. Atherosclerosis 1979;33:385-96.
297. Lin DS, Connor WE. The long term effects of dietary cholesterol upon the plasma vipids, lipoproteins,
cholesterol] absorption, and the sterol balance in man: the
demonstration of feedback inhibition of cholesterol
biosynthesis and increased bile acid excretion. J Lipid Res
1980;21:1042-52.
298. Mistry P, Miller NE, Laker M, Hazzard WR, Lewis B.
Individual variation in the effects of dietary cholesterol] on plasma lipoproteins and cellular cholesterol homeostasis
in man. J Clin Invest 1981;67:493-502.
299. Applebaum-Bowden D, Haffner SM, Hartsook £, Luk KH,
Albers JJ, Hazzard WR. Down-regulation of the low-density lipoprotein receptor by dietary cholesterol. Am J Clin Nutr
1984;39:360-7.
300. Sacks FM, Miller L, Sutherland M, Albers JJ, Salazar
J, Foster JM, Samonds KW, Kass EH. Ingestion of egg raises plasma low density lipoproteins in free-living subjects. The Lancet 1984;1:647-9.
301. Packard CJ, McKinney, Carr K, Shepherd J. Cholesterol feeding increases low density lipoprotein synthesis. J Clin
Invest 1983;72:45-51.
302. Beynen AC, Katan MB. Effect of egg yolk feeding on the concentration and composition of serum lipoproteins in man.
Atherosclerosis 1985;54:157-66.
303. Edington J, Geekie M, Carter R, Benfield L, Fisher K, Ball M, Mann J. Effect of dietary cholesterol on plasma
cholesterol concentration in subjects following reduced fat,
high fibre diet. Br Med J 1987;294:333-6.
184
304. Flaim E, Ferreri LF, Thye FW, Hill JE, Ritchey SJ. Plasma lipid and lipoprotein cholesterol concentrations in
adult males consuming normal and high cholesterol diets under controlled conditions. Am J Clin Nutr 1981;34:1103-8.
305. Nestel P, Tada N, Billington T, Huff M, Fidge N. Changes in very low density lipoproteins with cholesterol loading in man. Metabolism 1982;31(4):398-405.
306. Beynen AC, Katan MB. Reproducibility of the variations
between humans in the response of serum cholesterol to
cessation of egg consumption. Atherosclerosis 1985;57:19-
31.
307. Shekelle RB, Shyrock AM, Paul O, Lepper M, Stamler J, Liu S, Raynor WJ. Diet, serum cholesterol, and death from
coronary heart disease. New Engl J Med 1981;304(2):65-70.
308. Kushi LH, Lew RA, Stare FJ, Ellison CR, Lozy ME, Bourke G, Daly L, Grahan I, Hickey N, Mulcahy R, Kevancy J.
Diet and 20-year mortality from coronary heart disease. New
Engl J Med 1985;312:811-8.
309. Bronte-Stewart B, Antonis A, Eales L, Brock JF.
Effects of feeding different fats on the serum cholesterol! Tevel. Lancet 1956;1:521-6.
310. Kinsell LW, Partridge J, Boling L, Margen S, Michaels
G. Dietary modification of serum cholesterol and
phospholipid levels. J Endocrinol Metab 1952;12:909-13.
311. Kinsell LW, Michaels GD, Partridge JW, Boling LA, Balch HE, Cochrane GC. Effect upon serum cholesterol and phospholipids of diets containing large amoounts of begetable fat. J Clin Nutr 1953;1:224-31.
312. Ahrens EH, Hirsch J, Insull W, Tsalitas TT, Blomstrand R, Pererson ML. The influence of dietary fats on serum lipid
jevels in man. Lancet 1957;1:943-53.
313. Schaefer EJ, Levy RI, Ernst ND, Van Sant FD, Brewer HB. The effects of tow cholesterol, high polyunsaturated
fat, and tow fat diets on plasma lipid and lipoprotein cholesterol tevels in normal and hypercholesterolemic
subjects. Am J Clin Nutr 1981;34:1758-63.
314. Vessby B, Lithel? H, Boberg J. Reduction of low density and high density lipoprotein cholestero! by fat-
modified diets. Hum Nutr Clin Nutr 1982;36C:203-11.
185

315. Kuusi T, Ehnholm C, Huttunen JK, Kostiainen E, Pietined P, Leino V, Uusitalo U, Nikkari T, Iacono JM, Puska
P. Concentration and composition of serum lipoproteins
during a low-fat diet at two levels of polyunsaturated fat.
J Lipid Res 1985;26:360-7.
316. Reiser R, Probstfield JL, Silvers A, Scott LW, Shorney ML, Wood RD, O’brien BC, Gotto AM, Phil D, Insull W. Plasma lipid and lipoprotein response of humans to beef fat,
coconut oi! and safflower oil. Am J Clin Nutr 1985;42:190- 7.
317. Sirtori CR, TRemoli E, Gatti E, Montanari G, Sirtori
M, Colli S, Gianfranceschi G, Maderna P, Dentone Ci, Testolin G, Galli C. Controlled evaluation of fat intake in
the Mediterranean diet: comparative activities of olive oi]
and corn o11 on plasma lipids and platelets in high-risk
patients. Am J Clin Nutr 1986;44:635-42.
318. Katan MB, Berns MA, Glatz JF, Knuiman JT, Nobels A,
DeVries JH. Congruence of individual responsiveness to
dietary cholesterol and to saturated fat in jumans. J Lipid
Res 1988;29:883-92.
319. Weiswetler P, Janetschek P, Schwandt P. Influence of
polyunsaturated fats and fat restriction on serum
lipoproteins in humans. Metabolism 1985;34(1):83-7.
320. Judd JT, Oh SY, Hennig B, Dupont J, Marshall MW. Effects of low fat diets differing in degree of fat unsaturation on plasma lipids, lipoproteins, and
apolipoproteins in adult men. J Am Coll Nutr 1988;7(3):223- 34.
221. Boberg J, Berne C, Pollare T, Gustafsson I. Effects of
diet fat p/s ratio on serum lipoprotein concentrations. Adv
Exptal Med Biol 1987;210:159-63.
322. Keys A. Coronary heart disease in seven countries.
Circulation 1970;41(suppl1):1-21.
323. Baggio G, Pagnan A, Muraca M, Martini S, Opportuno A,
Bonanome A, Ambrosio GB, Ferrari S, Guarini P, Piccolo D,
Manzato E, Correcher R, Crepaldi G. Olive-oil-enriched diet:
effect on serum lipoprotwin levels and biliary cholesterol
saturation. Am J Clin Nutr 1988;47:960-4.
324. Mensink RP, Katan MB. Effect of monounsaturated fatty acids versus complex carbohydrates on high-density
lipoproteins in healthy men and women. Lancet 1987;1:122-5.
186

325. Grundy SM, Florentin L, Nix D, Whelan MF. Comparison
of monounsaturated fatty acids and carbohydrates for
reducing raised levels of plasma cholesterol! in man. Am J
Clin Nutr 1988;47:965-9,
326. Garg A, Bonanome A, Grundy SM, Zhang ZJ, Unger RH. Comparison of a high-carbohydrate diet eith a high-
monounsaturated fat diet in patients with non-insulin-
dependent diabetes mellitus. Mew Engi J Med 1988;319:829-
34,
327. International Collaborative Study Group. Metabolic epidemiology of plasma cholesterol. Mechanisms of variation
of plasma cholesterol within populations and between populations. Lancet 1986;2:991-6.
328. Himsworth HP. The dietetic factor determining the
glucose tolerance and sensitivity to insulin of health men. Clin Sci 1935:2:67-94.
329. Wigand JP, Anderson JH, Hennings SS, Blackard WG. Effect of dietary composition on insulin receptors in normal
subjects. Am J Clin Nutr 1979;32:6-9.
330. Anderson JW, Herman RH, Zakim D. Glucose tolerance and insulin response to prolonged high carbohydrtae feeding in normal men. Am J Clin Nutr 1968;21:Labstr]J 529.
331. Silva ME, Pupo AA, Ursich MJ. Effects of high- carbohydrate diet on blood glucose, insulin and triglyceride
levels innormal and obese subjects and in obese subjecrs
eith impaired glucose tolerance. Braz J Med Biol Res 1987;20:339-50.
332. Brunzell JO, Lerner RL, Hazzard WR, Porte D, Bierman
EL. Improved glucose tolerance with carbohydrate feedint in mild diabetes. New Eng? J Med 1971;284:521-4.
333. Ford S, Bozian RC, Knowles HC. Interactions of
obesity, and glucose and insulin levels in
hypertriglyceridemia. Am J Clin Nutr 1968;21:904-10.
334. Jourdan M, Goldbloom D, Margen S, Bradfield RB.
Differential effects of diet composition and weight loss on
glucose tolerance in obese women. Am J Clin Nutr
1974;27:1065-70.
335. Horton ES, Danforth E, Sims EA, Salans LB. Correlation
of forearm muscle and adipose tissue metabolism in obesity
before and after weight loss. Clin Res 1972;20:548A.
187

336. Rony HR, Ching TT. Studies on rat metabolism II. The
effect of certain hormones on fat transport. Endocrinology 1930;14:355-63.
337. Falko JM, Schonfeld G, Witztum JL, Kolar JB, Salmon P.
Effects of short-term high carbohydrate, fat-free diet on plasma levels of apo C-II and apo C-III and on the apo C subspecies in human plasma lipoproteins. Metabolism
1980;29(7):654-61.
338. Vessby B, Carlson LA. Conversion of type III
hyperlipoproteinemia to type IV hyperlipoproteinemia by a fat-free, carbohydrate-rich diet. Eur J Clin Invest
1975;5:359-63.
339. Simpson RW, Mann JI, Eaton J, Moore RA, Carter R, Hockaday TD. Improved glucose contlol in maturity-onset
diabetes treated with high-carbohydrate-modified diet. Br Med J 1979;1:1753-9.
340. Gonen B, Patsch W, Kuisk I, Schonfeld G. The effect of
short-term feeding of a high carbohydrate diet on HDL subclasses in normal subjects. Metab Clin Exp 1981;30:1125-
9.
341. Mann J. Complex carbohydrates: replacement energy for
fat or useful in their own right? Am J Clin Nutr
1987;45:1202-6.
342. Brussaard JH, Katan MB, Groot PHE, Havekes LM,
Hautvast GAJ. Serum lipoproteins of healthy persons fed a
low-fat diet or a polyunsaturated fat diet for three months. Atherosclerosis 1982;42:205-19.
343. Coulston AM, Liu GC, Reaven GM. Plasma glucose, insulin and lipid responses to high-carbohydrate low-fat diets in normal humans. Metabolism 1983;32(1):52-6.
344. Farquhar JW, Frank A, Gross RC, Reaven GM. Glucose,
insulin, and triglyceride responses to high and low carbohydrate diets in man. J Clin Invest 1966;45(10):1648-
56.
345. Fujita Y, Gotto AM, Phil D, Unger RH. Basal and
postprotein insulin and glucagon levels during a high and
low carbohydrate intake and their relationships to plasma
triglycerides. Diabetes 1975;24:552-8.
346. Reaven GM, Lerner RL, Stern MP, Farquhar JW. Role of
insulin in endogenous hypertriglyceridemia. J Clin Invest
1967;46(11):1756-67.
188

347. Hagenfeldt L, Hellstrom K, Wahren J. Triglyceride, free fatty acid and carbohydrate metabolism in hyperlipaemic
(type IV) and normolipaemic subjects on carbohydrate- or
fat-rich diets. Clin Sci Mol Med 1975;48:247-57.
348. Lees RS, Fredrickson DS. Carbohydrate induction of
hyperlipemia in normal man. Clin Res 1965;13:327.
349. Glueck CJ, Levy RI, Fredrickson DS. Immunoreactive insulin, glucose tolerance, and carbohydrate inducibility in
type II, III, IV, and V hyperlipoproteinemia. Diabetes 1969;18:739-47.
350. Macdonald I. The effects of dietary carbohydrates on high density lipoprotein levels in serum. Nut Rep Int 1978;17(6):663-8.
351. Reiser S, Hallfrisch J, Michaelis OE, Lazar FL, Martin
RE, Prather ES. Isocaloric exchange of dietary starch and sucrose in humans. I. Effects on levels of fasting blood
lipids. Am J Clin Nutr 1979;32:1659-69.
352. Porikos KP, Van Itallie TB. Diet-induced changes in serum transaminase and triglyceride levels in healthy adult
men. Am J Med 1983;75:624-30.
353. Olefsky JM, Farquhar JW, Reaven GM. Reappraisal of the role of insulin in hypertriglyceridemia. Am J Med
1974;57:551-60.
354. Crapo PA, Reaven G, Olefsky J, Alto P. Plasma giucose and insulin responses to orally administered simple and complex carbohydrates. Diabetes 1976;25:741-7.
355. Tne US-USSR steering committee for probiem area I: The pathogenesis of atherosclerosis. Nutrient intake and its
association with high-density lipoprotein and low-density
lipoprotein cholesterol in selected US and USSR
subpopulations. Am J Clin Nutr 1984;39:942-52.
356. Ernst N, Fisher M, Smith W, Gordon T, Rifkind BM, Little JA, Mishkel MA, Williams OD. The association of plasma high-density lipoprotein cholesterol with dietary intake and alcohol consumption. The lipid research clinics
program prevalence study. Circulation 1980;62(supp!] IV):41-
52.
357. Beaglehole R, Trost DC, Tamir I, Kwiterovich P, Gluech
CJ, Insull W, Christensen B. Plasma high-density lipoprotein cholesterol? in children and young adults. The lipid research clinics program prevalence study. Circulation 1980;62(supp]
IV):83-92.
189

358. Morrison JA, Larsen R, Glatfeller L, Boggs D, Burton K, Smith C, Kelly K, Mellies MJ, Khuory P, Glueck CJ.
Nutrient intake relationships with lipids and lipoproteins in 6-19-year-old children -the Princeton School District
Study. Metabolism 1980;29(2):133-40.
359. Williams PT, Krauss RM, Wood PD, Albers JJ, Dreon D,
Elisworth N. Associations of diet and alcohol intake with
high-density lipoprotein subclasses. Metabolism
1985; 34(6):524-30.
360. Hardinge MG, Stare FJ. Nutritional studies of
vegetarians. 2. Dietary and serum levels of cholesterol. Am
J Clin Nutr 1954;2:83-88.
361. Walker ARP, Arvidsson UB. Fat intake, serum
cholesterol concentration and atherosclerosis in the South
African Bantu. J Clin Invest 1954;33:1358-65, as reported
in: Eastwood M. Dietary fibre and serum lipids. Scand J Gastroenterol 1987;129:210-12.
362. Burkitt DP. Some disease characteristics of modern
western civilization. Br Med J 1973;1:274-8.
363. Trowell HC. Ischaemic heart disease and dietary fibre.
Am J Clin Nutr 1972;25:926-32.
364. Burkitt DP, Trowell HC. Refined carbohydrate foods and
disease. Academic Press, 1975; New York.
365. Morris JN, Marr JW, Clayton DG. Diet and heart: a
postscript. Br Med J 1977;2:1307-14.
366. Krombout D, Bosscheiler EB, de Lezenne Coulandre C.
Dietary fiber and 10-year mortality for coronary heart disease, cancer and all causes. Lancet 1982;2:518-22.
367. Arntzenius AC, Krombout D, Barth JD, Reiber JH,
Bruschke AV, Buis B, Van Gent CM, Kempen-Voogd N, Strikwerda
S, Van der Velde EA. Diet, lipoproteins, and the progression
of coronary atherosclerosis. The Leiden Intervention Tial. New Eng] J Med 1985;313:805-11.
368. Liu K, Stamler J, Trevisan M, Moss D. Dietary lipids, sugar, fiber, and mortality from coronary heart disease.
Bivariate analysis of international data. Arteriosclerosis
1982;2:221-7.
369. Albrink MJ, Davidson PC, Newman T. Lipid-lowering
effect of a very high carbohydrate high fiber diet. Diabetes
1976;25:324A.
190

370. Lewis B, Hammett F, Katan M, Kay RM, Merkx I, Nobels
A, Miller NE, Swan AV. Towards an improved lipid-lowering diet: additive effects of changes in nutrient intake. Lancet
1981;2:1310-3.
371. Reiser S. Metabolic effects of dietary pectin related
to human health. Food Technol 1987;Feb:91-9.
372. National Academy of Sciences-Nataional Research Council. Washington DC. Recommended dietary allowances. 1953 publication 302 p.8.
373. National Academy of Sciences-National Research Council. A report of the food and nutrition board. Recommended dietary allowances. seventh ed 1968. p. 19
374. National Academy of Sciences. National Research Council. Committee on dietary allowances, Food and nutrition board. Recommended dietary allowances. Ninth revised edition 1980. p. 46.
375. Hodges RE, Krehl WA, Stone DB, Lopez A. Dietary
carbohydrates and low cholesterol] diets: effects on serum lipids of man. Am J Clin Nutr 1967;20:198-208.
376. The story of soybeans, soybean 011, soybean meal, their uses and products. Chicago: Chicago Board of Trade 1956.
377. Moore MC Guzman MA, Schilling PE, Strong JP. Dietary- atherosclerosis study on deceased persons. J Am Diet Assoc
1976;68:216-23.
378. Connor WE, Connor SL. The key role of nutritional factors in the prevention of coronary heart disease. Prev
Med 1972;1:49-83.
379. Yudkin J. Diet and coronary thrombosis; hypothesis and
fact. Lancet 1957;2:155-62.
380. Yerushalmy J, Hilleboe HE. Fat in the diet and mortaltiy from heart disease; a methodologic note. N Y State
J Med 1957;57:2343-54.
381. Williams PT, Krauss RM, Kindel-Joyce S, Dreon DM,
Vranizan KM, Wood PD. Relationship of dietary fat, protein, cholesterol, and fiber intake to atherogenic lipoproteins in
men. Am J Clin Nutr 1986;44:788-97.
382. Sirtori CR, Agradi E. Soybean-protein diet in the treatment of type-II hyperlipoproteinaemia. Lancet
1977;1:275.
191
383. Carroll KK, Giovannetti PM, Huff MW, Moase O, Roberts
D, Wolfe RM. Hypocholesterolemic effect of substituting soybean protein for animal protein in the diet of healthy
young women. Am J Clin Nutr 1978;31:1312-21.
384. Descovich GC, Ceredi C, Gaddi A, Benassi MS, Mannino G, Colombo L, Cattin L, Fontana G, Senin U, Mannarino E, Caruzzo C, Bertielli E, Fragiacomo C, Noseda G, Sirtori M,
Sirtori CR. Multicentre study of soybean protein diet for
outpatient hypercholesterolaemic patients. Lancet
1980:2:709-15.
385. Holmes WL, Rubel GB, Hood SS. Comparison of the effect of dietary meat versus dietary soybean protein on plasma
lipids of hyperlipidemic individuals. Atherosclerosis 1980;36:379-87.
386. Wolfe BM, Giovannetti PM, Cheng DCH, Roberts DOCK,
Carroll KK. Hypoltpidemic effect of substituting soybean protein isolate for all meat and dairy protein in the diets of hypercholesterolemic men. Nut Rep Int 1981;24(6):1187-
98.
387. Goldberg AP, Lim A, Kolar JB, Grundhauser JJ, Steinke
FH, Schonfeld G. Soybean protein independently lowers plasma cholesterol! levels in primary hyperchotesterolemia.
Atherosclerosis 1982;43:355-68.
388. Verillo A, de Teresa A, Giarrusso PC, La Rocca S. Soybean protein diets in the management of type II
hyperlipoproteinaemia. Atherosclerosis 1985;54:321-31.
389. van Raaij JMA, Katan MB, Hautvast JGAJ, Hermus RJJ. Effects of casein versus soy protein diets on serum cholesterol and lipoproteins in young healthy volunteers. Am
J Clin Nutr 1981;34:1261-71.
390. Bosello O, Cominacini L, Zocca I, Garbin U, Compri R,
Davoli A, Brunetti L. Short- and long-term effects of
hypocaloric diets containing proteins of different sources on plasma lipids and apoproteins of obese subjects. Ann Nutr
Metab 1988;32:206-14.
391. van Raaij JMA, Katan MB, West CE, Hautvast JGAJ. Influence of diets containing casein, soy isolate, and soy
concentrate on serum cholesterol and lipoproteins in middle- aged volunteers. Am J Clin Nutr 1982;35:925-34.
392. Holl MG, Allen LH. Comparative effects of meals high
in protein, sucrose or starch on human mineral metabolism
and insulin secretion. Am J Clin Nutr 1988;48:1219-25.
192

393. Nuttall GQ, Gannon MC. Quantitative importance of
dietary constituents other than glucose as insulin
secretagogues in type II diabetes. Diabetes Care 1988;11(1):72-6.
394. Gannon MC, Nuttall FQ, Neil BJU, Westphal SA. The
insulin and glucose responses to meals of glucose plus
various proteins in type II diabetic subjects. Metabolism 1988;37(11):1081-8.
395. Sanchez A, Hubbard RW, Smit E, Hilton GF. Testing a
mechanism of control in hyman cholesterol] metabolism: relation of arginine and glycine to insulin and glycagon.
Atherosclerosis 1988;71:87-92.
193

APPENDICES
194
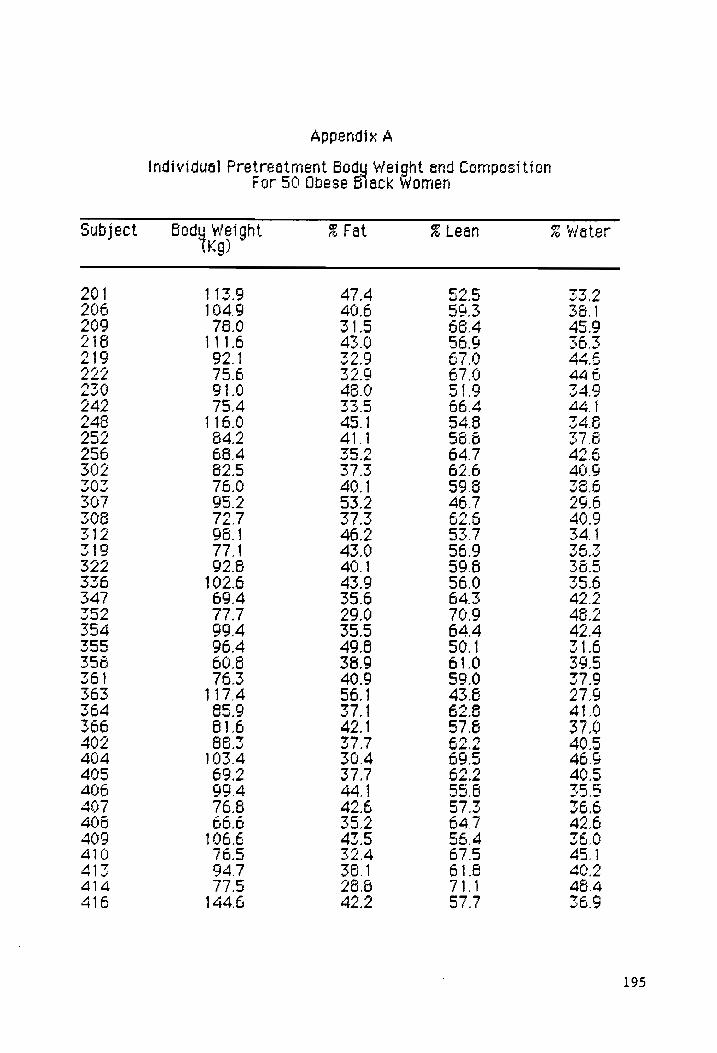
Appendix A
ht and Composition Weig 50 Obese Hack Women c
Individual Pretreatment Bod For
am Fat a Lean % ‘Water Kg)
Body Weight Subject
NAM
DOOM DOON— MMONAN TOMAAGSWAMHABOOG
NTN
a,
Sic:
i A
i
cine i
Si
i, Se
i, Ss
“ .
. .
.
MOWWoOT TTT
OVA OTOONNON
HK Ae
eh
COD OMMBMNwoMoOOw
MOT TIM
TMM TTPO
TMMMM TT TMMMAYT MTT To
Phase sp
MMYTRAOOATOOPOVOMrOMrKDOOMAT—-COONOHOONMNNOMr
TMoO-r
ee Sn
Se SS
SR
SOO ER SR
a i
Sn
ay
NOOWM
PY —- ONT OTN ODONMDOAD TOTO, MM h
CA NUP Tur
— —
h- HN OMVOOMWWOMNMOWMNTOMMMWIOF-OMOM
TOW ODOWWIOWDOoOr
WN
TOMOMNAON-—
KH AMEKNMNO AVON OAR
KK KrTE VN
T ON
mw
MmO-MNN OMI
KM OMPOMOMMAMAWOWORrAP-OM
TNWPINDAN
TEM ToMTMO
VY THOoMTMMTTTYTMONMT
MT MTMHMMH
TT TO TOMA
mm
ts
rT
oO— Nun
—-ON OND
—~DADANONAOANONAMYE ONANOREATOD
—-MTONTDOMOMDoOMmTwo
QOH AHYMTTIMCSSOKK-AQMNTMNMNMOWONOOCVoeooorrc=
CN
NEON EN GEN NAD 9999S)
PP
PO POPPY FOP
SP TT SS TS TS
195

Appendix A (Coatiaued)
Individuel Pretreatment Body Weight and Composition For 30 Obese Black women
subject Body Mergnt % Fat % Lean % Water (Kg)
417 80.2 23.8 66.1 478 42 87.7 36.5 61.6 395 422 106.8 36.9 63.0 41.2 425, 106.6 45.0 54.0 349 428 89.2 50.4 49.5 213
z 106. 3 53. 34. 435 65.0 37.2 62.7 40.5 427 75.1 305 69.4 46.6 440 102.6 36.2 61.6 40.0 444 80.5 39.1 60.8 39.4
196

Appendix B
ht and Composition omen i y We
se Black 4 or 56 Obe individusl Post-treetrent Bod
r
& Water % Lear feight i Kg)
Body subject
Mh ™ WG
IW
POON
MNMMOIDO TNO
MK MOoOwor- —OoOwwoW
OOOO
EN
PR
RK PREM
PRE
KH OK OMNI
NS
te
ee MITTS TM
ToGTTe GTN
Tyo TT ToyTFToHysg rg
eomemwdssyws
CUONAMAN CMO TODOOAATOMNOANOCOAMOERP
KOVTOOR MANY
TST
mmm
CMAM-MOAAN TIENEN
MT MMDODOANMBWAT
Or Mw Tr lormrana
DOD INWWINT-NOWDOTR
MOUND
TWOHKOTINDOOVDONWNOMOWEM
Mrmr
OT
—MNA—-— ON DNTMOPAOVMNANYOAWMMONTEr
TMM
mmm
aww
AOonN—OOPINWE-NPOONOTH
—MARDOr
DO OM
-NOTDONTNOF —
MMM TMM TN TMMMMON TMM TMONNIN MM
TMMMM
TTMTMMN Ts
M~OWOM~-OTNOMT
—OTONE NK NODDOMNAMNAODOVUOMNOMrMW—m
mt
AMOoTTOMoONWMOANTM -"MMOMDODIONE OMBMIOKrNWO MMO
nor
- Or Or —-—OOrOAPOPDDOrRVDOCVUOrRK
OBDOVMOOOOrWOOr AMT
= —-
were
—
_
—DNDOANONONDONAMF
ONANDOK NTO MTONTNOROMoOnwsTa
OOO K-AMYTTOMNCODVO-K-NMTMOMMMONO
NO SVI929900Orr-rT
NNANNAN AAA
SMD MDM MP MPM MM MPMP TIT
seg Toss
197

Appendix B (Lontraved
Indivicual Post-treatment Body weight and Composition or 36 Ubese Black women F
Subiect body werght a Fat ~% Leaf @ water LK)
417 77.2 29.3 69.6 47.6 42} GZ.) 36.6 63.3 41.4 422 90.1 26.9 71.6 48.2 425 167.0 43.0 56.9 36.3 426 89.6 47.2 32.6 Zo. 4295 96.1 35.9 64.6 42.0 434 96.7 29.2 60.7 29.2 435 64.2 36,2 63.7 41.6 427 73.6 29.3 70.6 479 446 99.3 36.7 63.2 413 444 79.9 56.0 61.5 40.2
198

Agoendtx C
One- anc Two-Minute Recovery Heart Rates as 6 Percentage of immediate Post-Evercise Heart Rate at Pre- and Past-Treatment for
Exercising Subjects
Pretreatment Post-Treatment
Subject One-Minute Twe-Minute One-Minute Twe-Minute rate Rate Pale Pale
201 67 26 52 cs 269 64 95 60 67 222 67 o1 Bo 78 242 3 77 Gi 76 252 92 64 79 75 256 G3 G6 77 6G 202 125 160 72 67
x eM ; : wv ~ ~
347 76 66 S6 67 255 166 106 G6 68 355 BO 70 75 67 261 67 a? 91 66 366 BG GO 5o 52 ape ra - 66 82 46 - - - 408 95 95 - - 410 GG 76 - - 414 100 99 3 67 4i6 67 67 - - 421 - - 66 7 422 oS - G0 aS 425 94 78 79 74 426 - - - - 429 G2 73 79 71 435 56 67 - - 444 100 114 74 67
199

Appendix 0
Individual Pretreatment Values of Total Cholesterol (mg/dl), Lipoprotein Cholesterol (maedl), Triglyceride (mg.d1), and
Insulin (ulUml) for 50 Subjects
Subject. TC TG LDL-c. HDi-c. HOLo TCFHDL-c INS
201 160 77 966 46 22 330325 206 166 «FF «(102.6 48 29 34 ©9409 209 249 «77 «1596 74 47 34 196 218 128 657) B26 34 13 38 020 474 219 165 155 97.0 37 2 4.4 - 222 187 0-68 «121452 21 3.6 127 230 203. «184 «107.2 59 40 34 86284 242 326 «122 280.6 4} 12 5.0 12.8 248 232 «-«93:«1644 28 47 23.9 252 233 202 1336 50 22 39 33.8 256 217 102 1476 49 3] 44 19.0 302 283 145 2260 38 1F 10.1 31.8 303 202. 430 810 35 5 55 0-368 307 199 103 «13740 41 27 48 263 308 210 87 1366 56 39 3.6 WA? 312 243 84 177.2 4g 27 5.0 146 319 176 «658 1144 = 50 26 3.5 10.6 322 226 64 1642 49 - 46 - 336 144 57 B46 48 25 3.0 10.1 347 175 69 108.2 53 33 33 17.2 352 180 53 1054 64 - 28 23.2 354 166 «6651120 AI 23 40-212 355 269 «62 «#1726 = €©=84 42 3.2 - 356 192 124 128.2 39 21 49 - 361 122 39 #662 48 33 25 11.5 363 195 68 1344 4? 27 4 47.5 364 205 130 1550 24 9 65 18.9 366 247 153 1714 45 30 ss 415 402 17 06690 952 25 26 ©6257 Add St 117 68260045 30 34 0-928 405 287 154 207.2 49 22 58 311 406 382 130 297.0 59 23 6.5 - 407 236 #83 1674 52 26 45 6.6 408 1p5 39 «110.2 46 30 3.4 7.0 409 161 106 105.8 34.C—“‘(ié‘é 47 46.8 410 170 74 (103.2 53 29 3.2 144 AIZ 170.056 107.B OT 29 330 BBE
200

Appendix D (serine
Individual PreTreatment Values of Total Cholesterol (mg.‘dl), Lipoprotein Cholesterol (madi), Triglyceride (mg/dl), and
Insulin (ulU/ml) for SQ Subjects
Subject Te TG LOL-c HDi-c =HDLo) = TeeHDL-c INS -_
4i4 19? aa («121.0 ao =o 2.0 lo.4 416 181 6&8 135.2 42 28 45 33.1 4? 138 se oF 4 43 ze 3.7 19.9 A? 190 BO 361140 o4 38 3.0 16.8 422 192 1210 «128.8 44 29 44 12.0 g2d 230 127 VFs8 RS 20 v4 ets 428 250 42 166.6 33 19 as 13.3 AZO 204 185) 1254 4] 24 2.0 23.9 434 131 68 62.4 Sa 23 3.7 95. 435 165 vi 08.8 a2 15 3.2 13.8 of 194 Sf 6104.6 62 36 =.4 13.4
440 188 b2 127.0 48 29 3.4 24.8 444 275 112 199.6 oS - 3.2 -
201

Appendix —
Individual Past-Treatment Values of Total Cholesterol (mardi), Lipoprotein Cholesterol (mg‘dl), Triglyceride (mgd), and
Insulin (uluml) for 50 Subjects
subject TC TG LDL-c HDL-c HDL2 = TCYHDL-c INS
201 208 f2 147.6 46 22 45 20.1 206 131 390970 43 ee Soo 16.6 209 209 48 143.4 20 30 3.7 13.1 218 155 79 W122 ei 1? 3.7 31.0 219 218 $121) «161.8 32 11 6.8 $2.0 22 1o4 - - 20 1? S.3 13.6 230 16F 614) 6115.2 49 30 3.8 127 242 223 S86 169.4 36 18 6.2 10.4 248 203 142 126.6 46 20 44 a8 232 Ze 190—-143.0 32 28 40 S78 200 189 #1 122.8 32 29 3.6 a? 202 22 120) 6173.0 Se 16 we 12.6 S03 251 IF? 184.6 S1 lo B.1 20.4 30? 171 10 113.2 e i? 46 22.2 308 196 B85 «132.0 49 23 40 14.6 si2 262 * 2046 40 14 6.6 13.0 S19 170 47) 113.6 47 24 3.0 iv? S22 207 65 147.0 47 2 44 25.7 336 136 62 876.6 4? 28 2.9 47 S47 162 47 419.6 3S 2] 3.4 S.? S52 153 3292.0 a0 50 3.1 10.4 394 162 65 «111.0 36 V7 43 14? 335 227 - - - - - - 396 176 72 «130.0 31 6 ae 1o¥ 361 tis 25 «665.4 42 2] 27 OQ? sos 162 62 120.6 45 Ze 40 19.8 364 240 «i41) 1768 35 19 0.8 13.6 366 264 61 203.6 44 2] 6.0 $2.9 402 146 3G «83.2 53 2? 2.8 12.9 404 132 46 6854 3? 19 3.6 16.1 405 306 160 2240 20 26 6.1 40.3 406 S64 1l4i 290.6 45 13 6.1 13.0 407 le? 968 110.4 3? 16 45 1o.3 406 144 45 680.0 Jo 28 2.6 16.7 409 166 «6115 108.0 34 16 49 36.7 410 147 36060 9.6 46 22 3.2 13.6 43s 195 66 129.8 a2 24 3.8 14.2
202

Appendix E (cartier
Individual Post-Treatment Values of Total Cholesterol (mg/dl), Lipoprotein Cholesterol (mg/dl), Triglyceride (mg/dl), and
Insulin (ulU/mi) for 50 Subjects
subject TC TG LOL-c HDL-c HDL TCAHDL-c INS
4i4 VFS BU 101.0 BQ 35 2.9 15.3 416 162 107 1146 46 2 | 40 245 ai? 143 103 Ba.4 42 2? 3.4 21.1 421 219 61 146.6 24 ZO 40 T.3 422 164 55 135.4 ai 23 3.0 9.0 425 199 102 145.6 ae l2 6.0 13.0 425 207 38 150.4 45 14 46 10.4 429 212 15? 149.6 31 18 6.8 12.8 434 1s? 66 106.4 a? 1? 42 1Q2.5 433 161 ol 118.8 32 34 3.3 11.4 437 1506 32 88.6 Bl 29 2.6 10.3 440 193 69 130.2 49 22 3.9 l4.2 dq 211 1Q5 142.0 45 28 44 217
203

Appendix F
Individual PreTreatment
Nutr
ient
In
take
s fo
r 59
0 Su
bjec
ts
ed
=’
ams,
Ura
—_
aL. ct Si
u Poly
Protein
(g)
Carbohydrate
(9 To
tal
Kcal
(g)
Subj
ect
Te —N& Yow TOOWOAM -OAMee— Oe OBO To
Oma—Noo- TANT TOM ToNaa-mMyYan
T-OONKFMOMTTONMC oF TTOMoOoOAAS NMOOTWUOTOOMO-—MOMMNTOONINING MUDDY KH NEN TENN N SH THKHNMMMNN KS
HW OMHENMSMOOOANNRDOT -DBoOAmMe
INTMIN-ORMYNOVONTYMOO-AatToaM TMDEMETROTORRn ND WOW ooarawe —— es gee — — — ——
HINT HNOONTRRAMTTAM—-OoTToOR ~MrNMEOMTOAMOANAT OOO ONATDOAOM— DOMNOMNOEMTPEOATNNNOCAr eID
-ONANSCHOMTOANMNNONANONDNMNNNE WOT HOOK MINNMT oR aga—-MNOe-KRR oot SATONANROMOCRMOGNKMA-NTOAONO NAME T See NNR RENN KKK KENNA HO
COOMNTTOMAMNOMOdTMeTmOrOOrR MM WIM LOL TAT — OMT NM HEME K ELS TONINAE NN OLIMWOMrMOUIMSETONE MS
= OT OD Oy Od > Od OS ON fm DO oN NO OST OO 0 pp mm ON EYP TU OO ETS LOL
Cod COP OSE ONY Coh Sf NE EC TE Cd te Bey BB I BB
204

Appendix F
(Lon
tinv
ed
Indi
vidu
al PreTreatment
Mutrient Intakes for
Polyunsaturated
Fat
(g)
Saturated
Fat
(g)
Tota
l.
Fat
(q)
Protein
(gq)
(g)
Carb
ohyd
rate
To
tal
Keal
(g)
ct
Subj e
TE NOON OTOMERMOANTROMomnoaaN MOONAMD HRY ROATR TTOMONR AR MMT =m TS TH NNNANNN EK NE NE KEK NNN
MOTT REET OMTOKMOMMANA—
MPNOOOHTUOODOMAMENTUOIMOe hs OMY TMMEKMPNAN KE NNANNAN MN EK MN TMM NAS
—OKMMTMAr~INENOCMNYNAOMOONNAYT oOoOoy—Tno-o-OTnNNMOoOnronMmMiMmea NNO WAM OO AAO HH = LI OM NO OO — — — —
NEE OOTY COOK NCOMranTayTa
MTMORDEOMOWOMOARNMORNMAOO-—wo AOD EE MP INP AN AE OWMWIEeE ORME Ow
DWNWINOWSMOMOMND-—BOONN KKMTNOM ONMTMOODOAM-T—ROND-OMGN-wS rTP TOOAOT HAR OMD-—-NOHKNAMrF—-MNMM NN SR RMN Se eH NEN NE NN EK MN SEK NN MeN
3620
2362
1696
14
236
2352
1634
21
92
1316
2939
1937
20
46
2962
1930
21
91
1689
1363
2243
2222
1762
2047
2970
2120
2370
1767
1737

Lys GZ
ath 99°0
L1¢ log
op Os
pao ot
OSI ae
LOP CZ
Ltt £60
L9Z GSe
OBZ OP
Gol Ly
lz PSE
Sep cI
86 0 Zz 0
aCe ZSE
O22 os
30° | S90
OZ LvE
ZLe PT
00'| 250
bre gee
GEZ P|
20° ISO
22 ZZ
GS | |
9Z'| 090
69| BIE
922 VS
cA0. PEO
SOP ZIE
19Z 96
620 €2'0
Sh GO¢
Og gp
P60 Se 0
G12 L0¢
Oz PP
790 Lp
P6I COL
PSI ZI
1o'l ZS0
687 ZOE
G9Z o'|
gO’ | tl
1 GZ gSZ
ZA ty
Lt 020
zal ZGZ
ES? 3°
Z6'0 6r'0
PLE BPC
G6s Z|
p60 99 0
622 ZV
99] as
g6'0 reo
GLI OL
652 1 Z
930 e200
ez Aa
gGp OG
76 | OG |
ZC 61Z
G/ |
GZ 560
£20 062
G1Z POP
Lg ZO
Gz 0 P'6S
602 66P
pz 260
£20 €7S
90Z OPZ
g€ ot
9Z | LL
| OZ
(Bu) (6)
o1ed o1ey
(6) 424
[G4a4salouy 4Aaqt4
G/L S/d
Pa eINeSUNOUGL
yaalqns
S199 GNS
OG JO)
SAYE IU]
JUSIIINN JUSWESa
Lag
JeNplAipuy|
eau“ve7) 4 xipuaddy
206

cpz re
Z6'0 cg'0
Zz
pry GSI
SP cy |
ZO
19° OPP
QSz c¢
LO" GI‘
f'0Z Lp
ZBI BZ
B0'| EL0
6 Or Gey
ELE 6
£90 OPO
E2Le pep
OLY ‘|
cP | Pro
PLS 62P
OPP LS
Lee 9P'0
Pre gZy
G6P o's
60'| PLO
GOs GZ2P
B97 9¢
eg Oro
Gz
Zep Sal
QI 09
Po ZO7
Zp va
09 LS0
eGo GSI
Ly g9¢
vP Stl
PLO 2 Oe
OIYP OPT
GZ GO|
£60 SVE
PIP geG
LZ eS'|
260 Pgs
Sip 62
we 660
ve G9z
OP ZLP
EZ 960
£0'| ELZ
GOP O27
LY Le'|
1g°0 162
BOP B27
"| P60
OS 0 OPI
LOP 961
LZ Pi
PY'0 | QZ
GOP 6S|
re 20'|
£20 P62
GOP ZZ
a6 98'0
esa Pie
POP 19Z
P| £o'|
O90 69h
ZOP 9G |
g's SO'l
PoO OV?
99¢ gc¢
Pol Pil
rat! ELE
PIL 905
LY G60
920 GSP
E9¢
(Gus) (6)
01a o1ey
(6) ye4
[O49 1Sa|oy7
4aqgi4 S/L
S/d Pa
PoUN|SSuNGuop| ysalqns
$19a[qnS OS
40} SOAS LU]
JUSLIINA yUSWyeaU
Lau, [ENpPIAIpUy
euuuie7)
4 “ipuaddy
207

Appendix
F (Lontinuved
Indi
vidu
al PreTreatment
Nutr
ient
In
take
s for
50 Su
bjec
ts
% Fa
t %
Carbohydrate
#% Pr
otei
n (q)
Pectin
Sucr
ose
(g)
gar
(q)
Su
a q)
ubj
an
TOMOAM—-OoOnagNngemuoa-— A~DWOMOVOMABOA —MAMOATMIDININN BR OOR Inthe —AMaINn YE TSM MMT NL TMM Miphy TTP she tT
NON OQMoMMe TT TNWOAMM AIIM TIN
MINWT NR RAN TOMMT OVANMINM Tint owe Se ee EQ Re mK RK QR Re Re ee ee ee ee
OM -WMNYTENMAS NONE NTO MOMMY TONS OMOMONK MORK TNaANoOTMnR Go TIT TOY TN TOMT OT OMT aM TMM Ts
NMOWTONMNINS — eer Taner eense OrmoOTOS DOdOOTT -—MoOosTo--—No
NM TOAM-COHK MAN TO-MAG—raaEr MOONE OTINONER TOHINMOOMONMR InN NN PY DOL eM MODBOHTMOTNSE TING — — =
NE ONNOVO-ORRNOTOSCToarnaro® WHER OK OOTONMOR-OCOMRRaAMR MOMNANOONANMON — Te MONT me mmore
208

Appendix
F (Lentnued
Indi
vidu
al PreTreatment
Nutr
ient
In
take
s fo
r 50
Subjects
% Fat
% Protein
# Ca
rboh
ydra
te
Sucrose
(g)
Sugar
(q) Su
bjec
t
TCL NOM ON OMMNIOOMAKE TH -—COuOMN —OTOO-—ANMNO-TOTROMOMnUOORM MT TMM ATY TM TTY MMP TMM TAT T
INO OMNAMH HNO KNW MK OR OMMNaAT N-wo— ~MATNTonaooMintnarT— —MMMIN = gee ee — ee |= = | a ee eee Qe gee ee ee ee ee oe
MAANDO-Oo— ‘HOM ODOM—rEENOMT—MT—
O—-AN-—NAMAMAMAAMRoN-oOMoaMNM NYT TMNDOMT TMMOMMMNTDTTMnToMin
TMMNDNME KOT MKOCANOKONK TINY —-NKSCOMMS—-—CO-—-NOSOO-—NOOCCOO-—IN
—MNKSOMMANE DK CATOVOMrrsoor-e
ONTMONNSONONUNOTMROaATTONAMM wo TS — SOTMMOO-ADOONMOMNSHTRARND
w= Ge = — qo
=—MONKNTTONRNNOCOANSCANMCOMNG NAM THN -NMOTOANKRMOAM-O-MT Hom MMTOTH He MK CATR AMOOANDO—
=_— —_— — ee Se Ee — —_— = = es —
MTONTRIOMOMOMYTOr -NNORATINE-ovt VOODOO VOCODKE TTT TAAAAAMMMTT MMM TTT vr rrr rrr errrrrru ay
209

Appendix G
Indi
vidu
al Post-Treatment
Nutr
ient
In
take
s fo
r 50 Su
bjec
ts
Polyunsaturated
Fat
(q)
Saturated
Fat
(g)
Total |
Fat
(q)
(g)
Protein
Carbonyrate
(g To
tal
Keal
(q)
Subject
CWO PeAMNH DORE MMENAMOAAAQAN
NTO MOONE ATMS ERAT ANE AYR ONG rm oN —MMN —— NEN Ke
AMT NMNOATS CMNATAS=-MAOANMANM
TNUSCSCANMONME NS SOUR MMT TS
OMMNONTERA-KTOAON AHN KEY MOO-aMm MA MMINON TRORNR-—GQONKRRR ONIN AO MOoPrMNN-MOOMNMrTONTYwuvooryer
=—MMNTROrAODAONMOMMNNMADOFTOM CMUOWUMONNMOMOTOMO-OTTME OW MOM AIIM MOON NIANGTHM TMM st tin
MMDOOMAOTWOOMTNEOO—-—AVOeOUMAw NOOO MOMSNM MAMAN -NaAMNATK a OMNMDBOAMDBAMMAOOMMNAINNOORNONS
NOM NDE NM TNOWOMAMYTOOOD TNO ONDWOD—TORPrNMNADMAUATY NO Tr-P OTT SOTM NORM MTPMSTANTVarss
ON ee A ee RS PTOO--AMTYOMGOOO- K-AMTmNninws CNEONE ONT CNTON CNTECNEECN CONE 99 9B DD DD
210

Appe
ndix
G
(Lor
tinu
ed
ts
eC
Individual Post-Treatment
Hutr
ient
In
take
s fo
r 50
Su
bj
Polyunsaturated
Fat
(q)
Saturated
Fat
(q)
Total
Fat
(q)
(q)
Protein
ee
Carboh
Total
Keal
{q)
>
aa)
Sub
je
Oy — ToToann— ~—TMIOINOND-DNOTONnN
TON TOM OMMT TONY TORNION TENA —_— ~~ NY
~AMOMOM MOOI MNOMNOMNTOroaor AT MOWOMT OV AVVoOToOOeNs SNM
OT OMMENOOON-TON— O-—oastao LOIN TIM OM COIN MINNA Y Nin gm pin yo
ONO TRNOMONMOR-TTOOROONMTRN OYRONNANTONengoatTounoartna—wo INNS R TRAIN TINM TOT TOR OoINE Ine
OT—-—DBONOOKMARKE TH TOMoR»wreoanvoean MNT MOCONUMA-N-woOe-uNoOo-TAN ~-Or DOR MO-—TONTYTONNEFAMUAOOMS
IS74
1367
74g
610
1265
1908
2009
1722
1601
1950
1354
1361
1220
1027
1490
GE I
CBE
1477
1623
1405
1929
1445
1424
1232
1264
211

Per PP
Pol S90
922 19¢
Ozt 9¢
690 ZL
Le QS¢
PPZ SO
OZ |
EL GLI
SS¢ cL i
rs Zi
Oz | O'9Z
PSE ELE
Se Iv
090 OZ
ZSe g9¢
6S cll
LZ £02
Lve Bt |
60 1o'|
9£°0 Zee
926 ZL I
pe 160
ZOO G<I
CZ O09
£0 660
Pe 0 EPI
61£ aa
ZZ ar’ |
ZL‘O 69
ZIE al
Le 00'|
OF 'O 6'0¢
BOS Ze
62 LEO
gf°0 eZ
LOE £9 |
I ZZ I
970 CPS
COE PLI
i 00'|
£90 Chl
ZOE L6P
Ot GZ |
Pal cOl
952 BP
ZI fh
OS | O'9Z
ZSC IZ I
LZ Z|
96 ££Z
8b 2p
90 OL
gO'| SLi
CVC cL
| PL 0
O£'0 gc
O£2 £92
| GLO
ISO gv
| Z2C
6 Op
O2'| G90
6S 612
id 6
OZ | O£°0
oC Q1Z
LOZ Ll
Go| SOZ
8°02 602
PSP q's
Pol 020
LEZ 902
Gt | PI
GZ pz
EPI 102
(Buu) (6)
o1e¢ Olea
(6) ye4
[O13 1Sa (Gyr
4agl4 G/L
S/d PaPunjesunGuoGys
yoalqns
SyIa[GnS OG
JO) SAYSpUl
JUSLIINN JUSW4eS4[-1S0g
([ENPLALPUY
gauyve7)
xipuaddy
212

GZ l¢
OZ |
L724 C1?d
PrP
99] o>
96 0
S50
bel OVP
69¢
L¢
PZ I
Crt
O>ol LEV
IOol PS
Pd tl
tll
202
CV oo¢
GS
IZ 4 £20
¢° GZ Por
O12
61 OZ
| 920
90¢
oHCV 9G2
O?
IZ) G16
oer
SZP OBZ
99
90 |
O96
G6
GZ2vr 12d
61 att
Ol?
06
CCP 92
| OZ
tcl S906
19 icp
Oo9Pr G7?
£606 65
1 irl
LIP 921
Pil Oc
| 920
¢ Ol OlP
Gcl od
i380 G20
£6)
PIP
LCC
Ce
P90
02 0
26
clr Vil
6 | an
| 00
| gG|
OP
Gil cP
OP
| ¢GO0
oG¢
6607 Old
lp So
| cc
0 O12
BOP £22
ov
PO |
Ico
OZe
LOV 622
OZ
IZ l
Poo
Pv OP
90P ti
6S
99 1
CBU
9¢¢
Gor L272
L¢
OS |
090
PPC
por
Z91 oe
10 1
OP O
ILI COP
Cld
OZ
Or |
oP 0
SLi
990¢ O¢¢
L£2 Po
I 080
9T |
VIE
Lév
ol 901
¢80
c 02
e9O¢
. (Busy
(6) o1yey
o1yeA (6)
ye4 [O484ySalOyy
4Aaql4 S/bM
S/d pa Sunypesunouoy|
yaelfqns
sjva[gns OG
JO} SAayeyUu]
JUSLIZNPY JUSSI
~7SOYg [ENPLAIpu|
puruvo7)
Y Xipuaddy
213

Appe
ndix
G
(Leatinued
Indi
vidu
al Post-Treatment
Nutrient
Inta
kes
for
50 Su
bjec
ts
%® Fat
% Ca
rboh
ydra
te
% Pr
otei
n Pe
ctin
(g)
Sucrose
(q)
Suga
r (3)
Su
bjec
t
—~“ROTMOrOOoooS MION TS TINndOounnnNnmMaow MOMNOSONOMOO-—-OAMBR-—MOAN-—AMO-INnD TMD TINT SIMMS MDMMMTEMMD MMS
MOOMANQINOMONTNN$§ TONA-—Oe—M —VYSOOONAR-—N IN TONOTMANTYNoOtoR
NONCONMOROOMVO-MENO-MeAOOT NWDO-MNOA—-OMONOHMAN-—NnNMmMTRT MUITOM TTR TMMUoMTMMTONTOwon TM
—TOKD-MNONMN-STMA-MMNAMNANGE
NN HO-O-O-SCSCO-SCOSCSCTOMOOO-N
AAMOAAOMMVOSOMNMNEENMMAOToOTTmM COMUNAMMONATONTOOOUMOTTaAoNn OOP-SMBOKMMAWUWAWHM H—KMNKMMmoan
AMOK MAH NInIN AiAMAmMn oom NOOANMAMTMOM—-OMN NOONE NYTID
— — = — —— ee ee
~VWMNDANCNONDAMRPONDNORNATOO— OOOH HK NMTTMOMOCCOKKAMTMMWWIO CNN GN GN NNN ON N39 8 PP PD POPE
214

Appendix
G (Lentiaved
Individual Post-Treatment
Nutrient
Inta
kes
for
50 Su
bjec
ts
% Fat
% Carbohydrate
% Pr
otei
n (g)
Pectin
Sucrose
(g)
ar
3) Su
Subj
ect
OMTHVTRANDO--COMaATTHRMRORKRA TINWONWMOOCKRO-ANM-—M-OYRMYaM MMTTAMM TIMMAMAMAMMIATAMMNT
OOO—-TOTMnamyra-Doanornnomy NIN OMATRATANNANNOMaoMooOaS
MTA SCOK NN KON SCOANOMANAN TMOA-OUORMOCOHUOUNTOORMR NNO NT MMOS TT NMNoOT nyo TAanmnnrTnm
MOAN DMAPNDSOTOTANEOONNORNIN DODO—“NOMANDONDOM=—MOCOMOROE
A—-NNMTMOPFODONRNNEM——TOODOwO NMOTYNODNOTOOTIR NOAMAMNNOR NIMH MAY OOTORKTMON TR MAMMMNAN
—_— = = —
~ONMODOTANTATONE MT ENN ENE © MYNMATINSTONTOCOROMNYT Tammoayt TON KOTR HARON TOR COMMNOMMmT — ee = = Ee
215

Appendix H
Individuel Height, and Exercise and Nutrition Group Designetion for 20 Subjects
Subject Height (cm) Exercise Group Nutrition Group
20 | 206 269 216 219 222 250 242 243 252
tN
& ~
CHEN CACHAN
ON OND OCHO
CNA DCAM CAA
ANI UTM OM
DB OID CACO
DOD ON ~Lm
CO CS
G4 Ch
CO me
COED C
OED
CR SO
OI
C BS
OTST
GG G
8 ALD
Ad CT
SI CAT
me SGA
WD
ON Qn
tho O OUT OA
A SIRO CON
OO A
CUTA
N CN
CNA
BR SN OOM
KO
—= CARS GIRO RD
GY = GIRO BO CA
Gd —
bo fo CA OA = Bo GIR GAGA GAGA BO
Ra
Gal
= GA
GAN
DD
GA
216

Appendix H (Leatinued
Individue] Height, and Exercise and Nutrition Group Designation for 30 Subjects
Subject Height fem) Exercise Group hutrition Group
417 421 422 425 426 429 434 435 437 446 444 H
OCAHHA
HAHAHAHA
ASOOOARVNND
— O-PS AON
NO
sar
ade DPS) ae nek eee KAD
se
ee
BR CA
LC
= GAB
RO ee
et
GH
1 = Exercise (70%+ sttendence) or Nutrition (BO%+ attendance): 2 = Some Exercise (30-70% attendance) or Some Nutrition (less than 60% attendance), 3 = No Exercise (lees than 30% attendance).
217

Appendix |
Pre-Treatment Mean Values of Body Weight and Composition for All subjects, and Divided into Nutrition and Exercise Groups
Bodu wernt % Fat &% Lean % Godu (KG) water
All Subjects o0.0 39.7 60.2 39.2
Hutrition Gu.9 39.] 60.6 59.6
Some Nutrition 66.0 40.9 59.6 36.4
Exercise G45 37.5 62.4 40.8
Some Exercise 66.6 40.2 39.6 36.6
No Exercise 95.4 40.4 99.5 36.6
Between Nutrition groups or among Exercise groups, no significant differences exist st
the p = .O5 level.
218

Appendix
Pre-Treatment One- and Two-Minute Mean Recoveru Heart Rate Values, a5 ¢ Percentage of Immediate Post-Exercise Heart Rate far
All Exercising Subjects, and Divided into Exercise Groups
MEANS
One-Minute Pate Two-Minute Fete
4il Exercising oo 1 B40 subjects
Percige 62.0 86.2
Some Exercise 95.4 94.6
No significant differences exist between Exercise groups at the p = .05 evel.
219

Appendix K
Pre-Treatment Mean Vajues of Total Cholesterol (modi), Lipoprotein Cholesteral (mg/dl), Triglyceride (mg/dl), and Insulin (ulU/ml} for Al]
Subjects, and aivided inte Nutrition and Exercise Groups
TC LDL HDL HDL2-C TG Ins TCAHBL
All Subjects 2029 1339 4&s 35.4 BO 247 435
Nutrition 200.0 i204 46.6 250 ud 25.1 435
Some Nutrition 2097 1472 506 264 £641 234 434
Exercise 2040 136.6 487 2485 65. 16.78 433
Some Exercise 215.1 !d34 522 27.4 Ql 202 440
No Exercise 193.4 1256 468 242 1052 31.50 432
Between Nutrition Groups or Among Exercise Groups, values with different letters as superscripts are significantly different form each other et the p = .05 level.
220

"JANIE GO
= d
ayy 7e
Way ye Yaws
aay
jus sep
AppUeaiyiubis ase
Sudiasaadns
se ssaqyay
PUA IP
QPL
sanjes ‘sdhiag
asbuiacy Buotue
au edna
Udy Layny
Uaeyog
qe Zl
zs
S69 acs
Gore Solle
asiuaxg on
qr ol L2z
oP B99
B00
Press! asiuaxg
aus
of £2
622 S68
Fo
Fo0c £9891
aSIIAGRy
el Qe
eo8 les
Mess beZ1Z
— UOlyLyny
awios
OG 062
wg
069 Bile
ZProdl WoL)
Pel bas
0738 Ze
FeIZ £12461
syoalqns, Liv
(6) 484
(B) yey
(5) 484
(B) b)
CED payeunjesunfitog
pajyeaunyes 30)
waqyorg ayeuphyoque)
= jeqo,
Sdnoig astauax 3
pues UOLLANN
CVUL PaplAlp
pues ‘syaalgns
[| aod
Sanje
UBAaly AYeQU]
JUBLIGNN JUaUIVBAI,
-Bug
| Xipuaddy
221

jada] GO
= d
ayy ye
puarayyip Fpueouudis ae
sydtacsdadas £8
$3syyay pUaua ip
Ypley san
yer “ednoay
asbouaxy buowe
av edad
Uo LaynN
UaeAjag nee
ees eee
cee
apy
OZ F
ea] azQ
fas AS lwaxq
ON
Qvbz POS
ze |
zoo gee
as1I4aNy aus
_F'69r ace
io} ogg
vos dS 1IIAK
gl Pas
egg ge |
Gig lPe
UL
LAyNpY AWS
py’
oG¢ FO!
G99 06z
UO! LINN
a ous PGs
Qn Z80
lie syoatqns
UY
(Dw) cf)
ORY o1jey
(6) ye4
[9144890
jadi Sil
Sid payeanyesunouoyy
— sdnoag astwaxg
pue UI LINN
GUL
PapiAIp pue
“SyAalgqns [py
40) Sanjer
Uva]
aye UY
UALINN JUaUNBAL)-arg
arwyve?)
]) Xipuaddy
222

"[aAa, GO’
> d
ayy ye
“ednorg a6
1944-79 buowe
16 Sdndug
UolpLaynN Usojaq
[Sika SesUadasJIp
pUeIILUbLS Ufy
£28¢ oF |
2 SP Lied
e298 92Z\
d51I404F
OP
SI LPP
PO} G99
P26
BS19ASA J
BUIOS
c <P BT
| TIP
tt |
£19
col
S31IIGHA
PbS
é Gl Gev
6L¢
P28
AS
UGLY LANE
GUIOS
OP
Zvi SVP
BV |
62d
¢ 901 UOL
ply rip
SOP
BT I CrP
£91 C6L
0901
syaalgns ity
4X
ulazyIgy#Y asyeuphyoquey
¥ a
ash mins g
ns
SANGIN SSlaiexy
pues MOI
LIip) OFUL
PapiAlp pue
‘syaalqns [py
sos Sane’,
UBaL] Aye
PUY JUSLIWNINY
(Pxeuunrsa) 7 Apueddy
{UBUIE
Ad) -ad
223

APPENDIX M
OBESITY IN BLACK WOMEN FORM NO. 1
SUBJECT NO. DATE YEAR
SOCIO-DEMOGRAPHIC INFORMATION
1. AGE = (RECORDED TO NEAREST MONTH ) MONTH, DAY, YEAR
2. EDUCATION (YEARS OF FORMAL EDUCATION COMPLETED)
3. IS SUBJECT: (1) MARRIED; (2) WIDOWED (3) DIVORCED; (4) SEPERATED; (5) NEVER MARRIED
4. TOTAL FAMILY INCOME (INCLUDE WAGES/SALARY, WELFARE PAYMENTS, CHILD SUPPORT, SOCIAL SECURITY PAYMENTS) PER MONTH PER YEAR
5. OTHER THAN MONETARY INCOME, DO YOU RECEIVE
(a) WIC (b) FOOD STAMPS
(c) GIFTS (FRIENDS/RELATIVES)
6. HOW MANY PEOPLE DOES THIS INCOME SUPPORT?
7. WHO LIVES IN THE HOUSEHOLD WITH YOU? (INDICATE BY
NUMBER )
(a} HUSBAND (b) PARENTS OR GRANDPARENTS (c) CHILDREN (d) RELATED FAMILY YOUNGER , OLDER THAN YOU (e) FRIENDS
8. IS SUBJECT EMPLOYED? YES NO
9. IF EMPLOYED, IS SUBJECT EMPLOYED (1) FULL-TIME (2) PART-TIME
224

10.
11.
12.
13.
APPENDIX M (Continued)
IF EMPLOYED, WHAT IS SUBJECT’S OCCUPATION? YOU DO MOST )
(1) PROFESSIONAL
(2) PROPRIETOR
(3) BUSINESS
(4) WHITE COLLAR
LOCATION OF SUBJECT’S RESIDENCE
(1) SMALL CITY
(2) OUTSIDE OF CITY
(3) RURAL
SUBJECT BECAME OVERWEIGHT DURING:
(1) CHILDHOOD
(2) TEENAGE
(3) DURING PREGNANCY AND AFTER
(4) LATER TIME
DOES SUBJECT HAVE ANY OVERWEIGHT
RELATIONSHIP AGE
FORM NO.
(5)
(6)
(7)
(8)
(CONTINUED )
(CIRCLE ONE
BLUE COLLAR
SERVICE
FARM
OTHER
FAMILY MEMBERS?
HEAVY VERY HEAVY
fo
to
or

APPENDIX N
MEDICAL HISTORY OF SUBJECT AND FAMILY, FORM NO. 2
OBESITY IN BLACK WOMEN
SUBJECT NO.
DATE
It is Ymportant that we ask the following questions because
your medical background, certain drugs, smoking, alcoholic
consumption and your menstrual cycle can affect the outcome
of some of the analyses we are doing. Your replies will be
kept in strict confidence.
1. DOES THE SUBJECT HAVE THE SICKLE CELL TRAIT? YES NO
2. ARE YOUR MENSTRUAL PERIODS REGULAR? YES = NO__ DATE OF LAST PERIOD
3. ARE YOU TAKING BIRTH CONTROL PILLS NOW? YES_ NO__ NAME
4. DO YOU HAVE ANY KNOWN ILLNESS OR CONDITIONS? YES. NO__ NAME
5. ARE YOU TAKING MEDICATION FOR ANY ILLNESS OR YES__ NO__ CONDITIONS? NAME DOSAGE
6. HAVE YOU TAKEN ANY MEDICINE DURING THE PAST YES. NO__ WEEK? NAME DOSAGE
7. .&IS THERE AN ILLNESS OR CONDITION THAT YOU YES. NO__ SUFFERED FROM IN THE PAST, BUT NO LONGER HAVE? NAME HOW LONG?
8. ARE YOU TAKING ANY PRESCRIPTION MEDICINE, YES NO__ GENERIC OR BRAND NAME MEDICATION FOR WEIGHT LOSS? NAME DOSAGE HOW LONG?
9. DO YOU SMOKE? HOW MUCH/WEEK? YES. NO
10. DO YOU CONSUME ALCOHOLIC DRINKS? YES. NO __
HOW MUCH/WEEK?
11. DO YOU HAVE HIGH BLOOD PRESSURE? YES. NO

APPENDIX N (Continued)
FORM NO. 2 (Continued)
12. DO YOU HAVE DIABETES? YES = NO
13. AMONG THE SUBJECT’S BROTHERS, SISTERS, PARENTS, AUNTS, UNCLES, OR GRANDPARENTS, IS THERE A KNOWN CASE OF:
HEART ATTACK NO. CASE YES NO HIGH BLOOD PRESSURE NO. CASE YES NO__ DIABETES NO. CASE YES = NO CANCER NO. CASE YES NO GOUT NO. CASE YES. NO GALL BLADDER DISEASE NO. CASE YES. NO__ EMOTIONAL/MENTAL PROBLEMS NO. CASE YES NO__
fo
to
~J

APPENDIX O
PHYSICAL EXAMINATION/MEDICAL APPROVAL, FORM NO. 11 OBESITY IN BLACK WOMEN NAME OF SUBJECT SUBJECT NO. DATE
1. BODY TEMPERATURE
2. BLOOD PRESSURE SYSTOLIC DIASTOLIC
® FINDINGS OF EXAMINATION:
is interested in participating in the
series of weight reduction lessons in the DEB Program
conducted by the VSU Nutrition Research Project. This educational program is designed to help women evaluate and
restructure eating habits and activity patterns to bring
about weight loss. It uses principles of behavior
modification to encourage changing actions or habits related to overeating and/or underactivity. The program has been
given the acronym DEB--diet, exercise, and behavior
modification.
The diet plan used is based on the seven food group exchange
system used for diabetic diets. The minimum calorie level
used is 1200. Participants are encouraged to determine a
calorie level that will bring about a weight loss of one to
two pounds per week.
Participants in the DEB program are encouraged to increase
their physical activity to help burn calories for weight reduction. Sports, low impact aerobics, walking, jogging,
and jumping rope are suggested. However, any increase in
ohysical activity is completely up to the participant.
On the basis of a physical examination and/or the medical
history of this patient, do you feel this patient is
physically able to participate in the weight reduction
program? No Yes
Activity limitations
Dietary tlimitatons
to
ro ©

APPENDIX P
ANTHROPOMETRIC MEASUREMENTS, FORM NO. 3
OBESITY IN BLACK WOMEN
SUBJECT NO.
DATE YEAR
*ASK SUBJECT TO REMOVE SHOES AND ALL HEAVY OUTER GARMENTS.
1. BLOOD PRESSURE (1) (1) SYSTOLIC DIASTOLIC
(3 READINGS) (2) (2) SYSTOLIC DIASTOLIC
(3) (3) SYSTOLIC DIASTOLIC
AVERAGE OF 3 SYSTOLIC DIASTOLIC
2. ARM CIRCUMFERENCE CM
3. TRICEPS SKINFOLD MM
4. SUBSCAPULOR SKINFOLD MM
5. HEIGHT CM
6. BODY FRAME: SMALL MEDIUM LARGE
7. WEIGHT LBS. / 2.2 = KG
8&8. BODY WEIGHT KG = (WT - CLOTHING WT )
CHECK THE CLOTHING ITEMS WORN WHEN SUBJECT WAS WEIGHED IN woos TO OBTAIN CLOTHING ESTIMATE. CALCULATE AND RECORD IN
CLOTHING LIST:
BRA: NATURAL (25 G) PADDED (40 G)
PANTIES: NYLON (18 G) COTTON (20 G)
SLIP: FULL (110 G) HALF (80 G)
SOCKS: FOOTLETS (30 G) SHORT SOCKS (35 G) KNEE SOCKS (50 G)
fro
to
co

APPENDIX P (Continued)
ANTHROPOMETRIC MEASUREMENTS, FORM NO. 3
OBESITY IN BLACK WOMEN
SUBJECT NO.
DATE YEAR
CLOTHING LIST CONTINUED:
SHEER HOSE: KNEE LENGTH (25 G) PANTY HOSE (60 G)
GIRDLE: PANTY-TYPE KNEELENGTH LONG-LINE
SLACKS: POLYESTER (250 G) COTTON (360 G) JEANS (440 G)
SKIRT: LIGHT (250 G) MEDIUM (360 G) HEAVY (420 G)
JACKET: LIGHT MEDIUM HEAVY
BLOUSE: LIGHT (100 G) MEDIUM (190 G) HEAVY (280 G)
SWEATER: LIGHT (320 G) MEDIUM (390 G) HEAVY (440 G)
BELT: LIGHT (60 G) MEDIUM (100 G) HEAVY (140 G)
DRESS: LIGHT MEDIUM HEAVY
OTHER: LIST AND WEIGHT SIMILAR ITEMS

APPENDIX @Q
BIOCHEMICAL DATA, FORM NO. 4
VIRGINIA STATE UNIVERSITY
OBESITY STUDY IN BLACK WOMEN
SUBJECT
DATE YEAR
BIOCHEMICAL DATA
SICKLE TRAIT (Hg-S)
HEMATOCRIT %
HEMOGLOBIN g/dl
SERUM IRON ug/d}
TIBC ug/dl
TOTAL CHOLESTEROL mg/dl
HDL CHOLESTEROL mg/dl
T. TRIGLYCERIDE mg/d}
FASTING GLUCOSE mg/dl
INSULIN
PLASMA CALCIUM
PLASMA MAGNESIUM
PLASMA ZINC
PLASMA COPPER
RBC ZINC
fo
@ +
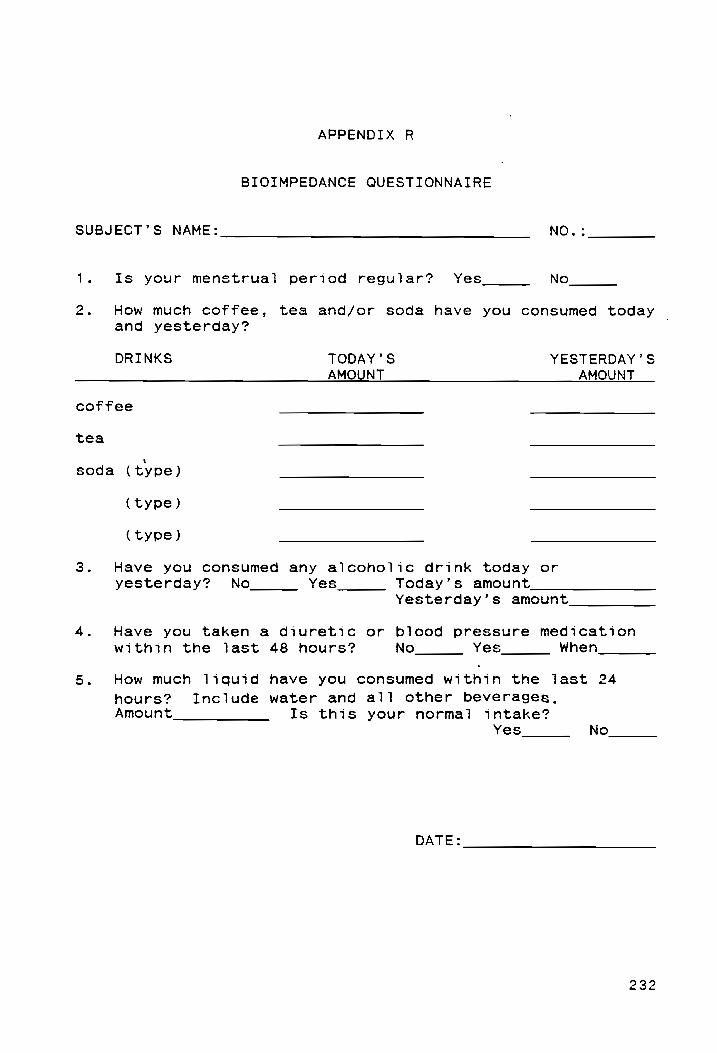
APPENDIX R
BIOIMPEDANCE QUESTIONNAIRE
SUBJECT’S NAME: NO.:
fo
Is your menstrual period regular? Yes No
How much coffee, tea and/or soda have you consumed today
and yesterday?
DRINKS TODAY ’S YESTERDAY’S AMOUNT AMOUNT
coffee
tea
soda (type)
(type)
(type)
Have you consumed any alcoholic drink today or
yesterday? No Yes Today’s amount
Yesterday’s amount
Have you taken a diuretic or blood pressure medication
within the last 48 hours? No Yes When
How much liquid have you consumed within the last 24
hours? Include water and all other beverages, Amount Is this your normal intake?
Yes No
DATE:

APPENDIX S
PHYSICAL ACTIVITY FORM, FORM #5
(Modified from S-150)
Subject No. Date
Year
THE FOLLOWING SET OF INFORMATION NEEDS TO BE ASKED FOR EACH ACTIVITY IN WHICH THE SUBJECT HAS PARTICIPATED DURING THE PAST YEAR.
(YEARLY BASIS) (TOTAL HOURS) 1. YEARLY (TOTAL HOURS) 2. MONTHLY (THROUGHOUT THE 12 MONTHS) 3. WEEKLY (THROUGHOUT THE 12 MONTHS)
INTENSITY
—_i,
. LIGHT (NO SWEATING, NOT TIRING) 2. MODERATE (SWEATING, SOMEWHAT TIRING) 3. VIGOUROUS (PROFUSE SWEATING, TIRING TO EXHAUSTING)
FOI OOO COOK GOO I IOI III KICK KK 0K 2K
1. BICYCLING YEARLY BASIS (TOTAL HOURS )
# OF DAYS/WEEK
MINUTES
INTENSITY
ACTIVITY CONVERTED TO TOTAL HOURS
2. VIGOROUS DANCING YEARLY BASIS (TOTAL HOURS )
# OF DAYS/WEEK
MINUTES
INTENSITY
ACTIVITY CONVERTED TO TOTAL HOURS
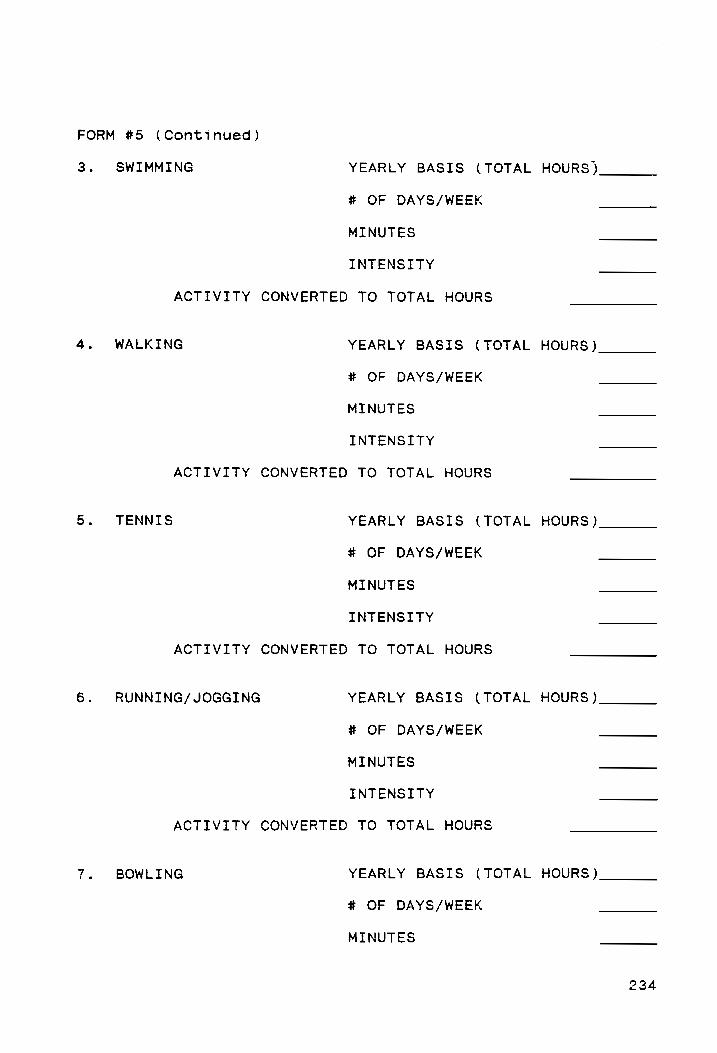
FORM #5 (Continued)
3. SWIMMING YEARLY BASIS (TOTAL HOURS)
# OF DAYS/WEEK
MINUTES
INTENSITY
ACTIVITY CONVERTED TO TOTAL HOURS
4. WALKING YEARLY BASIS (TOTAL HOURS)
# OF DAYS/WEEK
MINUTES
INTENSITY
ACTIVITY CONVERTED TO TOTAL HOURS
5. TENNIS YEARLY BASIS (TOTAL HOURS )
# OF DAYS/WEEK
MINUTES
INTENSITY
ACTIVITY CONVERTED TO TOTAL HOURS
6. RUNNING/ JOGGING YEARLY BASIS (TOTAL HOURS)
# OF DAYS/WEEK
MINUTES
INTENSITY
ACTIVITY CONVERTED TO TOTAL HOURS
7. BOWLING YEARLY BASIS (TOTAL HOURS )
# OF DAYS/WEEK
MINUTES

FORM #5 (Continued)
10.
11.
BOWLING (Con’t) INTENSITY
ACTIVITY CONVERTED TO TOTAL HOURS
FARMING/ GARDENING YEARLY BASIS (TOTAL HOURS )
# OF DAYS/WEEK
MINUTES
INTENSITY
ACTIVITY CONVERTED TO TOTAL HOURS
OTHER (JOB RELATED) YEARLY BASIS (TOTAL HOURS )
# OF DAYS/WEEK
MINUTES
INTENSITY
ACTIVITY CONVERTED TO TOTAL HOURS
OTHER (HOUSEHOLD TASKS ) YEARLY BASIS (TOTAL HOURS)
# OF DAYS/WEEK
MINUTES
INTENSITY
ACTIVITY CONVERTED TO TOTAL HOURS
OTHER, (PLEASE SPECIFY) YEARLY BASIS (TOTAL HOURS)
# OF DAYS/WEEK
MINUTES
INTENSITY
ACTIVITY CONVERTED TO TOTAL HOURS
ro
w
om

VSU Obesity Study
l. Dancing( aerobic)
2. icycling
3. Swi mmi ng
4. Stretches
5. Golfing
6. Walking (circle) Outdoor:
a. slowly
b. moderate
ce. rapidly
d. upstairs
7. Tennis
8. Running
9. Jogging
Intensity:
1
APPENDIX T
ACTIVITY SCURE
EXERCISE ACTIVITY LEVELS
2
Frequency
# of months # of days/week
Frequency # of months # of days/week
Frequency
# of months
# of days/week
Frequency
# of months
# of days/week
Frequency
# of months # of days/week
Frequency
f of months
f# of days/week
Frequency
# of months # of days/week
Frequency
# of aonths
# of days/week
Frequency
# of months
# of days/week
light, mild, moderate, vigorous
3 4
NAME
DATe
minutes intensity activity factor 6.4
minutes
intensity
activity factor 5.0
minutes
intensity
activity factor 4.0
minutes
intensity
activity factor 4.5
minutes
intensity
activity factor 5.0
minutes
intensity
activity factor 5.0
ainutes
intensity
activity factor 7.0
ainutes
intensity
activity faccor 14.0
minutes
intensity
activity factor 9.0
236

APPENDIX T (Continued)
10. Skating, Ice Frequency minutes # of sonths intensity
# of days/week activity factor 7.0
ll. Skating, Roller Frequency ui nutes # of months intensity # of days/week activity factor 7.0
12. Bowling Frequency minutes # of aonths intensity # of days/week activity factor 3.0
13. Calisthenics Frequency minutes # of aonths intensity f of days/week actvity factor 4.5
14. Farming or Frequency minutes
Gardening # of months intensity # of days/week activity factor 3.7
15. Snowskiing Frequency ainutes fof aonths intensity # of days/week activity factor 8.0
16. Housework Frequency minutes
(Standup work) # of months intensity # of days/week activity factor 3.7
17. Volleyball Frequency ninutes # of monchs intensity
$ of days/week activity factor 5.5
18. Other Frequency ainutes (Please # of aonths incensity specify) # of days/week activity factor .
Intensity: light, mild, moderate, vigorous l 2 3 4
237

APPENDIX U
ACTIVITY RECORD VSU OBESITY STUDY NAME:
Please record any activity you do, for the days listed,
along with the number of minutes per activity and an
intensity factor of either: 1) light, 2) mild, = 3)
moderate, 4) vigorous; or any other intensity indications
(ie: heartrate, sweating or not) -Thank You!!
Monday
Tuesday
Wednesday
Thursday
Friday
Saturday
Sunday
ro ®

APPENDIX V
FOOD RECALL #2, FORM NO. 9
OBESITY IN BLACK WOMEN
SUBJECT NO.
DATE OF RECALL YEAR
HOW MANY DAYS OF EACH WEEK DO YOU USUALLY EAT SOMETHING FOR BREAKFAST? (CIRCLE ONE) 0 1 2 3 4 5 6 7
DID YOU EAT BREAKFAST YESTERDAY? YES NO
WHERE DID YOU EAT THE FOOD IF YOU ATE SOMETHING FOR BREAKFAST? (CIRCLE ONE)
1. HOME
2. FAST FOOD TYPE, GROCERY, VENDING MACHINE, SNACK BAR
3. RESTAURANT, CAFETERIA
4. OTHER
WHAT DID YOU EAT AND/OR DRINK FOR BREAKFAST YESTERDAY? TIME
FOOD/DRINKS 8B. AMOUNT IN C. FREQ oD. NAS ID E. Wrin HOUSEHOLD UNITS OF UNITS GRAMS
239

APPENDIX V (Continued)
FOOD RECALL #2, FORM NO. 9
OBESITY IN BLACK WOMEN
SUBJECT NO.
DATE OF RECALL YEAR
5. HOW MANY DAYS OF EACH WEEK DO YOU USUALLY EAT SOMETHING BETWEEN BREAKFAST AND LUNCH? (CIRCLE ONE) oO 1 2 3 4 5 6 7
DID YOU EAT A MORNING SNACK YESTERDAY? YES NO
WHERE DID YOU EAT THE FOOD IF YOU ATE SOMETHING BETWEEN BREAKFAST AND LUNCH? (CIRCLE ONE)
1. HOME
2. FAST FOOD TYPE, GROCERY, VENDING MACHINE, SNACK BAR
3. RESTAURANT, CAFETERIA
4. OTHER
WHAT DID YOU EAT AND/OR DRINK BETWEEN BREAKFAST AND LUNCH YESTERDAY? TIME
FOOD/DRINKS B. AMOUNT IN C. FREQ oD. NAS ID E. Wr IN BOUSEHOLD UNITS OF UNITS GRAMS
240
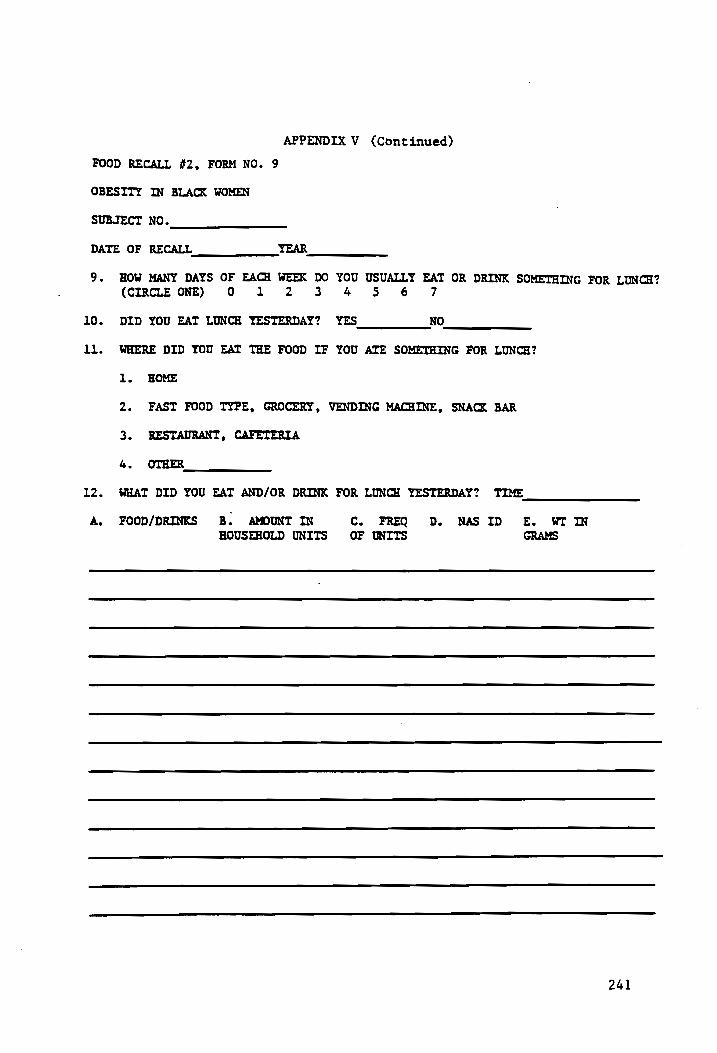
APPENDIX V (Continued)
FOOD RECALL #2, FORM NO. 9
OBESITY IN BLACK WOMEN
SUBJECT NO.
DATE OF RECALL YEAR
9. HOW MANY DAYS OF EACH WEEK DO YOU USUALLY EAT OR DRINK SOMETHING FOR LUNCH? (CIRCLE ONE) O 1 2 3 4 5S 6 7
10. DID YOU EAT LUNCH YESTERDAY? YES NO
1l. WHERE DID YOU EAT THE FOOD IF YOU ATE SOMETHING FOR LUNCH?
1. HOME
2. FAST FOOD TYPE, GROCERY, VENDING MACHINE, SNACK BAR
3. RESTAURANT, CAFETERIA
4. OTHER
12. WHAT DID YOU EAT AND/OR DRINK FOR LUNCH YESTERDAY? TIME
A. FOOD/DRINKS B. AMOUNT IN C. FREQ D. NAS ID E. Wr IN HOUSEHOLD UNITS OF UNITS GRAMS
241

APPENDIX V (Continued)
FOOD RECALL #2, FORM NO. 9
OBESITY IN BLACK WOMEN
SUBJECT NO.
DATE OF RECALL YEAR
13. HOW MANY DAYS OF EACH WEEK DO YOU USUALLY EAT SOMETHING BETWEEN NOON AND THE EVENING MEAL? (CIRCLE ONE) 0 12 3 4 5 6 7
14. DID YOU EAT AN AFTERNOON SNACK YESTERDAY? YES -_NO
15. WHERE DID YOU EAT THE FOOD IF YOU ATE SOMETHING FOR BETWEEN NOON AND THE EVENING MEAL? (CIRCLE ONE)
l. HOME
2. FAST FOOD TYPE, GROCERY, VENDING MACHINE, SNACK BAR
3. RESTAURANT, CAFETERIA
4. OTHER
16. WHAT DID YOU EAT AND/OR DRINK FOR AN AFTERNOON SNACK YESTERDAY? TIME
A. FOOD/DRINKS 3B. AMOUNT IN C. FREQ OD. NAS ID E. Win HOUSEHOLD UNITS OF UNITS GRAMS
242

APPENDIX V (Continued)
FOOD RECALL #2, FORM NO. 9
OBESITY IN BLACK WOMEN
SUBJECT NO.
DATE OF RECALL YEAR
17. HOW MANY DAYS OF EACH WEEK DO YOU USUALLY EAT AN EVENING MEAL? (CIRCLE ONE) O 1 2 3 4 5 6 7
18. DID YOU EAT AN EVENING MEAL YESTERDAY? YES No
19. WHERE DID YOU EAT THE FOOD IF YOU ATE AN EVENING MEAL? (CIRCLE ONE)
1. HOME
2. FAST FOOD TYPE, GROCERY, VENDING MACHINE, SNACK BAR
3. RESTAURANT, CAFETERIA
4. OTHER
20. WHAT DID YOU EAT AND/OR DRINK FOR AN EVENING MEAL YESTERDAY? TIME
A. FOOD/DRINKS 8B. AMOUNT IN C. FREQ D. NAS ID E. WT IN HOUSEHOLD UNITS OF UNITS GRAMS
243

APPENDIX V (Continued)
FOOD RECALL #2, FORM NO. 9
OBESITY IN BLACK WOMEN
SUBJECT NO.
DATE OF RECALL YEAR
21. HOW MANY DAYS OF EACH WEEK DO YOU USUALLY EAT SOMETHING BETWEEN THE EVENING MEAL AND THE TIME YOU GO TO BED? (CIRCLE ONE) 0 1 2 3 6 5 6 7
22. DID YOU EAT A BEDTIME SNACK YESTERDAY? YES NO __
23. WHERE DID YOU EAT THE FOOD IF YOU ATE A BEDTIME SNACK? (CIRCLE ONE)
1. HOME
2. FAST FOOD TYPE, GROCERY, VENDING MACHINE, SNACK BAR
3. RESTAURANT, CAFETERIA
4. OTHER
24. WHAT DID YOU EAT AND/OR DRINK FOR AN EVENING SNACK YESTERDAY? TIME
A. FOOD/DRINKS 8B. AMOUNT IN C. FREQ D. NAS ID E. WT IN HOUSEHOLD UNITS OF UNITS GRAMS
244

APPENDIX V (Continued)
FOOD RECALL #2, FORM NO. 9
OBESITY IN BLACK WOMEN
SUBJECT NO.
DATE OF RECALL YEAR
25. BOW MANY DAYS OF EACH WEEK DO YOU USUALLY EAT PRE-BREAKFAST? (CIRCLE ONE) OF 1 2 3 4 5 6 7
26. DID YOU EAT PRE-BREAKFAST YESTERDAY? YES NO
27. WHERE DID YOU EAT THE FOOD IF YOU ATE SOMETHING FOR PRE-BREAKFAST? (CIRCLE ONE)
l. HOME
2. FAST FOOD TYPE, GROCERY, VENDING MACHINE, SNACK BAR
3. RESTAURANT, CAFETERIA
4. OTHER
28. WHAT DID YOU EAT AND/OR DRINK PRIOR TO BREAKFAST YESTERDAY?
A. FOOD/DRINES 8. AMOUNT IN C. FREQ oD. NAS ID E. WI IN HOUSEHOLD UNITS OF UNITS . GRAMS
245

APPENDIX y (Continued)
FOOD RECALL #2, FORM NO. 9
OBESITY IN BLACK WOMEN
SUBJECT NO.
DATE OF RECALL _YEAR
29.
30.
31.
aA.
HOW MANY TIMES PER WEEK DO YOU USUALLY TAKE NUTRITIONAL SUPPLEMENTS SUCH AS VITAMINS, MINERALS, OR PROTEIN IN ADDITION TO THE FOODS You EAT? (CIRCLE ONE) OF 1 2 93 4 5 6 7
IF YOU TAKE SUPPLEMENTS, WHO RECOMMENDED THAT YOU TAKE THE SUPPLEMENTS?
l. PHYSICIAN 5S. GIRLFRIEND(S) 2. MOTHER 6. BOYFRIEND(S) 3. FATHER 7. MEDIA 4. SELF
WHAT SUPPLEMENTS DID YOU TAKE YESTERDAY, HOW MANY CAPSULES OR TABLETS AND WHAT TIME WERE THEY TAKEN?
(BE SURE IF THE SUPPLEMENT IS A SINGLE NUTRIENT THAT THE CONCENTRATION IN EACH TABLET IS OBTAINED. UNDER COLUMN E BELOW, RECORD THE MEAL CODE OR SNACK CODE CORRESPONDING TO THE TIME PERIOD WHEN THE SUPPLEMENT WAS CONSUMED. )
VITAMIN/MINERAL B. CONC OF C. FREQ oD. NAS EE. TIME F. HOW SUPPLEMENT TABLET TD OF DAY LONG
246

APPENDIX V (Centinued)
FOOD RECALL #2, FORM NO. 9
OBESITY IN BLACK WOMEN
SUBJECT NO.
DATE OF RECALL YEAR
THE FOLLOWING INFORMATION NEEDS TO BE ANSWERED BY THE INTERVIEWER.
A) SUBJECT'S AGE
B) YESTERDAY WAS (CIRCLE ONE) SU M TU W TH F_ SA
C) IS THIS RECALL BEING TAKEN ON THE DAY BLOOD IS DRAWN? (PLEASE CIRCLE)
YES = 1 NO = 2
247

APPENDIX W
OBESITY IN BLACK WOMEN DIETARY RECORD
NAME: DATE:
What did you eat and/or drink for the entire day? Please
record everything that you ate in the 24-hour period.
TIME PLACE FOOD/ BEVERAGES QUANTITIES PREPARATION METHOD AND/OR
INGREDIENTS
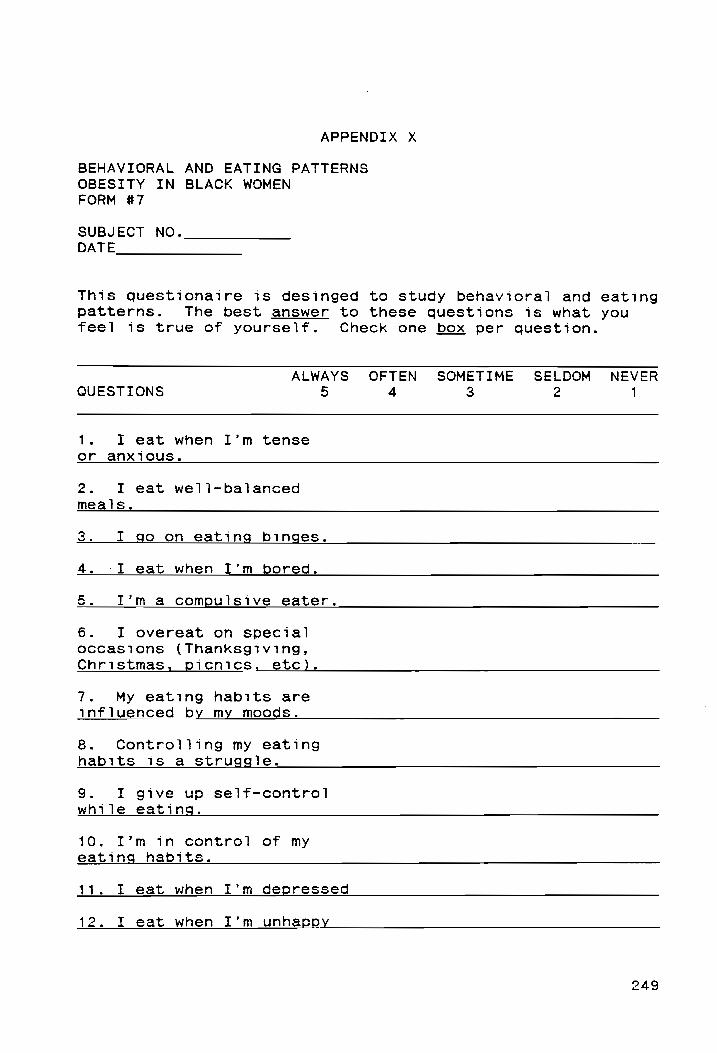
APPENDIX X
BEHAVIORAL AND EATING PATTERNS OBESITY IN BLACK WOMEN FORM #7
SUBJECT NO. DATE
This questionaire is desinged to study behavioral and eating
patterns.
feel is true of yourself.
The best answer to these questions is what you
Check one box per question.
ALWAYS QUESTIONS 5
OFTEN SOMETIME SELDOM NEVER 4 3 2 1
1. I eat when I’m tense
or anxious.
2. I eat well-balanced
meals.
3. I go on eating binges.
4. -I eat when I’m bored.
&§. I’m a compulsive eater.
6. I overeat on special occasions (Thanksgiving, Christmas, picnics, etc).
7. %\My eating habits are
influenced by my moods.
8. Controlling my eating
habits is a struggle.
9. I give up self-control
while eating.
10. I’m in control of my
eating habits.
11. I eat when I’m depressed
12. I eat when I’m unhappy

FORM #7 (Continued)
QUESTIONS ALWAYS OFTEN SOMETIME 5 4 3
SELDOM 2
NEVER 1
13. I eat when I’m lonely.
14. I sneak food.
15. I overeat the food I
really like.
16. I vomit after I stuff
myself.
17. I cause myself to
vomit after overeating.
18. I take laxatives after
overeating.
19. I’m self-conscious
about my eating habits.
20. I nave good eating
habits.
21. I eat to dull or block
out painful emotions.
22. I eat when I’m afraid
or nervous.
23. I eat when I’m _ shy.
24. My eating habits
control my life.
25. Food controls my life.
26. I eat when I’m feeling guilty.
27. I eat when I’m sad.
28. I sneak food when
nobody will know.
29. I take diuretics (water
pills) after overeating.
50
FORM #7 (Continued)
ALWAYS OFTEN SOMETIME QUESTIONS 5 4 3
SELDOM NEVER 2 1
30. I go on diets.
31. I go on eating sprees.
32. I overeat a little at
most meals.
33. I eat when I’m worried
34. I feel powerless to
control my eating habits.
35. I organize my life
around eating.
36. I eat when I’m angry
with cthers.
37. I overeat on occasions
when others are also overeating.
38. I go on eating sprees
during which I feel I have
little or no control.
39. I think about my eating patterns.
40. I eat a slight excess
of food on a regular and predictable basis.
41. Other people have
expressed concern about
my eating habits.
42. My eating patterns are
In opposition to what I
believe 3s right.
43. When I overeat, it 1s
usually because I cooked
too much and do not want
to waste food.

FORM NO. 7 (Continued)
ALWAYS OFTEN SOMETIME SELDOM NEVER QUESTIONS 5 4 3 2 1
44. I overeat to set a good example for my children so
they will not be wasteful.
45. I overeat because I
love “soul” food so much.
46. I overeat because my
parents taught me to eat
everything on my plate.
47. I overeat because I
remember times when I did
not have anything to eat.
48. Most times when I
overeat, I am unaware that
I_am overeating.
49. Tne reason I overeat is
because I enjoy my own cooking.
50. I am self-conscious
about eating in public.
51. I nave an eating
problem.
52. I feel guilty when I
eat too much.
53. I’m a compulsive eater
54. I fee! more in control
of my life when I am not
eating.
55. I feel more in control
of my life when I’m eating
56. I am satified with my
eating habits.
fo
or
fo

FORM NO. 7 (Continued)
ALWAYS OFTEN SOMETIME SELDOM NEVER QUESTIONS 5 4 3 2 1
57. My eating habits
indicate I lack
self-control.
58. I get pleasure just
thinking about eating.
59. My eating habits are primarily influenced by
my environment.
60. My eating habits are
primarily influenced by my
heredity (passed from
parent to offspring).
Permission to use this questionnaire has been granted by
Susan Crockett, M.S., R.D. and John Littrell, Ed.D.
ro
qn
wy

VITA
Katherine Williamson was born in Norfolk, VA in 1963,
and graduated from a Fairfax County VA high school in 1981.
In 1985 she graduated from Virginia Poltytechnic Institute
and State University with a B.S. in Animal Science and a
minor in Biology, pursuant to a career in veterinary
medicine. After a redirection of career goals, she began
taking courses in the department of Human Nutrition and
Foods in the fall of 1986. She has integrated various
aspects of exercise physiology into her graduate studies, in
both academic and research efforts. She is currently
working as the Aquatics Director at the Hensel Eckman YMCA
in Pulaski, VA, where she is able to utilize her skills in
both nutrition and exercise physiology.
Kelley ne Wn, Wows
254