Differentiating Rater Accuracy Training Programs - VTechWorks
186
Differentiating Rater Accuracy Training Programs by Andrea L. Sinclair Thesis submitted to the Faculty of the Virginia Polytechnic Institute and State University in partial fulfillment of the requirement for the degree of Master of Science in Industrial/Organizational Psychology Approved: Neil M.A. Hauenstein Roseanne J. Foti John Donovan October 4, 2000 Blacksburg, VA Keywords: Performance Appraisal and Rater Training
-
Upload
khangminh22 -
Category
Documents
-
view
3 -
download
0
Transcript of Differentiating Rater Accuracy Training Programs - VTechWorks

Differentiating Rater Accuracy Training Programs
by
Andrea L. Sinclair
Thesis submitted to the Faculty of the
Virginia Polytechnic Institute and State University
in partial fulfillment of the requirement for the degree of
Master of Science
in
Industrial/Organizational Psychology
Approved:
Neil M.A. Hauenstein
Roseanne J. Foti John Donovan
October 4, 2000
Blacksburg, VA
Keywords: Performance Appraisal and Rater Training

Differentiating Rater Training Programs
Andrea L. Sinclair
(ABSTRACT)
Prior investigation of a new rater training paradigm, rater variability training (RVT), found no clear empirical distinction between RVT and the more established frame-of-reference training (FOR), (Hauenstein, Facteau, & Schmidt, 1999). The purpose of the present study was to expand upon this previous investigation by including a purpose manipulation, alternative operationalizations of Cronbach’s accuracy components, finer-grained distinctions in the rating stimuli, and a second control group receiving quantitative accuracy feedback void of a substantive training lecture. Results indicate that finer-grained distinctions in the rating stimuli result in the best differential elevation accuracy for RVT trainees. Furthermore, RVT may be best suited for improving raters’ abilities to accurately evaluate average performing ratees when the performance appraisal is used for an administrative purpose. Evidence also suggests that in many cases, the use of Cronbach’s accuracy components obscures underlying patterns of rating accuracy. Finally, there is evidence to suggest that accuracy feedback without a training lecture improves some types of rating accuracy.

i
Table of Contents
Introduction .......................................................................................................................1 Review of Literature ..........................................................................................................3 Methods...........................................................................................................................22 Results .............................................................................................................................30 Discussion .......................................................................................................................48 References .......................................................................................................................56 Appendix A .....................................................................................................................61 Appendix B .....................................................................................................................65 Appendix C .....................................................................................................................68 Appendix D .....................................................................................................................72 Appendix E......................................................................................................................74 Appendix F......................................................................................................................89 Appendix G .....................................................................................................................90 Appendix H ...................................................................................................................148 Table 4.1........................................................................................................................149 Table 4.2........................................................................................................................150 Table 4.3........................................................................................................................151 Table 4.4........................................................................................................................152 Table 4.5........................................................................................................................153 Table 4.6........................................................................................................................154 Table 4.7........................................................................................................................157 Figure 4.1 ......................................................................................................................161 Figure 4.2 ......................................................................................................................162 Figure 4.3 ......................................................................................................................163 Figure 4.4 ......................................................................................................................164 Figure 4.5 ......................................................................................................................165 Figure 4.6 ......................................................................................................................166 Figure 4.7 ......................................................................................................................167 Figure 4.8 ......................................................................................................................168 Figure 4.9 ......................................................................................................................169 Figure 4.10 ....................................................................................................................170 Figure 4.11 ....................................................................................................................171 Figure 4.12 ....................................................................................................................172 Figure 4.13 ....................................................................................................................173 Figure 4.14 ....................................................................................................................174 Figure 4.15 ....................................................................................................................175 Figure 4.16 ....................................................................................................................176 Figure 4.17 ....................................................................................................................177 Vita................................................................................................................................178

1
Chapter 1. Introduction
Organizations rely on performance appraisals for making many organizational decisions. For example, organizations use appraisal information to make decisions about employee development, motivation, promotions and terminations. Hence, the information gained through the performance appraisal process has critical implications for both the individual and the organization. Because there is great importance placed on appraisal information, it is important to be cognizant that performance measurement typically relies on subjective measures, and therefore is subject to distortion. In order to deal with such distortions, various rater-training models have been proposed. Recently, considerable progress has been made in improving the effectiveness of rater training methods; however, many pertinent questions await investigation.
The present study investigates some of these questions. Fundamental to this
investigation is whether training leads to increases in performance appraisal rating accuracy. Of particular interest is the issue of whether the accuracy gains in one training program are greater than the accuracy gains in other training programs. Much research has demonstrated that frame-of-reference (FOR) training (Bernardin & Buckley, 1981) effectively improves rating accuracy (Athey & McIntyre, 1987; McIntyre, Smith, & Hassett, 1984; Pulakos, 1986; Woehr, 1994). However, there is evidence to suggest that FOR training may not be the best method for increasing all types of rating accuracy (Stamoulis & Hauenstein, 1993). Using Cronbach’s (1955) components of accuracy as their dependent measures, Stamoulis and Hauenstein found that FOR training led to significant increases in the accuracy components that collapses across ratees (stereotype accuracy and differential accuracy), but not for those components that collapse across rating dimensions (elevation and differential elevation). This is because during the FOR training session trainees discuss ratings within each ratee across performance dimensions. Therefore, the focus of FOR training is on the interrelated nature of performance dimensions, and not on between-ratee differentiation (Hauenstein, Facteau & Schmidt, 1999). As a result of this finding a new training program was proposed that focused on accurately differentiating performance levels of ratees (Stamoulis & Hauenstein, 1993; Hauenstein, 1998). However when systematically evaluated, no empirical distinction was found between the proposed rater variability training (RVT) and FOR training (Hauenstein et al., 1999).
The purpose of the present study is to address limitations in the Hauenstein et al. (1999)
study. This study improves upon four aspects of the previous study. To begin with, there is research suggesting that the benefits of RVT will emerge when a contextual constraint is imposed upon the raters. Hauenstein (1998) noted that FOR training is a more appropriate training method when performance appraisals are used for training and employee development because dimensional accuracy is important for those types of decisions. In contrast, RVT may be a more appropriate training method when the performance appraisals are used for administrative decisions because administrative decisions require accurate distinctions between ratees, collapsed over dimensions. Consequently, the present study includes a purpose manipulation such that raters in one group are informed that their evaluations will be used for developmental purposes (providing feedback) while raters in the other group are informed that their evaluations will be used for administrative purposes (hiring decisions).

2
In addition to the purpose manipulation, this study also uses an alternative operationalization of accuracy. Cronbach’s components of accuracy serve as the traditional operationalization of accuracy. This analysis requires squaring of components and a substantial amount of aggregation. As a result, valuable information about the direction of the rater’s accuracy scores (in relation to the target score) and the underlying patterns of over and underestimation is discarded (Edwards, 1993, 1994, 1995). Therefore, in addition to computing Cronbach’s components of accuracy, the present study includes an alternative analysis in which the distributions of the raw deviations between the observed components and the target components are inspected in relation to perfect accuracy.
The third improvement of this study is to develop a rating task in which participants are
required to make finer-grained distinctions between levels of performance. Hauenstein et al. (1999) note that asking raters to make distinctions between performance levels that are readily distinguishable (i.e., good, average, and poor) is not a sensitive test of the RVT model. The strength of the RVT model lies in its ability to accurately discriminate among ratees. However, when there are overt differences in the rating stimuli raters have very little difficulty in differentiating between performances, and thus the rater does not need to rely upon RVT to make these distinctions. This may explain why Hauenstein et al. did not find an empirical distinction between FOR and RVT. In order to incorporate finer-grained distinctions in the rating stimuli, the present study will ask participants to rate five different performances at posttest (as opposed to three). The raters will evaluate poor, below average, average, above average, and good performances.
A final point of interest is to isolate the effects of the accuracy feedback component in
the FOR and RVT training programs. Both FOR and RVT propose that it is a combination of lecture, practice, and accuracy feedback which produce increases in rating accuracy. Until now, there has been no research investigating whether the accuracy feedback component alone is responsible for improvements in rating accuracy. The present study includes a condition in which raters only receive quantitative accuracy feedback (for this condition the lecture component contains no instruction on how to improve the accuracy of performance ratings). If accuracy scores significantly improve for this group, then this would suggest that increases in rating accuracy are largely due to receiving quantitative accuracy feedback, and not a training lecture on how to improve the accuracy of ratings.

3
Chapter 2. Review of Literature Rater Training Methods
Among the first rater training programs proposed was rater error training (RET) (Latham, Wexley & Pursell, 1975). Latham et al. attributed the unreliability of performance appraisal to such rating errors as central tendency, leniency/severity, and halo error. These biases are problematic because they prevent raters from making distinctions between ratees. RET is designed to combat these biases by first providing raters the opportunity to evaluate the performance of a hypothetical ratee. Then, in a workshop context, the trainer discusses the ratings with the raters. During this discussion, the various rating errors are clearly defined, and raters are informed of the types of errors they committed. At that point, the raters are instructed to increase the variability in subsequent observed ratings by refraining from committing such errors.
Initial trials of the RET program proved successful. Latham et al. (1975) found that six months after participating in the RET workshop raters committed fewer rating errors whereas raters in the control group committed more similarity, contrast, and halo errors. Further investigation of the RET program, however, proved less promising. Smith (1986) reviewed the rater training literature and found that while RET reduced halo error it did not improve rating accuracy, and on two occasions RET negatively affected accuracy. In addition, the results of Murphy and Balzer’s (1989) meta-analysis illustrated that absence of rating errors is not an indication of accuracy. Thus, even though RET has been successful in prompting raters to provide ratings that have lower mean ratings (i.e., less leniency) and lower inter-item correlations (i.e., less halo), RET does not foster rating accuracy (Smith, 1986).
In response to RET’s failure to improve rating accuracy, Bernardin and Pence (1980) asserted that RET training merely encourages raters to replace one response set (e.g., leniency) with a different response set (e.g., severity). This criticism of the RET model led to the proposal of a new model: frame-of-reference training (Bernardin & Buckley, 1981). The primary goal of frame-of-reference training (FOR) is to increase the accuracy of ratings. FOR training sets out to accomplish this goal by establishing a common frame of reference to which raters refer when evaluating ratee performance. In this process, the raters first receive performance dimension training. Performance dimension training involves a discussion of job performance dimensions focusing on behavioral examples of a range of performance effectiveness. Next, raters are exposed to videotaped vignettes that contain critical incidents representing good, average, and poor job performance. The raters are then asked to evaluate these critical incidents. Once the raters have recorded justification for their ratings, the trainer informs the raters of the target scores. Finally, raters are given quantitative and qualitative feedback in regards to their ratings, and any discrepancies between their scores and the target scores are discussed (Bernardin & Buckley, 1981). Woehr and Huffcutt (1994) found an average effect size of .83 for studies comparing FOR training with control or no training on the dependent variables of rating accuracy.
Studies that have compared the effectiveness of RET and FOR training generally show that while RET is effective at reducing rating errors such as halo and leniency, rater error

4
training is an ineffective method for improving accuracy. FOR training, on the other hand, demonstrates significant improvements in rating accuracy, and has therefore been judged the superior approach (Athey & McIntyre, 1987; Bernardin & Buckley, 1981; Woehr, 1994). Nonetheless, there are findings in the FOR research that raise serious questions about the general superiority of FOR training. For example, Sulsky and Day (1992) found that FOR trainees recognized impression consistent behaviors even when the behaviors did not occur, meaning that FOR trained raters (as compared with controls) exhibited significantly worse behavioral accuracy for specific ratees. It appears that FOR training fosters accurate judgments of ratee performance, but decreases the accuracy of recall for the specific behaviors upon which those judgments are based (Hauenstein, 1998; Sulsky & Day, 1992; Sulsky & Day, 1994). In other words, once raters integrate the behaviors into the dimensional impressions, they are less likely to accurately remember the behaviors from which the dimensional impressions were formed. The failure to remember individual behaviors becomes problematic when raters are required to give ratees specific feedback (Sulsky & Day, 1994). Furthermore, false recognition of performance behaviors may lead to disputes between supervisors and subordinates (Sulsky & Day, 1992).
In addition to Sulksy and Day’s concerns about FOR training, Stamoulis and Hauenstein (1993) voice concerns about whether FOR is best for all types of rating accuracy. In regards to types of accuracy, Cronbach’s (1955) four components of rating accuracy have received much use in rater training research. Elevation, differential elevation, stereotype accuracy, and differential accuracy are based on the true psychometric conceptualization of accuracy, and contain both correlational and distance information in relation to the target scores.
Elevation serves as the average rating, over all ratees and items, given by the rater. A
highly accurate rating would occur when the rater’s overall average is close to the overall true score. To illustrate, Bost (1994) provides the example of judging an Olympic Figure Skating competition. The average of the judges’ scores for a single skater serves as the true score. Each judge’s elevation accuracy can be determined by comparing the true score to the score given by an individual judge for a single skater. Differential elevation is the accuracy component which gives the average rating assigned to each ratee across all performance dimensions. The rating given to each ratee by the rater allows for ranking best performer to worst performer. Keeping with the figure skating example, the judge who correctly rank ordered the performances of all the figure skaters from best performer to worst performer would be the most accurate in terms of differential elevation. Stereotype accuracy refers to accuracy in discriminating among performance dimensions, averaging over ratees. A judge with high stereotype accuracy would accurately assess which performance, the fixed program or the freestyle skate, was better. Differential accuracy refers to accuracy in distinguishing among ratees within dimensions. In other words, differential accuracy is the rater’s ability to recognize differences between ratees in their patterns of performance. In this case, the accurate judge would be able to accurately determine which skater had high creativity and low difficulty and which skater exhibited the opposite pattern.
Stamoulis and Hauenstein (1993) utilized Cronbach’s components of accuracy as their
dependent measures and found that FOR trainees demonstrated the greatest improvements on

5
the accuracy components that collapse over ratees (stereotype accuracy and differential accuracy), but that FOR did not demonstrate improvements on the accuracy components that collapse over dimensions (elevation and differential elevation). In other words, they found that FOR training improved the accuracy of between-dimension discrimination, but did not increase the accuracy of between-ratee discrimination. Stamoulis and Hauenstein explain that this is because FOR training is not designed to foster between-ratee discrimination as measured by elevation and differential elevation accuracy. Rather, Hauenstein et al. (1999) explain that the focus of FOR training is on the interrelated nature of performance dimensions and the development of internal frames of reference, as opposed to the development of accurate portrayal of the true variability among individual performances.
Murphy, Garcia, Kerkar, Martin, and Balzer (1982) maintain that elevation and
differential elevation are more important than the dimensional components of accuracy when it comes to organizational decision making. Similarly, Murphy and Cleveland (1995) recommend differential elevation over differential accuracy. Also, the most common types of appraisal-oriented decisions require elevation accuracy and differential elevation accuracy (Murphy et al., 1982). That is, decisions that call for accurate differentiation among individual ratees. If this is the case, then it appears that FOR is not the best training method for many organizational decisions (Hauenstein, 1998).
Clearly there are limitations to the FOR training method. In light of these limitations,
Sulsky and Day (1992) suggested developing a training program that combines elements of existing training programs. They argued that a combination of training approaches would supply raters with increased access to behavioral information. Expanding on this idea, Stamoulis and Hauenstein (1993) proposed a new model coined rater variability training (RVT). The RVT program has its roots in the RET and FOR models. The goal of RVT is to increase rater variability so that performance ratings accurately correspond to the true variability in performance, which thereby increases the discriminability among ratees (Hauenstein, 1998). To achieve this goal, RVT combines elements of the traditional RET and FOR programs. Hauenstein (1998) explained that RVT incorporates RET’s emphasis on distinguishing among different ratees, but unlike the RET model, RVT does not focus on rating errors because rating errors are not correlated with accuracy (Murphy & Balzer, 1989). In order to achieve accurate ratings, the RVT model incorporates the accuracy feedback component of frame of reference training whereby trainees are given quantitative feedback about the discrepancies between their ratings and the target scores (Hauenstein et al., 1999).
There are critical distinctions, however, between RVT and FOR training (Hauenstein et
al., 1999). First of all, FOR training emphasizes the importance of identifying differences between practice ratings and target scores. On the other hand, RVT emphasizes the importance of identifying the relative performance differences between individual ratees. Hauenstein et al. explain that FOR trainees discuss the practice rating for each ratee in comparison to the target ratings. In contrast, RVT focuses on discussing ratings within each dimension across ratees. In other words, all practice ratings for the first dimension are discussed in relation to target scores for the first dimension, then all practice ratings for the second dimension are discussed in

6
relation to target scores for the second dimension, and so forth until all dimensions have been discussed.
A recent study by Hauenstein, Facteau, and Schmidt (1999) represents the first
systematic evaluation of RVT. The design of this study replicated Stamoulis and Hauenstein (1993) with the addition of an RVT condition. Hauenstein et al. compared FOR and RVT using Cronbach’s (1955) accuracy components as the dependent measures. The purpose of their study was to determine if RVT was a more effective strategy for improving raters’ ability to accurately discriminate among the performance levels of different ratees. Accordingly, they predicted that RVT training would lead to greater improvements in elevation and differential elevation accuracy than would FOR training because these accuracy components measure the accuracy of ratings for ratees collapsed over dimensions. In addition, they hypothesized that FOR-trained raters would exhibit the greatest improvement on stereotype accuracy because FOR training focuses on the relationship among dimensions. Finally, there was no prediction of differences on differential accuracy because both FOR and RVT provide quantitative feedback about ratees on individual dimensions. Therefore, both attempt to improve differential accuracy. The training emphasis is different, however, in that FOR focuses on relative differences among performance dimensions and RVT focuses on relative differences among ratees.
Results of the study show support for the hypothesis that FOR trained raters exhibit the
greatest improvement on stereotype accuracy. However, there was no empirical distinction between RVT and FOR training. The authors offer three possible explanations for the lack of empirical distinction between FOR and RVT. One explanation is that raters were not under any contextual pressures to make evaluations for either administrative or developmental reasons. In other words, Hauenstein et al. (1999) did not take into account the intended purpose of the appraisal information. It may be that empirical differences between FOR and RVT emerge when raters operate under motivational presses when making post-test ratings.
Secondly, Hauenstein et al. (1999) suggest that the lack of empirical differences between
RVT and FOR may be due to problems with the dependent measures. They found that the sensitivity of Cronbach’s components of accuracy vary as a function of the number of ratees and dimensions used. Hauenstein et al. report that with only three ratees at post-test, systematic differences in the unsquared differential elevation components were not replicated when squared and aggregated into the differential elevation score. In contrast, analyses of the eighteen unsquared differential accuracy components produced no training effects, yet when squared and aggregated into differential accuracy scores reliable training effects were found. Thus, they report that the aggregation of many systematic small effects leads to an overall effect that is more readily detected. This suggests that there may be inherent limitations in the calculation of Cronbach’s accuracy scores such that the raters’ accuracy scores are obscured in the calculation of the four components.
A third possibility for RVT’s failure to demonstrate superior effectiveness over FOR (on
elevation and differential elevation), is that the discrimination among ratees was too easy due to overt differences in rating stimuli. That is, raters had little difficulty in distinguishing between a “good” performer, an “average” performer, and a “poor” performer. Hauenstein et al. (1999)

7
suggest that if the raters were asked to make more fine-grained distinctions, for example, distinguishing between three ratees that are all above average, then the benefits of RVT may emerge.
In addition to addressing these three limitations, the present study also examines the
possibility that the accuracy feedback component is the sole factor responsible for improvements in rating accuracy. Both FOR and RVT propose that the combination of lecture and feedback produce increases in rating accuracy. None of the rater training research, however, has investigated whether increases in rating accuracy are simply a product of providing raters with quantitative accuracy feedback. This study examines this possibility by including a second control group that receives accuracy feedback without a lecture on how to improve the quality of ratings. By addressing these four limitations, the present study seeks to improve and expand upon the Hauenstein et al. (1999) study. Purpose of Performance Appraisal
In the realm of rater training there has been a de-emphasis on the use of rater error training. In its place has emerged FOR and more recently, rater variability training. Initial trials of RVT, however, failed to yield empirical distinctions between FOR and RVT. One explanation for this lack of empirical distinction may be that there was no purpose manipulation. Consequently, the rater training literature is in need of methodologically sound research that controls for training format and the intended use of the appraisal data.
Landy and Farr (1980), in their process model of performance appraisal, identify purpose
of rating as a significant component in the rating process. They suggest that the purpose of the performance appraisal affects both the observation and the recall of behavior, as well as the evaluation of performance. In fact, it has been suggested that purpose of appraisal is the most important contextual factor for understanding performance appraisal processes and outcomes (Jawahar & Stone, 1997). Furthermore, Cleveland and Murphy (1992) state that ratings that are “used for one purpose may not (under similar circumstances) yield the same outcome when the appraisal system is used for a different purpose” (p. 138).
Cleveland, Murphy, and Williams (1989) identified twenty different organizational uses
of appraisal data. They found that the majority of these purposes could be dichotomized into two general classifications: Developmental Decisions and Administrative Decisions. When performance appraisal information is intended to be used for developmental purposes, employees receive concrete feedback about their job performance. This serves a valuable function because in order to improve performance in the future, employees need to know what their weaknesses were in the past and how to correct them. This also enables supervisors to identify which employees would receive the most benefit from additional training. Pointing out strengths and weaknesses is a coaching function for the supervisor, while receiving meaningful feedback and acting upon it is a motivational experience for the subordinate (Klimoski & Inks, 1990). In this way, performance appraisals serve as vehicles for personal development. Hence, the ultimate goal of developmental feedback is performance improvement. On the other hand, making and carrying out employment decisions are the fundamental goals of administrative decision-making. Administrative decisions include deciding which employees to promote,

8
which to terminate, which to discipline, which employees to transfer, and so forth. In short, performance appraisals used for administrative purposes serve as a key input for administering a formal organizational reward and punishment system (Cascio, 1998; Cummings, 1973).
Clearly, the goals of a developmental decision are distinct from the goals of an
administrative decision. This is an important distinction because the goals of the appraisal should be considered before choosing a rater training program (Hauenstein, 1998; Sulsky & Day, 1992). Another important distinction between developmental decisions and administrative decisions are the consequences associated with each type of decision. As stated by Williams, DeNisi, Blencoe and Cafferty, (1985), the consequences of a rating vary as a function of the purpose for which the appraisal is to be used. In particular, consequences that accompany an administrative decision are more serious than the consequences that accompany a developmental decision. For instance, when performance appraisal information is used to decide which employees should be terminated, the rater may incur more pressure to inflate the ratings. Murphy and Cleveland (1995) report that it is not unusual to find that 80% to 90% of all employees are rated as “above average.” Inflation is likely to occur because raters feel more concern for the ratee when the consequences of the rating are more severe (Fredholm, 1998). Furthermore, the rater may not want to be the one responsible for administering the poor evaluation leading to subordinate termination. McGregor (1957) acknowledged that raters are reluctant to “play God,” and therefore rate uncritically and leniently in order to avoid the ramifications of a deserved but harsh appraisal. Supervisors may also inflate ratings so as to ensure valued rewards for their subordinates (Lawler, 1976), or to avoid confronting a problem employee (Padgett, 1988). Whatever the reason for inflation, Hauenstein (1992) notes that the major problem with performance evaluations today is that employees are all given good ratings, and given that employees are subject to different resources, leadership styles, and tasks, it seems highly unlikely that all employees in an organization are performing at the same level (Murphy & Cleveland, 1995). When employees are all given good ratings it becomes difficult, if not impossible, to discriminate among individual employees and this limits the effectiveness of administrative decisions.
On the other hand, if the rater is told that the ratings will only be used to give the
employees useful feedback (developmental purpose), the rater may not feel as much pressure to inflate the ratings because the decision is not accompanied by a serious consequence (Fredholm, 1998; Hauenstein, 1992). Furthermore, Klimoski and Inks (1990) suggest that with developmental feedback the supervisor becomes more of a “coach” which thereby facilitates honesty and candid feedback. Other researchers have also agreed that raters will be more willing to give poor, but presumably more accurate evaluations when the ratings are to be used for counseling and feedback, rather than for administrative purposes (DeNisi, Cafferty, & Meglino, 1984).
Several studies have lent support to these assertions. Indeed, researchers have found that
ratings collected for administrative purposes are significantly higher than ratings collected for feedback or research purposes (Aleamoni & Hexner, 1980; Bernardin & Orban, 1990; Fredholm, 1998; Harris, Smith, & Champagne, 1995; Sharon & Bartlett, 1969; Zedeck & Cascio, 1982). For example, Aleamoni and Hexner (1980) found that student raters who were told that the

9
results of their ratings would be used for salary and promotion consideration rated their instructor more favorably on all aspects of performance than students who were told that their ratings would be used to help the instructor determine the students’ attitudes, interests, and opinions. More recently, Harris et al. (1995) found ratings of 223 production employees obtained for administrative purposes to be significantly more lenient than ratings obtained for research purposes. It is also important to note that raters exhibit greater behavioral accuracy when the perceived purpose of the rating is for developmental purposes as opposed to administrative purposes (Fredholm, 1998). Specifically, Fredholm found that raters in an administrative purpose condition inflated ratings whereas raters in a developmental condition provided more severe, but also more accurate ratings. Fredholm suggests that raters in the developmental purpose condition experienced less pressure to inflate subordinate ratings because they did not perceive negative consequences for the ratee.
These distinctions between developmental decisions and administrative decisions
suggest that a particular training program may be better suited for developmental purposes, while another type of training program may be better suited for administrative purposes. According to Harris et al. (1995), the lenient ratings associated with administrative decisions reduce distinctions among ratees. These inflated ratings make it very difficult to decide who should get a raise, who should be promoted, who should be terminated, and so forth. Consequently, when appraisal data is intended to be used for making administrative decisions the concern is with accurate differentiation among employees. The goal of RVT is most congruent with this situation because RVT’s strength lies in its ability to accurately discriminate among individual ratee performance (Hauenstein, 1998). In the case of RVT, those accuracy components that promote between-ratee discrimination (elevation and differential elevation) should demonstrate the greatest improvements (Stamoulis & Hauenstein, 1993; Hauenstein et al., 1999).
In contrast, because developmental decisions are not accompanied by the threat of
serious consequences, raters are not likely to experience pressure to be lenient and are thus more discriminating in their evaluations. In other words, ratee differentiation is less of a concern when appraisal data is used for developmental feedback. Consequently, FOR is the most appropriate training method when ratings are used for developmental purposes because FOR leads to accurate ordering of performance dimensions from best to worst performance (i.e., stereotype accuracy). This type of information is important for providing employees with developmental feedback. Lastly, both FOR and RVT should improve differential accuracy because both provide quantitative feedback about ratees on individual dimensions, although FOR emphasizes differences among performance dimensions whereas RVT emphasizes differences among ratees.
Two studies have investigated the interaction between the purpose of the performance
appraisal and the method of rater training. The first was a 1982 study by Zedeck and Cascio. In this study, 130 undergraduate students were assigned to either a training or a no-training control condition. The training condition closely resembled rater error training whereby raters were provided with explanations and examples of common rating errors (leniency, severity, central tendency, halo, and first impression errors). Discussion for the non-trained group focused on

10
general issues in management and organizational behavior. Each rater then received a booklet containing 33 one-paragraph descriptions of checkstand performance by supermarket checkers. Expert raters had previously scaled descriptions of relative performance (anchors) on a 1-7 scale of effectiveness--ineffectiveness. These mean values for the behavioral anchors served as the target scores. Upon reading the paragraphs, raters were asked to make a decision for the following purposes: recommending development, awarding a merit raise, or retaining a probationary employee. Raters evaluated the checker described in each paragraph on a 1-7 scale, where the 1, 4, and 7 points had the following definitions: developmental (1 = “strong need for development, 4 = “some development needed,” 7 = “no further development needed now”); merit raise ( 1 = “no raise recommended,” 4 = “average raise recommended,” 7 = “highest raise recommended”); retention ( 1 = “do not retain,” 4 = “neutral regarding retention,” 7 = “strongly recommend retention”). The dependent variable was the rater’s standard deviation of his or her evaluations across the 33 paragraphs. The greater the variability in the evaluations, the greater the discrimination among the 33 paragraphs. Zedeck and Cascio found support for the hypothesis that evaluations differ as a function of the purpose of appraisal, such that the evaluations for merit raise were inflated and thus less discriminating than the ratings for development and retention purposes. However, they found no effect for rater training, and no support for a purpose of appraisal and rater training interaction.
There are several potential explanations for Zedeck and Cascio’s (1982) failure to detect
a rater training effect or an interaction between rater training and purpose of appraisal. The most pertinent explanation may be the inclusion of only one type of rater training program. The study consisted of only a training group and a no-training control group. Furthermore, the one training condition included in the study was based on rater error training. Many researchers in the past several years have established that RET is not an effective method for improving rater accuracy (Bernardin & Pence, 1980; Borman, 1979; Hauenstein, Facteau, & Schmidt, 1999; Hedge & Kavanagh, 1988; Murphey & Balzer, 1989; Smith, 1986). Consequently, Zedeck and Cascio may have been unable to detect a training or a purpose by training interaction because they looked at only one particular training method--an ineffective training method.
An additional concern is the use of “paper people” as stimuli. That is, the rater’s
evaluations were based on written scenarios describing the job performance of hypothetical grocery checkers. The raters, therefore, may not have taken the task seriously due to the lack of realism. Moreover, “paper people” do not realistically convey performance. For example, Gorman, Clover, and Doherty (1978) encountered problems interpreting results of an interview situation when paper people were used instead of real candidates. A better alternative would be to develop stimulus videotapes. Ryan, Daum, Bauman, Grisez, and Mattimore (1995) compared the ratings of a group-discussion exercise made after live observation with ratings made after viewing a videotaped version of the same group-discussion exercise. Results indicated no differences in rating accuracy for the live and videotaped group discussions. The authors suggest that differences might not have been found between the live version and the videotaped version because the cognitive demands placed on the raters were similar. That is, in both viewing conditions the rater is a passive recipient of visual and auditory information (Ryan et al., 1995). Consequently, stimulus videos should be utilized in rater training programs because videos realistically convey performance, and thus are an improvement upon written scenarios.

11
Bernardin and Cooke (1992) also report a problem with the internal validity of the
Zedeck and Cascio (1982) study. The main problem they say is the confounding of scale anchors with the manipulation of purpose. Bernardin and Cooke state that the scale anchors for the developmental, retention, and merit conditions are similar, but not equivalent. Zedeck and Cascio used “some development needed,” “average raise recommended,” and “neutral regarding retention” as the middle anchors for the three purpose conditions. They were thereby comparing ratings of amount with ratings of intensity. Moreover, Zedeck and Cascio made no argument and presented no data to support their position that the scale anchors were psychologically equivalent. This difference in scale formats, confounds the manipulations, and thus makes the results uninterpretable (Bernardin & Cooke, 1992).
Lastly, Zedeck and Cascio (1982) used the rater’s standard deviation of his or her
evaluations across the 33 paragraphs as the dependent variable. In other words, this study only required the raters to provide an overall assessment, and did not require the raters to make assessments of each of the performance dimensions. An additional analysis, however, was also performed. Judgment analysis, or JAN (Christal, 1968), is an iterative procedure that groups raters (on the basis of the homogeneity of their regression equations) one at a time until all raters are clustered into one group. For each grouping there is an indication of the composite group predictive efficiency. This is measured in terms of the proportion of explained variance, R2
. Zedeck and Cascio’s methods for calculating accuracy, an overall rating and a cluster analysis, are problematic because they are not consistent with the traditional conceptualization of accuracy.
The second study that investigated the joint effects of perceived purpose and rater
training was conducted by McIntyre, Smith, and Hassett (1984). This study improved upon the Zedeck and Cascio (1982) study in that McIntyre et al. examined more than one type of training. In particular, the researchers examined four levels of training: (1) rater error training, (2) frame-of-reference training, (3) a combination of both RET and FOR, and (4) no training. The purpose factor was comprised of three levels (hiring, feedback, and research) for a total of 12 treatment conditions. The raters were randomly assigned to one of the twelve conditions whereby they viewed and then rated videotaped performances of male drama students acting as lecturers. The 12-item rating scale was based on four dimensions of teaching effectiveness: organization, clarity of communication, elocutionary skills, and intellectual stimulation. The target scores were derived from the mean “expert” ratings of six graduate students in the industrial/organizational psychology department. The ratings obtained from the subjects were manipulated to yield four dependent measures of accuracy: halo, leniency/severity, correlation accuracy (Q), and distance accuracy (|D|).
The researchers found a main effect for training type such that FOR training produced
more accurate ratings than RET and no-training; however, there was no empirical distinction between FOR and the combined methods of FOR and RET. Tentative support was found for the hypothesis that ratings done for hiring purposes were more lenient and less accurate than ratings done for other purposes. Although the researchers believed that purpose and training might interact, they did not develop a hypothesis for the joint effect of perceived purpose and training-

12
type. They did, however, conduct an exploratory analysis, but found no strong evidence that the two factors interacted.
There are several issues of concern with the various dependent measures utilized in this
study. Recall that McIntyre et al. (1984) incorporated halo, leniency/severity, correlation accuracy (Q), and distance accuracy (|D|) as the four dependent measures of accuracy. Halo and leniency/severity are measures of rating errors, and because rating errors are not correlated with accuracy (Murphy & Balzer, 1989), these dependent variables are not valid measures of accuracy. There are also problems with the remaining two dependent measures: correlation accuracy (Q), and distance accuracy (|D|). McIntyre et al. (1984) calculated Q for each rater by computing the mean of transformed correlations of his/her ratings with expert ratings. Edwards (1994) reports several inherent problems with such Q correlations:
. . . the interpretation of Q is ambiguous because it collapses across components and dimensions that, in most cases, are conceptually distinct. Q also confounds the effects of the component measures constituting each profile, such that relationships observed for Q may represent anything from the effect of a single component to the combined effects of all components. . . In addition to these problems, . . Q solely represents similarity in profile shape, with no indication of the distance between profiles. Consequently, profiles with large discrepancies but similar shapes may produce high values of Q, whereas profiles with small discrepancies but minor difference in shape may produce small or even negative values of Q. Because most studies of congruence are concerned with the distance between profiles rather than similarities in their shape, Q provides information of little apparent utility.
In addition, Edwards (1993) specifies several problems with McIntyre et al.’s (1984) use of sums of absolute difference (|D|) indices. McIntyre et al. (1984) state their hypotheses in terms of the magnitude of the difference between the subjects’ ratings and the expert ratings such that accuracy of ratings is maximized when subjects’ ratings are equal to expert ratings. Edwards (1993) explains that when a hypothesis is framed in such terms, two fundamental assumptions are made. The first assumption is that the effects of positive and negative differences between subject ratings and expert ratings are psychologically equivalent. According to the second assumption, when measures are aggregated (e.g., EL, DE, SA, and DA), accuracy occurs when the subject ratings are equal to expert ratings, regardless of the underlying pattern of ratings between the subject ratings and the expert ratings. To verify these assumptions it is necessary to take into consideration the absolute level of both observed ratings and target ratings as well as the direction of their difference (Edwards, 1993). However, when |D| is used this information is discarded. These problems with the dependent measures may account for the failure to detect a purpose by training interaction.
Zedeck and Cascio (1982), and McIntyre et al. (1984) set the stage for investigating rater
training format and purpose of appraisal interactions. However, as described above, these studies were limited. The present study retains the primary spirit of these studies by

13
investigating rater training format and purpose interactions while at the same time correcting for their limitations. Measures of Rating Accuracy
Initially, rating error measures (e.g., halo and leniency) were used as indirect measures of rating accuracy. However, it has since been demonstrated that rater error measures are invalid indices of rating accuracy (Murphy & Balzer, 1989). This led to the adoption of congruence measures in the rater training literature. Congruence refers to the fit, match, agreement, or similarity between two conceptually distinct constructs (Edwards, 1994). Congruence indices have been used for a variety of purposes. For example, the congruence index has been used in job satisfaction research to represent the gap between actual and desired job attributes (Edwards, 1991; Locke, 1976). Bernardin and Alvares (1975) used a congruence index to represent supervisor-subordinate agreement regarding the effectiveness of conflict resolution strategies. This index has also been used to represent interpersonal similarity regarding values (Meglino, Ravlin, & Adkins, 1989), the perceived instrumentality of behavior-outcomes linkages (Hammer & Dachler, 1975), fit between job demand and employee competence (Rosman & Burke, 1980), discrepancy between personal and assigned goals (Tubbs, & Dahl, 1991), and many other uses.
While congruence indices do serve as direct measures of accuracy and thus are an
improvement over rater error measures, they are not without fault. As evidenced in the Zedeck and Cascio (1982), and McIntyre et al. (1984) studies, methodological and theoretical limitations also apply to accuracy scores. Over the years, there has been much variation in the operational definitions of rating accuracy. One commonality, however, is that all operational definitions include a comparison of the rater’s ratings with the target scores of ratee performance. The closer the rater’s ratings are to the target score, the more accurate the ratings are believed to be (Borman, 1977). The wide variation among these operational definitions occurs with the ways in which these two sets of ratings are compared. A review of the various methods for comparing the two sets of scores clearly shows that not all methods share a common conceptual base. When the two sets of ratings do not share a common conceptual base this may result in weak relations among the various measures. These weak relations lead to research findings that may not generalize across the different measures (Sulsky & Balzer, 1988). In other words, the nature of differences found among raters may depend on the accuracy measures that were used.
Congruence is typically operationalized as an index representing the similarity between
profiles of component measures (Q), or as the algebraic, absolute, or squared difference between two component measures (e.g., D, |D|, D2). The first congruence index to receive widespread use was the Q-correlation (Burt, 1937; Stephenson, 1950). A Q-correlation consists of the correlation between sets of component measures (Cronbach & Glesser, 1953). That is, the correlation between observed ratings and target ratings in rater training research. As described above in relation to McIntyre et al. (1984), there are serious limitations involved with the use of this method. As a result of growing dissatisfaction with the Q-correlation, Cronbach and Glesser (1953) introduced the distance score (D) as a substitute for the Q-correlation. The D index simply sums (Xi - X’i )
2 over items or tests (Cronbach, 1992). However, Cronbach became dissatisfied with this index as well, stating that an index that reduces two columns of

14
scores to one number is too simplistic (Cronbach, 1955). On that account, Cronbach (1955) devised an alternative scheme for treating the distance scores, whereby the over-all distances (D2) would be divided into components having distinct meanings. In this case, a rater’s ratings for each ratee comprise a matrix X in which the ratees compose the columns of the matrix (i), and the performance dimensions compose the rows of the matrix ( j). Each element, xij, is the rating of ratee i with numerical value x on dimension j. In order to compute the D2 measure of accuracy and its various components, each matrix is compared with a true score matrix T in which each element tij is the true score of ratee i on performance dimension j. Then, D2 (a variation of D) is broken down into four components based on discrepancies between the rater’s ratings and the true score ratings. Each component expresses a different portion of the distance between rater ratings and true scores. Thus, the development of elevation, differential elevation, stereotype accuracy and differential accuracy.
Shortly after Cronbach (1955) proposed dividing D2 into conceptually distinct
components, he questioned the utility of the methodology (Cronbach, 1958). As he encountered students who tried to apply these methods in dissertation research, he found that it became increasingly clear that any mechanical summary across dimensions and ratees obscured valuable findings (Cronbach, 1958). He then made an analytic proposal to eliminate the distance score entirely.
As we continue to see the distance score and the components of accuracy in use today, it
appears that few took notice of Cronbach’s 1958 disavowal of the 1955 article. A notable exception is Edwards’ research on congruence indices (Edwards, 1993; 1994; 1995). Edwards has provided an in-depth analysis of the problems plaguing congruence research today. He has investigated the limitations of using difference scores as both independent variables (Edwards, 1993; 1994), and as dependent variables (Edwards, 1995). When training is used to enhance performance rating accuracy, congruence scores serve as a dependent variable. Hence, the primary concern is with Edwards’ critique of difference scores as dependent variables (although similar critiques apply to the use of difference scores as independent variables as well).
The first step in computing Cronbach’s measures of accuracy is simply to rescale the raw
scores into a metric that ranges from negative to positive. Next, the deviations are squared. It is at this step where valuable information is discarded. When the deviations are squared the units become non-directional (Edwards, 1993). That is, positive and negative differences are treated the same. For example once the scores are squared, a rater who underestimated the true score and assigned a – 4 rating is indistinguishable from a rater who overestimated the true score and assigned a + 4 rating. This is problematic because there may be relevant psychological meaning in these differences. Another problem occurs when the aggregate measures of accuracy are computed (EL, DE, SA, and DA). According to Edwards (1995) the variance of the difference score is a function of the variances and covariances of its component measures (i.e., ratees, and dimensions), and when the composite score is computed the relative contribution of these components is concealed. In other words, when we compute aggregate measures of accuracy, the underlying patterns of over and underestimation are ignored. As such, two raters with different patterns of over and underestimation may have identical accuracy scores. For example, two raters may both have an accuracy score of 5, however, the rating patterns underlying these

15
two scores may be different. In contrast, it follows that two raters may have very similar patterns of over and underestimation and thus are very similar in their rating accuracy, but nonetheless have very different accuracy scores.
Due to the limitations of Cronbach’s accuracy scores, an alternative procedure for
treating accuracy data needs to be formulated. Such a procedure has been presented in Edwards (1995). However, this procedure applies to situations in which the two factors comprising the congruence measure are both endogenous, meaning that they are both logically dependent on the predictors under examination (Edwards, 1995). Edwards explains that this procedure is not intended for situations in which one factor is exogenous, as is the case in studies of performance rating accuracy. In studies of performance rating accuracy, the training intervention influences only the trainee ratings and not the “expert” ratings (those which comprise the target score). Because expert ratings are not influenced by the training intervention, Edwards (1995) states that they should be treated as exogenous variables. At present, no formal procedure has been proposed for analyzing accuracy scores as dependent variables when one factor is endogenous and one exogenous.
The present study provides an alternative means for analyzing accuracy scores for studies
in which one factor is endogenous and the other exogenous. For the alternative analysis, accuracy is operationally defined as the raw deviation between the observed component ratings and the target component ratings. This means that the deviations are not squared or aggregated. These raw deviation scores serve as analogues to Cronbach’s EL, DE, SA, and DA. When raw deviation scores are used perfect rating accuracy is always zero. Consequently, the most accurate ratings are those closest to zero. Negative deviation scores indicate that trainees have underestimated the target score while positive deviation scores indicate that trainees have overestimated the target score. The advantage of using raw deviation scores is that information about the direction of the trainees’ ratings (in relation to the target scores) is retained, as well as information about the underlying patterns of over and underestimation. The disadvantage of using this alternative operationalization of accuracy is that it is much more cumbersome because the components are not aggregated.
This analysis permits an investigation of the interaction between training format and
purpose on the individual raw deviation components. In other words, the mean deviation scores for each condition are compared with the target mean deviation scores for each if the four performance dimensions (SA analogue), for each of the ratees (DE analogue), for each ratee within each dimension (DA analogue), and for the overall accuracy (EL analogue). The amount of aggregation is reduced in the stereotype accuracy analogue because there is no aggregation across dimensions. Likewise, the amount of aggregation is reduced for the differential elevation analogue because there is no aggregation across ratees, and aggregation for the differential accuracy analogue is eliminated entirely. By reducing the amount of aggregation, information about underlying patterns of accuracy is retained.
The predictions for the alternative operationalization of accuracy mirror the predictions
for the traditional operationalization of accuracy. However, it is believed that this alternative

16
analysis will provide supplemental information about the direction and pattern of ratings. Both of these pieces of information are obscured in the calculation of Cronbach’s components.
At present there is no clear consensus among researchers concerning the best or most appropriate measure of accuracy. Sulsky and Balzer (1988) report that existing operational definitions of accuracy are not based on a common conceptualization of accuracy. This suggests that different measures may tap different facets of rating ability, and thus a given study may yield different results depending on the particular measure employed. Taking this into account, the present study adheres to Murphy and Cleveland’s (1995) recommendation to utilize multiple measures of accuracy. Hence the present study employs Cronbach’s components of accuracy as well as the alternative operationalization of accuracy described above. Distinctions in Rating Stimuli
A problem with most rater training research today is that the rating tasks do not realistically reflect the fine-grained distinctions present in employees’ performances in actual organizations. For example, supervisors typically have to administer periodic performance evaluations for many subordinates. Although it may be relatively easy for the supervisor to distinguish between the very worst performer and the very best performer, the evaluator is likely to experience difficulty when trying to make distinctions amongst subordinates that fall somewhere between these two extreme levels of performance. Nonetheless, oftentimes rater training studies simply require raters to distinguish between an effective performance and an ineffective performance. For example, several rater training studies (Athey & McIntyre, 1987; McIntyre, Smith & Hassett; Murphy & Balzer, 1986; Murphy, Balzer, Kellam, & Armstrong, 1984) have utilized a set of videotapes developed by Murphy et al. (1982) in which the performance dimensions in question simply vary performance from effective to ineffective. The three performance dimensions embedded in these videotapes were: 1) clarity and organization (good or bad), 2) responses to questions (responsive or evasive), and 3) presentation style (dynamic or hesitant). Rarely will such clear-cut distinctions in performance effectiveness occur in real-life situations.
Initial investigations of the RVT model have also been guilty of over-simplifying levels
of performance effectiveness. In the Hauenstein et al. (1999) study, raters were asked to make distinctions between a good, average, and poor performance. It may be that distinguishing between ratees was too easy because of the overt differences in the rating stimuli (Hauenstein et al., 1999). This may explain why there was no empirical distinction between RVT and FOR training. The strength of the RVT model lies in its ability to help the rater focus on the variability in performances and thereby make accurate distinctions among ratees. However, when there are overt differences in the rating stimuli raters have little need for RVT. Stated differently, when raters are asked to make distinctions between performances that are clearly different, RVT does not have a chance to exert its effects and thus rater variability training is of no benefit to the rater. Consequently, asking raters to make distinctions between performance levels that are readily distinguishable is not a sensitive test of the RVT model.
On the other hand, FOR training teaches trainees that rater accuracy can be fostered by
knowing what are good, average, and poor examples of ratee performance. To accomplish this,

17
FOR training provides raters with appropriate prototypes (or frames) for good, average, and poor performance (Sulsky & Day, 1992). These prototypes are thought to guide raters’ processing of future performance information such that ratees learn to accurately categorize ratee performance (Day & Sulsky, 1995). Consequently, in FOR studies raters simply have to match (or categorize) ratee performance to the corresponding prototype. This seems to imply that FOR training may be less effective at enhancing rating accuracy if ratee performance does not directly match an established prototype (frame of reference). In actual organizations it is seldom the case that appraisers are faced with the task of rating performances that clearly correspond to established prototypes of good, average, and poor performance. More often, appraisers are pressed to make fine-grained distinctions between performance levels that are quite similar. It appears, then, that the FOR model has not been subjected to a stringent test. Stamoulis and Hauenstein (1993) commented that studies that have compared the effectiveness of FOR with other training programs have often given FOR and unfair advantage (e.g., Bernardin & Pence, 1980; McIntyre et al., 1984). This may explain why Woehr and Huffcutt (1994) found a strong effect size (.83) for FOR training on the dependent variables of rating accuracy.
As mentioned above, the strength of the RVT model lies in its ability to accurately
discriminate among ratees, however, when performance levels are distinctly different the rater need not rely on RVT to make these distinctions. Consequently, Hauenstein et al. argue that a more sensitive test of the model would require raters to make more fine-grained distinctions in performance. Consequently, the present study incorporates a methodological improvement whereby trainees are required to rate five ratees at posttest (as opposed to three ratees used in the Hauenstein et al. study). There is a poor, below average, average, above average, and good performance. Raters are thereby pressed to make finer-grained distinctions in the rating stimuli. When differentiating between subtle differences in performances the benefits of RVT should emerge. Quantitative Accuracy Feedback
Frame-of-reference training and rater variability training are similar in that both formats include three basic components: 1) a lecture on how to improve the quality of ratings, 2) an opportunity to practice rating performance, and 3) feedback on the practice ratings. Given these similarities, it is important to determine the unique characteristics of each method that purportedly improve rating accuracy.
Bernardin and Buckley (1981), the originators of frame-of-reference training, did not
specify the mechanisms by which FOR leads to increases in rating accuracy. In fact, it took several years before researchers began to propose the causal mechanisms driving the effect. Sulsky and Day (1992) were among the first to attempt to explain why FOR works. They proposed a cognitive categorization perspective in which the success of FOR training is thought largely to be a result of providing raters with the same performance theory as that adopted by those who generated the true scores. This common performance theory (i.e., frame-of-reference) is believed to aid raters in forming correct impressions by which to categorize ratee performance on each performance dimension (Sulsky & Day, 1994). More recently, Schleicher and Day (1998) expounded upon these ideas by investigating content variables as possible causal explanations for the link between FOR training and rating accuracy. The content variables

18
investigated were: (a) the content of the training and the extent to which raters agreed with the content, and (b) the content of raters’ impressions of ratees (Schleicher & Day, 1998). As hypothesized, they found that FOR training led to the formation of less idiosyncratic impressions which thereby increased rating accuracy.
As mentioned above, despite increases in rating accuracy due to FOR training, there is
evidence to suggest that FOR training may actually decrease memory accuracy for specific ratee behaviors (Lord, 1985; Sulsky & Day, 1992). Lord’s (1985) distinction between classification accuracy and behavioral accuracy provides an explanation for this finding. Classification accuracy refers to a rater’s ability to form an overall impression or classification of the ratee’s performance, whereas behavioral accuracy refers to a rater’s ability to encode and recall the specific ratee behaviors. Lord maintained that rater training programs that promote the use of categories that simplify information processing—such as FOR training—may strengthen classification accuracy while weakening behavioral accuracy. Indeed, Sulsky and Day (1992) found that FOR-trained subjects demonstrated lower behavioral accuracy than control subjects when asked about a particular ratee. They concluded that this finding suggests a reduction in behavioral accuracy as a function of the strength of the dimensional impression. Shortly after this study, Stamoulis and Hauenstein (1993) found that FOR trainees demonstrated the greatest improvements in the accuracy component that does not collapse across rating dimensions (i.e., stereotype accuracy). They explained that FOR’s focus on the development of internal standards for the various dimensions of performance does not cultivate between ratee differentiation as measured by differential elevation and elevation accuracy.
As an alternative rater-training method, Stamoulis and Hauenstein proposed rater
variability training which integrates RET’s emphasis on distinguishing among different ratees along with FOR’s accuracy feedback component. RVT feedback, however, orients discussion toward differences between ratees whereas FOR feedback orients discussion toward differences between the practice ratings and the performance standard. This combination of elements is believed to be the mechanism by which RVT fosters accurate distinctions among ratees.
A great deal of research has demonstrated an empirical base for the mechanisms by
which FOR works (Schleicher, & Day, 1998; Sulsky & Day, 1992; 1994). The hypothesized mechanisms for RVT are not as well researched. However, none of this research investigates whether it is the accuracy feedback component alone that is driving the effect. That is, increased rating accuracy may simply be due to the accuracy feedback that the raters receive in relation to their practice ratings. Stated differently, the content of the lecture component may be irrelevant to rating accuracy. Rater training research is clearly in need of an investigation to determine if all prior rating accuracy results are simply a product of receiving accuracy feedback. By including a control group that receives only accuracy feedback, the present study investigates this question. If the control group that receives only accuracy feedback, is indistinguishable from the groups that undergo rater training, then we can rule out lecture content as a causal mechanism of rating accuracy. Designing Rater Training Studies

19
Cooper and Richardson (1986) explain that unfair comparisons occur when a theory is favored by being more strongly operationalized, manipulated, or measured. Similarly, Stamoulis and Hauenstein (1993) have questioned the validity of most of the empirical research that espouses FOR training as the superior training method. As explained in Stamoulis and Hauenstein (1993), studies that have compared the effectiveness of FOR with other training programs have often given FOR an unfair advantage (Bernardin & Pence, 1980; McIntyre, Smith, & Hassett 1984). Consequently, in Stamoulis and Hauenstein (1993) and Hauenstein et al. (1999), each of the training conditions were structurally equivalent, differing only in terms of the content presumed by each perspective to differentially affect rating accuracy. In addition, a theoretically inert control group (Horvath, 1988), designed to control for the structure of training (SOT-control), was included to determine if improvement in accuracy was due to structural similarities of training or to the theoretically relevant components of training. The present study adheres to these set of guidelines with the addition of a second control group that receives accuracy feedback only.
Overview of Study and Hypotheses Because performance appraisals typically rely on subjective measures they are vulnerable
to distortion. For example, Murphy and Cleveland (1995) found that oftentimes 80% to 90% of all employees are rated as “above average.” In light of such distortions, rater-training programs have been developed with the goal of increasing rating accuracy. Frame-of-reference training is arguably the most widely supported method of rater accuracy training. Nonetheless, research has demonstrated that FOR training results in poor recall of specific ratee behaviors (Sulsky & Day, 1992) as well as poor between-ratee discrimination (Stamoulis & Hauenstein, 1993). With the objective of improving the accuracy of between-ratee discrimination, Stamoulis and Hauenstein proposed rater variability training. Hauenstein et al. (1999) compared RVT to FOR training, but found that RVT was no more effective than FOR at improving between-ratee discrimination. The purpose of the present study is to improve upon limitations in the previous study of RVT, and thereby produce differential elevation and elevation effects in rater variability training.
Of primary interest in the present study is the issue of purpose. It is believed that the
benefits of RVT may emerge when the purpose of the appraisal is manipulated. Researchers have long acknowledged that the intended use of appraisal data is an important determinant for choosing a rater training program (Feldman, 1986; Hauenstein, 1998; Hauenstein et al., 1999; Landy, & Farr, 1980; Sulsky & Day, 1992). In addition, Hauenstein (1998) has asserted that RVT should be most effective for administrative decisions and that FOR training should be most effective for developmental decisions, yet such claims have not been systematically evaluated. Therefore, the primary purpose of the present study is to manipulate rating purpose so as to provide a better opportunity for differentiating rater accuracy training programs. In particular, it is expected that when the purpose variable is included RVT will produce elevation and differential elevation effects, while FOR will produce a stereotype accuracy effect. The rationale behind these predictions is that RVT’s emphasis on identifying the relative performance differences between individual ratees facilitates between-ratee discrimination; elevation and differential elevation are the accuracy components that collapse over dimensions and thus tap

20
into between-ratee discrimination. On the other hand, FOR’s emphasis on differences between practice ratings and target scores as well as within ratee discrimination, facilitates between dimension discrimination. Stereotype accuracy is the accuracy component that collapses over ratees and thus taps into between-dimension discrimination. There is no prediction of differences on differential accuracy because both FOR and RVT provide quantitative feedback about ratees on individual dimensions. Therefore, both attempt to improve differential accuracy. The training emphasis is different, however, in that FOR focuses on relative differences among performance dimensions and RVT focuses on relative differences among ratees.
Another interest of this study is to explore alternative operationalizations of accuracy.
Edwards (1993; 1995) explained that the traditional methods for calculating rating accuracy (i.e., Cronbach’s components) are ambiguous for two main reasons. First of all, by squaring component scores, information about the direction of trainees’ ratings is discarded. Secondly, when the component measures are aggregated to form composite scores (EL, DE, SA, and DA), valuable information about the underlying patterns of ratings is lost. Because Cronbach’s components of accuracy are ambiguous, a second measure of rating accuracy is being included. This alternative measure of rating accuracy requires an investigation of the distributions of the simple deviation scores.
This study also incorporates more fine-grained distinctions in the rating stimuli. It may
be that previous research found a lack of empirical distinction between FOR and RVT because of overt differences in the rating stimuli. In other words, the rating task may have been too easy for the raters. Participants were asked to make distinctions among a poor, average, and good performance. These performance levels are distinctly different. The strength of RVT lies in its ability to help the rater focus on the variability in performance and thereby make accurate distinctions among ratees. However, when raters are asked to make distinctions among performances that are clearly different, rater variability training does not have an opportunity to exert its effects, and thus RVT is of no benefit to the trainee. Consequently, previous tests of RVT have not tested the model as it was initially conceptualized. In order for the benefits of RVT to emerge a more sensitive test of the model is needed. By requiring raters to make finer-grained distinctions, it is believed that the benefits of RVT will emerge.
A final topic of investigation is to determine if all prior rater-training findings are simply
the result of providing raters with accuracy feedback. To determine if this is the case, an accuracy only feedback (AO) condition is included in which raters only receive quantitative feedback relative to their practice ratings. The lecture on how to improve the quality of performance ratings is absent from this condition. If the same effects are found for the AO condition as for the rater training conditions, then it can be concluded that the empirical base for the FOR and RVT models is misguided.
The training methods considered in this study are FOR, RVT, an accuracy only feedback
(AO) condition, and a structure of training control (SOT) condition. The RET program is not evaluated in this study because researchers have established that RET is an ineffective method for producing accurate ratings.

21
Cronbach’s Hypotheses Hypothesis 1: Frame-of-reference training and rater variability training will produce
ratings that are more accurate on the Cronbach components than the AO and SOT-Control conditions.
Hypothesis 2: Perceived purpose of rating will affect accuracy of ratings such that trainees who perceive ratings to be used for administrative decisions will be less accurate on the Cronbach components than trainees who perceive the ratings to be used for developmental decisions.
Hypothesis 3: Perceived purpose and training-type will interact such that when the perceived purpose of ratings is for developmental decisions, FOR will be the most effective training method as evidenced by greater accuracy on stereotype accuracy (relative to all other groups). When the perceived purpose of ratings is for administrative decisions, RVT will serve as the most effective training method as evidenced by greater elevation and differential elevation relative to all other groups. Analogue to Cronbach’s Hypotheses
Hypothesis 4: For FOR and RVT, the raw deviation scores on the Cronbach analogue components will be closer to zero than the raw deviation scores for the AO and SOT-Control conditions.
Hypothesis 5: Perceived purpose will affect accuracy such that the raw deviation scores on the analogue components for trainees in the developmental purpose conditions will be closer to zero than the raw deviation scores for trainees in the administrative purpose conditions.
Hypothesis 6: Perceived purpose and training type will interact such that when the perceived purpose of ratings is for developmental decisions, FOR will be the most effective training method as evidenced by smaller raw deviation scores (i.e., closer to zero) on the four components representing the analogue to stereotype accuracy. When the perceived purpose of ratings is for administrative decisions, RVT will be the most effective training method as evidenced by smaller raw deviation scores on the five components representing the analogue to differential elevation, as well as a smaller raw deviation score for the one component representing the analogue to elevation.

22
Chapter 3. Method Experimental Design
The design is a 4 (Training Condition) X 2 (Purpose) X 2 (Time) mixed factor design. Subjects were randomly assigned to one of the eight conditions. In each condition, subjects rated lecture performances both before and after training. Subjects
Subjects were student volunteers from psychology courses at a large southeastern university. The students received three extra credit points for participation in this study. There were a total of 166 subjects. The data from 19 of the subjects was unusable because they knew/recognized one or more of the actors in the performance videos. One other subject’s data was discarded because he rated on the attractiveness of the lecturers. Consequently, there were 93 female subjects and 53 male subjects for a total of 146 subjects. Development of Stimulus Video Clips
Actors for the performance videos were obtained from a university theatre department. Eight different performance vignettes were developed. The same male actor appeared in the three pretest videos while five different female actors performed in the posttest videos. Consequently, there were a total of six actors. The filming of the performances occurred at a university television studio and was directed by the staff at the video broadcast studio; this helped ensure the quality of the videos. Once the performances were filmed, the videotape was digitized and converted to CD-ROM. The video clips were displayed via an LCD projector. This permitted a more efficient method for displaying the video clips.
The vignettes portray eight lecture performances. Three vignettes were scripted for
pretest and five vignettes were scripted for posttest. The filmed lectures were designed to vary performance along three dimensions of teaching effectiveness: organization, delivery, and depth of knowledge. The raters also provided an overall evaluation for a total of four performance dimensions. These performance dimensions are commonly used in the development of lecture TA videos (McDonald, 1991; Zedeck, Jacobs, & Kafry, 1976). Furthermore, these dimensions were selected because: 1) they appear to be conceptually independent of one another, 2) none of the dimensions require interaction with students, and 3) the dimensions are amenable to being displayed in a relatively short videotape (McDonald, 1991). Initially, one other performance dimension was intended to be used in the vignettes: “use of technology.” However, as evidenced in the pilot studies described below, subjects did not clearly differentiate between “poor,” “average,” and “good” uses of technology. Consequently, this dimension had to be discarded.
In order to maximize the probability that trainees perceived the lecture behaviors as
belonging to one of the four dimensions being assessed, a modified BARS (Smith & Kendall, 1963) approach was adopted for determining the critical incidents appearing in the vignettes. First, a group of 34 subjects was presented with the dimension definitions and then asked to generate, for each dimension, critical incidents illustrating good, average, and poor performance (see Appendix A). From these, all of the unique incidents were selected (i.e., redundant

23
incidents were discarded) and combined with a list of critical incidents generated in a previous study which similarly dealt with teacher evaluations (Parrill, 1999).
A second group of 35 subjects was then given the randomized list of the 73 critical
incidents generated by the first group. The task of the second group was to sort the critical incidents into the performance dimensions they most closely represented. Subjects were told that they did not have to classify any behaviors they felt were unclassifiable. Critical incidents were eliminated if there was not 70% or greater agreement in the categorization of behaviors (Cascio, 1998). Eleven of the original 73 critical incidents did not have 70% or greater agreement, and thus were discarded. The remaining 62 critical incidents were classified as belonging to one of the four performance dimensions (see Appendix B).
Finally a third group of 32 subjects was provided with the list of the remaining 62
critical incidents (see Appendix C). This third group was instructed to rate each of the incidents on a scale ranging from 0 to 100. They were told that 0 indicated an extremely ineffective lecture behavior, 50 indicated an average lecture behavior, and 100 indicated an extremely effective lecture behavior. The mean ratings for each critical incident were then calculated. Critical incidents were discarded if their standard deviations were higher than 25.00. Three critical incidents had standard deviations higher than 25.00. They were: 1) “only lectures on material from textbook,” 2) “teacher reiterates important points,” and 3) “teacher has to stop and think before he/she can explain something he/she should already know.” Also, at this point it was decided to discard the “use of technology” performance dimension because the subjects did not clearly differentiate between effective and ineffective uses of technology. For example, the mean rating for “uses overhead” was 71.41, the mean rating for “uses power point” was 73.73 and the mean rating for “uses the internet” was 68.91. Consequently, there were 50 remaining critical incidents to use for incorporating into the vignettes.
In the pretest videos, two critical incidents were incorporated for each dimension (see
Appendix D). The critical incidents with the highest mean ratings for each dimension were incorporated into the script for the “good” lecture performance. The critical incidents with the lowest mean ratings were incorporated into the script for the “poor” lecture performance, and the critical incidents that were closest to a mean rating of 50 were incorporated into the “average” lecture performance. By incorporating those incidents with the highest, lowest, and most average ratings, the three training scripts were clearly distinct from one another (see Appendix E).
For the posttest videos, each performance dimension was represented by one critical
incident (see Appendix D). None of the critical incidents that were used in the pretest videos were used in the posttest videos. Of the remaining critical incidents, those with the lowest mean ratings were incorporated into the “poor” lecture performance, and those with the highest mean ratings were incorporated into the “good” lecture performance. The “below average” performance contained two critical incidents with low mean ratings, and one critical incident with a high mean rating. The “average” performance contained the remaining critical incidents with mean ratings closest to 50. Finally, the “above average” lecture performance contained two critical incidents with high mean ratings and one critical incident with a low mean rating.

24
The lecturer in the pretest videos lectured on the topic of memory, and the lecturers in the
posttest videos all lectured on the topic of conformity (see Appendix E). The pretest videos ranged from three and a half minutes to five and a half minutes in length, while the posttest videos ranged from five and a half minutes to eight minutes long. Development of Target Scores
The measurement of rating accuracy requires a set of “true” or targets scores for comparison. Therefore, target scores were developed for each of the eight performance vignettes. Using procedures recommended by Woehr (1994)--who found interrater agreement of .89--four upper-level graduate students in industrial/organizational psychology served as the expert judges. First, the expert judges discussed each of the four performance dimensions in order to reach agreement about what constituted effective and ineffective performance on each of the dimensions. The judges also discussed how information should be combined when forming a rating on each dimension. The judges rated the three pretest performance videos first, and then the five posttest performance videos. For the pretest performances, the judges were first shown the average performance followed by the poor performance, and finally the good performance. For the posttest performances, the judges once again were first shown the average performance, then the above average performance, the good performance, the poor performance, and finally the below average performance. Before viewing each vignette the judges read the script. Then, each judge rated the lecturer on all four performance dimensions. After independently rating the lecturer, the judges discussed their individual ratings and then came to a consensus. The interrater agreement for the judges’ independent ratings was .77, indicating that even before the judges arrived at consensus ratings, their scores were rather similar to one another. This procedure was replicated for each ratee. Procedure
The procedure is a replication and extension of Stamoulis and Hauenstein (1993), and Hauenstein et al. (1999). The present study expands upon these previous studies by including a purpose condition, an alternative operationalization of accuracy, finer-grained distinctions in rating stimuli, and an accuracy only (AO) feedback condition.
Training sessions were conducted in a classroom computer lab. The number of trainees
in each session ranged from three to eleven. Training groups of this size ensured that all trainees were seated close enough to the screen to easily see and hear the vignette, and then engage in meaningful discussion during the discussion portion of the training. In order to adhere to fair comparisons, each training sessions was designed to last approximately 2 ½ hours (see Appendix F).
Three trainers (i.e., experimenters) conducted the training sessions. In order to control
for experimenter effects, trainers were alternated so that two different trainers conducted each type of training condition. The trainers participated in a training and practice session before conducting the real sessions. Furthermore, trainers strictly adhered to the training scripts (see Appendix G). This procedure is adopted from Stamoulis and Hauenstein (1993).

25
Participants were randomly assigned to a purpose condition and a training format. Upon arrival, the participants were informed that they had signed-up to participate in a performance evaluation task, and that they would be evaluating the lecture performances of graduate teaching assistants. The trainees were taught that performance appraisal is the systematic description of job-relevant strengths and weaknesses. Trainees were further instructed that performance appraisal comprises two processes, observation and judgment, and that both of these are subject to bias (Cascio, 1998). For this reason, the participants were told that before engaging in the evaluation task they would first undergo training/practice in order to learn how to accurately rate performance.
Before beginning the actual training session, the trainees viewed and then rated three
practice performances (pretest). Trainees were informed that the TA appearing in the practice clips was an actor playing the part of a lecture TA. The vignettes represented a good, average, and poor lecture performance. These pretest ratings were used to provide a baseline of rating accuracy for each of the trainees. After completing the pretest, the trainees were either told that they would evaluate TAs in order to provide feedback (developmental condition), or to help decide which of the candidates should be selected for the position as an Introductory Psychology TA (administrative condition). The trainees then received a rater-training lecture, dependent upon the assigned training format. During the practice component of the training session, the trainer displayed each trainee’s pretest ratings and asked each rater to describe his/her rationale in rating each of the three practice performances. The group then discussed how on-target each rater was in rating the practice vignettes. A summary rater training lecture then followed. Finally, trainees were asked to view and rate the actual performances of five lecture TAs (posttest). All training conditions viewed the same three vignettes at pretest and the same five vignettes at posttest. The order in which trainees viewed the various performances was randomly determined at pretest and posttest. Purpose Conditions
Before trainees arrived at the training session, it was randomly decided if the session would be a developmental condition or an administrative condition; approximately half of all trainees were assigned to each condition.
Developmental purpose. Those trainees assigned to the developmental purpose condition
were told that they would be evaluating TAs currently employed by the university and that the purpose of the performance evaluation was to provide feedback. Furthermore, trainees were told that the TAs would be instructed to use the evaluative feedback to gain awareness of their strengths and weaknesses as teachers, and to use that information to hone in on their teaching skills. Trainees were also informed that the teaching assistants’ supervisors would NOT have access to this information. To enhance the believability of the task, the trainees were informed that the existing teacher evaluation forms that all students complete at the end of each semester, although useful in many ways, are in some ways inadequate. In particular, trainees were told that it has become evident that many students have not taken seriously the teacher evaluation forms, and have rushed through the forms thereby failing to provide well thought out answers. For these reasons, the university is recruiting the aid of students in this evaluation task.

26
Administrative Purpose. In contrast, trainees assigned to the administrative purpose condition were informed that they would be evaluating the performance of potential candidates for lecture TA positions. The trainees were instructed that the people in charge of making hiring decisions would use the trainees’ ratings to help them determine which candidates should be hired as Introductory Psychology TAs. Furthermore, the trainees were told that the teaching experience the graduate students would gain from being a TA would be very valuable in terms of their future career aspirations (i.e., becoming college professors), and also that these graduate students rely on teaching assistantships for funding. Therefore, trainees in this condition were led to believe that their evaluations carried a serious consequence. Rater Training Methods
To compare differential effects of the core content of the training methods, the FOR, RVT, accuracy-only (AO), and SOT-control conditions were designed to be as similar as possible. All training conditions followed a protocol similar to the one implemented by Stamoulis and Hauenstein (1993), and by later by Hauenstein et al. (1999):
1. At pretest, trainees watched the three “practice” performances. Trainees rated the three performances and wrote-out justifications for their ratings. These ratings were used to establish a baseline of rating accuracy for each trainee.
2. At the beginning of the training session, trainees were lectured on the importance of conducting accurate performance evaluations, and the general need to pay close attention in observing work behaviors.
3. A group discussion was then conducted. The purpose of the discussion was to focus on generating lecture TA performance behaviors. The four rating dimensions (organization, delivery, depth of knowledge, and overall evaluation) were presented and discussed.
4. Next, there was a lecture and discussion relating to the specific training program assignment (RVT, FOR, AO, SOT).
5. The trainer then displayed each trainee’s ratings from the pretest, and asked each rater to describe his/her rationale in rating each of the three vignettes. Verbal feedback by the trainer was dependent on the training condition. The group then discussed how on-target each rater was in rating each vignette. The trainer answered any questions that might have arisen.
6. A summary of the content involved with the particular condition was presented in discussion format.
7. Upon completion of the training session, trainees viewed and rated the final five TA performances (posttest).
Although the structure of the FOR, RVT, AO, and SOT-control conditions was the same,
the content and focus of each was different (Hauenstein et al., 1999). All training conditions viewed the same performance vignettes. In addition, all training conditions exactly followed steps 1-3. However, beginning with step 4, the content and focus of each condition varied depending on the particular training format.
FOR Training. The FOR condition was specifically designed to follow the FOR program
as originally proposed by Bernardin and Buckley (1981). In the lecture, FOR trainees were told that rater accuracy can be fostered by the rater knowing what are good, average, and poor

27
examples of TA behavior within each dimension. During discussion, FOR trainees generated examples of good, average and poor behaviors in each performance dimension. Then the trainees’ pretest ratings were compared to the target ratings during the feedback portion of the session. The trainer wrote the target rating on the overhead projectors, and then the trainees’ observed ratings for the first ratee were discussed in relation to the target ratings, then observed ratings for ratee two were discussed in relations to the target ratings, and so on until all ratees were discussed. For each trainee, the trainer indicated the ratings that were similar and different from the target scores. The trainer briefly talked about the strengths and weaknesses in each rater’s rationale. The trainer asked if the trainees had any questions regarding discrepancies between their ratings and the target scores or between their rationale for a rating and the rationale given by the trainer. The training summary focused on FOR concepts covered in the FOR lecture (Hauenstein, et al., 1999; Stamoulis & Hauenstein, 1993).
RVT Training. The RVT condition followed the same pattern. During the lecture,
trainers explained that a primary goal of rating performance is accurate differentiation among ratees. RVT trainees were told that assigning ratings that correspond to the true variability in performance encourages rating accuracy. Trainees were provided with an analogy in which it was explained that differentiating among TAs is analogous to sorting pebbles by size with a sieve. If the holes in the sieve are too large, all of the pebbles pass through rendering the sorting effort useless. Trainees were instructed to introduce variability in their ratings to demonstrate that within each TA the level of effectiveness varies across dimensions, and that within each dimension the level of effectiveness varies across TAs. During discussion, RVT trainees were encouraged to describe several TAs and how their levels of effectiveness vary. During the feedback portion of the training session, the trainer compared the trainees’ pretest ratings with the target scores. The trainer wrote the target rating on the overhead transparency for the first dimension for the three performance levels along with each trainee’s observed ratings for the first dimension. For each trainee, the trainer indicated the ratings that were similar and different from the target scores. Then, the behavioral differences between vignettes were discussed, focusing on occurrences in each vignette that justified rating differences on the first dimension. The same protocol was repeated for all four dimensions. In this way, the focus was on accurately differentiating ratees within a dimension. The training summary focused on RVT concepts covered in the RVT lecture (Hauenstein et al., 1999).
Accuracy-Only. FOR and RVT are predicated on the notion that both the lectures on
how to improve rating accuracy and the quantitative feedback lead to increased rating accuracy. The purpose of the accuracy only (AO) condition was to test whether quantitative accuracy feedback alone is the cause of improvements in rating accuracy. To this end, the lecture components for the AO condition contained no information about how to improve performance ratings. The participants in this condition received a lecture on the history of performance appraisals and current trends in the use of performance appraisals. The trainees were also asked to generate some examples of how their performance is evaluated as students. The trainer wrote these examples on the chalkboard. Then during feedback, the trainer displayed each trainee’s ratings from the pretest and asked each rater to describe his/her rationale for the ratings. Then, the trainer simply informed the trainees of the target ratings. In this way, the trainer was only providing the trainees with quantitative accuracy feedback. The group then briefly discussed

28
how on target each rater was in rating each vignette, and the trainer answered any questions. The training summary returned to the issues described in the lecture on the history and trends of performance appraisals. Structuring the AO condition in this manner allowed for meaningful comparisons in terms of gauging whether the effects of quantitative accuracy feedback alone are enough to improve rating accuracy.
SOT Control Training. The SOT control condition was void of both lectures to improve
rating accuracy and quantitative accuracy feedback. Participants in this condition received the same lecture as the AO condition about the history of performance appraisals and the current trends in the use of them. Likewise, trainees were asked to generate examples of how their performance as a student is evaluated. During the feedback portion of the session, the raters were asked to present to the group their ratings for each of the three performance vignettes. For each trainee, the trainer generally indicated the ratings that were similar and different from the other trainees’ ratings, and then discussed how on-target the raters’ scores were in relation to one another. The trainer asked if there are any questions. The training summary returned to the issues addressed in the lecture on the history and trends of performance appraisals. Dependent Measures
Rating Scales. The rating scales typically used in rater training studies require raters to assign integer values to the performances. For example, raters may be asked to indicate on a scale of 1 (poor performance) to 7 (excellent performance) the number that best corresponds to the ratees’ performance. These scores are then compared to the target scores. The target scores, however, are seldom represented by integer values, and are oftentimes carried out to two or more decimal places. This means that raters can never capture true accuracy because true accuracy falls somewhere between the scale anchors. In order to deal with this issue, the present study used a scale that ranged from 0 to 100 (see Appendix H). Trainees were instructed that a 0 indicated an extremely ineffective performance, 50 indicated an average performance, and 100 indicated an extremely effective performance. For the target scores, the judges arrived at consensus ratings as opposed to computing the mean rating of the judges’ independent scores. This was done in order to avoid using target scores that were carried out to two or more decimal places. By using integers for the target scores, this permitted trainees to attain perfect accuracy.
Accuracy Scores. In the present study, accuracy is operationalized in two ways. The
more traditional approach employs elevation, differential elevation, stereotype accuracy, and differential accuracy as the operational definitions of accuracy. These Cronbach scores were converted to standardized z scores because there is not a direct correspondence between pretest ratings and posttest ratings. That is, at pretest the trainees evaluated a poor, average, and good performance, whereas at posttest the trainees evaluated five ratees whose performances were less easily distinguished. This made the rating task at posttest inherently more challenging, and therefore more difficult to achieve accuracy. Furthermore, because ratees were making more evaluations at posttest, this means that there were more chances to be inaccurate. For these reasons, it was decided to standardize the scores. In the case of standardized scores, negative values indicate higher levels of accuracy, and positive values indicate lower levels of accuracy.
29
The advantage of the Cronbach method is that it condenses the data into manageable components that are easily and objectively interpreted. The disadvantage of this approach is that it obscures information about the underlying patterns of over and underestimation, reduces systematic variance, and also discards information about the direction of the rater’s accuracy scores.
Raw deviation scores were used for the alternative operationalization of accuracy. In
order to obtain the raw deviation scores, the observed mean ratings were subtracted from the target mean ratings. This was done for both pretest and posttest. When using raw deviation scores, zero represents perfect accuracy. Raters who overestimated the target rating have a positive deviation score, whereas raters who underestimated the target rating have a negative deviation score.
For the elevation analogue to Cronbach’s elevation, there is one deviation score
representing the unsquared distance between the overall observed mean and the overall target mean. For the differential elevation analogue, there are eight separate deviation scores, one for each ratee (i.e., the three pretest lecturers and the five posttest lecturers). The differential elevation deviation scores, for a given rater, reflect the difference between his/her mean observed rating for a ratee and the overall target mean rating for that ratee. The stereotype accuracy analogue produces four deviation scores for pretest and four deviation scores for posttest. That is, one for each dimension. Each deviation score reflects the difference between the mean observed dimension rating and the corresponding mean dimension target score. Finally, the differential accuracy analogue produces thirty-two deviations scores (eight ratees X four dimensions). Each deviation represents the difference between the mean observed rating and the corresponding target score for that particular ratee and dimension.
30
Chapter 4. Results Descriptive statistics for pretest and posttest ratings for each of the standardized
Cronbach accuracy measures are presented in Table 4.1. Because the scores have been standardized, the more negative a value is the more accurate it is. The correlations between the accuracy measures are presented in Table 4.2. Consistent with Cronbach’s theoretical view, the scores are reasonably independent. A one-way MANOVA was conducted to determine if there were any significant experimenter effects. Results indicated that there were no significant differences among experimenters on pretest elevation, F (2, 143) = .511, p > .05; on pretest differential elevation F (2, 143) = 1.157, p > .05; on pretest stereotype accuracy, F (2, 143) = .533, p > .05, or on pretest differential accuracy, F (2, 143) = .696, p > .05. Check on Mean Differences for Pretest Cronbach Measures
In order to assure that random assignment worked as intended, 4 (Training Condition) X 2 (Purpose) analyses of variance (ANOVAs) were conducted on each pretest measure of accuracy. The ANOVA indicated that there are pretest differences among conditions on differential elevation accuracy. A significant training by purpose interaction was found, F (3, 138) = 3.447, p < .05 (see Figure 4.1). As the figure demonstrates, this interaction was largely driven by the difference between the RVT and AO conditions. At pretest, the RVT administrative condition was the most accurate of the conditions, while the RVT developmental condition was the least accurate. This same pattern was demonstrated by the FOR and SOT-Control conditions, although not as extreme. On the other hand, the AO conditions demonstrated the opposite pattern whereby the developmental AO condition was more accurate than the administrative AO condition at pretest. This was the source of the interaction. There was also a main effect of training that approached significance, F (3, 138) = 2.425, p = .068. Follow-up tests were conducted to evaluate the six pairwise differences among the training condition means. At pretest, the AO condition was nearly significantly more accurate on differential elevation than the FOR condition. For differential elevation, the ANOVA also indicated a main effect of purpose, F (1, 138) = 8.2, p < .01, such that the administrative purpose conditions were more accurate at pretest than the developmental purpose conditions.
For pretest stereotype accuracy, the training by purpose interaction approached
significance, F (3, 138) = 2.465, p = .065 (see Figure 4.2). Once again, this interaction was largely driven by differences between the RVT conditions. However, this time, the difference between the two RVT conditions was reversed for stereotype accuracy. That is, the RVT administrative condition was the least accurate at pretest, while the RVT developmental condition was much more accurate. Similar to the case with differential elevation, both FOR and SOT-Control had better stereotype accuracy under the administrative purpose condition and poorer stereotype accuracy under the developmental condition. This difference in patterns between RVT, FOR, and SOT-Control, was the cause of the interaction approaching the traditional significance cut-off. Although the effects for stereotype accuracy were not statistically significant, the fact that the pretest means were so divergent raises concern about the interpretation of the results for stereotype accuracy. In addition to a significant interaction, the main effect of training was nearly significant, F (3, 138) = 2.406, p = .07. Follow-up tests were conducted once again to evaluate the pairwise differences among the training condition means.
31
The follow-up tests indicate a nearly statistically significant difference between RVT and AO, such that the AO condition had better stereotype accuracy than the RVT condition at pretest.
These preliminary analyses indicate that random assignment did not work as intended for
differential elevation, and also remains a possible threat to validity for stereotype accuracy. The primary analytical plan for testing the hypotheses was to use analysis of covariance (ANCOVA) to statistically control for individual differences in pretest accuracy when testing the between subjects effects. When random assignment of subjects to conditions works, then ANCOVA decreases the likelihood of a Type II error. Unfortunately, when random assignment of subjects does not work, and groups differ on pretest scores, then interpretation of ANCOVA is more difficult (Cook & Campbell, 1979). Furthermore, these pretest differences on differential elevation suggest more generally the experimental groups may differ in meaningful ways that have not been measured (cf. Pedhazur, & Pedhazur Schmelkin, 1991), which warrants caution about the interpretation of all results in this study. Repeated Measures ANOVAs on Cronbach Measures
The initial analyses were used to explore the pattern of changes in accuracy scores as a function of the independent variables. The standardized Cronbach measures were used as the dependent variables in four 4 (Training Condition) X 2 (Purpose) X 2 (Time) repeated measures analyses of variance (See Table 4.3). Training condition and purpose were the between-subjects factors, and time was the within-subjects factor.
Elevation. The repeated measures analysis for elevation accuracy indicate that there were
no significant differences among training conditions, F (3, 138) = p > .05, no significant differences among purpose conditions, F (1, 138) p > .05, and no significant training by purpose interactions, F (3, 138) p > .05.
Differential Elevation. For differential elevation the repeated measures analysis
demonstrated a significant training by purpose interaction, F (3, 138) = 8.12, p < .05. This is somewhat troubling because the significant interaction indicates that the differences in pretest differential elevation were so large that the differences continued to influence the repeated measure analyses, and/or that training and purpose did not have much of an impact on accuracy. To determine the pattern underlying this interaction, differential elevation was collapsed over the time factor and a 4 (Training Condition) X 2 (Purpose) univariate ANOVA was conducted. The 4 X 2 ANOVA indicated by a significant training by purpose interaction, F (3, 138) = 3.442, p < .05. A plot of the cell means indicates that the significant interaction was driven by the AO training condition which demonstrated lower accuracy under the administrative condition and higher accuracy under the developmental condition while the opposite pattern was demonstrated by FOR, RVT, and SOT-Control (see Figure 4.3). The plot also demonstrates that the RVT administrative condition was most accurate on differential elevation when collapsed over pretest and posttest. There were no significant differences among training conditions, F (3, 138) p > .05, but there was a significant main effect of purpose, F (1, 138) = 8.12, p < .01, such that the administrative condition was significantly more accurate than the developmental condition. This main effect of purpose was qualified by the interaction.

32
Stereotype Accuracy. The repeated measures analysis for stereotype accuracy produced a significant within-subjects time by training interaction. In order to investigate the pattern underlying this interaction, I collapsed purpose conditions and plotted the time by training interaction (see Figure 4.4). An examination of the figure reveals that the interaction is primarily driven by better stereotype accuracy at pretest than at posttest for the SOT-Control condition, and higher stereotype accuracy at posttest than at pretest for the RVT condition.
Differential Accuracy. Finally, the repeated measures analysis for differential accuracy indicated a time by training by purpose three-way interaction that approached significance, F (3, 138) = 2.525, p = .06. To determine the pattern underlying the interaction two plots were created—one to display the time by training interaction for the administrative conditions (see Figure 4.5) and a second plot to display the time by training interaction for the developmental conditions (see Figure 4.6). The administrative plot indicates that FOR and SOT-Control had better differential accuracy at pretest than at posttest, while RVT and AO had better differential accuracy at posttest than at pretest. The developmental plot indicates that differential accuracy improved for the FOR condition at posttest. However, differential accuracy decreased for the RVT and CON conditions at posttest. Differential accuracy stayed about the same from pretest to posttest for the AO condition. Summarization of Repeated Measure Analyses
Elevation. The repeated measures analysis indicated that there were no significant differences among training conditions on elevation accuracy. This finding is inconsistent with the first hypothesis which predicted a main effect of training such that FOR and RVT would demonstrate higher accuracy on elevation relative to the AO and SOT-Control conditions. The repeated measures analysis also indicated no significant differences among purpose conditions on elevation accuracy. This finding is also inconsistent with the second hypothesis that predicted subjects in developmental conditions would be more accurate on elevation than subjects in administrative conditions. The third hypothesis predicted an interaction between training and purpose condition such that trainees in the RVT administrative condition would demonstrate greater elevation accuracy relative to all other conditions. Once again, the results of the repeated measures analysis were not consistent with this hypothesis. In summary, there were no differences between groups on elevation accuracy.
Differential Elevation. For differential elevation, the repeated measures analysis
indicated no significant main effects of training condition. This finding is not consistent with the first hypothesis that predicted greater differential elevation accuracy for RVT and FOR relative to all other conditions. There was a significant main effect of purpose indicating that the administrative purpose condition was more accurate than the developmental purpose condition. This finding is not consistent with the second hypothesis that predicted developmental conditions would be more accurate than administrative conditions. These main effects were qualified by a significant interaction between training and purpose. This significant interaction is problematic because any significant between-subjects factor should have interacted with time. Because there was no interaction with time this indicates that the effects of the purpose and training intervention were washed out by large differences between groups at pretest, and/or that the independent variables had no effect. The pattern underlying this

33
interaction indicates that the AO condition had higher differential elevation accuracy under the developmental purpose condition and lower differential elevation accuracy under the administrative purpose condition. This pattern is consistent with the second hypothesis that predicted greater accuracy for trainees in the developmental conditions. However, the remaining training conditions demonstrated greater differential elevation accuracy in the administrative conditions than in the developmental conditions. These patterns are inconsistent with the second hypothesis. The plot also demonstrates that the RVT administrative condition was most accurate on differential elevation. This pattern is consistent with the third hypothesis that predicted RVT administrative conditions would be most accurate on differential elevation relative to all other conditions.
Stereotype Accuracy. The repeated measures analysis for stereotype accuracy produced a
significant within-subjects time by training interaction. The pattern underlying this interaction indicates that the interaction is primarily driven by higher stereotype accuracy at pretest than at posttest for the SOT-Control condition, and higher stereotype accuracy at posttest than at pretest for the RVT condition. This finding demonstrates partial support for the first hypothesis which stated that RVT-trained subjects would be more accurate than subjects in the SOT-control conditions.
Differential Accuracy. The repeated measures analysis for differential accuracy
indicated a time by training by purpose three-way interaction that approached significance. A plot of the cell means indicates that RVT and AO trainees in the administrative purpose condition improved on differential accuracy at posttest while FOR and SOT-Control trainees in the administrative purpose condition decreased in differential accuracy at posttest. According to the first hypothesis, both RVT and FOR should have improved on differential accuracy at posttest. No differential predictions between FOR and RVT were made for this dependent variable.
For subjects in the developmental purpose condition, a plot of the cell means indicates
that FOR trained subjects improved on differential accuracy at posttest while RVT and SOT-Control conditions decreased in differential accuracy at posttest. Differential accuracy for the AO condition remained stable from pretest to posttest. Once again, this difference between FOR and RVT conditions is surprising because no differential predictions between FOR and RVT were made for this dependent variable. ANCOVA’s on Cronbach Measures
Analysis of covariance (ANCOVA) is a powerful tool in true experiments because it allows for the statistical control of pretest measures (Cook & Campbell, 1963), thereby reducing error variation and increasing power. The ANCOVA analyses are being used to test the hypotheses. Unfortunately, random assignment of subjects to conditions did not work as intended. Therefore, the results of the ANCOVAs must be interpreted more cautiously.
Elevation Accuracy. A preliminary analysis evaluating the homogeneity-of-slopes
assumption indicated that the relationship between pretest elevation and posttest elevation did not differ significantly as a function of the independent variables (see Table 4.4). Consequently,

34
all interaction terms involving the covariate were collapsed into the error term (see Table 4.5). The first hypothesis predicted better accuracy on all measures for the FOR and RVT conditions relative to the AO and SOT-control conditions. However, the ANCOVA indicated no significant differences among training conditions on elevation accuracy, F (3, 137) p > .05. The second hypothesis predicted greater accuracy on all measures for those trainees in developmental purpose conditions. This hypothesis was also not supported by the ANCOVA, F (1, 137) p > .05. Lastly, the third hypothesis predicted a training by purpose interaction such that RVT trainees in the administrative condition would demonstrate the greatest elevation accuracy relative to all other conditions. No support was found for this hypothesis, F (3, 137) p > .05. In summary, no significant differences were found for elevation accuracy.
Differential Elevation. The preliminary analysis evaluating the homogeneity-of-slopes
assumption for differential elevation suggested that the relationship between pretest differential elevation and posttest differential elevation differed as a function of training condition, F (3, 130) = 2.589, p = .056 (see Table 4.4). In order to investigate this relationship, cells were collapsed over purpose and a regression line was generated for each training condition with pretest differential elevation serving as the predictor and posttest differential elevation as the criterion. The regression lines were represented in one plot (see Figure 4.7). As seen in Figure 4.7, when trainees were inaccurate at pretest, in all cases their differential elevation accuracy improved after training. The SOT-Control condition demonstrated the least improvement in differential elevation while the RVT and FOR conditions demonstrated the greatest improvements in differential elevation accuracy. Interestingly, when trainees were accurate at pretest, in all cases but RVT, their differential elevation accuracy decreased at posttest, suggesting that RVT trainees benefited the most from training.
Stereotype Accuracy. The analysis of homogeneity of slopes for stereotype accuracy
indicated that the relationship between pretest stereotype accuracy and posttest stereotype accuracy did not differ significantly as a function of the independent variables (see Table 4.4). The ANCOVA (see Table 4.5) indicates that there was not a significant training by purpose interaction, F(3, 137) = .455, p > .05, nor a significant main effect of purpose, F (1, 137) = .864, p > .05. There was, however, a significant main effect of training, F (3, 137) = 3.74, p < .05. The AO condition had the most accurate posttest stereotype accuracy when adjusted for pretest differences (M = -.398). The RVT condition was next in posttest stereotype accuracy adjusted for pretest differences (M = -.139), followed by the FOR condition (M = .085). The SOT-control condition had the worst posttest stereotype accuracy when adjusted for pretest differences (M = .341). Using posttest stereotype accuracy as the dependent variable, follow-up t-tests were conducted to determine which training conditions were significantly different from one another. Trainees in the AO condition had significantly better stereotype accuracy than trainees in the FOR condition, t (72) = 2.463, p < .05, as well as better stereotype accuracy than trainees in the SOT-control condition, t (72) = -3.271, p < .01. The difference between stereotype accuracy for trainees in the RVT and SOT-control condition approached significance, with trainees in the RVT condition more accurate than trainees in the SOT-control condition, t (70) = -1.83, p = .07. All other differences between training conditions were non-significant.

35
Differential Accuracy. The preliminary analysis evaluating the homogeneity-of-slopes assumption for differential accuracy indicated that the relationship between pretest differential accuracy and posttest differential accuracy differed as a function of training condition, F (3, 130) =3.601, p < .05. In order to investigate this relationship, cells were collapsed over purpose and a regression line was generated for each training condition. Pretest differential accuracy served as the predictor and posttest differential accuracy served as the criterion. The regression lines were represented in one plot (see Figure 4.8). The plot reveals that trainees who were inaccurate at pretest improved in differential accuracy at posttest as a function of training. The FOR condition improved the most in posttest differential accuracy while the AO condition improved the least in posttest stereotype accuracy. Similar to differential elevation, the plot also reveals that trainees accurate at pretest were less accurate at posttest. This occurred for all trainees except those in the AO condition. For AO training, trainees inaccurate at pretest remained relatively inaccurate at posttest, and trainees accurate at pretest remained accurate at posttest indicating that training had little effect on the AO condition. Summarization of ANCOVA analyses for Cronbach Measures
Elevation Accuracy. The results of the ANCOVA analyses for elevation accuracy provide no support for the hypotheses. That is, FOR and RVT were no more accurate than the AO and SOT-Control conditions (H1), the developmental condition was not significantly more accurate than the administrative conditions (H2), and the RVT administrative condition was not significantly better on elevation accuracy than the other conditions (H3). In fact, there were no significant differences among any of the conditions on elevation accuracy.
Differential Elevation. There was a factor X covariate interaction for differential elevation such that the relationship between pretest differential elevation and posttest differential elevation differed as a function of training type. Cells were collapsed over purpose and regression lines were plotted for each training condition in order to investigate this relationship. When trainees were inaccurate at pretest, posttest differential elevation improved for all conditions except SOT-Control. RVT and FOR trainees inaccurate at pretest demonstrated the greatest improvement. This provides partial support for the first hypothesis that FOR and RVT would improve on differential elevation accuracy relative to AO and SOT-Control. The finding that AO also improved on differential elevation is inconsistent with the first hypothesis. Interestingly, when trainees were accurate at pretest, differential elevation decreased at posttest for all conditions except RVT. Also, when collapsed over purpose, the RVT administrative condition demonstrated the best differential elevation, indicating once again that differential elevation accuracy was most positively influenced by RVT. This was consistent with the third hypothesis. No support was found for hypothesis two on differential elevation.
Stereotype Accuracy. The ANCOVA for stereotype accuracy indicated a significant
main effect of training such that the AO conditions were significantly more accurate than trainees in the FOR and SOT-Control conditions. This finding did not support the first hypothesis that FOR and RVT trainees would have better stereotype accuracy than the AO and SOT-Control conditions. The results also indicate that the RVT trainees were nearly significantly more accurate than the SOT-Control trainees. This does provide partial support for the first hypothesis. In regards to the second hypothesis, trainees in the developmental

36
conditions did not have better stereotype accuracy than trainees in the administrative conditions, as was predicted. There was also no support for the third hypothesis; trainees in the FOR developmental conditions were no more accurate on stereotype accuracy than trainees in the other conditions.
Differential Accuracy. There was a factor X covariate interaction for differential
accuracy indicating that the relationship between pretest differential accuracy and posttest differential accuracy was not the same for all training conditions. To investigate this relationship cells were collapsed over the purpose factor and regression lines for each training condition were plotted. For those trainees inaccurate at pretest, differential accuracy noticeably improved at posttest for the FOR, RVT and SOT-Control conditions. The finding that SOT-Control also improved at posttest does not support the first hypothesis. Interestingly, when trainees were accurate at pretest, posttest differential accuracy decreased for all condition except AO. No support was found for hypotheses two and three. Alternative Analyses
The purpose of the alternative analyses was to eliminate the process of squaring components, and to reduce the amount of aggregation necessary for computing Cronbach’s accuracy measures. Calculation of the traditional Cronbach components raises concern because the squaring process, although necessary in order to aggregate, eliminates information about the direction of the deviations between the observed scores and the target scores and also reduces systematic variation. To see this reduction in systematic variance, consider a simple example. If before squaring the differential elevation components, the first ratee has a value of –3 and the second ratee has a value of +3, then the differential elevation variance of these two scores after squaring is zero. However, if the values are not squared then differential elevation variance is greater than zero. The loss of directional information and restriction of variance, both due to the squaring of components, may cause reliable training effects to go undetected.
Furthermore, the aggregation of the ratee components for differential elevation, the
aggregation of the dimension components for stereotype accuracy, and the aggregation of ratee by dimension components for differential accuracy eliminates information about the raters’ patterns of over and underestimation of the target scores. For example, trainee A and trainee B evaluate four ratees; consequently, four components (representing the four ratees) are involved in the computation of the differential elevation score for each trainee. Trainee A’s values on the four components are 5 for the first ratee, 20 for the second ratee, 5 for the third ratee, and 20 for the fourth ratee. Trainee B exhibits the opposite pattern: 20, 5, 20 and 5. These two trainees are clearly exhibiting differences in their evaluation of the four ratees. However, in order to calculate differential elevation these four components are aggregated. Upon aggregation, these two trainees end up having identical accuracy scores. As this simple example demonstrates, the process of aggregating components is problematic because it eliminates information about patterns of over and underestimation.
Consequently, there are three main objectives of the alternative analyses: 1) retain
information about direction of ratings, 2) retain systematic variation, and 3) retain information about the pattern of ratings. In order to accomplish these objectives, the scores will not be
37
squared, and the components will not be aggregated for differential elevation, stereotype accuracy and differential accuracy (elevation represents the overall grand mean, and therefore is comprised of only one component). That is, each component for each cell is investigated in relation to the corresponding target components. The decision as to whether the hypotheses are supported is determined by examining the pattern of distributions for each condition. In accordance with Edward’s recommendation, no single test established whether the hypotheses were supported or refuted, instead, the decision to support or refute was based on the interpretation of the observed patterns. Patterns, in this case, were deduced from the distributions of raw deviation scores. Although this method is more cumbersome, it permits an analysis of the patterns underlying accuracy.
The scores being compared are raw deviation scores. In order to obtain the raw deviation
scores, the observed mean ratings were subtracted from the target mean ratings. This was done for both pretest and posttest. When using raw deviation scores, zero represents perfect accuracy. Raters who overestimate the target rating have a positive deviation score, whereas raters who underestimate the target rating have a negative deviation score.
For the analogue to Cronbach’s elevation, there is one deviation score representing the
unsquared distance between the overall observed mean and the overall target mean. For the differential elevation analogue, there are eight separate deviation scores, one for each ratee (i.e., the three pretest lecturers and the five posttest lecturers). The differential elevation deviation scores, for a given rater, reflect the difference between his/her mean observed rating for a ratee and the overall target mean rating for that ratee. The stereotype accuracy analogue produces four deviation scores (four at pretest and another four at posttest)—one for each performance dimension. Each deviation score reflects the difference between the mean observed dimension rating and the corresponding mean dimension target score. Finally, the differential accuracy analogue produces a total of 32 deviation scores (eight ratees X four dimensions). That is, 12 at pretest and 20 at posttest. Each deviation represents the difference between the mean observed rating and the corresponding target score for that particular ratee and dimension.
Descriptive statistics for pretest and posttest ratings for each of the raw mean deviation
scores are presented in Table 4.6 (pretest) and Table 4.7 (posttest). Check on Mean Differences for Pretest Alternative Cronbach Components
Given the problems with random assignment for the traditional Cronbach analyses, it was expected that there would be pretest differences on the components that form the basis for Cronbach's measures. Consequently, 4 (Training Condition) X 2 (Purpose) analyses of variance (ANOVAs) were conducted on each of the alternative pretest accuracy components. The ANOVA indicated that there are pretest differences among conditions on differential elevation accuracy. A nearly significant training by purpose interaction was found for the second component of pretest differential elevation, F (3, 138) = 2.563, p = .057 (see Figure 4.9). As the figure demonstrates, this interaction was driven by the difference in patterns between the AO and SOT-Control conditions on the one hand, and the FOR and RVT conditions on the other hand. In particular, the AO and SOT-Control conditions were both more accurate under the developmental conditions and less accurate under the administrative conditions, while FOR and

38
RVT were more accurate under the administrative conditions and less accurate under developmental conditions at pretest. A significant training by purpose interaction was also found for the third component of pretest differential elevation, F (3, 138) = 3.721, p < .05 (see Figure 4.10). The difference in means between the AO condition and all other conditions is responsible for this significant interaction. The AO administrative condition was the most accurate on the third component of pretest differential elevation, while the AO developmental condition was the least accurate on the third component of pretest differential elevation. The other conditions all demonstrated the opposite pattern, whereby they were more accurate on this component in the developmental conditions than in the administrative conditions. There was also a main effect of training for the first component of differential elevation, F (3, 138) = 2.901, p < .05, such that the SOT-Control condition was significantly more accurate than the FOR condition at pretest.
The ANOVA also indicates a nearly significant pretest difference between conditions on
the second component of pretest stereotype accuracy, F (3, 138) = 2.513, p = .061. An investigation of Figure 4.11 indicates that all conditions except SOT-Control were more accurate in the developmental context than in the administrative context.
There were no significant interactions for the pretest differential accuracy components,
however, there were main effects associated with training and purpose. The differential accuracy component for ratee one on dimension one (R1D1) had a nearly significant main effect of training, F (3, 138) = 2.446, p = .067, such that the RVT conditions were more accurate than the FOR conditions at pretest. The main effect of training for ratee one dimension two (R1D2) was also nearly significant, F (3, 138) = 2.599, p = .055, such that the FOR conditions were more accurate than the RVT conditions. There were also several main effects of purpose for differential accuracy. For ratee two on dimension two (R2D2), the administrative conditions had significantly better differential accuracy than the developmental conditions, F (1, 138) = 7.226, p < .01. Trainees in the developmental conditions had significantly better differential accuracy for ratee two dimension three (R2D3) than trainees in the administrative conditions, F (1, 138) = 4.842, p < .015. For ratee two dimension four (R2D4), trainees in the administrative purpose conditions were significantly more accurate than trainees in the developmental conditions, F (1, 138) = 5.428, p < .05. Likewise, trainees in the administrative conditions had significantly better differential accuracy for ratee three dimension one (R3D1) than trainees in the developmental conditions, F (1, 138) = 5.269, p < .05. On the other hand, trainees in the developmental conditions were nearly significantly more accurate for ratee three dimension two (R3D2) than trainees in the administrative conditions, F (1, 138) = 3.508, p = .063. Lastly, trainees in the developmental conditions had significantly better differential accuracy for ratee three dimension four (R3D4) than trainees in the administrative conditions, F (1, 138) = 5.928, p < .05.
It is important to bear in mind that a total of 20 separate analyses of variance were
conducted on the alternative pretest accuracy measures for the differential accuracy analogue. Whenever a series of statistical tests are employed in the same experiment, experimentwise error becomes an issue. Consequently, there was a heightened probability for Type I errors in the check for pretest differences on the alternative accuracy components.

39
These pretest differences on the alternative accuracy components indicate that random
assignment did not work as intended for the differential elevation, stereotype accuracy, and differential accuracy analogues. These pretest differences suggest that experimental groups may differ in meaningful ways that have not been measured (cf. Pedhazur & Schmelkin, 1991). This warrants caution about the interpretation of the results for the alternative analysis. Comparison of Pretest Differences on Alternative Cronbach Components with the Pretest Differences on Traditional Cronbach Components
The only analogue on which there were no pretest differences was the elevation analogue. The lack of significant differences between conditions on the elevation analogue is consistent with the check of pretest differences for the traditional Cronbach elevation component. In other words, no pretest differences were found between groups on the traditional elevation component nor on the alternative elevation component.
The 4(training condition) X 2 (purpose) ANOVAs on the alternative pretest accuracy
components for differential elevation indicated that there are differences among conditions. Specifically, there was a nearly significant training by purpose interaction on the second component of the pretest differential elevation analogue such that the AO and SOT-Control conditions were more accurate in the developmental context and less accurate in the administrative context, while FOR and RVT exhibited the opposite pattern. A significant interaction was also found for the third component such that the AO administrative condition was the most accurate and the AO developmental was the least accurate. The other conditions demonstrated the opposite pattern on this third component of differential elevation. There was also a main effect of training on the first component whereby the SOT-Control condition was significantly more accurate than the FOR condition at pretest. The difference in the patterns of accuracy between the second and third components suggests that aggregating components may obscure these patterns. The results of the analysis of variance for the traditional differential elevation component are compared to these alternative analyses to see how aggregation of the components affected the results. The ANOVA for the traditional differential elevation component indicated a significant training by purpose interaction. The interaction was largely driven by the difference between the two RVT conditions, and not the difference between the two AO conditions which was the case for the alternative analyses. This demonstrates that the aggregation and squaring of components in the Cronbach measures results in outcomes that are different from the results of the unaggregated and unsquared components.
The ANOVAs on the four pretest stereotype accuracy analogues indicated a nearly
significant training by purpose interaction on the second component. Figure 4.11 indicates that in all conditions except SOT-Control, the trainees were more accurate in the administrative condition than in the developmental conditions. The analysis of variance on the traditional pretest measure of stereotype accuracy also indicated a nearly significant training by purpose interaction. However, the pattern driving the interaction for the aggregated measure is quite different from the pattern driving the interaction on the second component of the stereotype accuracy analogue. The significant interaction for the stereotype accuracy analogue was driven by the difference between the SOT-Control condition and all other conditions, whereas the
40
significant interaction for the traditional stereotype accuracy component was largely driven by the difference between the RVT and FOR conditions. Once again, it appears that aggregation of the components resulted in a set of outcomes different from the analyses of the unaggregated components.
The ANOVAs on the pretest differential accuracy analogue reveal no significant training
by purpose interactions; however, there were several significant main effects of training and of purpose. Interestingly, the ANOVA on the traditional pretest differential accuracy measure indicated no significant differences between groups. This suggests that the main effects evidenced on the unaggregated components may have canceled each other out when aggregated in the traditional analyses. Elevation Analogue.
A value of 0 for the unsquared elevation component indicates that, for a given rater, the rater’s mean observed rating collapsed over ratees and dimensions is equal to the target mean rating collapsed over ratees and dimensions. Using the posttest elevation component as the dependent variable and the pretest elevation component as the covariate, a one-way analysis of covariance was conducted for the alternative analysis of elevation. Results reveal no significant differences among conditions. Procedure for Remaining Alternative Analyses.
Recall that there are three ratees and four performance dimensions at pretest, and five ratees and four performance dimensions at posttest. Consequently, there are a different number of components for pretest and posttest. Because each pretest component does not correspond to each posttest component (as it did with the elevation analogue), ANCOVAs would be cumbersome to control for pretest differences. Therefore, in order to control for pretest differences, the pretest components were summed for each analogue. That is, the three pretest differential elevation components were summed to create a new variable, the four pretest stereotype accuracy components were summed to create another new variable, and the 12 pretest differential accuracy components were summed to create a third new variable. Regression analyses were then performed with these new variables as serving predictors. For example, for differential elevation there are five posttest components corresponding to the five ratees at posttest. Five regression analyses were performed such that each posttest differential elevation component served as the dependent variable, and the summed pretest differential elevation component served as the predictor for each analysis. Every time a regression analysis was performed the unstandardized residual was saved. Consequently, there were as many residual variables as there were posttest components. Performing regression analyses for the five differential elevation components, the four stereotype accuracy components and the 20 differential accuracy components yielded a total of 29 corresponding residual variables. These new residual variables reflect posttest accuracy after pretest accuracy has been extracted. This process provided a way to control for pretest differences. These new residual variables were then used as the within-subjects factors in repeated measures analyses. Differential Elevation Analogue.

41
A score of 0 for the unsquared differential elevation components indicates, that for a given rater, the rater’s mean observed rating of a ratee is equal to the target mean rating of that ratee. In other words, the deviation between the two scores is zero. A one-way repeated measures ANOVA was conducted with the within-subjects factor being the five residualized posttest differential elevation components, and type of training and purpose being the between-subjects factors. The results indicated a significant three-way interaction such that the posttest components differed as a function of the interaction between training DQG SXUSRVH� :LONV¶ �
.842, F (12, 357) = 1.996, p = .024. The results also indicated that the magnitude of the FRPSRQHQWV GLIIHUHG DV D IXQFWLRQ RI WUDLQLQJ� :LONV¶ � ����� F (12, 357) = 1.873, p = .036. Figure 4.12 presents a graph of the interaction for the administrative purpose conditions and Figure 4.13 presents a graph of the interaction for the developmental purpose conditions.
Examination of Figure 4.12 indicates that the AO administrative condition had the best
differential elevation on four of the five components. The only component on which the AO condition was not accurate was the differential elevation component for ratee three. In fact, all training conditions, except RVT, had poor differential elevation accuracy for ratee three. This indicates that there is something about ratee three that inhibits rating accuracy. Recall that ratee three was the lecturer that performed below average on the organization dimension, and above average on the delivery and depth of knowledge dimensions. This suggests that it may be more difficult to achieve rating accuracy for ratees who are not consistently good or consistently poor across performance dimension. However, both ratee two and ratee four exhibited variable performances across dimensions as well. These instances of variable performance for ratees two and four did not appear to inhibit rating accuracy. This indicates that there is something in addition to the variable levels of performance that inhibited rating accuracy on ratee three. Recall that ratee three was considered by the expert judges to have demonstrated the most average performance, whereas the expert judges considered ratee two as below average and ratee four as above average. These assigned designations coincide with the mean ratings of the critical incidents obtained in the pilot study (see Appendix D). The below average performance contained two critical incidents that were poor and one critical incident that was good, and the above average performance contained two critical incidents that were good and one critical incident that was poor. In other words, both the above and below average performances were comprised of critical incidents that were readily distinguished as poor or good. On the other hand, the average performance was comprised of one below average critical incident and two above average critical incidents. This is to say that ratee three not only displayed variable levels of performance, but also demonstrated performances that could not be as easily identified as poor or good. It appears that these characteristics of ratee three contributed to its poor rating accuracy for all conditions except RVT administrative.
In terms of over and underestimation of the target scores for the administrative purpose
(Figure 4.12), trainees in FOR overestimated the performance of the poor performing ratee (R1) and the above average performing ratee (R4), but underestimated the performance of the below average ratee (R2), the average ratee (R3) and the good ratee (R5). Trainees in RVT overestimated the performance of the poor (R1) and below average (R2) ratees, and underestimated the performance of the average (R3), above average (R4), and good (R5) ratees. Trainees in the AO condition overestimated the performance for all ratees except the below

42
average ratee, and even then their rating was only slightly below the target score. Lastly, the trainees in the SOT-Control condition underestimated the performances of the poor (R1) and below average (R2) ratees while they overestimated the performances of the remaining ratees.
Figure 4.13 for the developmental purpose conditions once again illustrates that all
conditions had the poorest differential elevation accuracy for ratee three--reinforcing the notion that raters apparently have difficulty capturing accuracy for variable performances comprised of critical incidents not readily distinguished as poor or good. According to this figure, no one condition was consistently more accurate than others.
In reference to the over and underestimation of target scores for the developmental
purpose, Figure 4.13 illustrates that the RVT and AO conditions exhibited distinct patterns. The RVT trainees overestimated the target score for all ratees, while the AO condition underestimated the target score for all ratees. Similar to the AO condition, the FOR trainees underestimated the performances for all ratees except the last ratee. The SOT-Control condition overestimated the performances of the first three ratees, and underestimated the performances of the last two ratees.
Comparing and contrasting these patterns of over and underestimation for Figures 4.12
and 4.13 illustrates how the purpose manipulation affected rating accuracy for each training condition. Most notable is the effect of purpose on the AO condition. In the administrative purpose, the AO trainees tended to be more lenient in their ratings, whereas in the developmental purpose the AO trainees tended to be more severe in their evaluations. The RVT trainees exhibited the opposite effect, although not as extreme. The FOR administrative trainees were somewhat lenient in their evaluations of ratees one and four, and more severe in their ratings for ratees two, three, and five. In the developmental condition, the FOR trainees continued to underestimate the performances of ratees two and three, but also underestimated the performance of ratee one and four, and overestimated the performance of ratee five. Finally, between the administrative and developmental conditions the ratings for the SOT-Control condition switched (e.g., from overestimating to underestimating, or vice versa) for all ratees except the third ratee whose performance was overestimated in both purpose conditions. Comparing these two figures, the AO administrative condition tended to demonstrate the best differential elevation accuracy, but only when the evaluation for ratee three was disregarded. The FOR administrative trainees also demonstrated reasonably good accuracy for ratees one, two, four and five. The RVT administrative trainees were the only raters to approximate accuracy for ratee three. The most dramatic trend across these two figures is the difference between the ratings for the two AO conditions. In the administrative context, AO trainees were lenient whereas in the developmental context AO trainees were more severe in their ratings. The SOT-Control condition was also reasonably influenced by the purpose manipulation as evidenced by the reversal of rating trends across the two purpose conditions. Stereotype Accuracy Analogue.
A score of 0 for the unsquared stereotype accuracy components indicates, that for a given rater, the rater’s mean observed rating of a given dimension is equal to the target mean rating of that dimension. A one-way repeated measures ANOVA was conducted with the within-subjects
43
factor being the four residualized posttest stereotype accuracy components, and type of training and purpose being the between-subjects factors. The results indicated a significant three-way interaction such that the posttest stereotype accuracy components differed as a function of the LQWHUDFWLRQ EHWZHHQ WUDLQLQJ DQG SXUSRVH� :LONV¶ � ����� F (9, 331) = 1.968, p = .042. Figure 4.14 presents a graph of the interaction for the administrative purpose conditions and Figure 4.15 presents a graph of the interaction for the developmental purpose conditions.
Examination of Figure 4.14 indicates that the RVT administrative condition tended to
stay closer to the zero accuracy point than the other conditions. The AO administrative and the SOT-Control administrative conditions tended to deviate more from zero than the RVT administrative and FOR administrative conditions. Overall, accuracy was best for dimensions two and three and poorest for dimensions one and four.
In regards to over and estimation of the target scores, the FOR and AO trainees exhibited
distinct patterns whereby the FOR trainees underestimated performance on all dimensions and the AO trainees overestimated performance on all dimensions. Similar to the AO trainees, the SOT-Control trainees overestimated performance on all dimensions except the organization dimension (D1). Finally, the RVT condition underestimated performance on organization (D1) and on the overall performance dimension (D4), and they overestimated performance on the delivery (D2) and depth of knowledge (D3) dimensions.
Figure 4.15 for the developmental purpose conditions indicates that the SOT-Control
condition had the best stereotype accuracy for dimensions two, three, and four. The RVT developmental and the AO developmental had the poorest stereotype accuracy overall. No particular dimension was consistently rated more accurate or inaccurate than the other dimensions.
Examining the patterns of over and underestimation, each training condition exhibited
clear patterns. The RVT and the SOT-Control conditions overestimated the target scores on all dimensions, whereas the FOR and AO conditions underestimated the target scores on all dimensions.
To determine how the purpose factor interacts with training, it is necessary to compare
Figures 4.14 and 4.15. As with the differential elevation analogue, the purpose factor appears to have had the most profound affect on the AO condition. Once again, the AO condition is more lenient on all dimension components in the administrative condition, and more severe on all dimension components in the developmental condition. The RVT condition demonstrated this same pattern, although not as extreme as the AO condition. On the other hand, the purpose manipulation apparently did not have much of an affect on the FOR condition. FOR trainees in both purpose conditions underestimated the target score on each performance dimension. Lastly, the SOT-Control condition went from assigning a rather harsh rating for dimension one in the administrative condition to assigning a rather lenient rating for the same dimension in the developmental condition. On the other hand, the SOT-Control condition assigned harsher ratings for dimensions two, three and four in the developmental condition than in the administrative condition. A comparison of the two figures indicates that the RVT
44
administrative and SOT-Control developmental conditions tended to be the most accurate on the stereotype accuracy components. The FOR developmental trainees were only more accurate than the RVT administrative and SOT-Control developmental trainees on the first component dimension of stereotype accuracy. Differential Accuracy Analogue.
A score of 0 for the unsquared differential accuracy components indicates, that for a given rater, the rater’s mean observed rating of a given ratee and dimension is equal to the target mean rating of that ratee and dimension. A one-way repeated measures ANOVA was conducted with the within-subjects factor being the 20 residualized posttest differential accuracy components, and type of training and purpose as the between-subjects factors. The results indicated a significant three-way interaction such that the posttest differential accuracy components differed as a function of thH LQWHUDFWLRQ EHWZHHQ WUDLQLQJ DQG SXUSRVH� :LONV¶ �
.518, F (57, 359) = 1.551, p = .01. The results also indicated that the magnitude of the GLIIHUHQWLDO DFFXUDF\ FRPSRQHQWV GLIIHUHG DV D IXQFWLRQ RI WUDLQLQJ� :LONV¶ � ����� F (57, 359) = 1.489, p = .017. Figure 4.16 presents a graph of the interaction for the administrative purpose conditions and Figure 4.17 presents a graph of the interaction for the developmental purpose conditions.
As seen in Figure 4.16, ratings tended to be least accurate for the performances of ratee
three. This pattern is consistent with the above findings for the differential elevation analogue which indicated that raters were least accurate in their evaluations of ratee three. Of the four conditions, the RVT administrative condition was the closest to the zero accuracy line for this particular ratee on these dimensions. Looking at the patterns of over and underestimation for the administrative purpose conditions, the FOR trainees tended to overestimate the performance for ratee one on all dimensions, as well as overestimate the performance of ratee four on all dimensions. On the other hand, FOR trainees underestimated the performances of ratees two, three, and five on all dimensions. RVT trainees tended to overestimate the performances of the first two ratees on all dimensions, and underestimate the performances of ratees three, four and five on all dimensions. For the most part, the trainees in the AO administrative condition appear to be rather lenient in their ratings. They overestimated the target score on all components except R2D3, R2D4, and R4D2. Finally, the SOT-Control condition underestimated the target score for the first two ratees on all dimensions, and overestimated the target scores for the remaining ratees on all dimensions.
Examination of Figure 4.17 for the developmental purpose conditions once again
indicates that ratings were least accurate for the ratee three; however, this time RVT-trained subjects in the developmental condition were not as accurate at evaluating ratee 3 as RVT-trained subjects in the administrative condition. With respect to the over and underestimation of the target scores for the developmental conditions, the FOR trainees underestimated the performances of the first four ratees on all dimensions (with the exception of R4D2), and slightly overestimated the performance of ratee five on all dimensions. The RVT trainees appeared to be relatively lenient in their ratings. They overestimated the target score on all components except R1D2, R1D3 and R1D4. The AO trainees, on the other hand, appeared to be harsher in their ratings. They underestimated the target scores for every component except

45
R1D3. Lastly, the SOT-Control condition consistently overrated the performances of the first three ratees on all dimensions. Their scores on the remaining components were more negative, but closer to the zero accuracy point.
Comparing and contrasting these patterns of over and underestimation for Figures 4.16
and 17 illustrates how the purpose manipulation affected rating accuracy for each condition. A comparison of the two figures once again illustrates that the AO condition tended to overestimate the target ratings in the administrative purpose condition, and underestimate the target ratings in the developmental purpose condition. The other conditions did not display such consistent patterns of over and underestimation. From these figures, it appears that the AO administrative condition is a bit more accurate than the other conditions, but only when the ratings for the third ratee are disregarded. In other words, the AO administrative trainees tended to consistently demonstrate good accuracy for all ratees except ratee three. The RVT administrative condition was the condition that most closely approximated accuracy for the performances of ratee three. When the ratings for ratee three are taken into consideration, the RVT administrative and SOT-Control developmental trainees tended to be the most accurate on the differential accuracy analogue. Summarization of Alternative Analyses and Comparison with Analyses for traditional Cronbach Measures.
Elevation Analogue. The ANCOVA for the alternative analysis of elevation indicated that there were no significant differences between conditions on the elevation component. This finding is inconsistent with the fourth hypothesis that deviation scores for the elevation component would be closer to zero for the FOR and RVT conditions than for the AO and SOT-Control conditions. The lack of significant results for the elevation component is also inconsistent with the fifth hypothesis that trainees’ deviation scores in the developmental conditions would be closer to zero than trainees’ deviation scores in the administrative purpose conditions. Lastly, it was predicted that trainees in the RVT administrative condition would have the best accuracy on the elevation analogue relative to all other conditions. This hypothesis was not supported.
Consistent with the Cronbach analyses, the results of the alternative analysis did not
support the hypotheses for the elevation analogue. Similarly, the repeated measures analysis and the ANCOVA conducted on the traditional Cronbach elevation score both revealed no significant differences between conditions.
Differential Elevation Analogue. The repeated measures analysis for the differential
elevation analogue indicated that training and posttest components had a significant interaction, however, this two-way interaction was qualified by a three-way training by purpose by component interaction. This three-way interaction indicated that the posttest components differed as a function of the interaction between training and purpose. The plots of the deviation scores suggest that the AO administrative condition was most accurate on the differential elevation components for ratees one, two, four and five, and that the FOR administrative trainees were also reasonably accurate on these same components. These trends are not consistent with the sixth hypothesis. According to the sixth hypothesis the RVT administrative condition

46
should have demonstrated the best accuracy across the differential elevation components. There was minimal support for this hypothesis; the RVT administrative trainees provided the most accurate rating for ratee three.
The results of the alternative analysis for differential elevation do not correspond to the
results of the analyses conducted on the traditional Cronbach differential elevation component. Surprisingly, the repeated measures analysis for the traditional differential elevation component indicated an interaction between training and purpose such that the AO condition had better differential elevation in the developmental condition and poorer differential elevation accuracy in the administrative condition. Furthermore, the repeated measures analysis for the traditional component indicated that the RVT administrative condition, not the AO administrative condition, was most accurate on differential elevation (recall that the ANCOVA was not conducted on the traditional measure of differential elevation due to violation of the homogeneity of slopes assumption).
Stereotype Accuracy Analogue. Results of the alternative stereotype accuracy repeated
measures analysis indicated a significant three-way interaction such that the posttest stereotype accuracy components differed as a function of the interaction between training and purpose. The plot of the mean raw deviation scores suggests that trainees in the RVT administrative condition and SOT-Control developmental condition tended to be most accurate on the majority of stereotype accuracy components. These trends are not consistent with the sixth hypothesis which predicted the best stereotype accuracy for the FOR developmental condition. In partial support of this hypothesis, the FOR developmental trainees did demonstrate the best stereotype accuracy on the first performance dimension.
In relation to the traditional Cronbach analyses, the repeated measures analysis for
traditional stereotype accuracy indicated a significant within-subjects time by training interaction such that trainees in the SOT-Control condition had higher stereotype accuracy at pretest than at posttest while trainees in the RVT condition exhibited the opposite pattern. On the other hand, the ANCOVA for traditional stereotype accuracy only revealed a main effect of training such that trainees in the AO condition had better stereotype accuracy than trainees in the FOR and SOT-Control conditions.
Differential Accuracy Analogue. The results of the repeated measures analysis for the
alternative differential accuracy analogue indicated a significant three-way interaction such that the differential accuracy components differed as a function of the interaction between training and purpose. There was also a significant interaction between differential accuracy components and training. From a comparison of Figures 4.16 and 4.17, it appears that the AO administrative trainees were slightly more accurate than other conditions, but only when ratee three was disregarded. The RVT administrative condition was the group that most closely approximated accuracy for the performances of ratee three. When the performance ratings for ratee three are taken into consideration it appears that the RVT administrative and SOT-Control developmental had better differential accuracy overall.

47
The repeated measures analysis for the traditional Cronbach components indicated a time by training by purpose three-way interaction that approached significance. The plot of cell means suggests that RVT and AO trainees in the administrative purpose condition improved on differential accuracy at posttest while FOR and SOT-Control administrative trainees decreased in differential accuracy at posttest. This trend seems to be consistent with the results of the alternative analyses. For the developmental conditions, the plot of cell means for the traditional Cronbach differential accuracy component suggests that FOR trained subjects improved on differential accuracy at posttest while RVT and SOT-Control conditions decreased in differential accuracy at posttest. This finding is not consistent with the results of the alternative analysis for differential accuracy. In regards to the ANCOVA for the traditional differential accuracy component, it was found that for those trainees inaccurate at pretest, differential accuracy improved at posttest for all training conditions except AO. It is difficult to determine from the plot of the mean raw deviation scores, if this last finding is consistent with the alternative analysis.

48
Chapter 5. Discussion This study was designed to improve understanding of rater training studies in general,
and rater variability training in particular. To accomplish this objective, the present study investigated which of four training programs produced the greatest improvements in rating accuracy, the role of purpose in rating accuracy, alternative operationalizations of accuracy, finer-grained distinctions in rating stimuli, and the role of quantitative accuracy feedback in improving rating accuracy.
Six hypotheses were investigated. The first three hypotheses were phrased in terms of
the traditional Cronbach accuracy measures, and the last three hypotheses made the same predictions using the language of the alternative operationalization of accuracy. As such, there were three effects under investigation.
The first of those effects involved the investigation of whether FOR and RVT would
have better accuracy than AO and SOT-Control. First of all, no support was found for the prediction that FOR and RVT would have better accuracy than AO and SOT-Control for both operationalizations of elevation accuracy. Secondly, the investigation using the traditional operationalization of differential elevation indicated that RVT and FOR benefited the most from training and SOT-Control benefited the least from training. This finding supports the first and fourth hypotheses that FOR and RVT would demonstrate better accuracy than the control. On the other hand, the alternative operationalization of differential elevation suggests that when collapsed over purpose, the AO condition tended to demonstrate better accuracy on four of the five differential elevation components. So, the finding for the alternative operationalization of differential elevation is not consistent with the hypotheses or with the findings for the traditional analyses. Next, for stereotype accuracy, results utilizing the traditional operationalization indicate that the RVT condition improved on stereotype accuracy relative to the SOT-Control condition, although the AO condition had the best stereotype accuracy relative to all conditions and was significantly better than FOR and SOT-Control. This finding demonstrates mixed support for the first and fourth hypotheses. Results of the alternative operationalization of stereotype accuracy did not indicate a significant interaction between accuracy components and training; this lack of an effect, however, was qualified by a three-way interaction discussed below. Lastly, the analyses for the traditional differential accuracy component revealed that when trainees were inaccurate at pretest differential accuracy improved at posttest for all conditions except AO. Once again, this demonstrates mixed support for the first and fourth hypotheses because the SOT-Control trainees were not predicted to improve on differential accuracy. Interestingly, with the exception of the ratings for ratee 3, the results of the alternative analysis indicate that the AO condition was relatively accurate on differential accuracy.
Overall, these findings provide limited support for the prediction that FOR and RVT
would demonstrate better accuracy than AO and SOT-Control. What little support there was for this prediction came from the results of the traditional analyses which indicated that: (1) FOR and RVT improved the most on differential elevation, (2) RVT improved on stereotype accuracy relative to SOT-Control, and (3) FOR and RVT trainees inaccurate at pretest improved

49
on differential accuracy relative to AO. In contrast, the results for the alternative analyses tended to indicate that the AO condition benefited the most from training.
In terms of the second effect under investigation, hypotheses two and five predicted that
there would be a main effect of purpose such that trainees in the developmental conditions would be more accurate than trainees in the administrative conditions. Neither the traditional analyses nor the alternative analyses indicated a main effect of purpose. This lack of a significant main effect of purpose, however, was qualified by significant training by purpose interactions.
The last of the predictions (hypotheses three and six) posited a training by purpose
interaction such that the FOR developmental trainees would be most accurate on the traditional and alternative stereotype accuracy measure, and the RVT administrative trainees would be most accurate on the traditional and alternative elevation and differential elevation measures. For elevation, neither the traditional nor the alternative analyses indicated any support for the hypothesis that RVT administrative trainees would be most accurate on this component.
For differential elevation, the results of the traditional operationalization indicated that
the differences in patterns between the RVT and AO resulted in a significant interaction. The RVT administrative condition was most accurate on differential elevation while the RVT developmental condition was least accurate on differential elevation, and the AO conditions demonstrated the opposite pattern. As such, when collapsed over the time factor, it became apparent that RVT administrative trainees were most accurate on differential elevation. This provides some support for the third hypothesis. Conversely, from the results of the alternative analysis it appears that the AO administrative condition, as opposed to the RVT administrative condition, demonstrated stronger accuracy on four of the five differential elevation components. This is inconsistent with the stated hypothesis. However, it was found that the RVT administrative condition was the only condition to provide a reasonably accurate rating for ratee three. This suggests that RVT-trained raters conducting performance appraisals for administrative purposes may be better able to accurately evaluate average performing ratees. In other words, RVT administrative trainees had the best differential elevation accuracy for the most average performance. This finding would not have been revealed if not for the alternative analyses.
For stereotype accuracy, the results using the traditional operationalization revealed no
significant interaction between training and purpose, and thus no support for the prediction that FOR developmental trainees would demonstrate strong stereotype accuracy. On the contrary, the results for the alternative operationalization of stereotype accuracy revealed that the magnitude of the dimension components differed as a function of the interaction between training and purpose, although not in the hypothesized direction. Instead, the FOR developmental condition demonstrated the best accuracy on only the first dimension, and this was the only dimension on which purpose appeared to have much of an effect for FOR. As a whole, the RVT administrative and SOT-Control developmental demonstrated the best accuracy on the stereotype accuracy analogue relative to the other conditions.

50
No differential effects were expected between FOR and RVT conditions on differential accuracy because both were expected to improve differential accuracy, albeit in different ways. Interestingly, results of the traditional analyses revealed a nearly significant time by training by purpose three-way interaction. It appears that for the administrative purpose condition, the RVT trainees benefited the most from training, and for the developmental purpose condition, the FOR trainees benefited the most from training. The results of the alternative analysis also indicated a significant three-way interaction for the differential accuracy analogue such that the magnitude of the differential accuracy components differed as a function of the interaction between training and purpose. In this case, however, it appears that the AO administrative condition tended to be a bit more accurate, but only when the evaluations for ratee three are disregarded. The RVT administrative condition was the only condition that approximated accuracy for the performances of ratee three. This reinforces the above stated notion that RVT-trained raters in an administrative context are better evaluators of average performing ratees. When the ratings for the third ratee are taken into consideration, both the RVT administrative and SOT-Control developmental trainees demonstrate reasonably good accuracy on the differential accuracy analogue.
In summary, limited support was found for the predicted interactions between training
and purpose. First of all, there was no support for the prediction that RVT administrative trainees would demonstrate the best elevation accuracy. As for differential elevation, results of the traditional analyses were consistent with the hypothesis such that RVT administrative trainees demonstrated the strongest differential elevation accuracy. However, results of the alternative analysis reveal that the RVT administrative trainees were only most accurate on the third component of differential elevation, and that the AO administrative trainees tended to be more accurate on the remaining components. Results of the traditional analyses for stereotype accuracy indicate no support for the hypothesis that FOR developmental trainees would be strongest on this component, and the alternative analyses indicate that FOR developmental trainees were only most accurate on the first performance dimension component.
As the above discussion illustrates, in some instances results of the alternative analysis
coincided with the results of the traditional analyses; however, in many cases there were considerable discrepancies between the two operationalizations of accuracy. Overall, the alternative analyses tended to be more indicative of accuracy in the AO condition than did the results of the traditional analyses. The difference in outcomes between the two sets of analyses indicates that the process of squaring and aggregating components can indeed obscure underlying patterns of accuracy, as Edwards has long indicated (1991, 1993, 1994, 1995). An example of how information can be obscured in the Cronbach components was demonstrated by the results of the alternative analyses for ratee three. Only when the components were left unaggregated did it become apparent that the RVT administrative condition was the only condition that provided accurate ratings for this ratee. If not for the alternative analyses, this effect would have gone undetected. Also, by examining the individual components it becomes apparent when aggregation across components is okay, and when it is problematic. For example, in Figure 4.15 the RVT condition consistently overestimated the target score on each of the four dimension components. In this case, aggregating across components would not result in loss of much information. However, in Figure 4.12 the RVT condition overestimated the

51
target score for the first two ratee components and underestimated the target score for the last three ratee components. Squaring and aggregating across components in this case would be problematic because the underlying patterns of over and underestimation would be obscured.
In summary, the Cronbach analyses are attractive because they distil all the ratings
provided by subjects into four easily manageable scores, and the associated analyses are straightforward. Unfortunately, the squaring and aggregation that is necessary to arrive at these four components obscures the underlying patterns of accuracy. Aggregating components is particularly problematic when the scores on the individual components are variable. That is, when the raters do not consistently under or overestimate the ratees and performance dimensions. Incorporating Finer-Grained Distinctions in the Rating Stimuli
This study also aimed to improve understanding of rater training programs by incorporating finer-grained distinctions in the rating stimuli. Fine-grained distinctions in rating stimuli is an issue that has been neglected in most rater training studies. Previous studies have simply asked raters to make distinctions between an effective or ineffective performance (e.g., Murphy et al., 1982) or between a poor, average, and good performance (e.g., Hauenstein et al., 1999). This is a rather simple task, and one that is rather unrepresentative of performance appraisals in the workplace. Outside of the laboratory, performance evaluators are seldom afforded the luxury of having to evaluate readily distinguishable performances. Instead, they are more often required to evaluate individuals who are similar in their levels of performance. Consequently, previous rater training studies have not provided a very sensitive test of rater training programs.
Results of the present study reveal that, as a whole, trainees’ ratings were most accurate
for the poor and good ratees, while their ratings were least accurate for the below average, average, and above average ratees. The only exception to this overall pattern is the RVT administrative condition. The RVT administrative condition was the only condition that provided comparatively accurate ratings for ratee three. Recall, that ratee three displayed a variable performance comprised of critical incidents that were rated in the pilot study as above and below average, making this the most “average” performance out of the five. All other conditions demonstrated the greatest inaccuracy when evaluating this ratee. Since the focus of the RVT program is on making distinction between ratees, the RVT-trained raters are more attuned to drawing finer-grained distinctions between performances. Furthermore, the RVT program is designed so that it most closely compliments the performance appraisal that is used for making administrative decisions. In order to make these administrative decisions the rater must be able to accurately rank-order the performances from best to worst. The task of identifying the best performance and the worst performance is relatively simple. However, the more fine-grained distinctions there are between performances, the more difficult it becomes to rank order the performances. This is when the benefits of rater variability training should emerge. On the other hand, the content of the FOR training program does not prepare the raters to draw these fine-grained distinctions between ratees because FOR training focuses on differentiating performance dimensions. Furthermore, FOR training only establishes within the

52
rater’s frame-of-reference, prototype examples of easily distinguishable performances. These reasons may explain why the RVT administrative condition had the best accuracy for ratee three. The Role of Quantitative Accuracy Feedback in Rater Training Programs
A final goal of this study was to separate the training lecture component from the practice and feedback components in order to determine if rating accuracy improved simply as a function of receiving quantitative accuracy feedback. In other words, the intent was to investigate if the empirical base for these training programs (i.e., the training lecture) is irrelevant. This was investigated by including a fourth training condition that only received quantitative accuracy feedback. In this way, the AO condition did not have the benefit of receiving a training lecture on how to improve the accuracy of their ratings.
There is some evidence to indicate that rating accuracy improved simply as a function of
receiving quantitative accuracy feedback. For the traditional analyses, it was found that when raters were inaccurate at pretest, differential elevation improved for the AO condition. The AO conditions also demonstrated the best stereotype accuracy relative to all other conditions. The results of the alternative analyses also reveal support for the notion that quantitative accuracy feedback, and not the training lecture, is responsible for improving rating accuracy. For the alternative analyses it was found that the AO administrative condition demonstrated strong accuracy on the differential elevation components for the first, second, fourth, and fifth ratees. Also, results of the alternative analyses indicate that the AO administrative condition demonstrated strong accuracy on the differential accuracy components (with the exception of the dimension scores for ratee three). The results of the alternative analysis did not indicate strong stereotype accuracy for the AO condition. This is interesting because the results from the traditional stereotype component indicated that the AO condition had the strongest stereotype accuracy of all conditions.
These findings provide some indication that quantitative accuracy feedback may be
sufficient for improving some types of rating accuracy. Obviously, more studies are needed to further evaluate whether quantitative accuracy feedback is enough to improve rating accuracy. If, however, accuracy feedback is indeed sufficient for improving rating accuracy, as these preliminary analyses suggest, then this has far-reaching implications for rater training research, and the organizations that utilize rater training programs. If accuracy feedback is all that is necessary for improving rating accuracy, then this reduces the time and the costs involved in rater training. Future studies should also investigate whether practice alone is sufficient for improving rating accuracy. The present study isolated the accuracy feedback component from the training lecture, but the practice component was not isolated from the feedback component. It may be that rating accuracy improves simply as a function of practice, and not as a function of practice with quantitative accuracy feedback. The results of the present study reveal that the SOT-Control condition demonstrated reasonably good accuracy, and in a couple of instances the SOT-Control condition was more accurate than the other training conditions. One explanation for this lack of differentiation between the control condition and the training conditions is that the control condition improved rating accuracy as a result of practice on the pretest. Limitations

53
There are, of course, several possible explanations for why limited and mixed support was found for the hypotheses. First and foremost, is the issue of random assignment. The analyses of variance on the pretest measures revealed that random assignment did not work as intended. This was evidenced by the significant differences between conditions on the pretest measures for both the traditional and the alternative operationalizations of accuracy. These significant differences between the groups at pretest may have been large enough to mask the effects of the independent variables, and thereby render the manipulations useless. Since random assignment of subjects to conditions did not work, this made interpretation of the results more difficult. Furthermore, the pretest differences among conditions suggest that the experimental groups differed in meaningful ways that were not measured (cf. Pedhazur & Pedhazur Schmelkin, 1991). This warrants caution about the interpretation of the results in this study.
As just explained, the differences between conditions at pretest is the primary culprit in
terms of finding lack of support for the hypotheses. However, other factors likely contributed to the limited support. Recall that all analyses using elevation accuracy, for both the traditional analyses and the alternative analyses, produced no significant differences between conditions. This may not be so much a problem with the study, as it is a problem with the measure. Elevation is the most aggregated and least specific of the Cronbach components, and therefore the least sensitive to training. Because elevation is the least sensitive to training it is less likely to detect significant differences between conditions. This is one possible explanation for why no significant differences were found between conditions on Cronbach’s elevation component and on the alternative elevation analogue.
Another factor that contributed to the lack of support for the hypotheses is that the SOT-
Control condition demonstrated reasonable accuracy, which made it difficult for the remaining training conditions to significantly exceed the accuracy level of the SOT-Control condition. The finding that the SOT-Control condition performed reasonably well brings into question the role of practice mentioned earlier. It may be that the practice the trainees received during the pretest sufficiently improved their rating accuracy. Hauenstein (1998) explained that a series of practice ratings allows trainees to calibrate their performance standards to the rating scales. In addition to receiving practice in the SOT-Control condition, the raters also had the opportunity to see their fellow trainees’ ratings on the pretest, and to discuss how their own ratings related to their fellow trainees’ ratings. In other words, even though the SOT-Control condition did not receive quantitative accuracy feedback about the target scores, they did receive normative feedback from their fellow trainees. This normative feedback may have allowed the idiosyncratic raters to bring their ratings in-line with the majority view. In other words, the ratings of the fellow trainees’ acted as an external standard against which each individual rater was able to check his/her internal calibration. Hauenstein (1998) noted that this active participation in the rating process is an important factor in improving rating accuracy. This may explain why the SOT-Control group was relatively accurate. Because the control group was relatively accurate, this made it difficult to differentiate the other training programs from the control.

54
Virtually no support was found for the main effect of purpose. According to the hypothesis, trainees in the developmental condition should have been more accurate than trainees in the administrative condition. Despite the lack of support for this main effect, the purpose factor did demonstrate significant interactions with type of training. It is believed that stronger purpose effects (both main effects and interactions) would have emerged if the performances would have been more realistic. Through the course of the study, it became apparent that some of the raters believed that the actors in the videos were real TAs, while others were more skeptical. For example, some raters made comments on their evaluation forms such as, “I hope I never get stuck with this TA,” while other raters made comments such as, “I think this person is a fake.” The actors appearing in the videotapes were not professional actors; they were college students majoring in theatre. Consequently, it may very well have been that the performances were less than realistic. This lack of believability most likely attenuated the results of the purpose manipulation.
Confusion over the appropriate classification of critical incidents into performance
dimensions is another factor that may have contributed to the lack of empirical support for the hypotheses. Although great care was taken to ensure that the critical incidents clearly represented independent performance dimensions, trainees may have coded particular critical incidents as belonging to more than one performance dimension, or to unintended performance dimensions. For example, results of the pilot study indicated that the critical incident “refers to textbook,” represented the depth of knowledge performance dimension. However, during the discussion and feedback portion of the training session, several trainees explained that they perceived “refers to textbook” as a behavior representing the organization performance dimension. That is, the trainees explained that if the lecturer would have been organized, then he would not have had to refer to the textbook. In the development of the target scores, one of the expert judges made this same comment. This confound may account for some discrepancies between target scores and observed scores on the dimension ratings.
Another possible explanation for the lack of empirical distinctions is that it was more
difficult to achieve accuracy at posttest than at pretest. This is because the raters were forced to make finer-grained distinctions at posttest. At pretest, the raters simply had to evaluate a poor, average, and good performance. This may have been a relatively simple task, and therefore the trainees pretest scores were relatively accurate to begin with. Not only were the trainees asked to engage in a more difficult rating task at posttest, but they were also asked to evaluate more ratees at posttest. Because the trainees were evaluating more ratees, and also being asked to make finer-grained distinctions between performances this means that there were more chances to be inaccurate at posttest than there were to be inaccurate at pretest.
Another issue is that the sample size was rather small; each condition was comprised of
15-23 trainees. With larger sample sizes there would have been more power to detect differences between conditions.
In conclusion, there was limited support for the predictions. Several potential
explanations were provided for the limited support. Foremost among these was the finding that random assignment did not adequately control for pretest differences. Despite such limitations

55
and despite the limitations of laboratory-based performance appraisal research, results supported the prediction that finer-grained distinctions in the rating stimuli would result in the best differential elevation accuracy for RVT trainees. There was also evidence to suggest that RVT may be the most effective training program for increasing the accuracy of ratings for average performing ratees when the purpose of the appraisal is an administrative one. By that same token, the evidence suggests that FOR training may not be an effective means for improving rating accuracy when raters are required to make ratings for ratees who are not clearly poor or good in their performance. If not for the alternative analyses using the unaggregated accuracy components, then these effects would have gone undetected. There was also evidence to suggest that quantitative accuracy feedback, without the benefit of a training lecture, may result may improve certain types pf rating accuracy. Future studies should investigate this further, as well as the role of practice and normative feedback in rating accuracy. If rating accuracy is improved by these means alone, then this would be welcome news for organizations because rater training would become less expensive and less time consuming.

56
References
Aleamoni, L.M., & Hexner, P.Z. (1980). A review of the research on student evaluation and a report on the effect of different sets of instructions on student course and instructor evaluation. Instructional Science, 9, 67-84.
Athey, T.R., & McIntyre, R.M. (1987). Effect of rater training on rater accuracy: Levels of processing theory and social facilitation theory perspectives. Journal of Applied Psychology, 72, 567-572.
Bernardin, H.J., & Alvares, K.M. (1975). The effects of organizational level on perceptions of role conflict resolution strategy. Organizational Behavior and Human Performance, 14, 1-9.
Bernardin, H.J., & Buckley, M.R. (1981). Strategies in rater training. Academy of Management Review, 6, 205-212.
Bernardin, H.J., & Cooke, D.K. (1992). Effects of purpose of appraisal on discriminability and accuracy of ratings. Psychological Reports, 70, 1211-1215.
Bernardin, H.J., & Orban, J.A. (1990). Leniency effect as a function of rating format, purpose for appraisal, and rater individual differences. Journal of Business and Psychology, 5, 197-211.
Bernardin, H.J., & Pence, E.C. (1980). Effects of rater training: Creating new response set and decreasing accuracy, Journal of Applied Psychology, 65, 60-66.
Borman, W.C. (1977). Consistency of rating accuracy and rating errors in the judgment of human performance. Organizational Behavior and Human Performance, 20, 238-252.
Borman, W.C. (1979). Format and training effects on rating accuracy and rater errors. Journal of Applied Psychology, 64, 410-421.
Bost, K.A. (1994). The influence of rewards and training on performance appraisal ratings. Unpublished manuscript.
Burt, C.L. (1937). Correlations between persons. British Journal of Psychology, 28, 59-96.
Cascio, W.F. (1998). Applied Psychology in Human Resource Management. Upper Saddle River, NJ: Prentice-Hall.
Christal, R.E. (1968). JAN: A technique for analyzing group judgment. Journal of Experimental Education, 36, 24-27.
Cleveland, J.N., & Murphy, K.R. (1992). Analyzing performance appraisal as goal-directed behavior. In G. Ferris & K. Rowland (Eds.), Research in personnel and human resources management (Vol. 10, pp. 121-185).
Cleveland, J.N., Murphy, K.R., & Williams, R.E. (1989). Multiple uses of performance appraisal: Prevalence and correlates. Journal of Applied Psychology, 74, 130-135.
Cook, T.D., & Campbell, D.T. (1979). Quasi-Experimentation: Design & Analysis Issues for Field Settings. Chicago: Rand McNally College Publishing Company.
Cooper, W.H., & Richardson, A.J. (1986). Unfair comparisons, Journal of Applied Psychology, 71, 179-184.
Cronbach, L.J., & Gleser, G.C. (1953). Assessing the similarity between profiles. Psychological Bulletin, 52, 177-193.
Cronbach, L.J. (1955). Processes affecting scores on “understanding of others” and “assumed similarity.” Psychology Bulletin, 52, 177-193.

57
Cronbach, L.J. (1958). Proposals leading to analytic treatment of social perception scores. In R. Tagiuri & L. Petrullo (Eds.), Person perception and interpersonal behavior (pp. 353-379). Standford, CA: Stanford University Press.
Cronbach, L.J. (1992) Four Psychological Bulletin articles in perspective. Psychological Bulletin, 112, 389-392.
Cummings, L.L. (1973). A field experimental study of the effects of two performance appraisal systems. Personnel Psychology, 26, 489-502.
Day, D.V., & Sulsky, L.M. (1995). Effects of frame-of-reference training and information configuration on memory organization and rating accuracy. Journal of Applied Psychology, 80(1), 158-167.
DeNisi, A.S., Cafferty, T.P., & Meglino, B.M. (1984). A cognitive view of the performance appraisal process: A model and research propositions. Organizational Behavior and Human Performance, 33, 360-396.
Edwards, J.R. (1991). Person-job fit: A conceptual integration, literature review, and methodological critique. In C.L. Cooper & I.T. Robertson (Eds.), International review of industrial and organizational psychology (Vol. 6 pp. 283-357). New York: Wiley.
Edwards, J.R. (1993). Problems with the use of profile similarity indices in the study of congruence in organizational research. Personnel Psychology, 46, 641-665.
Edwards, J.R. (1994). The study of congruence in organizational behavior research: Critique and a proposed alternative. Organizational Behavior and Human Decision Processes, 58, 51-100; erratum, 58, 323-325.
Edwards, J.R. (1995). Alternatives to difference scores as dependent variables in the study of congruence in organizational research. Organizational Behavior and Human Decision Processes, 64, 307-324.
Feldman. J.M. (1986). Instrumentation and training for performance appraisal: A perceptual-cognitive viewpoint.” In K. Rowland and G. Ferris (Eds.), Research in Personnel and Human Resources Management, Vol.5 Greenwich, CT: JAI press, 1986.
Fredholm, R.L. (1998). Effects of dual accountability and purpose of appraisal on accuracy. Unpublished manuscript, Virginia Polytechnic Institute and State University, Blacksburg, Virginia.
Gorman, C.D.; Clover, W.H., & Doherty, M.E. (1978). Can we learn anything about interviewing real people from “interviews” of paper people? Two studies of the external validity of a paradigm. Organizational Behavior and Human Performance, 22, 165-192.
Hammer, T.H., & Dachler, H.P. (1975). A test of some assumptions underlying the path goal model of supervision: Some suggested conceptual modifications. Organizational Behavior and Human Performance, 14, 60-75.
Harris, M.M, Smith, D.E., & Champagne, C. (1995). A field study of performance appraisal and purpose: Research- versus administrative-based ratings. Personnel Psychology, 48, 151-160.
Hauenstein, N.M.A. (1992). An information processing approach to leniency in performance judgement. Journal of Applied Psychology, 77, 485-493.
Hauenstein, N.M.A. (1998). Training raters to increase the accuracy and usefulness of appraisals. In J. Smither (Ed.), Performance Appraisal: State of the Art in Practice, pp. 404-444. San Francisco: Josey Bass.

58
Hauenstein, N.M.A., Facteau, & Schmidt, J.A. (1999). Rater variability training: An alternative procedure to rater error training and frame-of-reference training. Unpublished Manuscript, Virginia Polytechnic Institute and State University, Blacksburg.
Hedge, J.W., & Kavanagh, M.J. (1988). Improving the accuracy of performance evaluations: Comparison of three methods of performance appraiser training. Journal of Applied Psychology, 73, 68-73.
Horvath, P. (1988). Placebos and common factors in two decades of psychotherapy research, Psychological Bulletin, 104, 214-225.
Jawahar, I.M., & Stone, T.H. (1997). Influences of raters’ self-consciousness and appraisal purpose on leniency and accuracy of performance ratings. Psychological Reports, 80, 232-336.
Klimoski, R., & Inks, L. (1990). Accountability forces in performance appraisal. Organizational Behavior and Human Decision Processes, 45, 194-208.
Landy, F.J., & Farr, J.L. (1980). Performance rating. Psychological Bulletin, 87, 72-107.
Latham, G.P., Wexley, K.N., & Pursell, E.D. (1975). Training managers to minimize rating errors in the observation of behavior. Journal of Applied Psychology, 60, 550-555.
Lawler, E.E. (1976). Control systems in organizations. In M. Dunnette (Ed.), Handbook of industrial and organizational psychology. Chicago: Rand McNally.
Locke, E.A. (1976). The nature and causes of job satisfaction. In M. Dunnette (Ed.), Handbook of industrial and organizational psychology (pp. 1297-1350). Chicago: Rand McNally.
Lord, R.G. (1985). Accuracy in behavioral measurement: An alternative definition based on raters’ cognitive schema and signal detection theory. Journal of Applied Psychology, 70, 66-71.
McDonald, T. (1991). The effect of dimension content on observation and ratings of job performance. Organizational Behavior and Human Decision Processes, 48, 252-271.
McGregor, D. (1957). An uneasy look at performance appraisal. Harvard Business Review, 35, 89-94.
McIntyre, R.M., Smith, D., and Hasset, C.E. (1984). Accuracy of performance ratings as affected by rater training and perceived purpose of rating.” Journal of Applied Psychology, 69, 147-156.
Meglino, B.M., Ravlin, E.C., & Adkins, C.L. (1989). A work values approach to corporate culture: A field test of the value congruence process and its relationship to individual outcomes. Journal of Applied Psychology, 74, 424-434.
Murphy, K.R., & Balzer, W.K. (1989). Rating errors and rating accuracy. Journal of Applied Psychology, 74, 619-624.
Murphy, K.R.; Balzer, W.K.; Kellam, K.L.; Armstrong, J.G. (1984). Effects of the purpose of rating on accuracy in observing teacher behavior and evaluating teaching performance. Journal of Educational Psychology, 76, 45-54.
Murphy, K.R., & Cleveland, J.N. (1995). Understanding Performance Appraisal. Thousand Oaks CA.: Sage, pp. 267-298.
Murphy, K.R., Garcia, M., Kerkar, S., Martin, C., & Balzer, W.K. (1982). Relationship between observational accuracy and accuracy in evaluating performance. Journal of Applied Psychology, 67, 320-325.

59
Padgett, M.Y. (1988). Performance appraisal in context: Motivational influences on performance ratings. Unpublished manuscript. Wayne State University.
Parrill, S. (1999). Revisiting rating format research: Computer-based rating forms and components of accuracy. Unpublished manuscript. Virginia Polytechnic and State Institute, Blacksburg, VA.
Pedhazur, E.J., & Pedhazur Schmelkin, L. (1991). Measurement Design, and Analysis: An Integrated Approach. Hillsdale, New Jersey: Lawrence Erlbaum Associates.
Pulakos, E. D. (1986). The development of training programs to increase accuracy with different rating tasks. Organizational Behavior & Human Decision Processes, 38(1), 76-91.
Rosman, P., & Burke, R.J., (1980). Job satisfaction, self-esteem, and the fit between perceived self and job on valued competencies. Journal of Psychology, 105, 259-269.
Ryan, A.M., Daum, D., Bauman, T., Grisez, M., Mattimore, K., Nalodka, T., & McCormick, S. (1995). Direct, indirect, and controlled observation and rating accuracy. Journal of Applied Psychology, 80 (6), 664-670.
Schleicher, D.J., & Day, D.V. (1998). A cognitive evaluation of frame-of-reference rater training: Content and process issues. Organizational Behavior and Human Decision Processes, 73, 76-101.
Sharon, A., & Bartlett, C. (1969). Effect of instructional conditions in producing leniency on two types of rating scales. Personnel Psychology, 22, 252-263.
Smith, D.E. (1986). Training programs for performance appraisal: A review. Academy of Management Review, 11, 22-40.
Smith, P.C., & Kendall, L.M. (1963). Retranslation of expectations: An approach to the construction of unambiguous anchors for rating scales. Journal of Applied Psychology, 47, 149-155.
Stamoulis, D.T., & Hauenstein, N.M.A. (1993). Rater training and rating accuracy: Training for dimensional accuracy versus training for ratee differentiation. Journal of Applied Psychology, 78, 42-52.
Stephenson, W. (1950). A statistical approach to typology: The study of trait-universes. Journal of Clinical Psychology, 6, 26-38.
Sulsky, L.M., & Balzer, W.K. (1988). Meaning and measurement of performance rating accuracy: Some methodological and theoretical concerns. Journal of Applied Psychology, 73, 497-506.
Sulsky, L.M., & Day, D.V. (1992). Frame-of-reference training and cognitive categorization: An empirical investigation of rater memory issues. Journal of Applied Psychology, 77, 501-510.
Sulsky, L.M., & Day, D.V. (1994). Effects of frame-of-reference training on rater accuracy under alternative time delays. Journal of Applied Psychology, 79, 535-543.
Tubbs, M.E., & Dahl, J.G., (1991). An empirical comparison of self-report and discrepancy measures of goal commitment. Journal of Applied Psychology, 76, 708-716.
Williams, K.J., DeNisi, A.S., Blencoe, A.G., & Cafferty, T.P. (1985). The role of appraisal purpose: Effects of purpose on information acquisition and utilization. Organizational Behavior and Human Decision Processes, 35, 314-339.
Woehr, D.J. (1994). Understanding frame-of-reference training: The impact of training on the recall of performance information. Journal of Occupational and Organizational Psychology, 51, 22-50.

60
Woehr, D.J., & Huffcutt, A.I. (1994). Rater training for performance appraisal: A quantitative review. Journal of Occupational and Organizational Psychology, 67, 189-205.
Zedeck, S. , & Cascio, W.F. (1982). Performance appraisal decisions as a function of rater training and purpose of the appraisal. Journal of Applied Psychology, 67, 752-758.
Zedeck, S., Jacobs, R., & Kafry, D. (1976). Behavioral expectations: Development of parallel forms and analysis of scale assumptions. Journal of Applied Psychology, 61, 112-115.

61
Appendix A Form Used to Generate Critical Incidents – Phase 1 Directions: Please generate examples of behaviors which represent the following four dimensions of teaching performance. Definitions of the performance dimensions are provided. Generate as many examples as you can think of. List your examples in the spaces provided. Performance Dimensions: 1) Organization – This is the degree to which the lecturer has put together an orderly and
structured presentation such that the material being presented logically flows from one point to the next. For example, “going off on tangents” would be an example of poor organization. Examples of Good Organization:
Examples of Mediocre Organization: Examples of Poor Organization:

62
2) Delivery – This is the degree to which the lecturer is a skillful speaker. This dimension of
teaching effectiveness is what most people think of as public speaking skills. Examples of some behaviors relevant to delivery are loudness of voice, eye contact and use of lecture notes. Delivery only refers to the manner in which the lecture is presented, not to the content and organization of the material.
Examples of Good Delivery: Examples of Mediocre Delivery: Examples of Poor Delivery:

63
3) Depth of Knowledge – This refers to the breadth of information presented in the lecture. In
other words, this is the comprehensiveness of the lecturer’s presentation. An example representing good depth of knowledge would be, “easily relates real-world knowledge to the topic of discussion.”
Examples of Good Depth of Knowledge: Examples of Mediocre Depth of Knowledge: Examples of Poor Depth of Knowledge:

64
4) Use of Technology -- This refers to the extent to which the lecturer employs the use of
various information technologies to make the subject matter more stimulating and more easily understood. The use of overhead projects or power point presentations are examples of such technologies.
Examples of Good Use of Technology: Examples of Mediocre Use of Technology: Examples of Poor Use of Technology:
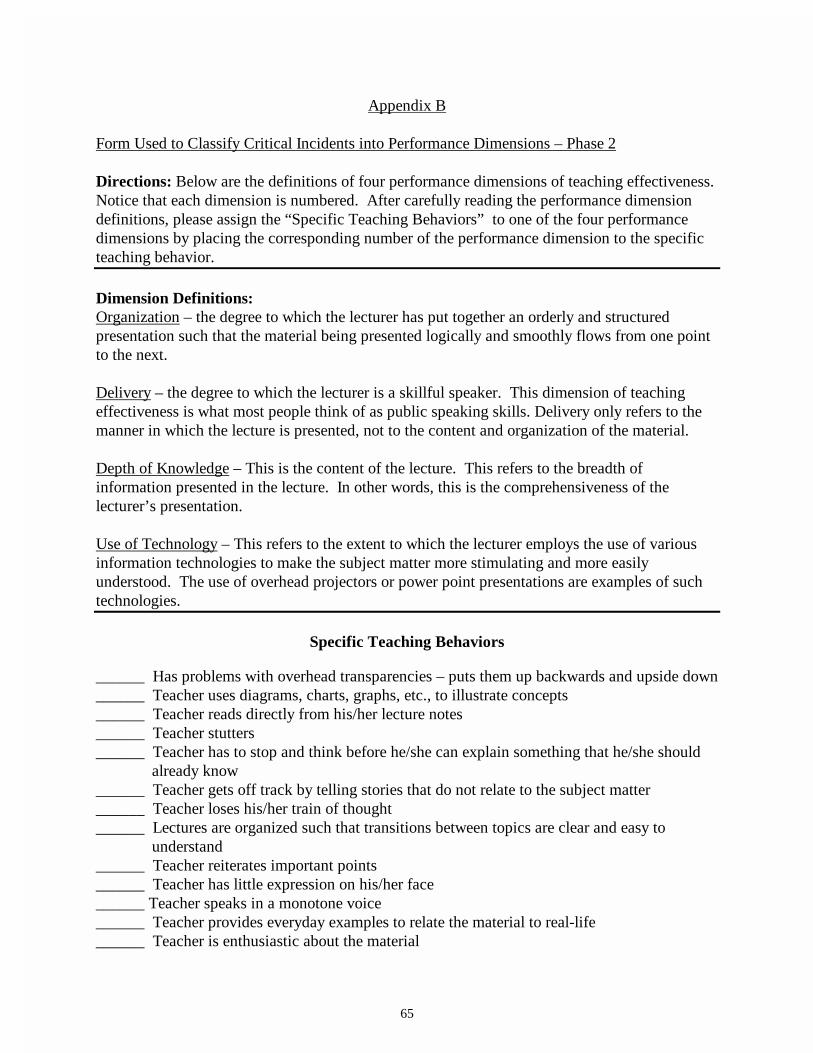
65
Appendix B Form Used to Classify Critical Incidents into Performance Dimensions – Phase 2 Directions: Below are the definitions of four performance dimensions of teaching effectiveness. Notice that each dimension is numbered. After carefully reading the performance dimension definitions, please assign the “Specific Teaching Behaviors” to one of the four performance dimensions by placing the corresponding number of the performance dimension to the specific teaching behavior. Dimension Definitions: Organization – the degree to which the lecturer has put together an orderly and structured presentation such that the material being presented logically and smoothly flows from one point to the next. Delivery – the degree to which the lecturer is a skillful speaker. This dimension of teaching effectiveness is what most people think of as public speaking skills. Delivery only refers to the manner in which the lecture is presented, not to the content and organization of the material. Depth of Knowledge – This is the content of the lecture. This refers to the breadth of information presented in the lecture. In other words, this is the comprehensiveness of the lecturer’s presentation. Use of Technology – This refers to the extent to which the lecturer employs the use of various information technologies to make the subject matter more stimulating and more easily understood. The use of overhead projectors or power point presentations are examples of such technologies.
Specific Teaching Behaviors ______ Has problems with overhead transparencies – puts them up backwards and upside down ______ Teacher uses diagrams, charts, graphs, etc., to illustrate concepts ______ Teacher reads directly from his/her lecture notes ______ Teacher stutters ______ Teacher has to stop and think before he/she can explain something that he/she should
already know ______ Teacher gets off track by telling stories that do not relate to the subject matter ______ Teacher loses his/her train of thought ______ Lectures are organized such that transitions between topics are clear and easy to
understand ______ Teacher reiterates important points ______ Teacher has little expression on his/her face ______ Teacher speaks in a monotone voice ______ Teacher provides everyday examples to relate the material to real-life ______ Teacher is enthusiastic about the material

66
______ The teacher is fidgety (e.g., messes with his/her hair, taps foot, etc.) ______ Teacher talks too slowly ______ Teacher talks too fast ______ Does not use any visual aids ______ Teacher chews gum during class ______ Teacher scrambles to find his/her lecture notes ______ Teacher uses appropriate body language (e.g., hand gestures) to emphasize important
points ______ Teacher’s voice has good volume ______ Teacher has good voice inflection ______ Shallow explanation of concepts – definitions only ______ Explains the same concept in more than one way ______ Teacher randomly skips from one topic to the next ______ Teacher writes on the chalkboard with back turned to students while lecturing ______ Laid back presentation style ______ At the beginning of class the teacher provides a topical outline to clarify the structure and
the focus of the upcoming lecture ______ Teacher uses the chalkboard ______ Teacher uses overhead projector ______ Teacher uses power point ______ Teacher uses the internet ______ Teacher has problems operating overhead projector ______ Teacher has problems operating power point ______ Teacher has difficulty using the internet ______ Teacher confuses two different concepts ______ Teacher provides a summary of the main points ______ Teacher moves around the classroom ______ Teacher has repetitive verbal patterns (e.g., says, “uh,” “um”) ______ Teacher uses difficult vocabulary words which makes it difficult for students to
understand the lecture ______ Teacher mumbles ______ Teacher attempts to use humorous anecdotes and examples to stimulate interest in the
topic ______ Teacher has good eye contact ______ Teacher is able to inform the class of exceptions to general research findings ______ Overheads are cluttered with too much information ______ Teacher makes connections between concepts so the students can see how the concepts
relate to one another ______ Teacher has all of his/her lecture materials in order ______ Overhead notes are not prepared ahead of time ______ Teacher gets visibly frustrated when he/she cannot locate a particular piece of
information ______ Teacher appears to be nervous ______ Teacher can easily cite information/research

67
______ Teacher uses a laser pointer ______ Teacher only refers to lecture notes as a reminder ______ Teacher talks about a study that he/she doesn’t know very well ______ Teacher repeatedly looks at his/her watch ______ Random pauses in speech ______ Teacher has to refer to the textbook for definitions ______ The font on the overhead transparencies is too small to read ______ Uses colorful visual aids ______ Only lectures on material from the textbook ______ Provides outside information that supplements textbook material ______ Explains things in a concise and precise manner ______ Backs up his/her statements with research findings ______ Teacher is able to relate the lecture topic to other fields of study ______ Uses poor grammar ______ Stands behind a podium during most of the lecture ______ Sits behind a desk during most of the lecture ______ Presents current research on a topic ______ Teacher repeats him/herself ______ Teacher has poor posture ______ Teacher forgets to bring some of his/her lecture notes to class ______ Teacher forgets the name of a concept he/she is trying to explain ______ Teacher enunciates clearly

68
Appendix C Classification of Critical Incidents into Performance Dimensions. Critical Incidents Classified as Representing the Organization Performance Dimension: • “Has problems with overhead transparencies – puts them up backwards and upside down”
(71.4% agreement) • “Teacher gets off-track by telling stories that do not relate to the subject matter”
(91.4% agreement) • “Teacher loses his/her train of thought”
(71.4%) • “Lectures are organized such that transitions between topics are clear and easy to
understand” (82.9% agreement)
• “Teacher scrambles to find his/her notes” (91.4% agreement)
• “Teacher randomly skips from one topic to the next” (85.7% agreement)
• “At the beginning of class, the teacher provides a topical outline to clarify the structure and focus of the upcoming lecture” (85.7%)
• “Teacher provides a summary of the main points” (73.5% agreement)
• “Teacher has all of his/her lecture notes in order” (100% agreement)
• “Overhead transparencies are not prepared ahead of time” (73.5% agreement)
• “Teacher forgets to bring some of his/her lecture notes to class” (77.1% agreement)
Critical Incidents Classified as Representing the Delivery Performance Dimension: • “Teacher stutters”
(94.3% agreement) • “Teacher has little expression on his/her face”
(97.1% agreement) • “Teacher speaks in a monotone voice”
(97.1% agreement) • “Teacher is enthusiastic about the material”
(77.1% agreement) • “Teacher is fidgety (e.g., messes with hair, taps foot, etc.)”
(91.4% agreement) • “Teacher talks too slowly”
(97.1% agreement) • “Teacher talks too fast”
(97.1% agreement)
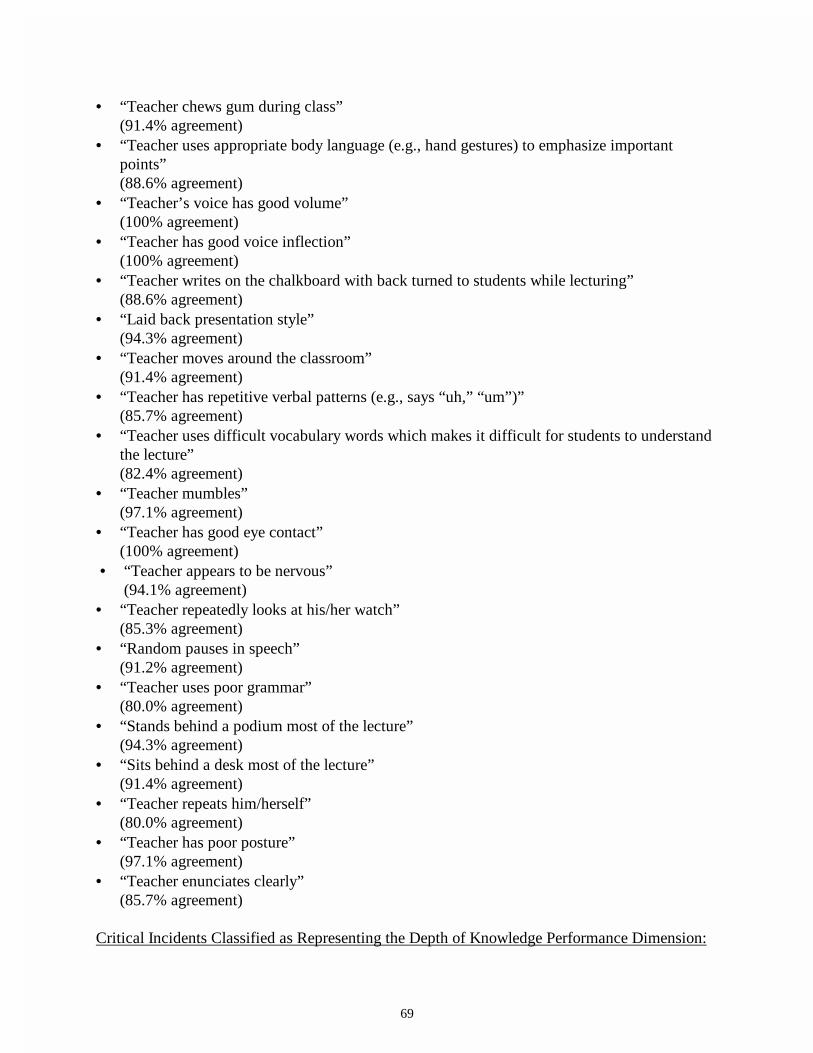
69
• “Teacher chews gum during class” (91.4% agreement)
• “Teacher uses appropriate body language (e.g., hand gestures) to emphasize important points” (88.6% agreement)
• “Teacher’s voice has good volume” (100% agreement)
• “Teacher has good voice inflection” (100% agreement)
• “Teacher writes on the chalkboard with back turned to students while lecturing” (88.6% agreement)
• “Laid back presentation style” (94.3% agreement)
• “Teacher moves around the classroom” (91.4% agreement)
• “Teacher has repetitive verbal patterns (e.g., says “uh,” “um”)” (85.7% agreement)
• “Teacher uses difficult vocabulary words which makes it difficult for students to understand the lecture” (82.4% agreement)
• “Teacher mumbles” (97.1% agreement)
• “Teacher has good eye contact” (100% agreement)
• “Teacher appears to be nervous” (94.1% agreement)
• “Teacher repeatedly looks at his/her watch” (85.3% agreement)
• “Random pauses in speech” (91.2% agreement)
• “Teacher uses poor grammar” (80.0% agreement)
• “Stands behind a podium most of the lecture” (94.3% agreement)
• “Sits behind a desk most of the lecture” (91.4% agreement)
• “Teacher repeats him/herself” (80.0% agreement)
• “Teacher has poor posture” (97.1% agreement)
• “Teacher enunciates clearly” (85.7% agreement)
Critical Incidents Classified as Representing the Depth of Knowledge Performance Dimension:
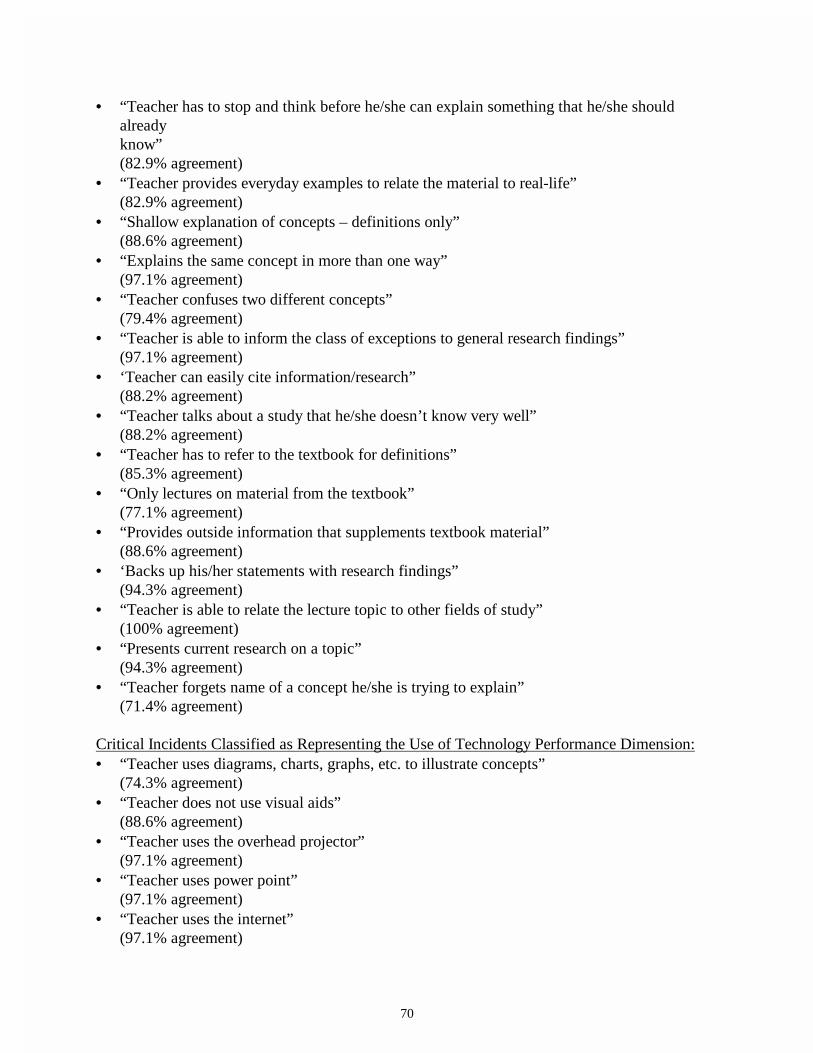
70
• “Teacher has to stop and think before he/she can explain something that he/she should already know” (82.9% agreement)
• “Teacher provides everyday examples to relate the material to real-life” (82.9% agreement)
• “Shallow explanation of concepts – definitions only” (88.6% agreement)
• “Explains the same concept in more than one way” (97.1% agreement)
• “Teacher confuses two different concepts” (79.4% agreement)
• “Teacher is able to inform the class of exceptions to general research findings” (97.1% agreement)
• ‘Teacher can easily cite information/research” (88.2% agreement)
• “Teacher talks about a study that he/she doesn’t know very well” (88.2% agreement)
• “Teacher has to refer to the textbook for definitions” (85.3% agreement)
• “Only lectures on material from the textbook” (77.1% agreement)
• “Provides outside information that supplements textbook material” (88.6% agreement)
• ‘Backs up his/her statements with research findings” (94.3% agreement)
• “Teacher is able to relate the lecture topic to other fields of study” (100% agreement)
• “Presents current research on a topic” (94.3% agreement)
• “Teacher forgets name of a concept he/she is trying to explain” (71.4% agreement)
Critical Incidents Classified as Representing the Use of Technology Performance Dimension: • “Teacher uses diagrams, charts, graphs, etc. to illustrate concepts”
(74.3% agreement) • “Teacher does not use visual aids”
(88.6% agreement) • “Teacher uses the overhead projector”
(97.1% agreement) • “Teacher uses power point”
(97.1% agreement) • “Teacher uses the internet”
(97.1% agreement)

71
• “Teacher has problems operating the overhead projector” (82.4% agreement)
• “Teacher has problems operating power point” (82.4% agreement)
• “Teacher has difficulty using the internet” (82.4% agreement)
• “Teacher uses a laser pointer” (97.1% agreement)
Critical Incidents Not Clearly Classified into One of the Four Performance Dimensions: • “Teacher reads directly from his/her lecture notes”
(62.9% agreement) • “Teacher reiterates important points”
(51.4% agreement) • “Teacher uses the chalkboard”
(68.6% agreement) • “Teacher attempts to use humorous anecdotes and examples to stimulate interest in the
topic” (50% agreement)
• “Overheads are cluttered with too much information” (64.7% agreement)
• “Teacher makes connections between concepts so the students can see how the concepts relate to one another” (50% agreement)
• “Teacher gets visibly frustrated when he/she cannot locate a particular piece of information” (55.9% agreement)
• “Teacher only refers to lecture notes as a reminder (doesn’t read from them the entire time)” (64.7% agreement)
• “The font on the overhead transparencies is too small to read” (51.4% agreement)
• “Uses colorful visual aids” (51.4% agreement)
• “Explains things in a concise and precise manner” (37.1% agreement)

72
Appendix D Critical Incidents Represented on the Stimulus Video Clips and their Mean Ratings. Pretest Lecture – Poor Performance Organization: 1. skips around (M = 18.11, SD = 19.97) 2. forgets some of his lecture notes (M = 16.37, SD = 21.64) Delivery: 1. stutters (M = 12.24, SD = 18.28) 2. fidgety (M = 19.98, SD = 24.30) Depth of Knowledge: 1. shallow explanation of concepts – definitions only (M = 19.73, SD = 23.90) 2. forgets name of concept (M = 16.48, SD = 23.44) Pretest Lecture – Average Performance Organization: 1. gets off-track (M = 39.8, SD = 24.30) 2. overhead transparencies are upside down and backwards (M = 42.13, SD = 22.76) Delivery: 1. chewing gum (M = 45.67, SD = 22.07) 2. laid back presentation style (M = 60.21, SD = 18.71) Depth of Knowledge: 1. reports exception to general research finding (M= 61.88, SD = 18.88) 2. refers to textbook (M = 38.99, SD = 20.59) Pretest Lecture – Good Performance Organization: 1. notes and overheads are in order (M = 91.43, SD = 6.65) 2. provides summary of main points (M = 91.00, SD = 13.15) Delivery: 1. expresses enthusiasm in the subject (M = 93.23, SD = 21.49) 2. good voice inflection (M = 92.55, SD = 6.52) Depth of Knowledge: 1. cites research (M = 90.37, SD = 18.16) 2. provides supplementary information (M = 94.96, SD = 18.61) Posttest Lecture – Poor Performance Organization: looses train of thought (M = 20.57, SD = 19.06) Delivery: repetitive verbal patterns (e.g., says “uh” and “um”) (M = 21.09, SD = 19.01) Depth of Knowledge: confuses two different concepts (M = 23.47, SD = 20.70) Posttest Lecture – Below Average Performance Organization: scrambles to find lecture notes (M = 21.56, SD = 21.23) Delivery: good volume (M = 86.53, SD = 6.52) Depth of Knowledge: forgets details of a study (M = 28.74, SD = 23.92) Posttest Lecture – Average Performance Organization: overhead transparencies are not prepared ahead of time – writes out notes during lecture (M = 36.75, SD = 24.69) Delivery: good body language (M = 79.89, SD = 16.92) Depth of Knowledge: provides information on current research (M = 74.92, SD = 17.94) Posttest Lecture – Above Average Performance Organization: goes over topical outline at the beginning of the lecture (M = 83.77, SD = 16.50)

73
Delivery: talks too fast (M = 22.87, SD = 19.79) Depth of Knowledge: explains things in more than one way (M = 85.96, SD = 18.16) Posttest Lecture – Good Performance Organization: good transitions between topics (M = 89.76, SD = 10.93) Delivery: clear enunciation (M = 88.06, SD = 9.83) Depth of Knowledge: provides examples (M = 90.18, SD = 21.51) Note. Ratings were on a scale from 0 – 100; 0 = extremely ineffective, 50 = average, and 100 = extremely effective.

74
Appendix E Script for Pretest Lecture – Poor Performance
Today, I’m going to talk about memory. Memory is defined as the capacity to retain and
later retrieve information. There are three basic memory systems: (1) sensory memory is a memory system that retains representations of sensory input for a brief period of time. Sensory memory can hold a great deal of information, and it has a very short duration. Psychologists have been most interested in our sensory memory for visual stimuli and auditory stimuli. There are specific names for visual sensory memory and auditory sensory memory, and they’re on the tip of my tongue . . . . ahh hah! The sensory memory system for visual information is called iconic memory, . . . but I can’t remember the name of the system for auditory information. Anyways, moving along
Short-term memory is the memory system that briefly holds information that is currently being used. By paying attention to incoming sensory information it is transferred into the short-term memory system. Short-term memory can hold a limited amount of information and it holds information for less than 20 seconds.
Long-term memory is the memory system which has relatively permanent storage of information. Information is entered into long-term memory by engaging in elaborative rehearsal. Elaborative rehearsal is when you consider the meaning of the information you’re trying to remember, and you relate the information to other knowledge that is already present in your memory. Long-term memory has an unlimited capacity for storage of information and— Oh, wait--going back to short-term memory, I forgot to mention that it can hold 7 plus or minus 2 bits, or pieces, of information. Okay, now back to long-term memory. The long-term memory system can also retain information permanently, or at least for a very long time.
I had a good diagram here to illustrate these concepts, but I can’t seem to find it. Hmm, I seemed to have forgotten some of my notes. So, I guess that’s about it for memory systems . . .

75
Script for Pretest Lecture – Average Performance The topic of today’s lecture is memory. Memory refers to our ability to retain and later
retrieve information. We have three basic memory systems.
Sensory memory is our memory for the information we receive from our five senses. Our sensory memory system can hold a lot of information, but it can only hold that information for a very brief period of time. Sensory memory for visual stimuli and auditory stimuli are the two types of sensory memory that psychologists have devoted the most time and effort to studying. Now, there are particular names for each of these types of memory . . . let me see here . . . . . (reading from the textbook) “iconic memory is the name for visual sensory memory; individuals are only able to store iconic memory for less than one second. Echoic memory is the name for auditory sensory memory; individuals are able to store echoic memory for just a few seconds.” Speaking of sensory memory, my “senses” have been driving me crazy lately. My allergies have been horrible this season. I think I must be allergic to absolutely everything. I can’t wait until I go to my doctor tomorrow and get some medicine. Maybe then I’ll finally be able to get a good night’s sleep.
Well, enough about my problems. Back to the discussion of memory. Short-term memory is the memory system where we store information that we’re currently using. Information is transferred from sensory memory into short-term memory when we pay attention to the information. Whereas sensory memory can hold an unlimited amount of information, short-term memory can only hold 5 to 9 pieces of information at a time. This capacity for information storage is commonly referred to as, “7 plus or minus 2 bits”. There are some exceptions, however, to this 7 + or – 2 bits of information rule. There have been some extreme cases where individuals have been able to recall large amounts of information. For example, one individual was able to list pi out to something like 100 decimal places. Short-term memory can hold information longer than sensory memory, but it still only holds information for relatively brief periods of time—about 20 seconds or less.
Long-term memory is the final destination for stored information. Information is transferred into long-term memory by way of elaborative rehearsal. Elaborative rehearsal is when you rehearse information in a meaningful way. One way this can be done is by relating the information you’re trying to remember to information that is already present in your memory. The capacity for information storage in long-term memory is virtually limitless and storage of information in long-term memory appears to be relatively permanent
Here is a diagram that nicely illustrates the three memory stores. Vast amounts of information are brought in from the senses, and if the information is paid attention to it will be transferred to short-term memory, and if elaboratively rehearsed it will finally be transferred to long-term memory where it will be permanently stored. And there you have it—those are the three memory systems (camera fades out)

76
Script for Pretest Lecture – Good Performance
Today I’ll be discussing a truly fascinating topic in psychology, and that topic is memory! In the past several decades we have discovered more about memory than in all the time before. Despite all this knowledge we have gained, the brain’s memory structure still remains very much a mystery.
Memory is defined as our ability to retain and later retrieve information. If we take a structural viewpoint, we can speak of memory as being composed of three separate systems. Those three systems are: the sensory memory system, the short-term memory system, and the long-term memory system. In 1890, William James was among the first psychologists to propose a system structure of memory. However, it wasn’t until 1968 that Atkinson and Shiffrin formally proposed a sensory memory system, a short-term memory system and a long-term memory system.
Your intro psych textbook defines sensory memory as, “a memory system that retains representations of sensory input for brief periods of time.” Another textbook defines sensory memory as the memory system that holds information coming in through the senses for a period ranging from a fraction of a second to several seconds. Both of these definitions convey that sensory memory only lasts for a very short time. In particular, our sensory memory for auditory stimuli lasts for only a few seconds. In 1967, Neisser labeled sensory memory for auditory information, echoic memory. Sensory memory for visual stimuli lasts for only a few fractions of a second! Neisser labeled this memory as iconic memory. What these two definitions of short-term memory do not convey is that an absolutely enormous amount of information can be held in the sensory memory system!
Short-term memory, also called working memory, is the system where we store the
information we are currently using. In other words, whatever you are thinking about right now is in your short-term memory system! If we pay attention to the information in our sensory memory system, then that information will be transferred to the short-term memory system. As I just mentioned, the capacity for information storage in sensory memory is virtually limitless. Short-term memory, on the other hand, has a much smaller capacity for information storage. We can only hold about seven pieces of information in short-term memory. This limit is commonly referred to as “7 plus or minus 2 bits of information.” One way to overcome the limitation of 7 + or - 2 bits of information, is to use a technique called chunking. Chunking means organizing or grouping separate bits of information into larger units, or chunks so that they are more meaningful. This is a good technique to know because it allows us to store a lot more information than we otherwise would be able to! Another characteristic of short-term memory is that it can retain information for approximately 20 seconds. This is longer than storage of information in sensory memory, but much shorter than long-term memory storage.
Long-term memory is our vast storehouse of permanent or relatively permanent memories.
Engaging in elaborative rehearsal facilitates the transfer of information from short-term memory to long-term memory. We engage in elaborative rehearsal when we consider the meaning of the material, and then relate that information to knowledge already present in our long-term

77
memory. Craik and Lockhart would refer to this as “deep processing.” Deep processing, they say, is the opposite of shallow processing, and it requires greater cognitive effort. To reiterate, long-term memory can hold a vast amount of information, and storage of information in long-term memory is relatively permanent.
The diagram here clearly demonstrates the relation between the three memory systems. As
you can see, information is brought in through the five senses. If that information is paid attention to, then it goes into short-term memory, where if elaboratively rehearsed is transferred to long-term memory where it remains indefinitely.
So, that wraps things up for the discussion on memory systems. To quickly recap, I first defined memory. Then, we covered the three basic systems of memory. Sensory memory, has the shortest duration, but it does hold an enormous amount of information. Short-term memory, on the other hand, only holds a limited amount of information, but it does have a longer duration—not as long as long term-memory, however, which holds a vast amount of information AND lasts indefinitely. (camera fades out)

78
Script for Posttest Lecture – Poor Performance Today I’m going to spend some time talking about conformity. Conformity is defined as a
change in a person’s behavior or opinions as a result of real or imagined pressure from a person or group of people.
There are several factors that can affect the degree to which we conform. Here are some of those: (1) The size of the majority is a factor which affects the degree to which we conform. If there are two or more people present then we are much more likely to conform than if just one other person was present. (2) The presence of a dissenting partner can also affect conformity. If there is just one other person present who is not going along with the group, then others are less likely to conform. (3) The make-up of the group also influences the degree of conformity. Researchers have found that conformity is more likely to occur when . . .
(a) the group is made-up of experts. We are more likely to conform to the opinions of experts because we have a strong desire to be correct, and we believe that experts are more likely to hold the correct opinion.
(b) the members are important to the individual. We’re more likely to conform to friends
and family members because it’s more important for us to be liked by these people than it is for us to be liked by people we don’t know well.
(c) the group is similar to the individual in some way. Research demonstrates that we
identify with people who are similar to us, and this identification leads us to conform to the person or group that is similar to us.
(4) When we find ourselves in ambiguous situations we are also more likely to conform to what’s going on around us. This is because when the physical reality is ambiguous we rely more on social reality. In other words, when we’re not sure what we’re supposed to be doing, we look around to see what others are doing and then copy their behavior.
Researchers have identified several “types” of conformity. One such “type” of conformity is compliance. Compliance is a behavior that is motivated by the desire to gain a reward or avoid a punishment. We comply only as long as there is the promise of a reward or the threat of a punishment. In other words, once the reward or punishment has been removed we stop complying. There several techniques that people may use in order to get us to comply to their wishes:
(a) For example, there’s the foot-in-the-door technique. A person using this
technique will start with a very large request, and then once the large request is rejected the person will make a smaller request. . . . Wait, that’s not right. I’m sorry that’s the door-in-the-face technique. I got the two mixed up. Let me fix that real quick--draw arrows on the overhead so that the definitions are switched around. Okay, so the door-in-the-face technique is when you start out with a large request and then make a smaller more reasonable request.

79
(b) The foot-in-the-door technique is the reverse of that. It’s when you start off with a small request and then make a larger request. The reasoning behind this is that . umm. . . . the reasoning behind this is that . . . . ???? I’m totally drawing a blank here. Pause Okay, let’s move on to the lowball technique and maybe it will come back to me later.
(c) The lowball technique is when you change the terms of the arrangement after the
deal has already been made.
(d) There’s also the that’s-not-all technique. Here a small extra incentive is offered before the person has a chance to accept or reject the offer.
Okay, now where was I??? What was I talking about??? Ohh, right I was talking about
different types of conformity. Social Facilitation is an example of another type of conformity. Social facilitation is when the presence of other people decreases--woops, I almost did it again—social facilitation is when the presence of other people increases the likelihood of behavior. Social facilitation is more likely to occur for behaviors that are well-learned.
Social Inhibition, on the other hand, is when the presence of others decreases the likelihood of behavior. And this is more likely to occur for behaviors that have just been recently learned. Bystander Apathy is an example of social inhibition. According to the research, the probability that a person in distress will receive help, decreases as the number of bystanders increases. That’s about all I have for today (camera fades out)

80
Script for Posttest Lecture – Below Average Performance Conformity—that’s today’s lecture topic. Conformity is a change in a person’s behavior or opinions as a result of real or imagined pressure from a person or group of people.
Many things can affect the extent to which people conform. For example, (1) the size of the majority affects conformity. Conformity is more likely to occur in larger groups. (2) If there is another person who “bucks the system” so to speak, by deciding not to go along with the majority, then the presence of this dissenter may also result in other people not conforming. (3) The make-up of the group also influences the extent of conformity. Conformity is more likely to occur if . . .
(a) the group is made-up of experts. Because experts are perceived as being correct, individuals are more likely to conform to experts’ opinions and behaviors.
(b) the members are important to the individual. We conform to friends and family
members more often than to strangers because we want to “fit-in” with the people we are close to.
(c) The group is similar to the individual. We identify with people who are similar to
us, and this results in greater conformity. (4) We’re also more likely to conform when we find ourselves in ambiguous situations. In ambiguous situations we’re not sure what the appropriate behavior is, and so we look to see what others are doing and then follow suit.
Conformity occurs in many different forms. One form of conformity is compliance. Compliance is a conforming behavior motivated by the desire to gain a reward or avoid a punishment. This is the least enduring type of conformity. Once the promise of a reward or the threat of punishment is removed then the person ceases to comply. People may use several different techniques in order to get a person to comply with their wishes.
a. The foot-in-the-door technique is an example a compliance technique. A person who uses this technique will make a small request and then follow-up that request with a larger request.
b. The door-in-the-face technique is the opposite of the foot-in-the-door
technique. A person using this technique will first ask for a large request. After the person refuses this large request, then the person will make a smaller more reasonable request. There was an important study done several years ago which nicely illustrates both of these concepts, but I’m having trouble recalling the study. It had something to do with going around to peoples’ homes and asking them to put a big sign in their front yard. I think it was a “drive safely” sign. The first time through they asked the home owners to donate something like $10,000 to a “drive safely campaign.” The people

81
would of course refuse, so then the experimenters would ask them to simply put a drive safely sign in their front yard. (pause) There was another part to this study, but it seems to have slipped my mind.
c. Well, moving along, another compliance technique is the lowball technique.
Here the person making the request changes the terms of the arrangement after the deal has been made.
d. Another compliance technique is the that’s-not-all-technique. Here the
person making the request offers a small extra incentive in order to get the person to comply.
Social Facilitation is another form of conformity. Social facilitation is when the presence
of other people increases the likelihood of a particular behavior. Social facilitation is more likely to occur when the behavior in question is a well-learned behavior.
On the other hand, social inhibition occurs with recently learned behaviors. This is when the presence of other people decreases the likelihood of a particular behavior. Bystander Apathy is a special form of social inhibition. This occurs when passers-by fail to offer help to a person in need. Bystander apathy is more likely to occur if there are many people around who could offer help. This is because people feel less personally responsible for offering help when other people are around who could help. That concludes my presentation on conformity (camera fades out)

82
Script for Posttest Lecture – Average Performance
Conformity will be the topic of discussion in today’s lecture. Conformity is defined as a change in a person’s behavior or opinions as a result of real or imagined pressure form a person or a group of people. There are several variables that can influence the amount of conformity that occurs. (1) The size of the majority is one of those variables. When only one other individual is present we are less likely to conform, however, when there are two or more individuals present we experience more pressure to conform and thus conformity increases in larger groups. (2) The presence of a dissenter is another factor influencing conformity. Researchers have found that if one person is willing to go against the group, then conformity decreases. (3) The make-up of the group can also affect conformity. Conformity within a group increases if . . .
(a) the group consists of experts. People conform to the views of experts because the experts are more likely to be right.
(b) the members are important to the individual. We conform to friends and family
members more often than to strangers because it is more important for us to be accepted by our friends and family.
(c) The group is similar to the individual. We identify with people who are similar to
us and this leads to an increase in conformity. (4) We see an increase of conformity when individuals find themselves in ambiguous situations. That is, when we find ourselves in situations that are new or unfamiliar to us, we conform to the behaviors of those around us. (5) A recent 1999 study revealed another factor that plays a role in conformity. In this study it was found that older people are less likely to conform than are younger people.
There are several different kinds of conformity. Compliance is one kind of conformity. Compliance refers to behavior motivated by a desire to gain a reward or avoid a punishment. A person will only comply as long as there is the promise of a reward or the threat of punishment. Researchers have identified several compliance techniques:
(a) The foot-in-the-door technique is a compliance technique. A person using this technique will make a small request, and then ask the person to comply with a larger request. A 1999 study by Chartrand, however, demonstrated that people are more likely to agree to the larger request if there has been a time delay between the small request and the large request.
(b) A person using the door-in-the-face technique, on the other hand, will make a
large request and then follow it up with a smaller more reasonable request to which the person is more likely to comply.

83
(c) A person using the lowball technique will change the terms of the arrangement after the deal has been made.
(d) Another compliance technique is the that’s-not-all technique. A person using
this technique will offer a small extra incentive in order to induce compliance.
In regards to other types of conformity, there’s social facilitation and social inhibition. Social Facilitation is when the presence of other people increases the likelihood of a particular behavior. Social facilitation is more likely to occur for well-learned behaviors.
The opposite of social facilitation is social inhibition. Social inhibition is when the presence of other people decreases the likelihood of behavior. This is more likely to occur when behaviors have just recently been learned. A particular type of social inhibition is bystander apathy. The term bystander apathy refers to the finding that individuals are less likely to offer help to a person in distress, if there are several other people nearby who could also offer help. In other words, as the number of bystanders increases each individual feels less responsible for offering help. So, that about sums things up (camera fades out)

84
Script for Posttest Lecture – Above Average Performance The first topic on the agenda for today is conformity. Here is an outline of what you can expect to be covered in today’s lecture on conformity (puts up overhead).
First of all, I will provide a definition of conformity. Then, after having defined conformity, I’ll discuss several factors that can affect the extent to which people conform to their surrounding environments. Finally, the lecture on conformity will conclude with a discussion of some of the different types of conformity.
Conformity is defined as a change in a person’s behavior or opinions as a result of real or imagined pressure from a person or group of people. Another way in which we could think about conformity is as it being a sort of succumbing to peer pressure.
There are several factors which influence the extent to which people conform. Here are some of those: (1) The size of the majority influences the degree of conformity. When two or more people are present then it’s much more likely that a person will conform to the behavior and opinions of the group. In other words, the majority rules. (2) The presence of a dissenter is another factor that can reduce the amount of conformity. If there is at least one other person present who goes against the majority, then others are more likely to dissent. So if one person goes astray from the majority, then this paves the way for others to go against the majority. (3) The make-up of the group can also influence the amount of conformity. Conformity is more likely to occur if . . .
(a) the group is made up of experts. People have a strong desire to be right. So if a person finds him or herself within a group of people who are so-called “experts” on a particular topic, then the person is likely to conform his or her views on that topic to the views of the experts.
(b) the members are important to the individual. People conform because they want
to be liked and accepted by the group. If a particular group of people is of no consequence to a person, then there is no need to conform because the person doesn’t want to become a member of the group.
(c) the group is similar to the individual in some way. We identify with people who
are similar or comparable to us, and this leads to increases in conformity. (4) An ambiguous situation is another factor that influences conformity. When physical reality is ambiguous, we rely more on social reality. This means that we’re more likely to conform to what other people are doing in ambiguous or novel situations because the group’s behavior supplies us with valuable information about what we’re supposed to be doing.
Conformity can take many forms. One particular type of conformity is compliance. Compliance refers to a behavior motivated by the desire to gain a reward or avoid a punishment. This is the least enduring type of conformity. A person will comply with another person or

85
group only as long as the threat of punishment or the promise of reward is present. Once the punishment or the reward is removed, the person ceases to comply. When a person says, “they twisted my arm to get me to do such and such,” essentially they’re saying that I was complying with their demands. There are particular compliance techniques or strategies that people can use in order to get a person to comply with their demands.
(a) The foot-in-the-door technique is a strategy designed to secure a favorable response to a small request at first, with the aim of making the person more likely to agree later to a larger request. In other words, you get your foot in the door by asking for something small, and then once the person agrees to this small request you move on to bigger and better things. People are likely to agree to subsequent requests after they have agreed to initial requests because people like to be consistent.
(b) The door-in-the-face technique is also another compliance technique. A
person using this strategy will first ask for a large, unreasonable request fully aware that the person is likely to refuse the request. Then, at a later time, a smaller, more reasonable request is made. This time the person is more likely to agree.
(c) Another compliance technique is the lowball technique. A person using this
strategy gains compliance by making a very attractive initial offer. Once this initial offer is accepted, the person changes the terms of the arrangement and thus makes the deal less attractive. Most people would probably consider this to be a form of deception.
(d) People also try to gain compliance by using the that’s not all technique. Here
a small extra incentive is offered before the person has a chance to accept or reject the deal. This can be thought of as “sweetening the deal.”
Social facilitation is an example of another type of conformity. Social facilitation is
when the presence of other people increases the likelihood of a particular behavior. On the other hand, social inhibition is when the presence of other people decreases the likelihood of behavior. A person exhibiting social inhibition could also be accused of having stage fright. Social inhibition is much more likely to occur with behaviors that have just recently been learned. Bystander apathy is a particular form of social inhibition. Bystander apathy refers to the finding that a person in distress is less likely to receive help from a bystander as the number of bystanders increases. In other words, if someone is in need of help and there is only one other person present, then that person is likely to offer help. But if two or more people are present then there is less chance that the distressed individual will receive help. Psychologists believe that when more than one person is present there is a diffusion of responsibility so that no one in particular feels personally responsible for helping. This phenomenon has also been referred to as bystander non-intervention. Well, that’s all the material I have on conformity . . . camera fades out

86
Script for Posttest Lecture – Good Performance
In today’s lecture I will focus on conformity. First of all, we’ll begin with a definition of conformity. Conformity is defined as a change in a person’s behavior or opinion as a result of real or imagined pressure from a person or a group of people.
Now that we know the definition of conformity, I want to spend some time talking about a few factors that influence conformity. (1) First of all, the size of the majority can influence the amount of conformity that occurs. When we find ourselves in the presence of one other person we’re not likely to conform to the behavior of that person, but if we find ourselves in the presence of two or more people then we’re more likely to conform. For example, if you and a friend were going to see a movie and each of you wanted to see something different, you’d probably spend some time arguing back and forth trying to decide which movie to see. However, if you and several of your friends were going to see a movie and they all wanted to see the same movie, and you were the only one who wanted to see a different movie, then in this case you’d be more likely to succumb to the majority.
(2) The presence of a dissenter is a second factor that can influence conformity. If there is one other person who is willing to go against the majority, then others are likely to go against the majority as well. For example, say Bill is at a high school party and he feels pressured to drink because everyone else is drinking, but if one other person speaks up and refuses to drink then it’s more likely that Bill will refrain from drinking as well.
(3) Next, the make-up of the group is another factor that can influence the degree of conformity. People are more likely to conform when . . .
(a) the group is made-up of experts. This is because people have a strong desire to be right, and so they’re more likely to conform to people who they think have the right answers. For example, let’s say you’re arguing with some of your friends about who’s the best presidential candidate. You’d be more apt to agree with your friends who are political science majors than you would be to agree with friends who are interior design majors. This is because you perceive the poli sci majors as having more of an expert opinion on the matter.
(b) If the members are important to the individual then there’s also a greater chance
of conformity. This is because individuals want to “fit-in” with those people they like and admire. For example, you’re more likely to conform to the opinions of your fellow sorority sisters or fellow fraternity brothers than you are to the opinions of a rival sorority or fraternity.
(c) Also, if the group is similar to the individual in some way then there is a greater
chance of conformity. For example, you’d be more likely to yield to the opinions of fellow college students than to the opinions of fourth graders.

87
(4) Finally, people are more likely to conform when they find themselves in ambiguous situations. In other words, in ambiguous situations people look to see what others are doing, and then follow along. Now that we’ve discussed some factors that influence the degree of conformity, I next
want to discuss some different types of conformity. Compliance is the first type of conformity I’m going to discuss. Compliance is a behavior motivated by the desire to gain a reward or avoid a punishment. This happens to be the least enduring type of conformity because a person will comply only as long as there is a promise of reward or the threat of punishment. Once the promise of reward or threat of punishment is removed, the person no longer complies. Researchers have identified several compliance techniques that people use in order to get others to comply with their demands:
(a.) One of the most commonly practiced compliance techniques is the foot-in-the-door technique. A person using this technique first gets someone to agree to a small request. Once a favorable response has been secured, then the person will make a larger request. Agreement to the initial small request results in the person being more likely to agree to a later larger request. For example, let’s say I’m a door-to-door salesperson and I’m selling life insurance. If I can get you to agree to the smallest policy that I’m selling, then later on down the road I’m more likely to get you to agree to a larger policy.
(b.) Surprisingly, the exact opposite compliance strategy seems to work just as
well. This strategy is called the door-in-the-face technique. A person using this strategy will first make a large, rather unreasonable request. Once this request has been turned down, then the person makes a smaller more reasonable request which is more likely to be accepted. For example, let’s say I work for the March of Dimes and I call you up and ask you to donate $1000 dollars to the March of Dimes. After you refuse, I then ask if you could donate just $10. This seems to be a pretty reasonable request after the $1000 dollar request and so you agree to donate 10 bucks.
(c.) A third compliance strategy is the lowball technique. A person using this
strategy will make a very attractive initial offer, and then once you’ve agreed to the offer the person changes the terms of the agreement. For example, a salesperson agrees to sell Chris a TV for $400. The salesperson goes to do the paperwork and then comes back and says, “the manager said I can’t go that low.” “I’m sorry, but the lowest I can go is $450.” Even though the salesperson has changed the terms of the initial deal Chris will most likely go along with the new deal because once we’ve made an initial commitment we find it hard to go back and change our minds.
(d.) Lastly, there’s the that’s-not-all technique. A person using this technique
offers a small extra incentive before the deal has been accepted or rejected.

88
Car salesmen are famous for using this technique. For example, a car salesman may say something like “I’ll throw in a free set of floor mats if you buy this car!” Customers often feel compelled to reciprocate for this “extra” and often say yes, even though price of the floor mats is miniscule when compared to the cost of the car.
Okay, so compliance is one type of conformity and I’ve just discussed four different
compliance techniques that people commonly use. Now, I still want to discuss two more types of conformity: social facilitation and social inhibition.
Social facilitation is when the presence of other people increases the likelihood of a particular behavior. Social facilitation is more likely to occur for behaviors that are well-learned. For example, if you are a really good dancer and you’re at a party and music is playing you’re likely to start dancing right in front of everyone. However, if you’re a really bad dancer and you really haven’t spent much time practicing your dance moves, then you’re less likely to dance at the party. So that’s an example of social facilitation.
Social inhibition is the opposite of social facilitation. Social inhibition is when the presence of other people decreases the likelihood of behavior. And social inhibition is more likely to occur for behaviors that have just recently been learned. For example, if a diver has just learned a new dive, the diver will probably feel nervous performing that new dive in front of an audience. Not until the diver has had a chance to practice the dive several times and become more comfortable with the dive will the diver want to perform that skill in front of a large audience. This would be an example of social inhibition.
Bystander Apathy is a special form of social inhibition. According to bystander apathy, if a person is in distress, that person is less likely to receive help as the number of bystanders increases. In other words, if just one bystander were present, then typically that person would offer help. But if more than one person were present then it’s less likely that any one person would stop to offer help to the distressed individual. This is because people experience a diffusion of responsibility when more than one person is present. For example, researchers have discovered that diffusion of responsibility occurs with tipping servers in a restaurant. (put up “diffusion of responsibility” overhead) As this graph illustrates, when the number of people in the party increases, the size of the tip decreases. This is because when more people are present each person feels less personally responsible for leaving the tip. And that concludes my presentation on conformity (camera fades out)

89
Appendix F
Training Session Protocol with Component Durations (2 ½ hrs. per condition)
FOR Training RVT Training AO Training SOT Training :10 Introduction :10 Introduction :10 Introduction :10 Introduction :20 Pretest :20 Pretest :20 Pretest :20 Pretest :05 Perf. Appraisal, :05 Perf. Appraisal, :05 Processes :05 Processes Work Multidim., Work Multidim., & Trends of & Trends of Behavior Obs. Behavior Obs. Perf. Apprs. Perf. Apprs. Lecture Lecture Lecture Lecture :10 Gen. Job :10 Gen. Job :10 Gen. Job :10 Gen. Job Behaviors Behaviors Behaviors Behaviors & Dims. & Dims. & Dims. & Dims. Discussion Discussion Discussion Discussion :10 FOR Concepts :10 RVT Concepts :10 Trends of :10 Trends of Lecture and Disc. Lecture and Disc. P.A. Lecture P.A. Lecture :05 Recap of FOR :05 Recap of RVT :05 Recap of :05 Recap of concepts concepts AO concepts SOT concepts :10 Break :10 Break :10 Break :10 Break :20 Pretest Rating :20 Pretest Rating :20 Pretest :20 Pretest Feedback via Feedback via Rating Rating FOR concepts RVT concepts Feedback Feedback :05 FOR Summary :05 RVT Summary :05 AO Summary :05 SOT Summary :45 Posttest :45 Posttest :45 Posttest :45 Posttest :05 Post-training :05 Post-training :05 Post-training :05 Post-training
Quiz Quiz Quiz Quiz :05 Debriefing :05 Debriefing :05 Debriefing :05 Debriefing

90
Appendix G
Frame-of-Reference / Administrative Training Protocol Materials • Business casual dress (i.e., look professional) • Training protocol for condition assigned to that session • Key to get into 4076 • Rater training CD-ROM • LCD projector (should already be in the room) • Overhead projector (should already be in the room) • Overhead transparencies • Transparency pen • Extra coding pencils • Training packet for the trainees • Orange extra credit opscans (enough for 4 opscans per person) • Informed consent forms—a set of “pre-debriefing” informed consent forms, and a set of
debriefing informed consent forms. If they need to keep a copy, give them the “pre-debriefing” informed consent.
• Video camera
Introduction DISTRIBUTE FIRST OF INFORMED CONSENT FORMS
Thank-you all for coming. Before we begin, I just want to let you know that today’s session will run for approximately 2 ½ hours, and because of its length you will be given a break.
Your purpose in being here today is to evaluate the lecture performance of five
individuals who are applying for assistantships as recitation instructors in Introductory Psychology for the upcoming Fall semester. Currently these five applicants are all college seniors who have been accepted into the psychology graduate program here at Virginia Tech.
Each year the psychology department carefully selects a handful of in-coming grad
students to work as Intro Psych recitation instructors. This is a highly sought after assistantship because it pays for the grad students’ tuition, and it also gives them a stipend on which to live. This teaching assistantship is also highly sought after because it gives the grad students invaluable teaching experience, and this teaching experience is very important to those students who one day want to become professors. The five students’ who you will be evaluating today, have all been selected as candidates for the TA position because they have all expressed strong interest in becoming psychology professors once they receive their degree. Unfortunately, there are only three TA positions available for next fall, and so the psychology department has to make a decision about which three to hire.
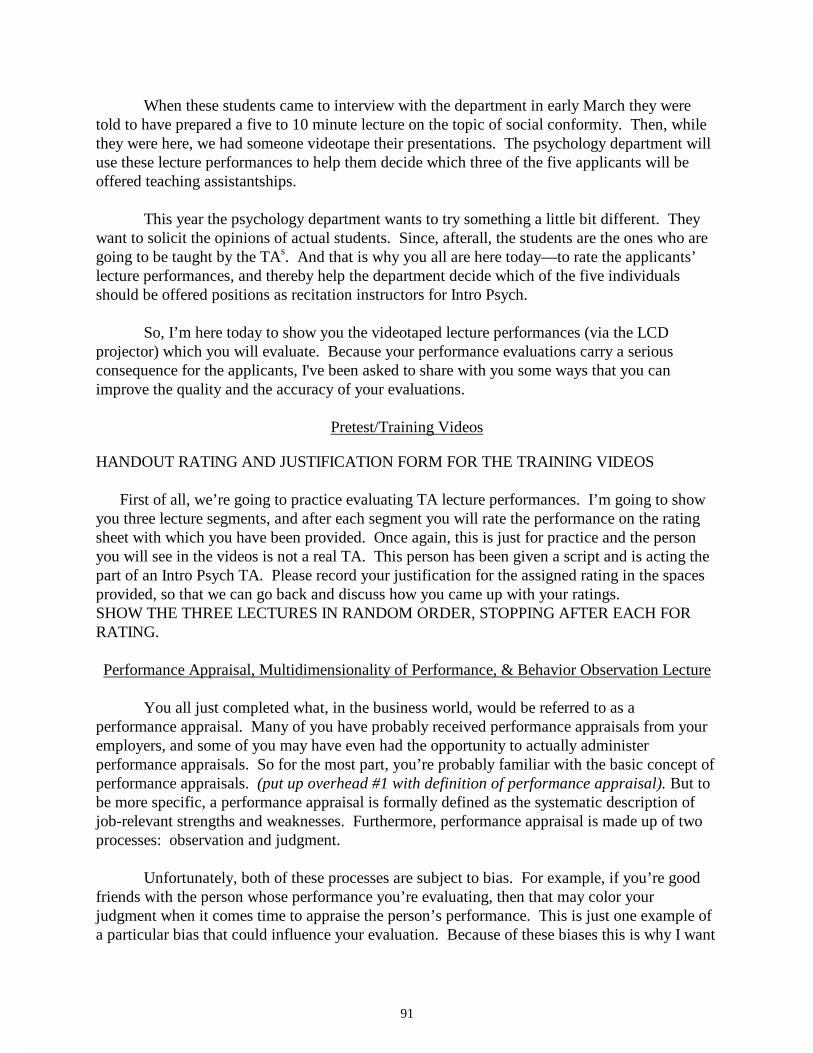
91
When these students came to interview with the department in early March they were told to have prepared a five to 10 minute lecture on the topic of social conformity. Then, while they were here, we had someone videotape their presentations. The psychology department will use these lecture performances to help them decide which three of the five applicants will be offered teaching assistantships.
This year the psychology department wants to try something a little bit different. They
want to solicit the opinions of actual students. Since, afterall, the students are the ones who are going to be taught by the TAs. And that is why you all are here today—to rate the applicants’ lecture performances, and thereby help the department decide which of the five individuals should be offered positions as recitation instructors for Intro Psych.
So, I’m here today to show you the videotaped lecture performances (via the LCD
projector) which you will evaluate. Because your performance evaluations carry a serious consequence for the applicants, I've been asked to share with you some ways that you can improve the quality and the accuracy of your evaluations.
Pretest/Training Videos
HANDOUT RATING AND JUSTIFICATION FORM FOR THE TRAINING VIDEOS
First of all, we’re going to practice evaluating TA lecture performances. I’m going to show
you three lecture segments, and after each segment you will rate the performance on the rating sheet with which you have been provided. Once again, this is just for practice and the person you will see in the videos is not a real TA. This person has been given a script and is acting the part of an Intro Psych TA. Please record your justification for the assigned rating in the spaces provided, so that we can go back and discuss how you came up with your ratings. SHOW THE THREE LECTURES IN RANDOM ORDER, STOPPING AFTER EACH FOR RATING. Performance Appraisal, Multidimensionality of Performance, & Behavior Observation Lecture
You all just completed what, in the business world, would be referred to as a
performance appraisal. Many of you have probably received performance appraisals from your employers, and some of you may have even had the opportunity to actually administer performance appraisals. So for the most part, you’re probably familiar with the basic concept of performance appraisals. (put up overhead #1 with definition of performance appraisal). But to be more specific, a performance appraisal is formally defined as the systematic description of job-relevant strengths and weaknesses. Furthermore, performance appraisal is made up of two processes: observation and judgment.
Unfortunately, both of these processes are subject to bias. For example, if you’re good
friends with the person whose performance you’re evaluating, then that may color your judgment when it comes time to appraise the person’s performance. This is just one example of a particular bias that could influence your evaluation. Because of these biases this is why I want

92
to take some time to familiarize you with the rating process, and give you a chance to do some practice ratings.
Now going back to your practice rating forms, notice that there are four different
dimensions of performance on which you were asked to evaluate the TA. You may have thought to yourself, “why is it necessary to make so many ratings for each person? Shouldn’t an overall performance rating be enough?” The answer is that one overall rating is probably not enough to capture the quality of the performance. This is because the job of a lecture TA, like most jobs, is not unidimensional—it’s multidimensional. And by that I mean that there are many different facets that make-up the job of a lecture TA. Because the job is multidimensional, this means that the lecturer could be strong in certain dimensions of performance, but weak on other dimensions of performance. And that’s why I asked you to rate the TA on 3 dimensions of performance: (1) organization, (2) delivery, and (3) depth of knowledge, in addition to an overall rating.
A good performance appraisal system, however, cannot be built solely upon a rating form
which sufficiently describes the various dimensions of performance. In order for performance ratings to give an accurate portrayal of a person’s performance, the rater must pay close attention to the person’s performance. And because the lecture performance is multidimensional, the person who is evaluating the TA needs to attend to as much of the person’s specific behaviors as is possible. That is, in order for you to be good evaluators of performance, you need to pay close attention to the specific things the lecturer says and does. Being a good observer, and making evaluations on each dimension of performance is the first step towards accurate and useful performance evaluations.
General Lecture Behaviors and Dimensions Discussion
Now that I have talked about the general nature of the performance appraisal process, I’d now like to talk more about specific lecture TA behaviors. Thinking back to what you observed in the three practice videos, and using your general knowledge and past experience with lecture TAs, I want us all to identify a range of lecture TA behaviors. SPEND A COUPLE OF MINUTES WRITING DOWN THEIR IDEAS ON THE CHALKBOARD. (put up overhead #2 of TA behaviors) Here are some other examples of TA behaviors that we will be referring to during this training session (read each example)
• Teacher has good voice inflection • Teacher forgets to bring the answers to the in-class homework assignment • Teacher doesn’t know the answers to questions students ask • Teacher has poor posture • Teacher is a couple of minutes late for class • Teacher is able to perform experiments in class to illustrate concepts • Teacher doesn’t talk loud enough • Teacher brings handouts to class for students • Teacher doesn’t know the correct pronunciation of a researcher’s name whose study he/she
is lecturing about
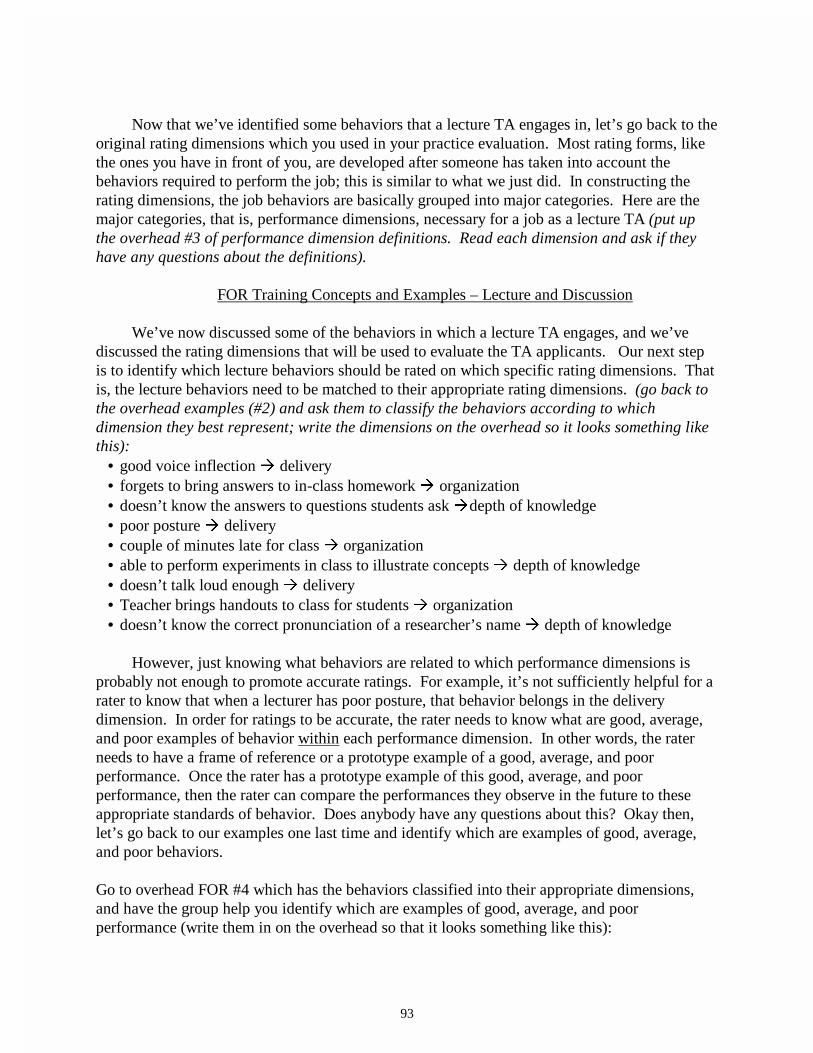
93
Now that we’ve identified some behaviors that a lecture TA engages in, let’s go back to the
original rating dimensions which you used in your practice evaluation. Most rating forms, like the ones you have in front of you, are developed after someone has taken into account the behaviors required to perform the job; this is similar to what we just did. In constructing the rating dimensions, the job behaviors are basically grouped into major categories. Here are the major categories, that is, performance dimensions, necessary for a job as a lecture TA (put up the overhead #3 of performance dimension definitions. Read each dimension and ask if they have any questions about the definitions).
FOR Training Concepts and Examples – Lecture and Discussion
We’ve now discussed some of the behaviors in which a lecture TA engages, and we’ve discussed the rating dimensions that will be used to evaluate the TA applicants. Our next step is to identify which lecture behaviors should be rated on which specific rating dimensions. That is, the lecture behaviors need to be matched to their appropriate rating dimensions. (go back to the overhead examples (#2) and ask them to classify the behaviors according to which dimension they best represent; write the dimensions on the overhead so it looks something like this):
• good voice inflection Æ delivery • forgets to bring answers to in-class homework Æ organization • doesn’t know the answers to questions students ask Ædepth of knowledge • poor posture Æ delivery • couple of minutes late for class Æ organization • able to perform experiments in class to illustrate concepts Æ depth of knowledge • doesn’t talk loud enough Æ delivery • Teacher brings handouts to class for students Æ organization • doesn’t know the correct pronunciation of a researcher’s name Æ depth of knowledge
However, just knowing what behaviors are related to which performance dimensions is
probably not enough to promote accurate ratings. For example, it’s not sufficiently helpful for a rater to know that when a lecturer has poor posture, that behavior belongs in the delivery dimension. In order for ratings to be accurate, the rater needs to know what are good, average, and poor examples of behavior within each performance dimension. In other words, the rater needs to have a frame of reference or a prototype example of a good, average, and poor performance. Once the rater has a prototype example of this good, average, and poor performance, then the rater can compare the performances they observe in the future to these appropriate standards of behavior. Does anybody have any questions about this? Okay then, let’s go back to our examples one last time and identify which are examples of good, average, and poor behaviors. Go to overhead FOR #4 which has the behaviors classified into their appropriate dimensions, and have the group help you identify which are examples of good, average, and poor performance (write them in on the overhead so that it looks something like this):

94
Organization • Forgets to bring answers to homework assignment (poor) • Couple of minutes late to class (average) • Teacher brings handouts to class for students (good) Delivery • Good voice inflection (good) • Poor posture (average) • Doesn’t speak loud enough (poor) Depth of Knowledge • Doesn’t know answers to students’ questions (poor) • Able to perform in-class experiments that illustrate lecture concepts (good) • Doesn’t know correct pronunciation of a researcher’s name who’s study he/she is lecturing
about (average)
Recap What’s Been Covered Thus Far
(overhead FOR #5 of what we’ve covered so far) Okay, so we’ve learned that rater accuracy is fostered by (1) being an attentive observer of what the ratee (person being evaluated) says and does in the line of work, (2) making ratings for each performance dimension, (3) identifying job-relevant behaviors, (4) clearly defining the dimensions of performance (5) knowing which behaviors correspond to which performance dimensions, and (6) having a prototype example of a good, average, and poor performance.
Now, the three practice lectures that you watched earlier will serve as your prototype
example of a good, average, and poor lecture performance. A group of expert raters, previously evaluated these three lectures and came up with a set of “target” performance ratings. We’ll next compare your ratings to the target ratings so that you can see how close your scores are to the target scores. You’ll see that there are some similarities and some differences between your ratings and the target ratings. Our goal is to reduce these differences so that you all rate very similarly to the target performance ratings. I’ll now collect your rating forms and record your ratings on the overhead so that we can compare everyone’s ratings to the target scores. GIVE THE GROUP A 10 MINUTE BREAK, AND WHILE THEY’RE ON BREAK WRITE DOWN THEIR RATINGS ON THE APPROPRIATE OVERHEADS (FOR #6).
Expert Judges Behavioral Rationale and Pretest Rating Feedback via FOR Concepts AFTER BREAK HAND BACK THEIR RATING FORMS
Before we get into a discussion about the similarities and differences between your ratings and the target ratings, I first want to explain to you the expert judges’ behavioral rationale for their ratings. Poor Ratee: (make sure you are describing these in the same order in which they watched the videos)

95
Organization – target rating = 31, Behaviors: (1) skips around -- starts talking about long-term memory and then goes back to STM and talks about how much information it can hold; (2) forgets some notes—towards the end of the lecture he tries to find a diagram, but realizes he’s forgotten it.
Delivery – target rating = 22, Behaviors: (1) stuttering and stumbling over words; halted speech; (2) inappropriate body language -- grabs neck and scratches head (fidgety) Depth of Knowledge – target rating = 24, Behaviors: (1) very shallow explanation of concepts—basically only tells us the definition of things; (2) forgets the name of a concept he’s trying to explain Overall Rating – 25
After you’ve gone through the experts’ behavioral rationale for the Poor Ratee, display the overhead with everyone’s ratings on it. You can see that there are some similarities and some differences between your ratings and these target score ratings. Our goal is to reduce the differences so that you all rate very similarly to the target performance ratings. Let’s take a look at each of your ratings individually. FOR EACH RATER: • ASK THE RATER TO READ OR DESCRIBE THEIR REASONS FOR THE WAY IN
WHICH THEY RATED EACH OF THE THREE LECTURES • ASK THE GROUP HOW ON TARGET THE RATER’S BEHAVIORAL RATIONALE
WAS FOR EACH OF THE THREE RATEES • AS THE TRAINER, MAKE SURE EACH SPECIFIC RATING IS DISCUSSED IN ITS
SIMILARITY OR DISCREPANCY FROM THE TARGET PERFORMANCE RATING. MAKE SURE REASONS ARE IDENTIFIED FOR BOTH SIMILARITIES AND DIFFERENCES.
• NOTE: DO THIS FOR EACH RATEE! Average Ratee:
Organization – target rating = 45, Behaviors: (1) gets off the subject—starts talking about his allergies; (2) overhead transparencies upside down & backwards Delivery – target rating = 48, Behaviors: (1) chewing gum; (2) laid back presentation style Depth of Knowledge – target rating = 52, Behaviors: (1) is able to report an exception to a general research finding – tells us that there are exceptions where people can remember more than 7 +/- 2 bits of information; (2) reads from textbook – can’t remember the names or definitions for auditory sensory memory and visual sensory memory so has to read it from the textbook Overall – 50
Good Ratee:
Organization – target rating = 92, Behaviors: (1) notes and overheads are in order; (2) provides a good summary of the main points

96
Delivery – target rating = 90, Behaviors: (1) expresses enthusiasm in the subject; (2) good voice inflection Depth of Knowledge – target rating = 91, Behaviors: (1) cites the names of researchers associated with the concepts; (2) provides supplementary information – in addition to citing research, provides a second definition of sensory memory from a different textbook, tells us about chunking (a way to expand our STM capacity), tells us about levels of processing (i.e., shallow vs. deep processing) Overall – target rating = 92
Summary of Training
Okay, that wraps up our training and practice session. Now you’re ready to evaluate the applicants. But before we do that, I want to briefly summarize the main points in our discussion on improving the accuracy of performance ratings.
First of all, when I mention the phrases: frame of reference, performance standard, and
prototypical example, to what am I referring? (knowing job-relevant behavioral examples of various levels of performance)
What are some of the ways in which you learned more about the accurate frame of
reference for the job of a lecture TA? (1. talked about examples of actual lecture behaviors; 2. shown examples of good, average, and poor lecture performance; 3. Informed of the target ratings for those performances along with an explanation of reasons for those ratings; 4. got feedback about how well you did in comparison to the target ratings).
What did you get out of practicing? And then receiving feedback? (hopefully you honed
in on the performance standards) And the most important question, how can you improve the quality of your ratings? (1.
Observe all job-relevant behavior; 2. know the rating dimensions; 3. Use the performance standards, i.e., prototype, you’ve acquired for each performance dimension).
Posttest/Evaluation of the “Real” TAs
(hand out rating forms) It’s now time to rate the real applicants on their lecture performance. It’s important that I emphasize that the reason for doing these ratings is help the psychology department decide which of the five applicants should be awarded positions as recitation instructors for Intro Psych. Once again, please take this task very seriously because it has important implications for the applicants’ funding. SHOW THE FIVE PERFORMANCES, STOPPING AFTER EACH FOR RATING. COLLECT THEIR RATING FORMS, AND HAND-OUT THE POST-TRAINING QUIZ.

97
Debriefing
Before you leave today, I need to inform you that the true purpose of today’s study was
not to determine which applicants should be awarded assistantships. The people you saw in the videos were actors from the theatre department. The true purpose of the study was two-fold. The first purpose was to determine if Frame-of-Reference training, the type of training you all just underwent, is an effective method for improving rating accuracy. The second purpose of the study, was to determine if individuals rate performance less accurately when they believe that their performance ratings have serious implications for the ratees. Any questions? Have them sign the debriefing informed consent. Sign extra credit materials. Make sure the intro students have filled out 3 orange opscans with their name, date, SS#, and 077 in the seat space. Thank them for their participation, and dismiss them.
98
Frame-of-Reference/Developmental Training Protocol
Materials • Business casual dress (i.e., look professional) • Training protocol for condition assigned to that session • Key to get into 4076 • Rater training CD-ROM • LCD projector (should already be in the room) • Overhead projector (should already be in the room) • Overhead transparencies • Transparency pen • Extra coding pencils • Training packet for the trainees • Orange extra credit opscans (enough for 4 opscans per person) • Informed consent forms—A “pre-debriefing” set and a “post-debriefing” set. If they need to
keep a copy give them the “pre-debriefing” consent form. • Video camera
Introduction DISTRIBUTE FIRST SET OF INFORMED CONSENT FORMS
Thank-you all for coming. Before we begin, I just want to let you know that today’s session will run for approximately 2 ½ hours, and because of its length you will be given a break.
Your purpose in being here today is to evaluate the lecture performance of five randomly
selected first-year graduate teaching assistants. These TAs all work for the psychology department as recitation instructors for Intro Psych. Now, as I’m sure you’re all aware, at the end of each semester students are asked to complete teacher evaluation forms. And although these evaluation forms can provide valuable feedback to the instructors, it’s become apparent that many students don’t really take the time to provide well-thought out responses, and as few as 5% of the students provide written comments at the end of the evaluation form. Consequently, the Intro Psych TAs have expressed that they would like to receive more concrete and specific feedback about their performance. They’re especially interested in getting some candid feedback about their strengths and weaknesses and what they need to do to improve their performance. And that’s why you are all here today—to provide that specific feedback to the Intro Psych TAs.
To give you some background, one week towards the end of last semester we went
around to the recitation classes and videotaped segments of the TAs actual lectures. All of the videotaping was done in the course of one week, so that all of the TAs would be lecturing on the same topic. The TAs in the department knew this project was going on, and they had all agreed

99
to participate. In fact, the TAs were very supportive of this project, because as I said earlier, they were the ones who first expressed interest in getting better feedback on their performance. Although the TAs knew this project was going on, they didn’t know which week the videographers were going to “drop-in” and videotape their lecture, nor did they know who would be randomly selected (obviously there wasn’t enough time to go around and film all the TAs). It was done this way, so that we could obtain a candid and accurate portrayal of the TAs
lecture performance. If the TAs had known ahead of time that they were going to be filmed, then they may have prepared and performed differently.
So today I’ll show you (via the LCD projector) segments of each of the TAs lecture
performances. Unfortunately, we don’t have time to show you the whole lecture, but this should give you a pretty good impression about how the person is doing. Before you rate the lectures, however, I first want to share with you some ways that you can improve the quality and the accuracy of your evaluations.
Pretest/Training Video
HANDOUT RATING AND JUSTIFICATION FORM FOR THE TRAINING VIDEOS
First of all, we’re going to practice evaluating TA lecture performances. I’m going to show
you three lecture segments, and after each segment you will rate the performance on the rating sheet with which you have been provided. Once again, this is just for practice and the person you will see in the videos is not a real TA. This person has been given a script and is acting the part of an Intro Psych TA. Please record your justification for the assigned rating in the spaces provided, so that we can go back and discuss how you came up with your ratings. SHOW THE THREE LECTURES IN RANDOM ORDER, STOPPING AFTER EACH FOR RATING. Performance Appraisal, Multidimensionality of Performance, & Behavior Observation Lecture
You all just completed what, in the business world, would be referred to as a
performance appraisal. Many of you have probably received performance appraisals from your employers, and some of you may have even had the opportunity to actually administer performance appraisals. So for the most part, you’re probably familiar with the basic concept of performance appraisals. (put up overhead #1 with definition of performance appraisal). But to be more specific, a performance appraisal is formally defined as the systematic description of job-relevant strengths and weaknesses. Furthermore, performance appraisal is made up of two processes: observation and judgment.
Unfortunately, both of these processes are subject to bias. For example, if you’re good
friends with the person whose performance you’re evaluating, then that may color your judgment when it comes time to appraise the person’s performance. This is just one example of a particular bias that could influence your evaluation. Because of these biases this is why I want

100
to take some time to familiarize you with the rating process, and give you a chance to do some practice ratings.
Now going back to your practice rating forms, notice that there are four different
dimensions of performance on which you were asked to evaluate the TA. You may have thought to yourself, “why is it necessary to make so many ratings for each person? Shouldn’t an overall performance rating be enough?” The answer is that one overall rating is probably not enough to capture the quality of the performance. This is because the job of a lecture TA, like most jobs, is not unidimensional—it’s multidimensional. And by that I mean that there are many different facets that make-up the job of a lecture TA. Because the job is multidimensional, this means that the lecturer could be strong in certain dimensions of performance, but weak on other dimensions of performance. And that’s why I asked you to rate the TA on 3 dimensions of performance: (1) organization, (2) delivery, and (3) depth of knowledge, in addition to an overall rating.
A good performance appraisal system, however, cannot be built solely upon a rating form
which sufficiently describes the various dimensions of performance. In order for performance ratings to give an accurate portrayal of a person’s performance, the rater must pay close attention to the person’s performance. And because the lecture performance is multidimensional, the person who is evaluating the TA needs to attend to as much of the person’s specific behaviors as is possible. That is, in order for you to be good evaluators of performance, you need to pay close attention to the specific things the lecturer says and does. Being a good observer, and making evaluations on each dimension of performance is the first step towards accurate and useful performance evaluations.
General Lecture Behaviors and Dimensions Discussion
Now that I have talked about the general nature of the performance appraisal process, I’d now like to talk more about specific lecture TA behaviors. Thinking back to what you observed in the three practice videos, and using your general knowledge and past experience with lecture TAs, I want us all to identify a range of lecture TA behaviors. SPEND A COUPLE OF MINUTES WRITING DOWN THEIR IDEAS ON THE CHALKBOARD. (put up overhead #2 of TA behaviors) Here are some other examples of TA behaviors that we will be referring to during this training session (read each example)
• Teacher has good voice inflection • Teacher forgets to bring the answers to the in-class homework assignment • Teacher doesn’t know the answers to questions students ask • Teacher has poor posture • Teacher is a couple of minutes late for class • Teacher is able to perform experiments in class to illustrate concepts • Teacher doesn’t talk loud enough • Teacher brings handouts to class for students • Teacher doesn’t know the correct pronunciation of a researcher’s name whose study he/she
is lecturing about

101
Now that we’ve identified some behaviors that a lecture TA engages in, let’s go back to the
original rating dimensions which you used in your practice evaluation. Most rating forms, like the ones you have in front of you, are developed after someone has taken into account the behaviors required to perform the job; this is similar to what we just did. In constructing the rating dimensions, the job behaviors are basically grouped into major categories. Here are the major categories, that is, performance dimensions, necessary for a job as a lecture TA (put up the overhead #3 of performance dimension definitions. Read each dimension and ask if they have any questions about the definitions).
FOR Training Concepts and Examples – Lecture and Discussion
We’ve now discussed some of the behaviors in which a lecture TA engages, and we’ve discussed the rating dimensions that will be used to evaluate the TA applicants. Our next step is to identify which lecture behaviors should be rated on which specific rating dimensions. That is, the lecture behaviors need to be matched to their appropriate rating dimensions. (go back to the overhead examples (#2) and ask them to classify the behaviors according to which dimension they best represent; write the dimensions on the overhead so it looks something like this):
• good voice inflection Æ delivery • forgets to bring answers to in-class homework Æ organization • doesn’t know the answers to questions students ask Ædepth of knowledge • poor posture Æ delivery • couple of minutes late for class Æ organization • able to perform experiments in class to illustrate concepts Æ depth of knowledge • doesn’t talk loud enough Æ delivery • Teacher brings handouts to class for students Æ organization • doesn’t know the correct pronunciation of a researcher’s name Æ depth of knowledge
However, just knowing what behaviors are related to which performance dimensions is probably not enough to promote accurate ratings. For example, it’s not sufficiently helpful for a rater to know that when a lecturer has poor posture, that behavior belongs in the delivery dimension. In order for ratings to be accurate, the rater needs to know what are good, average, and poor examples of behavior within each performance dimension. In other words, the rater needs to have a frame of reference or a prototype example of a good, average, and poor performance. Once the rater has a prototype example of this good, average, and poor performance, then the rater can compare the performances they observe in the future to these appropriate standards of behavior. Does anybody have any questions about this? Okay then, let’s go back to our examples one last time and identify which are examples of good, average, and poor behaviors. Go to overhead FOR #4 which has the behaviors classified into their appropriate dimensions, and have the group help you identify which are examples of good, average, and poor performance (write them in on the overhead so that it looks something like this): Organization

102
• Forgets to bring answers to homework assignment (poor) • Couple of minutes late to class (average) • Teacher brings handouts to class for students (good) Delivery • Good voice inflection (good) • Poor posture (average) • Doesn’t speak loud enough (poor) Depth of Knowledge • Doesn’t know answers to students’ questions (poor) • Able to perform in-class experiments that illustrate lecture concepts (good) • Doesn’t know correct pronunciation of a researcher’s name who’s study he/she is lecturing
about (average)
Recap What’s Been Covered Thus Far
(overhead FOR #5 of what we’ve covered so far) Okay, so we’ve learned that rater accuracy is fostered by (1) being an attentive observer of what the ratee (person being evaluated) says and does in the line of work, (2) making ratings for each performance dimension, (3) identifying job-relevant behaviors, (4) clearly defining the dimensions of performance (5) knowing which behaviors correspond to which performance dimensions, and (6) having a prototype example of a good, average, and poor performance.
Now, the three practice lectures that you watched earlier will serve as your prototype
example of a good, average, and poor lecture performance. A group of expert raters, previously evaluated these three lectures and came up with a set of “target” performance ratings. We’ll next compare your ratings to the target ratings so that you can see how close your scores are to the target scores. You’ll see that there are some similarities and some differences between your ratings and the target ratings. Our goal is to reduce these differences so that you all rate very similarly to the target performance ratings. I’ll now collect your rating forms and record your ratings on the overhead so that we can compare everyone’s ratings to the target scores. GIVE THE GROUP A 10 MINUTE BREAK, AND WHILE THEY’RE ON BREAK WRITE DOWN THEIR RATINGS ON THE APPROPRIATE OVERHEADS (FOR #6).
Expert Judges Behavioral Rationale and Pretest Rating Feedback via FOR Concepts AFTER BREAK HAND BACK THEIR RATING FORMS
Before we get into a discussion about the similarities and differences between your ratings and the target ratings, I first want to explain to you the expert judges’ behavioral rationale for their ratings. Poor Ratee: (make sure you are describing these in the same order in which they watched the videos)

103
Organization – target rating = 31, Behaviors: (1) skips around -- starts talking about long-term memory and then goes back to STM and talks about how much information it can hold; (2) forgets some notes—towards the end of the lecture he tries to find a diagram, but realizes he’s forgotten it. Delivery – target rating = 22, Behaviors: (1) stuttering and stumbling over words; halted speech; (2) inappropriate body language -- grabs neck and scratches head (fidgety) Depth of Knowledge – target rating = 24, Behaviors: (1) very shallow explanation of concepts—basically only tells us the definition of things; (2) forgets the name of a concept he’s trying to explain Overall Rating – 25
After you’ve gone through the experts’ behavioral rationale for the Poor Ratee, display the overhead with everyone’s ratings on it. You can see that there are some similarities and some differences between your ratings and these target score ratings. Our goal is to reduce the differences so that you all rate very similarly to the target performance ratings. Let’s take a look at each of your ratings individually. FOR EACH RATER: • ASK THE RATER TO READ OR DESCRIBE THEIR REASONS FOR THE WAY IN
WHICH THEY RATED EACH OF THE THREE LECTURES • ASK THE GROUP HOW ON TARGET THE RATER’S BEHAVIORAL RATIONALE
WAS FOR EACH OF THE THREE RATEES • AS THE TRAINER, MAKE SURE EACH SPECIFIC RATING IS DISCUSSED IN ITS
SIMILARITY OR DISCREPANCY FROM THE TARGET PERFORMANCE RATING. MAKE SURE REASONS ARE IDENTIFIED FOR BOTH SIMILARITIES AND DIFFERENCES.
• NOTE: DO THIS FOR EACH RATEE! Average Ratee:
Organization – target rating = 45, Behaviors: (1) gets off the subject—starts talking about his allergies; (2) overhead transparencies upside down & backwards Delivery – target rating = 48, Behaviors: (1) chewing gum; (2) laid back presentation style Depth of Knowledge – target rating = 52, Behaviors: (1) is able to report an exception to a general research finding – tells us that there are exceptions where people can remember more than 7 +/- 2 bits of information; (2) reads from textbook – can’t remember the names or definitions for auditory sensory memory and visual sensory memory so has to read it from the textbook Overall – 50
Good Ratee:
Organization – target rating = 92, Behaviors: (1) notes and overheads are in order; (2) provides a good summary of the main points

104
Delivery – target rating = 90, Behaviors: (1) expresses enthusiasm in the subject; (2) good voice inflection Depth of Knowledge – target rating = 91, Behaviors: (1) cites the names of researchers associated with the concepts; (2) provides supplementary information – in addition to citing research, provides a second definition of sensory memory from a different textbook, tells us about chunking (a way to expand our STM capacity), tells us about levels of processing (i.e., shallow vs. deep processing) Overall – target rating = 92
Summary of Training
Okay, that wraps up our training and practice session. Now you’re ready to evaluate the applicants. But before we do that, I want to briefly summarize the main points in our discussion on improving the accuracy of performance ratings.
First of all, when I mention the phrases: frame of reference, performance standard, and
prototypical example, to what am I referring? (knowing job-relevant behavioral examples of various levels of performance)
What are some of the ways in which you learned more about the accurate frame of
reference for the job of a lecture TA? (1. talked about examples of actual lecture behaviors; 2. shown examples of good, average, and poor lecture performance; 3. Informed of the target ratings for those performances along with an explanation of reasons for those ratings; 4. got feedback about how well you did in comparison to the target ratings).
What did you get out of practicing? And then receiving feedback? (hopefully you honed
in on the performance standards) And the most important question, how can you improve the quality of your ratings? (1.
Observe all job-relevant behavior; 2. know the rating dimensions; 3. Use the performance standards, i.e., prototype, you’ve acquired for each performance dimension).
Evaluation of the “Real” TAs
(hand out rating forms) It’s now time to rate the real TAs on their lecture performance. It’s important that I emphasize that the reason for doing these ratings is so that the TA’s can receive feedback about their lecture performance, specifically on their strengths and weaknesses. The TAs are the only ones who will have access to this information—their supervisors will NOT see the ratings you assign. Once again, these ratings are strictly for the benefit of the TAs so that they can hone in on their teaching skills. SHOW THE FIVE PERFORMANCES, STOPPING AFTER EACH FOR RATING. COLLECT THEIR RATING FORMS, AND HAND-OUT THE POST-TRAINING QUIZ.

105
Debriefing
Before you leave today, I need to inform you that the true purpose of today’s study was
not to provide intro psych TAs with performance feedback. The people you saw in the videos were actors from the theatre department. The true purpose of the study was two-fold. The first purpose of the study was to determine if Frame-of-Reference training, the type of training you all just underwent, is an effective method for improving rating accuracy. The second purpose of the study, was to determine if individuals rate performance more accurately if they believe that their performance ratings will only be used to provide feedback, and not be used by the person’s supervisor for determining rewards and punishments. Any questions? Have them sign the debriefing informed consent. Sign extra credit materials. Make sure the intro students have filled out 3 orange opscans with their name, date, SS#, and 077 in the seat space. Thank them for their participation, and dismiss them.
106
Rater Variability Training/Administrative Training Protocol
Materials • Business casual dress (i.e., look professional) • Training protocol for condition assigned to that session • Key to get into 4076 • Rater training CD-ROM • LCD projector (should already be in the room) • Overhead projector (should already be in the room) • Overhead transparencies • Transparency pen • Extra coding pencils • Training packet for the trainees • Orange extra credit opscans (enough for 4 opscans per person) • Informed consent forms—on set “pre-debriefing” and one set debriefing • Video camera
Introduction DISTRIBUTE FIRST SET OF INFORMED CONSENT FORMS Thank-you all for coming. Before we begin, I just want to let you know that today’s session will run for approximately 2 ½ hours, and because of its length you will be given a break.
Your purpose in being here today is to evaluate the lecture performance of five
individuals who are applying for assistantships as recitation instructors in Introductory Psychology for the upcoming Fall semester. Currently these five applicants are all college seniors who have been accepted into the psychology graduate program here at Virginia Tech.
Each year the psychology department carefully selects a handful of in-coming grad
students to work as Intro Psych recitation instructors. This is a highly sought after assistantship because it pays for the grad students’ tuition, and it also gives them a stipend on which to live. This teaching assistantship is also highly sought after because it gives the grad students invaluable teaching experience, and this teaching experience is very important to those students who one day want to become professors. The five students’ who you will be evaluating today, have all been selected as candidates for the TA position because they have all expressed strong interest in becoming psychology professors once they receive their degree. Unfortunately, there are only three TA positions available for next fall, and so the psychology department has to make a decision about which three to hire.
When these students came to interview with the department in early March they were
told to have prepared a five to 10 minute lecture on the topic of social conformity. Then, while they were here, we had someone videotape their presentations. The psychology department will

107
use these lecture performances to help them decide which three of the five applicants will be offered teaching assistantships.
This year the psychology department wants to try something a little bit different. They
want to solicit the opinions of actual students. Since, afterall, the students are the ones who are going to be taught by the TAs. And that is why you all are here today—to rate the applicants’ lecture performances, and thereby help the department decide which of the five individuals should be offered positions as recitation instructors for Intro Psych.
So, I’m here today to show you the videotaped lecture performances (via the LCD
projector) which you will evaluate. Because your performance evaluations carry a serious consequence for the applicants, I've been asked to share with you some ways that you can improve the quality and the accuracy of your evaluations.
Pretest/Training Videos
HANDOUT RATING AND JUSTIFICATION FORM FOR THE TRAINING VIDEOS
First of all, we’re going to practice evaluating TA lecture performances. I’m going to show
you three lecture segments, and after each segment you will rate the performance on the rating sheet with which you have been provided. Once again, this is just for practice and the person you will see in the videos is not a real TA. This person has been given a script and is acting the part of an Intro Psych TA. Please record your justification for the assigned rating in the spaces provided, so that we can go back and discuss how you came up with your ratings. SHOW THE THREE LECTURES IN RANDOM ORDER, STOPPING AFTER EACH FOR RATING. Performance Appraisal, Multidimensionality of Performance, & Behavior Observation Lecture
You all just completed what, in the business world, would be referred to as a
performance appraisal. Many of you have probably received performance appraisals from your employers, and some of you may have even had the opportunity to actually administer performance appraisals. So for the most part, you’re probably familiar with the basic concept of performance appraisals. (put up overhead #1 with definition of performance appraisal). But to be more specific, a performance appraisal is formally defined as the systematic description of job-relevant strengths and weaknesses. Furthermore, performance appraisal is made up of two processes: observation and judgment.
Unfortunately, both of these processes are subject to bias. For example, if you’re good
friends with the person whose performance you’re evaluating, then that may color your judgment when it comes time to appraise the person’s performance. This is just one example of a particular bias that could influence your evaluation. Because of these biases this is why I want to take some time to familiarize you with the rating process, and give you a chance to do some practice ratings.

108
Now going back to your practice rating forms, notice that there are four different dimensions of performance on which you were asked to evaluate the TA. You may have thought to yourself, “why is it necessary to make so many ratings for each person? Shouldn’t an overall performance rating be enough?” The answer is that one overall rating is probably not enough to capture the quality of the performance. This is because the job of a lecture TA, like most jobs, is not unidimensional—it’s multidimensional. And by that I mean that there are many different facets that make-up the job of a lecture TA. Because the job is multidimensional, this means that the lecturer could be strong in certain dimensions of performance, but weak on other dimensions of performance. And that’s why I asked you to rate the TA on 3 dimensions of performance: (1) organization, (2) delivery, and (3) depth of knowledge, in addition to an overall rating.
A good performance appraisal system, however, cannot be built solely upon a rating form
which sufficiently describes the various dimensions of performance. In order for performance ratings to give an accurate portrayal of a person’s performance, the rater must pay close attention to the person’s performance. And because the lecture performance is multidimensional, the person who is evaluating the TA needs to attend to as much of the person’s specific behaviors as is possible. That is, in order for you to be good evaluators of performance, you need to pay close attention to the specific things the lecturer says and does. Being a good observer, and making evaluations on each dimension of performance is the first step towards accurate and useful performance evaluations.
General Lecture Behaviors and Dimensions Discussion
Now that I have talked about the general nature of the performance appraisal process, I’d now like to talk more about specific lecture TA behaviors. Thinking back to what you observed in the three practice videos, and using your general knowledge and past experience with lecture TAs, I want us all to identify a range of lecture TA behaviors. SPEND A COUPLE OF MINUTES WRITING DOWN THEIR IDEAS ON THE CHALKBOARD. (put up overhead #2 of TA behaviors) Here are some other examples of TA behaviors (read each example):
• Teacher has good voice inflection • Teacher forgets to bring the answers to the in-class homework assignment • Teacher doesn’t know the answers to questions students ask • Teacher has poor posture • Teacher is a couple of minutes late for class • Teacher is able to perform experiments in class to illustrate concepts • Teacher doesn’t talk loud enough • Teacher brings handouts to class for students • Teacher doesn’t know the correct pronunciation of a researcher’s name who’s study he/she is
lecturing about Now that we’ve identified some behaviors that a lecture TA engages in, let’s go back to the
original rating dimensions which you used in your practice evaluation. Most rating forms, like
109
the ones you have in front of you, are developed after someone has taken into account the behaviors required to perform the job; this is similar to what we just did. In constructing the rating dimensions, the job behaviors are basically grouped into major categories. Here are the major categories, that is, performance dimensions, necessary for a job as a lecture TA (put up the overhead # 3 of performance dimension definitions. Read each dimension and ask if they have any questions about the definitions).
RVT Training Concepts and Examples – Lecture and Discussion
We’ve now discussed some of the behaviors in which a lecture TA engages, and we’ve
discussed the rating dimensions that will be used to evaluate the real applicants. The ability to discern the adequacy or the inadequacy of each individual’s performance on these dimensions is important because it indicates something about the aptitude of each applicant. However, it only tells us part of the story. We really need to be able to determine variability between applicants so that we can determine which one is the best. Having you rate the lecture performance of these applicants will not do the psychology department any good, if at the end of the evaluation, the department can’t make a decision about which three of the five applicants should be given assistantships.
Imagine that you need to sort pebbles by size, and you do this by passing them through a
sieve. If the holes in the sieve are so large that every pebble passes through, then the sieve has failed to distinguish between the pebbles. Similarly, if this performance appraisal task fails to distinguish between applicants, then the evaluation will have been a wasted effort. Consequently, the goal of performance appraisals is to make distinctions among the people being evaluated. In order for performance appraisal to differentiate between applicants, we need to tighten the performance standards and develop behavioral examples that allow the evaluators to discern differences between the applicants. A good evaluator should be able to compare applicants in terms of who is the best and who is the worst, so that he/she can rank order the applicants from best performance to worst performance.
Any questions? Considering the three specific performance dimensions (organization, delivery, and depth
of knowledge), I would like for you to describe the performance of three TAs that we could rank order from best to worst.
Let’s start with the best performance first; what would be an example of a good
organizational behavior? (May want to refer back to the overhead that shows examples of TA behaviors---- e.g., brings handouts to class for students); what would be an example of a good delivery behavior? (e.g., good voice inflection); what would be an example of a good depth of knowledge behavior? (e.g., ability to perform in-class experiments that illustrate lecture concepts).
Let’s next describe the other extreme—the worst performance. What would be an example
of a poor organizational behavior? (e.g., forgets to bring answers to the in-class homework

110
assignment); What would be an example of a poor delivery behavior? (e.g., doesn’t speak loud enough for the whole class to hear); What would be an example of a poor depth of knowledge behavior? (e.g., doesn’t know the answers to students’ questions).
Lastly, let’s describe a performance that falls somewhere in between these two extremes.
What would be an example of an average organizational behavior? (e.g., couple of minutes late to class); what would be an example of an average delivery behavior? (e.g., poor posture); what would be an example of an average depth of knowledge behavior? (e.g., doesn’t know the correct pronunciation of a researcher’s name whose study he/she is lecturing about).
Recap of What’s Been Covered Thus Far (overhead RVT #4 of what we’ve covered so far) Okay, so we’ve learned that rater
accuracy is fostered by (1) being an attentive observer of what the ratee (person being evaluated) says and does in the line of work, (2) making ratings for each performance dimension, (3) identifying job-relevant behaviors, (4) clearly defining the dimensions of performance, (5) looking for variability among ratees, and (6) comparing the differences between ratees.
The practice videos you watched earlier demonstrated variability between applicants.
There was an example of a good, average, and poor performance. A group of expert raters, previously evaluated these three practice lectures and came up with a set of “target” performance ratings. Our next step is to compare your ratings to the target ratings. I’ll now collect your rating forms and record your ratings on the overhead. GIVE THE GROUP A 10 MINUTE BREAK, AND WHILE THEY’RE ON BREAK WRITE DOWN THEIR RATINGS ON THE APPROPRIATE OVERHEADS (RVT #5).
Expert Judges Behavioral Rationale & Pretest Rating Feedback via RVT Concepts AFTER BREAK HAND BACK THEIR RATING FORMS
Before we get into a discussion about the similarities and differences between your ratings and the target ratings, I first want to explain to you the expert judges’ behavioral rationale for their ratings. Organization Dimension:
Poor Ratee -- target rating = 31, Behaviors: (1) skips around -- starts talking about long-term memory and then goes back to STM and talks about how much information it can hold; (2) forgets some notes—towards the end of the lecture he tries to find a diagram, but realizes he’s forgotten it. Average Ratee – target rating = 45, Behaviors: (1) gets off the subject – starts talking about his allergies; (2) overhead transparencies upside down & backwards Good Ratee – target rating = 92, Behaviors: (1) notes and overheads are in order; (2) provides a good summary of the main points
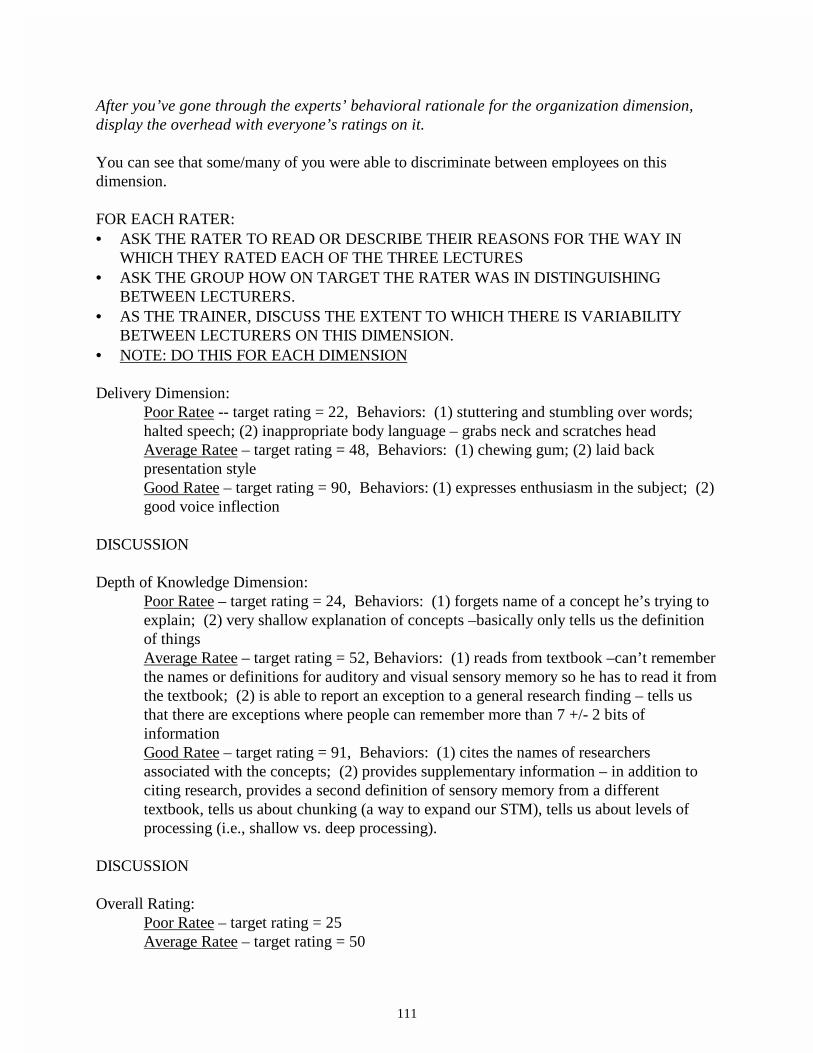
111
After you’ve gone through the experts’ behavioral rationale for the organization dimension, display the overhead with everyone’s ratings on it. You can see that some/many of you were able to discriminate between employees on this dimension. FOR EACH RATER: • ASK THE RATER TO READ OR DESCRIBE THEIR REASONS FOR THE WAY IN
WHICH THEY RATED EACH OF THE THREE LECTURES • ASK THE GROUP HOW ON TARGET THE RATER WAS IN DISTINGUISHING
BETWEEN LECTURERS. • AS THE TRAINER, DISCUSS THE EXTENT TO WHICH THERE IS VARIABILITY
BETWEEN LECTURERS ON THIS DIMENSION. • NOTE: DO THIS FOR EACH DIMENSION Delivery Dimension:
Poor Ratee -- target rating = 22, Behaviors: (1) stuttering and stumbling over words; halted speech; (2) inappropriate body language – grabs neck and scratches head Average Ratee – target rating = 48, Behaviors: (1) chewing gum; (2) laid back presentation style Good Ratee – target rating = 90, Behaviors: (1) expresses enthusiasm in the subject; (2) good voice inflection
DISCUSSION Depth of Knowledge Dimension:
Poor Ratee – target rating = 24, Behaviors: (1) forgets name of a concept he’s trying to explain; (2) very shallow explanation of concepts –basically only tells us the definition of things Average Ratee – target rating = 52, Behaviors: (1) reads from textbook –can’t remember the names or definitions for auditory and visual sensory memory so he has to read it from the textbook; (2) is able to report an exception to a general research finding – tells us that there are exceptions where people can remember more than 7 +/- 2 bits of information Good Ratee – target rating = 91, Behaviors: (1) cites the names of researchers associated with the concepts; (2) provides supplementary information – in addition to citing research, provides a second definition of sensory memory from a different textbook, tells us about chunking (a way to expand our STM), tells us about levels of processing (i.e., shallow vs. deep processing).
DISCUSSION Overall Rating: Poor Ratee – target rating = 25 Average Ratee – target rating = 50

112
Good Ratee – target rating = 92 DISCUSSION
Summary of Training
Okay, that wraps up our training and practice session. Now you’re ready to evaluate the
applicants. But before we do that, I want to briefly summarize the main points in our discussion on improving the accuracy of performance ratings.
First of all, when I mention rater variability, what I am talking about? (behavioral
examples that allow raters to make distinctions between ratees) What are some of the ways we learned more about the importance of variability in
performance appraisal? (sieve analogy, viewed practice examples of a range of performances, got feedback about our practice ratings)
What did you get out of the practice feedback? (hopefully the ability to make distinctions
between employees) And the most important question, how can you improve the quality of your ratings? (be a
good observer of what the ratee says and does, make ratings for each performance dimension, look for variability between ratees, and compare the differences between ratees so that you can rank order them).
Posttest/Evaluation of the “Real” TAs
(hand out rating forms) It’s now time to rate the real applicants on their lecture performance. It’s important that I emphasize that the reason for doing these ratings is help the psychology department decide which of the five applicants should be awarded positions as recitation instructors for Intro Psych. Once again, please take this task very seriously because it has important implications for the applicants’ funding. SHOW THE FIVE PERFORMANCES, STOPPING AFTER EACH FOR RATING. COLLECT THEIR RATING FORMS, AND HAND-OUT THE POST-TRAINING QUIZ.
Debriefing
Before you leave today, I need to inform you that the true purpose of today’s study was not to determine which applicants should be awarded assistantships. The people you saw in the videos were actors from the theatre department. The true purpose of the study was two-fold. The first purpose was to determine if Rater Variability Training, the type of training you all just underwent, is an effective method for improving rating accuracy. The second purpose of the

113
study, was to determine if individuals rate performance less accurately when they believe that their performance ratings have serious implications for the ratees. Any questions? Have them sign the debriefing informed consent. Sign extra credit materials. Make sure the intro students have filled out 3 orange opscans with their name, date, SS#, and 077 in the seat space. Thank them for their participation, and dismiss them.

114
Rater Variability / Developmental Training Protocol
Materials • Business casual dress (i.e., look professional) • Training protocol for condition assigned to that session • Key to get into 4076 • Rater training CD-ROM • LCD projector (should already be in the room) • Overhead projector (should already be in the room) • Overhead transparencies • Transparency pen • Extra coding pencils • Training packet for the trainees • Orange extra credit opscans (enough for 4 opscans per person) • Informed consent forms—one set of “pre-debriefing” and one set of debriefing consent
forms • Video camera
Introduction DISTRIBUTE FIRST SET OF INFORMED CONSENT FORMS
Thank-you all for coming. Before we begin, I just want to let you know that today’s session will run for approximately 2 ½ hours, and because of its length you will be given a break.
Your purpose in being here today is to evaluate the lecture performance of five randomly
selected first-year graduate teaching assistants. These TAs all work for the psychology department as recitation instructors for Intro Psych. Now, as I’m sure you’re all aware, at the end of each semester students are asked to complete teacher evaluation forms. And although these evaluation forms can provide valuable feedback to the instructors, it’s become apparent that many students don’t really take the time to provide well-thought out responses, and as few as 5% of the students provide written comments at the end of the evaluation form. Consequently, the Intro Psych TAs have expressed that they would like to receive more concrete and specific feedback about their performance. They’re especially interested in getting some candid feedback about their strengths and weaknesses and what they need to do to improve their performance. And that’s why you are all here today—to provide that specific feedback to the Intro Psych TAs.
To give you some background, one week towards the end of last semester we went
around to the recitation classes and videotaped segments of the TAs actual lectures. All of the videotaping was done in the course of one week, so that all of the TAs would be lecturing on the same topic. The TAs in the department knew this project was going on, and they had all agreed

115
to participate. In fact, the TAs were very supportive of this project, because as I said earlier, they were the ones who first expressed interest in getting better feedback on their performance. Although the TAs knew this project was going on, they didn’t know which week the videographers were going to “drop-in” and videotape their lecture, nor did they know who would be randomly selected (obviously there wasn’t enough time to go around and film all the TAs). It was done this way, so that we could obtain a candid and accurate portrayal of the TAs
lecture performance. If the TAs had known ahead of time that they were going to be filmed, then they may have prepared and performed differently.
So today I’ll show you (via the LCD projector) segments of each of the TAs lecture
performances. Unfortunately, we don’t have time to show you the whole lecture, but this should give you a pretty good impression about how the person is doing. Before you rate the lectures, however, I first want to share with you some ways that you can improve the quality and the accuracy of your evaluations.
Pretest/Training Video HANDOUT RATING AND JUSTIFICATION FORM FOR THE TRAINING VIDEOS
First of all, we’re going to practice evaluating TA lecture performances. I’m going to show
you three lecture segments, and after each segment you will rate the performance on the rating sheet with which you have been provided. Once again, this is just for practice and the person you will see in the videos is not a real TA. This person has been given a script and is acting the part of an Intro Psych TA. Please record your justification for the assigned rating in the spaces provided, so that we can go back and discuss how you came up with your ratings. SHOW THE THREE LECTURES IN RANDOM ORDER, STOPPING AFTER EACH FOR RATING. Performance Appraisal, Multidimensionality of Performance, & Behavior Observation Lecture
You all just completed what, in the business world, would be referred to as a
performance appraisal. Many of you have probably received performance appraisals from your employers, and some of you may have even had the opportunity to actually administer performance appraisals. So for the most part, you’re probably familiar with the basic concept of performance appraisals. (put up overhead #1 with definition of performance appraisal). But to be more specific, a performance appraisal is formally defined as the systematic description of job-relevant strengths and weaknesses. Furthermore, performance appraisal is made up of two processes: observation and judgment.
Unfortunately, both of these processes are subject to bias. For example, if you’re good
friends with the person whose performance you’re evaluating, then that may color your judgment when it comes time to appraise the person’s performance. This is just one example of a particular bias that could influence your evaluation. Because of these biases this is why I want
116
to take some time to familiarize you with the rating process, and give you a chance to do some practice ratings.
Now going back to your practice rating forms, notice that there are four different
dimensions of performance on which you were asked to evaluate the TA. You may have thought to yourself, “why is it necessary to make so many ratings for each person? Shouldn’t an overall performance rating be enough?” The answer is that one overall rating is probably not enough to capture the quality of the performance. This is because the job of a lecture TA, like most jobs, is not unidimensional—it’s multidimensional. And by that I mean that there are many different facets that make-up the job of a lecture TA. Because the job is multidimensional, this means that the lecturer could be strong in certain dimensions of performance, but weak on other dimensions of performance. And that’s why I asked you to rate the TA on 3 dimensions of performance: (1) organization, (2) delivery, and (3) depth of knowledge, in addition to an overall rating.
A good performance appraisal system, however, cannot be built solely upon a rating form
which sufficiently describes the various dimensions of performance. In order for performance ratings to give an accurate portrayal of a person’s performance, the rater must pay close attention to the person’s performance. And because the lecture performance is multidimensional, the person who is evaluating the TA needs to attend to as much of the person’s specific behaviors as is possible. That is, in order for you to be good evaluators of performance, you need to pay close attention to the specific things the lecturer says and does. Being a good observer, and making evaluations on each dimension of performance is the first step towards accurate and useful performance evaluations.
General Lecture Behaviors and Dimensions Discussion
Now that I have talked about the general nature of the performance appraisal process, I’d now like to talk more about specific lecture TA behaviors. Thinking back to what you observed in the three practice videos, and using your general knowledge and past experience with lecture TAs, I want us all to identify a range of lecture TA behaviors. SPEND A COUPLE OF MINUTES WRITING DOWN THEIR IDEAS ON THE CHALKBOARD. (put up overhead #2 of TA behaviors) Here are some other examples of TA behaviors (read each example):
• Teacher has good voice inflection • Teacher forgets to bring the answers to the in-class homework assignment • Teacher doesn’t know the answers to questions students ask • Teacher has poor posture • Teacher is a couple of minutes late for class • Teacher is able to perform experiments in class to illustrate concepts • Teacher doesn’t talk loud enough • Teacher brings handouts to class for students • Teacher doesn’t know the correct pronunciation of a researcher’s name who’s study he/she is
lecturing about

117
Now that we’ve identified some behaviors that a lecture TA engages in, let’s go back to the
original rating dimensions which you used in your practice evaluation. Most rating forms, like the ones you have in front of you, are developed after someone has taken into account the behaviors required to perform the job; this is similar to what we just did. In constructing the rating dimensions, the job behaviors are basically grouped into major categories. Here are the major categories, that is, performance dimensions, necessary for a job as a lecture TA (put up the overhead # 3 of performance dimension definitions. Read each dimension and ask if they have any questions about the definitions).
RVT Training Concepts and Examples – Lecture and Discussion
We’ve now discussed some of the behaviors in which a lecture TA engages, and we’ve
discussed the rating dimensions that will be used to evaluate the real applicants. The ability to discern the adequacy or the inadequacy of each individual’s performance on these dimensions is important because it indicates something about the aptitude of each applicant. However, it only tells us part of the story. We really need to be able to determine variability between applicants so that we can determine which one is the best. Having you rate the lecture performance of these applicants will not do the psychology department any good, if at the end of the evaluation, the department can’t make a decision about which three of the five applicants should be given assistantships.
Imagine that you need to sort pebbles by size, and you do this by passing them through a
sieve. If the holes in the sieve are so large that every pebble passes through, then the sieve has failed to distinguish between the pebbles. Similarly, if this performance appraisal task fails to distinguish between applicants, then the evaluation will have been a wasted effort. Consequently, the goal of performance appraisals is to make distinctions among the people being evaluated. In order for performance appraisal to differentiate between applicants, we need to tighten the performance standards and develop behavioral examples that allow the evaluators to discern differences between the applicants. A good evaluator should be able to compare applicants in terms of who is the best and who is the worst, so that he/she can rank order the applicants from best performance to worst performance.
Any questions? Considering the three specific performance dimensions (organization, delivery, and depth
of knowledge), I would like for you to describe the performance of three TAs that we could rank order from best to worst.
Let’s start with the best performance first; what would be an example of a good
organizational behavior? (May want to refer back to the overhead that shows examples of TA behaviors---- e.g., brings handouts to class for students); what would be an example of a good delivery behavior? (e.g., good voice inflection); what would be an example of a good depth of knowledge behavior? (e.g., ability to perform in-class experiments that illustrate lecture concepts).

118
Let’s next describe the other extreme—the worst performance. What would be an example
of a poor organizational behavior? (e.g., forgets to bring answers to the in-class homework assignment); What would be an example of a poor delivery behavior? (e.g., doesn’t speak loud enough for the whole class to hear); What would be an example of a poor depth of knowledge behavior? (e.g., doesn’t know the answers to students’ questions).
Lastly, let’s describe a performance that falls somewhere in between these two extremes. What would be an example of an average organizational behavior? (e.g., couple of minutes late to class); what would be an example of an average delivery behavior? (e.g., poor posture); what would be an example of an average depth of knowledge behavior? (e.g., doesn’t know the correct pronunciation of a researcher’s name whose study he/she is lecturing about).
Recap of What’s Been Covered Thus Far (overhead RVT #4 of what we’ve covered so far) Okay, so we’ve learned that rater
accuracy is fostered by (1) being an attentive observer of what the ratee (person being evaluated) says and does in the line of work, (2) making ratings for each performance dimension, (3) identifying job-relevant behaviors, (4) clearly defining the dimensions of performance, (5) looking for variability among ratees, and (6) comparing the differences between ratees.
The practice videos you watched earlier demonstrated variability between applicants.
There was an example of a good, average, and poor performance. A group of expert raters, previously evaluated these three practice lectures and came up with a set of “target” performance ratings. Our next step is to compare your ratings to the target ratings. I’ll now collect your rating forms and record your ratings on the overhead. GIVE THE GROUP A 10 MINUTE BREAK, AND WHILE THEY’RE ON BREAK WRITE DOWN THEIR RATINGS ON THE APPROPRIATE OVERHEADS (RVT #5).
Expert Judges Behavioral Rationale & Pretest Rating Feedback via RVT Concepts AFTER BREAK HAND BACK THEIR RATING FORMS
Before we get into a discussion about the similarities and differences between your ratings and the target ratings, I first want to explain to you the expert judges’ behavioral rationale for their ratings. Organization Dimension:
Poor Ratee -- target rating = 31, Behaviors: (1) skips around -- starts talking about long-term memory and then goes back to STM and talks about how much information it can hold; (2) forgets some notes—towards the end of the lecture he tries to find a diagram, but realizes he’s forgotten it.

119
Average Ratee – target rating = 45, Behaviors: (1) gets off the subject – starts talking about his allergies; (2) overhead transparencies upside down & backwards Good Ratee – target rating = 92, Behaviors: (1) notes and overheads are in order; (2) provides a good summary of the main points
After you’ve gone through the experts’ behavioral rationale for the organization dimension, display the overhead with everyone’s ratings on it. You can see that some/many of you were able to discriminate between employees on this dimension. FOR EACH RATER: • ASK THE RATER TO READ OR DESCRIBE THEIR REASONS FOR THE WAY IN
WHICH THEY RATED EACH OF THE THREE LECTURES • ASK THE GROUP HOW ON TARGET THE RATER WAS IN DISTINGUISHING
BETWEEN LECTURERS. • AS THE TRAINER, DISCUSS THE EXTENT TO WHICH THERE IS VARIABILITY
BETWEEN LECTURERS ON THIS DIMENSION. • NOTE: DO THIS FOR EACH DIMENSION Delivery Dimension:
Poor Ratee -- target rating = 22, Behaviors: (1) stuttering and stumbling over words; halted speech; (2) inappropriate body language – grabs neck and scratches head Average Ratee – target rating = 48, Behaviors: (1) chewing gum; (2) laid back presentation style Good Ratee – target rating = 90, Behaviors: (1) expresses enthusiasm in the subject; (2) good voice inflection
DISCUSSION Depth of Knowledge Dimension:
Poor Ratee – target rating = 24, Behaviors: (1) forgets name of a concept he’s trying to explain; (2) very shallow explanation of concepts –basically only tells us the definition of things Average Ratee – target rating = 52, Behaviors: (1) reads from textbook –can’t remember the names or definitions for auditory and visual sensory memory so he has to read it from the textbook; (2) is able to report an exception to a general research finding – tells us that there are exceptions where people can remember more than 7 +/- 2 bits of information Good Ratee – target rating = 91, Behaviors: (1) cites the names of researchers associated with the concepts; (2) provides supplementary information – in addition to citing research, provides a second definition of sensory memory from a different textbook, tells us about chunking (a way to expand our STM), tells us about levels of processing (i.e., shallow vs. deep processing).

120
DISCUSSION Overall Rating: Poor Ratee – target rating = 25 Average Ratee – target rating = 50 Good Ratee – target rating = 92 DISCUSSION
Summary of Training
Okay, that wraps up our training and practice session. Now you’re ready to evaluate the
applicants. But before we do that, I want to briefly summarize the main points in our discussion on improving the accuracy of performance ratings.
First of all, when I mention rater variability, what I am talking about? (behavioral
examples that allow raters to make distinctions between ratees) What are some of the ways we learned more about the importance of variability in
performance appraisal? (sieve analogy, viewed practice examples of a range of performances, got feedback about our practice ratings)
What did you get out of the practice feedback? (hopefully the ability to make distinctions
between employees) And the most important question, how can you improve the quality of your ratings? (be a
good observer of what the ratee says and does, make ratings for each performance dimension, look for variability between ratees, and compare the differences between ratees so that you can rank order them).
Posttest/Evaluation of the “Real” TAs
(hand out rating forms) It’s now time to rate the real TAs on their lecture performance. It’s important that I emphasize that the reason for doing these ratings is so that the TA’s can receive feedback about their lecture performance, specifically on their strengths and weaknesses. The TAs are the only ones who will have access to this information—their supervisors will NOT see the ratings you assign. Once again, these ratings are strictly for the benefit of the TAs so that they can hone in on their teaching skills. SHOW THE FIVE PERFORMANCES, STOPPING AFTER EACH FOR RATING. COLLECT THEIR RATING FORMS, AND HAND-OUT THE POST-TRAINING QUIZ.
Debriefing

121
Before you leave today, I need to inform you that the true purpose of today’s study was not to provide intro psych TAs with performance feedback. The people you saw in the videos were actors from the theatre department. The true purpose of the study was two-fold. The first purpose of the study was to determine if Rater Variability Training, the type of training you all just underwent, is an effective method for improving rating accuracy. The second purpose of the study, was to determine if individuals rate performance more accurately if they believe that their performance ratings will only be used to provide feedback, and not be used by the person’s supervisor for determining rewards and punishments. Any questions? Have them sign the debriefing informed consent. Sign extra credit materials. Make sure the intro students have filled out 3 orange opscans with their name, date, SS#, and 077 in the seat space. Thank them for their participation, and dismiss them.

122
Accuracy Only / Administrative Training Protocol
Materials • Business casual dress (i.e., look professional) • Training protocol for condition assigned to that session • Key to get into 4076 • Rater training CD-ROM • LCD projector (should already be in the room) • Overhead projector (should already be in the room) • Overhead transparencies • Transparency pen • Extra coding pencils • Training packet for the trainees • Orange extra credit opscans (enough for 4 opscans per person) • Informed consent forms—a set of “pre-debriefing” and a set of debriefing • Video camera
Introduction DISTRIBUTE FIRST OF INFORMED CONSENT FORMS Thank-you all for coming. Before we begin, I just want to let you know that today’s session will run for approximately 2 ½ hours, and because of its length you will be given a break.
Your purpose in being here today is to evaluate the lecture performance of five
individuals who are applying for assistantships as recitation instructors in Introductory Psychology for the upcoming Fall semester. Currently these five applicants are all college seniors who have been accepted into the psychology graduate program here at Virginia Tech.
Each year the psychology department carefully selects a handful of in-coming grad
students to work as Intro Psych recitation instructors. This is a highly sought after assistantship because it pays for the grad students’ tuition, and it also gives them a stipend on which to live. This teaching assistantship is also highly sought after because it gives the grad students invaluable teaching experience, and this teaching experience is very important to those students who one day want to become professors. The five students’ who you will be evaluating today, have all been selected as candidates for the TA position because they have all expressed strong interest in becoming psychology professors once they receive their degree. Unfortunately, there are only three TA positions available for next fall, and so the psychology department has to make a decision about which three to hire.
When these students came to interview with the department in early March they were
told to have prepared a five to 10 minute lecture on the topic of social conformity. Then, while they were here, we had someone videotape their presentations. The psychology department will

123
use these lecture performances to help them decide which three of the five applicants will be offered teaching assistantships.
This year the psychology department wants to try something a little bit different. They
want to solicit the opinions of actual students. Since, afterall, the students are the ones who are going to be taught by the TAs. And that is why you all are here today—to rate the applicants’ lecture performances, and thereby help the department decide which of the five individuals should be offered positions as recitation instructors for Intro Psych.
So, I’m here today to show you the videotaped lecture performances (via the LCD
projector) which you will evaluate. Because your performance evaluations carry a serious consequence for the applicants, I've been asked to share with you some ways that you can improve the quality and the accuracy of your evaluations.
Pretest/Training Videos
HANDOUT RATING AND JUSTIFICATION FORM FOR THE TRAINING VIDEOS
First of all, we’re going to practice evaluating TA lecture performances. I’m going to show
you three lecture segments, and after each segment you will rate the performance on the rating sheet with which you have been provided. Once again, this is just for practice and the person you will see in the videos is not a real TA. This person has been given a script and is acting the part of an Intro Psych TA. Please record your justification for the assigned rating in the spaces provided, so that we can go back and discuss how you came up with your ratings. SHOW THE THREE LECTURES IN RANDOM ORDER, STOPPING AFTER EACH FOR RATING.
Lecture on the Process of Performance Appraisal
You all just completed what, in the business world, would be referred to as a performance appraisal. Many of you have probably received performance appraisals from your employers, and some of you may have even had the opportunity to actually administer performance appraisals. So, for the most part, you’re probably familiar with the basic concept of performance appraisals. (put up overhead #1 with definition of performance appraisal) But to be more specific, a performance appraisal is formally defined as the systematic description of job-relevant strengths and weaknesses. Furthermore, performance appraisal is made up of two processes: observation and judgment.
Unfortunately, both of these processes are subject to bias. For example, if you’re good
friends with the person whose performance you’re evaluating, then that may color your judgment when it comes time to appraise the person’s performance. This is just one example of a particular bias that could influence your evaluation. Because performance appraisals are based on subjective criteria, some people have argued that the use of performance appraisals should be abandoned. Nonetheless, surveys of managers from both large and small organizations

124
consistently show that organizations are unwilling to abandon performance appraisal because they regard it as an important assessment tool.
The current view of performance appraisal is rapidly changing because the performance
management movement has redefined the performance evaluation process. Organizations are less likely to view performance appraisal as a once-a-year activity performed only by the ratee’s immediate supervisor (the “ratee” is the person be evaluated). Instead, the new trend has been to get more people involved in the appraisal process. In addition to receiving ratings from their supervisors, people now often receive performance evaluations from their fellow peers and also from their subordinates. This is why we are asking you, the students, to be involved in this performance evaluation task. By having a wider range of people providing performance ratings, this increases the types and the amount of information that is available to us about the applicants’ performances. And the more information we receive about their performances, then the less likely we are to fall prey to biases.
General Lecture Behaviors and Dimensions Discussion
Now that I have talked about the general nature of the performance appraisal process, I’d
like to spend some time talking about specific lecture TA behaviors. Thinking back to what you observed in the three practice videos, and using your general knowledge and past experience with lecture TAs, I want us all to identify a range of lecture TA behaviors. SPEND A COUPLE OF MINUTES WRITING DOWN THEIR IDEAS ON THE CHALKBOARD. (put up overhead #2 of TA behaviors) Here are some other examples of TA behaviors (read each example):
• Teacher has good voice inflection • Teacher forgets to bring the answers to the in-class homework assignment • Teacher doesn’t know the answers to questions students ask • Teacher has poor posture • Teacher is a couple of minutes late for class • Teacher is able to perform experiments in class to illustrate concepts • Teacher doesn’t talk loud enough • Teacher brings handouts to class for students • Teacher doesn’t know the correct pronunciation of a researcher’s name who’s study he/she is
lecturing about Now that we’ve identified some behaviors that a lecture TA engages in, let’s go back to the
original rating dimensions which you used in your practice evaluation. Most rating forms, like the ones you have in front of you, are developed after someone has taken into account the behaviors required to perform the job; this is similar to what we just did. In constructing the rating dimensions, the job behaviors are basically grouped into major categories. Here are the major categories, that is, performance dimensions, necessary for a job as a lecture TA (put up the overhead # 3 of performance dimension definitions. Read each dimension and ask if they have any questions about the definitions).

125
Generic Performance Appraisal Lecture—History and Trend of Performance Appraisal
I would now like to start off this next portion of the session by talking for a few minutes about the general concept of performance appraisal. As mentioned earlier, performance appraisal can be defined as “a systematic description of job-relevant strengths and weaknesses.” The first instruments designed to measure performance were developed in the 1920s, and since that time psychologists have constantly persisted in a quest to develop measurement instruments that are accurate, meaningful, and easy to use.
There are two general types of instruments that are used for measuring behavior: objective
measures and subjective measures. Objective measures, which we have not yet talked about, include production data—things such as dollar volume of sales, units produced, and number of errors. Objective measures also include employment data—things such as number of accidents, turnover rates, absences, and tardiness. As you can see, these objective measures all deal with quantitative data. This quantitative data is intuitively appealing because it is not biased by subjective interpretation. The problem with objective measures, however, is that they often do not measure performance, but rather factors beyond an individual’s control. For example, dollar volume of sales is influenced by numerous factors beyond a particular salesperson’s control—things such as territory location, nature of the competition, price and quality of the product, and so forth. It is imperative to keep in mind that the purpose of performance appraisals is to judge an individual’s performance, not factors beyond his or her control. This is one shortcoming of objective performance measures. Furthermore, production data, a type of objective measure, is clearly not an appropriate form of performance measurement for a lecture TA. The job of a lecture TA is not a production job. In other words, lecture TAs are not producing anything. The job of a TA is a nonproduction job. A nonproduction job is one in which competence or efficiency is measured in qualitative terms.
Because of these disadvantages of objective measures, researchers have placed major
emphasis on subjective measures of performance. When you rated the practice lectures a few minutes ago, you were using a subjective measurement instrument. However, subjective measures also have problems of their own. They depend on human judgment, and are therefore prone to certain kinds of biases. For subjective measures to be useful, they must be based on a careful analysis of the behaviors important for effective performance--this is why we took the time to identify examples of lecture TA behaviors.
There is enormous variation in the types of subjective performance measures used by
organizations. Some use a long list of elaborate rating scales; others use only a few simple scales; while still others require raters to write a paragraph or two concerning the performance of each of the ratees. The method we have chosen for today’s study is a sort of amalgamation of these latter two options. We have provided you with a rather simple rating scale, but we have also asked you to combine your numerical ratings along with a written justification for your ratings. We believe that this will help to provide ratings of better quality.
Now, whenever a performance appraisal system is implemented, the people performing the
evaluations should be trained to appropriately conduct performance appraisals. This includes

126
familiarizing the raters with the rating scale, minimizing their fear of being criticized by ratees for making judgments, and illustrating the need for the performance evaluation. Also, the raters should be knowledgeable about the philosophy, objectives, and standards of the chosen performance appraisal system. This is what we hope to accomplish today.
It is important to keep in mind that performance appraisal is not practiced only in business.
Indeed, it has been taking place throughout your academic career. As a student, what are some ways in which your performance has been evaluated? (e.g., tests, term papers, research proposals, etc) WRITE THESE EXAMPLES ON THE
CHALKBOARD
Recap of What’s Been Covered Thus Far (overhead # 4 of what we’ve covered so far) Okay, so far we’ve learned that it is important
for raters to be aware of the (1) philosophy, (2) objectives, and (3) standards of the chosen appraisal system.
Now, let’s go back to your practice ratings from the mock lecture performances, and see
how well you did. We’re going to compare your performance ratings to the performance ratings assigned by a group of expert raters, and then we’ll discuss how on target your ratings are. COLLECT THEIR RATING FORMS, AND GIVE THE GROUP A 10 MINUTE BREAK. WHILE THEY’RE ON BREAK WRITE DOWN EVERYONE’S RATINGS ON THE CHALKBOARD, ALONG WITH THE TARGET SCORE MATRIX (prominently display target score matrix on the chalkboard) . YOU SHOULD WRITE DOWN THEIR RATINGS IN THE FOLLOWING FORM:
RATER NAME ORG. DELIVERY KNOWLEDGE OVERALL 1ST PERFORMANCE: ____ ____ ____ ____ 2ND PERFORMANCE: ____ ____ ____ ____ 3RD PERFORMANCE: ____ ____ ____ ____ THE TARGET SCORE MATRIX SHOULD BE WRITTEN IN THE FOLLOWING FORM: (Make sure that you list the performances in the same order in which the raters viewed the performances. For example, if you showed the average performance first, followed by the good performance, and then the poor performance then write the target matrix in that order)
ORG. DELIVERY DEPTH OVERALL POOR PERFORMANCE: 31 22 24 25 AVG. PERFORMANCE: 45 48 52 50 GOOD PERFORMANCE: 92 90 91 92
Pretest Rating Feedback (Accuracy Feedback Only)

127
AFTER BREAK HAND BACK THEIR RATING FORMS
Displayed on the chalkboard are the expert judges’ ratings, and your performance ratings. FOR EACH RATER: • ASK THE RATER TO READ OR DESCRIBE THEIR REASONS FOR THE WAY IN
WHICH THEY RATED EACH OF THE THREE LECTURERS • ASK THE GROUP HOW ON TARGET THE RATER WAS • AS THE TRAINER, MAKE A GENERAL COMMENT AS TO THE SIMILARITY AND
DIFFERENCES BETWEEN TRAINEE’S RATINGS AND TARGET RATINGS • ANY QUESTIONS?
Performance Appraisal Discussion
At this point I would like to switch gears. Before, I lectured for awhile about the concept of performance appraisals. Now, I’d like to have more of a group discussion about performance appraisal, and hear more of what you have to say on the subject.
First of all, speaking more in terms of the business world, do you think it’s important for organizations to conduct performance appraisals? Why? What benefit do they provide?
Those of you who have received performance evaluations in the past, do you think that they were helpful? Why or why not?
Those of you who have had an opportunity to administer performance appraisals, what
did you find difficult about doing them? At this point you can all take a 10 minute break. When you come back, you will rate the five TA applicants.
Posttest/Evaluation of the “Real” TAs
(hand out rating forms) It’s now time to rate the real applicants on their lecture performance. It’s important that I emphasize that the reason for doing these ratings is help the psychology department decide which of the five applicants should be awarded positions as recitation instructors for Intro Psych. Once again, please take this task very seriously because it has important implications for the applicants’ funding. SHOW THE FIVE PERFORMANCES, STOPPING AFTER EACH FOR RATING. COLLECT THEIR RATING FORMS, AND HAND-OUT THE POST-TRAINING QUIZ.
Debriefing

128
Before you leave today, I need to inform you that the true purpose of today’s study was not to determine which applicants should be awarded assistantships. The people you saw in the videos were actors from the theatre department. The true purpose of the study was two-fold. The first purpose was to determine if quantitative accuracy feedback is an effective method for improving rating accuracy. The second purpose of the study, was to determine if individuals rate performance less accurately when they believe that their performance ratings have serious implications for the ratees. Any questions? Have them sign the debriefing informed consent. Sign extra credit materials. Make sure the intro students have filled out 3 orange opscans with their name, date, SS#, and 077 in the seat space. Thank them for their participation, and dismiss them.

129
Accuracy Feedback/Developmental Training Protocol
Materials • Business casual dress (i.e., look professional) • Training protocol for condition assigned to that session • Key to get into 4076 • Rater training CD-ROM • LCD projector (should already be in the room) • Overhead projector (should already be in the room) • Overhead transparencies • Transparency pen • Extra coding pencils • Training packet for the trainees • Orange extra credit opscans (enough for 4 opscans per person) • Informed consent forms—A “pre-debriefing” set and a “post-debriefing” set. If they need to
keep a copy give them the “pre-debriefing” consent form. • Video camera
Introduction DISTRIBUTE FIRST OF INFORMED CONSENT FORMS
Thank-you all for coming. Before we begin, I just want to let you know that today’s session will run for approximately 2 ½ hours, and because of its length you will be given a break.
Your purpose in being here today is to evaluate the lecture performance of five randomly
selected first-year graduate teaching assistants. These TAs all work for the psychology department as recitation instructors for Intro Psych. Now, as I’m sure you’re all aware, at the end of each semester students are asked to complete teacher evaluation forms. And although these evaluation forms can provide valuable feedback to the instructors, it’s become apparent that many students don’t really take the time to provide well-thought out responses, and as few as 5% of the students provide written comments at the end of the evaluation form. Consequently, the Intro Psych TAs have expressed that they would like to receive more concrete and specific feedback about their performance. They’re especially interested in getting some candid feedback about their strengths and weaknesses and what they need to do to improve their performance. And that’s why you are all here today—to provide that specific feedback to the Intro Psych TAs.
To give you some background, one week towards the end of last semester we went
around to the recitation classes and videotaped segments of the TAs actual lectures. All of the videotaping was done in the course of one week, so that all of the TAs would be lecturing on the same topic. The TAs in the department knew this project was going on, and they had all agreed

130
to participate. In fact, the TAs were very supportive of this project, because as I said earlier, they were the ones who first expressed interest in getting better feedback on their performance. Although the TAs knew this project was going on, they didn’t know which week the videographers were going to “drop-in” and videotape their lecture, nor did they know who would be randomly selected (obviously there wasn’t enough time to go around and film all the TAs). It was done this way, so that we could obtain a candid and accurate portrayal of the TAs
lecture performance. If the TAs had known ahead of time that they were going to be filmed, then they may have prepared and performed differently.
So today I’ll show you (via the LCD projector) segments of each of the TAs lecture
performances. Unfortunately, we don’t have time to show you the whole lecture, but this should give you a pretty good impression about how the person is doing. Before you rate the lectures, however, I first want to share with you some ways that you can improve the quality and the accuracy of your evaluations.
Pretest/Training Video HANDOUT RATING AND JUSTIFICATION FORM FOR THE TRAINING VIDEOS
First of all, we’re going to practice evaluating TA lecture performances. I’m going to show
you three lecture segments, and after each segment you will rate the performance on the rating sheet with which you have been provided. Once again, this is just for practice and the person you will see in the videos is not a real TA. This person has been given a script and is acting the part of an Intro Psych TA. Please record your justification for the assigned rating in the spaces provided, so that we can go back and discuss how you came up with your ratings. SHOW THE THREE LECTURES IN RANDOM ORDER, STOPPING AFTER EACH FOR RATING.
Lecture on the Process of Performance Appraisal
You all just completed what, in the business world, would be referred to as a performance appraisal. Many of you have probably received performance appraisals from your employers, and some of you may have even had the opportunity to actually administer performance appraisals. So, for the most part, you’re probably familiar with the basic concept of performance appraisals. (put up overhead #1 with definition of performance appraisal) But to be more specific, a performance appraisal is formally defined as the systematic description of job-relevant strengths and weaknesses. Furthermore, performance appraisal is made up of two processes: observation and judgment.
Unfortunately, both of these processes are subject to bias. For example, if you’re good
friends with the person whose performance you’re evaluating, then that may color your judgment when it comes time to appraise the person’s performance. This is just one example of a particular bias that could influence your evaluation. Because performance appraisals are based on subjective criteria, some people have argued that the use of performance appraisals should be

131
abandoned. Nonetheless, surveys of managers from both large and small organizations consistently show that organizations are unwilling to abandon performance appraisal because they regard it as an important assessment tool.
The current view of performance appraisal is rapidly changing because the performance
management movement has redefined the performance evaluation process. Organizations are less likely to view performance appraisal as a once-a-year activity performed only by the ratee’s immediate supervisor (the “ratee” is the person be evaluated). Instead, the new trend has been to get more people involved in the appraisal process. In addition to receiving ratings from their supervisors, people now often receive performance evaluations from their fellow peers and also from their subordinates. This is why we are asking you, the students, to be involved in this performance evaluation task. By having a wider range of people providing performance ratings, this increases the types and the amount of information that is available to us about the applicants’ performances. And the more information we receive about their performances, then the less likely we are to fall prey to biases.
General Lecture Behaviors and Dimensions Discussion
Now that I have talked about the general nature of the performance appraisal process, I’d like to spend some time talking about specific lecture TA behaviors. Thinking back to what you observed in the three practice videos, and using your general knowledge and past experience with lecture TAs, I want us all to identify a range of lecture TA behaviors. SPEND A COUPLE OF MINUTES WRITING DOWN THEIR IDEAS ON THE CHALKBOARD. (put up overhead #2 of TA behaviors) Here are some other examples of TA behaviors (read each example):
• Teacher has good voice inflection • Teacher forgets to bring the answers to the in-class homework assignment • Teacher doesn’t know the answers to questions students ask • Teacher has poor posture • Teacher is a couple of minutes late for class • Teacher is able to perform experiments in class to illustrate concepts • Teacher doesn’t talk loud enough • Teacher brings handouts to class for students • Teacher doesn’t know the correct pronunciation of a researcher’s name who’s study he/she is
lecturing about Now that we’ve identified some behaviors that a lecture TA engages in, let’s go back to the
original rating dimensions which you used in your practice evaluation. Most rating forms, like the ones you have in front of you, are developed after someone has taken into account the behaviors required to perform the job; this is similar to what we just did. In constructing the rating dimensions, the job behaviors are basically grouped into major categories. Here are the major categories, that is, performance dimensions, necessary for a job as a lecture TA (put up the overhead # 3 of performance dimension definitions. Read each dimension and ask if they have any questions about the definitions).
132
Generic Performance Appraisal Lecture—History and Trend of Performance Appraisal
I would now like to start off this next portion of the session by talking for a few minutes
about the general concept of performance appraisal. As mentioned earlier, performance appraisal can be defined as “a systematic description of job-relevant strengths and weaknesses.” The first instruments designed to measure performance were developed in the 1920s, and since that time psychologists have constantly persisted in a quest to develop measurement instruments that are accurate, meaningful, and easy to use.
There are two general types of instruments that are used for measuring behavior: objective
measures and subjective measures. Objective measures, which we have not yet talked about, include production data—things such as dollar volume of sales, units produced, and number of errors. Objective measures also include employment data—things such as number of accidents, turnover rates, absences, and tardiness. As you can see, these objective measures all deal with quantitative data. This quantitative data is intuitively appealing because it is not biased by subjective interpretation. The problem with objective measures, however, is that they often do not measure performance, but rather factors beyond an individual’s control. For example, dollar volume of sales is influenced by numerous factors beyond a particular salesperson’s control—things such as territory location, nature of the competition, price and quality of the product, and so forth. It is imperative to keep in mind that the purpose of performance appraisals is to judge an individual’s performance, not factors beyond his or her control. This is one shortcoming of objective performance measures. Furthermore, production data, a type of objective measure, is clearly not an appropriate form of performance measurement for a lecture TA. The job of a lecture TA is not a production job. In other words, lecture TAs are not producing anything. The job of a TA is a nonproduction job. A nonproduction job is one in which competence or efficiency is measured in qualitative terms.
Because of these disadvantages of objective measures, researchers have placed major
emphasis on subjective measures of performance. When you rated the practice lectures a few minutes ago, you were using a subjective measurement instrument. However, subjective measures also have problems of their own. They depend on human judgment, and are therefore prone to certain kinds of biases. For subjective measures to be useful, they must be based on a careful analysis of the behaviors important for effective performance--this is why we took the time to identify examples of lecture TA behaviors.
There is enormous variation in the types of subjective performance measures used by
organizations. Some use a long list of elaborate rating scales; others use only a few simple scales; while still others require raters to write a paragraph or two concerning the performance of each of the ratees. The method we have chosen for today’s study is a sort of amalgamation of these latter two options. We have provided you with a rather simple rating scale, but we have also asked you to combine your numerical ratings along with a written justification for your ratings. We believe that this will help to provide ratings of better quality.

133
Now, whenever a performance appraisal system is implemented, the people performing the evaluations should be trained to appropriately conduct performance appraisals. This includes familiarizing the raters with the rating scale, minimizing their fear of being criticized by ratees for making judgments, and illustrating the need for the performance evaluation. Also, the raters should be knowledgeable about the philosophy, objectives, and standards of the chosen performance appraisal system. This is what we hope to accomplish today.
It is important to keep in mind that performance appraisal is not practiced only in business.
Indeed, it has been taking place throughout your academic career.
As a student, what are some ways in which your performance has been evaluated? (e.g., tests, term papers, research proposals, etc) WRITE THESE EXAMPLES ON THE CHALKBOARD
Recap of What’s Been Covered Thus Far (overhead # 4 of what we’ve covered so far) Okay, so far we’ve learned that it is important
for raters to be aware of the (1) philosophy, (2) objectives, and (3) standards of the chosen appraisal system.
Now, let’s go back to your practice ratings from the mock lecture performances, and see
how well you did. We’re going to compare your performance ratings to the performance ratings assigned by a group of expert raters, and then we’ll discuss how on target your ratings are. COLLECT THEIR RATING FORMS, AND GIVE THE GROUP A 10 MINUTE BREAK. WHILE THEY’RE ON BREAK WRITE DOWN EVERYONE’S RATINGS ON THE CHALKBOARD, ALONG WITH THE TARGET SCORE MATRIX (prominently display target score matrix on the chalkboard) . YOU SHOULD WRITE DOWN THEIR RATINGS IN THE FOLLOWING FORM:
RATER NAME ORG. DELIVERY KNOWLEDGE OVERALL 1ST PERFORMANCE:____ ____ ____ ____ 2ND PERFORMANCE:____ ____ ____ ____ 3RD PERFORMANCE:____ ____ ____ ____ THE TARGET SCORE MATRIX SHOULD BE WRITTEN IN THE FOLLOWING FORM: (Make sure that you list the performances in the same order in which the raters viewed the performances. For example, if you showed the average performance first, followed by the good performance, and then the poor performance then write the target matrix in that order)
ORG. DELIVERY DEPTH OVERALL POOR PERFORMANCE: 31 22 24 25 AVG. PERFORMANCE: 45 48 52 50 GOOD PERFORMANCE: 92 90 91 92

134
Pretest Rating Feedback (Accuracy Feedback Only) AFTER BREAK HAND BACK THEIR RATING FORMS
Displayed on the chalkboard are the expert judges’ ratings, and your performance ratings. FOR EACH RATER: • ASK THE RATER TO READ OR DESCRIBE THEIR REASONS FOR THE WAY IN
WHICH THEY RATED EACH OF THE THREE LECTURERS • ASK THE GROUP HOW ON TARGET THE RATER WAS • AS THE TRAINER, MAKE A GENERAL COMMENT AS TO THE SIMILARITY AND
DIFFERENCES BETWEEN TRAINEE’S RATINGS AND TARGET RATINGS • ANY QUESTIONS?
Performance Appraisal Discussion
At this point I would like to switch gears. Before, I lectured for awhile about the concept of performance appraisals. Now, I’d like to have more of a group discussion about performance appraisal, and hear more of what you have to say on the subject.
First of all, speaking more in terms of the business world, do you think it’s important for
organizations to conduct performance appraisals? Why? What benefit do they provide? Those of you who have received performance evaluations in the past, do you think that
they were helpful? Why or why not? Those of you who have had an opportunity to administer performance appraisals, what
did you find difficult about doing them? At this point you can all take a 10 minute break. When you come back, you will rate the five TA applicants.
Posttest/Evaluation of the “Real” TAs
(hand out rating forms) It’s now time to rate the real TAs on their lecture performance. It’s important that I emphasize that the reason for doing these ratings is so that the TA’s can receive feedback about their lecture performance, specifically on their strengths and weaknesses. The TAs are the only ones who will have access to this information—their supervisors will NOT see the ratings you assign. Once again, these ratings are strictly for the benefit of the TAs so that they can hone in on their teaching skills. SHOW THE FIVE PERFORMANCES, STOPPING AFTER EACH FOR RATING. COLLECT THEIR RATING FORMS, AND HAND-OUT THE POST-TRAINING QUIZ.

135
Debriefing
Before you leave today, I need to inform you that the true purpose of today’s study was
not to provide intro psych TAs with performance feedback. The people you saw in the videos were actors from the theatre department. The true purpose of the study was two-fold. The first purpose of the study was to determine if quantitative accuracy feedback is an effective method for improving rating accuracy. The second purpose of the study, was to determine if individuals rate performance more accurately if they believe that their performance ratings will only be used to provide feedback, and not be used by the person’s supervisor for determining rewards and punishments. Any questions? Have them sign the debriefing informed consent. Sign extra credit materials. Make sure the intro students have filled out 3 orange opscans with their name, date, SS#, and 077 in the seat space. Thank them for their participation, and dismiss them.

136
SOT Control / Administrative Training Protocol
Materials • Business casual dress (i.e., look professional) • Training protocol for condition assigned to that session • Key to get into 4076 • Rater training CD-ROM • LCD projector (should already be in the room) • Overhead projector (should already be in the room) • Overhead transparencies • Transparency pen • Extra coding pencils • Training packet for the trainees • Orange extra credit opscans (enough for 4 opscans per person) • Informed consent forms—one set “pre-debriefing” and one set debriefing • Video camera
Introduction DISTRIBUTE FIRST OF INFORMED CONSENT FORMS Thank-you all for coming. Before we begin, I just want to let you know that today’s session will run for approximately 2 ½ hours, and because of its length you will be given a break.
Your purpose in being here today is to evaluate the lecture performance of five
individuals who are applying for assistantships as recitation instructors in Introductory Psychology for the upcoming Fall semester. Currently these five applicants are all college seniors who have been accepted into the psychology graduate program here at Virginia Tech.
Each year the psychology department carefully selects a handful of in-coming grad
students to work as Intro Psych recitation instructors. This is a highly sought after assistantship because it pays for the grad students’ tuition, and it also gives them a stipend on which to live. This teaching assistantship is also highly sought after because it gives the grad students invaluable teaching experience, and this teaching experience is very important to those students who one day want to become professors. The five students’ who you will be evaluating today, have all been selected as candidates for the TA position because they have all expressed strong interest in becoming psychology professors once they receive their degree. Unfortunately, there are only three TA positions available for next fall, and so the psychology department has to make a decision about which three to hire.
When these students came to interview with the department in early March they were
told to have prepared a five to 10 minute lecture on the topic of social conformity. Then, while they were here, we had someone videotape their presentations. The psychology department will
137
use these lecture performances to help them decide which three of the five applicants will be offered teaching assistantships.
This year the psychology department wants to try something a little bit different. They
want to solicit the opinions of actual students. Since, afterall, the students are the ones who are going to be taught by the TAs. And that is why you all are here today—to rate the applicants’ lecture performances, and thereby help the department decide which of the five individuals should be offered positions as recitation instructors for Intro Psych.
So, I’m here today to show you the videotaped lecture performances (via the LCD
projector) which you will evaluate. Because your performance evaluations carry a serious consequence for the applicants, I've been asked to share with you some ways that you can improve the quality and the accuracy of your evaluations.
Pretest/Training Video HANDOUT RATING AND JUSTIFICATION FORM FOR THE TRAINING VIDEOS
First of all, we’re going to practice evaluating TA lecture performances. I’m going to show
you three lecture segments, and after each segment you will rate the performance on the rating sheet with which you have been provided. Once again, this is just for practice and the person you will see in the videos is not a real TA. This person has been given a script and is acting the part of an Intro Psych TA. Please record your justification for the assigned rating in the spaces provided, so that we can go back and discuss how you came up with your ratings. SHOW THE THREE LECTURES IN RANDOM ORDER, STOPPING AFTER EACH FOR RATING.
Lecture on the Process of Performance Appraisal
You all just completed what, in the business world, would be referred to as a performance appraisal. Many of you have probably received performance appraisals from your employers, and some of you may have even had the opportunity to actually administer performance appraisals. So, for the most part, you’re probably familiar with the basic concept of performance appraisals. (put up overhead #1 with definition of performance appraisal) But to be more specific, a performance appraisal is formally defined as the systematic description of job-relevant strengths and weaknesses. Furthermore, performance appraisal is made up of two processes: observation and judgment.
Unfortunately, both of these processes are subject to bias. For example, if you’re good
friends with the person whose performance you’re evaluating, then that may color your judgment when it comes time to appraise the person’s performance. This is just one example of a particular bias that could influence your evaluation. Because performance appraisals are based on subjective criteria, some people have argued that the use of performance appraisals should be abandoned. Nonetheless, surveys of managers from both large and small organizations
138
consistently show that organizations are unwilling to abandon performance appraisal because they regard it as an important assessment tool.
The current view of performance appraisal is rapidly changing because the performance
management movement has redefined the performance evaluation process. Organizations are less likely to view performance appraisal as a once-a-year activity performed only by the ratee’s immediate supervisor (the “ratee” is the person be evaluated). Instead, the new trend has been to get more people involved in the appraisal process. In addition to receiving ratings from their supervisors, people now often receive performance evaluations from their fellow peers and also from their subordinates. This is why we are asking you, the students, to be involved in this performance evaluation task. By having a wider range of people providing performance ratings, this increases the types and the amount of information that is available to us about the applicants’ performances. And the more information we receive about their performances, then the less likely we are to fall prey to biases.
General Lecture Behaviors and Dimensions Discussion
Now that I have talked about the general nature of the performance appraisal process, I’d like to spend some time talking about specific lecture TA behaviors. Thinking back to what you observed in the three practice videos, and using your general knowledge and past experience with lecture TAs, I want us all to identify a range of lecture TA behaviors. SPEND A COUPLE OF MINUTES WRITING DOWN THEIR IDEAS ON THE CHALKBOARD. (put up overhead #2 of TA behaviors) Here are some other examples of TA behaviors (read each example):
• Teacher has good voice inflection • Teacher forgets to bring the answers to the in-class homework assignment • Teacher doesn’t know the answers to questions students ask • Teacher has poor posture • Teacher is a couple of minutes late for class • Teacher is able to perform experiments in class to illustrate concepts • Teacher doesn’t talk loud enough • Teacher brings handouts to class for students • Teacher doesn’t know the correct pronunciation of a researcher’s name who’s study he/she is
lecturing about Now that we’ve identified some behaviors that a lecture TA engages in, let’s go back to the
original rating dimensions which you used in your practice evaluation. Most rating forms, like the ones you have in front of you, are developed after someone has taken into account the behaviors required to perform the job; this is similar to what we just did. In constructing the rating dimensions, the job behaviors are basically grouped into major categories. Here are the major categories, that is, performance dimensions, necessary for a job as a lecture TA (put up the overhead # 3 of performance dimension definitions. Read each dimension and ask if they have any questions about the definitions).
139
Generic Performance Appraisal Lecture—History and Trend of Performance Appraisal
I would now like to start off this next portion of the session by talking for a few minutes about the general concept of performance appraisal. As mentioned earlier, performance appraisal can be defined as “a systematic description of job-relevant strengths and weaknesses.” The first instruments designed to measure performance were developed in the 1920s, and since that time psychologists have constantly persisted in a quest to develop measurement instruments that are accurate, meaningful, and easy to use.
There are two general types of instruments that are used for measuring behavior: objective
measures and subjective measures. Objective measures, which we have not yet talked about, include production data—things such as dollar volume of sales, units produced, and number of errors. Objective measures also include employment data—things such as number of accidents, turnover rates, absences, and tardiness. As you can see, these objective measures all deal with quantitative data. This quantitative data is intuitively appealing because it is not biased by subjective interpretation. The problem with objective measures, however, is that they often do not measure performance, but rather factors beyond an individual’s control. For example, dollar volume of sales is influenced by numerous factors beyond a particular salesperson’s control—things such as territory location, nature of the competition, price and quality of the product, and so forth. It is imperative to keep in mind that the purpose of performance appraisals is to judge an individual’s performance, not factors beyond his or her control. This is one shortcoming of objective performance measures. Furthermore, production data, a type of objective measure, is clearly not an appropriate form of performance measurement for a lecture TA. The job of a lecture TA is not a production job. In other words, lecture TAs are not producing anything. The job of a TA is a nonproduction job. A nonproduction job is one in which competence or efficiency is measured in qualitative terms.
Because of these disadvantages of objective measures, researchers have placed major
emphasis on subjective measures of performance. When you rated the practice lectures a few minutes ago, you were using a subjective measurement instrument. However, subjective measures also have problems of their own. They depend on human judgment, and are therefore prone to certain kinds of biases. For subjective measures to be useful, they must be based on a careful analysis of the behaviors important for effective performance--this is why we took the time to identify examples of lecture TA behaviors.
There is enormous variation in the types of subjective performance measures used by
organizations. Some use a long list of elaborate rating scales; others use only a few simple scales; while still others require raters to write a paragraph or two concerning the performance of each of the ratees. The method we have chosen for today’s study is a sort of amalgamation of these latter two options. We have provided you with a rather simple rating scale, but we have also asked you to combine your numerical ratings along with a written justification for your ratings. We believe that this will help to provide ratings of better quality.
Now, whenever a performance appraisal system is implemented, the people performing the
evaluations should be trained to appropriately conduct performance appraisals. This includes
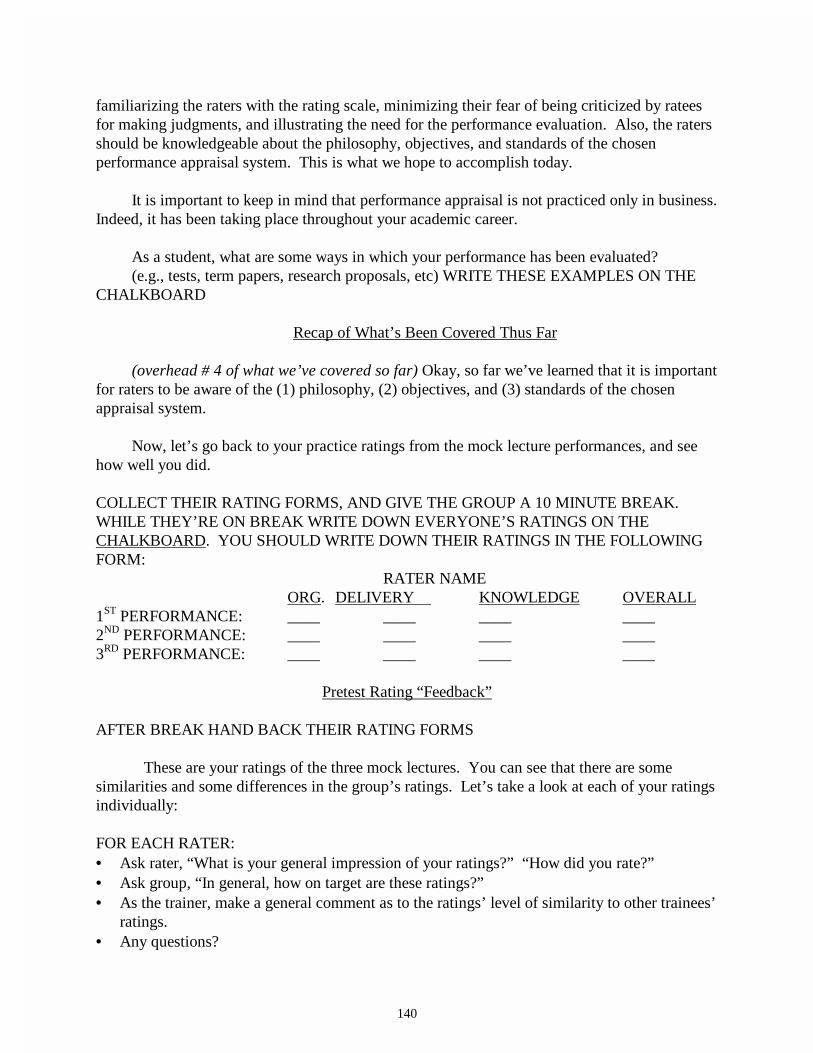
140
familiarizing the raters with the rating scale, minimizing their fear of being criticized by ratees for making judgments, and illustrating the need for the performance evaluation. Also, the raters should be knowledgeable about the philosophy, objectives, and standards of the chosen performance appraisal system. This is what we hope to accomplish today.
It is important to keep in mind that performance appraisal is not practiced only in business.
Indeed, it has been taking place throughout your academic career. As a student, what are some ways in which your performance has been evaluated? (e.g., tests, term papers, research proposals, etc) WRITE THESE EXAMPLES ON THE
CHALKBOARD
Recap of What’s Been Covered Thus Far
(overhead # 4 of what we’ve covered so far) Okay, so far we’ve learned that it is important for raters to be aware of the (1) philosophy, (2) objectives, and (3) standards of the chosen appraisal system.
Now, let’s go back to your practice ratings from the mock lecture performances, and see
how well you did. COLLECT THEIR RATING FORMS, AND GIVE THE GROUP A 10 MINUTE BREAK. WHILE THEY’RE ON BREAK WRITE DOWN EVERYONE’S RATINGS ON THE CHALKBOARD. YOU SHOULD WRITE DOWN THEIR RATINGS IN THE FOLLOWING FORM:
RATER NAME ORG. DELIVERY KNOWLEDGE OVERALL 1ST PERFORMANCE: ____ ____ ____ ____ 2ND PERFORMANCE: ____ ____ ____ ____ 3RD PERFORMANCE: ____ ____ ____ ____
Pretest Rating “Feedback” AFTER BREAK HAND BACK THEIR RATING FORMS
These are your ratings of the three mock lectures. You can see that there are some similarities and some differences in the group’s ratings. Let’s take a look at each of your ratings individually: FOR EACH RATER: • Ask rater, “What is your general impression of your ratings?” “How did you rate?” • Ask group, “In general, how on target are these ratings?” • As the trainer, make a general comment as to the ratings’ level of similarity to other trainees’
ratings. • Any questions?

141
Performance Appraisal Discussion
At this point I would like to switch gears. Before, I lectured for awhile about the concept
of performance appraisals. Now, I’d like to have more of a group discussion about performance appraisal, and hear more of what you have to say on the subject.
First of all, speaking more in terms of the business world, do you think it’s important for
organizations to conduct performance appraisals? Why? What benefit do they provide? Those of you who have received performance evaluations in the past, do you think that
they were helpful? Why or why not? Those of you who have had an opportunity to administer performance appraisals, what
did you find that it was a difficult task? Why?
Posttest/Evaluation of the “Real” TAs
(hand out rating forms) It’s now time to rate the real applicants on their lecture performance. It’s important that I emphasize that the reason for doing these ratings is help the psychology department decide which of the five applicants should be awarded positions as recitation instructors for Intro Psych. Once again, please take this task very seriously because it has important implications for the applicants’ funding. SHOW THE FIVE PERFORMANCES, STOPPING AFTER EACH FOR RATING. COLLECT THEIR RATING FORMS, AND HAND-OUT THE POST-TRAINING QUIZ.
Debriefing
Before you leave today, I need to inform you that the true purpose of today’s study was not to determine which applicants should be awarded assistantships. The people you saw in the videos were actors from the theatre department. The true purpose of the study was two-fold. The first purpose was to determine if training helps to improve rating accuracy. The second purpose of the study, was to determine if individuals rate performance less accurately when they believe that their performance ratings have serious implications for the ratees. Any questions? Have them sign the debriefing informed consent. Sign extra credit materials. Make sure the intro students have filled out 3 orange opscans with their name, date, SS#, and 077 in the seat space. Thank them for their participation, and dismiss them.
142
SOT Control / Developmental Training Protocol
Materials • Business casual dress (i.e., look professional) • Training protocol for condition assigned to that session • Key to get into 4076 • Rater training CD-ROM • LCD projector (should already be in the room) • Overhead projector (should already be in the room) • Overhead transparencies • Transparency pen • Extra coding pencils • Training packet for the trainees • Orange extra credit opscans (enough for 4 opscans per person) • Informed consent forms—A “pre-debriefing” set and a “post-debriefing” set. If they need to
keep a copy give them the “pre-debriefing” consent form. • Video camera
Introduction DISTRIBUTE FIRST SET OF INFORMED CONSENT FORMS
Thank-you all for coming. Before we begin, I just want to let you know that today’s session will run for approximately 2 ½ hours, and because of its length you will be given a break.
Your purpose in being here today is to evaluate the lecture performance of five randomly
selected first-year graduate teaching assistants. These TAs all work for the psychology department as recitation instructors for Intro Psych. Now, as I’m sure you’re all aware, at the end of each semester students are asked to complete teacher evaluation forms. And although these evaluation forms can provide valuable feedback to the instructors, it’s become apparent that many students don’t really take the time to provide well-thought out responses, and as few as 5% of the students provide written comments at the end of the evaluation form. Consequently, the Intro Psych TAs have expressed that they would like to receive more concrete and specific feedback about their performance. They’re especially interested in getting some candid feedback about their strengths and weaknesses and what they need to do to improve their performance. And that’s why you are all here today—to provide that specific feedback to the Intro Psych TAs.
To give you some background, one week towards the end of last semester we went
around to the recitation classes and videotaped segments of the TAs actual lectures. All of the videotaping was done in the course of one week, so that all of the TAs would be lecturing on the same topic. The TAs in the department knew this project was going on, and they had all agreed to participate. In fact, the TAs were very supportive of this project, because as I said earlier, they
143
were the ones who first expressed interest in getting better feedback on their performance. Although the TAs knew this project was going on, they didn’t know which week the videographers were going to “drop-in” and videotape their lecture, nor did they know who would be randomly selected (obviously there wasn’t enough time to go around and film all the TAs). It was done this way, so that we could obtain a candid and accurate portrayal of the TAs
lecture performance. If the TAs had known ahead of time that they were going to be filmed, then they may have prepared and performed differently.
So today I’ll show you (via the LCD projector) segments of each of the TAs lecture
performances. Unfortunately, we don’t have time to show you the whole lecture, but this should give you a pretty good impression about how the person is doing. Before you rate the lectures, however, I first want to share with you some ways that you can improve the quality and the accuracy of your evaluations.
Pretest/Training Video
HANDOUT RATING AND JUSTIFICATION FORM FOR THE TRAINING VIDEOS
First of all, we’re going to practice evaluating TA lecture performances. I’m going to show
you three lecture segments, and after each segment you will rate the performance on the rating sheet with which you have been provided. Once again, this is just for practice and the person you will see in the videos is not a real TA. This person has been given a script and is acting the part of an Intro Psych TA. Please record your justification for the assigned rating in the spaces provided, so that we can go back and discuss how you came up with your ratings. SHOW THE THREE LECTURES IN RANDOM ORDER, STOPPING AFTER EACH FOR RATING.
Lecture on the Process of Performance Appraisal
You all just completed what, in the business world, would be referred to as a performance appraisal. Many of you have probably received performance appraisals from your employers, and some of you may have even had the opportunity to actually administer performance appraisals. So, for the most part, you’re probably familiar with the basic concept of performance appraisals. (put up overhead #1 with definition of performance appraisal) But to be more specific, a performance appraisal is formally defined as the systematic description of job-relevant strengths and weaknesses. Furthermore, performance appraisal is made up of two processes: observation and judgment.
Unfortunately, both of these processes are subject to bias. For example, if you’re good
friends with the person whose performance you’re evaluating, then that may color your judgment when it comes time to appraise the person’s performance. This is just one example of a particular bias that could influence your evaluation. Because performance appraisals are based on subjective criteria, some people have argued that the use of performance appraisals should be abandoned. Nonetheless, surveys of managers from both large and small organizations

144
consistently show that organizations are unwilling to abandon performance appraisal because they regard it as an important assessment tool.
The current view of performance appraisal is rapidly changing because the performance management movement has redefined the performance evaluation process. Organizations are less likely to view performance appraisal as a once-a-year activity performed only by the ratee’s immediate supervisor (the “ratee” is the person be evaluated). Instead, the new trend has been to get more people involved in the appraisal process. In addition to receiving ratings from their supervisors, people now often receive performance evaluations from their fellow peers and also from their subordinates. This is why we are asking you, the students, to be involved in this performance evaluation task. By having a wider range of people providing performance ratings, this increases the types and the amount of information that is available to us about the applicants’ performances. And the more information we receive about their performances, then the less likely we are to fall prey to biases.
General Lecture Behaviors and Dimensions Discussion
Now that I have talked about the general nature of the performance appraisal process, I’d like to spend some time talking about specific lecture TA behaviors. Thinking back to what you observed in the three practice videos, and using your general knowledge and past experience with lecture TAs, I want us all to identify a range of lecture TA behaviors. SPEND A COUPLE OF MINUTES WRITING DOWN THEIR IDEAS ON THE CHALKBOARD. (put up overhead #2 of TA behaviors) Here are some other examples of TA behaviors (read each example):
• Teacher has good voice inflection • Teacher forgets to bring the answers to the in-class homework assignment • Teacher doesn’t know the answers to questions students ask • Teacher has poor posture • Teacher is a couple of minutes late for class • Teacher is able to perform experiments in class to illustrate concepts • Teacher doesn’t talk loud enough • Teacher brings handouts to class for students • Teacher doesn’t know the correct pronunciation of a researcher’s name who’s study he/she is
lecturing about
Now that we’ve identified some behaviors that a lecture TA engages in, let’s go back to the original rating dimensions which you used in your practice evaluation. Most rating forms, like the ones you have in front of you, are developed after someone has taken into account the behaviors required to perform the job; this is similar to what we just did. In constructing the rating dimensions, the job behaviors are basically grouped into major categories. Here are the major categories, that is, performance dimensions, necessary for a job as a lecture TA (put up the overhead # 3 of performance dimension definitions. Read each dimension and ask if they have any questions about the definitions).
Generic Performance Appraisal Lecture—History and Trend of Performance Appraisal

145
I would now like to start off this next portion of the session by talking for a few minutes
about the general concept of performance appraisal. As mentioned earlier, performance appraisal can be defined as “a systematic description of job-relevant strengths and weaknesses.” The first instruments designed to measure performance were developed in the 1920s, and since that time psychologists have constantly persisted in a quest to develop measurement instruments that are accurate, meaningful, and easy to use.
There are two general types of instruments that are used for measuring behavior: objective
measures and subjective measures. Objective measures, which we have not yet talked about, include production data—things such as dollar volume of sales, units produced, and number of errors. Objective measures also include employment data—things such as number of accidents, turnover rates, absences, and tardiness. As you can see, these objective measures all deal with quantitative data. This quantitative data is intuitively appealing because it is not biased by subjective interpretation. The problem with objective measures, however, is that they often do not measure performance, but rather factors beyond an individual’s control. For example, dollar volume of sales is influenced by numerous factors beyond a particular salesperson’s control—things such as territory location, nature of the competition, price and quality of the product, and so forth. It is imperative to keep in mind that the purpose of performance appraisals is to judge an individual’s performance, not factors beyond his or her control. This is one shortcoming of objective performance measures. Furthermore, production data, a type of objective measure, is clearly not an appropriate form of performance measurement for a lecture TA. The job of a lecture TA is not a production job. In other words, lecture TAs are not producing anything. The job of a TA is a nonproduction job. A nonproduction job is one in which competence or efficiency is measured in qualitative terms.
Because of these disadvantages of objective measures, researchers have placed major
emphasis on subjective measures of performance. When you rated the practice lectures a few minutes ago, you were using a subjective measurement instrument. However, subjective measures also have problems of their own. They depend on human judgment, and are therefore prone to certain kinds of biases. For subjective measures to be useful, they must be based on a careful analysis of the behaviors important for effective performance--this is why we took the time to identify examples of lecture TA behaviors.
There is enormous variation in the types of subjective performance measures used by
organizations. Some use a long list of elaborate rating scales; others use only a few simple scales; while still others require raters to write a paragraph or two concerning the performance of each of the ratees. The method we have chosen for today’s study is a sort of amalgamation of these latter two options. We have provided you with a rather simple rating scale, but we have also asked you to combine your numerical ratings along with a written justification for your ratings. We believe that this will help to provide ratings of better quality.
Now, whenever a performance appraisal system is implemented, the people performing the
evaluations should be trained to appropriately conduct performance appraisals. This includes familiarizing the raters with the rating scale, minimizing their fear of being criticized by ratees

146
for making judgments, and illustrating the need for the performance evaluation. Also, the raters should be knowledgeable about the philosophy, objectives, and standards of the chosen performance appraisal system. This is what we hope to accomplish today.
It is important to keep in mind that performance appraisal is not practiced only in business. Indeed, it has been taking place throughout your academic career.
As a student, what are some ways in which your performance has been evaluated? (e.g., tests, term papers, research proposals, etc) WRITE THESE EXAMPLES ON THE
CHALKBOARD
Recap of What’s Been Covered Thus Far
(overhead # 4 of what we’ve covered so far) Okay, so far we’ve learned that it is important for raters to be aware of the (1) philosophy, (2) objectives, and (3) standards of the chosen appraisal system.
Now, let’s go back to your practice ratings from the mock lecture performances, and see
how well you did. COLLECT THEIR RATING FORMS, AND GIVE THE GROUP A 10 MINUTE BREAK. WHILE THEY’RE ON BREAK WRITE DOWN EVERYONE’S RATINGS ON THE CHALKBOARD. YOU SHOULD WRITE DOWN THEIR RATINGS IN THE FOLLOWING FORM:
RATER NAME ORG. DELIVERY KNOWLEDGE OVERALL 1ST PERFORMANCE: ____ ____ ____ ____ 2ND PERFORMANCE: ____ ____ ____ ____ 3RD PERFORMANCE: ____ ____ ____ ____
Pretest Rating “Feedback” AFTER BREAK HAND BACK THEIR RATING FORMS
These are your ratings of the three mock lectures. You can see that there are some similarities and some differences in the group’s ratings. Let’s take a look at each of your ratings individually: FOR EACH RATER: • Ask rater, “What is your general impression of your ratings?” “How did you rate?” • Ask group, “In general, how on target are these ratings?” • As the trainer, make a general comment as to the ratings’ level of similarity to other trainees’
ratings. • Any questions?

147
Performance Appraisal Discussion
At this point I would like to switch gears. Before, I lectured for awhile about the concept of performance appraisals. Now, I’d like to have more of a group discussion about performance appraisal, and hear more of what you have to say on the subject.
First of all, speaking more in terms of the business world, do you think it’s important for organizations to conduct performance appraisals? Why? What benefit do they provide?
Those of you who have received performance evaluations in the past, do you think that
they were helpful? Why or why not? Those of you who have had an opportunity to administer performance appraisals, what
did you find that it was a difficult task? Why? At this point you can all take a 10 minute break. When you come back, you will rate the five Intro Psych TAs.
Posttest/Evaluation of the “Real” TAs
(hand out rating forms) It’s now time to rate the real TAs on their lecture performance. It’s important that I emphasize that the reason for doing these ratings is so that the TA’s can receive feedback about their lecture performance, specifically on their strengths and weaknesses. The TAs are the only ones who will have access to this information—their supervisors will NOT see the ratings you assign. Once again, these ratings are strictly for the benefit of the TAs so that they can hone in on their teaching skills. SHOW THE FIVE PERFORMANCES, STOPPING AFTER EACH FOR RATING. COLLECT THEIR RATING FORMS, AND HAND-OUT THE POST-TRAINING QUIZ.
Debriefing
Before you leave today, I need to inform you that the true purpose of today’s study was not to provide intro psych TAs with performance feedback. The people you saw in the videos were actors from the theatre department. The true purpose of the study was two-fold. The first purpose of the study was to determine if people need to be trained to improve the accuracy of their ratings. The second purpose of the study, was to determine if individuals rate performance more accurately if they believe that their performance ratings will only be used to provide feedback, and not be used by the person’s supervisor for determining rewards and punishments. Any questions?

148
Have them sign the debriefing informed consent. Sign extra credit materials. Make sure the intro students have filled out 3 orange opscans with their name, date, SS#, and 077 in the seat space. Thank them for their participation, and dismiss them.

149
Appendix H
Sample of the Rating Scale. Instructions: Rate the performance of the ratees on each of the following dimensions. Rate them on a scale from 0 – 100. A score of 0 would indicate an extremely ineffective performance, a score of 100 would indicate an extremely effective performance, and a score of 50 would be an average performance. Record your justification for your rating in the available spaces. Organization – This is the degree to which the lecturer has put together an orderly and structured presentation such that the material being presented logically and smoothly flows from one point to the next. Delivery – This is the degree to which the lecturer is a skillful speaker. This dimension of teaching effectiveness is what most people think of as public speaking skills. Delivery only refers to the manner in which the lecture is presented, not to the content and organization of the material. Depth of Knowledge – This is the content of the lecture. This refers to the breadth of information presented in the lecture. In other words, this is the comprehensiveness of the lecturer’s presentation. Overall Evaluation – Your general impression of the lecturer’s performance. ______________________________________________________________________________
Ratee 1
Organization Rating: ______ Delivery Rating: ______ Depth of Knowledge Rating: ______

150
Overall Rating: ______

151
Table 4.1 Descriptive Statistics (Standard Scores): Accuracy Components Broken Down by Type of Training and Purpose Pretest
FOR RVT AO SOT-CON Accuracy Type Purpose M SD n M SD n M SD n M SD n ELEV ADM .24 1.22 21 -.19 .86 17 -.05 .78 18 -.07 1.14 17 DEV .21 1.04 19 .19 .97 15 -.52 .84 16 .07 .99 23 DIFEL ADM .08 1.03 21 -.52 .72 17 -.27 .77 18 -.20 .87 17 DEV .39 1.15 19 .80 .90 15 -.38 .55 16 .09 1.20 23 STAC ADM -.10 .89 21 .76 1.81 17 -.12 .63 18 -.27 .67 17 DEV .20 1.13 19 -.07 .69 15 -.35 .56 16 -.06 .79 23 DIFAC ADM -.26 .99 21 .41 1.28 17 -.13 .87 18 -.25 .62 17 DEV .21 1.38 19 .11 .82 15 -.09 .84 16 .03 .95 23 ____________________________________________________________________________________________________________ Posttest
FOR RVT AO SOT-CON Accuracy Type Purpose M SD n M SD n M SD n M SD n ELEV ADM -.10 .85 21 -.13 1.25 17 -.07 1.05 18 -.004 1.16 17 DEV -.20 .85 19 .35 1.01 15 -.25 .83 16 .36 .96 23 DIFEL ADM -.17 .70 21 -.36 .88 17 .16 1.10 18 -.20 .86 17 DEV .26 1.31 19 -.04 .93 15 -.31 .79 16 .48 1.09 23 STAC ADM .16 .90 21 -.09 1.21 17 -.17 .98 18 .30 .90 17 DEV .01 .67 19 -.19 1.19 15 -.63 .69 16 .38 1.13 23 DIFAC ADM .16 .91 21 -.12 .79 17 -.21 1.04 18 -.11 1.09 17

152
DEV -.29 .80 19 .31 1.00 15 -.09 1.31 16 .28 1.02 23

153
Table 4.2 Correlations Among Accuracy Measures
Measure 1 2 3 4 1. Elevation 2. Differential Elevation 3. Stereotype Accuracy 4. Differential Accuracy
-- .328** -.043 .045
.217** -- -.044 .015
.063 .045 -- .180*
-.038 -.006 .588** --
Note. Correlations of pretest scores are above the diagonal. Correlations on posttest scores are below the diagonal. * p < .05 ** p < .01

154
Table 4.3 Source Table for 4 (Training Condition) x 2 (Purpose) x 2 (Time) Repeated Measures Analyses of Variance for Cronbach’s Accuracy Measures ____________________________________________________________________________________________________________ Between subjects
Elevation Differential elevation Stereotype accuracy Differential accuracy
Source df MS F df MS F df MS F df MS F Training Type (TT) 3 1.43 1.20 3 1.52 1.43 3 2.83 2.94* 3 1.10 .95 Purpose (P) 1 .36 .31 1 8.5 8.12** 1 1.56 1.63 1 1.02 .88 TT x P 3 1.90 1.59 3 3.64 3.44* 3 1.64 1.71 3 .40 .35 Error 138 1.19 -- 138 1.06 -- 138 .96 -- 138 1.16 -- ___________________________________________________________________________________________________________ Within subjects
Elevation Differential elevation Stereotype accuracy Differential accuracy Source df MS F df MS F df MS F df MS F Time (T) 1 .00 .01 1 .00 .05 1 .00 .0 1 .00 .01 T x TT 3 1.29 1.61 3 1.42 1.78 3 3.06 3.24* 3 .41 .49 T x P 1 .32 .40 1 .80 1.01 1 .00 .00 1 .00 .00 T x TT x P 3 .19 .15 3 1.62 2.03 3 1.14 1.21 3 2.13 2.53

155
Error 138 .80 -- 138 .80 -- 138 .94 -- 138 .84 --
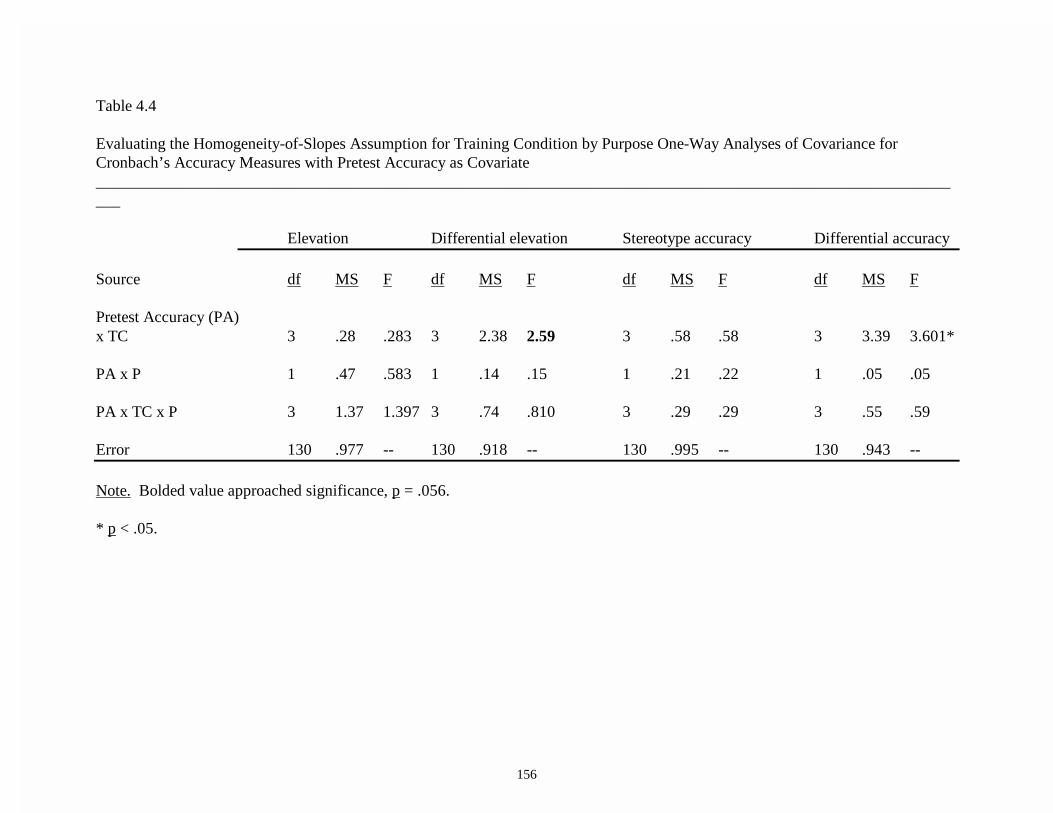
156
Table 4.4 Evaluating the Homogeneity-of-Slopes Assumption for Training Condition by Purpose One-Way Analyses of Covariance for Cronbach’s Accuracy Measures with Pretest Accuracy as Covariate ____________________________________________________________________________________________________________
Elevation Differential elevation Stereotype accuracy Differential accuracy Source df MS F df MS F df MS F df MS F Pretest Accuracy (PA) x TC 3 .28 .283 3 2.38 2.59 3 .58 .58 3 3.39 3.601* PA x P 1 .47 .583 1 .14 .15 1 .21 .22 1 .05 .05 PA x TC x P 3 1.37 1.397 3 .74 .810 3 .29 .29 3 .55 .59 Error 130 .977 -- 130 .918 -- 130 .995 -- 130 .943 -- Note. Bolded value approached significance, p = .056. * p < .05.

157
Table 4.5 Training Condition by Purpose One-Way Analyses of Covariance for Cronbach’s Accuracy Measures with Pretest Accuracy as the Covariate Elevation Differential elevation Stereotype accuracy Differential accuracy ____________________________________________________________________________________________________________ Source df MS F df MS F df MS F df MS F PA 1 5.28 5.454* 1 2.60 2.734 1 .01 .013 1 3.41 3.466 TC 3 1.18 1.217 -- -- -- 3 3.61 3.74* -- -- -- P 1 .68 .701 1 1.03 1.085 1 .83 .864 1 .37 .375 TC x P 3 .63 .650 -- -- -- 3 .44 .455 -- -- -- Error 137 .968 -- 137 .951 -- 137 .964 -- 137 .985 -- Note. Blank spaces indicate that the results could not be meaningfully interpreted due to significant factor X covariate interaction. * p < .05.

158
Table 4.6 Descriptive Statistics for Raw Deviation Scores: Alternative Accuracy Components Broken Down by Type of Training and Purpose Pretest
FOR RVT AO SOT-CON Accuracy Type Purpose M SD n M SD n M SD n M SD n ELEV ADM -2.60 13.24 21 -2.20 10.72 17 -2.05 11.32 18 -1.24 13.06 17 DEV 2.37 14.12 19 .65 13.97 15 -.86 8.86 16 -5.06 12.10 23 DIFEL 1ST ADM -2.21 17.21 21 -2.01 13.16 17 3.00 13.02 18 -4.72 12.97 17 DEV 5.08 19.12 19 1.62 17.26 15 .13 12.83 16 -4.25 15.56 23 DIFEL 2ND ADM -6.85 16.81 21 -1.07 14.56 17 1.01 14.52 18 3.49 20.25 17 DEV 7.72 18.77 19 -4.80 26.87 15 -5.16 14.23 16 -2.25 22.00 23 DIFEL 3RD ADM -13.74 15.71 21 -3.5 11.80 17 -10.14 12.01 18 -2.49 13.07 17 DEV -5.70 16.24 19 -4.45 11.45 15 2.45 6.00 16 -8.67 9.38 23 STAC 1ST ADM -9.41 14.72 21 -3.16 15.30 17 -.65 12.59 18 -3.49 14.05 17 DEV 1.25 16.12 19 2.51 12.78 15 -2.27 8.76 16 -5.20 11.64 23 STAC 2ND ADM -8.16 13.26 21 -6.37 13.28 17 -4.22 12.48 18 .04 12.27 17 DEV 2.85 14.89 19 .34 15.48 15 -.58 10.13 16 -6.47 12.62 23 STAC 3RD ADM -5.77 14.30 21 2.41 13.19 17 -1.24 12.7 18 -.16 14.29 17 DEV 2.98 16.27 19 .33 15.09 15 .48 9.85 16 -3.45 13.91 23 STAC 4TH ADM -7.07 13.49 21 -1.67 11.47 17 -2.06 9.84 18 -1.36 13.37 17 DEV 2.40 13.63 19 -.56 14.86 15 -1.07 8.92 16 -5.10 13.21 23

159
Table 6 cont. FOR RVT AO SOT-CON
Accuracy Type Purpose M SD n M SD n M SD n M SD n DIFAC R1D1 ADM -6.38 17.06 21 -10.71 16.04 17 .50 18.13 18 -12.18 12.69 17 DEV -.89 20.32 19 -.33 16.68 15 -4.75 17.94 16 -10.17 16.00 23 DIFAC R1D2 ADM -2.95 17.61 21 -3.47 13.54 17 2.83 13.13 18 -2.53 15.76 17 DEV 4.05 17.92 19 3.67 17.92 15 -2.44 12.93 16 -3.61 16.26 23 DIFAC R1D3 ADM 1.71 18.80 21 7.29 17.81 17 5.33 13.50 18 -1.06 14.90 17 DEV 11.63 22.94 19 4.67 21.00 15 7.25 13.60 16 -.30 18.65 23 DIFAC RID4 ADM -1.24 17.99 21 -1.18 14.65 17 3.33 12.21 18 -3.12 13.63 17 DEV 5.53 19.06 19 1.47 18.03 15 .44 13.82 16 -2.91 17.06 23 DIFAC R2D1 ADM -6.05 22.79 21 5.06 24.26 17 5.22 14.54 18 6.94 22.73 17 DEV 8.58 26.67 19 10.00 29.76 15 -3.75 11.90 16 -1.17 22.31 23 DIFAC R2D2 ADM -7.24 17.73 21 -7.76 18.58 17 .06 19.54 18 3.24 21.47 17 DEV 12.26 22.91 19 5.67 24.24 15 -1.19 18.00 16 -1.48 21.76 23 DIFAC R2D3 ADM -7.14 17.96 21 1.29 19.32 17 -1.89 17.70 18 1.18 21.80 17 DEV 1.42 24.24 19 -.67 28.31 15 -10.00 20.13 16 -3.57 24.34 23 DIFAC R2D4 ADM -6.95 16.86 21 -2.88 18.93 17 .63 13.54 18 2.59 20.65 17 DEV 8.63 17.39 19 4.20 27.63 15 -5.69 13.64 16 -2.78 23.12 23 DIFAC R3D1 ADM -15.81 19.62 21 -3.82 17.79 17 -7.67 12.88 18 5.24 17.22 17 DEV -3.95 16.49 19 .87 6.13 15 1.69 6.90 16 -4.26 8.22 23 DIFAC R3D2 ADM -14.29 18.74 21 -7.88 16.33 17 -15.56 17.05 18 -.59 10.29 17

160
DEV -7.79 16.72 19 -8.33 17.90 15 1.88 8.51 16 -14.35 15.93 23 Table 6 cont. DIFAC R3D3 ADM -11.86 17.10 21 -1.35 16.59 17 -7.17 13.85 18 -.59 12.61 17 DEV -4.11 17.90 19 -3.00 16.99 15 4.19 5.01 16 -6.48 15.39 23 DIFAC R3D4 ADM -13.00 14.30 21 -.94 5.26 17 -10.17 10.97 18 -3.53 13.17 17 DEV -6.95 17.47 19 -7.33 14.09 15 2.06 5.71 16 -9.61 10.82 23

161
Table 7 Descriptive Statistics for Raw Deviation Scores: Alternative Accuracy Components Broken Down by Type of Training and Purpose Posttest
FOR RVT AO SOT-CON Accuracy Type Purpose M SD n M SD n M SD n M SD n ELEV ADM 5.89 9.33 21 6.21 11.15 17 8.12 8.84 18 7.04 10.88 17 DEV 2.89 10.07 19 10.45 9.91 15 2.72 9.73 16 7.91 11.91 23 DIFEL 1ST ADM 6.45 8.36 21 6.81 14.40 17 5.93 13.78 18 -.82 10.94 17 DEV 1.20 15.89 19 4.65 14.17 15 3.97 13.80 16 7.98 19.72 23 DIFEL 2ND ADM 2.42 16.70 21 8.21 18.88 17 3.31 15.05 18 2.90 19.59 17 DEV -1.09 18.42 19 9.83 15.55 15 .03 11.18 16 7.14 19.79 23 DIFEL 3RD ADM 8.21 18.44 21 9.34 17.87 17 14.32 12.80 18 15.13 12.29 17 DEV 2.29 20.12 19 20.12 16.43 15 2.81 16.39 16 17.53 18.43 23 DIFEL 4TH ADM 13.98 12.00 21 11.34 10.87 17 14.32 12.80 18 15.13 12.29 17 DEV 13.36 17.69 19 19.47 11.70 15 12.23 14.07 16 10.33 18.86 23 DIFEL 5TH ADM -3.61 6.77 21 -4.62 7.55 17 -2.33 9.66 18 .31 3.63 17 DEV -1.32 7.60 19 -1.83 5.70 15 -5.47 11.31 16 -3.41 8.89 23 STAC 1ST ADM 3.03 9.81 21 3.41 11.55 17 6.27 8.64 18 2.93 12.38 17 DEV -.84 10.08 19 9.89 10.27 15 .33 9.10 16 7.23 12.68 23 STAC 2ND ADM 7.74 10.27 21 7.88 11.67 17 9.31 9.01 18 8.86 12.20 17 DEV 5.02 9.48 19 10.65 11.24 15 2.08 10.78 16 9.01 12.94 23 STAC 3RD ADM 4.50 9.93 21 5.61 11.84 17 6.58 9.86 18 6.62 9.65 17 DEV 1.78 11.72 19 8.69 10.32 15 3.80 10.20 16 5.70 12.06 23

162
Table 7 cont. FOR RVT AO SOT-CON
Accuracy Type Purpose M SD n M SD n M SD n M SD n STAC 4TH ADM 8.29 9.59 21 7.95 11.52 17 10.33 9.90 18 9.73 10.96 17 DEV 5.59 10.15 19 12.55 10.08 15 4.66 9.76 16 9.72 12.71 23 R1D1 ADM 1.81 11.19 21 1.35 17.28 17 1.17 15.83 18 -6.59 15.86 17 DEV -1.95 20.65 19 4.53 15.86 15 -1.44 16.52 16 6.04 22.23 23 R1D2 ADM 3.14 11.13 21 6.29 16.96 17 2.11 12.37 18 -3.24 10.15 17 DEV -1.63 16.47 19 -1.67 15.08 15 -2.25 9.27 16 4.83 21.3 23 R1D3 ADM 11.43 11.87 21 11.53 14.48 17 11.06 16.31 18 4.76 11.96 17 DEV 3.79 16.52 19 8.87 16.72 15 14.00 20.21 16 11.26 19.72 23 R1D4 ADM 9.43 9.20 21 8.06 14.81 17 9.39 15.45 18 1.76 10.99 17 DEV 4.58 15.94 19 6.87 15.29 15 5.56 13.57 16 9.78 21.22 23 R2D1 ADM -7.95 13.38 21 .00 20.91 17 -3.94 15.67 18 -5.29 21.47 17 DEV -10.74 17.21 19 2.00 18.78 15 -6.88 11.99 16 1.39 20.58 23 R2D2 ADM 6.24 20.05 21 9.94 19.06 17 7.83 17.08 18 6.06 21.87 17 DEV -.74 17.70 19 12.00 19.98 15 2.56 15.39 16 10.04 21.58 23 R2D3 ADM 2.81 20.55 21 9.94 19.06 17 7.83 17.08 18 6.06 21.87 17 DEV 1.89 22.21 19 10.67 15.06 15 -.38 10.02 16 5.30 22.52 23 R2D4 ADM 8.57 18.20 21 13.47 18.32 17 7.06 15.78 18 7.41 19.59 17 DEV 5.21 19.67 19 14.67 16.61 15 4.81 10.85 16 11.83 20.63 23 R3D1 ADM 15.62 21.16 21 15.24 19.34 17 25.44 22.37 18 18.82 25.22 17
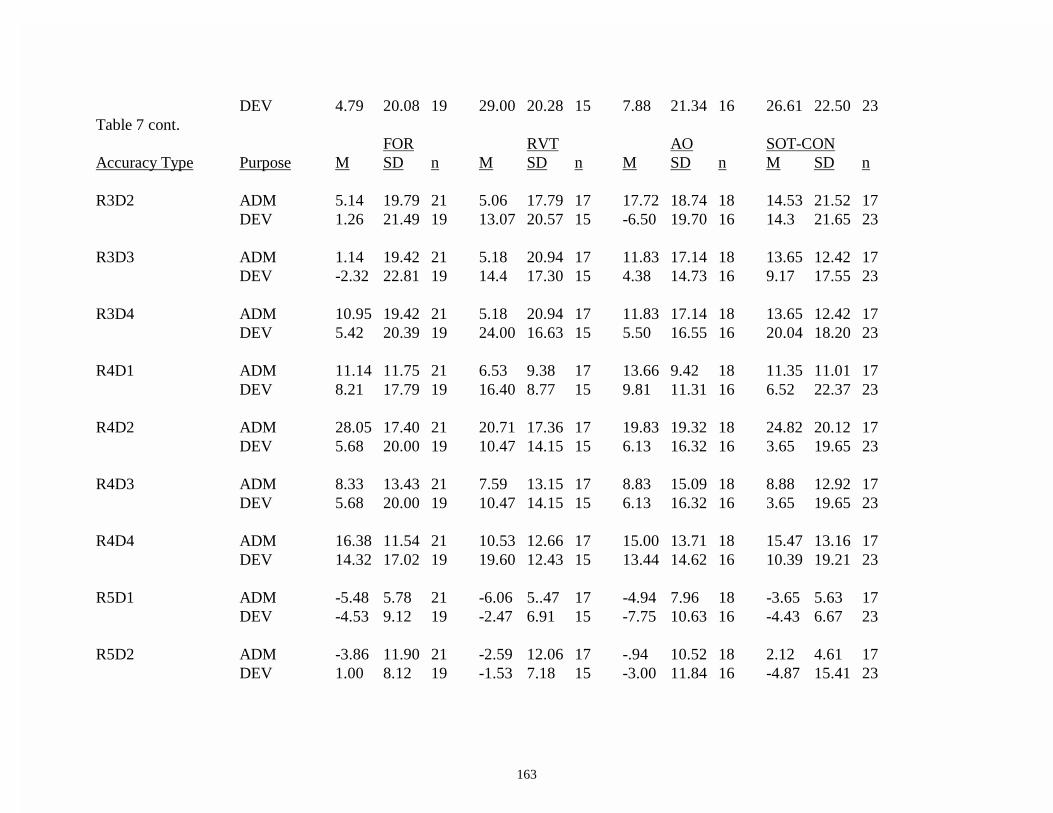
163
DEV 4.79 20.08 19 29.00 20.28 15 7.88 21.34 16 26.61 22.50 23 Table 7 cont.
FOR RVT AO SOT-CON Accuracy Type Purpose M SD n M SD n M SD n M SD n R3D2 ADM 5.14 19.79 21 5.06 17.79 17 17.72 18.74 18 14.53 21.52 17 DEV 1.26 21.49 19 13.07 20.57 15 -6.50 19.70 16 14.3 21.65 23 R3D3 ADM 1.14 19.42 21 5.18 20.94 17 11.83 17.14 18 13.65 12.42 17 DEV -2.32 22.81 19 14.4 17.30 15 4.38 14.73 16 9.17 17.55 23 R3D4 ADM 10.95 19.42 21 5.18 20.94 17 11.83 17.14 18 13.65 12.42 17 DEV 5.42 20.39 19 24.00 16.63 15 5.50 16.55 16 20.04 18.20 23 R4D1 ADM 11.14 11.75 21 6.53 9.38 17 13.66 9.42 18 11.35 11.01 17 DEV 8.21 17.79 19 16.40 8.77 15 9.81 11.31 16 6.52 22.37 23 R4D2 ADM 28.05 17.40 21 20.71 17.36 17 19.83 19.32 18 24.82 20.12 17 DEV 5.68 20.00 19 10.47 14.15 15 6.13 16.32 16 3.65 19.65 23 R4D3 ADM 8.33 13.43 21 7.59 13.15 17 8.83 15.09 18 8.88 12.92 17 DEV 5.68 20.00 19 10.47 14.15 15 6.13 16.32 16 3.65 19.65 23 R4D4 ADM 16.38 11.54 21 10.53 12.66 17 15.00 13.71 18 15.47 13.16 17 DEV 14.32 17.02 19 19.60 12.43 15 13.44 14.62 16 10.39 19.21 23 R5D1 ADM -5.48 5.78 21 -6.06 5..47 17 -4.94 7.96 18 -3.65 5.63 17 DEV -4.53 9.12 19 -2.47 6.91 15 -7.75 10.63 16 -4.43 6.67 23 R5D2 ADM -3.86 11.90 21 -2.59 12.06 17 -.94 10.52 18 2.12 4.61 17 DEV 1.00 8.12 19 -1.53 7.18 15 -3.00 11.84 16 -4.87 15.41 23
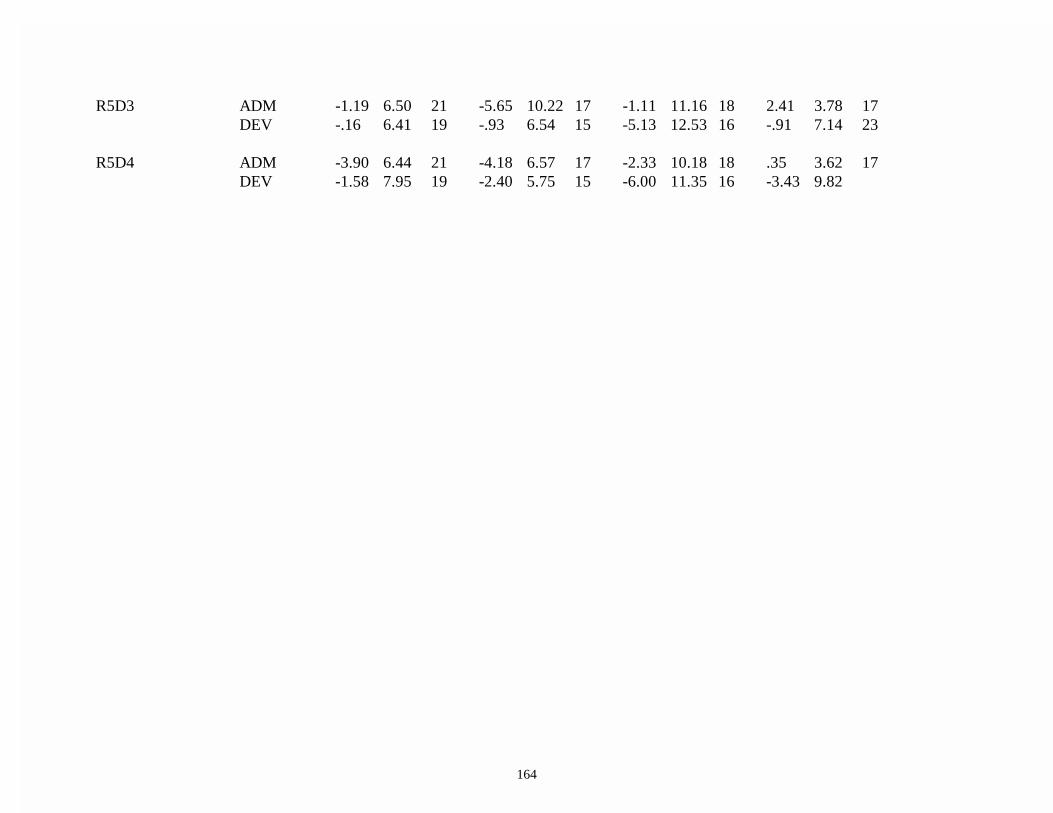
164
R5D3 ADM -1.19 6.50 21 -5.65 10.22 17 -1.11 11.16 18 2.41 3.78 17 DEV -.16 6.41 19 -.93 6.54 15 -5.13 12.53 16 -.91 7.14 23 R5D4 ADM -3.90 6.44 21 -4.18 6.57 17 -2.33 10.18 18 .35 3.62 17 DEV -1.58 7.95 19 -2.40 5.75 15 -6.00 11.35 16 -3.43 9.82

165
Training by Purpose Interaction for Pretest Differential Elevation
-0.6
-0.4
-0.2
0
0.2
0.4
0.6
0.8
1
Administrative Developmental
Purpose
Pre
test
Dif
fere
nti
al E
leva
tio
n (
z)FOR
RVT
AO
SOT-Con
Figure 4.1. Training by Purpose Interaction for Pretest Differential Elevation

166
Training by Purpose Interaction for Pretest Stereotype Accuracy
-0.6
-0.4
-0.2
0
0.2
0.4
0.6
0.8
1
Administrative Developmental
Purpose
Pre
test
Ste
reo
typ
e A
ccu
racy
(z)
FOR
RVT
AO
SOT-Con
Figure 4.2. Training by Purpose Interaction for Pretest Stereotype Accuracy

167
Differential Elevation for Training Condition by Purpose Interaction Aggregated over Pretest and Posttest
-0.5
-0.4
-0.3
-0.2
-0.1
0
0.1
0.2
0.3
0.4
0.5
Administrative Developmental
Purpose
Dif
fere
nti
al E
leva
tio
n (
z)FOR
RVT
AO
SOT-Con
Figure 4.3. Differential Elevation for Training Condition by Purpose Interaction Aggregated over Pretest and Posttest

168
Stereotype Accuracy for Time by Training Interaction Aggregated over Purpose
-0.5
-0.4
-0.3
-0.2
-0.1
0
0.1
0.2
0.3
0.4
0.5
Pretest Posttest
Time
Ste
reo
typ
e A
ccu
racy
(z)
FOR
RVT
AO
SOT-Con
Figure 4.4. Stereotype Accuracy for Time by Training Interaction Aggregated over Purpose
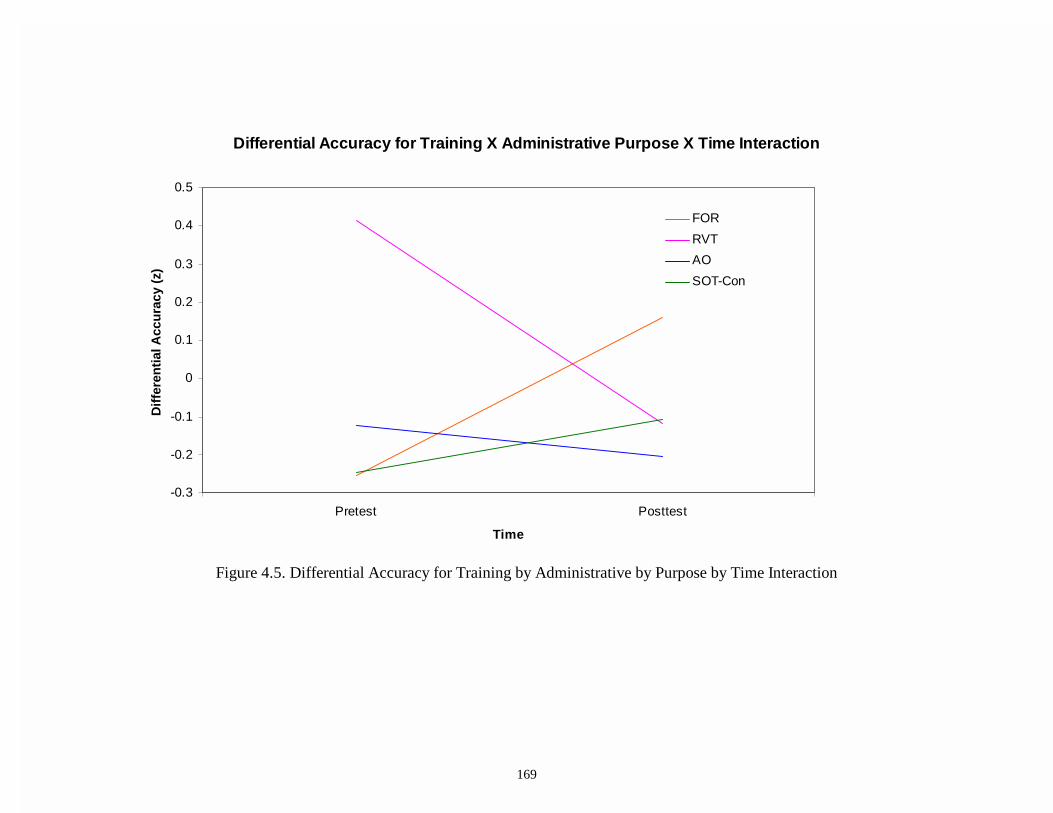
169
Differential Accuracy for Training X Administrative Purpose X Time Interaction
-0.3
-0.2
-0.1
0
0.1
0.2
0.3
0.4
0.5
Pretest Posttest
Time
Dif
fere
nti
al A
ccu
racy
(z)
FOR
RVT
AO
SOT-Con
Figure 4.5. Differential Accuracy for Training by Administrative by Purpose by Time Interaction

170
Differential Accuracy for Training X Developmental Purpose X Time Interaction
-0.4
-0.3
-0.2
-0.1
0
0.1
0.2
0.3
0.4
Pretest Posttest
Time
Dif
fere
nti
al A
ccu
racy
(z)
FOR
RVT
AO
SOT-Con
Figure 4.6. Differential Accuracy for Training by Developmental Purpose by Time Interaction

171
Regression Lines for Differential Elevation Collapsed Over Purpose
-0.6
-0.4
-0.2
0
0.2
0.4
0.6
-1 -0.8 -0.6 -0.4 -0.2 0 0.2 0.4 0.6 0.8 1
Pretest
Po
stte
st
FOR
RVT
AO
SOT-Con
Figure 4.7. Regression Lines for Differential Elevation Collapsed Over Purpose

172
Regression Lines for Differential Accuracy Collapsed Over Purpose
-0.8
-0.6
-0.4
-0.2
0
0.2
0.4
0.6
-1 -0.8 -0.6 -0.4 -0.2 0 0.2 0.4 0.6 0.8 1
Pretest
Po
stte
st
FOR
RVT
AO
SOT-Con
Figure 4.8. Regression Lines for Differential Accuracy Collapsed Over Purpose

173
Training by Purpose Interaction for Alternative Pretest Differential Elevation, Second Component
-0.8
-0.6
-0.4
-0.2
0
0.2
0.4
Administrative Developmental
Purpose
Alt
ern
ativ
e P
rete
st D
iffe
ren
tial
Ele
vati
on
, 2n
d C
om
po
nen
t (z
)
FOR
RVT
AO
SOT-Con
Figure 4.9. Training by Purpose Interaction for Alternative Pretest Differential Elevation, Second Component
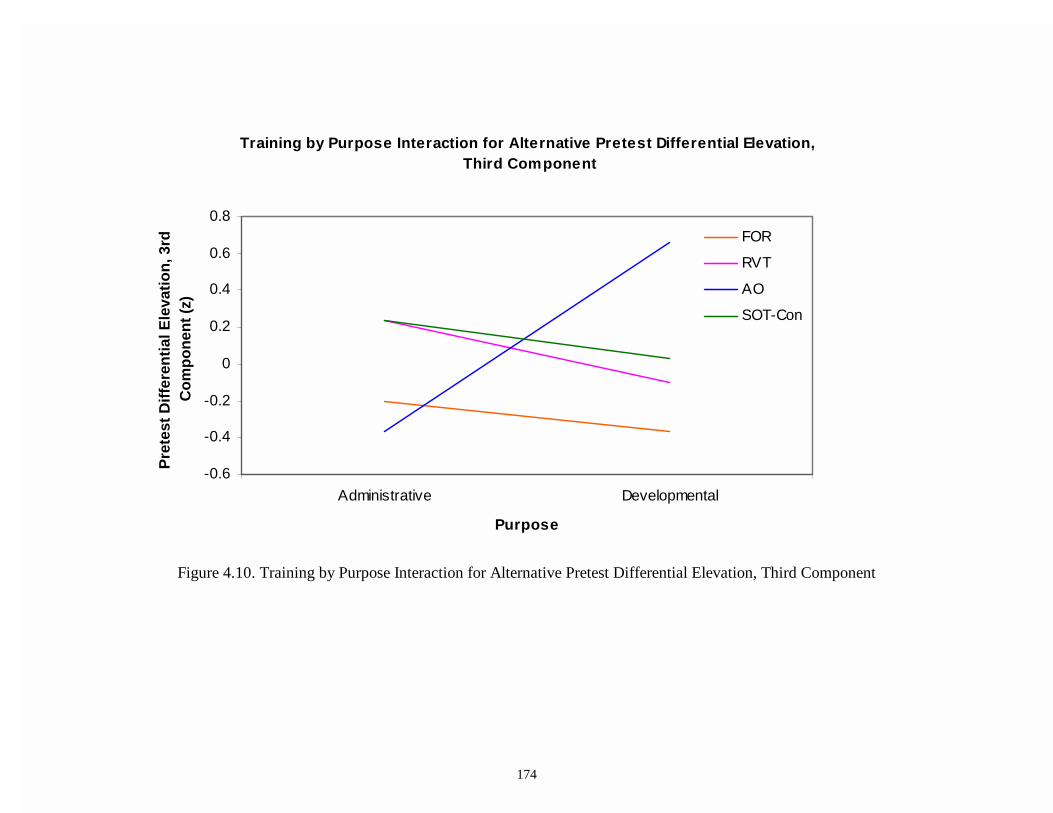
174
Training by Purpose Interaction for Alternative Pretest Differential Elevation, Third Component
-0.6
-0.4
-0.2
0
0.2
0.4
0.6
0.8
Administrative Developmental
Purpose
Pre
test
Dif
fere
nti
al E
leva
tio
n, 3
rd
Co
mp
on
ent
(z)
FOR
RVT
AO
SOT-Con
Figure 4.10. Training by Purpose Interaction for Alternative Pretest Differential Elevation, Third Component

175
Training by Purpose Interaction for Alternative Pretest Stereotype Accuracy, Second Component
-0.8
-0.6
-0.4
-0.2
0
0.2
0.4
0.6
Administrative Developmental
Purpose
Alt
ern
ativ
e P
rete
st S
tere
oty
pe
Acc
ura
cy,
2nd
Co
mp
on
ent
(z)
FOR
RVT
AO
SOT-Con
Figure 4.11. Training by Purpose Interaction for Alternative Pretest Stereotype Accuracy, Second Component

176
Alternative Analysis--Residualized Differential Elevation Ratee Components for Administrative Purpose Conditions
-8
-6
-4
-2
0
2
4
6
8
R1 R2 R3 R4 R5
Ratees
Mea
n R
aw D
evia
tio
n S
core
sFOR
RVT
AO
SOT-Con
Figure 4.12. Alternative Analysis—Residualized Differential Elevation Ratee Components for Administrative Purpose Conditions

177
Alternative Analysis--Residualized Differential Elevation Ratee Components for Developmental Purpose Conditions
-10
-8
-6
-4
-2
0
2
4
6
8
10
R1 R2 R3 R4 R5
Ratees
Mea
n R
aw D
evia
tio
n S
core
sFOR
RVT
AO
SOT-Con
Figure 4.13. Alternative Analysis—Residualized Differential Elevation Ratee Components for Developmental Purpose Conditions

178
Alternative Analysis--Residualized Stereotype Accuracy Dimension Components for Administrative Purpose Conditions
-1.5
-1
-0.5
0
0.5
1
1.5
2
2.5
D 1 D 2 D 3 D 4
Dimensions
Mea
n R
aw D
evia
tio
n S
core
s
FOR
RVT
AO
SOT-Con
Figure 4.14. Alternative Analysis—Residualized Stereotype Accuracy Dimension Components for Administrative Purpose
Conditions

179
Alternative Analysis--Residualized Stereotype Accuracy Dimension Components for Developmental Purpose Conditions
-8
-6
-4
-2
0
2
4
6
8
D 1 D 2 D 3 D 4
Dimensions
Mea
n R
aw D
evia
tio
n S
core
s
FOR
RVT
AO
SOT-Con
Figure 4.15. Alternative Analysis—Residualized Stereotype Accuracy Dimension Components for Developmental Purpose
Conditions

180
Alternative Analysis--Residualized Differential Accuracy Ratee by Dimension Components for Administrative Purpose Conditions
-10
-8
-6
-4
-2
0
2
4
6
8
10
12
r1d1 r1d2 r1d3 r1d4 r2d1 r2d2 r2d3 r2d4 r3d1 r3d2 r3d3 r3d4 r4d1 r4d2 r4d3 r4d4 r5d1 r5d2 r5d3 r5d4
Ratees by Dimensions
Mea
n R
aw D
evia
tio
n S
core
s
FOR
RVT
AO
SOT-Con
Figure 4.16. Alternative Analysis—Residualized Differential Accuracy Ratee by Dimension Components for Administrative Purpose
Conditions

181
Alternative Analysis--Residualized Differential Accuracy Ratee by Dimension Components for Developmental Purpose Conditions
-20
-15
-10
-5
0
5
10
15
r1d1 r1d2 r1d3 r1d4 r2d1 r2d2 r2d3 r2d4 r3d1 r3d2 r3d3 r3d4 r4d1 r4d2 r4d3 r4d4 r5d1 r5d2 r5d3 r5d4
Ratees by Dimensions
Mea
n R
aw D
evia
tio
n S
core
s
FOR
RVT
AO
SOT-Con
Figure 4.17. Alternative Analysis—Residualized Differential Accuracy Ratee by Dimension Components for Developmental Purpose
Conditions

182
ANDREA L. SINCLAIR Home Address and Phone Office Address and Phone 1300-H Houndschase Ln, NW Academic Assessment Program Blacksburg, VA 24060 Hillcrest Hall 103 (540) 961 – 0569 Virginia Polytechnic Institute and State University (540) 231 – 4581 EDUCATION
M.S. Industrial/Organizational Psychology, expected December 2000 Virginia Polytechnic Institute and State University Blacksburg, Virginia Thesis Title: Differentiating Rater Accuracy Training Programs B.A. Psychology, May 1998 Hanover College Hanover, Indiana Thesis Title: Moderating Effects of Gender on Perceptions of Aggressive Behavior.
PROFESSIONAL AND RESEARCH ACTIVITIES May 1999 – Academic Assessment Program Graduate Assistant – Virginia Tech Present Conduct focus groups Create surveys and databases and analyze data Review courses in the core curriculum Deliver Presentations Edit Newsletters Maintain Website August 1998 – Recitation Instructor for Introductory Psychology – Virginia Tech May 1999 Responsible for the planning and instruction of four introductory
psychology courses within a single academic year December 1999 – Consulting Assistant to Shenandoah Life Insurance Co.—Roanoke, August 1999 Virginia
Developed questionnaire for the collection of data on compensation practices and use of information technologies

183
PUBLICATION Maiden name is Buuck
Buuck, A.L. (1999). “Rivalry versus harmony: The role of group goals.” In Helena K.
Chandler and Jack W. Finney (Eds.), Exploring Introductory Psychology: A Reader and Workbook. New York: McGraw-Hill, Inc.
CONFERENCE PRESENTATIONS
Sinclair, A.L. (April 2001). Paper under review for presentation at the 2001 Annual Conference of the Society for Industrial and Organizational Psychology, San Diego, CA.
Buuck, A.L. (April 1998). Moderating Effects of Gender of Perceptions of Aggressive
Behavior. Paper presented at Seventieth Annual Meeting of the Midwestern Psychological Association, Chicago, Illinois.
GRANT
1998: An analysis of the organizational structure of the Metropolitan Museum of Art. Hanover College Richter Grant Program. Primary Investigator. $2,000. HONORS AND AWARDS
• Dean’s List, Hanover College, 1994 – 1998 • National Honor Society in Psychology 1995 – 1998 • Gamma Sigma Pi, Member • Zirkle Award in Psychology, May 1998 • Samuel Robinson Award Recipient, 1997
PROFESSIONAL AFFILIATIONS
• Society for Industrial and Organizational Psychology, Student Affiliate (1998 –
present) • American Psychological Association, Student Affiliate (2000 – present)