Catalytic Reforming: Critical Variables in Catalytic Reforming and Unit Monitoring Best Practices
Upload
independentCategory
view
3download
0
ME
SD
a
ARRAA
KMMRPH
1
agmraitpc[g
pv
iU
0d
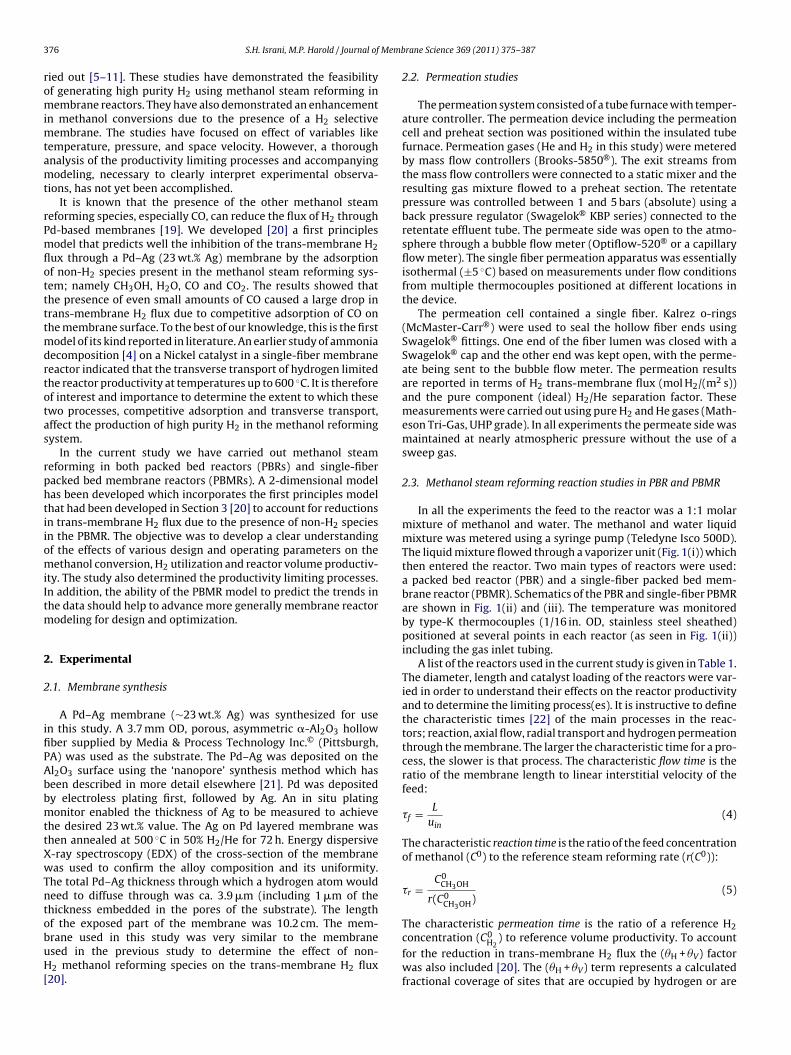
Journal of Membrane Science 369 (2011) 375–387
Contents lists available at ScienceDirect
Journal of Membrane Science
journa l homepage: www.e lsev ier .com/ locate /memsci
ethanol steam reforming in single-fiber packed bed Pd–Ag membrane reactor:xperiments and modeling
ameer H. Israni1, Michael P. Harold ∗
epartment of Chemical & Biomolecular Engineering, University of Houston, Houston, TX 77204-4004, United States
r t i c l e i n f o
rticle history:eceived 29 September 2010eceived in revised form 8 December 2010ccepted 10 December 2010vailable online 21 December 2010
eywords:embrane reactor
a b s t r a c t
The steam reforming of methanol was carried out in both a packed bed reactor (PBR) and single-fiberpacked bed Pd–Ag membrane reactor (PBMR) utilizing a 3.9 �m thick Pd–Ag membrane. A systematiccomparison of the two reactor types was made for key performance metrics such as conversion, pro-ductivity, and hydrogen utilization at different pressures (3–5 bars) and temperatures (250–300 ◦C) ona commercial Cu/ZnO/Al2O3 catalyst. The reactor diameter and catalyst loadings of the PBMR were var-ied in order to determine the rate limiting process. A two-dimensional model was used to simulate theexperiments and to identify the rate limiting process(es). A recently developed model of H2 flux inhibi-
ethanoleformingdydrogen
tion by competitive adsorption of the primary methanol reforming species (CO, CO2, CH3OH, H2O) wasincorporated into the PRMR model [20]. Using the H2 flux parameters and independently determinedreforming kinetics from the PBR studies, very good agreement between the measured and predictedconcentration and temperature dependence on space velocity was obtained. The simulations reveal thatthe rate limiting process is the permeation of H2 through the membrane as a result of the competitiveadsorption of CO in particular. The findings provide guidance on the design improvements needed toachieve higher productivity and hydrogen utilization.
. Introduction
In recent years there has been considerable interest in usingPd membrane reactor to generate ultra high purity hydro-
en for on-demand supply to a hydrogen proton-exchangeembrane fuel cell (PEMFC). Comprehensive reviews of earlier
esearch of Pd membranes, separation units, and reactors haveppeared [1,2]. The membrane reactor approach consolidatesnto one unit the multi-step hydrogen generation and purifica-ion process comprising reforming, water gas shift (WGS), andreferential oxidation (PrOX). A variety of different hydrogen-ontaining feedstocks have been considered, including ammonia
3,4], methanol [5–11], natural gas [12,13], ethanol [14,15], andasoline [16].Methanol is an attractive hydrogen source to generate highurity H2, especially for use in a portable application like a PEMFCehicle. Methanol is a liquid with a fairly high volumetric energy
∗ Corresponding author at: Department of Chemical & Biomolecular Engineer-ng, University of Houston, S225 Engineering Building 1, Houston, TX 77204-4004,nited States. Tel.: +1 713 743 4307; fax: +1 713 743 4323.
E-mail address: [email protected] (M.P. Harold).1 Now with Praxair Inc., Chicago, IL, United States.
376-7388/$ – see front matter © 2010 Elsevier B.V. All rights reserved.oi:10.1016/j.memsci.2010.12.029
© 2010 Elsevier B.V. All rights reserved.
density so its storage on a vehicle does not pose weight or safetyconcerns, as in the case of compressed hydrogen. Methanol is acommodity chemical that can be synthesized readily from vari-ous sources including natural gas and biomass, etc. [17]. Moreover,the reaction conditions of methanol steam reforming are relativelymild, with typical temperatures around 300 ◦C. The comparativelylow reaction temperatures mitigate the cold-start problems thaton-board fuel reformers can encounter [17]. Also, due to the lowreaction temperature, a separate water gas shift reactor is not nec-essary for the methanol system as needed in the processing of otherhydrocarbons [18].
Many studies have focused on methanol steam reforming inPd-based membrane reactors. Along with the methanol reformingreaction,
CH3OH + H2O ↔ 3H2 + CO2, �H = +49.4 kJ/mol (1)
the methanol decomposition reaction,
CH3OH ↔ 2H2 + CO, �H = +90.5 kJ/mol (2)
and the water gas shift reaction,
CO + H2O ↔ 3H2 + CO2, �H = −41.1 kJ/mol (3)
take place in the reactor. Several studies related to methanolsteam reforming in Pd-based membrane reactors have been car-
3 Memb
romimtamt
rPmflottttmdrtotas
rphtiiomiItm
2
2
ifiPAbbmttXwTntobuH[
76 S.H. Israni, M.P. Harold / Journal of
ied out [5–11]. These studies have demonstrated the feasibilityf generating high purity H2 using methanol steam reforming inembrane reactors. They have also demonstrated an enhancement
n methanol conversions due to the presence of a H2 selectiveembrane. The studies have focused on effect of variables like
emperature, pressure, and space velocity. However, a thoroughnalysis of the productivity limiting processes and accompanyingodeling, necessary to clearly interpret experimental observa-
ions, has not yet been accomplished.It is known that the presence of the other methanol steam
eforming species, especially CO, can reduce the flux of H2 throughd-based membranes [19]. We developed [20] a first principlesodel that predicts well the inhibition of the trans-membrane H2
ux through a Pd–Ag (23 wt.% Ag) membrane by the adsorptionf non-H2 species present in the methanol steam reforming sys-em; namely CH3OH, H2O, CO and CO2. The results showed thathe presence of even small amounts of CO caused a large drop inrans-membrane H2 flux due to competitive adsorption of CO onhe membrane surface. To the best of our knowledge, this is the first
odel of its kind reported in literature. An earlier study of ammoniaecomposition [4] on a Nickel catalyst in a single-fiber membraneeactor indicated that the transverse transport of hydrogen limitedhe reactor productivity at temperatures up to 600 ◦C. It is thereforef interest and importance to determine the extent to which thesewo processes, competitive adsorption and transverse transport,ffect the production of high purity H2 in the methanol reformingystem.
In the current study we have carried out methanol steameforming in both packed bed reactors (PBRs) and single-fiberacked bed membrane reactors (PBMRs). A 2-dimensional modelas been developed which incorporates the first principles modelhat had been developed in Section 3 [20] to account for reductionsn trans-membrane H2 flux due to the presence of non-H2 speciesn the PBMR. The objective was to develop a clear understandingf the effects of various design and operating parameters on theethanol conversion, H2 utilization and reactor volume productiv-
ty. The study also determined the productivity limiting processes.n addition, the ability of the PBMR model to predict the trends inhe data should help to advance more generally membrane reactor
odeling for design and optimization.
. Experimental
.1. Membrane synthesis
A Pd–Ag membrane (∼23 wt.% Ag) was synthesized for usen this study. A 3.7 mm OD, porous, asymmetric �-Al2O3 hollowber supplied by Media & Process Technology Inc.© (Pittsburgh,A) was used as the substrate. The Pd–Ag was deposited on thel2O3 surface using the ‘nanopore’ synthesis method which haseen described in more detail elsewhere [21]. Pd was depositedy electroless plating first, followed by Ag. An in situ platingonitor enabled the thickness of Ag to be measured to achieve
he desired 23 wt.% value. The Ag on Pd layered membrane washen annealed at 500 ◦C in 50% H2/He for 72 h. Energy dispersive-ray spectroscopy (EDX) of the cross-section of the membraneas used to confirm the alloy composition and its uniformity.
he total Pd–Ag thickness through which a hydrogen atom wouldeed to diffuse through was ca. 3.9 �m (including 1 �m of thehickness embedded in the pores of the substrate). The length
f the exposed part of the membrane was 10.2 cm. The mem-rane used in this study was very similar to the membranesed in the previous study to determine the effect of non-2 methanol reforming species on the trans-membrane H2 flux20].
rane Science 369 (2011) 375–387
2.2. Permeation studies
The permeation system consisted of a tube furnace with temper-ature controller. The permeation device including the permeationcell and preheat section was positioned within the insulated tubefurnace. Permeation gases (He and H2 in this study) were meteredby mass flow controllers (Brooks-5850®). The exit streams fromthe mass flow controllers were connected to a static mixer and theresulting gas mixture flowed to a preheat section. The retentatepressure was controlled between 1 and 5 bars (absolute) using aback pressure regulator (Swagelok® KBP series) connected to theretentate effluent tube. The permeate side was open to the atmo-sphere through a bubble flow meter (Optiflow-520® or a capillaryflow meter). The single fiber permeation apparatus was essentiallyisothermal (±5 ◦C) based on measurements under flow conditionsfrom multiple thermocouples positioned at different locations inthe device.
The permeation cell contained a single fiber. Kalrez o-rings(McMaster-Carr®) were used to seal the hollow fiber ends usingSwagelok® fittings. One end of the fiber lumen was closed with aSwagelok® cap and the other end was kept open, with the perme-ate being sent to the bubble flow meter. The permeation resultsare reported in terms of H2 trans-membrane flux (mol H2/(m2 s))and the pure component (ideal) H2/He separation factor. Thesemeasurements were carried out using pure H2 and He gases (Math-eson Tri-Gas, UHP grade). In all experiments the permeate side wasmaintained at nearly atmospheric pressure without the use of asweep gas.
2.3. Methanol steam reforming reaction studies in PBR and PBMR
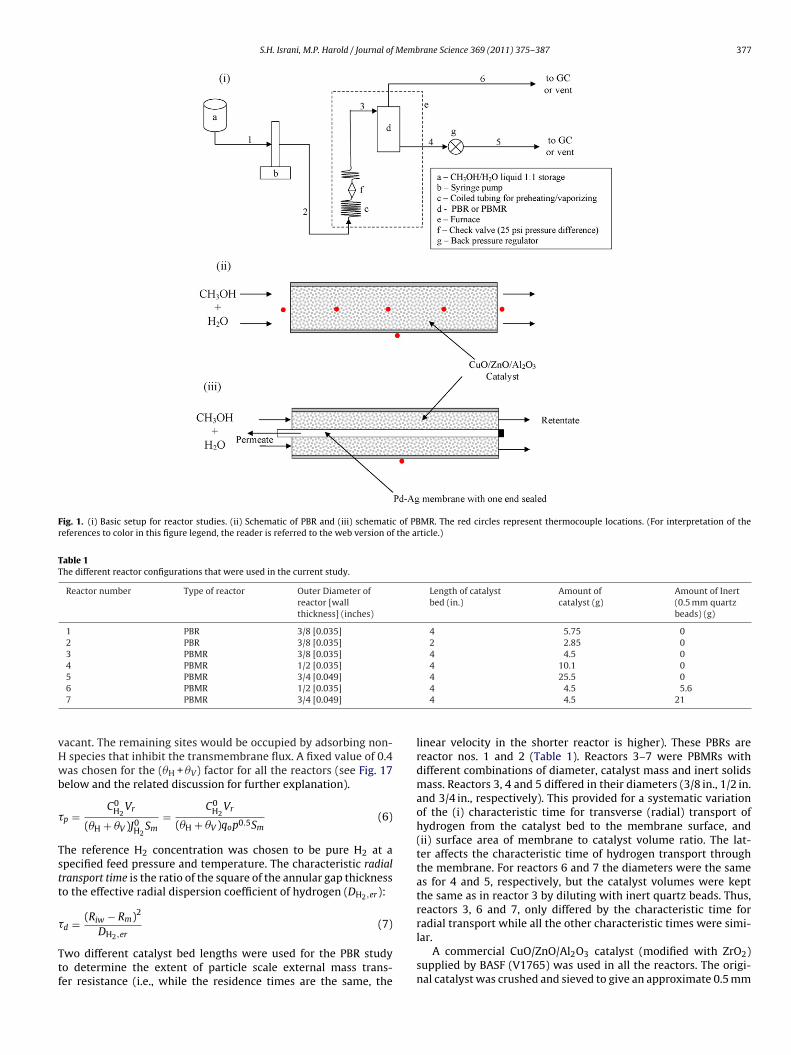
In all the experiments the feed to the reactor was a 1:1 molarmixture of methanol and water. The methanol and water liquidmixture was metered using a syringe pump (Teledyne Isco 500D).The liquid mixture flowed through a vaporizer unit (Fig. 1(i)) whichthen entered the reactor. Two main types of reactors were used:a packed bed reactor (PBR) and a single-fiber packed bed mem-brane reactor (PBMR). Schematics of the PBR and single-fiber PBMRare shown in Fig. 1(ii) and (iii). The temperature was monitoredby type-K thermocouples (1/16 in. OD, stainless steel sheathed)positioned at several points in each reactor (as seen in Fig. 1(ii))including the gas inlet tubing.
A list of the reactors used in the current study is given in Table 1.The diameter, length and catalyst loading of the reactors were var-ied in order to understand their effects on the reactor productivityand to determine the limiting process(es). It is instructive to definethe characteristic times [22] of the main processes in the reac-tors; reaction, axial flow, radial transport and hydrogen permeationthrough the membrane. The larger the characteristic time for a pro-cess, the slower is that process. The characteristic flow time is theratio of the membrane length to linear interstitial velocity of thefeed:
�f = L
uin(4)
The characteristic reaction time is the ratio of the feed concentrationof methanol (C0) to the reference steam reforming rate (r(C0)):
�r =C0
CH3OH
r(C0CH3OH)
(5)
The characteristic permeation time is the ratio of a reference H2concentration (C0
H2) to reference volume productivity. To account
for the reduction in trans-membrane H2 flux the (�H + �V) factorwas also included [20]. The (�H + �V) term represents a calculatedfractional coverage of sites that are occupied by hydrogen or are
S.H. Israni, M.P. Harold / Journal of Membrane Science 369 (2011) 375–387 377
Fig. 1. (i) Basic setup for reactor studies. (ii) Schematic of PBR and (iii) schematic of PBMR. The red circles represent thermocouple locations. (For interpretation of thereferences to color in this figure legend, the reader is referred to the web version of the article.)
Table 1The different reactor configurations that were used in the current study.
Reactor number Type of reactor Outer Diameter ofreactor [wallthickness] (inches)
Length of catalystbed (in.)
Amount ofcatalyst (g)
Amount of Inert(0.5 mm quartzbeads) (g)
1 PBR 3/8 [0.035] 4 5.75 02 PBR 3/8 [0.035] 2 2.85 03 PBMR 3/8 [0.035] 4 4.5 04 PBMR 1/2 [0.035] 4 10.1 0
vHwb
�
Tstt
�
Ttf
5 PBMR 3/4 [0.049]6 PBMR 1/2 [0.035]7 PBMR 3/4 [0.049]
acant. The remaining sites would be occupied by adsorbing non-species that inhibit the transmembrane flux. A fixed value of 0.4as chosen for the (�H + �V) factor for all the reactors (see Fig. 17
elow and the related discussion for further explanation).
p =C0
H2Vr
(�H + �V )J0H2
Sm=
C0H2
Vr
(�H + �V )qop0.5Sm(6)
he reference H2 concentration was chosen to be pure H2 at apecified feed pressure and temperature. The characteristic radialransport time is the ratio of the square of the annular gap thicknesso the effective radial dispersion coefficient of hydrogen (DH2,er):
(Riw − Rm)2
d =DH2,er
(7)
wo different catalyst bed lengths were used for the PBR studyo determine the extent of particle scale external mass trans-er resistance (i.e., while the residence times are the same, the
4 25.5 04 4.5 5.64 4.5 21
linear velocity in the shorter reactor is higher). These PBRs arereactor nos. 1 and 2 (Table 1). Reactors 3–7 were PBMRs withdifferent combinations of diameter, catalyst mass and inert solidsmass. Reactors 3, 4 and 5 differed in their diameters (3/8 in., 1/2 in.and 3/4 in., respectively). This provided for a systematic variationof the (i) characteristic time for transverse (radial) transport ofhydrogen from the catalyst bed to the membrane surface, and(ii) surface area of membrane to catalyst volume ratio. The lat-ter affects the characteristic time of hydrogen transport throughthe membrane. For reactors 6 and 7 the diameters were the sameas for 4 and 5, respectively, but the catalyst volumes were keptthe same as in reactor 3 by diluting with inert quartz beads. Thus,reactors 3, 6 and 7, only differed by the characteristic time for
radial transport while all the other characteristic times were simi-lar.A commercial CuO/ZnO/Al2O3 catalyst (modified with ZrO2)supplied by BASF (V1765) was used in all the reactors. The origi-nal catalyst was crushed and sieved to give an approximate 0.5 mm
3 Memb
nwe2v
m2tkTvmsKir
iati5tOtrdeapmmr
mtr(fa
H
Y
3
witmissnrrr
((
78 S.H. Israni, M.P. Harold / Journal of
ominal particle diameter. The quartz beads (Sigma-Aldrich) whichere used to dilute the catalyst bed were of nearly the same diam-
ter (0.5 mm). The PBR and PBMR experiments were carried out at50 and 300 ◦C with the total pressure on the reaction/catalyst sidearied between 1 and 5 bars (absolute).
The composition of all vapors exiting the PBR and PBMR wereeasured using a gas chromatograph (Agilent-6890N®) with a
5 m Haysep® DB column (helium carrier gas) equipped with ahermal conductivity detector (TCD). The permeate side was alwaysept open to atmosphere through the GC or bubble flow meter.he reactor effluent (or retentate in the case of the PBMR) wasented to the vacuum hood after passing through the gas chro-atograph and/or the bubble flow meter. The reactor pressure was
et at the desired value using a back pressure regulator (Swagelok®
BP series) fitted on the retentate outlet tubing. The overall andndividual C, H, and O mass balances all closed within 5% for all theeactor experiments.
The catalyst was initially reduced in the reactor using a 1% H2n N2 stream (total flow rate of 500 sccm per 10 g of active catalyst)t a furnace temperature of 250 ◦C and at 1.6 bars pressure. Afterhe resulting exotherm had subsided sufficiently (usually requir-ng approximately 20 min) the H2 concentration was increased to% and held for at least 1 h. The H2O in the exit stream was moni-ored using the GC as a guide to completion of catalyst reduction.nce the catalyst was reduced the H2/N2 stream was shut off and
he CH3OH and H2O mixture was fed to the reactor. Each steameforming experiment required 20–30 min after the feed was intro-uced to achieve steady state (as determined by stabilization of thexit concentrations, exit flow rates and the temperatures). Onceparticular run was completed the next run was started by sim-ly changing the required parameter. Since both the catalyst andembrane maintained their initial activity throughout the experi-ents, no activation or reduction step was required after the initial
eduction step.The PBMR data were used to calculate several key performance
etrics in addition to the conversion of methanol. The H2 produc-ivity (effectively a space–time yield) is defined as the molar flowate of the permeate hydrogen product per unit reactor volumemol H2/(m3 s)). The H2 utilization (YH2 ) is defined as fraction of H2ed into reactor (in the form of CH3OH and H2O) that is recovereds permeate H2:
2 productivity (mol H2/(m3 s)) = permeate H2 molar flow ratereactor or catalyst volume
(8)
H2 (%) = 100 × permeate H2 flow rate(2 × inlet CH3OH flow rate) + (1 × inlet H2O flow rate)
(9)
. Model development
A 2-dimensional, non-isothermal, pseudo-homogeneous modelas developed to simulate the performance of the PBR and the var-
ous PBMRs that were used in the experiments. It has been shownhat 2-dimensional models are necessary to satisfactorily simulate
embrane reactors due to the possibility of concentration polar-zation effects [4,22]. Single-particle simulations carried out in thistudy (not reported here) as well as in previous studies [10,23]
howed that for 0.5 mm CuO/ZnO/Al2O3 catalyst particles the inter-al mass transfer resistance is insignificant. Also, since the results ofeactor 1 and 2 were exactly the same for similar residence times (aseported in Section 3), it was assumed that external mass transferesistances could be neglected.rane Science 369 (2011) 375–387
3.1. Momentum balance
The Darcy–Brinkman equation [24], along with the continuityequation, was used to simulate the velocity and pressure profilesin the porous catalyst beds of the PBRs and PBMRs:
�
�U- = ∇ ·
[−p + 1
εbed
{�(∇U- + (∇U- )T ) − 2
3�(∇ · U- )
}](10)
∇ · (U- ) = 0 (11)
The density of the gas mixture () is given by the gas law for mix-tures:
= p
�T
∑i
xiMi (12)
where i = H2, CH3OH, H2O, CO2 or CO.The following boundary conditions were used for the momen-
tum balance:
(a) z = 0; u = uin, v = 0(b) z = L ; p = pout
(c) For PBR at r = 0; ∇U- = 0 and for PBMR r = Rm; u = v = 0(d) r = Riw; u = v = 0
3.2. Mass balance
Stefan–Maxwell based equations [25] with additional reactionterms were used to model the mass balances of the five methanolsteam reforming species:
∇ ·(
ωiU- − ωi
∑i
D̄ij
(∇xj + (xj − ωi)
∇p
p
))=∑
k
ϑkRk (13)
where i, j = H2, CH3OH, H2O, CO2 or CO and index k represents thevarious reactions (see Section 3.6). The following boundary condi-tions were used for the Stefan–Maxwell equations
a) z = 0 ; ω = ωi,inb) r = Riw; for all species; no flux at impermeable reactor wall
(c) (i) For PBR at r = 0; ωi∑
iDij( ∇ xj + (xj − ωi)( ∇ p/p)) = 0for i = 1–5 (no flux at centerline). (ii) For PBMR at r = Rm;ωiv − ωi
∑iD̄ij(∇xj + (xj − ωi)(∇p/p)) = −JH2 (i = H2);
ωi∑
iDij( ∇ xj + (xj − ωi)( ∇ p/p)) = 0 (all other species)
3.3. Energy balance (catalyst bed)
A simple model comprising convection, conduction, and reac-tion heat source terms was used to describe the steady-state energybalance in the catalyst bed:
∇ · (−keff ∇T) + CpU- · ∇T =∑
k
�HkRk (14)
The following boundary conditions were used for the energy bal-ance:
(a) z = 0 ; T = Tin(b) r = Rm; keff ∇ T = heff(T2 − T)
3.4. Energy balance (reactor wall)
Conductive heat transport was assumed for the reactor wall:
kss ∇2T2 = 0 (15)
The following boundary conditions were used for the reactor wall:
(a) r = Riw; kss ∇ T2 = heff(T − T2)(b) r = Row; kss ∇ T = houtside(Tfurnace − T2)
Memb
a
3
d
J
w
(KHpH
OH)1/2
m
3
P
H3OH
H2O/p
(
3
G
w
P
3
f
w
k
k
meability experiments, no model parameters were adjusted to get afit of the PBMR data. Thus, the premise is that if a satisfactory fit ofthe PBMR results were obtained then this would provide strong evi-dence that all of the critical processes are captured satisfactorily in themodel.
Table 2List of parameter values used in the reactor simulations.
Parameter Value
Permeate pressure (atmosphere) 1Pd–Ag membrane outer diameter (mm) 3.7Catalyst particle size (mm) 0.5Catalyst particle porosity 0.693
S.H. Israni, M.P. Harold / Journal of
The Tfurnace temperature was measured by a thermocouplettached to the outside wall of the reactor (Fig. 1(ii) and (iii)).
.5. Trans-membrane H2 flux
The H2 flux through the Pd–Ag membrane under reaction con-itions was given by the following expression [20]
H2 = (�H + �V )qo exp(
− EH
�T
)(p0.5
H2,ret − p0.5H2,perm) (16)
here
�H + �V ) =1 +√
1 +√
KHpH2 + (KH2OpH2O) + (KCOpCO)1/3 + (KCO2 pCO2 )1/2 + (KCH3OHpCH3
The equilibrium parameters (Ki) in Eq. (17) were used as esti-ated in a previous study [20].
.6. Reaction rate expressions
The reaction rate expressions and parameters were used fromeppley et al. [26]:
(i) Methanol steam reforming
RSR =kSRK∗
CH3O(1)(pCH3OH/p0.5H2
)(1 − p3H2
pCO2 /KeqSRpC
(1 + K∗CH3O(1)(pCH3OH/p0.5
H2) + K∗
HCOO(1)pCO2 p0.5H2
+ K∗OH(1)(p
(ii) Methanol decomposition
RMD =kMDK∗
CH3O(2)(pCH3OH/p0.5
H2)(1 − p2
H2pCO/KeqMDpCH3OH)Cs2Cs2a
(1 + K∗CH3O(2)
(pCH3OH/p0.5H2
) + K∗OH(2)
(pH2O/p0.5H2
))(1 + (K∗H(2)
)0.5p0.5H2
)
(19)
iii) Water-gas shift
RWGS =kwK∗
OH(1)(pCOpH2O/p0.5
H2)(1 − pH2 pCO2 /KeqWGSpCOpH2O)C2
s1
(1 + K∗CH3O(1)
(pCH3OH/p0.5H2
) + K∗HCOO(1)
pCO2 p0.5H2
+ K∗OH(1)
(pH2O/p0.5H2
))2
(20)
where the parameters are defined in the list of notation.
.7. Effective radial diffusivities
The effective radial diffusivities were calculated according tounn [27]:
1Peij,eff
= udparticle
Dij,eff= 1
Pef+ εbed
� Re Scij(21)
here
ef = 40 − 29 exp(−7/Re) (22)
.8. Effective bed thermal conductivity
The effective bed thermal conductivity was calculated using theollowing expression [28]
keff
kfluid= kcond + kconv (23)
here
cond = εbed + 1 − εbed
0.22ε2bed
+ (2/3)(kfluid/ksolid)(24)
conv = Re × Pr
8.65(1 + 19.4(dparticle/2Riw)2)(25)
rane Science 369 (2011) 375–387 379
2
+ ((KI(KCH3OHpCH3OH))/√
KHpH2 ) + ((KIKII(KCH3OHpCH3OH))/(KHpE2 ))(17)
pH2O)Cs1Cs1a
0.5H2
))(1 + (K∗H(1))
0.5p0.5H2
)(18)
3.9. Effective wall to bed heat transfer coefficient
The effective wall to bed heat transfer coefficient was calculatedusing the following expression [28]
heff = hcond + hconv (26)
where
hcond =(
2εparticle + 1 − εparticle
(1/3)(kfluid/ksolid) + 0.0024(2Riw/dparticle)
)kfluid
dparticle(27)
hconv = 0.0835 Re0.53 Pr0.33 kfluid
dparticle(28)
The approach for applying the above model to the experimentalsystem was as follows. Tables 2 and 3 provide the values of model
parameters used in the simulations. The reaction rate parame-ters from Peppley et al. [26] were used as an initial guess topredict results for the PBR. As shown in the Results section, theCs1, Cs1a, Cs2 and Cs2a parameters were then adjusted to obtaingood fits for the PBR data. These particular parameters repre-sent the site concentrations as described by Peppley et al. Anadjustment of these amounts to a modification of the catalyticactivity which is not unexpected since the catalyst used by Pep-pley et al. is not identical to the catalyst used in the currentstudy (e.g., their catalyst did not contain the Zr modifier). Thesum of squared residuals (experimental minus simulation results)for composition and temperature profiles were used to estimatethe best values of the parameters (specific values are provided inthe next section). The PBMR model comprised the kinetic modeland associated parameters together with the H2 membrane fluxmodel (Eq. (16) and (17)), the parameters of which were esti-mated from pure component permeability measurements from thecurrent study and mixture permeability measurements from ourrecent study [20]. A key point to note is that once the kinetic andmembrane parameters were estimated from PBR and membrane per-
Catalyst particle surface area (m2/kg) 1.02 × 10⁵
Catalyst particle density (kg/m3) 1980Inert quartz bead density (kg/m3) 1750Catalyst bed porosity 0.4Catalyst bed tortuosity 1.5
380 S.H. Israni, M.P. Harold / Journal of Membrane Science 369 (2011) 375–387
Table 3Values of rate and equilibrium constants used in reactor simulations [26].
Rate or equilibrium constant �S (J mol−1 K−1) ko (m2 s−1 mol−1) �H (kJ mol−1) E (kJ mol−1)
kSR – 7.4 × 10⁻¹⁴ – 102.8kMD – 3.8 × 10⁻²⁰ – 170.0kWGS – 5.9 × 10⁻¹³ – 87.6K∗
CH3O(1)−41.8 – −20.0 –
K∗OH(1)
−44.5 – −20.0 –K∗
H(1)−100.8 – −50.0 –
K∗HCOO(1)
179.2 – 100.0 –– −20.0 –
– −20.0 –– −50.0 –
4
fpm
q
E
Tempittaa
pPrdtaCa[br
Fl
20
40
60
80
100
500005000500
Met
han
ol C
on
vers
ion
%
GHSV (scc/h/g cat)
250 C, 3 barsPBR -
250 C, 5 barsPBR -
300 C, 5 barsPBR -
250 C, 3 barsPBMR -
250 C, 5 barsPBMR -
300 C, 5 barsPBMR -
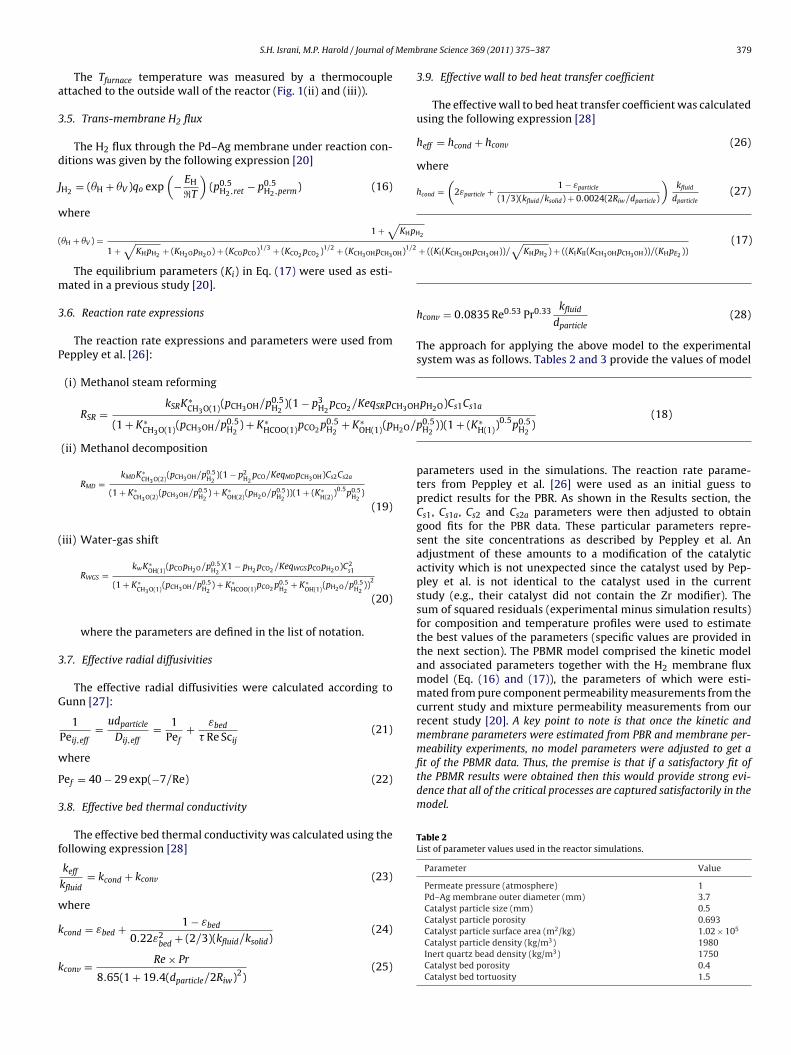
Fig. 3. Comparison of methanol conversions in PBR (reactor 1) and PBMR (reactor3). The symbols are the experimental results and the lines are the modeling results.The solid lines are the PBR results and the dashed lines are the PBMR results.
0.5
0.6
0.7
0.8
e %
H2
CO
CO2
H2O
CH3OH
K∗CH3O(2)
30.0
K∗OH(2)
30.0K∗
H(2)−46.2
. Results and discussion
Fig. 2 reports the H2 flux through the Pd–Ag membrane at dif-erent temperatures and pressures when pure H2 was fed to theermeation cell. These data were used to obtain the pure gas per-eability parameters of the membrane:
0 = 0.0199 [mol/(m2s) Pa0.5] (29)
H = 15.7 [kJ/mol] (30)
hese parameters along with the surface adsorption model param-ters (from Eqs. (16) and (17)) were then used in the overall PBMRodel. When the outside of the membrane was pressurized with
ure Helium, no leakage was detected through the membrane. Thisndicated that the membrane was defect free and that the separa-ion factor was infinite. These pure gas permeation properties wereested again at several points throughout the reaction studies andt the end of the investigation. Any changes in the H2 permeabilitynd separation factor were negligible (<1%).
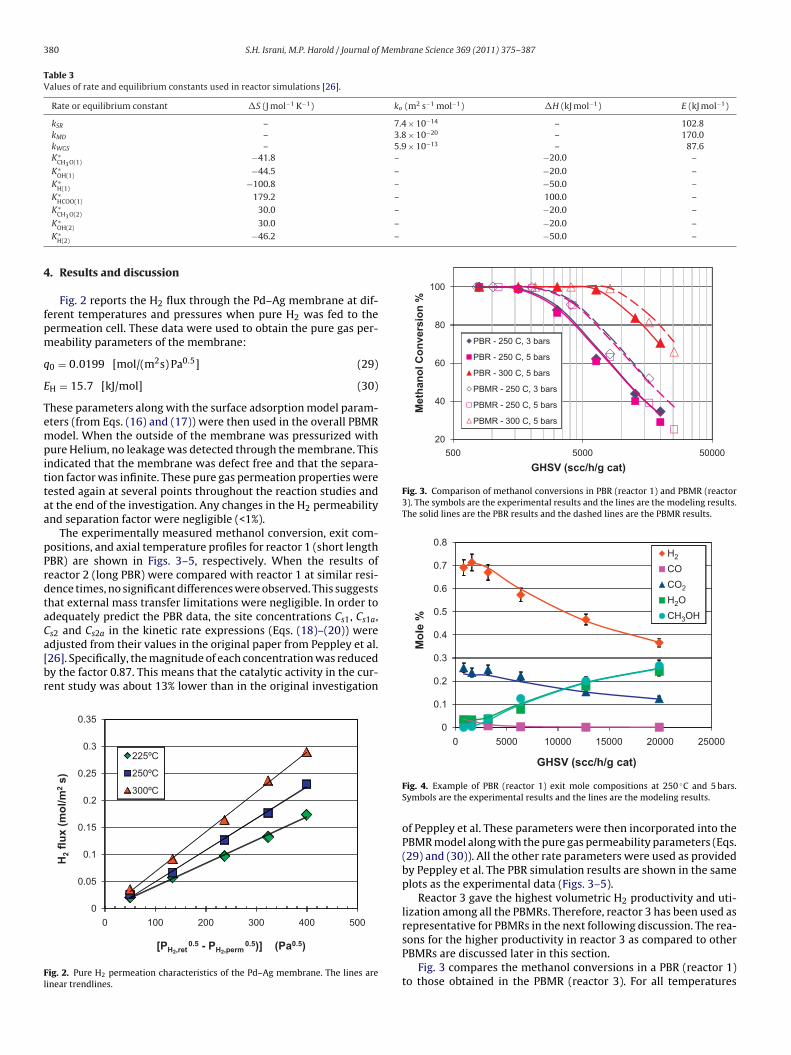
The experimentally measured methanol conversion, exit com-ositions, and axial temperature profiles for reactor 1 (short lengthBR) are shown in Figs. 3–5, respectively. When the results ofeactor 2 (long PBR) were compared with reactor 1 at similar resi-ence times, no significant differences were observed. This suggestshat external mass transfer limitations were negligible. In order todequately predict the PBR data, the site concentrations Cs1, Cs1a,
s2 and Cs2a in the kinetic rate expressions (Eqs. (18)–(20)) weredjusted from their values in the original paper from Peppley et al.26]. Specifically, the magnitude of each concentration was reducedy the factor 0.87. This means that the catalytic activity in the cur-ent study was about 13% lower than in the original investigation0
0.05
0.1
0.15
0.2
0.25
0.3
0.35
5004003002001000
H2
flu
x (m
ol/m
2s)
[PH2,ret0.5 P- H2,perm
0.5)] (Pa0.5)
225ºC
250ºC
300ºC
ig. 2. Pure H2 permeation characteristics of the Pd–Ag membrane. The lines areinear trendlines.
0
0.1
0.2
0.3
0.4
2500020000150001000050000
Mo
l
GHSV (scc/h/g cat)
Fig. 4. Example of PBR (reactor 1) exit mole compositions at 250 ◦C and 5 bars.Symbols are the experimental results and the lines are the modeling results.
of Peppley et al. These parameters were then incorporated into thePBMR model along with the pure gas permeability parameters (Eqs.(29) and (30)). All the other rate parameters were used as providedby Peppley et al. The PBR simulation results are shown in the sameplots as the experimental data (Figs. 3–5).
Reactor 3 gave the highest volumetric H2 productivity and uti-lization among all the PBMRs. Therefore, reactor 3 has been used as
representative for PBMRs in the next following discussion. The rea-sons for the higher productivity in reactor 3 as compared to otherPBMRs are discussed later in this section.Fig. 3 compares the methanol conversions in a PBR (reactor 1)to those obtained in the PBMR (reactor 3). For all temperatures
S.H. Israni, M.P. Harold / Journal of Membrane Science 369 (2011) 375–387 381
210
220
230
240
250
0.10.080.060.040.020
Tem
per
atu
re a
t r
= 0
(ºC
)
Axial Length (m)
W/Fmo = 2.25 W/Fmo = 3.5
W/Fmo = 7 W/Fmo = 14
W/Fmo = 28 W/Fmo = 56
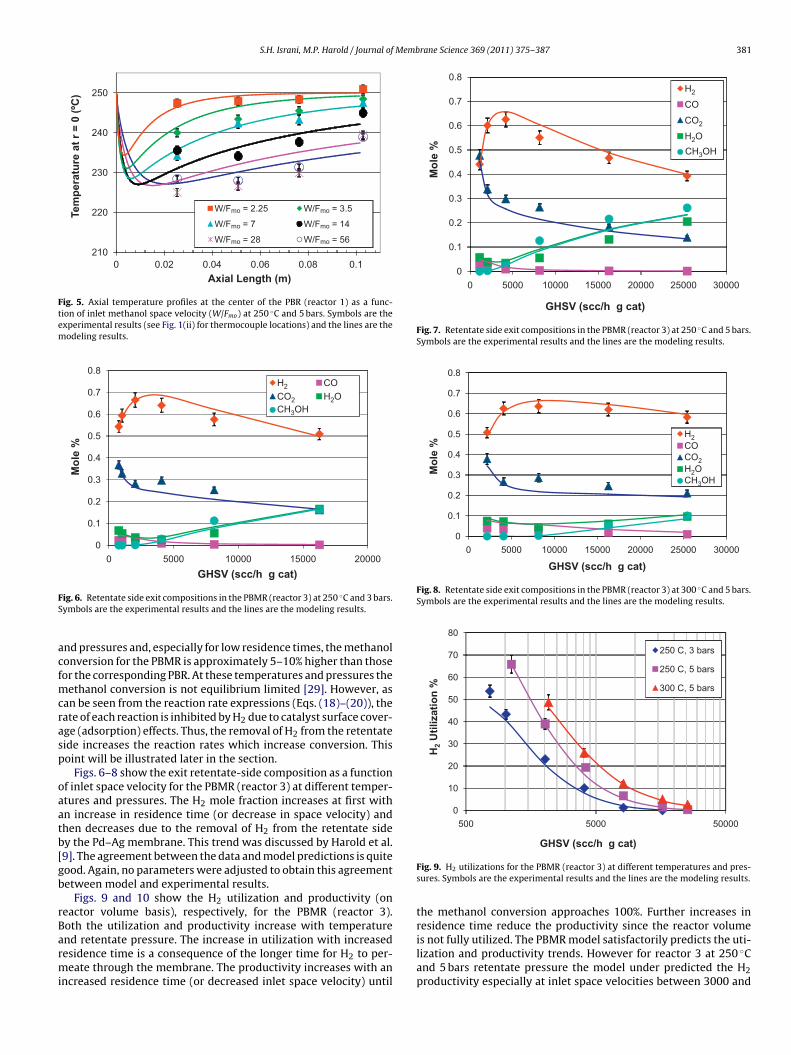
Fig. 5. Axial temperature profiles at the center of the PBR (reactor 1) as a func-tion of inlet methanol space velocity (W/Fmo) at 250 ◦C and 5 bars. Symbols are theexperimental results (see Fig. 1(ii) for thermocouple locations) and the lines are themodeling results.
0
0.1
0.2
0.3
0.4
0.5
0.6
0.7
0.8
20000150001000050000
Mo
le %
GHSV (scc/h g cat)
H2 CO
CO2 H2OCH3OH
FS
acfmcrasp
oaatb[gb
rBarmi
0
0.1
0.2
0.3
0.4
0.5
0.6
0.7
0.8
150001000050000 300002500020000
Mo
le %
GHSV (scc/h g cat)
H2
CO
CO2
H2O
CH3OH
Fig. 7. Retentate side exit compositions in the PBMR (reactor 3) at 250 ◦C and 5 bars.Symbols are the experimental results and the lines are the modeling results.
0
0.1
0.2
0.3
0.4
0.5
0.6
0.7
0.8
300002500020000150001000050000
Mo
le %
GHSV (scc/h g cat)
H2COCO2H2OCH3OH
Fig. 8. Retentate side exit compositions in the PBMR (reactor 3) at 300 ◦C and 5 bars.Symbols are the experimental results and the lines are the modeling results.
0
10
20
30
40
50
60
70
80
500005000500
H2
Uti
lizat
ion
%
250 C, 3 bars
250 C, 5 bars
300 C, 5 bars
ig. 6. Retentate side exit compositions in the PBMR (reactor 3) at 250 ◦C and 3 bars.ymbols are the experimental results and the lines are the modeling results.
nd pressures and, especially for low residence times, the methanolonversion for the PBMR is approximately 5–10% higher than thoseor the corresponding PBR. At these temperatures and pressures the
ethanol conversion is not equilibrium limited [29]. However, asan be seen from the reaction rate expressions (Eqs. (18)–(20)), theate of each reaction is inhibited by H2 due to catalyst surface cover-ge (adsorption) effects. Thus, the removal of H2 from the retentateide increases the reaction rates which increase conversion. Thisoint will be illustrated later in the section.
Figs. 6–8 show the exit retentate-side composition as a functionf inlet space velocity for the PBMR (reactor 3) at different temper-tures and pressures. The H2 mole fraction increases at first withn increase in residence time (or decrease in space velocity) andhen decreases due to the removal of H2 from the retentate sidey the Pd–Ag membrane. This trend was discussed by Harold et al.9]. The agreement between the data and model predictions is quiteood. Again, no parameters were adjusted to obtain this agreementetween model and experimental results.
Figs. 9 and 10 show the H2 utilization and productivity (oneactor volume basis), respectively, for the PBMR (reactor 3).oth the utilization and productivity increase with temperature
nd retentate pressure. The increase in utilization with increasedesidence time is a consequence of the longer time for H2 to per-eate through the membrane. The productivity increases with anncreased residence time (or decreased inlet space velocity) until
GHSV (scc/h g cat)
Fig. 9. H2 utilizations for the PBMR (reactor 3) at different temperatures and pres-sures. Symbols are the experimental results and the lines are the modeling results.
the methanol conversion approaches 100%. Further increases inresidence time reduce the productivity since the reactor volume
is not fully utilized. The PBMR model satisfactorily predicts the uti-lization and productivity trends. However for reactor 3 at 250 ◦Cand 5 bars retentate pressure the model under predicted the H2productivity especially at inlet space velocities between 3000 and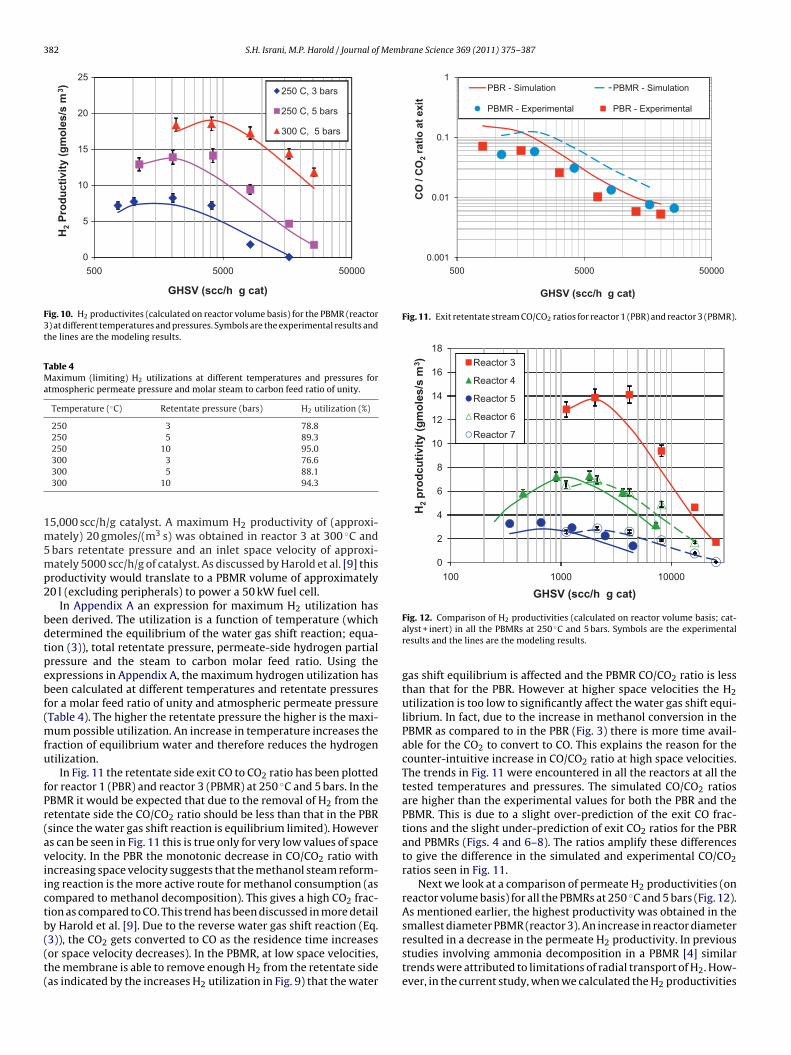
382 S.H. Israni, M.P. Harold / Journal of Membrane Science 369 (2011) 375–387
0
5
10
15
20
25
500005000500
H2
Pro
du
ctiv
ity
(gm
ole
s/s
m3 )
GHSV (scc/h g cat)
250 C, 3 bars
250 C, 5 bars
300 C, 5 bars
Fig. 10. H2 productivites (calculated on reactor volume basis) for the PBMR (reactor3) at different temperatures and pressures. Symbols are the experimental results andthe lines are the modeling results.
Table 4Maximum (limiting) H2 utilizations at different temperatures and pressures foratmospheric permeate pressure and molar steam to carbon feed ratio of unity.
Temperature (◦C) Retentate pressure (bars) H2 utilization (%)
250 3 78.8250 5 89.3250 10 95.0
1m5mp2
bdtpebf(mfu
fPr(aviictb((t(
0.001
0.01
0.1
1
500005000500
CO
/ C
O2
rati
o a
t ex
it
GHSV (scc/h g cat)
SimulationPBR - SimulationPBMR -
ExperimentalPBMR - ExperimentalPBR -
Fig. 11. Exit retentate stream CO/CO2 ratios for reactor 1 (PBR) and reactor 3 (PBMR).
0
2
4
6
8
10
12
14
16
18
100001000100
H2
pro
dcu
tivi
ty (
gm
ole
s/s
m3 )
GHSV (scc/h g cat)
Reactor 3
Reactor 4
Reactor 5
Reactor 6
Reactor 7
300 3 76.6300 5 88.1300 10 94.3
5,000 scc/h/g catalyst. A maximum H2 productivity of (approxi-ately) 20 gmoles/(m3 s) was obtained in reactor 3 at 300 ◦C andbars retentate pressure and an inlet space velocity of approxi-ately 5000 scc/h/g of catalyst. As discussed by Harold et al. [9] this
roductivity would translate to a PBMR volume of approximately0 l (excluding peripherals) to power a 50 kW fuel cell.
In Appendix A an expression for maximum H2 utilization haseen derived. The utilization is a function of temperature (whichetermined the equilibrium of the water gas shift reaction; equa-ion (3)), total retentate pressure, permeate-side hydrogen partialressure and the steam to carbon molar feed ratio. Using thexpressions in Appendix A, the maximum hydrogen utilization haseen calculated at different temperatures and retentate pressuresor a molar feed ratio of unity and atmospheric permeate pressureTable 4). The higher the retentate pressure the higher is the maxi-
um possible utilization. An increase in temperature increases theraction of equilibrium water and therefore reduces the hydrogentilization.
In Fig. 11 the retentate side exit CO to CO2 ratio has been plottedor reactor 1 (PBR) and reactor 3 (PBMR) at 250 ◦C and 5 bars. In theBMR it would be expected that due to the removal of H2 from theetentate side the CO/CO2 ratio should be less than that in the PBRsince the water gas shift reaction is equilibrium limited). Howevers can be seen in Fig. 11 this is true only for very low values of spaceelocity. In the PBR the monotonic decrease in CO/CO2 ratio withncreasing space velocity suggests that the methanol steam reform-ng reaction is the more active route for methanol consumption (asompared to methanol decomposition). This gives a high CO2 frac-ion as compared to CO. This trend has been discussed in more detaily Harold et al. [9]. Due to the reverse water gas shift reaction (Eq.
3)), the CO2 gets converted to CO as the residence time increasesor space velocity decreases). In the PBMR, at low space velocities,he membrane is able to remove enough H2 from the retentate sideas indicated by the increases H2 utilization in Fig. 9) that the waterFig. 12. Comparison of H2 productivities (calculated on reactor volume basis; cat-alyst + inert) in all the PBMRs at 250 ◦C and 5 bars. Symbols are the experimentalresults and the lines are the modeling results.
gas shift equilibrium is affected and the PBMR CO/CO2 ratio is lessthan that for the PBR. However at higher space velocities the H2utilization is too low to significantly affect the water gas shift equi-librium. In fact, due to the increase in methanol conversion in thePBMR as compared to in the PBR (Fig. 3) there is more time avail-able for the CO2 to convert to CO. This explains the reason for thecounter-intuitive increase in CO/CO2 ratio at high space velocities.The trends in Fig. 11 were encountered in all the reactors at all thetested temperatures and pressures. The simulated CO/CO2 ratiosare higher than the experimental values for both the PBR and thePBMR. This is due to a slight over-prediction of the exit CO frac-tions and the slight under-prediction of exit CO2 ratios for the PBRand PBMRs (Figs. 4 and 6–8). The ratios amplify these differencesto give the difference in the simulated and experimental CO/CO2ratios seen in Fig. 11.
Next we look at a comparison of permeate H2 productivities (onreactor volume basis) for all the PBMRs at 250 ◦C and 5 bars (Fig. 12).As mentioned earlier, the highest productivity was obtained in thesmallest diameter PBMR (reactor 3). An increase in reactor diameter
resulted in a decrease in the permeate H2 productivity. In previousstudies involving ammonia decomposition in a PBMR [4] similartrends were attributed to limitations of radial transport of H2. How-ever, in the current study, when we calculated the H2 productivities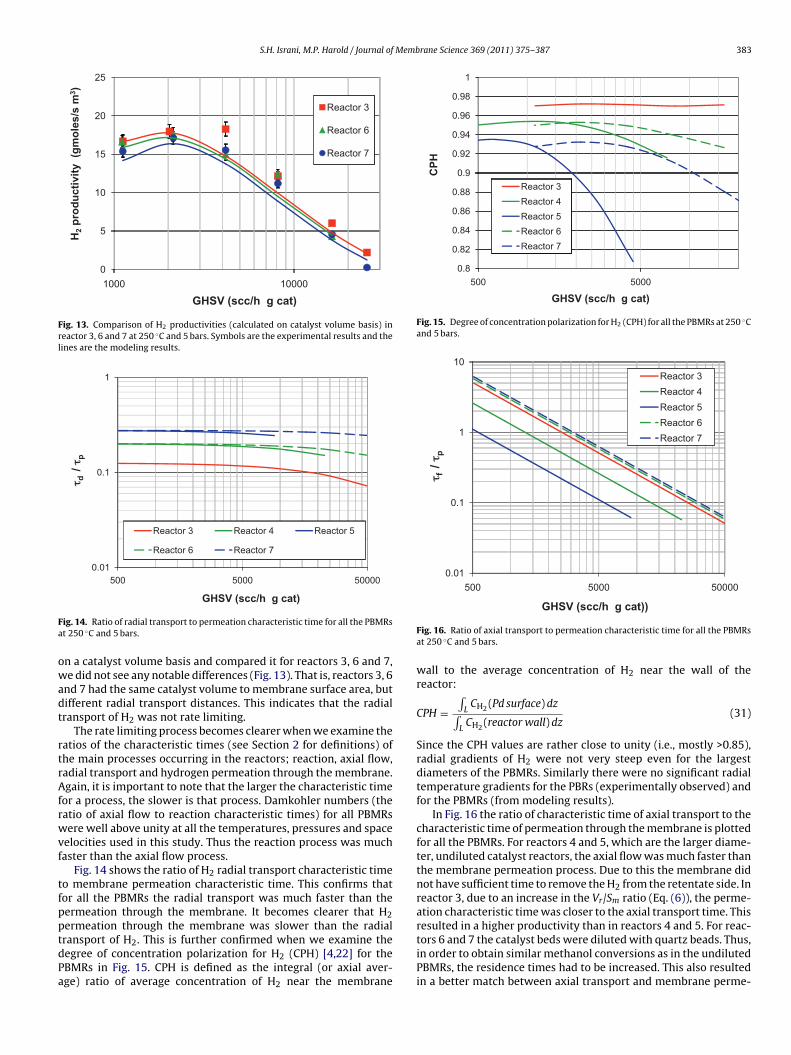
S.H. Israni, M.P. Harold / Journal of Membrane Science 369 (2011) 375–387 383
0
5
10
15
20
25
100001000
H2
pro
du
ctiv
ity
(g
mo
les/
s m
3 )
GHSV (scc/h g cat)
Reactor 3
Reactor 6
Reactor 7
Fig. 13. Comparison of H2 productivities (calculated on catalyst volume basis) inreactor 3, 6 and 7 at 250 ◦C and 5 bars. Symbols are the experimental results and thelines are the modeling results.
0.01
0.1
1
500005000500
τ d/ τ
p
Reactor 3 Reactor 4 Reactor 5
Reactor 6 Reactor 7
Fa
owadt
rtrAfrwvf
tfpptdPa
0.8
0.82
0.84
0.86
0.88
0.9
0.92
0.94
0.96
0.98
1
5000500
CP
H
GHSV (scc/h g cat)
Reactor 3
Reactor 4
Reactor 5
Reactor 6
Reactor 7
Fig. 15. Degree of concentration polarization for H2 (CPH) for all the PBMRs at 250 ◦Cand 5 bars.
0.01
0.1
1
10
500005000500
τ f/τ
p
Reactor 3
Reactor 4
Reactor 5
Reactor 6
Reactor 7
GHSV (scc/h g cat)
ig. 14. Ratio of radial transport to permeation characteristic time for all the PBMRst 250 ◦C and 5 bars.
n a catalyst volume basis and compared it for reactors 3, 6 and 7,e did not see any notable differences (Fig. 13). That is, reactors 3, 6
nd 7 had the same catalyst volume to membrane surface area, butifferent radial transport distances. This indicates that the radialransport of H2 was not rate limiting.
The rate limiting process becomes clearer when we examine theatios of the characteristic times (see Section 2 for definitions) ofhe main processes occurring in the reactors; reaction, axial flow,adial transport and hydrogen permeation through the membrane.gain, it is important to note that the larger the characteristic time
or a process, the slower is that process. Damkohler numbers (theatio of axial flow to reaction characteristic times) for all PBMRsere well above unity at all the temperatures, pressures and space
elocities used in this study. Thus the reaction process was muchaster than the axial flow process.
Fig. 14 shows the ratio of H2 radial transport characteristic timeo membrane permeation characteristic time. This confirms thator all the PBMRs the radial transport was much faster than theermeation through the membrane. It becomes clearer that H2
ermeation through the membrane was slower than the radialransport of H2. This is further confirmed when we examine theegree of concentration polarization for H2 (CPH) [4,22] for theBMRs in Fig. 15. CPH is defined as the integral (or axial aver-ge) ratio of average concentration of H2 near the membraneGHSV (scc/h g cat))
Fig. 16. Ratio of axial transport to permeation characteristic time for all the PBMRsat 250 ◦C and 5 bars.
wall to the average concentration of H2 near the wall of thereactor:
CPH =∫
LCH2 (Pd surface) dz∫
LCH2 (reactor wall) dz
(31)
Since the CPH values are rather close to unity (i.e., mostly >0.85),radial gradients of H2 were not very steep even for the largestdiameters of the PBMRs. Similarly there were no significant radialtemperature gradients for the PBRs (experimentally observed) andfor the PBMRs (from modeling results).
In Fig. 16 the ratio of characteristic time of axial transport to thecharacteristic time of permeation through the membrane is plottedfor all the PBMRs. For reactors 4 and 5, which are the larger diame-ter, undiluted catalyst reactors, the axial flow was much faster thanthe membrane permeation process. Due to this the membrane didnot have sufficient time to remove the H2 from the retentate side. Inreactor 3, due to an increase in the Vr/Sm ratio (Eq. (6)), the perme-ation characteristic time was closer to the axial transport time. This
resulted in a higher productivity than in reactors 4 and 5. For reac-tors 6 and 7 the catalyst beds were diluted with quartz beads. Thus,in order to obtain similar methanol conversions as in the undilutedPBMRs, the residence times had to be increased. This also resultedin a better match between axial transport and membrane perme-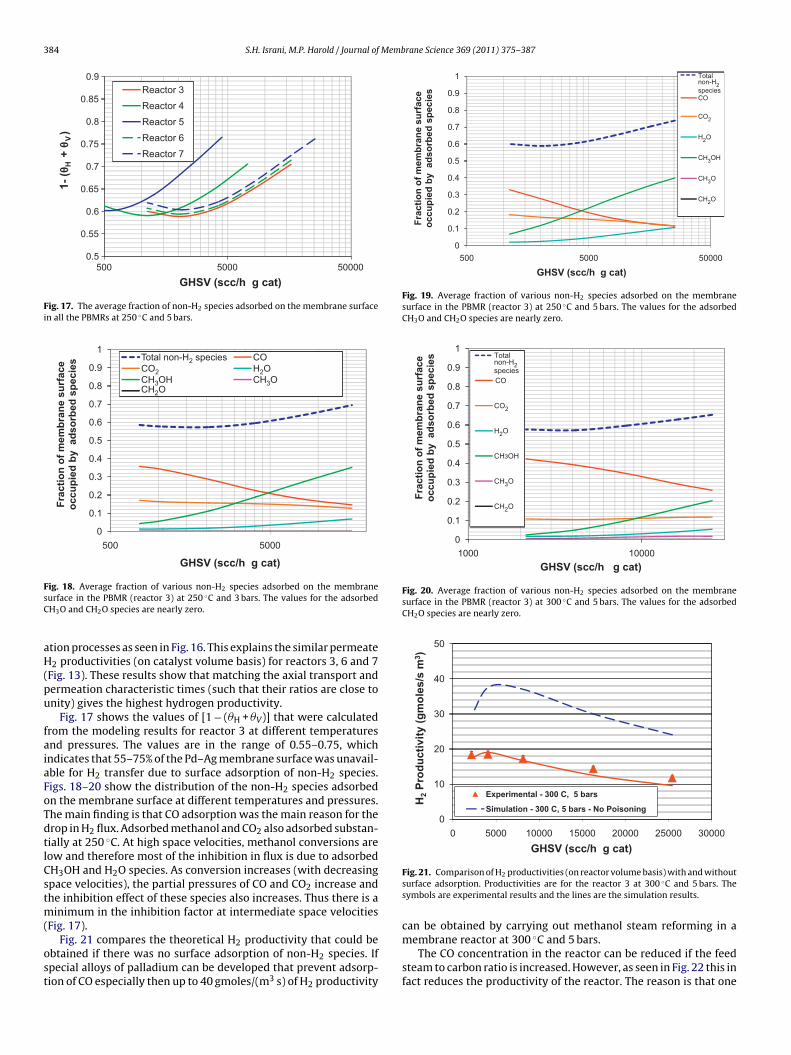
384 S.H. Israni, M.P. Harold / Journal of Membrane Science 369 (2011) 375–387
0.5
0.55
0.6
0.65
0.7
0.75
0.8
0.85
0.9
500005000500
1-(θ
H +
θV
)
GHSV (scc/h g cat)
Reactor 3
Reactor 4
Reactor 5
Reactor 6
Reactor 7
Fig. 17. The average fraction of non-H2 species adsorbed on the membrane surfacein all the PBMRs at 250 ◦C and 5 bars.
0
0.1
0.2
0.3
0.4
0.5
0.6
0.7
0.8
0.9
1
5000500
Fra
ctio
n o
f m
emb
ran
e su
rfac
e o
ccu
pie
d b
y a
dso
rbed
sp
ecie
s
GHSV (scc/h g cat)
Total non-H2 species COCO2 H2OCH3OH CH3OCH2O
FsC
aH(pu
faiaFoTdtlCstm(
ost
0
0.1
0.2
0.3
0.4
0.5
0.6
0.7
0.8
0.9
1
500005000500
Fra
ctio
n o
f m
emb
ran
e su
rfac
e o
ccu
pie
d b
y a
dso
rbed
sp
ecie
s
GHSV (scc/h g cat)
Total non-H2 speciesCO
CO2
H2O
CH3OH
CH3O
CH2O
Fig. 19. Average fraction of various non-H2 species adsorbed on the membranesurface in the PBMR (reactor 3) at 250 ◦C and 5 bars. The values for the adsorbedCH3O and CH2O species are nearly zero.
0
0.1
0.2
0.3
0.4
0.5
0.6
0.7
0.8
0.9
1
100001000
Fra
ctio
n o
f m
emb
ran
e su
rfac
e o
ccu
pie
d b
y a
dso
rbed
sp
ecie
s
GHSV (scc/h g cat)
Total non-H2 speciesCO
CO2
H2O
CH3OH
CH3O
CH2O
Fig. 20. Average fraction of various non-H2 species adsorbed on the membranesurface in the PBMR (reactor 3) at 300 ◦C and 5 bars. The values for the adsorbedCH2O species are nearly zero.
0
10
20
30
40
50
300002500020000150001000050000
H2
Pro
du
ctiv
ity
(gm
ole
s/s
m3 )
GHSV (scc/h g cat)
300 C, 5 barsExperimental -
No Poisoning300 C, 5 bars -Simulation -
can be obtained by carrying out methanol steam reforming in a
ig. 18. Average fraction of various non-H2 species adsorbed on the membraneurface in the PBMR (reactor 3) at 250 ◦C and 3 bars. The values for the adsorbedH3O and CH2O species are nearly zero.
tion processes as seen in Fig. 16. This explains the similar permeate2 productivities (on catalyst volume basis) for reactors 3, 6 and 7
Fig. 13). These results show that matching the axial transport andermeation characteristic times (such that their ratios are close tonity) gives the highest hydrogen productivity.
Fig. 17 shows the values of [1 − (�H + �V)] that were calculatedrom the modeling results for reactor 3 at different temperaturesnd pressures. The values are in the range of 0.55–0.75, whichndicates that 55–75% of the Pd–Ag membrane surface was unavail-ble for H2 transfer due to surface adsorption of non-H2 species.igs. 18–20 show the distribution of the non-H2 species adsorbedn the membrane surface at different temperatures and pressures.he main finding is that CO adsorption was the main reason for therop in H2 flux. Adsorbed methanol and CO2 also adsorbed substan-ially at 250 ◦C. At high space velocities, methanol conversions areow and therefore most of the inhibition in flux is due to adsorbedH3OH and H2O species. As conversion increases (with decreasingpace velocities), the partial pressures of CO and CO2 increase andhe inhibition effect of these species also increases. Thus there is a
inimum in the inhibition factor at intermediate space velocitiesFig. 17).
Fig. 21 compares the theoretical H2 productivity that could bebtained if there was no surface adsorption of non-H2 species. Ifpecial alloys of palladium can be developed that prevent adsorp-ion of CO especially then up to 40 gmoles/(m3 s) of H2 productivity
Fig. 21. Comparison of H2 productivities (on reactor volume basis) with and withoutsurface adsorption. Productivities are for the reactor 3 at 300 ◦C and 5 bars. Thesymbols are experimental results and the lines are the simulation results.
membrane reactor at 300 ◦C and 5 bars.The CO concentration in the reactor can be reduced if the feed
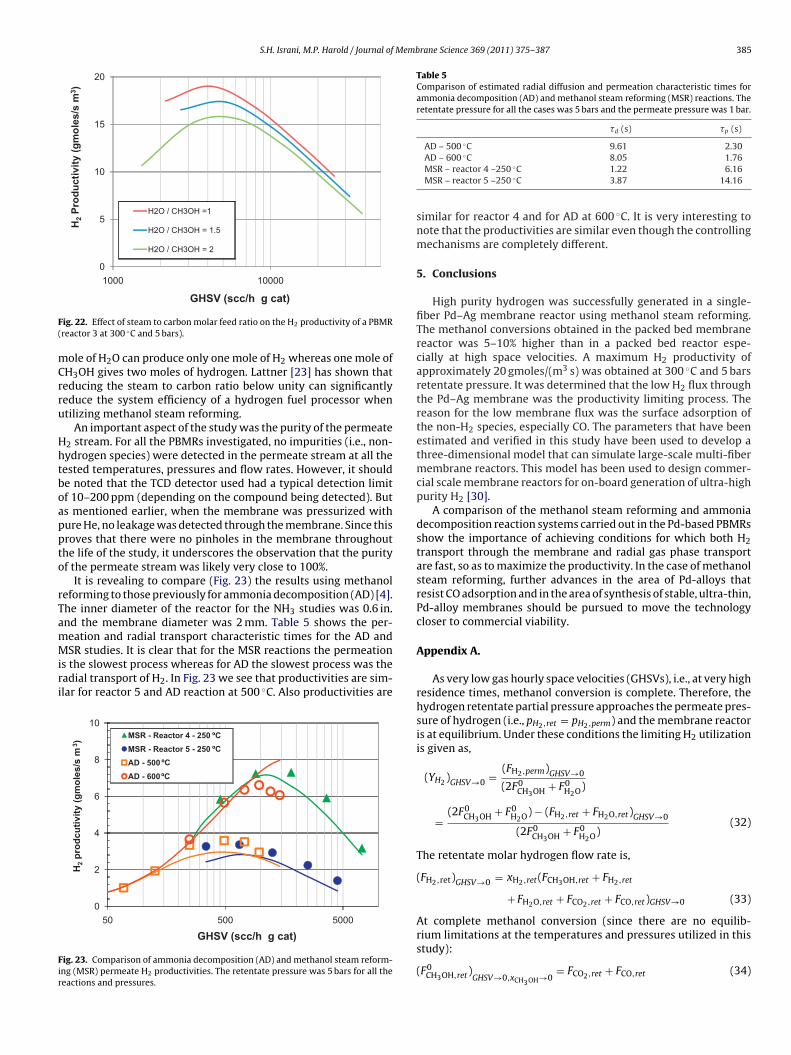
steam to carbon ratio is increased. However, as seen in Fig. 22 this infact reduces the productivity of the reactor. The reason is that one
S.H. Israni, M.P. Harold / Journal of Membrane Science 369 (2011) 375–387 385
0
5
10
15
20
100001000
H2
Pro
du
ctiv
ity
(gm
ole
s/s
m3 )
H2O / CH3OH =1
H2O / CH3OH = 1.5
H2O / CH3OH = 2
F(
mCrru
Hhtboappto
rTamMiri
Fir
Table 5Comparison of estimated radial diffusion and permeation characteristic times forammonia decomposition (AD) and methanol steam reforming (MSR) reactions. Theretentate pressure for all the cases was 5 bars and the permeate pressure was 1 bar.
�d (s) �p (s)
◦
GHSV (scc/h g cat)
ig. 22. Effect of steam to carbon molar feed ratio on the H2 productivity of a PBMRreactor 3 at 300 ◦C and 5 bars).
ole of H2O can produce only one mole of H2 whereas one mole ofH3OH gives two moles of hydrogen. Lattner [23] has shown thateducing the steam to carbon ratio below unity can significantlyeduce the system efficiency of a hydrogen fuel processor whentilizing methanol steam reforming.
An important aspect of the study was the purity of the permeate2 stream. For all the PBMRs investigated, no impurities (i.e., non-ydrogen species) were detected in the permeate stream at all theested temperatures, pressures and flow rates. However, it shoulde noted that the TCD detector used had a typical detection limitf 10–200 ppm (depending on the compound being detected). Buts mentioned earlier, when the membrane was pressurized withure He, no leakage was detected through the membrane. Since thisroves that there were no pinholes in the membrane throughouthe life of the study, it underscores the observation that the purityf the permeate stream was likely very close to 100%.
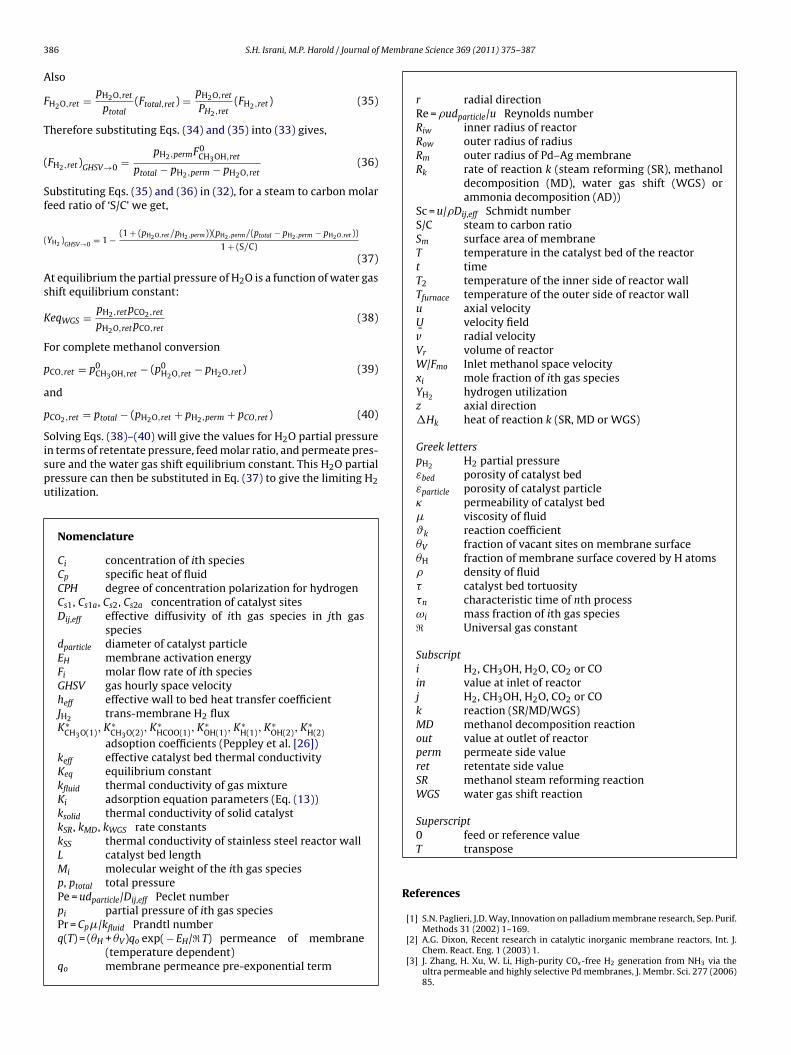
It is revealing to compare (Fig. 23) the results using methanoleforming to those previously for ammonia decomposition (AD) [4].he inner diameter of the reactor for the NH3 studies was 0.6 in.nd the membrane diameter was 2 mm. Table 5 shows the per-
eation and radial transport characteristic times for the AD andSR studies. It is clear that for the MSR reactions the permeations the slowest process whereas for AD the slowest process was theadial transport of H2. In Fig. 23 we see that productivities are sim-lar for reactor 5 and AD reaction at 500 ◦C. Also productivities are
0
2
4
6
8
10
500050050
H2
pro
dcu
tivi
ty (
gm
ole
s/s
m3 )
GHSV (scc/h g cat)
250 Reactor 4 -MSR - ºC
ºC
ºC
ºC
250 Reactor 5 -MSR -
500 AD -
600 AD -
ig. 23. Comparison of ammonia decomposition (AD) and methanol steam reform-ng (MSR) permeate H2 productivities. The retentate pressure was 5 bars for all theeactions and pressures.
AD – 500 C 9.61 2.30AD – 600 ◦C 8.05 1.76MSR – reactor 4 –250 ◦C 1.22 6.16MSR – reactor 5 –250 ◦C 3.87 14.16
similar for reactor 4 and for AD at 600 ◦C. It is very interesting tonote that the productivities are similar even though the controllingmechanisms are completely different.
5. Conclusions
High purity hydrogen was successfully generated in a single-fiber Pd–Ag membrane reactor using methanol steam reforming.The methanol conversions obtained in the packed bed membranereactor was 5–10% higher than in a packed bed reactor espe-cially at high space velocities. A maximum H2 productivity ofapproximately 20 gmoles/(m3 s) was obtained at 300 ◦C and 5 barsretentate pressure. It was determined that the low H2 flux throughthe Pd–Ag membrane was the productivity limiting process. Thereason for the low membrane flux was the surface adsorption ofthe non-H2 species, especially CO. The parameters that have beenestimated and verified in this study have been used to develop athree-dimensional model that can simulate large-scale multi-fibermembrane reactors. This model has been used to design commer-cial scale membrane reactors for on-board generation of ultra-highpurity H2 [30].
A comparison of the methanol steam reforming and ammoniadecomposition reaction systems carried out in the Pd-based PBMRsshow the importance of achieving conditions for which both H2transport through the membrane and radial gas phase transportare fast, so as to maximize the productivity. In the case of methanolsteam reforming, further advances in the area of Pd-alloys thatresist CO adsorption and in the area of synthesis of stable, ultra-thin,Pd-alloy membranes should be pursued to move the technologycloser to commercial viability.
Appendix A.
As very low gas hourly space velocities (GHSVs), i.e., at very highresidence times, methanol conversion is complete. Therefore, thehydrogen retentate partial pressure approaches the permeate pres-sure of hydrogen (i.e., pH2,ret = pH2,perm) and the membrane reactoris at equilibrium. Under these conditions the limiting H2 utilizationis given as,
(YH2 )GHSV→0 = (FH2,perm)GHSV→0
(2F0CH3OH + F0
H2O)
=(2F0
CH3OH + F0H2O) − (FH2,ret + FH2O,ret)GHSV→0
(2F0CH3OH + F0
H2O)(32)
The retentate molar hydrogen flow rate is,
(FH2,ret)GHSV→0 = xH2,ret(FCH3OH,ret + FH2,ret
+ FH2O,ret + FCO2,ret + FCO,ret)GHSV→0 (33)
At complete methanol conversion (since there are no equilib-rium limitations at the temperatures and pressures utilized in thisstudy):
(F0CH3OH,ret)GHSV→0,xCH3OH→0
= FCO2,ret + FCO,ret (34)
3 Membrane Science 369 (2011) 375–387
A
F
T
(
Sf
(
As
K
F
p
a
p
Sispu
r radial directionRe = udparticle/u Reynolds numberRiw inner radius of reactorRow outer radius of radiusRm outer radius of Pd–Ag membraneRk rate of reaction k (steam reforming (SR), methanol
decomposition (MD), water gas shift (WGS) orammonia decomposition (AD))
Sc = u/Dij,eff Schmidt numberS/C steam to carbon ratioSm surface area of membraneT temperature in the catalyst bed of the reactort timeT2 temperature of the inner side of reactor wallTfurnace temperature of the outer side of reactor wallu axial velocityU- velocity fieldv radial velocityVr volume of reactorW/Fmo Inlet methanol space velocityxi mole fraction of ith gas speciesYH2 hydrogen utilizationz axial direction�Hk heat of reaction k (SR, MD or WGS)
86 S.H. Israni, M.P. Harold / Journal of
lso
H2O,ret = pH2O,ret
ptotal(Ftotal,ret) = pH2O,ret
PH2,ret(FH2,ret) (35)
herefore substituting Eqs. (34) and (35) into (33) gives,
FH2,ret)GHSV→0 =pH2,permF0
CH3OH,ret
ptotal − pH2,perm − pH2O,ret(36)
ubstituting Eqs. (35) and (36) in (32), for a steam to carbon molareed ratio of ‘S/C’ we get,
YH2 )GHSV→0 = 1 − (1 + (pH2O,ret/pH2,perm))(pH2,perm/(ptotal − pH2,perm − pH2O,ret ))
1 + (S/C)(37)
t equilibrium the partial pressure of H2O is a function of water gashift equilibrium constant:
eqWGS = pH2,retpCO2,ret
pH2O,retpCO,ret(38)
or complete methanol conversion
CO,ret = p0CH3OH,ret − (p0
H2O,ret − pH2O,ret) (39)
nd
CO2,ret = ptotal − (pH2O,ret + pH2,perm + pCO,ret) (40)
olving Eqs. (38)–(40) will give the values for H2O partial pressuren terms of retentate pressure, feed molar ratio, and permeate pres-ure and the water gas shift equilibrium constant. This H2O partialressure can then be substituted in Eq. (37) to give the limiting H2tilization.
Nomenclature
Ci concentration of ith speciesCp specific heat of fluidCPH degree of concentration polarization for hydrogenCs1, Cs1a, Cs2, Cs2a concentration of catalyst sitesDij,eff effective diffusivity of ith gas species in jth gas
speciesdparticle diameter of catalyst particleEH membrane activation energyFi molar flow rate of ith speciesGHSV gas hourly space velocityheff effective wall to bed heat transfer coefficientJH2 trans-membrane H2 fluxK∗
CH3O(1), K∗CH3O(2), K∗
HCOO(1), K∗OH(1), K∗
H(1), K∗OH(2), K∗
H(2)adsoption coefficients (Peppley et al. [26])
keff effective catalyst bed thermal conductivityKeq equilibrium constantkfluid thermal conductivity of gas mixtureKi adsorption equation parameters (Eq. (13))ksolid thermal conductivity of solid catalystkSR, kMD, kWGS rate constantskSS thermal conductivity of stainless steel reactor wallL catalyst bed lengthMi molecular weight of the ith gas speciesp, ptotal total pressurePe = udparticle/Dij,eff Peclet numberpi partial pressure of ith gas speciesPr = Cp�/kfluid Prandtl numberq(T) = (�H + �V)qo exp( − EH/� T) permeance of membrane
(temperature dependent)qo membrane permeance pre-exponential term
Greek letterspH2 H2 partial pressureεbed porosity of catalyst bedεparticle porosity of catalyst particle� permeability of catalyst bed� viscosity of fluidϑk reaction coefficient�V fraction of vacant sites on membrane surface�H fraction of membrane surface covered by H atoms density of fluid� catalyst bed tortuosity�n characteristic time of nth processωi mass fraction of ith gas species� Universal gas constant
Subscripti H2, CH3OH, H2O, CO2 or COin value at inlet of reactorj H2, CH3OH, H2O, CO2 or COk reaction (SR/MD/WGS)MD methanol decomposition reactionout value at outlet of reactorperm permeate side valueret retentate side valueSR methanol steam reforming reactionWGS water gas shift reaction
Superscript
0 feed or reference valueT transposeReferences
[1] S.N. Paglieri, J.D. Way, Innovation on palladium membrane research, Sep. Purif.Methods 31 (2002) 1–169.
[2] A.G. Dixon, Recent research in catalytic inorganic membrane reactors, Int. J.Chem. React. Eng. 1 (2003) 1.
[3] J. Zhang, H. Xu, W. Li, High-purity COx-free H2 generation from NH3 via theultra permeable and highly selective Pd membranes, J. Membr. Sci. 277 (2006)85.
Memb
[
[
[
[
[
[
[
[
[
[
[
[
[
[[
[
[
[
S.H. Israni, M.P. Harold / Journal of
[4] S.H. Israni, B.R. Nair, M.P.M.P. Harold, Hydrogen generation and purification ina composite Pd hollow fiber membrane reaction: experiments and modeling,Catal. Today 139 (2009) 299.
[5] J. Han, I. Kim, K.-S. Choi, Purifier-integrated methanol reformer for fuel cellvehicles, J. Power Sources 86 (2000) 223–227.
[6] Y.-M. Lin, M.-H. Rei, Study on the hydrogen production from methanol steamreforming in supported palladium membrane reactor, Catal. Today 67 (2001)77–84.
[7] A.S. Damle, Hydrogen production by reforming of liquid hydrocarbons in amembrane reactor for portable power generation—experimental studies, J.Power Sources 186 (2009) 167–177.
[8] A. Basile, G.F. Tereschenko, N.V. Orekhova, M.M. Ermilova, F. Gallucci, A.Iulianelli, An experimental investigation on methanol steam reforming withoxygen addition in a flat Pd–Ag membrane reactor, Int. J. Hydrogen Energy 31(2006) 1615–1622.
[9] M.P. Harold, B. Nair, G. Kolios, Hydrogen generation in a Pd membrane fuelprocessor: assessment of methanol-based reaction systems, Chem. Eng. Sci. 58(2003) 2551–2571.
10] B.K.R. Nair, M.P. Harold, Hydrogen generation in a Pd membrane fuel proces-sor: productivity effects during methanol steam reforming, Chem. Eng. Sci. 61(2006) 6616–6636.
11] I.S. Wieland, I.T. Melin, I.A. Lamm, Membrane reactors for hydrogen production,Chem. Eng. Sci. 57 (2002) 1571–1576.
12] Y.-M. Lin, G.-L. Lee, M.-H. Rei, An integrated purification and production ofhydrogen with a palladium membrane-catalytic reactor, Catal. Today 44 (1998)343–349.
13] J.H. Tong, Y. Matsumura, Methane steam reforming in hydrogen-permeablemembrane reactor for pure hydrogen production, Top. Catal. 51 (2008)123–132.
14] S. Tosti, R. Borelli, A. Santucci, L. Scuppa, Pd–Ag membranes for auto-thermalethanol reforming, Asia-Pac. J. Chem. Eng. 5 (2010) 207–212.
15] D.D. Papadias, S.H.D. Lee, M. Ferrandon, S. Ahmed, An analytical and exper-imental investigation of high-pressure catalytic steam reforming of ethanolin a hydrogen selective membrane reactor, Int. J. Hydrogen Energy 35 (2010)2004–2017.
[
[
[
rane Science 369 (2011) 375–387 387
16] K. Murata, T. Hayakawa, K. Suzuki, S. Hamakawa, Hydrogen production bydecomposition of hydrocarbons over Ni/Ca/carbon catalysts using membrane-type reactor, J. Jpn. Pet. Inst. 43 (2000) 162–166.
17] D.R. Palo, R.A. Dagle, J.D. Holladay, Methanol steam reforming for hydrogenproduction, Chem. Rev. 107 (2007) 3992–4021.
18] L.F. Brown, A comparative study of fuels for on-board hydrogen production forfuel-cell powered automobiles, Int. J. Hydrogen Energy 26 (2001) 381–397.
19] A. Unemoto, A. Kaimai, K. Sato, T. Otake, K. Yashiro, J. Mizusaki, T. Kawada, T.Tsuneki, Y. Shirasaki, I. Yasuda, The effect of co-existing gases from the pro-cess of steam reforming reaction on hydrogen productivity of palladium alloymembrane at high temperature, Int. J. Hydrogen Energy 32 (2007) 2881–2887.
20] S.H. Israni, M.P. Harold, Methanol steam reforming in Pd-based membranereactors: effects of reaction system species on hydrogen flux through a Pd–Agmembrane, Ind. Eng. Chem. Res. 49 (2010) 10242–10250.
21] B.K.R. Harold, M.P. Harold, Pd encapsulated and nanopore hollow fiber mem-branes: synthesis and permeation studies, J. Membr. Sci. 290 (2007) 182–195.
22] B.K.R. Nair, M.P. Harold, Experiments and modeling of transport in Pd and Pd/Agcoated alumina hollow fibers, J. Membr. Sci. 311 (2008) 53–67.
23] J.R. Lattner, Ph.D. Thesis, University of Houston, 2005.24] M. Parvazinia, V. Nassehi, R. Wakeman, M. Ghoreishy, Finite element model-
ing of flow through a porous medium between two parallel plates using theBrinkman equation, Transp. Porous Media 63 (2006) 71–90.
25] C.F. Curtiss, R.B. Bird, Multicomponent diffusion, Ind. Eng. Chem. Res. 38 (1999)2515–2522.
26] B.A. Peppley, J.C. Amphlett, L.M. Kearns, R.F. Mann, Methanol–steam reformingon Cu/ZnO/Al2O3 catalysts. Part 2. A comprehensive kinetic model, Appl. Catal.A: Gen. 179 (1999) 31–49.
27] D.J. Gunn, Axial and radial dispersion in fixed beds, Chem. Eng. Sci. 42 (1987)363.
28] V. Specchia, G. Baldi, S. Sicardi, Heat transfer in packed bed reactors with one
phase flow, Chem. Eng. Commun. 4 (1980) 361–380.29] K. Faungnawakij, R. Kikuchi, K. Eguchi, Thermodynamic evaluation of methanolsteam reforming for hydrogen generation, J. Power Sources 161 (2006) 87–94.
30] S.H. Israni, M.P. Harold, Design of multi-fiber packed bed membrane reactors:3-dimensional simulation studies of methanol steam reforming and ammoniadecomposition, in preparation.
Copyright © 2022 FDOKUMEN