a study on consumer buying behaviour towards packed fruit ...
62
1 “A STUDY ON CONSUMER BUYING BEHAVIOUR TOWARDS PACKED FRUIT JUICE WITH REFERENCE TO STUDENTS OF CHRIST COLLEGE, IRINJALAKUDA” Project Report submitted to UNIVERSITY OF CALICUT In partial fulfillment of the requirement for the award of the degree of BACHELOR OF COMMERCE Submitted by ALEX ANTONY GEORGE (CCASBCM208) Under the supervision of Prof. SIJI PAUL V DEPARTMENT OF COMMERCE CHRIST COLLEGE(AUTONOMOUS), IRINJALAKUDA MARCH 2021
-
Upload
khangminh22 -
Category
Documents
-
view
0 -
download
0
Transcript of a study on consumer buying behaviour towards packed fruit ...

1
“A STUDY ON CONSUMER BUYING BEHAVIOUR
TOWARDS PACKED FRUIT JUICE WITH REFERENCE TO
STUDENTS OF CHRIST COLLEGE, IRINJALAKUDA”
Project Report submitted to
UNIVERSITY OF CALICUT
In partial fulfillment of the requirement for the award of the degree of
BACHELOR OF COMMERCE
Submitted by
ALEX ANTONY GEORGE
(CCASBCM208)
Under the supervision of
Prof. SIJI PAUL V
DEPARTMENT OF COMMERCE
CHRIST COLLEGE(AUTONOMOUS), IRINJALAKUDA
MARCH 2021

2
CHRIST COLLEGE(AUTONOMOUS), IRINJALAKUDA
CALICUT UNIVERSITY
DEPARTMENT OF COMMERCE
CERTIFICATE
This is to certify that the project report entitled “A STUDY ON CONSUMER
BUYING BEHAVIOUR TOWARDS PACKED FRUIT JUICE WITH
REFERENCE TO STUDENTS OF CHRIST COLLEGE,
IRINJALAKUDA” is a bonafide record of project done by ALEX ANTONY
GEORGE, Reg. No. CCASBCM208 under my guidance and supervision in
partial fulfillment of the requirement for the award of the degree of
BACHELOR OF COMMERCE and it has not previously formed the basis for
any Degree, Diploma and Associateship or Fellowship.
Prof. K.J JOSEPH Prof. SIJI PAUL V
Co-ordinator Project Guide
3
DECLARATION
I, ALEX ANTONY GEORGE, hereby declare that the project work
entitled “A STUDY ON CONSUMER BUYING BEHAVIOUR TOWARDS
PACKED FRUIT JUICE WITH REFERENCE TO STUDENTS OF CHRIST
COLLEGE, IRINJALAKUDA” is a record of independent and bonafide
project work carried out by me under the supervision and guidance of Prof. Siji
Paul V, Assistant Professor-On contract, Department of Commerce and
Management Studies, Christ College, Irinjalakuda.
The information and data given in the report is authentic to the best of my
knowledge. The report has not been previously submitted for the award of any
Degree, Diploma, Associateship or other similar title of any other university or
institute.
Place: Irinjalakuda ALEX ANTONY GEORGE
Date 29-03-2021 CCASBCM208
4
ACKNOWLEDGEMENT
I would like to take the opportunity to express my sincere gratitude to all
people who have helped me with sound advice and able guidance.
Above all, I express my eternal gratitude to the Lord Almighty under whose
divine guidance; I have been able to complete this work successfully.
I would like to express my sincere obligation to Rev.Dr. Jolly Andrews,
Principal-in-Charge, Christ college Irinjalakuda for providing various facilities.
I am thankful to Prof. K.J. Joseph, Co-ordinator of B.Com (Finance), for
providing proper help and encouragement in the preparation of this report.
I am thankful to Prof. Prassy Viswambharan, Class teacher for her cordial
support, valuable information and guidance, which helped me in completing
this task through various stages.
I express my sincere gratitude to Prof. Siji Paul V, Assistant Professor-On
contract, whose guidance and support throughout the training period helped me
to complete this work successfully.
I would like to express my gratitude to all the faculties of the Department for
their interest and cooperation in this regard.
I extend my hearty gratitude to the librarian and other library staffs of my
college for their wholehearted cooperation.
I express my sincere thanks to my friends and family for their support in
completing this report successfully.

5
TABLES OF CONTENTS
SL.NO CONTENTS PAGE NO:
LIST OF TABLES
LIST OF FIGURES
CHAPTER 1 INTRODUCTION 1-4
CHAPTER 2 REVIEW OF LITERATURE 5-12
CHAPTER 3 INDUSTRY PROFILE &
COMPANY PROFILE 13-18
CHAPTER 4 DATA ANALYSIS AND
INTERPRETATION 19-37
CHAPTER 5 FINDINGS, SUGGESTIONS
& CONCLUSION 38-41
BIBLIOGRAPHY
ANNEXURE

6
LIST OF TABLES
TABLE
NO: TITLE PAGE NO:
4.1 Table showing Gender wise classification of
respondents 20
4.2 Table showing Age wise classification of
respondents 21
4.3 Table showing opinion of respondents for whom
fruit juice is buying 22
4.4 Table showing classification of how often the
respondents purchase fruit juice
23
4.5 Table showing classification of respondents based
on quantity of fruit juice purchased
24
4.6 Table showing classification of respondents on the
basis of their knowledge about the product
25
4.7 Table showing classification of respondents based
on preferred brand.
26
4.8 Table showing opinion of the respondents based on
loyalty towards the above mentioned brands
27
4.9 Table showing opinion of respondents based on
place of purchase
28
4.10
Table showing classification of respondents based
on the amount spend for purchasing packed fruit
juice on weekly basis
29
4.11 Table showing opinion of respondent based on
considering nutrition value
30

7
4.12 Table showing opinion of respondents based on
their preference in freshness of fruit juice
31
4.13
Table showing classification of respondents based
on consuming fruit juice without influence of
advertisement
32
4.14 Table showing opinion of respondents based on
disposal of waste
33
4.15 Table showing opinion of respondents based on the
addiction of drinking packaged fruit juice
34
4.16 Table showing opinion of respondents based on the
flavour they prefer
35
4.17 Table showing opinion of respondents on drinking
too much fruit juice will cause health problems
36
4.18 Table showing opinion of respondents on
satisfaction of fruit juice based on different factors
37

8
LIST OF FIGURES
FIGURE
NO: TITLE PAGE NO:
4.1 Figure showing gender wise classification of
respondents 20
4.2 Figure showing age wise classification of
respondents 21
4.3 Figure showing opinion of the respondents based on
for whom fruit juice is buying
22
4.4 Figure showing opinions of respondents based on
how often they purchase fruit juice
23
4.5 Figure showing classification of respondents based
on quantity of fruit juice they purchase
24
4.6
Figure showing classification of the respondents on
the basis of availability of knowledge about fruit
juice
25
4.7 Figure showing classification of respondents
based on their preferred brand
26
4.8 Figure showing opinion of respondents based on
loyalty towards above mentioned brands
27
4.9 Figure showing opinion of the respondents on place
of purchase
28
4.10
Figure showing classification of the respondents
based on the amount spend for purchasing packaged
fruit juice
29
4.11 Figure showing opinion of respondents based on
considering nutrition value before buying fruit juice 30
4.12 Figure showing the opinion of the respondents
based on their preference in freshness of juice
31
9
4.13
Figure showing classification of respondents
based on consuming fruit juice without observing
advertisement
32
4.14 Figure showing opinion of the respondents based
on disposal of waste after consumption
33
4.15 Figure showing opinion of the respondents based on
addiction of drinking packaged fruit juice
34
4.16 Figure showing opinion of the respondents based on
the flavour they prefer
35
4.17 Figure showing opinion of respondents on drinking
too much fruit juice will cause health problems
36

10
CHAPTER : 1
INTRODUCTION

11
1.1 Introduction
Consumer buying behavior refers to actions taken by consumers before buying
a product or service. This process may include consulting search engines,
engaging with social media posts, or a variety of other actions. It is valuable for
businesses to understand this process because it helps businesses better tailor
their marketing initiatives to the marketing efforts that have successfully
influenced consumers to buy in the past.
Consumer buying behavior is the study of individuals, groups, or organizations
and all the activities associated with the purchase, use and disposal of goods
and services and how the consumer’s emotions, attitudes and preference affect
buying behavior. Buyer’s reactions to a firms marketing strategy has a great
impact on the firm’s success.
A consumer’s buying decision depends on the type of products that they need
to buy. Consumer buying behavior is determined by the level of involvement
that a consumer shows towards a purchase decision. The amount of risk
involved in a purchase also determines the buying behavior. Higher priced
goods tend to higher risk, thereby seeking higher involvement in buying
decisions. There are four types of consumer buying behavior: Complex buying
behavior, Dissonance-reducing buying behavior, Habitual buying behavior and
Variety seeking behavior.
India is one of the fastest growing economies of the world. In the present
competitive world, most of the companies are shifting their focus from
producing aerated cold drinks to fresh fruit juices which are in packed form,
since fruit juice offer a high nutrition and a sense of appeal, packaged fruit
juices have a good amount of market shares.
This study aims to examine the consumer’s satisfaction level on packaged fruit
juices with special reference to the students of Christ College Irinjhalakuda.
Due to availability of number of brands in the packaged fruit juice there will be
difference in the satisfaction level.

12
1.2 Statement of the problem
Today the majority of fruit juice products target adults. The purpose of this
study is to develop a better understanding of consumer buying behavior for
packaged fruit juice. Specifically, to evaluate where there is significant
relationship between consumer preference towards packaged fruit juice by
adults who usually spends more of their time away from home and what are the
factors influencing consumer’s buying behavior.
1.3 Objectives of the study
• To study the buying behavior of consumers in general towards packaged
fruit juices among the students of Christ College Irinjhalakuda
• To ascertain the level of satisfaction perceived in consuming packaged fruit
juices.
1.4 Research design
1.4.1 Nature of the study
The study is descriptive in nature. A descriptive study is one that is designed to
describe the distribution of one or more variables without regard to any casual
or other hypothesis.
1.4.2 Nature of data
The study is based on primary data. The data is collected from students of
Christ College Irinjhalakuda
1.4.3 Sources of Data
Primary data is collected through questionnaire which is suitable for this study,
from the students of Christ College Irinjhalakuda. Secondary data is also used

13
in the study for proper understanding of concepts used in the study. This
secondary data is collected from various books and websites.
1.5 Sample Design
1.5.1 Nature of population
Population is finite. More than 4000 students are studying in Christ College
Irinjhalakuda. A questionnaire had been issued to the students of Christ
College, Irinjalakuda. Age group of the respondents varies from 18 to 21 years.
1.5.2 Sample unit
Sample unit was the students of Christ College Irinjalakuda (Autonomous).
Sampling unit was an individual person. The term sampling unit refers to
singular value within a sample database.
1.5.3 Method of sampling
Stratified sampling has been adopted in the study. Data had been collected
using questionnaire. Questionnaire had been distributed to the students in
Christ College Irinjalakuda. Sample had been selected using stratified sampling
technique. All together there are more than 4000 students. These students are
classified on the basis of their specialization. Specialization is broadly
classified into science and arts. Students from science and commerce had been
selected at random.
1.5.4 Size of Sample
Size of sample is 50. Sample size measures the number of individual samples
measured or observation used in survey.

14
1.6 Tools of analysis
Following tools are used in the study
- Percentage
- Charts
- Likert scale
1.7 Chapterization
Chapter 1 includes Statement of Problem, Objectives of the study, Hypothesis
of the study, Research design, Sample design, Tools of analysis etc
Chapter 2 includes Review of literature
Chapter 3 includes Industry profile and Company profile
Chapter 4 includes Data analysis and interpretation
Chapter 5 includes Findings, Suggestions and Conclusion.

15
CHAPTER : 2
REVIEW OF LITERATURE

16
2.1 Introduction
This chapter deals with review of literature. Review of literature is divided into
two parts conceptual reviews and empirical literature. Conceptual literature
includes explanation of various concepts used in the study. Empirical literature
includes reviews of previous studies. These studies are arranged in
chronological order
2.2 Conceptual review
Marketers expect that by understanding what causal the consumers to buy
particular goods and services, they will be able to determine which products
are needed in the market place, which are obsolete and how best to present the
goods to the consumer. The study on consumer behaviour assumes that the
consumers are actors in the market place. The perspective role of theory
assumes that consumers play various roles in the market place. Starting from
the information provider from the user to the payer and to the disposer,
consumers play those roles in the decision process.
According to Engel, Blackwell and Mansard consumer behaviour is “the
actions and decision processes of people who purchase goals and services for
personnel consumption”.
According to Loudon and Bitta consumer behaviour is “the decision process
and physical activity, which individuals engage in when evaluating, acquiring,
using or disposing of goods and service”.
2.2.1 Factors influencing consumer behaviour:
Following are the factors influencing consumer
behavior:
a) Marketing mix factors
b) Personnel mix factors
c) Psychological factors

17
d) Social factors
e) Cultural factors
2.2.1.1 Marketing mix factors
Each component of the market mix product, pricing, promotion and place of
distribution has a direct or indirect impact on the buying process of the
consumer.
i. Product
The special characteristics of the product, the physical appearance and the
packaging can influence the buying decision of a consumer.
ii. Pricing
The price charged on the product or services consumed by the consumer affect
the buying behaviour of the consumers. Marketers must consider the price
sensitivity of the target customers while fixing prices.
iii. Promotion
The variables of promotion mix such as advertising publicity, public relations,
personnel selling and sales promotion affect the buying behaviour of the
consumers. Marketers select the promotion mix after considering the nature of
the target audience.
iv. Place
The channels of distribution and the place of distribution affect the buying
behaviour of the consumers. The marketers make an attempt to select the right
channel and distribute the products at the right place.

18
2.2.1.2 Personnel factors
The personnel factors such as age, occupation, lifestyle, social and economic
status and the gender of a consumer may affect the buying decision of the
consumers individually or collectively.
i. Age factor
The age factor greatly influences the buying behaviour. Example: teenagers
prefer trendy clothes whereas office executives prefer sober and formal
clothing.
ii. Gender
The consumer behaviour varies across gender. Example: girls prefer certain
feminine colours such as pink, purple and peach whereas boys go for blue,
black and brown.
iii. Education
Highly educated persons may spend on books, personnel care products and so
on but a person with low or no education may spend less on books and more on
personnel grooming products. iv. Income level
Normally, the higher the income level, the higher is the level of spending and
vice versa, but this may not be the case in developing countries especially in
the rural areas.
2.2.1.3 Psychological factors
A person’s buying behaviour is influenced by the psychological factors such as
the following:

19
i. Learning
It refers to changes in individual behaviour that are caused by information and
experience. Example: when a customer buys a new brand of apparels and is
satisfied by its uses, then they are more likely to buy the same brand the next
time. Through learning, people acquire beliefs and attitudes which in turn
influence the buying behaviour.
ii. Attitude
It is human tendency to respond in a given manner to a particular situation or
object or idea. Consumers may develop a positive or negative or a neutral
attitude towards certain products or brands which in turn affects their buying
behaviour.
iii. Motives
A motive is the inner drive that motives a person to act or behave in a certain
manner. A marketer must identify the buying motives of the target customers
and influence them to act positively towards the marketed products.
Some of the buying motives include the following factors:
• Pride and possession
• Love and affection
• Comfort and convenience
• Sex and romance
iv. Beliefs
A belief is a descriptive thought that a person holds about certain things. It may
be based on knowledge, opinion, faith, trust and confidence. People may hold
certain beliefs of certain brands/products. Beliefs develop brand images which
in turn can affect the buying behaviour.

20
2.2.1.4 Social factors
The social factors such as reference groups, family and social status affects the
buying behaviour. Social factors in turn reflect a constant and dynamic influx
through which individuals learn different meanings of consumption.
i. Reference groups
A reference group is a small group of people such as colleagues at workplace,
club members, friends circle, neighbors, family members and so on.
The reference groups influence the members in following manner:
• They influence member’s values and attitudes.
• They expose members to new behaviour and lifestyle
• They create pressure to choose certain products or brands.
ii. Family
The family is the main reference group that may influence the consumer
behaviour. Nowadays children are well informed about goods and services
through media or friends circle and other sources. Therefore, they influence
considerably in the decisions of buying both fast moving consumer goods and
durable items.
2.2.1.5 Cultural factors
There is a subtle influence of cultural factors on a consumer’s decision process.
Consumers live in a complex social and cultural environment. The types of
products and service they buy can be influenced by the overall cultural context
in which they grow up to become individuals. Cultural factors include race and
religion tradition, caste and moral values. Culture also includes subculture, sub-
castes, religious sect and languages.

21
i. Culture
It influences consumer behaviour to a great extent. Cultural values and
elements are passed from one generation to another through family, educational
institutions, religious bodies and social environment. The cultural diversity
influences food habits, clothing, customs and traditions. For example,
consuming alcohol and meat in certain religious communities is not restricted,
but in certain communities, consumption of alcohol and meat is prohibited.
ii. Subculture
Each culture consists of smaller subcultures that provide specific identity to its
members. Subcultures include sub-castes, religious sects (Roman Catholics,
Syrian Catholics, Protestant Christians, etc.), geographic regions (South
Indians, North Indians) and language (Marathi, Malayali, Gujarati).
The behaviour of people belonging to various subcultures is different.
Therefore, marketers may adopt multicultural marketing approaches, that is,
designing and marketing goods and services that cater to the tastes and
preferences of the consumers belonging to different subcultures.
2.3 Empirical literature
Shrey Agarwal (2020) in “A study on consumer perception and attitude
towards packaged fruit drinks” following are the objectives to find, to
understand consumer shopping behaviour, with focus on fruit based beverages,
to understand consumer perception and preferences, to find triggers and barrier
for fruit based beverages, and to obtain a deep insight of the factors, including
economical, behavioral and psychological that influence consumers decisions.
It has been observed based upon the responses generated that brand plays an
important role as consumer go for known brands. The biggest factor that
directs consumer towards fruit juice is the growing health awareness.
Aline Bravim Santos, Sharlayne de Souza Bottoni (2017) in “Study of
consumers of ready-to drink juices and fruit nectars” the authors aimed to

22
analyze and characterize the profile of consumers of juices by associating the
socio demographic variables. It finds that marketing strategies especially
nutritional marketing can influence the purchasing decisions of consumers.
Tatiana Bonilla (2010) the study “Analysis of consumer preferences
towards 100% fruit juice packages and labels” aimed to identify, which
packaging and labeling attributes consumers consider important when choosing
100% fruit juice products. It finds that choice of product is heavily influenced
by the material of the package also the consumers place positive values and are
willing to pay a high amount for PET bottle.
Dr. M Ceasar and Ms. Siva Sundari (2016) the study “Consumer
perception on fruit drinks a field survey in Tirunelveli district,
Tamilnadu” aimed to ascertain the level of satisfaction perceived in mango
fruit drinks in the study area. The authors have concluded that satisfaction
perceived in the study area is very high. Majority of the consumers strongly
agreed that they were satisfied about the flavour and colour of the fruit juice.
Dr. Gurvishal Sinha (2018) the study “Influencing parameters in purchase
behaviour for packed fruit juices are setting new millennium in Indian
markets” has the following objectives, to decode out that there is an influence
on the purchase of packed fruit juice due to the location and to find out that
professional skills are authentically having an impact on purchase of packed
fruit juices. From the study following conclusions are obtained, locations and
skills both play an important role in purchasing the packed fruit juices. Also
people in the cities are now very health conscious.
Shuwen Yang (2014) the study “How packaging of juice products influence
customer experience” has following objectives, how packaging elements
stimulate customer experience, as a mediator in influencing consumers
purchase intention and to find purchase intention for healthy juice products.
From the study the author concludes that providing positive customer
experience was seen a way to help people to make healthy choices easier and

23
packaging elements of the product were found to have positive influence on the
customer experience and the purchase intention.
Dr. Vanitha Esaimani (2019) in “A study on impact of consumers
preference and consumers buying behaviour towards soft drinks with
special reference to youth” the objective of the author was to highlight
findings of the study in the context consumers buying behaviour towards soft
drinks with special reference to youth. Based on the analysis of the data for this
study the author concludes that soft drink is preferred by the youth. She also
finds that product innovation, price, promotion and distribution are important
factors that have influence on consumer buying behaviour.
Pooja Boga, Tejaswini Sandeep Khanolkar (2015). The study “Fresh fruit
juice – a study on consumer preference and demographic profiling”
focuses on consumption pattern of various soft drinks in different age group.
The study demonstrates detailed analysis of preferences of these populations
and finds the variation in perception of different individuals at different age
group.
Abhay Goyal (2019) a study on “Enhancing consumer preference towards
healthy drinks” aims to find Indian consumer behaviour trends and their
current purchase pattern of fruit based beverages. The author concludes that by
designing the right advertisement and incorporating a right balance of
fear/attitude/response coupled with a socially relevant message, health drink
manufacturers can target the required consumer segment and boost sale of their
health drinks.
Thakor Anikumar (2016) a study on “Impact of packaging on consumer
buying behaviour” aims to figure out impact of packaging on consumer
buying behaviour and to explore reasons behind that. The study concludes that
most of the consumers like the product quality after they purchased their
desired packaged products. There is a positive thinking and trend about well
designed package, shows high product quality.

24
CHAPTER : 3
INDUSTRY PROFILE & COMPANY PROFILE
25
3.1Introduction
This chapter deals with Industry profile and company profile. In Industry
profile history of soft drink industry and their present performance in the
market has been explained. In company profile a brief description about the
companies selected in the study has been explained.
3.2 Industry profile
In soft drink industry, the production, marketing, and distribution are of non-
alcoholic drinks, generally carbonated, flavored, and sweetened, water-based
beverages. The history of soft drinks in the United States illustrates important
business innovations, such as product development, franchising, and mass
marketing, as well as the evolution of consumer tastes and cultural trends.
Many Europeans long believed natural mineral waters held medicinal qualities
and favored them as alternatives to often-polluted common drinking water. By
1772, British chemist Joseph priestly invented a means to synthetically
carbonate water, and the commercial manufacturing of artificial mineral waters
began with Johann Jacob Schweppe's businesses in Geneva in the 1780s and
London in the 1790s. The first known U.S. manufacturer of soda water was
Yale university chemist Benjamin Silliman in 1807, though Joseph Hawkins of
Baltimore secured the first U.S. patent for the equipment to produce the drink
two years later. By the 1820s, pharmacies nationwide provided the beverage as
a remedy for various ailments, especially digestive.
Though the drinks would continue to be sold in part for their therapeutic value,
customers increasingly consumed them for refreshment, especially after the
1830s, when sugar and flavorings were first added. Soda fountains emerged as
regular features of drugstores by the 1860s and served beverages flavored with
ginger, vanilla, fruits, roots, and herbs. In 1874 a Philadelphia store combined
two popular products to make the first known ice-cream soda. The first cola
drink appeared in 1881.
26
In the late 1800s, several brands emerged that were still popular a century later.
Pharmacists experimenting at local soda fountains invented Hires Root Beer in
Philadelphia in 1876, Dr. Pepper in Waco, Texas, in 1885, Coca-Cola in
Atlanta and Georgia, in 1886, and Pepsi-Cola in New Bern, North California,
in 1893, among others.
The history of Coca-Cola reveals how national markets in soft-drink brands
developed. To limit the cost of transportation, manufacturers of syrup
concentrates licensed bottlers to mix the product, package, and distribute it
within a specific territory. Candler underestimated the importance of the
bottling side of the business and in 1899 sold the national rights to bottle Coke
for a fairly small sum to Benjamin F. Thomas and Joseph B. Whitehead, who
then started a national network of bottlers, creating the basic franchising format
by which the industry is still run.
After World War 2, the soft-drink industry became a leader in television
advertising, the use of celebrity endorsements, catchy slogans, tie-ins with
Hollywood movies, and other forms of mass marketing, particularly focusing
on young consumers and emphasizing youth-oriented themes. As health and
fitness consciousness and environmental awareness became popular, the
industry responded with sugar-free and low-calorie diet sodas, beginning in the
1960s, and later, caffeine-free colas and recyclable containers.
In 2001, the soft-drink industry included approximately five hundred U.S.
bottlers with more than 183,000 employees, and it achieved retail sales of more
than $61 billion. Americans that year consumed an average of 55 gallons of
soft drinks per person, up from 48 in 1990 and 34 in 1980. The nine leading
companies accounted for 96.5 percent of industry sales, led by Coca-Cola with
more than 43 percent of the soft drink market and Pepsi with 31 percent.
Seven individual brands accounted for almost two-thirds of all sales: Coca-Cola
Classic (itself with nearly 20 percent of the market), Pepsi-Cola, Diet Coke,
Mountain Dew (a Pepsi product), Sprite (a Coca-Cola product), Dr. Pepper, and
27
Diet Pepsi. Domestic sales growth slowed in the late 1990s because of
increased competition from coffee drinks, iced teas, juices, sports drinks, and
bottled waters. The industry continues, however, to tap lucrative international
markets; Coke and Pepsi each have bottling operations in more than 120
countries.
3.3 Company profile
3.3.1 Mazza
Mazza is a Coca-Cola fruit drink brand from India and marketed in the Middle
East, Africa, Eastern Europe and Asia. Its most popular drink is its mango fruit
drink. The Union Beverages Factory, based in the UAE, began selling it as a
franchisee in the Middle East and Africa in 1976. By 1995, it had acquired
rights to the Maaza brand in these countries through Maaza International Co.
LLC Dubai. Maaza was launched in 1976 in India and was acquired by Coca-
Cola India in 1993 from Parle Bisleri along with other brands such as Limca,
Citra, Thums up and Gold spot. Maaza was acquired by House of Spices in
2005 for the North American market. In 2006 Infra Food brands acquired
Maaza for the European, Caribbean and West-African market and cooperate
with House of Spices for the North American market.
3.3.2 Slice
Slice is a line of fruit –flavored soft drink originally manufactured by PepsiCo
and introduced in 1984 but discontinued by PepsiCo in the United States in the
late 2000s. Slice was reintroduced in the United States and Canada by New
Slice Ventures LLC, who acquired the trademark rights in those countries.
Slice was also reintroduced in India by PepsiCo in 2008 as a Mango-flavored
fruit drink and currently advertised as Tropicana Slice.
Slice was a big success upon release, inspiring other juice-infused drinks based
on already existing juice brands, such as Coca-Cola's Minute Maid orange soda
and Cadbury Schweppes's Sunkist. By May 1987, Slice held 3.2 percent of the
28
soft drink market. One year later, it had fallen to 2.1 percent and was below 2
percent in June 1988. The original design of the can was a solid color related to
the flavor of the drink. These were replaced in 1994 with black cans that
featured colourful bursts related to the flavour of the drink, along with slicker
graphics. In 1997, the cans became blue with colour-coordinated swirls. The
original orange flavour was reformulated around this time with the new slogan,
"It's orange, only twisted”.
In December 2018, New Slice Ventures announced that its new Slice-branded
products had become available for wholesale pre-order in four flavours:
Raspberry & Grapefruit, Blackberry, Mango and Pineapple & Cranberry.
3.3.3 Frooti
Frooti was launched in a green rectangular Tetra Pak as a ready-to-serve mango
drink. Although it wasn't the first mango drink, Frooti quickly acquired a large
market share. The packaging played a major role behind its success, since it
could be carried easily and conveniently. Frooti also provided a refreshing
mango taste that translated into a huge demand for itself.
The tagline "Mango Frooti, Fresh and Juicy", was created by the marketing
duo-team of Arun Lahori and GM Menon. In a crisp brief to the then
communications agency on the brand, to: "make mango Frooti synonymous
with freshness and juiciness". Coined in a flash by creative honcho Bharat
Dhabolkar, "Fresh and juicy got to be Frooti". The slogan revitalized the
company, helping the brand strengthen and consolidate its position as the
undisputed country wide leader of packaged juice drinks. Over the years the
brand has experienced a series of repositioning, from the original tagline
"Mango Frooti, Fresh and Juicy" to "Juice Up your Life". Eventually, the
original tagline- "Mango Frooti, Fresh and Juicy" was reinstalled. The present
ad campaigns focus on reaffirming Frooti's leading position across India in a
confident manner.

29
Along with the brand film, the marketing plan includes outdoors, BTL, mall
activation, visibility at retail outlets (POP) and a strong digital presence. The
first leg of this campaign was launched on social media and as per Kurup in
less than a week, its total timeline deliveries amounted to 52 million. It
managed to garner over 8 million Twitter handles and a count of 80,000 tweets.
Frooti's YouTube channel views increased by 2.5 million and subscribers
increased by 600%. The brand has spent 40% more on its marketing this year.
3.3.4 Real
Dabur Real Juice is the product of Dabur Foods which in turn is a subsidiary of
its parent company Dabur India. It is associated with food and beverage
industry as it belongs to the beverage category. This FMCG product is of
Indian origin and was introduced in the consumer market in the year 1996.
Fruit juice market is very competitive as several bands have joined it and are
fighting to create a niche place for themselves. It is 100% preservative-free and
packaged juice offering wholesome nutrition, great taste in an attractive and
hygienic pack. Packaging is an important part of a product that has the ability
to attract customers especially kids towards it. Dabur has changed its design
and packaging to make it more attractive.
Dabur Real Juice is an Indian brand and has extended its reach to cover every
part of rural and urban India. It has extended its product reach to cover overseas
market via its parent company that already has established channels in more
than sixty countries. It has manufacturing facilities in Jaipur, Siliguri, Nepal.
Packaging is an important part of a real juice industry and Dabur has upgraded
its packaging technology by bringing a state-of-the-art packaging machine in
year 1997 from Nimco, based in Chicago.
Dabur Real Juice has an excellent and widespread distribution network that
makes its products available in consumer market easily and regularly. Its
distribution channel is one of its main strength that has helped the company y
30
in reaching across far and wide. Its products are manufactured at its
manufacturing facilities and the packaged products from these plants are
supplied to Carrying and Forwarding Agents. The C&F agents supply them to
distributors and stockiest, who in turn hand over it to retailers. The goods reach
customers via grocery stores, convenience stores, hypermarket, supermarket,
malls, café, and corner shops. It has extended its product reach to include
places like restaurants, hotels, railways, airlines, hospitals, and E-commerce
portals.
Dabur Real Juice is easily available in every online shopping portal.
3.3.5 Jumpin
Godrej is well known for their range of home appliances, engineering, personal
care, industrial, consumer products, security equipment’s etc. The foods
division of Godrej industries produces and markets edible oils, vanaspati, fruit
drinks, fruit nectar and bakery fats. The foods division of Godrej industries
manufactures fruit drinks under the brand name of Jumpin. This range of fruit
drinks is available in four flavours of mango, pineapple, apple and orange. It
comes in a baseline pack design that is trendy and easy to hold. Flavour
retention is high. Jumpin is available in slim packs of 200 ml in trays of 27.
Also available in 1000 ml pack

31
4.1 Introduction
This chapter deals with data analysis and interpretation. Data had been
collected using questionnaire. Questionnaire had been distributed to the
students in Christ College Irinjalakuda. Sample had been selected using
stratified sampling technique. All together there are more than 4000 students.
This chapter is an attempt made to analyze the satisfaction level of packaged
fruit juices. It also takes into consideration whether there is any difference in
satisfaction level with regard to age.
In this study, data is analyzed with the help of descriptive statistical tools. Here
percentage analysis is used as one of descriptive statistical tool for describing
the data.
4.2 Descriptive Analysis
Descriptive statistics are simply describing what is or what the data shows.
Descriptive Statistics are used to present quantitative descriptions in a
manageable form. In a research study we may have lots of measures.
Descriptive statistics help us to simplify large amounts of data in a sensible
way. Each descriptive statistic reduces lots of data into a simpler summary.
Descriptive statistics do not, however, allows making conclusions beyond the
data we have analyzed or reach conclusions regarding any hypotheses we might
have made. They are simply a way to describe our data. Descriptive statistical
tools are those tools in which, these are used to describe the characteristics of a
single variable, like its frequency and percentages etc.

32
CHAPTER : 4
DATA ANALYSIS AND INTERPRETATION

33
Table 4.1
Table showing classification of the respondents based on Gender
Gender Number of the respondents Percentage
Male 27 54%
Female 23 46%
Total 50 100%
(Source; Primary data)
Table 4.1 shows that 54% of the respondents are male and rest of the 46%
belongs to female. Therefore, majority of the respondents are of male
respondents.
Figure 4.1
Figure showing classification of the respondents based on Gender
(Source; Primary data)
54%
46%Male
Female

34
Table 4.2
Table showing classification of the respondents based on age group.
Age Number of
respondents
Percentage
18 4 8%
19 5 10%
20 28 56%
21 13 26%
Total 50 100%
(Source; Primary data)
Table 4.2 shows that 8% of the respondents belongs to the age group of 18,
10% of the respondents are from the age group 19, 56% of respondents belong
to the age group of 20 and rest of the 26% of the respondents belongs to the age
group of 21. Therefore, majority of the respondents are from the age group 20.
Figure 4.2
Figure showing classification of the respondents based on age group.
(Source; Primary data)
8%
10%
26%56%
Age 18
Age 19
Age 20
Age 21

35
Table 4.3
Table showing opinion of the respondents based on for whom the
fruit juice is buying.
Particulars Number of
respondents
Percentage
For yourself 26 52%
Family 17 34%
Friends 7 14%
Total 50 100%
(Source; Primary data)
Table 4.3 shows that 52% of the respondents buy fruit juice for their own
consumption and 34% of the respondents buy fruit juice for their family and
rest of the 14% of the respondents buy fruit juice for their friends. Therefore,
majority of the respondents purchase fruit juice for their own consumption.
Figure 4.3
Figure showing opinion of the respondents based on for whom the
fruit juice is buying
(Source; Primary data)
52%34%
14%
For yourself
Family
Friends

36
Table 4.4
Table showing opinion of the respondents based on how often they
purchase a fruit juice.
Particulars Number of
respondents
Percentage
1 to 3 times a week 10 20%
4 to 6 times a week 5 10%
Rarely 35 70%
Total 50 100%
(Source; Primary data)
Table 4.4 shows that 20% of the respondents buys fruit juice in 1 to 3 times in a
week and 10% of the respondents buys fruit juice in 4 to 6 times in a week and
rest of 70% of the respondents buy fruit juice rarely. Therefore, majority of the
respondents purchase fruit juice rarely.
Figure 4.4
Figure showing opinion of the respondents based on how often they
purchase a fruit juice.
(Source; Primary data)
20%
10%
70%
1-3 times week
4-6 times a week
Rarely

37
Table 4.5
Table showing classification of the respondents based on quantity of
fruit juice they purchase.
Quantity Number of
respondents
Percentage
250ml 21 42%
500ml 17 34%
700ml 3 6%
1L 9 18%
Total 50 100%
(Source; Primary data)
Table 4.5 shows that 42% of the respondents purchase 250ml of fruit juice and
34% of the respondents purchase 500ml of fruit juice and 6% of the
respondents purchase 700ml of fruit juice and rest of 18% purchase 1 Liter of
fruit juice. Therefore, majority of respondents purchase 250ml of fruit juice.
Figure 4.5
Figure showing classification of the respondents based on quantity of
fruit juice they purchase.
(Source; Primary data)
42%
34%
6%
18%
250 ml
500 ml
700 ml
1 L

38
Table 4.6
Table showing classification of the respondents on the basis of their
knowledge about the fruit juice
Particulars Number of
respondents
Percentage
Television 23 46%
Newspaper 4 8%
Social media 22 44%
Others 1 2%
Total 50 100%
(Source; Primary data)
Table 4.6 shows that 46% of the respondents are of the opinion that they
acquire knowledge about fruit juice from Television and 44% of the
respondents are of the opinion that they acquire knowledge about fruit juice
from social media and 8% of the respondents are of the opinion that they
acquire knowledge about fruit juice from newspaper. 2% of respondent is of
the opinion that they acquire knowledge about fruit juice from other source.
Therefore, majority of the respondents acquire knowledge from Television.
Figure 4.6
Figure showing classification of the respondents on the basis of
availability of knowledge about fruit juice.
(Source; Primary data)
47%
8%
44%
1%
Television
Newspaper
Socialmedia
Others

39
Table 4.7
Table showing classification of respondents based on preferred
brand.
Brand Number of
respondents
Percentage
Real 3 6%
Mazza 8 16%
Frooti 21 42%
Jumpin 3 6%
Slice 8 16%
others 7 14%
Total 50 100%
(Source; Primary data)
Table 4.7 shows that 6% of the respondents prefer Real brand and 16% of the
respondents prefer Mazza brand, 42% of the respondents prefer Frooti brand,
6% of the respondents prefer Jumpin brand and 16% of the respondents prefer
Slice brand and rest of 14% prefer other brands. Therefore, majority of the
respondents prefer Frooti brand.
Figure 4.7
Figure showing classification of respondents based on preferred
brand
(Source; Primary data)
6%
16%
42%
6%
16%
14%Real
Mazza
Frooti
Jumpin
Slice
Others

40
Table 4.8
Table showing opinion of the respondents based on loyalty towards
the above-mentioned brands.
Particulars Number of
respondents
Percentage
Yes 32 64%
No 18 36%
Total 50 100%
(Source; Primary data)
Table 4.8 shows 64% of respondents are of Loyal customers on mentioned
brand and rest of 36% of respondents are not loyal customers of mentioned
brand. Therefore, majority of the customers are loyal customers of the brand
they consume.
Figure 4.8
Figure showing opinion of the respondents based on loyalty towards
the above-mentioned brands.
(Source; Primary data)
65%
35%
Yes
No

41
Table 4.9
Table showing opinions of the respondents on place of purchase.
Place of purchase Number of
respondents
Percentage
Grocery Store 17 34%
Supermarket 22 44%
Hypermarket 9 18%
Restaurant 2 4%
Total 50 100%
(Source; Primary data)
Table 4.9 shows 34% of the respondents purchase fruit juice from grocery
store, 44% of the respondents purchase fruit juice from super markets, 18% of
the respondents from hyper market and 4% of the respondents from restaurant.
Therefore, majority of the respondents purchase fruit juice from supermarket.
Figure 4.9
Figure showing opinion of the respondents on place of purchase.
(Source; Primary data)
35%
45%
19%
1%
Grocery store
Supermarket
Hypermarket
Restaurant
42
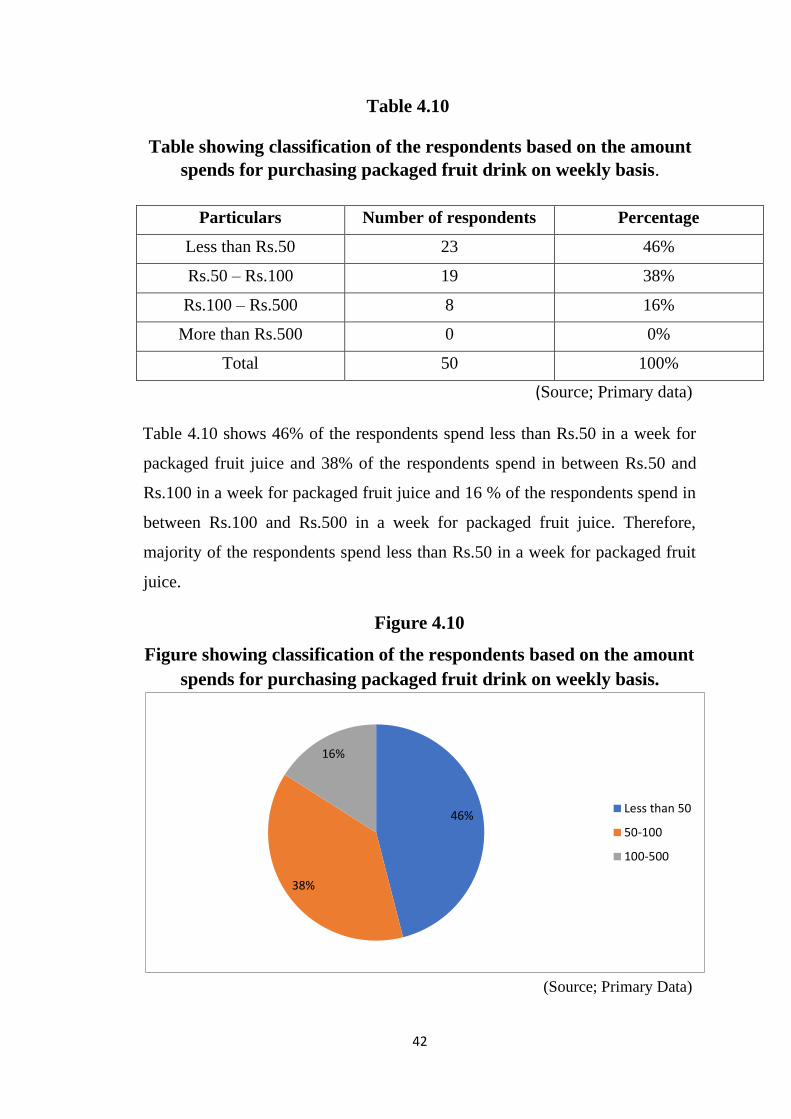
Table 4.10
Table showing classification of the respondents based on the amount
spends for purchasing packaged fruit drink on weekly basis.
Particulars Number of respondents Percentage
Less than Rs.50 23 46%
Rs.50 – Rs.100 19 38%
Rs.100 – Rs.500 8 16%
More than Rs.500 0 0%
Total 50 100%
(Source; Primary data)
Table 4.10 shows 46% of the respondents spend less than Rs.50 in a week for
packaged fruit juice and 38% of the respondents spend in between Rs.50 and
Rs.100 in a week for packaged fruit juice and 16 % of the respondents spend in
between Rs.100 and Rs.500 in a week for packaged fruit juice. Therefore,
majority of the respondents spend less than Rs.50 in a week for packaged fruit
juice.
Figure 4.10
Figure showing classification of the respondents based on the amount
spends for purchasing packaged fruit drink on weekly basis.
(Source; Primary Data)
46%
38%
16%
Less than 50
50-100
100-500

43
Table 4.11
Table showing opinion of the respondents based on considering
“Nutrition value” before buying packaged fruit juice.
Particulars Number of respondents Percentage
Yes 14 28%
No 16 32%
Sometimes 20 40%
Total 50 100%
(Source; Primary data)
Table 4.11 shows that 28% respondents look for nutrition value before buying
packaged fruit juice and 32% of respondents are not bothered about nutrition
value before buying packaged fruit juice and rest of 40% respondents
sometimes look for nutrition value. Therefore, majority of the respondents look
for nutrition value before buying packaged fruit juice.
Figure 4.11
Figure showing opinion of the respondents based on considering
“Nutrition value” before buying packaged fruit juice.
(Source; Primary data)
28%
32%
40% Yes
No
Sometimes

44
Table 4.12
Table showing opinion of the respondents based on their preference
in freshness of fruit juice.
Particulars Number of respondents Percentage
Important 44 88%
Not so important 6 12%
Total 50 100%
(Source; Primary data)
Table 4.12 shows 88% of respondents says that freshness of fruit juice is
important and 12% says that freshness of fruit juice is not so important.
Therefore, majority of the respondents considers freshness of fruit juice is
important.
Figure 4.12
Figure showing opinion of the respondents based on their preference
in freshness of fruit juice
(Source; Primary data)
88%
12%
Important
Not so important

45
Table 4.13
Table showing classification of the respondents based on consuming
Fruit juice without the influence of advertisement.
Particulars Number of
respondents
Percentage
Yes 31 62%
No 19 38%
Total 50 100%
(Source; Primary data)
Table 4.13 shows 62% of the respondents consume fruit juice without
observing advertisement and rest of 38% of respondents consumes fruit juice
after observing advertisement. Therefore, majority of the respondents consume
fruit juice without observing advertisement.
Figure 4.13
Figure showing classification of the respondents based on consuming
Fruit juice without observing advertisement.
(Source; Primary data)
62 %
38 %
Yes No

46
Table 4.14
Table showing opinions of respondents based on disposal of waste
Particulars Number of
respondents
Percentage
Yes 39 78%
No 11 22%
Total 50 100%
(Source; Primary data)
Table 4.14 shows 78% of the respondents dispose waste properly after
consuming. 22% of the respondents do not dispose waste properly after
consuming. Therefore majority of the respondents dispose waste properly.
Figure 4.14
Figure showing opinions of the respondents based on disposal of
waste after consumption.
(Source; Primary data)
78%
22%
Yes
No

47
Table 4.15
Table showing opinion of the respondents based on the addiction of
drinking packaged fruit juice
Particulars Number of
respondents
Percentage
Yes 15 30%
No 35 70%
Total 50 100%
(Source; Primary data)
Table 4.15 shows 30% of respondents are addicted to drinking fruit juice. 70%
of the respondents do not have addiction towards drinking fruit juice. Therefore
majority of the respondents do not have addiction.
Figure 4.15
Figure showing opinion of the respondents based on addiction of
drinking packaged fruit juice
(Source; Primary data)
30%
70%
Yes
No

48
Table 4.16
Showing the opinion of the respondents based on the flavour they
prefer
Particulars Respondents Percentage
Apple 10 20%
Mango 24 48%
Guava 6 12%
Orange 9 18%
Grapes 1 2%
Total 50 100%
(Source: Primary Data)
Table 4.16 shows 20% of the respondents prefer apple, 48% of the respondents
prefer mango, 12% of the respondents prefer guava, 18% of the respondents
prefer orange and 2% prefer grapes. Therefore majority of the respondents
prefer mango flavour.
Figure 4.16
Figure showing opinion of the respondents based on the flavour they
prefer.
(Source: Primary Data)
20%
48%
12%
18%
2%
Apple
Mango
Guava
Orange
Grapes

49
Table 4.17
Showing the opinions of the respondents on drinking too much fruit
juice will cause health problems
Particulars Respondents Percentage
Yes 37 74%
No 13 26%
Total 50 100%
(Source: Primary Data)
Table 4.17 shows that 74% of the respondents think that drinking too much
fruit juice cause health problems and 26% of respondents do not think.
Therefore majority of the respondents think that drinking too much fruit juice
cause health problems.
Figure 4.17
Figure showing opinion of respondents on drinking too much fruit
juice will cause health problems
(Source; Primary Data)
74%
26%
Yes
No

50
Table 4.18
Table showing opinion of the respondents on satisfaction of fruit
juice based on different factors.
HS- Highly Satisfied, S- Satisfied, N – Neutral, D – Dissatisfied, HD – Highly
Dissatisfied
Factors HS S N D HD Total
Flavour 44% 44% 10% - 2% 100%
Colour 12% 50% 28% 2% 8% 100%
Price 14% 46% 32% 4% 4% 100%
Company Brand 18% 56% 24% - 2% 100%
Packaging 16% 54% 26% - 4% 100%
Manufacturing
and expiry date
24% 34% 28% 12% 2% 100%
Quantity 24% 34% 28% 8% 6% 100%
(Source; Primary Data)
Table 4.18 shows that 44% of the respondents say that they are highly satisfied
with flavour of fruit juice. 50% of the respondents are satisfied with colour of
fruit juice. 46% of the respondents say that they satisfied with price of fruit
juice. 56% of the respondents agree that they satisfied with company brand of
fruit juice. 54% of the respondents agree that they satisfied with packaging of
fruit juice. 34% of the respondents are satisfied with manufacturing and expiry
date of fruit juice. 34% of the respondents are satisfied with quantity of fruit
juice.

51
CHAPTER : 5
FINDINGS, SUGGESTIONS AND CONCLUSIONS

52
5.1 Findings
The following important findings are recorded.
• In this study majority of the respondents are male.
• In this study most of the respondents are of 20 years
• In this study majority of the respondents purchase fruit juice for their
own consumption.
• In this study majority of the respondents purchase fruit juice rarely.
• According to the study majority of the respondents purchase 250ml of
fruit juice.
• Majority of the respondents acquire knowledge about fruit juice from
Television.
• According to the study most of the respondents prefer Frooti brand.
• In this study majority of the respondents are loyal customers of the
brand they consume.
• Most of the respondents purchase fruit juice from Supermarket.
• Majority of the respondents spend less than Rs.50 for purchasing
packaged fruit juice on weekly basis.
• Most of the respondents sometimes look for nutrition value before
buying packaged fruit juice.
• Majority of the respondents prefer freshness of fruit juice.
• Most of the respondents consume fruit juice without observing
advertisement.
• Majority of the respondents dispose waste properly.
• Most of the respondents are not addicted to fruit juice.
• In this study most of the respondents prefer mango flavour.
• Most of the respondents think drinking too much fruit juice cause health
problems.
• According to the study most of the respondents are satisfied with flavour
of packaged fruit juice.

53
• In this study majority of the respondents are satisfied with the colour of
the packaged fruit juice.
• In this study majority of the respondents are satisfied with price of
packaged fruit juice.
• Majority of the respondents are satisfied with the company brand of the
fruit juice they purchase.
• In this study majority of the respondents are satisfied with the packaging
of the packaged fruit juice they consume.
• In this study majority of the respondents are satisfied with the
manufacturing and expiry date of the packaged fruit they purchase.
• In this study majority of the respondents are satisfied with the quantity
of the packaged fruit juice the purchase.

54
5.2 Suggestions
• It is advisable if companies use innovative methods in the advertising area.
• Company must introduce different types of colours which increases
customer satisfaction to a large extend.
• It is advisable to give importance to nutrition value in the fruit juice.
• Making fresh fruit juices with natural things will help to increase the sales
of the product and it is very useful to the consumers.
• Reduction in the price will lead to increase the sales of the company.
• It is advisable if the companies take necessary steps to increase the quality
of grape flavour

55
5.3 Conclusion
The objective of the study is to analyze the consumer behavior with respect to
packaged fruit juices. Consumer buying behaviors is very important in the
industry because consumers will make many buying decisions every day. The
study is based on the consumer behaviour analysis which serves a great idea on
how respondents spend their available resources like, time money and effort
while purchasing packaged fruit juice.
In this study flavour, colour, price, company brand, packaging, quantity,
manufacturing expiry date are the major factors that affect consumer
perception. Most of the respondents prefer Frooti fruit juice. Mainly the
consumer get information about the fruit juice is from the TV. Most of the
respondents are satisfied with the flavour of fruit juice.

56
BIBLIOGRAPHY

57
BIBLIOGRAPHY
Journals
1. Shrey Agarwal (2020). A study on consumer perception and attitude
towards packaged fruit drinks.
2. Aline Bravim Santos, Sharlayne de Souza Bottoni (2017) .Study of
consumers of ready-to drink juices and fruit nectars.
3. Tatiana Bonilla (2010). Analysis of consumer preferences towards 100%
fruit juice packages and labels.
4. Dr. M Ceasar and Ms. Siva Sundari (2016). Consumer perception on fruit
drinks a field survey in Tirunelveli district, Tamilnadu.
5. Dr. Gurvishal Sinha (2018). Influencing parameters in purchase
behaviour for packed fruit juices are setting new millennium in Indian
markets.
6. Shuwen Yang (2014). How packaging of juice products influence
customer experience.
7. Dr. Vanitha Esaimani (2019). A study on impact of consumers preference
and consumers buying behaviour towards soft drinks with special
reference to youth.
8. Pooja Boga, Tejaswini Sandeep Khanolkar (2015). Fresh fruit juice – a
study on consumer preference and demographic profiling.
9. Abhay Goyal (2019). Enhancing consumer preference towards healthy
drinks.
10. Thakor Anikumar (2016). Impact of packaging on consumer buying
behaviour.
Books
PRODUCTS MARKETING, 24(6), 75-76
Websites
https://en.wikipedia.org/wiki/Maaza
https://en.wikipedia.org/wiki/Frooti

58
ANNEXURE

59
QUESTIONNAIRE
A STUDY ON CONSUMER BUYING BEHAVIOUR TOWARDS
PACKED FRUIT JUICE WITH REFERENCE TO STUDENTS OF
CHRIST COLLEGE IRINJHALAKUDA
I am Alex Antony George, III DC B.com student in the UG department of
Commerce; Christ College Irinjhalakuda. As a part of my academics I am
conducting a study on consumer buying behaviour towards packed fruit juice
with reference to students of Christ College Irinjhalakuda. I request you to
spend some of your valuable time and fill in the questionnaire. I assure you that
the data provided will be highly confidential and used for academic purpose
only.
Thanking you.
1. Name:
2. Age:
17 18 19 20 21
3. Gender:
Male Female
4. For whom do you buy fruit juice
For yourself Family
Children Friends
5. How often do you purchase fruit juice
1 to 3 times a week 4 to 6 times a week
Rarely
6. Quantity you used to buy

60
250 ml 500ml
700 ml 1L
7. Which of the following factors affect your purchase?
Television Radio Newspaper
Social media Other
8. Preferred brand of fruit juice
Real Mazza Frooti
Jumpin Slice Other
9. Loyalty towards above mentioned brands
Yes No
10. Place of buying
Grocery store Super Market Hyper Market
Restaurant Other
11. Amount spend for fruit juice on weekly basis
Less than 50 50-100
100-500 More than 500
12. Do you consider nutrition value while buying fruit juice?
Yes No Sometimes
13. Your Preference in freshness of juice
Important Not so Important
14. Do you buy fruit juice without influence of advertisement?
Yes No
61
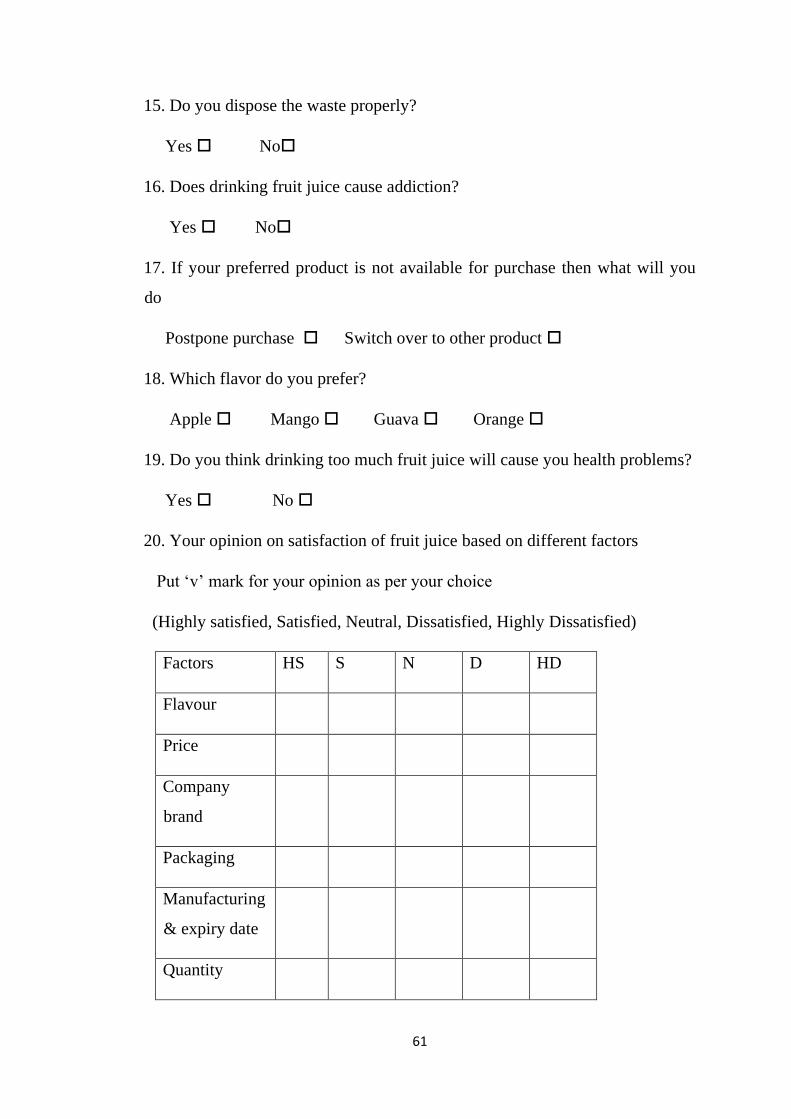
15. Do you dispose the waste properly?
Yes No
16. Does drinking fruit juice cause addiction?
Yes No
17. If your preferred product is not available for purchase then what will you
do
Postpone purchase Switch over to other product
18. Which flavor do you prefer?
Apple Mango Guava Orange
19. Do you think drinking too much fruit juice will cause you health problems?
Yes No
20. Your opinion on satisfaction of fruit juice based on different factors
Put ‘v’ mark for your opinion as per your choice
(Highly satisfied, Satisfied, Neutral, Dissatisfied, Highly Dissatisfied)
Factors HS S N D HD
Flavour
Price
Company
brand
Packaging
Manufacturing
& expiry date
Quantity

62
Colour