ANDERSON JUNIOR COLLEGE JC2 H2 Geography ...
720
READ THESE INSTRUCTIONS FIRST 1. Write your name and class in the spaces provided below, and on all the work you hand in. 2. Write in dark blue or black pen on both sides of the paper. 3. You may use an HB pencil for any diagrams or graphs. 4. Do not use staples, paper clips, glue or correction fluid. Answer three questions. One from each section. You should make reference to appropriate examples studied in the field or the classroom, even where such examples are not specifically requested by the question. Diagrams and sketch maps should be drawn whenever they serve to illustrate an answer. The world outline map may be annotated and handed in with relevant answers. You are reminded of the need for good English and clear presentation in your answers. At the end of the examination, fasten all your work securely together. The number of marks is given in brackets [ ] at the end of each question or part question. Name: PDG: Section A Section B Section C Total Marks Please circle the no. of the attempted question for each section. 1 / 2 3 / 4 5 / 6 32 32 32 96 Percentage 100 This question paper consists of 1 cover sheet and 2 printed pages of questions. ANDERSON JUNIOR COLLEGE JC2 H2 Geography Preliminary Examinations (2018) H2 GEOGRAPHY 9751/01 Paper 1 Structured Essay Questions 27 August 2018 3 hrs Additional Materials: Writing Paper World outline map
-
Upload
khangminh22 -
Category
Documents
-
view
0 -
download
0
Transcript of ANDERSON JUNIOR COLLEGE JC2 H2 Geography ...

READ THESE INSTRUCTIONS FIRST 1. Write your name and class in the spaces provided below, and on all the work you hand in. 2. Write in dark blue or black pen on both sides of the paper. 3. You may use an HB pencil for any diagrams or graphs. 4. Do not use staples, paper clips, glue or correction fluid. Answer three questions. One from each section. You should make reference to appropriate examples studied in the field or the classroom, even where such examples are not specifically requested by the question. Diagrams and sketch maps should be drawn whenever they serve to illustrate an answer. The world outline map may be annotated and handed in with relevant answers. You are reminded of the need for good English and clear presentation in your answers. At the end of the examination, fasten all your work securely together. The number of marks is given in brackets [ ] at the end of each question or part question.
Name: PDG:
Section A Section B Section C
Total Marks
Please circle the no. of the attempted question for each section.
1 / 2
3 / 4
5 / 6
32
32
32
96
Percentage
100
This question paper consists of 1 cover sheet and 2 printed pages of questions.
ANDERSON JUNIOR COLLEGE JC2 H2 Geography Preliminary Examinations (2018)
H2 GEOGRAPHY 9751/01
Paper 1 Structured Essay Questions 27 August 2018
3 hrsAdditional Materials: Writing Paper World outline map

2
AJC 2018 JC2 H2 Geography Preliminary Examinations – Paper 1
Section A – Tropical Environments
Answer one question from this section.
1 (a) Explain how seasonal variations in wind direction affects tropical climates. [12]
(b) To what extent do you agree that variations in rainfall only exist between climatic zones in the tropics?
[20]
2 (a) Explain the variations in surface runoff generation within the tropics. [12]
(b) “Man is solely to blame for flooding hazards in the world today.” To what extent do you agree?
[20]
Section B – Development, Economy and Environment
Answer one question from this section. 3 (a) Explain the different perspectives on how development may be achieved for
countries at various levels of development.
[12]
(b) Evaluate the usefulness of existing approaches in measuring development and its progress.
[20]
4 (a) Discuss the impacts of extractive industries on countries at low levels of development. [12]
(b) “The key to escaping the resource curse is the diversification of the economy.” Evaluate the validity of the given statement. [20]

3
AJC 2018 JC2 H2 Geography Preliminary Examinations – Paper 1
Section C – Sustainable Development
Answer one question from this section.
5 (a) Explain the challenges in attaining sustainable development over space and
time. [12]
(b) “Climate change is the most significant challenge to achieving sustainable
development.” To what extent do you agree with this statement? [20]
6 (a) Explain the factors that affect liveability in cities at low levels of development. [12]
(b) Assess the effectiveness of strategies used to enhance liveability in cities. [20]

READ THESE INSTRUCTIONS FIRST The Insert contains all the Resources referred to in the questions.
This question paper consists of 11 printed pages.
[Turn Over]
ANDERSON JUNIOR COLLEGE JC2 H2 Geography Preliminary Examinations (2018)
H2 GEOGRAPHY 9751/02
Paper 2 Data Response Questions INSERT 12 September 2018
3 hrs

2
AJC 2018 JC2 H2 Geography Preliminary Examinations Paper 2- INSERT
Resource 1 for Question 1
Map of Labrador Nature Reserve, including the locations of Sites A and B

3
AJC 2018 JC2 H2 Geography Preliminary Examinations Paper 2- INSERT
Resource 2 for Question 1
Data collected on infiltration rates from Site A
Time Infiltration rate (mm/min)
1 min 10
2 mins 9
3 mins 7
4 mins 4
5 mins 1
Data collected on infiltration rates from Site B
Time Infiltration rate (mm/min)
1 min 15
2 mins 12
3 mins 10
4 mins 8
5 mins 7

4
AJC 2018 JC2 H2 Geography Preliminary Examinations Paper 2- INSERT
Resource 3 for Question 2
Climograph for Bohol, Philippines
Source: https://en.climate-data.org/location/483265/
Climograph for Paracas, Peru
Source: https://en.climate-data.org/location/1029599/

5
AJC 2018 JC2 H2 Geography Preliminary Examinations Paper 2- INSERT
Resource 4 for Question 2
Chocolate Hills, before the 2013 earthquake
Source: http://www.asiatri.com/2016/11/betten-watkinson-win-2016-bellevue-bohol-5150/chocolate-hills/
Chocolate Hills, after the 2013 earthquake
Source: https://blogs.agu.org/landslideblog/2013/10/16/wipha-typhoon-bohol-earthquake/

6
AJC 2018 JC2 H2 Geography Preliminary Examinations Paper 2- INSERT
Resource 5 for Question 2
Map of warm and cold ocean currents, and relative location of Paracas, Peru
Source: https://www.tes.com/lessons/OAhtY6FP_NHDPQ/ocean-currents
Resource 6 for Question 2
Landforms in Paracas National Park, Peru
Source: https://www.researchgate.net/publication/307133979_Numerical_Investigation_of_Turbulent-Driven_Secondary_Flow?_sg=rsTr7A0nP5Ps_BYbo_YiTc0-gHshYWQ3-kEUX45KvE-
Pf8wDvtG94sMdO_HK9KrCYoiuqfTS5Q

7
AJC 2018 JC2 H2 Geography Preliminary Examinations Paper 2- INSERT
Resource 7 for Question 3
Wages in the garment industry for selected Asian countries
Source: https://www.wsj.com/articles/garment-workers-push-for-higher-wages-1413321601
Resource 8 for Question 3
Article on efforts to increase workers’ wages in Bangladesh
Criticized over unsafe conditions and low pay in its garment industry, Bangladesh took a first step to raise wages on Monday with a special government-appointed board voting to nearly double the minimum wage. Bangladesh’s garment industry has faced growing international pressure to improve worker safety and wages especially since the collapse of the Rana Plaza factory building in April, which killed more than 1,100 garment workers. But the Rana Plaza disaster also focused attention on a global supply chain in which multinational brands pushed hard to keep costs down, even as they promise consumers that their clothes are made in safe, well-run factories. More than 100 multinational clothing brands and retailers have signed a legally binding, Europe-dominated accord that requires them to help finance fire safety and building improvements in Bangladeshi factories. But most American brands, including Walmart and Gap, refused to join, and have instead pursued an approach that does not oblige them to help finance improvements. Bangladesh’s economy is heavily dependent on the garment industry for jobs and foreign exchange earnings. Factory owners say that to stay competitive they must keep wages from rising too high. Mohammad Fazlul Azim, a factory owner and member of Parliament, warned that the wage increase could bankrupt many factories, especially smaller ones. Source: “Bangladesh takes steps to increase lowest pay”, The New York Times, November 2013

8
AJC 2018 JC2 H2 Geography Preliminary Examinations Paper 2- INSERT
Resource 9 for Question 3
Extract from website of Clean Clothes Campaign, a non-state actor
Source: http://turnaroundhm.org/

9
AJC 2018 JC2 H2 Geography Preliminary Examinations Paper 2- INSERT
Resource 10 for Question 4
Slum Population in Selected States in India
Slum Population Total Population State 2001 2011 2001 2011 Andhra Pradesh 5,149,272 10,186,934 15,752,946 84,580,777 Delhi 2,025,890 1,785,390 10,979,341 16,787,941 Gujarat 1,346,709 1,680,095 11,427,259 60,439,692 Jharkhand 309,557 372,999 2,418,755 32,988,134 Maharashtra 10,644,605 11,848,423 33,624,960 112,374,333
Source: https://web.archive.org/web/20061206212031/http://www.censusindia.net:80/results/slum1.html;
https://www.census2011.co.in/
Resource 11 for Question 4
Distribution of informal settlements in Ahmedabad, India
Source: https://openknowledge.worldbank.org/bitstream/handle/10986/16384/wps6267.pdf?sequence=1
Note: Gamtals refer to village areas that have been surrounded by the city over time. Oftentimes due to late incorporation in the city, they are not serviced with urban infrastructure.

10
AJC 2018 JC2 H2 Geography Preliminary Examinations Paper 2- INSERT
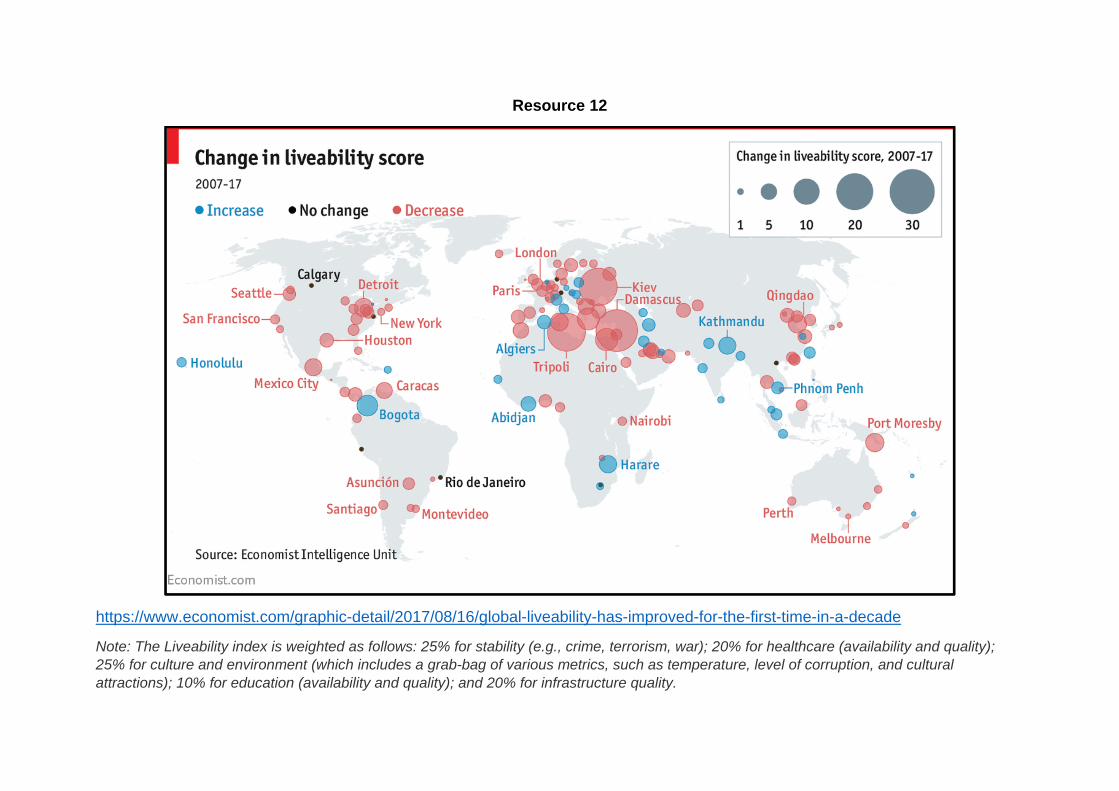
Resource 12 for Question 4
Reimaging of the Sabarmati Riverfront in Ahmedabad, India
Source: http://epaperbeta.timesofindia.com/NasData/Publications/TheTimesOfIndia/Mumbai/2017/09/22/Photographs/018/22_
09_2017_018_026_011.jpg

11
AJC 2018 JC2 H2 Geography Preliminary Examinations Paper 2- INSERT
Resource 13 for Question 4
Article on impacts of urban reimaging of the Sabarmati Riverfront in Ahmedabad
Once a bleak riverbed that was dry most of the year, the Sabarmati that winds through central Ahmedabad is now a swelling and much cleaner waterway, fed by canals and barrages from an upstream river. Previously, the old river was clogged with sewage and the tin-roofed shanties clustered along the banks blocked access for the general public. Now, an interceptor sewer system, part of the $200-million Sabarmati project, has been constructed on both the banks of the river to intercept the sewer running into the river and divert it to treatment plants. Backers of the project boast that the rejuvenation of the Sabarmati riverfront has made it a center of civic life, just as it was a century ago. A key feature of this project is a two-level, continuous promenade on both sides of the river, built just above the water level to serve only pedestrians and cyclists and to provide access to the water. The whole stretch of river banks is public, open to every citizen. But overhauling the Sabarmati required one of the largest urban resettlement programs undertaken in India. Tens of thousands of poor riverfront families were given space in government-built apartment blocks, but most were located on the outer reaches of the city, all but disconnected from transit networks, utilities and people's former livelihoods, the families said. Some of the buildings were unfinished or lacked potable water. Also, not all slum dwellers were resettled. For thousands other impoverished slum dwellers, they and their families are stuck in a temporary housing site, living in tumbledown shacks made of plywood and plastic sheets that fall apart during the heavy summer rains, miles from city services or decent jobs. Adapted from:
• http://sabarmatiriverfront.com/UserFiles/File/INCLUSIVE%20GROWTH.pdf • https://economictimes.indiatimes.com/news/politics-and-nation/poor-excluded-in-ahmedabads-urban-
development-model-study/articleshow/47582007.cms • http://www.latimes.com/world/asia/la-fg-india-river-20140803-story.html

READ THESE INSTRUCTIONS FIRST 1. Write your name and class in the spaces provided below, and on the work you hand in. 2. Write in dark blue or black pen on both sides of the paper. 3. You may use an HB pencil for any diagrams or graphs. 4. Do not use staples, paper clips, glue or correction fluid. Candidates answer all questions. The Insert contains all the Resources referred to in the questions. You should make reference to appropriate examples studied in the field or the classroom, even where such examples are not specifically requested by the question. Diagrams and sketch maps should be drawn whenever they serve to illustrate an answer. The world outline map may be annotated and handed in with relevant answers. You are reminded of the need for good English and clear presentation in your answers. At the end of the examination, fasten all your work securely together. The number of marks is given in brackets [ ] at the end of each question or part question.
Name: PDG:
Section A Section B Total Marks
1 2 3 4
25
25
25
25
100
This question paper consists of 5 printed pages. [Turn Over]
ANDERSON JUNIOR COLLEGE JC2 H2 Geography Preliminary Examinations (2018)
H2 GEOGRAPHY 9751/02
Paper 2 Data Response Questions 12 September 2018
3 hrsAdditional Materials: Writing Paper 1 Insert
1 World map outline

2
AJC 2018 JC2 H2 Geography Preliminary Examinations – Paper 2
Section A
Theme 4: Geographical Investigations 1 A class of 25 18-year old students were tasked to investigate the influence of land use
on infiltration rates in Singapore. After splitting into groups of 5, one of the groups selected Labrador Nature Reserve as their study area, and decided to carry out their primary fieldwork at two sites – Sites A and B – in the nature reserve. The group crafted the following hypothesis for their investigation: “The higher the level of urbanisation of the site, the lower the infiltration rate in the site.” The following equipment were provided to measure infiltration rate at the two different land use sites:
• A tin can, about 30cm in height and a diameter of 10cm, with both ends removed • A 1.5-litre bottle of water • A ruler • Hammer • Wooden plank • Stopwatch
The investigation was conducted on a weekday afternoon in June. They were given 3 hours to complete their investigation, from 2 pm to 5 pm. At the respective sites, the tin can was driven into the soil to about 10cm deep by using a hammer onto a wooden plank placed on the rim of the can. A ruler was placed vertically inside the tin can to record the fall in water level. Water was poured to a depth of 20 cm. Measurements of the remaining depth of water was taken every 1 minute to compute the infiltration rate. At the same time, constant top-ups of water were carried out to maintain a regular head of water above soil. Resource 1 shows a map of Labrador Nature Reserve, which indicates the locations of Sites A and B. Resource 2 shows data collected on infiltration rates at Sites A and B.

3
AJC 2018 JC2 H2 Geography Preliminary Examinations – Paper 2
(a) Explain why the hypothesis crafted by the group is not suitable for the investigation at Labrador Nature Reserve. [2]
(b) Explain how the impacts of the investigation could be minimised. [4]
(c) With reference to Resource 2, sketch a line graph to represent the infiltration
rates for Site A and Site B over time respectively. Suggest one reason why this method may be better than the one depicted in Resource 2. [6]
(d) With reference to Resources 1 and 2, account for the differences in infiltration rates between Sites A and B. [4]
(e) Evaluate the usefulness of the investigation in understanding the influence of land use on infiltration rates, and suggest how the investigation could be improved. [9]

4
AJC 2018 JC2 H2 Geography Preliminary Examinations – Paper 2
Section B
Theme 1: Tropical Environments
Geomorphic processes and landscapes in Bohol, Philippines and Paracas, Peru
2 Resource 3 shows climographs for Bohol, Philippines and Paracas, Peru. Resource 4 shows Chocolate Hills, a limestone landscape in Bohol, Philippines, before and after an earthquake in 2013. Resource 5 is a map of ocean currents. Resource 6 shows landforms in Paracas National Park.
(a) With reference to Resource 3, identify the climate classification of Bohol and Paracas. [2]
(b) With reference to Resources 3 and 4, explain how the landscape in Bohol, before the 2013 earthquake, may have been formed. [8]
(c) Using evidence from Resource 4 and your own knowledge, suggest how the 2013 earthquake might have affected the landform shown in Resource 4. [6]
(d) With reference to Resource 5, account for Paracas’ rainfall characteristics. [4]
(e) Explain how the landforms shown in in Resource 6 may have come about. [5]

5
AJC 2018 JC2 H2 Geography Preliminary Examinations – Paper 2
Theme 2: Development, Economy and Environment
Wages of workers in the garment industry in Bangladesh
3 Resource 7 shows wages in the garment industry for selected Asian countries.
Resource 8 is an article on efforts to increase workers’ wages in Bangladesh. Resource 9 is an extract from the website of Clean Clothes Campaign, the largest global alliance of labour unions and non-governmental organisations (NGOs) fighting for the improvement of working conditions and empowering garment industry workers.
(a) With reference to Resource 7, compare the wage level of Bangladesh to the other Asian countries. [4]
(b) Suggest reasons why transnational corporations (TNCs) in the garment industry may locate their operations in the countries listed in Resource 7. [5]
(c) With reference to Resource 8 and your own knowledge, suggest possible impacts that TNCs may have on their host economies. [6]
(d) With reference to Resource 8, explain why raising wages may not be necessarily beneficial for Bangladesh. [3]
(e) With reference to Resource 9 and your own knowledge, explain the role of
non-state actors in influencing the global economy. [7]

6
AJC 2018 JC2 H2 Geography Preliminary Examinations – Paper 2
Theme 3: Sustainable Development
Urban liveability in Ahmedabad, India
4 Ahmedabad, the former capital of the Indian state of Gujarat, is one of the most
populous cities in the country as of 2011. It also houses a key urban reimaging project implemented along the Sabarmati River, an important source of water for the city. Resource 10 shows the trends in slum population in various states in India from 2001 to 2011. Resource 11 shows the distribution of informal settlements in Ahmedabad. Resource 12 shows the main features of urban reimaging of the Sabarmati River in Ahmedabad. Resource 13 is an extract on impacts of urban reimaging of the Sabarmati Riverfront in Ahmedabad.
(a) Compare the trends in slum population between Gujarat and Delhi from 2001 to 2011 with reference to Resource 10. [3]
(b) Describe the distribution of the range of informal settlements in Ahmedabad in 2001 using Resource 11. [4]
(c) With reference to Resource 11, suggest reasons for the distribution of the range of informal settlements in Ahmedabad in 2001. [5]
(d) With reference to Resource 12, explain two ways in which urban reimaging of the Sabarmati Riverfront might have helped enhance urban liveability in the area. [4]
(e) Using Resources 12 and 13 and your own knowledge, evaluate the extent to which urban reimaging along Sabarmati Riverfront has improved the lives of slum dwellers in Ahmedabad. [9]

2018 JC2 H2 Geo Prelim Paper 1– MARK SCHEME Page 1 of 9
AJC 2018 JC2 H2 Geography Preliminary Examinations – Paper 1
Section A – Tropical Environments
Answer one question from this section.
1 (a) Explain how seasonal variations in wind direction affects tropical climates. [12]
Indicative content: • Seasonal variations in wind direction refer to monsoons. • The effects of such variations on tropical climates generally revolve
around rainfall seasonality. • An explanation of how such seasonal variations in wind direction occur
should be provided: change in position of the overhead sun across the months; shifts of the ITCZ.
• Explanation of how these variations then affect rainfall patterns in the tropics should also be provided: effect of variations in land/ sea surfaces on rainfall patterns; other local factors – such as orographic barriers.
• A higher level response will offer detailed explanations of both how the seasonal variations in wind directions occur, as well as their resultant effects on rainfall patterns in the tropical climates. An understanding of context will also be shown, perhaps through discussing/ comparing the effects of the Asian and African monsoons.
Levels marked using H2 generic level descriptors for 12m SEQ sub-part (a)
(b) To what extent do you agree that variations in rainfall only exist between climatic zones in the tropics?
[20]
Indicative content: • Variations in rainfall can be seen between climatic zones: total amount;
seasonality • Variations in rainfall can also be seen within climatic zones, in different
locations with location-specific factors/ conditions: orographic barriers; local heating; ocean currents; continentality
• A higher level response will have a clear statement of degree of agreement with the perspective offered. Responses should provide justification for their stand.
Possible links to other topics include: • Occurrence of tropical cyclones leading to higher than average rainfall in
some parts of the tropics (Topic 1.2) • Climate change leading to effects on rainfall patterns or changes in
rainfall within a climatic zone over time (e.g. wet places getting wetter, dry places getting drier) (Topic 3.1)
Levels marked using H2 generic level descriptors for 20m SEQ sub-part (b)

2018 JC2 H2 Geo Prelim Paper 1– MARK SCHEME Page 2 of 9
AJC 2018 JC2 H2 Geography Preliminary Examinations – Paper 1
2 (a) Explain the variations in surface runoff generation within the tropics. [12]
Indicative content:
• In essence, students are required to discuss how variations in surface runoff are a result of variations within the tropics. Therefore, in order to address the question, students are required to do the following:
o Identify the two different types of surface runoff (overland flow) in the tropics – Hortonian overland flow and saturation overland flow.
o Identify variations within the tropics that would result in differences in surface runoff generation – in this case, differences in precipitation between the humid and arid tropics.
o Explain why such differences in precipitation would result in Hortonian overland flow and saturation overland flow respectively.
• A higher level response might include the following: o Detailed explanations of the differences between Hortonian
overland flow and saturation overland flow o Consistent and explicit relevance of the response to the
context - e.g. contrasting between humid and arid tropics with relevant examples
Levels marked using H2 generic level descriptors for 12m SEQ sub-part (a)
(b) “Man is solely to blame for flooding hazards in the world today.” To what extent do you agree?
[20]
Indicative content: • Students should discuss both natural and anthropogenic causes of
flooding, and provide a comparison of the relative importance of human activities in causing flooding hazards in the world today.
o In the case of natural causes of flooding, students may particularly want to discuss the role of heavy rainfall in causing flooding hazards.
o In the case of human causes of flooding, students could discuss the roles of deforestation and urbanisation in causing flooding hazards. The role of climate change in intensifying rainfall events, leading to greater frequency and/or magnitude of flooding hazards could also be raised.
• Students could argue that human activities are largely to blame for flooding hazards, especially given current urbanization trends and the trend of global warming.
o Fully agreeing with the given statement, which requires evidence that natural factors do not have a part to play in causing flooding hazards at all, is generally not a recommended stand to take.
o However, it is possible for students to discuss the role of humans in mitigating flooding hazards to support arguments of how human activities are not completely to blame for the

2018 JC2 H2 Geo Prelim Paper 1– MARK SCHEME Page 3 of 9
AJC 2018 JC2 H2 Geography Preliminary Examinations – Paper 1
occurrence of flooding hazards. • Students should, where possible, make reference to case studies that
demonstrate the relative importance of human activities / natural factors in causing flooding hazards.
• A higher level response might include the following: o A clear statement of degree of agreement with the perspective
offered, with justification for their stand. o Consistent use of case studies to support arguments within the
essay. Possible links to other topics include: • The influence of climate on rainfall patterns and thereby the occurrence
of flooding hazards in the tropics (Topic 1.1) • The influence of climate change in influencing rainfall patterns (e.g.
changes in precipitation intensity and influence on frequency of tropical cyclone occurrence) (Topic 3.1)
• The influence of urbanisation on flooding hazard occurrence (e.g. pluvial flooding) (Topic 3.2)
Levels marked using H2 generic level descriptors for 20m SEQ sub-part (b)

2018 JC2 H2 Geo Prelim Paper 1– MARK SCHEME Page 4 of 9
AJC 2018 JC2 H2 Geography Preliminary Examinations – Paper 1
Section B – Development, Economy and Environment
Answer one question from this section. 3 (a) Explain the different perspectives on how development may be achieved for
countries at various levels of development.
[12]
Indicative Content: • Different perspectives on how development may be achieved include:
o Core-periphery model: Shows how the core regions become more economically developed than the periphery regions. Beneficial effects can spread from the developed, core regions to the less developed, peripheral regions due to increasing deconcentration from the core, increasing interactions between core and periphery and development of transport and communications infrastructure. These thus lead to economic growth and diffusion to the peripheral regions.
o Dependency theory: proposes that the development of the richer
nations was attained at the expense of the poorer ones, hence accounting for the persistent poverty or low levels of development of the developing countries. While richer countries were able to develop from the profits reaped by importing primary commodities from the poorer nations and selling manufactured products, the poorer countries constantly faced a situation of trade deficit where the price of primary commodities were always lower than the price of manufactured products they had to purchase from the richer nations.
o Bottom-up development: Shifted the focus away from an economic
understanding of development. Hence it emphasized self-reliance, meeting people’s basic needs, being ecologically sensitive as aspects of development that should be attained/ considered. Involved greater public participation in contextualizing nature of development.
• A higher level response will offer detailed explanations of how each of the
perspectives offered insights as to how development is achieved. Responses might also discern how these perspectives differentiated the development pathways of developed vs developing countries.
Levels marked using H2 generic level descriptors for 12m SEQ sub-part (a)
(b) Evaluate the usefulness of existing approaches in measuring development and its progress.
[20]
Indicative content: • Existing approaches in measuring development: economic measures;
Human Development Index (HDI); Multi-dimensional Poverty Index (MPI) • Existing approaches in measuring development progress: MDGs; post-
2015 Development Agenda and SDGs

2018 JC2 H2 Geo Prelim Paper 1– MARK SCHEME Page 5 of 9
AJC 2018 JC2 H2 Geography Preliminary Examinations – Paper 1
• Responses should include a discussion of the extent of usefulness of these measures in measuring developing development and its progress.
• A higher level response will specify criteria in evaluating the usefulness of the approaches. These could include: comprehensiveness; comparability; relevance over time; ease of use for specific groups (e.g. governments, policymakers, etc.).
Possible links to other topics include: • Indicators that measure sustainable urban development (Topic 3.2)
Levels marked using H2 generic level descriptors for 20m SEQ sub-part (b)

2018 JC2 H2 Geo Prelim Paper 1– MARK SCHEME Page 6 of 9
AJC 2018 JC2 H2 Geography Preliminary Examinations – Paper 1
4 (a) Discuss the impacts of extractive industries on countries at low levels of development. [12]
Indicative content:
• Students should explain the environmental impacts of extractive industries, although related social and economic impacts of extractive industries will also be accepted and will in fact enhance the quality of the answer. Explanations should include the identification of impacts, details of these impacts, and why these impacts would occur, particularly in the context of countries at low levels of development (LDCs).
• A higher level response might include the following: o Well-elaborated case studies situated in LDCs to elaborate on
identified impacts of extractive industries. Levels marked using H2 generic level descriptors for 12m SEQ sub-part (a)
(b) “The key to escaping the resource curse is the diversification of the economy.” Evaluate the validity of the given statement. [20]
Indicative content: • Students should discuss the extent of importance of one economic policy
– diversification of the economy – in escaping the resource curse. This could possibly include the following elements:
o A clear explanation of the resource curse theory o A discussion of strategies / characteristics of good governance
that would help countries escape the resource curse, with diversification of the economy as one required point of discussion.
o An assessment of the importance of diversification of the economy, through analyzing its strengths and/or weaknesses, and/or through contrasting this strategy with other strategies and/or characteristics of good governance.
• Responses which focus mostly on the reasons for the resource curse, rather than on how countries might escape the resource curse will not be able to attain a high level of marks
• A higher level response might include the following: o Use of weighing criteria to evaluate how crucial the
diversification is to escaping the resource curse. o Consistent use of case studies to justify arguments being made
(e.g. the case study of Botswana) Possible links to other topics include: • The role of different actors – e.g. TNCs and the state – in facilitating
countries’ escape from the resource curse (Topic 2.1) Levels marked using H2 generic level descriptors for 20m SEQ sub-part (b)

2018 JC2 H2 Geo Prelim Paper 1– MARK SCHEME Page 7 of 9
AJC 2018 JC2 H2 Geography Preliminary Examinations – Paper 1
Section C – Sustainable Development
Answer one question from this section. 5 (a) Explain the challenges in attaining sustainable development over space and
time. [12]
Indicative content: • Political challenges: lack of political commitment and will; tedium of
negotiation and lack of consensus; protection of self-interests; lack of “hard laws” and legally-binding limits; lack of clarity on how to implement actions
• Economic challenges: differences in level of development across countries; high costs of implementation
• A higher level response will offer detailed explanations of how these challenges can be observed through the obstacles and outcomes of the Rio Earth Summit and Rio+20.
Levels marked using H2 generic level descriptors for 12m SEQ sub-part (a)
(b) “Climate change is the most significant challenge to achieving sustainable
development.” To what extent do you agree with this statement? [20]
Indicative content: • Responses should include a discussion on the correlation between
climate change and the achievement of sustainable development – generally, the effects of climate change would lead to setbacks in the economic, environmental and social domains of societies, hence potentially hindering sustainable development.
• An alternative approach would also consider how the effects of climate change might trigger mitigation/ adaptation responses that would aid in achieving sustainable development in the long run.
• Responses could also consider the role of other factors in affecting sustainable development, for instance on a more local scale: e.g. waste, poor housing conditions; traffic congestion
• Reasons as to why these other factors are deemed more/ less significant compared to climate change could also be provided.
• A higher level response will have a clear statement of degree of agreement with the perspective offered. Responses should provide justification for their stand.
Possible links to other topics include: • Issues in Sustainable Urban Development (Topic 3.2) • Increased frequency in El Nino events due to global warming (Topic 1.1) • Increased occurrence of tropical cyclones and flooding events due to
global warming (Topic 1.2) • Causes and effects of tropical deforestation which illustrate the difficulty
in achieving sustainable development (Topic 1.2)

2018 JC2 H2 Geo Prelim Paper 1– MARK SCHEME Page 8 of 9
AJC 2018 JC2 H2 Geography Preliminary Examinations – Paper 1
• Environmental impacts of TNC (Topic 2.1) • Impacts of extractive industries (Topic 2.2)
Levels marked using H2 generic level descriptors for 20m SEQ sub-part (b)

2018 JC2 H2 Geo Prelim Paper 1– MARK SCHEME Page 9 of 9
AJC 2018 JC2 H2 Geography Preliminary Examinations – Paper 1
6 (a) Explain the factors that affect liveability in cities at low levels of development. [12]
Indicative content: • Responses should include a discussion of at least two different
categories of factors that affect urban liveability: political, social, economic and environmental factors. Explanations should identify the respective factors and explain what they entail.
• A higher level response might include the following: o Choice of factors & relevant examples that reflect
characteristics of cities at low levels of development (i.e. LDC cities) – the context of the question. One example would be war-torn cities in the Middle-East and their low ranking in liveability indexes, which reflects safety and stability as part of political factors that affect urban liveability.
Levels marked using H2 generic level descriptors for 12m SEQ sub-part (a)
(b) Assess the effectiveness of strategies used to enhance liveability in cities. [20]
Indicative content: • Responses should discuss the extent to which strategies used to enhance
liveability are effective, using a criterion/ a set of weighing criteria. More than one strategy needs to be discussed.
• Strategies discussed must include a clear explanation on how the strategy is meant to address issue(s) affecting liveability in cities (in order to enhance urban liveability). Students can discuss strategies used to reimage a city and/or manage the effects of pluvial flooding on liveability, but are not restricted to this. Students may discuss strategies to achieve sustainable urban development only if there are clear links made to how strategy could enhance urban liveability.
• A higher level response might include the following: o Consistent application of a set of criteria or criterion to evaluate
the effectiveness of different strategies. o Recognition that the effectiveness of strategies would vary
according to context – e.g. between developed and developing cities, between different social groups in a city.
Possible links to other topics include: • With reference to strategies used to mitigate pluvial flooding to enhance
urban liveability, students might make links to flooding in the tropics more generally (Topic 1.2) and the influence of climate change on urban liveability (Topic 3.1)
Levels marked using H2 generic level descriptors for 20m SEQ sub-part (b)

2018 JC2 H2 Geo Prelim – Paper 2 MARK SCHEME Page 1 of 14
AJC 2018 JC2 H2 Geography Preliminary Examinations – Paper 2
Section A
Theme 4: Geographical Investigations 1 A class of 25 18-year old students were tasked to investigate the influence of land use on
infiltration rates in Singapore. After splitting into groups of 5, one of the groups selected Labrador Nature Reserve as their study area, and decided to carry out their primary fieldwork at two sites – Sites A and B – in the nature reserve. The group crafted the following hypothesis for their investigation: “The higher the level of urbanisation of the site, the lower the infiltration rate in the site.” The following equipment were provided to measure infiltration rate at the two different land use sites:
• A tin can, about 30cm in height and a diameter of 10cm, with both ends removed • A 1.5-litre bottle of water • A ruler • Hammer • Wooden plank • Stopwatch
The investigation was conducted on a weekday afternoon in June. They were given 3 hours to complete their investigation, from 2 pm to 5 pm. At the respective sites, the tin can was driven into the soil to about 10cm deep by using a hammer onto a wooden plank placed on the rim of the can. A ruler was placed vertically inside the tin can to record the fall in water level. Water was poured to a depth of 20 cm. Measurements of the remaining depth of water was taken every 1 minute to compute the infiltration rate. At the same time, constant top-ups of water were carried out to maintain a regular head of water above soil. Resource 1 shows a map of Labrador Nature Reserve, which indicates the locations of Sites A and B. Resource 2 shows data collected on infiltration rates at Sites A and B.
(a) Explain why the hypothesis crafted by the group is not suitable for the investigation at Labrador Nature Reserve. [2]
Answer Guide: • Not specific – does not specify the sites delineated for investigation and/or the
different land uses required • Not measurable – variations in land use cannot be measured by level of
urbanisation Point-marked – 1m for identification of reason, and 1m for explanation of reason.
(b) Explain how the impacts of the investigation could be minimised. [4]
Answer Guide: • Minimisation of impacts on the ecosystem in the area, through measures
such as: o Minimising the removal of vegetation when hammering the tin can into the
soil to measure infiltration rates, especially at Site B o Avoiding littering at the park
• Minimisation of social impacts in the nature park, given that it is a weekday
afternoon in June where there might be members of the public in the area,

2018 JC2 H2 Geo Prelim – Paper 2 MARK SCHEME Page 2 of 14
AJC 2018 JC2 H2 Geography Preliminary Examinations – Paper 2
through measures such as: o Conducting investigation away from pathways, especially at Site A given
that Site A is a road / next to a carpark o Reduce noise levels when conducting investigation, as the nature park is
an area of leisure and recreation for members of the public.
• Any other impacts & corresponding suggestions – list is non-exhaustive Point-marked.
(c) With reference to Resource 2, sketch a line graph to represent the infiltration rates for Site A and Site B over time respectively. Suggest one reason why this method may be better than the one depicted in Resource 2. [6]
Answer Guide: • Sketch of line graph:
o 2 marks for Site A and B respectively. Marks are allocated based on: Accuracy of data points Use of appropriate x- and y- axes
• Possible reasons for line graph being an improvement over the table (1m for
identified reason, 1m for explanation): o Easier visualization of change of infiltration rates over tine at each site o Easier comparison of difference in change in infiltration rates between
Sites A and B o Any other appropriate reason accepted.
Point marked.
(d) With reference from Resources 1 and 2, account for the differences in infiltration rates between Sites A and B. [4]
Answer Guide: • Infiltration rates at Site A are lower than at Site B.
o Site A: Being located at a car park / road, the ground is therefore likely to be concretised and largely impermeable. This hence reduces infiltration rates at the area.
o Site B: Being located directly within the gazetted nature reserve area in Labrador Nature Reserve, it is likely that vegetative cover is high. This means that soil will be more permeable owing to the presence of plant roots that provide fissures, thus enhancing infiltration rates.
Point marked.
(e) Evaluate the usefulness of the investigation in understanding the influence of land use on infiltration rates, and suggest how the investigation could be improved. [9]
Answer Guide: Possible points for evaluation of usefulness of the investigation: • Arguments supporting the view that the investigation has been useful:
o Does allow for a conclusion to be drawn that variations in land use do impact infiltration rates in the area.
o Sites selected for investigation are very clearly of two different types of land use, contributing to the validity of the investigation in meeting its aims

2018 JC2 H2 Geo Prelim – Paper 2 MARK SCHEME Page 3 of 14
AJC 2018 JC2 H2 Geography Preliminary Examinations – Paper 2
• Arguments against the view that the investigation has been useful:
o Accuracy of the investigation is unclear, given: The use of a single-ring infiltrometer rather than a double-ring
infiltrometer, which means that the lateral flow of water is not controlled in the investigation
Investigation was not repeated in the same session o Reliability of the investigation is unclear, given that:
Only one session of the investigation was conducted, and on only one day
Possible suggestions on how to improve the investigation: • Improve reliability and accuracy of the investigation through:
o Using a double-ring infiltrometer to control lateral flow of water during the investigation
o Choice of more sites of different land uses to corroborate findings further o Repetition of investigation on the same day, near to Sites A and B
respectively, and taking the average result o Having multiple sessions across several days and taking the average
result. Levels marked using H2 Generic Level Descriptors for 9m DRQ on Theme 4.

2018 JC2 H2 Geo Prelim – Paper 2 MARK SCHEME Page 4 of 14
AJC 2018 JC2 H2 Geography Preliminary Examinations – Paper 2
Section B
Theme 1: Tropical Environments
Geomorphic Processes and Landscapes in Bohol, Philippines and Paracas, Peru
2 Resource 3 shows climographs for Bohol, Philippines and Paracas, Peru. Resource 4 shows Chocolate Hills, a limestone landscape in Bohol, Philippines, before and after an earthquake in 2013. Resource 5 is a map of ocean currents. Resource 6 shows landforms in Paracas National Park.
(a) With reference to Resource 3, identify the climate classification of Bohol and Paracas. [2]
Answer Guide: • Bohol – Am/ tropical monsoon climate • Paracas – Bwh/ tropical desert
Point marked.
(b) With reference to Resources 3 and 4, explain how the landscape in Bohol, before the 2013 earthquake, may have been formed. [8]
Indicative content: • Landscape identification: cone and cockpit karst
• Why the Am climate contributes to landscape formation:
o An abundance of rainfall is required as water is a key agent for the chemical weathering processes of carbonation and solution, and a sufficient amount of water is required to dissolve part of the rock. This therefore allows intense vertical solution to occur.
o Also supports dense vegetation, hence providing an abundance of humic acids from decaying vegetation.
• Geological characteristics that favour landscape development – the nature of limestone:
o Well-bedded and jointed allowing for drainage of water along fractures and thus localised (concentrated) solution along these fractures
o Comprises of calcium carbonate which is highly soluble
• Process of formation: o Cone karsts generally develop first from dolines, which are surface
conical depressions formed essentially by the solution and/or collapse of underlying limestone strata.
o Due to intense chemical weathering in the form of carbonation and solution, the dolines develop into cockpits. Neighbouring cockpits may ultimately overlap and merge.
o Over time, the low residual hills marking the boundary of a cockpit are converted into cone-shaped rises by the expansion of cockpits from various sides.
Level Marks Descriptors
3 6 - 8 • Response considers both the role of climate and geology in the formation of the landscape.
• Detailed explanation of identified factors and how they

2018 JC2 H2 Geo Prelim – Paper 2 MARK SCHEME Page 5 of 14
AJC 2018 JC2 H2 Geography Preliminary Examinations – Paper 2
contribute the process of landscape formation. • Accurate identification of the landscape in Resource 4.
2 4 - 5 • Response considers only the role of climate or the role
geology in the formation of the landscape. • Explanation of identified factors and how they contribute the
process of landscape formation is provided, but weaker responses may lack depth in explanation.
• Weaker responses may not accurately identify the landscape in Resource 4.
1 1 - 3 • Response may consider the role of climate or the role geology in the formation of the landscape, but response generally lacks depth, or appears descriptive.
• Weaker responses may not accurately identify the landscape in Resource 4.
0 0 No creditworthy response Levels marked.
(c) Using evidence from Resource 4 and your own knowledge, suggest how the 2013 earthquake might have affected the landform shown in Resource 4. [6]
Indicative content: • In general, earthquake has caused mass movements to occur on the slopes of the
cone karst.
• In particular, based on the centre middleground of Resource 4 (after earthquake), it appears that a slide/ rotational slide/ slumping has occurred as there seems to be an arcuate or crescent-shaped head scarp at the top of the slope.
• Process: o Considering that the slopes of the cone karst are relatively steep, the
effect of the tangential pull of gravity on slope materials is expected to be a significant, and accounts for a relatively high amount of shear stress.
o Earthquake causes ground-shaking which may cause the slope materials to be loosened/ lose cohesiveness hence resulting in a reduction in shear strength.
o The Am climate of Bohol also suggests that slope materials are likely to contain some amount of water content, thus increasing the likelihood of lubrication along the slide plane, reducing friction and shear strength.
Level Marks Descriptors
3 5 - 6 • Response makes reference to the mechanisms of shear stress and shear strength.
• Specifies the effects of the earthquake on the landscape, and higher level responses would identify the type of mass movement accurately.
• Detailed explanation of factors and how they lead to the occurrence of mass movements.
2 3 - 4 • Response may not make reference to the mechanisms of shear stress and shear strength consistently.

2018 JC2 H2 Geo Prelim – Paper 2 MARK SCHEME Page 6 of 14
AJC 2018 JC2 H2 Geography Preliminary Examinations – Paper 2
• Specifies the effects of the earthquake on the landscape in general.
• Explanation of factors and how they lead to the occurrence of mass movements may be lacking in depth or breadth.
1 1 - 2 • Response does not make reference to the mechanisms of shear stress and shear strength.
• Lack specification of the effect of the earthquake on the landscape or may be inaccurate.
• Explanation of factors may be lacking, or may contain errors.
0 0 No creditworthy response Levels marked.
(d) With reference to Resource 5, account for Paracas’ rainfall characteristics. [4]
Answer Guide: • Rainfall characteristic: low/ no rainfall throughout the year.
• Locational characteristic: coastal location, proximity to cold current
o Cold current tends to cool the air above, lowering the capacity of the air to hold moisture (i.e. evaporation might be lower), hence, air tends to be dry and saturation is hard to be achieved. This limits the amount of rainfall received throughout the year.
(e) Explain how the landforms shown in in Resource 6 may have come about. [5]
Answer Guide: • Landforms: barchan dunes
• Climatic conditions: aridity limited presence of vegetation, hence allowing sand
particles to be easily transported by wind, before they are eventually deposited to form various depositional features.
• Formation of barchans dunes:
o Ususally occurs where the wind blows consistently from one direction. o The dune begins as a small mound of sand, formed either by chance or on
the lee side of an obstruction such as a rock or bush. o Once in existence, the dune will trap more sand blown in by the wind. The
fresh sand will be transported up the gentle windward slope, over the dune crest, and onto the steep lee face of the dune – this will cause downwind migration of the dune. The rate of migration will be slowest at the centre of the dune (where it is highest) and more rapid at its extremities; as a result it will develop horns.

2018 JC2 H2 Geo Prelim – Paper 2 MARK SCHEME Page 7 of 14
AJC 2018 JC2 H2 Geography Preliminary Examinations – Paper 2

2018 JC2 H2 Geo Prelim – Paper 2 MARK SCHEME Page 8 of 14
AJC 2018 JC2 H2 Geography Preliminary Examinations – Paper 2
Theme 2: Development, Economy and Environment
Wages of workers in the garment industry in Bangladesh
3 Resource 7 shows wages in the garment industry for selected Asian countries. Resource 8 is an
article on efforts to increase workers’ wages in Bangladesh. Resource 9 is an extract from the website of Clean Clothes Campaign, the largest global alliance of labour unions and non-governmental organisations (NGOs) fighting for the improvement of working conditions and empowering garment industry workers.
(a) With reference to Resource 7, compare the wage level of Bangladesh to the other Asian countries. [4]
Answer Guide:
Bangladesh Basis of comparison Other Asian Countries • Lowest minimum
wage level – US$68
Lowest wage level • All above US$68 – US$70 – 165.
• No/ little variation – appears to only be at US$68.
Range of wage levels • Besides Cambodia, all display a range of wage levels.
• China has the largest range.
(b) Suggest reasons why transnational corporations (TNCs) in the garment industry may locate their operations in the countries listed in Resource 7. [5]
Answer Guide:
Context of Country/ Objective of TNC
Asset-orientation approach:
TNCs aim to profit maximize by lowering cost of
production
Market-orientation approach:
TNCs aim to profit maximize by lowering cost of
production
Lower cost of production
• TNCs locate functions in these LDCs/ emerging economies as labour cost/ land cost, etc., is relatively cheaper than their home countries or more developed countries.
• In addition, there might also be cost savings as state policies might incentivize investment by TNCs in the form of low coporate taxes, subsidies, etc.
Large potential • The emerging

2018 JC2 H2 Geo Prelim – Paper 2 MARK SCHEME Page 9 of 14
AJC 2018 JC2 H2 Geography Preliminary Examinations – Paper 2
market economies in particular e.g. China/ India offer large markets as well as rising incomes which increases their potential as a viable market. Hence, TNCs locate in these countries to better meet the needs and improve sales to these markets.
(c) With reference to Resource 8 and your own knowledge, suggest possible impacts TNCs may have on their host economies. [6]
Indicative content: • Impacts suggested from Resource 8:
o Unsafe working conditions – collapse of factory building, leading to death of workers
o Low wages for workers – partly due to desire of host economies to attract investments, state may keep minimum wage levels low. The dependence of the economies on these TNCs may also imply a lack of willingness to impose policies that would require TNCs to ensure safer conditions or increase wages, for fear that these TNCs would disinvest.
• Other impacts: o Capital injections o Technological and knowledge diffusion o Competition with domestic firms o Creation of employment opportunities o Environmental degradation
Level Marks Descriptors
3 5 - 6 • Response makes good reference to Resource 8 in suggesting impacts.
• Detailed explanation of how these impacts come about, both in relation to the objectives of the TNCs, as well as the context of the host economies.
2 3 - 4 • Response makes some reference to Resource 8 in suggesting impacts.
• Explanation of how these impacts come about may lack depth or may be limited in considering the objectives of the TNCs, or the context of the host economies.
1 1 - 2 • Response makes limited reference to Resource 8 in suggesting impacts.
• Largely descriptive response – little attempt to explain how these impacts come about.
0 0 No creditworthy response

2018 JC2 H2 Geo Prelim – Paper 2 MARK SCHEME Page 10 of 14
AJC 2018 JC2 H2 Geography Preliminary Examinations – Paper 2
Levels marked.
(d) With reference to Resource 8, explain why raising wages may not be necessarily beneficial for Bangladesh. [3]
Answer Guide: • May lead to disinvestment of TNCs revenue losses for Bangladesh; loss of
employment • May cause bankruptcy of local factories/ companies:
o As local factories are likely to be small-scale operations with a small profit margin, they are unable to sustain high costs of production.
o Also, some local companies serve as suppliers to TNCs increasing wages would make them less competitive as they might need on to pass on these increases in cost of production to the TNCs being footloose, TNCs may choose to switch suppliers, causing local companies to lose the partnership.
(e) With reference to Resource 9 and your own knowledge, explain the role of non-state
actors in influencing the global economy. [7]
Indicative content: • Non-state actor in Resource 9: Clean Clothes Campaign
• Role in influencing global economy – in general:
o As watchdog: holding institutions to account, promoting transparency and accountability in this case, institution is H&M
o As advocate: raising awareness of societal issues and challenges and advocating for change in this case, highlighting the fact that H&M has not kept to the promise to ensure “Living Wages” for its workers
o As representative: giving power to the voice of the marginalized or under-represented in this case, Clean Clothes is fighting for the under-paid workers in H&M’s global production networks
• How global economy might be influenced: o Initiates and encourages social movements of collective action – in this
case, to prompt TNCs to commit to and implementing a reasonable minimum wage for their workers.
o By tapping on social media and “organizing” social media communities, efforts are not limited by physical or legal structures, hence increasing scope of influence.
o Hence, overall impact on global economy might be to improve the impacts of TNCs on its host economies.
Level Marks Descriptors
3 6 - 7 • Response demonstrates accurate knowledge of the role of non-state actors in the context of the global economy.
• Response makes good reference to Resource 9 to illustrate the role of non-state actors.
• Detailed explanation of how the global economy is influenced/ potentially affected by the actions of non-state actors.

2018 JC2 H2 Geo Prelim – Paper 2 MARK SCHEME Page 11 of 14
AJC 2018 JC2 H2 Geography Preliminary Examinations – Paper 2
2 3 – 5 • Response demonstrates knowledge of the role of non-state actors in the context of the global economy, but some inaccuracies may be present.
• Response makes some reference to Resource 9 to illustrate the role of non-state actors.
• Explanation of how the global economy is influenced/ potentially affected by the actions of non-state actors is present, but weakest level responses may lack depth.
1 1 - 2 • Response is largely descriptive, listing facts from Resource 9 with little attempt to explain how these show the role of non-state actors in the context of the global economy.
• Response lacks clarity and focus on the question.
0 0 No creditworthy response Levels marked.

2018 JC2 H2 Geo Prelim – Paper 2 MARK SCHEME Page 12 of 14
AJC 2018 JC2 H2 Geography Preliminary Examinations – Paper 2
Theme 3: Sustainable Development
Urban Liveability in Ahmedabad, India
4 Ahmedabad, the former capital of the Indian state of Gujarat, is one of the most populous cities
in the country as of 2011. It also houses a key urban reimaging project implemented along the Sabarmati River, an important source of water for the city. Resource 10 shows the trends in slum population in various states in India from 2001 to 2011. Resource 11 shows the distribution of informal settlements in Ahmedabad. Resource 12 shows the main features of urban reimaging of the Sabarmati River in Ahmedabad. Resource 13 is an extract on impacts of urban reimaging of the Sabarmati Riverfront in Ahmedabad.
(a) Compare the trends in slum population between Gujarat and Delhi from 2001 to 2011 with reference to Resource 10. [3]
Answer Guide:
Gujarat Basis of comparison Delhi Gujarat experienced an increase in total slum population of 333,386 people.
Change in total slum population from 2001 to
2011
Delhi experienced a decrease in total slum population of 240,500 people.
Both states experienced a decrease in slum population as a proportion of total population: • Proportion of slum
population in Gujarat experienced a drop from 11.7% to 2.8%.
Change in slum population as a
proportion of total population
Both states experienced a decrease in slum population as a proportion of total population: • Proportion of slum
population in Delhi experienced a drop from 18.5% to 10.6%.
… (b) Describe the distribution of the range of informal settlements in Ahmedabad in 2001
using Resource 11. [4] Answer Guide:
• The old city is located in the centre of the city, directly next to the eastern bank of the major water body running through Ahmedabad.
• Informal developments are located within a 10km radius of the city centre. These are mainly in the eastern region of the city, radiating outwards from the Old City.
• Gamtals are distributed further afield, within a 6 – 12km radius from the city centre.
• A number of informal developments and gamtals follow the major roads that radiate from the city centre.
Point marked – 2 marks awarded for each accurate observation-evidence pairing.
(c) With reference to Resource 11, suggest reasons for the distribution of the range of informal settlements in Ahmedabad in 2001. [5]
Answer Guide: Possible points that might be raised: Distribution Reasons

2018 JC2 H2 Geo Prelim – Paper 2 MARK SCHEME Page 13 of 14
AJC 2018 JC2 H2 Geography Preliminary Examinations – Paper 2
Location in centre of city
• Increased mobility and accessibility around the city, especially to jobs which are located in the city centre
• Affordability of location, as slum dwellers are likely not to be able to commute to and from distant locations each day for formal employment
Location near major transport networks
Location near major water body
• Acts as a source of (clean) water for the slum dwellers for daily activities such as cleaning, cooking and drinking, as the slum dwellers may not have infrastructure for potable water within their dwellings.
Gamtals’ location further away from city centre
• Urban sprawl / expansion of urban areas over time as the size of the city and the number of urban dwellers grow, such that even village areas have been incorporated into the city, as seen from Resource 4.
Levels marked (see level descriptors below): Level Marks Descriptors
3 4-5 • Response identifies at least 2 reasons for distribution of informal settlements in Ahmedabad.
• Response provides a detailed and appropriate explanation of the reasons for the distribution of informal settlements in Ahmedabad. In addition, reasons are clearly linked to specific described trend(s), rather than generic reasons.
• Use of Resource 4 [specific trends identified in part (b) especially] to support identification of reasons throughout the response. Demonstrates understanding of reasons for distribution of informal settlements from own knowledge.
2 2 – 3 • Response identifies at least 2 reasons for distribution of informal settlements in Ahmedabad.
• Response provides appropriate explanations of suggested reasons for the distribution of informal settlements in Ahmedabad. However, explanations may not be detailed. Reasons provided may be generic, instead of being referenced to a specific trend.
• Use of Resource 4 to support identification of reasons in response is present, but not consistently. Demonstrates some understanding of reasons for distribution of informal settlements from own knowledge, but may not be fully accurate.
1 1 • Response only identifies 1 reason for distribution of informal settlements, OR may identify at least 2 reasons which are inappropriate. Reasons suggested are not elaborated on.
• Reasons provided may be generic, instead of being

2018 JC2 H2 Geo Prelim – Paper 2 MARK SCHEME Page 14 of 14
AJC 2018 JC2 H2 Geography Preliminary Examinations – Paper 2
referenced to a specific trend.
• Minimal reference to Resource 4, if at all.
0 0 No creditworthy response …
(d) With reference to Resource 12, explain two ways in which urban reimaging of the Sabarmati Riverfront might have helped enhance urban liveability in the area. [4]
Answer Guide:
• Environmental liveability: o Improves sanitation and waste management in the area with the
incorporation of industrial sewerage outlets, the Pirana landfill site, and the Pirana sewage treatment plant along the Sabarmati River.
• Social liveability: o Provides public spaces for interaction and community gatherings to
improve conviviality, as seen from upper level of Promenade which acts as a space to host various activities, and various parks and plazas along the Sabarmati Riverfront
o Conservation and promotion of cultural heritage through conservation of traditional market (Ravivari, a 606-year old traditional flea market)
• Economic liveability: o Public spaces for gatherings to host events & activities (e.g. Ravivari –
vendors are able to earn an income through the formal incorporation of the flea market into the riverfront)
Point marked – 2 marks awarded for each well-developed explanation, with clear identification of the aspect of liveability that is improved.
(e) Using Resources 12 and 13 and your own knowledge, evaluate the extent to which urban reimaging along Sabarmati Riverfront has improved the lives of slum dwellers in Ahmedabad. [9]
Answer Guide: Possible points for evaluation: • Arguments supporting the view that the lives of slum dwellers have improved can
point to any of the reasons seen in Resource 5 - especially the improvement of environment liveability through improved sanitation and waste management, and improvement of economic liveability through the conservation of the traditional flea market which some slum dwellers are likely to be engaged in. Some of these points are corroborated in Resource 6 – e.g. “cleaner waterway” and the incorporation of the “interceptor sewerage system” which enhances environmental liveability. • Arguments against the view that the lives of slum dwellers have improved can
point to the following that are evident in Resource 6: o Displacement of slum dwellers, which separates them from their
homes, livelihoods and way of life (thus negatively affecting social and economic liveability)
o Resettlement projects do not meet the need of slum dwellers, negatively affecting social and economic liveability as well (similar points to displacement of slum dwellers).
Levels marked using H2 Generic Level Descriptors for 9m DRQ on Theme 1, 2 or 3.

1
GEOGRAPHY 9751/01
Paper 1 Structured Essay Questions 14 August 2018
3 hours
Additional Materials: Answer Paper
READ THESE INSTRUCTIONS FIRST
Write your class and name on all the work you hand in. Write in dark blue or black pen on both sides of the paper. You may use an HB pencil for any diagrams, graphs or rough working. Do not use staples, paper clips, highlighters, glue or correction fluid. Answer three questions. One from each section. You should make reference to appropriate examples studied in the field or the classroom, even where such examples are not specifically requested by the question. Diagram and sketch maps should be drawn whenever they serve to illustrate an answer. The world outline map may be annotated and handed in with relevant answers. You are reminded of the need for good English and clear presentation in your answers. At the end of the examination, you are to hand in each question separately. The number of marks is given in brackets [ ] at the end of each question or part question.
Start each question on a fresh sheet of paper. You will hand in each question separately. This document consists of 2 printed pages and 1 blank page. [Turn over
Catholic Junior College JC2 Preliminary Examinations Higher 2

2
BLANK PAGE

3
Section A - Tropical Environments
Answer one question from this section.
1(a) Explain the role of climate in affecting weathering processes in the humid and arid tropics.
[12]
(b) How far do you agree that human activities play a significant role in influencing the nature and occurrence of mass movements?
[20]
2(a) Explain the climatic characteristics of arid tropics.
[12]
(b) Discuss the role of wind erosion in the formation of aeolian landforms in the arid tropics
[20]
Section B – Development, Economy and Environment.
Answer one question from this section.
3(a) Explain how different characteristics of TNCs would affect the ways in which they organise their intra-firm and inter-firm networks.
[12]
(b) "International institutions and regional trade blocs serve to weaken the power of the state." Discuss the validity of this statement.
[20]
4(a) Explain how the core-periphery theory may be applied to the global and national scales.
[12]
(b) Discuss the challenges that countries may face in achieving the sustainable development goals.
[20]
Section C – Sustainable Development
Answer one question from this section.
5(a) Explain why the effects of global warming may vary across the globe.
[12]
(b) To what extent are mitigation strategies the best approach to deal with climate change?
[20]
6(a) Explain how the occurrence of pluvial floods may affect liveability of cities.
[12]
(b) Evaluate the role of climate in causing pluvial floods. [20]
**** END OF PAPER ****

GEOGRAPHY 9751/02
Paper 2 27 August 2018
3 hours
READ THESE INSTRUCTIONS FIRST
This Insert contains all the Photographs, Table and Figures referred to in the questions.
This document consists of 12 printed pages and 1 blank page.
[Turn over]
Catholic Junior College JC2 Preliminary Examinations Higher 2

BLANK PAGE

Resource 1 for Question 1
Resource 2A for Question 1 Site A (Nature Reserve)
Legend: Site for Geographical Investigation
SITE A
SITE B
Sample Point
Bukit Timah Nature Reserve

Resource 2B for Question 1 Site B (Residential – The Dairy Farm Estate)
Resource 3 for Question 1 Data collected from Sites A (Nature Park) and B (Residential)
Site A Land use Nature park
Fall Unit / Cm
Time/Sec Infiltration Rate (cm/min)
1 2 30 2 5 12 3 8 7.5 4 12 5 5 16 3.75 6 22 2.73 7 30 2 8 39 1.54 9 48 1.25 10 58 1.03 11 70 0.86 12 84 0.71 13 100 0.6 14 120 0.5 15 145 0.41 16 170 0.35 17 195 0.31 18 220 0.27 19 246 0.24 20 272 0.22
Average Infiltration Rate (cm/min)
3.56
Site B Land use Residential
Fall Unit / Cm
Time/Sec Infiltration Rate
(cm/min) 1 25 2.40 2 63 0.95 3 134 0.45 4 323 0.19 5 431 0.14 6 548 0.11 7 683 0.09 8 818 0.07 9 952 0.06
10 1088 0.06 11 1221 0.05
Average Infiltration Rate (cm/min)
0.42
Sample Point

Resource 4 for Question 2 Climograph of Guiuan, Eastern Samar
Resource 5 for Question 2 Photograph of the devastation in Tacloban City, Eastern Samur

Resource 6 for Question 2 Map showing development of Typhoon Haiyan across The Philippines on November 8, 2013
Note: A municipality is a local government unit (LGU) in the Philippines. Municipalities are also usually called towns.

Resource 7 for Question 2 Flood Hazard Map of a Section of Tacloban City

Resource 8 for Question 3

Source: https://www.economist.com/international/2017/02/25/a-report-from-de-beerss-new-diamond-mine

Resource 9 Distribution of Natural Resources in Angola
Source: https://www.sahistory.org.za/place/angola
Resource 10
Source: https://www.diamonds.net/News/NewsItem.aspx?ArticleID=43603&ArticleTitle=Angola%2C+100+Years+Later

Resource 11
Source: http://www.mining.com/angola-eases-controls-over-diamond-sector-to-double-output-in-four-years/
Resource 12
https://www.economist.com/graphic-detail/2017/08/16/global-liveability-has-improved-for-the-first-time-in-a-decade
Note: The Liveability index is weighted as follows: 25% for stability (e.g., crime, terrorism, war); 20% for healthcare (availability and quality); 25% for culture and environment (which includes a grab-bag of various metrics, such as temperature, level of corruption, and cultural attractions); 10% for education (availability and quality); and 20% for infrastructure quality.

13
Resource 13
High disadvantage is defined as low access to ‘material and social resources and ability to participate in society’, which include factors such as employment, English-speaking proficiency and household income.
Source: Resilient Melbourne Report. https://www.melbourne.vic.gov.au/SiteCollectionDocuments/resilient-melbourne-strategy.pdf

14
Resource 14
Resilient Melbourne Report. https://www.melbourne.vic.gov.au/SiteCollectionDocuments/resilient-melbourne-strategy.pdf

15

1
GEOGRAPHY 9751/02
Paper 2 27 Aug 2018
3 hours
Additional Materials: Answer Paper 1 Insert
READ THESE INSTRUCTIONS FIRST
Write your class and name on all the work you hand in. Write in dark blue or black pen on both sides of the paper. You may use an HB pencil for any diagrams, graphs or rough working. Do not use staples, paper clips, highlighters, glue or correction fluid. Candidates answer all questions. The Insert contains all the Resources referred to in the questions. You should make reference to appropriate examples studied in the field or the classroom, even where such examples are not specifically requested by the question. Diagram and sketch maps should be drawn whenever they serve to illustrate an answer. The world outline map may be annotated and handed in with relevant answers. You are reminded of the need for good English and clear presentation in your answers. At the end of the examination, you are to hand in each question separately. The number of marks is given in brackets [ ] at the end of each question or part question.
Start each question on a fresh sheet of paper. You will hand in each question separately. This document consists of 5 printed pages and 1 blank page. [Turn over
Catholic Junior College JC2 Preliminary Examinations Higher 2

2
BLANK PAGE

3
Section A
Theme 4: Geographical Investigations
1 You are part of a group of classmates that was tasked to investigate the influence of land use on infiltration rates in Singapore. The group was divided up into 2 teams of four to measure the infiltration rate at 2 locations simultaneously. In planning the geographical investigation, the teams identified the land use areas by first looking at the land use map of Singapore. For practicality reasons, the teams chose to conduct their study at two sites of different land use - Site A which is a nature park land within Bukit Timah Nature Reserve and Site B, a built-up residential area in the Dairy Farm Estate. The teams chose to collect data on infiltration within the different land use areas they had identified. The study was conducted at one accessible point within each survey site. The investigation was conducted on the Saturday morning of 30 June 2018. The infiltration rate is measured by using a set of infiltration rings and by timing the speed at which the water level in the ring falls. The following equipment and materials were used to measure infiltration rate at the two different land use sites:
• Dual-ring infiltrometer comprising two tin cans, the first about 30 cm tall with a diameter of 15 cm and the second smaller tin can about 25 cm tall and with a smaller diameter of 9 cm. Both tin cans have both ends of it removed.
• Plentiful supply of water • A ruler • Hammer • Wooden plank • Stopwatch
At the respective sites, the smaller tin can (measuring 25 cm by 9 cm) was driven into the soil to about 10 cm deep by using a hammer onto a wooden plank placed on the rim of the can. The larger tin can (measuring 30 cm by 15 cm) was then placed over the smaller tin can and then driven into the soil to about 10 cm deep too. It was noted that at site B, the students had difficulty hammering the infiltration ring into the ground. A ruler was placed vertically inside the inner ring to record the fall in water level. Water was poured into both the rings to a depth of 10 cm. The level of

4
water in the outer ring was topped up to keep it at a constant level of 10 cm. As the water level decreased by every 1 cm, a recording of the time was taken. This is the fall rate. The data was recorded in the recording sheet. Resource 1 shows a map of the nature park in Bukit Timah Nature Reserve and residential area in the Dairy Farm Estate. Resource 2A and 2B comprises photographs of Sites A and B where the study was conducted. Resource 3 shows data collected on infiltration rates at Sites A and B.
(a) With reference to Resource 1, 2A and 2B, suggest a suitable research question for your group investigation and state 2 reasons why the research question is at a suitable scale.
[3]
(b) With reference to Resource 2A and 2B, explain how you would minimise the impact of your investigation differently at the two sites.
[4]
(c) Explain the limitations of the data representation method in Resource 3 and how would you improve on it.
[5]
(d) Evaluate the reliability of the data collected as shown in Resource 3 in ascertaining the influence of land use on infiltration rates
[9]
(e) Suggest two ways to improve on your data collection method. [4]
Section B
Theme 1: Tropical Environments
Impact of Tropical Cyclone in The Philippines
2 Typhoon Haiyan, known as Super Typhoon Yolanda in The Philippines, was one of the strongest tropical cyclones ever recorded. On making landfall, Haiyan devastated portions of Southeast Asia, particularly the Philippines. It is the deadliest Philippine typhoon on record, killing at least 6,300 people in that country alone. Tropical-storm-force winds are extending 240 kilometers from the typhoon's centre causing catastrophic destruction in the Visayas (one of the three principal geographical divisions of the Philippines, located in the central part of the archipelago) particularly on Samar and Leyte. According to UN officials, about 11 million people were affected – many were left homeless Resource 4 is the climograph of Guiuan, the location where Typhoon Haiyan first made landfall at 4.40am at peak intensity. Resource 5 shows

5
devastation caused by Typhoon Haiyan in Tacloban City, Eastern Samur. Resource 6 shows the development of Typhoon Haiyan across The Philippines on November 8, 2013. Resource 7 shows the total cost of infrastructure and agriculture damaged by Typhoon Haiyan.
(a) With reference to Resource 4, identify the type of climate and describe the variations in both temperature and precipitation throughout the year.
[4]
(b) With reference to Resource 6, describe the path and intensity of the storm across The Philippines.
[3]
(c) With reference to Resource 6, explain how tropical cyclones develop high wind speeds and intense rainfall.
[4]
(d) Using Resources 5, 6 and 7, account for the impacts of Cyclone on the Visayas.
[5]
(e) With reference to all Resources and your own knowledge, evaluate the extent to which prediction can help to mitigate the effects of flooding in Tacloban City.
[9]
Theme 2: Development, Economy and Environment
Diamond Extraction in Angola, West Africa
3 Angola is the fifth largest diamond producer in the world. It was engaged in a civil war between 1975 and 2002 and earns the reputation of engaging in blood diamonds, as rebels fund their insurgency through the sale of diamonds. The country has also been accused of poor human rights abuses such as use of violence and child labour in diamond mines. The Multidimensional Poverty Index (MPI) shows that 77% of Angola’s population was classified as poor in 2001. Resource 8 shows the distribution of global diamond production. Resource 9 shows the distribution of Angola’s natural resources across the country, while Resource 10 shows Angola’s diamond production and exports between 2004 and 2012. Resource 11 shows an online article about Angola’s plan to ease controls over its diamond sector.
(a) With reference to Resource 8, describe the pattern of diamond production in the world in 2016.
[4]

6
(b) With reference to Resource 9, compare the distribution of natural resources in the country.
[4]
(c) With reference to Resource 10, describe the relationship between diamond production and exports in Angola from 2004 to 2012. .
[4]
(d) Using information from Resource 11, explain the environmental impacts that diamond mining has on Angola.
[6]
(e) With reference to all resources, explain how the resource curse thesis may be used to explain the impact of extractive industries on Angola’s development.
[7]
Theme 3 – Sustainable Development
Liveability in Melbourne
4 Melbourne is a city in Australia. It has been ranked constantly for 7 consecutive years by The Economist as the world's most liveable city. It is shifting away from its manufacturing focus to be a more knowledge and service-based economy. Further advances in digital technology and automation are expected to cause the loss of even more manufacturing jobs in coming years Resource 12 shows the changes in city’s rankings by The Economist from 2007-2017. Resource 13 shows the spatial distribution of disadvantage across Melbourne. Resource 14 shows the trends in housing and homelessness.
(a) Describe the variations in liveability score from 2007-2017 as shown in Resource 12.
[4]
(b) With reference to Resource 12 and your own knowledge, explain possible reasons why some cities experienced an increase in liveability score while others experienced a decrease.
[4]
(c) With reference to Resource 13, describe the spread of disadvantage across Melbourne.
[4]
(d)
Explain the relationship between housing price and average age of first home buyers and homelessness as shown in Resource 14.
[6]
(e) Using Resource 5, 6 and your own knowledge, suggest reasons why some neighbourhoods has high levels of disadvantage.
[7]

7
**** END OF PAPER ****

Name: Index Number:
Class:
_________________________________________________________________________ HIGHER 2 GEOGRAPHY 9751/02 Paper 2 Data Response Questions INSERT Friday 21 September 2018 3 hours _________________________________________________________________________ READ THESE INSTRUCTIONS FIRST This insert contains all the Resources referred to in the question paper. _____________________________________________________________________________
This document consists of 15 printed pages [Turn over
DUNMAN HIGH SCHOOL PRELIMINARY EXAMINATIONS Year 6

2
9751/2018/02/Preliminary Examinations
Resources 1A and 1B for Question 1
Resource 1A: Park Connector Network (PCN) and area investigated

3
9751/2018/02/Preliminary Examinations
Resource 1B: Base map recording the characteristics of one section of path

4
9751/2018/02/Preliminary Examinations
Resource 2 for Question 1
Recording sheet used at site 24, path adjacent to road

5
9751/2018/02/Preliminary Examinations
Resource 3 for Question 1
Photograph of one section of park connector taken during the fieldwork

6
9751/2018/02/Preliminary Examinations
Resources 4A and 4B for Question 2:
Resource 4A: Part of the Amazon river channel in Brazil (normal discharge)
Resource 4B: Part of the Yamuna river channel in India (low discharge)

7
9751/2018/02/Preliminary Examinations
Resource 5 for Question 2
Limit of Active and Inactive Dunes in the Southern Regions of the Sahara
*Isohyet – a line on a map connecting locations having the same amount of rainfall in a given time period.
Resource 6 for Question 2
Comparison of rainfall limit in the African continent since the Last Glacial Maximum

8
9751/2018/02/Preliminary Examinations
Resources 7A, 7B and 7C for Question 2
Resource 7A: Location of the Blue Nile Basin in Africa
Resource 7B: Geomorphic processes in the Blue Nile Basin during the Last Glacial Maximum
Resource 7C: Geomorphic processes in the Blue Nile Basin during the Holocene

Resource 8 for Question 3
Distribution of mineral wealth and of commodities of selected countries in Sub-Saharan Africa
9

10
9751/02/2018/Preliminary Examinations
Resource 9 for Question 3
Relationship between commodity prices and GDP Growth Rates in Sub-Saharan Africa from 1961 to 2014

11
9751/02/2018/Preliminary Examinations
Resources 10A and 10B for Question 3
Resource 10A: Human Development Index (HDI) for Sub-Saharan Africa in 2012

12
9751/02/2018/Preliminary Examinations
Resource 10B: Share of population without access to electricity and mobile phone penetration in Sub-Saharan Africa.
Resource 11 for Question 3
Oil spill and resultant oil fire in the Ogoni delta in Nigeria

13
9751/02/2018/Preliminary Examinations
Resource 12 for Question 4
EIU* Liveability index and WWF** Ecological Footprint measuring sustainability of selected cities in 2008.
*EIU: Economist Intelligence Unit is a British business providing forecasting and advisory services to various public and private institutions. **WWF: World Wildlife Fund is the leading organisation in wildlife conservation.

14
9751/02/2018/Preliminary Examinations
Resource 13 for Question 4
Profile Circles*** of Sustainability for Melbourne, Australia and Port Moresby, Papua New Guinea (PNG) in 2013
Melbourne, Australia 2013
Port Moresby, Papua New Guinea 2013
***Profile Circles provide a simple way of presenting complex data about a city. The circular figure is divided into four domains: Ecology, Economics, Politics and Culture. Each of these domains is divided in seven subdomains, with the names of each of these subdomains read from top to bottom in the lists under each domain name.

15
9751/02/2018/Preliminary Examinations
Resource 14 for Question 4
An advertisement for plans to promote and develop a large scale tourism project on reclaimed land in Port Moresby, Papua New Guinea; a low income country.

Name: Index Number:
Class:
_________________________________________________________________________ HIGHER 2 GEOGRAPHY 9751/01 Paper 1 Structured Essay Questions Thursday 13 September 2018 3 hours Additional material: World outline map _________________________________________________________________________ READ THESE INSTRUCTIONS FIRST Write your name and class clearly on the work you hand in. Write in dark blue or black pen on both sides of the paper. You may use a HB pencil for any diagrams or graphs. Do not use staples, paper clips, glue or correction fluid. Answer three questions. One from each section. You should make reference to appropriate examples studied in the field or in the classroom, even when such examples are not specifically requested by the question. Diagrams and sketch maps should be drawn whenever they serve to illustrate an answer. The outline world map may be annotated and handed in with relevant answers. You are reminded of the need for good English and clear presentation in your answers. At the end of the examination, fasten all your work securely together. The number of marks is given in the brackets [ ] at the end of each question or part question.
This document consists of 3 printed pages and 1 blank page.
[Turn over 9751/2018/01/Prelim Examinations
DUNMAN HIGH SCHOOL PRELIMINARY EXAMINATIONS Year 6

2
9751/2018/ Prelim Examinations
Section A – Tropical Environments
Answer one question from this section.
1 (a) Explain the differences in channel processes in the tropics. [12]
(b) ‘The river channels in the tropics have very different characteristics’. Discuss the validity of this statement.
[20]
2 (a) Explain why tropical deforestation is a major environmental concern.
[12]
(b) ‘The biggest challenge to effective management of tropical deforestation is political will’. Discuss the validity of this statement.
[20]
Section B – Development, Economy and Environment
Answer one question from this section.
3 (a) With reference to one or more TNCs, explain how the production circuit of
firm(s) operates at the global level.
[12]
(b) ‘Regional and international organisations are the most important actors in governing the global economy.’ To what extent do you agree with this view?
[20]
4 (a)
Explain the considerations when assigning ownership of water resource in countries at low levels of development.
[12]
(b)
‘International water agreements between riparian states is an effective strategy in managing transboundary water resources and their resultant conflicts.’ To what extent do you agree with this view?
[20]

3
9751/2018/ Prelim Examinations
Section C – Sustainable Development
Answer one question from this section.
5 (a) Explain what sustainable development means to countries at different levels of development.
[12]
(b) ‘Achieving sustainable development is more successful in some countries than others’. Discuss the validity of this statement.
[20]
6 (a) Explain how the ecological footprint and urban metabolism vary in cities of different levels of development.
[12]
(b) Evaluate the success of urban reimaging strategies adopted to improve the urban liveability of cities you have studied.
[20]

4
9751/2018/ Prelim Examinations
BLANK PAGE

Name: Index Number:
Class:
_________________________________________________________________________ HIGHER 2 GEOGRAPHY 9751/02 Paper 2 Data Response Questions Friday 21 September 2018 3 hours Additional materials: 1 Insert World outline map _________________________________________________________________________ READ THESE INSTRUCTIONS FIRST Write your name and class clearly on all the work you hand in. Write in dark blue or black pen on both sides of the paper. You may use a HB pencil for any diagrams or graphs. Do not use staples, paper clips, highlighters, glue or correction fluid. Candidates answer all questions. The Insert contains all the Resources referred to in the questions. You should make reference to appropriate examples studied in the field or in the classroom, even where such examples are not specifically requested by the question. Diagrams and sketch maps should be drawn whenever they serve to illustrate an answer. The outline world map may be annotated and handed in with relevant answers. You are reminded of the need for good English and clear presentation in your answers. At the end of the examination, fasten all your work securely together. The number of marks is given in brackets [ ] at the end of each question or part question.
This document consists of 6 printed pages
[Turn over 9751/2018/02/Prelim Examinations
DUNMAN HIGH SCHOOL PRELIMINARY EXAMINATIONS Year 6

2
9751/02/2018/Preliminary Examinations
Section A
Theme 4: Geographical Investigation
1 A student undertook an individual fieldwork exercise along part of the Park Connector
Network (PCN) to assess the walkability of different paths (see Resource 1A). The PCN is made up of linear open spaces which serve as pathways linking major parks, nature reserves and green spaces within the urban area. Walkability is an element of liveability. Walkability is the extent to which the environment is conducive to walking for recreation and personal travel. It includes considerations of comfort, air quality lighting and safety, provision of amenities such as shelters, the path’s accessibility for all users and its connectivity to other walking routes. The student surveyed 30 sections of park connectors in the area investigated, totalling approximately 16km in length. She surveyed the sections on weekdays between 10:00 and 12:00hrs and between 14:00 and 16:00hrs over a 4-day period, avoiding one day when it rained heavily for most of the day. A stratified random sample of sections from each of the following types of path was taken. • Paths adjacent to canals • Paths adjacent to roads. • Paths adjacent to elevated train tracks. • Paths within parks.
Equipment used: • large scale map of the area investigated • printed recording sheets and pen • iPad
For each section of path, its characteristics, such as the location of benches, was recorded on the base map (see Resource 1B) and a copy of the recording sheet was completed (see Resource 2). Photographs were taken of key features, such as unclear signage which could lead to conflicts between walkers and cyclists. After the surveys were completed the data was compiled and analysed so that conclusions could be made about the walkability of the paths in the area investigated.

3
9751/02/2018/Preliminary Examinations
Study Resources 1 to 3. Resource 1 shows the Park Connector Network (PCN) and area investigated as well as a base map recording the characteristics of one section of path. Resource 2 shows one of the recording sheets used in the survey. Resource 3 is a photograph of one section of park connector taken during the fieldwork.
(a) Suggest a suitable geographical question for this investigation about
walkability. [1]
(b) With reference to Resources 1 and 3, describe two potential risks
associated with undertaking this fieldwork and explain how each risk could be minimised.
[4]
(c) Explain the strengths and limitations of the data which was collected using the recording sheet shown in Resource 2.
[6]
(d) Using Resource 2, explain one data source that could provide information
about walkability of paths for the elderly and describe an appropriate method to represent this data.
[5]
(e) Evaluate this investigation about the walkability of the area investigated and
explain how it could be improved and extended.
[9]

4
9751/02/2018/Preliminary Examinations
Section B
Theme 1: Tropical Environments
Geomorphic and fluvial processes in the tropics 2 Resource 4A shows part of the Amazon river channel in Brazil that experiences
perennial flow. Resource 4B shows part of the Yamuna river channel in India that experiences seasonal flow. Resources 5, 6 and 7 show information of geomorphic processes during the Quaternary period between the Last Glacial Maximum (18,000 BP) and the Holocene (11700 BP). Resource 5 shows present day rainfall conditions and the limit of active and inactive dunes in the southern regions of the Sahara. Resource 6 shows the changes in rainfall limit since the Last Glacial Maximum. Resource 7A shows the location of the Blue Nile Basin in Africa. Resources 7B and 7C show the geomorphological processes operating in the Blue Nile Basin during the Last Glacial Maximum and the Holocene respectively.
(a) With reference to Resources 4A and 4B, compare the characteristics of the two
river channels.
[4]
(b) With reference to Resources 4A and 4B, outline and explain the likely changes that will take place in the two river channels during the wet season.
[6]
(c) With reference to Resources 5, outline one difference between the latitudinal limits of the active and the inactive dunes.
[2]
(d) With reference to Resources 7B and 7C, explain the difference in slope stability.
[4]
(e) With reference to Resources 5, 6, 7B, 7C and your own knowledge, discuss the effects of past climate change on geomorphic processes in the tropics.
[9]

5
9751/02/2018/Preliminary Examinations
Theme 2: Development, Economy and Environment
Development and Managing Resource Base in Sub-Saharan Africa
3 Resource 8 shows the distribution of mineral wealth and commodities of selected countries in Sub-Saharan Africa. Resource 9 shows the relationship between commodity prices and GDP Growth Rates in Sub-Saharan Africa from 1961-2014. Resource 10A shows the Human Development Index (HDI) for Sub-Saharan Africa in 2012. Resource 10B shows two indicators for Sub-Saharan Africa: the share of population without access to electricity and mobile phone penetration in Sub-Saharan Africa. Resource 11 shows an oil spill and resultant oil fire in the Ogoni delta in Nigeria, Africa.
(a) Describe the distribution of Sub-Saharan Africa’s mineral wealth and its impact
on some of these countries in Resource 8.
[5]
(b) With reference to Resource 9, describe the relationship between the changes in commodity prices and GDP growth rates in Sub-Saharan Africa between1961 to 2014.
[3]
(c) With reference to Resources 8, 9, 10A and 10B as well as your own knowledge,
suggest three reasons why resource rich countries such as Nigeria have low levels of HDI.
[6]
(d) With reference to Resource 11, explain how the extraction of minerals can
affect the local environment.
[4]
(e) With reference to resource 8 as well as any other resources, and your own knowledge, recommend whether Guinea should build a new iron ore mine that produces bauxite.
[7]

6
9751/02/2018/Preliminary Examinations
Theme 3: Sustainable Development
Liveability and Sustainability of Cities
4 Resource 12 shows the EIU’s Liveability index and WWF’s Ecological Footprint in 2008. Resource 13 shows Profile Circles of Sustainability for Melbourne, Australia and Port Moresby, Papua New Guinea (PNG) in 2013. Resource 14 shows an advertisement for plans to promote and develop a large scale tourism project on reclaimed land in Port Moresby, New Guinea, a low income country.
(a) Describe the relationship between the liveability index and ecological footprint
as shown in Resource 12.
[4]
(b) With reference to Resources 12 and 13, suggest three reasons to account for the differences in liveability between Melbourne in Australia and Port Moresby in Papua New Guinea.
[6]
(c) With reference to Resource 13, compare the performance in the scoring for sustainability for Melbourne and Port Moresby.
[4]
(d) With reference to Resources 12 and 13, suggest ways in which Melbourne, Australia can score higher in its sustainability ratings.
[4]
(e) Imagine that you are the city planner for Port Moresby, Papua New Guinea. You are tasked to evaluate the viability of developing a large scale tourism flagship project on reclaimed land in Port Moresby. With reference to Resources 12, 13, 14 and your own knowledge, assess if this project meets the needs of its residents.
[7]

Name: Index Number:
Class:
Answer Scheme for Papers 1 and 2 _________________________________________________________________________
DUNMAN HIGH SCHOOL PRELIMINARY EXAMINATIONS Year 6

2
9751/2018/02/Prelim Examinations
Paper 1
Theme 1: Tropical Environments
1a Explain the differences in channel processes in the tropics.
Indicative content The main factors to explain the differences would be discharge and sediment characteristics. There will be greater and continuous erosion and transport of load especially the suspended load due to the higher and regular discharge in the humid tropics albeit there will be seasonal differences in the seasonally humid climates. However, deposition will be more dominant in the arid tropics as the rivers are generally dry most of the time.
1b ‘River channels in the tropics have very different characteristics.’ Discuss the validity of this statement.
Indicative content The main argument is that the river channels in the humid and arid tropics are very different, but the counter-argument is that there are important similarities too e.g channels in both the seasonally humid and dry climates exhibit nested channels due to variations in levels of discharge. The presence of nested channels in the dry climates is a good synoptic link to the wetter past experienced by these climates.
2a Explain why tropical deforestation is a major environmental concern?
Indicative content: There are 2 key aspects in this response: the context and why the impacts are a ‘major’ environmental concern. To understand ‘major’, the impacts should be examined from a scale perspective. Global impacts would be atmospheric and biological: global warming and loss of biodiversity. The release of stored carbon has large-scale impact as these heat-trapping gases have a long lifespan leading to global warming concerns. It is especially a worrying trend in the tropics as the scale of deforestation is very large and growing rapidly especially in the Amazon Basin. At the regional scale, the lithological and hydrological impacts can be discussed.
2b ‘The biggest challenge to effective management of tropical deforestation is political will’. Discuss.
Indicative content:
A variety of legislative and regulatory measures have been established to protect forests. These include REDD+ (international partners), reforestation, protected areas, pledges. Much of the forest is owned by the state and so the state is able to have the legitimacy to implement strategies on a suitable scale to address the problems, but the state needs to have the political will to be committed to sustainable forest management practices.

3
9751/2018/02/Prelim Examinations
3(a) With reference to one or more TNCs, explain how these firm’s production circuit operates at the global level. Candidates would need to define what is meant as a production circuit: part of the global production network (GPNs) that TNCs operates on in order to find the “spatial fix” in the production network at the global level. Production circuit is a result of the international fragmentisation of production processes in order to maximise profits based on comparative advantages certain locales have over others in some aspects of the production circuit. Production circuit includes inputs, transformation, distribution, consumption, additional inputs (technology, service and energy inputs) and control system such as logistics, financial and regulation). Candidates would then highlight how these production circuit operates at the Global level. Can use either BMW or Shell as case studies or a combination of both. Need not give more than 1 TNC if required as long as your case study covers all of the above mentioned aspects in detail.
(b) “Regional and international organisations are the most important actors in governing the global economy.” To what extent do you agree with this view? Candidates would need to discuss the role of the regional and international organisations as the most important actor in the global economy or are these organisations merely an actor in the global economy. As such, a large portion of the essay must discuss the role of this entity at the global level. The effectiveness of the role of international and regional organisations determined by 2 factors-
1) its bargaining power vis-à-vis other actors (“negotiated outcomes”) and 2) the relative importance of other actors such as the state and TNCs in determining
global trade policies. Conclusion: Role of regional and international regulators are definitely an important agent in the global economy, but its importance is determined by its bargaining power with other global actors such as the state and TNCs.
4(a)
Explain the considerations when assigning ownership of water resource in countries at low levels of development. Candidates would need to explain what are the various forms of ownership – public, private, semi-private in the form of concessions, management, leases, divestiture Candidates would be required to explain the various considerations, Social considerations, Economic & Technological Considerations and Political
(b)
“International water agreements between riparian states is an effective strategy in managing transboundary water resources and their resultant conflicts.” To what extent do you agree with this view? Candidates would need to identify a host of strategies in managing transboundary water resources which can include international water agreement within riparian countries, unilateral state directed basin management programs as well as evoking international principles in sharing of trans-border water resources so as to avert conflicts. These conflicts

4
9751/2018/02/Prelim Examinations
would be over the quality and quantity of water resources. The success of these strategies is contingent to various criterions. Hence, trans-boundary agreements could be deployed to resolve potential conflicts if these considerations were fully tackled with.
Theme 3: Sustainable Development
5aExplain what sustainable development means to countries at different levels of development.
Indicative content Sustainable development involves three interdependent dimensions: economic, social and environmental. Candidates may also include the key ideas of ‘needs’ and ‘limits.’ Responses should recognize that countries are at different levels of development and will prioritise their needs differently. A good explanation would entail the understanding of the different agendas (brown, grey and green) associated with the level of development and their implications on sustainable development.
5b ‘Achieving sustainable development is more successful in some countries than others’. Discuss.
Indicative content Having established the different understandings of SD to countries of various levels of development, the focus of this essay is to outline the possible challenges of achieving SD in selected countries. Sustainable development requires a planning agenda which maximises goals across the three dimensions. Candidates may explain that sustainable options are being adopted in key areas such as public transport, energy needs and water management. A higher level of response will show that sustainable development is contextualized to countries at different levels of development and acknowledge that all three dimensions of sustainable development are prioritized accordingly.
6a Explain how the ecological footprint and urban metabolism vary in cities of different levels of development.
Indicative content Factors that can influence the ecological footprint and urban metabolism include demographic, socio-economic, economic and institutional factors. Generally, the ecological footprint will be high and unsustainable in the DC cities due to the greater consumption of resources and carbon emissions due to affluence and lifestyle needs. Urban metabolism is increasingly more circular in the European cities. Strong political will through policies and socio-cultural factors like education and societal norms have contributed to urban metabolism becoming more circular.
6b Evaluate the success of urban reimaging strategies adopted to improve the urban liveability of cities you have studies.

5
9751/2018/02/Prelim Examinations
Indicative content Success’ should be outlined as to whether the reimaging strategies have been able to improve urban liveability. The key aspects of urban liveability are employment, housing, transport infrastructure as well as a clean, green and safe environment. Thus, successful outcomes would typically be the ability to attract businesses, middle class, creative talent and tourists that will result in widespread economic benefits leading to improved social and environmental liveability for all the urban dwellers.

6
9751/2018/02/Prelim Examinations
Paper 2
Section A
Theme 4: Geographical Investigation
1 A student undertook an individual fieldwork exercise along part of the Park Connector Network
(PCN) to assess the walkability of different parts (see Resource 1a). The PCN is made up of linear open spaces which serve as pathways linking major parks, nature reserves and green spaces within the urban area. Walkability is an element of liveability. Walkability is the extent to which the environment is conducive to walking for recreation and personal travel. It includes considerations of comfort, air quality lighting and safety, provision of amenities such as shelters, the path’s accessibility for all users and its connectivity to other walking routes. The student surveyed 30 sections of park connectors in the area investigated, totalling approximately 16km in length. She surveyed the sections on weekdays between 10:00 and 12:00hrs and between 14:00 and 16:00hrs over a 4-day period, avoiding one day when it rained heavily for most of the day. A stratified random sample of sections from each of the following types of path were taken. • Paths adjacent to canals • Paths adjacent to roads. • Paths adjacent to elevated train tracks. • Paths within parks.
Equipment used: • large scale map of the area investigated • printed recording sheets and pen • iPad
For each section of path, its characteristics, such as the location of benches, was recorded on the base map (see Resource 1b) and a copy of the recording sheet was completed (see Resource 2). Photographs were taken of key features, such as unclear signage which could lead to conflicts between walkers and cyclists. After the surveys were completed the data was compiled and analysed so that conclusions could be made about the walkability of the paths in the area investigated. Study Resources 1 to 3. Resource 1 shows the Park Connector Network (PCN) and area investigated as well as a base map recording the characteristics of one section of path. Resource 2 shows one of the recording sheets used in the survey. Resource 3 is a photograph of one section of park connector taken during the fieldwork.
(a) Suggest a suitable geographical question for this investigation about walkability.
Does the Park Connector Network in the North East Section of Singapore have a high walkability index?
[1]
(b) With reference to Resources 1 and 3, describe two potential risks associated
with undertaking this fieldwork and explain how each risk could be minimised.
[4]

7
9751/2018/02/Prelim Examinations
- Personal safety risk as shown in Resource 3 as the PCN is bounded by trees and vegetation that may create pathways that are isolated.
- Environmental risk as shown in resource 1 as the PCN can be exposed to the afternoon sun.
- Environmental risk as shown in Resource 1 as the PCN is quite extensive and stretches several kilometres.
- Environmental risks as shown in Resource 1 as the PCN abuts water bodies and major expressways
- Note* Must cite from both Resources 1 and 3 to get 4 marks.
(c) Explain the strengths and limitations of the data which was collected using the
recording sheet shown in Resource 2. [6]
Strengths: Walkability uses a range of indicators that are comprehensive Whole range of sub-categories are likewise provided Limitations: Data collected is very generic and broad Categories of “overall assessment” is misleading. Note* Provide strengths and limitations to the answer with referencing to Resource 2.
(d) Using Resource 2, explain one data source that could provide information about
walkability of paths for the elderly and describe an appropriate method to represent this data. Path slope/gradient could be considered to look at ease of walking for the elderly as the steeper the slopes, elderly using wheel chair or walking aids will face difficulty accessing those section of the paths. Note* Draw a line graph highlighting slope gradient from a section of the PCN. (provide explanation (3 marks) and illustration (2 marks))
[5]
(e) Evaluate this investigation about the walkability of the area investigated and
explain how it could be improved and extended. Accuracy: The investigation carried out is generally quite accurate as it uses participant observations with the participant walking along the path to determine if it meets all the requirements for walkability. However, the accuracy of the study could be better improved by expanding the entire area of study to other locales within the PCN rather than just zooming in on the North-East section only as each section of the PCN may have spatial variations in terms of accessibility. Reliability: Investigator surveyed 30 sections over 4 days in bright and sunny weather. This study was done over a short period, conducted once in desirable weather and the place was not re-visited. The reliability of this study could be enhanced if a repeat visit would be conducted
[9]

8
9751/2018/02/Prelim Examinations
2(a) (b) (c) (d) (e)
With reference to Resources 5A and 5B, compare the characteristics of the two river channels. The characteristics can be discussed in terms of the channel width, depth and the depositional landforms ie the mid-channel bars. With reference to Resources 5A and 5B, outline and explain the likely changes that will take place in the two river channels during the wet season. Outline: Channel width and depth of 5A will be smaller than that of 5B and vegetated bars will still remain in the channel
LEVELS MARKS DESCRIPTORS
3 5-6 Well-developed Response demonstrates accurate knowledge and understanding of the effects of discharge on channel morphology. There is good balance in the response. Response is generally accurate, clear, with good data support and focus on the question.
2 3-4 DevelopedResponse demonstrates some knowledge and understanding of the effects of discharge on channel morphology. There may be a lack of balance in the response. Response is generally clear, with some data support and focus on the question but there may be some lapses in the explanation.
1 1-2 UndevelopedResponse demonstrates limited or no knowledge the effects of discharge on channel morphology. Response lacks clarity, details and focus on the question.
0 0 No creditworthy response
With reference to Resources 6, outline one difference between the latitudinal limits of the active and the inactive dunes The active dunes are located further north between 13°N to 18°N The inactive dunes are located nearer to the equator between 7°N to 13°N With reference to Resource 8A and 8B, explain the difference in slope stability. The reasons will be the height of the tree line – vegetation cover increases slope stability through the binding action of the roots and the amount of organic content that binds the soil. The type of weathered products and influence on slope is also an important reason. With reference to Resources 6, 7, 8A, 8B and your own knowledge, discuss the effects of past climate change on geomorphic processes in the tropics. Indicative content Past climate change refers to the cooler and drier conditions associated with the LGM and the warmer and wetter conditions of the Holocene. This response should examine the effects of climate change across space and scale. Generally, the LGM encourages more physical weathering and wind processes and this is on a smaller scale and more evident at the high
[4] [6] [2] [4] [9]

9
9751/2018/02/Prelim Examinations
altitudes of the tropics and the present arid tropics for wind erosion. However, during the Holocene, the wetter and warner conditions encourage more chemical weathering, mass movement processes and water action on a larger scale in the tropics including the drylands.
LEVELS MARKS DESCRIPTORS
3 7-9 Well-developed Response demonstrates accurate knowledge and understanding of how past climate change has affected geomorphic processes in the tropics. There is good balance in the response Response is generally accurate, clear, with good data support and focus on the question.
2 4-6 DevelopedResponse demonstrates some knowledge and understanding of how past climate change has affected geomorphic processes in the tropics. There may be a lack of balance in the response. Response is generally clear, with some data support and focus on the question but there may be some lapses in the explanation.
1 1-3 UndevelopedResponse demonstrates limited or no knowledge of geomorphic processes. Response lacks clarity, details and focus on the question.
0 0 No creditworthy response
Theme 2: Development, Economy and Environment
Development and Managing Resource Base in Sub-Saharan Africa
3 Resource 8 shows Sub-Saharan Africa’s mineral wealth of selected countries and commodities. Resource 9 shows changes in commodity prices vs Sub-Saharan Africa GDP Growth Rates. Resource 10 shows two indicators of development for Sub-Saharan Africa. Resource 11 shows an oil fire and resultant oil spill in the Ogoni delta in Nigeria, Africa
(a) Describe the distribution of Sub-Saharan Africa’s mineral wealth and its impact on some
of these countries in Resource 8. Many sub-saharan countries are resource rich with many of them accounting for significant portions of global production in some minerals. Several Sub-Saharan countries are also heavily reliant on their mineral resources as a vital source of income. Lastly, mineral wealth allows many Sub-saharan countries potential for even greater income streams if they are tapped.
[5]
(b) With reference to Resource 9, compare the relationship between the changes in commodity prices and GDP growth rates in Sub-Saharan Africa since 1961. Positive direct relationship between GDP growth and changes in commodity prices. Generally, when commodity prices increase, GDP growth of Sub-Saharan countries will likewise increase. The relationship is not immediate but has a short lag time. Cite figures to support your answer. This relationship is constant throughout.
[3]
(c) With references to Resources 8, 9 and 10 as well as your own knowledge, suggest
three reasons why resource rich countries such as Nigeria have low levels of HDI. [6]

10
9751/2018/02/Prelim Examinations
Nigeria has low HDI of 0.453 which is considered low due to a variety of reasons. - Overly dependence on raw materials or resources. - Poor governance as shown in Resource 10b where the revenue earned is not
invested wisely in developmental projects or in infrastructure that can benefit the people of Nigeria.
- Own knowledge: corruption within the country which impeded distribution of income to the poorer communities,
- Note* Answers must contain references to resources 8-10 as well as your own knowledge.
(d) With reference to Resource 11, explain how the extraction of minerals can affect the
local environment. -Environmental impact in the extraction of oil resources. -Transportation of raw materials can pollute the environment due to accidents, -Storage of raw materials with poor storage conditions. Any 2 of these activities can be discussed in some details with the resultant environmental impacts.
[4]
(e) With reference to Resource 8 as well as any other resources and your own knowledge, recommend whether Guinea should build a new iron ore mine that produces bauxite. Benefits of iron ore mine for Guinea: Economic Benefits: Revenue, Jobs Social Benefits: Access to financial resources to build services such as clinics, hospitals, schools Development potential: Revenue stream to plan development projects. Negative impacts of iron ore mine for Guinea: Economic: Resource curse and reliance on TNCs Environmental: Strip mining and impacts on biodiversity, land and water bodies
[7]
Theme 3: Sustainable Development
Liveability and Sustainability in Cities
4 Resource 12 shows the EIU’s Liveability index and WWF’s Ecological Footprint. Resource 13 shows Circles of Sustainability for Melbourne, Australia and Port Moresby, Papua New Guinea (PNG) in 2013. Resource 14 shows an advertisement for plans to promote and develop a large scale tourism project on reclaimed land in Port Moresby, Papua New Guinea, a low income country.
(a) Describe the relationship between the liveability index and ecological footprint as shown
in Resource 12. -Generally, cities that score very highly in the liveability index have a larger ecological footprint as well. Reverse applies for low liveable cities such as Dhaka (38 out of 100, 0.6ha per capita) - Cities with low density car oriented cities however score higher in the ecological footprint (e.g: Melbourne at 98 out of 100 but ecological footprint of 7.8 per capita) with similar cities that are compact transit-oriented cities (e.g. Vienna at 98 out of 100 and ecological footprint of 5 ha per capita) though both of these cities have similar liveability indexes.
[4]

11
9751/2018/02/Prelim Examinations
-Other anomalies will be cities at moderate levels of liveability but having very high ecological footprints as well e.g: Dubai at 72 out of 100 but ecological footprint of 9.6ha per capita.
(b) With reference to Resource 13, compare the performance in the scoring for sustainability for Melbourne and Port Moresby. -Melbourne scores very highly in 3 of the 4 dimensions in the economics, political and culture areas than Port Moresby -Melbourne’s performance in their sustainability is consistently rated at above satisfactory and higher as compared to Port Moresby where nearly all indicators are measures as Basic to critical. Provide supporting evidences for your answer.
[4]
(c) With reference to Resource 12 and 13, suggest three reasons to account for the
differences in liveability between Melbourne in Australia, and Port Moresby in Papua New Guinea. - Melbourne and Port Moresby (38 out of 100). Melbourne is a city in a Developed
economy, as such it has access to funds and expertise that allows the city residents to build a better environment and provide amenities and facilities in meeting the needs of its population Most urban issues in Melbourne have been addressed
- Better access to social and cultural services
[6]
(d) With reference to Resource 12 and 13 suggest ways in which Melbourne, Australia can
score higher in its sustainability ratings. - Provide more sustainable public transport system - Provide more sustainable building materials - Reduction of energy through the promotion of cleaner energy
[4]
(e) Imagine that you are the city planner for Port Moresby, Papua New Guinea. You are tasked to evaluate the viability of developing a large scale tourism flagship project on reclaimed land in Port Moresby. With reference to Resources 12, 13, 14 and your own knowledge, assess if this project meets the needs of its residents. - Port Moresby is a city with a love liveability score (Resource 12) and with poor
performances in all dimensions. Most of its scoring is at the basic and unsatisfactory level with great need to address wealth distribution (Economic dimension) and safety concerns (political dimension)(Resource 13). As such, to build a tourism flagship project, it must first address the economic and political dimensions. Hence the tourism flagship project must meet some criterion for it to be considered.
[7]

© EJC 2018 9751/01 [Turn Over
EUNOIA JUNIOR COLLEGE JC2 Preliminary Examination 2018 General Certificate of Education Advanced Level Higher 2
GEOGRAPHY Paper 1 Structured Essay Questions
9751/01
13 September 2018
3 hours
Additional Materials: Answer Paper World Outline Map
READ THESE INSTRUCTIONS FIRST Write your name, civics group and question number on all the work you hand in. Write in dark blue or black pen on both sides of the paper. Write your answer to each question on a fresh sheet of paper. Do not use paper clips, highlighters, glue or correction fluid. You should make reference to appropriate examples studied in the field or the classroom, even when such examples are not specifically requested by the question. Diagrams and sketch maps should be drawn whenever they serve to illustrate your answer. You are reminded of the need for good English and clear presentation in your answers. At the end of the examination, fasten all your work securely together. The number of marks is given in brackets [ ] at the end of each question or part question.
This document consists of 3 printed pages and 1 blank page.

© EJC 2018 9751/01
2
Section A – Tropical Environments
Answer one question from this section.
1 (a) (b)
Explain the factors influencing rainfall distribution in the humid tropics. ‘The interplay of climate and geology explains the variation in the karst landscapes in the humid tropics.’ Discuss this statement with support from relevant diagram(s).
[12] [20]
2 (a) (b)
Explain the variations in the drainage basin water balance within the tropics. ‘Channel patterns constantly evolve as a result of different physical conditions’. Discuss this statement with support from relevant diagram(s).
[12] [20]
Section B – Development, Economy and Environment
Answer one question from this section.
3 (a) (b)
Explain how the core-periphery model and dependency theory help in understanding development in low income countries. ‘The state is no longer important with the presence of other actors in the global economy’. To what extent do you agree with this statement?
[12] [20]
4 (a) (b)
Explain how Thomas Malthus and Ester Boserup view the relationship between population and resources. Assess the success of strategies used to manage transboundary sources of water supply and associated conflicts.
[12] [20]

3
© EJC 2018 9751/01
Section C – Sustainable Development
Answer one question from this section.
5 (a) (b)
Explain how ecological footprint and urban metabolism are important in the understanding of sustainable urban development in cities with high resource use. To what extent is it difficult but necessary to measure sustainable urban development?
[12] [20]
6 (a) (b)
Explain why hydropower and one other energy source are considered sustainable alternatives to fossil fuels. ‘International cooperation is crucial for the successful mitigation of and adaptation to climate change’. To what extent do you agree with the statement?
[12] [20]
- End of Paper -

© EJC 2018 [Turn Over
EUNOIA JUNIOR COLLEGE JC2 Preliminary Examination 2018 General Certificate of Education Advanced Level Higher 2
GEOGRAPHY Paper 2 Data Response Questions
9751/02
20 September 2018
3 hours
Additional Materials The Insert contains all the resources referred to in the question paper.
This document consists of 11 printed pages.

© EJC 2018 9751/02
2
Resource 1 for Question 1
Photos of Marina Bay area before and after development BEFORE:
AFTER:

3
© EJC 2018 9751/02
Resource 2 for Question 1
Current land-use map of Marina Bay area

© EJC 2018 9751/02
4
Resource 3 for Question 1
Excerpt of survey questions crafted by the students
1. Do you agree with the following statements? Strongly
Agree (5) Agree (4) Neutral (3) Disagree (2)
Strongly Disagree
(1) a) Marina Bay caters well
to different groups of people.
b) Marina Bay meets my needs as a resident living in Singapore
c) Marina Bay is primarily serving the needs of expatriates.
Resource 4 for Question 2
Global distribution of average annual solar radiation received on Earth’s surface

5
© EJC 2018 9751/02
Resource 5a for Question 2
Resource 5b for Question 2

© EJC 2018 9751/02
6
Resource 6 for Question 2
Bedload particle diameter and distance from the source of a river

7
© EJC 2018 9751/02
Resource 7 for Question 2
Drainage pattern of two drainage basins

© EJC 2018 9751/02
8
Resource 8 for Question 3
Nature of Foreign Direct Investment in Vietnam from 2012 to 2017
Resource 9 for Resource 3
Number of labour workers employed by Nike directly or indirectly world-wide

9
© EJC 2018 9751/02
Resource 10 for Question 3
Annual and hourly minimum wages of selected countries
Resource 11 for Resource 3
Excerpt of an article on new laws in Vietnam to attract foreign investment
FINANCIER WORLDWIDE: Vietnam seeks to attract more foreign investment with new laws. Published: Dec 2015
The Vietnamese authorities have confirmed the principle of free enterprise in Vietnamese
law - doing away with most foreign ownership restrictions in Vietnamese companies,
reducing red tape in the foreign investment approval process and bringing corporate
governance rules a step closer to international standards.
The new laws contributed to the improvement of the business climate in Vietnam which in
turn resulted in a sustained period of high economic growth. This new regulation was
welcomed by many foreign investors as a ‘game changer’, expected to boost foreign capital
inflows into the country’s stock market and improve its overall competitiveness. Vietnam
thus became an Asian tiger and an attractive investment destination.
However, the country is also facing new challenges presented by the ASEAN Economic
Community (AEC) and a series of new free trade agreements, including the Trans-Pacific
Partnership (TPP). The government is searching for new measures to give the economy
fresh momentum for more long-term sustainable development
Adapted from source: https://www.financierworldwide.com/vietnam-seeks-to-attract-more-foreign-investment-with-two-new-laws/#.W2V5G9IzbIU

© EJC 2018 9751/02
10
Resource 12 for Question 4
Spatial Distribution of Elderly in New Zealand, 2011-2031
Resource 13 for Question 4
Main means of travel to work in Auckland and Wellington

11
© EJC 2018 9751/02
Resource 14 for Question 4
Current (2015) and proposed (2030) rail network in Auckland

© EJC 2018 9751/02 [Turn Over
EUNOIA JUNIOR COLLEGE JC2 Preliminary Examination 2018 General Certificate of Education Advanced Level Higher 2
GEOGRAPHY Paper 2 Data Response Questions
9751/02
20 September 2018
3 hours
Additional Materials: Answer Paper World Outline Map Insert
READ THESE INSTRUCTIONS FIRST Write your name, civics group and question number on all the work you hand in. Write in dark blue or black pen on both sides of the paper. Write your answer to each question on a fresh sheet of paper. Do not use paper clips, highlighters, glue or correction fluid. Candidates answer all questions. You should make reference to appropriate examples studied in the field or the classroom, even when such examples are not specifically requested by the question. Diagrams and sketch maps should be drawn whenever they serve to illustrate your answer. The world outline map may be annotated and handed in with relevant answers. You are reminded of the need for good English and clear presentation in your answers. At the end of the examination, fasten all your work securely together. All questions in this paper carry equal marks. The number of marks is given in brackets [ ] at the end of each question or part question.
This document consists of 4 printed pages.

© EJC 2018 9751/02
2
Section A
Theme 4: Geographical Investigations
1 The Marina Bay area is an extension of Singapore's Central Business District. During the 1970s and 1980s, the government reclaimed land to develop the area into a world-class destination. Marina Bay is currently envisioned as a vibrant 24/7 and sustainable mixed-use district where people live, work, play. A group of 25 students from Goodwill Junior College wanted to examine the impact of urban imaging of the Marina Bay area on different groups of people living in the city. The students took 3 days during their June vacation to conduct the study via site observations and the use of a questionnaire survey on 100 respondents, administered at the entrance of the Marina Bay Sands integrated resort. They also have access to secondary data including photos and a land-use map.
Resource 1 shows the photos of the Marina Bay area before and after development. Resource 2 shows the current land-use map of the Marina Bay area. Resource 3 shows an excerpt of the survey questions crafted by the students.
(a) Suggest a research question for the investigation and explain three reasons why it is of a suitable scale.
[4]
(b) Explain how Resources 1 and 2 are useful as secondary data to a group of students
carrying out this investigation on the impact of urban imaging of Marina Bay.
[5]
(c) With reference to Resource 3, describe an appropriate method to represent the data that would be obtained. Outline one advantage of the chosen data representation method.
[3]
(d) Your group concluded that some of the data collected may not be completely reliable
and/or accurate. Explain how the process of data collection could be improved.
[5]
(e) The Urban Redevelopment Authority (URA) has asked the group to gather information to assess the success of urban imaging of Marina Bay. Outline how the group would go about collecting the information.
[8]

3
© EJC 2018 9751/02
Section B
Theme 1: Tropical Environments
Climates and Hydrological Systems in the Tropics
2 Resource 4 shows the global distribution of average annual solar radiation received on the
Earth’s surface. Resource 5a and 5b show the annual climates of Manaus, Brazil (latitude 30S) and Kano, Nigeria (latitude 120N). Resource 6 shows the changes in bedload particle diameter and distance from the source of a river in Manaus. Resource 7 shows the drainage pattern of two drainage basins.
(a) With reference to Resource 4, explain the variations in the global distribution of average annual solar radiation received on Earth’s surface.
[6]
(b) Contrast the climates of Manaus, Brazil and Kano, Nigeria using Resource 5a and 5b. [5] (c) Using Resource 6, describe the changes in bedload particle diameter with increasing
distance from the source of the river. [4]
(d) Explain two fluvial erosional processes that have led to the changes in bedload particle
diameter in Resource 6. [4]
(e) With the aid of a diagram(s), explain how and why the characteristics of hydrographs
would differ between the two drainage basins shown in Resource 7. [6]
Theme 2: Development, Economy and Environment
Increasing Global Competitiveness in Vietnam
3 Resource 8 shows the nature of Foreign Direct Investments in Vietnam from 2012 to 2017. Resource 9 shows the number of labour workers employed by Nike directly or indirectly worldwide. Resource 10 shows the annual and hourly minimum wage of selected countries. Resource 11 shows an excerpt of an article on new laws in Vietnam seeking to attract foreign investments.
(a) With reference to Resource 8, describe the changes in Foreign Direct Investments and number of new projects in Vietnam from 2012 to 2017.
[4]
(b) Using Resource 8 and your own knowledge, suggest reasons for the relative significance
of Processing-manufacturing in the structure of Vietnam’s economy. [5]
(c) Using Resources 9, 10 and your own knowledge, explain why Nike employs labour
workers from around the world. [7]
(d) Using Resources 8, 10, 11 and your own knowledge, evaluate the extent to which
Vietnam can be considered competitive in the global economy.
[9]

© EJC 2018 9751/02
4
Theme 3 – Sustainable Development
Issues of Traffic Congestion and Liveability in New Zealand
4 Resource 12 shows the changes in spatial distribution of elderly population in New Zealand
from 2011-2031. Resource 13 shows the main means of travel to work in Auckland and Wellington. Resource 14 shows the current (2015) and proposed (2030) rail network in Auckland. Auckland is a major city in New Zealand’s North Island and Wellington is the capital of New Zealand.
(a) Describe the spatial distribution of elderly population in New Zealand in 2031, seen in Resource 12.
[3]
(b) Explain three limitations of Resource 12 in representing changes in spatial distribution
of elderly population in New Zealand from 2011 to 2031. [5]
(c) Using Resource 13, compare between the main means of travel to work by employed
population in Auckland and Wellington. [4]
(d) In February 2018, the NZ Herald wrote that Aucklanders, on average, spend 80
unproductive hours on the road in a year due to traffic congestion. With reference to Resource 13, account for the causes of traffic congestion faced in Auckland.
[4]
(e) Using Resources 13, 14 and your own knowledge, evaluate the strategies that the
Auckland city government can implement to ease traffic congestion in the city.
[9]
-End of Paper-

Eunoia Geography Unit JC2 H2 Geography Prelims Examination
2018
Marking Scheme for JC2 H2 Geography Prelims
Section A – Tropical Environments
1 (a) (b)
Explain the factors influencing rainfall distribution in the humid tropics Indicative Content Candidates should consider both the spatial and temporal rainfall variations that exists across the humid tropics. Responses should describe the variations across the 3 climatic types (Af, Am & Aw). Factors to explain these variations should include global scale like migration of ITCZ, ENSO, Monsoons and localized scale like relief/topographic effects on onshore wind flow.
A higher level response will offer detailed explanation of the factors focusing on ITCZ, seasonal variation of monsoonal winds and at least localized factor accompanied by well annotated diagrams (e.g. location of ITCZ on the World Outline Map, ENSO, formation of orographic rain. Responses that make reference to places in the climatic zones should be credited with higher marks.
Levels marked using H2 generic level descriptors for 12m SEQ sub-part (a)
The interplay of climate and geology explains the variation in the karst landscapes in the humid tropics.’ Discuss this statement with support from relevant diagram(s). Indicative Content Karst landscapes in the humid tropics have characteristic surface and sub surface morphology as a result of the interaction between water and geology. Candidates should demonstrate the movement of both surface water (rivers) and sub-surface river and water and the dissolution processes of the rock type (limestone or dolomites) and rock structure. A variety of surface landforms such as cone, tower and isolated karst and surface landforms such as cave and speleothems could be used to illustrate the movement of water affect the geology or vice versa. Other factors that could influence the karst landforms could be tectonic uplift, vegetation and time. A higher level response should demonstrate the differential erosion by water on the soluble rock guided by secondary permeability of the rock structure. This is evident through the varied landforms found in the landscapes. Evidence of the varied landscapes can be seen. The counter argument to the statement could examine the present of other factors such as tectonic uplift in changing the dynamic of solution processes to enhance the forms of the landforms over time. Reference to concrete examples of karst landscapes in Guilin, China or Vietnam and Malaysia should be credited. A good response could use the carbonation equation to demonstrate the dissolution of limestones in sub-aerial to shape the landscapes and movement of water in sub-surface especially in cave resulting in varied forms of speleothems.
[12] [20]

Eunoia Geography Unit JC2 H2 Geography Prelims Examination
2018

Eunoia Geography Unit JC2 H2 Geography Prelims Examination
2018 2(a) 2(b)
Explain the variations in the drainage basin water balance within the tropics Indicative Content The drainage basin water balance differs between climates in the tropics as well as over time. In general, it should be noted that the drainage basin water balance in the humid tropics is in surplus, whilst it is in deficit in the arid tropics. Students should establish the differences in drainage basin and provide relevant explanation to the differences, making close reference to the components of the hydrologic cycle (ie: inputs, flows / stores, output). Higher level responses should identify that the drainage basin water balance varies over time as well, especially so for seasonally humid / arid climates (Af, Aw, BSh, BWh). ‘Channel patterns constantly evolve as a result of different physical conditions’. Discuss this statement with support from relevant diagram(s). Indicative Content Physical conditions refer to the climatic and geological conditions of the drainage basin. Different climatic and geological conditions influence river discharge and hence the amount of energy possessed by the river to do work (ie: fluvial erosion, transport, deposition). In general, students should establish that drainage basins with constantly high discharge gives rise to high-energy river systems that facilitate the formation of meanders, whereas basins with high discharge variability promotes erosion and deposition leading to braided channels. Such channel patterns also evolve due to the geological conditions of the channel (eg: erodability and cohesiveness of beds and banks). Ultimately, students should be able to conclude if climatic and geologic conditions are fully responsible for the development of channel patterns. Higher level responses should explore the influence of other activities or conditions that would influence the development of channel patterns. These other factors could include natural events such as mass movements; or human activities such as deforestation, hard engineering efforts to manage floods. Students could also explore the impact of global climate change on the drainage basins and hence effects on channel patterns. Synoptic links: Floods (Topic 1.2), Deforestation (Topic 1.2), Climate Change (Topic 3.1)
[12]

Eunoia Geography Unit JC2 H2 Geography Prelims Examination
2018

Eunoia Geography Unit JC2 H2 Geography Prelims Examination
2018
Section B – Development, Economy and Environment 3 (a)
Explain how the core-periphery and dependency theory help in understanding development in low income countries Indicative Content (low income countries) The centre–periphery (or core–periphery) model is a spatial metaphor which describes and attempts to explain the structural relationship between the advanced or metropolitan ‘centre’ and a less developed ‘periphery’, either within a particular country Stage 1 – The first stage refers to an underdeveloped region characterized by the prevalence of primary production activities. In this stage, independent local centres with no hierarchy represents the pre-industrial (agricultural), pre-colonial stage and is associated with a series of isolated self-sufficient local economies and a small scale settlement structure. Many low income countries have a huge primary sector focused on agriculture, with little surplus goods being produced. Stage 2 – Backwash Effect. The centre core ‘feeds’ on the rest of the nation, and the extensive periphery is drained. This is also known as the “backwash” effect, where by population migrations, trade and capital movements all converge on the key growth points of the core region. Low income countries will be drained of talent and resources. Stage 3 characterizes the eventual development of a single national centre with strong sub-cores and peripheries. The simple centre-peripheral model has progressively transformed to a multi-nuclear one with the development of sub-cores and peripheries.
New sub-cores start to develop due to economic growth and diffusion from the core region (spread effect). This may also be due to governmental intervention to stimulate growth and development in the periphery, by the process of decentralization due to increase in production costs (mainly labour and land) in the core area. Low income countries will be benefit from the “spread effect” as production activities move to these areas (e.g. global shift of manufacturing or services) to India.
In a historical sense, dependency theory looks at the unequal power relations that have developed as a result of colonialism. As a result, surplus value was extracted from the peripheral and transferred to core regions, and from LDCs to DCs.
Dependency theory has relevance and currency in today’s context. Although colonialism has collapsed after the 2nd World War, its legacy continued in the form of neo-colonialism. International finance and capitalism became the preferred methods of control over LDCs. As a result, many LDCs has a significant of debt. For example, 25% of aid received by African countries each year is used to repay debt rather than build infrastructure. LDCs also suffer from a reliance on importing finished goods and exporting natural resources.
[12]

Eunoia Geography Unit JC2 H2 Geography Prelims Examination
2018 3(b)
‘The state is no longer important with the presence of other actors in the global economy’. To what extent do you agree with this statement? Indicative Content Candidates should discuss this statement in relation to the global economy (one that is interdependent, inter-connected, integrated and ICT enabled). Most scripts were able to discuss this in relation to other actors in the global economy but they differ in terms of the amount of details/alignment to the question. While the provision of public goods is a relevant role of the state, it is not sufficient for candidates to say how they would improve the welfare of the people without relating to how it would impact the global economy. For example, how these public infrastructure would make the country have the basic facilities and amenities that would attract FDIs and labour flows into the economy. In addition, the state can invest in home-grown corporations (e.g. Chaebols Better scripts were able to highlight that the significance of the state can differ between that of more developed and less developed countries (e.g. through their involvement in political decisions in international organisations). Possible Synoptic Links: 3.1 Sustainable Development, e.g. how states play an important in ensuring efforts to attain SD at the national scale or 3.1 Climate Change – how different states collaborate within a supranational framework (e.g. Paris Climate Agreements) to mitigate a global issue.
[20]

Eunoia Geography Unit JC2 H2 Geography Prelims Examination
2018 4 (a) 4(b)
Explain how Thomas Malthus and Ester Boserup view the relationship between population and resources. Indicative Content Thomas Malthus and Ester Boserup saw the relationship between population and resources at 2 ends of the spectrum – the former taking on the pessimist ‘doomsday’ approach whilst the latter taking on an optimistic/cornucopian stance. In approaching this question, students should adequately explain the premises in which both the nature of relationship between population and resources. Specifically, whether the humankind (population) is seen as consumers or producers of resources; as well as the regenerative potential of resources. Higher level responses would also highlight the common ground established by both perspectives. Assess the success of strategies used to manage transboundary sources of water supply and associated conflicts. Transboundary sources of water supply present challenging situations for riparian states and hence the conflicts are associated with quantity, quality, timing and reliability. In assessing the success of strategies, students should identify that these strategies require specificity in tackling the associated conflict, and are more effective when employed at both the regional and local/community level. Students should surface a variety of transboundary rivers and associated conflicts in evaluating the strategies. Higher level responses should identify that every river is unique and the success of strategies would hinge upon whether it would allow riparian states to achieve desired outcomes on economic, social, environmental and political dimensions, and at a larger scale, attainment of sustainable development goals. Synoptic links: Understanding Development (Topic 2.1), Sustainable Development (Topic 3.1), Sustainable Urban Development (Topic 3.2)
`

Eunoia Geography Unit JC2 H2 Geography Prelims Examination
2018 Section C – Sustainable Development
5 (a) Explain how ecological footprint and urban metabolism are important in the
understanding of sustainable urban development in cities with high resource use.
[12]
The EF is a resource management tool that measures how much land and water area a human population requires to produce the resources it consumes and to absorb its waste under prevailing technology and socio-economic conditions. It is calculated based on the total area of productive land and sea required per person to meet their food, energy, raw material, water and waste disposal needs. The significance of the ecological footprint is conditioned by 3 key factors:
• The rate of population growth • The levels of development and consumption • The nature of available technology
Associated concepts of carrying capacity and ecological overshoot should also be addressed. A higher level of response would make specific reference to EF values of certain countries Urban Metabolism- The Rogers models (Figure 1) compares an unsustainable city with a sustainable city. Using a systems approach, notice the differences in the amount of inputs and outputs, and the important roles of recycling and pollution control in the sustainable city

Eunoia Geography Unit JC2 H2 Geography Prelims Examination
2018 (b) To what extent is it difficult but necessary to measure sustainable urban
development? Indicative Content
[20]
Candidates should address both key words of “difficult” and “necessary”. “Difficult” 1) Highlight that there are indicators to measure SUD but these are fraught with
limitations. 2) Broad and ambiguous meanings of SUD which are subjected to different
interpretations. The more “qualitative” aspects of SD is hard to measure. How can values of justice or equity be measured?
3) Nature of SUD – idea of trade-offs. While one aspect of SUD is being achieved, other aspects may be compromised.
“Necessary” 1) SUD comprises various dimensions and can be contextualized to a regional
scale (e.g. European Green City Index, China Urban Sustainability Index) 2) While it is difficult to measure the “end state”, assessment of SUD can be
seen as a process, such that city governments can work towards SD at the urban scale.
6 (a) Explain why hydropower and one other energy source are considered
sustainable alternatives to fossil fuels.
[12]
Indicative Content Other energy sources could include nuclear power, biofuels, solar energy, wind energy and geothermal energy. Candidates should address the term “sustainable” which can be understood to be less pollutive, higher energy security and a lower probability of catastrophic events A higher level response should cover why fossil fuels are not considered sustainable and how hydropower and the chosen energy sources are considered to be sustainable alternatives. Levels marked using H2 generic level descriptors for 12m SEQ sub-part (a)
(b) ‘International cooperation is crucial for the successful mitigation of and adaptation to climate change’. To what extent do you agree with the statement?
[20]
Indicative Content Responses should include a discussion on the extent that international cooperation is crucial to the successful mitigation of and adaptation to climate change. There should be recognition of other factors other than international cooperation that are relevant to the examples used. Reasons should be provided on why one factor is more crucial than another. A higher level response would be able to discern the differences in approach for mitigation of and adaptation to climate change and highlight how the role of international cooperation might be more important for one than another.
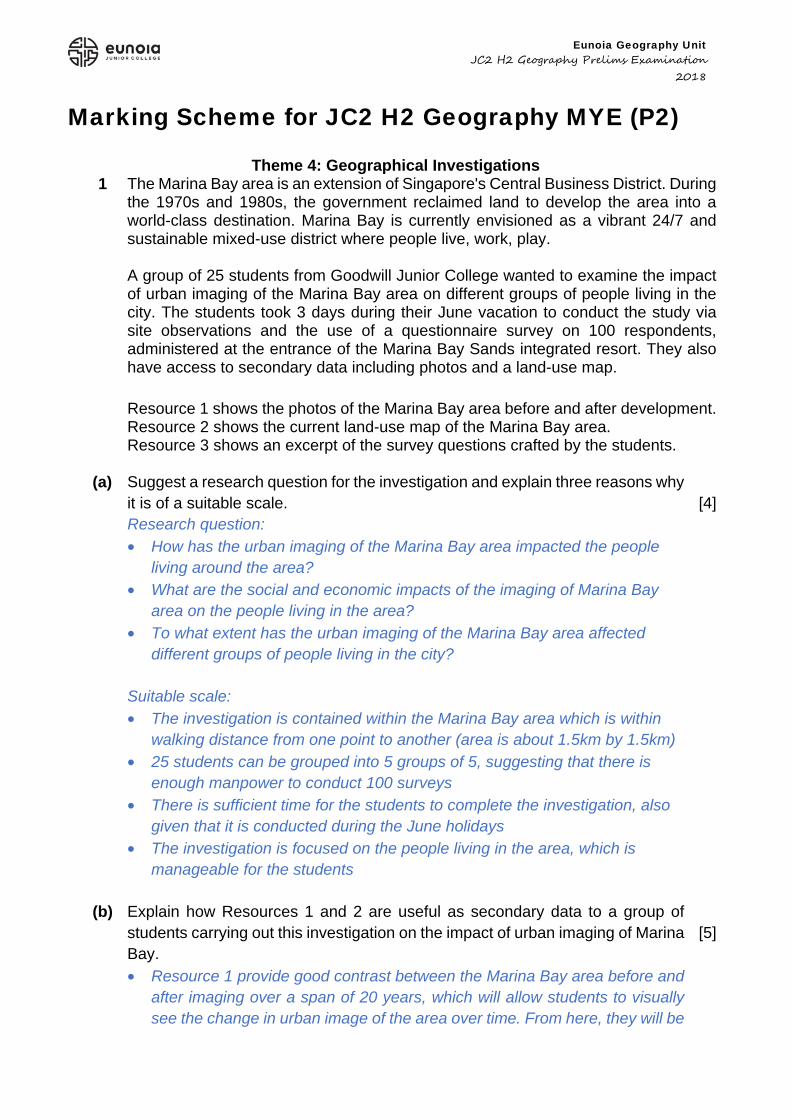
Eunoia Geography Unit JC2 H2 Geography Prelims Examination
2018
Marking Scheme for JC2 H2 Geography MYE (P2)
Theme 4: Geographical Investigations 1 The Marina Bay area is an extension of Singapore's Central Business District. During
the 1970s and 1980s, the government reclaimed land to develop the area into a world-class destination. Marina Bay is currently envisioned as a vibrant 24/7 and sustainable mixed-use district where people live, work, play. A group of 25 students from Goodwill Junior College wanted to examine the impact of urban imaging of the Marina Bay area on different groups of people living in the city. The students took 3 days during their June vacation to conduct the study via site observations and the use of a questionnaire survey on 100 respondents, administered at the entrance of the Marina Bay Sands integrated resort. They also have access to secondary data including photos and a land-use map.
Resource 1 shows the photos of the Marina Bay area before and after development.Resource 2 shows the current land-use map of the Marina Bay area. Resource 3 shows an excerpt of the survey questions crafted by the students.
(a) Suggest a research question for the investigation and explain three reasons why it is of a suitable scale.
[4]
Research question: • How has the urban imaging of the Marina Bay area impacted the people
living around the area? • What are the social and economic impacts of the imaging of Marina Bay
area on the people living in the area? • To what extent has the urban imaging of the Marina Bay area affected
different groups of people living in the city? Suitable scale: • The investigation is contained within the Marina Bay area which is within
walking distance from one point to another (area is about 1.5km by 1.5km) • 25 students can be grouped into 5 groups of 5, suggesting that there is
enough manpower to conduct 100 surveys
• There is sufficient time for the students to complete the investigation, also given that it is conducted during the June holidays
• The investigation is focused on the people living in the area, which is manageable for the students
(b) Explain how Resources 1 and 2 are useful as secondary data to a group of students carrying out this investigation on the impact of urban imaging of Marina Bay.
[5]
• Resource 1 provide good contrast between the Marina Bay area before and after imaging over a span of 20 years, which will allow students to visually see the change in urban image of the area over time. From here, they will be

Eunoia Geography Unit JC2 H2 Geography Prelims Examination
2018 able to make initial conclusions on the level of urban liveability brought about by the changes.
• Resource 2 indicates the landuse of the area, which allows the students to identify the type of landuse that has been added to the area as part of the imaging efforts.
• Resource 2 as a map provide students with a sense of the size of the area and allows them to measure the distance between amenities, which could deepen their understanding of the aspects contributing to the liveabiliy of the area.
• Resource 2 is also useful as a base map for student to delineate the areas in which they would conduct their surveys
(c) With reference to Resource 3, describe an appropriate method to represent the data that would be obtained. Outline one advantage of the chosen data representation method.
[3]
Appropriate data representation & advantage(s): • Bar chart
o Display relative numbers or proportions of multiple categories o Summaries a large data set in visual form o Clarify trends better than tables o Estimate key values at a glance (good visual representation)
• Pie Chart o Display relative proportions of multiple classes of data o Size of the circle can be made proportionate to the total quantity it
represents o Summarise a large data set in visual form
(d) Your group concluded that some of the data collected may not be completely reliable and/or accurate. Explain how the process of data collection could be improved.
[5]
Reasons why the data collected may not be completely reliable / accurate & proposed improvements • Issue with question – too broad and subjective (eg: different groups of people
covers a large range and respondents are required to respond to a whole range rather than a specific type; ‘needs’ may refer to a variety of needs)
o To provide specific groups of people (eg: elderly, handicapped, migrants, children, etc) and needs (eg: entertainment, safety, etc) for respondents to respond to
• Issue with study group in survey – respondents may not be able to accurately differentiate between ‘residents’ and ‘expatriates’, or have not interacted with them to respond to the survey question, leading to an inaccurate assessment on whether Marina Bay will serve their needs

Eunoia Geography Unit JC2 H2 Geography Prelims Examination
2018 o To further refine the question based on the profile of the respondent
and for them to respond if their own needs have been met • Issue with data collection method – it was not about the sampling method
used, and whether it is consistently used for all groups, leading to unreliable data
o To standardise a stratified sampling method based on age group, profile (local vs expats), gender
• Issue with data collection method - administered at the entrance of the Marina Bay Sands integrated resort which would only provide a narrow profile of respondents, leading to a skewed data, unrepresentative of the actual population
o To conduct survey at multiple points within the Marina Bay area which will capture a more representative target group.
(e) The Urban Redevelopment Authority (URA) has asked the group to gather information to assess the success of urban imaging of Marina Bay. Outline how the group would go about collecting the information.
[8]
To assess the success of urban imaging of Marina Bay, students should: • Craft an appropriate research question for the investigation • Identify the appropriate target group and data collection methods • Consider issues like ethics when conducting the investigation Levels marked Level Marks Descriptors 3 7-8 Insightful response in employing the various sources of data
(both primary and secondary). Considerations in the GI are clearly identified and appropriately addressed. Response shows good knowledge and understanding of urban imaging and GI methods.
2 4-6 Able to use a few data collection methods but may leave out on either the primary or secondary data collection. Response may be unbalanced or lacking in details.
1 1-3 Response shows some knowledge and understanding of data collection methods. Strategies used may be generic to fieldwork but of limited relevance to the context.

Eunoia Geography Unit JC2 H2 Geography Prelims Examination
2018
Section B
Theme 1: Tropical Environments
Climates and Hydrological Systems in the Tropics
2 Resource 4 shows the global distribution of average annual solar radiation received on the Earth’s surface. Resource 5a and 5b show the annual climates of Manaus, Brazil (latitude 30S) and Kano, Nigeria (latitude 120N). Resource 6 shows the changes in bedload particle diameter and distance from the source of a river in Manaus. Resource 7 shows the drainage pattern of two drainage basins.
(a) With reference to Resource 4, explain the variations in the global distribution of average annual solar radiation received on Earth’s surface.
[6]
[Description of Variation] – Maximum 2 marks Higher amount of average annual solar radiation within the tropics (between 23.5oN and 23.5oS), ranging from 150-275 watts per square metre. Highest insolation found received in the tropic of Cancer and Capricorn, e.g. 275 watts per square metre in the Middle East, or 225 watts per square metre at Australia. Lower amount of average annual solar radiation outside of the tropics (decrease polewards), ranging from 275 to 75 watts per square metre [Explanation] Higher amount of average annual solar radiation due to axial tilt of the Earth - higher angle of incidence in the tropics and the smaller distance travelled through the atmosphere. Angle of Incidence- high angle of incidence means that the amount of insolation would be spread over a smaller area and be less diffused. Smaller distance travelled across the atmosphere – less insolation will be lost by scattering and reflection by the atmosphere. Cloud Cover – Lack of cloud cover (due to the permanence of the Sub tropical high pressure belt) means that there are less clouds to reflect and scatter the amount insolation received.
(b) Contrast the climates of Manaus, Brazil and Kano, Nigeria using Resource 5a and 5b. [Differences] in terms of temperature and rainfall Temperature – Manaus- constant average of about 26oC with small annual range of about 2 degrees celcius. In contrast, two peaks of temperature (34 degrees) experienced in April and October (30.5 degrees). Annual temperature range of about 8 degrees celcius.
[5]

Eunoia Geography Unit JC2 H2 Geography Prelims Examination
2018 Rainfall-
[Seasonality of Rainfall] Receives rainfall throughout the year, ranging from 45mm to 260mm. This is opposed to the distinct wet dry seasons in Kano (dry season – Nov- April, and wet season (March – September). [Peak and Least Rainfall] Least rainfall in Aug (45mm) in Manaus, Brazil compared to peak rainfall of 260mm in Kano, Nigeria. [Total Amount of Rainfall] – Manaus receives about 1780mm, as compared to 850mm in Kano.
(c) Using Resource 6, describe the changes in bedload particle diameter with increasing distance from the source of the river.
[4]
• Maximum particle diameter decreases from 120mm (2km) to 110mm (4km) to
90mm (6km). • Slight/marginal increase in minimum particle size, 24mm (2km) to 28mm to
32mm (6km). • No change in median particle diameter at about 60mm. • Middle 50% of particles – largest range (42mm) decreases to about 36mm,
which decreases to (30mm). Note increase in size in the middle (50%), from 4km to 6km.
(d) Explain two fluvial erosional processes that have led to the changes in bedload particle diameter in Resource 6.
[4]
Corrasion – refers to the scratching and scraping of the river bed and banks by the load carried by the river (largely by bed load). Attrition - refers to the breakup of the load itself into small, angular fragments as a result of collision and mutual scraping of the load.
(e) With the aid of a diagram(s), explain how and why the characteristics of hydrographs would differ between the two drainage basins shown in Resource 7.
[6]
Candidates should point out that the drainage density for Basin B is higher than that of Basin A, given the same basin size. [HOW] Hydrograph of Basin B would demonstrate a flashier hydrograph, with a steeper rising limb, higher peak flow, steeper falling limb, and lower base flow. [WHY] Lack of Vegetation in Basin B – What impact does it have on overland flow and amount of infiltration? Higher Drainage Density in Basin B – Channel flow > throughflow processes. Also less distance travelled by various pathways to reach the river channel.

Eunoia Geography Unit JC2 H2 Geography Prelims Examination
2018
3 Resource 8 shows the nature of Foreign Direct Investments in Vietnam from 2012 to 2017. Resource 9 shows the number of labour workers employed by Nike worldwide. Resource 10 shows the annual and hourly minimum wage of selected countries. Resource 11 shows an excerpt of an article on new laws in Vietnam seeking to attract foreign investments.
(a) With reference to Resource 8, describe the changes in Foreign Direct Investments and number of new projects in Vietnam from 2012 to 2017.
• In general, FDIs have increased from 2010 to 2017, with a steady increase in
terms of realised capital (quote values) • In terms of new registered and added capital, there has been some
fluctuations (increase between 2012 and 2013, decrease from 2013 to 2015 and a steady increase from 2015 to 2017)
• The number of new projects have increased from 2012 to 2016, with about double the number of new projects. There is a slight dip in the number of projects from 1408 in 2016 to 1378 in 2017.
(b) Using Resource 8 and your own knowledge, suggest reasons for the relative
significance of Processing-manufacturing in the structure of Vietnam’s economy. • The processing-manufacturing sector has received the highest FDI in the
period, with 10.83b (49.4% of total FDI) • Possible reasons could include:
o Vietnam being an industrialising country which has attracted a high number of projects related to the processing and manufacturing of products
o Relatively ideal location within southeast Asia for shipping of processed goods to other parts of the world
o Role of government in promoting the sector o Availability of cheaper labour that has attracted TNCs to relocate their
processing plants to Vietnam.
(c) Using Resources 9, 10 and your own knowledge, explain why Nike employs labour workers from around the world.
• Footloose nature of Nike as a TNC allows them to locate / outsource their production plants to tap on the skills and affordable labour (countries with comparative advantage) -
o This is seen in R9 where nearly 1 million workers are employed from 744 factories worldwide.
o In R10: the minimum wage for India, Indonesia and Vietnam are lower, which corresponds to the high number of workers employed in these countries.
o China, which has the highest minimum wage, are valued for the skills for higher value added processes
• Production plants are located near consumer markets o To offset shipping costs of finished products in order to increase
revenue and maximise profits o This is shown by factories present in emerging markets in Asia (esp
South Asia) and South America (R9)

Eunoia Geography Unit JC2 H2 Geography Prelims Examination
2018
(d) Using Resources 8, 10, 11 and your own knowledge, evaluate the extent to which Vietnam can be considered competitive in the global economy.
There is no right or wrong answers to this question as the students are to provide a response to whether Vietnam can be considered competitive in the global economy, and provide support from the respective resources. Vietnam is considered competitive: • R8: Positive growth new and added capital year on year with increasing
realised capital despite a slight dip in number of new projects • R8: a strong performance in processing-manufacturing sector indicating that
they are able to attract TNCs • R9: Largest number of workers employed by Nike and 2nd largest number of
factories indicating strong attraction • R11: Relevant and targeted laws aimed at attracted FDI in bid to increase
competitiveness Vietnam is not considered competitive: • R8: Dip in number of new projects since 2017 may indicate lost of
competitiveness to other countries • R8: Most FDI in processing-manufacturing sector which is less value adding
than other sectors such as R&D • R9: Not conclusive if Nike is the significant TNC it hosts; or a signal of high
dependency on one TNC for its economic development • R11: despite new laws enacted in 2015, number of new projects have
declined from 2016 (may indicate that the law has little effect in increasing competitiveness)
• R11: facing challenges in maintaining sustainable development Level Marks Descriptors 3 7-9 • Response demonstrates a clear knowledge and
understanding of the context in the question. • Uses relevant, detailed and accurate factual information
and conceptual understanding. • Reflects strong critical thinking skills and may include
perceptive insights for the strongest responses. • Source(s) is well used to support the response. • Provides a logical and well-developed evaluation well
founded on evidence and/or different viewpoints. 2 4-6 • A satisfactory response which is generally sound and
contains relevant points, but may not always focus on the context in the question.

Eunoia Geography Unit JC2 H2 Geography Prelims Examination
2018 • Uses factual information and conceptual understanding
that is generally appropriate to the given context but lacks detail and may contain some inaccuracies.
• Displays general critical thinking skills. • Source(s) is used to support parts of the response. • Provides an evaluation, which may be limited in depth and
sufficient elaboration in some parts. 1 1-3 • Response shows a poor understanding of the context in the
question. • Uses basic factual information and conceptual
understanding which has some, but limited relevance to the question.
• Source(s) is not used or not accurately used to support the response.
• Provides little or no evaluation 0 0 No creditworthy response.

Eunoia Geography Unit JC2 H2 Geography Prelims Examination
2018
Theme 3 – Sustainable Development
Issues of Traffic Congestion and Liveability in New Zealand
4 Resource 12 shows the changes in spatial distribution of elderly population in New Zealand from 2011-2031. Resource 13 shows the main means of travel to work in Auckland and Wellington. Resource 14 shows the current (2015) and proposed (2030) rail network in Auckland. Auckland is a major city in New Zealand’s North Island and Wellington is the capital of New Zealand.
(a) Describe the spatial distribution of elderly population in New Zealand in 2031, seen in Resource 12.
[3]
• Generally higher in the southern parts of New Zealand ranging from 22.6-27.5%.
• Highest in the north-western states (West Coast, Tasman and Nelson) of the southern part and the northernmost part of New Zealand with more than 27.5% of the population being elderly.
• Lowest in the state of Auckland with 15.1-17.5%.
(b) Explain three limitations of Resource 12 in representing changes in spatial distribution
of elderly population in New Zealand from 2011 to 2031. [5]
• Only shows changes to proportion of elderly over time but not the absolute
increase – Difficult to implement policies targeted at the elderly because of uncertainty of whether the number has actually risen. It could be a change in total population size rather than the number of elderly.
• Variations within each state is not shown – There might be variations within each state but it is difficult to represent in a choropleth map.
• Abrupt change at boundaries – Not reflective of the possibly gradual change between boundaries.
(c) Using Resource 13, compare between the main means of travel to work by employed
population in Auckland and Wellington. [4]
Similarities
• The highest percentage for both Auckland and Wellington is via private care, truck or van with 59% and 37% respectively.
• The lowest percentage is also similar for both cities with public bus having only 2% in Wellington and 3% in Auckland.
Differences • The percentage of working population who travel to work via train in Wellington is
significantly more than Auckland at 21%. • Even though the highest percentage for both cities is in private vehicles, it is
significantly higher in Auckland by 22%.
(d) In February 2018, the NZ Herald wrote that Aucklanders, on average, spend 80
unproductive hours on the road in a year due to traffic congestion. With reference to Resource 13, account for the causes of traffic congestion faced in Auckland.
[4]
• Resource 13 shows that the percentage of population who drove to work whether via
private car, truck or van or the company car, truck or van totalled 77%. • This would equate to significant traffic on the road, especially during peak hours. • Only 4% of the working population were passengers in car, truck van or company
bus which showed the lack of car-sharing/pooling in Auckland. Public transport also only came up to 6% of Auckland’s working population.
• All these lead to build-up of traffic on roads and hence traffic congestion.

Eunoia Geography Unit JC2 H2 Geography Prelims Examination
2018 (e) Using Resources 13, 14 and your own knowledge, evaluate the strategies that the
Auckland city government can implement to ease traffic congestion in the city.
[9]
Indicative Content
Candidates should combine their knowledge of the causes of traffic congestion from their own knowledge as well as that shown in the Resources and suggest suitable strategies to ease traffic congestion in Auckland. For example, Resource 14 shows the current and proposed rail network in Auckland. Candidates should not that Resource 13 shows that majority of Auckland’s working population travel to work via private transport or company car, van or truck and only 3% commute via train. Improvements to the accessibility and connectivity of the rail network will hopefully encourage more commuters to use the public trains to travel to work instead. A higher level response will recognise that a multi-pronged approach is necessary and it is insufficient to merely improve public transport networks. The mindset of the people with reference to using private transport has to be changed as well. Levels marked using H2 generic level descriptors for open-ended 9m DRQ on Themes 1,2 and 3

INNOVA JUNIOR COLLEGE JC2 PRELIMINARY EXAMINATIONS in preparation for General Certificate of Education Advanced Level
Higher 2
GEOGRAPHY
Paper 1 Structured Essay Questions Additional Materials: Answer Paper
World outline map
9751/01
27th August 2018
3 hours
READ THESE INSTRUCTIONS FIRST Write your name and class on all the work you hand in. Write in dark blue or black pen on both sides of the paper. You may use a HB pencil for any diagrams or graphs. Do not use staples, paper clips, glue or correction fluid. Answer three questions. One from each section. You should make reference to appropriate examples studied in the field or the classroom, even where such examples are not specifically requested by the question. Diagrams and sketch maps should be drawn whenever they serve to illustrate an answer. The world outline map may be annotated and handed in with relevant answers. You are reminded of the need for good English and clear presentation in your answers. At the end of the examination, fasten each section with a separate cover page and hand in. The number of marks is given in brackets [ ] at the end of each question or part question.
This document consists of 3 printed pages and 1 blank page.
Innova Junior College [Turn over

2
9751/01/IJC/AUG18
Section A – Tropical Environments
Answer one question from this section.
1 (a) With the aid of well-labelled diagrams, account for the variation in channel
morphology in the tropics.
[12]
(b) "Discharge is the most important factor influencing channel patterns in the tropics."
Discuss.
[20]
2 (a) Using relevant diagrams, explain how wind erosion affects landforms in the hot and arid tropics.
[12]
(b) Assess the role played by climate in affecting the formation of landscapes in the
humid tropics.
[20]
Section B – Development, Economy and Environment
Answer one question from this section
3 (a) Account for the emergence of the New International Division of Labour (NIDL). [12] (b) “Besides being a prime cause of poor economic growth, poor governance breeds
corruption, which cripples investment, wastes resources, and diminishes confidence.” (Ahmed Zewail) To what extent do you agree that a country’s development is largely in the hands of the state?
[20]
4 (a) Explain the impact of privatisation of water resources in lower income countries.
[12]
(b) “As I travel around the world, people think the only place where there is potential
conflict over water is the Middle East, but they are completely wrong. We have the problem all over the world.” (Kofi Anan). To what extent do you agree that water conflicts are not only experienced by many countries but are becoming more difficult to solve.
[20]

3
9751/01/IJC/AUG18
Section C – Sustainable Development
Answer one question from this section
5 (a) Explain the effects of climate change on sustainable development of countries at
lower levels of development.
[12]
(b) Assess the effectiveness of mitigation and adaptation strategies in combating the
negative effects of climate change.
[20]
6
(a)
(b)
Explain why urban traffic congestion occurs in countries at low levels of development. To what extent have strategies to ease traffic congestion in cities been effective?
[12]
[20]

4
9751/01/IJC/AUG18
BLANK PAGE

9751/02/IJC/SEP18
INNOVA JUNIOR COLLEGE JC2 PRELIMINARY EXAMINATIONS in preparation for General Certificate of Education Advanced Level Higher 2
GEOGRAPHY Paper 2 Data Response Questions INSERT
9751/02
12 Sept 2018
3 hours
READ THESE INSTRUCTIONS FIRST This Insert contains all the Resources referred to in this questions.
INSERT
This document consists of 14 printed pages
Innova Junior College [Turn over

2
9751/02/IJC/SEP18
Resource 1 for Question 1
Map of surrounding area of Nordcom 1 and Nordcom 2
Source: Adapted from Google Maps

3
9751/02/IJC/SEP18
Resource 2 for Question 1
Profile of Nordcom 1 and Nordcom 2
Nordcom 1
Strategically positioned between Woodlands Regional Centre and Seletar Regional Centre, Nordcom 1 is set to benefit from the Urban Redevelopment Authority’s (URA) Master Plan 2014 for Regional Centres to serve as vibrant liveable hubs for business and recreation.
Expect enhanced infrastructure following the growth of the North Region into a conduit for increased economic and human activity.
Synthesize the business capabilities of the modern factory and sleek character of modern office-like spaces – Nordcom 1 offers 130 factory spaces, with a unique product mix of ramp-up, flatted and 3-storey units. Unit sizes are from 1,658 to 6,039 sq ft, with high floor-to-floor heights of up to 6m. Loading & unloading access is also catered for 40-foot trucks.
Nordcom 2
Tap on Nordcom 2’s excellent locational advantages with its strategic location and enhanced connectivity to Sembawang and Admiralty MRT stations, major expressways and the upcoming North-South Corridor.
Welcome guests and clients alike to a space you're proud of. These B1-type units* support clean & light industries, and can be used for office-like operations such as design and development, as well as manufacturing, assembly and associated storage. Choose from ramp-up, flatted and 3-storey factory units with sizes from 1,636 sq ft to 5,888 sq ft. All 347 ensuite units are built to suit your requirements and designed with natural lighting and ventilation in mind.
The B1 industrial development is ready for immediate occupation.
* B1-type units are areas used or intended to be used for industry, warehouse, utilities and telecommunication uses for which the relevant authority does not impose a nuisance buffer (i.e. distance between industry and residential areas) greater than 50m. Source: Far East Organisation website for Nordcom 1 and 2

4
9751/02/IJC/SEP18
Resource 3 for Question 1
Collated results from survey conducted with 50 residents at HDB Sun Breeze and HDB Sun Natura
No Question To a large
extent To some
extent No impact
1 To what extent has the setting up of Nordcom 1 and 2 made an impact to your life?
5 20 25
Positive Neutral Negative 2 Has the impact been
largely positive or negative?
12 30 13
Yes No Not Sure
3 Has the presence of Nordcom 1 and 2 brought more income to the area?
1 4 45
Yes No Not Sure 4 Are you affected by the
noise or pollution generated from Nordcom 1 or 2?
7 25 18

5
9751/02/IJC/SEP18
Resource 4 for Question 2
Climate graph of Freetown, Sierra Leone
Source : https://en.climate-data.org/location/526/
Latitude of 8 degrees, North

6
9751/02/IJC/SEP18
Resource 5 for Question 2
Mass movements across the African Continent
The areas shaded in purple experience a “slight” mass movement potential, red and orange areas experience “moderate” potential, and yellow areas experience “severe” potential.
Source : https://www.earth.com/image/dangerous-massmovements-africa/

7
9751/02/IJC/SEP18
Resource 6 for Question 2
Location of Mass Movement that occurred in Sierra Leone
Legend
Warm Ocean Current Cold Ocean Current Sierra Leone Steeper Regions in the African Continent
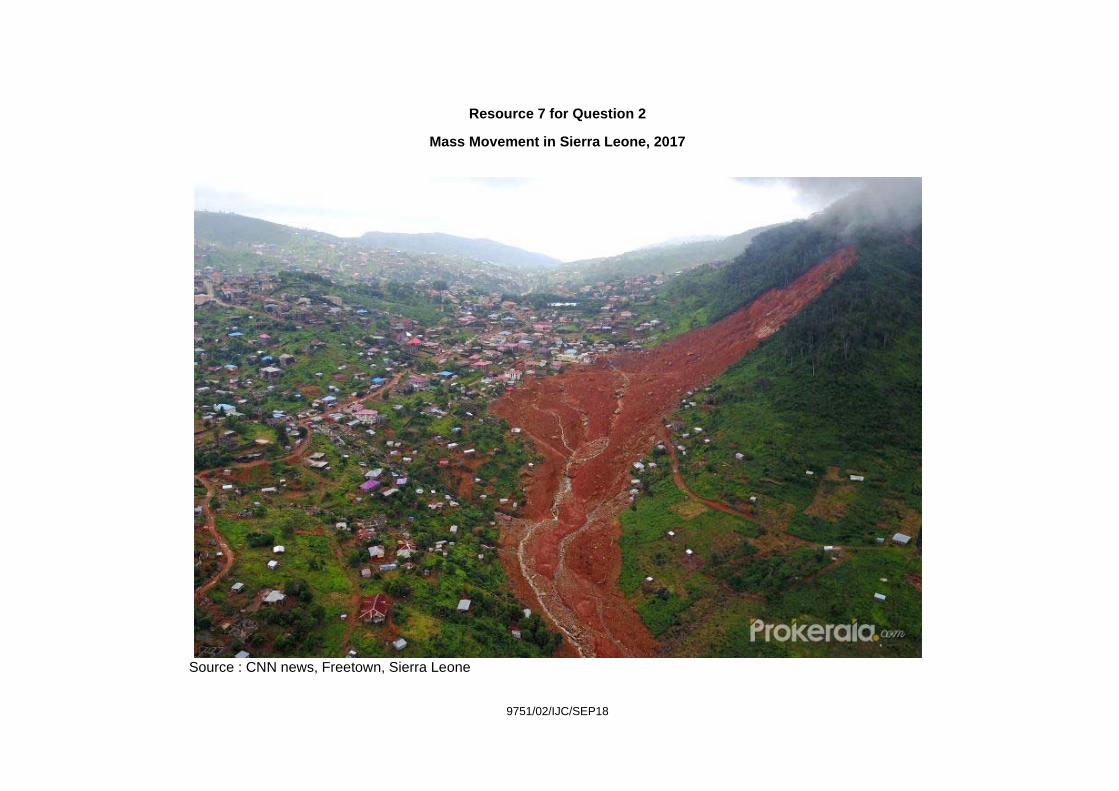
9751/02/IJC/SEP18
Resource 7 for Question 2
Mass Movement in Sierra Leone, 2017
Source : CNN news, Freetown, Sierra Leone

9751/02/IJC/SEP18
Resource 8 for Question 3
World Distribution of Coal Resources
Source : World Energy Council

10
9751/02/IJC/SEP18
Resource 9 for Question 3
9A : Coal Production in Million Tons between 1960 and 2010 in the US and China
Year Coal Production(US) Coal Production (China)
1960 410 500
1970 600 480
1980 800 600
1990 1100 1000
2000 1050 1100
2010 1050 3000
9B : Coal Consumption between US and China between 1965 to 2012

11
9751/02/IJC/SEP18
Resource 10 for Question 3
Degradation caused by coal mining in China

9751/02/IJC/SEP18
Resource 11 for Question 4
Map showing sources of world’s mismanaged plastic waste*
*Mismanaged waste means the material is littered or not properly disposed of. This can usually be attributed shortcomings in the waste management system.

9751/02/IJC/SEP18
Resource 12 for Question 4
Global plastic production and use
How plastic is used globally

14
9751/02/IJC/SEP18
Resource 13 for Question 4
News Article on Starbucks’ plan to eliminate plastic straws
Starbucks to eliminate plastic straws in stores globally by 2020
SEATTLE: By 2020, consumers will no longer be able to get single-use plastic straws at all Starbucks stores globally. This would apply to its more than 28,000 company operated and licensed stores, the coffee giant announced on Monday (Jul 9). Starbucks said it will make available strawless lids or straws made of other materials instead. “Starbucks has designed, developed and manufactured a strawless lid, which will become the standard for all iced coffee, tea and espresso beverages," the company said in a news release. "The lid is currently available in more than 8,000 stores in the United States and Canada for select beverages including Starbucks Draft Nitro and Cold Foam." In Asia, the lid is being piloted for Nitro beverages in markets such as China, Japan, Singapore, Thailand and Vietnam. For customers who prefer to have or need a straw, Starbucks said straws made of paper or compostable plastic will be available upon request - for their Frappuccino blended beverages. Source: Channel News Asia

INNOVA JUNIOR COLLEGE JC2 PRELIMINARY EXAMINATIONS in preparation for General Certificate of Education Advanced Level Higher 2
GEOGRAPHY Paper 2 Data Response Questions Additional Materials: Answer Paper 1 Insert
World outline map (optional)
9751/02
12 Sept 2018
3 hours
READ THESE INSTRUCTIONS FIRST Write your name and class on all the work you hand in. Write in dark blue or black pen on both sides of the paper. You may use a HB pencil for any diagrams or graphs. Do not use staples, paper clips, glue or correction fluid. Candidates answer all questions. You should make reference to appropriate examples studied in the field or the classroom, even where such examples are not specifically requested by the question. Diagrams and sketch maps should be drawn whenever they serve to illustrate an answer. The world outline map may be annotated and handed in with relevant answers. You are reminded of the need for good English and clear presentation in your answers. At the end of the examination, fasten Question 1 and 2 with a cover and Question 3 and 4 with another cover page. The number of marks is given in brackets [ ] at the end of each question or part question.
This document consists of 6 printed pages.
Innova Junior College [Turn over

2
9751/02/IJC/SEP18
Section A
Theme 4: Geographical Investigation
1 A group of 20, 18 year old students from a junior college in Singapore wanted to examine the
impact of industries on local communities. They have decided to study the impact of Nordcom 1 and Nordcom 2, which are two new light industrial areas located near a residential area in Woodlands. The students wanted to gather information on the impact of the industrial area on the residents living nearby, especially in terms of noise, pollution and economic impact. They were given one week to complete their investigation in August in 2018. The students then decided to divide themselves into four teams of 5. Two teams carried out their investigation in the newly completed residential areas, HDB Sun Natura and HDB Sun Breeze; and two other teams carried out their investigation in the residential areas further away. They have decided to carry out questionnaire surveys by approaching residents who were walking by the shops or at food establishments. The questions asked in the survey were:
• “To what extent has the setting up of Nordcom 1 and 2 made an impact to your life?” • “Has the impact been largely positive or negative?” • “Has the presence of Nordcom 1 and 2 brought more income to the area?” • “Are you affected by the noise or pollution generated from Nordcom 1 or 2?”
The investigation was conducted from 12pm to 1pm each day. Each group interviewed 25 residents in total. Resource 1 shows a map of the surrounding area of Nordcom 1 and 2. Resource 2 shows the profile of Nordcom 1 and 2, explaining the type of activities found in the area. Resource 3 shows the collated results from the questionnaire survey.

3
9751/02/IJC/SEP18
(a) With reference to Resources 1 and 2, suggest a suitable hypothesis for the investigation and explain two reasons why the research is at a suitable scale.
[3]
(b) With reference to Resource 1 and the context provided, suggest and describe a suitable sampling method for the investigation.
[3]
(c) Your group concluded that the method of data collection through the questionnaire survey may not be completely reliable and accurate. Explain how the process of data collection could be improved.
[7]
(d) Suggest one limitation of the data representation method shown in Resource 3 and sketch an alternative data representation method to show the perception of the residents on the extent to which the setting up of Nordcom 1 and 2 have made an impact to their lives.
[4]
(e) Evaluate the usefulness of the data shown in all the resources in helping students understand the impact of industries on local communities.
[8]

4
9751/02/IJC/SEP18
Section B
Theme 1: Tropical Environments
Mass Movement in Sierra Leone
2
Sierra Leone is located at 8o North of the African Continent. It is on the windward side of the Sugar Loaf Mountains. Freetown is the capital and largest city of Sierra Leone. Resource 4 shows the climate graph of Freetown, Sierra Leone. Resource 5 shows a satellite image of mass movements that have occurred across the African continent. Resource 6 shows the location of the mass movement that occurred in Sierra Leone. Resource 7 shows a photograph of the mudslide that occurred in Sierra Leone in 2017.
(a) Using Resource 4, state the probable climate of Freetown, Sierra Leone and account for its
characteristics.
[5]
(b) Using Resources 5 and 6 describe the relationship between topography and the different
degrees of mass movements in the continent.
[4]
(c) Using Resource 7, with the use of a well-labeled diagram, state the type of mass movement
that would have occurred and describe it. [4]
(d) Using Resources 6 and 7, explain the reasons for the mass movement. [5]
(e) Using all resources and your own knowledge, suggest reasons how the mass movement
would have affected the natural and human environments.
[7]

5
9751/02/IJC/SEP18
Theme 2: Development, Economy and Environment
Coal Mining and Production in China
3 China has one of the biggest coal resources in the world. It has 10% of its economy focusing on the primary, 44% on the secondary/manufacturing and 46% targeted at the tertiary industries, respectively. Resource 8 shows the distribution of coal resources in the world. Resource 9A shows the production and 9B shows the consumption of coal in the US and China. Resource 10 shows the degradation caused by coal mining in China.
(a) Using Resource 8, describe the distribution of coal resources in the world. [5]
(b) Using Resources 9A and 9B and your own knowledge, suggest reasons why China’s coal production has increased compared to that of the US.
[7]
(c) Using Resource 10, describe the impact of coal mining in China. [5]
(d) Using all resources and your own knowledge, evaluate whether China is affected by the
resource curse.
[8]

6
9751/02/IJC/SEP18
Theme 3: Sustainable Development
Climate Change in developing countries 4 Resource 11 shows a map of the world’s mismanaged waste.
Resource 12 shows the global plastic production and use from 1950-2015. Resource 13 shows an article on Starbucks’ plans to eliminate the use plastic straws globally by 2020.
(a) Describe the distribution of mismanaged plastic waste as shown in Resource 11. [3]
(b) Account for how the distribution of mismanaged plastic waste shown in Resource 11 may have changed after 2010.
[3]
(c) Explain how Resource 12 shows the linear nature of production, consumption and disposal of plastic waste.
[5]
(d) With reference to Resource 12 and 13, evaluate the effectiveness of eliminating use of single-use plastic straws at Starbucks stores in contributing to the global reduction of plastic waste.
[5]
(e) With reference to all resources and your knowledge, discuss the role of various stakeholders in minimizing the impact of plastic waste.
[9]

INNOVA JUNIOR COLLEGE JC2 PRELIMINARY EXAMINATIONS in preparation for General Certificate of Education Advanced Level
Higher 2
GEOGRAPHY
Paper 1 Structured Essay Questions Additional Materials: Answer Paper
World outline map
9751/01
27th August 2018
3 hours
READ THESE INSTRUCTIONS FIRST Write your name and class on all the work you hand in. Write in dark blue or black pen on both sides of the paper. You may use a HB pencil for any diagrams or graphs. Do not use staples, paper clips, glue or correction fluid. Answer three questions. One from each section. You should make reference to appropriate examples studied in the field or the classroom, even where such examples are not specifically requested by the question. Diagrams and sketch maps should be drawn whenever they serve to illustrate an answer. The world outline map may be annotated and handed in with relevant answers. You are reminded of the need for good English and clear presentation in your answers. At the end of the examination, fasten each section with a separate cover page and hand in. The number of marks is given in brackets [ ] at the end of each question or part question.
This document consists of 3 printed pages and 1 blank page.
Innova Junior College [Turn over

2
9751/01/IJC/AUG18
ANSWER SCHEME (PRELIM
EXAMINATIONS, 2018)

3
9751/01/IJC/AUG18
Section A – Tropical Environments
Answer one question from this section.
1 (a) With the aid of well-labelled diagrams, account for the variation in channel morphology in
the tropics. Suggested Answer
• To define Channel Morphology (The dimension (width, depth), shape and pattern (sinuous, meandering, straight) of a stream channel.)
• It is different in the Humid and Arid Tropics – Due to Climate (Temperature and Rainfall), Geology of the Soil/Land, Vegetation
• Students can use either Bradshaw or Schumm to explain the morphology of channels/rivers in the arid and humid regions. (Though the theories explain about movement from the upper to the lower courses, the factors like width, depth, gradient, velocity, discharge are to be considered for this answer)
Arid Humid Climate (High fluctuating or large diurnal range in the year with low precipitations eg: BWh and BSh – lesser than 500mm of rain per year)
Climate (Due to the location around equator temperatures do not fluctuate much, high precipitation but can have distinct precipitation/dry season eg: Af, Am and Aw)
Inputs are lower for the arid regions compared to the humid regions and this input affects the channel
For the Channel Morph in the arid region –ephemeral streams and tributaries (not permanent due to the high temperatures promoting evaporation – water tends to flow outwards (widely) thus higher surface area so the evaporation rates are higher. Lower discharges in the channel, channels can be shallower due to the lower discharges so the vertical and lateral erosion rates are much lower
In the humid region there is perennial tributaries, higher rainfall contributes to higher discharges and channels can be deeper due to vertical erosion. At the lower courses there will be more lateral erosion due to erosion of the banks. Channels are deeper due to higher discharges
The velocity of channel in the arid region will usually be lower due to the lower discharges – there will be higher friction thus reducing the speed at which the discharge flow. However, during periods of flash floods the velocity will increase due to high amounts of rainfall. This is also due to the fact that the land or soil is baked, and does not aloow for infiltration to occur so the overland flow is Horton and there will be high surface flow moving into the channels. In addition to that the vegetation is also low in the arid regions thus allow for overland flow to move quickly into the rivers.
Velocity will be high – high rainfall and discharges – more laminar flow rather than turbulent flows. Soil is also very porous and there is usually luxuriant vegetation so infiltration and interception rates and levels are high.
[12]

4
9751/01/IJC/AUG18
(b) "Discharge is the most important factor influencing channel patterns in the tropics."
Discuss.
[20] It is an important factor eg: Braided Channels – fluctuating discharge and for the
Meanders – Perennial. But other factors also – Load type and composition and also other pre-requisites eg: Leopold Langbein Students should be able to give evidence on how discharge makes a difference. There must be good explanation on how the type of discharge in the arid region (fluctuating discharge) and Am/Aw (distinct dry periods) brings about the formation of braided channel – So high discharge high erosion, transportation and low discharge high deposition. Diagrams must be drawn to show how the change in the discharge brings about the formation of features such as braid bars, submerging braid bars, flanking channels etc For the meandering channels – explain high discharges in the humid regions eg: Af so meandering – formation of cliffs and SOS. Explain the fluvial processes that form the features, use diagrams to enhance the answer. But there are other factors which are as important eg: Load type – how load types is different for meandering, higher percentages of clay while for braided there is a higher percentage of coarse load to form the more stabilized bars. Leopold and langbeing – pools and riffles for meanders are important. Diagrams are essential for this question.

5
9751/01/IJC/AUG18
2 (a) Using relevant diagrams, explain how wind erosion affects landforms in the hot and
arid tropics.
[12]
What is wind erosion – Aeolian processes of abrasion must be explained well and also the movement of the sand – saltation, suspension, creep etc. Erosion is different from weathering. Erosion must be clearly defined. Draw diagram/s – Yardang, Loess, Dunes – any 2 to be explained. Diagrams needed (Arid)
As for the Arid regions – low rainfall and fluctuating temperature brings about weathering processes that carve out various features example – thermal fracture, salt weathering. Water is important – Lut in Iran (Yardangs – undercutting by water)

6
9751/01/IJC/AUG18
(b) Assess the role played by climate in affecting the formation of landscapes in the humid tropics.
[20]
Climate is important – rainfall amounts and temperature in the humid regions – Karst, Van’t Hoff to be quoted. Show difference between the Af, Am and Aw. Show the difference in Rainfall and Temperatures. Explain the rate/type of weathering due to variation in climatic factors But other factors are important – Geology (type of minerals) eg: Granite – cavernous due to salt and also limestone – carbonation process. Show that even if Geology is the same for limestone, the fact that climate variations will either exacerbate or slow down the process of disintegration/breakdown of limestone. The rate of breakdown will vary Vegetation – how the density of vegetation is affected by climate. Sparse and Dense vegetation.

7
9751/01/IJC/AUG18
Section B – Development, Economy and Environment
Answer one question from this section
3 (a) Account for the emergence of the New International Division of Labour (NIDL). [12]
- New International Division of Labour : NIDL is the spatial separation of tasks and functions (for instance headquarters, R&D and branch plants) which may previously have been done on the same site or within one country.
- global scale, based on the law of comparative advantage. -
1. Technological Advancement
2. Change in Spatial Organisation of Relationships in Production
3. Rise and Growing Importance of Transnational Companies (TNCs)
4. Proliferation of supranational bodies encouraging trade liberalisation (Lecture 26)
5. State/Government Strategies: Economic zones set up by governments to attract Foreign Direct Investment (FDI)

8
9751/01/IJC/AUG18
(b) “Besides being a prime cause of poor economic growth, poor governance breeds corruption, which cripples investment, wastes resources, and diminishes confidence.” (Ahmed Zewail) To what extent do you agree that a country’s development is largely in the hands of the state?
[20]
Good to go with the focus of the question about states being important. Trade Policies, Investment Policies and examples of countries which have improved due to such clear policies. Eg: Singapore or South Korea But it is important to explain about countries not being able to develop eg: Nigeria, Myanmar etc, Then in these circumstances the command and control is taken over by the TNCs- So this is where the profit mindedness of TNCs will be explained in relation to the views and objectives of a state. The exploitation of TNCs, repatriation of profits etc to be explained. SOs also play a role in development – IMF and Argentina or WB giving out loans etc eg: Uganda. But conditions attached. Policies set are not suitable eg: PESO was capped at US$

9
9751/01/IJC/AUG18
4 (a) Explain the impact of privatisation of water resources in lower income countries. What is privatization of water? The pros and cons of privatizing water Who has privatized water (Material from Lecture 34)
[12]
Why Privatise
1. The appeal to the greater efficiency of private companies 2. The accusation of government failure in resource provision as a result of
underinvestment 3. Inefficient management and unresponsiveness to the needs of the poor 4. The argument that the present water supply ‘crisis’ can only be resolved
by private companies 5. Improvement, development and expansion of infrastructure, increasing
efficiency of water supply and distribution, development of technical expertise, securing funds to finance investments
6. Water should not be considered a public good because it could create even further inefficiencies in how water is distributed. People currently waste and take for granted water supplies. It exacerbated the drought situation in California. If water is considered a public good, it could mean less efficient distribution of water based on regional need and resources.
7. It cannot be denied that water is essential to every aspect of human life but the provision of it is costly. Water needs to be treated before it is fit for human consumption and it is distributed to individuals using costly infrastructure. These come at a cost. As such, it is rather unfair for people to want to benefit from the provision of clean and safe water but are unwilling to pay for it.

10
9751/01/IJC/AUG18
(b) “As I travel around the world, people think the only place where there is potential conflict over water is the Middle East, but they are completely wrong. We have the problem all over the world.” (Kofi Anan). To what extent do you agree that water conflicts are not only experienced by many countries but are becoming more difficult to solve.
[20]
Students must answer if conflicts are becoming more difficult to solve – Why? Lack of
water, TNCs exploitation, Weather issues, Droughts, Cyclones, Water is polluted, Not
cleaning it, increasing population. In ability to compromise due to all the above
demands within a country so transboundary rivers face issues.
All the above to be explained in relation to case studies.

11
9751/01/IJC/AUG18
Section C – Sustainable Development
Answer one question from this section
5 (a) Explain the effects of climate change on sustainable development of countries at lower levels of development.
[12]
Indicative content Candidates should make reference to the effects of climate change on the economy, society and environment. Examples should be used to illustrate the effect in countries of low levels of development, especially Small Island Developing States (SIDS). There must be links made to how these effects can affect sustainable development of countries. A higher level response should elaborate clearly on both the negative and possible positive effects of climate change in the various dimensions. Candidates would have shown how the effects of climate change can worsen over time, and bring in issues pertaining to vulnerability of certain groups of people and make links to sustainable development. Levels marked using H1 generic level descriptors for 9m SEQ sub-part (a)
(b) Assess the effectiveness of mitigation and adaptation strategies in combating the
negative effects of climate change.
[20] Indicative content
Responses should elaborate on the various mitigation and adaptation strategies and discuss its effectiveness in adapting to the impact of climate change. The strategies discussed should be at varying scales (i.e. global scale, national scale, individual scale) and there should be clear criterion on the assessment of the effectiveness of these strategies (i.e. whether it reduces GHG emissions, whether it reduces the impact of effects as a result of sea level rise). There should be mention of specific examples and empirical evidence to support the assessment. A higher level response an understanding that a variety of strategies need to be employed by countries in order to manage the impact of climate change. There is an understanding of scale: that climate change is a global problem that require global solutions, but at the same time also require a change at the national and individual level. There is an appreciation of climate change being a problem that needs a long period of time to resolve, and that implementation of effective strategies can be hampered by economic and political factors. Possible links to other topics include tropical climates (Topic 1.1), flooding (Topic 1.2), development, structure of the economy and role of the state (Topic 2.1). Levels maked using H2 generic level descriptors for 20m SEQ sub-part (b)

12
9751/01/IJC/AUG18
6
(a)
(b)
Explain why urban traffic congestion occurs in countries at low levels of development. High population Crowded Urban planning is weak (strong center) Lack of distribution of activities to the outskirts of city Rural to urban migration is high To what extent have strategies to ease traffic congestion in cities been effective?
[12]
[20]
ERP/COE Private car owning is expensive (Singapore n London – Place) Better/Efficient/Affordable Public transport Pple choose to travel (Singapore Before with MRT and Today with problems – Time) (Curitiba Vs Rio – Difference in size of city affects scale of success) Urban Planning Weak centre and distribution to the rest of the region. (Working on the Environment)

13
9751/01/IJC/AUG18

NNOVA JUNIOR COLLEGE JC2 PRELIMINARY EXAMINATIONS in preparation for General Certificate of Education Advanced Level Higher 2
GEOGRAPHY Paper 2 Data Response Questions Additional Materials: Answer Paper 1 Insert
World outline map (optional)
9751/02
14Sept 2018
3 hours
READ THESE INSTRUCTIONS FIRST Write your name and class on all the work you hand in. Write in dark blue or black pen on both sides of the paper. You may use a HB pencil for any diagrams or graphs. Do not use staples, paper clips, glue or correction fluid. Candidates answer all questions. You should make reference to appropriate examples studied in the field or the classroom, even where such examples are not specifically requested by the question. Diagrams and sketch maps should be drawn whenever they serve to illustrate an answer. The world outline map may be annotated and handed in with relevant answers. You are reminded of the need for good English and clear presentation in your answers. At the end of the examination, fasten all your work securely together. The number of marks is given in brackets [ ] at the end of each question or part question.
This document consists of 5 printed pages.
Innova Junior College [Turn over

2
9751/02/IJC/SEP17

3
9751/02/IJC/SEP17
Answer Scheme H2/P2

4
9751/02/IJC/SEP17
Section A Theme 3: Geographical Investigation
1 A group of 20 18 year old students from a junior college in Singapore wanted to examine the impact of industries on local communities. They have decided to study the impact of Nordcom 1 and Nordcom 2, which are two new light industrial areas located near a residential area in Woodlands. The students wanted to gather information on the impact of the industrial area on the residents living nearby, especially in terms of noise, pollution and economic impact. They were given one week to complete their investigation in August in 2018. The students then decided to divide themselves into four teams of 5. Two teams carried out their investigation in the newly completed residential areas, HDB Sun Natura and HDB Sun Breeze; and two other teams carried out their investigation in the residential areas further away. They have decided to carry out questionnaire surveys by approaching residents who were walking by the shops or at food establishments. The questions asked in the survey were:
• “To what extent has the setting up of Nordcom 1 and 2 made an impact to your life?” • “Has the impact been largely positive or negative?” • “Has the presence of Nordcom 1 and 2 brought more income to the area?” • “Are you affected by the noise or pollution generated from Nordcom 1 or 2?”
The investigation was conducted from 12pm to 1pm each day. Each group interviewed 25 residents in total. Resource 1 shows a map of the surrounding area of Nordcom 1 and 2. Resource 2 shows the profile of Nordcom 1 and 2, explaining the type of activities found in the area. Resource 3 shows the collated results from the questionnaire survey.
(a) With reference to Resources 1 and 2, suggest a suitable hypothesis for the investigation and explain two reasons why the research is at a suitable scale.
[3]
• The residents living nearest to Nordcom 1 and Nordcom 2, in Sun Natura and
Sun Breeze, will face greater impact from the industrial areas compared to the residents living in residential areas further away. [1]
• Any two: o Enough manpower to conduct investigation. 20 students broken into four
teams of 5. o Given time of one week is sufficient and manageable. o Area given is manageable, with the furthest residential area about 400m
away from Nordcom 1 and 2.

5
9751/02/IJC/SEP17
(b) With reference to Resource 1 and the context provided, suggest and describe a
suitable sampling method for the investigation.
[3]
From notes: o simple random sampling: giving each member of the population an equal
chance of being selected for the investigation (e.g. rolling a dice and selecting from a list of possible questionnaire respondents)
o systematic random sampling: selecting every kth element of the sampling frame, beginning with a randomly chosen point (e.g. selecting the 9th person from an ordered list of respondents to interview)
o stratified random sampling: selecting a simple random sample from given subgroups in the population (e.g. randomly select 5 focus group participants from different age cohorts)
(c) Your group concluded that the method of data collection through the questionnaire survey may not be completely reliable and accurate. Explain how the process of data collection could be improved.
[7]
Possible points (must be linked to accuracy/reliability) • HDB Sun Natura and HDB Sun Breeze are newly completed (Sun Natura in
mid 2018) and the residents may not have lived in the area long enough to truly gauge the impact of Nordcom 1 and 2, as shown in responses to Q3 as well questionnaire survey could take note of how long they have lived in the area
• Similarly, Nordcom 2 is only ready in Dec 2018, which means that the residents may not be able to truly appreciate the impact of having Nordcom 2 in the area, especially in terms of positive impact could have chosen a different location with a more established industrial area
• Questions too vague - may not truly reflect the impact felt to residents in the area could have probed to asked for examples on how the area has left an impact
• 12pm – 1pm on weekdays would mean that the results would mostly come from elderly residents who are unemployed, or adults who are not working, such as housewives. Therefore, may not be able to get representative data. could have conducted it on weekends or at different times of the day.
• Sample size might be too small to get a representative conclusion (as also seen in Resource 3) the team could have increased the sample size

6
9751/02/IJC/SEP17
Level Marks Descriptors3 6-7 Response demonstrates accurate knowledge of survey
collection methods, issues with both accuracy and/or reliability of these and relevant improvements. Reflects a good understanding of the context of the investigation and of data collection techniques.
2 3-5 Response demonstrates good knowledge of survey collection methods. Provides an explanation of issues relating to reliability and/or accuracy with some reference to possible improvements. Some of the responses may focus on generic fieldwork issues and improvements may not be relevant to the context of the investigation.
1 1-2 Response shows some knowledge of survey collection methods. Some reference is made to issues with reliability and/or accuracy but may recommend irrelevant or inappropriate improvements or provide inaccurate explanation of methods. Response may be of limited relevance to the given context.
0 0 No creditworthy response.
(d) Suggest one limitation of the data representation method shown in Resource 3 and sketch an alternative data representation method to show the perception of the residents on the extent to which the setting up of Nordcom 1 and 2 have made an impact to their lives.
• Table – difficult to compare visually • Any suggested data representation method that would allow for easy visual
comparison. Must include: o 1m title o 1m accuracy of data o 1m labelling
[4]
(e) Evaluate the usefulness of the data shown in all the resources in helping students
understand the impact of industries on local communities. Possible points for usefulness (all these need elaboration):
• R1 – useful to show the distance between residential areas and industrial areas.
• R2 – useful to understand the activities that goes on in Nordcom 1 and 2 and potential impact
• R3 – useful to understand perception of impact for areas closer to industrial area
[8]

7
9751/02/IJC/SEP17
Possible points for not useful: • Findings are too vague, difficult to come to a conclusion, especially without
the data for findings at residential areas further away. • Requires more details to appreciate true impact of industries on local
communities. • Covers general economic impact (only income) and environmental impact
(noise and pollution), but how about social impact, such as job opportunities, or other economic impact such as cost of living? Other impact such as heavy traffic, which can affect time taken to travel especially during peak hours, or safety concerns?
Theme 3: Climate Change and Energy
Climate Change in developing countries
4 Resource 11 shows a map of the world’s mismanaged waste. Resource 12 shows the global plastic production and use from 1950-2015. Resource 13 shows an article on Starbucks’ plans to eliminate the use plastic straws globally by 2020.
(a) Describe the distribution of mismanaged plastic waste as shown in Resource 11.
• [general] Higher in LDCs compared to DCs
[specific - high] Highest in Asia – China (8.8 million), Philippines (1.9 million), Vietnam (1.8 million)
• [specific - low] Lower in developed regions such as Europe and North America – Eg: European countries (generally all lower than 0.5 million), US (0.3 million)
[3]
(b) Account for how the distribution of mismanaged plastic waste shown in Resource 11
7-8

8
9751/02/IJC/SEP17
may have changed after 2010. • With growing affluence, there might be greater consumption and industrialisation
compared to before 2010, therefore, there might an increase in plastic waste in general, leading to a subsequent increase in mismanaged plastic waste.
• However, after 2010, some of the countries may have improved their waste management systems, in which plastic is properly disposed of or recycled, instead of littered and polluting the global waters.
• This may lead to a lower total amount of plastic waste in global waters after 2010.
[3]
(c) Explain how Resource 12 shows the linear nature of production, consumption and
disposal of plastic waste.
[5]
Note – definition in notes: Linear metabolism refers to a process where raw materials are extracted, combined and processed into consumer goods that eventually end up as rubbish that is rarely reabsorbed into living nature. • [How R12 shows it – shows understanding of linear metabolism] Resource 12
shows the linear nature of production, consumption and disposal of plastic waste as most of the plastic produced is disposed after one use and is not reabsorbed into living nature.
• [production] Resource 12 shows that out of 8.3 billion tonnes of virgin plastic produced, only 2.6bt is still in use (virgin plastic and recycled), and the rest disposed.
• [consumption] Most of the plastic is used for packaging, with 150 million tonnes out of 400 tonnes (37.5%).
• [disposal – after single use] 5.3 billion tones of plastic are immediately disposed after single use, with 0.7bt incinerated and the remainder (4.6bt) discarded.
• [disposal – after recycling] Even out of the 0.5bt of plastic that has been recycled, only 0.1.bt are recycled and still in use, with 0.4bt eventually being incinerated or discarded as well.
(d) With reference to Resource 12 and 13, evaluate the effectiveness of eliminating use of single-use plastic straws at Starbucks stores in contributing to the global reduction of plastic waste. Effective – Reduces single use disposables and therefore reduces the amount of plastics used. Resource 12 shows that most plastic are used for packaging. Therefore, by directly reducing single use disposables like straws or by providing alternative, more eco-friendly options as described in Resource 13, the impact is reduced. Not effective – However, the alternative strawless lids is also made of plastic and is also a large contributor to plastic waste. This makes it less effective as opposed to promoting recycling. For example, Starbucks could encourage more of its
[5]

9
9751/02/IJC/SEP17
consumers to bring their own cups or purchase reusable cups. As shown in Resource 12, only 0.5b tons of plastic is recycled out of 8.3bt. Therefore, with the encouragement of using reusable cups, this impact can be reduced. Level Marks Descriptors
3 5 Response demonstrates a clear knowledge and understanding of the context in the question. Source(s) is well used to support the response. Provides a logical and well-developed evaluation well founded on evidence and/or different viewpoints.
2 3-4 A satisfactory response which is generally sound and contains relevant points, but may not always focus on the context in the question. Source(s) is used to support parts of the response. Provides an evaluation, which may be limited in depth and sufficient elaboration in some parts.
1 1-2 Response demonstrates poor understanding of the context in the question. Source(s) is not used or not accurately used to support the response. Provides little or no evaluation
0 0 No creditworthy response.
(e) With reference to all resources and your knowledge, discuss the role of various stakeholders in minimizing the impact of plastic waste.
[9]
• Resource 10
o Role of state in providing sufficient infrastructure and regulation o Role of industries to ensure that waste is properly disposed of
• Resource 11 o Role of individuals and companies to reduce single use plastic and to
encourage greater recycling. • Resource 12
o Role of companies in reducing single use plastic. o Role of consumer in providing demand for such goods to reduce impact
of plastic waste – affect how companies make decisions in production to meet the needs of the consumer.
• Own knowledge: o Role of International Organisations to impose global regulations on
pollution. o Role of NGOs to create awareness and work with other stakeholders to
find solutions to the problem of plastic waste pollution.

10
9751/02/IJC/SEP17

11
9751/02/IJC/SEP17
Theme 1 : Tropical Environments
Mass Movement in Sierra Leone
2
Sierra Leone is located at 8o North of the African Continent. It is on the windward side of the Sugar Loaf Mountains. Freetown is the capital and largest city of Sierra Leone. Resource 4 shows the climate graph of Freetown, Sierra Leone at latitude 8o North . Resource 5 shows a satellite image of mass movements that have occurred across the African continent. Resource 6 shows the location of the mass movement that occurred in Sierra Leone. Resource 7 shows a photograph of the mudslide that occurred in Sierra Leone in 2017.
(a) Using Resource 4, state the probable climate of Freetown, Sierra Leone and account for its
characteristics. - Am climate - High rainfall of 3027mm - Near the coast and is at 8 degrees North so the full impact of the Monsoons will be
experienced due to close proximity to the Atlantic Ocean - Temperatures almost uniform with low diurnal range in the year due to its equatorial - Distinct wet period for 4 months, when the monsoons (African) comes in
[5]
(b) Using Resources 5 and 6 describe the relationship between topography and the different
degrees of mass movements in the continent.
[4]
- Positive relationship - When there is high topography there are more serious mass movements as shown
by the yellow purple shading in Resource 7 - As one moves away from the high relief (mountains or hills) the degree of mass
movements reduce - Most of the coastal regions seem to have higher degrees of mass movements
compared to the inner regions. Coastal regions that are at the windward side of the mountains seem to have higher degrees of mass movements
- Eventhough there are many mountains in the middle of the African continent – the degree of mass movements tends to be lesser. This seems to be an anomaly

12
9751/02/IJC/SEP17
(c) Using Resource 7, with the use of a well-labeled diagram, state the type of mass movement that would have occurred and describe it.
[5]
- Debris Flow or Slide (Can be both) - - Many rills showing evidence of flow of water - Loose mud, sand, soil and rock with a lot of water. Traveling down the slope - Spread out at the foot of the hill
Debris slides and debris flows are triggered in steep terrain in connection with heavy rain and/or rapid snowmelt. Human encroachment on steep slopes may increase the risk of debris collapses and subsequent and debris flows. Debris slides, debris flows and debris floods are different, but partly overlapping, terms for a process where debris on a slope collapses and suddenly, or with a gradual acceleration, is transported down the slope. The initial collapse usually occurs on slopes steeper than 25 degrees. With increasing water content, the initial debris slide can pick up speed and develop into a debris avalanche or debris flow.

13
9751/02/IJC/SEP17
(d) Using Resources 6 and 7, explain the reasons for the mass movement. [4]
- Steepness (topography), gravitational pull, shear stress (res 6) - Heavy rainfall induced by the coastal region, ITCZ, warm ocean currents - Deforested land, many developments, steep, stability of the slope is affected
(e) Using all resources and your own knowledge, suggest reasons how the mass movement would have affected the natural and human environments.
[7]
- Res 4 –rainfall is high, monsoon, loosening of the soil, as seen in Res 7 – also
deforestation, cohesiveness of the soil is affected greatly. - Trees / Biodiversity affected - Rivers affected, Res 6 - Dangerous living conditions especially the yellow regions, liveability reduces as seen
in Res 5 - Sierra Leone, Freetown is an example of how pple could have been affected socially
– living region, clustered, death, economic activity affected (6 and 7)

14
9751/02/IJC/SEP17
Theme 2 : Development, Economy and Environment
Coal Mining and Production in China
3 China has one of the biggest coal reserves in the world. It has 10% of its economy focusing on the primary, 44% on the secondary/manufacturing and 46% targeted at the tertiary industries, respectively. Resource 8 shows the distribution of coal resources in the world. Resource 9 shows the production and consumption of coal in the US and China. Resource 10 shows the degradation caused by coal mining in China.
(a) Using Resource 8, describe the distribution of coal resources in the world. [5]
• There is a need to describe both the AMOUNT and Quality of coal resources’ distribution. And observe a pattern/trend/relationship in the resource available.
• Whether describing amount or quality, you have to look for the general trend and then provide supporting evidence or anomaly.
• In terms of amount, you can choose to RANK from highest to lowest the amount of resource availability (just a few countries) or the highest and the lowest. US has the most coal resource in the world, at 237 billion tonnes (do not forget the unit of measurements), followed by Russia at 157 billion tonnes and China at 115 billion tonnes. To make sense of the above, mention that the 3 countries together has close to 60% of the world total.
• Or for amount, you can make reference to the countries with the highest and lowest coal reserves. US has the highest coal reserves in the world at 237 billion tonnes, and Serbia (not Siberia) has the lowest at 14 billion tonnes amongst the 10 countries.
• Or you could have noted that there is a higher concentration of coal reserves in the northern hemisphere than the southern hemisphere. Coal reserves in the south make up only 107 billion tonnes and is less than 1/8 of the world total. And the 2 countries in the southern hemisphere with coal resources are South Africa and Australia.
• For quality, there are 2 types - Lower quality and higher quality (there are just too many who read the 2 wrongly). Also do note whether you are referring to absolute or relative amount. For instance, US may have a lower relative amount of higher quality coal, but the absolute total amount of higher quality coal -approximately 100 billion tonnes - is still one of the highest in the world. There is a higher proportion of lower quality coal than higher quality coal in Germany, US and Russia and Serbia and Ukraine. In the case of Germany 100 percent is low quality.
• Other countries have higher percentage of higher quality of coal. They are Kazakhstan, India, China and Australia. In South Africa, 100 % of the coal resources are higher quality.
• And to form some sort of relationship, it is important to note that countries with the greater amount of coal resources may not have higher quality coal. For instance US, Russia, and Australia, more than half of the reserves are lower quality coal. The exception is China where slightly less than half of the coal is of lower quality. In South Africa and Kazakhstan, where the coal reserves are smaller (less than 50 billion tonnes), a significant share of the coal resources are of higher quality. In Kazakhstan, close to half is of higher quality. Or you

15
9751/02/IJC/SEP17
could have noted that DCs may have proportionately more lower quality coal. For example, US, Germany, Australia. And LDCs seem to have more higher quality coal. For instance, South Africa, Inda and Khazakhstan.
Comments • The failure to observe certain trends/ pattern/ relationship is most common
amongst candidates. Many merely listed whatever comes to mind. Attempt to make comparison between DCs and LDCs or Northern and Southern Hemisphere can be a good starting point.
• Redundant statement to start the essay, such as “there is a spatial distribution of coal resources in Resource 8”. BTW, ‘Resource 8’ has to be spelt with Capital R.
(b) Using Resources 9A and 9B and your own knowledge, suggest reasons why China’s
coal production has increased compared to that of the US.
[7]
• Can look at reasons as consumption or demand driven, policy driven, environmentally driven, economically driven and political driven ones. A good answer should attempt to look at the reasons from different angles and to consider both China and US in your explanation.
• Resource 9A shows that China’s coal production has increased relative to US’s. The coal production in 1960 was comparable between the two countries at 400-500 million tons. But by 2010, coal production in China is 3 times more than that of US. This increase in production corresponds with the increase in coal consumption in China and US. It is noteworthy that about half of Chinese’s coal produced or about 1300 million tons are being consumed internally. Whereas, in US, less than half of the US’s coal or 700 million tons are consumed internally. Both countries are coal exporters.
• Due to rising affluence, rising population, China experienced an increased demand for energy resources, and hence the increase production of coal to meet these demands. Resource 9B shows the increase in consumption internally but for the US it has been hovering at 200-400 million tons (demand-driven) [Note that China’s population increase is not enough to account for the more than 3 times increase in coal demand after 2000, for the population increase is far less than 3 times over the same period.]
• China is also undergoing industrialization, hence fueling the need to extract more coal resources to meet the demands of its manufacturing sector. Coal is used both as an energy source as well as raw materials in the manufacturing sector. On the other hand, US is undergoing deindustrialation and the closure of factories may mean the decline in need for coal as a resource and raw materials. (demand-driven) [Many have difficulties identifying the key concepts of industrialization and deindustrialization]
• Due to WTO entry, China could have entered into more favourable trade pacts to export more coal. Also, more TNCs are encouraged to shift to China, driving up the need for coal resources. The significant increase in coal production and consumption after 2000 corresponded with China’s WTO entry in 2001 (policy-driven)
• Coal is afterall a cheapest form of energy option and hence it remains the favourite choice for a less developed country such as China. On the other hand, more Americans could have switched to cleaner form of energy which may also be more expensive in DCs with higher labour cost for coal extraction. In US,

16
9751/02/IJC/SEP17
the demand for coal has dropped from 2005, implying that coal is less favourable than other cleaner energy sources (economic or cost-driven reason)
• US could have pushed for the switch to cleaner and renewable energy resources, such as wind, solar and water. And there is a reduced demand for coal (environmentally-driven reason) Comments
• There is a need to refer to Resources 9A and 9B, but do note that the 2 Resources do not provide specific reasons. They only help to justify the above reasons for the increase production of coal.
There (c) Using Resource 10, describe the impact of coal mining in China. [5]
• The angle taken in answering the question is important. Do not merely read off what you see in picture, e.g, “The photos above in Resource 10 shows… land degraded by ….” Instead you should be saying “coal mining has led to land degradation as shown in Resource 10. The land was cleared and removed of the precious topsoil, making the land highly vulnerable to mass movement…ground water leached toxic compounds and are ingested by the local population contributing to health risks” [Note the questions didn’t ask you to read off what you see in the photographs]
• Some possible impacts – air and water pollution – Release of GHGs affecting the atmospheric and hydrological systems, social Issues – Health, Land Degradation (National Environment), Biodiversity of Fauna and Flora affected
• Many have difficulties with the second photograph and discuss the indirect impact of coal mining, saying how the factories combust coal resources to give off air pollution etc. Besides the potential health risks from combustion of coal, also consider how miners inhale the particulate matters during coal extraction and suffered from respiratory diseases.
• Coal mining factories? Just too many refer to coal mining factories? They are either coal mines or coal processing factories.
• Negative benefits? Please use only negative impact or positive impact.
(d) Using all resources and your own knowledge, evaluate whether China is affected by the resource curse.
[8]
• Begin by defining resource curse. Resource curse also known as the paradox
of plenty, refers to the paradox that countries with an abundance of natural resources (like fossil fuels and certain minerals), tend to have less economic growth, less democracy, and worse development outcomes than countries with fewer natural resources. This often involved the resource rich countries being exploited by the DCs which import the resources.
• There is evidence showing that China is one of the top ten producers of coal in the world (Resource 8). So there is abundant resource in China, and China qualifies as a resource-rich country and Resource 9A and 9B show that there is high production (which could have arisen due to high demand) and consumption (usage) of coal in the country. So it means that the demand for the resource may be high. It could be used heavily by manufacturing industries as China is a workshop of the world. It has a high percentage of manufacturing or secondary

17
9751/02/IJC/SEP17
industries in the country which demands for coal (own knowledge) and locally it may be demanded greatly due to electricity needs etc. The coal has been tapped on to the advantage of the Chinese economy such that there is little evidence to suggest that China has been cursed by the abundant coal resource.
• Yet, the degradation shown in Resource 10 shows vast amounts of land which have degraded due to the extraction of coal and the pollution that occurs and affects the people. So it looks as if China may be facing the Resource Curse. The coal resources have made the people worse-off socially and environmentally.
• Based on contextual knowledge, it is to be noted that China is advancing rapidly economically as more TNCs are moving out of the country to invest in other countries, it is greatly revered as a manufacturing giant in the world. Every country seem to want to invest in China due to its attractive national policy on trade and finance. China not only has coal but other resources like oil and minerals. It is also moving slowly into the tertiary industry, having many service oriented industries especially in the SEZs eg: Pudong.
• China has a stable government. It has seen economic growth in recent years. And is part of the WTO and has FTAs with many countries like the US, India and Singapore. Being that the case it seems that China has diversified well enough not to be affected by the Resource Curse.
• Marks are awarded for fair EVALUATION of the issue. There is also a need to extract relevant information from the Resources and contextual knowledge to back up your answer.

18
9751/02/IJC/SEP17
Level Marks Descriptors
3 7-8 Responses demonstrates a clear knowledge and
understanding of the context in the question. Uses relevant, detailed and accurate factual information and conceptual understanding. Reflects strong critical thinking skills and may include perceptive insights for the strongest responses. Source(s) is well used to support the response. -Provides a logical and well developed evaluation well founded on evidence and/or different viewpoints. Or -Makes a decision which clearly addresses different elements of the issue/or interests of different stakeholders.
2 4-6 A satisfactory response which is generally sound and contains relevant points, but may not always focus on the context in the question. Uses factual information and conceptual understanding that is generally appropriate to the given context but lacks detail and may contain some inaccuracies. Displays general critical thinking skills. Source(s) is used to support parts of the response. -Provides an evaluation, which may be limited in depth and sufficient elaboration in some parts Or -Shows some attempt to address different elements of the issue and views of different stakeholders when making a decision but is not well developed.
1 1-3 Responses shows a poor understanding of the context in the question. Uses basic factual information and conceptual understanding which had some but limited relevance to the question, Source (s) is not used or not accurately used to support the response. -Provide little or no evaluation Or -Evidence of decision making, if present is simple and may be flawed
0 0 No creditworthy response

19
9751/02/IJC/SEP17
Theme 3: Climate Change and Energy
Climate Change in developing countries
4 Resource 11 shows a map of the world’s mismanaged waste. Resource 12 shows the global plastic production and use from 1950-2015. Resource 13 shows an article on Starbucks’ plans to eliminate the use plastic straws globally by 2020.
(a) Describe the distribution of mismanaged plastic waste as shown in Resource 11.
• [general] Higher in LDCs compared to DCs
[specific - high] Highest in Asia – China (8.8 million), Philippines (1.9 million), Vietnam (1.8 million)
• [specific - low] Lower in developed regions such as Europe and North America – Eg: European countries (generally all lower than 0.5 million), US (0.3 million)
Comments • Is it even appropriate to say that US has the leaset mismanaged waste when
there are many countries without mismanaged wastes.
[3]
(b) Account for how the distribution of mismanaged plastic waste shown in Resource 11
may have changed after 2010. • Need to offer both the potential increase and decrease, and to look beyond just
China’s.
• With growing affluence, there might be greater consumption and industrialisation compared to before 2010, therefore, there might be an increase in plastic waste in general, leading to a subsequent increase in mismanaged plastic waste.
• However, after 2010, some of the countries may have improved their waste management systems, in which plastic is properly disposed of or recycled, instead of littered and polluting the global waters.
• This may lead to a lower total amount of plastic waste in global waters after 2010.
[3]
(c) Explain how Resource 12 shows the linear nature of production, consumption and
disposal of plastic waste.
[5]
Note – definition in notes: Linear metabolism refers to a process where raw materials are extracted, combined and processed into consumer goods that eventually end up as rubbish that is rarely reabsorbed into living nature. • [How R12 shows it – shows understanding of linear metabolism] Resource 12
shows the linear nature of production, consumption and disposal of plastic waste as most of the plastic produced is disposed after one use and is not reabsorbed

20
9751/02/IJC/SEP17
into living nature. Then provide appropriate data/statistics to backup the response.
• [production] Resource 12 shows that out of 8.3 billion tonnes of virgin plastic produced, only 2.6bt is still in use (virgin plastic and recycled), and the rest disposed.
• [consumption] Most of the plastic is used for packaging, with 150 million tonnes out of 400 tonnes (37.5%).
• [disposal – after single use] 5.3 billion tones of plastic are immediately disposed after single use, with 0.7bt incinerated and the remainder (4.6bt) discarded.
• [disposal – after recycling] Even out of the 0.5bt of plastic that has been recycled, only 0.1.bt are recycled and still in use, with 0.4bt eventually being incinerated or discarded as well.
Comments : • Many don’t understand linear nature of production, consumption and disposal
and merely read off all the data, without highlighting that there is limited to no recycling. And some even went on to talk about the plastics for packaging, building and construction, hence little credit can be given for the lack of understanding for the concept.
(d) With reference to Resource 12 and 13, evaluate the effectiveness of eliminating use of single-use plastic straws at Starbucks stores in contributing to the global reduction of plastic waste. • Note the command word of the question, hence a one-sided answer will not be
given the full credit. • Effective – Reduces single use disposables and therefore reduces the amount of
plastics used. Resource 13 shows that Starbucks has more than 28000 stores worldwide, implying that the scale of the impact can be extensive. Resource 12 shows that most plastic are used for packaging. Therefore, by directly reducing single use disposables like straws or by providing alternative, more eco-friendly options as described in Resource 13, the impact is reduced.
• Not effective – However, the alternative strawless lids is also made of plastic and
is also a large contributor to plastic waste. This makes it less effective as opposed to promoting recycling. For example, Starbucks could encourage more of its consumers to bring their own cups or purchase reusable cups. As shown in Resource 12, only 0.5b tons of plastic is recycled out of 8.3bt. Therefore, with the encouragement of using reusable cups, this impact can be reduced.
Level Marks Descriptors
3 5 Response demonstrates a clear knowledge and understanding of the context in the question. Source(s) is well used to support the response. Provides a logical and well-
[5]

21
9751/02/IJC/SEP17
developed evaluation well founded on evidence and/or different viewpoints.
2 3-4 A satisfactory response which is generally sound and contains relevant points, but may not always focus on the context in the question. Source(s) is used to support parts of the response. Provides an evaluation, which may be limited in depth and sufficient elaboration in some parts.
1 1-2 Response demonstrates poor understanding of the context in the question. Source(s) is not used or not accurately used to support the response. Provides little or no evaluation
0 0 No creditworthy response.
(e) With reference to all resources and your knowledge, discuss the role of various stakeholders in minimizing the impact of plastic waste.
[9]
• Stakeholders worth considering include government, TNCs, individual, non-
governmental organisation (such as Greenpeace), media. It is most ideal to organise the paragraphs via the different stakeholders, ie., one for government, one for individuals etc.
• You can extract from the Resources the role of the stakeholders below. • Resource 10
o Role of state in providing sufficient infrastructure (landfills) and regulation o Role of industries to ensure that waste is properly disposed of
• Resource 11 o Role of individuals and companies to reduce single use plastic and to
encourage greater recycling. • Resource 12
o Role of companies in reducing single use plastic. o Role of consumer in providing demand for such goods to reduce impact
of plastic waste – affect how companies make decisions in production to meet the needs of the consumer.
• And from contextual knowledge, you can also observe the followings : o Government can through campaigns raise environmental awareness. o Individuals can make the efforts to reduce the use of plastic bags and
plastic cups etc. o Role of International Organisations to impose global regulations on
pollution. o Role of NGOs to create awareness and work with other stakeholders to
find solutions to the problem of plastic waste pollution. o Media can publicise the issue or even identify culprits of the
environmental degradations.

22
9751/02/IJC/SEP17

[Turn over
JURONG JUNIOR COLLEGE JC2 PRELIMINARY EXAMINATION 2018
GEOGRAPHY
Higher 2 9751/01
Paper 1 29 August 2018
3 hours
READ THESE INSTRUCTIONS FIRST Write your name and class on all the work you hand in. Write in dark blue or black pen. You may use a soft pencil for any diagrams, graphs or rough working. Do not use paper clips, highlighters, glue or correction fluid. Section A Answer all questions. Section B Answer all questions. The Insert contains all the Resources referred to in the questions. Diagrams and sketch maps should be drawn whenever they serve to illustrate an answer. You are reminded of the need for good English and clear presentation in your answers. At the end of the examination, fasten all your work securely together. The number of marks is given in brackets [ ] at the end of each question or part question. Please attach your answers to the cover page provided.
This document consists of 3 printed pages.

2
Section A – Tropical Environments Answer one question from this section.
1 (a) Explain the characteristics of mass movement processes that occur in the
tropics.
[12]
(b) “The role of water is important in affecting the different mass movement types that occur in the tropics”. Discuss the validity of this statement.
[20]
2 (a) Explain the different factors that affect the shape of storm hydrographs.
[12]
(b) “The causes of floods are mainly attributed to human rather than natural causes.” Discuss the validity of this statement.
[20]
Section B – Development, Economy and Environment Answer one question from this section. 3 (a) Explain the impacts of the TNCs on host economies of countries at low
levels of development.
[12]
(b) ‘TNCs plays the most important role in the economic development of the country.’ Assess the validity of this statement with reference to countries at low levels of development.
[20]
4 (a) Explain the impacts of extractive industries.
[12]
(b) Using examples, evaluate strategies used to prevent the resource curse. [20]

[Turn over
3
Section C Sustainable Development
Answer one question from this section. 5
(a) Explain factors that could affect sustainable development in cities of countries at different levels of economic development.
[12]
(b) Evaluate the effectiveness of waste management strategies used in countries of different levels of economic development.
[20]
6
(a) Explain the reasons to account for urban re-imaging in countries at high levels of development.
[12]
(b) To what extent have urban re-imaging strategies benefited everyone living in the cities of countries at high levels of development?
[20]

JURONG JUNIOR COLLEGE
JC2 GEOGRAPHY Preliminary Examination 2018
GEOGRAPHY Higher 2 9751/02
Paper 2 13 September 2018 INSERT 3 hours
The Insert contains all the Resources referred to in the question paper.
This document consists of 7 printed pages.

2
Resource 1 for Question 1
Community Participation of Elderly and Future Elderly
Resource 2 for Question 1 Reasons for Not Participating in Community Activities among Elderly and Future
Elderly
Resource 3 for Question 1 Keeping in touch with family members whom elderly and future elderly do not live
with
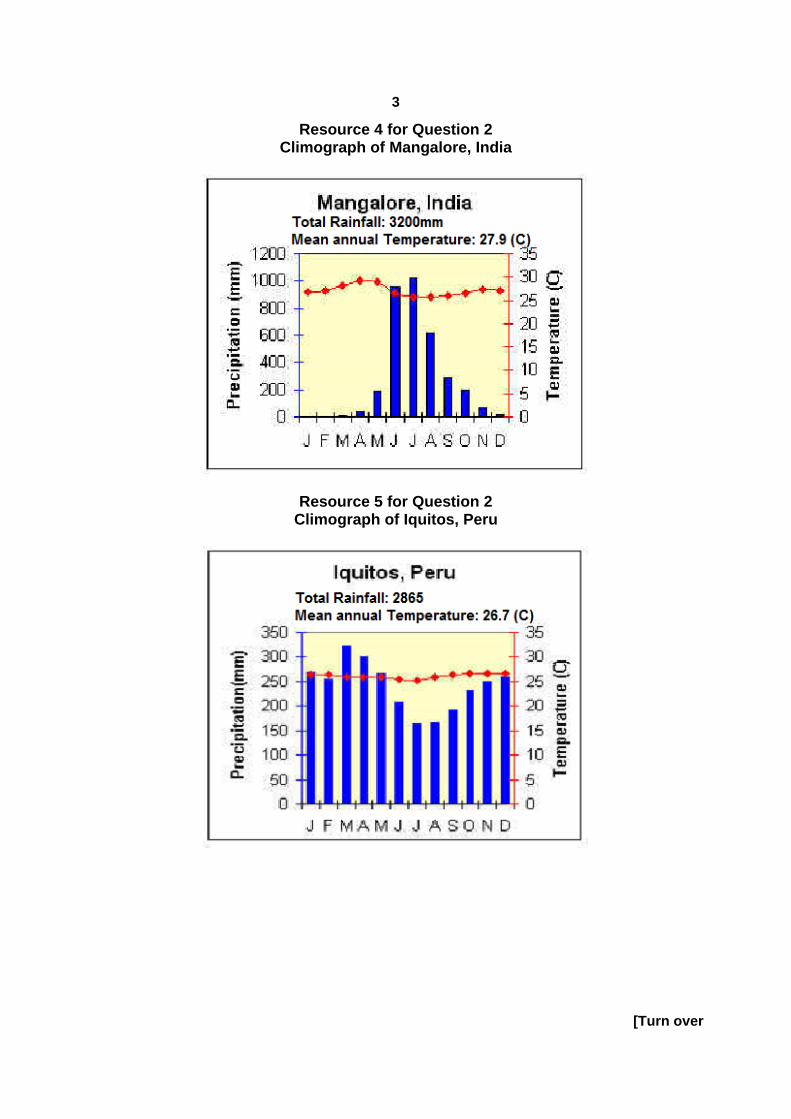
[Turn over
3
Resource 4 for Question 2 Climograph of Mangalore, India
Resource 5 for Question 2 Climograph of Iquitos, Peru

4
Resource 6 for Question 2 Monsoon winds during summer and winter in India
Resource 7 for Question 3 Water scarcity issues around the world

[Turn over
5
Resource 8 for Question 3 Water withdrawal ratios by continent
Resource 9 for Question 3 Mekong River in Southeast Asia

6
Resource 10 for Question 3 Population changes of several countries along Mekong river
Country Population in 1990
(millions) Population in 2018 (millions)
Thailand 57.1 68.2 Cambodia 8.9 16.2 Laos 4.2 6.9 Vietnam 66 96.5
Resource 11 for Question 4
Amount and share of electricity produced from nuclear sources in the world, 1990-2013

[Turn over
7
Resource 12 for Question 4 Generating Capacity of Nuclear Power Plants in Major countries
Resource 13 for Question 5 Total investment in clean energy of China and EU

[Turn over
JURONG JUNIOR COLLEGE JC2 GEOGRAPHY
Preliminary Examination 2018
GEOGRAPHY Higher 2 9751/02
Paper 2 13 September 2018
3 hours
READ THESE INSTRUCTIONS FIRST Write your name and class on all the work you hand in.
Write in dark blue or black pen. You may use a soft pencil for any diagrams, graphs or rough working. Do not use paper clips, highlighters, glue or correction fluid.
Section A Answer all questions. Diagrams and sketch maps should be drawn whenever they serve to illustrate an answer. You are reminded of the need for good English and clear presentation in your answers. At the end of the examination, fasten all your work securely together. The number of marks is given in brackets [ ] at the end of each question or part question. Please attach your answers to the cover page provided.
This document consists of 5 printed pages.

2
Section A
Answer all questions in this section. Each Question carries 25 marks.
You should allocate your time accordingly.
Theme 4: Geographical Investigation
Needs of the Elderly
Theme 4: Geographical Investigation
1 A group of 24, eighteen year old students from Jurong Junior College in Singapore wanted to study the needs of the elderly living in the various public housing estates in Singapore. They had access to various census and survey information on the needs of the elderly from government sources. The main focus of the students was to investigate the social aspects of community participation for elderly residents. They were allocated three days for field investigations at the end of November in the mornings.
Resource 1 shows data on community participation of elderly and future elderly. Resource 2 shows data on the reasons for not participating in community activities among elderly and future elderly. Resource 3 shows reasons for keeping in touch with family members whom elderly and future elderly do not live with.
(a) Suggest a plan detailing how students managed to collect the data provided in Resource 1, 2 and 3.
[7]
(b) Explain how Resource 1, 2 and 3 can help the students understand more about the needs of the elderly in Singapore.
[6]
(c) Identify the data representation method in Resource 3 and state its usefulness and limitations.
[3]
(d) Suggest and justify another data representation method to showcase data in Resource 2.
[5]
(e) Identify some obstacles that students would face during the data collection process.
[4]
Section B

[Turn over
3
Theme 1: Tropical Environments
Flood Risk in India
2 Resource 4 shows the climograph of Mangalore, India Resource 5 shows the climograph of Iquitos, Peru Resource 6 shows the direction of monsoon winds during Summer and Winter in India. .
(a)
Using Resource 4 and 5, compare the rainfall and temperature characteristics of Mangalore, India and Iquitos, Peru.
[6]
(b) Using Resource 4, 6 and your own knowledge, account for the precipitation pattern for Mangalore, India.
[6]
(c) Using Resource 4 and Resource 6, explain how flood risk in Mangalore may differ in December and in July.
[4]
(d) Imagine you are working for the Flood management authorities in India, suggest a plan which you can advise the authorities to reduce the impacts of flooding in Mangalore based on information in Resource 4 and Resource 6.
[9]

4
Theme 2: Development, Economy and Environment
Water Scarcity
3 Resource 7 shows a world map indicating various types of water scarcity issues. Resource 8 shows the water withdrawal ratios by continent. Resource 9 shows a map of the river running through several countries in Southeast Asia. Resource 10 shows the population changes of several countries along Mekong river.
(a)
With reference to Resource 7, describe the global distribution of water scarcity issues.
[4]
(b) Using Resource 7, explain the difference between economic and physical water scarcity.
[2]
(c) Using Resource 8 and your own knowledge, describe and explain why water withdrawal ratios vary between different parts of the world.
[8]
(d) With reference to Resource 9, briefly explain the transboundary nature of the Mekong river.
[2]
(e) Using Resources 9,10 and your own knowledge, examine the nature of issues relating to transboundary water use.
[9]

[Turn over
5
Theme 3: Sustainable Development Nuclear Energy in the World and China
4 Resource 11 shows the amount and share of electricity produced from
nuclear sources in the world, 1990-2013. Resource 12 shows the Generating Capacity of Nuclear Power Plants in Major countries. Resource 13 shows the total investment in clean energy of China and the EU.
(a) With reference to Resource 11, describe the trend of amount and share of electricity produced from nuclear sources in the world from 1990-2013.
[3]
(b) With reference to Resource 12, describe the generating capacity of nuclear power plants (In Operation and Under Construction & Planning) in major countries.
[5]
(c) With reference to Resource 12, discuss the implications of nuclear power plants plans in the major countries.
[5]
(d)
(a)
With reference to Resource 13, compare and contrast the total investment in clean energy of China and the EU. With reference to resource 12, 13 and your own knowledge, assess China’s contribution to sustainable development.
[6]
[6]

1
2018 H2 P1 Essay
Question 1
a) Explain the characteristics of mass movement processes that occur in the tropics. [12]
** For mass movement types, possible types of mass movement that can occur in tropical regions:
Heave (although more prominent in the temperate regions, can occur in tropical regions when extreme changes in temperatures or alternate cycles of wetting and drying occurs) [Possible in AW climate types where there are temperature and rainfall variations throughout the year]
Flow (Common in Af and Am climates where high and intense rainfall events can occur) Slides (Common in BS and BW climates where lack of vegetation could induce rock slides
along slide plane). May also occur in AW or Am climates where rotational slips could occur in the presence of a curvilinear slide plane
Falls (common in all climate types where weathering causes lines of weaknesses to develop and once it gave way along areas of weaknesses, falls occur.
** Need to make some subtle link climatic types where mass movement types could occur. If students merely relate to characteristics w/o the links to the climatic types, maximum of 9 marks.
Characteristics of Heave:
Speed: Very slow (1mm to 1cm per year)
Movement: Particles are lifted perpendicularly and dropped vertically
Factors dependent on: Alternating cycles of expansion and contraction which can be attributed to large temperature changes, alternating cycles of wetting and drying
Water content: generally low
Key features: bent tree trunks, terracettes
Material size: Varies from large to small
Characteristic of flow: Speed: Generally fast Movement: Materials when incorporated with water, essentially moves as a semi-fluid mass Water content: Very high Factors dependent on: Water content (which determines speed and volume) Material size: Varies (from earthflow (mixed)to mudflow (generally fine)) Characteristic of Slide: Speed: Fast Movement: Along slide plane and in contact with surface Water content: low (may only be present to lubricate the surface Factors dependent on: presence of slide plane Material size: varies (Can be a rock or a consolidated mass) Characteristic of fall: Speed: Very fast Movement: Free fall through sky Water content: Low or absent Factors dependent on: Lines of weakness Material size: varies but usually rather large (rock falls)

2
b) The role of water is important in affecting the different mass movement types that occur in the tropics. Discuss the validity of this statement. [20]
The role of water should never always be ignored in mass movements and that water certainly plays an important role in influencing the mass movement types as well as the rate at which mass movements occur in different tropical environments. This certainly means that the effects of water on mass movements should not be ignored. However, it must be noted that the role of water in various mass movement types differ very much depending on the type of mass movement. Strictly speaking, we are also looking at three main kinds of mass movements, namely heave, flow and slide.
Supporting Argument
Water, as will be argued, plays the most significant role in flows within tropical regions as humid tropical regions are associated with high precipitation. For example in flows, nearly all movement occurs as turbulent motion within the body of the flowing mass. In the case of flows, the material is essentially semi-fluid. As with flows, an abundant amount of water is usually present.
In the case of mudflow, earthflow and debris flow in humid tropical regions such as Tropical rainforest, Tropical Monsoon and Tropical wet and dry (Savannah), water also plays an extremely important role during wet season or during times of intense precipitation. The main difference between these kinds of flows involves the kinds of materials which consequently has an effect on the speed of movement. However it can be said that in general these forms of flows require water to be present to sustain the mass movement. For example, in the case of mudflows, during an event of a heavy rainfall, exposed regolith becomes rapidly saturated. As such, the cohesion strength between particles becomes virtually lost and unstable resulting in a decrease in shear strength and moves down the slope in a turbulent manner as mudflows. In such an example, water is an extremely important component in the mass movement process.

3
Although water is the main influencing component of mass movement in flows, water also plays a role in heave which is also known as creep. One kind of heave in which water plays an important role is frost creep. In heave, although the main process has been expansion and contraction and the subsequent moving of materials down a slope. In creep, water is important because it is responsible for alternating cycles of wetting and drying or areas that experience temperature fluctuations during the year such as Tropical wet and dry climates. The slope expands when it is wet and contracts when it dries. As a result of this, heave is resulted.
As can be seen, in this kind of heave process, the role that water plays is very important. If both soil creep results from extreme temperature changes or alternate wetting and drying, it can be said that the role of water cannot be ignored.
In the case of slides, although water cannot be seen as the main influencing factor, it plays a supporting role in providing the necessary lubricant that facilitates the mass movement process.
Counter Argument
However, it must be recognized that water does not play an extremely important role in all mass movement types. In the case of slides, the main contributing factor has been the presence of a slide plane.
In slides, it involved the movement of a coherent mass of material along a distinct and well-defined failure plane. In slides, as mentioned earlier, water is not essential although we may see it as that it may be necessary to provide a certain level of lubrication to aid in the process. For both rock slides and rotational slips, the main requirement is the presence of a failure plane where materials move in a coherent mass. In such a case, water may not play an extremely essential role in the mass movement process.
Secondly, as in the case of heave, if the cause of heave is largely due to large temperature changes, then the role of water in such an instance may not be that important.
May also want to mention rock slides.
Similarly, the role of water in falls in tropical regions is also not directly important. In the case of falls, it is dependent on the presence of lines of weaknesses present in rocks that eventually break away from the parent rock and falls through the air. The role that water plays many not be so direct. However, water may also be seen as important as it may carry out physical and chemical weathering processes along the rock joints and in time to come, cause the rock joints to widen and break away from the parent rock.
The role of other factors

4
Other factors may also be responsible for contributing to mass movements. For example, in the event of an earthquake, the likelihood of mass movements may become more likely. When earthquake occurs, due to the intense shaking of the ground surface, the cohesive strength of the particles may be lost, more lines of weaknesses may also be created, causing the likelihood of rock falls and rock slides more likely.
Clearing of vegetation might also make mudflow and debris flow more likely when bare surfaces are exposed to rain and resulting in oversaturation of the soil.
Conclusion
Recognise the important role water plays Also sought to recognize other factors and how water may not be important. Discusses how water may not be essential for all mass movement types.

5
Question 2 Explain the different factors that affect the shape of storm hydrographs. [12]
** As a general guide, students should give factors coming from at least 2 categories. They need not talk about all factors but a good explanation will be needed. For 9 marks, at least minimally cover 5 factors while for 12 marks cover 6 factors Indicative content: Climatic Factors
Effect on hydrological processes Implication on hydrograph
Rainfall intensity
• High rainfall intensity can quickly generate high
amounts of HOF • Low rainfall intensity would allow infiltration but
would not be able to generate HOF easily
Steep rising limb, short lag time, high peak discharge
Gentle rising limb, long lag time, low peak discharge
Rainfall duration
• Prolonged rainfall saturates the ground and tends to
generate SOF • Rainfall of short duration may add to soil moisture
but may not lead to saturation of the ground. Thus, little or no SOF may be generated.
Steep rising limb, short lag time, high peak discharge
Gentle rising limb, long lag time, low peak discharge
Evapo-transpiration
rate
• Low rates of evapotranspiration results in high
antecedent moisture (i.e. moisture present in the soil before rain event) and thus encourages the development SOF.
• High rates of evapotranspiration results in low
antecedent moisture which promotes high rates of infiltration. This slows down the generation of SOF.
Steep rising limb, short lag time, high peak discharge
Gentle rising limb, long lag time, low peak discharge
[Extra information]
Snowmelt
• Rapid snowmelt (especially in summer) can quickly
generate high volume of overland flows • Slow snowmelt may only gradually generate low
volume of overland flows
Steep rising limb, short lag time, high peak discharge
Gentle rising limb, long lag time, low peak discharge
Drainage Characteristics

6
Effect on hydrological processes Implication on hydrograph
Basin size
If a basin is small, it is likely that rainfall will reach the main channel more rapidly than in a larger basin. This is because the water will have a much further distance to travel in a larger basin.
If a basin is small, the amount of rainfall received in the catchment area will also be low. This results in a lower amount of discharge in the main channel.
THINK: If a small basin has shorter lag time and also lower peak discharge, will the rising limb also be affected by the basin size? (Hint: Draw the hydrographs and see!)
Shorter lag time in smaller basins
Low peak discharge
What is your conclusion? =)
Basin shape
• In a circular basin, the tributaries often tend to come together and join the main stream approximately in the same place at the same time. Following a period of heavy rainfall, such ‘centralized’ merging of the streams results in a very large and very rapid increase in discharge of the main stream.
• In an elongated basin, the tributaries tend to be relatively short, and tend to join the main stream at separate intervals. This means that after a period of heavy rainfall, the runoff from the lower tributaries will reach the gauging station BEFORE the runoff from the upper tributaries finally flow down and reach the gauging station. It also takes a longer time for runoff from the upper reaches of the basin to reach the gauging station.
Steep rising limb, short lag time, high peak discharge
Gentle rising limb, long lag time, low peak discharge

7
Drainage Density
• In a basin with high drainage density, a large proportion of rainfall will become overland flow (surface runoff). This leads to a higher and more rapid increase in discharge.
• In a basin with low drainage density, a large proportion of rainfall will most likely infiltrate and percolate into the ground. A small proportion of the rainfall will be channeled as overland flow. This leads to a smaller and slower increase in discharge.
Steep rising limb, short lag time, high peak discharge
Gentle rising limb, long lag time, low peak discharge

8
Basin slope gradient
In steep-sided upland valleys, steep slopes leave little time for infiltration and encourage generation of high amounts of surface runoff. Water is likely to reach the river more quickly than in gently sloping lowland areas, leading to rapid increase in discharge.
Steep rising limb, short lag time, high peak discharge

9
Presence of Vegetation
Effect on hydrological processes Implication on hydrograph
Vegetation cover
Leaves and branches increase the rate of interception, which reduces the rate of soil compaction caused the impact of falling raindrops. This increases infiltration rate! At the same time, the roots of plants and trees increase the lines of weaknesses in the ground, further increasing infiltration rate. As such, the presence of vegetation cover generally leads to decreased amounts of surface runoff (due to increased infiltration rate).
Gentle rising limb, long lag time, low peak discharge
+ Gentler falling limb (since higher infiltration leads to increased throughflow and
baseflow)
Geological Factors
Effect on hydrological processes Implication on hydrograph
Soil or rock permeability
• Impermeable rock or soil reduces infiltration and
percolation, resulting in the generation of high volume of overland flow.
• The reduction in infiltration and percolation also decreases the amount of throughflow and baseflow into the river.
• Permeable rock or soil facilitates high infiltration
and percolation, reducing the occurrence of overland flow.
• Instead, because of high infiltration and percolation, rainfall reaches the stream primarily via throughflow and baseflow.
Steep rising limb, short lag time, high peak discharge
+ Steeper falling limb
Gentle rising limb, long lag time, low peak discharge
+ Gentler falling limb
Human Factors
Effect on hydrological processes Implication on hydrograph
Dams and reservoirs
Dams DO NOT affect the amount of surface runoff generated, BUT they regulate the flow of water and are also able to store a sizeable volume of water in their
Lower peak discharge

10
reservoirs. Generally thus, dams reduce the amount of discharge into the main river or channel.
Deforesta-tion
The reduction of vegetation cover produces the opposite effects to what was mentioned in the above section on “Vegetation Cover”. Generally, reduction in forest cover leads to:
o Reduced infiltration rate o Higher surface runoff
[Note: Afforestation is the counter-process to deforestation, and INCREASES vegetation cover.]
Steep rising limb, short lag time, high peak discharge
Urbanisation
Urbanisation produces large amounts of impermeable surfaces made of concrete, tarmac, and metal. Water cannot infiltrate through such materials, and this leads to a rapid generation of surface runoff.
Moreover, drains and canals carry water more quickly to the nearest river.
As a result, rainfall reaches the river extremely quickly, greatly reducing lag time and also massively increasing peak discharge.
Steep rising limb, short lag time, high peak discharge

11
b) “The causes of floods are mainly attributed to human rather than natural causes.”
Discuss the validity of this statement. [20]
Causes of floods may be attributed to both human and as well as natural causes. However it must be noted that the factors have to be direct factors. Factors such as urbanisation and deforestation can be discussed but only serve as factors contributing to worsening (acerbating factors) and should not be discussed as direct causes of floods.
Indicative content: Natural causes of floods Intense rainfall and tropical cyclones
o Intense rainfall will result in infiltration-excess flow (IEF) where rainfall intensity exceeds the infiltration capacity of the ground.
o The increase in IEF causes river discharge to increase, and this can lead to the formation of floods.
o High rainfall intensity is associated with convectional rainfall and especially in tropical regions. The formation of tropical cyclones also generates short but intense rainfall.
o Also, during intense rainfall, the impact from falling raindrops tends to compact unvegetated soil particles, and cause the pore paces to be sealed (recall: raindrop effect). This reduces infiltration capacity, further increasing the likelihood of IEF being generated.

12
Prolonged rainfall
o Prolonged rainfall leads to the increase in soil moisture storage and groundwater storage via infiltration and percolation respectively. The ground eventually becomes saturated with water, and over time, saturation overland flow (SOF) is generated.
o The increase in SOF causes river discharge to increase, and this can lead to the formation of floods.
o Prolonged rainfall is usually experienced in tropical monsoon regions, during the wet (monsoon) season.
Seasonal rainfall during wet season (monsoon season)
o Tropical monsoon regions usually experience a distinct wet season or monsoon season, where there is a higher amount of rainfall. These regions typically experience prolonged rainfall (see above) in the wet season, which generates SOF.
o Most of the time, countries in such regions are prepared for the increased rainfall during the wet season. However this seasonal increase in rainfall can still lead to the formation of floods, especially if:
The wet season is unusually long or extended The intensity of rainfall is higher than expected The wet season arrives much earlier than expected
o The above 3 cases tend to result in tremendous increases in discharge. Rivers that are unable to cope with such large increases in discharge will therefore overtop their banks and flood the surrounding area.
Eg: Brahmaputra River in India and Bangladesh and Yangtze River in China are prone to flooding during the monsoon seasons. In India, up to 70% of the annual rainfall occurs in 100 days in the summer south-west monsoon
Snowmelt
o Snowmelt or meltwater can greatly increase the discharge in the river, and cause the river to overflow its banks and flood.
o Snowmelt can be generated by: Warmer temperatures during spring/summer Volcanic events
o In the spring or summer months in temperate regions, warmer temperatures can cause snow or ice to melt, producing large amounts of meltwater.
E.g. In December 2008, the state of Washington (USA) experienced heavy snowfall. By January 2009, the heavy snowfall began to rapidly melt, producing enormous amounts of meltwater and generating extremely heavy floods.
E.g. In the Yukon River in Canada, the most common cause of flooding is the melting of snow and ice in spring.
o Rising magma can heat up the sides of a volcano, causing ice and snow on the flanks on the volcano to melt. Lava flows and hot gases from volcanic eruptions can also melt snow and ice, and generate meltwater.
E.g. The 2010 volcanic eruption in Iceland produced devastating flash floods, as hot gases from the volcanic eruption melted huge chunks of ice from the Eyjafjallajokull glacier.
E.g. The 1985 eruption of the Nevado del Ruiz volcano in Columbia melted ice and snow on the sides of the volcano, producing devastating floods and lahars.
Storm movement
o Storm movement in a catchment area can either amplify or dampen a flood wave.

13
o Storms that move down-valley (i.e. moving from the upper reaches of the basin to the lower reaches) are more likely to cause flooding. This is because such direction of storm movement tends to amplify the peak discharges downstream.
E.g. The disastrous 1996 flash flood that occurred in Buffalo Creek, Colorado (USA) was due to 2 reasons. Firstly, a severe wildfire caused extensive deforestation in the basin, leading to reduced infiltration and increased surface runoff. Secondly, the storm (that produced the surface runoff) moved down-valley, tremendously amplifying the peak discharges, and hence causing a severe flash flood.
Unusual climatic phenomena
o Climatic phenomena such as El Nino and La Nina have resulted in unexpected occurrences and amounts of rainfall and these have, in some cases, resulted in floods.
El Nino – Said to have played a role in the 1993 Mississippi River flood. La Nina – Said to have played a role in the floods in Sudan and Bangladesh in
1998
Human causes of floods
Dam failure
o Dams are able to regulate the flow of water to the downstream areas, providing them with water even during the dry seasons.
o However, dams are also causes of floods if they fail or collapse.
o Dam failure can occur due to: Unexpectedly-high amounts of rainfall Sedimentation in reservoir Engineering failures
o Unexpected rainfall. The reservoirs behind dams store water during the rainy season (this water is typically released during the dry season). However, in some cases, the rainy season experiences an unusually high amount of rainfall. The reservoir may not be designed to hold such a large amount of water, and the reservoir overflows. Downstream areas receive a sudden surge of water, and flooding occurs.
o Sedimentation in reservoir. Improper maintenance of the dam may lead to the accumulation of sediments in the reservoir. This reduces the holding capacity of the reservoir. When this happens, the reservoir is unable to hold large amounts of water, and the dam is more likely to overflow during times of heavy rainfall.
o Engineering failures. In some cases, leakages in the dam structures cause the dam to release water too quickly. In more severe cases, engineering failures may cause the dam to even collapse. In both circumstances, downstream areas receive a sudden surge of water, and flooding occurs.
E.g. Banqiao Dam, China E.g. Teton Dam, USA E.g. Val di Stava Dam, Italy
o ** Students can also bring in or feel free to talk about recent case study of dam failure in Laos (2018) which resulted in flooding downstream and loss of lives
Levee failure
o Levees refer to embankments on the river bank. Levees can be natural or artificial.
o Artificial levees are built to increase the holding capacity of the river channel, and thus prevent overflowing of the river.
o However, levees are also causes of floods if they fail or collapse.
o Levee failure can occur due to:

14
Overflowing of levees, Breaching or collapse of levees.
o Overflowing of levees. In some cases the amount of discharge is extraordinarily high (due to high rainfall or other circumstances), and far greater than what the levees were originally designed to contain. This causes the river to overflow the levees, and flood the surrounding areas.
o Breaching or collapse of levees. Increased discharge in the rivers also leads to both increased velocity and increased fluid pressure in the channel. Firstly, the increased velocity can increase the rate of erosion at the base of the levee structure, causing it to collapse. Secondly, the increased fluid pressure against the levees may also force water to “breach” the levees, eventually causing the levees to collapse.
Other contributing reasons though not direct reasons to floods:
- Deforestation o Deforestation can worsen floods by increasing surface runoff as soil becomes
compacted due to removal of trees and vegetation Increase in IEF Water reaches channel faster increase in channel flow Water overflows channels flooding
o Can also increase erosion Mass movement holding capacity of river is reduced flooding occurs due to reduced capacity of river
- Urbanisation o Concretised surfaces Impermeable surfaces Higher IEF Water reaches
channel faster increase in channel flow Water overflows channels flooding - Pluvial floods in Urban areas
o Water may sometimes be channelled to low points in the city’s terrain (also known as ‘ponding’) This may happen if drainage systems are choked or rainfall is too intensed. Can happen as most urbanised areas have little permeability

15
Section B
Question 3
(a)
Explain the impacts of the TNCs on host economies of countries at low levels of development.
[12]
1. Economic Impacts a) Positive & Negative on Host Economies
Positive Negative o Aid in the structural shift of economies
especially NIEs such as Singapore in the past when we wanted to move from an industrial to post-industrial economy through the following:
(1) Employment: o Number of Jobs--dependent on the scale
of TNC operation, whether it is capital or labour-intensive
o Type of jobs--level of development of host country labour and compatibility with the operations of the TNC, DCs tend to be able to take higher-order skilled jobs that pay more. We also need to consider whether the jobs are indirect or directly created by the TNC.
o Wage and salary level: The type of jobs will determine the wage levels. Higher skilled jobs will tend to be paid more. However, TNC tend to be pay higher than the host economies because of their wealth levels they tend to pay higher than local prices so as to recruit more capable workers to give them more edge since they are deemed to be a foreign company and has no home-ground advantage compared to the local companies.
o Time frame: Another consideration is
whether the jobs created are for the long term or for the short term. This is dependent on how long the TNC stays in the country.
(2) Technology: o Extent of transfer: Technically if the TNC
employs local labour, there will be some degree of transfer through skills and techniques. However, the TNCs tend to limit their transfer of technology, they tend to transfer the results of innovation but not innovation capabilities – the ‘know-how’ but not the ‘know why’. This is evident as most TNCs locate their R & D support laboratories in their home country. This is
Most of the negative impacts will be affecting the long-term health of the local economic sector:
o Local firms might be under-developed due to the superiority of TNCs in terms of their resources, management and financial skills. Recall how TNCs are able to provide higher wages to attract local talent. Smaller firms might be forced to close down, stifling the prospects of local enterprise skills. Some can consider this as positive point, as some local firms or state-owned enterprises are kept ‘alive’ due to state subsidies but are in fact not doing well. TNCs provide more equal competition and might provide more ‘incentive’ for local firms to be more productive and efficient.
o Dependency: The over-dominance of the TNC in the local economy leads to another problem. This will depend on the nature of relationship between the TNC and host economy and their contrasting level of development. If the host country is a LDC and the TNC main aim to locate in this LDC is due to low labour cost, there is a high risk of the TNC relocating to another country if they are able to provide more competitive labour costs. [This situation of TNCs relocating frequently to the lower wages countries is termed ‘caravan capitalism’. To prevent negative impacts such as economic leakages the role of government is very important, this will be discussed in Lect 6 Role of Government] TNCs are after-all profit-driven enterprises, depending on the scale of operation in the host economy this

16
to keep their competitive edge over other countries.
o Appropriateness of the technology transfer: Also many LDCs do not have the necessary infrastructure or skilled labour to optimised the technology from the DCs.
o Most TNCs are from DCs and their technology is largely capital-intensive, LDCs tend to be capital scare and labour-intensive, hence these means fewer jobs will be created, hence extensive transfer of technology in this case might not be suitable.
(3) Capital and finance: o TNCs will channel high inflows of
capital directly via FDI or indirectly via corporate taxes. This will also depend on how ‘shrewd’ the host economy is to prevent economic leakages via remittance back to TNC’s home country, some host economies will implement taxes on the profits of TNCs or have legislation stipulating that TNCs reinvest a certain amount of their profits back to the local economy.
(4) Trade Balance: o Positive trade balance/Surplus
(More exports than imports) TNCs may practice import substitution, the plant that they set up in the host economy produces goods for the local population so that the host economy does not need to import from other countries. Domestic firms which are vertically integrated into the TNC’s activities via its production network would also be able to gain access to new export markets.
o Negative trade balance/deficit (More outflow of funds through exports) Imports by TNCs, although this may be offset its imports are essential for export-producing activities. Note: Trade balances can be studied via the volume and values of the imports and exports. It would be more accurate to look at these two variables.
would lead to massive economic revenue loss and employment.
o Local economies have to pay for development of infrastructure like roads and railways to attract FDI. The money would be a significant strain on some of these less-developed countries.
o Other sectors of the economy might be over-looked as the government channels all its revenue to attracting TNC foreign development.

17
Host Economies
Positive Impacts Negative Impacts • Creation of jobs and higher pay in
LDCs, this seems like a direct economic impact. However, with income generated from employment, they could be channeled to social infrastructural development such as building schools and better hospital facilities. Some form of ‘trickle-down effect’ or multiplier effect might be generated. For instance, when the population is gainfully employed, they can use the income to buy goods and services from local retailers and generate income for the local economy.
• Skill levels of the local population may rise through training by the TNC. This can be considered an economic impact but it can also have long-term social impacts where the labour is seen to be more attractive to investors in the long term.
• Social development projects & engagement with local communities e.g. microfinance & healthcare programs set up by TNCs to aid the local communities. E.g. Citigroup microfinance program which provides financial aid to poor families to start small businesses. These projects have helped to improve the overall standard of living in the country.
[N.B: Some critics have said that these projects are merely publicity stunts by TNCs to improve their corporate image that has been tarnished by bad press reports about TNCs violating environmental or legal practices]
• Changes in attitude and
consumption patterns
• Exploitation of local labour force: TNCs have been accussed of setting up sweat-shops with poor working conditions for local workers. Such ill-practices include long working hours, poor wages, under-age employment as well as fines for simple mistakes. As most of these LDCS have little job opportunities, many workers are willingly to endure the poor working conditions. Instability of jobs as TNCS is prone to closing plants if greater profits can be made in other countries.
• Limited skill transfer: There might be minimal transference of skills because workers are not expected to do high level skills. Hence workers do not upgrade their skills in anyway.
• Entry of values which might have harmful social and moral effects E.g. entry consumerism and materialism. Nestle introduced formulae milk to LDCs but because the natives do not have the necessary sterilisation equipment and hygiene standards, many of the children developed health problems from milk bottles that were not sterilised properly.
• Lost of local cultural heritage through the invasion of foreign culture e.g. the setting up of Starbucks in the Forbidden City in Beijing.
Environmental Impacts on Host Economies
Positive Negative • Solving environmental problems: o Capital inflow of FDI could be used to
solve environmental problems that LDCs usually face.
o However, these gains could be negated by corruption.
o Loss of Greenfield sites due to construction of factories. World total Greenfield FDI projects increased from 9,300 in 2003 to 9,800 in 2004.
o Pollution: Industries can produce
untreated waste and air pollutants. Pollution could lead to adverse impact

18
o TNCs have capital and technology to implement environmental practices and schemes. Such as fitting cars with catalytic converters or having hybrid cars that run on less pollution.
on health of residents. Respiratory problems could result from the pollutants.
o Poor Environmental Management: Many LDCs lack the resources and manpower in environmental regulation, legislation & enforcement. Hence, they are unable to penalise the TNC’s when they violate the regulations. Also, the main aim of these LDCs is still economic profit and maintaining their attractiveness to investors. What they perhaps are thinking is only for the short term gains because in the long-term, pollution could affect the health of the workers leading to poor work productivity. Over-consumption of resources could also lead to shortages which might compromise future economic development of the country.
(b)
‘TNCs plays the most important role in the economic development of the country.’ Assess the validity of this statement with reference to countries at low levels of development.
[20]
Economic development usually attained through economic planning and executing economic strategies to develop or sustain a country as a leading global hub for business or investments TNCs play the most important role TNCs does not pay the most important role
TNCS is most important as:
o The state is unable to counter regional imbalance in economic development
o E.g. developed core and underdeveloped periphery
TNC is important The sheer scale, structure,
global nature of the geographical spatial distribution and the diversity of sectors that TNCs are involved in ensure that it has the ability to dominate a particular national economy
Aid in the structural shift of economies especially NIEs (in the past) and LDCs today (from an industrial to post-
Role of state is key in the economic development of the country
o The government’s main economic objective is to protect domestic markets and foster economic growth. It also aims to regulate foreign investment, industry, and trade. The government can achieve this in the following ways: Creating a favourable
business climate Promoting industrial
development Promoting trade
o Maintaining social and political order in a country
o Providing infrastructure o Industrial Development <->
cumulative causation &multiplier effect

19
industrial economy) through employment numbers and type
Assists in some degree of transfer through skills and techniques
TNCs will channel high inflows of capital directly via FDI or indirectly via corporate taxes
TNCs may practice import substitution- increases trade balance
Export Processing Zones (EPZs)
Industrial clusters o Providing economic incentives
Import substitution policies Protected home markets via
tariffs and quotas on imports Tax incentives Cheap labour Encouragement of inward
investment and development of their own TNCs
o Provide public goods and services
The role of supranational bodies is important too
Role of international organisations Facilitate world trade
and fair trade practices (especially for LDcs)
Trade negotiations Promoting the process
of trade liberalization Role of trade blocs
Increased trade and export earnings.
Stimulus for FDI Increased
competitiveness of businesses
Increased regional and national development
Question 4
(a)Explain the impacts of extractive industries [12]
Production of Spoil
• Spoil refers to the waste produced when ore is obtained from the mined material.
• Large mines produce large amounts of waste because the ore is only a small fraction of the total volume of the mined material
• The production of spoil is an increasing problem because:
(a) Of the growth in demand for minerals (especially to fuel the economic development of fast
growing economies such as India and China) (b) As rich ores are mined out, lower-grade deposits are worked, producing even more waste per
unit of mineral produced. For example, four centuries ago, the average grade of copper ore

20
mined was about 8%. Now the average grade is 0.9%, which means almost 1 billion tonnes of waste is generated to produce 9 million tonnes of copper.
• Deposition of spoil during mining can bury streams and rivers. This has a serious effect on stream-water quality and wildlife habitats.
• When spoil is piled into tall heaps, it can create geomorphological hazards such as landslides. This is because the added weight of the spoil on slopes can result in shear stress exceeding the shear strength of the slope. A catastrophic landslide that occurred at the Gyama copper/gold mine in Tibet in March 2013 killed 83 workers.
• Moreover, disposal of spoil often degrades areas of natural ecosystems beyond the immediate
zone of impact of the mining areas.
Environmental pollution
(a) Air pollution
• This can result from the hazard of self-ignition.
• It is associated with the waste rock heaps deposited by the oil-shale mining industry in Estonia. Once these are ignited, the average burning period of mine spoil is about 10 years.
• The town of Baotou in Inner Mongolia, China has suffered from air pollution as a result of the
processing of rare earth elements (RREs) at a mine 120 km away. 9600 to 12 000 m3 of waste gas, containing dust concentrate, hydrofluoric acid, sulphur dioxide and sulphuric acid are released with every tonne of rare metals that is mined.
• Residents have started to suffer from breathing difficulties and liver and pancreatic diseases
caused by the polluted air.
• Moreover, the energy used to process the rocks comes from a coal-fired power station. Sulphur dioxide and carbon dioxide released by burning coal contribute to air pollution and global warming.
(b) Water pollution
• Using the same example of the mining of RREs in Baotou above, given that the concentration of rare earths in the ore is very low, they must be separated and purified using hydro-metallurgical techniques and acid baths.
• However, the toxic and radioactive waste products of this are contained in large ponds known as tailings which have not been properly sealed.
• Chemicals have seeped into the surrounding land and into the groundwater, contaminating the
soil and damaging farmland. Farmers have been forced to abandon their land and move away, with difficulties in obtaining compensation.

21
• Another form of water pollution associated with mining is acid mine drainage. This occurs when any deposit containing sulphide reacts with air and water to produce sulphuric acid. If sulphuric acid reaches rivers, the damage to plants and animals can be very serious.
• Acid mine damage is a problem of operational mines as well as being a pollution source for some
years after mine closure.
• For example, the Sao Domingos mine in southern Portugal, which produced copper and sulphur for more than 100 years, was closed in 1966. However, it still continues to pollute rivers that flow into the largest drinking water reservoir in the province of Huelva.
• Another water pollution issue is that of mercury pollution.
• This is especially common in areas mined for gold by small-scale prospectors. Mercury is used to
separate fine gold particles from other minerals in river-bed sediments, but is an extremely toxic metal.
• Although large-scale mines have since used more efficient and less environmentally damaging
techniques in gold processing, mercury pollution can be long-lasting.
• For instance, the use of mercury in the 1950s and 1960s at the Discovery mine in the Canadian Northwest Territories polluted nearby Giauque Lake, which is still designated a contaminated site by Environment Canada, decades later.
• When contaminated water held in ponds at mines are accidentally released prior to treatment,
they can cause much damage to the environment. • The 1998 Aznalcollar mining accident in southwest Spain severely affected one of the most
important bird-breeding and over-wintering sites in western Europe, the Coto Donana nature reserve. The release of acidic wastewater killed large numbers of fish and had severe consequences for the many bird species dependent on the nature reserve and adjacent areas.
Habitat and landform destruction
• Mining e.g. surface mining can involve the removal of surface vegetation, soil and where necessary, layers of bedrock in order to reach buried ore deposits.
• However, this has serious effects on ecology. Large amounts of soil and rock have to be moved and this destroys habitats and landforms.
Land subsidence
• Land subsidence most often occurs in coal mining, when whole seams of material, frequently several metres thick, are removed. The overlying strata may then collapse downwards. This may happen rapidly and with little warning, or occur gradually over a period of time.
• Subsidence can be in the form of: (a) Crown holes: localised crater-like holes that appear at the surface following collapse of strata
into a mine.

22
(b) General subsidence: settlement of the ground surface over a wide area resulting from the collapse of part of the mine.
• Subsidence can cause damage to mining equipment, buildings, communications and agricultural drainage systems. The issue may be worsened by the reactivation of geological faults in the area, causing fault scarps to form. Examples in the south Wales coal field are up to 4 metres high and several kilometres long.
** Students minimally must discuss 3 points from at least 2 categories
b) Using examples, evaluate strategies used to prevent the resource curse. [20]
Introduction:
• Brief statement on what the resource curse is • Give brief background on selected examples – e.g. Botswana is blessed with diamond wealth,
Norway is blessed with oil wealth, yet both have avoided the resource curse. Describe changes in development indicators of Botswana to show this.
• Indicate stand: the strategies in Botswana and Norway’s cases are effective as they enable the countries to manage their wealth from minerals in a sustainable manner that extends into the long term. However, these are not effective per se. Their effectiveness have been contributed by the contextual conditions that promote good governance and transparency as well.
Main Body:
One strategy pursued by Botswana was economic diversification. To promote this, the Business and Economic Advisory Council (BEAC) was created in 2005. It was tasked to identify constraints hindering economic diversification, formulate a key strategy and action plan to overcome those constraints and identify projects for Botswana to move forward.
Since the implementation of the action plan produced by the BEAC, Botswana’s economic diversification focussed on creating a business friendly environment – there are no foreign exchange controls and there are few non-tariff barriers to imports. Taxation is favourable with a standard income tax rate of 25% for individuals and 15% for manufacturing and international financial services. Moreover, there is the provision of the structures and incentives that serve to improve Botswana’s business capacity through training and business development efforts. Other measures include addressing policy and institutional matters such as ensuring the stability of the financial sector, providing instruments of support for diversification initiatives including the promotion of privatisation and creating projects to drive diversification through the support of agriculture and tourism among other sectors
The reasons for behind economic diversification were the danger of relying on the mineral sector for the majority of revenue as it renders states very susceptible to the price shocks of the sector they depend on. Furthermore. mineral wealth was limited in that the wealth acquired from mining would only last as long as there were diamonds in the ground. Lastly, it was important for Botswana to develop the non-mineral sectors given the narrow linkage of the mining sectors with the rest of the economy, especially in employment creation. The sector only directly employs 2% of the labour force.
However, this strategy may not be a total success, at least not at this point in time. This is because the homegrown private sector remains weak while the key targeted sectors notably manufacturing have not fully yielded intended results. Nonetheless, this strategy can be said to help Botswana avoid the resource curse as signs of success of economic diversification include

23
manufacturing contribution increased from 8.5% to 11.4% in 2001. In addition, manufacturing output at independence comprised mainly meat and meat products. These accounted for only 14% in 2001 while other consumer goods comprised 35% of output and the intermediate goods, 51%.
Another strategy used by both Botswana and Norway was the use of sensible fiscal rules to curb excessive spending and to promote the sustainability of mineral wealth. In Botswana’s case, one rule was that of sustainable budgeting that aimed to ensure that all mineral revenue be invested productively or saved rather than be used for consumption. This rule led to the creation of the Sustainable Budget Index (SBI) – defined as the ratio of non-education, non-health recurrent expenditure to non-mining revenue. A SBI of no greater than unity (1 to 1) is targeted in order to ensure non-investment expenditure to be financed by non-mineral revenue and conserve the country’s wealth. Another fiscal rule sets the maximum government expenditure at 40% of GDP to be consistent with the projected medium-term government revenue. In addition to limiting expenditure, it should be noted that they are also focused on increasing the productivity of revenue spent and limiting debt.
In Norway’s case, this was seen in the Fiscal Rule introduced in 2001 to ensure that a large part of the oil revenues was saved. The gist of this rule was that the spending of the oil revenues should be equal to the expected real return from the Pension Fund. Thus, the fund would grow when new oil revenues flowed in, but as one would only withdraw the expected return, the fund would never be smaller. This rule would enable the government to run with a permanent non-oil budget deficit, allowing for higher public spending and/or lower taxes than would be possible without the oil revenues. Thus, the Pension Fund and the fiscal rule would ensure that the large, volatile and temporary net cash flow from the petroleum sector is transferred to a stable supplement to the government budget. In essence, through this rule, the oil revenues allow higher public spending and/or lower taxes than would otherwise have been possible for the entire future. The fiscal rule had 2 other objectives – to avoid fiscal policy affected by the boom-bust cycle associated with mineral commodities and to mitigate the costs when spending of the oil revenues increases. If followed, the fiscal rule will ensure that the spending of the oil revenues will last forever, to the benefit of both current and future generations. When the direct revenues from petroleum production diminish in the future, this will be compensated by the return from the Pension Fund.
Thus, as can be seen above, the fiscal rules pursued by both Botswana and Norway can be said to be helpful to both countries in avoiding the resource curse as they seek to preserve the mineral wealth for future use as well as avoiding levels of expenditures that correspond to the boom-bust cycles of mineral commodities that is detrimental for good economic management.
Another strategy pursued by both governments is investing their mineral wealth in a sovereign wealth fund. In Botswana, this was seen in the creation of the Pula Fund in 1993. The objective of the fund was to provide greater flexibility in the management of international reserves and greater certainty in the forecasting of annual dividend payments to the government from the Bank of Botswana. The Pula Fund has 2 functions. Firstly, it was a stabilisation fund. This takes previous years’ fiscal surpluses and saves them in the Government Investment Account. This account is then used to finance fiscal deficits. Secondly, it was a savings fund for future generations. This is the intergenerational equity fund to ensure that the mineral revenues are invested in such a way that future generations can also profit from the resources, even after it has been depleted. The success of this fund can be seen in its assets reaching US$7 billion in 2008.
In Norway, this strategy was reflected in the creation of the Pension Fund. In relation to this fund, all government net revenues from the petroleum sector would be transferred to this fund.

24
However, the fund would be integrated in the ordinary government budget, so in case of a deficit in the ordinary budget, there would be an automatic deduction from the Pension Fund. This was so to avoid the situation where politicians could “pretend” that they were saving in the fund, while at the same time borrowing to finance the ordinary budget spending. Another characteristic was that money from the fund could only be used on the ordinary government budget. Thus, it could not be used to finance purposes which were not given priority in the ordinary budget procedure in the parliament. Thirdly, wealth from the fund should be invested in foreign assets. This served the dual purpose of both providing currency income from the return on the assets as well as avoiding increased investment in Norway that can push up the already high Norwegian cost level. This strategy can be said to work well for Norway as the return from investment using wealth from the Pension Fund has been fair, with an average annual real return above management costs of 3.25% during the period 1998 until April 2013.
Nonetheless, the effectiveness of these strategies have been aided by contextual conditions in both countries that have promoted good governance and the associated traits of transparency and accountability, without which the effect of these strategies may have been less beneficial.
In Botswana, this is seen in the creation of the National Development Plans involving a consultative system of committees that include members of civil society as well as senior political offices. These include the House of Chiefs, which include 8 hereditary tribal chiefs in matters pertaining to the review of parliament decisions. By continuing the Tswana tribal tradition of consultation, it enabled Botswana to be transparent and accountable, especially on government officials. Moreover, the consultative approach created a degree of trust in the government – the sense that government exists to serve the people and promote development and is not the instrument of one group or individuals for the purpose of getting hold of the wealth. This transparency is also seen in how adherence to the National Development Plans are ensured by a rule that makes it illegal to implement any additional projects without going back to parliament once the plan has been approved. The plans therefore prevent the starting of projects for which no provision was made to cover the total costs over time. In relation to the Pula Fund, adherence to rules prevent the government from interfering in the investments of the funds as well as using its assets. Moreover, the country’s requirement for parliamentary approval of changes to the budget had promoted the efficient management of the intergenerational fund.
In Norway, in relation to the Pension Fund, the central bank, Norges Bank was tasked with handling the fund. It was well-respected and had experience from managing currency reserves. Moreover, asset managers of the fund from the central bank are supervised by the bank’s Control and Compliance Unit, which in turn is supervised and controlled by the bank’s Executive Board and internal audit. Further up, the bank is supervised by the Supervisory Council as well as the Ministry of Finance. Finally, the latter is supervised by the Office of the Auditor General. Thus, there are many layers to ensure transparency and accountability.
Conclusion:Therefore, other than the effective strategies that had been crafted by Botswana and Norway, there is merit in stating the point that good governance promoted by the local context contributed to the effectiveness of the strategies pursued by both countries. Without this culture in place, regardless of how good the strategies may be on paper, the likelihood they will fail upon implementation becomes higher as they could be exposed to personal interests which may not necessarily be in line with the state’s interest.

25
Question 5
(a)
DC LDC 1. Influence over the world
economy Rise of important ‘world’ and ‘global’ cities with great economic and political influence internationally. The good thing is they are trend setters but this could mean they would affect global economic trends as well. Could be targets of terrorism (e.g. NY Twin Towers & London Bombings)
2. Over-concentration of global capital: Cities have high concentration of financial services such as banking and international business. They might attract more investments compared to other countries.
3. Rising cost of living negating the quality of life.
4. Increasing Income disparity leading to residential segregation and social tensions.
1. Uneven development & under-development: Rise in mega-cities and primate cities and the negative backwash effects on the country. This could lead to uneven development and rural under-development in the LDCs.
2. Speed of growth: Rate of urban growth is so rapid that it is 3 times faster than Europe when it first started urbanising. Measures by the government are not quick enough to compliment the rate of growth. However, this rapid and massive scale of urban growth has caused many problems such as the lack of housing; water sanitation facilities and many other problems for LDCs.
3. Size of Population (Scale of the problem)
For every city-dweller in the DCs, there are 4 city-dwellers in the LDCs. The greatest numbers of large cities are found in LDCs. By 2015, 24 of the 30 largest urban agglomerations will be in LDCs.
4. Lack of resources: The greatest challenge for the government of these poorer countries is to improve the lives of the people living in these cities, given the lack of resources and corruption levels in LDCs. The LDCs are becoming urban before they attain a certain level of affluence and development levels associated with urbanisation. This could mean massive social problems which will be shown in many forms of urban deprivations in later lectures of housing and social-economic polarisations.
Strategies to manage non-hazardous solid waste in DCs and LDCs [Usually countries adopt a variety of strategies to manage non-hazardous waste] 1. Landfill
• Landfill is a very common waste disposal method but it is not a long term solution. Landfills have to be carefully designed to prevent contamination of

26
groundwater, air and land. Usually the sites are barren and non-productive brown-field sites.
• However, in many land-scarce urban locations, land is precious and expensive, the amount of land is limited and many landfills are running out of space. Once the landfill has exceeded its carrying capacity, it might not be able to be redeveloped as it could be toxic or polluted.
• In Singapore, for instance to reduce land for landfills, the government has been trying to look at other innovative means to reduce waste sent to the landfills. Pulau Semakau is a unique offshore landfill that is constructed in the sea and operated since 1999, about 200,000 tonnes of solid waste and all incinerated ash are sent to the landfill annually to 2035.
• The island covers a total area of 3.5 square kilometres and has a capacity of 63 million m³. The landfill is filled mainly with ash from Singapore’s 4 incineration plants. The landfill was designed to be clean, free of smell and is actually quite scenic. Recreational activities are allowed on the island. And care was done during its construction to reclaim the sea into land, to reduce the damage done to the corals. The landfill is lined with impermeable membrane and clay and any leachate produced is treated a plant onsite the island. Regular water testing is also carried to ensure its safety to prevent leakages. [Used in combination with Taxes]
• In the UK, to reduce waste sent to the landfills, they have implemented a Landfill Tax since 1996.
• In Sweden, less than 1 per cent of Swedish household waste was sent to landfill last year or any year since 2011.
• There is a ban on landfill in EU countries, so instead of paying fines, governments have to look at ways to reduce the waste generated.
2. Incineration • Incineration is the burning of waste at high temperatures. The process can
release harmful emissions and gases into the atmosphere. Such emissions can be reduced via improving combustion techniques and fitting pollution control devices.
• The burning of waste to produce energy can be adopted in incineration. • Incineration can also reduce mass of waste from 95-96%, hence reducing
storage space in landfills that are fast filling up. Incineration merely reduces the waste sent to landfills but landfills are still needed.
• Sweden is a country known for its high ability to sort and recycle waste and its incineration plants lack garbage. The incineration plants produce electricity to supply 250,000 homes and heating for 950,000 homes.
• Since 1991, Sweden was one of the first countries to implement a heavy tax on fossil fuels and its incineration plants generates electricity from renewables.
• Incinerated ashes constitute 15 per cent of the weight of waste before burning. From the ashes, metals are separated and recycled, and the rest, such as porcelain and tile, which do not burn, is sifted to extract gravel that is used in road construction. [Recycling] About one per cent still remains and is deposited in rubbish dumps. [Landfills]
• The smoke from incineration plants consists of 99.9 per cent non-toxic carbon dioxide and water, but is still filtered through dry filters and water. The dry filters are deposited. The sludge from the dirty filter water is used to refill abandoned mines.
• The Swedish government also worked on educating the people to change their mindset and habits and recycle and reuse, to generate less waste.

27
• There has been a national campaign called “Miljönär-vänlig” who has been around for several years to promote repairing, sharing and reusing. Recycling stations are as a rule no more than 300 metres from any residential area. Most Swedes separate all recyclable waste in their homes and deposit it in special containers in their block of flats or drop it off at a recycling station.
• Swedish households sort their newspapers, plastic, metal, glass, electric appliances, light bulbs and batteries. They also separate food waste and all of this is reused, recycled or composted.
• Rubbish trucks are often run on recycled electricity or biogas. Wasted water is purified to the extent of being potable. Special rubbish trucks go around cities and pick up electronics and hazardous waste such as chemicals.
• They government has a cohesive national recycling policy that engages the private sector as well, where they import and burn waste to produce energy for the national heating network to combat the freezing Winters in Sweden.
• Other examples, private companies like H&M has begun accepting used clothing from customers in exchange for rebate coupons in an initiative called Garment Collecting.
• The Optibag company has developed a machine that can separate coloured waste bags from each other. People throw food in a green bag, paper in a red one, and glass or metal in another. Once at the recycling plant, Optibag sorts the bags automatically. This way, waste sorting stations could be eliminated.
• The southern Swedish city of Helsingborg even fitted public waste bins with loudspeakers playing pleasant music – all in the name of recycling.
3. Taxation • This method tries to deter waste production by passing the cost of waste
management to the consumers. This hopes to reduce waste and increase recycling rates. Cost can be passed on to consumer by increasing retail products for its packaging. This method is also often combined with other methods such as recycling.
• For instance, the UK has this environmental tax called the Landfill Tax of 1996, where to avoid the extra cost, the country commits to reducing waste through industrial legislation and increasing the cost of disposing waste to landfills. However, UK has not been able to reduce the waste, hence to reduce the money they have to pay for the Landfill tax, the UK pays transport cost to have their waste transported to Sweden’s incineration plant.
• The Landfill tax is also a means for the UK to reach the EU target that UK has committed to increase the percentage of waste generated in the country to 50% in 2020. UK hasn’t reached their goal yet, recycling in the UK has peaked at around 45% in 2014. EU target is 65% of the waste be recycled by 2030.
• The UK government also has invested millions into recycling facilities and energy recovery plants. This also indirectly create jobs.
4. Recycling & Recovery • In many LDCs, many rural-urban migrants have difficulty securing employment
and many end up scavenging through waste sites to obtain any materials that they can sell.
• Also in many LDCs, due to the sheer population size and lack of proper waste facilities, much of the waste is disposed of on the streets and the sewers.
• To solve the issue which has socio-economic and environmental impacts, innovative means to incorporate these waste-pickers to their waste management schemes. In Buenos Aires, the government has legalized the informal garbage collectors recognizing their contribution to recycling and urban sanitation.

28
• In Bogata, waste pickers have formed co-operatives to bid for municipal waste collection contracts.
• Bandung has an ‘integrated resource recovery’ strategy for waste management based on co-operation between the municipal authority, NGO and a local community of scavengers. The program was able to help provide shelter upgrading, health-care provisions, toilet construction and various economic activities such as composting of organic waste and seed farming. The plan is to get aid from government such as tax incentives for industries.
• The key to sustainability it seems is to draw linkages between socio-economic and environmental goals.
• In DCs, there are more formalized recovery and recycling schemes for metals and other materials like paper and glass. For instance, in Germany, there are numerous recycling stations at supermarkets for consumers to return their plastic and glass materials for money.
• Recycling can reduce the amount of waste sent to landfills and incineration. • Less raw materials are needed and this reduces negative pollution and
conserves resources from future generation. • This strategy also creates employment opportunities (economic) and have
good environmental and social benefits. Question 6
(a) Explain the reasons to account for urban re-imaging in countries at high levels of development.
[9]
Causes Economic Changes
• Deindustrialisation & offshoring– global shift of manufacturing growth from the west to the LDC
• Move from manufacturing to tertiary industries (Tertarisation)
• Decentralisation of industries out of congested cities to Greenfield sites and industrial estates on the periphery. Companies might find peripheral location cheaper or due to proximity to skilled labour in suburbs. High cost of development in CBD locations and peripheral locations offer lower costs.
• This also leads to suburbanisation as the rich move away from the city centre.
• Unemployment – especially for blue-collar workers, jobs might be also be more for females
(b) To what extent have urban re-imaging strategies benefited everyone living in the cities of countries at high levels of development?
[16]
Define Key terms: Urban Re-imaging strategies 24 hour cities, flagship development project, heritage
tourism & cultural tourism (Re-imaging strategies are part of Gentrification efforts to project a better image of the inner city to attract investment back so as to reverse the negative effects of inner city decline)
Gentrification projects aim to: Redistribute income within the city through the ‘trickle-down’ effect. I.e. trickle down of
benefits into the pockets of the most disadvantaged through job creation, servicing visitors and incoming visitors

29
Increased consumer spending can spur the multiplier effect as other related and non-related industries develop
Reverse urban decline via the promotion of economic vitality, improving social conditions, social integration, upgrading & improving physical environment of city
Causes of urban decline
1. De-industralisation 2. Economic decline 3. Suburbanisation 4. Influx of migrants
Negative effects of inner city decline:
Economic, social and environmental decline
• Lack of services • Unemployment • Drugs and crime • Urban decay • Road congestion and pollution • Lack of green space
Suggested Thesis Points (Body): Using the case study of Sheffield
Benefits in terms of economics and physical infrastructure, likely to be benefiting only the
middle class people.
Didn’t really benefit the poor.
• Overall there has been a stunning transformation in the visual appearance of the area
• 1.7 billion pounds of public sector investment attracted a further 6.1 billion of private sector investment, mainly in new businesses, office development and housing
• The population of the area increased from 39,000 in 1981 to 68,000 in 1995
• 140 million was spent on reclaiming a total of 7 sq kilometres of derelict land
• 950 million was spent on improving access to the area, including new roads, the Docklands Light Railway and the London City Airport
• The number of businesses located in the area increased from 1000 in 1981 to 2350 in 1995 and the number of jobs from 27,000 to 66,000
• 19,000 new homes were built refurbished
• 7700 council houses were refurbished (Some help for the poor but insufficient)
• Most of the new housing is built with the encouragement of the LDDC; housing is very expensive and well beyond the reach of the original inner city residents. This has led to major gentrification
• Although 7,700 council houses were refurbished, relatively little was done for locals particularly in the early years of the LDDC.
• Most of the new jobs (in areas such as financial services and the media) need highly skilled or experienced people. Few opportunities have opened up for the relatively unskilled inner city residents
• The influx of highly paid professional population has increased socio-economic inequalities and highlighted the poverty in the social housing estates
• The rapid changes has destroyed the traditional close-knit ‘Eastenders’ community
• Inadequate public expenditure on transport infrastructure means that transport links to the area are inadequate.
Re-imaging hopes to bring back economic investments to the city centre, however, redistribution of income is not uniform.

30
Suggested Points for Conclusion:
• Analyses that there are global, structural and systemic problems that re-imaging cannot fully address
• Re-imaging strategies are merely marketing strategies that change the physical landscapes via redevelopment but often they do not solve root problems of inner city decline of social inequality and economic restructuring
•

31

Prelim H2 P2 Answer Key
Question 1
(a) Suggest a plan detailing how students managed to collect the data provided in Resource 1, 2 and 3.
[8]
1. Groups and venues Students could organise themselves into teams, each team will be assigned to a specific venue, select a few suitable housing estates for instance a mature estate with more elderly and a newer estate with more future elderly residents. In the neighbourhoods specifically, they will choose a suitable public spot to find the specific residents to do the job.
2. Sample Size: The students should conduct the surveys with the residents each student should at least do 10 surveys with random elderly/future elderly residents. This is to ensure that the sample size of the survey (total 120 surveys) would be sufficient for data analysis. At each estate the number of surveys should be equal for fairness in terms of comparison by sample size.
3. Timing of the survey: Students should ideally consider the timings that would allow them to have enough respondents to complete their surveys. Students need to choose wisely their timings (e.g. weekday or weekend) to collect sufficient data. For instance maybe, 3 shifts per day at select timings (peak or non-peak hours), where there are more human traffic to be able to have sufficient respondents.
4. Survey questions Students should design a short survey with a few questions asking respondents about their interaction levels. The survey should be short in MCQ or short answer questions, so that respondents would be willingly to participate, as it doesn’t take up too much of their time.
(b) Explain how Resource 1, 2 and 3 can help the students understand more about the needs of the elderly in Singapore.
[6]
• Resource 1 shows the level of community participation levels of the elderly, beyond physical infrastructure, it is important to know the social dimensions of the need of the elderly. Data suggest that most of the elderly have low levels of community participation, so more could be done to encourage community participation.

• Resource 2 shows the reasons why the elderly are not participating in community activities. Resource 1 shows the data but not the reasons behind it so, resource 2 will provide the reasons behind it.
• Resource 3 looks at the frequency with which elderly
meet with the elderly. This could help us understand how socially integrated the elderly are and their social connections. Their living arrangement could also be inferred from this.
• All 3 resources provide us an understanding to the social aspects of the needs of the elderly.
(c) Identify the data representation method in Resource 3 and state its usefulness and limitations.
[3]
Bar Graph Usefulness:
• Bar graphs are visually easy to understand, indicating the % clearly.
• It also shows 2 categories of elderly and future elderly able to compare future generations.
• Shows clearly the percentages accordingly.
Limitations:
• We do not know the sample size of participants for the survey
(d) Suggest and justify another data representation method to showcase data in Resource 2.
(d)
Piechart
Advantages • display relative proportions of multiple classes of data • size of the circle can be made proportional to the total quantity it
represents • summarize a large data set in visual form • be visually simpler than other types of graphs • permit a visual check of the reasonableness or accuracy of
calculations • require minimal additional explanation • be easily understood due to widespread use in business and the
media
Bar-graph

Advantages • show each data category in a frequency distribution • display relative numbers or proportions of multiple categories • summarize a large data set in visual form • clarify trends better than do tables • estimate key values at a glance • permit a visual check of the accuracy and reasonableness of
calculations be easily understood due to widespread use in business and the media
(e) Identify some obstacles that students would face during the data collection process.
[3]
• Elderly might not want to participate in the interview either due to lack of interest or fear of privacy. Care-takers might not want the elderly to participate.
• Language issues such as the elderly only know dialect that the surveyors might not understand or able to translate.
• Health issues such as the elderly being hard of hearing or having dementia which might affect accuracy of data.
Question 2
(a) Using Resource 1 and 2, compare the rainfall and temperature characteristics of Mangalore, India and Iquitos, Peru.
[6]
Similarities Low annual range in temperature for both locations though Mangalore slightly higher. Iquitos is about 1 degrees and Mangalore is about 3 degrees High average annual temperatures exceeding 25 degrees Celsius. Iquitos at 26.7 degrees and Mangalore at 27.9 degrees High annual rainfall for both locations. Iquitos at 2865mm and Mangalore at 3200mm
Differences Rainfall is rather consistent for Iquitos ranging from 160mm in July to 325mm in March (no distinct dry season). Rainfall is rather uneven for Mangalore (ranging from 0mm in January and February to 1000mm in July.

Highest peak rainfall for Mangalore is much higher than peak rainfall of Iquitos (1000mm versus 325mm)
(b) Using Resource 1, 3 and your own knowledge, account for the
precipitation pattern for Mangalore, India. [6]
For this question, explain the seasonal changes of the monsoon with changes in the ITCZ in January and July. NE monsoon Drier as ITCZ shifts south during northern hemisphere winter High pressure in Northern Hemisphere Dry continental air blows from Asian continent from the Siberian high Dry conditions. In July, SW monsoon ITCZ shifts north, South west monsoonal winds blow across the Indian ocean towards Asian landmass (Asiatic low) due to strong solar heating and resulting in low surface pressure over Asian landmass Brings moisture as the winds pick up moisture from the Indian ocean Wet conditions Mangalore is also near the coast near the Western Ghats (If students know though not necessary) Mountain barriers facilitate the trapping of precipitation along the windward coastal area near where Mangalore is located High precipitation results.
(c) Using Resource 1 and Resource 3, explain how flood risk in Mangalore may differ in December and in July.
[4]
December lower flood risk Drier conditions Lower discharge levels Within bankfull discharge levels July Higher flood risk High intense precipitation above 1000mm Saturated soil conditions, higher discharge levels Exceed bankfull discharge levels Higher flood risk
(d) Imagine you are working for the Flood management authorities in India, suggest a plan which you can advise the authorities to reduce the impacts of flooding in Mangalore based on information in Resource 1 and Resource 3.
(9)
Indicative content: For this Question, can make use of points studied in flood management such as hard and soft management measures and also flood warning systems. Any 4 points well explained. Plan can include at least 3 points from the various management strategies from Prediction, Mitigation and Response:
- Flood and rain warning systems

- Recurrence interval (but not recommended unless records are kept (difficult to predict due to erratic weather these days)
- Flood risk and hazard mapping - Satellite imaging and terrain mapping (to determine low lying
and high risk areas) - Flood risk planning (If possible reduce building in flood prone
areas or if need to build must have good drainage and pumps to manage areas)
- Hard measures such as flood guard, watertight encasement, building of settlements on higher stilts may reduce damages cause by floods
- Others may also include channelization measures to reduce risk of flooding
- If all else fails, need to have contingency plans to deal with floods such as disaster relief, resettlement
- In urban areas may also need to clear and improve drainage and add pumps to prevent pluvial floods
** Note: Students are to talk about how these measures can help the authorities achieve planning objectives of reducing flooding impacts. Please DO NOT talk about limitations in this aspect.

Question 3
(a) With reference to Resource 1, describe the global distribution of water scarcity issues.
[4]
Economic water scarcity Mainly found in central and Southern parts of Africa, Southern parts of Asia, Southern central America and North western parts of South America Physical water scarcity Central and Western Asia + Middle East, Southeast Australia, South Africa and North Africa. Also found in Central North America Approaching water scarcity Madagascar, Eastern Europe, central Asia, central America + Eastern South America Little or no water scarcity North Asia, Large parts of Europe, North America and Large parts of South America
(b) Using Resource 1, explain the difference between economic and physical water scarcity.
[2]
Absolute Water Scarcity More than 75% of river runoff extracted for agriculture and human use. i.e. Physical shortage in resource Economic water scarcity Less than 25% of river runoff extracted for agriculture and human use. Can also arise as a result of inability to tap on resource due to limited infrastructure or water is too polluted for human use. Area usually have plentiful resource.
(c) Using Resource 2 and your own knowledge, describe and explain why water withdrawal ratios vary between different parts of the world.
[8]
Indicative content: Agriculture withdrawal ratios highest in Asia and Africa at 81% and 82% respectively Large percentage may be attributed to the fact that both continents have many countries that are largely agrarian economies. These economies may also depend largely on export of agricultural produce or for own domestic consumption Thus high percentage of water withdrawal via agriculture Europe and America highest withdrawal from industries as these economies are industrialised economies that depend highly on manufacturing Therefore water use for industries tend to be very high

For municipalities, they took up the lowest ration of withdrawal for all regions but tends to be higher for more developed regions such as Europe and Oceania. For the Americas it is skewed as it not only includes the more developed regions such as USA and Canada but also poorer regions such as Mexico and Ecuador. Reasons for higher municipal withdrawal for more developed regions compared to poorer regions attributed to availability and ability to afford to pay for water. In less developed regions, due to high cost, poor people will have to ration their water use and conserve every drop they have. Likely for them to reuse water as well due to also difficulty of obtaining water for use. High cost may also be from local people selling water at high price to these people who do not have access to piped water.
Level Marks Descriptors
3 7-8 Clear focus of question with use of relevant knowledge and examples in the response.
2 4-6 Response provides some analysis and evaluation. Most terms are accurately used. Generally well organised and structured.
1 1-3 Response is brief and fragmentary and lacks clarity.
0 0 No Creditworthy response
(d) With reference to Resource 3, briefly explain the transboundary nature of the Mekong river.
[2]
- The Mekong river flows through 6 countries, starting from China,
entering along Laos and Myanmar and along the northern parts of Thailand, entering Cambodia and finally emptying into Vietnam.
(e) Using Resources 3,4 and your own knowledge, examine the nature of issues relating to transboundary water use.
[9]
Indicative content Nature of issues relating to transboundary water use can be classified into 3 aspects:
- Quality (Environmental access to clean water) - Quantity (Competing claims for limited supply of water) - Timing (Building of dams)

According to Resource 4, the nature of issues relating to transboundary issues relating to water use may be relating to access to the water due to population growth. In the resource, it can be seen that various countries along the Mekong river has seen tremendous population growth from 1990 to 2018. Thailand’s population has grown by 11.1 million, Cambodia by 7.3 million, Laos by 2.7 million and Vietnam by 30.5 million. As such quantity may be an important issue in the competing use of water. Secondly timing may also be an issue in Transboundary water conflicts. Dam building in this case the Xiaowan Dam in China and several dams along the Mekong river to either capture water for water use or generation of electricity for the growing population could also be an issue. The building of dams affect fisheries as spawning grounds are flooded and can no longer be reached. In addition, the trapping of sediments behind dams can also affect the viability of agriculture downstream as fertile sediments can no longer reach the delta. The issue is also further complicated by control of waters upstream as seasonal fluctuations in river is disrupted. (Flooding can take place when water is suddenly released downstream and cause flooding in the downstream states) [** Students can also use other case studies to bring up issue of timing] Lastly the nature of issues relating to transboundary water use can also be related to quality. Environmental pollution released by agricultural seepage in the upstream states as in the case of Colorado river severely degrades the water quality making it unusable by the time it reaches Mexico. Furthermore, the problem is worsened when dams were built upstream and siphoning water from Mexican delta. The result is decreased volume in flushing out pollutants. In the case of Mekong river, blasting of rocks to improve navigational safety can also cause sedimentation and severely degrading water quality in the Mekong river. As such, issues relating to transboundary nature of water issues are often multi-faceted and may involve more than one reason in determining the nature of the conflict.

Question 4
(a) With reference to Resource 1, describe the trend of the amount and share of electricity produced from nuclear sources in the world from 1990-2013.
[4]
From 1990 to 2013, there has been a decrease in % of world total share of electricity from nuclear sources. It was 17% in 1990 and 11% in 2013. [1] There has been an inverse relationship between decrease in % of world total and total amount of electricity. There has been an increase in total amount of energy from nuclear energy, the amount increased from 1900 Twh to 2600 Twh in 2010 [1], from 2010-2013, there is a slight decrease to 2300 Twh. [1]
(b) With reference to Resource 2, describe the generating capacity of nuclear power plants (In Operation and Under Construction & Planning) in major countries.
[5]
• In terms of in operation capacity of nuclear power plant, the highest 3 countries are DC, they are USA with 10,267.7, France and Japan.
• The lowest three in operation are UK, India and Brazil. (Cite resources) In terms of under construction and planning, the highest is China with 6076.2 and Russia with 2761.2, these are the NIEs.
• The lowest under construction would be Brazil, France & UK (cite)
• In terms of world total operation 392,226 is in operation and under construction and planning it is 200,810 MV).
(c) With reference to Resource 2, discuss the implications of nuclear power plants plans in the major countries.
[5]
Positive • Supposedly a cleaner source of energy as it does not
produce carbon dioxide.
Negative
• Potential health risk of radiation exposure in case of leakages.

• Radioactive waste disposal needs to be carefully managed and could cause health and environmental problems (contamination of water).
• Nuclear energy requites uranium as a fuel and this contributes to release of carbon dioxide
• Costly on government revenue
(d) With reference to Resource 3, compare and contrast the total investment in clean energy of China and the EU.
[6]
Similarities • % of GDP in 2010 total investment in clean energy is the
same in 2010 at 0.7% of GDP. • Total investment in clean energy in terms of per capita, both
the EU and China have the same amount in 2015. (cite value)
Differences • EU has higher per capita investment in the year 2005. (Cite
value) • % of GDP China has higher figures than the EU from 2005-
2015. (cite value) • For the EU, total investment level is higher from 2005-2012
but from 2013 onwards, China has greater investment levels. (cite value)
• China increase energy sees an increase, EU increases to 2011 and then decreases. China sees a steadily increase of investments whereas EU sees an increase follow by a decrease.
(e) With reference to all the resources, assess China’s contribution to sustainable development.
[7]
Resource 2, China is planning more nuclear plants and is currently the 6th highest in operation. Hence it contribution to nuclear energy is of great influence. The aggressive plans could be that China is the world’s largest population and industries, their shift to nuclear energy might be less environmentally taxing in carbon dioxide emission since currently China is using a lot of unrenewable resources such as coal. However, the impact of nuclear energy could be very good. Given the health risk, these might not be environmentally and socially sustainable. Nuclear energy is not sustainable as uranium fuel is finite. Nuclear power is not carbon free. It requires water to cool superheated ones and potential for water pollution is high. In terms of economic sustainability, nuclear energy takes a huge contribution of the China’s GDP, this could involve high government

subsidy and taxes which could be used for other energy investment such as solar and wind power or other social spending areas. This might not be economically sustainable. Nuclear power plant generates more electricity to conventional power plants that run on fossil fuels, hence given China’s population size and industrial needs, the government might have felt that it is more efficient to use nuclear power plants. Nuclear power plant could create potential jobs for peoples (short term economic sustainability) but in the long term social impacts might outweigh the short term gains. Potential solar and wind energy for provision for electricity but doesn’t seem to looking this areas as much as nuclear energy. These sources tend to be less toxic compared to nuclear energy and are also renewable. China has been looking at HEP but there is environmental damage and transborder conflict as well. Such as the Mekong river involvement.

Class Adm No Candidate Name:
2018 Preliminary Exams
Pre-University 3
GEOGRAPHY 9751/01 Paper 1 Structured Essay Questions 17 September 2018 3 hours Additional Materials: Answer Paper World Outline Map INSTRUCTIONS TO CANDIDATES Write your name, admission number and class on all the work you hand in. Write in dark blue or black pen on both sides of the paper. You may use a soft pencil for any diagrams, graphs, or rough working. Do not use staples, paper clips, highlighters, glue or correction fluid. Answer three questions. One from each section. You should make reference to appropriate examples studied in the field or the classroom, even where such examples are not specifically requested by the question. Diagram and sketch maps should be drawn whenever they serve to illustrate an answer. The world outline map may be annotated and handed in with relevant answers. You are reminded of the need for good English and clear presentation in your answers. At the end of the examination, fasten all your work securely together. The number of marks is given in brackets [ ] at the end of each question or part question.
___________________________________________________________________ This document consists of 2 printed pages
[Turn over

2
Section A – Tropical Environments
Answer one question from this section.
1 (a) Explain how the characteristics of tropical climates based on the Köppen-Geiger climate classification system are similar and distinctive with one another. [12]
(b) Discuss the extent to which trade winds play a role in influencing rainfall patterns in the tropics. [20]
2 (a) Explain the impacts of tropical deforestation at different spatial scales. [12]
(b) 'Deforestation is an issue that can be managed in the tropics'. To what extent do you agree with this statement? [20]
Section B – Development, Economy and Environment
Answer one question from this section.
3 (a) Explain the reasons for underperforming resource-rich countries. [12]
(b) Discuss the extent to which overpopulation can help explain the level of development of low-income countries. [20]
4 (a) Explain the factors contributing to transboundary water conflict. [12]
(b) Evaluate the effectiveness of strategies used to manage transboundary sources of water supply and associated conflicts. [20]
Section C – Sustainable Development
Answer one question from this section.
5 (a) Explain the evidence of climate change since the last Ice Age. [12]
(b) ‘Adaptation strategies to lower impacts of climate change is more worthy an investment than mitigation strategies against climate change’. Discuss the validity of the statement. [20]
6 (a) Explain the difficulties of measuring urban liveability in cities of low levels of development. [12]
(b) “Cities are liveable places for the elderly”. How far do you agree with the statement? [20]

1
2018 Preliminary Exams
Pre-University 3
GEOGRAPHY 9751/02 Paper 2 Data Response Questions 10 September 2018 3 hours
READ THESE INSTRUCTIONS FIRST This Insert contains all the Resources referred to in the questions.
___________________________________________________________________
This document consists of 9 printed pages and 1 blank page.
Class: Adm No
Candidate Name: _________________________________

2
Resource 1 for Question 1
Location of Rolls-Royce (in red box) in Seletar, Singapore

3
Resource 2 for Question 1
Types of partnership that Rolls-Royce has established with the local institutions in Singapore
Partnerships with local institutions
Type of institutions Purpose of Partnerships
Institute of Technical Education (ITE)
Public Vocational Education Institution agency
To develop courses and promote information sharing in the fields of aircraft and marine propulsion
Singapore Workforce Development Agency (WDA)
Government Statutory Board under Ministry of Manpower of Singapore
To develop 11 new aerospace manufacturing programmes. This will be part of the Precision Engineering Workforce Skills Qualifications (PE WSQ) framework and will be pegged at Higher and Advanced Certificate levels.
Singapore Airlines Engineering Company
Singapore TNC Provide aerospace professionals with opportunity to acquire advanced skills in specialist areas for long-term career development within aerospace industry
Agency for Science, Technology and Research (A*STAR)
Government Statutory Board under Ministry of Trade and Industry of Singapore
Joint lab collaboration programme to develop next-generation aerospace manufacturing and maintenance, repair and overhaul (MRO) capabilities enabled by advanced processes, automation and digital technologies. This for the Small-Medium Enterprises (SMEs) to adopt the latest technologies to be part of the high-value global manufacturing supply chain.
Defence Science and Technology Agency (DTSA)
Government Statutory Board under the Ministry of Defence of Singapore
To focus on the use of data analytics and digital twins aimed at optimising the time and resources spent on engine maintenance, and thereby improving the availability and performance of the Republic of Singapore Air Force (RSAF) aircraft1. These capabilities will potentially transform engine support and maintenance training.
Total investment in the Rolls-Royce Seletar facility has exceeded S$700 million and has created 500 new, highly skilled jobs.

4
Resource 3 for Question 2
Protected Status of Karst Areas in Southeast Asia
Resource 4 for Question 2
Climograph and Karst Landscape of Ha Long Bay, Vietnam

5
Resource 5 for Question 2
Mekong River in Vietnam
Resource 6 for Question 2
Forest Cover in Vietnam from 1990 to 2010
A B

6
Resource 7 for Question 3
Nike’s production map in 2014

7
Resource 8 for Question 3
Nike’s job openings and the description of the jobs offered in its US and global corporate offices in 2015
Resource 9 for Question 3
China’s factfile
Year 2005 2010 2015 Total Population (billions)
1.304 1.338 1.364
Rate of natural increase (%)
-0.02% -1% -5.29%
GDP per person (US$)
1753 4561 8069
Employment in manufacturing (%)
30.96 36.37 52.43

8
Resource 10 for Question 4
Worldwide Investments in Renewavle Energy from 2006 to 2015
Resource 11 for Question 4
Renewable Energy Investments by Techonolgy (%) in 2015

9
Resource 12 for Question 4
Leading Investors in Renewable Energy (USD Billion) in 2015
Resource 13 for Question 4
China’s Targeted Energy Mix by 2050

10
BLANK PAGE

Class Adm No Candidate Name:
[Turn over
2018 Preliminary Exams
Pre-University 3
GEOGRAPHY 9751/02 Paper 2 Data Response Questions 10 September 2018 3 hours Additional Materials: Answer Paper 1 Insert World Outline Map INSTRUCTIONS TO CANDIDATES Write your name, admission number and class on all the work you hand in. Write in dark blue or black pen on both sides of the paper. You may use a soft pencil for any diagrams, graphs, or rough working. Do not use staples, paper clips, highlighters, glue or correction fluid. Candidates answer all questions. The Insert contains all the Resources referred to in the questions. You should make reference to appropriate examples studied in the field or the classroom, even where such examples are not specifically requested by the question. Diagram and sketch maps should be drawn whenever they serve to illustrate an answer. The world outline map may be annotated and handed in with relevant answers. You are reminded of the need for good English and clear presentation in your answers. At the end of the examination, fasten all your work securely together. The number of marks is given in brackets [ ] at the end of each question or part question.
___________________________________________________________________ This document consists of 5 printed pages and 1 Insert.
[Turn over

2
Section A
Theme 4: Geographical Investigation
1 A group of twenty 18-year-old students were tasked with undertaking a fieldwork exercise on the impact of the aerospace industry in Singapore. They selected Rolls-Royce’s research and development (R&D) facility at Seletar, Singapore, for their investigation. Rolls-Royce R&D is located at Seletar Aerospace Park and is responsible for Rolls-Royce integrated manufacturing and research and training. The facility assembles up to 250 engines and produce 8,600 fan blades (a Roll-Royce state-of-the-art patented technology) annually. Singapore is the regional centre for Rolls-Royce’ R&D and corporate functions. The group was divided into four teams of five students each to collect data from:
(i) the employees and management staff of Roll-Royce Seletar (ii) businesses within 1km of the site (iii) residents of the adjacent housing estates (such as Sengkang and Punggol) (iv) strategic local partners working with Rolls-Royce
The teams would visit the Rolls-Royce facility at Seletar to collect data from employees, businesses and residents on five weekdays in March. Resource 1 shows the location of Rolls-Royce (in red box) in Seletar, Singapore. Resource 2 shows the types of partnership that Rolls-Royce has established with the various stakeholders in Singapore to bring about positive impacts to the local community.
(a) Suggest a research question for the investigation based on Resource 1 and state how the research question might be suitable for the investigation. [4]
(b) Suggest an appropriate plan to collect primary data in the area as represented in Resource 1. [7]
(c) Suggest how students could supplement the information and findings presented in Resource 2 to find out more about Rolls-Royce’s impact on local industries. [5]
(d) Using Resources 1 and 2, evaluate how this research might be useful in
understanding the impacts of Rolls-Royce R&D in Singapore. [9]

3
Section B
Theme 1: Tropical Environments
The Tropical Environment of Vietnam
2 Resource 3 shows data on protected status of karst areas in Southeast Asia. Resource 4 shows the climograph and a photograph of the karst landscape of Ha Long Bay in Vietnam. Resource 5 shows an aerial photograph of the Mekong River in Vietnam. Resource 6 shows the changes in forest cover in Vietnam from 1990 to 2005.
(a) Describe Vietnam’s karst landscape relative to those in other Southeast Asia countries’ as shown in Resource 3. [3]
(b) Using Resource 4, explain the conditions necessary for the development of karst landscape. [7]
(c) With the aid of a well-labelled diagram, explain the channel characteristics at cross-section AB as shown in Resource 5. [5]
(d) With reference to Resource 6, suggest two reasons for the trends in forest cover in Vietnam from 1990 to 2010. [5]
(e) Explain how the changes in primary forest cover in Vietnam as shown in Resource 6 would affect the tropical environment of Vietnam shown in Resources 4 and 5. [5]

4
Theme 2: Development, Economy and Environment
Nike’s Global Production Network
3 Resource 7 shows Nike’s production map in 2014. Resource 8 shows Nike’s job openings in the US and around the world and the description of the jobs offered in its corporate offices in 2015. Resource 9 is a factfile about China.
(a) With reference to Resource 7, describe the spatial distribution of Nike’s global production network. [3]
(b) Suggest reasons for the locations of Nike’s global production network as shown
in Resource 7. [6]
(c) With reference to Resource 8, describe the global patterns of job openings (including US) offered by Nike’s corporate offices. [3]
(d) Using evidence from Resource 9, suggest two reasons why Nike may want to continue its operations in China. [4]
(e) Using Resources 7, 8, 9 and your own knowledge, recommend whether Nike should prioritise its investment in Asia Pacific or the Americas region and justify your decision. [9]
5
Theme 3: Sustainable Development
Global and China’s Investments in Renewable Energy 4 Resource 10 shows the worldwide investments in renewable energy between 2006 to
2015. Resource 11 shows the renewable energy investments by technology in 2015. Resource 12 shows the leading investors in renewable energy in 2015. Resource 13 shows China’s targeted energy mix by 2050.
(a) With reference to Resource 10, describe the changes in worldwide investments in renewable energy between 2006 to 2015. [4]
(b) With reference to Resource 10, account for the changes in worldwide investments
in renewable energy between 2006 to 2015. [4]
(c) Explain possible reasons contributing to the proportion of renewable energy investments by technology as shown in Resource 11. [4]
(d) Discuss possible reasons contributing to China’s investment in renewable energy as shown in Resource 12. [6]
(e) Discuss the likelihood of China achieving its aims by 2050 as stated in Resource 13. [7]
Copyright Acknowledgements
Question 1 Resource 1 http://www.streetdirectory.com/sg/engine-test-rolls-royce-singapore/6-seletar-aerospace-rise-797575/105236_151296.html (last accessed 20 Aug 2018)
Question 1 Resource 2 https://www.rolls-royce.com/media/press-releases-archive/yr-2010/101028-enhance-skills.aspx https://www.rolls-royce.com/media/press-releases-archive/yr-2010/activity-contributing-to-singapore-economy.aspx https://www.a-star.edu.sg/News-and-Events/News/Press-Releases/ID/5691 https://www.rolls-royce.com/media/press-releases.aspx#18-07-2018-dsta-and-rr-partner-to-harness-digital-technologies-for-defence (last accessed 20 Aug 2018)
Question 2 Resource 3 https://academic.oup.com/bioscience/article/56/9/733/262911 (last accessed 24 August 2018) Question 2 Resource 4 https://www.klook.com/activity/7448-halong-bay-day-tour-hanoi-halong-bay/ and
http://www.southalltravel.co.uk/holidays-tours/vietnam/discover-vietnam/ (last accessed 25 August 2018)
Question 2 Resource 5 https://www.flickr.com/photos/fesign/29348001830 (last accessed 25 August 2018) Question 2 Resource 6 https://news.mongabay.com/2013/09/hydro-projects-a-front-for-logging-in-vietnam/ (last
accessed 25 August 2018) Question 3 Resource 7 https://slideplayer.com/slide/8732707/ (last accessed 20 Aug 2018) Question 3 Resource 8 http://timdegner.com/nike/ (last accessed 4 May 2018) Question 3 Resource 9 Copyright, Millennia Institute, 2018 Question 4 Resource 10 https://www.rsm.global/insights/economic-insights/global-trends-renewable-energy Question 4 Resource 11 https://www.rsm.global/insights/economic-insights/global-trends-renewable-energy Question 4 Resource 12 https://www.rsm.global/insights/economic-insights/global-trends-renewable-energy Question 4 Resource 13 http://www.nepalenergyforum.com/chinas-shift-from-coal-to-hydro-comes-at-a-heavy-price/

Class Adm No Candidate Name:
2018 Preliminary Exams
Pre-University 3
GEOGRAPHY 9751/01 Paper 1 Structured Essay Questions 17 September 2018 3 hours Additional Materials: Answer Paper World Outline Map INSTRUCTIONS TO CANDIDATES Write your name, admission number and class on all the work you hand in. Write in dark blue or black pen on both sides of the paper. You may use a soft pencil for any diagrams, graphs, or rough working. Do not use staples, paper clips, highlighters, glue or correction fluid. Answer three questions. One from each section. You should make reference to appropriate examples studied in the field or the classroom, even where such examples are not specifically requested by the question. Diagram and sketch maps should be drawn whenever they serve to illustrate an answer. The world outline map may be annotated and handed in with relevant answers. You are reminded of the need for good English and clear presentation in your answers. At the end of the examination, fasten all your work securely together. The number of marks is given in brackets [ ] at the end of each question or part question.
___________________________________________________________________ This document consists of 2 printed pages
[Turn over

2
Section A – Tropical Environments
Answer one question from this section.
1 (a) Explain how the characteristics of tropical climates based on the Köppen-Geiger climate classification system are similar and distinctive with one another. [12]
Indicative Content The tropical climates are classified into the humid tropics which include Tropical Rainforest (Af), Tropical Monsoon (Am), Tropical Savanna (Aw) and arid tropics namely Sub-tropical Steppe (BSh) and Tropical Desert (BWh) climates based on the Koppen-Geiger climate classification system. Students are required to compare these tropical climates based on their characteristics, such as mean annual temperature, total annual precipitation and precipitation pattern. A higher level response will provide detailed explanation in elaborating the similarities and differences in the climatic characteristics. Knowledge on various atmospheric processes, circulation and factors operating at different spatial scales is used purposefully to elaborate on the points of comparison made. Relevant examples are also used to substantiate response. Levels marked using H2 generic level descriptors for 12m SEQ sub-part (a). Suggested Response The tropical climates are classified into the humid tropics which include Tropical Rainforest (Af), Tropical Monsoon (Am), Tropical Savanna (Aw) and arid tropics namely Sub-tropical Steppe (BSh) and Tropical Desert (BWh) climates based on the Koppen-Geiger climate classification system. All of these tropical climates are similar in having high mean annual temperature. Yet, between the humid tropics and arid tropics, there is a difference in annual temperature range, where humid tropics tend to have low annual temperature range while arid tropics tend to have larger annual temperature range. Similarly, humid and arid tropical climates differ in having high and low total annual precipitation respectively. Within the humid and arid tropical climates, there are variations that exist in their precipitation patterns. P1: Based on Koppen-Geiger climate classification system, tropical climates all have high mean annual temperature, where the average temperature of the coldest month is above 18°C.
• Tropical climates exist almost entirely between the Tropics of Cancer and Capricorn • The movement of the position of the overhead sun is confined within this region
(summer solstice: Tropics of Cancer, winter solstice: Tropics of Capricorn, Equinox: Equator)
• Hence, the tropics is characterised by high mean annual temperature due to high angle of incidence the sun rays have with the tropics of the earth’s surface, resulting in insolation to be concentrated over smaller area, thus resulting in high mean annual temperature
• Though exceptions do exist, where high altitude places within the tropics do not experience tropical climates, such as Cameron Highlands, Malaysia
• Examples of tropical climates: o Singapore (Af climate): Located 1°N of equator, High mean annual temperature
of 27°C o Bamako, Mali (Aw climate): Located 13°N of the equator. High mean annual
temperature of about 27°C o Yuma, Arizona, USA (BWh climate): Located 32°N of the equator. High mean
annual temperature of 25°C
P2: Despite having similar high mean annual temperature, humid and arid tropics differ in terms of annual temperature range. Humid tropics tend to experience low annual temperature range while arid tropics tend to have large annual temperature range.
• This could be attributed to their latitudinal position and also the shifting position of the overhead sun

3
• Places experiencing Af climate tend to be found near the equator. Their latitudinal position subjects them to high angle of incidence of insolation throughout the year, resulting in little variation in monthly temperature across the year.
o Singapore: Located 1°N of equator. Low annual temperature range of 1.7°C • Am and Aw climate tend to have slight variation in monthly temperature, causing larger
annual temperature range as compared to Af but still within the low range. o Temperatures slowly rise to their highest levels of the year before the arrival of
the rain (brought either by monsoon winds or the ITCZ) but temperature drop by a few degrees due to the presence of clouds and rainfall that help to cool the climate slightly. During the ‘winter’ season, generally clear skies allow warm temperatures by day but nights can be cool
o Akyab, Myanmmar: Located 20°N of the equator. Low annual temperature range of 7.8°C.
o Bamako, Mali: Located 13°N of the equator. Annual temperature range of 7.8°C.
• Arid tropics OTOH have large annual temperature range o High monthly temperature during the summer due to the position of the
overhead sun at the hemisphere at where the place is. Monthly temperature falls when the position of the overhead sun shifts to the other hemisphere. This leads to the high annual temperature range experienced
o Yuma, Arizona, USA: Located 32°N of the equator. Large annual temperature range of 20°C
P3: Similarly, the humid and arid tropics have high and low total annual precipitation respectively.• Humid tropics
o Generally, the humid tropics is associated with the rising limb of the Hadley Cell and the ITCZ, and thus having total annual rainfall exceeding evapotranspiration
o Their latitudinal position places them under the constant influence of the rising limb of the Hadley Cell and the ITCZ which encourages the formation of clouds and rainfall via convection and convergence of winds
o Examples Belem, Brazil (Af): Located 1°S of equator. Total annual precipitation
of 2740 mm. Chittagong, Bangladesh (Am): Total annual precipitation of 2730mm
[how topography enhances the amount of rainfall received] • Arid tropics
o Their latitudinal position subjects them to the subsiding limb of the Hadley Cell. Subsidence of air inhibits the formation of clouds and hence rain, and thus arid tropics is characterised by annual potential evaporation exceeding annual precipitation
o Examples Longreach, Australia (BSh): Close to low total annual precipitation of
266mm Cairo, Egypt (BWh): 18mm of low total annual precipitation
P4: Within the humid and arid tropics, there exists variations in precipitation pattern. • Humid tropics
o Af: Rainfall is distributed nearly uniformly throughout the year. Due to their latitudinal position, places with Af climate have high TAP that is distributed evenly throughout the year because they are under the constant influence of the ITCZ and rising limb of the Hadley Cell. High rates of atmospheric convection is promoted at the rising limb of the Hadley Cell and together with the convergence of trade winds at the ITCZ, they form large cumulonimbus clouds that often bring heavy precipitation to these places
E.g. Singapore o Am: Distinct wet and dry season. Wet season largely as a result of presence of
moist trade/monsoon winds that bring heavy rainfall to the region e.g. moist

4
SW Asian monsoon wind that bring heavy rainfall to Indian sub-continent during the middle of the year). Monthly precipitation during the peak rainfall can easily exceed 800mm. Dry season relates to the shifting of the ITCZ away from the particular hemisphere and the presence of dry winds (e.g. dry NE monsoon wind that blows past the Indian sub-continent at the end of the year) that bring little to no rain to the region
Eg. Chittagong, Bangladesh o Aw: Greater seasonality in precipitation: Seasonality of precipitation is
attributed to their location farther away from the equator. During the high sun season (summer) the ITCZ favours the formation of afternoon thundershowers. However, when the position of the overhead sun shifts to the opposite hemisphere, the arrival of the subtropical high brings descending air and the resultant lack of precipitation. Dry seasons are more pronounced and longer lasting that those of Am climate because of their distance farther from the equator that puts them closer to the mean position of the subtropical high
E.g. Bamako, Mali • Arid Tropics
o BSh vs BWh: Precipitation occurs more often during the summer months than during the winter for BSh, as a result of localised convection. For BWh, they tend to have more precipitation during the winter months whereby lower atmospheric temperature promotes the occurrence saturation and thus the formation of clouds and rain
E.g. Yuma, Arizona, USA (BWh) vs Monterrey, Mexico (BSh)
Marker’s Report • To do this question, students need to have very strong content knowledge on tropical
climates • Question is poorly done because
o Weak elaboration on how the various climate are similar or different with one another
o Lack of accurate comparison of the various climate types o Lacking relevant examples to exemplify the points
(b) Discuss the extent to which trade winds play a role in influencing rainfall patterns
in the tropics. [20]
Indicative Content The tropics can be defined as a climatic region of radiation surplus delimited by boundaries fluctuating between 30 and 35° latitude, north and south. In studying rainfall patterns in the tropics, there are a myriad of factors that influence it. The convergence of trade winds at ITCZ plays a crucial role in affecting precipitation pattern but largely in the humid tropics. It can be argued that there are many other factors such as the Hadley Cell, monsoon winds system, tropical cyclones, topography, local heating, continentality that operate at different spatial and temporal scale that could affect rainfall pattern spatially and temporally as well. A higher level response will discuss the role of trade winds in influencing rainfall patterns in the tropics with reference to other factors at different spatial and temporal scales. The analysis should be centred upon the role of trade winds yet acknowledging that these factors do not act independently in influencing rainfall patterns in the tropics. The essay must also be well-exemplified with relevant case studies. Synoptic links: Theme 1 (Past climates, tropical cyclones, tropical deforestation), Theme 3 (Climate Change) Levels marked using H2 generic level descriptors for 20m SEQ sub-part (b). Suggested Response

5
The tropics can be defined as a climatic region of radiation surplus delimited by boundaries fluctuating between 30 and 35° north and south of the equator. Based on the Koppen-Geiger climate classification system, tropical climates can be broadly classified into humid tropics which include tropical rainforest (Af), tropical monsoon (Am), tropical savannah (Aw) and arid tropics which include sub-tropical steppe (BSh) and tropical desert climates (BWh). These tropical climates exhibit variations in their rainfall patterns, such as uniformity and seasonality in precipitation or even year-to-year variability in precipitation. Although the convergence of trade winds at the Intertropical Convergence Zone (ITCZ) can largely explain for rainfall patterns in the humid tropics, especially for Af and Aw climates, by itself it does not account for rainfall patterns in the entire tropics. Furthermore, trade winds itself is unable to explain for possible long term climatic changes and also does not account for local variations in rainfall patterns. Hence, trade winds influence rainfall patterns in the tropics to a small extent. P1 [spatial scale/seasonal variations]: The convergence of trade winds at the ITCZ largely account for the high total annual precipitation in the humid tropics and the seasonality of precipitation that Aw climate experiences.
• Trade winds are formed as a result of atmospheric pressure gradient that exists between the sub-tropical high and equatorial low of the Hadley Cell
• Formation of NE and SE trades that converge at the ITCZ • Position of the ITCZ follows the position of the overhead sun • Af climate has high total annual precipitation that is well distributed across the year due
to ITCZ that is characterised by large bands of cloud that brings high amounts of rainfallo E.g. Singapore: Located 1°N of equator. Total annual precipitation of 2410 mm.
Rainfall is distributed nearly uniformly throughout the year and all months average at 220 mm of rainfall under the influence of the ITCZ
• Aw: Seasonality of precipitation is attributed to their location farther away from the equator. During the high sun season (summer) the ITCZ favours the formation of afternoon thundershowers. However, when the position of the overhead sun shifts to the opposite hemisphere, the arrival of the subtropical high brings descending air and the resultant lack of precipitation. Dry seasons are more pronounced and longer lasting that those of Am climate because of their distance farther from the equator that puts them closer to the mean position of the subtropical high
o E.g. Acapulco, Mexico: Located 17°N of the equator, it has moderate total annual precipitation of 1175mm. Great seasonality in precipitation, with wet season during the middle of the year where monthly rainfall exceeds 200mm with the arrival of the ITCZ while the end and start of the year has low monthly rainfall of less than 40mm of rainfall as the ITCZ shifts to the other hemisphere
P2: [spatial variation – humid vs arid] However, trade winds alone do not account for rainfall pattern for the entire tropics, especially in the arid tropics.
• Af: The high total annual precipitation that Af climate has is not attributed to the role of ITCZ alone. As places experiencing Af climate tend to exist within 10°N/S of the equator, their position near the equator puts them under the influence both the ITCZ and rising limb of the Hadley Cell. At the rising limb of the Hadley Cell, atmospheric convectional activity is promoted that often bring heavy thundershowers in mid to late afternoon
• Am: High total annual precipitation of Am climate is largely attributed to the role of monsoon winds. Wet season largely as a result of presence of moist monsoon winds that bring heavy rainfall to the region. Monthly precipitation during the peak rainfall can easily exceed 800mm. Dry season relates to the shifting of the ITCZ away from the particular hemisphere and the presence of dry winds that bring little to no rain to the region. Am climate has higher TAP than Aw because of the contribution of both monsoon winds and ITCZ
o E.g. Chittagong, Bangladesh: High total annual precipitation of 2730mm, with wet season in the middle of the year where monthly rainfall goes above 100mm and can exceed 500mm while dry season during the rest of the year where monthly rainfall goes below 60mm
• BSh/BWh low total annual precipitation: Their latitudinal position subjects them to the subsiding limb of the Hadley Cell. Subsidence of air inhibits the formation of clouds and

6
hence rain, and thus arid tropics is characterised by annual potential evaporation exceeding annual precipitation
o E.g. Longreach, Australia (BSh): Close to low total annual precipitation of 266mm and Cairo, Egypt (BWh): 18mm of low total annual precipitation
• BSh vs BWh pattern: Precipitation occurs more often during the summer months than during the winter for BSh, as a result of localised convection. For BWh, they tend to have more precipitation during the winter months whereby lower atmospheric temperature promotes the occurrence saturation and thus the formation of clouds and rain
E.g. Yuma, Arizona, USA (BWh) vs Monterrey, Mexico (BSh)
P3: [spatial scale – global vs local] Also, trade winds that operate at the global scale is unable to explain for variations in rainfall patterns at the local scale.
• At the local scale, topography which is the study of the shape and features of the surface of the Earth has an influence on the amount of rainfall received
• Orographic or relief rainfall is the result of condensation and cloud formation in moist air that has been physically forced to rise over topographic barriers
• When warm moist air blows against a mountain range, it is forced to rise o As it rises, the air moves into a higher elevation where the surrounding air
pressure is much lower o This allows the parcel of rising air to expand and undergo adiabatic cooling o When saturation is reached at dew point temperature, condensation occurs
and water vapour changes into water droplets to form clouds o This result in heavy rainfall on the windward side of the mountain
• At the leeward side of the mountain, dry air descends o The air parcel is going into an environment where the surrounding air pressure
is higher o The air parcel will be compressed, and compression of air heats this air parcel
and undergoes adiabatic warming o With adiabatic warming, relative humidity of the air parcel decreases. Little to
no clouds form at the leeward side which bring little to no rain • Although the convergence of trade winds may bring high amount of rainfall, topography
has the influence to cause marked variations in the amount of rainfall received on the windward and leeward sides of topographic barriers
o An example of a topographic barrier is the Himalayas which results in heavy rainfall in Terai region located in the windward slope but dry conditions to the leeward slope, such as places like the Tibetan plateau and Mongolia’s Gobi Desert despite the onset of monsoon and trade winds during the middle of the year
P4: [temporal influence: short vs long term] Even though trade winds may be able to account for short term periodic changes to rainfall patterns, it is unable to be used to explain for long term changes in rainfall patterns.
• El Nino that occurs in the Pacific Ocean basin every 3-7 years is due to the weakening or even reversal of trade winds that cause changes to the amount of rainfall received in the eastern and western Pacific
o El Nino in 2017 delivered 10 times as much rainfall than usual to Peru that cost at least 62 people’s lives
o OTOH, 2016 El Nino resulted in drought in countries like Malaysia and Singapore in the Western Pacific
• However, trade winds would not be able to account for rainfall pattern across longer time period
o [Future] Human-induced climate change Humans have been modifying the earth’s surface on a large scale
especially through deforestation. With less or no vegetation, transpiration, which is an output of the hydrological cycle, is reduced. This lowers the amount of atmospheric water vapour for the formation of clouds and hence decreases the amount of precipitation

7
E.g. In the Amazon Basin, deforestation in the ‘Arc Deforestation’ area in 2010 has reduced annual mean rainfall across the Amazon basin by about 1.8%. It is estimated that business-as-usual deforestation would result in a reduction of mean annual rainfall by about 8.1% by 2050
o [Past to possible future] Climate change Desiccation of pluvial lakes in the tropics suggest that the climate was
much cooler with increased precipitation during the Pleistocene. However, during Holocene interglacial period, the climate became more arid and pluvial lakes contracted
E.g. The Dead Sea is currently 1,292 feet below mean sea level, but records proved that its waters originally filled its basin to 1,400 feet above its present level
Such changes to climate could be attributed to the drivers such as orbital forcing, solar forcing and reduction in thermohaline circulation and not due to the role of trade winds
Conclusion In conclusion, the role of trade winds in influencing rainfall patterns in the tropics is to a small extent. Although it largely accounts for the high total annual precipitation in the humid tropics and seasonality of precipitation that Aw climate receives, it alone is unable to account for rainfall pattern in the entire tropics, especially the arid tropics. Furthermore, as a wind system that operate on a global/macro scale, it is unable to account for local variations in rainfall pattern that could be influenced by factors such as topography. Even though trade winds play a role in causing short term periodic climatic changes to the Pacific region, it is unable to explain for long term changes to rainfall patterns as induced by other natural and human drivers. Trade winds may play a large role in providing explanation to the high amount of precipitation received in the humid tropics, but rainfall in the tropics is influenced by many other atmospheric processes and factors that are interrelated that could complement or negate the effects of others. It is insufficient to look at only one particular factor to understand tropical climates, as they are a result of the effects multiple factors and processes. Marker’s Report:
• Another question that is poorly done – students need to learn how to choose questions that are to their favour (Question 2 is an easier question to score as compared to Q1!)
• Weak content knowledge to elaborate • Lacks evaluation. Many students are very descriptive and only listed out the various
factors but did not evaluate the role of trade winds (what do trade winds do or not do?). Other atmospheric processes/factors should only come in the explanation not in the argument

8 2 (a) Explain the impacts of tropical deforestation at different spatial scales. [12]
Indicative Content Tropical deforestation refers to the loss of tropical forests due to removal or clearance of trees in forested areas. Impacts of tropical deforestation include landslides, soil erosion and sedimentation, disruption of ecosystems and loss of biodiversity, disruption of biogeochemical cycles and release of sored carbon. Students have to classify these impacts to discuss how they have an effect at different spatial scales. A higher level response will discuss how these impacts may cut across various spatial scales and not necessarily confined to a certain spatial scale. Impacts should also not be seen in silo but rather there is interrelationships between the impacts as well. Impacts of tropical deforestation at different spatial scales should be exemplified with relevant examples throughout the essay. Levels marked using H2 generic level descriptors for 12m SEQ sub-part (a). Suggested Response Tropical deforestation refers to the loss of tropical forests due to removal or clearance of trees in forested areas. Due to deforestation, impacts at various spatial scales could be resulted, such as landslides and soil erosion at the immediate local scale that can have knock on impact on regional scale when sedimentation causes flooding along the river. Disruption of ecosystems though occurs at the local or regional scale can affect global biodiversity. Lastly, as trees act as carbon sink, deforestation would result in the release of stored carbon that could enhance greenhouse effect and increases the rate of global warming. P1: At the immediate local scale, the removal of trees could lead to impacts such as soil erosion and landslides.
• Soil erosion o When trees are removed, it reduces interception within the drainage basin o Rainfall intensity reaching the ground increases and increases the chance of it
being higher than the infiltration capacity of the ground which encourages the occurrence of Hortonian OLF that could move soil particles along with it as rainwash
o Without vegetation/trees to intercept rainfall, rainsplash effect is also more likely to take place, resulting in splash erosion. Also, rainsplash effect compacts the soil, and lowers soil porosity which increases the chance of OLF occurring and hence increases the chance of occurrence of rainwash as well
o E.g. Scientists have estimated that a third of the world’s arable land has been lost through soil erosion and other types of degradation since the 1960s due to deforestation for agricultural land
• Landslides • Trees help to bind and consolidate soil material on slope with their roots • With deforestation, the removal of trees reduces shear strength of the slope due to
less cohesive soil material • With heavy rainfall, shear stress acting on the slope could exceed its shear strength,
triggering the occurrence of a landslide • E.g. The cutting down of at least 28,000 trees in the area where the village of Malin
is in Pune, India was partly the cause of a deadly mudslide in 2014
P2: Soil erosion and landslides as a result of deforestation have the potential to cause sedimentation in rivers that could bring about flooding in the region.
• Soil and slope materials from soil erosion and mass movement could be transported to rivers and streams where they get deposited
• Sedimentation refers to the accumulation of materials/sediments in water bodies such as rivers
• With sedimentation, it reduces width and/or depth/capacity of the river, causing the river to be unable to hold as much discharge as before, increasing the likelihood of

9
flooding that could take place that is not necessarily confined to where deforestation has occurred in the vicinity but downstream as well
• E.g. Deforestation has increased the proportion of the drainage basin in China, East Asia and the Amazon to be subjected to erosion which in the long run have contributed to the issue of siltation. Heavy siltation/sedimentation has raised the river bed increasing the risk of flooding in the Yangtze river basin in China, major river basins of humid tropics in East Asia and the Amazonian Basin
P3: Also, forests often serve as habitats for large amount of biodiversity and deforestation though disrupts ecosystems at the local scale, it could cause loss of biodiversity at the global scale.
• Tropical forests support about two thirds of all known species and contain 65 per cent of the world’s 10, 000 endangered species despite covering less than 10% of Earth’s land surface
• Deforestation depletes biodiversity by destroying habitat, by separating contiguous areas of rainforest from each other, by interfering with plant reproduction, and by exposing organisms of deep forest to “edge” effects
• Forests, especially those in the tropics, serve as storehouses of biodiversity and consequently deforestation, fragmentation and degradation destroys the biodiversity as a whole and habitat for migratory species including the endangered ones, some of which have still to be catalogued
• Biodiversity losses of today are comparable to the great mass extinctions of eons past • Many of the species being lost are vital to the preservation of our ecosystems, or to
significant parts of them • E.g. Biodiversity in Borneo: One year after logging began in one area surveyed, some
species such as the Burmese brown tortoise, had disappeared from the areas and populations of ungulates, hornbills (despite their protected status) were significantly lower.
P4: Deforestation also leads to the release of stored carbon that could bring about global climatic impact by increasing the rate at which global warming occurs.
• Deforestation through direct burning of the logged trees, decomposition of biomass and other processes disrupts the global carbon cycle by increasing the concentration of atmospheric carbon dioxide
• Removal of trees also reduces the ability to remove subsequent inputs of carbon dioxide by photosynthesis (removal of carbon sink)
• Deforestation increases the rate at which carbon dioxide is released from the soil into the atmosphere
o Carbon in the soil accumulates through the decay of organic matter, such as dead leaves and animals
o As deforestation exposes soil to sunlight, this increases soil temperature and the rate of carbon oxidation in the soil. Carbon oxidation is a process by which carbon in the soil reacts with oxygen in the atmosphere to produce carbon dioxide
• Deforestation contributes to global warming which occurs from increased atmospheric concentrations of greenhouse gases (GHG) that enhances natural greenhouse effect, leading to net increase in the global mean temperature as the forests are primary terrestrial sink of carbon
• E.g. Tropical deforestation is responsible for the emission of roughly two billion tonnes of carbon (as CO2) to the atmosphere per year. Release of the carbon dioxide due to global deforestation is equivalent to an estimated 25 per cent of emissions from combustion of fossil fuels
Marker’s Report • A handful of students misinterpreted the term ‘spatial scales’. Note that there is a
difference between ‘across space/spatially’ and with ‘spatial scales’ • Lack of content knowledge from syllabus

10
• For those who applied the content knowledge to the context, there is a need to meaningfully analyse how the impacts could cut across different scales etc.
(b) 'Deforestation is an issue that can be managed in the tropics'.
To what extent do you agree with this statement? [20]
Indicative Content After discussing about the impacts of tropical deforestation, students are now required to evaluate upon the management of the issue. In this essay, students should critically analyse why deforestation occur (causes) and persist (causes, failure of strategies to manage deforestation), although it perhaps could be managed with strategies. A higher level response will discuss the interplay between causes of tropical deforestation and strategies to manage deforestation to evaluate if it is an issue that can be managed. A range of causes and strategies that act on a variety of scales should be used in the discussion to highlight the complexity of the issue. Synoptic links: Theme 2 (Development, TNCs, Managing Resource Base, Resource Appraisal), Theme 3 (Sustainable Development, Climate Change) Suggest Response Introduction Deforestation refers to the loss of forests due to removal or clearance of trees in forested areas. In the tropics, deforestation has become an issue of concern as the magnitude of land-use changes to non-forested land use is large, albeit decreasing in recent decades. It has been estimated that 18.7 million acres of forests are lost annually due to anthropogenic alteration of tropical vegetation for a myriad of reasons that include but not limited to agricultural expansion, demand for resources such as timbre and palm oil as well as for space due to population growth and for development. Although there have been strategies put in place that can help to manage the issue of deforestation if properly enforced, often these strategies do not address the root cause of deforestation, making them ineffective in managing the issue. Furthermore, the current capitalistic economic system that unfavours developing countries worsens the issue especially when most tropical forests exist in these developing countries. As development in developing countries continues in the near future, the undervaluation of forests in the current economic system will result in mismanagement of forests for economic and social needs. Hence, I agree with the statement only to a small extent. Body Paragraphs P1: The issue of deforestation can be managed in the tropics if strategies taken are well implemented and enforced to reduce the rate or prevent deforestation from happening.
• Deforestation involves the removals of trees on a large scale and it brings about many consequences such as increasing the rate of global warming, soil erosion, loss in biodiversity and ecosystem services. This unsustainable human activity has to be reduced or even prevented to protect and conserve the forests that we have in the tropics that serve many purposes which include their role as carbon sinks to mitigate climate change
• One major agent of deforestation is TNCs which use the forest for the production of their goods. Being an agent of deforestation also meant that TNCs have the ability to reverse this trend. Some TNCs have implemented ‘zero deforestation’ policies in their supply chains by holding their suppliers accountable for producing commodities like timber and paper in a way that does not fuel deforestation
o For example, one such TNC is McDonald’s that has pledged in April 2015 to end deforestation across its entire supply chain. McDonald’s promised not to contribute to deforestation in areas most critical to reducing carbon in the atmosphere - known as high carbon value and high carbon stock forests. By having commitments like this from major agents of deforestation and if these

11
agents follow through their commitments, the rate of tropical deforestation can be reduced or done in a more sustainable manner
• In an attempt to manage deforestation, states have also put in place strategies like policies to protect forests
o The Brazilian state has introduced various policies, legislative and regulative measures to protect the Amazonian forest. This included the Action Plan for the Prevention and Control of Deforestation in the Legal Amazon (PPCDAm), introduced in 2004 to coordinate efforts among federal, state, and municipal governments, and civil organizations. Approximately half of the deforestation that was avoided in the Brazilian Amazon during 2005-2009 was the result of government conservation policies. Policies introduced in the second half of the 2000s helped avoid 62,000 km2 of deforested area between 2005 and 2009
P2: However, strategies fail to manage the issue of deforestation in the tropics in the long run as they often do not address the root cause of the issue.
• There are various causes of deforestation such as logging and urbanisation but the main root cause of deforestation lies in overconsumption as a result of development. In the name of development, activities like irrational and unscrupulous logging, cash crops and cattle ranching are carried out. Despite the developed countries making up one quarter of the world’s population, they consume almost four-fifth of the world’s resources. This lifestyle of overconsumption of resources is also being advertised in and forced upon developing countries, causing the world to be using forest resources in an unsustainable manner
o If strategies to manage tropical deforestation do not manage this lifestyle of overconsumption of resources, they will be unsuccessful as deforestation will continue as long as there is the demand for the resources. Despite McDonald’s commitment in ‘zero deforestation’, palm oil which is a major contributor of deforestation and used in many of its products, if the demand for goods containing palm oil continue to rise with limited availability of sustainably sourced palm oil is limited today, deforestation may still continue or even worsen.
o Besides TNCs, to manage tropical deforestation, United Nations, which is a supranational body, initiated the REDD (Reducing Emissions from Deforestation and forest Degradation) program whereby a market-based approach is taken to create a financial value for the carbon stored in forests, offering economic incentives for developing countries to reduce emissions from forested land and invest in low carbon-paths to sustainable development. Yet, in Keo Seima, Cambodia, despite the REDD programme being implemented, logging was still rampant among residents as the demand for forest resources present a source of livelihood for these villagers.
• Without tackling the root cause of deforestation, strategies will not be successful in managing the issue of deforestation
P3: Furthermore, the current capitalistic economic system that unfavours developing countries worsens the issue especially when most tropical forests exist in these developing countries.
• Wealthy countries or the erstwhile colonial powers having deficit of their own natural resources are mainly sustaining on the resources of the financially poorer countries that are generally natural resource rich. Unfortunately, the governments of these poor resource rich countries had generally adopted the same growth-syndrome as their western neighbours or their erstwhile colonial master giving emphasis on maximizing exports, revenues and exploiting their rich natural resources unsustainably for short-term gains
o Bias in trade relations: For the primary producers it becomes necessary to export a larger quantity of goods in order to buy the same, or even a smaller, quantity of manufactured goods
o E.g. In 2006, Indonesia and Malaysia supplies 44% and 43% of the global supply of palm oil

12
• Also, pursuing the guided development agenda, the financially poorer countries are on a heavy international debt and are now feeling the urgency of repaying these huge debts due to escalating interest rates. Such a situation compels these debt-ridden poorer countries to exploit their rich natural resources, including their forests, partly to earn foreign exchange for servicing their debt
o For instance, construction of roads for logging operations in some South-east Asian countries was funded by Japanese aid which allowed the Japanese timber companies to exploit the forests of these countries
P4: As development in developing countries continues in the near future, the undervaluation of forests in the current economic system will result in mismanagement of forests for economic and social needs.
• Undervaluation of forests in the current economic system o Forests gain value only when they are cleared for obtaining legal title through
‘improvement’ o Capitalist society tends to value the things that the market values and dismisses
and does not respect whatever has no value for the market. Case seen for public environmental goods and services such as forests which translates into a growing process of environmental deterioration and destruction
• Development o Due to undervaluation of forests, forests are often exploited and value for their
instrumental rather than intrinsic or inherent uses o Countries often prioritise economic and social needs over environmental needso In the name of development, forests are cleared to produce further capital and
incentives Tropical deforestation is caused by the drive for maximizing profits
within the agricultural sector. Higher prices for crops and lower prices for farm inputs also spur faster deforestation. Technological innovations make farming more profitable either prompting the expansion of farms into forest or attract new farmers to forest frontiers. Example: Brazil’s deforestation to clear land for cash crops production (soybeans, coffee)
Rampant consumerism by the developed countries frequently has been claimed as a major reason for tropical deforestation. The opening of tropical countries to the world commodity markets accelerated deforestation. The products include coffee, sugar, bananas, cotton and beef in Central America and oil palm, rubber and timber in Southeast Asia
• Overpopulation/poverty/urbanisation o More people require more food and space which requires more land for
agriculture and habitation. This in turn results in more clearing of forests o Expanding cities and towns require land to establish the infrastructures
necessary to support growing population which is done by clearing the forests. Researchers found that deforestation is now driven largely by urbanization and trade
o Social and economic development in Singapore have contributed to the loss of 90% of its original rainforest. Tropical rainforests found mostly in developing countries, such as in South East Asia, will be subjected to deforestation to clear land for more space for development
Conclusion In conclusion, I agree with the statement to a small extent. Albeit that there are strategies that could manage the issue of deforestation by preventing or reduce the rate at which it is happening if they are well implemented and enforced, strategies do not manage the issue in the long run as they often do not address the root cause of tropical deforestation. Furthermore, the bias built into the global economic system makes it difficult to address the issue of deforestation that developing countries are facing. Deforestation is also a thorny issue to manage due to its undervaluation in the current economic system that unfavours its existence and provides

13
justification for its clearance for other ‘greater’ purposes. Deforestation is a complex issue that requires stakeholders at various levels to work together to address its importance and value to the society. Unfortunately, if countries continue to prioritise economic development over environmental conservation and only see forests for its instrumental value, the issue of deforestation will persist and sustainable development harder to be achieved. Marker’s Report • Students who attempted Q2 generally did better than those who did Q1 • However, majority focused on evaluating the strategies when the question requires you to
evaluate on the issue and not the strategies. Strategies should only form part of the essay. • Topics from other themes should be brought into the discussion • Lack of concrete case studies to illustrate arguments
Section B – Development, Economy and Environment
Answer one question from this section.
3 (a) Explain the reasons for underperforming resource-rich countries. [12] I: Explain R: What are the reasons behind resource-rich countries underperforming? A: Introduction: Natural resource-rich countries, as the term suggests, possess an abundance of natural resource which could be utilised for economic and technological advancements. However, it has been observed that most of these resource-rich countries have lower economic and income growth when compared with natural resource poor countries. Wealth in extractive sectors (oil, gas and mining) in general contributes little to national, local and regional development and the alleviation of poverty. Examples of resource-rich countries which are under performing are Nigeria and Venezuela. Body Para 1: One of the reasons behind resource-rich countries underperforming would be the economic leakage due to the repatriation of revenue earned. There is a tendency for multinational enterprises involved in natural resource exploitation to repatriate profits, rather than reinvesting in the local economy. Natural resources tend to be owned by firms with significant degrees of monopoly and monopsony power. Examples would be global multinationals such as De Beers diamond mining, oil production by Shell, BP and Esso. This means that the profits from selling natural resources are taken primarily by a small percentage of wealthy shareholders (often foreign). This means profits flow back to the country of the multinational and do not directly benefit the developing economy. Furthermore, the level of tax paid by multinationals is often set at low level to attract investment. Developing economies such as Nigeria, a country blessed with large amount of oil, but cursed with weak legal structures and history of business also see profits syphoned off by corruption. Mining companies do provide employment, but the percentage of earnings going to workers is often low. Body Para 2: Monetary value of natural resources in world markets is notoriously volatile and countries which depend on such natural resources solely to generate income for the nation would be awaiting its own doom in the long run, some even in the short run. Instability in prices of many natural resources creates uncertainty, hampering long-term planning. In the real world, the trading relationships between the industrialised

14
countries and the low-income, primary-producing countries are often unequal. In the first place, there is a long-term tendency of the composition of demand to change as income rise. Thus, the growth in demand for manufactured goods and services tends to be greater than the growth in demand for primary products. This immediately builds a bias into trade relationships between the two groups of countries, such as Nigeria as mentioned above and the United States (Nigeria’s largest buyer of crude oil), favouring the industrialised countries such as the US at the expense of the primary producers such as Nigeria, which are often the resource-rich countries. Over time, these inequalities tend to be reinforced through the operation of the cumulative processes of economic growth. As the price of manufactured goods increases relative to the price of primary products, the terms of trade move against the primary producers and in favour of the industrial producers. For the primary producers it becomes necessary to export a larger quantity of goods in order to buy the same, or even a smaller, quantity of manufactured goods. In other words, they have to run faster just to stand still or to avoid going backwards. Although the terms of trade do indeed fluctuate over time, there is no doubt that they have generally, and systematically, deteriorated for the non-oil primary producing countries over the years. Body Para 3: Additionally, due to the high level of technology used in extractive industries, the type of jobs created are actually not suited to the profile of the labour force in the resource-rich but underdeveloped countries. These TNCs in the extractive industries therefore employ larger number of skilled labour (often from their home countries) in order to manage the operations and even to operate the high-tech machines. Papua New Guinea (PNG)’s famous OK Tedi copper mine generated 40% of public revenues and 80% of exports. However, OK Tedi only provided 2,000 jobs. Another example is PNG’s new Liquefied Natural Gas Project – it may double GDP in five years, but the project will only create 8,000 jobs. Most of PNG’s 6.6 million people still live on subsistence agriculture and are poor. Body Para 4: The very presence of oil and gas resources within developing countries exacerbates the risk of violent conflict. The list of civil conflicts fought at least in part for control of oil and gas resources is long. A partial list would include Nigeria, Angola, Burma, Papua New Guinea (Bougainville), Chad, Pakistan (Balochistan), and of course Sudan. Econometric studies confirm that the risk of civil war greatly increases when countries depend on the export of primary commodities, particularly fossil fuels. At least three factors could explain this correlation. First, the prospect of resource rents may be an incentive to rebel or secede. Second, wealth from resources may enable rebel groups to finance their operations. Third, the high levels of corruption, extortion, and poor governance that accompany resource wealth often generate grievances leading to rebellion. Marker’s Report • Most candidates who attempted this question scored L3. • Whilst most are able to provide examples for the reasons they have provided, the
elaborations of the reasons are found wanting, especially for the factor of volatile nature of the natural resources.

15 (b) Discuss the extent to which overpopulation can help explain the level of development of
low-income countries. [20] I: Discuss R: To what extent can overpopulation account for the level of development of low-income countries? A: Introduction: Overpopulation is the state whereby the human population rises to an extent exceeding the carrying capacity of the ecological setting. It is believed that overpopulation will place great demands on resources and land, leading to widespread environmental issues in addition to impacting global economies and standards of living. However, in a world where technology is in a state of flux and economic systems preside over the distribution of various resources in the world, it is perhaps too simplistic to reason that a single problem of overpopulation can explain the poor economic performance, widespread poverty and low standard of living in some of the low-income countries. Therefore, overpopulation can only help explain the level of development of low-income countries to a small extent. Body Paragraph 1 [Counter stand]: P: It is true that countries with widespread poverty are often plagued with large population size, with large number of population experience famine and plagued with widespread diseases, where it is apparent that the authorities are unable to cope with the exploding population size. EE: In fact, this is the doomsday scenario painted by Thomas Malthus in his Theory of Population change. Malthus expressed a pessimistic view over the danger of overpopulation and claimed that food supply was the main limit to population growth. Malthus believed that the human population increases geometrically whereas food supplies can grow only arithmetically, being limited by available new land. This is when preventive checks and positive checks will kick in. Preventive checks are methods which people can choose to reduce human fertility such as abstinence or delaying marriages. Positive checks are anything which increases mortality such as low living standards, unhealthy living conditions resulting in diseases, war and famine. In the case of countries with high poverty rate such as Burundi, a country with limited natural resources and agricultural land with a GDP per capita of $271 which is the 2nd lowest in the world in 2012, it is often found that these countries would also register high population growth. For example, Burundi has the 2nd highest birth rate in the world of 6.04 in 2016. L: Thus, it is often argued that population is the paramount factor in determining of the environment is able to withstand the onslaught of demands and impacts that uncontrolled population growth can inflict upon the environment. Body Paragraph 2 [Pro stand]: P: However, to not proceed to delve deeper into the reasons behind overpopulation which can seemingly result in low economic development of any country would be too naïve and simplistic. EE: In fact, there have been countries which may have been considered as overpopulated which would, by the cause and effect suggested by the question, have resulted in low-income status of these countries. However, the opposite has been observed to be true as Malthus has overlooked one very important factor which may affect carrying capacity and thus, enable any less well-endowed countries to carry population far beyond its initial carrying capacity. According to Esther Boserup, population growth will trigger technological gains and therefore, agricultural growth. Malthus was not able to anticipate that food supplies could be increased not only by

16
increasing the supply of land (which he saw was finite) but also by improving fertilizers, crop strains and so forth. In fact, in most of the advanced countries the rate of increase of food production has been much greater than the rate of population growth. Even in India now, thanks to the Green Revolution, the increase in food production is greater than the increase in population. Singapore, whose carrying capacity would only be about 100,000 people if calculated based on available land size, would be a low income country if not far reaching technological innovations which ensures that more than 5.5 million people in the country is living decently with one of the highest GDP per capita in the world. L: In other words, rather than pointing to overpopulation as the main cause of widespread poverty, countries which have not been able to yield from technological innovations might see that their resources seemingly are inadequate to meet the basic needs of their expanding population. Body Paragraph 3 [Pro stand]: P: The overpopulation argument is easily used as part of an elaborate apologetic through which class, ethnic, or (neo-)colonial repression may be justified but if one delves deeper, it can be realised that a lot of low-income countries are actually rich in resources and should not be in such predicaments, if not for the economic system dominated by the capitalists and elite ruling classes which have left the allocation of resources to market forces and a few elite ruling classes of the State which resulted in failed allocation of resources. EE: The exploitative social relation between capital and labour is essential for the creation of surplus value which is gained by underpaying labour to produce a profit. This allows for the accumulation of capital by a small number of individuals who through dispossession and accumulation bring about the formation of a powerful capitalist class. When capital becomes concentrated in this manner in the hands of a few, overproduction results when workers earn insufficient wages to purchase the goods that may be available to them, leading the system to its own collapse. Unfortunately, this capital accumulation by the few elites often take place at the expense of resource-rich countries were resources are extracted by exploiting labour. Thus, the local mass population remains poor whilst the economic gains were syphoned off by the elites, sometimes foreigners. Sierra Leone, a country with high population growth, has significant mineral, agricultural and fishery resources that could lead the country to economic growth. However, the country is still one of the top 10 poorest countries in the world. Rampant corruption meant that most of the economic gains have been siphoned off by the military and/or the TNCs and local farmers and workers have to cope with high inflation and low income. L: Therefore, it can be seen from the example of Sierra Leone that overpopulation may just be a façade that hides the true problem of resource allocation as Harvey has suggested. Body Paragraph 4 [Pro stand]: P: Harvey has further posited that the problem of overpopulation resulting in low-income country may be a result of a fundamental flaw in human’s value system of how Man places arbitrary values on nature which leads to indiscriminate exploitation of available use values to the point of ecological collapse. EE: Capital has often exhausted and even permanently destroyed the resources latent in nature in certain locations. This has been particularly true when capital is geographically mobile. When the cotton growers in the American South or the coffee growers of Brazil exhausted their soils they simply moved on to other more fertile lands where the profitable pickings were even easier. Colonies were mined for their resources without regard to the local (often indigenous) population’s well-being, leading to widespread poverty. The ecological effects are localised, leaving behind an uneven geographical

17
landscape of abandoned mining towns exhausted, soils, toxic waste dumps and devalued asset values which ultimately lowers the standard of living of locals surviving on the land. L: By questioning our value system which has resulted in ecological collapse, one would easily realise that overpopulation is but a façade to mask the inherent problem in our economic system resulting in widespread poverty in several countries in the world. Conclusion: In 1798 Thomas Malthus erroneously predicted social catastrophe (spreading famine, disease, war) as exponential population growth outran the capacity to increase food supplies and even up till today, several countries plagued with widespread poverty have attempted to use his theories to justify the poor standard of living in the country. However, one would have to delve deeper into the concept of ‘overpopulation’ to realise that there are several other more deep-seated reasons for the problems that are plaguing the low-income countries now. Synoptic link: [Theme 1: SD] There is perhaps a need to re-evaluate how our economic system allocates resources to ensure equity and justice. At the root of it all, it might boil down to our humans have erroneously (not) assign values to nature, bringing about unsustainable development and ultimately, to our own demise. Marker’s Report • Problematic to dump Malthus, Boserup and Harvey’s theories as the answers without really
addressing the question: this is not asking candidates to evaluate the validity of Malthus, Boserup and Harvey, but rather, using their theories to validate the statement or otherwise. Do note that there is a difference.
• For candidates who are able to craft TS answering to the questions, elaborations may still be weaker as there needs to be more targeted elaborations to answer the question, not just elaborating on Malthus, Boserup and Harvey’s theories.
4 (a) Explain the factors contributing to transboundary water conflict. [12] I: Explain R: What are the reasons behind transboundary water conflict? A: Introduction: While the underlying reasons for water-related controversy can be numerous, such as power struggles and competing development interests, all water disputes can be attributed to one or more of three issues: quantity, quality, and timing. Body Paragraph 1: Competing claims for a limited quantity of water are the most obvious reason for water-related conflict. The potential for tensions over allocation increases when the resource is scarce. But even when pressure on the resource is limited, its allocation to different uses and users can be highly contested. As people become more aware of environmental issues and the economic value of ecosystems, they also claim water to support the environment and the livelihoods it sustains. The Mekong is one of the world’s major rivers. From the Tibetan Plateau, it runs through China’s Yunnan province, Myanmar, Thailand, Laos, Cambodia and Vietnam. The mainstream Lancang/Mekong Dams in Yunnan Province hold incalculable risks and costs for the millions of people residing along the downstream stretch of the Mekong River and in the Mekong Delta. Silt and sediment required to sustain agriculture along river banks and in the Delta will be

18
retained behind dam walls not only on the mainstream Lancang/Mekong but also behind dam walls on its tributaries, fish migration routes will be impeded, and natural seasonal (monsoonal) flows to which the river’s ecosystem and people have adapted to over generations will be altered. An example of conflict occurred in 2004 when a sudden drop in the water level led to anti-China demonstrations in Mekong river countries Body Paragraph 2: Another contentious issue is water quality. Low quality—whether caused by pollution from wastewater and pesticides or excessive levels of salt, nutrients, or suspended solids—makes water inappropriate for drinking, industry, and sometimes even agriculture. Unclean water can pose serious threats to human and ecosystem health. Water quality degradation can therefore become a source of dispute between those who cause it and those affected by it. Further, water quality issues can lead to public protests if they affect livelihoods and the environment. Water quality is closely linked to quantity: decreasing water quantity concentrates pollution, while excessive water quantity, such as flooding, can lead to contamination from overflowing sewage. The Colorado River is the primary source of water for a region that receives little annual rainfall. The Colorado River Basin offers a major renewable water supply in the southwestern US. the signing of the Colorado River Compact in 1922 was an important milestone in the management of the Colorado River and became the foundation for the law of the river. this compact included the seven Colorado River Basin states (Wyoming, Colorado, Utah, New Mexico, Nevada, Arizona and California), and apportioned water from the Colorado River between the Upper and Lower Basin states. Mexico was initially excluded from the compact until 1944 when Mexico was guaranteed 1850 million cu m of Colorado water. However, no provision was made for water quality, which has now become a contentious issue. Water now delivered to Mexico has already been used in the Wellton-Mohawk Irrigation district close to the USA-Mexico border. It is often of high salinity before its transfer to Mexico. A desalination plant was completed in 1992 at Yuma, Arizona but was only fully operational until early 2004 as it was considered too expensive to run. the salinity of the source water is also affecting the amount of reclaimed water for use in the Lower Basin states. Potable use and resultant wastewater treatment concentrates the salts Body Paragraph 3: Third, the timing of water flow is important in many ways. Thus the operational patterns of dams are often contested. Upstream users, for example, might release water from reservoirs in the winter for hydropower production, while downstream users might need it for irrigation in the summer. In addition, water flow patterns are crucial to maintaining freshwater ecosystems that depend on seasonal flooding. When unilateral development initiatives produce international tensions, it becomes more difficult to support cooperative behaviour. As mistrust between riparians grows, threats and disputes rage across boundaries. One of the most important sources of water for both Israelis and Palestinians, the Mountain Aquifer, is threatened by pollution from untreated sewage. The existing conflict has impeded donor initiatives to build wastewater treatment plants in Palestine, setting the stage for a vicious circle as groundwater pollution increases regional water scarcity and, in turn, exacerbates the Israeli-Palestinian conflict. Marker’s Report • Generally high L3 was awarded. • Could have improved to a higher level if elaboration could be detailed on each of the given
cause. • Some responses lacked example.

19 (b) Evaluate the effectiveness of strategies used to manage transboundary sources
of water supply and associated conflicts. [20] I: Evaluate R: To what extent have the strategies used to manage transboundary sources of water supply and associated conflicts been successful? A: Introduction: International basins that include political boundaries of two or more countries cover 45.3 percent of Earth’s land surface, host about 40 percent of the world’s population, and account for approximately 60 percent of global river flow. Water was an underlying source of political stress and one of the most difficult topics in subsequent negotiations. In other words, even though the wars were not fought over water, allocation disagreements were an impediment to peace. If one were to measure the ‘effectiveness’ of strategies to manage transboundary sources of water supply by the number of wars and physical conflicts that countries have inflicted upon one another, then the strategies must have worked extremely well as it has been observed that no war has erupted primarily due to water conflicts in the past century. However, if one were to define effectiveness of these strategies as whether or not the lives of the people whose lives depend on the rivers have improved, then it can be argued that the strategies would be effective to a small extent. Considering that there are still millions of people who are unable to access to clean water from the rivers for drinking and daily use, it seems that at a local level, the strategies may have been ineffective. Body Paragraph 1 [Counter stand]: P: Transboundary water management strategies provide a platform for multiple stakeholders in multiple countries for constructive debates and decision making in order to try to resolve competing interests for a win-win situation. EE: Even if the negotiation process can be lengthy, most disputes are resolved peacefully and cooperatively on the able. Such cooperative water management mechanisms can anticipate conflict and solve smouldering disputes, provided that all stakeholders are included in the decision making process and given the means (information, trained staff, and financial support) to act as equal partners. Since 1996, 125 member organisations from 49 countries have been part of the International Network of Basin Organisations whose objectives include: facilitating the exchange of experiences and expertise among network members; promoting the principles and means of sound water management in sustainable development cooperation programmes; promoting the exchange of information and training programmes for the different actors involved in water management. On the international level, river basin commissions with representatives from all riparian states have been successfully involved in joint riparian water resources management. Especially in transboundary basins, achieving cooperation has been a drawn-out and costly process. Recognising this, the World Bank agreed to facilitate the Nile Basin Initiative negotiation process for 20 years. In the Nile basic case, an “elite model” that seeks consensus between high-level representatives before encouraging broader participation has enjoyed some success in developing a shared vision for basin management. L: Thus, such water management mechanisms do allow countries to put forth their issues and disagreements on the table for negotiation and in doing so, with third parties facilitating, some improvements have been made. Body Paragraph 2 [Pro stand]:

20
P: However, although there are have been numerous numbers of platforms serving as strategies for countries to negotiate deals for transboundary water sources to ensure equity amongst all riparian states, the problems associated with individual transboundary water systems are very country-specific. EE: They accommodate factors including fears over national sovereignty, political sensitivities, historical grievances and national self-interest. Thus, developing international principles for the management, and control of such resources remains problematic. Furthermore, it is also recognised that realising the outcomes of international agreements will need to depend on close consideration of local interests and appropriate understanding, tools and capacity at that level if measures to achieve those goals are to be implemented. Therefore, if the number of countries involved as stakeholders in the river management, the more difficult it is for outcomes to be desirable for all stakeholders. For example, the Colorado River treaty between the US and Mexico were successful in allowing Mexico to rightfully access good quality river water because there are only 2 countries involved and both the US and Mexico do have cordial relationship. The upstream riparian state, the US, shows commitment and willingness to resolve the conflict of interest over shared water resources and both nations are willing to re-negotiate and re-interpret the 1944 Treaty and credit must be given to the US for their willingness to ‘keep their promise’ regarding the supply of water to Mexico. the water treaties were re-negotiated to a higher level within the 1993 North American Agreement on Environmental Cooperation between Canada, US and Mexico. This leads to the founding of a highly regulated administration which jointly decided laws, verifications and sanctions. With this agreement, the mere advisory functions of water commission is upgraded to one with legal and political weight. L: However, such cases are few and far between due to the unique condition of the (only) two riparian states and their relationship. Body Paragraph 3 [Pro stand]: P: Many of these river agreements also involve large numbers of countries or riparian states, and the fact that not all states possess equal bargaining chips or power may render such agreements or cooperation ineffective for countries with lesser bargaining power. EE: Some agreements have hinged upon economic cooperation to jointly utilise the rivers for joint economic purposes to bring about better standards of living for the people of all the riparian states. This depends on the willingness shown by all states to ‘compromise’ their sovereignty during discussion and cooperation. nations should not look at ‘restrictive sovereignty’. Rather, they should look at sovereignty from the perspective of positive cooperation and interdependence. However, this is easier said than done. The Mekong River Commission, while having good intentions and objectives to resolve any potential conflicts of interest among riparian nations, is not as effective as it plans to be. For example, China is one of the most powerful nations in the Mekong region and without its participation in the main inter-governmental cooperation framework for managing the Mekong Basin’s resources, the main inter-governmental cooperation framework for managing the Basin’s resources will be ineffectively carried out. L: Therefore, till date, there has been reports of the Mekong river being dammed or polluted upstream, reflecting the difficulty of coming up with a consensus if there are too many states with unequal power in the negotiation. Body Paragraph 4 [Pro stand]: P: Finally, although many water agreements have stressed the importance of protecting the immediate environment of the rivers as environmental degradation of, and surrounding the river may bring about negative economic consequences, it is sometimes

21
even harder for developing economies to want to partake in this narrative to protect their rivers. EE: Given the fact that many of the riparian countries of some rivers are either at the early stage of the economic development or rebuilding their economy, environment strategy of resolving the conflict of interest over shared water resources will not be very much favoured by the riparian countries. For example, since the livelihood and prosperity of a growing population living in the Mekong River Basin depends on a healthy environment, there have been plans to provide a framework for managing the Mekong River and an indicative Mekong River Basin Environmental Report card to inform the people of the basin about environment conditions, urging riparian states to take care of the Mekong River basin. However, given the fact that many of the riparian countries of the Mekong River region are either at the early stage of the economic development or rebuilding their economy, environment strategy of resolving the conflict of interest over shared water resources will not be very much favoured by the riparian countries, rendering such approaches to be ineffective. L: Therefore, with many countries whose leaders may lack the foresight or planning skills to approach the problem holistically, it is hard for water agreements to be effective to bring about better standards of living for the millions of people whose lives depend on the river. Conclusion: Water management is, by definition, conflict management. For all the twenty-first century wizardry—dynamic modeling, remote sensing, geographic information systems, desalination, biotechnology, or demand management—and the new-found concern with globalization and privatization, the crux of water disputes is still about little more than opening a diversion gate or garbage floating downstream. Yet anyone attempting to manage water-related conflicts must keep in mind that rather than being simply another environmental input, water is regularly treated as a security issue, a gift of nature, or a focal point for local society. Disputes, therefore, are more than “simply” fights over a quantity of a resource; they are arguments over conflicting attitudes, meanings, and contexts. Obviously, there are no guarantees that the future will look like the past; the worlds of water and conflict are undergoing slow but steady changes. An unprecedented number of people lack access to a safe, stable supply of water. As exploitation of the world’s water supplies increases, quality is becoming a more serious problem than quantity, and water use is shifting to less traditional sources like deep fossil aquifers, wastewater reclamation, and interbasin transfers. Conflict, too, is becoming less traditional, driven increasingly by internal or local pressures or, more subtly, by poverty and instability. These changes suggest that tomorrow’s water disputes may look very different from today’s. Marker’s Report • Substantiation of arguments is lacking in the responses. • May be effective to use a single case study but evaluating it from multiple angles (e.g, why
Mekong River Commission was not very effective at several levels/scales). • Higher level of response would consider not just economic benefits of such water
management strategies but an evaluation of the environmental impacts or benefits of such water agreements. It would also look into the nuances of negotiating such agreements or consensus such as the difference in bargaining power and negotiating stances of the riparian states.

22
Section C – Sustainable Development
Answer one question from this section.
5 (a) Explain the evidence of climate change since the last Ice Age. [12] I: Explain R: What are the evidence showing climate change since the last Ice Age? Introduction: Though huge gaps exist in our knowledge of past climates, scientists have learned much about the climatic history of earth. Humans continue to gain insights into past climates based on information left in the geological and biological records through what are called proxy indicators. Proxy data gives us some idea of paleoclimates, the climates of the past, must have been like. Methods to uncover evidence of climate change since the last Ice Age (last glacial maximum was about 20,000 years ago) is explained below. Body Paragraph 1: The study of ocean deposits can enable us to get a glimpse into the isotopic records of oxygen in the ocean, thereby allowing us to understand the climate conditions at any point in time reflected by the age of the ocean deposits. Chemical composition of the shells of foraminifera (a form of zooplankton) are studied for the isotopic record of oxygen in ocean. The chemical composition of the shells they construct is affected by the chemistry of the ocean waters in which they live. When foraminifera die, the hard shells fall to the ocean floor, to accumulate as ocean sediment. Cores of sediment recovered from the deep oceans provide a record of these organisms that goes back in time, as successive generations of shells have been deposited on those of their predecessors. An analysis of the isotopic composition of the calcium carbonate in these shells would provide a picture of changing ocean chemistry over time. During glacial period, water is continuously removed from the oceans and stored on land in the form of snow and ice. Water molecules are removed from the oceans by evaporation but not returned via condensation and rainfall. The remaining ocean slowly becomes depleted in the lighter isotope (O16 isotope)/ enriched with the heavier isotope (O18 isotope). There will be higher O18 content in the water and hence in the shells of foraminifera during glacial period and the reverse for interglacial periods. Thus, the O16 and O18 isotopes in ocean deposits will allow us to estimate the glacial and interglacial periods. Body Paragraph 2: A remarkably detailed record of past changes in climate has been established from ice cores, mainly from the Greenland and Antarctic ice sheets and from glaciers at lower latitudes. Snow that accumulates at high altitude does not melt but gets buried by later snowfall and compressed into ice. As more snow accumulates, the ice itself is slowly compressed, flowing outwards towards the edge of the ice sheet. By drilling down through the centre of an ice sheet, a record of past snowfall events can be recovered. Scientists have also determined the O18/O16 ratio for deep ice cores obtained. In the ice that forms during glacial period, there would be higher concentration of O16 isotope due to higher evaporation rates of O16 isotopes, and hence less concentration of O18 isotopes in the ice that forms. Ice cores also provide information on the past chemistry of the atmosphere. As new snow falls onto a glacier, bubbles of the ambient air were trapped in the ice. They can be used to reconstruct how the composition of the atmosphere has changed from glacial to interglacial periods. The concentration of greenhouse gases and other trace gases in these bubbles yields a long term record of their varying levels in the air. There exists a strong correlation between past

23
temperatures and concentrations of carbon dioxide and methane. Low levels of these gases are observed during glacial periods while high levels are observed during interglacial periods Body Paragraph 3: Since the distribution of vegetation is largely controlled by climate, an understanding of changes in the plant communities of an area over time can be used to infer how the climate in that particular location may have changed over time. Pollen grains are extremely resistant to decay and have a form that differs from one plant to another. Lake sediments may contain pollen grains deposited from the vegetation in the local region. The study of deposition of pollen grains allow one to infer the past climate at a local scale. Cores of sediment from lakes can thus give a picture of what vegetation was like in the past. It is also possible to map out how individual species have migrated over time.
Marker’s Report:
• Question is poorly done. • Many students have confused evidences of climate change with factors contributing to
climate change. • Most students have not addressed the context of the question “last ice age” well and
explicitly.
(b)
‘Adaptation strategies to lower impacts of climate change is more worthy an investment than mitigation strategies against climate change’. Discuss the validity of the statement. [20] I: Discuss R: To what extent are adaptation strategies a worthier an investment than mitigation strategies against climate change? A: Introduction Climate change is defined as a change in any statistical property of the atmosphere, such as a change in mean temperature. Limiting the effects of climate change is necessary to achieve sustainable development and equity. Two responses to climate change are mitigation and adaptation. Mitigation refers to human intervention to reduce the sources or enhance the sinks of greenhouse gases (GHGs) so as to reduce the rate of climatic change via the management of its drivers. Adaptation is the process of adjustment to actual or expected climate and its effects, to moderate harm or exploit beneficial opportunities. If one were to calculate the returns of adaptation and mitigation strategies against climate change and decide if which one is more worthy, it would perhaps be useful to assess based on the geographical concepts of place and time. For countries especially countries of low level of development bearing the brunt of the effects of climate change, it would perhaps be worthy to invest in adaptation strategies as they are more immediate and could save lives and properties against the onslaught of impacts of climate change. However, if one were to assess the long term returns of the both mitigation and adaptation strategies for both developed and developing

24
countries, one could argue that mitigation strategies would be worth the investment in the long run. Therefore, it is to a small extent that adaptation strategies are more worthy an investment than mitigation strategies. Body Paragraph 1 [Counter stand]: P: Adaptation strategies are indeed one of the most important investment for countries which are facing threats from effects of climate change, especially for countries of low development, because as compared to mitigation strategies, effects of adaptation strategies are more immediate, especially in the face of increasing incidence of extreme weather events. EE: In fact, The IPCC urged particular attention be given to adaptation in developing countries where climate change brings additional threats and compounds existing risks and vulnerabilities within countries with the fewest resources and where the majority of the world' s poor live. Governments at various levels are starting to develop adaptation plans and policies and to integrate climate-change considerations into broader development plans and to increase the adaptive capacity of their city or country. In Kenya, for example, droughts which once occurred every 10 years has become an annual event, wiping out livestock and causing famine. As an alternative to food aid, an NGO-financed Meat Safety Net Programme pays herders a fair, fixed price for the weakest cows or goats. The animals are slaughtered and the meat and hide are returned to the seller. They can then use the money to restock, pay food or pay off debts. Kenya is a country with low adaptive capacity and without this investment from NGOs and various other stakeholders, the farmers and many others in Kenya would have led worse lives or even lost their lives in the short run when there is more extreme weather in the region. L: As compared to mitigation strategy, adaptation strategies like that mentioned above would have saved lives and properties more than others and is definitely a worthier investment especially in the context of low-income development countries which are vulnerable to climate change impacts. Body Paragraph 2 [Pro stand]: P: Unfortunately, although adaptation strategies’ effects are immediate, they unfortunately are unable to ensure that the strategies could hold off the impacts of climate change forever, as long as climate change continues to exacerbate the various impacts of various climatic disasters. EE: This is especially true for hard adaptation strategies which rely mostly on man-made structures to offer direct protection by defending vulnerable areas. These usually involve capital-intensive, large, complex, inflexible technology and infrastructure. However, not only are they capital intensive, but they also lack flexibility and adaptability to sudden changes in projections of climate change. Developing countries would often have to borrow money from the World Bank or International Monetary Fund and incur huge interest whilst trying to pay off the debt, which constitutes huge investment with high opportunity cost for such countries. Unfortunately, this ‘investment’ is unable to last long as climate change may actually mean that it is often inadequate to build these infrastructures to last a stronger hurricane, or storm surge, or extreme temperatures. For example, sea level has risen by 50cm/century in New Orleans which increases the risk of coastal flooding. Flood defences have been improved after each flood. However, no systematic risk management practice has been implemented. The 2005 flood affected 80% of the city and killed 1800 people, despite the flood walls being built and reinforced almost every year by the local government. L: Thus, it will be naïve for authorities to think that as long as they ‘invest’ more to build costly infrastructure to protect its people against impacts of climate change, they would surely be protected, bring into doubt the real ‘returns’ of such adaptation strategies.

25
Body Paragraph 3 [Pro stand]: P: On the contrary, strategies to mitigate climate change are more worthy an investment because they address the root cause of climate change, which is definitely worth the investment in the long run in order to eradicate impacts of climate change in the long run, as opposed to adaptation strategies. EE: Mitigation strategies involve ways to either reduce emissions of GHGs or enhancing carbon sinks on earth. Through these strategies, the amount of GHGs that trap heat in the atmosphere and ‘responsible’ for the rise in global average temperature on earth would be reduced. This would then slow down the rate at which climate is changing and its associated impacts. To mitigate climate change, the Kyoto Protocol which is an international treaty, was set up in 1997 and it placed obligations on developed countries to cut down their current GHG emissions to an average of 5% against 1990 levels. It was the first ever global climate diplomacy and results have shown that the sum of emissions from nations with legally binded Kyoto targets have fallen. Besides at the international arena, countries have also stepped up in their mitigation efforts. To reduce emissions associated with deforestation, Brazil has slowed down its rate of deforestation by half in late 2000s through policies rolled out. Also, Thailand has successfully restored 10 hectares of mangroves in coastal areas in a bid to enhance its carbon sink. All these strategies aim to deal with climate change by reducing the amount of GHGs in the atmosphere. L: Therefore, in order to resolve the root cause so that in the long run, adaptation strategies could take a backseat, mitigation strategies would certainly be imperative. Body Paragraph 4 [Pro stand]: P: More importantly, what humans deem as ‘worthy’ may not so for the entire ecosystem, such as adaptation strategies who have been argued to be extremely anthropocentric – focusing on protecting humans at the expense of the environment and EE: To illustrate, there has been efforts to improve the provision of potable water as weather variability due to climate change could present significant challenges for the management of water resources. One such method is desalination, a costly method to treat seawater such that it becomes potable. As the cost is high of both setting up and running the systems are high, it definitely requires high amount of capital investment from the government to set up and run the system. Even for countries which foresee water supplies being unstable or unpredictable because of unpredictable weather and climatic conditions, it may seem like a worthy investment to build desalination plants, as seen in the success of Singapore. However, this may not be the case in other countries as such desalination plants increase the salinity of soil or rivers further downstream, destroying ecosystems and the environment. For all the flora and fauna which would be destroyed due to this strategy, one would question the true net worth of such methods. L: Hence, if one were to view the issue from a systems perspective, adaptation strategies succeeding to protect humans at the expense of other natural environments may not be that worthy of an investment after all, the ‘worthiness’ is defined narrowly by humans for our own benefit. Conclusion: Whilst adaptation strategies are definitely important to save lives and properties in the short run, it certainly cannot be a cat and mouse game – of catching up with scarier and more detrimental effects of climate change by building taller, stronger and smarter infrastructure or adaptable plans. Governments would still need to put in concerted effort to ensure that their future generations of children do not have to keep up with this cat and mouse game – that the future is one which is sustainable and mitigation
26
efforts would have to be stepped up to ensure that this is not just a few targets and policies written on policy papers but never fulfilled. If the earth can be saved from effects of climate change in the long term and our children can have the same safe and clean environment as enjoyed by their fathers, then this would then be the worthiest investment that any government and authority can make. Marker’s Report:
• Students have generally shown a good understanding on the different strengths and
weaknesses of mitigation strategies and adaptation strategies. • Students can afford to engage more critically with the debates surrounding climate
change.
6 (a) Explain the difficulties of measuring urban liveability in cities of low levels of development. [12] I: Explain R: How difficult is it to measure urban liveability in cities of low levels of development? A: Introduction: Liveability - defined as a perspective on the quality of urban life space - is hugely complex and contextual. Liveability is a subjective rather than an absolute term and its precise meaning depends on the place, time and purpose of the assessment and on the value system of the assessor. A liveable city can be understood as one where essential needs of the urban population such as food, shelter and security are fulfilled. But recent discussions, particularly in the context of developed countries, have framed the notion of a “liveable city” akin to a “desirable city.” This shift in emphasis from minimum requirements for liveability to lifestyle choices has brought with it a cottage industry of international ranking systems and indicators that compare cities on the basis of material wellbeing, as well as social and environmental performance indicators. However, for cities of low levels of development, this ‘industry’ of measuring and ranking cities have brought about problems as one would discover that it is not straightforward or easy to measure urban liveability at cities of low levels of development. Body Paragraph 1: It is difficult to measure liveability in cities of low level of development in accordance to the basket of indicators as stipulated by many in the liveability indexes as the basis of these comparisons may be western-centric. A good example would be The Mercer Quality of Living Survey ranks cities on their quality of life. Cities are evaluated based on 39 factors including political environment, economic environment, natural environment, personal safety, health, education, transportation and other public service factors. Cities were compared to New York City which was given a base score of 100. Mercer’s Quality of Living Survey is dominated by well-manicured older European cities such as Zurich, Geneva, Vienna, Copenhagen, Helsinki and Munich, as well as New World metropolises in the western world like Vancouver and Toronto; Auckland, New Zealand; and Perth and Melbourne in Australia. Therefore, it would be difficult to measure the cities of low

27
development based on the same basket of indicators and compare them with other cities in the world for a fair and unbiased comparison. Body Paragraph 2: Even if one were to ignore the difficulty of using the same basket of measurements to compare cities of different contexts and insist on using the indicators to assess a city’s liveability, it would be difficult to attain reliable data for meaningful assessment in the cities of low levels of development. Liveability indexes such Economic Intelligence Unit (EIU) Liveability Ranking scores each city on over 30 qualitative and quantitative factors, across five broad categories: 1) Stability; 2) Healthcare; 3) Culture and Environment; 4) Education and 5) Infrastructure. Like many other indicators, EIU’s liveability ratings allow urban authorities to monitor and keep track of past impacts, present state and future plans to design policies that can better the state of urban environments. However, in cities of low development where there are informal housing and economy, one can imagine how strenuous it would be gather to data on education and infrastructure. Even if there would be data in these areas, the reliability of the data would be questionable. Body Paragraph 3: As mentioned above, liveability as a concept is extremely subjective and to truly measure liveability in the cities of low development can be difficult as urban dwellers even within the same city has different views and opinions about liveability. EIU’s measurement of liveability had ranked Beijing as the most liveable city in China, much to the disdain of the millions in China as it is well known that Beijing is heavily polluted. Berkeley Earth's scientific director, Richard Muller, as saying that breathing Beijing's air is the equivalent of smoking almost 40 cigarettes a day and calculates that air pollution causes 1.6 million deaths a year in China, or 17 percent of the total. However, there are also many in China who felt that should Beijing be less liveable, why would thousands still flock to the capital city for work every year. Therefore, there must be some aspects of Beijing which outweighs the effect of pollution in these urban dwellers’ minds. It is therefore difficult to measure a defined set of indicators for liveability when such a concept is in itself controversial and subjective. Marker’s Report:
• Question is poorly done. • In most scripts, the concept of “urban liveability” has not been carefully unpacked. • Some students have confused sustainable urban development indicators with liveability
indicators. • Most students have not addressed the context of the question “in cities of low levels of
development” well and explicitly.
(b) “Cities are liveable places for the elderly”. How far do you agree with the statement? [20]
An elderly refers to an “older person”. In most developed world, the age of 65 years and above has been commonly used as a definition of “elderly”. While being “old”

28
could be said to be a biological reality, being “old” is simultaneously a social construct. Westernization and capitalist development today is fast expanding negatives connotations of an “elderly” associated with “physical decline”, “immobility” and “unproductivity”. Such social constructs, norms and expectations associated with an “elderly” have spatial consequences. This means that urban environments can become sites where ageism, defined as the stereotyping and discriminating of individuals or groups on the basis of their age, can be reproduced. This essay agrees with the statement to a small extent. While cities could be liveable places for the elderly if sound policies are put in place to create “age friendly” environments, a critical analysis will reveal that cities in general continue to be unliveable sites with the diverse and heterogeneous experiences of elderly neglected. At the same time, a large portion of the elderly population continues to be economically marginalise as they struggle to remain compatible with the capitalistic economy. Cities will remain unliveable spaces if elderly are financially insecure – without the capacity to afford and have their social needs catered. Lastly, cities remain largely designed for a “mythical average person” – super-mobile, without dependants or disabilities. This person is more likely to be young than old. The result is the continued exclusion and spatial segregation of elderly from urban landscapes. Body TS1: Cities could be liveable places for the elderly if sound policies are put in place to create “age friendly” urban environments. An age-friendly city encourages active ageing - defined as the process of optimizing opportunities for health, participation and security in order to enhance quality of life as people age. In practical terms, an age-friendly city adapts its structures and services to be accessible to and inclusive of older people with varying needs and capacities.
Case Study: Milan, Italy has made a commitment to accessibility which goes above and beyond what is required by Italian and European law. Its building standards not only support accessibility and usability but they also promote Universal Design standards. There is a high level of accessibility across most means of transportation with two of the city’s four metro lines fully compliant for people with disability and elderly. Recently, Milan, Italy won the Access City Award – the European prize for making cities more accessible to people with disabilities and elderly. Creating an age-friendly city requires strong political commitment. This commitment to construct age-friendly cities however remain unseen in most cities across the world. TS2: Most cities across the world continue to be unliveable sites with the diverse and heterogeneous experiences of elderly neglected. Case Study: Elderly is not a heterogeneous category. “Old age” intersects with other identity markers such as class, race, ethnicity, religion, gender, sexuality etc. to create varying levels of marginal experiences for elderly. A research performed by Ontario Human Rights Commission of elderly experiences in Toronto, Canada has found out that while older men do experience particular concerns, the unique and often compounded disadvantage experienced by older women needs to be recognised. Owing to a number of factors including longer life expectancy, labour force participation patterns, wage inequality, social programs and systems designed primarily from a male-centred or gender-neutral perspective, older women are more likely to experience poverty. This however continues to be unrecognised by most urban policymakers.

29
TS3: Next, a large portion of the elderly population continues to be economically marginalise as they struggle to remain compatible with the capitalistic economy. Cities will remain unliveable spaces if they are financially insecure – without the capacity to afford and have their social needs catered. Capitalism promotes people who are productive and independent. They should earn for their life and pay taxes for the state. Elderly are unable to meet the requirements of an “ideal citizen” in a capitalistic economy. The elderly population are not able to work as efficiently as the young. They may also experience health limitations and are unable to perform types of work that demand physical strength. These biological and physiological restrictions also reduce their mobility, a feature commonly desired by employers. Economic marginalisation of the elderly is also perpetuated by the “social construction” of old age associating elderly population with characteristics of “physical decline”, “immobility” and “unproductivity”. In addition, there is also a belief that elderly are outdated and unable to master the techniques of handling modern technologies. While such associations are gross generalisations, they have reduced the elderly population’s economic mobility and chances.
Case Study: Based on a research from the Australian Human Rights Commission, it is documented that 27% of Australians aged 50 years and above have had experienced some form age discrimination at workplace in the last two years.
TS4: Lastly, cities remain largely designed and thought to cater for a “mythical average person” – super-mobile, without dependants or disabilities. This person is more likely to be young than old. The result is the continued exclusion and spatial segregation of elderly from urban landscapes. The physical urban reality and social construct that elderly do not belong to many urban spaces have restricted their mobility. An implication of spatial exclusion brought about by elderly unfriendly urban design is segregation – whereby “self-imposed house arrest” of the elderly have meant that city centres have become age-cleansed youth enclaves. A city that excludes certain social groups is an unjust and unliveable city.
Case Study: Spatial exclusion can be witnessed in the context of Singapore where elderly who only speak dialects and mother tongues face issues orientating in urban environments that cater predominantly to English speakers. Lack of intelligible signage discourage elderly from exploring far from their familiar home and neighbourhood, physically excluding them from many urban experiences.
Extension This essay has argued that cities remain largely unliveable places for the elderly. In extension, looking ahead, as an ageing population becomes an increasing reality across cities in both the developed and developing world, addressing the marginal experiences of elderly is crucial, and these efforts have to be immediate if policymakers and political authorities are interested in improving the urban liveability of cities.
Marker’s Report: • Students have generally shown a good understanding on the possibilities and
challenges for elderly living in the city. • Most examples that students have drawn upon to support their arguments are
from the context of Singapore.

Class Adm No Candidate Name:
[Turn over
2018 Preliminary Exams
Pre-University 3
GEOGRAPHY 9751/02 Paper 2 Data Response Questions 10 September 2018 3 hours Additional Materials: Answer Paper 1 Insert World Outline Map INSTRUCTIONS TO CANDIDATES Write your name, admission number and class on all the work you hand in. Write in dark blue or black pen on both sides of the paper. You may use a soft pencil for any diagrams, graphs, or rough working. Do not use staples, paper clips, highlighters, glue or correction fluid. Candidates answer all questions. The Insert contains all the Resources referred to in the questions. You should make reference to appropriate examples studied in the field or the classroom, even where such examples are not specifically requested by the question. Diagram and sketch maps should be drawn whenever they serve to illustrate an answer. The world outline map may be annotated and handed in with relevant answers. You are reminded of the need for good English and clear presentation in your answers. At the end of the examination, fasten all your work securely together. The number of marks is given in brackets [ ] at the end of each question or part question.
___________________________________________________________________ This document consists of 5 printed pages and 1 Insert.
[Turn over

2
Section A
Theme 4: Geographical Investigation
(a) Suggest a research question for the investigation based on Resource 1 and state
how the research question might be suitable for the investigation. [4]
1m – Suitable research question: How has the setting up of Rolls-Royce’s R&D facility at Seletar affected the residents and businesses of Seletar and Punggol? Suitability of RQ: 1m: Geographical manageability: Punggol is a housing estate adjacent to Rolls-Royce facility and Seletar is the area where Rolls-Royce is located and can be segmented into suitable areas for data collection by the twenty students to collect relevant data based on the residents’ and businesses’ experiences with Rolls Royce in various areas. 2m: Temporal manageability: The students can focus on collecting secondary data and primary data, such as number of employment generated for residents staying in Punggol and Sengkang from the year of the setting up of Rolls-Royce’s R&D facility to today or identify businesses which have been operating before the setting up for Rolls-Royce facility to for interviews. Point marked Marker’s Report: • Some students are still unable to provide manageable RQs, although most were
able to score 1m for this. • Suitability of RQ lacked elaboration. For e.g., there is a need to elaborate on the
types of data that might be appropriate to collect based on the area of research and why is that suitable.
(b) Suggest an appropriate plan to collect primary data in the area as represented in Resource 1. [7]
Indicative content: Data needed: o Primary data: Through quantitative surveys for residents and businesses
to find out the impacts of setting up of Rolls Royce (RR) has on them, such as possibility of traffic congestion due to the setting up of the plant (for residents) and increase of earnings due to setting up of RR (for businesses). A survey will be most appropriate as it is easy to administer and does not take up very much time. Likert scale can be used as it is the easiest to understand and used by the mass public. There could also be interviews and focus group discussions with identified residents and businesses in Punggol and Seletar to find out about the impacts of setting up of RR on the residents and businesses in a more in-depth manner (such as interviewing a resident who works at RR, and businesses who have/have not benefitted from the setting up for RR in Seletar).
o Appropriate sampling method: e.g. For students, convenience sampling is probably most accessible and easiest of the sampling method for them. Simple random sampling or stratified random sampling will be very difficult

3
to carry out as access to employees’ and residents’ information is restricted.
o Secondary data: No. of jobs generated for Punggol residents since the setting up for RR facility. No. of forward or backward linkage suppliers of RR located in Seletar.
• Limitations: e.g. Students might need information from Rolls Royce itself but the company might not want to divulge information to these students due to confidentiality and sensitivity of the information. When interviewing businesses, it may also be easier to gather information from establishments such as restaurants/cafes/eateries as compared to gathering information from the business in the forward and backward linkages of RR as they may deem such information to be confidential and sensitive as well.
Research ethics: e.g. listing the key points that would be shared with the survey respondents about their research purpose, anonymity of respondents.
Risk mitigation: need to manage safety of the students e.g. stop fieldwork before sunset, use appropriate language during interviews, work in pairs
Levels marked
• L1/1-2m: Type of data needed unclear/not stated; methods chosen may not be appropriate. Context of research not considered.
• L2/3-5m: Considers at least 4 of the above points, although not responses for all points are valid/well-considered.
• L3/6-7m: Considers all aspects and contexts of planning for investigation.
Marker’s Report: • Many obtained low L2 because while there was information on what data to
collect and how to collect, there was not much justification/elaboration on why the data would be collected in the manner described.
• Many did not really use the information provided in the question stem to help them to elaborate on their plan.
• Many provided brief explanation unclear response
(c) Suggest how students could supplement the information and findings presented in Resource 2 to find out more about Rolls-Royce’s impact on local industries. [5] Indicative content:
• Should include information to better understand the extent to which the collaborations have impacted locals, such as number of people who has participated in the partnerships for each local institutions and out of these, how many of them are locals. There should also be more information on the income generated or added due to such collaborations, such as from Singapore Airlines Engineering Company whose employees have participated in the collaboration to advance their skills in the aerospace industry and also from those who have participated in the collaboration with WDA’s new aerospace manufacturing programmes.
• The information provided in R2 is surely inadequate to assess impact of RR on local industries as there is no information on the local private institutions that RR might have worked with. Such private institutions include private

4
training establishments. For example, 4 out of 5 of the listed collaborations are with public institution and even the TNC stated is a state-linked corporations. More could be gleaned if more information on RR’s collaboration with private firms or institutions.
• Finally, there should be more comprehensive information on the type of forward and backward linkages that RR has provided to the local suppliers in aerospace and other related industries. This should enable one to have a fuller overview of the types and depth of economic impact that setting up an R&D research facility which is of higher value-addedness has on the local industries.
Levels marked
• L1/1-2m: Supplementary of information suggested is piecemeal and may not be purposeful.
• L2/3-4m: Considers some aspects and contexts to propose the information and findings needed to carefully consider the various impacts on local industries
• L3/5m: Considers all aspects and contexts to propose the information and findings needed to carefully consider the various impacts on local industries with relevant and strong use of resource.
Marker’s Report: • Many obtained low L2/3 as use of resource was not strong and piecemeal. • The possible impacts of RR via backward and forward linkages were not considered at
all by any candidate.
(d) Using Resources 1 and 2, evaluate how this research might be useful in
understanding the impacts of Rolls-Royce R&D in Singapore. [9]
Indicative content: Stand: Useful to a small extent
Useful: • Able to use map provided in R1 to identify the areas nearest to the RR facility
to draw out useful boundaries to scope the research in order to ensure that it is manageable for the students.
• R2 provides a brief overview of the type of collaboration and possible effects that RR has on the various groups of communities in Singapore when they partner with RR. For example, the list shows that RR has collaborated with a few stakeholders in SG, other than TNC such as Singapore Airlines. It can be gleaned from R2 that a few statutory boards and educational institutions in Singapore have been working with RR to provide training platforms to benefit local workforce and students.
Not useful:
• R1 may not be useful because it merely informs one of the location of RR in relation to its surrounding areas. However, the effects of this R&D facility may be more far reaching than those depicted in the map, such as whether the jobs created by the facility have benefited locals who are staying in the other parts of Singapore. The same goes to the impacts on local suppliers which might fall outside the area stated in R1. There is also no indication of the related traffic congestion or enhancements to public transport in the

5
immediate vicinity due to the RR facility, which could bring about both positive and negative impacts to the surrounding residents as depicted in R1.
• R2 is also not useful as this is only a list of collaborations with government agencies, institutions and government-linked TNC. The impact of RR on the local industry is certainly more than just these 5 collaborations. There has to be more information, from the types of jobs and related income of the jobs created in the facility itself, the jobs created from related industries because of the backward and forward linkages to the RR facility, and the GDP that has been generated due to the presence of RR in these related industries.
Levels marked • L1/1-3m: Poor use of resources to explain stand. No prominent stand. Stating
the use of resource instead of evaluating. • L2/4-6m: Adequate use of resources to explain stand. Able to evaluate resource
based on some aspects of ‘impacts to local community’. • L3/7-9m: Good and tight use of resources to explain stand. Able to evaluate
resource based on comprehensive aspects of ‘impacts to local community’. Marker’s Report: • Most fell in L2 as only a limited range of impacts were explored using the resources. • Some explored a wider range of impacts and used that to evaluate the resources but
the linkages to resources 1 and 2 are weak.
Section B
Theme 1: Tropical Environments
The Tropical Environment of Vietnam
2 Resource 3 shows data on protected status of karst areas in Southeast Asia. Resource 4 shows the climograph and a photograph of the karst landscape of Ha Long Bay in Vietnam. Resource 5 shows an aerial photograph of the Mekong River in Vietnam. Resource 6 shows the changes in forest cover in Vietnam from 1990 to 2005.
(a) Describe Vietnam’s karst landscape relative to those in other Southeast Asia countries’ as shown in Resource 3. [3]
Award 1 mark for each description, up to a maximum of 3 marks Possible responses include:
• Vietnam has the 3rd largest karst area in SEA • Vietnam has 14.7% of karst landscape in SEA • However, Vietnam has the 3rd lowest percentage of karst protected area with
only 7% of its karst protected compared to other countries in SEA • Vietnam has lower than average protected karst area in percentage, protecting
only 7% of its karst area when the region’s average is 13% Point marked

6
Marker’s Report • Most students were able to get at least 2 marks for this question • A handful of students had description of karst in SEA in general which does not
answer the question and hence did not obtain marks for those description • Students have to work on the specificity of their answers (e.g. some wrote
Vietnam has one of the most/least … give a sensing of their placing compared to the other countries in SEA!)
(b) Using Resource 4, explain the conditions necessary for the development of karst
landscape. [7]
Indicative Content Karst landscapes are associated with the humid tropics. Students should discuss the climatic conditions associated with Halong Bay, based on the climograph given in the resource, that provides the necessary conditions for the formation of karst landscape. Besides climate, students should also make use of the photograph resource provided of Halong Bay to discuss how geology also affects the development of karst landscape, not just in the type of rock (limestone) but also how joint pattern would affect the resultant karst landscape. Climate
• Temperature o From R4, Halong Bay receives moderate mean annual temperature of
23°C, where monthly temperature tends to reach its highest in the middle of the year in June and July with temperatures about 27°C
o High temperature increases the rate at which biochemical activities take place, such as the decomposition of organic matter, that would increase the production of carbon dioxide and organic acid that will then increase the rate at which chemical weathering could take place
o Furthermore, vant Hoff’s rule states that the rate of chemical weathering increases 2 to 3 times with every 10°C increase in temperature, thus the moderate mean annual temperature of Halong Bay would allow for chemical weathering, in particular carbonation and solution, to occur and facilitate the development of karst landscape
• Precipitation
o For the development of karst landscape, chemical weathering (carbonation and solution) of the limestone needs to take place. The agent responsible for chemical weathering is acidulated water
o From R4, Halong Bay’s receives high total annual precipitation of about 1920mm
o This high amount of precipitation favours the active weathering of limestone, especially during the middle of the year when Halong Bay experiences the wet season
Geology • Besides climate, the formation of karst landscape would require the presence of
soluble rocks, such as limestone • As seen in R4, Halong Bay is made up of cone karst. The white scarp indicates
soluble carbonate rocks • Joint pattern of rocks is important in influencing the resultant karst landscape.
In this case, it could be inferred that the joint spacing of the karst is not too dense to allow for the formation of cone karst
Vegetation • From R4, it could be seen that the karst landscape has vegetation grown on it

7
• The presence of vegetation contributes to carbon dioxide levels as well as humic acid into the soil environment when it decomposes which raises the acid level in the soil
• When rainwater infiltrates through the soil, the soil becomes more acidic through the enrichment of dissolved carbon dioxide and thus would become more effective in carrying out carbonation and solution weathering processes
Levels marked
Level Marks Description3 6-7 Response demonstrates accurate knowledge as well as clearly
identifying and accounting for the conditions necessary for the development of karst landscape as seen in R4. Explanation made use of both good and accurate use of resources and content knowledge to account for at least 2 conditions in the development of karst landscape seen in R4. Response is clearly focused on the question throughout with a detailed account of the necessary conditions for the development of karst landscape.
2 3-5 Response demonstrates adequate knowledge and identifies at least 2 conditions necessary for the development of karst landscape and attempts to account for them. Response uses R4 to account for the necessary conditions but may be limited or lack accuracy at times. Response may lack detail and depth or lack a clear focus on the question.
1 1-2 Response demonstrates limited knowledge and identifies only 1 condition necessary for the formation of karst landscape from R4. Limited reference is made to R4 to account for the necessary conditions required. Use of resource where present lacks accuracy. Little or no explanation is made and response lacks detail, clarity and focus on the question.
0 0 No creditworthy response
Marker’s Report
• Most students were able to identify the climatic condition, however the use of resource to support the explanation can be better. Some only managed to able to mention chemical weathering without explaining how it helps with the development of karst
• Many students were able to provide the condition of vegetation which is good
• However, only a handful discussed about geology! The factor of geology was not well-explained. Some mentioned purity of the rock which cannot be seen from the resource itself. But what can be seen is the joint density which should be discussed
• A few discussed about underground caverns which cannot be seen from the resource at all! Focus on what is shown on the resource, do not be too excited to throw out your content knowledge
(c) With the aid of a well-labelled diagram, explain the channel characteristics at
cross-section AB as shown in Resource 5. [5]

8
Indicative content
• Point A is the inner convex bank while Point B is the outer concave bank • At Point B, helicoidal flow that is moving faster at the outer concave bank leads
to greater erosion rates • As a result of lateral erosion by a river on its concave bank where channel flow
is fast, a steep slope known as a river cliff is formed • This helicoidal flow then loses its energy at Point A, resulting in the river to move
slower and deposits its material there • Coarse sediments carried by the river from erosion or mass movement
accumulate to form point bars • The gradual dissipation of energy leads to progressive fining of sediment
towards the upper surface that could form slip off slope
Level Marks Description3 5 Response provides a well-labelled diagram of the cross section AB seen
in R5. Diagram is supported with accurate knowledge of the processes that take place at the cross section of a meander and the effect on the characteristics across points AB. Response is clear, detailed and shows focus on the question.
2 3-4 Response provides a diagram of the cross section AB but with few minor errors. Diagram is supported with knowledge on the processes that take place at the cross section of a meander and the effect on the characteristics across point AB but may lack accuracy or detail in parts. Response is mostly clear but may lack focus on the question at times.
1 1-2 Response fails to provide a well-labelled diagram of the cross section AB seen in R5. Diagram is supported with some knowledge on the processes that take place at the cross section of a meander and the effect on the characteristics across point AB. However, response lacks detail, clarity and focus on the question with little or no explanation of the characteristics at the cross section AB.
0 0 No creditworthy response Marker’s Report
A question that is relatively poorly done A handful of students brought in pools and riffles but is NAQ because this question specifically just need you to explain how the channel characteristics form at the cross-section AB Most diagram are not well-drawn/well labelled. Some even missed out AB. Some confused between concave/convex banks Students need to know the role of helicoidal flow and how it shapes the cross-section of rivers
(d) With reference to Resource 6, suggest two reasons for the trends in forest cover
in Vietnam from 1990 to 2010. [5]

9 Indicative Content
• From R6, primary forest cover has fallen from 390,000 hectares in 1990 to 75,000 hectares in 2010 but forest cover (excluding plantations) has increased from 8,300,000 hectares in 1990 to 10,200,000 hectares in 2010
• Primary forest cover in Vietnam has fallen due to drivers of deforestation such as logging, agriculture and development (students need to choose 1 to explain in detail)
• However, forest cover continues to increase despite fall in primary forest cover due to strategies adopted such as reforestation or afforestation to manage the issue of deforestation
Level Marks Description3 4-5 Able to accurately explain for the nuance shown in R6. Reasons provided
are explained in detail and to the context of the question (Vietnam). Resource used accurately to describe the trends shown as well. Focus on the question is evident.
2 2-3 Response did not make full use of the resource. Provided 2 reasons but lacks analysis by providing one-sided reasons. I.e. both on why primary forest has decreased or both on why forest cover has increased. Explanation may lack detail but is relevant to the context of the question (Vietnam).
1 1 Response did not make accurate use of the resource. Explanation lacks detail and clarity. Reasons provided are not suited to the context of the question (Vietnam). Response lacks focus on the question.
0 0 No creditworthy response
Marker’s Report:
• Many were unable to pick out the nuance shown in the resource. Focused only on forest cover (excluding plantations) trend and hence max L2
• Some managed to point out the 2 trends but reasons provided are not strong/have flaws. For example, mentioning deforestation for the decline in primary forest cover but increase in protected areas for increase in forest cover (then shouldn’t primary forest increase as well? Unless it is stated that secondary forests are planted and protected then okay). The resource is showing that deforestation is still happening especially for primary forest but the country is planting secondary forests as part of afforestation efforts (students should know the difference between primary and secondary forests)
• Note that when the question asks for only two reasons, please provide only two reasons. Any reason provided after will not be accepted
(e) Explain how the changes in primary forest cover in Vietnam as shown in Resource 6 would affect the tropical environment of Vietnam shown in Resources 4 and 5. [5]
Indicative Content • From R6, primary forest cover has fallen from 390,000 hectares in 1990 to
75,000 hectares in 2010 indicating that deforestation is taking place in Vietnam• The act of deforestation could result in increased sedimentation in the Mekong
River in Vietnam seen in R5. Due to deforestation, soil erosion could take place at higher rates due to lack of tree roots to hold the soil together. Soil materials may then end up in the river, causing sedimentation that could lead to flooding in the long run due to accumulation of sediments in the river that lower the river’s capacity.
• Deforestation also releases stored carbon due to the role that trees play as carbon sinks. Deforestation through direct burning of the logged trees, decomposition of biomass and other processes disrupts the global carbon cycle

10
by increasing the concentration of atmospheric carbon dioxide and the removal of trees also reduces the ability to remove subsequent inputs of carbon dioxide by photosynthesis (removal of carbon sink). This could accelerate the rate at which chemical weathering of carbonation and solution takes place on soluble rocks seen in R4.
Level Marks Description3 5 Response demonstrates accurate knowledge to explain possible effects
of deforestation in R6 on tropical environments in R4 and R5. Explanation made use of both good and accurate use of resources and content knowledge to elaborate. Response is clearly focused on the question throughout with a detailed account of the possible effects on tropical environment seen in R4 and R5.
2 3-4 Response demonstrates adequate knowledge to explain possible effects of deforestation in R6 on tropical environments in R4 and R5 and attempts to account for them. Response uses the resources but may be limited or lack accuracy at times. Response may lack detail and depth or lack a clear focus on the question.
1 1-2 Response demonstrates limited knowledge to explain possible effects of deforestation in R6 on tropical environments in R4 and R5. Limited reference is made to the resources. Use of resource where present lacks accuracy. Little or no explanation is made and response lacks detail, clarity and focus on the question.
0 0 No creditworthy response Marker’s Report
• Many were able to discuss how deforestation has taken place but will be good to provide data again to prove that
• While talking about the effects, students should relate to impacts learnt in content and connect to the resources
• Some mentioned about deforestation on the karst landscape itself which is most limited in scale. Rather, discuss about impacts that are more probable to occur
• Some still mixed up mass movement and soil erosion. Note that in R5, there is no slope, so it should just be on soil erosion (explain how it occurs)
• Need to work on elaboration: Some were very brief in explaining how deforestation causes soil erosion and hence flooding.

11
Theme 2: Development, Economy and Environment
Nike’s Global Production Network
3 Resource 7 shows Nike’s production map in 2014. Resource 8 shows Nike’s job openings in the US and around the world and the description of the jobs offered in its corporate offices in 2015. Resource 9 is a factfile about China.
(a) With reference to Resource 7, describe the spatial distribution of Nike’s global production network. [3] 1m – From R7, the HQ remains in Nike’s home country of the USA. 1m – The branches are generally located in the European countries with estimated 25 branches. The next most populous area with Nike’s branches is Asia-Pacific with about 15 branches. 1m – Manufacturing facilities are mainly in the developing countries, such as China, Indonesia, Thailand and Vietnam. Point marked Marker’s Report: • This question was generally well done.
(b) Suggest reasons for the locations of Nike’s global production network as shown
in Resource 7. [6] Indicative content: • HQ in home country:
o Coordinate and control global operations with help of skills analysts and monitoring systems for key personnel to make informed decisions within short periods of time to cope with volatile needs in the department.
o Most TNCs will retain their HQs in the home country as this is where the culture and design language of the TNC is kept intact according to the original culture of the TNC.
• Branches in Europe and Asia Pacific: o Purchasing power of consumers in Europe are higher as these are
developed countries with high standards of living. o With rising level of affluence in Asia Pacific especially in China and India,
it makes business sense to tap into the improving purchasing prowess of the consumers in the region.
• Manufacturing in Asia: o Textile industry such Nike’s is labour intensive – imperative to keep cost
down by situating production with large supply of labour to keep labour cost to the minimum and these are often found in Asian countries such as China, Thailand and Vietnam.
o Regulations regarding labour rights and environmental laws are also laxer and ill-enforced in these countries.
Levels marked • L1/1-2m: Did not provide reasons for all 3 aspects of the GPN.

12
• L2/3-4m: All 3 aspects of the GPN was covered but elaboration was found wanting or was generic.
• L3/5-6m: All 3 aspects of the GPN was well elaborated and insightful. Marker’s Report: • Most obtained high L2. • Whilst most are able to provide extensive explanations for locations of branches,
the explanation for production should go beyond cheap labour. • Explanation for location of HQ in the home county was not well elaborated. Answers
need to go beyond ‘stable economy and political system’, or ‘coordinate and control’ but rather, what is available in the US to enable this ‘coordinate and control’ function to be situated in the US and in any other country (such as the UK) capable for providing the same (if not better) function.
(c) With reference to Resource 8, describe the global patterns of job openings (including US) offered by Nike’s corporate offices. [3] 1m – Majority of Nike’s job opening is in the US cities, with 429 openings for the US, with Portland having the highest number of openings. This number is much more than the total number of job openings combined globally outside the US (244). 1m – In areas outside the US, Asia has been given the most number of openings with China, Taiwan and Singapore taking 3 out of the top 5 countries for job openings in Nike. On the whole, job openings in Asia accounted for about 49% of the job openings outside of the US. 1m – European countries such as Netherlands, Belgium and Germany also accounted for 34% of the job openings outside of the US. Point marked Marker’s Report: • Use of resources was weak. Candidates generally stated the numbers as reference
to the resource but more could be done to state a % to provide a sense of proportion to the job opening in relation to the global/US total job openings.
(d) Using evidence from Resource 9, suggest two reasons why Nike may want to
continue its operations in China. [4] 2m – R9 shows an increase in total population from 1304 billion to 1364 billion, a total of 60 billion increase in population just within 2005 and 2015. This means potential increase in demand with larger consumer base. This will help Nike to increase its profit due to higher sales in China. 2m – In terms of purchasing power, R9 shows that the GDP per person has increased significantly from US$1753 to US$8069. This is about 4.5 times the income in 2005. This increase in GDP is a good indication of the purchasing power of the population. It can be foreseen that there should be more people who can afford more expensive products such as Nike’s and also potential for Nike to bring in their higher-end products to enhance their profit margin. Other possible points: sustained or even enhanced labour supply due to increase in total population

13
Point marked Marker’s Report: • Whilst most are able to point to higher population and income, elaboration of cause
and effect of these to Nike’s operations/margins are weak.
(e) Using Resources 7, 8, 9 and your own knowledge, recommend whether Nike
should prioritise its investment in Asia Pacific or the Americas region and justify your decision. [9] Indicative content: • [State objective of a TNC like Nike]: Obtain higher revenue to maximise profit,
gain market foothold in new markets, stay at the top of the game via advanced R&D and innovation.
• [Asia Pacific]: - Presence of emerging developing economies such as China as shown in
R9 with increasing population and even more impressive GDP growth. - From R7, with manufacturing facilities already mostly present (98% for
footwear) in Asia, it makes sense for Nike to prioritise investment in Asia to capitalise on proximity of manufacturing facilities to these emerging markets
- Also from R7, currently Asia Pacific region is already raking in $1.6 billion as compared to Americas region of $0.6 billion. Nike should continue with this momentum to introduce new products or even set up R&D in the Asia Pacific region to cater to the needs of the consumers in the Asian market for their new products.
- From R8, Asia Pacific is also emerging to become one of the key geographical area of employment of Nike’s global operations, taking up nearly 50% of the global job openings outside of the US. Thus, this means that there is increasing suitable types of labour in the Asian economies that can Nike could employ, as compared to the Americas where from R9, apart from 9 job openings, there is no other job openings. This may be a reflection of the fact that labour type in the Americas are not suitable for Nike’s global productions or operations and this may become problematic even if Nike would like to expand its investment in the Americas.
Levels marked
• L1/1-3m: Weak/little use of resources to back decision. Justifications might be based on sweeping statements.
• L2/4-6m: Appropriate use of resources to back decision. Justifications of decisions reflect some knowledge of the supply chain of textile industries and the key objectives of TNC operations.
• L3/7-9m: Appropriate use of resources to back decision. Justifications of decisions reflect in-depth knowledge of the supply chain of textile industries and the key objectives of TNC operations. Able to justify decision by proposing problems based on resources if the other area is chosen instead.
Marker’s Report: • Most candidates are not able to counter-argue their decision by pointing out the
possible problems if investments were to be expanded in the other area.

14
Theme 3: Sustainable Development
Global and China’s Investments in Renewable Energy 4 Resource 10 shows the worldwide investments in renewable energy between 2006 to
2015. Resource 11 shows the renewable energy investments by technology in 2015. Resource 12 shows the leading investors in renewable energy in 2015. Resource 13 shows China’s targeted energy mix by 2050.
(a) With reference to Resource 10, describe the changes in worldwide investments in renewable energy between 2006 to 2015. [4]
Award 1 mark for each point to a maximum of 4 marks. Possible responses include:
- Worldwide investment in renewable energy has generally increased from 112 US Billion in 2006 to 290 US Billion in 2015
- The largest increase took place between 2009 to 2010, where investment increased by approximately 62.5 US Billion
- Smallest change is a decrease from 2008 to 2009, with a fall by 12.5 billion - Worldwide investment in renewable energy is inconsistent/not a
consistent increase. - From 2008 to 2009 and from 2011 to 2013, investment decreased by
approximately 12.5 US Billion and 50 US Billion respectively. Data from the Resource should be used when appropriate to support responses. Point marked Marker’s Report
• A handful of students did not answer the question which asked to describe the CHANGES and not just describe worldwide investments in general (take note of such words!)
• Hence, students should describe general change (increase from 2006 to 2015), specific largest and smallest changes (increase/decrease by how much) and anomalies
• Need to read data properly. A handful wrote that the largest increase was from 2008 to 2009 when it should be 2009 to 2010
(b) With reference to Resource 10, account for the changes in worldwide investments
in renewable energy between 2006 to 2015. [4]
Award 1 mark for each point to a maximum of 2 marks. Award 1 mark for each accompanying explanation to a maximum of 2 marks. Possible responses include:
- Population growth threatening already-scarce supply of non-renewable energy sources
- Pressure to reduce the negative effects of climate change - Promoting economic development in ways that reduce harm on the
environment Data from the Resource should be used when appropriate to support responses. Point marked Marker’s Report:

15
• Not done well, most students were unable to 1) identify suitable/possible reasons and 2) elaborate on them
• Students need to think why there has been an increase in worldwide investment (linking to CC!)
• A handful discussed the drop in investment in some years due to financial crises which was accepted
• Note: Renewable energy does not include nuclear energy
(c) Explain possible reasons contributing to the proportion of renewable energy
investments by technology as shown in Resource 11. [4]
Award 1 mark for each point to a maximum of 2 marks. Award 1 mark for each accompanying explanation to a maximum of 2 marks. Possible reasons include:
- Already established infrastructure/technologies for certain forms of renewable energy (eg. Solar and Wind Energy)
- Cost of investment Data from the Resource should be used when appropriate to support responses. Marker’s Report
• Another poorly done question • Question asked about reasons that contribute to the PROPORTION of renewable
energy, i.e. some form of comparison is needed but some just stated reasons for each type of renewable energy
• Many were unable to elaborate 2 proper reasons • Some wrote sweeping statements such as how solar is widely available with
countries receiving sunlight every day or how solar is free and infinite (others are not?). Phrasing is important. You may write that sunlight is a MORE widely available resource than geothermal energy and hence more investment to harness the energy
(d) Discuss possible reasons contributing to China’s investment in renewable energy
as shown in Resource 12. [6]
Indicative Content
- Pressure by the developed world to transit towards greener modes of growth
- Economic benefits of developing their renewable energy sector - Population growth threatening already-scarce supply of non-renewable
energy sources
Levels marked Marker’s Report
• Many did not do well as they focused only on why china’s investment in renewable energy is high but did not compare the amount of money invested by China relative to other countries and also did not discuss the significance of why China’s investment in renewable energy is that high in 2015

16
o With these angles, what would you be writing instead? This will then make use of the resource more purposefully to show higher level analysis for higher marks
Levels Marks Descriptors 3 5 -6 Response demonstrates good knowledge of the likely
reasons contributing to China’s leading position in the investment in renewable energy. Explanation is detailed, thorough and relevant to the context of the question. Reference is made to the resource to substantiate response.
2 3-4 Response demonstrates reasonable knowledge of the likely reasons contributing to China’s leading position in the investment in renewable energy. Explanation is clear and mostly relevant to the context of the question. Reference is made to the resource to substantiate response.
1 1-2 Response demonstrates some or limited knowledge of the likely reasons contributing to China’s leading position in the investment in renewable energy. Explanation may not be always relevant to the context of the question.
0 0 No creditworthy response.
(e) Discuss the likelihood of China achieving its aims by 2050 as stated in Resource 13. [7] Indicative Content
- Prioritization of the renewable energy sector by the Chinese state would allow China to achieve its aims by 2050
- Contestations by the civil society against certain forms of renewable energy development by prevent China from achieving its aims by 2050
- China’s population may grow faster than the speed at which the renewable sector can develop
Levels marked
Marker’s Report
• Another question that is poorly done • Some did not address the demand of the question. Question is asking whether
its targets are possible and NOT asking for reasons for the trends shown • Students should be discussing why there is the potentials for China to venture
into AES, the challenges as well as whether the target for reduction in coal is possible!
Levels Marks Descriptors 3 6-7 Response demonstrates good knowledge on the possibilities
and challenges of China’s renewable energy targets/aims. Explanation is detailed, thorough and relevant to the context of the question. Reference is made to the resource to substantiate response.
2 4-5 Response demonstrates reasonable knowledge on the possibilities and challenges of China’s renewable energy targets/aims. Explanation is clear and mostly relevant to the context of the question. Reference is made to the resource to substantiate response.
1 1-3 Response demonstrates some or limited knowledge on the possibilities and challenges of China’s renewable energy targets/aims. Explanation may not be always relevant to the context of the question.
0 0 No creditworthy response.

17
Copyright Acknowledgements
Question 1 Resource 1 http://www.streetdirectory.com/sg/engine-test-rolls-royce-singapore/6-seletar-aerospace-rise-797575/105236_151296.html (last accessed 20 Aug 2018)
Question 1 Resource 2 https://www.rolls-royce.com/media/press-releases-archive/yr-2010/101028-enhance-skills.aspx https://www.rolls-royce.com/media/press-releases-archive/yr-2010/activity-contributing-to-singapore-economy.aspx https://www.a-star.edu.sg/News-and-Events/News/Press-Releases/ID/5691 https://www.rolls-royce.com/media/press-releases.aspx#18-07-2018-dsta-and-rr-partner-to-harness-digital-technologies-for-defence (last accessed 20 Aug 2018)
Question 2 Resource 3 https://academic.oup.com/bioscience/article/56/9/733/262911 (last accessed 24 August 2018) Question 2 Resource 4 https://www.klook.com/activity/7448-halong-bay-day-tour-hanoi-halong-bay/ and
http://www.southalltravel.co.uk/holidays-tours/vietnam/discover-vietnam/ (last accessed 25 August 2018)
Question 2 Resource 5 https://www.flickr.com/photos/fesign/29348001830 (last accessed 25 August 2018) Question 2 Resource 6 https://news.mongabay.com/2013/09/hydro-projects-a-front-for-logging-in-vietnam/ (last
accessed 25 August 2018) Question 3 Resource 7 https://slideplayer.com/slide/8732707/ (last accessed 20 Aug 2018) Question 3 Resource 8 http://timdegner.com/nike/ (last accessed 4 May 2018) Question 3 Resource 9 Copyright, Millennia Institute, 2018 Question 4 Resource 10 https://www.rsm.global/insights/economic-insights/global-trends-renewable-energy Question 4 Resource 11 https://www.rsm.global/insights/economic-insights/global-trends-renewable-energy Question 4 Resource 12 https://www.rsm.global/insights/economic-insights/global-trends-renewable-energy Question 4 Resource 13 http://www.nepalenergyforum.com/chinas-shift-from-coal-to-hydro-comes-at-a-heavy-price/

MERIDIAN JUNIOR COLLEGE PRELIM EXAMINATION Higher 2
_________________________________________________________________________________
JC 2 H2 Geography 9751/01
Paper 1 13 September 2018
3 Hours
Additional Materials: Answer Book World outline map _________________________________________________________________________________
READ THESE INSTRUCTIONS FIRST Write your name and Civics Group clearly on all your answer scripts. Write in dark blue or black pen on both sides of the paper. You may use a soft pencil for any diagrams, graphs or rough working. Answer three questions. One from each section. Start each question on a fresh sheet of paper.
1. At the end of the examination, fasten this cover sheet and all your work in chronological order together securely for submission.
The number of marks is given in the brackets [ ] at the end of each question or part question. You should make a reference to appropriate examples studied in the field or the classroom, even where the examples are not specifically requested by the question. Sketch maps and diagrams should be drawn wherever they serve to illustrate an answer. You are reminded of the need for good English and clear presentation in your answers. _________________________________________________________________________________
This document consists of 4 printed pages
Name: ________________________________________________
Class: ________________________________________________
Index number: ________________________________________________
Qn no.*
(Section A) Marks
Qn no. *
(Section B) Marks Qn no. *
(Section C) Marks
1 3 5
2 4 6
Total
*Please circle the question number attempted accordingly.

9751/01/PRELIMS/JC2/MJC/2018
2
Section A - Tropical Environments
Answer one question from this section.
1 (a) Explain how hydrographs can help in the study of flows in the humid tropics of Asia. [12]
(b) ‘Seasonal variation in wind direction have strong influence on rainfall patterns in the tropics.’
How far do you agree with this statement? [20]
2 (a) Account for the variation of mass movement processes in the tropics. [12]
(b) The effects of deforestation are more devastating to the physical than the human environment.
Discuss. [20]

9751/01/PRELIMS/JC2/MJC/2018
3
Section B – Development, Economy and Environment
Answer one question from this section
3 (a) Explain the characteristics of extractive industries with reference to countries at different levels of development. [12]
(b) Critically examine the role of natural resources in influencing the development of countries.
[20]
4 (a) Account for the global emergence of the New International Division of Labour (NIDL). [12]
(b) ‘International agreements are ineffective in managing transboundary water resources.’
To what extent do you agree with the statement?
[20]

9751/01/PRELIMS/JC2/MJC/2018
4
Section C – Sustainable Development
Answer one question from this section
5 (a) Explain the effects of climate change on the sustainable development of countries at high levels of development. [12]
(b) Discuss the challenges of mitigating the effects of pluvial floods in cities at varying levels of development. [20]
6 (a) Explain the key tenets of sustainable development in relation to countries with fast growing populations. [12]
(b) To what extent do you agree that management of non-hazardous solid waste is a key solution to sustainable urban development? [20]

9751/02/Prelims/JC2/MJC/2018
MERIDIAN JUNIOR COLLEGE PRELIM EXAMINATION Higher 2
_________________________________________________________________________________
JC2 H2 Geography 9751/02
Paper 2 19 September 2018
Insert
3 Hours
_________________________________________________________________________________
READ THESE INSTRUCTIONS FIRST This Insert contains the Photograph and all the Figures referred to in the questions. _________________________________________________________________________________
This document consists of 10 printed pages.

9751/02/PRELIMS/JC2/MJC/2018
2
Resource 1 for Question 1
Map of Pasir Ris Wafer Fabrication Park and its surrounding
Map of Eunos Industrial Estate and its surrounding

3
9751/02/Prelims/JC2/MJC/2018
Resource 2 for Question 1
Air Quality Meter
Resource 3 for Question 1
Recording sheet created by students for recording air quality
Site name: _________________________________ Site description: ____________________________ Record of readings: Air Quality Parameter Reading at 9am Reading at 6pm Particulate Matter 2.5 (PM 2.5) Particulate Matter 10 (PM 10) Humidity Temperature
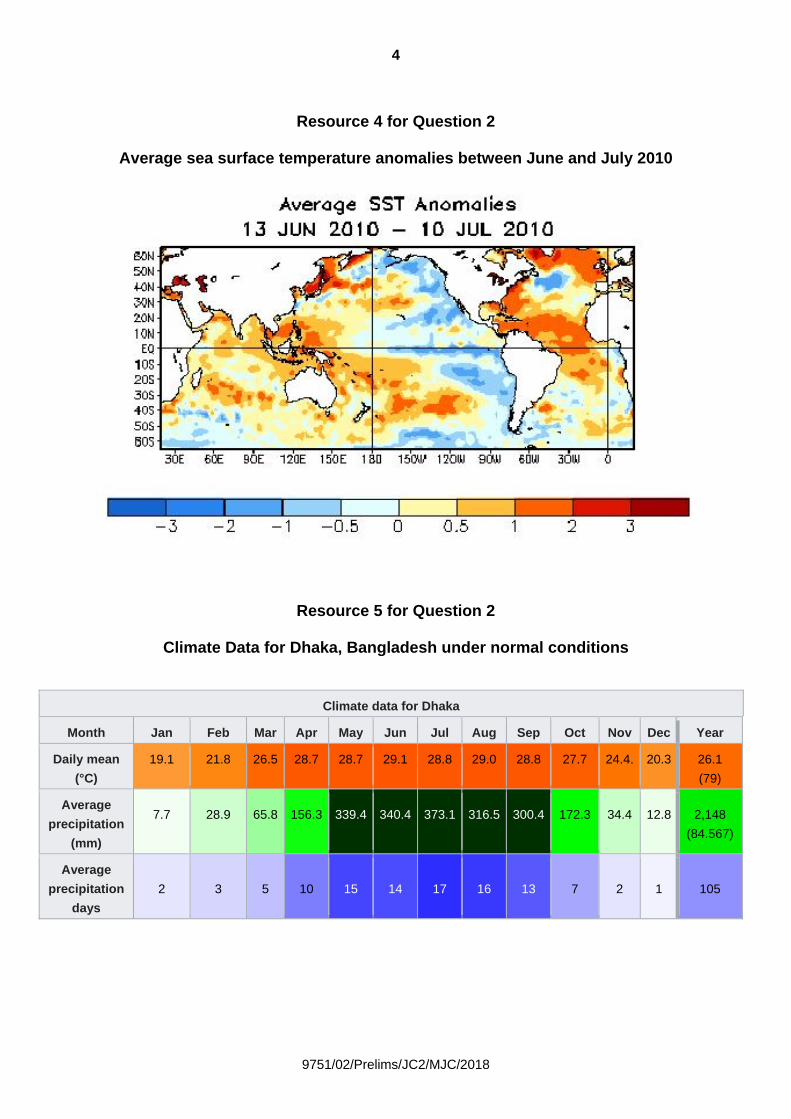
4
9751/02/Prelims/JC2/MJC/2018
Resource 4 for Question 2
Average sea surface temperature anomalies between June and July 2010
Resource 5 for Question 2
Climate Data for Dhaka, Bangladesh under normal conditions
Climate data for Dhaka
Month Jan Feb Mar Apr May Jun Jul Aug Sep Oct Nov Dec Year
Daily mean
(°C)
19.1
21.8
26.5
28.7
28.7
29.1
28.8
29.0
28.8
27.7
24.4. 20.3
26.1
(79)
Average
precipitation
(mm)
7.7
28.9
65.8
156.3
339.4
340.4
373.1
316.5
300.4
172.3
34.4
12.8
2,148
(84.567)
Average
precipitation
days
2 3 5 10 15 14 17 16 13 7 2 1 105

5
9751/02/Prelims/JC2/MJC/2018
Resource 6 for Question 2
Jamuna River and a segment of the features of the river

6
9751/02/Prelims/JC2/MJC/2018
Resource 7 for Question 3
Global trade flows in 2001

7
9751/02/Prelims/JC2/MJC/2018
Resource 8 for Question 3
Global inequalities in R&D expenditure, 2002

8
9751/02/Prelims/JC2/MJC/2018
Resource 9 for Question 4
Distribution of squatter settlements in Lima, Peru, 2004

9
9751/02/Prelims/JC2/MJC/2018
Resource 10a for Question 4
Clarke Quay, Singapore in the past
Resource 10b for Question 4
Clarke Quay, Singapore in the present

10
9751/02/Prelims/JC2/MJC/2018
Resource 11 for Question 4
Commentary on Clarke Quay, Singapore
Clarke Quay served as a dock for the loading and unloading of cargo for commercial houses and warehouses, also known as godowns, along the Singapore River from the 1800s. It was named after Sir Andrew Clarke, governor of the Straits Settlements from 1873 to 1875. Many of the shophouses seen here fronting the Singapore River feature sheltered verandahs at the top floor. They are mainly of the Teochew style of shophouses. From 1977 to 1987, the heavily polluted Singapore River was cleaned up, and the bumboats and wooden boats called tongkangs that plied the river became a thing of the past. Clarke Quay was designated a heritage conservation area in 1989, and it reopened in 1993 as a family-friendly attraction with more than 170 retail shops, 17 food and beverage joints and a $25-million adventure ride. However, the project proved commercially unviable and Clarke Quay was redeveloped as a dining and nightlife destination in the early 2000s. The changes and the opening of the Clarke Quay MRT station in 2003 increased visitor traffic. In 2012, Clarke Quay received one million visitors a month. Excerpt from: https://graphics.straitstimes.com/STI/STIMEDIA/2015/slider/microsite/index.html#central-clarkequay

9751/02/PRELIMS/JC2/MJC/2018
MERIDIAN JUNIOR COLLEGE PRELIM EXAMINATION Higher 2
_________________________________________________________________________________
JC 2 H2 Geography 9751/02
Paper 2 19 September 2018
3 Hours
Additional Materials: Answer Book Insert World outline map _________________________________________________________________________________
READ THESE INSTRUCTIONS FIRST Write your name and Civics Group clearly on all your answer scripts. Write in dark blue or black pen on both sides of the paper. You may use an HB pencil for any diagrams or graphs. Do not use staples, paper clips, glue or correction fluid. Candidates answer all questions. The Insert contains all the Resources referred to in the questions. You should make a reference to appropriate examples studied in the field or the classroom, even where the examples are not specifically requested by the question. Sketch maps and diagrams should be drawn wherever they serve to illustrate an answer. You are reminded of the need for good English and clear presentation in your answers. Start each question on a fresh sheet of paper.
1. At the end of the examination, fasten this cover sheet and all your work in chronological order together securely for submission.
The number of marks is given in the brackets [ ] at the end of each question or part question. _________________________________________________________________________________
This document consists of 5 printed pages.
Name: ________________________________________________
Class: ________________________________________________
Index number: ________________________________________________
Qn no.
Marks
Qn no. Marks
1 3
2 4
Total

9751/02/PRELIMS/JC2/MJC/2018
2
Section A Theme 4 – Geographical Investigation
1 A class of 22 Geography students were tasked to undertake an investigation to ascertain the impact of industries on local communities. They were given 2 weeks during June to conduct the investigation. During the planning phase of the geographical investigation, the team identified the industrial estates by first looking at the Jurong Town Corporations (JTC) industrial map of Singapore. Due to time and manpower constraints, the team chose to focus on investigating the environmental impacts of industries on local communities and identified two industries of different nature to conduct their study:
1. Pasir Ris Wafer Fabrication Park, which is characterised by high technology-based light industries
2. Eunos Industrial Estate, which is characterised by medium-to-heavy industries. Both industrial estates are located at the Eastern part of Singapore To measure the air quality, an Air Quality Meter was used. They selected sites within 500m of each industry and recorded the readings for particulate matter (PM) concentration in the air, temperature and humidity levels. The readings were taken daily at 9am and 6pm and the results were recorded. Resource 1 shows the map used by the students for the 2 sites of investigation. Resource 2 shows the Air Quality Meter and the features. Resource 3 shows a table the students created to record the readings.
(a) With reference to Resource 1 and Resource 3, suggest a hypothesis for the investigation and explain why it is suitable. [3]
(b) Explain the considerations the students should take note of when selecting the sites for measuring air quality. [5]
(c) State two limitations of the data collection method and explain how the data collection process can be improved. [6]
(d) Suggest how the data recorded can be represented. [2]
(e) Evaluate the usefulness of the investigation in understanding impacts of industries on local communities. [9]

9751/02/PRELIMS/JC2/MJC/2018
3
Section B
Theme 1: Tropical Environment
Climate Variability and Channel Morphology in Asia Pacific
2 Resource 4 shows the average sea surface temperature anomalies between June and July 2010.
Resource 5 shows the climate data of Dhaka, Bangladesh, under normal conditions.
Resource 6 shows the Jamuna River and a segment of the features of the river.
(a) Using Resource 4, describe the temperature anomalies in the Pacific Ocean. [4]
(b) Using Resources 4, 5 and 6, suggest how temperatures anomalies can result in changes in rainfall pattern in Dhaka, Bangladesh. [4]
(c) Describe the morphological features of the segment of Jamuna river shown in Resource 6. [4]
(d) Using Resources 4 and 6, explain how the temperature anomalies may result in changes in channel processes and morphological features of the Jamuna River. [6]
(e) Using Resource 4 and your own knowledge, explain how impacts of the temperature anomalies may differ between Australia and Peru. [7]

9751/02/PRELIMS/JC2/MJC/2018
Theme 2: Development, Economy and Environment
Global Economic Development
3 Resource 7 shows the pattern of global trade flows in 2001.
Resource 8 shows the global inequalities in R&D expenditure in 2002.
(a) Using Resource 7, compare the pattern of global trade flows between Africa and Western Europe in 2001. [4]
(b) Suggest reasons for pattern of trade flows described in (a). [6]
(c) Describe the global inequalities in R&D expenditure in 2002 as shown in Resource 8. [3]
(d) Explain how Resources 7 and 8 may reflect a core-periphery relationship in the global economy. [5]
(e) Using Resources 7 and 8, suggest what further information you would require for a fuller understanding of the nature of current global economic development. [7]
4

9751/02/PRELIMS/JC2/MJC/2018
5
Theme 3: Sustainable Development
Squatter settlements and Re-imaging in Peru and Singapore
4 Resource 9 shows the distribution of squatter settlements in Lima, Peru.
Resource 10a and 10b shows Clarke Quay, Singapore in the past and present respectively.
Resource 11 shows a commentary on Clarke Quay, Singapore.
(a) Using Resource 9, compare the location and extent of squatter settlements in the districts named Metropolitan Lima and Cono Sur.
[4]
(b) Squatter settlements can be seen as ‘slums of hope’. With reference to Resource 9, explain why living in a squatter settlement may be a positive experience for many people.
[5]
(c) Identify the features in Resource 10 which show that urban reimaging has taken place.
[3]
(d) Using Resource 9, 10 and 11, suggest reasons for urban re-imaging in cities. [4]
(e) Imagine you are a planning official from Metropolitan Lima who is looking into reimaging of Metropolitan Lima.
With reference to Resource 9, 10 and 11 and your own knowledge, critically evaluate the applicability of the reimaging strategies undertaken at Clarke Quay to Metropolitan Lima.
[9]

MERIDIAN JUNIOR COLLEGE PRELIM EXAMINATION Higher 2
_________________________________________________________________________________
JC 2 H2 Geography 9751/01
Paper 1 13 September 2018
3 Hours
Additional Materials: Answer Book World outline map _________________________________________________________________________________
READ THESE INSTRUCTIONS FIRST Write your name and Civics Group clearly on all your answer scripts. Write in dark blue or black pen on both sides of the paper. You may use a soft pencil for any diagrams, graphs or rough working. Answer three questions. One from each section. Start each question on a fresh sheet of paper.
1. At the end of the examination, fasten this cover sheet and all your work in chronological order together securely for submission.
The number of marks is given in the brackets [ ] at the end of each question or part question. You should make a reference to appropriate examples studied in the field or the classroom, even where the examples are not specifically requested by the question. Sketch maps and diagrams should be drawn wherever they serve to illustrate an answer. You are reminded of the need for good English and clear presentation in your answers. _________________________________________________________________________________
This document consists of 4 printed pages
Name: ________________________________________________
Class: ________________________________________________
Index number: ________________________________________________
Qn no.*
(Section A) Marks
Qn no. *
(Section B) Marks Qn no. *
(Section C) Marks
1 3 5
2 4 6
Total
*Please circle the question number attempted accordingly.

9751/01/PRELIMS/JC2/MJC/2018
2
DEFINE KEY TERMS IN INTRO – Pls memorise them properly, too many inaccurate definitions!!
SET THE CONTEXT
Section A - Tropical Environments
Answer one question from this section.
1 (a) Explain how hydrographs can help in the study of flows in the humid tropics of Asia. [12]
Relate parts of hydrograph to different surface and sub-surface flows within the drainage basin
(b) ‘Seasonal variation in wind direction have strong influence on rainfall patterns in the tropics.’
How far do you agree with this statement? [20]
To discuss factors affecting rainfall pattern and to recognise that seasonal variation in wind direction only affect parts of tropics. Weigh importance of factors for different parts of tropics.
2 (a) Account for the variation of mass movement processes in the tropics. [12]
Address all types of mass movement – flow, slide, fall, heave and factors resulting in them
(b) The effects of deforestation are more devastating to the physical than the human environment.
Discuss. [20]
To compare devastation of deforestation between physical and human environment. To see that physical impact lead to human impact. Addressing forest as a natural resource and unsustainability of deforestation

9751/01/PRELIMS/JC2/MJC/2018
3
Section B – Development, Economy and Environment
Answer one question from this section
3 (a) Explain the characteristics of extractive industries with reference to countries at different levels of development. [12]
To relate to the different characteristics of extractive industries stated in syllabus – location specific, capital and technology intensive, state and private ownership
(b) Critically examine the role of natural resources in influencing the development of countries.
[20]
To recognise the role of natural resource in development - countries susceptible to resource curse and others who manage to avoid it. Also to recognise that natural resource is not the only factor influencing development of a country
4 (a) Account for the global emergence of the New International Division of Labour (NIDL). [12]
Explain reasons of rise of NIDL including factors relating to technology, comparative advantage, actions by actors such as state, supranational organisations
(b) ‘International agreements are ineffective in managing transboundary water resources.’
To what extent do you agree with the statement?
[20]
Weighing effectiveness of international agreements as a means of transboundary water resource management using located examples. Also to

9751/01/PRELIMS/JC2/MJC/2018
4
discuss other means of management methods e.g. cooperative water management, improving governance. To recognise challenge of transboundary water management as one hindered by protection of sovereignty of state

9751/01/PRELIMS/JC2/MJC/2018
5
Section C – Sustainable Development
Answer one question from this section
5 (a) Explain the effects of climate change on the sustainable development of countries at high levels of development. [12]
Relate effects of climate change to 3 different aspects of sustainable development – social, economic, environmental
(b) Discuss the challenges of mitigating the effects of pluvial floods in cities at varying levels of development. [20]
Address social, economic, political and environmental challenges of mitigating pluvial floods. Higher level answers would address specific geographical conditions of cities which increase/ decrease challenge.
6 (a) Explain the key tenets of sustainable development in relation to countries with fast growing populations. [12]
Address 3 key tenets in syllabus:
- Meeting needs of poor - Limitations imposed by technology and society - Maximising 3 goals of sustainable development
(b) To what extent do you agree that management of non-hazardous solid waste is a key solution to sustainable urban development? [20]
Management of non-hazardous solid waste is as a solution to sustainable urban development, also to address other issues e.g. transport and slum issue. Address social, environment, economic aspect of sustainable urban development.

9751/01/PRELIMS/JC2/MJC/2018
6

9751/02/PRELIMS/JC2/MJC/2018
MERIDIAN JUNIOR COLLEGE PRELIM EXAMINATION Higher 2
_________________________________________________________________________________
JC 2 H2 Geography 9751/02
Paper 2 19 September 2018
3 Hours
Additional Materials: Answer Book Insert World outline map _________________________________________________________________________________
READ THESE INSTRUCTIONS FIRST Write your name and Civics Group clearly on all your answer scripts. Write in dark blue or black pen on both sides of the paper. You may use an HB pencil for any diagrams or graphs. Do not use staples, paper clips, glue or correction fluid. Candidates answer all questions. The Insert contains all the Resources referred to in the questions. You should make a reference to appropriate examples studied in the field or the classroom, even where the examples are not specifically requested by the question. Sketch maps and diagrams should be drawn wherever they serve to illustrate an answer. You are reminded of the need for good English and clear presentation in your answers. Start each question on a fresh sheet of paper.
1. At the end of the examination, fasten this cover sheet and all your work in chronological order together securely for submission.
The number of marks is given in the brackets [ ] at the end of each question or part question. _________________________________________________________________________________
This document consists of 5 printed pages.
Name: ________________________________________________
Class: ________________________________________________
Index number: ________________________________________________
Qn no.
Marks
Qn no. Marks
1 3
2 4
Total

9751/02/PRELIMS/JC2/MJC/2018
2
Section A Theme 4 – Geographical Investigation
1 A class of 22 Geography students were tasked to undertake an investigation to ascertain the impact of industries on local communities. They were given 2 weeks during June to conduct the investigation. During the planning phase of the geographical investigation, the team identified the industrial estates by first looking at the Jurong Town Corporations (JTC) industrial map of Singapore. Due to time and manpower constraints, the team chose to focus on investigating the environmental impacts of industries on local communities and identified two industries of different nature to conduct their study:
1. Pasir Ris Wafer Fabrication Park, which is characterised by high technology-based light industries
2. Eunos Industrial Estate, which is characterised by medium-to-heavy industries. Both industrial estates are located at the Eastern part of Singapore To measure the air quality, an Air Quality Meter was used. They selected sites within 500m of each industry and recorded the readings for particulate matter (PM) concentration in the air, temperature and humidity levels. The readings were taken daily at 9am and 6pm and the results were recorded. Resource 1 shows the map used by the students for the 2 sites of investigation. Resource 2 shows the Air Quality Meter and the features. Resource 3 shows a table the students created to record the readings.
(a) With reference to Resource 1 and Resource 3, suggest a hypothesis for the investigation and explain why it is suitable. [3]
Award 1m for a suitable and testable hypothesis relating industries and impact to local community Award 2m for explanation which address time, resource, scale of research
(b) Explain the considerations the students should take note of when selecting the sites for measuring air quality. [5]
Consideration could include manpower, contamination which affect accuracy of data, number of sites, characteristics of sites
(c) State two limitations of the data collection method and explain how the data collection process can be improved. [6]

9751/02/PRELIMS/JC2/MJC/2018
3
For each limitation, explain a related solution to improve the data collection process. Could include limitations in terms of timing, spatial scale, manpower resource etc
(d) Suggest how the data recorded can be represented. [2]
Suggested representation should include ability to compare between places and across time.
(e) Evaluate the usefulness of the investigation in understanding impacts of industries on local communities. [9]
Evaluation should include usefulness and limitations of research and of environmental impact measurements as well as a detailed discussion of other information useful for understanding other aspects of impacts e.g. social and economic impacts of industries on local communities

9751/02/PRELIMS/JC2/MJC/2018
4
Section B
Theme 1: Tropical Environment
Climate Variability and Channel Morphology in Asia Pacific
2 Resource 4 shows the average sea surface temperature anomalies between June and July 2010.
Resource 5 shows the climate data of Dhaka, Bangladesh, under normal conditions.
Resource 6 shows the Jamuna River and a segment of the features of the river.
(a) Using Resource 4, describe the temperature anomalies in the Pacific Ocean. [4]
Note differences between East and West Pacific Ocean and intensity of temperature anomalies
(b) Using Resources 4, 5 and 6, suggest how temperatures anomalies can result in changes in rainfall pattern in Dhaka, Bangladesh. [4]
Explain how increase in temperature shown in resource 4 can result in increase in amount of precipitation and also changes in monsoon precipitation
(c) Describe the morphological features of the segment of Jamuna river shown in Resource 6. [4]
Relate to specific features of braided stream e.g. broad containing channel, anastomising stream, mid channel bars etc and support with evidence from resource 6
(d) Using Resources 4 and 6, explain how the temperature anomalies may result in changes in channel processes and morphological features of the Jamuna River. [6]
Relate changes to temperature to discharge changes (increase rainfall/ Himalayan snow melt) and hence changes to channel processes (erosion, transportation, deposition) which may change features of braided stream
(e) Using Resource 4 and your own knowledge, explain how impacts of the temperature anomalies may differ between Australia and Peru. [7]
Discuss environmental, social, economic differences in impact between Australia and Peru. Note that Resource 4 does not show El Nino.

9751/02/PRELIMS/JC2/MJC/2018
5

9751/02/PRELIMS/JC2/MJC/2018
Theme 2: Development, Economy and Environment
Global Economic Development
3 Resource 7 shows the pattern of global trade flows in 2001.
Resource 8 shows the global inequalities in R&D expenditure in 2002.
(a) Using Resource 7, compare the pattern of global trade flows between Africa and Western Europe in 2001. [4]
Comparison can be made in terms of volume of trade, amount of trade flows, types and variety of trade
(b) Suggest reasons for pattern of trade flows described in (a). [6]
Explain why Africa has lower amount and variety of trade flows than Western Europe, relate to factors affecting economy e.g. comparative advantage, government policies, technology availability etc
(c) Describe the global inequalities in R&D expenditure in 2002 as shown in Resource 8. [3]
North has higher R&D expenditure than South, developed countries have higher R&D expenditure than South, anomaly of Australia
(d) Explain how Resources 7 and 8 may reflect a core-periphery relationship in the global economy. [5]
Resource 7 – greater amounts of trade flows in DC regions than LDC regions Resource 8 – developed countries have higher R&D expenditure than South Higher technology and expertise in DCs allow for greater investment and trade flows than LDCs
(e) Using Resources 7 and 8, suggest what further information you would require for a fuller understanding of the nature of current global economic development. [7]
• Type of trade in different industries, volume of each • Actors involved • More specifics within each region – regional inequalities • More up to date information
4

9751/02/PRELIMS/JC2/MJC/2018
7
9751/02/PRELIMS/JC2/MJC/2018
8
Theme 3: Sustainable Development
Squatter settlements and Re-imaging in Peru and Singapore
4 Resource 9 shows the distribution of squatter settlements in Lima, Peru.
Resource 10a and 10b shows Clarke Quay, Singapore in the past and present respectively.
Resource 11 shows a commentary on Clarke Quay, Singapore.
(a) Using Resource 9, compare the location and extent of squatter settlements in the districts named Metropolitan Lima and Cono Sur.
[4]
Compare in terms of numbers, location, size, location
(b) Squatter settlements can be seen as ‘slums of hope’. With reference to Resource 9, explain why living in a squatter settlement may be a positive experience for many people.
[5]
Address social, economic, environmental sustainability of slums
(c) Identify the features in Resource 10 which show that urban reimaging has taken place.
[3]
Modern new high rise building, cleanliness, streets and shelters
(d) Using Resource 9, 10 and 11, suggest reasons for urban re-imaging in cities. [4]
Factors for re-imaging e.g. reverse physical dilapidation, economic and social regeneration and sustainability support with data
(e) Imagine you are a planning official from Metropolitan Lima who is looking into reimaging of Metropolitan Lima.
With reference to Resource 9, 10 and 11 and your own knowledge, critically evaluate the applicability of the reimaging strategies undertaken at Clarke Quay to Metropolitan Lima.
[9]
Consider applicability of re-imaging strategy in various aspects including physical accessibility, economic and social ability, political capability

National Junior College SH2 Preliminary Exam 2018
GEOGRAPHY Paper 1 Structured Essay Questions Higher 2
9751/01
3 hours 21 August 2018
READ THESE INSTRUCTIONS FIRST Write your index number and name on the work you hand in. Write in dark blue or black pen on both sides of the paper. You may use an HB pencil for any diagrams or graphs. Do not use staples, paper clips, glue or correction fluid. Section A Answer one question. Section B Answer one question. Section C Answer one question. You should make reference to appropriate examples studied in the field or the classroom, even where such examples are not specifically requested by the question. Diagrams and sketch maps should be drawn whenever they serve to illustrate an answer. The world outline map may be annotated and handed in with relevant answers. You are reminded of the need for good English and clear presentation in your answers. At the end of the examination, fasten all your answer scripts securely together. The number of marks is given in brackets [ ] at the end of each question or part question.
This document consists of 3 printed pages and 1 blank page.

2
Section B – Development, Economy and Environment
Answer one question from this section.
Section A – Tropical Environments
Answer one question from this section.
1 (a) Explain how channel morphology varies with discharge across the humid
tropics. [12]
(b) ‘The 2011 flooding in Thailand was triggered by the landfall of tropical storms.’ Evaluate the validity of the statement with reference to examples that you have studied. [20]
2 (a) Describe and explain how materials are eroded by wind and water in the
arid tropics. [12]
(b) Discuss the relative importance of geology in influencing the types and rates
of erosion in the arid tropics. [20]
3 (a) Describe and explain how development can bring about changes in a
country's economy. [12]
(b) Assess the extent to which labour characteristics influence the ways in
which states bring about economic development. [20]
4 (a) Describe and explain how the views on the relationship between population
and resources have varied over time. [12]
(b) 'An abundance of natural resources can be both a blessing and a curse for countries at low levels of development.' Discuss. [20]

3
Section C – Sustainable Development
Answer one question from this section.
5 (a) Explain what sustainable development means to countries at different levels
of development. [12]
(b) Discuss how developing countries respond to climate change in pursuit of
sustainable development. [20]
6 (a) Compare the reasons for the development of slums in developing and
developed regions. [12]
(b) To what extent have strategies to improve slums been effective in
developing countries? [20]

4
BLANK PAGE

National Junior College SH2 Preliminary Exam 2018
GEOGRAPHY Paper 2 Data Response Questions INSERT
9751/02
3 hours 12 September 2018
READ THESE INSTRUCTIONS FIRST The insert contains all the Resources referred to in the questions.
This document consists of 14 printed pages.

2
Resource 1 for Question 1
Demographic profile of respondents
Set A (15)
Set B (30)
Age 0-19 6 5
20-39 4 10
40-59 0 10
60 and above 5 5
Gender Female 2 16
Male 13 14
Ethnicity Chinese 13 16
Indian 2 7
Malays 0 7
Others 0 0
Source: Original

3
Resource 2 for Question 1
Data representation of responses from selected questions
Source: Original
0%
10%
20%
30%
40%
50%
60%
70%
80%
90%
100%
The presence of KFC has increasedmy food options
KFC provides a comfortableenvironment for me to hang out
with my friends
KFC's 'No Straw' initiative is a goodmove for the environment
Survey Results
Strongly Disagree (%) Disagree (%) Agree (%) Strongly Agree (%)

4
Resource 3 for Question 1
Notice by a Kopitiam outlet at Greenridge Shopping Centre
Source: https://mothership.sg/2018/09/kopitiam-kfc-straw/

5
Res
ou
rce
4 fo
r Q
ues
tio
n 2
Glo
bal
dis
trib
uti
on
of
des
erts
in t
he
wo
rld
So
urc
e: h
ttps
://r
evis
ionw
orld
.com
/a2-
leve
l-lev
el-r
evis
ion/
geog
raph
y/ar
id-a
nd-s
emi-a
rid-e
nviro
nmen
ts-0
/cau
ses-
and-
dist
ribut
ion-
dese
rts

Resource 5 for Question 2 Photograph of landform in an arid region
Source: http://tamop412a.ttk.pte.hu/files/foldrajz1/www/en/ch02.html

7
Resource 6 for Question 2 Photograph of sand dunes in a desert
Source: http://tamop412a.ttk.pte.hu/files/foldrajz1/www/en/ch02.html

8
Resource 7 for Question 3 Groundwater levels in India, 2015
Source: https://www.wri.org/blog/2015/02/3-maps-explain-india%E2%80%99s-growing-water-risks

9
Resource 8 for Question 3 Water consumption by sector in India (BCM=billion cubic meters)
Source: https://www.eninconperspectives.com/burgeoning-water-consumption-and-its-
decreasing-availability-in-india-a-demand-supply-mismatch/

10
Resource 9 for Question 3 Extract on bottled water industry in India
As municipal bodies fail to provide safe drinking water, bottled water suppliers do brisk business in India. According to Market Research Euromonitor, the bottled water market in India is estimated to be 4.4 billion litres in volume in 2016, worth Rs 7,040 crore. Bottled water sales are expected to touch Rs 11,000 crore, growing by 25 per cent CAGR to touch Rs 21,500 crore by 2021.
Beverage majors like PepsiCo, The Coca-Cola Company, Bisleri International and Parle Agro are more focussed now on their bottled water divisions. India’s home-grown company, Patanjali has also announced plans for foraying into this market, expected to grow three times faster than that of beverages.
A reason for the boom in the bottled water business is water supplies that are too little, too polluted or too mismanaged. India is already reeling under an acute shortage of drinking water. A WaterAid report in 2016 ranked India among the worst countries in the world for the number of people without safe water. An estimated 76 million people in India have no access to safe water.
Data from the Union Ministry of Drinking Water and Sanitation (MODWS) suggests that 77 per cent of India’s rural population had access to at least 40 Litres Per Capita Day (LPCD) of safe drinking water. Even so, India compares poorly with other countries in terms of the rural population able to access safe drinking water. The crisis is fuelled by over-exploitation of ground water. A ministry official informs that groundwater was the source of 85 per cent of the drinking water in rural India, the rest coming from surface water like rivers and streams.
India is the largest exploiter of groundwater in the world. It pulls out 251 cubic km of water every year, which is higher than that of the United States and China put together. Ground water levels in India are sinking faster than in most major countries. “The situation is already critical in 40 per cent of our water reserves. Going forward it will be tougher to meet water demands. If we are not doing anything to reduce our exploitation of groundwater, there will be water wars,” says Kapil Narula, CEO & Executive Director, CII-Triveni Water Centre. Even where water is available, pollution is a major concern.
Source: https://fluoridealert.org/news/cost-of-water-surges-as-a-business-booms/
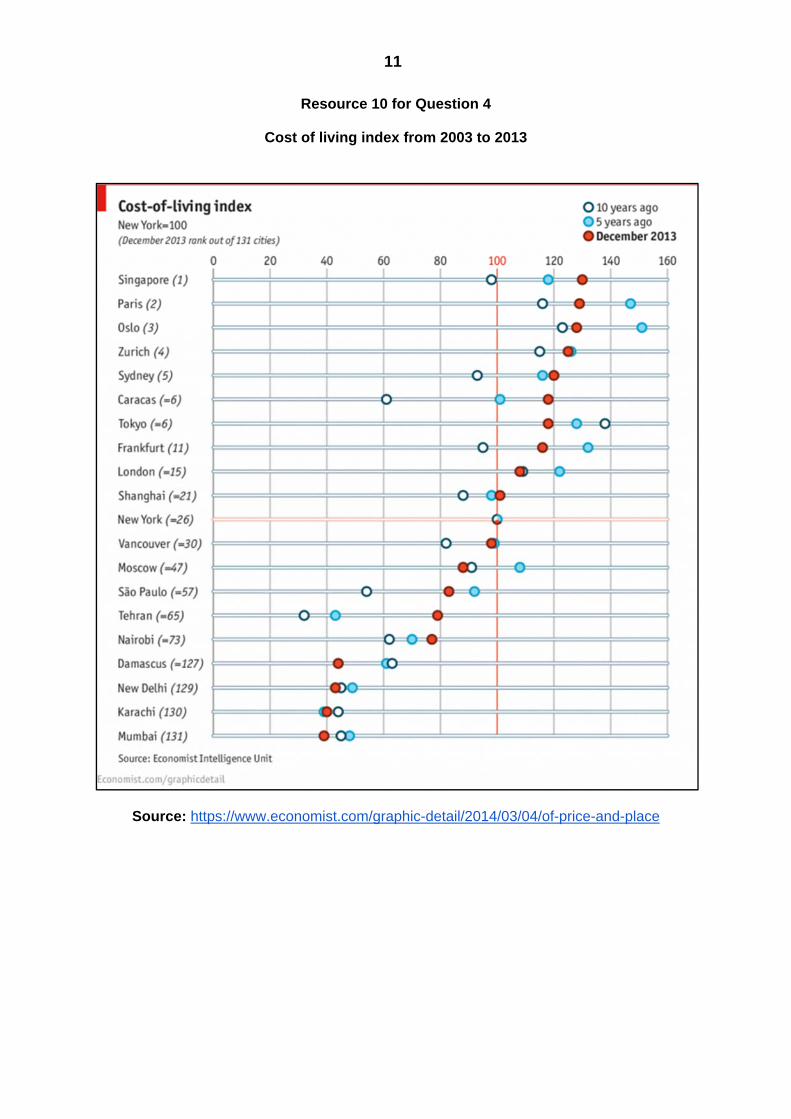
11
Resource 10 for Question 4
Cost of living index from 2003 to 2013
Source: https://www.economist.com/graphic-detail/2014/03/04/of-price-and-place

12
Resource 11 for Question 4
Poster of “Car-Lite” Singapore
Source: https://www.mewr.gov.sg/ssb/about-ssb/zippy-maree

13
Resource 12 for Question 4
Poster on recycling in National University of Singapore
Source: https://cpb-us-w2.wpmucdn.com/blog.nus.edu.sg/dist/e/185/files/2009/11/ZeroWaste-Exams-Sem1-
Ay0910.jpg
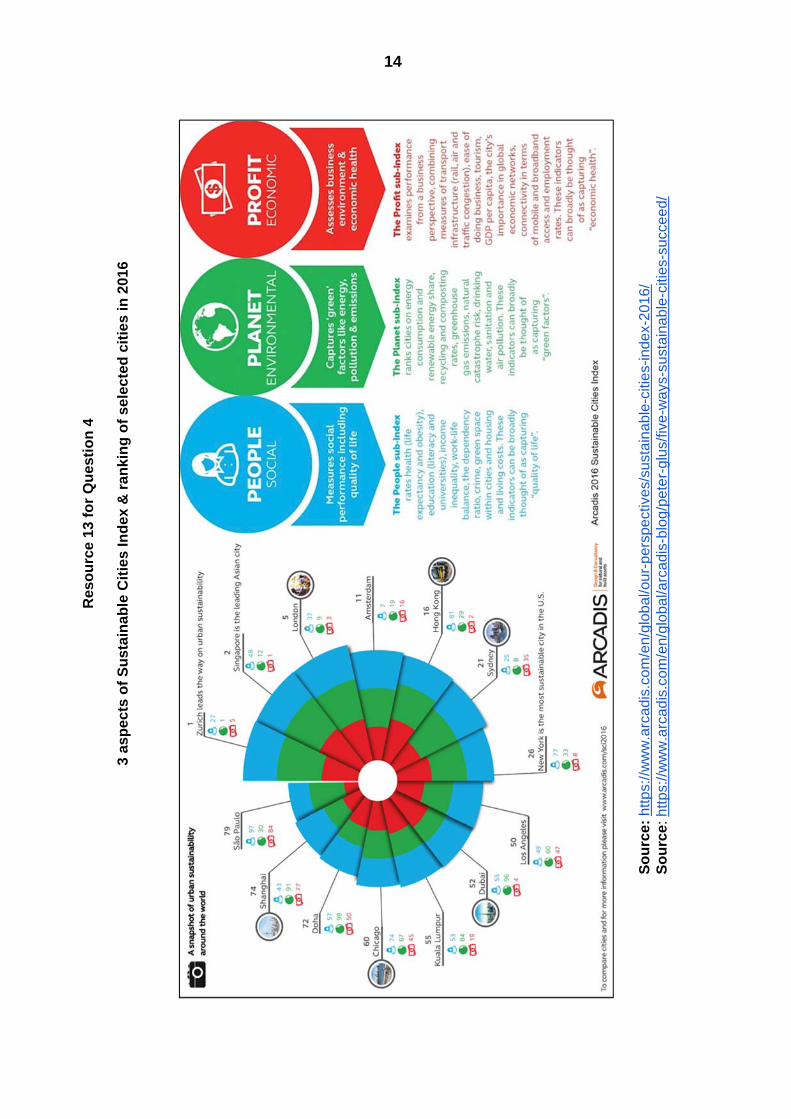
14
Res
ou
rce
13 f
or
Qu
esti
on
4
3
asp
ects
of
Su
stai
nab
le C
itie
s In
dex
& r
anki
ng
of
sele
cted
cit
ies
in 2
016
So
urc
e: h
ttps:
//ww
w.a
rcad
is.c
om/e
n/gl
obal
/our
-per
spec
tives
/sus
tain
able
-citi
es-in
dex-
2016
/ S
ou
rce:
http
s://
ww
w.a
rcad
is.c
om/e
n/gl
obal
/arc
adis
-blo
g/pe
ter-
glus
/five
-way
s-su
stai
nabl
e-ci
ties-
succ
eed/


National Junior College SH2 Preliminary Exam 2018
GEOGRAPHY Paper 2 Data Response Questions Higher 2
9751/02
3 hours 12 September 2018
READ THESE INSTRUCTIONS FIRST Write your index number and name on the work you hand in. Write in dark blue or black pen on both sides of the paper. You may use an HB pencil for any diagrams or graphs. Do not use staples, paper clips, glue or correction fluid. Answer all questions. You should make reference to appropriate examples studied in the field or the classroom, even where such examples are not specifically requested by the question. Diagrams and sketch maps should be drawn whenever they serve to illustrate an answer. The world outline map may be annotated and handed in with relevant answers. You are reminded of the need for good English and clear presentation in your answers. At the end of the examination, fasten all your answer scripts securely together. The number of marks is given in brackets [ ] at the end of each question or part question.
This document consists of 5 printed pages and 1 blank page and 1 insert.

2
Section A
Theme 4 - Geographical Investigation 1 A group of 12 students were tasked to investigate the impact of transnational
corporations (TNCs), in particular fast food restaurants, on the local community, the environment and local enterprises. They decided to examine the impact of a Kentucky Fried Chicken (KFC) outlet in Greenridge Shopping Centre on the community in Bukit Panjang, especially after KFC Singapore rolled out the ‘No Straws’ Initiative nationwide on 20 June 2018. To carry out their investigation, the students split themselves up into two teams of 6. Team A focused on conducting questionnaire surveys with residents while Team B worked with local enterprises nearby to elicit their views on how KFC has affected their business. They collected data on two days (Friday and Saturday), from 11am to 3pm. Students from Team A distributed themselves in Greenridge Shopping Centre and interviewed about 15 residents at random. When they got together to corroborate their responses after the first hour, they found that their responses were similar. In an attempt to gather more varied responses, one of the students suggested interviewing people of different demographic profile by being more deliberate in their choice of respondents. Team A then split themselves into pairs and went to the nearby housing estates to conduct more interviews. Students from Team B tried to speak with local enterprises in Greenridge. However they were either given very short and curt responses, or rejected. One of the students then suggested taking photographs and videos as data instead.

3
Study Resources 1 to 3. Resource 1 shows the demographic profile of the respondents interviewed by Team A. Set A refers to the first 15 respondents whom the students interviewed in Greenridge Shopping Centre. Set B refers to the subsequent 30 respondents whom the students interviewed at the nearby housing estates. Resource 2 shows the data representation of responses from selected questions carried out by Team A. Resource 3 shows a photograph of a notice taken by Team B at the Kopitiam in Greenridge Shopping Centre.
(a) Suggest a research question for the investigation and explain its suitability. [4] (b) With reference to Resource 1, explain how the change in sampling
techniques used in Set A and Set B may have improved Team A’s findings. [4] (c) Identify the data representation method shown in Resource 2 and assess
whether it is appropriate. [4] (d) Explain the ethical concerns of using photographs and videos as data for
the investigation. [4] (e) Evaluate the usefulness of the data shown in Resources 2 and 3 in helping
to ascertain the extent of a TNC’s impact on the local community where it operates. You may refer to your own knowledge where necessary. [9]

4
Section B
Theme 1 – Tropical Environments
Arid regions and the Sahara Desert
Theme 2 – Development, Economy and Environment
Water Scarcity in India
2 Resource 4 shows the global distribution of deserts in the world. Resource 5 shows a photograph of a landform found in an arid region. Resource 6 shows a photograph of sand dunes in a desert.
(a) With reference to Resource 4, describe and explain the global distribution
of arid regions across the tropics. [5] (b) Suggest other possible reasons for the aridity experienced in the Gobi and
Atacama deserts respectively as shown in Resource 4. [6] (c) Describe and explain the formation of the landform shown in Resource 5. [4] (d) Suggest how Resource 5 can prove the existence of variations in past
climates in the Sahara desert. [4] (e) Using Resource 6 and your own knowledge, how may wind direction
influence the development of sand dunes in the arid tropics? [6]
3 Resource 7 shows the groundwater levels of India in 2015. Resource 8 refers to the breakdown of water consumption by sector in India in 2010, 2013 and projection in 2030. Resource 9 consists of an extract from an article on the bottled water industry in India.
(a) Using Resource 7, describe the distribution of areas with low levels of
groundwater in India. [4] (b) With reference to Resources 7 and 8, suggest possible reasons for the low
levels of groundwater in India. [6] (c) Explain the impact of privatising water resources on society and the
environment as seen in Resource 9. [6] (d) Using Resources 8 and 9 and your own knowledge, discuss the extent to
which actors such as TNCs play an important role in managing natural resources. [9]

5
Theme 3 – Sustainable Development
Sustainable development in Singapore
4 Resource 10 shows the cost of living index from 2003 to 2013. Resource 11 shows a poster on the “Car-Lite” strategy used in Singapore to manage traffic congestion. Resource 12 shows a poster of an initiative to recycle notes in the campus of the National University of Singapore (NUS). Resource 13 shows the 3 aspects of the Sustainable Cities Index, as well as the ranking of a few selected cities in 2016.
(a) Using Resource 10, compare the changes in the cost of living index from
2003 to 2013 across Singapore, Shanghai and Tokyo. [5] (b) Describe and explain how the various elements outlined in the strategy of a
“Car-Lite” Singapore in Resource 11 can address problems associated with traffic congestion. [7]
(c) With reference to Resource 12, explain two ways in which recycling can
affect the global carbon cycle. [5] (d) Explain how Resources 10, 11 and 12 can be used to justify Singapore’s
ranking on the Sustainable Cities Index as shown in Resource 13. [8]

6
BLANK PAGE

NANYANG JUNIOR COLLEGE Year 2 Preliminary Examination
H2 GEOGRAPHY 9751/01 Paper 1 Structured Essay Questions 14 September 2018
3 hours Additional Materials: Answer Paper World outline map
READ THESE INSTRUCTIONS FIRST Write your Centre number, index number and name on the work you hand in. Write in dark blue or black pen on both sides of the paper. You may use an HB pencil for any diagrams or graphs. Do not use staples, paper clips, glue or correction fluid. Answer three questions. One from each section. You should make reference to appropriate examples studied in the field or the classroom, even where such examples are not specifically requested by the questions. Diagrams and sketch maps should be drawn whenever they serve to illustrate an answer. The world outline map may be annotated and handed in with relevant answers. You are reminded of the need for good English and clear presentation in your answers. At the end of the examination, fasten all your work securely together. The number of marks is given in brackets [ ] at the end of each question or part question.
This document consists of 3 printed pages. [Turn over

2
Higher 2 Geography / 9751 / 01
Section A – Tropical Environments
Answer one question in this section.
1 (a) Explain why tropical climates vary spatially. [12]
1 (b) To what extent can the successful management of the impacts of a flood result from the immediate response to such an event? [20]
2 (a) Explain the nature of flows and stores occurring in the humid and arid tropics. [12] 2 (b) Discuss the factors that contribute to the formation and development of meandering
and braided channels. [20]
Section B – Development, Economy and Environment
Answer one question from this section. 3 (a) Explain ways by which Global Production Networks (GPNs) are able to remain
competitive in rapidly industrialising countries. [12]
3 (b) “The only way for countries to achieve successful economic growth is to be part of a
supranational body.” How far do you agree with this statement? [20]
4 (a) Explain the challenges faced by countries at varying levels of development in the
implementation of the Millennium Development Goals 2000 – 2015. [12]
4 (b) Examine the relevance of the Limits to Growth theory in understanding population
growth and resource utilisation. [20]

3
Higher 2 Geography / 9751 / 01
Section C – Sustainable Development
Answer one question from this section.
5 (a) Explain the strategies adopted by countries with small land sizes in coping with climate change. [12]
5 (b) ‘The effects of climate change has economic and social implications.’ Discuss this
statement with reference to countries at varying levels of development. [20] 6 (a) Explain the challenges faced by the elderly and one other social group living in
countries at low levels of development. [12] 6 (b) Assess the extent to which strategies to meet the needs of the elderly in urban
areas have responded adequately to demographic and social change. [20]

NANYANG JUNIOR COLLEGE Year 2 Preliminary Examination
H2 GEOGRAPHY 9751/02 Paper 2 Data Response Questions 20 September 2018 INSERT
3 hours Additional Materials: Answer Paper
1 Insert World outline map
READ THESE INSTRUCTIONS FIRST This Insert contains all the Resources referred to in the questions.
This document consists of 12 printed pages. [Turn over

2
Higher 2 Geography / 9751 / 02
Resource 1 for Question 1
The catchment area of Stung Chrey Bak Stream in Cambodia
Source: Sopheak, C., Wales, N and Frewer, T. An Investigation of Land Cover and Land Use Change in Stung Chrey Bak Catchment, Cambodia CDRI Working Paper Series No. 53
Upstream study site

3
Higher 2 Geography / 9751 / 02
Resource 2 for Question 1
A segment of the upstream of Stung Chrey Bak Stream
Source: Sopheak, C., Wales, N and Frewer, T. An Investigation of Land Cover and Land Use Change in Stung Chrey Bak Catchment, Cambodia CDRI Working Paper Series No. 53

4
Higher 2 Geography / 9751 / 02
Resource 3 for Question 1
Data collected from the upstream segment of Stung Chrey Bak Stream
Section Velocity
(m/s)
Length
(m)
Water level
(cm)
1 0.5 1 12
2 1.1 1 15
3 1.5 1 22
4 1.8 1 24
5 1.7 1 28
6 1.6 1 35
7 2 1 37
8 1.9 1 42
9 2.1 1 44
10 2.1 1 46
11 1.8 1 33
12 1.6 1 19
13 1.5 1.3 14
Source: adapted from https://www.slideshare.net/techoly/steram-dicharge-measurement

5
Higher 2 Geography / 9751 / 02
Resource 4 for Question 2
Mass movement hazard in Sierra Leone, Africa
Source: http://www.opinionnigeria.com/lessons-from-freetown-and-congo-landslides-by-greg-odogwu/#sthash.Oj4BZ40d.dpbs
Resource 5 for Question 2
Mass movement in Egypt, Africa
Source: https://www.aljazeera.com/news/middleeast/2008/09/20089611533425930.html

Resource 6 for Question 2
The locations and climographs of Sierra Leone and Egypt
Source: https://www.bugbog.com/maps/africa/
Climograph of Sierra Leone
Climograph of Egypt

Resource 7 for Question 3
Employment structures and economic development of selected countries
Source: Unknown

8
Higher 2 Geography / 9751 / 02
Resource 8 for Question 3
Comparison between Internet penetration and mobile penetration of selected Asian countries and Australia
Source: https://www.researchgate.net/figure/Infographic-Internet-and-Mobile-Penetration-Resource-asia_fig2_262723188

9
Higher 2 Geography / 9751 / 02
Resource 9 for Question 3
The internet user profile for Southeast Asian countries in 2013
Source: https://www.researchgate.net/figure/Infographic-Internet-user-growth-2000-2010-Resource-asia_fig1_262723188
Southeast Asia online populations are relatively young
… who spent much of their time online

10
Higher 2 Geography / 9751 / 02
Resource 10 for Question 4
Type of waste composition in Phnom Penh, Cambodia
Country Type of waste composition (in %)
GDP/CapFood wastes
Paper Plastic Metal Glass Others
Phnom Penh,
Cambodia 63.3 6.4 15.5 0.6 1.2 13 513
Resource 11 for Question 4
The plastic situation in Cambodia
Source: http://geeksincambodia.com/beating-the-plastic-situation-innovatively-eco-friendly-startups-in-the-
kingdom/
Note: 5,000 Riels = S$1.68

11
Higher 2 Geography / 9751 / 02
Resource 12 for Question 4
A typical street scene in Phnom Penh
Source: https://urbanvoicecambodia.net/documentary-reflects-cambodias-battle-plastic/?lang=en
Resource 13 for Question 4
Typical characteristics of waste management in Asian cities by level of development
Waste characteristics
Level of development
Less developed cities
Rapidly developing cities
Developed cities
Waste generation (kg/capita-day)
0.3-0.7 0.5-1.5 >1.0
Waste collection rate <70% 80-95% 95-100% Recycling Informal Formal and informal Formal
Expenditure from Municipal budget (%)
15-40 5-25 1-5

12
Higher 2 Geography / 9751 / 02
Resource 14 for Question 4
News article about plastic bag fee implementation in Phnom Penh.
Environment Ministry rolls out plastic bag fee Khouth Sophak Chakrya and Daphne Chen | Publication date 29 March 2018 | 08:52 ICT Customers at shopping centres and supermarkets will be charged 400 riel per plastic bag beginning April 10. Heng Nareth, the director of environmental protection at the Ministry of Environment, said the aim is to reduce wasteful use of plastic bags. The initiative, he said, “is not to gain income for the state, but to change the attitude of people and turn their awareness to think about the impacts on the environment and society by reducing plastic bag consumption in Cambodia.” Chea Sopheak, the general manager of Sorya Mall, said she had been invited to several meetings with the ministry over the past few months and was supportive of the measure, even if it might cause discomfort among customers. “We are doing it for the sake of our environment,” she said. “It’s a starting point to educate people and get customers to take part in this effort to reduce plastic.” Soeung Saran, executive director of the urban issues NGO Sahmakum Teang Tnaut, welcomed the initiative. “In terms of waste management, plastic bags are one of the major issues,” he said. “Everyone throws them onto the street and waste management is still relatively poor.” However, Saran questioned the strength of enforcement. Nareth said vendors who disobey the pronouncement will receive a written warning before possibly being subject to fines or closure. He said officials hope to expand the initiative to other stores and wet markets.
Source: https://www.phnompenhpost.com/national/environment-ministry-rolls-out-plastic-bag-fee

NANYANG JUNIOR COLLEGE Year 2 Preliminary Examination
H2 GEOGRAPHY 9751/02 Paper 2 Data Response Questions 20 September 2018
3 hours Additional Materials: Answer Paper
1 Insert World outline map
READ THESE INSTRUCTIONS FIRST Write your Centre number, index number and name on the work you hand in. Write in dark blue or black pen on both sides of the paper. You may use an HB pencil for any diagrams or graphs. Do not use staples, paper clips, glue or correction fluid. Candidates answer all questions. The Insert contains all the Resources referred to in the questions. You should make reference to appropriate examples studied in the field or the classroom, even where such examples are not specifically requested by the questions. Diagrams and sketch maps should be drawn whenever they serve to illustrate an answer. The world outline map may be annotated and handed in with relevant answers. You are reminded of the need for good English and clear presentation in your answers. At the end of the examination, fasten all your work securely together. The number of marks is given in brackets [ ] at the end of each question or part question.
This document consists of 6 printed pages. [Turn over

2
Higher 2 Geography / 9751 / 02
Section A
Theme 4 – Geographical Investigation
1. A group of geography students went to study the Stung Chrey Bak Stream in
Cambodia as part of their overseas geographical investigation project. The stream is a tributary which feeds the Tonle Sap River. The team wanted to investigate the impact of landuse changes on flood risk and liveability of the area.
Data collection on stream velocity, depth, wetted perimeter and cross-sectional area was done over two days in December during the dry season. The team first measured a segment of the upstream before repeating the same process for a segment downstream. Due to time constraints, only one measurement (at 10am for both days) was taken for each stream segment. Equipment used: • ball of twine • meter ruler • measuring tape • portable flow meter to measure stream velocity The team measured the river velocity at regular intervals using a portable flow meter at depths of 0.2% and 0.8% from the water surface.
Flow meter used to measure velocity http://www.cleo.net.uk/consultants_resources/geography/source2sea/Sor2Sea/CURRENT.HTM
After measuring velocity, the team then laid an unweighted measuring tape along the river bed to measure the wetted perimeter. There were some boulders on the channel bed for the upper segment of the stream. Depth measurements were also taken at equal distances across the river. The data is used to plot the stream’s wetted perimeter and to calculate the cross sectional area.

3
Higher 2 Geography / 9751 / 02
Cross-sectional area of the upstream segment of Stung Chrey Bak Stream
Sopheak, C., Wales, N and Frewer, T. An Investigation of Land Cover and Land Use Change in Stung Chrey Bak Catchment, Cambodia CDRI Working Paper Series No. 53
Discharge is then calculated by multiplying the cross sectional area of the channel by the mean velocity of the water. Resource 1 shows the catchment area of Stung Chrey Bak Stream in Cambodia. Resource 2 shows a segment of the upstream of Stung Chrey Bak Stream. Resource 3 shows data collected from the upstream segment of Stung Chrey Bak Stream.
(a) With reference to Resources 1 and 2, suggest a suitable hypothesis for the
group’s investigation. [1] (b) What safety precautions should the team take when conducting the stream
investigation? [5] (c) Calculate the mean velocity of the channel in Resource 3 and sketch one line
graph to represent the cross-sectional velocity of the upstream segment of Stung Chrey Bak Stream. [4]
(d) The team concluded that some of the data collected may not have been
completely reliable and/or accurate. What improvements can be made in the planning and data collection process for this stream investigation? [6]
(e) Evaluate the usefulness of the river velocity data shown in Resource 3 in
ascertaining the flood risk of Stung Chrey Bak Stream. [9]
1 2 3 4 5 6 7 8 9 10 11 12 13

4
Higher 2 Geography / 9751 / 02
Section B
Theme 1: Tropical Environments
Mass movement hazards in Tropical Africa 2. Resource 4 and 5 show mass movement hazards in Sierra Leone and Egypt in
Africa. Resource 6 shows the locations and climographs of Sierra Leone and Egypt.
(a) Identify the type of mass movement hazards as shown in Resources 4 and 5.
[2]
(b) With reference to Resources 4 and 5 compare the physical effects of the mass movement hazards. [3]
(c) Suggest possible causes that could have led to the mass movement hazards
in Resources 4 and 5. [5]
(d) With reference to Resource 6, account for the rainfall pattern for Sierra Leone and Egypt. [7]
(e) Using Resource 6, explain the role of climate in influencing the type of mass movement as shown in Resources 4 and 5. [8]

5
Higher 2 Geography / 9751 / 02
Theme 2: Development, Economy and Environment
Development Gap in Asia 3. Resource 7 shows employment structures and economic development of
selected countries. Resource 8 shows the comparison between Internet penetration and mobile penetration of selected Asian countries and Australia. Resource 9 shows the internet user profile for Southeast Asian countries in 2013.
(a) With reference to Resource 7, describe the employment structures for both
the richer and poorer countries. [4] (b) Name the mapping technique used in Resource 7 and state one strength and
one limitation in representing the employment structures of the richer and poorer countries. [3]
(c) With reference to Resource 8, compare the internet penetration and mobile
penetration of Asian countries. [5]
(d) Using Resources 7 and 8 and your own knowledge, explain the possible existence of a development gap amongst Asian countries. [6]
(e) With reference to Resources 8 and 9, explain the socio-economic opportunities and challenges which developing countries like Vietnam may experience with the growth of internet penetration. [7]

6
Higher 2 Geography / 9751 / 02
Theme 3: Sustainable Development
Waste Management in Asian Cities
4. Resource 10 shows the type of waste composition in Phnom Penh, Cambodia. Resource 11 is an infographic showing the plastic situation in Cambodia. Resource 12 shows a typical street scene in Phnom Penh. Resource 13 shows the typical characteristics of waste management in Asian cities by level of development. Resource 14 shows a news article about plastic bag fee implementation in Phnom Penh. (a) Describe the composition of waste in Phnom Penh as shown in Resource 10.
[2]
(b) With reference to Resource 11, account for the percentage of plastic waste in Phnom Penh as shown in Resource 10. [5]
(c) With reference to Resource 12, explain how waste affects the liveability of Phnom Penh. [4]
(d) With reference to Resource 13, compare the solid waste management characteristics among Asian cities by level of development. [5]
(e) Using all resources and your own knowledge, assess the challenges faced in
managing plastic bag consumption in less developed cities. [9]

NYJC H2 Geog Paper 1 Prelims 2018 Mark scheme
Section A – Tropical Environments
1 (a) Explain why tropical climates vary spatially. [12] Indicative content: Students will be able to explain why tropical climates (humid and arid tropics) differ from place to place in terms of temperature and precipitation even though the region is located in an area of insolation surplus. Slight differences in temperature patterns can be made to the effects of long term factors like latitude, height above sea level, land and sea, geographic position and ocean currents as well as local ones like cloud cover. In explaining the greater variations in precipitation patterns, students will explain the role of the Hadley cell (factor of latitude in affecting primary pressure cells), topographic features resulting in differences between windward and leeward slopes, continentality effects and ocean currents. A higher level response will include students’ ability to finely differentiate between the humid and seasonally humid tropics’ (Am and Aw) with regard to rainfall patterns (Am being coastal will have more rainfall from onshore winds during summer monsoon than Aw being continental interiors for same latitude locations). Top marks will be awarded to students who are able to bring in the role of humans in affecting climates via the urban heat island effects i.e. cities as contrasted to surrounding rural areas. Levels marked using H2 generic level descriptors for 12m SEQ sub-part (a). 1 (b) To what extent can the successful management of the impacts of a flood result from
the immediate response to such an event? [20]
Indicative content: To begin with, students should provide the definition of flooding. The focus of the question lies in the ‘immediate response’ to a flood event and whether it led to successful management with support from case studies i.e. alleviating the negative impacts of flooding. So, what constitutes an immediate response? A clear description of ‘immediate response’ which is indeed ‘search and rescue’ often in helicopters and boats is required. Having dealt with the immediate, then short term responses like water supplies, housing, shelter and aid in the form of food and blankets etc. can be discussed. Mid-term response measures will include re-housing, insurance payouts and repair of infrastructure. However, for successful management, it is necessary to mention the need for longer-term responses like hard and soft engineering techniques, community preparedness and insurance schemes. Countries that are deemed as well prepared would have also invested time and money to do flood prediction as this not only provides time for evacuation efforts but also aid in the evaluation of the adequacy of current flood protection structures in their countries. Contextualised examples of both successful and unsuccessful countries in flood management are needed. A higher response to flood management is to look beyond the channel such as management of the whole drainage basin. This will help increase lag time and lower peak

2
Higher 2 Geography / 9751 / 01
discharge. Measures include controlling the rate of tropical deforestation within the catchment and the management of pluvial flooding due to rapid urbanisation. Noting that flooding after all is a climate led event, it is important for students to recognise that even developed countries are unable to guard against high magnitude, low frequency flooding despite having everything in placed. The challenges brought about by climate change such as stronger and more frequent tropical storms only puts more countries at risk in particular the economically weaker countries. Possible synoptic links: Theme 1.1 Storm runoff generation, Theme 2.1 Role of the State, Theme 3.1 Climate change due to enhanced greenhouse effect and Theme 3.2 Urbanisation and pluvial floods. Levels marked using H2 generic level descriptors for 20m SEQ sub-part (b). 2 (a) Explain the nature of flows and stores occurring in the humid and arid tropics. [12] Indicative content Students will show the understanding that flows and stores are affected by climate. Indeed climate affects hydrological processes on a regional scale which in turn determines the nature of flows and stores. In order to show the impact of climate, students will have to provide a brief description of the climatic conditions for both regions. As both climates are at the extreme ends of each other in terms of precipitation (though they may exhibit the same high mean annual temp), students will argue that flows and stores of both regions will likely to be affected by input rather than output. The factor of precipitation often plays an overriding role in determining the nature and amount of flows and stores. By this default, both climatic belts should see more differences in flows and stores as compared to similarities. A higher level response will include students making a finer distinction between climates within the humid tropics as Am and Aw receive a more seasonal precipitation pattern as compared to Af. Students will be able to articulate the temporal differences in the nature of flows and stores in their discussion of the two sub-types. In addition, they will recognize the impact of human activities e.g. deforestation, extractive industries as well as local factors such as geology and relief in altering the nature of flows and stores. Levels marked using H2 generic level descriptors for 12m SEQ sub-part (a). 2 (b) Discuss the factors that contribute to the formation and development of meandering
and braided channels. [20] Indicative content Students will explain the influence of a variety of factors that contribute to both the formation as well as the development of meandering and braided channels. Climate remains the primary factor as it controls the amount of discharge which in turn affects the velocity of the river to do its work – erosion, transportation and deposition. However, climate alone will not be able to explain fully the two types of channel patterns. Local factors such as geology, abundant bedload and channel slope must be considered to form
3
Higher 2 Geography / 9751 / 01
the complete picture. Climate together with local factors combine to control water discharge, erodibility of the channel banks and sediment supply. A higher level response will include how time as a factor could alter the shape of meandering channels such as the formation of cut-offs and ox-bow lake. Likewise, human activities and climate change too have an impact on channel patterns. Both of these factors may create positive feedback loops. Examples could include the impact of extractive industries such as the mining of mineral ores as well as rapid deforestation which have led to high sediment load being discharged into the waterways. This overloads the channel and cause sedimentation to occur resulting in meandering channels becoming braided through time. Similarly, as climate becomes drier, the decrease in discharge will inevitably reduce channel velocity, increase deposition and hence braiding. Hard engineering methods that increase the channel gradient through straightening for flood relief may also cause channels to braid. Possible synoptic links: Theme 1.2 Deforestation, Theme 2.2 Extractive industries and Theme 3.1 Climate Change Levels marked using H2 generic level descriptors for 20m SEQ sub-part (b). 3 (a) Explain ways by which Global Production Networks (GPNs) are able to remain
competitive in rapidly industrialising countries. [12] Indicative content Students will be able to provide a brief description of the characteristics of GPNs in terms of their structure and operations. As GPNs are being centred around dominant TNCs, the quest to increase their profit margins has seen many of these large firms from industrialised economies shifting production activity across borders to the developing countries. The dominant trend has been for firms in many sectors to focus on their core activity or ‘competency’ while seeking non-core inputs via external relationships. This trend is part of a broader shift from Fordist (mass production) to more flexible post-Fordist production systems. The destinations are usually the rapidly industrialising countries i.e. emerging economies such as BRICS. In staying competitive, students will be able to explain how TNCs engage in inter-firm trade such as subcontracting, strategic alliance, joint ventures, franchising and cooperative agreements. A higher response will include the ability to contextualise each strategy with specific examples of TNCs engaging in them to stay ahead of their game. It is also important to articulate that not all strategies have achieved their intended results such as that of outsourcing when standards have not been met by suppliers. Levels marked using H2 generic level descriptors for 12m SEQ sub-part (a).

4
Higher 2 Geography / 9751 / 01
3 (b) “The only way for countries to achieve successful economic growth is to be part of a supranational body.” How far do you agree with this statement? [20]
Indicative content Students will argue on how supranational bodies are able to help countries; particularly the developing ones in achieving economic success. Students will explain how countries have benefited economically by being part of or worked with a world institution (World Bank, IMF or WTO) and that of a trading bloc such as ASEAN, EU, NAFTA etc. Yet, it is important to note that not all countries have benefited from being a part of a supranational body. As these supranational bodies are being governed by state representatives with bulk coming from the DCs, they tend to work in favour of the richer countries. LDCs and sometimes NIEs have to be at the “mercy” of the conditions laid out by the supranational body as seen in the case of Thailand and Greece during the financial crisis. On a wider note, countries’ participation in a supranational body (ies) is definitely not the only way to achieve successful economic growth. The role of the state and other non-state actors in the global economy (TNCs and civil society, NGOs) should also be considered as critical success factors. A higher response will see students arguing from the perspective that achieving economic growth stems from the interplay of the power relations between the state, the supranational body as well as non-state actors such as the TNCs and the civil society. Successful countries e.g. Four Asian Tigers highlight the importance of states in managing its partners well in addition to having the vision and commitment in implementing infrastructural, economic and social development policies/strategies. This also includes the ability to garner support from the civil society to implement bottom up approaches to help in the economic and social development of rural areas. Possible Synoptic links: Theme 1.2 Deforestation, Theme 2.2 Extractive industries and resource management and Theme 3.1 Sustainable Development and 3.2 Reimaging in enhancing urban liveability and promoting urban tourism Levels marked using H2 generic level descriptors for 20m SEQ sub-part (b). 4 (a) Explain the challenges faced by countries at varying levels of development in the
implementation of the Millennium Development Goals 2000 – 2015. [12] Indicative content The main objective of the MDGs is an attempt to bridge the enormous magnitude of the inequalities that stem from the effects of globalisation. With its eight overarching goals and 18 specific targets, it has to some extent achieved positive results such as the reduction of extreme poverty as well as improvements made in primary school net enrolment rate. However, the report card has also shown that both LDCs and DCs were confronted with their own distinct set of challenges. Amongst LDCs, greater focus was often paid to economic growth and social-sector spending while ignoring hunger and nutrition, environment and technology transfer. Other challenges included goals being deemed as too demanding and some argued as unrealistic in the attempt to create an incentive for more rapid progress. As for DCs, their challenges include the belief that people in rich countries can largely avoid making changes in their own lifestyles; hence adopting a “business as usual attitude” towards consumption. There were tradeoffs which DCs were

5
Higher 2 Geography / 9751 / 01
not willing to undertake for a greener environment as they continued to rely on fossil fuels as their main source of energy. Other challenges for DCs include income inequality between states e.g. deindustrialised areas vs those with sunrise industries. Likewise for most middle-income countries, the MDGs may be seen as not particularly ambitious or relevant. Such attitudes only hindered the progress made towards achieving the intended goals. A higher response will see students highlighting that for certain challenges such as climate change and environmental degradation, they remain common obstacles faced by all countries regardless of their economic status. Global emissions of carbon dioxide have increased by over 50 per cent since 1990. Addressing the unabated rise in greenhouse gas emissions and the resulting likely impacts of climate change, such as altered ecosystems, weather extremes and risks to society, remains an urgent, critical challenge for all nations. Levels marked using H2 generic level descriptors for 12m SEQ sub-part (a). 4 (b) Examine the relevance of the Limits to Growth theory in understanding population
growth and resource utilisation. [20]
Indicative content: Students will put forth the main tenets of Meadow’s LTG theory - we will run into fixed resource limits, but human demands (driven by growing population and affluence) will overshoot those limits and cause a crash (outbreak crash scenario). The discussion will include Meadows’ LTG’s five variables: population, industrialisation, pollution, food production and resource depletion in the real world context of the 21st century vis-à-vis the concept of an environmental limit. Some evidence to support Meadows’ theory include environmental destruction, species extinction, water pollution leading to scarcity and conflicts. Students can make reference to Harvey’s contradiction 16. In the counterarguments, students will highlight the limitations of the LTG model whilst offering the alternative perspective offered by the Hedonists theorists - the possibility that even with population growth, food supply and resources can be increased to meet global needs. The tenets of the Cornucopians’ and Boserup’s will offer alternatives to the pessimists’ ideas. Harvey’s idea on the relative resource scarcity due to capitalists’ exploitation on labour should also be brought in to refute the thesis. A higher level response could be to assess the theories in relation to empirical data drawn from examples that support both camps. Other factors such as poor governance that reduce and depletes resource base will continue to challenge particularly the HIPC countries in meeting their needs could also be included. Possible synoptic links: Tropical deforestation (Topic 1.2), Influence of TNCs and States in depleting resources and causing environmental degradation (Topic 2.1), Extractive Industries and Water Management in depleting resources and causing environmental degradation (Topic 2.2) and Sustainable development and Climate Change (Topic 3.1) Levels marked using H2 generic level descriptors for 20m SEQ sub-part (b).

6
Higher 2 Geography / 9751 / 01
5 (a) Explain the strategies adopted by countries with small land sizes in coping with climate change. [12]
Indicative Content Candidates should be able to explain a variety of mitigation and adaptation strategies that are implemented to cope with climate change. Mitigation strategies are strategies implemented to reduce the rate of climate change via the management of its drivers. Adaptation strategies refer to the process of adjustment to actual or expected climate and its effects, in order to moderate harm or exploit beneficial opportunities. Responses should be supported by appropriate examples from countries with small land sizes. Countries with small land sizes include small islands and developing states, such as Maldives, Tuvalu, Monaco, Seychelles, Singapore etc. A higher level response consists of a carefully directed explanation of strategies from more than one country with small land size. Responses should also reveal the impacts and challenges brought about by climate change that are faced by countries with small land sizes and link to the subsequent strategies implemented. Levels marked using H2 generic level descriptors for 12m SEQ sub-part (a). 5 (b) ‘The effects of climate change has economic and social implications.’ Discuss this
statement with reference to countries at varying levels of development. [20]
Indicative Content Candidates should include a discussion of a range of effects of climate change and link to their economic and social implications. Effects of climate change include temperature increase, permafrost degradation, rising sea levels, changes to precipitation patterns, increase in frequency of severe weather, increase coastal and river flooding in some areas and drought in others, mass movement, impacts on ecosystems etc. The economic and social implications are things that are likely to happen as a result of those effects. For example, livelihood of people especially farmers, fishermen and indigenous people, health risks, deaths, poverty, economic loss from extreme weather events, economic cost involved in adaptation and mitigation etc. Appropriate and relevant case studies at varying scales and levels of development should be used purposefully to support responses. A higher level response should discuss the economic and social implications in the context of countries at varying levels of development. Candidates should also consider how the implications vary across space and time. It could also include political implications as a result of the effects of climate change. For example, the power relations between governments at varying levels of development, negotiations at regional and international scales etc. Possible links to other topics include tropical climates (1.1), tropical deforestation, flooding in the tropics (1.2), structure of the economy, TNCs, role of the state, regional and international organisations, non-state actors (Topic 2.1), water resource management (2.2), measurement of sustainable urban development, issues in sustainable urban development, pluvial floods (3.2). Levels marked using H2 generic level descriptors for 20m SEQ sub-part (b).

7
Higher 2 Geography / 9751 / 01
6 (a) Explain the challenges faced by the elderly and one other social group living in countries at low levels of development. [12]
Indicative Content Candidates should make reference to examples from countries at low levels of development and outline relevant challenges faced by the elderly and one other social group (disabled). Challenges faced by the elderly include mobility, health, safety, poverty, ageism, social isolation, loneliness and elder abuse. Challenges faced by the disabled include stigma, discrimination, abuse, exploitation (social barriers), accessibility (structural barriers), poverty, housing, and financial independence. A high level response should identify traits or characteristics associated with countries at low levels of development and make explicit links to how these traits or characteristics contribute to the challenges faced or exceptions. Another possible approach is to demonstrate how these challenges could vary across, and within social groups, over a period of time. Levels marked using H2 generic level descriptors for 12m SEQ sub-part (a). 6 (b) Assess the extent to which strategies to meet the needs of the elderly in urban
areas have responded adequately to demographic and social change. [20]
Indicative Content Responses should consider the extent of adequacy of a variety of strategies to meet the needs of the elderly in urban areas. The extent of adequacy is measured by how much a strategy has responded to the demographic and social change happening in urban areas. Demographic and social changes include ageing population, culture and technology, changes in society due to environmental changes (climate change, natural disasters), social conflict (war, terrorism) etc. More than one example should be provided and evaluated in relation to a criterion/criteria. A higher level response could apply a set of criteria or a criterion consistently to evaluate different examples. Another approach could be to consider the challenges specific to the context of each example and devising different criteria to evaluate. There may even be an offer of further solutions or improvements that can be made for the future. Possible links to other topics include climate change and essential needs of the poor (3.1), development and role of the state (2.1). Paraphrase: Have the strategies responded adequately to demographic and social change? How adequate are they? Levels marked using H2 generic level descriptors for 20m SEQ sub-part (b).

NYJC Preliminary Examination 2018 Paper 2 Mark Scheme 1. (a) With reference to Resources 1 and 2, suggest a suitable hypothesis for the
group’s investigation. [1] • landuse changes has led to a heightening of flood risk and a reduction to the
liveability of the area. • an area with a higher proportion of vegetation cover is less prone to flooding than
one with a lower proportion. Point marked (b) What safety precautions should the team take when conducting the stream
investigation? [5] • do a visual check if there are dangerous animals in the river or along the river
banks e.g. crocodiles, monitor lizards etc. • determine the best section for making wading measurements by noting the
potential risk such as slippery rocks, deep segments, pot holes, quick sand etc. • always probe the stream bed ahead with a rod when moving from bank to bank.
Keep your feet spread apart and alignment of legs parallel to the flow for better stability.
• wear a safety jacket when wading and conducting discharge measurements. Tie the tagline securely so that you may pull yourself out, if necessary.
• always follow safety precautions when entering the stream. If the water is too deep or swift, select another site. Never venture out into the stream alone without another person available to assist you in case of emergency.
• determine whether the river stage is rising or falling. Beware of rapid rises in river stage when wading and anticipate and allow for changes in flow conditions at the end of the measurement. It is a good idea to select an object (rock, stump, mark along bank, etc.) that is just above water surface and keep watching it to determine if the river stage is rising or falling.
• find out if there are dams at the upper reaches of the stream. Notify dam, reservoir or gate operators before entering stream.
Point marked (c) Calculate the mean velocity of the channel in Resource 3 and sketch one line
graph to represent the cross-sectional velocity of the upstream segment of Stung Chrey Bak Stream. [4]
Award 1 mark for the mean velocity of the channel • Mean velocity of the channel – 1.6 m/s For the sketching of line graph, 1 mark awarded for each of the following: • Title

2
Higher 2 Geography / 9751 / 02
• Relative accuracy of the line graph • Appropriate labels for both axes
Line graph showing the cross-sectional velocity of the upstream
segment of Stung Chrey Bak Stream
Point marked
(d) The team concluded that some of the data collected may not have been completely reliable and/or accurate. What improvements can be made in the planning and data collection process for this stream investigation? [6]
Limitations: • data was done over two days in December during the dry season • only one measurement (at 10am for both days) were taken for each stream
segment • measuring tape was unweighted. In addition, there were some boulders on the
channel bed for the upper segment of the stream Improvements made to planning: • have a contingency plan to come back during the wet season in June/July and if
possible during the intermonsoonal months of March and September to do stream measurements so that an average could be obtained across one year (annual Q) apart from noting the peak and low flow periods. Alternatively, students can also look for secondary data to find out about the level of discharge during the wet season to reduce the risk of having to collect primary data as discharge levels will be higher.
Segments
Velocity (m/s)

3
Higher 2 Geography / 9751 / 02
• to obtain more than one measurement per day instead of just at 10am. Afternoon measurements may record a different reading owing to greater surface evaporation or usage by farmers to irrigate their fields.
Improvements made to the data collection process: • in improving the measurement of the wetted perimeter, it will be better to use a
thicker rope so that it is more visible from the water surface and being heavier, it can sink to the bottom of the channel bed so that it hugs the channel bed for a more accurate measurement.
• as there are irregularities in the river bed on the upper segment, it will be good to make multiple measurements of the same site or to move to another site just slightly further upstream or downstream to obtain a more accurate measurement of the cross-section.
Level marked
Level Marks Descriptors 3 5 – 6 Response shows accurate knowledge in articulating the
limitations of the data collected and is able to provide a comprehensive list of suggestions towards how it can be improved during the planning and data collection stages. Response uses resource accurately. Response is clearly focused on the question throughout with a detailed explanation of the reasons.
2 3 – 4 Response shows adequate knowledge in articulating the limitations of the data collected and is able to provide some suggestions towards how it can be improved during the planning and data collection stages. Use of resource may be limited or lack accuracy at times. Response may lack detail and depth or lack a clear focus on the question.
1 1 – 2 Response shows limited knowledge in articulating the limitations of the data collected and is only able to provide limited appropriate suggestions towards how it can be improved during the planning and data collection stages. Little or no use of the resource. Use of resource where present will lack accuracy. Response lacks details and focus on the question.
0 0 No creditworthy response
(e) Evaluate the usefulness of the river velocity data shown in Resource 3 in
ascertaining the flood risk of Stung Chrey Bak Stream. [9] Indicative Content: Usefulness points could include the fact that the data gives some idea of river response to rainfall event. In general, higher velocity due to an increase in Q would increase the risk of flooding (direct relationship). Discharge level can be obtained by multiplying the mean channel velocity and cross-sectional area data obtained during the fieldwork.

4
Higher 2 Geography / 9751 / 02
However, as the measurements were taken during the dry season, it does not give a full picture of how high discharge can reach during the wet summer monsoons in June/July. In addition, one should refer to other information that would be useful in ascertaining flood risk. These could include the following: • climatic characteristics – precipitation amounts and type will determine input into
the channel. Seasonality in climate such as that of Am or Aw may result in seasonal flooding i.e. flood risk increases during the wet monsoons (summer) with the convergence of trade winds at the ITCZ
• drainage basin characteristics – size, geology (degree of permeability determines the generation of quick flow which in return increases flood risk), topography, vegetation cover, drainage density and bifurcation ratio. Determines peak Q and lag time.
• obtain secondary records such as the annual pattern of discharge levels. Enables the calculation of recurrence interval in order to predict flood frequency and magnitude. Floods with greater frequency will register a shorter RI. Greater care should be paid to floods with longer R.I as they may be low in frequency but when it happens, the magnitude is going to be devastating.
• human disturbances within the drainage basin. Altered basins tend to lead to higher peak Q and a shorter lag time. Examples include channel modifications, deforestation, mining, agricultural practices, animal husbandry
A higher response will present evaluation of usefulness of resource and of knowledge of river velocity measurements. Response could also recognise that there are limitations related to the methods involved in the collection of velocity data. The improvised method is definitely less accurate as compared to mechanical methods such as a proper gauging station equipped with a mechanised flow metre. Levels marked using H2 generic level descriptors for 9m open-ended DRQ for Theme 4.

5
Higher 2 Geography / 9751 / 02
Theme 1: Tropical Environments Mass movement hazards in Tropical Africa
2. Resource 4 and 5 show mass movement hazards in Sierra Leone and Egypt in
Africa. Resource 6 shows the locations and climographs of Sierra Leone and Egypt.
(a) Identify the type of mass movement hazards as shown in Resources 4 and 5. [2] • Resource 4 – landslide • Resource 5 - rockfall Point marked (b) With reference to Resources 4 and 5 compare the physical effects of the mass
movement hazards. [3] • Similarity – large amount of debris brought downslope • Differences – nature and size and materials brought downslope Resource 4 – fine clayey materials that have been chemically altered (reddish
regolith) Resource 5 – large, angular boulders (only a difference in shape and size)
Point marked

6
Higher 2 Geography / 9751 / 02
(c) Suggest possible causes that could have led to the mass movement hazards in Resources 4 and 5. [5]
• MM occurs when safety factor has been breached. It is the ratio between:
shear strength Fs =
• when the safety factor is less than 1 (that is, Shear Strength < Shear Stress),
slope failure is imminent. For Resources 4 and 5, slope failure are a result of both physical and human factors.
• Physical causes: Resource 4 – steep slopes, large trees that increase shear stress on the
slope, weathered materials that have lost its cohesive strength as compared to parent rock
Resource 5 – presence of joints and bedding planes as seen in the photo help facilitate physical weathering like block disintegration or even translational slides
• Human causes: Resource 4 – undermining of toe support at the foot of the slope due to the
construction of houses (evidence of houses at the mid-ground of the photo) Resource 5 – weight of buildings on top of the cliff increases shear stress
Level marked
Level Marks Descriptors 3 5 Response demonstrates accurate knowledge of the causes
of mass movements in relation to the two resources vis-à-vis the safety factor. Well balanced answer with the inclusion of both physical and human causes. Good use of the resource with supporting data used to back up response.
2 3 – 4 Response demonstrates adequate knowledge of the causes of mass movements in relation to the two resources without making reference to the safety factor. Answer may only relate to either physical or human causes. Use of resource present in response but may lack accuracy. Response may lack clarity, detail and relevance to question.
1 1 – 2 Response demonstrates some inaccuracy in knowledge of the causes of mass movements in relation to the two resources without making reference to the safety factor. Response lacks detail, clarity and focus on the question.
0 0 No creditworthy response
(d) With reference to Resource 6, account for the rainfall pattern for Sierra Leone
and Egypt. [7]
• Sierra Leone
shear stress
7
Higher 2 Geography / 9751 / 02
Tropical monsoon climate – caused by the migration of the overhead sun due to the short term factor of seasonal changes as well as land and sea differences that drive the local pressure gradient. Summer max. occurs during the period of high sun resulting in onshore winds. Winter minimum when ITCZ shifts to the southern hemisphere causing winds to blow offshore and hence no or little rain. Relate to the concept of secondary pressure cells.
• Egypt Arid climate – caused by the sub-tropical high pressure systems at 300N/S
where cool dry air is forced to descent after moisture has been removed at the equator. Relate to the concept of primary pressure cells i.e. falling arm of the Hadley cell.
Level mark
Level Marks Descriptors 3 6-7 Response demonstrates accurate knowledge as well as
clearly identifying and accounting for the differences in rainfall pattern between Sierra Leone and Egypt. Response uses resource accurately to account for the rainfall pattern between the two locations. Response is clearly focused on the question throughout with a detailed account of the differences between the two stations.
2 3 – 5 Response shows adequate knowledge and identifies the differences and attempts to account for them. Response use resource to account for the differences in precipitation but may not have accounted for the whole year’s rainfall i.e. only selected time periods. Response may lack detail and depth or lack a clear focus on the question.
1 1 – 2 Response is able to identify the difference in rainfall pattern but shows limited knowledge in accounting for it. Response lacks detail, clarity and focus on the question.
0 0 No creditworthy response
(e) Using Resource 6, explain the role of climate in influencing the type of mass movement as shown in Resources 4 and 5. [8]
• climate which is the average weather conditions over 30 years affect
geomorphological processes (weathering, mass movements and erosion) on a regional scale
• role of climate in influencing landslides in Sierra Leone from Resource 6, Sierra Leone has a high mean annual rainfall of over
3000mm with bulk of it concentrated over a period of 8 months from Apr to November
presence of a high amount of rainfall promotes deep CW for most parts of the year breaks down parent rock to become regolith (Resource 4) decrease shear strength as its unconsolidated nature makes regolith prone to downslope movement. The extra weight of a deep regolith will increase the likelihood of instability.

8
Higher 2 Geography / 9751 / 02
high amount of rainfall promotes luxuriant vegetation in the form of tropical monsoon forest tall and big trees (Resource 4) adds weight to the slope increase shear stress. Vegetation is able to prevent small scale MM but not for large scale ones like landslide
slope is vulnerable to failure during the wet season (Resource 6) twin effects: rain acts as a source of lubricant on the slope in allowing particles to move over one another; rain also increases pore water pressure which in turn decreases the frictional strength of the solid material hence weakening the slope.
• Role of climate in influencing rockslides in Egypt from Resource 6, Egypt is an arid region with mean rainfall of only 183mm per
annum. low amount of ppt encourages PW all year round via insolation-induced
weathering. As seen in Resource 5, the presence of joints allows block disintegration to occur due to repeated cycles of daytime heating and nocturnal cooling. This weakens the rock; causing blocks to become detached from the parent material. These blocks may fall from the cliff face via the process of rockfall or they may be detached from the parent material via rockslides along defined planes. In Resource 5, the bedding planes separating sedimentary layers can act to cause translational slides especially if the beds are dipping.
though CW may be limited by the little amount of moisture, selective CW along the lines of weaknesses may widen the joints and further weaken the rock; allowing rockslides to occur when safety factor is breached.
Level marked
Level Marks Descriptors
3 7 - 8 Response demonstrates accurate knowledge of the role of climate in influencing the type of mass movements in the two resources. Good and accurate use of resource in highlighting how climate determines weathering types on a regional scale in relation to the amount of insolation and precipitation received in the two localities. Response is clear, detailed and show focus on the question.
2 4 – 6 Response demonstrates knowledge of the role of climate in influencing the type of mass movements in the two resources. Explanation of the role of climate in determining weathering types on a regional scale in relation to the amount of insolation and precipitation received in the two localities may lack accuracy or detail in parts. Response is mostly clear but may lack focus on the question at times.
1 1 – 3 Response demonstrates some knowledge of the role of climate in influencing mass movements in general. Limited reference is made to the resource in explaining the type of mass movement. Response lacks details, clarity and focus on the question.
0 0 No creditworthy response

9
Higher 2 Geography / 9751 / 02
Theme 2: Development, Economy and Environment Development Gap in Asia
3. Resource 7 shows employment structures and economic development of
selected countries. Resource 8 shows the comparison between Internet penetration and mobile penetration of selected Asian countries and Australia. Resource 9 shows the internet user profile for Southeast Asian countries in 2013.
(a) With reference to Resource 7, describe the employment structures for both the
richer and poorer countries. [4] • richer countries have higher employment in the secondary (manufacturing) and
tertiary sectors. For USA, its tertiary sector accounts for close to 80%. These countries tend to have a small or insignificant primary sector.
• in contrast, poorer countries have a higher percentage of people engaged in the primary sector especially for countries such as Ethiopia, Kenya, Sierra Leone, Bangladesh, China and India with more than 50% of its people engaged in this sector.
• however, as compared to the richer nations, the poorer countries are more diverse in terms of their economic structures. Countries like Mexico, Peru, Brazil, Egypt and Malaysia have close to 50% or more of their people employed in the tertiary sector. Primary sector employs only 25% or less of their population.
Point marked (b) Name the mapping technique used in Resource 7 and state one strength and
one limitation in representing the employment structures of the richer and poorer countries. [3]
Point marked • pie charts • strength - allows for quick comparison between different countries i.e. it
represents data visually as a fractional part of a whole. Reference is made easier due to colour coding between sectors.
• limitation - does not show the total (absolute) or accurate figures. Size of the circles is similar for all the countries represented.
(c) With reference to Resource 8, compare the internet penetration and mobile
penetration of Asian countries. [5] • comparison between internet penetration and mobile penetration in general (2
marks) higher mobile penetration than internet penetration. 6 countries register more
than 100% penetration for mobile services as compared to none achieving 100 penetrations for internet services.
• comparison between the Asian countries for both internet penetration and mobile
penetration (3 marks)

10
Higher 2 Geography / 9751 / 02
higher internet penetration and mobile penetration for Developed and Newly Industrialising countries as compared to less developed countries. Countries like Japan and the 4 Asian tigers (Singapore, S Korea, Hong Kong and Taiwan) have more than 70% internet penetration and more than 90% mobile penetration.
South Korea tops the list for internet penetration (80%) whilst Singapore and Hong Kong are joint-top for mobile penetration (150%).
India remains the country with the lowest internet penetration (8%) and mobile penetration (50%)
Level marked
Level Marks Descriptors 3 5 Comparison of the internet penetration and mobile
penetration of Asian countries is made. Good use of the resource with supporting data used to back up response. Response is clear and shows focused and detailed comparison.
2 3 – 4 Comparison of the internet penetration and mobile penetration of Asian countries is made. Use of resource present in response but may lack accuracy. Response may lack clarity, detail and relevance to question.
1 1 – 2 Comparison is limited with only one or two relevant trends mentioned. A large part of the response remains descriptive. Response lacks detail, clarity and focus on the question.
0 0 No creditworthy response (d) Using Resources 7 and 8 and your own knowledge, explain the possible
existence of a development gap amongst Asian countries. [6]
• definition of development gap – the gulf between rich and poor nations when measured using various economic yardsticks such as GDP/GNP per capita, energy consumption etc. As a broader definition, it could also include social (literacy, life expectancy, housing, gender etc.) environmental (sustainable development, waste management, pollution levels) and even political gap (voting rights)
From Resource 7 (economic development gap) • as seen in Resource 7, countries with a larger tertiary and secondary sector tend
to be economically better off than those with a larger primary sector owing to the higher value-added index tied to them.
• in Resource 7, Japan is the only Asian country amongst the richer nations with more than 95% of its people employed in tertiary and secondary sectors. Tertiary sector jobs may include low end services such as consumer related ones as well as higher end ones such as quaternary services such as legal, financial, marketing and advertising. At the apex, this will include the quinary sector comprising of top decision makers known as gold collared workers egs. CEOs,

11
Higher 2 Geography / 9751 / 02
CFOs, COOs Managing directors etc. Secondary sector in Japan will likely be those involved in high tech manufacturing, precision engineering, robotics etc.
• amongst the poorer nations, a development gap could also be present. Of the 4 Asian countries, Malaysia appears better off than the other 3 (China, India and Bangladesh) as 80% of its people are engaged in tertiary or secondary with more in the former.
• China, India and Bangladesh all have more than 50% of their people employed in the primary sector. Income derived from the agricultural sector tends to be unstable unlike manufacturing and services as agricultural produce, being perishable are affected by the vagaries of the weather. They are hence subjected to greater price fluctuations.
From Resource 8 (social development gap) • Japan and the NIEs are ahead of the other Asian nations as they have a higher
internet penetration and mobile penetration. These two services may be regarded as a proxy indicator to literacy rate amongst the countries. Internet penetration and mobile penetration (those that comes with data plan) require basic computer literacy in assessing the World Wide Web. They are also regarded as economic indicators as subscribers are charged a fee for the use of these services. Large parts of rural India and Indonesia may not have the financial means and computer skills to access the internet as compared to the more highly educated NIEs.
• China appears to be an anomaly. It has the same proportion of people engaged in the primary sector as India and with a slightly lower proportion in the tertiary sector. Yet, its internet penetration more than doubles that of India. This perhaps could be due to the Chinese being more savvy and open to using technology than the Indians. Role of the state in promoting its use could also be included such as the wide spread use of e-commerce and cashless mobile payment e.g. Alipay, Unionpay, Tencent finance etc in China.
Level marked
Level Marks Descriptors 3 5 - 6 Response demonstrates accurate knowledge of the concept
of development gap in the context of structure of the economy. Good and accurate use of resources to highlight the economic and social gap between richer and poorer Asian countries. Ability to link the structure of a country’s economy to the income level of countries. Response is clear, detailed and shows focus on the question.
2 3 – 4 Response demonstrates knowledge of the concept of development gap in the context of structure of the economy. Some use of resources to highlight the economic and social gap between richer and poorer Asian countries but may lack accuracy or relevance to context. Response is mostly clear and shows some supporting detail and focus on the question.
1 1 – 2 Response demonstrates some knowledge of the concept of development gap. Limited use of resources to explain the relationship between the structure of the economy and the existence of the development gap amongst Asian nations.

12
Higher 2 Geography / 9751 / 02
Response lacks detail, clarity and focus on the question. 0 0 No creditworthy response
(e) With reference to Resources 8 and 9, explain the socio-economic opportunities
and challenges which developing countries like Vietnam may experience with the growth of internet penetration. [7]
• Resource 8 shows Vietnam has an internet penetration of 28% which is ahead of
other developing countries such as Thailand, The Philippines, Indonesia and India.
• Resource 9 shows Vietnam having a very young online population with 74% below 35 years of age. In terms of average time spent online, it came in second to Thailand at 26.2 hours in March 2013.
• Resources 8 and 9 appear favourable to Vietnam in terms of socio-economic opportunities brought about by her growth in internet penetration and a youthful internet savvy population.
• possible socio-economic opportunities growth of the tertiary sector – e-commerce, online learning, web-page
designers, online dating services etc. outsourcing of services from TNCs – back-office functions and call centres
(liken India and The Philippines) sectoral shift from manufacturing to tertiary – increase in value-adding for the
economy and allowing the country to move towards a knowledge based economy
improved overall welfare i.e. increase in purchasing power due to higher wages earned in the tertiary sector
exposure to cultural diversity – K pop, J pop, reality TV shows • possible socio-economic challenges widening of income gap between the educated and less educated who cannot
afford the mobile phone or do not have knowledge of using the internet exploitation of workers by TNCs – work conditions, wage depression over-dependence on TNCs – footloose nature of TNCs may cause them to
uproot and shift to other low cost locations if current host country loses its comparative advantage
states may have to cede power to the TNCs if they are unable to control them negative influencers of the internet such as internet addictions, online
gambling, internet scams, cyber-attack resulting in data breached Level marked
Level Marks Descriptors 3 6 - 7 Response identifies the growth of internet penetration in
Vietnam vis-à-vis its potential and challenges that accompany its development. Good and accurate use of the resources in supporting the arguments Response is detailed and shows focus on the question.
2 3 – 5 Response identifies the growth of internet penetration in

13
Higher 2 Geography / 9751 / 02
Vietnam but the explanation on the possible socio-economic opportunities and challenges that accompanies its development may not always be shown clearly. Response lacks detail, clarity and focus on the question.
1 1 – 2 Response identifies the growth of internet penetration in Vietnam but there is limited or no explanation on the possible socio-economic opportunities and challenges that accompanies its development. Response lacks detail and relevance to the question.
0 0 No creditworthy response
Theme 3: Sustainable Development
Waste Management in Asian Cities
4. Resource 10 shows the type of waste composition in Phnom Penh, Cambodia. Resource 11 is an infographic showing the plastic situation in Cambodia. Resource 12 shows a typical street scene in Phnom Penh. Resource 13 shows the typical characteristics of waste management in Asian cities by level of development. Resource 14 shows a news article about plastic bag fee implementation in Phnom Penh.
(a) Describe the composition of waste in Phnom Penh as shown in Resource 10. [2]
Possible responses • Waste in Phnom Penh is mostly composed of food wastes at 63.3%. • The second highest type of waste is plastic at 15.5%. • The rest of the waste types are less significant with paper 6.4%, metal 0.6% and
glass 1.2%. Point marked (b) With reference to Resource 11, account for the percentage of plastic waste
in Phnom Penh as shown in Resource 10. [5]
Indicative content • According to Resource 11, the price of plastic is very cheap. 500 pieces of
plastic bags, weighing 1kg, only cost 5,000 riels, which is approximately S$1.68. Plastic is such an amazingly cheap, light, flexible, durable and convenient material that is being used widely in packaging such as bags, bottles, straws, cups, containers etc. The extremely low price contributed to overconsumption. Most of the time, plastic packaging is also contaminated with food waste and are unlikely to be recycled or even reuse. This contributes to the high amount of plastic waste.
• In Phnom Penh, each person consumes a staggering number of 2,000 plastic bags annually. This is about 10 times higher than those from the European Union who consumes only 200 plastic bags annually. The rampant usage of

14
Higher 2 Geography / 9751 / 02
single-use plastic contributed to the high percentage of plastic waste in Phnom Penh.
• Resource 11 shows that the projected increase to 7 million tourists in 2020 can potentially lead to more plastic pollution in the future. This is because tourists who visit Cambodia have a high tendency to generate plastic waste as well. Due to the lack of a filtration system, potable water is not readily available. As such, tourists who visit Cambodia will purchase bottled water for drinking and they are often single-use plastic water bottles. It is unlikely to find potable water source to refill so the bottles are not reused and tossed away as trash.
Levels marked Level Marks Descriptors
3 5 Response shows accurate knowledge as well as clearly identifying and accounting for the percentage of plastic waste. Good use made of the resource with supporting data used to substantiate response. Response is detailed and shows focus on the question.
2 3-4 Response shows adequate knowledge and identifies the percentage of plastic waste and attempts to account for it. Use of the resource present in response but may lack accuracy. Response may lack detail and depth or lack a clear focus on the question.
1 1-2 Response shows limited knowledge and makes a limited attempt to account for the percentage of plastic waste. Little or no use of the resource to account for the plastic waste shown. Use of resource where present will lack accuracy. Response lacks detail and focus on the question.
0 0 No creditworthy response.
(c) With reference to Resource 12, explain how waste affects the liveability of
Phnom Penh. [4]
Possible responses • Waste has become part of the lives of the poor communities. • Piles of uncollected waste dumped on streets of the capital city as shown in
Resource 12 is unsightly and gives a negative image of the country. • It reflects poorly on the management ability of the government. Lack confidence
in the ability of the government to solve the waste problem. • The presence of rotting food waste dumped behind a mobile food cart suggests
poor hygiene standards, making food safety a health concern for anyone. • Waste is not biodegradable, which means it stays around for thousands of years
and slowly leaks harmful chemical substances into the surrounding environment. • Rotting food gives off a pungent smell. Point marked (d) With reference to Resource 13, compare the solid waste management
characteristics among Asian cities by level of development. [5]

15
Higher 2 Geography / 9751 / 02
Indicative content • Waste generation (kg/capita-day) is highest in developed Asian cities at more
than 1kg/capita-day. Rapidly developing Asian cities generate between 0.5 to 1.5kg/capita-day of waste. The less developed Asian cities generate 0.3 – 0.7 kg/capita-day of waste, the lowest among the three.
• Waste collection rate is also the lowest for less developed Asian cities at less than 70%. Rapidly developing cities have a moderately high percentage of 80-95%, while developed Asian cities have close to 100% collection rate.
• Recycling is formal in developed cities and informal in less developed Asian cities. Rapidly developing Asian cities can conduct both formal and informal recycling.
• Waste expenditure from municipal budget takes between 15 to 40% in less developed Asian cities due to their lower GDP. Comparatively, developed cities only need to devote 1-5% of their municipal budget for waste. The percentage expenditure for rapidly developing cities has a moderate range from 5 to 25%.
Levels marked Level Marks Descriptors
3 5 Response demonstrates accurate knowledge and a good understanding of the waste characteristics among Asian cities. Comparisons of waste characteristics are made between the three categories of Asian cities by level of development. Good use of the resource with supporting data used to back up response. Response is clear and shows focussed and detailed comparison.
2 3-4 Comparisons of waste characteristics among Asian cities seen in response. Some inaccuracies of knowledge and understanding in terms of the waste characteristics. Use of resource present in response but may lack accuracy. Response may lack clarity, detail and relevance to question.
1 1-2 Response shows an attempt at a comparison among Asian cities but with little accurate knowledge shown or use of the resource. Comparison is limited with only one or two relevant waste characteristics. Response lacks detail, clarity and focus on the question.
0 0 No creditworthy response.
(e) Using all resources and your own knowledge, assess the challenges faced
in managing plastic bag consumption in less developed cities. [9]
Indicative content Challenges faced could include low prices of plastic bags, overconsumption by individuals, and consumption by tourists, rampant use, habit and attitudes, waste management expenditure, waste collection system, recycling facilities, public education, enforcement etc. The extent of the difficulty should be presented. A higher level response will identify the traits and characteristics in less developed cities and make explicit links to how these traits contribute to the challenges faced in

16
Higher 2 Geography / 9751 / 02
managing plastic bag consumption. Candidates should give their viewpoint upon considering all the resources. Levels marked using H2 generic level descriptors for open-ended 9m DRQ on Themes 1, 2 and 3.

PIONEER JUNIOR COLLEGE JC2 Preliminary Examination Higher 2
GEOGRAPHY 9751/01
Paper 1 Structured Essay Questions 14 September 2018
3 hours
Additional Materials: Answer Paper World outline map
READ THESE INSTRUCTIONS FIRST Write your Name, Class and Index Number on the work you hand in. Write in dark blue or black pen on both sides of the paper. You may use an HB pencil for any diagrams or graphs. Do no use staples, paper clips, glue or correction fluid. Answer three questions. One from each section. The Insert contains all the Resources referred to the questions. You should make reference to appropriate examples studied in the field or the classroom, even where such examples are not specifically requested by the question. Diagram and sketch maps should be drawn whenever they serve to illustrate an answer. The world outline map may be annotated and handed in with relevant answers. You are reminded of the need for good English and clear presentation in your answers. At the end of the examination, fasten all your work securely together. The number of marks is given in brackets [ ] at the end of each question or part question.
This document consists of 2 printed pages.

2
Section A – Tropical Environments Answer one question from this section.
1 (a) Explain how and why the flows in a drainage basin differ in tropical rainforest
(Af) and sub-tropical steppe (BSh) climates.
[12]
(b)
To what extent do you agree that sediment regime is the dominant factor in influencing channel patterns?
[20]
2 (a) Explain the role of climate in causing mass movements in the tropics. [12] (b) ‘The issue of deforestation can only be resolved with international action.’ To
what extent do you agree with this statement?
[20]
Section B – Development, Economy and Environment Answer one question from this section.
3 (a) With reference to countries at low levels of development, explain bottom-up
approach to development. [12]
(b) ‘The New International Division of Labour (NIDL) is primarily driven by the
quest for low cost labour.’ To what extent do you agree with this statement? [20]
4 (a) Explain David Harvey’s perspective on the relationship between population
and resources. [12]
(b) Discuss the reasons for the underperformance of resource-rich countries. [20]
Section C – Sustainable Development Answer one question from this section.
5 (a) Explain the political challenges in attaining sustainable development in
countries at low levels of development. [12]
(b) ‘Hydropower is the most sustainable alternative energy source.’ To what
extent do you agree with this statement? [20]
6 (a) Explain the concept of ecological footprint with reference to cities at high
levels of development. [12]
(b) ‘The key to managing waste in cities sustainably is to reduce waste
generation.’ To what extent do you agree with this view? [20]
______________________________________________________________________________________
END OF PAPER

PIONEER JUNIOR COLLEGE
JC2 Preliminary Examination
Higher 2
GEOGRAPHY 9751/02
INSERT 19 September 2018 READ THESE INSTRUCTIONS FIRST This Insert contains all the Resources referred to in the questions.
This document consists of 11 printed pages.

2
Resource 1 for Question 1
Site A and Site B on the map of Coney Island
Resource 2 for Question 1
Site A
Site B
Site A

3
Site B
Resource 3 for Question 1
Data collected to calculate the infiltration rate of Sites A and B
Site A Site B
Fall Unit (cm) Grass Patch Sandy n minimum vegetation cover
1 1:20 min = 80 sec 20.05 sec
2 3:53 min = 233 sec 27.36 sec
3 5:23 min = 323 sec 39.75 sec
4 13:19 min = 799 sec 40.18 sec
5 16:02 min = 962 sec 42.58 sec

4
Resource 4 for Question 2
Monsoon winds (arrows), ITCZ over Africa during January and July and number of days per month with measurable rainfall
Resource 5 for Question 2
Location of Sites X, Y and climatic zones in Africa

5
Resource 6 for Question 2
Climographs for Sites X and Y
Site X (16.72°N, 3.00°W)
Total Annual Rainfall : 202.5mm
Annual Average Temperature: 27.8°C
Elevation: 263m
Site Y (0.52°N, 25.10°E)
Total Annual Rainfall : 1841.0mm
Annual Average Temperature: 24.5°C
Elevation: 415m

6
Resource 7 for Question 2
Soil profile taken at Site X
Soil profile taken at Site Y
30 metres
80 centimetres

7
Resource 8 for Question 3
Global Network of Samsung Electronics
Resource 9 for Question 3
Share of smartphone shipments to China

8
Resource 10 for Question 3
Flows in cobalt processing
* Cobalt is used as a key component in smartphone batteries.

9
Resource 11 for Question 3
Cobalt mining in Democratic Republic of Congo
Resource 12 for Question 4
Liveability ranking of cities in 2015
Rank Monocle Quality of Life Survey 2015 EIU Liveability Ranking 2015
1 Tokyo, Japan Melbourne, Australia
2 Berlin, Germany Vienna, Austria
3 Vienna, Austria Vancouver, Canada
4 Copenhagen, Denmark Toronto, Canada
5 Munich, Germany Adelaide, Australia
6 Melbourne, Australia Calgary, Canada
7 Fukuoka, Japan Sydney, Australia
8 Sydney, Australia Perth, Australia

10
Resource 13 for Question 4
Liveability indicators in selected Australian cities

11
Resource 14 for Question 4
Changes in Housing prices in Melbourne between 2012 to 2017
___________________________________________________________________ END OF INSERT
Less than
$200K
$200K to
$300K
$300K to
$400K
$400K to
$500K
$500K to
$600K
$600K to
$700K
$700K to
$800K
$800K to
$900K
$900K to $1 m
> $1m

PIONEER JUNIOR COLLEGE
JC2 Preliminary Examination
Higher 2
GEOGRAPHY 9751/02
Paper 2 Data Response Questions 19 September 2018
3 hours Additional Materials: Answer Paper
1 Insert World outline map
READ THESE INSTRUCTIONS FIRST Write your Name, Class and Index Number on the work you hand in. Write in dark blue or black pen on both sides of the paper. You may use an HB pencil for any diagrams or graphs. Do no use staples, paper clips, glue or correction fluid. Answer ALL questions. The Insert contains all the Resources referred to in the questions. You should make reference to appropriate examples studied in the field or the classroom, even where such examples are not specifically requested by the question. Diagram and sketch maps should be drawn whenever they serve to illustrate an answer. The world outline map may be annotated and handed in with relevant answers. You are reminded of the need for good English and clear presentation in your answers. At the end of the examination, fasten all your work securely together. The number of marks is given in brackets [ ] at the end of each question or part question.
This document consists of 4 printed pages.

2
Section A
Theme 4: Geographical Investigation
1 A group of 8 students were tasked to undertake a primary fieldwork on investigating infiltration on different landuse. The group selected a study area in Coney Island with possible sites of varying landuse. The group was divided up into two teams of four to measure the infiltration rates at two different sites. One site (Site A) was a site covered with grass. The other site (Site B) was located on a beach with sandy soil. Both teams carried out the primary investigation at Sites A and B in the study area in Resource 1 on 3 September 2018 (Monday). Teams were each given the following equipment to gather primary data on infiltration rates:
• Milo Tin (as infiltration tube) • Ruler • Stop watch • Water
The infiltration rate was calculated by finding out the time it took for water level in the cylinder to fall by 1cm. The time took for the water level to drop by 1cm was defined using a ruler and personal observation. The data collected was recorded using a data collection sheet. Resource 1 shows the map of both Sites A and B. Resource 2 shows the land use associated with each site. Resource 3 shows the data collected by one of the teams to calculate the infiltration rates associated with each site.
(a) With reference to Resource 2, suggest a suitable hypothesis and provide two reasons
why it is at a suitable scale. [3]
(b) Explain how both teams can minimise the risks in carrying out their primary investigation
at Sites A and B as shown in Resource 2. [4]
(c) With reference to Resources 1 and 2, explain how the students might have carried out
their primary fieldwork on investigating infiltration on different landuse. [8]
(d) Suggest two other pieces of information that may be useful in understanding infiltration
rates at both sites. [5]
(e) The group concluded that data collected as shown in Resource 3 may not be completely
reliable and/or accurate. Explain how the process of data collection can be improved.
[5]

3
Section B
Theme 1: Tropical Environments
Climatic conditions and anomalies in Africa
2 Resource 4 shows monsoon winds and ITCZ over Africa in January and July and number of days per month with measurable rainfall. Resource 5 shows climatic zones in Africa and location of Sites X and Y. Resource 6 shows the climographs for Sites X and Y. Resource 7 shows soil profiles taken at Sites X and Y.
(a) With reference to Resource 4, describe the patterns of measurable rainfall in January and
July. [4]
(b) With reference to Resource 4, account for the patterns of measurable rainfall in January
and July. [5]
(c) Describe the rainfall patterns of Sites X and Y as seen in Resource 6. [3] (d) Compare the soil profiles for Sites X and Y as seen in Resource 7. [4] (e) With reference to Resources 5, 6 and 7 and your own knowledge, evaluate the extent to
which climate can account for the development of soil profiles as shown in Resource 7. [9]
Theme 2: Development, Economy and Environment
Samsung’s Global Production Networks (GPNs)
3 Samsung is a TNC which operates globally via its extensive production networks. Resource 8 shows the global network of Samsung Electronics. Resource 9 shows changes in share of smartphone shipments in China between 2013 to 2014. Resource 10 shows the flows in cobalt processing, which is a key component of GPNs of smartphone manufacturers like Samsung. Resource 11 depicts cobalt mining in the Democratic Republic of Congo (DRC) which supplies more than half of the world’s demand for cobalt.
(a) Describe the trends in location of Samsung’s global production bases as shown in
Resource 8. [3]
(b) Explain the implications of keeping production ‘in-house’ as depicted in Resource 8. [5] (c) Suggest reasons for Samsung’s changing market share in China as shown in Resource 9. [5] (d) With reference to Resource 10, describe the GPNs of batteries for smartphone companies. [3] (e) With reference to Resources 10 and 11 and your own knowledge, discuss the impacts of
GPNs on developing countries like the DRC. [9]

4
Theme 3: Sustainable Development
Liveability in Australia
4 Australian cities are often ranked highly in liveability indicators. Resource 12 shows ranking of cities
in 2 different liveability measures. Resource 13 depicts affordability, quality of life and living costs in selected Australian cities based on an Australian investment firm. Resource 14 depicts changes in housing prices in Melbourne over a 5 year period between June 2012 and June 2017.
(a) With reference to Resource 12, compare the ranking of cities across the 2 different
measures. [3]
(b) Suggest possible reasons for the variations in ranking depicted in Resource 12. [5] (c) With reference to Resource 13, suggest why there is a difference in liveability ranking
between Adelaide and Darwin. [6]
(d) With reference to Resource 14, describe the changes in housing prices in Melbourne. [4] (e) With reference to Resources 13 and 14 and your own knowledge, explain why not all
residents in Melbourne may enjoy a high quality of urban living. [7]
___________________________________________________________________
END OF PAPER

2018 Preliminary Exams
H2 Geography Paper 1 Marking Guide All essays to be marked according to these generic level descriptors:

2
Section A – Tropical Environments Answer one question from this section.
1 (a) Explain how and why the flows in a drainage basin differ in tropical
rainforest (Af) and sub-tropical steppe (BSh) climates. Indicative content: • Candidates to show understanding in the differences in characteristics of the
various flows and stores in Af and BSh as their rainfall and temperature patterns differ. Factors such as soil, geology and vegetation can also be discussed.
• Higher level responses will acknowledge the temporal aspect of how the flows change in the year and able to use the water balance equation to illustrate how flows can vary.
Levels marked using H2 generic level descriptors for 12m SEQ sub-part (a)
[12]
(b)
To what extent do you agree that sediment regime is the dominant factor in influencing channel patterns? Indicative content: • Candidates to make the links that sediment regime (load size and volume)
can influence the channel patterns, braided and meandering along the river’s long profile
• There is a need to consider other factors (external and internal) such as climate, vegetation cover, channel discharge, which can influence channel pattern, i.e. at the different formation stages.
• Higher level responses should apply a set of clear criteria to assess the factors involved, e.g. scale, temporal, in the different contexts of how channel patterns are formed.
Levels marked using H2 generic level descriptors for 20m SEQ sub-part (b)
[20]
2 (a) Explain the role of climate in causing mass movements in the tropics.
Indicative content: • Candidates to show understanding of the different climatic characteristics in the
humid and dry topics accounting for different processes thus leading to different types of mass movement.
• Humid tropics would be dominated by chemical and biochemical weathering and dry tropics would be largely physical weathering
• Hence humid tropics would have mass movement that have higher water content, higher speed and failed landmass of smaller rock particles such as landslide, mudflow, slump, in contrast, dry tropics would have mass movement that have lower water content, higher speed (due to size of failed landmass) such as rockslide, rockfall and soil creep.
• Higher level responses will acknowledge the spatial variations in tropics and how it can influence mass movements.
[12]
Levels marked using H2 generic level descriptors for 12m SEQ sub-part (a)

3
(b) ‘The issue of deforestation can only be resolved with international
action.’ To what extent do you agree with this statement? Indicative content: • Candidates to show understanding of the various strategies to resolve
deforestation at the different levels: global, regional and local • There is a need to address international action as it is the given content in the
question and discuss the relevance and limitation of the strategy and evaluate its importance at the global platform
• Higher level responses should look at other strategies at varying scales to have an integrated approach to resolve deforestation.
Levels marked using H2 generic level descriptors for 20m SEQ sub-part (b)
[20]
Section B – Development, Economy and Environment Answer one question from this section.
3 (a) With reference to countries at low levels of development, explain
bottom-up approach to development. Indicative content:
[12]
• Bottom-up or 'grassroots' development is the opposite of a top-down approach in which government imposes development schemes on people.
• Its values include listening to local people to discover their needs and views, collaborating with local leaders and using existing community structures to facilitate action.
• Many bottom-up initiatives have a bespoke character and are not simply rolled out or transferred from another context.
• Many are small scale. The emphasis is usually on improving quality of life and/or standard of living for ordinary people.
• Bottom-up development is often the work of NGOs in collaboration with local government.
• A higher level response consists of a well-focused and carefully directed explanation of bottom-up approaches from more than one country at a low level of development. Responses should reveal insights of the character and nature of bottom-up development in countries at low level of development. In this context, the response should draw relationships between the strategies employed by the community and the outcomes achieved.
• E.g. to utilize WaterAid in Nepal, self-help housing in Cali, Columbia and improving sanitation in Orangi Project, Pakistan
Levels marked using H2 generic level descriptors for 12m SEQ sub-part (a)
(b) ‘The New International Division of Labour (NIDL) is primarily driven by the quest for low cost labour.’ To what extent do you agree with this statement? Indicative content:
• Responses should be able to discuss the importance of low cost labour as a driving force for NIDL. In addition, they need to critically evaluate
[20]

4
the role of other factors such as government incentives, lack of government regulations for labour and environment, cost of operations and access to suppliers/raw materials.
• A higher level response could make use of examples to illustrate the
interplay of the various factors that led to NIDL. lt could also include a discussion of the relative influence of specific factors in relation to the examples used. There is a recognition that NIDL of specific industries can vary based on decisions of firms.
• Possible links to other topics include 2.2 Extractive industries, 3.1 Sustainable development
Levels marked using H2 generic level descriptors for 20m SEQ sub-part (b)
4 (a) Explain David Harvey’s perspective on the relationship between
population and resources. [12]
Indicative content:
• The idea of spatial fix was derived by Harvey to reconstruct Marx’s theory of the geography of capitalist accumulation.
• This derived term was used by Harvey to describe capitalism’s insatiable drive to resolve its inner crisis tendencies by geographical expansion and geographical restructuring.
• For him, the reproduction and reconfiguration of space are central to the understanding of resource appraisal and the valuation of environment in capital accumulation
• Harvey aimed to show that a) capitalism could not survive without being geographically expansionary (and thus perpetually seeing out ‘spatial fixes’ for its problems: b) major innovation in transport and communication technologies were necessary conditions for that expansion to occur; c) the modes of geographical expansion depended on whether it was the search for markets, fresh labour powers, resources or fresh opportunities to invest in new production facilities that was at stake
• Through his aims above, Harvey asserts that there is a strong connection between the overaccumulation of capital (based on Marx’s 1st contradiction of capitalism) and how the ‘spatial fix’ gets pursued-impinging the valuation of resources and environment of societies today.
• Higher level responses can make reference to empirical examples to depict Harvey’s perspective (E.g. China pursuing spatial fix through investments in Africa) and relate to how this impinges on the relationship between population and resources
Levels marked using H2 generic level descriptors for 12m SEQ sub-part (a)
(b) Discuss the reasons for the underperformance of resource-rich countries.
[20]
Indicative content:
• Responses should include a discussion of factors which can explain the performance of resource-rich countries. Candidates should also consider the extent of usefulness of the 'resource-curse' thesis in explaining the

5
underperformance of resource rich countries. There should be the recognition of factors other than those accounted for by the thesis that are relevant to the examples used. Reasons are provided as to why certain factors are deemed more influential than others.
• A higher level response could be to assess the factors in relation to empirical data drawn from different resource-rich countries that are underperforming
• Possible links to other topics include reference to the management of
tropical deforestation (Topic 1.2), influence of TNCs (Topic 2.1), responses to climate change that limits resource exploitation (Topic 3.1).
Levels marked using H2 generic level descriptors for 20m SEQ sub-part (b)
Section C – Sustainable Development Answer one question from this section.
5 (a) Explain the political challenges in attaining sustainable development in
countries at low levels of development. Indicative content: • Candidates to explain the political challenges in attaining sustainable
development (SD) such as lack of global consensus on the concept of SD, inadequate participation and contribution in existing international legal instruments and agreements, lack of political commitment, shortcomings of policies.
• Higher responses will draw out the characteristics of countries at low levels of development and make the links to political challenges.
Levels marked using H2 generic level descriptors for 12m SEQ sub-part (a)
[12]
(b) ‘Hydropower is the most sustainable alternative energy source.’ To what
extent do you agree with this statement? [20]
Indicative content: • Responses should assess the risks and benefits of hydropower and at least
one other alternative energy source (i.e. nuclear energy), and come to a reasoned conclusion on which alternative energy source is the best.
• Higher level responses would apply a set of clear criteria to determine what makes a “best” alternative – e.g. extent of environmental impact, cost-effectiveness, input-output ratio, safety – and thus evaluate the truth of the given statement in current contexts.
Levels marked using H2 generic level descriptors for 20m SEQ sub-part (b)
6 (a) Explain the concept of ecological footprint with reference to cities at
high levels of development. Indicative content:
[12]
• Candidates should be able to explain the concept of ecological footprint which is a quantitative assessment of all the biophysical resources needed to support the consumption of particular groups of people, a country, or city, for example, in terms of the raw materials and energy used to extract, produce and transport manufactured

6
goods and for their disposal. It is typically expressed in terms of hectares of biologically productive area (of world average productivity) that are required to support that activity.
• Ecological footprint of cities show variations at different levels of development. London’s ecological footprint for instance is estimated to be 125 times its actual size and in Calgary, Canada estimated footprint is a high of 9.8 hectares. City-based consumers and industries based in wealthy nations have the capacity to draw resources from far beyond their immediate regions and have increasingly appropriated the carrying capacity of rural regions in other nations, with little apparent regard for the environmental impact of their actions.
• Therefore due to increased waste generation as well as resource consumption, cities in developed countries tend to have a larger ecological footprint.
• A higher level response could draw on examples of cities at high levels of development and analyse/weigh the causal factors behind these variations and include spatial variations
Levels marked using H2 generic level descriptors for 12m SEQ sub-part (a)
(b) ‘The key to managing waste in cities sustainably is to reduce waste generation.’ To what extent do you agree with this view?
[20]
Indicative content: • Candidates should be able to develop an argument related to the view
presented in the question and use BPs to support the argument rather than to evaluate strategies alone.
• Answers should draw on cities at different levels of development to analyse the effectiveness of strategies. Reference should be drawn to context of cities to depict why waste management is a central concern in achieving sustainability
• Link must be made to concepts of sustainability (Long term feasibility, achieving a balance between social, economic and environmental aspects etc)
• A higher level response would look at the spatial variations when managing waste sustainably and challenges faced as cities at different levels of development are likely to face differing issues/concerns.
______________________________________________________________________________________
END OF PAPER

JC2 H2 2018 Prelims Marking Guide Section A
Theme 4: Geographical Investigation
1 A group of 8 students were tasked to undertake a primary fieldwork on investigating infiltration on different landuse. The group selected a study area in Coney Island with possible sites of varying landuse. The group was divided up into two teams of four to measure the infiltration rates at two different sites. One site (Site A) was a site covered with grass. The other site (Site B) was located on a beach with sandy soil. Both teams carried out the primary investigation at Sites A and B in the study area in Resource 1 on 3 September 2018 (Monday). Teams were each given the following equipment to gather primary data on infiltration rates:
• Milo Tin (as infiltration tube) • Ruler • Stop watch • Water
The infiltration rate was calculated by finding out the time it took for water level in the cylinder to fall by 1cm. The time took for the water level to drop by 1cm was defined using a ruler and personal observation. The data collected was recorded using a data collection sheet. Resource 1 shows the map of both Sites A and B. Resource 2 shows the land use associated with each site. Resource 3 shows the data collected by one of the teams to calculate the infiltration rates associated with each site.
(a) With reference to Resource 2, suggest a suitable hypothesis and provide two reasons
why it is at a suitable scale. Award 1 mark for any testable and sensible related to type of landuse and the infiltration rate. Possible response include: • Hypothesis: Infiltration rate is lower at Site A, which is a vegetated area, compared
to that on Site B, which is a sandy beach. • It is at a suitable scale as it has a clearly defined research areas – the role of
landuse in affecting the infiltration rate • Sites of differing landuse – sandy beach and vegetated area • 2 sites which are of close proximity • Task is within the capability of the students Point Marked
[3]
(b) Explain how both teams can minimise the risks in carrying out their primary investigation
at Sites A and B as shown in Resource 2. Possible responses include: • Risk: General safety
[4]

2
o Do a reconnoitre trip to map out places of potential hazards and places that can give first aid (e.g. clinics) – also to identify a shelter area during the bad weather conditions
o Check weather forecast and to do data collection on another day if the event of bad weather.
o Ensure that there is first-aider and first aid kit for both teams o Wear proper footwear to protect from sharp objects o Wear hats or use umbrella when the weather is too hot and have proper hydration
• Risk: Water safety at Site B
o Check high tide and low tide time and be aware of the high tide mark on the beach at Site B
• Risk: Timing of primary data collection o Ensure that the data collection is done in the morning and avoid afternoon when it
could be too hot and possible problem of dehydration o Stop investigation before sunset as the late timing may lead to students reaching
home very late, issues of safety Award 2 marks for a strategy to minimize the risk identified.
(c) With reference to Resources 1 and 2, explain how the students might have carried out
their primary fieldwork on investigating infiltration on different landuse. Indicative Content:
o Developing a plan: o Data: establish the data needed to prove the hypothesis, e.g. primary data
(quantitative) of infiltration rates will have to be collected at each site o Timing: to conduct the investigation on one weekday afternoon o Data Collection: o Sampling method: random stratified sampling with the selection of two sites –
Site A, a vegetated area and Site B on a sandy beach o In the field:
o Mark the inside of the milo tin with a line for every 1 cm, up to 15cm. o At the respective sites, twist the milo tin (which is the infiltration tube) 10-
15cm into the soil o Place a ruler inside the milo tin to measure the fall in water level. o Pour water into the milo tin to a depth of 10 cm o As the water level decreases by every 1cm, take a recording of the time
elapsed. o Record the data in the recording sheet. o Repeat two times to get an average timing for each site.
o Consider research ethics: e.g. to obtain permission to conduct the investigation in coney island, consideration for the other park users; minimize noise disturbance, avoid littering, minimise the effects of trampling on the vegetated areas, fill up any voids caused by the investigation
o Consider limitations: e.g. the tools used, limitations of data collected, e.g. one area may not be conclusive to prove the relationship between landuse and infiltration rate
o Present and analyse data collected: establish a data representation method e.g. line graph to represent the infiltration rates. Compare the line graphs between the two sites. Interpret the data in relation to the hypothesis posed
[8]

3
Levels marked:
Level Marks Descriptors
3 6-7
Response demonstrates accurate knowledge of geographical investigation methods. Outlines a relevant and coherent plan with reference to data collection, methods, investigation limitations and risk mitigation strategies. Response is relevant to context of question throughout
2 3-5
Response demonstrates some knowledge of geographical investigation methods. Outlines a clear plan with some reference to data collection, methods, investigation limitations and risk mitigation strategies. Response is mostly relevant to context of question but may lack clarity and coherence.
1 1-2
Response demonstrates limited or no knowledge of geographical investigation methods. Outline of plan is limited and may not refer to one or more of the facets of an investigation in their outline plan. Much of the response may not be relevant to context of question.
0 0 No creditworthy response
(d) Suggest two other pieces of information that may be useful in understanding infiltration
rates at both sites. Possible responses include:
• Data on rainfall; relate to soil antecedent moisture condition • Soil samples; relate to soil type and its characteristics, e.g. permeability and porosity• Anthropogenic activity, e.g. frequency and type of human activities on both sites Levels marked:
Level Marks Descriptors
3 5 Response demonstrates accurate knowledge of factors that can affect infiltration rate. Insightful explanation of the factors with references to characteristics of both sites.
2 3 – 4 Response demonstrates good knowledge of other factors that can affect infiltration rate. Explanation may be limited in depth and detail. Some references made to the context of both sites.
1 1 – 2 Response shows some knowledge of factors that can affect infiltration rate. Inappropriate or incorrect explanation of factors. Response may be of limited relevance to the given context.
0 0 No creditworthy response.
[5]
(e) The group concluded that data collected as shown in Resource 3 may not be completely
reliable and/or accurate. Explain how the process of data collection can be improved. Indicative Content: • Data collected: • The data collected may not be sufficient to provide a good overview of how varying
landuse can affect infiltration rate as only 2 varying landuse were considered. Can expand investigation to areas of other landuse, e.g. construction site
[5]

4
• Timing: • The collection of data is only taken once at one particular point at each site.
Repeated measurements (at least 2) and taking the average can reduce the margin of error.
• To conduce the fieldwork on another day at the same timing so that it is more representative of finding out the infiltration rate in the day
• Try to conduct the measurement on a day with no rain so as to eliminate the influence of the soil antecedent moisture from the rainfall
• Human Error: • Ensure the same person is reading the data so as to eliminate the element of
human error • Try to read the reading at the eye level to reduce parallax error. • Equipment: • Proper equipment, an infiltrometer, should be used to collect data to increase the
accuracy of data Levels marked:
Level Marks Descriptors
3 5-6
Response demonstrates accurate knowledge of data collection methods, issues with both accuracy and/or reliability of these and relevant improvements. Reflects a good understanding of the context of the investigation and of data collection techniques.
2 3 – 4
Response demonstrates good knowledge of data collection methods. Provides an explanation of issues relating to reliability and/or accuracy with some reference to possible improvements. Description may be limited in depth and detail.
1 1 – 2
Response shows some knowledge of relevant data collection methods. Some reference is made to issues with accuracy and reliability but may recommend inappropriate or irrelevant improvements or provide incorrect explanation of methods. Response may be of limited relevance to the given context.
0 0 No creditworthy response.

5
Section B
Theme 1: Tropical Environments
Climatic conditions and anomalies in Africa
2 Resource 4 shows monsoon winds and ITCZ over Africa in January and July and number of days
per month with measurable rainfall. Resource 5 shows climatic zones in Africa and location of Sites X and Y. Resource 6 shows the climographs for Sites X and Y. Resource 7 shows soil profiles taken at Sites X and Y.
(a) With reference to Resource 4, describe the patterns of measurable rainfall in January and
July. Possible responses: • Overall: there is a reversal in areas with high and low rainfall between January and
July. Specifics:
In January • Areas with high rainfall, with more than 16 days per month with measurable rainfall,
are generally found concentrated in East Africa and Madagascar, between the latitudes of 0-20˚S.
• Areas with low rainfall, between 0-5 days per month with measurable rainfall are in found in West Africa between the latitudes of 0-20˚N In July,
• Areas with high rainfall, with more than 16 days per month with measurable rainfall, are generally found concentrated in West Africa, between the latitudes of 0-20˚S.
• Areas with low rainfall, between 0-5 days per month with measurable rainfall are in found in East Africa between the latitudes of 0-20˚N
• Anomaly: Madagascar has at least 2-15 days of measurable rainfall per month. Point marked.
[4]
(b) With reference to Resource 4, account for the patterns of measurable rainfall in January
and July. Possible responses:
• The main two components of the African Monsoons are 1) the West African Monsoon, and 2) the East African Monsoon
• The monsoon winds are formed due to the reversal of land and sea temperatures between Asia and the Pacific and Indian Oceans during the summer and winter hence monsoon winds occur during the NH’s summer (mid-year monsoon) and winter months (year-end monsoon)
• As the large landmass of Asia, has a low specific capacity, gains and loses heat more quickly than the surrounding oceans, the continent develops a strong centre of low pressure in summer and high pressure in winter
[5]

6
West African Monsoon • DRY In January, West Africa tends to be dry as warm, dry monsoon winds, also
known as dry harmattan, are blowing from Sahel and Sahara Region
• WET In July, Monsoon rainfall over West Africa occurs due to low level southwesterly flow of monsoon wind and rain from the Atlantic Ocean and the Inter-Tropical Convergence Zone (ITCZ) north of the equator.
East African Monsoon • WET: The East African Monsoon winds and rain are often the extension of mid-year
and year-end monsoon. They are associated with the ITCZ moving south of the equator, drawing trade-winds with rain. The so-called long rains prevail during winter to spring months.
Levels marked. Levels Marks Descriptors 3 5 Response demonstrates accurate knowledge and understanding
of the formation of monsoon in both July and January. Explanation is detailed, thorough and relevant. Good reference made to resources and relevant information used to substantiate response
2 3-4 Response demonstrates adequate knowledge and understanding of concept of the formation of monsoon. Explanation is valid but may be somewhat limited in relevance and detail and limited reference to resource.
1 1-2 Response demonstrates little or no knowledge and understanding of the formation of monsoon. Explanation lacks detail and makes little or no reference to resource. Overall, the response does not address the context of the question
0 0 No creditworthy response
(c) Describe the rainfall patterns of Sites X and Y as seen in Resource 6.
Possible responses:
• Site Y has higher amount and greater seasonality rainfall as compare to Site X. • Site Y has 1841mm and Site X has 202.5mm of annual rainfall. • Site Y has highest rainfall of around 220mm in October and lowest of 100mm in
January as compared to Site X with highest rainfall of around 80mm in August and lowest of 0mm in at least 6 months from November to April.
Point marked.
[3]
(d) Compare the soil profiles for Sites X and Y as seen in Resource 7.
Possible responses: • Differ in terms of soil depth, soil colours, soil horizons • Site Y has deeper soil depth of 30m as compared to Site X of 80cm.
[4]

7
• Site Y has reddish soil colour and Site Y has soil of lighter brown and white deposits (calcium)
• Site Y has thin layer of O-horizon, humus (dark brown) and thick vegetation cover however Site X has limited/no O-horizon, with no vegetation cover.
Point marked.
(e) With reference to Resources 5, 6 and 7 and your own knowledge, evaluate the extent to
which climate can account for the development of soil profiles as shown in Resource 7. Indicative content: • Candidates should demonstrate an understanding of the impacts of the factors on the
soil profiles of humid tropics and arid tropics. Answer will need to make clear links to explain how factors can result in the different aspect of the soil profile (e.g. thickness, texture, colour) of both humid and arid tropics.
• Responses to link climate, climate-related factor (vegetation cover) and parent rock to the formation of different soil profiles in the tropics.
• A high level response will acknowledge the spatial variations in the soil profiles, where climate play a more significant role with its global scale of influence.
.
Level Marks Descriptors
3 7-9 Response demonstrates a clear knowledge and understanding of the context in the question. Uses relevant, detailed and accurate factual information and conceptual understanding. Reflects strong critical thinking skills and may include perceptive insights for the strongest responses. Source (s) is well used to support the response. Provides a logical and well-developed evaluation well founded on evidence and/or different viewpoints. OR Makes a decision which clearly addresses different elements of the issue and/or interest of different stakeholders.
2 4-6 A satisfactory response which is generally sound and contains relevant points, but may not always focus on the context in the question. Uses factual information and conceptual understanding that is generally appropriate to the given context but lacks details and may contain some inaccuracies. Displays general critical thinking skills. Source (s) is used to support parts of the response. Provides an evaluation, which may be limited in depth and sufficient elaboration in some parts. OR Shows some attempt to address different elements of the issue and/or views of different stakeholders when making a decision but is not well-developed.
[9]

8
1 1-3 Response shows a poor understanding of the context in the question. Uses basic factual information and conceptual understanding which has some, but limited relevance to the question. Source (s) is not used or not accurately used to support the response. Provides little or no evaluation. OR Evidence of decision-making, if present is simple and may be flawed.
0 0 No creditworthy response.
Theme 2: Development, Economy and Environment
Samsung’s Global Production Networks (GPNs)
3 Samsung is a TNC which operates globally via its extensive production networks. Resource 8 shows the global network of Samsung Electronics. Resource 9 shows changes in share of smartphone shipments in China between 2013 to 2014. Resource 10 shows the flows in cobalt processing, which is a key component of GPNs of smartphone manufacturers like Samsung. Resource 11 depicts cobalt mining in the Democratic Republic of Congo (DRC) which supplies more than half of the world’s demand for cobalt.
(a) Describe the trends in location of Samsung’s global production bases as shown in
Resource 8. [3]
Point marked. • Largest no of production bases is concentrated in Asia (28 out of 38) • China makes up nearly half of this proportion (13) and has the highest number
of production bases. • Least no in Africa (only 1) • Absence of production base in Australia
(b) Explain the implications of keeping production ‘in-house’ as depicted in Resource 8. [5] Indicative content:
• Able to have greater control over production processes, avoid reliance/dependence on subcontractors, maintain competitive advantage by keeping technological developments in-house
• However, this may affect cost effectiveness due to need to invest in production bases, may not be able to tap on comparative advantage of subcontractors
Levels Marked:
Level Marks Descriptors 3 5 Response demonstrates accurate knowledge of production processes
of TNCs and implications of in-house production. Explanation is detailed, thorough and relevant. Reference made to resource in response and information from resource used to substantiate response.
2 3-4 Response demonstrates adequate knowledge and understanding of production processes of TNCs and implications of in-house production. Explanation is valid but may be somewhat limited in detail. Some of the response may not fully address the context of the question. Limited reference made to resource,

9
1 1-2 Response demonstrates limited or no knowledge and understanding of production processes of TNCs and implications of in-house production. Explanation lacks detail. Overall the response does not address the context of the question. No reference made to resource.
0 0 No creditworthy response
(c) Suggest reasons for Samsung’s changing market share in China as shown in Resource 9. [5] Indicative content:
• Samsung’s market share has significantly reduced in a year from 18% to 8% • This could be due to reasons such as increasing attractiveness of competitors’
products (Apple and Xiami has an increasing market share of more than 5%) • It could also be due to government policies to protect home grown companies
such as Xiaomi which makes the product more competitive in terms of pricing• This could also be due to larger no/entrance of new competitors in the
smartphone market in China which leads to a lower market share despite high no of units sold
Levels Marked: Level Marks Descriptors 3 5 Response demonstrates accurate knowledge of market share of TNCs
and factors accounting for changes. Explanation is detailed, thorough and relevant. Reference made to resource in response and information from resource used to substantiate response.
2 3-4 Response demonstrates adequate knowledge and understanding of market share of TNCs and factors accounting for changes. Explanation is valid but may be somewhat limited in detail. Some of the response may not fully address the context of the question. Limited reference made to resource,
1 1-2 Response demonstrates limited or no knowledge and understanding of market share of TNCs and factors accounting for changes. Explanation lacks detail. Overall the response does not address the context of the question. No reference made to resource.
0 0 No creditworthy response
(d) With reference to Resource 10, describe the GPNs of batteries for smartphone companies. [3] Point marked.
• Primary product of cobalt is obtained from mines in DRC • This is then processed in China and then sent to factories in Asia like Japan,
South Korea and China to make batteries • These batteries are then supplied to smartphone companies in US and Europe
(e) With reference to Resources 10 and 11 and your own knowledge, discuss the impacts of GPNs on developing countries like the DRC.
[9]
Indicative content: • Resource 10: reflects that GPNs can incorporate countries like DRC which are
rich in natural resources like cobalt and it is able to participate as a trading centre. However, this can also reflect that these countries often may not benefit in terms of value adding of their product, as seen as cobalt is sent to be processed in countries like China and made into batteries in other countries which are in high demand.
• Resource 11 can depict that GPNs can provide employment for the locals who are involved in extracting the minerals. However, there are often issues of underpaid and exploited labor (child labour) which can affect the social development of these countries. Moreover, the resource also shows water pollution in the background as a result of extensive mining activities.
• Own knowledge: developing countries can benefit economically through employment, revenues etc. However, depends on the nature of industries and

10
role of governance. Environmentally, there could be irreversible damages which could result (water pollution, deforestation etc)
• Candidates should be able to form an opinion/judgement based on the points raised and support it with relevant information on developing countries.
Levels marked:
Level Marks Descriptors 3 7-9 Response demonstrates clear knowledge and understanding of the context in the question.
Uses relevant, detailed and accurate factual information and conceptual understanding. Reflects strong critical thinking skills. Source(s) is well used to support the response.
• Provides a logical and well-developed evaluation well founded on evidence and/or different viewpoints.
OR • Makes a decision which clearly addresses different elements of the issue and/or
interests of different stakeholders. 2 4-6 A satisfactory response which is generally sound and contains relevant points, but may not
always focus on the context in the question. Uses factual information and conceptual understanding that is generally relevant to the given context but lacks detail and may contain some inaccuracies. Displays general critical thinking skills. Source(s) is used to support parts of the response.
• Provides and evaluation, which may be limited in depth and insufficient evidence and support used.
OR • Shows some attempt to address different elements of the issue and/or views of
different stakeholders when making a decision but is not well-developed or exemplified.
1 1-3 Response shows a poor understanding of the context in the question. Uses basic factual information and conceptual understanding which has some, but limited, relevance to the question. Source(s) is not used or not accurately used to support the response.
• Provides little or no evaluation. OR
• Evidence of decision-making, if present, are simple and may be flawed and contains no reference to views of stakeholders.
0 0 No creditworthy response.
Theme 3: Sustainable Development
Liveability in Australia
4 Australian cities are often ranked highly in liveability indicators. Resource 12 shows ranking of cities
in 2 different liveability measures. Resource 13 depicts affordability, quality of life and living costs in selected Australian cities based on an Australian investment firm. Resource 14 depicts changes in housing prices in Melbourne over a 5 year period between June 2012 and June 2017.
(a) With reference to Resource 12, compare the ranking of cities across the 2 different
measures. [3]
Point marked. • Only 3 cities appear in both rankings: Melbourne, Sydney and Vienna • Top ranked city in Monocle is not even ranked in top 8 for EIU • For both rankings, cities in Australia are ranked highest (4 out of 8 in EIU and
tied with Germany and Japan for 2 out of 8 in Monocle)
(b) Suggest possible reasons for the variations in ranking depicted in Resource 12. [5] Indicative content:
• Difference in indicators and weightage of factors for ranking • Difference in surveys/respondents • Responses should be supported by ranking shown in Resource.
Levels Marked:
Level Marks Descriptors

11
3 5 Response demonstrates accurate knowledge of liveability indicators and suggests accurate reasons for variations. Explanation is detailed, thorough and relevant. Reference made to resource in response and information from resource used to substantiate response.
2 3-4 Response demonstrates adequate knowledge and understanding of liveability indicators and suggests reasons for variations. Explanation is valid but may be somewhat limited in detail. Some of the response may not fully address the context of the question. Limited reference made to resource,
1 1-2 Response demonstrates limited or no knowledge and understanding of liveability indicators. Explanation lacks detail. Overall the response does not address the context of the question. No reference made to resource.
0 0 No creditworthy response
(c) With reference to Resource 13, suggest why there is a difference in liveability ranking between Adelaide and Darwin.
[6]
Indicative content: • Adelaide has a higher overall ranking of 2 compared to Darwin which is ranked
last in the cities depicted • This could be due to housing prices which are much lower in Adelaide which
could make it more liveable due to affordability ($395201 compared to $547143)
• Could also be due to walkability which allows easy access to amenities where Adelaide has a score of 54 compared to Darwin with 45
• Another reason could be cost of living assessed by average cost of coffee where its $3.50 in Sydney compared to $4.81 in Darwin which can affect day to day expenses
• Other factors which can be explained are safety, health, culture and amenities Levels Marked:
Level Marks Descriptors 3 5-6 Response demonstrates accurate knowledge of factors affecting
liveability and suggests reasons for variations. Explanation is detailed, thorough and relevant. Reference made to resource in response and information from resource used to substantiate response.
2 3-4 Response demonstrates adequate knowledge and understanding of factors affecting liveability and suggests reasons for variations. Explanation is valid but may be somewhat limited in detail. Some of the response may not fully address the context of the question. Limited reference made to resource,
1 1-2 Response demonstrates limited or no knowledge and understanding of factors which affect liveabilty. Explanation lacks detail. Overall the response does not address the context of the question. No reference made to resource.
0 0 No creditworthy response
(d) With reference to Resource 14, describe the changes in housing prices in Melbourne. [4] Point marked. Accepted answers include;
• Generally housing prices have increased in Melbourne over the 5 year period with a much lower proportion of houses which are less than $400K
• NE of the CBD have seen the greatest increase in housing prices from 600K to more than 1 million
• East of the CBD have seen greater change in housing prices compared to the West

12
• Radius of expensive housing (over 1m) has increased by more than double
(e) With reference to Resources 13 and 14 and your own knowledge, explain why not all residents in Melbourne may enjoy a high quality of urban living.
[7]
Indicative content: • Lower income may not enjoy a high quality of urban living because of high
housing prices as seen in Resource 13 (highest in cities surveyed) and where housing prices have increased significantly over a 5 year period (Resource 14). This could price out the lower income from the housing market, pushing them further out of the city centre, affecting their quality of living if they have to commute longer distances/driven to homelessness
• Walkability score reflected in Resource 13 is 57: though its relatively high compared to other cities, residents with no cars may still find it difficult to access amenities
• If transport/amenities are not made disabled/elderly friendly, these residents may also not be able to enjoy a high quality of urban living
• Lower income migrants in Melbourne may not be given equal access to amenities or integrated into society which can affect their quality of urban living
Levels Marked:
Level Marks Descriptors 3 6-7 Response demonstrates accurate knowledge of social groups in the
city and factors which can affect their quality of urban living. Explanation is detailed, thorough and relevant. Reference made to resource in response and information from resource used to substantiate response.
2 3-5 Response demonstrates adequate knowledge of factors which can affect quality of urban living. Explanation is valid but may be somewhat limited in detail. Some of the response may not fully address the context of the question. Limited reference made to resource,
1 1-2 Response demonstrates limited or no knowledge and understanding of factors which can affect quality of urban living. Explanation lacks detail. Overall the response does not address the context of the question. No reference made to resource.
0 0 No creditworthy response

This paper consists of 3 printed pages including the cover page Page 1
Raffles Institution 2018 Year 6 Preliminary Examination
Level: Year 6 H2 GEOGRAPHY Time: 3 hours 9751 Paper 1 Raffles Institution Raffles Institution Raffles Institution Raffles Institution Raffles Institution Raffles Institution Raffles Institution Raffles Institution Raffles Institution Raffles Institution Raffles Institution Raffles Institution Raffles Institution Raffles Institution Raffles Institution Raffles Institution Raffles Institution Raffles Institution Raffles Institution Raffles Institution Raffles Institution Raffles Institution Raffles Institution Raffles Institution Raffles Institution Raffles Institution Raffles Institution Raffles Institution Raffles Institution Raffles Institution Raffles Institution Raffles Institution Raffles Institution Raffles Institution Raffles Institution Raffles Institution Raffles Institution Raffles Institution Raffles Institution Raffles Institution Raffles Institution Raffles Institution Raffles Institution Raffles Institution Raffles Institution Raffles Institution Raffles Institution Raffles Institution Raffles Institution Raffles Institution Raffles Institution Raffles Institution Raffles Institution Raffles Institution Raffles Institution Raffles Institution Raffles Institution Raffles Institution Raffles Institution Raffles Institution Raffles Institution Raffles Institution Raffles Institution Raffles Institution Raffles Institution Raffles Institution Raffles Institution Raffles Institution Raffles Institution Raffles Institution Raffles Institution Raffles Institution Raffles Institution Raffles Institution Raffles Institution READ THESE INSTRUCTIONS FIRST
Write your Index number and name on the work you hand in. Write in dark blue or black pen on both sides of the paper. You may use a pencil for any diagrams or graphs. Do not use staples, paper clips or correction fluid. Answer three questions. One from each section. You should make reference to appropriate examples studied in the field or the classroom, even where such examples are not specifically requested by the question. Diagram and sketch maps should be drawn whenever they serve to illustrate an answer. World outline maps will be provided if you request for them. They may be annotated and handed in with the relevant answers. You are reminded of the need for good English and clear presentation in your answers. At the end of the examination, fasten all your work securely together. The number of marks is given in brackets [ ] at the end of each question or part question. Answer every question on a fresh sheet of writing paper.

This paper consists of 2 printed pages including the cover page Page 2
SECTION A – Tropical Environments
Answer one question from this section. 1 (a) Explain the differences between infiltration excess and saturation
overland flow in the tropics. [12]
(b) ‘Channel patterns in the tropics are consequences of patterns of
discharge.’ Discuss the validity of this view.
[20]
2 (a) Explain the evolution of cone karst to isolated karst in the humid tropics. [12] (b) ‘Wind erosion shapes landforms in the arid tropics while water erosion
shapes landforms in the humid tropics.’ To what extent do you agree?
[20]
SECTION B – Development, Economy and Environment
Answer one question from this section. 3 (a) Explain how regional and/or international bodies may affect the
economic well-being of countries at low levels of development. [12]
(b) ‘The primary role of the state is to regulate the economy.’ To what extent do you agree?
[20]
4 (a) Explain how extractive industries can impact on countries with low
levels of development. [12]
(b) To what extent is the Malthusian principle still relevant in understanding
population growth and resource use today? [20]

This paper consists of 3 printed pages including the cover page Page 3
SECTION C – Sustainable Development
Answer one question from this section. 5 (a) Explain the concept of ‘sustainable development’ and its relevance to
countries of low levels of development. [12]
(b) ‘The effects of climate change on sustainable development are
determined by human actions.’ How far do you agree with this statement?
[20]
6 (a) Explain the factors that affect ecological footprint of cities with high
levels of development. [12]
(b) Evaluate the effectiveness of strategies used to improve the image of
cities.
[20]

This insert consists of 13 pages including the cover page Page 1
Raffles Institution 2018 Year 6 Preliminary Examination
Level: Year 6 H2 GEOGRAPHY Time: 3 hours 9751 Paper 2 Raffles Institution Raffles Institution Raffles Institution Raffles Institution Raffles Institution Raffles Institution Raffles Institution Raffles Institution Raffles Institution Raffles Institution Raffles Institution Raffles Institution Raffles Institution Raffles Institution Raffles Institution Raffles Institution Raffles Institution Raffles Institution Raffles Institution Raffles Institution Raffles Institution Raffles Institution Raffles Institution Raffles Institution Raffles Institution Raffles Institution Raffles Institution Raffles Institution Raffles Institution Raffles Institution Raffles Institution Raffles Institution Raffles Institution Raffles Institution Raffles Institution Raffles Institution Raffles Institution Raffles Institution Raffles Institution Raffles Institution Raffles Institution Raffles Institution Raffles Institution Raffles Institution Raffles Institution Raffles Institution Raffles Institution Raffles Institution Raffles Institution Raffles Institution Raffles Institution Raffles Institution Raffles Institution Raffles Institution Raffles Institution Raffles Institution Raffles Institution Raffles Institution Raffles Institution Raffles Institution Raffles Institution Raffles Institution Raffles Institution Raffles Institution Raffles Institution Raffles Institution Raffles Institution Raffles Institution Raffles Institution Raffles Institution Raffles Institution Raffles Institution Raffles Institution Raffles Institution Raffles Institution
READ THESE INSTRUCTIONS FIRST: This Insert contains all the Resources referred to in the question paper.
INSERT

This insert consists of 13 pages including the cover page Page 2
Resource 1 for Question 1
Storm Hydrographs

This insert consists of 13 pages including the cover page Page 3
Resource 2 for Question 1
Maps with locations of Site A and Site B

This insert consists of 13 pages including the cover page Page 4
Resource 3 for Question 1
Recording Sheet
Sample collection date: 18 /8 / 2018 and 19 /8 /2018
Sample collection time: 8:00am
Observations:
Time Taken
Change in water level, Eg 20mm of
infiltrometer
(mm)
Infiltration Rate
(mm/min) (min) (sec)
Day 1 Site A 2 30 10mm 4 mm/min
Day 1 Site B 4 0 10mm 2.5mm/min
Day 2 Site A 1 25 10mm 7mm/min
Day 2 Site B 2 0 10mm 5mm 2.5mm/min

This insert consists of 13 pages including the cover page Page 5
Resource 4 for Question 2
Climograph of Pahang

This insert consists of 13 pages including the cover page Page 6
Resource 5 for Question 2
Vegetation structure, soil profile and mean biomass of a typical forest in Pahang

This insert consists of 13 pages including the cover page Page 7
Resource 6 for Question 2
Pahang’s water budget
Resource 7 for Question 2
A tea plantation in a forest of Pahang

This insert consists of 13 pages including the cover page Page 8
Resource 8 for Question 3
Locations of resource extraction in Democratic Republic of Congo (DRC)

This insert consists of 13 pages including the cover page Page 9
Resource 9 for Question 3
Ownership of copper and cobalt mines operating in the Katanga Province
of the DRC
North America: 3 players, 4 mines
Private Partner: AFRICAN METALS CORP., Canada Stock Exchange : TSX-V
Private Partner: IVANHOE MINES, Canada Stock Exchange : TSX
Private Partner: FREEPORT-McMAHON, USA GECAMINES, DRC Stock Exchange: FCX, NYSE, TSX, OMX
Europe: 2 players, 10 mines
Private Partner: ENRC, Luxembourg Stock Exchange : Private
Private Partner: GLENCORE, Switzerland Stock Exchange: LSE, JSE, SEHK
Australia: 3 players, 3 mines
Private Partner: MAWSON WEST, Australia Stock Exchange : TSX
Private Partner: TIGER RESOURCES, Australia Stock Exchange : ASX
Private Partner: MMX, Australia-China Stock Exchange: SEHK
Asia: 4 players, 5 mines
Private Partner: JINCHUAN RESOURCES, China. Stock Exchange : SEHK
Private Partner: FORTUNE AHEAD, Hongkong Stock Exchange : Private
Private Partner: CHINA RAILWAY ENGINEERING, China Stock Exchange: SEHK, SSE
Private Partner : NORINCO, China Stock Exchange : SZSE
DRC Private: 2 players, 2 mines
Private Partner: FORREST GROUP, DRC Stock Exchange : Private
Private Partner: SHALINA, DRC Stock Exchange: Private
DRC State-owned: 5 mines
State-owned : DECAMINES, DRC Stock Exchange: N/A

This insert consists of 13 pages including the cover page Page 10
Res
ou
rce
10 f
or
Qu
esti
on
3
M
ove
men
t o
f co
bal
t fr
om
min
es in
DR
C t
o g
lob
al m
arke
ts

This insert consists of 13 pages including the cover page Page 11
Resource 11 for Question 4
No. of one-person households by age-groups in Singapore.
Resource 12 for Question 4
Changes in percentage of elderly population (65 years and above) from 7 percent to 14 percent

This insert consists of 13 pages including the cover page Page 12
Resource 13 for Question 4
New traffic improvement as part of a “Silver Zone” in Bukit Merah View

This insert consists of 13 pages including the cover page Page 13
Resource 14 for Question 4
Costs for different aged care options in Singapore
AGED CARE OPTIONS IN SINGAPORE
Not-for-profit Nursing Homes (6 to 8 Bed) S$1200-3500
Private Nursing Homes (Single Room) S$3600-7000
Private Nursing Homes in Johor Bahru (Single Room) S$740-2150
Assisted Living Facility (Single Room) S$3500
Care at Home (incl. domestic helper’s wages) S$2500-3000

This paper consists of 4 printed pages including the cover page Page 1
Raffles Institution 2018 Year 6 Preliminary Examination
Level: Year 6 H2 GEOGRAPHY Time: 3 hours 9751 Paper 2 Raffles Institution Raffles Institution Raffles Institution Raffles Institution Raffles Institution Raffles Institution Raffles Institution Raffles Institution Raffles Institution Raffles Institution Raffles Institution Raffles Institution Raffles Institution Raffles Institution Raffles Institution Raffles Institution Raffles Institution Raffles Institution Raffles Institution Raffles Institution Raffles Institution Raffles Institution Raffles Institution Raffles Institution Raffles Institution Raffles Institution Raffles Institution Raffles Institution Raffles Institution Raffles Institution Raffles Institution Raffles Institution Raffles Institution Raffles Institution Raffles Institution Raffles Institution Raffles Institution Raffles Institution Raffles Institution Raffles Institution Raffles Institution Raffles Institution Raffles Institution Raffles Institution Raffles Institution Raffles Institution Raffles Institution Raffles Institution Raffles Institution Raffles Institution Raffles Institution Raffles Institution Raffles Institution Raffles Institution Raffles Institution Raffles Institution Raffles Institution Raffles Institution Raffles Institution Raffles Institution Raffles Institution Raffles Institution Raffles Institution Raffles Institution Raffles Institution Raffles Institution Raffles Institution Raffles Institution Raffles Institution Raffles Institution Raffles Institution Raffles Institution Raffles Institution Raffles Institution Raffles Institution READ THESE INSTRUCTIONS FIRST
Write your Index number and name on the work you hand in. Write in dark blue or black pen on both sides of the paper. You may use a pencil for any diagrams or graphs. Do not use staples, paper clips or correction fluid. Candidates answer all questions. The Insert contains all the Resources referred to in the questions. You should make reference to appropriate examples studied in the field or the classroom, even where such examples are not specifically requested by the question. Diagram and sketch maps should be drawn whenever they serve to illustrate an answer. World outline maps will be provided if you request for them. They may be annotated and handed in with the relevant answers. You are reminded of the need for good English and clear presentation in your answers. The number of marks is given in brackets [ ] at the end of each question or part question. Answer every question on a fresh sheet of writing paper.

This paper consists of 4 printed pages including the cover page Page 2
SECTION A
Theme 4: Geographical Investigation
1 You and your classmates were tasked to investigate infiltration rates of two sites. You decided to split yourselves into two groups of four to measure the infiltration rates of soil at each site. Site A is near the river running through Bishan-Ang Mo Kio Park with residential areas approximately 400 metres north and south of it. Site B is at a construction site near the junction of Tanglin Road and Grange Road with commercial and residential areas within its 200 metres radius. Together with your classmates, you made your own double ring infiltrometers with used aluminium milk powder tins. You decided to use the stopwatch function of your smart phones. Infiltration rates are calculated by a standardised recording sheet prepared by yourselves. At each site, both groups chose the flattest ground possible and clipped off any existing grass before you gently twist your double-ring infiltrometer into the soil. Both groups poured water into the infiltrometers, the water level dropped faster initially and measurements were taken only when all three members decided the fall in water level slowed down. Both groups started at the same time and completed the task in an hour. To ensure accuracy, the groups carried out the same steps the next day. Photographs of the exact placement of the infiltrometers were taken to ensure the same spots were utilised. Resource 1 shows storm hydrographs of Site A and Site B. Resource 2 shows maps with locations of Site A and Site B. Resource 3 shows the consolidated data collected by you and your classmates to calculate infiltration rates.
(a) With reference to Resource 1, suggest a suitable hypothesis for this
geographical investigation. [1]
(b) Describe three potential risks at Site A shown in Resource 2 and
explain how each risk could be minimized. [6]
(c) Explain how you would minimize the impact of your investigation at
Sites A and B differently. [4]
(d) Suggest two limitations of Resource 3 in representing the findings and
draw bar graphs to represent the infiltration rates of Sites A and B. [5]
(e) Evaluate this investigation to ascertain the flood risks of Sites A and B,
and explain how it could be improved and extended. [9]

This paper consists of 4 printed pages including the cover page Page 3
SECTION B
Theme 1: Tropical Environments
Plantations in Pahang
2 Pahang is a state in Peninsular Malaysia. Two-thirds of Pahang’s land is forested and 12.8% of the total land area is used for plantation agriculture. Resource 4 is a climograph of Pahang. Resource 5 shows the vegetation structure, soil profile and mean biomass of a typical forest in Pahang. Resource 6 is the water budget of entire Pahang. Resource 7 is a photograph of a tea plantation in a forest of Pahang.
(a) Identify the climatic zone of Pahang according to Köppen–Geiger
climate classification system. Support your answer with data from Resource 4.
[4]
(b) Describe the vegetation structure and mean biomass of a typical forest
in Pahang as shown in Resource 5. [3]
(c) With the help of Resources 5 and 6, suggest the possible processes
that result in the soil profile of a typical forest in Pahang. [6]
(d) With reference to Resource 7, explain how the landscape was changed
to develop a plantation. [4]
(e) Using Resources 4, 6 and 7, explain why occurrence of mass
movements is a major concern of plantation owners in Pahang. Support your response with information from the resources.
[8]

This paper consists of 4 printed pages including the cover page Page 4
Theme 2: Development, Economy and Environment
Resource Extraction in Democratic Republic of Congo
Theme 3: Sustainable Development
Needs of the Elderly in Singapore and selected countries
3 Resource 8 shows the extraction of various resources in the Democratic Republic of Congo (DRC). Resource 9 shows information on the ownership of copper and cobalt mines operating in Katanga Province of the DRC. Resource 10 shows information on the movement of cobalt from mines in the DRC to global markets.
(a) Using Resource 8, describe the spatial pattern of resource extraction in
the DRC. [3]
(b) To what extent does Resource 8 show a core-periphery pattern of
development within the DRC. [5]
(c) Explain three possible impacts of foreign ownership of mines as
depicted in Resource 9. [6]
(d) Describe the global production network of cobalt as shown in Resource
10. [4]
(e) Evaluate the usefulness of Resources 8, 9 and 10 as evidence for the
resource curse thesis in the DRC. [7]
4 Resource 11 shows the number of one-person households by age-groups in Singapore from 2000 to 2014. Resource 12 shows the changes in percentage of elderly population (65+ years) from 7 percent to 14 percent for selected countries. Resource 13 depicts a new Silver Zone traffic measure in Bukit Merah View to help the elderly make their way across roads safely. Resource 14 shows the costs for the different aged care options in Singapore.
(a) Explain two limitations of Resource 11 in understanding the needs of
the elderly in Singapore. [3]
(a) With reference to Resource 12, compare the patterns of Asian countries
and non-Asian countries for the change in percentage of elderly population (aged 65+) to rise from 7% to 14%.
[4]
(c) Using evidence from Resources 11 & 12, outline why the needs of the
elderly population would be considered a pressing issue for Singapore? [5]
(d) Explain how the mobility of elderly residents may be improved with the
new traffic measure depicted in Resource 13. [4]
(e) Using Resource 14 and your own knowledge, recommend one option
for an elderly person who is no longer able to live independently. Justify your decision.
[9]

1
Paper 2 Suggested Points Geographical Investigation
1
(a) With Reference to Resource 1, suggest a suitable hypothesis for this geographical investigation.
[1]
The infiltration rates of soil in Bishan-AMK park is higher than soil at junction of Tanglin and Grange roads.
(b) Describe three potential risks at Site A shown in Resource 2 and explain how each risk could be minimized.
[6]
Site A is near Kallang river, may have steep or gentle slopes + grass + flora and fauna – wear proper shoes to avoid falling and proper clothing to protect from insect bites etc
Low human traffic esp weekdays as most residents around the area may be working, nearest housing about 400m away and park users may bring pets – go in groups and be aware of strangers, inform teachers and park authority
Increment weather – check forecast, bring umbrella, hot so must be properly hydrated
(c) Explain how you would minimize the impact of your investigation at Sites A and B differently.
[4]
A is near walking path/ river / trees / park facilities so avoid unnecessary damage to trees and plants and do not vandalise park facilities and B near construction and offices so do not hinder / get into the way of people who need to work (do not block their way or be in way of construction machines / vehicles)
Cannot disturb the people / make unnecessary noise – A – park users who are using the parks , B – residents and construction and office workers from the 200m radius doing their daily activities
(d) Suggest two limitations of Resource 3 in representing the findings and draw bar graphs to represent the infiltration rates of Sites A and B.
Difficulty in seeing the differences in infiltration rates between sites / days (lack of visual comparison)
Extra information / unnecessary info meant for calculation and not for audience
[5]

2
(e) Evaluate this investigation to ascertain the flood risks of Sites A and B, and explain how it could be improved and extended.
Strengths
Choice of 2 distinct sites. Infiltration provides a sense of how different land uses (park vs construction) impact infiltration rates Construction site has a lower infiltration rates of 2.5 while park 4 to 7.
Problems and improvements
Lack proper sampling method and limited in the number of samples.
Make sure infiltrometer is hammered to 5cm and not gently twist .
Must watch the water levels in both rings to ensure the water will not flow sideways.
Must twist ring deep enough so that water will not leak out
[9]
0
1
2
3
4
5
6
7
8
Site A Site B
Infiltration Rates (mm/min)
Day 1 Day 2
0
1
2
3
4
5
6
7
8
Day 1 Day 2
Infiltration Rates (mm/min)
Site A Site B

3
Theme 1: Tropical Environments
Plantations in Pahang
Extension
More sites/ temporal aspects – effects of wind direction on rain so must use rain gauge etc for pluvial rain esp for Site B + coupled with discharge for Site A.
2 Pahang is a state in Peninsular Malaysia. Two-thirds of Pahang’s land is forested and 12.8% of the total land area is used for plantation agriculture. Resource 4 is a climograph of Pahang. Resource 5 shows the vegetation structure, soil profile and mean biomass of a typical forest in Pahang. Resource 6 is the water budget of entire Pahang. Resource 7 is a photograph of a tea plantation in a forest of Pahang.
(a) Identify the climatic zone of Pahang according to Köppen–Geiger climate classification system. Support your answer with data from Resource 4.
[4]
Af
High r/f throughout the year + evidence (lowest 79mm in Sept and highest 97mm in Jan) generally
Consistently high temp + low range (2 deg C) + evidence (26-28 deg C)
(b) Describe the vegetation structure and mean biomass of a typical forest in Pahang as shown in Resource 5.
[3]
Tall and dense vegetation structure Presence of emergent and continuous canopies and limited vegetation at the lower level. Mean biomass of 1100 tonnes per hectare
(c) With the help of Resources 5 and 6, suggest the possible processes that result in the soil profile of a typical forest in Pahang.
[6]
O - Thin humus in R5 due to rapid decomposition as seen in high precipitation and temp (implied by rather high potential evapotranspiration) in R6 and organic matter from plants in R5.
A/B - R6 – precipitation exceeds evapotranspiration in all months.
Laterisation / leaching with repeated wetting and drying by frequent thunderstorms leading to profile with insoluble and high iron content in R5. The high levels of precipitation given in R6 means that soil water movement is predominantly downward creating intense leaching which explains the red colour of the soil and high aluminium content as seen in R5.
C/R - Deep weathering of parent material in R5 bec of chemical weathering bec high temp and precipitation in R6. The soils are intensely weathered,

4
3a) more in the East (quote some ‘stats’) None in the West
hence the great depth of weathered material (regolith), but they supply relatively few nutrients to the vegetation.
(d) With reference to Resource 7, explain how the landscape was changed to develop a plantation.
[4]
Terracing Construction of roads Land clearance
(e) Using Resources 4, 6 and 7, explain why occurrence of mass movements is a major concern of plantation owners in Pahang. Support your response with information from the resources.
R4 – Heavy, and occasionally continuous, rainfall throughout the year in Pahang can add weight to slope material (increasing shear stress) and create lubrication (decreasing shear strength) on the slope, leading to landslides.
R6 – precipitation is higher than evapotranspiration, therefore vast water surpluses throughout the year and there is no water deficit in Pahang.
With the abundance of water, mass movements are easily triggered because of an increase in shear stress or a reduction in shear strength. Water encourages mass movement by simultaneously increasing the former while decreasing the latter.
Owners are concerned because mass movements are easily triggered due to the presence of water all year round in Pahang. Outcomes will be loss of crops (ec), properties and machineries (ec) and endangered the lives of the people at the plantation (sc). Owners need to be alert to weather changes and mitigate accordingly.
Plentiful rainfall and warm temperatures (R5) are conducive to high levels of vegetation growth in Pahang. If deforestation has taken place (R7), the shear strength of slopes will be reduced because of the removal of the binding properties of the roots, and also exposes the soil to the direct impact of the torrential downpours (R5). However, vegetation in form of crops (tea in R7) may also add weight to slopes, increasing shear stress.
Owners are concerned as vegetation can work both ways. They must be aware of the effects of clearing of trees and well as problems of intensive cultivation.
R7 – Areas of high relief with steep slopes in R7 may experience flows and landslides most frequently, especially when combined with other contributing factors.
[8]

5
Exception is Oil in Matadi b) Yes somewhat.
West is the Core with high level of resource extraction East is the periphery with little activities in resource extraction
However, Res 8 does not show the economic value of those activities eg. No. of jobs, wages levels, value of production output development includes more than just resource extraction/ mining activities. Others like manufacturing. Usually measured by economic indicators eg GDPpp, average income
c) Negative:
econ leakage / profit repatriation reliance of foreign labour or expat labour less likely to care about the environment likely to exploit workers
Positive: -transfer of technology to local companies -better financial management/ large capital investments / listed on stock exchanges eg TSX, SEHK -good practices on the environment -joint ventures possible between local and foreign companies eg Freeport-McMahon and Gecamines
d) GPN = production, distribution, consumption
Production = done in DRC Distribution = sent to China, Japan and SK for processing into components & batteries Consumption = sent to Europe and USA as batteries for cars and other high-tech products
e) DRC is rich with natural resources, many mines, huge variety of minerals and fossil
fuels Heavy reliance on foreign TNCs eg from China, Australia, Canada local players and local govt in DRC – very small proportion
primary sector done in DRC Secondary and tertiary done in other countries

6
4a) data shows popn aged 65+
Data does not show breakdown of elderly who can still live independently or those who need assistance
shows data on living alone (may indicate issues of elderly loneliness, emotional needs). Other needs not shown eg financial needs, transport needs, healthcare needs
b) Asian countries –steeper curve ie. increase at a faster rate OR they change from 7%
to 14% within a shorter period/ eg S’pore 18 years, China 24 years Conversely, other countries took longer period to change from 7% to 14% eg France 110 years, Russia 25 years
Other countries started this process from an earlier period eg UK 1930-1975, Sweden 1890-1970
c) Res 11 shows total number of elderly living alone has increased from around 15,000
(2000) to 40,000 (2014). More elderly might be facing loneliness or require assistance in daily life
Singapore has the steepest live, meaning it has the highest rate of increase among those countries, highest rate of ageing. Govt must plan policies to meet needs of ageing popn
d) zig-zagging of roads – slows down the vehicular traffic
single lane road- smaller road width makes it easier to cross divider in the middle of the road- elderly can cross one side first before negotiating the other side. They can look at one direction at a time
e) issues of costs
issues of privacy/ having private space familiarity at home visits by children proximity to home Financial needs -finances and costs –eg use retirement funds or funds from children Socio-emotional needs -interaction and group acitivities -visits or phone calls from children -someone to chat with -religious needs Safety & security -issues of crimes -abuse from carers or others Healthcare needs -able to see doctors

7
-given medication -costs of healthcare Mobility and transport -going for walks -use of wheelchair or PMDs / barrier free access -use of technology to keep in touch -grab bars Concept of liveability of living space for the elderly Concept of sustainable development (SD) and the 3 domains, esp balancing ECON domain and SOCIAL domain

GEOGRAPHY 9751/01 Paper 1 Structured Essay Questions 12 September 2018
3 hours Additional Materials: Answer Paper World outline map Cover Page READ THESE INSTRUCTIONS FIRST Write your name, admission number and class on all the work you hand in. Write in dark blue or black pen on both sides of the paper. You may use an HB pencil for any diagrams or graphs. Do not use staples, paper clips, highlighters, glue or correction fluid. Answer three questions. One from each section. You should make reference to appropriate examples studied in the field or the classroom, even where such examples are not specifically requested by the question. Diagrams and sketch maps should be drawn whenever they serve to illustrate an answer. The world outline map may be annotated and handed in with relevant answers. You are reminded of the need for good English and clear presentation in your answers. At the end of the examination, fasten all your work below the cover page securely together. The number of marks is given in brackets [ ] at the end of each question or part question.
___________________________________________________________________ This document consists of 3 printed pages and 1 blank page.
[Turn over
RIVER VALLEY HIGH SCHOOL General Certificate of Education Advanced Level Preliminary Examination 2018 Higher 2

2
Section A – Tropical Environments
Answer one question from this section.
1 (a) Explain how channel morphology changes downstream in a humid tropical drainage basin.
[12]
(b) Using examples, discuss the factors contributing to the variation in channel
patterns in a tropical drainage basin.
[20]
2 (a) Explain the role of water in the development of soils in the semi-arid and arid tropics.
[12]
(b) The distinctive fluvial and aeolian landscapes of the arid tropics are shaped
primarily by the ambient climatic conditions. Discuss.
[20]
Section B – Development, Economy and Environment
Answer one question from this section.
3 (a) Explain how global divisions of labour have changed since the start of the 20th Century.
[12]
(b) With reference to examples, assess the role of international organisations
in promoting development worldwide.
[20]
4 (a) Explain the environmental impacts of extractive industries in countries at low levels of development.
[12]
(b) ‘Natural resource endowments would enable developing countries to make
the transition from underdevelopment to industrial ‘take-off’, just as they have done for developed countries such as Australia, the United States and the United Kingdom.’ (Walter Rostow, 1961). To what extent do you agree with this statement?
[20]

3
Section C – Sustainable Development
Answer one question from this section.
5 (a) Explain how human activities in countries at various levels of development are contributing to the enhanced greenhouse effect.
[12]
(b) Using examples, discuss the extent to which the pursuit of economic growth
is compatible with the principles of sustainable development.
[20]
6 (a) Explain how the concepts of ecological footprint and urban metabolism are important in the understanding of sustainable urban development in cities with fast growing populations.
[12] (b) Assess the effectiveness of strategies used to manage non-hazardous solid
waste in a sustainable manner.
[20]

4
Blank Page

GEOGRAPHY 9751/02 Paper 2 Data Response Questions 18 September 2018
3 hours Additional Materials: Answer Paper 1 Insert World outline map Cover Page READ THESE INSTRUCTIONS FIRST Write your name, admission number and class on all the work you hand in. Write in dark blue or black pen on both sides of the paper. You may use an HB pencil for any diagrams or graphs. Do not use staples, paper clips, highlighters, glue or correction fluid. Candidates answer all questions. The Insert contains all the Resources referred to in the questions. You should make reference to appropriate examples studied in the field or the classroom, even where such examples are not specifically requested by the question. Diagrams and sketch maps should be drawn whenever they serve to illustrate an answer. The world outline map may be annotated and handed in with relevant answers. You are reminded of the need for good English and clear presentation in your answers. At the end of the examination, fasten all your work below the cover page securely together. The number of marks is given in brackets [ ] at the end of each question or part question.
___________________________________________________________________ This document consists of 4 printed pages.
[Turn over
RIVER VALLEY HIGH SCHOOL General Certificate of Education Advanced Level Preliminary Examination 2018 Higher 2

2
Section A Theme 4 – Geographical Investigation
Answer one question from this section.
1 A group of 6 students observed that a section of the Bukit Batok Canal in the western
part of Singapore was refurbished with rain gardens as part of the Public Utilities Board’s (PUB) ‘Active, Beautiful and Clean’ (ABC) Waters Programme. Rain gardens help to manage surface runoff in urban areas in a more sustainable manner, by controlling the quantity and quality of surface runoff to prevent pluvial flooding, through natural filtration and encouraging subsurface conveyance of water into catchments. The students wanted to study the effectiveness of the rain garden project in Bukit Batok by measuring infiltration rates of surfaces adjacent to the canal. Breaking into 2 teams, each team of 3 students concurrently took readings from 10 randomly sampled sites along the segment that underwent refurbishment (as seen in Photograph ‘A’), and 10 randomly sampled sites along the segment that remained unchanged (as seen in Photograph ‘B’). The infiltration readings were taken on two separate occasions over a period of 2 days owing to inclement weather interrupting the fieldwork after readings from 5 sites were sampled. Equipment used for each team:
• Double-ring Infiltrometer • Stopwatch • Bottles of water • Printed recording sheets and writing materials • Large scale map of the study area
The infiltration readings were plotted into infiltration rate graphs. Resource 1 shows the study area with the location of the sample sites as well as photographs of the two contrasting segments of the Bukit Batok Canal. Photograph ‘A’ shows a section that was refurbished with rain gardens and recreational infrastructure. Photograph ‘B’ shows a stretch of the canal that was not included in the refurbishment. Resource 2 shows the recording sheet and equipment that was used for the fieldwork. Resource 3 shows two infiltration rate graphs constructed from 2 site readings, one for ‘A’ sample sites and one for ‘B’ sample sites.
(a) Suggest a suitable research question for this investigation about infiltration rates.
[1]
(b) With reference to Resources 1 and 2, explain two potential risks associated
with carrying out this geographical investigation and how the group might minimise each risk.
[4] (c) Referring to Resource 2, explain how the students used the equipment to
measure the infiltration rate at a data site.
[5] (d) The students reflected that the findings might have been compromised by
intervening factors. With reference to Resources 1, 2 and 3, discuss how the process of data collection could be improved.
[7]
(e) Discuss the value of this geographical investigation and its potential
contribution to the management of urban runoff in Bukit Batok.
[8]

3
Section B Theme 1: Tropical Environments
Tropical Climates
2 Resource 4 shows the global distribution of atmospheric pressure in December and June. Resource 5 shows the global radiation balance in December and June. Resource 6 shows the Oceanic Niño Index (ONI), which shows warm/El Niño (red) and cold/La Niña (blue) phases of abnormal sea surface temperatures in the tropical Pacific Ocean from 1950 to 2018. Resource 7 shows selected significant climate anomalies and events in June 2017.
(a) Compare the global pattern of atmospheric pressure in December with that
in June as shown in Resource 4.
[3] (b) With reference to Resource 5, explain the seasonal change in the earth’s
radiation balance.
[4] (c) Referring to Resources 4 and 5, discuss the extent to which atmospheric
pressure may be attributed to solar heating.
[7] (d) Comment on the periodicity of El Niño events from 1950 to 2018 according
to the Oceanic Niño Index in Resource 6.
[3] (e) With reference to Resources 6 and 7, discuss the validity of the notion that
El Nino Southern Oscillation (ENSO) related events aggravate the impacts of climate change as much as they are affected by it.
[8]
Theme 2: Development, Economy and Environment FDI, TNCs and GPNs
3 Resource 8 shows the foreign direct investment (FDI) into China, a medium income
country in Asia, in 1992 and 2006. Resource 9 shows a plan of the Gateway City Industrial Estate in Thailand, also a medium income country in Asia, in 2008. Resource 10 shows the global production network (GPN) which supports the construction of BMW’s Mini car. BMW is a German based automobile manufacturing company and is headquartered in Munich, Bavaria, Germany.
(a) Describe the changes in FDI shown in Resource 8. [3] (b) Suggest reasons for the changes you have described in (a). [5] (c) Using evidence from Resource 9, describe the characteristics of the
industrial estate which make it an attractive location for foreign transnational corporations (TNCs).
[4] (d) Describe and suggest reasons for BMW’s GPN as illustrated in Resource
10.
[4] (e) Using Resources 8, 9 and 10, as well as your own knowledge, recommend
whether BMW should consider changing its current GPN in favour of Asian countries like China and Thailand. Justify your answer.
[9]

4
Theme 3: Sustainable Development Urban Reimaging in the UK
4 Despite the UK being a relatively small country there is considerable variation in
economic activity between places. Reading (southern England) and Middlesbrough (northeast England) are similarly sized urban areas in the UK as shown in Resource 11. Resource 12 shows job type in Reading and Middlesbrough. Resource 13 breaks down people in the two urban areas by economic activity. Resource 14 illustrates the demographic characteristics of Reading and Middlesbrough. Resource 15 shows images of both urban areas. Since 2010, the UK government has attempted to measure ‘national wellbeing’ by conducting a survey asking people about how they feel about their lives. Results from 2015 for Reading and Middlesbrough are shown in Resource 16. Resource 17 shows some examples of the use of logos and slogans in the rebranding of rural and urban places.
(a) With reference to Resources 12 and 13, which urban area is considered more economically successful? Explain your answer.
[4]
(b) Using Resources 14, 15 and 16, which urban area might be more in need
of urban reimaging? Explain your answer.
[5] (c) With reference to Resource 17, evaluate the strengths and limitations of
such rebranding strategies.
[5] (d) Apart from what is shown in Resource 17, describe other strategies to
improve the image of urban places.
[3] (e) Would urban reimaging necessarily improve the liveability of urban places?
Discuss with reference to the resources and your own knowledge.
[8]

GEOGRAPHY 9751/02
Paper 2 Data Response Questions 18 September 2018
INSERT 3 hours
READ THESE INSTRUCTIONS FIRST This Insert contains all the Resources referred to in the questions.
___________________________________________________________________ This document consists of 13 printed pages and 1 blank page.
[Turn over
RIVER VALLEY HIGH SCHOOL General Certificate of Education Advanced Level Preliminary Examination 2018 Higher 2

2
Resource 1 for Question 1 Study Area

3
Resource 2 for Question 1 Data Recording Sheet and Fieldwork Equipment

4
Resource 3 for Question 1 Infiltration Graphs

5
Resource 4 for Question 2 Global Atmospheric Pressure Distribution
Resource 5 for Question 2 Global Radiation Budget in December and June

6
Resource 6 for Question 2 The Oceanic Niño Index (ONI)

7
Resource 7 for Question 2 Selected Significant Climate Anomalies and Events in June 2017

8
Resource 8A for Question 3 Foreign direct investment (FDI) into China, 1992
Resource 8B for Question 3
Foreign direct investment (FDI) into China, 2006

9
Resource 9 for Question 3 Plan of the Gateway City Industrial Estate, Thailand, 2008

10
Resource 10 for Question 3 BMW’s Mini and the global production network that supports its construction

11
Resource 11 for Question 4 Locations of Reading and Middlesbrough in the UK
Resource 12 for Question 4
Employment in Reading and Middlesbrough in 2015
Resource 13 for Question 4 Economic activity in Middlesbrough and Reading in 2015
Middlesbrough •
• Reading

12
Resource 14 for Question 4 The age profile and population change of Reading and Middlesbrough in 2011
Resource 15 for Question 4 Images of Reading (top) and Middlesbrough (bottom)
1991 2011 Reading’s Population
136,000 155,000
Middlesbrough’s Population
146,000 138,400

13
Resource 16 for Question 4 National wellbeing survey results 2015
Resource 17 for Question 4 Rural and urban destination logos

14
Blank Page

1
RVHS H2 GEOGRAPHY PAPER 1 PRELIMS 2018
1 (a) Explain how channel morphology changes downstream in a humid tropical drainage basin.
[12]
Indicative Content: A humid tropical drainage basin is characterised by abundant total annual precipitation, yet there might be seasonality of rainfall in the Am climate or negligible seasonality in Af climates. In any case, this signals the conditions enabling the work of perpetual streams due to a sufficiently shallow water table that constantly feeds streams through baseflow. In such a context, Bradshaw’s model and Schumm’s model would be suitable for explaining how channel morphology changes downstream in tandem with parallel changes to discharge and velocity. To account for these changes, it is helpful to analyse the interactions between channel form, channel energy and the contextual hydrological environment at different parts of the river’s long profile.
(b) Using examples, discuss the factors contributing to the variation in channel patterns in a tropical drainage basin.
[20]
Indicative Content: Some of the largest drainage basins in the world occur in the tropical latitudes: the Mekong, Amazon and Nile river basins are obvious examples. Yet, they span a range of climatic, altitudinal and geological regions and hence display a variety of channel forms and patterns (even within different parts of the drainage basin. This essay discusses the interplay between these factors and contends that in view of a longer time scale in geological time, the current channel patterns and forms cannot be attributed to a dominant factor alone. Climate as a factor is central for the primary role of rainfall amount and seasonality in determining river regime. Most saliently humid hydrology differs significantly from arid hydrology and both are characterized by distinct channel pattern and forms. Topographical factors like altitude and slope changes, as well as geological factors like jointing and rock type should be discussed through examples like braided channels and karst hydrology that demonstrate the influence of these factors together with tropical climates. Attempts to make synoptic links to human actions like deforestation and engineering are possible but should always relate clearly to the hydrological concepts directly altering channel pattern.
2 (a) Explain the role of water in the development of soils in the semi-arid and
arid tropics. [12]
Indicative Content: Soil development begins with the physical and chemical weathering of rocks and regolith exposed to the atmosphere and to the action of water percolating down from the earth surface. Even though the semi-arid and arid tropics experiences general moisture deficit, there can still be the occurrence of rainfall when the ITCZ is overhead. Processes of calcification and salinization should be discussed to explain the role water plays in the development of soils in the semi-arid and arid tropics. Characteristics of thin soils and limited soil profile development should also be discussed to illustrate the largely restricted processes of weathering and soil formation.

2
(b) The distinctive fluvial and aeolian landscapes of the arid tropics are shaped primarily by the ambient climatic conditions. Discuss.
[20]
Indicative Content: While it is valid to assert that the characteristic dryness of the arid tropics helps to create distinctive aeolian and fluvial landscapes, it is also important to highlight that landforms found in such arid environments are also a product of their underlying geological structure. The examples of yardangs, dunes and loess can be used and discussed to illustrate this understanding. Yardangs are formed by both fluvial and aeolian processes and sand dunes and loess are essentially aeolian landforms. However, their development also requires specific geological and topographical conditions. Opportunities to make synoptic links include references to the factors of geological time and climate change in influencing the development of yardangs, dunes and loess.
3 (a) Explain how global divisions of labour have changed since the start of the
20th Century. [12]
Indicative Content: The notion of a global division of labour is founded on the observation that there is a geographical distribution of different forms of economic activity and production concentrating in different parts of the world, particularly along the division between what dependency theory and later world systems theory called the Core and the Periphery. The definition of the key phrase ‘global divisions of labour’ may include both the traditionally named NIDL, as well as the subsequent shifts in tertiary industries (what some term the ‘2nd global shift’). Key patterns observed should include the changes in the distribution of manufacturing activity between the core economies and the periphery economies, the emergence of the semi-periphery and the accompanying shifts in services. Explanation of the key driving forces behind the New International Division of Labour (NIDL) should take into account the technological forces enabling economic globalization, vertical disintegration of manufacturing production as well as corporate rationalization by TNCs to establish global production networks through offshoring and outsourcing of different stages of vertically disintegrated manufacturing production or service provision.
(b) With reference to examples, assess the role of international organisations in promoting development worldwide.
[20]
Indicative Content: The highly integrated and interconnected nature of the global economy today is one with multiple participants and stakeholders, and whose increasingly volatility and dynamism is as much influenced by free market forces as by the machinations and strategic planning of TNCs and national governments. The response should be prefaced by knowledge about the intended and potential role of international organisations such as global financial institutions: for regulation and promotion of trade, for lending and bolstering languishing economies, and for arbitration and accountability beyond the national scale. In recognizing that while international financial institutions like the IMF and the World Bank exist to promote development worldwide (largely through encouraging and regulating free trade), and have concretely intervened with such intentions, a critical evaluation also suggests that their influence has not promoted development universally, and may even have perpetuated the development gap that still exists in today’s global economy. Perceptive responses may discuss the unequal power between developing and developed member countries in deciding the rules of global governance.

3
Examples may include countries at lower levels of economic development for whom structural adjustment plans have been recommended following economic crises, and a balanced response would critically evaluate both positive and negative implications of these recommendations.
4 (a) Explain the environmental impacts of extractive industries in countries at low
levels of development.
[12]
Indicative Content: The extractive industry consists of any operations that remove metals, mineral and aggregates from the earth. Examples of extractive processes include oil and gas extraction, mining, dredging and quarrying. The value to society of the products of the extractive industry is undeniable. Nevertheless, despite their potential positive economic impacts, extractive activities tend to leave a strong environmental footprint that must be addressed. Discussions of the environmental impacts of extractive industries can include impacts on the natural ecosystem and habitat destruction, geomorphological changes to the surrounding landscapes, as well as pollution problems associated inappropriate surface disposal of waste rocks or ‘tailings’.
(b) ‘Natural resource endowments would enable developing countries to make the transition from underdevelopment to industrial ‘take-off’, just as they have done for developed countries such as Australia, the United States and the United Kingdom.’ (Walter Rostow, 1961). To what extent do you agree with this statement?
[20]
Indicative Content: At first glance, it seems intuitive that countries with natural resource abundance will have the comparative advantage and potential to break out of the cycle of poverty, develop through the five linear stages, and ultimately reach what Walter Rostow termed as ‘economic maturity’. However, many observers also believe that reliance on natural resources has adverse consequences for economic growth. Being richly endowed with natural resources can threaten a country’s long-term economic prosperity as natural resource-intensive economies grow slower over time than economies that are less natural resource-intensive. This is the so-called ‘resource-curse’ thesis as propounded by geographer Richard Auty in 1993. Essay response should include reasons for underperforming resource-rich countries as explained by the ‘resource-curse and also discuss the exceptions to the thesis. Opportunities to make synoptic links can include the different ways of thinking about development, role of the state and the need for good governance in the management of natural resources.

4
5 (a) Explain how human activities in countries at various levels of development are contributing to the enhanced greenhouse effect.
[12]
Indicative Content: The response should be founded on a technically sound definition of the enhanced greenhouse effect, not just in terms of the concept of ‘forcings’ essential for maintaining a net radiative surplus in the earth’s atmosphere and the key role of greenhouse gases, but also in acknowledging the central role of human activities in the adjective ‘enhanced’. While the essential part of the answer should cover the key forces driving the enhanced greenhouse effect (population growth and increasing affluence driving rising demand for energy, loss of carbon sinks to deforestation and land-use change), there should be discussion of the variation and differences between contributions from countries at different levels of development, illustrated using examples.
(b) Using examples, discuss the extent to which the pursuit of economic growth is compatible with the principles of sustainable development.
[20]
Indicative Content: While sustainable development is neatly defined in the Brundtland Report as ‘development that meets the needs of the present without compromising the ability of future generations to meet their own needs’, its applied meaning is often contested and ambiguous. Nevertheless, the fundamental ideas of ‘needs’ and ‘limitations’ should highlight that equity lies at the heart of this ideal and acknowledges that the earth has a carrying capacity imposed by the state of technology and social organization. The response should be built upon the following key ideas: - Sustainable development takes into account the environmental, social and economic needs
and limitations, and ‘trade-offs’ are often necessary - This is because the present model of development is founded on capitalist definitions of
economic valuation, based on a linear metabolism of resource extraction and consumption. - The existing mode of economic valuation is founded on financially measurable output and
does not necessarily factor in environmental costs and services - The extent to which the pursuit of economic growth is compatible with the principles of
sustainable development hinges upon whether the ‘trade-offs’ between economic development and environmental and social costs can be minimised.
Responses should outline possibilities of economic reform towards a ‘green economy’, with investment in innovation into alternative energy, application of principles of circular metabolism and proper valuation of goods and services to factor in environmental and social costs. Responses should acknowledge the inherent difficulties of such endeavors through examples of the differing agendas between countries at different levels of development. Case in point would be the difficulty of reaching consensus in multinational environmental agreements like the Paris Agreement.
6 (a) Explain how the concepts of ecological footprint and urban metabolism are
important in the understanding of sustainable urban development in cities with fast growing populations.
[12]
Indicative Content: At the urban scale, for a city to display the hallmarks of sustainable urban development, it should exhibit records of small ecological footprint, circular metabolism, as well as the ability to promote greater urban liveability, social equity and environmental justice. Hence, concepts of ecological footprint and urban metabolism are important in helping us to understand the ways and challenges of pursuing sustainable urban development in cities with fast growing populations.

5
Essay discussions should include an examination of the concepts of ‘ecological footprint’, ‘compact cities’, ‘linear vs circular urban metabolism’, and ‘sustainable urban development’. In brief, applying the understandings of concepts of ecological footprint and urban metabolism to cities enables a greater appreciation of the practices that could help to achieve sustainable urban development.
(b) Assess the effectiveness of strategies used to manage non-hazardous solid waste in a sustainable manner.
[20]
Indicative Content: Non-hazardous solid waste management has become one of the major environmental issues facing cities today. As urban populations increase, so too, has the amount of waste generated. While there currently exist many strategies, from recycling to incineration and landfills, to deal with the burgeoning problem of solid urban waste, few of them are truly sustainable, and the essay response should aim to fully evaluate the effectiveness of these waste management strategies. Strategies and concepts of ‘landfills’, ‘incineration’, ‘not-in-my-backyard syndrome’, ‘social and environmental injustice’, ‘Extended producer responsibility policies’, as well as ‘Reduce, Reuse and Recycle’ can be discussed. Synoptic thinking can be achieved by referring to ideas of sustainable development and climate change, as well as role of the state in promoting development.

1
RVHS H2 GEOGRAPHY PAPER 2 PRELIMS 2018
1 (a) Suggest a suitable research question for this investigation about infiltration
rates. [1]
Key criteria:
1. clearly defined 2. capable of being researched 3. situated within manageable spatial and/or time scales
Award 1m for any suitable research question. No marks if a hypothesis statement is given. e.g. How do raingardens impact infiltration patterns in urban areas in the tropics? (b) With reference to Resources 1 and 2, explain two potential risks associated with
carrying out this geographical investigation and how the group might minimise each risk.
[4] ‘Risk’ is defined as the threats to welfare and danger to life for the investigators. In the context, these may include: - Dangers associated with traffic because of proximity to the roads - The canal as a source of danger - Weather related risks (thunder storms, high mid-day temperatures)
Award 2m for each elaborated risk and proposal for precautionary measures (c) Referring to Resource 2, explain how the students used the equipment to
measure the infiltration rate at a data site.
[5]
1. Operational steps to using the double-ring infiltrometer and explanation of rationale a) Plunging infiltrometer up to limit of the ring lid b) Filling the outer ring to prevent lateral diffusion of water c) Filling up to a standardised level and noting the fall in water level on the ruled markings on the
infiltrometer for a standardised time. d) Refilling to the same level and repeating the measurement of water level fall in a standardised time
(to maintain standardised pressure on the soil) for the number of times necessary 2. Precautionary principles (minimial disturbance of soil structure, timing and reading)
a) Taking care to clear the sample site of irrelevant debris like rocks and litter which might compromise readings
b) Minimising disturbance of soil structure by single, clean action of inserting the infiltrometer c) Avoiding parallax error by ensuring perpendicularity of the infiltrometer
Point Marked: Award max 3m for pure description of steps without rationale (d) The students reflected that the findings might have been compromised by
intervening factors. With reference to Resources 1, 2 and 3, discuss how the process of data collection could be improved.
[7]

2
Indicative content: Intervening factors affecting accuracy / credibility of data:
1) Separation of data collection into 2 sittings compromises the comparability of the data collected. Ideal situation would have been collecting all data within the same sitting to ensure that relevant conditions like antecedent soil moisture are the same
2) random sampling might not have been the most suitable method for ensuring that the range of data collected is representative of the types of surfaces found along segments A and B respectively (many types of surfaces)
3) Difficulties of measuring in a planted bed
Suggestions for improvement: - Improving sampling method (stratified) - Improving data collection procedure (take at one sitting, postpone and repeat fieldwork)
Levels marked:
Level Marks Descriptors
3 6-7 o Response demonstrates accurate knowledge of criteria for accurate data collection methods, both of the use of the infiltrometer and the sampling technique, and critically evaluates the described process issues for both accuracy and/or reliability.
o Recommendations are given for addressing the issues. o Reflects a good understanding of the context of the investigation by citing relevant
information from the resources and preamble 2 3-5 o Response demonstrates good knowledge of data collection methods. Provides an
explanation of issues relating to reliability and/or accuracy with some reference to possible improvements. Description may be limited in depth and detail or apply mostly to only one set of measurements
o Brief mention is made of recommendations to address the issues o Some reference is made to relevant information from the resources and preamble.
1 1-2 o Response shows superficial knowledge of relevant data collection methods. Some
reference is made to issues with accuracy and reliability but may recommend inappropriate or irrelevant improvements or provide incorrect explanation of methods.
o Response may be of limited relevance to the given context. Little or no reference is made to resources.
(e) Discuss the value of this geographical investigation and its potential contribution
to the management of urban runoff in Bukit Batok.
[8]
Indicative content: Value of the investigation is in validating the effectiveness of the raingarden as a SUDs (sustainable urban drainage system) strategy for managing pluvial flooding. Findings of the investigation can be used by PUB to refine and improve on their plans or to extend their plans to the rest of the canal. Evaluation of the limited scope of the findings and suggestions on further extensions of investigation (e.g. extending sample to different ground surfaces, investigation into canal discharge patterns, water testing for quality of raingarden effluents, longitudinal studies of infiltration rates) Levels marked:
Level Marks Descriptors 3 7-8 Response demonstrates a clear knowledge and understanding of the context in the
question. Uses relevant, detailed and accurate factual information and conceptual understanding. Reflects strong critical thinking skills and may include perceptive insights for the strongest responses. Source(s) is well used to support the response.
o Provides a logical and well-developed evaluation well founded on evidence and/or different viewpoints.

3
2 4-6 A satisfactory response which is generally sound and contains relevant points, but may not always focus on the context in the question. Uses factual information and conceptual understanding that is generally appropriate to the given context but lacks detail and may contain some inaccuracies. Displays general critical thinking skills. Source(s) is used to support parts of the response.
o Provides an evaluation, which may be limited in depth and sufficient elaboration in some parts.
1 1-3 Response shows a poor understanding of the context in the question. Uses basic factual information and conceptual understanding which has some, but limited relevance to the question. Source(s) is not used or not accurately used to support the response.
o Provides little or no evaluation
0 0 No creditworthy response.
Theme 1: Tropical Environments Tropical Climates
2 (a) Compare the global pattern of atmospheric pressure in December with that
in June as shown in Resource 4.
[3] Award 1m for each comparison point with citation of example
• Latitudinal shifts in high pressure and low pressure centres between December and June - Inversion of high and low pressure - Persistence but latitudinal shift of subpolar pressure centres. • land-sea differences in shifts of pressure centres
(b) With reference to Resource 5, explain the seasonal change in the earth’s
radiation balance.
[4] Award 2m for stating key seasonal changes to zones of radiative surplus and deficit, and citing evidence from Resource 5 Award 2m for explanations of changes:
- Seasonal shift of subsolar point due to tilt of the earth’s axis in relation to plan of ecliptic. - Seasonal shift of Hadley cell and ITCZ providing cloud cover - Differences between hemispheres in terms of land-sea surface difference of albedo
(c) Referring to Resources 4 and 5, discuss the extent to which atmospheric
pressure may be attributed to solar heating.
[7] Indicative content:
- Solar heating affects atmospheric pressure through influence of the atmospheric temperature range and seasonality. Where the earth’s surface receives more intense and prolonged solar heating, temperature profiles are generally high, and this in turn contributes to low atmospheric pressures due to thermal expansion, increased buoyancy and atmospheric instability due to convective uplift.
- This is supported by the correspondence between the latitudinal range of radiative surplus (a result of higher insolation) and lower atmospheric pressure shown in resources 4 and 5.
- However, atmospheric temperature is not merely governed by the amount of radiative input an area receives. Other factors affecting the ability of surfaces to trap or reflect heat, including albedo of glaciers and low level clouds affecting counterradiation
- Atmospheric pressure may be influenced by regional influences of temperature such as upwelling of cold currents.

4
Levels marked:
Level Marks Descriptors
3 6-7 Response adequately explains link between atmospheric pressure, temperature and solar heating. Evaluation is made of the relative importance of solar heating vis-à-vis regional factors. Located examples are raised from the resources or beyond for illustration to good effect
2 3-5 Response explains link between atmospheric pressure, temperature and solar heating. Other factors besides solar heating may be mentioned but may not be well elaborated and applied to the question (ie evaluated according to the question) Located examples are superficially mentioned
1 1-2 Response shows superficial knowledge of link between atmospheric pressure, temperature and solar heating. Little mention of other factors. Little or no reference to resources for examples.
(d) Comment on the periodicity of El Niño events from 1950 to 2018 according
to the Oceanic Niño Index in Resource 6.
[3] Award 1m for each observation supported with cited detail from resource 6
- El Nino events have a wide range of periodicities: • Strong events have a longer periodicity • Moderate events have a shorter periodicity
- El Nino events generally alternate with La Nina • However, some periods have persistent El Nino or La Nina with slight perturbations
(e) With reference to Resources 6 and 7, discuss the validity of the notion that
El Nino Southern Oscillation (ENSO) related events aggravate the impacts of climate change as much as they are affected by it.
[8]
Indicative content:
- El Nino Southern Oscillation (ENSO) events refer to departures from regional climatic patterns and phenomena associated with the expected Walker circulation patterns, such as exceptional high temperatures and rainfall in the western South America, and drought conditions in Indo-Australia.
- Resource 7 also shows worldwide climatic anomalies that may be associated via teleconnections with the moderate La Nina event as seen in Resource 6
- Climate change impacts range from generally higher temperatures, which are amplified regionally by positive feedback such as arid desiccation, to new extents of glacial retreat. However climate change impacts also include more extreme flunctuations of seasonal temperatures (polar vortex and heat waves).
- The response should discuss the extent to which the phenomena outlined in Resource 7 can be attributed to climate change and to the associated ENSO event
Levels marked: Level Marks Descriptors
3 7-8 Response demonstrates a clear knowledge and understanding of the context in the question. Uses relevant, detailed and accurate factual information and conceptual understanding. Reflects strong critical thinking skills and may include perceptive insights for the strongest responses. Source(s) is well used to support the response.
o Provides a logical and well-developed evaluation well founded on evidence and/or different viewpoints.
2 4-6 A satisfactory response which is generally sound and contains relevant points, but may not always focus on the context in the question. Uses factual information and conceptual understanding that is generally appropriate to the given context but lacks detail and may contain some inaccuracies. Displays general critical thinking skills. Source(s) is used to support parts of the response.

5
o Provides an evaluation, which may be limited in depth and sufficient elaboration in some parts.
1 1-3 Response shows a poor understanding of the context in the question. Uses basic factual information and conceptual understanding which has some, but limited relevance to the question. Source(s) is not used or not accurately used to support the response.
o Provides little or no evaluation
0 0 No creditworthy response.
Theme 2: Development, Economy and Environment FDI, TNCs and GPNs
3 (a) Describe the changes in FDI shown in Resource 8. [3]
Changes can be observed in the form of: - Increase in number of FDI - Scale of FDI - Spatial spread of sources of FDI
Award 1m for any changes observed supported with evidence from Resource 8
(b) Suggest reasons for the changes you have described in (a). [5]
Indicative content - Acceleration of the process of globalisation and the NIDL - Comparative advantages in manufacturing offered by China - FDI policies and favourable investment climate offered by China
Levels marked:
Level Marks Descriptors 3 5 o Response demonstrates a wide-ranging and comprehensive
coverage of reasons for the changes described in (a). o Substantiating example(s) are also well incorporated into
response.
2 3-4 o Response demonstrates a decent coverage of reasons for the changes described in (a) with the use of resources to support explanations.
o Explanations, however, may lack some depth or detail.
1 1-2 o Response shows some to little knowledge of reasons for the changes described in (a).
o Response may be too generic and has limited reference to the Resources.
(c) Using evidence from Resource 9, describe the characteristics of the industrial estate which make it an attractive location for foreign transnational corporations (TNCs).
[4]
Possible answers include: - Good road access and communication network - Existence of environmental services like reservoir, water treatment plants,
incineration plant and landfill for waste disposal

6
- Strong presence of other companies like Toyota and Isuzu - Siting of the export processing zone, the IEAT office and Customs office, as well
as the residential area - Availability of open spaces surrounding the industrial estate
Award 1m for any descriptions supported with evidence from Resource 9
(d) Describe and suggest reasons for BMW’s GPN as illustrated in Resource 10.
[4]
Possible answers include:
- Geographical proximity - Avoidance of import tariffs - Historical ties to outsourcing locations - Comparative advantages like cheaper rent and labour cost
Award 1m for any valid description and explanation
(e) Using Resources 8, 9 and 10, as well as your own knowledge, recommend whether BMW should consider changing its current GPN in favour of Asian countries like China and Thailand. Justify your answer.
[9]
Indicative content In this decision-making question, there are no wrong answers. Candidates should combine their knowledge and understanding of the global economy with the evidence provided in the resources to make a decision. A case can be made for BMW to stick with its current GPN or pivot towards the Asian market. Possible considerations include: o The current geo-political situations of the European Union. o Market potential and trajectory of growth of the Asian countries including China and
Thailand. o The profit-maximising tendencies of TNCs like BMW. Marked by levels on the generic mark scheme.
Theme 3: Sustainable Development Urban Reimaging in the UK
4 (a) With reference to Resources 12 and 13, which urban area is considered
more economically successful? Explain your answer. [4]
Reading. Possible responses:
- Comparisons between the number of professionals, skilled trades, caring and leisure workers
- Comparisons between the percentage of economically active people in Reading and Middlesbrough
Award 1m for each comparison/ explanation supported with evidence from Resources 12 and 13.
(b) Using Resources 14, 15 and 16, which urban area might be more in need of urban reimaging? Explain your answer.
[5]

7
Indicative content Middlesbrough. Possible responses:
- The perceived industrial image of Middlesbrough - Population decline in Middlesbrough - Findings from the national well-being survey shown in Resource 16
Levels marked:
Level Marks Descriptors 3 5 o Response demonstrates accurate knowledge and a good
understanding of the concept of urban reimaging. o Good use of the resources with supporting data used to back up
decision and explanation. o Response is clear and shows focussed and detailed comparison.
2 3-4 o Response demonstrates decent knowledge and understanding of the concept of urban reimaging.
o Use of resources present in response but lack accuracy. o Response may lack clarity, detail, and relevance to question.
1 1-2 o Response shows limited understanding of the concept of urban reimaging.
o Response lacks detail, clarity and focus on the question with limited use of the resources.
(c) With reference to Resource 17, evaluate the strengths and limitations of such rebranding strategies.
[5]
Indicative content Possible strengths:
- Aesthetic appeal of the logos and slogans - Eye catching and catchy
Possible Limitations:
- Over-exaggeration - Unrepresentative stereotype
Levels marked:
Level Marks Descriptors 3 5 o Response demonstrates accurate knowledge and a good
understanding of the strengths and limitations of the rebranding strategies shown in Resource.
o Good use of the resource to support discussions. o Response is clear and shows focussed and detailed evaluation.
2 3-4 o Response demonstrates adequate knowledge and understanding of the strengths and limitations of the rebranding strategies.
o Use of resource present in response but lack accuracy. o Response may lack clarity, detail, and relevance to question.
1 1-2 o Response shows some knowledge and understanding of the strengths and limitations of the rebranding strategies.
o Use of the resource is limited. o Response lacks detail, clarity and focus on the question.

8
(d) Apart from what is shown in Resource 17, describe other strategies to improve the image of urban places.
[3]
Possible responses:
- Advertising - Hosting of major sporting or cultural events - Improving of city infrastructure
(e) Would urban reimaging necessarily improve the liveability of urban places?Discuss with reference to the resources and your own knowledge.
[8]
Indicative content Response should exhibit a strong understanding of concepts of urban liveability and urban reimaging. Contextualised examples should also be included to substantiate arguments and references to the various resources should be made. In short, whether an urban location is liveable or not is largely determined by the extent to which the place satisfies the physical and psychological needs and wants of its residents. Thus, urban reimaging efforts must take note of the above to meet the differing needs of the different social groups (original residents, newcomers, youths, the elderly, the disabled, etc) in the city. Levels marked:
Level Marks Descriptors 3 7-8 o Response demonstrates accurate and comprehensive knowledge of
the links between the concepts of urban liveability and urban reimaging.
o Good use of the resources is shown to support arguments put forth.
o Substantiating example(s) are also well incorporated into response.
2 4-6 o Response demonstrates some good knowledge of the concepts of
urban liveability and urban reimaging. o Explanations, however, may lack some depth or detail, and/or use
of the resources.
1 1-3 o Response shows some to little knowledge of the concepts of urban liveability and urban reimaging.
o Response may be too generic and has limited reference to the Resources.

1
© SAJC 2018 9751/01/18 Prelims
ST ANDREW’S JUNIOR COLLEGE J2 Prelims Higher 2
Geography Paper 1 Structured Essay Questions Additional Materials: Answer Paper World outline map
9751/0111 September 2018
3 hours
READ THESE INSTRUCTIONS FIRST Write your name and class on all the work you hand in. Write in dark blue or black pen on both sides of the paper. You may use a soft pencil for any diagrams, graphs or rough working. Do not use paper clips, highlighters, glue or correction fluid. Begin each question on a fresh page. Answer one question from each section. You should make reference to appropriate examples studied in the field or the classroom, even where such examples are not specifically requested by the question. Diagrams and sketch maps should be drawn whenever they serve to illustrate an answer. The world map may be annotated and handed in with relevant answers. You are reminded of the need for good English and clear presentation in your answers. At the end of the examination, fasten all work securely together. The number of marks is given in brackets [ ] at the end of each question or part question. You are advised to spend not more than 1 hour on each section.
This document consists of 2 printed pages.
[Turn Over]

2
© SAJC 2018 9751/01/18 Prelims
Section A – Tropical Environments
Answer one question from this section
1 (a) Explain the variations in rainfall patterns within the tropics. [12] (b) Evaluate the extent to which erosion by water is responsible for the formation of landscapes
in the arid tropics. [20] 2 (a) Using one or more diagrams, explain the relationship between velocity, sediment size and
fluvial processes. [12]
(b) To what extent is climate the most important factor in the formation of different channel patterns in the humid tropics? [20]
Section B – Development, Economy and Environment
Answer one question from this section
3 (a) Explain the uneven levels of development in one region you have studied. [12] (b) The Millennium Development Goals (MDGs) have at times been described by their critics as
“worthless”. How far do you agree with such a criticism? [20] 4 (a) Explain the ways extractive industries are different from other industries. [12] (b) To what extent are the impacts of extractive industries only environmental? Support your
answer with reference to low income countries. [20]
Section C – Sustainable Development
Answer one question from this section 5 (a) Explain what is meant by greenhouse effect and how human activities may affect its operation.
[12]
(b) ‘Adapting to the effects of climate change is more useful than mitigating them.’ Discuss the validity of this view with countries at low levels of development. [20] 6 (a) Explain why traffic congestion in rapidly growing urban areas needs to be eased. [12]
(b) Assess the extent to which strategies to help improve urban liveability for the elderly can be
considered effective. [20]

1
© SAJC 2018 9751/02/18 Prelims
ST ANDREW’S JUNIOR COLLEGE J2 Prelims Higher 2
Geography Paper 2 Data Response Questions INSERT
9751/0213 September 2018
3 hours
READ THESE INSTRUCTIONS FIRST This Insert contains all the Resources referred to in the questions.
This document consists of 11 printed pages.
[Turn Over]

2
© SAJC 2018 9751/02/18 Prelims
Resource 1 for Question 1
Photographs showing the confluence of the Klang River and Gombak River in Kuala Lumpur, Malaysia
1977 Present

3
© SAJC 2018 9751/02/18 Prelims
Res
ou
rce
2 fo
r Q
ues
tio
n 1
Map
sh
ow
ing
th
e lo
cati
on
of
the
con
flu
ence
of
Kla
ng
Riv
er
and
Go
mb
ak R
iver
an
d i
ts v
icin
ity

4
© SAJC 2018 9751/02/18 Prelims
Resource 3 for Question 1
The flood risk questionnaire used by the students
1. How long have you living and/or working in this area?
Less than 1 year 1─5 years 6─10 years 11─20 years more than 20 years
2. On a scale of 1 (not at all concerned) to 4 (very concerned), how concerned are you about the risk of flooding in this area?
1 2 3 4
3. From what you can remember, has this area ever been flooded in the past? YES/NO
If YES, please tell us briefly when, and what caused the flood?
4. On a scale of 1 (very low) to 4 (very high), what is your current understanding of the risk of this area being affected by flooding?
1 2 3 4
5. What do you think is the most likely way that you might be affected by flooding? (tick one)
River/surface water overflowing Sewers overflowing
Water flowing over the land/down roads
Others: (please elaborate)
Water rising out of the ground
6. Which of the following measures do you think would be the best way to minimise future flood risks, without stopping further development in this area? (tick one)
Build more/larger sewers Plant more trees
Make more surfaces permeable (so rain/floodwater can seep through)
Create more green spaces in new developments to absorb rain/floodwater
Build flood barriers at key points along the river
Others: (please elaborate)
7. For recording purposes only and if you don’t mind, what is your postcode/road name?
___________________________________________________________________________
Thank you for your help.
Without asking, record the following:
Gender: M/F
Age range: 16─25 26─35 36─50 50─64 65+

5
© SAJC 2018 9751/02/18 Prelims
Resource 4 for Question 2
Rainfall Forecast of Tropical Cyclone Megi, 27 September 2016
Rainfall (inches)

6
© SAJC 2018 9751/02/18 Prelims
Resource 5 for Question 2
Factors affecting the development of a tropical cyclone
Resource 6 for Question 2
A mass movement event triggered after Cyclone Megi

7
© SAJC 2018 9751/02/18 Prelims
Reso
urce
7 fo
r Que
stio
n 3
Wee
kly
air c
argo
rece
ived
regu
larly
at Z
arag
oza

8
© SAJC 2018 9751/02/18 Prelims
Reso
urce
8 fo
r Que
stio
n 3
Wee
kly
air c
argo
sent
regu
larly
from
Zar
agoz
a

9
© SAJC 2018 9751/02/18 Prelims
Resource 9 for Question 3
An extract from an online publication of a reputable news agency Zara Accused of Alleged 'Slave Labour' In Brazil 17 Aug 2011 Spanish high-street retailer Zara has been accused of allegedly accepting slave-labour working conditions in more than 30 of its outsourced plants running in Brazil. During an episode of an investigative TV show, reporters visited a factory where Bolivian immigrant workers were caught in slave-like conditions in garment production for the company. In one of the workshops, a Bolivian worker explained to the reporter that a pair of Zara jeans – which in Brazil is sold for roughly R$200 (US$50) – has a working cost of R$1.80. Such a sum is divided equally between all the people involved in the production system, which on the case of the pair of jeans takes about seven individuals. The workers average monthly income of about R$900 for a shift of no less than 12 hours. Working safety conditions found in these factories were also critical. A fire extinguisher had an expiration date of 1998.
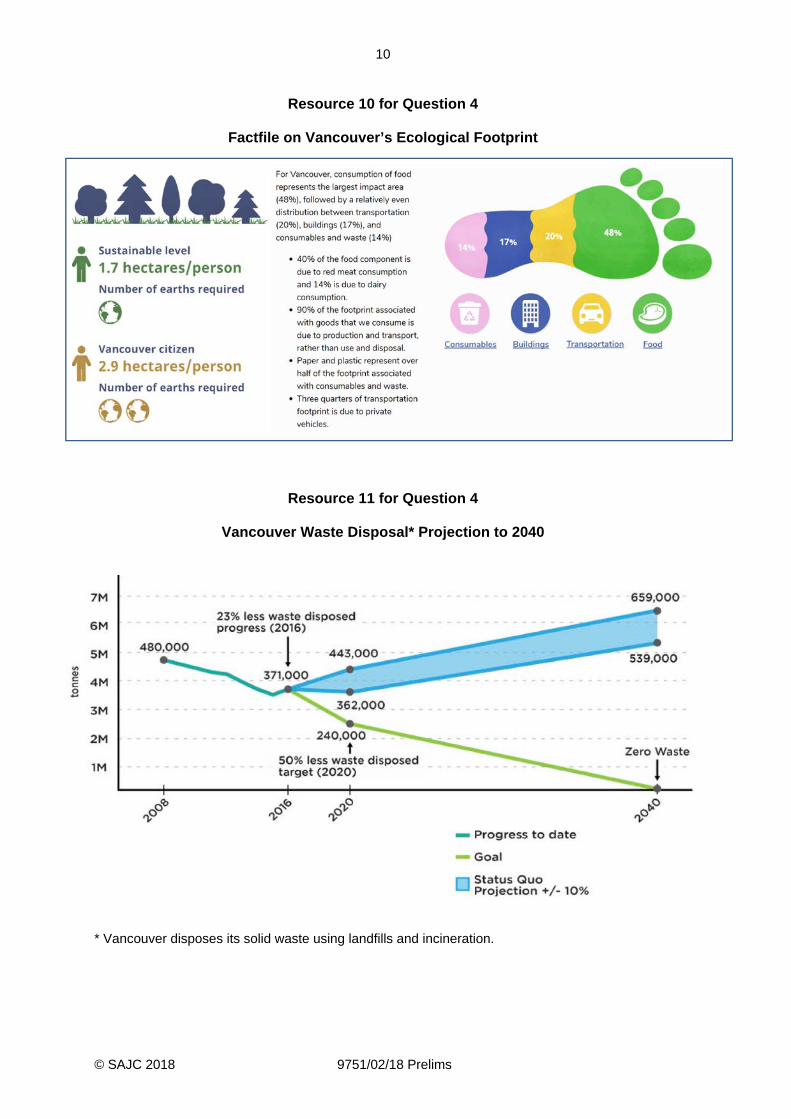
10
© SAJC 2018 9751/02/18 Prelims
Resource 10 for Question 4
Factfile on Vancouver’s Ecological Footprint
Resource 11 for Question 4
Vancouver Waste Disposal* Projection to 2040
* Vancouver disposes its solid waste using landfills and incineration.

11
© SAJC 2018 9751/02/18 Prelims
Res
ou
rce
12 f
or
Qu
esti
on
4
P
ost
ers
use
d t
o e
nco
ura
ge
was
te r
edu
ctio
n
A ‘g
reen
bin
’ he
lps
to re
cycl
e fo
od s
crap
s by
tu
rnin
g th
em in
to
com
post
to b
e us
ed a
s fe
rtilis
er.

SAJC 2018 Prelims H2 Geography Mark Scheme
© SAJC 2018 9751/01/18 Prelims_Page 1
Section A – Tropical Environments
Answer one question from this section
1 (a) Explain the variations in rainfall patterns within the tropics. [12] Better responses will be able to integrate the use of variations in annual total rainfall, seasonality in rainfall patterns, sketches of climograph or the use of world map may also be used to support and illustrate the variations in rainfall patterns in the tropics. The predominant mechanism influencing rainfall—seasonal migration of the ITCZ and the resulting movement of the Hadley cell must be explained in detail. The effect of latitude on uneven heating can also be used to explain the presence of convectional rainfall. Other more localised factors like topographical barriers, continentality, ocean currents can also be used to explain variations. Indicative content: (i) Migration of the Hadley Cell
a. Influence of the Inter tropical convergence zone b. Influence of Subtropical High
(ii) Topographical Barriers
(iii) Effect of Continentality
(b) Evaluate the extent to which erosion by water is responsible for the formation of landscapes
in the arid tropics. [20] Fluvial erosion is not entirely responsible for the formation of arid landscapes, instead the role of Aeolian processes, and specifically erosion and deposition are not to be neglected. The two mechanism tend to work symbiotically, although most landforms are indeed dominantly a result of either fluvial or Aeolian processes. Rills, Gullies & wadis are dominantly the result of fluvial erosion (rill and gully erosion), while yardangs, dunes and deflation hollows are the dominantly the result of Aeolian processes. Better responses will be able to identify how both sets of processes are interlinked in which, one might aid the other e.g. How gully erosion accelerates the initial stages of corridor formation in yardangs. Weakest response would go with simplistic and unbalanced argument on the importance of either water or wind.

SAJC 2018 Prelims H2 Geography Mark Scheme
© SAJC 2018 9751/01/18 Prelims_Page 2
2 (a) Using one or more diagrams, explain the relationship between velocity, sediment size and fluvial processes. [12]
The Hjulstrom curve ought to be used to illustrate the relationship between velocity, sediment size and fluvial processes. Answers could be organised according to sediment size or fluvial processes. Better responses will also be able to draw upon specific fluvial erosion, transportation and depositional process to support responses. (b) To what extent is climate the most important factor in the formation of different channel
patterns in the humid tropics? [20]
Responses ought to recognise that beyond the influence of climate, there are also contributing factors leading to the formation of different channel patterns, specifically sediment load and velocity that can cause the river to be in disequilibrium, make alterations to the channel morphology via different channel processes. A comparison between the total annual rainfall across different climatic types should also be brought in to support explanations. Arguments could be made recognising that given climate affects discharge and hence, the capacity and competence of the channel, it is indeed comparatively important. Indicative content: Argument 1: Given that climate determines discharge, the river therefore responds according to the changes in the discharge, which favours the development of different channel patterns. Argument 2: Other factors like the sediment load is also important in the formation of the different climatic types.
• Favouring meandering channels – Mixed loads comprising mainly clays, silt (due to persistent flooding) and some gravels will allow for the shape of the meanders to be maintained given that banks are more cohesive.
• Favouring braided channels – Large bed loads and channels with banks composed of incoherent sands and gravels. These materials are easily eroded during periods of high discharge, further adding to the sediment load, which may have been contributed by weathering and/or mass movement on the slopes flanking the channels.

SAJC 2018 Prelims H2 Geography Mark Scheme
© SAJC 2018 9751/01/18 Prelims_Page 3
Section B – Development, Economy and Environment
Answer one question from this section
3 (a) Explain the uneven levels of development in one region you have studied. [12] Remarks
• It is important to consider the scalar dimension in this question, i.e. region. o However, the interpretation of ‘region’ can be broad. It can be strictly geographical, such
as Asia, or SE Asia, or Europe, or Africa. Or it can be more conceptual, such as within the South in the N-S divide (so, LDCs vs NIEs), or within a trade bloc (such as AFTA).
o What not to do: Treat the world as one big region, or look at only one country. • The emphasis is unevenness of development, not merely low levels of development. Strong
responses would explain why some countries are poorer or richer than others. • Reference to measurements of development such as HDI, MPI, GDP, GINI, etc will help
illustrate the unevenness of development in the chosen region, providing the context for the explanation.
Indicative content
• An opportunity to consider factors in an interactive manner in several dimensions. For example, when explaining low levels of development: o physical e.g. extreme environments, remoteness, water issues, land degradation, hazards
such as droughts and floods o social e.g. tribalism, elites, population pressure, AIDS o economic e.g. extreme poverty, indebtedness, lack of funds, diversion of funds towards
other priorities, inflation, landlessness o political e.g. instability, breakdown in governmental structures, corruption, inability to cope.
• Concepts to explain development levels may also be used effectively here. These include core-periphery, dependency theory, and resource-curse thesis.
(b) The Millennium Development Goals (MDGs) have at times been described by their critics as
“worthless”. How far do you agree with such a criticism? [20] Indicative content
• The MDGs that ran its course from 2000 to 2015 helped to raise development in several areas and in different regions to some extent.
• Overall, it would be overly harsh to describe this project as “worthless” as the MDGs registered some success. The MDGs had been a guiding force in helping to raise development globally. Without these goals, there might be less concerted effort in ensuring development reaches the countries at low levels of development, and no motivation or aid given to governments of these countries. Its mixed success has also set the foundation on which SDGs are built.
• Thus, the “worth” of MDGs should be more fairly acknowledged and criticisms taken constructively as reminders on how improvements can be made. Labelling these as “worthless” is unfair and extreme, sweeping aside years of hard work by various organisations and respective governments who have played their part to raise development in areas that need this most.

SAJC 2018 Prelims H2 Geography Mark Scheme
© SAJC 2018 9751/01/18 Prelims_Page 4
4 (a) Explain the ways extractive industries are different from other industries. [12] Remarks and indicative content
• This question is about characteristics of extractive industries, but not an invitation to simply describe or list them. These would include (i) locational specific (ii) capital and technology intensive (iii) a mixture of large private and state-owned firms, although the dominance of each may differ between sectors
• There is a need to explain these characteristics vis-à-vis other industries, such as service and manufacturing.
(b) To what extent are the impacts of extractive industries only environmental? Support your
answer with reference to low income countries. [20] Indicative content
• There can be no doubting that extractive industries involve a range of environmental impacts Many examples suggest that the environmental impact may be so severe that the regenerative capacity of nature is compromised, especially in environmentally sensitive areas.
• However, when considering the study of extractive industries across the syllabus, including and beyond Topic 2.2, the impacts of extractive industries cannot only be environmental, but social and economic as well.

SAJC 2018 Prelims H2 Geography Mark Scheme
© SAJC 2018 9751/01/18 Prelims_Page 5
Section C – Sustainable Development
Answer one question from this section 5 (a) Explain what is meant by greenhouse effect and how human activities may affect its operation.
[12] Indicative content
• Explain, using diagrams, how greenhouse gases trap long wave radiation emitted from ground surfaces. o The main greenhouse gases are water vapour, carbon dioxide, methane, nitrous oxide. o They are particularly effective in absorbing outgoing (terrestrial) long wave radiation
(LWR). Whilst most occur naturally, there have been significant increases in the past century or so in gases such as CO2 and N2O due to industrialisation.
• Human activities affect this effect by increasing the greenhouse gases in the atmosphere, and reduction of carbon sinks, hence enhancing the greenhouse effect, whereby SWR relatively easily passes through the atmosphere whilst outgoing LWR is effectively trapped within the atmosphere leading to global warming. Global warming refers to the increase in the average temperature of the Earth’s atmosphere and oceans.
• Causes of increased greenhouse gases (not merely CO2) include: o landuse changes (e.g. agriculture, deforestation and industrialisation), o fossil fuel burning, o reduction in carbon sink, etc
(b) ‘Adapting to the effects of climate change is more useful than mitigating them.’ Discuss the validity of this view with countries at low levels of development. [20] Remarks and indicative content
• Responses to the impacts and risks of climate change may be categorised as mitigation or adaptation.
• According to IPCC, mitigation measures are “human intervention to reduce the sources or enhance the sinks of greenhouse gases”. Hence, these aim to reduce the severity of the impacts brought about by climate change. If we accept the scientific consensus that global warming is due mainly to an increased concentration of greenhouse gases, then the reduction of these gases in the atmosphere must be a primary management strategy.
• Adaptation measures form “the process of adjustment to actual or expected climate and its effects”. Hence, these help societies to live with the impacts of climate change, so as to become more suited to a changing environment.
• Both mitigation and adaptation are complementary, so they are often, and should be, adopted together. They represent a two-pronged approach to the challenge of climate change.
Indicative content • Argument 1: Mitigation is more useful than adaptation if we take a long-term view on
managing climate change.
• Argument 2: Mitigation measures have seen varied levels of success, however. Even when mitigation measures work well, their effectiveness will only be observed later. Countries today, especially low income ones, experiencing the effects of climate change must take action now to deal with them. Hence, adaptation measures are important, because these are about the ‘here and now’.

SAJC 2018 Prelims H2 Geography Mark Scheme
© SAJC 2018 9751/01/18 Prelims_Page 6
6 (a) Explain why traffic congestion in rapidly growing urban areas needs to be eased. [12] Remarks
• This is a question on negative impacts of traffic congestion, in the context of ‘rapidly growing urban areas’, which will be best exemplified by urban areas in less developed countries.
• The best answers will classify them into types and will use examples to illustrate. Good marks will be awarded to those who see the range of problems and can exemplify in some cases, paying attention to the severity and scale of the problems (and therefore needs easing)
Indicative content
• Environmental: noise and air pollution • Economic: loss in productivity, cost of road maintenance • Social: time loss with loved ones and with oneself, health effects, stress, etc
(b) Assess the extent to which strategies to help improve urban liveability for the elderly can be
considered effective. [20] Indicative content
• The response ought to establish a good understanding of urban liveability, which is defined as a relative term whose precise meaning depends on the place, time and purpose of the assessment and on the value system of the individual assessor. As such, for the elderly, urban liveability would differ from that of other urban dwellers (differential liveability).
• The strategies to improve liveability can be assessed for effectiveness can be based on the intent on which these were designed, and/or also on whether they have indeed served their purpose upon implementation. Response ought to be balanced and consider how some needs/demands are relatively easier to address than the others, before coming to a weighed assessment on the relatively effectiveness thus far. Evaluation on how the place, and socio-economic differences influencing the extent of success/effectiveness may also be examined. Reference to examples in UK, Singapore, Japan, etc will be essential.

SAJC 2018 H2 Geography Paper 2_Mark Scheme_pg 1
© SAJC 2018 9751/02/18 Prelims
Section A
Theme 4: Geographical Investigation
1 (a) With reference to Resource 1, describe the main changes made to the river channel,
and explain how these are meant to reduce flooding. [5] Changes Reduce flooding because… • Vegetation on the river
banks have been removed, and replaced by concrete [1m]
Speeds up the flow, such that flood waters can be removed quickly (i.e. more efficient) downstream: • Reduction of friction between water and the
banks (i.e. lowers roughness) • Concrete lining prevents bed or bank erosion,
lowers sediment load of the river [2m]
• The river has been widened (note that the natural river banks have been “pushed back” to closer to the buildings) [1m]
• Capacity of the river has been increased, allowing more water to be contained within the channel, helping to prevent bankfull discharge from being exceeded
[1m]
(b) With the help of Resources 1 and 2, suggest a research question for the group to
guide them in their investigation, and briefly explain why it is of a suitable scale. [3]
Possible research question: [1m] • To what extent has the channelisation at the confluence of Rivers Klang and
Gombak reduced the perception of flood risk among users of the area in its vicinity? Considerations: [not creditable directly, but must be reflected in the research qn] • Fixed variable – channelisation • Variable to be tested – perception of flood risk • Where? – Confluence of the rivers • Who? – Users of the area in the vicinity of the confluence (defined here as within
300m radius)
Why it is of a suitable scale: [2m] • Geographical area is small, only 300m radius, which is a little over 0.28km2 • There is sufficient resources in terms of manpower (20 students) that can be
divided into enough teams (5 teams of 4) to be spread out within this area • A total of 4 hours over two evenings is reasonable amount of time to survey 50
members of the public (average one team surveys 5 respondents every evening)
(c) With the help of Resource 2, outline the steps necessary for the students to obtain a representative sample they require for the survey. [4]
There is no fixed way of sampling, but explanations should be given for the suggested approach. Considerations should include: • Where to conduct the survey (e.g. stratified sampling to select five locations based
on characteristics such as distance from the confluence; landuse; etc) • Who to find as respondents (e.g. a blend of quota and convenience sampling to
obtain sampling profile that is reflective of actual population by age, gender, etc)

SAJC 2018 H2 Geography Paper 2_Mark Scheme_pg 2
© SAJC 2018 9751/02/18 Prelims
Level Marks Descriptors 2 3-4 Response demonstrates good to very good knowledge of sampling
method(s). Outlines a clear plan with reference to data collection, methods, and may consider limitations. Response is relevant to context of question but may lack clarity and coherence for lower end of the level.
1 1-2 Response demonstrates limited or no knowledge of sampling methods. Outline of method is limited and may not refer to one or more of the facets of an investigation in their outline plan. Much of the response may not be relevant to context of question.
0 0 No creditworthy response.
(d) Explain one strength and one limitation of the data that will be collected using the questionnaire shown in Resource 3. [4]
Strengths may include: [Any one strength well-explained, 2m] • Breadth of coverage – perception of risk (Q2 to Q4), cause (Q5), suggestions on
mitigation measures (Q6), profile of the respondents (Q1, Q7 and items at end) • Clarity of questions – generally clear, unlikely to cause misunderstanding and
hence collect invalid and unreliable information Limitations may include: [Any one limitation well-explained, 2m] • There was no question on comparing between the before and after of the
channelisation efforts. This is a major limitation because the investigation was intended to investigate whether flood risks have been reduced because of channelisation.
• There is an assumption that respondents are familiar with the mechanisms of flooding in the area (see Q5) and thus be able to identify solutions (see Q6)
(e) Evaluate this investigation about flood risk in the area shown in Resources 1 and 2,
and explain how it could be improved and extended. [9] Indicative content: Strengths • Flood risk is more commonly understood in terms of whether a river floods frequently and
the magnitude of the floods. Investigating through the perceptions of the public is often overlooked, so this investigation will contribute a very useful piece of information from the users’ views.
Limitations • However, studying only the perception of the public makes it a very narrow study. Flood
risk of an area extends beyond perception of the public. • Difficult to obtain perceptions of respondents who have lived in the area before and after
channelisation. Improvements and extension • To more fully meet the investigation’s objective to ascertain flood risk of the area, there
are other considerations, including flood recurrence history stretching to in the 1970s, climatic data, landuse change over time, infiltration rates, etc
• Flood risk study could consider the various social, economic and environmental costs that could be brought to the area
• Channelisation in this area may result in flooding further downstream, so a study can be carried out for lower stream areas.

SAJC 2018 H2 Geography Paper 2_Mark Scheme_pg 3
© SAJC 2018 9751/02/18 Prelims
Theme 1: Tropical Environments
Cyclone Megi and Mass Movement in the Tropics
2 Resource 4 shows the forecasted rainfall for a region in East Asia, following the predicted path of Cyclone Megi in September 2016. Resource 5 outlines the various factors that affect the development of a tropical cyclone. Resource 6 shows rescue efforts following a mass movement event that was triggered by Cyclone Megi.
(a) With reference to Resource 4, describe the passage of the weather system as
Cyclone Megi moves inland. [3] Point marked, data referencing is expected.
Indicative content: • As the cyclone develops off the shores of the island of Taiwan (South China Sea),
it originates as a cyclone of 74 mph, estimated to bring around 1-3 inches of rainfall.
• As it hits the shores of Taiwan on 27th September 2016, while wind intensity remains unchanged, the forecasted rainfall increases to 3-6 inches.
• Finally, as the tropical cyclone moves towards Fuzhou, China, the tropical cyclone declines in wind speed, slowing down, the forecasted rainfall remains high, with some areas along the coast forecasted to receive 6-9 inches of rainfall.
(b) With the help of Resources 4 and 5, suggest and explain the conditions that have allowed Cyclone Megi to form, and develop over time. [5] Response ought to pay attention to both the conditions for the formation as well as the development over space and time of the cyclones. The best answers will be able to address both. Development should also include the decay of cyclones.
Indicative content: • Warm sea surface: Sea surface water temperature off the shores of Taiwan must
have been above 27°C, which is also highly likely in September even though the overhead sun has shifted towards the equator. The high temp of water to a depth of about 60m (Resource 5) is maintained from heating achieved earlier in June-Aug due to water’s ability to retain heat longer.
• Low Pressure cell: Air above the warm sea waters will also be heated, forming an intense LP cell which attracts winds from the surround HP areas, due to the pressure gradient. This causes the converging winds spiraling in towards the cell, and forced upwards.
• Consistent/uniform surface and upper atmospheric winds: This ensures that the system set up in earlier stages is not ripped apart.
• Latent heat: The cooling of water vapour as it rises results in condensation which releases latent heat, providing required energy to continued instability and thus powering the cyclone system. It further fuels and develops the Cyclone, causing winds to increase in strength, until it dissipates when the cyclone strikes the shore as seen in Resource 4. Without a warm water surface to thrive on, the wind speed brought along by Cyclone Megi declined to 39-73mph in Fuzhou and finally becoming a tropical depression of less than 39 mph.

SAJC 2018 H2 Geography Paper 2_Mark Scheme_pg 4
© SAJC 2018 9751/02/18 Prelims
Levels Marks Descriptors 3 5 Well-explained and sound answer that acknowledges the conditions for
both the formation and the development of Cyclone Megi. Resources have been purposefully engaged with to support explanations.
2 3-4 A good answer that acknowledges the conditions for both the formation and the development of Cyclone Megi, but Resources must not have been purposefully engaged with to support explanations.
1 1-2 Explanation is likely to have only been restricted to the conditions influencing the formation of Cyclone Megi, or its development. Response uses basic factual information and conceptual understanding which has some, but limited, relevance to the question. Resources 4 and 5 are not used or not accurately used to support the response.
0 0 No creditworthy response.
(c) Describe the characteristics of the mass movement shown in Resource 6. [3]
Point-marked. There is no need to identify the specific type of mass movement. Though the description would likely lead candidates to the conclusion that it is likely to be a flow.
• Established channel: By which materials move along the surface of the slope,
following the established channels. • Clear scarp at the head of the slope, leaving behind an hourglass shaped slope. • Debris at foot of the slope: Sediment fan at the base of the slope comprising of debris
of assorted sizes. • Deformed materials without semblance of the initial materials from the slope. (d) With the help of Resource 4, explain how Cyclone Megi could have triggered the
occurrence of the mass movement event shown in Resource 6. [5]
Indicative Content: Increase Shear Stress:
• The intense and excessive rainfall (Resource 4: particularly along the coastal regions of Fujian, receiving a maximum of 6-9 inches of rainfall) that accompanies Cyclone Megi would have caused slope saturation.
• With the exceeding amount of rainfall that falls in a short period of time, this increase in the volume of water would have increased the weight of the potentially mobile mass as the pore spaces are filled with water, thus increasing shear stress.
Decrease Shear Strength: • Upon saturation, the surface tension between water and particles in the sediments
will be lost as the water get between the grains and eliminates grain-to-grain frictional contact by increasing pore water pressure, allowing sediments to slide over one another, decreasing shear strength. The mass loses cohesiveness and begins to flow like a fluid.
• Strong winds (more than 74mph in Taiwan and 39-73mph when the Cyclone reaches the coasts of Fuzhou, China) may also have removed vegetation on the slope as seen in Resource 6. The loss of trees and plants what can help to maintain land stability may cause shear strength to decrease. Without the tree roots to hold onto the soil and other vegetation to the bedrock, it is likely that as the soil approaches saturation, there will be little resistance to gravity downslope.

SAJC 2018 H2 Geography Paper 2_Mark Scheme_pg 5
© SAJC 2018 9751/02/18 Prelims
Levels Marks Descriptors 3 5 Well-explained and sound answer that acknowledges the combination of a
decline in shear strength as well as an increase in shear stress as a result of cyclones which causes the mass movement. Reference to Resources is integrated well.
2 3-4 A good answer that acknowledges how a decline in shear strength as well as an increase in shear stress as a result of cyclones causes the mass movement. Reference to Resources may be limited on lower end of the level.
1 1-2 Response shows a poor understanding of the context in the question. Uses basic factual information and conceptual understanding which has some, but limited, relevance to the question. Resources are not used or not accurately used to support the response. Provides little or no evaluation.
0 0 No creditworthy response.
(e) With the help of your own knowledge, evaluate the relative importance of climate and at least one other factor in the occurrence of the mass movement event shown in Resource 6. [9]
Response ought to weigh across the importance of climate (role of water and vegetation) with any other factors which might be chosen for comparison (e.g. geological structure, tectonic activities, human activities). Best answers will arrive at a weighed conclusion. Answers may come to a conclusion that other secondary factors like geological structure, anthropogenic factors and tectonic activities will fasten the onset and pace of MM, but the role of climate is still relatively more important. For instance, soil liquefaction caused by seismic shaking will only occur when soils are initially already saturated or tending towards saturation.
Theme 2: Development, Economy and Environment
The Global Supply Chain of Zara
3 (a) With reference to Resource 7, describe the change in the number of European Union
suppliers to Zara, and explain one reason for the change. [3] Describe the change: [1m, both trend and support must be cited or else no credit] Between 2007 and 2012, the number has decreased annually, from 689 in 2007 to 457 in 2012. Possible reason: [2m] • The cost of using EU suppliers have gone up, or lost competitiveness to cheaper
ones elsewhere. This cost relates to factors of production including labour, or raw materials to be used
• The evidence can be seen in the increase in suppliers used in Africa and especially Asia. Asian suppliers have increased from 333 in 2007 to 725 in 2012, moving in opposite direction from the trend seen in EU.

SAJC 2018 H2 Geography Paper 2_Mark Scheme_pg 6
© SAJC 2018 9751/02/18 Prelims
(b) Compare the flows of weekly cargo shown in Resource 7 with those shown in Resource 8. [5]
Resource 7 (received at ZAZ) Resource 8 (sent from ZAZ) Cities in the network (How many, and where)
9 cities sending: Seoul, Shanghai, HK, Delhi, Moscow, Dubai, Amsterdam, Bahrain, Dhaka
8 cities receiving: Mexico joins the network Dhaka and Amsterdam are droppedDubai and Bahrain serve also as transit points, towards HK, although Bahrain is itself a recipient
Weekly volume (Spatial differences)
At least 600 tonnes, with all cities contributing >130 tonnes except for Bahrain (101-130) and Dhaka (<71)
Seoul and Dubai are largest recipients (>130 each) Shanghai and Moscow (101-130 each) HK (about 200 tonnes) Bahrain and Mexico (<71 each)
(c) With the help of Resources 7 and 8, suggest why Zara has increased the use of air
transport in its global supply chain. [5] Remarks: The hint for this question is in the preamble – “In recent years, Zara has increasingly
used air transport in its supply chain in addition to sea and land transport.” Possible reasons: All to do with making more profit.
• Market-seeking: Geographical reach into markets far from Spain • Speed: The ability to produce and deliver new goods from suppliers to logistics
hub to shops must be quick in the fashion sector • Cost: Economies of scale will help to bring down transport cost
Level Marks Descriptors 3 5 Response demonstrates a good understanding of a Zara’s market-seeking
and profit-seeking motives, and addresses the context presented, that is, comparing between air transport and sea/land in the overall scheme of Zara’s operations.
2 3-4 Response demonstrates some understanding of Zara’s market-seeking and profit-seeking motives, and will attempt to show how air transport allows Zara to make more revenue and/or lower cost. On the lower end, may not consider the advantages air transport provides over land/sea.
1 1-2 Response provides poor to basic level of understanding of Zara’s market-seeking and profit-seeking motives, and may lose the context of the question regarding how air transport is an important strategy in Zara’s overall scheme of operations.
(d) With the help of Resources 7 and 9, explain why Zara’s large supplier network has
both strengths and limitations to its host economies. [6] Remarks: • This question is about the possible positive (i.e. strengths and benefits) and
negative (i.e. limitations and disadvantages) impacts of a large TNC such as Zara on its host economies.

SAJC 2018 H2 Geography Paper 2_Mark Scheme_pg 7
© SAJC 2018 9751/02/18 Prelims
• However, economic impacts should be prioritised, as the question uses the word “economies”. It is possible to gain high credit so long as both strengths and limitations are considered in this dimension alone. The best answers would also address the significance of “large supplier network” in channeling Zara’s impacts.
Indicative content: • Economic: (+) FDI, generates employment, economic linkages to local firms,
payment of taxes, multiplier effect, transfer of technology, etc; (-) stifle competition from local firms, suppression of tech devt, financial cost to host, ability to switch out of local economies should more favourable conditions exist elsewhere, etc
• Social: (+) Projects to help improve welfare of communities such as education and women empowerment, etc; (-) exploitation of labour in terms of salary, working conditions, etc
• Environment: (+) Some efforts by TNCs to be more environmentally-conscious; (-) unwelcome change to atmosphere, land and water, not following laws or follow through on regulations; etc
Level Marks Descriptors 3 5-6 Response shows a good to strong understanding of Zara’s possible
economic impacts, demonstrating breadth and/or depth when considering these. There would also be some references to the significance to do with the largeness of its supplier network, but will be weaker at the lower end.
2 3-4 Response demonstrates an adequate understanding of Zara’s possible economic impacts, and may include social/environmental impacts. There could be breadth or depth, but at the lower end, the emphasis on economic impacts may be weak, although present.
1 1-2 Response provides minimal or superficial coverage of Zara’s possible impacts, regardless of dimensions.
(e) With the help of Resource 9 and your own knowledge, explain the role of media agencies in influencing the actions of TNCs behind well-known brands such as Zara. [6] Remarks:
• The media agencies featured in the Resource include news agencies (the source of the report) and TV channels (which provided the material reported).
• The question uses Zara as an example, but invites a general explanation of the role of media agencies in influencing the actions of TNCs. However, a strong answer must demonstrate a close reading, and drawing from, Resource 9 rather than treating it as though it wasn’t attached to the question.
Indicative content: • Media agencies play an important role in any economy by garnering support or
opposition for those who govern, by highlighting or failing to do so the views and/or sins of industry, by providing a voice for the people or not doing so, and by simply spreading economic information.
• In the case of TNCs, agencies in the media industry can influence them by means such as affecting their reputation.
• For example, the media do play a role in shaping the public image of TNCs, or their corporate managers and directors, and in so doing pressure them to behave according to societal norms, thereby avoiding actions that will result in censure and consumer boycotts.

SAJC 2018 H2 Geography Paper 2_Mark Scheme_pg 8
© SAJC 2018 9751/02/18 Prelims
• Some key points from Resource 9: “slave-labour working conditions”, details shared by a worker, figures of salary vs earnings that suggest the extent of exploitation, observations of working conditions, etc
Level Marks Descriptors 3 5-6 Response demonstrates good to strong appreciation of the role of media
agencies in influencing TNC actions from own knowledge, and draws effectively from the Resource to help illustrate the theoretical reasoning.
2 3-4 Response shows an adequate understanding of how media agencies influence TNC actions. The use of the Resource is present, but not well-integrated.
1 1-2 Response provides little or minimal understanding of the role of media agencies.
0 0 No creditworthy response.
Theme 3: Sustainable Development
Waste Management in Vancouver
4
(a) With the help of Resource 10, explain one usefulness and one limitation of ecological footprint as an indicator of sustainable urban development. [4]
Usefulness: [2m] • The larger the EF, the less sustainable a city is. In Vancouver, EF is 2.9 gha/pax,
which is above the ideal size (1.7 gha) that will help make it more sustainable. It suggests that if everyone uses resources like Vancouver, 2 Earths are required, and clearly, this is not possible.
• The calculation of EF reveals which aspects of resource use could have more scope for reduction. In this case, Vancouver’s food consumption is responsible for about half of its EF, so more can be looked into how the footprint linked to food can be reduced. Similarly, the use of paper and plastic, and private transport, all need to be reviewed as possible areas in which Vancouver can reduce reliance on to achieve SUD.
Limitation: [2m] • The calculation of ecological footprints for cities may obscure the fact that
particular groups of city dwellers contribute disproportionately to these footprints. For example, the poorest segment of Vancouver’s population would very likely be much less than that of its wealthiest.
• The meaning of EF depends on the quality and range of statistics from which it is calculated. Resource 4 shows us the range of considerations, and it is reasonable to question the reliability of the data for each of the category, such as food and waste.

SAJC 2018 H2 Geography Paper 2_Mark Scheme_pg 9
© SAJC 2018 9751/02/18 Prelims
(b) With reference to Resource 11, describe the projection of Vancouver’s waste disposal to 2040 if current waste reduction efforts remain unchanged. [2]
Current waste production: 371,000 tonnes Projection by 2020 if efforts remain unchanged: • Could drop to 362,000 but may also rise to 443,000 tonnes
Projection by 2040 if efforts remain unchanged: • Waste will be increased, to a value in the range of 539,000 to 659,000 tonnes,
an increase of 45-77% from 2016.
(c) Explain three reasons why it will be difficult for Vancouver to achieve its goal of producing zero waste by 2040, as seen in Resource 11. [6]
Possible reasons [2m each]: • Reduce waste production is difficult especially in a population that is rich and
large. Resource 5 suggests that waste production will actually increase if nothing more is done to reduce them, so the inclination of the city is to produce more waste. Hence, waste reduction is actually “going against the grain”.
• Achieving this goal will require alignment across all sectors of society, not just individuals but businesses as well. Mindsets and behavior of everyone can take a long time to change. Use of laws and policies may not sit well with people, and education efforts may only show after many years.
• Infrastructure and technology in waste management may not be fast enough to meet the continued waste production among its citizens.
(d) With the help of Resource 12, explain the extent to which public education as a
strategy can help Vancouver to reduce waste. [6]
Indicative content Helpful - Education aims to change mindsets, and in turn, the behavior of its citizens. Reaches out to a variety of segments in the population. Allows a host of platforms and approaches, such as through posters that can be placed in a variety of places, and also can include elements to reach out to the public and stimulate their imagination. etc Not very helpful - Whether these messages would ever reach the target audience remains a question (e.g. these posters can be ignored, vandalised, etc). Humans may need more active motivation from the authorities than passive messaging. Other means such as financial incentives to encourage waste reduction, reusing and recycling would be required to complement public education. etc
Level Marks Descriptors 3 5-6 Response shows the ability to consider the usefulness of public education
from more than one perspective, and is able to explain convincingly why it is only to some extent that this strategy can be relied on. The use of examples, though not necessary, may be a feature in the best answers.
2 3-4 Response offers a balanced account on the usefulness of public education to help reduce waste, although it may be that only one-sided view is presented but explained well.
1 1-2 Response provides a simplistic and one-sided view on the use of public education to help reduce waste. There would be little to none of explanation of its chosen stand.
0 0 No creditworthy response.

SAJC 2018 H2 Geography Paper 2_Mark Scheme_pg 10
© SAJC 2018 9751/02/18 Prelims
(e) Using the resources and your own knowledge, suggest and explain why waste reduction is deemed a major part of Vancouver’s plans for sustainable urban development. [7] Indicative content • Protecting the Environment: reducing EF of Vancouver (currently two times
larger than Earth can sustain), addresses climate change and other environmental impacts (pollution, GHGs from decomposition of waste, etc), pushes the city towards circular metabolism
• Contribute to Economic well-being: waste can become a resource that support new business opportunities, reducing the need for increasingly scarce materials and inputs; etc
• Benefitting Society: Strengthening community connections in a society that is diverse (becoming a zero waste community), recovery of products that are reusable and rescuing food that is edible can provide employment across different segments of society, especially for the lower income groups, etc
Level Marks Descriptors 3 5-7 Response considers fully the dimensions (i.e. breadth) that help a city
achieve SUD, and shows convincingly how waste reduction contributes to these (i.e. depth). Examples may be used, though not necessary.
2 3-4 Response provides a partial account of the relationship between waste reduction and SUD. May have only breadth or depth.
1 1-2 Response lacks both breadth and depth, and sketchy on why waste reduction has a key role to play in SUD.
0 0 No creditworthy response.

SERANGOON JUNIOR COLLEGE JC2 PRELIMINARY EXAMINATION 2018 Higher 2
_______________________________________________________________________
GEOGRAPHY 9751/01 Paper 1 Structured Essay Questions
Thursday 13 Sept 2018 3 hours
Additional materials: Writing Paper _______________________________________________________________________ READ THESE INSTRUCTIONS FIRST Write your name and civics group on all the work you hand in. Write in dark blue or black pen on both sides of the paper. You may use a soft pencil for any diagrams, graphs, or rough working. Do not use staples, paper clips, highlighter, glue or correction fluid. Answer three questions. One from each section. You should make reference to appropriate examples studied in the field or the classroom, even where such examples are not specifically requested by the question. Diagrams and sketch maps should be drawn whenever they serve to illustrate an answer. The world outline map may be annotated and handed in with relevant answers. You are reminded of the need for good English and clear presentation in your answers. At the end of the examination, fasten all your work securely together. The number of marks is given in brackets [ ] at the end of each question or part question. ____________________________________________________________________________
This document consists of 3 printed pages and 1 blank page [Turn over

© SRJC 2018 9751/Preliminary Examination/18
2
Section A - Tropical Environments
Answer one question from this section.
1 (a) Explain the main land surface geomorphological processes operating in the humid
tropical climates. [12]
(b) Discuss the contribution of events in Pleistocene times to the present-day landforms of tropical regions.
[20]
2 (a) Explain the effects of geology and changes in base level on the long profiles and
cross profiles of river valleys.
[12]
(b) Assess the role of the Inter Tropical Convergence Zone (ITCZ) in determining the distribution of rainfall totals and extreme weather events in the tropics.
[20]
Section B – Development, Economy and Environment
Answer one question from this section.
3 (a) Examine the validity of Malthus’ theory on the relationship between population and
resources in low income countries.
[12]
(b) To what extent has the use and management of resources been influenced by economics and technology in developing countries?
[20]
4 (a) Explain the roles of watchdogs and civil society groups in countries at low levels of
development.
[12]
(b) To what extent are multilateral institutions still relevant in light of the rapid growth of bilateral and regional trade agreements in the past two decades?
[20]

© SRJC 2018 9751/Preliminary Examination/18
3
Section C – Sustainable Development
Answer one question from this section.
5 (a) Explain the challenges in measuring urban liveability in countries at higher levels of
development.
[12]
(b) “Although there are solutions to managing traffic congestion, these solutions often bring other problems”. With reference to cities in developed countries, discuss this statement.
[20]
6 (a) With reference to cities in countries at varying levels of development, explain why
pluvial floods are considered hazardous.
[12]
(b) Evaluate the extent to which changes to catchment characteristics can mitigate the impacts of pluvial floods in urban environments.
[20]
End of Paper

© SRJC 2018 9751/Preliminary Examination/18
4
BLANK PAGE

SERANGOON JUNIOR COLLEGE JC2 PRELIMINARY EXAMINATION 2018 Higher 2
_____________________________________________________________________ GEOGRAPHY 9751/02 Paper 2 Data Response Questions Wednesday INSERT 19 Sept 2018
3 hours _____________________________________________________________________ READ THESE INSTRUCTIONS FIRST This insert contains all the Resources referred to in the questions.
_______________________________________________________________________
This document consists of 13 printed pages and 1 blank page
[Turn over

© SRJC 2018 9751/Preliminary Examination/18/insert [Turn over
2
Resource 1 for Question 1
Map of the High Line, New York (USA)
Chelsea Market : Consists of 38 vendors which serve up a range of dining options that include sushi, lobster, cheese and breads.
Whitney Museum of American Art : Features art pieces from famous artists such as Andy Warhol and Jackson Pollack.
The Plinth : Location for public art installations
Standard Hotel : 18 Floor hotel that is renowned for its distinctive architecture.
A section of the High Line
Chelsea-Elliot public housing estate

© SRJC 2018 9751/Preliminary Examination/18/insert [Turn over
3
Resource 2 for Question 1
Breakdown of respondents by age and ethnicity
Focus Group 1 Focus Group 2 Focus Group 3
Ethnicity
African-American and Latino
African-American
White
Age range
40 - 60
19 - 30
20 – 50

© SRJC 2018 9751/Preliminary Examination/18/insert [Turn over
4
Resource 3 for Question 1
Sample of a mental map

© SRJC 2018 9751/Preliminary Examination/18/insert [Turn over
5
Resource 4 for Question 2
Sediment yield and drainage density in different tropical climates
Resource 4a Sediment yield in different tropical climates
*Note : Effective precipitation is the amount of precipitation required to produce a known amount of surface runoff
Resource 4b
Drainage density in different tropical climates
*

© SRJC 2018 9751/Preliminary Examination/18/insert [Turn over
6
Resource 5 for Question 2
A river form in a tropical region

© SRJC 2018 9751/Preliminary Examination/18/insert [Turn over
7
Resource 6 for Question 3
Main water catchments in Kenya

© SRJC 2018 9751/Preliminary Examination/18/insert [Turn over
8
Resource 7 for Question 3
Regions of water deficit in Kenya
Resource 8 for Question 3
Multidimensional poverty index (MPI) in different regions of Kenya

© SRJC 2018 9751/Preliminary Examination/18/insert [Turn over
9
Resource 9 for Question 3
Sustainable Development Goals (SDG) 4, 5 and 6
Resource 10 for Question 3
Percentage of population with access to improved water sources * in Kenya
*Improved water sources refer to potable water sources such as piped water, rain harvested water and water from protected wells

© SRJC 2018 9751/Preliminary Examination/18/insert [Turn over
10
Resource 11 for Question 4
Myanmar’s electricity production by source from 2003 to 2012

© SRJC 2018 9751/Preliminary Examination/18/insert [Turn over
11
Resource 12 for Question 4
Distribution of existing and planned hydropower plants in Myanmar

© SRJC 2018 9751/Preliminary Examination/18/insert [Turn over
12
Resource 13 for Question 4
Information on the Myitsone mega-dam project
Insert : Myitsone Dam
• The Myitsone Dam project (circled in Resource 13) was a major project funded by China Power Investment.
• The mega dam project was intended to be built a mile below the confluence of the Mali and N'Mai rivers in Kachin State, the source of the Irrawaddy River. Kachin State has been the site of political conflicts between various minority groups and the military government.
• There are significant historical and cultural sites at the Mali and N'mai Hka rivers. The dam is located in a region that is recognized as one of the world's top biodiversity hotspots. The region is also tectonically active.
• The mega-dam project once completed, would have exported 90% of its electricity to China.
KACHIN STATE

© SRJC 2018 9751/Preliminary Examination/18/insert [Turn over
13
Resource 14 for Question 4
Wind Power in Myanmar
End of Insert
Wind Power Potential (W/m2)
Proposed wind sites

© SRJC 2018 9751/Preliminary Examination/18/insert [Turn over
14
BLANK PAGE

SERANGOON JUNIOR COLLEGE JC2 PRELIMINARY EXAMINATION 2018 Higher 2
_______________________________________________________________________
GEOGRAPHY 9751/02 Paper 2 Data Response Questions Wednesday
19 Sept 2018 3 hours
Additional materials: Writing Paper 1 Insert _______________________________________________________________________ READ THESE INSTRUCTIONS FIRST Write your name and civics group on all the work you hand in. Write in dark blue or black pen on both sides of the paper. You may use a soft pencil for any diagrams, graphs, or rough working. Do not use staples, paper clips, highlighter, glue or correction fluid. Candidates answer all questions. The Insert contains all the Resources referred to in the question paper. You should make reference to appropriate examples studied in the field or the classroom, even where such examples are not specifically requested by the question. Diagrams and sketch maps should be drawn whenever they serve to illustrate an answer. The world outline map may be annotated and handed in with relevant answers. You are reminded of the need for good English and clear presentation in your answers. At the end of the examination, fasten all your work securely together. The number of marks is given in brackets [ ] at the end of each question or part question. ____________________________________________________________________________
This document consists of 4 printed pages. [Turn over

© SRJC 2018 9751/Preliminary Examination/18
2
Section A
Theme 4 : Geographical Investigations
1
The High Line is a 2.33km elevated linear park built on a disused section of the New York Central Railroad line. The US$150m urban regeneration project was widely hailed as a success, attracting nearly five million visitors annually and spurring new property developments and attractions along the High Line. A group of ten students from the City University of New York decided to conduct an investigation to ascertain if the High Line met the needs of low-income residents in the Chelsea-Elliot public housing estate (location of the estate is indicated in Resource 1). The students organised three focus group discussion sessions, conducted at a community centre near the Chelsea-Elliot public housing estate. Each focus group comprised 4-6 residents in the estate. Each 1-hour focus group discussion session was led by a student facilitator. During each session, the student facilitator would ask a series of open-ended questions to elicit responses on the regenerated High Line. The student facilitator also carried out a mental mapping exercise with the focus group. Resource 1 shows a map of the High Line and selected attractions along the High Line, as well as the location of the Chelsea-Elliot public housing estate. Resource 2 shows the breakdown of participants by age and ethnicity in the respective focus groups. Resource 3 shows one sample of a mental map, with annotations gathered from the residents, showing their view of changes in the neighbourhood after the regenerated High Line.
(a) Using Resource 1, identify the features that show attempts to regenerate the High Line.
[4]
(b) Suggest reasons why the students conducted focus group discussions and categorised the focus groups as shown in Resource 2.
[5]
(c) Explain how the group may overcome ethical concerns they face in their collection of primary data for this investigation.
[4]
(d) Outline the steps you will take to analyse and present the data collected from the focus group discussions.
[5]
(e) Using Resources 1 and 3, evaluate if the needs of local residents have been met and suggest how this evaluation can aid urban planning.
[7]

© SRJC 2018 9751/Preliminary Examination/18
3
Section B
Theme 1 : Tropical Environments
Erosion and sediment yield in the tropics
2 Resource 4 shows the sediment yield and drainage density in different tropical climates. Resource 5 shows a river form in a tropical region.
(a) Describe the spatial variation in sediment yield across the tropical regions as shown in Resource 4a.
[2]
(b) With reference to Resource 4a, describe and explain the relationship between annual sediment yield and effective precipitation.
[5]
(c) Using Resources 4a and 4b, explain how mean annual precipitation and one other physical factor can affect drainage density.
[6]
(d) Explain two ways by which the river, shown in Resource 5, obtains its sediment from outside the channel.
[4]
(e) With the help of all Resources, assess the extent to which the calibre and quantity of sediment load are responsible for the channel form shown in Resource 5.
[8]
Theme 2 : Development, Economy and Environment
Water Issues in Kenya
3 Resource 6 shows the main water catchments in Kenya. Resource 7 shows the regions of water
deficit in Kenya. Resource 8 shows the multidimensional poverty index (MPI) in different regions of Kenya. Resource 9 shows the Sustainable Development Goals (SDG) 4, 5 and 6. Resource 10 shows the percentage of population with access to improved water sources in Kenya.
(a) With reference to Resource 6, describe the physical environment where the main water catchments are located.
[3]
(b) With the help of Resources 6 and 7, explain the reasons for regions experiencing water deficit.
[6]
(c) Using Resources 6, 7 and 8, describe the relationships between the locations of water deficit and the level of multi-dimensional poverty index (MPI).
[6]
(d) Using Resource 9 and your own knowledge, show how Kenya, by achieving the SDG 6 (Clean Water), is also able to achieve SDGs 4 and 5.
[5]
(e) Describe and suggest reasons for the trend in the access to improved water sources as shown in Resource 10.
[5]
[Turn Over

© SRJC 2018 9751/Preliminary Examination/18
4
Theme 3 : Sustainable Development
Energy in Myanmar
4 Myanmar is a developing country in South East Asia. To enhance energy security, the country has made significant investments in renewable energy. Resource 11 shows Myanmar’s electricity production by source from 2003 to 2012. Resource 12 illustrates the distribution of existing and planned hydropower plants in Myanmar. Resource 13 provides information on the Myitsone mega-dam project. In 2011, the Myanmar government ordered a halt to construction of the controversial $3.6 billion mega dam following rare public opposition to the Chinese-backed hydropower project. Resource 14 features a wind power density map of Myanmar and proposed wind power sites.
(a) Suggest three reasons for the trends in Myanmar’s electricity production by hydropower from 2003-2012, as observed in Resource 11.
[5]
(b) Using Resource 12, compare the distribution of existing and planned hydropower plants in Myanmar.
[4]
(c) With reference to Resource 13 and your own knowledge, suggest possible reasons why local communities opposed the construction of the Myitsone dam.
[8]
(d) Citing evidence from all Resources and your own knowledge, recommend whether Myanmar should prioritise either further investment in hydropower or develop wind power capabilities.
[8]
End of Paper

1
Name: _____________________________________ CG: ________ Date: ________________
SERANGOON JUNIOR COLLEGE
JC2 H2 P1 GEOGRAPHY 2018 Preliminary Examination Answer Scheme
Rubric for 12m Essays
Level Marks Descriptors 4 10-12 Response is consistently analytical and comprises purposeful
explanations. Response addresses the question fully using accurate and detailed knowledge. Depth of relevant knowledge and understanding is evident throughout. Response is coherent and use of terminology is accurate throughout.
3 7-9 Response is analytical and explanatory rather than descriptive. There is a clear focus on the question. Response demonstrates relevant knowledge and understanding. The response is coherent and the use of terminology is mostly accurate. A (75%) : 9 B (67%) : 8 C (58%) : 7
2 4-6 Response includes analysis and explanation but is generally dominated by description. Response reflects understanding of the question and is generally relevant. Some parts of the response may be unclear. Use of terminology is limited. 50% (D) : 6 42 % (S) : 5 33 % (U) : 4
1 1-3 Response lacks focus on the question. Response is generally fragmentary and lacks a clear structure and organisation. There may be many unsupported, brief or incomplete assertions and/or arguments with some inaccurate use of terminology.
0 0 No creditworthy response.

2
Rubric for 20m Essays Level
Marks Descriptor
5 17-20 Response is perceptive, logical and has strong evaluative elements. Evaluation is relevant and comprehensive. Strong evidence of synoptic thinking where knowledge from different topics is synthesised purposefully. Use of detailed and accurate knowledge reflecting depth of understanding of the subject content. The argument or discussion is coherent and well supported by relevant material. Use of terminology is accurate.
4 13-16 Response displays a sound evaluative element. There is some evidence of synoptic thinking through synthesising knowledge from different topics. Response is generally focused on the demands of the question and features accurate knowledge, reflecting depth of understanding of the subject content. The argument or discussion is coherent and supported by relevant material. Use of terminology is accurate and appropriate.
3 9-12 Response is broadly evaluative rather than descriptive. Response addresses the questions and features accurate knowledge, reflecting some understanding of the subject content. Argument or discussion is mainly coherent and supported by material which is largely relevant. Use of terminology is relevant and mostly accurate. 12 B • Content accuracy
• Rigour of elaboration (use of relevant statistics, reference to models, use of technical terms) for most parts of the essay
• Addressing the question consistently • Clear evaluation shown in selected parts of essay (clear
argument, supporting evidence, alternative perspectives 11 C • Content accuracy
• Rigour of elaboration (use of relevant statistics, reference to models, use of technical terms) for most parts of the essay
• Addressing the question consistently • Attempt at evaluation (clear argument, supporting evidence,
alternative perspectives 10 D • Content accuracy (some CE)
• Rigour of elaboration for some parts of the essay • Addressing the question for most parts of the essay • Attempt at evaluation (clear argument, supporting evidence,
alternative perspectives)
9 E • Content accuracy (some CE) • Addressing the question, but may veer off in some parts • Attempt at evaluation ( but superficial or hypothetical)
2 5-8 Response is largely descriptive. Response attempts to provide an argument to address the question. The weakest responses in this level may lack balance and/or depth. Response structure is broadly coherent but may lack clarity. Some lapses in use of terminology though generally accurate. 8 (S) , < 7 (U)
1 1-4 Response lacks focus on the question and may be largely irrelevant to it. Response is fragmentary and lacks clarity. There may also be unsupported assertions and/or arguments with limited or no use of relevant terminology.
0 0 No creditworthy response.

3
1 (a) Explain the main land surface geomorphological processes operating in the humid tropical climates. [12] Geomorphological processes are those that bring about a change in the morphology of landforms and they are influenced by climate. Humid tropical regions would include : - all-seasons rain equatorial regions (Af) - seasonal rainfall monsoon (Am) and savannah (Aw) regions Dominant geomorphic processes: identify and explain 1. Chemical weathering
2. Mass movement
3. Surface erosion
a. on the plains of Aw Surface erosion is most effective in the tropical savannah (Aw) climate - Limited vegetation cover (mainly grassland) which offers little protection - High intensity rain which generates sheet-floods during the summer monsoon erodes surface sediments from the uppermost layers of the regolith in the process called exhumation - the smooth surface of the savanna plains is progressively being lowered and leads to the gradual exposure of the basal surface of weathering which leads to large-scale exfoliation by dilatation b. Surface erosion in other humid tropical regions - on deforested surfaces of the rainforest (Af) and in areas of weak, easily eroded clays where the kinetic energy of high intensity rain causes rainsplash and rill erosion, and where the rills flow together, causing gully erosion. These gullies dissect slopes forming badland topography. 1 (b) Discuss the contribution of events in Pleistocene times to the present-day landforms of tropical regions. [20] SCRIPTORS The tropics, like the rest of the world, underwent repeated changes during the Pleistocene epoch which lasted from 2.6mllion to 11,700 years ago which was then followed by the early Holocene epoch. These changes included changes in climate, sea level fluctuations and tectonic uplift. The geomorphological effects of such changes were enormous. While the geologic past is a good guide, for understanding current tropical landforms, it is essential to acknowledge that the processes operating under present climatic conditions also cause geomorphic effects.
Event 1 : Climate change Event 2: Tectonic uplift and its influence on karst landforms
Event 3 : Sea level fluctuations
Event 4 : Role of present day processes

4
2 (a) Explain the effects of geology and changes in base level on the long profiles and cross profiles of river valleys. [12] IPTOR VEL MAR LONG PROFILE General shape is concave upwards. Some show regular concave section separated by convex section. Some show steeper overall gradient than others
Geological reasons for the irregularities along the LP 1. Resistant rock outcrops present across the stream 2 - Differences in rock resistance Structural knickpoint along a LP 3. Differences in rock properties (lithological variations) and the effect on the graded profile. Even after the irregularities have been smoothened out , differences in the rate of supply and calibre of the sediment from different rocks may affect the nature of the graded profile. 4- Downstream decrease in the size of particle/sediment size (calibre)
5- Irregularities at a local scale : pool and riffle sequence of a straight/meandering channel A riffle-pool sequence also contributes to the irregularities of a LP. Riffles are formed in shallow areas by coarser materials such as gravel and they raise the gradients along the straight section of a meander while pools are deeper and gentler resulting in an irregular local profile.

5
EFFECT OF BASE LEVEL OF EROSION ON LP Changes in base level result from: a- Eustatic (sea level) change b- Isostatic (tectonic) change : e.g. crustal uplift, where land is uplifted due to plate movement activity. Rivers are rejuvenated when the land over which they flow is uplifted, and this sometimes causes waterfalls to develop CROSS PROFILE Geology on cross profile Rock type may modify the local development of valley cross sections, in that, whereas hard coherent rocks (sandstone, granite) are able to support steep valley sides, whereas incoherent rocks undergo collapse , thus resulting in lower slope angle Geological structure affects valley shape in several ways. Where the river has taken advantage of a weak stratum, like a layer of shale, clay or sand.
Fall in the base level of erosion on cross profile : Paired and unpaired terraces A sequence of such falls will produce a staircase of terraces. A: Paired Terraces - A lowering of base level (sea level) will cause incision of the stream, leaving remnants of the former valley floor standing up as terraces B: Unpaired terraces- are formed when laterally shifting streams are cutting down steadily (probably because base-level is also falling continuously.

6
Fall in the base level of erosion on cross profile : Incised and ingrown meanders
Effects of base level falls on the cross profile of river meander : Incised menader

7
2 (b) Assess the role of the ITCZ (inter tropical convergence zone) in determining the distribution of rainfall totals and extreme weather events in the tropics. [20] Indicative content ITCZ – a low pressure belt produced by the intense solar heating and uplift of air at a convergence zone. Its position and seasonal migration across the equator are important in determining rainfall totals in the tropics. The ITCZ is also useful to explain extreme weather phenomena such as tropical cyclones, intense rainfall and drought. Other factors, however, are required for a fuller comprehension P1: Location of ITCZ in determines rainfall totals P2 : How ITCZ influences tropical cyclone The shift of the ITCZ across the equator means that it will warm the SST of the seas where it is located. TCs occur most commonly in late summer and early autumn (when sea temperatures reach their maximum) July to October in the NH and Jan-Feb in the southern hemisphere. The heat energy is necessary for the evaporation and convective rise of warm water vapour to reach cloud condensation level, where latent heat is released to fuel the system. Extreme weather events would include : very high wind speeds (119km/hr and above) and torrential rain concentrated around the eye. (Note : storm surges, inland and coastal flooding are not extreme weather events) P3: Other factors affecting rainfall totals - Continentality - Subtropical high pressure (latitude 30° N/S) - Cold ocean currents P4: Other factors causing extreme weather phenomena El Nino Climate change means extreme weather phenomena have become the new normal: more warming causes evaporation and forms more water vapour – a vital ingredient for more intense rainfall and intense tropical cyclones, higher frequency of Category 4 and 5 storms (super typhoons). Higher temperature favours intense, longer drought, heatwaves

8
3 (a) Examine the validity of Malthus’ theory on the relationship between population and resources in low income countries. [12] P1 : Explain Malthus Theory P2 : Relevance of Malthusian theory (exponential population growth) • Examination of two hundred years of demographic history reveal the exponential nature of human
population growth in the past centuries, of which the bulk of population growth occurred in the last century.
• Much of this population growth has occurred in the low-income countries. For example, according to the results of the 2015 Revision of World Population Prospects, total fertility is now 2.5 children per woman globally, but the African continent remains the region with the highest fertility at 4.7 children per woman.
P3 : Relevance of Malthusian theory (projected food shortages) P3 : Limitations of Malthusian theory • Malthus asserted that food production would not keep pace with population growth owing to the
operation of the law of diminishing returns in agriculture. But by making rapid advances in technology, countries have been able to postpone the stage of diminishing returns.
Eg : The Green Revolution in India refers to a period of time when agriculture in India changed to an industrial system due to the adoption of modern methods and technology such as high yielding variety (HYV) seeds, tractors, irrigation facilities, pesticides, fertilizers.
• Cite other limitations
3 (b) To what extent has the use and management of resources been influenced by economics and technology in developing countries ? [20] Introduction Define : Resource use: how communities appropriate a resource to meet their needs and wants Resource management : how communities regulate their use of resources Argument/context : Many countries of low levels of development enjoy an abundance of natural resources, and the way
these resources are used and managed are shaped by a variety of factors Economic and technological factors influence the way a resource is appraised, hence changing the way
a resource can be mobilised and managed over time However, other factors can also influence the appraisal and subsequent use and management of
resources Body P1 : Technological factors affect use of resources

9
P2 : Economic factors affect use of resources P3 : Economic and technological factors affect the management of resources P4 : Political factors affect use and management of resources P5 : Social factors affect use and management of resources Conclusion : (has the use and management of resources been influenced by economics and technology in developing countries ?)
• Economics and technology definitely significant factors in the use and management of resources developing countries
• Not the only factors – ultimately, interaction and interplay of factors

10
5(a) Explain the challenges in measuring urban liveability in countries at higher levels of development. [12] KS DESCRIPTOR
1) Determining the aspects to be measured : Contested concept • Such contestations in meaning is reflected in the different ranking criteria used in liveable city
rankings such as the Economic Intelligence Unit (EIU), Monocle and Mercer. Although all 3 indicators are geared towards the needs of expatriates, they deploy different indicators. For instance, EIU doesn’t have a specific indicator to measure economic aspects. Mercer includes indicator on natural disasters while Monocle and EIU lacks such an indicator.
• Such disagreements point to not only different measurement criteria in detemining what a highly liveable city is but also normative judgements about what “good” cities and good urban living environment should look like. Ultimately, as pointed out by Pacione (2009), urban liveability is hard to define because it is a relative term, whose precise meaning depends on the place, time, purpose of the assessment and on the value system of the assessor.
2) Determining the methods of measurement
3) Sourcing for relevant data

11
5 (b) “Although there are solutions to managing traffic congestion, these solutions often bring other problems”. With reference to cities in developed countries, discuss this statement. [20] Indicative content Introduction
• Define – traffic congestion • Argument – often argued that solutions to managing traffic congestion bring other problems due
their inherent limitations • Balance argument – However, not all transport management strategies bring problems ;
selected strategies can bring positive impacts Body P1 : Problems associated with supply fix policies
P2 : Problems associated with demand management policies
P3 : Problems associated with other strategies P4 : However, can be argued that some of these problems are short-term and can be easily reversed with specific policies P5 : Despite these limitations, there are also strategies that bring benefits (positive externalities?) beyond curbing congestion Conclusion : “Although there are solutions to managing traffic congestion, these solutions often bring other problems”.
• Often argued that solutions to managing traffic congestion bring other problems due their inherent limitations . However, not all transport management strategies bring problems ; selected strategies can bring positive impacts as well.
• This suggests that implementation of transport management strategies entails a holistic evaluation of various impacts (environmental, economic, social) to ensure that these strategies are sustainable solutions for urban dwellers.

12
6 (a) With reference to cities in countries at varying levels of development, explain why pluvial floods are considered hazardous. [12] Overview statement : Pluvial floods considered hazardous as they cause adverse social ad economic impacts Case study 1 : SG
• Refer to lect book • However, due to heavy investment in flood management strategies in a HIC city such as SG,
pluvial flood episodes are curbed in terms of magnitude and intensity, leading to reduced losses. Case study 2 : Chennai, India
• Refer to lect book
• As compared to a HIC city, LIC cities such as Chennai suffer more adverse impacts due to poorer flood management strategies that lead to more frequent and extensive pluvial floods. In addition, a large proportion of the urban residents are highly vulnerable (ie : slum dwellers), culminating in greater losses.

13
6 (b) Evaluate the extent to which changes of catchment characteristics can mitigate the impacts of pluvial floods in urban environments. [20] Intro
• Define : mitigate impacts (reduce adverse economic and social impacts associated with pluvial floods)
• Argument : Changes to the catchment can mitigate impacts of pluvial floods by reducing the generation of HOF which is a key cause of pluvial floods
• Balance argument : • However, strategies involving changes of catchment characteristics do have limitations • In addition , the generation of HOF is not the only cause of pluvial floods; tidal flooding and
overwhelmed canals also contribute to pluvial floods, and hence entail other management strategies
• Finally, beyond addressing the cause of floods, strategies that mitigate impacts solely such as flood forecasting and community preparedness are also vital in the management of pluvial floods.
Body P1 : Strategies involving changes of catchment characteristics P2 : Limitations of strategies involving changes of catchment characteristics P3 : Other causes of floods entail other management strategies P4 : Other management strategies Conclusion (are changes to catchment characteristics mitigate the impacts of pluvial floods in urban environments?)
• Changes to the catchment are a key strategy in curbing flood impacts as it is the catchment characteristics that contributing to pluvial flooding
• However, strategies involving changes of catchment characteristics do have limitations. In addition , there are other causes of pluvial floods that entail other management strategies. Finally, beyond addressing the cause of floods, strategies that mitigate impacts solely such as flood forecasting and community preparedness are also vital in the management of pluvial floods.
• In conclusion, variety of strategies are needed to reduce impacts of pluvial floods in urban environments

1
Name: _____________________________________ CG: ________ Date: ________________
SERANGOON JUNIOR COLLEGE
JC2 H2 P2 GEOGRAPHY 2018 Preliminary Answer Scheme
DRQ 1
Rubric Criteria to hit
Marks Reflection (i) How different is my answer from the rubric?
(ii) Why is it different?
a) Using Resource 1, identify the features that show attempts to regenerate the High Line.
Some ideas : • Greening of the city via the creation of the linear park improves aesthetic appeal and improves the
walkeability of the high line • Pedestrianisation (building of an elevated linear park facilitates pedestrian flows above vehicular traffic). • Addition of cultural attractions such as the Whitney Museum of American Art and The Plinth appeal to both
locals and tourists • etc
[4]
(b) Suggest reasons why the students conducted focus group discussions and categorised the focus groups as shown in Resource 2.
• As the research focus is about the needs of low income groups, focus groups provide a means to derive a rich source of qualitative data. Personal contact between the facilitator and participants often results in more meaningful
answers.
[5]

2
In focus groups, participants can build on each others’ answers, leading to a wider range of responses.
• Unlike interviews, focus groups allows for the researcher to gather the opinions of a large number of
people for comparatively little time and expense.
• The participants are categorised according to age and ethnicity as different demographic characteristics have different needs and experiences of the High Line : For younger age groups, they may desire more recreation and leisure along the High Line. While
older age groups, may desire more job opportunities and access to affordable amenities / services. Ethnic minorities may be seeking more inclusive activities
• Being in a group with similar age and ethnicity may also make the participants more at ease, facilitating
the generation of responses (c) Explain how the group may overcome ethical concerns they face in their collection of primary data for this investigation.
• Informed consent – Before the session, the group should be informed of the research focus, demands and risks associated with the focus group discussion • Communicate and enforce ground rules - In a focus group setting, participants may be rude and judgemental ; the student facilitator should enforce expectations on appropriate behaviour during the session. • Be respectful when speaking to participants – do not pass judgment or make jokes about what they share • Do not ask sensitive information – Avoid asking personal information such as income, employment, specific age, marital status. If such information needs to be solicited, do so via self-administered questionnaire survey so as to protect the privacy of the participants.
[4]

3
d) Outline the steps you will take to analyse and present the data collected from the focus group discussions.
Record Transcription Coding : - Prepare a list of themes/topics ; these were serve as codes in the transcript - Annotate these themes/topics in the transcript
Presentation of data : - Prepare an executive summary with the key findings from the coding and analysis of the transcript
[5]

4
(e) Using Resources 1 and 3, evaluate if the needs of local residents have been met and suggest how this evaluation can aid urban planning.
Level Marks Descriptors
3 6-7 Response demonstrates a clear knowledge and understanding of the context in the question. Uses relevant, detailed and accurate factual information and conceptual understanding. Reflects strong critical thinking skills and may include perceptive insights for the strongest responses. Source(s) is well used to support the response. Provides a logical and well-developed evaluation well founded on evidence and/or different viewpoints. OR Makes a decision which clearly addresses different elements of the issue and/or interest of different stakeholders
2 4-5 A satisfactory response which is generally sound and contains relevant points, but may not always focus on the context in the question. Uses factual information and conceptual understanding that is generally appropriate to the given context but lacks detail and may contain some inaccuracies. Displays general critical thinking skills. Source(s) is used to support parts of the response. Provides an evaluation, which may be limited in depth and sufficient elaboration in some parts. OR Shows some attempt to address different elements of the issue and/or views of different stakeholders when making a decision but is not well-developed
1 1-3 Response shows a poor understanding of the context in the question. Uses basic factual information and conceptual understanding which has some, but limited relevance to the question. Source(s) is not used or not accurately used to support the response. Provides little or no evaluation
[7]

5
OR •evidence of decision-making, if present, is simple and may be flawed
0 0 No creditworthy response. Evaluation Overall evaluation : Largely not met, given the dominance of negative feedback regarding regeneration efforts. Evident that the bulk of new amenities, services and infrastructural improvements cater to tourists and the rich, neglecting the needs of low-income residents.
• To some extent , yes: Cite relevant evidence
• To a large extent, no : Provision of amenities and services lacking Recreation inadequate Likely that specific groups feel more excluded than others
o Although the estate is near the High Line Park, which is accessible by two stairs, this may be inaccessible to the elderly and immobile
o Closing down of nearby provision shops affects the elderly more, as they are less physically mobile and will have difficulty accessing shops further away
• More information needed to assess if needs have been met: Types of needs of specific demographic groups Employment opportunities
Relevance to urban authorities
• By understanding the impacts of such urban regeneration projects on low income residents, urban authorities are able to plan for infrastructure, amenities and services that are more inclusive. For example : Ensuring that there is a catchment of provision shops and cheaper eateries closer to low-income
public housing estates. Plan for more appealing arts and cultural activities (eg – Latin dance parties) along the High line

6
Creating recreational spaces for local communities in their neighbourhood (such as skating parks)

7
DRQ 4
Rubric Criteria to hit
Marks Reflection (i) How different is my answer from the rubric?
(ii) Why is it different? a) Suggest three reasons for the trends in Myanmar’s electricity production by hydropower from 2003-
2012, as observed in Resource 1.
o Steady increase and subsequent domination of hydropower as a source of electricity (cite stats) o Possible reasons :
High costs of importing or extracting fossil fuels, thus rendering hydropower a less costly energy option
Abundance of rivers located in mountainous areas make tapping hydropower economically feasible
Financial support from international banks to develop hydropower capabilities due to increasing emphasis on renewable energy (esp in light of climate change)
[5]
(b) Using Resource 2, compare the distribution of existing and planned hydropower plants in Myanmar.
Existing Planned
Difference 1 Southern and central regions of Myanmar
Northern and more peripheral regions of Myanmar
[4]

8
Difference 2 Located close to major cities and state capitals. For instance, there is a cluster of 4 hydro power plants near Nay Pyi Taw, 4 plants near Lolkaw and another 6 near Mandalay and Sagaing.
Located further from major cities and state capitals.
(c) With reference to Resource 3 and your own knowledge, outline possible reasons why local communities opposed the construction of the Myitsone dam.
Given the many mega-dam projects built along the Mali and N’Mai rivers, local communities will be well aware of the various issues pertaining to these projects, intensifying opposition.
o Political reasons : In light of ongoing conflicts between various ethnic minority groups and the government, there
may be a lingering distrust of the government’s intentions in approving this mega-dam project, hence leading to lack of local support.
o Environmental reasons : Building of dam is likely to inundate forests located upstream of the Myitsone Dam. There will be
significant loss of biodiversity, esp. since the site is identified as one of the world’s top biodiversity spots
Impoundment of water behind a dam can also trigger earthquakes. The huge volume of water impounded can assert stress on crustal rocks. This is of specific concern as the region is tectonically active.
Construction of a dam can block or delay upstream fish migration and can lead to the decline or even extinction of species that depend on longitudinal movements along the stream during different phases of their life cycle.
o Cultural reasons :
[8]

9
There will be loss of significant historical and cultural sites at the Mali and N’mai Hka river due to inundation following the building of the dam. This loss can threaten the cultural identity of the many ethnic minority groups residing in the region.
o Social reasons : Big dams often displace inhabitants of the area to be inundated. Most affected communities are
ethnic minority groups, which are already economically and socially vulnerable. While compensation may be offered, many inhabitants may not possess formal ownership documents, slowing or preventing legal compensation.
o Economic reasons: Although the sale of energy to China will earn export revenue for Myanmar, some may question
the extent of economic benefits for local communities. Agriculture and livelihoods will be adversely affected. Mega dams reduce flow downstream,
leading to less flooding, hence floodplains will not be recharged with fertile sediment. Even if flooding did occur, input of fertile sediment is limited due to trapping of sediment behind the dam.
Decline in aquatic species can adversely affect fisheries.
(d) Citing evidence from all resources and your own knowledge, recommend whether Myanmar should prioritise further investment in hydropower or develop wind power capabilities.
Level Marks Descriptors
3 7-8 Response demonstrates a clear knowledge and understanding of the context in the question. Uses relevant, detailed and accurate factual information and conceptual understanding. Reflects strong critical thinking skills and may include perceptive insights for the strongest responses. Source(s) is well used to support the response. Provides a logical and well-developed evaluation well founded on evidence and/or different viewpoints. OR Makes a decision which clearly addresses different elements of the issue and/or
[8]

10
interest of different stakeholders 2 4-6 A satisfactory response which is generally sound and contains relevant points,
but may not always focus on the context in the question. Uses factual information and conceptual understanding that is generally appropriate to the given context but lacks detail and may contain some inaccuracies. Displays general critical thinking skills. Source(s) is used to support parts of the response. Provides an evaluation, which may be limited in depth and sufficient elaboration in some parts. OR Shows some attempt to address different elements of the issue and/or views of different stakeholders when making a decision but is not well-developed
1 1-3 Response shows a poor understanding of the context in the question. Uses basic factual information and conceptual understanding which has some, but limited relevance to the question. Source(s) is not used or not accurately used to support the response. Provides little or no evaluation
OR •evidence of decision-making, if present, is simple and may be flawed
0 0 No creditworthy response. Possible argument(s) : develop wind power capabilities instead
• Hydropower projects (esp. mega dam projects) bring extensive negative impacts and are highly controversial. In contrast, wind power brings less extensive adverse impacts (ecological impact such as death of birds is rare ; due to the remote location of many wind power plants, adverse impacts on local communities such as noise pollution are limited).
• Hydropower is an unreliable source of energy during drier months, unlike wind power which is relatively consistent throughout the year.
• Further technological advancements can increase energy generation from wind power plants, such as offshore wind turbines.

11

12

JC2H2PE2018 PAPER 1
1
TEMASEK JUNIOR COLLEGE
PRELIMINARY EXAMINATION 2018
GEOGRAPHY 9751/01 Higher 2 Paper 1 3 HOURS Additional Materials: World Outline Map
READ THESE INSTRUCTIONS FIRST Write your Centre number, index number, name and CG on all the work you hand in. Begin the answer to each question on a fresh sheet of paper. Write in dark blue or black pen. You may use a soft pencil for any diagrams, graphs or rough working. Do not use highlighters, glue or correction fluid. Answer three questions, one from each section. You should make reference to appropriate examples studied in the field or the classroom, even where such examples are not specifically requested by the question. Diagrams and sketch maps should be drawn whenever they serve to illustrate an answer. The world outline map may be annotated and handed in with relevant answers. You are reminded of the need for good English and clear presentation in your answers. At the end of the examination, fasten all your work securely together. The number of marks is given in brackets [ ] at the end of each question or part question. You should spend time according to marks allocated to questions.
This document consists of 3 printed pages and 1 blank page

JC2H2PE2018 PAPER 1
2
SECTION A – Tropical Environments
Answer one question from this section. All questions carry 32 marks.
1 (a) Explain how changes in the pathways and water stores in a drainage basin
affect discharge in a river channel. [12] 1 (b) To what extent is an understanding of channel morphology important in
explaining the processes that occur in river channels? [20] 2 (a) With the aid of the rock cycle, explain the formation and characteristics of
a named igneous, sedimentary and metamorphic rock respectively. [12] 2 (b) Discuss the view that karst landforms in the humid tropics are the result of
present day processes. [20]
SECTION B – Development, Economy and Environment Answer one question from this section. All questions carry 32 marks.
3 (a) Explain how the Multidimensional Poverty Index has helped in measuring
and monitoring development across countries in the developing world. [12] 3 (b) Assess the usefulness of the dependency theory in understanding
development across the world. [20] 4 (a) Explain the characteristics of extractive industries and their development in
resource-rich countries. [12] 4 (b) “Extractive industries are a curse for resource-rich countries and their
environment.” How far do you agree with the statement? [20]

JC2H2PE2018 PAPER 1
3
SECTION C – Sustainable Development
Answer one question from this section. All questions carry 32 marks.
5 (a) Explain how Rio Earth Summit and Rio+20 have contributed to the pursuit
of sustainable development for countries with fast growing populations. [12] 5 (b) To what extent are the effects of climate change on sustainable
development always negative? [20] 6 (a) With reference to one city that you have studied, explain the factors
affecting its liveability. [12] 6 (b) “It is easy to create a city but difficult to create a liveable one.”
To what extent are liveability issues in cities hard to manage? [20]
END OF PAPER

JC2H2PE2018 PAPER 1
4
BLANK PAGE

JC2H2PE2018 PAPER 2
1
TEMASEK JUNIOR COLLEGE
PRELIMINARY EXAMINATION 2018
GEOGRAPHY 9751/02 Higher 2 Paper 2 3 HOURS Additional Materials: Resource Booklet World Outline Map
READ THESE INSTRUCTIONS FIRST Write your Centre number, index number, name and CG on all the work you hand in. Begin the answer to each question on a fresh sheet of paper. Write in dark blue or black pen. You may use a soft pencil for any diagrams, graphs or rough working. Do not use highlighters, glue or correction fluid. Answer all questions. You should make reference to appropriate examples studied in the field or the classroom, even where such examples are not specifically requested by the question. Diagrams and sketch maps should be drawn whenever they serve to illustrate an answer. The world outline map may be annotated and handed in with relevant answers. You are reminded of the need for good English and clear presentation in your answers. At the end of the examination, fasten all your work securely together. The number of marks is given in brackets [ ] at the end of each question or part question. You should spend time according to marks allocated to questions. All resources referred to in the question paper are in the Resource Booklet.
This document consists of 6 printed pages

JC2H2PE2018 PAPER 2
2
SECTION A
Answer the question below. The question carries 25 marks.
Theme 4: Geographical Investigation
1 Sungei Kadut Industrial Estate is located in northwestern Singapore known for its furniture making and the manufacturing of automobile parts. It is located in close proximity to the Choa Chu Kang housing estate. A group of five junior college students were tasked to carry out a geography fieldwork exercise at the Sungei Kadut Industrial Estate to investigate the impact of these industries on the environment. The students decided to conduct pH and turbidity tests along the Pang Sua river to determine the water quality within the industrial estate. Both pH and turbidity are significant measures of water quality, whereby pH measures how alkali or acidic the river is, while turbidity measures the concentration of particulate matter found in the river. Both the pH and turbidity are in turn affected by the nature of the effluence entering the river from the surrounding catchment area. The students chose five locations that were accessible by road for their data collection. As a group, the students moved from site to site over the span of three hours on a Saturday morning to conduct their study. The equipment used by the students included:
• White container for the water sample with Secchi disk sticker adhered to the base of the container (to measure turbidity)
• 5 10ml test tubes • 10 pH test kit tablets • Indicator chart (to match turbidity and pH values) • Latex Gloves
After the tests were completed, the data were compiled and analysed by the students so that conclusions could be made about the impact of the Sungei Kadut Industrial Estate on the environment.

JC2H2PE2018 PAPER 2
3
Study Resources 1 and 2. Resource 1 is a map of the area around Sungei Kadut Industrial Estate and shows the five locations where the students collected their data at. Resource 2 shows the procedure undertaken by the students at each sample site to measure pH and turbidity along the Pang Sua River.
(a) Design a recording sheet that the students may use to collate their data
collected across the different sites marked out in Resource 1. [3] (b) With reference to Resources 1 and 2, explain the limitations pertaining to
the planning and data collection of the investigation. Suggest how these limitations can be overcome. [7]
(c) Suggest how the students can mitigate the potential risks that may arise
when undertaking this investigation. [3] (d) Explain why the group’s data may differ if they had conducted their
investigation after a heavy thunderstorm. [4] (e) Suggest how the group of students can extend their investigation to
examine the impact of Sungei Kadut Industrial Estate on local communities. [8]

JC2H2PE2018 PAPER 2
4
SECTION B
Answer the question below. The question carries 25 marks.
Theme 1: Tropical Environments
Climate Characteristics and Physical Processes in Australia
2 Resource 3 shows the climograph of Cairns, Australia. Resource 4 shows the global average sea surface temperatures (SST) anomalies between 11 October 2015 and 7 November 2015. Resource 5 shows various physical processes that influence the climate of Australia. Resource 6 shows the effects of Tropical Cyclone Yasi on a town in Cairns in 2011.
(a) With reference to Resource 3, briefly describe the climograph of Cairns. [2] (b) With the aid of a diagram and Resource 4, explain how the change in
average sea surface temperatures in the Pacific Ocean between 11 October 2015 and 7 November 2015 could affect the weather conditions in Eastern Australia. [6]
(c) Compare the tracks of Tropical Cyclones George and Yasi shown in
Resource 5. [3] (d) Suggest strategies that could be used to minimise the effects of flooding
arising from the tropical cyclone shown in Resource 6. [5] (e) With reference to the resources provided and your own knowledge, how
far do you agree that the ITCZ is primarily responsible to explain the climate of Cairns? [9]

JC2H2PE2018 PAPER 2
5
SECTION C
Answer the question below. The question carries 25 marks.
Theme 2: Development, Economy and Environment
Global Production Network of Semiconductors
3
Resource 7 shows the network connections and profits earned by countries in producing manufactured goods between 2000 and 2011. The size of the circle shows the profit earned for a country. The thickness of the line shows the intensity of network connections between countries. Resource 8 traces the path of production of a semiconductor. Semiconductors, also known as microchips, are the ‘brains’ of all modern electronics and drive the digital economy. They are critical to the function of a range of products from everyday consumer electronics like laptops and mobile phones, to sophisticated equipment in economic sectors like aerospace and finance. Resource 9 shows the spatial organisation of six major semiconductor transnational corporations in 2016.
(a) Describe the changes in the pattern of network connections from 2000 to
2011 shown in Resource 7. [3] (b) Identify the change in Mexico’s profits in manufactured goods between
2000 and 2011 shown in Resource 7 and suggest reasons for this change. [6] (c) Describe the spatial distribution of the production circuit of the
semiconductor shown in Resource 8. [3] (d) With reference to Resources 8 and 9, explain how the organisation of the
semiconductor industry has benefitted USA. [4] (e) With reference to the resources provided, how far do you agree that USA
is the most dominant player in the global semiconductor industry? [9]

JC2H2PE2018 PAPER 2
6
SECTION D
Answer the question below. The question carries 25 marks.
Theme 3: Sustainable Development
Issues of Urban Sustainability in Nairobi, Kenya
4 Nairobi is the capital and largest city of Kenya. With a population of 3.5 million residents, it is one of the fastest growing cities in Africa at a rate of 6 percent annually. More than half of the population in Nairobi live in slums. Resource 10 is a photograph showing changes in an urban area in Nairobi, Kenya between 1950 and 2010. Resource 11 is an excerpt from a news article on traffic conditions in Nairobi. Resource 12 shows a town plan of Dandora, which is a suburb in the eastern part of Nairobi. The resource also shows the location of Dandora in Nairobi.
(a) With reference to Resource 10, compare the changes in the urban area
between 1950 and 2010. [4] (b) State three ways in which Nairobi might be considered unsustainable
using evidence from Resource 11. [3] (c) With reference to Resource 11 and your own knowledge, account for the
traffic conditions in Nairobi. [6] (d) With reference to Resource 12, explain why Dandora may be an attractive
location for slum settlements. [6] (e) With the aid of examples, suggest three reasons why the waste
management strategy shown in Resource 12 is a poor solution to Nairobi’s waste problems. [6]
END OF PAPER

JC2H2PE2018 PAPER 2
1
FIGURE 1A FOR QUESTIO
This document consists of 10 printed pages
READ THESE INSTRUCTIONS FIRST This resource booklet contains the resources referred to in the questions as well as the World Outline Maps
TEMASEK JUNIOR COLLEGE
PRELIMINARY EXAMINATION 2018
GEOGRAPHY 9751/02 Higher 2 Paper 2 3 hours RESOURCE BOOKLET

JC2H2PE2018 PAPER 2
2
Resource 1 for Question 1
Map of fieldwork site
Key: X = location of study

JC2H2PE2018 PAPER 2
3
Resource 2 for Question 1
Data collection procedure undertaken by students to measure pH and turbidity of Pang Sua River

JC2H2PE2018 PAPER 2
4
Resource 3 for Question 2
Climograph of Cairns, Australia
Resource 4 for Question 2
Global average sea surface temperatures (SST) anomalies between 11 October 2015 and
7 November 2015

JC2H2PE2018 PAPER 2
5
Resource 5 for Question 2
Physical processes influencing the climate of Australia
Resource 6 for Question 2
Effects of Tropical Cyclone Yasi on a town in Cairns in 2011

JC2H2PE2018 PAPER 2
6
Resource 7 for Question 3
Network connections and profits earned by countries in producing manufactured goods between 2000 and 2011
= Profits earned by a country
= Intensity of network connections

JC2H2PE2018 PAPER 2
7
Resource 8 for Question 3
Map of a semiconductor’s production network

JC2H2PE2018 PAPER 2
8
Resource 9 for Question 3
Spatial organisation of six major semiconductor transnational corporations in 2016
Location of Headquarters: Intel - USA Micron - USA Infineon - Germany NXP - Netherlands Toshiba - Japan Samsung – South Korea

JC2H2PE2018 PAPER 2
9
Resource 10 for Question 4
Urban change in Nairobi, Kenya between 1950 and 2010

JC2H2PE2018 PAPER 2
10
Resource 11 for Question 4
An excerpt from a news article on traffic conditions in Nairobi, Kenya
Nairobi has been ranked the second-worst city in the world on traffic congestion. On average, Nairobians spend 62.44 minutes in traffic while Kolkatans spend an average of 68.86, Mumbai 60.11, Jakarta 56.98 and Manila 56.77 minutes.
Frederick Karanja, the Nairobi County chief officer for roads and public works, said the volume of cars has contributed to the endless traffic jams in the city. Mr Karanja said lack of a proper and organised public transport system in the city has increased the number of personal vehicles. The nature of Nairobi’s roads is also to blame, with the designs a major contributor to jams. Mr Karanja also blamed boda boda* operators and taxis parking haphazardly along roads for the traffic mess.
It is expected that the congestion leads to an estimated 58 million shillings a day of lost productivity in the city, and as many as 13,000 people killed in road accidents a year. People exposed to the daily hassles of traffic jams also suffer from health problems as the air quality exceeds the World Health Organisation’s limits. These health problems include heart disease, asthma, obesity, aging and gastrointestinal problems, among many others.
*Boda bodas are bicycle and motorcycle taxis commonly found in East Africa.
Resource 12 for Question 4
Town plan of Dandora in East Nairobi
Slum

JC2H2PE2018 PAPER 1 TEMASEK JUNIOR COLLEGE GEOGRAPHY DEPARTMENT
1
SECTION A – Tropical Environments
1 (a) Explain how changes in the pathways and water stores in a drainage basin
affect discharge in a river channel. Indicative Content Focus on the question should be on the pathways and water stores in a drainage basin, which include:
• Pathways: overland flow, infiltration, percolation, throughflow and baseflow
• Water stores: interception and biological water storage, soil water storage, groundwater storage, channel storage
[River] discharge could be interpreted as an output. As such, students should be thinking about how the pathways and water stores would have an effect on river discharge. A higher level response will focus on how the pathways and water stores changes and its resultant effect on discharge in a river channel. Students could see the link of discharge to hydrographs and draw connections in their answer to it. Levels marked using H2 generic level descriptors for 12m
[12]
1 (b) To what extent is an understanding of channel morphology important in
explaining the processes that occur in river channels? Having established the pathways and water stores in the drainage basin and its effect on river discharge in (a), candidates would now discuss the relationship between channel morphology and the processes that occur in the channel. Indicative Content: Candidates would be required to have an understanding of what constitutes channel morphology. Furthermore, candidates will need to identify the processes that occur in river channels, which includes erosion, transportation and deposition. Candidates will then need to make the link as to how the fluvial processes shape channel morphology. However, there are other elements that also are impoetant in explaining the processes that occur in the river channel. A higher level response will would see that there is no standard channel morphology and this is result of various combinations of the fluvial processes and the factors that shape them. Examples could be used to illustrate the interplay of these factors, processes and forms. Possible links to other topics include effects of tropical deforestation (Topic
[20]

JC2H2PE2018 PAPER 1 TEMASEK JUNIOR COLLEGE GEOGRAPHY DEPARTMENT
2
1.2), the actions of extractive industries (Topic 2.2) and the effects of climate change (Topic 3.1). Levels marked using H2 generic level descriptors for 20m
2 (a) With the aid of the rock cycle, explain the formation and characteristics of
a named igneous, sedimentary and metamorphic rock respectively. Indicative Content: The rock types that need to be considered in relation to the rock cycle would include ignrous, sedimentary and metamorphic rocks. A higher level response will focus on one named rock type as stipulated by the question. In understanding these rock type in detail, candidates will be able to provide a range of characteristics about it. Furthermore, better responses will recognise that these rock types are all linked as seen through the rock cycle. Levels marked using H2 generic level descriptors for 12m
[12]
2 (b) Discuss the view that karst landforms in the humid tropics are the result of
present day processes. Having established the characteristics of rocks and how they are linked to one another in (a), attention is now turned to the landforms that arise from the different rock types and the processes involved in shaping their formation. Indicative Content: Candidates would be required to realise that karst landforms are a topography that are associated with limestone. The types of landforms that candidates may engage with in their answer include tower karst, cone karst and isolated karst. They should also be able to make linkes to the processes and factors that underlie the formation of karst landscapes in the humid tropics. A higher level response will be able to interrogate the term ‘present day’ in greater details, and realise that not all processes occurring are still active in the present day. They could highlight the condititions that would set the context on whether these processes are happening in the present day or not. Possible links to other topics include effects of tropical deforestation (Topic 1.2), the actions of extractive industries (Topic 2.2) and the effects of climate change (Topic 3.1).
[20]

JC2H2PE2018 PAPER 1 TEMASEK JUNIOR COLLEGE GEOGRAPHY DEPARTMENT
3
Levels marked using H2 generic level descriptors for 20m
SECTION B – Development, Economy and Environment
3 (a) Explain how the Multidimensional Poverty Index has helped in measuring and monitoring development across countries in the developing world. Indicative Content: Multidimensional Poverty Index (MPI) is one of the tools that has been partially created by the United Nations as a means of measuring and monitoring development across the world. A higher level response will be able to place emphasis on the context of how MPI has aided in the measuring and monitoring development across countries in the developing world. Stronger candidates will recognise that development affects multiple domains of life. Examples would improve the overall quality of the answer. Levels marked using H2 generic level descriptors for 12m
[12]
3 (b) Assess the usefulness of the dependency theory in understanding
development across the world. Having considered about the state of development in countries of the developing world in (a), candidates would now evaluate the different ways of thinking about development as proposed by certain schools of thought and its usefulness to understanding development across the world more broadly. Indicative Content: Candidates should demonstrate an understanding of dependency theory. In particular, candidates will need to show how dependency theory does play out in the state of development in the world today. Candidates will also need to show the ways in which the dependency theory is not useful in understanding the state of development in the world today. A higher level response will be able to show how other theories may be more useful in understanding development across the world. Another approach would be to recognise that the usefulness of the theories may be spatially and temporally specific. Possible links to other topics include physical processes (Topic 1.1), and/or natural environment and resources (Topic 2.2) and aims of sustainable development (Theme 3.1).
[20]

JC2H2PE2018 PAPER 1 TEMASEK JUNIOR COLLEGE GEOGRAPHY DEPARTMENT
4
Levels marked using H2 generic level descriptors for 20m
4 (a) Explain the characteristics of extractive industries and their development in
resource-rich countries. Indicative Content: Some of the characteristics of extractive industries include it being location specific, location specific, capital and technology intensive, and a mixture of large private and state-owned firms. Candidates must demonstrate how extractive industries have developed in resource-rich countries. A higher level response will be able to provide examples of resource-rich countries and how the extractive industry has taken root on their shores. Candidates may also base their knowledge of an example of a resource firm and the expansion of their business into resource-rich countries globally. Levels marked using H2 generic level descriptors for 12m
[12]
4 (b) “Extractive industries are a curse for resource-rich countries and their
environment.” How far do you agree with the statement? Having considered the nature of extractive industries and its development in (a), candidates would now apply this and assess the impact of the industry on resource-rich countries. Indicative Content: Responses should include a discussion of the various impacts that are experienced by resource-rich countries and their environment. A higher level response will be able engage in a detailed discussion of impacts that are not solely centred on the environment. Evaluation should be able to weigh whether or not the industry has been a curse on the countries and their environment. Students may also see the connection of the question to the resource-curse thesis. However, they may also see that there are exceptions to this curse. Possible links to other topics include reference to the management of tropical deforestation (Topic 1.2), influence of TNCs (Topic 2.1), responses to climate change that limits resource exploitation (Topic 3.1). Levels marked using H2 generic level descriptors for 20m
[20]

JC2H2PE2018 PAPER 1 TEMASEK JUNIOR COLLEGE GEOGRAPHY DEPARTMENT
5
SECTION C – Sustainable Development
5 (a) Explain how Rio Earth Summit and Rio+20 have contributed to the pursuit of sustainable development for countries with fast growing populations. Indicative Content: Responses should demonstrate an understanding of Rio de Janeiro 1992 UN Conference on Environment and Development (a.k.a. Rio Earth Summit) and the Rio de Janeiro 2012 UN Conference on Sustainable Development (a.k.a. Rio+20). These international conferences were guided by the goal to achieve sustainable development, as set forth by the ‘our Common Future’ report and its key tenets. A higher level response were attained when candidates were able to contextualise their answers to countries with fast growing populations. They could also enhance their overall answers by providing examples of outcomes from the conferences that have taken root in these countries with fast growing populations and improved their sustainability. Levels marked using H2 generic level descriptors for 12m
[12]
5 (b) To what extent are the effects of climate change on sustainable
development always negative? Having established the concept of sustainable development and its real-world applications in (a), candidates would now consider how climate change affects the world’s goal to achieve sustainability. Indicative Content: Climate change is largely agreed by many scientists to be caused mainly by human activities. Reports by the Intergovernmental Panel on Climate Change (IPCC) warns that climate change could compromise our pursuit of sustainable development. This seems to suggest that climate change has negative impacts on our pursuit of sustainable development. As such, candidates would be required to showcase the possible effects of climate change on sustainable development. A higher level response will recognise that climate changes has an impact of different aspects of our lives, covering the domains of politics, economics, society and environment. Candidates may also make links of how the negative impacts may be minimised with the responses to climate change that have been put in place in society’s and governments’ pursuit of sustainable development. Possible links to other topics include Millenium Development Goals (Topic
[20]

JC2H2PE2018 PAPER 1 TEMASEK JUNIOR COLLEGE GEOGRAPHY DEPARTMENT
6
2.1), considerations of sustainable development at the urban scale (Topic 3.2), influence of other actors such as TNCs (Topic 2.1), resource exploitation and its link to climate change (Topic 3.1). Levels marked using H2 generic level descriptors for 20m
6 (a) With reference to one city that you have studied, explain the factors
affecting its liveability. Indicative Content: Responses should be able to highlight a range of factors that affect the liveability of a particular city that they have chosen to engage with in this answer. A higher level response will highlight a broad range of factors that affect urban liveability that could be political, socio-economic and environmental in nature. They may also make use of their understanding of the measures of liveability to enhance their answers. Levels marked using H2 generic level descriptors for 12m
[12]
6 (b) “It is easy to create a city but difficult to create a liveable one.”
To what extent are liveability issues in cities hard to manage? Having established the factors that affect urban liveability in (a), candidates would now consider the challenges and solutions used to create liveable cities and their overall effectiveness. Indicative Content: Responses should consider various aspects of urban liveability. These include urban reimaging and how it is used to raise the quality of urban living space, addressing the needs of different social groups in the city, and responding to environmental hazards in cities such as pluvial floods. Each of these aspects of urban liveability have strategies that may be used to improve the overall liveability of cities, but with various levels of success. A higher level response could apply a set of criteria or criterion to evaluate these different strategies. Another approach could be to consider what had been achieved in spite of the challenges specific to the city mentioned. Possible links to other topics include quality of flood management strategies (Topic 1.2), addressing the Millenium Development Goals (Topic 2.1), the concept of sustainable development (Topic 3.1).
[20]

JC2H2PE2018 PAPER 1 TEMASEK JUNIOR COLLEGE GEOGRAPHY DEPARTMENT
7
Levels marked using H2 generic level descriptors for 20m

JC2H2PE2018 PAPER 2 TEMASEK JUNIOR COLLEGE GEOGRAPHY DEPARTMENT
1
SECTION A Theme 4: Geographical Investigation
1 (a) Design a recording sheet that the students may use to collate their data
collected across the different sites marked out in Resource 1. Award 1 mark for title, award 2 mark for accurate components in data recording sheet (including consideration of sites, pH and turbidity scores).
[3]
(b) With reference to Resources 1 and 2, explain the limitations pertaining to
the planning and data collection of the investigation. Suggest how these limitations can be overcome. Indicative Content:
• Uneven spacing of sites – to be overcome by ensuring even spacing of sites along Pang Sua River
• Impacts of water quality not only limited to Pang Sua River – to be overcome by also looking at other potential sites where water quality may be affected by industries
• Too limiting to conduct study on Saturday morning – other days and times to be considered
• Timing of data collection at sites to also be reassessed • Method of data collection has issue of subjectivity – overcome by
using more sophisticated equipment to take readings of pH and turbidity. Consider also other ways to measure water quality.
• Getting more students involved to conduct study for greater effectiveness and more reliable data.
[7]
(c) Suggest how the students can mitigate the potential risks that may arise
when undertaking this investigation. Indicative Content:
• Road safety • Attire for fieldwork • Safety from falling into channel • Safety from chemicals in channel • Weather-related considerations
[3]
(d) Explain why the group’s data may differ if they had conducted their
investigation after a heavy thunderstorm. Indicative Content:
[4]

JC2H2PE2018 PAPER 2 TEMASEK JUNIOR COLLEGE GEOGRAPHY DEPARTMENT
2
• Increase in turbidity – addition of sediment from surrounding area picked up by overland flow
• Decrease in turbidity – addition of rainfall into channel discharge • Neutralising pH value – addition of rainfall into channel discharge • Lowering pH value – effect of acid rain
(e) Suggest how the group of students can extend their investigation to
examine the impact of Sungei Kadut Industrial Estate on local communities. Indicative Content: Candidates will need to consider what the other impacts may be that arise due to the activities in the industrial estate. A higher level response will highlight the various groups of people that may make up the local community in the area around the Sungei Kadut Industrial Estate, of which they may experience different forms of impacts due to the activities at the industrial estate. They may also consider the adaptions of the investigation in alignment with the five stages of investigation, which include:
• Crafting the research question or hypothesis • Developing a plan for the new investigation • How to go about collecting data • How to best present and analyse the collected data • Evaluating and communicating the new findings
Levels marked using an adapted version of the H2 generic level descriptors for Theme 4.
[8]

JC2H2PE2018 PAPER 2 TEMASEK JUNIOR COLLEGE GEOGRAPHY DEPARTMENT
3

JC2H2PE2018 PAPER 2 TEMASEK JUNIOR COLLEGE GEOGRAPHY DEPARTMENT
4
SECTION B
Theme 1: Tropical Environments
Climate Characteristics and Physical Processes in Australia
2 (a) With reference to Resource 3, briefly describe the climograph of Cairns.
Award 1 mark for identifying the temperature pattern (being generally high) and 1 mark for the rainfall pattern (high but fluctuating over months) of Cairns.
[2]
(b) With the aid of a diagram and Resource 4, explain how the change in
average sea surface temperatures in the Pacific Ocean between 11 October 2015 and 7 November 2015 could affect the weather conditions in Eastern Australia. Reserve 1 mark for diagram. Indicative Content:
• Shift in rainfall patterns in Eastern Australia – drier than usual • Cool surface temperatures over water • High pressure created • Atmospheric stability • little to no cloud formation
[6]
(c) Compare the tracks of Tropical Cyclones George and Yasi shown in
Resource 5. Indicative Content:
• longer track • difference in curvative • areas in Australia affected by cyclones differ • direction of movement differs
[3]
(d) Suggest strategies that could be used to minimise the effects of flooding
arising from the tropical cyclone shown in Resource 6. Indicative Content: Any of these strategies explained in detail would have been accepted:
• construction of embankments (levees) • channel deepening and straigtening
[5]

JC2H2PE2018 PAPER 2 TEMASEK JUNIOR COLLEGE GEOGRAPHY DEPARTMENT
5
• use of gabions • overflow or relief channels • storage areas • dam constructions • prediction (ie using past events to indicate scale of threat) • preventive planning • adaption • early warnings • evacuation drills • afforestation of watersheds • contouring ploughing in the nearby river basin that may worsen
floods
(e) With reference to the resources provided and your own knowledge, how
far do you agree that the ITCZ is primarily responsible to explain the climate of Cairns? Indicative Content: As seen in (a), the climate of Cairns is one being generally high in temperature and rainfall, but fluctuating rainfall over the course of the year. Candidates will need to explain how the migration of the ITCZ helps in explaining the seasonality seen in Cairn’s climate as shown in the climograph in Resource 3. Candidates will need to recognise that there are other factors other than the ITCZ that are also responsible in explaining the climate of Cairns as seen in the resources provided. These factors include:
• ENSO (as also highlighted in part (d)) • Winds and Monsoon • Warm East Australian ocean current • Tropical cyclones (as seen by Tropical Cyclone George and Yasi as
some examples) • Urbanization as seen in the town in Cairns featured in Resource 6
Higher level responses will consider the extent of impact that these factors may have on the overall climate of Cairns. The use of an evaluation criteria may be helpful in helping them decision which factor is primarily responsible. Levels marked using H2 generic level descriptors for open-ended 9m DRQ on Themes 1, 2 and 3.
[9]

JC2H2PE2018 PAPER 2 TEMASEK JUNIOR COLLEGE GEOGRAPHY DEPARTMENT
6

JC2H2PE2018 PAPER 2 TEMASEK JUNIOR COLLEGE GEOGRAPHY DEPARTMENT
7
SECTION C
Theme 2: Development, Economy and Environment
Global Production Network of Semiconductors
3 (a) Describe the changes in the pattern of network connections from 2000 to
2011 shown in Resource 7. Indicative Content:
• new connections established • disconnections over time • overall arrangement of the network • the number of connections • intensity of connections
[3]
(b) Identify the change in Mexico’s profits in manufactured goods between
2000 and 2011 shown in Resource 7 and suggest reasons for this change. Award 1 mark for candidates that accurately identify the change in Mexico’s profits in manufactured goods between 2000 and 2011. Indicative Content: Aspects to consider for the change identified above include:
• NIDL and the factors that led to its emergence • Role of transnational corporations (TNCs) • Role of the state – regulating economic activities; providing public
services and goods; business owner and investor • Influence of regional and international organisations (intra-regional
trade organisations; global financial institutions; trade organisations)• Involvement of non-state actors
[6]
(c) Describe the spatial distribution of the production circuit of the
semiconductor shown in Resource 8. Indicative Content:
• Candidates must be able to see how Resource 8 links to the production and its components of:
o Inputs o Transformation o Distribution o Consumption
[3]

JC2H2PE2018 PAPER 2 TEMASEK JUNIOR COLLEGE GEOGRAPHY DEPARTMENT
8
(d) With reference to Resources 8 and 9, explain how the organisation of the
semiconductor industry has benefitted USA. Indicative Content:
• USA could be seen as both host and home economy • Benefits that may be considered could be of socio-economic and
environmental in nature. • Could also consider stakeholders that may benefit in USA
[4]
(e) With reference to the resources provided, how far do you agree that USA
is the most dominant player in the global semiconductor industry? Indicative Content: In such an evaluation question, there are no wrong answers. Candidates should combine their knowledge and understanding of the global economy with the evidence from the various resources to come to a decision on whether USA is the most dominant player in the global semiconductor industry. They could construct an argument for or against USA based on:
• Value of activities • Various functions of TNCs and their locations • Scale of activities • Competitiveness of TNCs • Profitability of industry for countries • Network connections • Temporal considerations
Levels marked using H2 generic level descriptors for open-ended 9m DRQ on Themes 1, 2 and 3.
[9]

JC2H2PE2018 PAPER 2 TEMASEK JUNIOR COLLEGE GEOGRAPHY DEPARTMENT
9

JC2H2PE2018 PAPER 2 TEMASEK JUNIOR COLLEGE GEOGRAPHY DEPARTMENT
10
SECTION D
Theme 3: Sustainable Development
Issues of Urban Sustainability in Nairobi, Kenya
4 (a) With reference to Resource 10, compare the changes in the urban area
between 1950 and 2010. Indicative Content: Comparisons could be made in terms of:
• Building type • Building density • Population numbers, population density • Land use function
[4]
(b) State three ways in which Nairobi might be considered unsustainable
using evidence from Resource 11. Indicative Content: The three ways that Nairobi may be considered unsustainable could be derived from the three dimensions of unsustainability highlighted by the concept, which include:
• economic unsustainability • social unsustainability • environmental unsustainability.
Candidates will be required to draw these aspects out from Resource 11.
[3]
(c) With reference to Resource 11 and your own knowledge, account for the
traffic conditions in Nairobi. Indicative Content: Candidates may approach this question from thinking about these factors that may cause traffic congestion in Nairobi.
• Demographic situation, leading to overcrowding • Political aspect – lack of planning and financial support • Urban form and structure, leading to congestion during certain
times of day • Infrastructural considerations – shape of network
[6]

JC2H2PE2018 PAPER 2 TEMASEK JUNIOR COLLEGE GEOGRAPHY DEPARTMENT
11
(d) With reference to Resource 12, explain why Dandora may be an attractive location for slum settlements. Indicative Content:
• Need to consider location of slum being in the periphery of Nairobi; on unwanted and undesirable land
• Economic prospects of the area (factories; market) • Transport convenience (roads, railway line) • Low cost housing options • Existence of infrastructure and amenities – electricity lines, sewage
treatments, religious spaces (eg church; school; market)
[6]
(e) With the aid of examples, suggest three reasons why the waste
management strategy shown in Resource 12 is a poor solution to Nairobi’s waste problems. Indicative Content: Waste management strategy highlighted in the resource is a landfill / tip dump / rubbish dump / garbage dump / dumping ground – a site for the disposal of waste materials which may be left in piles. The issues associated with this method that could be mentioned include:
• Groundwater pollution due to leachates • Air pollution (from landfill gases produced) • Loss of use of land for other functions (agriculture, housing,
business use) • Expensive process to ensure that the waste disposed does not lead
to negative environmental impacts • Flammability of waste disposed. • Site for vectors
[6]

_________________________________________________________________________ This document consists of 3 printed pages
[Turn over
VICTORIA JUNIOR COLLEGE JC 2 PRELIMINARY EXAMINATION 2018 HIGHER 2
H2 GEOGRAPHY 9751/01
Paper 1 3 hours READ THESE INSTRUCTIONS FIRST Write your name and index number on the work you hand in. Write in dark blue or black pen on both sides of the paper. You may use an HB pencil for any diagrams or graphs. Do not use staples, paper clips, glue or correction fluid. Answer three questions. One from each section. You should make reference to appropriate examples studied in the field or the classroom, even where such examples are not specifically requested by the question. Diagrams and sketch map should be drawn whenever they serve to illustrate and answer. You are reminded of the need for good English and clear presentation of your answers. At the end of the examination fasten all your work securely together. The number of marks is given in brackets [ ] at the end of each question or part question.

2
Section A – Tropical Environments
Answer one question from this section. 1 (a) Explain the factors influencing aeolian processes in the arid tropics. [12] (b) Discuss the factors influencing mass movement in the tropics. [20]
2 (a) Explain how channel morphology varies in the tropics. [12] (b) To what extent do aeolian processes play the most important role in the formation
of arid landscapes? [20]
Section B – Development, Economy and Environment
Answer one question from this section. 3 (a) Explain the relevance of the arguments made by Malthus and Harvey to resource
scarcity in countries at different levels of development. [12] (b) Discuss the challenges that states may face in governing the global economy. [20]
4 (a) Explain how the arguments in dependency theory and core-periphery model can help to account for the development gap at different scales.
[12] (b) ‘There are too many people on Earth relative to resources’. To what extent do
you agree? [20]

3
Section C – Sustainable Development
Answer one question from this section. 5 (a) Explain the limitations of replacing fossil fuels with alternative energy sources in
countries at low levels of development. [12] (b) ‘All cities need to make sustainable urban development a priority’. Do you agree? [20]
6 (a) Explain the impacts of urban reimaging on different stakeholders in cities in countries at high levels of development.
[12] (b) To what extent is it possible to fully address the impacts of climate change? [20]

1
_________________________________________________________________________ This document consists of 11 printed pages and 1 blank page
[Turn over
VICTORIA JUNIOR COLLEGE JC 2 PRELIMINARY EXAMINATION 2018 HIGHER 2
H2 GEOGRAPHY 9751/02
Paper 2 INSERT 3 hours READ THESE INSTRUCTIONS FIRST. The Insert contains all the Resources referred to in the questions.

2
BLANK PAGE

3
Resource 1 for Question 1
Map of the Jincheng District where the FAW-VW manufacturing plant is located.

4
Resource 2 for Question 1
Features of the noise recorder
Resource 3 for Question 1
Atmospheric pollution (PM10) map for Chang Chun across 9 study sites (A – I)

5
Resource 4 for Question 1
An excerpt of an interview between the CEO of Volkswagen, Herbert Deiss and a reporter for CNBC, a news media company
CNBC: You mentioned that Volkswagen (VW) is stepping up investment in electrification to meet new quotas and standards initiated by the Chinese government. Is VW prepared to meet those new rules which kick in in 2019?
DEISS: Yes we are prepared, definitely. We have to accept that the Chinese government and citizens are choosing a route forward and I think for China, electric cars make a lot of sense. The density of population is huge and the air quality has the potential to improve a lot. There's a huge commitment towards electric cars and we are taking part of this.
CNBC: Another proposal by the Chinese government is the lowering of import taxes on vehicles – how significant of a move would that be for your profitability in the country?
DEISS: VW is deeply localized, with most of the parts of our vehicles manufactured in China by local firms that we outsource to. I would say for our vehicles, the production chain is probably 95, 98 percent localized, so we're not really depending on import tariffs. But generally, for other vehicle manufacturing firms, I think the reduction of import taxes is a positive move. It opens up the market and encourage more firms to offer their vehicles to Chinese consumers.
CNBC: You talk about the tech and R&D taking place here, is protecting intellectual property still a concern for you doing business in China today?
DEISS: Not as much as it was some 10 years ago and there’s also not much to protect anymore because China really has grown up. Chinese workers who initially started with VW and other leading vehicle firms are now working with domestic firms and some have also started their own vehicle manufacturing firms. We are still able to protect some aspects of our intellectual property in terms of vehicle design but the process knowledge of manufacturing vehicles are becoming common industry knowledge. There's no complaints from our side.

6
Resource 5 for Question 2
Article on the karst landscape of Ha Long Bay
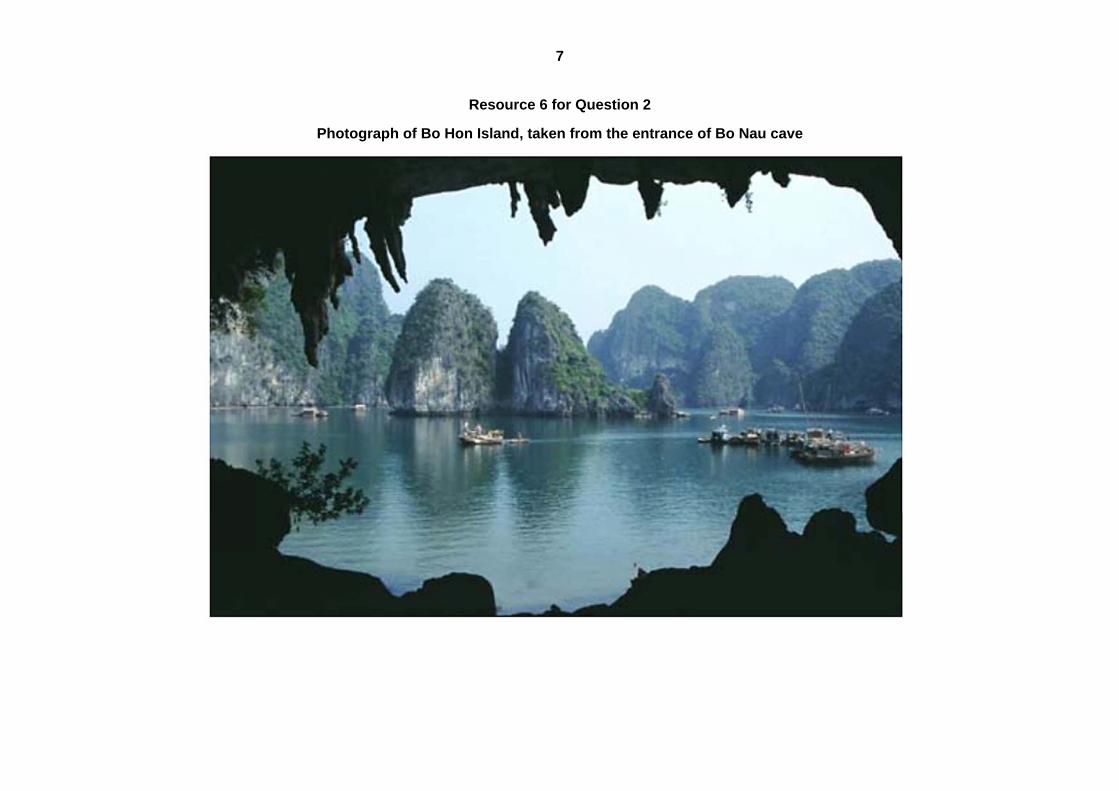
7
Resource 6 for Question 2
Photograph of Bo Hon Island, taken from the entrance of Bo Nau cave

8
Resource 7 for Question 3
Distribution of Zara’s suppliers by region (%) from 2007 to 2012
Resource 8 for Question 3
Zara’s production chain

9
Resource 9 for Question 3
Article on labour issues in the garment industry
Sudden factory closures are not uncommon in the garment industry, in which competition is fierce and capital flexible. Within the garment industry production chain, power is concentrated at the top, where major brands such Zara make high profits and have a lot of leverage over the factories vying for their orders.
Past precedents in Indonesia, Cambodia and Latin America, involving major brands such as Adidas, Nike, H&M and Walmart, have shown that brands can and should take responsibility to ensure that abandoned workers in their production chain are paid their owed wages.
Bravo factory in Istanbul, Turkey, produces garments for Zara, Next and Mango. Despite 75% of the factory’s overall production being for Zara (the other 2 companies being Next and Mango), and Zara making record profits for the first quarter of 2017, Zara has refused to ensure that the workers producing the clothing that made them those profits were fully compensated for their labour. The amount the workers are asking for is 2,739,281.30 Turkish Lira (about 650,000 euros), which in case of Zara, constitutes less than 0.01% of net sales for only the first quarter of 2017.
After more than a year of negotiation Zara, Next, and Mango have not been able to come with a settlement to fully compensate all 140 workers in the factory. The brands’ offer would cover only about a fourth of the amount agreed upon by the workers. Azem Atmaca, a former Bravo factory worker, stresses that it would be unacceptable to find a solution for less than the full group of 140 workers: “One worker would get his money and the other wouldn’t. We all have families and children.”

10
Resource 10 for Question 4
Infographic on the elderly in the state of Maharashtra and Pune, a city in the Maharashtra state

11
Resource 11 for Question 4
Scores of 4 Indian cities in the 2018 Ease of Living Index

12
Resource 12 for Question 4
Rankings for 4 Indian cities in the Ease of Living Index and Mercer’s Quality of Living Survey in 2018
Rank in Ease of Living Index (out of 111 cities)
Rank in Quality of Living Survey (out of 231 cities)
Pune 1 142
Hyderabad 27 142
Chennai 14 151
Bengaluru 58 149

_________________________________________________________________________ This document consists of 5 printed pages
[Turn over
VICTORIA JUNIOR COLLEGE JC 2 PRELIMINARY EXAMINATION 2018 HIGHER 2
H2 GEOGRAPHY 9751/02
Paper 2 3 hours READ THESE INSTRUCTIONS FIRST Write your name and index number on the work you hand in. Write in dark blue or black pen on both sides of the paper. You may use an HB pencil for any diagrams or graphs. Do not use staples, paper clips, glue or correction fluid. Answer all questions. The Insert contains all the Resources referred to in the questions. You should make reference to appropriate examples studied in the field or the classroom, even where such examples are not specifically requested by the question. Diagrams and sketch map should be drawn whenever they serve to illustrate and answer. You are reminded of the need for good English and clear presentation of your answers. At the end of the examination fasten all your work securely together. The number of marks is given in brackets [ ] at the end of each question or part question.

2
Section A
Theme 4: Geographical Investigation 1 Chang Chun is an important industrial city in China with a focus on the automotive
sector. FAW-Volkswagen Automobile Co., Ltd. (FAW-VW) is a joint venture between FAW Group (a Chinese state-owned automotive manufacturing company) and Volkswagen (a German transnational corporation) which manufactures Volkswagen vehicles for sale in China. A FAW-VW manufacturing plant is located in the residential area of Jincheng District in Chang Chun. Some of the residents are employees at the FAW-VW manufacturing plant. A team of 5 students from a local university are interning with the Chang Chun City Authorities. They have been tasked with assessing the impacts of the FAW-VW manufacturing plant on the city. The team was given a noise recorder and a laptop.
They also have access to secondary data in the form of:
• A map of of the Jincheng District where the FAW-VW manufacturing plant is located.
• An atmospheric pollution (PM10) map for Chang Chun City across 9 study sites.
• An excerpt of an interview with the Chief Executive Officer (CEO) of Volkswagen.
Resource 1 shows a map of the Jincheng District where the FAW-VW manufacturing plant is located. Resource 2 shows the features of the noise recorder. Resource 3 shows the atmospheric pollution (PM10) map for Chang Chun across 9 study sites (A – I). Resource 4 shows an excerpt of an interview between the CEO of Volkswagen, Herbert Deiss and a reporter for CNBC, a news media company.
(a) With reference to Resource 2, suggest possible issues that may affect accuracy
while using the noise recorder to collect primary data on noise pollution caused by the FAW-VW manufacturing plant.
[4] (b) With reference to Resources 1 and 2, develop a plan to collect primary data to
assess the levels of noise pollution caused by the FAW-VW manufacturing plant in the Jincheng District.
[7] (c) Explain why the data presentation technique shown in Resource 3 is appropriate
to present the level of pollution in Chang Chun. [5] (d) With reference to Resources 1, 3 and 4, evaluate the usefulness of secondary
data in assessing the impacts of the FAW-VW manufacturing plant on Chang Chun.
[9]

3
Section B
Theme 1: Tropical Environments
Karst of Ha Long Bay, Vietnam
2 Resource 5 is an article on the karst landscape of Ha Long Bay. Resource 6 is a photograph of Bo Hon Island, taken from the entrance of Bo Nau cave. Bo Hon Island is one of the islands in Ha Long Bay.
(a) With reference to Resource 5, describe the physical characteristics of Ha Long Bay.
[4] (b) With the aid of a well-labelled sketch, describe the key features of the karst
landscape shown in Resource 6. [6] (c) Explain the processes that have contributed to the formation of the karst
landscape shown in Resource 6. [7] (d) With reference to Resource 5, suggest how sea level rise may affect the karst
landscape in Ha Long Bay. [4] (e) Suggest the processes that may have contributed to the formation of the rock
types in Ha Long Bay as shown in Resource 5. [4]

4
Theme 2: Development, Economy and Environment
Transnational Corporation (TNC) operations and impacts 3 Zara is a Spanish garment TNC based in Galicia, Spain. It is the world’s largest
apparel retailer. Zara has more than 2200 stores in 96 countries. It is renowned for its ability to develop a new product and get it to stores within 2 weeks compared to a 6 month industry average. Resource 7 shows the distribution of Zara’s suppliers by region from 2007 to 2012. Resource 8 shows Zara’s production chain. Resource 9 is an article on labour issues in the garment industry.
(a) With reference to Resource 7, describe the distribution of Zara’s suppliers from
2007 to 2012. [4] (b) Suggest reasons for the distribution of Zara’s suppliers described in (a). [5] (c) Using Resource 8, explain how information and communication (ICT) and
transport technologies may facilitate Zara’s global operations. [6] (d) With reference to Resources 8 and 9, explain the role of inter-firm networks in
Zara’s production chain. [5] (e) With reference to Resource 9, explain how non-state actors could have helped
to play a role in the protection of workers from TNCs like Zara. [5]

5
Theme 3: Sustainable Development
Measures of liveability and needs of the the elderly in India 4 Resource 10 shows an infographic on the elderly in the state of Maharashtra and
Pune, a city in the Maharashtra state. Resource 11 shows the scores of 4 Indian cities in the 2018 Ease of Living Index. The Ease of Living Index is used to measure the liveability of 111 cities in India across 4 dimensions. Resource 12 shows the rankings for 4 Indian cities in the Ease of Living Index and Mercer’s Quality of Living Survey in 2018.
(a) With reference to Resource 10, suggest possible challenges that Pune may face in meeting the needs of its elderly residents.
[5] (b) With reference to Resource 10, suggest what Pune can do to meet the needs of
its elderly residents. [6] (c) Compare the scores for the 4 Indian cities shown in Resource 11. [5] (d) With reference to Resources 11 and 12 and your own knowledge, assess the
usefulness of measures of liveability. [9]

VJC H2 Paper 1 Prelims
1
Section A – Tropical Environments 1 (a) Explain the factors influencing aeolian processes in the arid tropics. [12] Indicative content
Responses should consider the wind (e.g. velocity) and surface characteristics (e.g. nature of sediments, vegetation cover) that influence the various aeolian processes (i.e. erosion, transportation and deposition). Higher level responses will have a good coverage of both wind and surface characteristics as well as the different aeolian processes.
(b) Discuss the factors influencing mass movement in the tropics. [20] Indicative content
Responses can consider how natural and human factors contribute to mass movement through their influence on shear stress and shear strength. Higher level responses may discuss the relative importance of natural factors such as heavy rainfall and tectonic hazards in contributing to mass movements through a consideration of their role as trigger mechanisms. The relative significance of human and natural trigger mechanisms can also be considered. The role of natural and human contributing factors can also be discussed in relation to relevant examples.
2 (a) Explain how channel morphology varies in the tropics. [12] Indicative content
Higher level response will be those that are able to show variation explicitly: • Spatial variation across climates: humid (meanders tend to be found at areas
with steady discharge e.g. tropical rainforest climate) vs. semi arid or arid (braided channels tend to be form in areas with an unstable flow regime e.g. monsoon/savanna climate)
• Spatial variation along length of channel: upper course vs. lower course
• E.g. as we move downstream: form ratio gets higher, hydraulic radius gets larger, etc.
• Temporal variation: wet vs. dry season (e.g. Auranga River: wet season
meander and dry season braided) (b) To what extent do aeolian processes play the most important role in the formation
of arid landscapes? [20] Indicative content

2
Responses can discuss the role of aeolian and fluvial processes in the formation of various arid landscapes such as yardangs, dunes, loess and rills and gullies. Higher level responses will explicitly weigh the relative importance of aeolian and fluvial processes in the formation of the various arid landscapes. There is also a strong awareness of the conditions in the arid tropics that impacts the relative significance of aeolian and fluvial processes (e.g. the lack of precipitation; the rare but intense precipitation; the lack of vegetation cover). Strongest responses may even consider how the relative importance of aeolian and fluvial processes may have changed over time (e.g. as climates have changed).

3
Section B – Development, Economy and Environment 3 (a) Explain the relevance of the arguments made by Malthus and Harvey to resource
scarcity in countries at different levels of development. [12] Indicative content
Responses should explain the specific arguments proposed in both Malthus’ theory on food scarcity (AP Food vs Population GP, positive – negative checks) as well as Harvey’s theories on relative scarcity (capitalism, labour, nature as capital) with an emphasis on relevance to a variety of context in countries at different levels of development. The strongest responses will be well supported with relevant examples.
(b) Discuss the challenges that states may face in governing the global economy. [20] Indicative Content
Responses should evaluate the ability of the state to govern (control and influence flows of goods/capital and other stakeholders – especially TNCS). The roles of the state that can be explored include: regulator of the economy, provider of public goods and services and business owner/ investor. Stronger responses will be able to discuss specific conditions/factors e.g newly elected governments, competition for TNC FDI etc that limit (challenge) the ability of the state to govern at the global scale. The strongest responses will be well supported with relevant examples.
4 (a) Explain how the arguments in dependency theory and core-periphery model can help to account for the development gap at different scales.
[12] Indicative Content
Dependency theory • The development of cities and countries has depended on the accumulation
of surplus value that occurs via a process of unequal exchange that extends from within countries to between countries at different levels of development.
• Unequal exchange between the core and the periphery. Unequal
exchange as the core buys the materials (primary resources) from the periphery for cheap, after value adding (through manufacturing), the product they produce is more expensive than the materials used to make it. They then sell the finished goods to the periphery at a much higher cost.
• For the periphery, their exports earn a lot less than what they spend from the imports from the core, so it leads to trade imbalance earnings—allowing the core and periphery to continue to be rich and poor respectively.

4
• Therefore, the condition of less developed rural areas and/or countries at
lower levels of development is not the outcome of inertia, misfortune, chance, climatic conditions, etc. but rather a reflection of the manner of their incorporation into the capitalist system where they are integrated at the bottom of the hierarchy of dependence.
• Hence the development gap can exist at different scales, within countries,
and between countries at different levels of development. Core-periphery model • At various scales, sharp territorial contrasts exist in wealth, economic
advancement, and growth between economic heartlands and outlying subordinate zones—the growth and prosperity of core regions is at the expense of exploited peripheral zones.
• Within country: wealthy urban cores and depressed rural peripheries or
prospering high-tech concentrations and declining manufacturing belts in many developed countries.
• Between countries: core-periphery contrasts are discerned between
Western Europe, Japan and the United States as prosperous cores and the countries at the lowest levels of development as underdeveloped peripheries.
• Idea that development gap should and will continue to exist in order to drive
the growth of core regions, where eventually peripheral regions will benefit through the trickle-down effect. However, without intervention, trickle-down effect is usually minimal or non-existent—leading to the persistence of the development gap between core and peripheral regions.
(b) ‘There are too many people on Earth relative to resources’. To what extent do
you agree? [20] Indicative content
Responses could consider the dynamics of the population-resource relationship as proposed by the theories of Malthus, Boserup and Harvey. Evaluations of the statement should consider the complexities of scarcity (absolute vs relative) especially given a variety of possible resources (natural vs manmade, finite vs infinite). Strong responses will be able to discuss specific contexts and conditions where the statement may hold true/false e.g. food supply in countries at higher levels of development vs lower levels of development. The strongest responses may consider even more variations e.g. rural vs urban areas in countries at lower levels of development and arguments will be well supported with relevant examples.

5
Section C – Sustainable Development 5 (a) Explain the limitations of replacing fossil fuels with alternative energy sources in
countries at low levels of development. [12] Indicative Content
Responses should explain the limitations of various alternative energies (hydropower and nuclear energy) e.g. technical expertise, setup costs etc. as well as the reasons for the continued dominance of fossil fuels (coal, gas and oil) e.g. cost to consumers, versatile applications etc. in the context of countries at low levels of development. The strongest responses will be well supported with relevant examples
(b) ‘All cities need to make sustainable urban development a priority’. Do you agree? [20] Indicative Content
• Sustainable urban development entails the integration of the three pillars of
sustainability: economic, social, environmental, similar to the objectives of sustainable development, applied in a context i.e. urban areas or cities.
• All cities should (eventually) make sustainable urban development a priority.
Why is SD important? And therefore why is SD in cities so important that all cities should prioritise it? • SD is defined as: ‘development which meets the needs of the present without
compromising the ability of future generations to meet their own needs’.
• Fixation on economic growth had led to increasing environmental degradation and social inequality. Thus SD goes beyond economics to include considerations on the environment and society, where it aims to maximize the goals across the three interdependent dimensions of economic, social, and environment.
• Moreover, the socio-economic system that we live in cannot expand
indefinitely since it is limited by the finite global biosphere and it is thus important for development to take into consideration the environment.
• As urbanization is one of the most significant trends of the past and present
century, cities are increasingly becoming significant as places of mass production and consumption to drive overall human progress. But presently, cities are not delivering on their potential to help achieve sustainable development
• Economically, the current model of urbanization is unsustainable due to
widespread unemployment, the existence of unstable and low-paying jobs and informal income-generating activities, which create economic hardship, unequal access to urban services and amenities and poor quality of life for many.

6
• Socially, the current model of urbanization generates multiple forms of inequality and deprivation, which creates spatial inequalities and divided cities.
• Environmentally, the current model of urbanization favours economic
activities, industries and infrastructure which are hotspots for energy consumption as well as key sources of greenhouse gases which contributes dangerously to climate change (cities have a large ecological footprint also)
• Cities impose an environmental impact on their hinterlands and on
ecosystems far beyond the immediate region, owing to their demand for renewable resources which cannot be met from within the city's boundaries.
• Cities are also major producers of wastes, much of which impact upon
the surrounding region. • Thus if the development of cities is left unchecked, the above issues are likely
to worsen. • Therefore, efforts to attain SD should be focused on cities, and all cities
should make SUD a priority. • Moreover, the concentration of people in cities provides enhanced
opportunities for a) enhanced scope of recycling and reusing, b) provision and use of public transport than private motor vehicles, c) economies of scale in providing essential basic services such as water and electricity, etc.
Although all cities should make SUD a priority, not all cities are able to make it a priority now. • Cities in countries at lower levels of development are likely to prioritise more
immediate and pressing challenges such as those relating to economic development, or to the 'brown agenda' such as water supply, sewage and sanitation, and housing issues.
6 (a) Explain the impacts of urban reimaging on different stakeholders in cities in countries at high levels of development.
[12] Indicative Content
• Different impacts on different stakeholders: local residents (how different
income level would be affected?), domestic businesses (are certain businesses more impacted than the other?), government / city authorities
Higher level response would: • Show how different stakeholders from the same city are impacted differently
by the same project OR

7
• Variations in impacts within stakeholder groups (e.g. different group of
residents—employment, skills, where they live, different income level etc.) (b) To what extent is it possible to fully address the impacts of climate change? [20] Indicative Content
• Variation in level of effectiveness of individual strategies in fully addressing
the impacts of climate change though adequate is not the highest level of response.
Higher-level response discusses the key challenges in fully addressing the impacts of climate change.
1) Willingness of governments to cooperate with each other—especially challenging when countries have their own interests to protect, or when they have other more urgent immediate issues to resolve.
• Adaptive measure: transboundary water conflicts arising from building
dams on transboundary rivers (to resolve increased likelihood of water scarcity)
• Mitigative measure: MEAs such as the Kyoto Protocol and the Paris
Agreement (reducing carbon emissions)
2) Financial ability and level of access to technology to implement strategies to fully address impacts of climate change is more limited in countries at lower levels of development.
• Moreover, countries may be more disinclined to implement strategies
such as reducing deforestation if the country’s economy is heavily dependent on the very same activity.
• Even if financial incentives (from external parties) for payment for
ecosystem services such as ‘Reducing Emissions from Deforestation and Forest Degradation’ (REDD) are provided, the challenge of leakage may exist where in this case, the forest destroyers might move to another area of forest or to a different country. Worst still, the money may not be used for its intended purpose.
• For countries at higher levels of development, even with adequate
funds and access to technology to implement adaptive strategies such as building dams, the expected increase in frequency and intensity of climate change related extreme weather events can still overcome existing measures.
3) There are natural factors affecting climate change (Milankovitch theory)
and humans are not able to influence it—though recent climate change has largely been attributed to being caused by anthropogenic activities.

VJC H2 Paper 2 Prelims
1
Section A
Theme 4: Geographical Investigation 1 Chang Chun is an important industrial city in China with a focus on the automotive
sector. FAW-Volkswagen Automobile Co., Ltd. (FAW-VW) is a joint venture between FAW Group (a Chinese state-owned automotive manufacturing company) and Volkswagen (a German transnational corporation) which manufactures Volkswagen vehicles for sale in China. A FAW-VW manufacturing plant is located in the residential area of Jincheng District in Chang Chun. Some of the residents are employees at the FAW-VW manufacturing plant. A team of 5 students from a local university are interning with the Chang Chun City Authorities. They have been tasked with assessing the impacts of the FAW-VW manufacturing plant on the city. The team was given a noise recorder and a laptop.
They also have access to secondary data in the form of:
• A map of of the Jincheng District where the FAW-VW manufacturing plant is located.
• An atmospheric pollution (PM10) map for Chang Chun City across 9 study sites.
• An excerpt of an interview with the Chief Executive Officer (CEO) of Volkswagen.
Resource 1 shows a map of the Jincheng District where the FAW-VW manufacturing plant is located. Resource 2 shows the features of the noise recorder. Resource 3 shows the atmospheric pollution (PM10) map for Chang Chun across 9 study sites (A – I). Resource 4 shows an excerpt of an interview between the CEO of Volkswagen, Herbert Deiss and a reporter for CNBC, a news media company.
(a) With reference to Resource 2, suggest possible issues that may affect accuracy
while using the noise recorder to collect primary data on noise pollution caused by the FAW-VW manufacturing plant.
[4] Indicative content
• Weak battery may result in weak sensor and/or microphone • Microphone+Sensor is faulty • Operator’s breathing, conversation, movement is recorded by sensitive
microphone especially because handheld • Environmental sounds not related to industrial activity may be measured by
sensitive microphone Point-marked
(b) With reference to Resources 1 and 2, develop a plan to collect primary data to
assess the levels of noise pollution caused by the FAW-VW manufacturing plant in the Jincheng District.

2
[7] Indicative content
• Data needed would be noise recordings caused by FAW-VW manufacturing
plant in the Jincheng District. • Equipment needed would be the noise recorder and laptop. • Noise recordings can be obtained around the the FAW-VW manufacturing
plant to determine the average levels in the vicinity of the plant which would require
• Systematic sampling along the 4 roads that surround the FAW-VW site ( Anshung, Chuan Ye, Dong Feng and Anqing Road )
• Noise recordings can be obtained with increasing distance from FAW-VW site
to determine how noise levels change with distance from the FAW-VW site. • Systematic sampling along the 3 parallel roads (Chuan Ye, Jin Cheng, Dong
Feng) with measurements taken at set intervals 100m. • Noise recordings can be obtained at different sites which constrast with the
characteristics of the FAW-VW site to determine how noise levels change with different location types. Stratified sampling according to site characteristics e.g FAW-VW site vs Daishan Park vs Major intersection ( Junction of Dongfeng and Feiyue) vs Residential areas ( South of the plant, in the vicinity of Dong Feng Street).
• For accuracy at each sampling site, multiple measurements could be taken
and averaged out for a more accurate measurements. • Time should be allotted to allow transfer of data to the laptop after 5
measurements as well as for charging the noise recorder if the battery runs low to ensure the sensor is adequately powered to ensure accurate measurements.
• Ethical issues include ensuring businesses are not hampered by locating
measurement sites away from customer flows. Simillarly, students should ensure they are not making noise near residential locations and disturbing residents.
• But if set intervals fall near businesses, the students should ask permission
from businesses before taking measurements. • Safety issues ( traffic conditions, slippery and uneven pavements) could be
addressed by being vigilant or electing a safety I/C. Levels- marked
Level Marks Descriptors
3 6 – 7 Response shows good knowledge of data collection methods (including sampling), resource limitations, ethical issues, risks, data accuracy and reliability. Response reflects a good

3
understanding of the given context of the investigation. Good use of resource.
2 3 – 5 Response shows some knowledge of data collection methods (including sampling), resource limitations, ethical issues, risks, data accuracy and reliability. Some parts of the response may be generic instead of being focused on the given context of the investigation. Some use of the resource.
1 1 – 2 Response shows little knowledge of data collection methods (including sampling), resource limitations, ethical issues, risks, data accuracy and reliability. Response may be of limited relevance to the given context of the investigation. Little use of the resource.
0 0 No creditworthy response.
(c) Explain why the data presentation technique shown in Resource 3 is appropriate
to present the level of pollution in Chang Chun. [5] Indicative content
A map: • shows the spatial distribution of the level of pollution. • Using the map compass allows spatial analysis of the data by grouping study
sites by location on the map (sub-regions) e.g all study sites in the south is above the average of all study sites with the exception of G.
• Using the distance scale allows spatial analysis of the data by drawing relationships with distance e.g pollution levels are increasing with increasing distance from Study site D in an eastward direction.
• Additional map data ( e.g road density, airport) allows cross referencing to help account for pollution levels.
• Additional information e.g location of manufacturing plant allows comparisons to be made with locations near and further from the plant
Levels-marked
Level Marks Descriptors
3 5 Response shows good knowledge of the stregths of using maps to present levels of pollution. Response reflects a good understanding of the given context of the investigation. Good use of resource.
2 3 - 4 Response shows some knowledge of the stregths of using maps to present levels of pollution. Some parts of the response may be generic instead of being focused on the given context of the investigation. Some use of the resource.
1 1 – 2 Response shows littlew knowledge of the stregths of using maps to present levels of pollution.. Response may be of limited relevance to the given context of the investigation. Little use of the resource.

4
0 0 No creditworthy response.
(d) With reference to Resources 1, 3 and 4, evaluate the usefulness of secondary
data in assessing the impacts of the FAW-VW manufacturing plant on Chang Chun.
[9] Indicative content
Resources 1 ,3 and 4 are useful in assessing the impacts of the FAW-VW manufacturing but in different ways ( Resource 1 for planning & collecting data while Resource 2 & 4 for actual environmental and economic impacts) and to different extents. Resource 1 allows planning for appropriate sites ( areas in the vicinity of the plant, Daishan Park) for noise recording to assess impacts. It also allows identification of possible stakeholders that may be impacted by the plant ( Bank of Jilin , Fei Yue Road Post Branch, Changchun Express Logistics Company & FAW Jiefang Car Limited Company) where interviews can be held with key personnel on the relationship of the various businesses with the FAW-VW manufacturing plant. But beyond planning for the investigation, Resource 1 does not show actual impacts of the plant. A second map of the location before the plant would be useful to compare how the landuse has changed. Resource 3 in contrast does show the possible impact that the plant has had on the environment in terms of atmospheric pollution ( 65 PM10 at Study Site C which is slightly above the average of the 9 sites – 64.3 PM10). This data is especially useful as it requires skills and equipment that the interns may not possess/ have access to. But similar to the map, it only shows the current values and not the values before for a comparison to be made and the impact assessed. Also, the lack of information of the other study sites does not allow easy comparison of the values at different sites. For example, Study Site A,B,D,G and E have lower levels atmospheric pollution It would be useful to compare the landuse at these sites to with Site C to see if the presense of the VW plant may account for the higher levels of atmospheric pollution. There is also issues of the accuracy and reliability of the measurements as little details of the process is explained. Resource 4 shows possible environmental and economic impacts of the plant in terms of : Atmospheric pollution of car emission for vehicles manufactured - There’s a huge commitment towards electric cars and we are taking part of thi
Profits for local firms - VW is deeply localized, with most of the parts of our vehicles manufactured
in China by local firms that we outsource to. I would say for our vehicles, the production chain is probably 95, 98 percent localized

5
Training of the local labour force - Chinese workers who initially started with VW and other leading vehicle firms
are now working with domestic firms and some have also started their own vehicle manufacturing firms.
A large limitation of Resource 4 is that it is not specific to the FAW-VW manufacturing plant on Chang Chun. The information would need to be cross referenced with other data e.g carrying out research using company publications or interviews with key personnel at the FAW Jiefang Car Limited Company to determine if they are benefiting economically from the FAW-VW plant. Levels-marked using the generic descriptors for H2 9m DRQ fron Theme 4

6
Section B
Theme 1: Tropical Environments
Karst of Ha Long Bay, Vietnam
2 Resource 5 is an article on the karst landscape of Ha Long Bay. Resource 6 is a photograph of Bo Hon Island, taken from the entrance of Bo Nau cave. Bo Hon Island is one of the islands in Ha Long Bay.
(a) With reference to Resource 5, describe the physical characteristics of Ha Long Bay. [4] Indicative content
• Bay makes up of many islands with the largest being Cat Ba Island (16.4km by
17.3/19.1km). • The entire bay is made up of sedimentary rocks with two major rock types—
clastic and limestone. • Clastic rocks are predominantly found north of Dau Go at Bai Chay and
Hong Gai, which is the mainland. Clastic rocks can also be found about 12km east of Cong Do.
• The majority of the islands in Ha Long Bay are made up of limestone karst,
stretching from the western parts of the bay around Vung Ba Cua till east of Cong Do and down south towards the Gulf of Tonkin where Dau Be is. Limestone karst also extends up north of Cong Do where it is connected to the mainland.
• The single largest coherent mass of rock is the Cat Ba limestone karst that
makes up Cat Ba Island.
• Throughout the bay area, caves are only found in limestone karst—more specifically ‘other limestone karst’.
Levels-marked Level Marks Descriptors
2 3 – 4 Response describes key patterns present in the map. Good and accurate use of the resource throughout by quoting relevant sections of the map to present key patterns. Response is consistently clear and focused on the question.
1 1 – 2 Response mainly describes what is present in the map without highlighting patterns (In other words, only providing the points under the white bullet points above). Resource is used for some parts of the response. Response lacks clarity detail and focus on the question.
0 0 No creditworthy response.

7
(b) With the aid of a well-labelled sketch, describe the key features of the karst landscape shown in Resource 6.
[6] Indicative content
Possible features to include in sketch: • Mouth of cave • Stalactite and stalagmites • Tower karst and cone karst • Karst plain covered by the sea Levels-marked Level Marks Descriptors
3 5 – 6 Accurate (must include the cone and tower karst) sketch that is labelled well. Labels must be correctly linked to the respective features. Description of key features of the karst landscape must be specific to the photo.
2 3 – 4 Sketch lacks accuracy at parts where some features are not accurately labelled. Gaps present in description of key features.
1 1 – 2
Inaccurate sketch where labels merely identify the karst landscape with minimal to no description of the key features.
0 0 No creditworthy response.
(c) Explain the processes that have contributed to the formation of the karst landscape
shown in Resource 6. [7] Indicative content
1. Precipitation of calcium carbonate to form stalactites: icicle-shaped mineral
deposits growing down from the ceiling of a cave
• When water rich with calcium carbonate enters or moves through the cave system, the precipitation of calcium carbonate can occur in two ways:
• Through the evaporation of water.
• The diffusion of carbon dioxide from the water to the air when it comes
into contact with air with less carbon dioxide. As CO2 escapes from the water into the cave atmosphere, acidity of the water is decreased, causing calcium carbonate to precipitate.
• Continued precipitation of calcium carbonate forms depositional features on
the ceilings 2. Carbonation solution that occurred ever since the whole of Ha Long Bay was
dry land.

8
• Cooler temperatures that were 5-10oC lower than today during the cooler stages of the Pleistocene meant that water was locked into the icecaps of higher latitudes, and sea level declined by about 100 m—causing the whole of Ha Long Bay to be dry land.
• During then, carbonation solution occurred on the limestone basin of the Ha
Long Bay area—forming solution and/or collapsed dolines.
• Cone karst landscape forms as dolines enlarge and coalesce, leaving conical residual hills with dolines on all sides.
• When continued deepening of the dolines causes the floor of the
depressions to reach the water table, the cockpits are eventually widened faster than they are deepened. Continued lateral solution that is faster than vertical solution transforms cockpits into extensive plains that separate the residual hills. The lateral solution will also lead to the undercutting of the hills, steepening their sides.
• Sea level rise from warmer temperatures today covered the karstic plain
leaving behind islands of tower and cone karsts. Levels-marked Level Marks Descriptors
3 6 – 7 Response demonstrates good knowledge and thorough explanation on at least 2 processes that have contributed to the formation of the karst landscape shown in Resource 6. Response is consistently clear, detailed, and focused on the question.
2 3 – 5 Response demonstrates some knowledge and explanation on the processes that have contributed to the formation of the karst landscape shown in Resource 6. Response may lack clarity, detail and focus on the question.
1 1 – 2
Response demonstrates limited knowledge and lacks details to explain the processes that have contributed to the formation of the karst landscape shown in Resource 6. Response lacks clarity, detail and focus on the question.
0 0 No creditworthy response.
(d) With reference to Resource 5, suggest how sea level rise may affect the karst
landscape in Ha Long Bay. [4] Indicative content
• Resource 5 shows the presence of caves scattered throughout the bay. Rising
sea level may submerge caves, such as the Bo Nau Cave in Resource 6, further promoting the development of the cave—enlarging cavities into caverns.
• Karst islands that are not as tall may become fully submerged, leading to a
reduced amount of karst islands in Ha Long Bay as seen in Resource 5.

9
• More carbonation solution from seawater would take place throughout the karst
islands scattered throughout the bay area as seen in Resource 5, such as at the foot of the tower and cone karst seen in Resource 6, causing cone karst to develop into tower karst, or the collapse of tower karsts within clusters may give rise to greater amounts of isolated tower karst forming.
Levels-marked Level Mark
s Descriptors
2 3 – 4 Response is well explained and contextualised to the resource. Response is consistently clear and focused on the question.
1 1 – 2 Little to no use of the resource where points are not explained well. Response lacks clarity detail and focus on the question.
0 0 No creditworthy response.
(e) Suggest the processes that may have contributed to the formation of the rock types
in Ha Long Bay as shown in Resource 5. [4] Indicative content
• Both clastic rocks and limestone are types of sedimentary rocks. • Formation involves the weathering of pre-existing rock, transportation of the
weathered material from the original site by the wind or by river, and deposition of the eroded material in the sea or in some other sedimentary environment.
• The deposited sediments then undergo lithification to become sedimentary
rocks.
• Lithification refers to the process that turns raw rock sediment into consolidated sedimentary rock. It can occur by way of:
• Compaction as grains are squeezed together by the weight of
overlying sediment and
• Cementation of loose sediments as minerals precipitate around particles and bind them together.
• The limestone rocks may be formed from a) either the fragments of
other rocks (clasts) or from the break up and deposition of shells, coral and other marine organisms, or b) by direct precipitation of minerals from solution.
Point-marked

10
Theme 2: Development, Economy and Environment
Transnational Corporation (TNC) operations and impacts 3 Zara is a Spanish garment TNC based in Galicia, Spain. It is the world’s largest
apparel retailer. Zara has more than 2200 stores in 96 countries. It is renowned for its ability to develop a new product and get it to stores within 2 weeks compared to a 6 month industry average. Resource 7 shows the distribution of Zara’s suppliers by region from 2007 to 2012. Resource 8 shows Zara’s production chain. Resource 9 is an article on labour issues in the garment industry.
(a) With reference to Resource 7, describe the distribution of Zara’s suppliers from
2007 to 2012. [4] Indicative content
• More than half of Zara’s suppliers were European in 2007 though this saw a
decline by 22 percentage points through the years. • Asian suppliers saw a reversed trend, with from 2007 to 2012, a rise of 18.3
percentage points. • Although Europe dominated Zara’s supplier distribution since 2007, there was
a shift to Asia by 2011. • Africa (6.9% in 2007 and 8.7% in 2012) and the Americas (2.7% in 2007 and
4.6% in 2012) remained small players in Zara’s supplier distribution, though both experienced an increase in their shares from 2007 to 2012.
Levels-marked
Level Marks Descriptor 2 3 – 4 Response highlights key patterns. Good and accurate
use of the resource throughout by citing relevant figures from the resource. Response is consistently clear, detailed and focused on the question.
1 1 – 2 Response does not highlight any key pattern. Limited or no use of the resource. Response lacks clarity, detail and focus on the question.
0 0 No creditworthy response.
(b) Suggest reasons for the distribution of Zara’s suppliers described in (a). [5] Indicative content
• The dominance of Zara’s European suppliers up till 2011 is likely to be due to
proximity to Zara HQ. This could mean that turnaround time would be faster for Zara to produce new products quickly and get them to the market just as quickly, which is what Zara is famous for.
• The subsequent shift to Asia could be cost related, since labour related costs
are a comparative advantage. Productivity may not have increased in pace with

11
labour costs in Europe, making Asia a more attractive location for the labour-intensive garment industry.
• Africa and Americas could have continued to have a small share despite the
low labour costs due to civil unrest or political instability which have contributed to higher risks for investments.
Levels-marked
Level Marks Descriptor 3 5 Response covers at least two relevant reasons. At
least two patterns are explained. Reasons are well-explained. Good and accurate use of the resource throughout. Response is consistently clear, detailed and focused on the question.
2 3 – 4 Response covers at least at least two relevant reasons. At least two patterns are explained. Reasons may not be well-explained in some parts. Resource is used for some parts of the response. Response may lack clarity, detail and focus on the question at some parts.
1 1 – 2 Response covers only one reason or only one pattern is explained. Reason(s) are not well-explained. Limited or no use of the resource. Response lacks clarity, detail and focus on the question.
0 0 No creditworthy response.
(c) Using Resource 8, explain how information and communication (ICT) and transport
technologies may facilitate Zara’s global operations. [6] Indicative content
• Frequency of flights to and from Spain will support a more global mode of
production, to allow Zara to enjoy lower cost production in Asia. Among the European suppliers, [efficiencies in air and overland transport] also support Zara’s need to be close to her suppliers.
• Frequent, small batch distribution is possible due transport and ICT
technologies. Efficient modes of transport would have allowed for distribution of products to be frequent, and without/ with little delay. Technologies could also mean there is less need for bulk transportation of products and related economies of scale- hence small batch distribution is possible.
• Effective modes of communication such as computerised inventory controls
accessible company wide etc, will make tracking sales, fulfilling shipments and delivering new orders more quickly.
• ICT technologies could allow consumers to give real time feedback, or post
sales feedback. Channels such as social media will also allow Zara to keep up on trends and on consumer preferences etc. Communication between store and the design team can be instantaneous thanks to ICT.
Levels-marked

12
Level Marks Descriptor 3 5 – 6 Response covers both transport technologies and ICT.
At least two stages of the production chan are covered. Role of transport technologies and ICT are well-explained. Good and accurate use of the resource throughout. Response is consistently clear, detailed and focused on the question.
2 3 – 4 Response covers both transport technologies and ICT. At least two stages of the production chan are covered. Role of transport technologies and ICT may not be well-explained in some parts. Resource is used for some parts of the response. Response may lack clarity, detail and focus on the question at some parts.
1 1 – 2 Response covers only either transport technologies or ICT; Or only one stage is covered. Role of transport technologies and/or ICT are not well-explained. Limited or no use of the resource. Response lacks clarity, detail and focus on the question.
0 0 No creditworthy response.
(d) With reference to Resources 8 and 9, explain the role of inter-firm networks in
Zara’s production chain. [5] Indicative content
• Suppliers help to provide raw materials for Zara (Resource 8)
• Subcontractors produce Zara’s apparel since Zara does not manufacture any
of its products on its own (Resources 8 and 9).
• Logistics firms are important in facilitating the movement of Zara’s finished goods from production bases to Spain, Zara’s home country (Resource 9).
• Logistics firms are also important in facilitating the movement of finished goods
from the warehouse in Spain to the markets in small batches in a timely manner that helps Zara to adjust quickly to changes in consumers’ demands and preferences (Resource 9).
• Local retailers can help Zara to sell its products to consumers in markets where
there are barriers to entry for foreign-owned businesses. Levels-marked
Level Marks Descriptor 3 5 Response covers at least two different types of inter-
firm networks. Role of other firms are well-explained. Good and accurate use of both resources throughout. Response is consistently clear, detailed and focused on the question.
2 3 – 4 Response covers at least two different types of inter-firm networks. Role of other firms may not be well-explained in some parts. Resources are used for some

13
parts of the response. Response may lack clarity, detail and focus on the question at some parts.
1 1 – 2 Response covers only one type of inter-firm networks. Role of other firms are not well-explained. Limited or no use of the resources. Response lacks clarity, detail and focus on the question.
0 0 No creditworthy response. (e) With reference to Resource 9, explain how non-state actors could have helped to
play a role in the protection of workers from TNCs like Zara. [5] Indicative content
• Watchdogs could have conducted checks on the working conditions in the
factories.
• Watchdogs or media agencies could have raised awareness of the workers’ plight following the factory closure on national or international platforms.
• Watchdogs could also launch a boycott campaign to apply pressure on the
TNCs to provide compensation for the workers.
• Standards organisations could have encouraged TNCs to acquire certification for fair contract terms e.g. compensation in the event of factory closure.
Levels-marked
Level Marks Descriptor 3 5 Response covers at least two different groups of non-
state actors. Role of non-state actors are well-explained. Good and accurate use of the resource throughout. Response is consistently clear, detailed and focused on the question.
2 3 – 4 Response covers at least two different groups of non-state actors. Role of non-state actors may not be well-explained in some parts. Resource is used for some parts of the response. Response may lack clarity, detail and focus on the question at some parts.
1 1 – 2 Response covers only one group of non-state actors. Role of non-state actors are not well-explained. Limited or no use of the resource. Response lacks clarity, detail and focus on the question.
0 0 No creditworthy response.

14
Theme 3: Sustainable Development
Measures of liveability and needs of the the elderly in India 4 Resource 10 shows an infographic on the elderly in the state of Maharashtra and
Pune, a city in the Maharashtra state. Resource 11 shows the scores of 4 Indian cities in the 2018 Ease of Living Index. The Ease of Living Index is used to measure the liveability of 111 cities in India across 4 dimensions. Resource 12 shows the rankings for 4 Indian cities in the Ease of Living Index and Mercer’s Quality of Living Survey in 2018.
(a) With reference to Resources 10, suggest possible challenges that Pune may face in meeting the needs of its elderly residents.
[5] Indicative content
• The increasing trend in the number of elderly residents may strain city
authorities’ resources to meet their needs. • There may be unreported cases of cruelty/abandonment/abuse of senior
citizens, which makes it difficult for authorities to protect elderly residents. • Pune has very few existing retirement homes to cater to its 700,000 senior
citizens. Levels-marked
Level Marks Descriptor 3 5 Response covers at least two challenges that Pune
may face in meeting the needs of its elderly residents. Challenges are well-explained. Good and accurate use of the resource throughout by quoting relevant sections of the infographic. Response is consistently clear, detailed and focused on the question.
2 3 – 4 Response covers at least two challenges that Pune may face in meeting the needs of its elderly residents. Challenges may not be well-explained in some parts. Resource is used for some parts of the response. Response may lack clarity, detail and focus on the question at some parts.
1 1 – 2 Response covers only one challenge that Pune may face in meeting the needs of its elderly residents. Challenges are not well-explained. Limited or no use of the resource. Response lacks clarity, detail and focus on the question.
0 0 No creditworthy response.
(b) With reference to Resource 10, suggest what Pune can do to meet the needs of its
elderly residents. [6] Indicative content
• Pune can increase the budget allocated to fund retirement homes.

15
• Pune can set up centres or helplines to facilitate the reporting of cruelty/abuse/abandonment of senior citizens
• Pune can set up a committee to look into measures to encourage active ageing. Levels-marked
Level Marks Descriptor 3 5 - 6 Response covers at least two strategies that Pune can
implement to meet the needs of its elderly residents. Links between proposed measure and the needs of elderly residents are well-explained. Good and accurate use of the resource throughout by quoting relevant sections of the infographic. Response is consistently clear, detailed and focused on the question.
2 3 – 4 Response covers at least two strategies that Pune can implement to meet the needs of its elderly residents. Links between proposed measure and the needs of elderly residents may not be well-explained in some parts. Resource is used for some parts of the response. Response may lack clarity, detail and focus on the question at some parts.
1 1 – 2 Response covers only one strategy that Pune can implement to meet the needs of its elderly residents. Links between proposed measure and the needs of elderly residents are not well-explained. Limited or no use of the resource. Response lacks clarity, detail and focus on the question.
0 0 No creditworthy response.
(c) Compare the scores for the 4 Indian cities shown in Resource 11. [5] Possible points
• Pune scored the highest overall (58) and also for 3 out of the 4 dimensions. • Bengaluru scored the lowest overall (34) and also across all 4 dimensions. • 3 out of the 4 cities performed worst in the physical dimension (Pune,
Hyderabad and Bengaluru). • Only Chennai performed worst in the economic dimension. • The greatest disparity between the cities is in the social dimension (Pune
scored the highest at 16 marks out of the maximum 25 marks [67% of max marks] and Bengaluru scored the lowest at 8 out of the maximum 25 marks [32% of the max marks]).
Levels- marked
Level Marks Descriptor 3 5 Response highlights both similarities and differences.
Key similarities and differences are highlighted. Good and accurate use of the resource throughout by citing relevant figures from the resource and there is a good understanding of the weightage used in the index. Response is consistently clear, detailed and focused on the question.

16
2 3-4 Response highlights both similarities and differences, though not all are key similarities and differences. Resource is used for some parts of the response. There is some understanding of the weightage used in the index and data is mostly accurate. Response may lack clarity, detail and focus on the question at some parts.
1 1 – 2 Response highlights only key similarities or differences; or do not highlight any key similarities or differences (e.g. comparing the cities dimension by dimension). Limited or no use of the resource. There is poor understanding of the weightage used in the index, leading to inaccurate data. Response lacks clarity, detail and focus on the question.
0 0 No creditworthy response.
(e) With reference to Resources 11 and 12, and your own knowledge, assess the
usefulness of measures of liveability. [9] Indicative content
Candidates should be able to articulate the different purposes/uses of measures of liveability (e.g. to assess current levels, for comparisons across space and time, to monitor progress, etc.). Candidates should discuss whether those measures have been useful in achieving the various purposes. A higher level response will weigh the relative usefulness of measures by making comparisons across different measures to consider which measure has been relatively more useful. Candidates can also discuss the common challenges that come with measuring liveability and how this may limit the potential usefulness of measures of liveability (e.g. differences in dimensions and indicators used due to differences in purposes and definitions of liveability, resulting in differences in ranking of cities across various measures i.e. Resource 12). Levels marked using H2 generic descriptors for 9m DRQ from Themes 1, 2 and 3

YISHUN JUNIOR COLLEGE YISHUN JUNIOR COLLEGE YISHUN JUNIOR COLLEGE YISHUN JUNIOR COLLEGE YISHUN JUNIOR COLLEGE YISHUN JUNIOR COLLEGE YISHUN JUNIOR COLLEGE YISHUN JUNIOR COLLEGE YISHUN JUNIOR COLLEGE YISHUN JUNIOR COLLEGE YISHUN JUNIOR COLLEGE YISHUN JUNIOR COLLEGE YISHUN JUNIOR COLLEGE YISHUN JUNIOR COLLEGE YISHUN JUNIOR COLLEGE YISHUN JUNIOR COLLEGE YISHUN JUNIOR COLLEGE YISHUN JUNIOR COLLEGE YISHUN JUNIOR COLLEGE YISHUN JUNIOR COLLEGE YISHUN JUNIOR COLLEGE YISHUN JUNIOR COLLEGE YISHUN JUNIOR COLLEGE YISHUN JUNIOR COLLEGE YISHUN JUNIOR COLLEGE YISHUN JUNIOR COLLEGE YISHUN JUNIOR COLLEGE YISHUN JUNIOR COLLEGE YISHUN JUNIOR COLLEGE YISHUN JUNIOR COLLEGE YISHUN JUNIOR COLLEGE YISHUN JUNIOR COLLEGE YISHUN JUNIOR COLLEGE YISHUN JUNIOR COLLEGE YISHUN JUNIOR COLLEGE YISHUN JUNIOR COLLEGE YISHUN JUNIOR COLLEGE YISHUN JUNIOR COLLEGE YISHUN JUNIOR COLLEGE YISHUN JUNIOR COLLEGE YISHUN JUNIOR COLLEGE YISHUN JUNIOR COLLEGE YISHUN JUNIOR COLLEGE YISHUN JUNIOR COLLEGE YISHUN JUNIOR COLLEGE YISHUN JUNIOR COLLEGE YISHUN JUNIOR COLLEGE YISHUN JUNIOR COLLEGE YISHUN JUNIOR COLLEGE YISHUN JUNIOR COLLEGE YISHUN JUNIOR COLLEGE YISHUN JUNIOR COLLEGE YISHUN JUNIOR COLLEGE YISHUN JUNIOR COLLEGE YISHUN JUNIOR COLLEGE YISHUN JUNIOR COLLEGE YISHUN JUNIOR COLLEGE YISHUN JUNIOR COLLEGE YISHUN JUNIOR COLLEGE YISHUN JUNIOR COLLEGE YISHUN JUNIOR COLLEGE YISHUN JUNIOR COLLEGE YISHUN JUNIOR COLLEGE YISHUN JUNIOR COLLEGE YISHUN JUNIOR COLLEGE YISHUN JUNIOR COLLEGE YISHUN JUNIOR COLLEGE YISHUN JUNIOR COLLEGE YISHUN JUNIOR COLLEGE YSIHUN JUNIOR COLLEGE
YISHUN JUNIOR COLLEGE JC 2 PRELIMINARY EXAMINATION 2018
Geography 9751/01 Paper 1 Structured Essay Questions 20 AUGUST 2018 3 hours QUESTION PAPER Additional materials: Answer Paper World outline map READ THESE INSTRUCTIONS FIRST Start each question on a fresh piece of paper. Write your name and CTG on all the work you hand in. Write in dark blue or black pen on both sides of the paper. You may use a pencil for any diagrams or graphs. Do not use staples, paperclips, highlighters, glue or correction fluid. Answer three questions. One from each section. You should make reference to appropriate examples studied in the field or the classroom, even where such examples are not specifically requested by the question. Diagrams and sketch maps should be drawn whenever they serve to illustrate an answer. The world outline map may be annotated and handed in with relevant answers. You are reminded of the need for good English and clear presentation in your answers. The number of marks is given in brackets [ ] at the end of each question or part question. At the end of the examination, fasten all your work securely together in the correct order.
This document consists of 3 printed pages and 1 blank page.

2
BLANK

3
Section A – Tropical Environments
Answer one question from this section 1 (a) Explain how the weakening of the Walker Circulation impacts the Pacific.
[12]
(b) Assess the role of the Intertropical Convergence Zone (ITCZ) in influencing rainfall variation across the tropics.
[20]
2 (a) Explain the conditions that favour the development of tropical cyclones
in Tropical Asia.
[12]
(b) “The effects of flooding can only be minimised through changes to the river channel.” Discuss the validity of this statement.
[20]
Section B – Development, Economy and Environment
Answer one question from this section 3 (a) Explain bottom-up development with reference to countries at low
levels of development.
[12]
(b) “The state is the most important actor in enabling development on the national scale.” To what extent do you agree with this statement?
[20]
4 (a) Explain why resources may be appraised differently across space and
time.
[12]
(b) To what extent do you agree that the Malthusian perspective on population and resources is no longer applicable in the world today?
[20]

4
Section C – Sustainable Development
Answer one question from this section 5 (a) Explain the impacts of climate change on low-income countries.
[12]
(b) “The impacts of climate are global but its solutions are local.” To what extent have strategies to manage climate change been successful?
[20]
6 (a) Explain the causes of urban traffic congestion in countries at high levels
of development.
[12]
(b) Evaluate the effectiveness of strategies to ease traffic congestion in cities.
[20]
- END OF PAPER -

YISHUN JUNIOR COLLEGE JC 2 PRELIMINARY EXAMINATION 2018
H2 GEOGRAPHY 9751/02 Paper 2 Data Response Questions
11 September 2018 3 Hours INSERT READ THESE INSTRUCTIONS FIRST This Insert contains all the Resources referred to in the questions.
This insert consists of 11 printed pages and 1 blank page.

2
BLANK

3
Resource 1 for Question 1
Map of Eunos Industrial Estate
The area bound in red marks the study area
Resource 2 for Question 1
Survey of households on noise from Eunos Industrial Estate
Percentage of households surveyed for whom noise level was Block Very high High Moderate Low
31 5 15 20 50 32 15 30 20 35 33 50 20 15 10 34 55 25 15 5 35 45 25 22 10 36 40 20 25 15

4
Resources 3 for Question 2
Map of Mulu Caves in Sarawak, Malaysia

5
Resource 4 for Question 2
Limestone features in the Cave of the Winds

6
Resource 5 for Question 2
Climograph of Miri in Sarawak, Malaysia

7
Resource 6 for Question 3
Intra-firm and inter-firm networks of a TNC (transnational corporation)
Resource 7 for Question 3
Spatial distribution of the global value chain an Apple product

8
Resource 8a for Question 3
Subcontracting of the world’s top notebook brand-name companies to Taiwanese supplier firms, 2010
Resource 8b for Question 3
International subcontracting: Example of the production of a customized Apple MacBook Pro

9
Resource 9 for Question 3
Excerpt of report from CNET and American media website that publishes articles on technology and consumer electronics

10
Resource 10 for Question 4
Location and growth of the world’s megacities

11
Resource 11 for Question 4
Land use map and the location of slums in Mumbai

12
Resource 12 for Question 4
Excerpt from a research paper dealing with the challenges in slum management in Mumbai
The last decade has seen an enormous debate on the future of Mumbai and it planning
for development. The idea that Mumbai should become Shanghai or Singapore is very
appealing to policy makers, the elite and people in the corridors of power. However, over
the years, any kind of urban planning process has been ignored in Mumbai. The state
government has acquired all initiatives and all thinking in regard to urban development,
eroding entirely the function of the municipality. The real challenge before Mumbai is to
provide affordable housing to the majority of its population with a very low level of income
living in inhospitable slums. This is not an issue related to the access to housing alone but
also the sustainability and security of income and livelihood of the slum dwellers.

YISHUN JUNIOR COLLEGE YISHUN JUNIOR COLLEGE YISHUN JUNIOR COLLEGE YISHUN JUNIOR COLLEGE YISHUN JUNIOR COLLEGE YISHUN JUNIOR COLLEGE YISHUN JUNIOR COLLEGE YISHUN JUNIOR COLLEGE YISHUN JUNIOR COLLEGE YISHUN JUNIOR COLLEGE YISHUN JUNIOR COLLEGE YISHUN JUNIOR COLLEGE YISHUN JUNIOR COLLEGE YISHUN JUNIOR COLLEGE YISHUN JUNIOR COLLEGE YISHUN JUNIOR COLLEGE YISHUN JUNIOR COLLEGE YISHUN JUNIOR COLLEGE YISHUN JUNIOR COLLEGE YISHUN JUNIOR COLLEGE YISHUN JUNIOR COLLEGE YISHUN JUNIOR COLLEGE YISHUN JUNIOR COLLEGE YISHUN JUNIOR COLLEGE YISHUN JUNIOR COLLEGE YISHUN JUNIOR COLLEGE YISHUN JUNIOR COLLEGE YISHUN JUNIOR COLLEGE YISHUN JUNIOR COLLEGE YISHUN JUNIOR COLLEGE YISHUN JUNIOR COLLEGE YISHUN JUNIOR COLLEGE YISHUN JUNIOR COLLEGE YISHUN JUNIOR COLLEGE YISHUN JUNIOR COLLEGE YISHUN JUNIOR COLLEGE YISHUN JUNIOR COLLEGE YISHUN JUNIOR COLLEGE YISHUN JUNIOR COLLEGE YISHUN JUNIOR COLLEGE YISHUN JUNIOR COLLEGE YISHUN JUNIOR COLLEGE YISHUN JUNIOR COLLEGE YISHUN JUNIOR COLLEGE YISHUN JUNIOR COLLEGE YISHUN JUNIOR COLLEGE YISHUN JUNIOR COLLEGE YISHUN JUNIOR COLLEGE YISHUN JUNIOR COLLEGE YISHUN JUNIOR COLLEGE YISHUN JUNIOR COLLEGE YISHUN JUNIOR COLLEGE YISHUN JUNIOR COLLEGE YISHUN JUNIOR COLLEGE YISHUN JUNIOR COLLEGE YISHUN JUNIOR COLLEGE YISHUN JUNIOR COLLEGE YISHUN JUNIOR COLLEGE YISHUN JUNIOR COLLEGE YISHUN JUNIOR COLLEGE YISHUN JUNIOR COLLEGE YISHUN JUNIOR COLLEGE YISHUN JUNIOR COLLEGE YISHUN JUNIOR COLLEGE YISHUN JUNIOR COLLEGE YISHUN JUNIOR COLLEGE YISHUN JUNIOR COLLEGE YISHUN JUNIOR COLLEGE YISHUN JUNIOR COLLEGE YSIHUN JUNIOR COLLEGE
YISHUN JUNIOR COLLEGE JC 2 PRELIMINARY EXAMINATION 2018
H2 GEOGRAPHY 9751/02 Paper 2 Data Response Questions 11 September 2018 3 Hours QUESTION PAPER Additional materials: Answer Paper 1 Insert World outline map READ THESE INSTRUCTIONS FIRST Start each question on a fresh piece of paper. Write your name and CTG on all the work you hand in. Write in dark blue or black pen on both sides of the paper. You may use a pencil for any diagrams or graphs. Do not use staples, paperclips, highlighters, glue or correction fluid. Candidates answer all questions. The Insert contains all the Resources referred to in the questions. You should make reference to appropriate examples studied in the field or the classroom, even where such examples are not specifically requested by the question. Diagrams and sketch maps should be drawn whenever they serve to illustrate an answer. The world outline map may be annotated and handed in with relevant answers. You are reminded of the need for good English and clear presentation in your answers. The number of marks is given in brackets [ ] at the end of each question or part question. At the end of the examination, fasten all your work securely together in the correct order.
This question paper consists of 6 printed pages.

2
Section A
Theme 4: Geographical Investigation 1 Your class has been tasked to investigate the impact of light industries on the local
community in Singapore. After a round of brainstorming, your class selected the Eunos Industrial Estate. The Eunos Industrial Estate is bounded by the Pan Island Expressway, Eunos Road 8, Eunos Crescent and Sims Avenue. The estate was built between 1977 and 1981. Presently, it comprises 57 blocks of single-storey terrace workshops, 4 blocks of 4-storey industrial shops, a block of 2-storey industrial shops and 4 canteens. The types of business include general manufacturing and woodworking. In view of the resources and time available, the class decided to delimit the study area to the following blocks within the estate: • Blocks 1006 – 1011 • Blocks 1029 – 1038 • Blocks 1040 -1050 The class was divided into 4 groups of 5 students to collect data from the delimited portion of the estate: (i) Employees of the various companies (ii) Businesses within a 650 metres of the study area (iii) Residents within 650 metres of the study area The data to be collected includes: (i) Nature of businesses in the study area (ii) Nature of employees (i.e. Singaporean, permanent residents and foreign
workers) (iii) Location of businesses frequented (iv) Expenditure at these businesses (v) Noise levels experienced by residents (vi) Other impacts such as littering The groups decided to visit the site on 2 Saturdays from 9 am to 1 pm to collect the data. A survey was conducted of residents at the residential blocks 31 to 36, within 650 metres of the study area. It was determined that the sample would comprise units on even floors of the 6 blocks and a random selection of 2 units for each of the selected floors. Data collection with regards to the employees was limited. Resource 1 shows the location of the Eunos Industrial Estate where the study area is bounded in red. Resource 2 shows the results of the survey on noise pollution.

3
(a) With reference to Resource 2, suggest a hypothesis for the investigation.
[1]
(b) Suggest the possible challenges and risks that students may encounter when conducting the investigation and how they may be overcome.
[4]
(c) Your group realized that the data collected may be inaccurate. Suggest the possible problems with the method of collecting data and how you could resolve them.
[7]
(d) With reference to Resources 1 and 2, suggest two possible ways in which the students may collect data on employees of the businesses at the industrial estate.
[4]
(e) Evaluate the usefulness of the data shown in Resource 2 in determining the impact of industrial activity on Eunos.
[9]

4
Section B
Theme 1: Tropical Environments
Limestone in Sarawak, Malaysia
2 The Gunung Mulu National Park is the largest national park in the state of Sarawak, Malaysia. It comprises Gunung Mulu, a 2377-metre-high sandstone pinnacle and a complex system of caves. Resource 3 shows a map of the Mulu Caves. The cave system lies amidst the Melinau Limestone Formation that consists of a 2.1 km thick sequence of massively bedded, strong, pale grey limestones of the Upper Eocene-Lower Miocene age. Resource 4 shows limestone features found in the Cave of the Winds. Resource 5 shows the climograph of Miri, a town in Sarawak.
(a) Using Resource 3, describe the Mulu Cave system.
[4]
(b) With reference to Resource 4 and your own knowledge, explain the formation of the limestone features shown.
[4]
(c) Using Resource 5, describe the climate at Miri.
[4]
(d) With reference to Resources 3 and 5, suggest why the Gunung Mulu National Park may be susceptible to mass movements.
[4]
(e) Using Resources 3 to 5, and your own knowledge, evaluate the role of climate in the development of the Mulu Caves.
[9]

5
Theme 2: Development, Economy and Environment
Global Production Networks of TNCs
3 Resource 6 shows the intra-firm and inter-firm networks of a TNC (transnational corporation). Resource 7 illustrates the spatial distribution of the global value chain of one of Apple’s products. Value chain refers to the entire sequence of productive or value-added activities from the conception of a product to its manufacturing and commercialisation. Value chain disaggregation provides a breakdown of locations where various production or value-added activities are carried out. Resource 8a shows the subcontracting of the world’s top notebook brand-name companies to Taiwanese supplier firms in 2010. Resource 8b provides an illustration of how international subcontracting works. Resource 9 is an excerpt of a news report from the Financial Times.
(a) With reference to Resource 6, describe the function of the headquarters (HQ) of a TNC.
[3]
(b) With reference to the table in Resources 8a, describe the spatial relationship between supplier firms and their clients.
[2]
(c) As seen from Resource 6, 7, 8a and 8b, international subcontracting is a way for TNCs to organize inter-firm transnational operations. Using Resources 6, 7, 8a, 8b and your own knowledge, evaluate the view that international subcontracting only brings benefits to TNCs.
[7]
(d) Using Resource 7 and your own knowledge, explain three locational requirements for research and development (R&D) activities.
[6]
(e) Using Resource 9 and your own knowledge, assess the reasons for TNCs’ limited global reach.
[7]

6
Theme 3: Sustainable Development
Urban Growth and Slums
4 Resource 10 shows the world’s current and future megacities and their population size for 2015 and 2030 (projected). Resource 11 shows a land use map and a map of the location of slums in Mumbai. Resource 12 is an excerpt from a research paper dealing with the challenges that Mumbai faces in addressing the issue of slum management.
(a) Using Resource 10, describe the distribution of current and future megacities in Asia.
[4]
(b) Identify two limitations of the data representation method shown in Resource 10.
[2]
(c) Using Resource 10 and your own knowledge, explain the slowing of growth of megacities in countries with high levels of development.
[6]
(d) With reference to Resource 10, 11 and your own knowledge, explain the reasons for the location of slums in Mumbai.
[5]
(e) With the use of Resource 12 and your own knowledge, assess the effectiveness of slum management strategies in different cities
[8]
- END OF PAPER -

© ACJC. H2/9751/01/Prelims/2018 1
ANGLO-CHINESE JUNIOR COLLEGE JC 2 Preliminary Examinations 2018
______________________________________________________________________________
GEOGRAPHY 9751/01 Higher 2
Paper 1 Structured Essay Questions Time: 3 hours 29 August 2018
(Wednesday)
READ THESE INSTRUCTIONS FIRST Write your Centre number, index number and name on all the work you hand in. Start every question on a fresh piece of writing paper Write in dark blue or black pen. You may use a soft pencil for any diagrams, graphs or rough working. Do not use staples, paper clips, highlighters, glue or correction fluid. Answer three questions. One from each section. You should make reference to appropriate examples studied in the field or the classroom, even where such examples are not specifically requested by the question. Diagrams and sketch maps should be drawn whenever they serve to illustrate an answer. The world outline map may be annotated and handed in with relevant answers. You are reminded of the need for good English and clear presentation in your answers. The number of the marks is given in brackets [ ] at the end of each question or part question. On the cover sheet provided, include:
• Your name and index no. • The question numbers of the question you have attempted in the boxes provided, and
place the cover sheet as the top page over your answers to Section A. Start each question on a fresh piece of paper. At the end of the examination, fasten your answers to each question separately; with the cover page fastened as the top page for Section A. Submit your answers to each section separately; with three bundles submitted.
This Question Paper consists of 3 printed pages, including this cover page. Department of Geography Anglo-Chinese Junior College 25 Dover Close East Singapore 139745 [Turn Over

© ACJC. H2/9751/01/Prelims/2018 2
Section A – Tropical Environments
Answer one question from this section.
1 (a) Explain the dominant geomorphic processes operating in humid tropic regions.
[12]
(b) Assess the significance of weathering and erosion in the development of tropical karsts in humid tropic regions.
[20]
2 (a) Explain the conditions necessary for the development of tropical
cyclones.
[12]
(b) Evaluate the effectiveness of soft-engineering mitigation methods in managing the impacts of flooding in tropical environments. [20]
Section B – Development, Economy and Environment
Answer one question from this section.
3 (a) Explain the usefulness of the bottom-up development approach for understanding development in low-income countries.
[12]
(b) ‘The state is the most influential actor in the global economy.’ Discuss the validity of this statement.
[20]
4 (a) Explain the considerations when assigning ownership of water
resources to the private sector in countries facing relative water scarcity.
[12]
(b) To what extent does the resource curse thesis explain the under-performance of resource-rich countries?
[20]
[Turn Over

© ACJC. H2/9751/01/Prelims/2018 3
Section C – Sustainable Development
Answer one question from this section.
5 (a) Explain how the indicators used to study the liveability of cities may be useful to city governments.
[12]
(b) To what extent can re-imaging improve the quality of urban living space for urban dwellers?
[20]
6 (a) Explain the challenges of improving the lives of slum dwellers in
cities with fast growing populations.
[12]
(b) ‘Sustainable development for cities at low levels of development is impossible without foreign aid.’ How far do you agree? [20]
[End

© ACJC. H2/9751/02/Insert/Prelims/2018 1
ANGLO-CHINESE JUNIOR COLLEGE JC 2 Preliminary Examinations 2018
____________________________________________________ GEOGRAPHY 9751/02 Higher 2
INSERT Time: 3 hours 24 August 2018
(Friday)
READ THESE INSTRUCTIONS FIRST This Insert contains all the Resources referred to in the questions.
This Insert consists of 13 printed pages. Department of Geography Anglo-Chinese Junior College 25 Dover Close East Singapore 139745
[Turn Over

© ACJC. H2/9751/02/Insert/Prelims/2018
2
Resource 1 for Question 1
Location of the Winforton Village and River Wye
L = Levees G = Gabion (a basket or container filled with stones and rocks)
[Turn Over

© ACJC. H2/9751/02/Insert/Prelims/2018
3
Resource 2 for Question 1
Bi-polar analysis for levees
[Turn Over

© ACJC. H2/9751/02/Insert/Prelims/2018
4
Resource 3 for Question 1
Questionnaire Survey for the residents of WInforton Village
Introduction: I am doing a geography project on the effectiveness of flood mitigation methods. This interview is likely to take 15 minutes. 1) Age: ______________ 2) Gender: ___________ 3) Employment status: ____________________ 4) Household income (gross): ______________
5) How long have you stayed in this house? (please tick accordingly)
less than 2 years between 2 and 5 years more than 5 years
6) How effective are the levees built in the southwest of Winforton Village? Give a number. 0- Being not effective at all and 10 – Being very effective
0 1 2 3 4 5 6 7 8 9 10
Give reasons for your number: __________________________________________________________________ __________________________________________________________________ 7) How effective are the gabions built in the south of Winforton Village? Give a
number. 0- Being not effective at all and 10 – Being very effective
0 1 2 3 4 5 6 7 8 9 10 Give reasons for your number: __________________________________________________________________ __________________________________________________________________ 8) When was the last time this area was flooded? Please tick accordingly.
less than 2 years ago
between 2 and 5 years ago
more than 5 years
9) What kind of hard engineering and/or soft engineering methods need(s) to be adopted to enhance the effectiveness of the overall flood mitigation in this area?
_______________________________________________________________________ _______________________________________________________________________ _______________________________________________________________________
[Turn Over

© ACJC. H2/9751/02/Insert/Prelims/2018
5
Resource 4 for Question 2
Location and Climograph of Niamey, Niger
Source: https://simple.wikipedia.org/wiki/Niger_River#/media/File:Niger_river_map.svg
https://en.climate-data.org/location/497/

© ACJC. H2/9751/02/Insert/Prelims/2018
6
Resource 5 for Question 2
Long profile of the Upper, Middle and Lower Niger River
Source: http://sp.lyellcollection.org/content/386/1/327
Resource 6 for Question 2
Satellite image of Niamey and Middle Niger River
Source: https://en.wikipedia.org/wiki/Niamey
[Turn over

© ACJC. H2/9751/02/Insert/Prelims/2018
7
Resource 7 for Question 3
Relationship between GNP per capita and access to clean water
[Turn over

© ACJC. H2/9751/02/Insert/Prelims/2018
8
Resource 8 for Question 3
Available water per person per year and annual rainfall in Africa
Resource 8A for Question 3
Resource 8B for Question 3
[Turn over

© ACJC. H2/9751/02/Insert/Prelims/2018
9
Resource 9 for Question 3
Water conservation programme implemented in Southern Nevada
[Turn over

© ACJC. H2/9751/02/Insert/Prelims/2018
10
Resource 10 for Question 3
Construction of Dams along Mekong River, 2015
[Turn over

© ACJC. H2/9751/02/Insert/Prelims/2018
11
Resource 11 for Question 4
Top 10 most congested cities in the world, 2017
Resource 12 for Question 4
Car dependence in the Paris, France, 2001
*Car dependence is defined as the need for the use of a car to travel to work, shop and see friends and family.
[Turn over

© ACJC. H2/9751/02/Insert/Prelims/2018
12
Resource 13 for Question 4
A station of Vélib’, the public bicycle-sharing scheme in Paris
The Vélib’ consists of a network of 1,800 bicycle stations, which are available 24 hours a day all year round. These are located every 300 meters in Paris. Each station consists of a central terminal to make payment for rental and bicycle posts for the docking of bicycles. The first 30 minutes of each trip are free of charge and subsequently, the next half-hour costs 1€, third half-hour 2€, and 4€ for every half-hour thereafter.
[Turn over
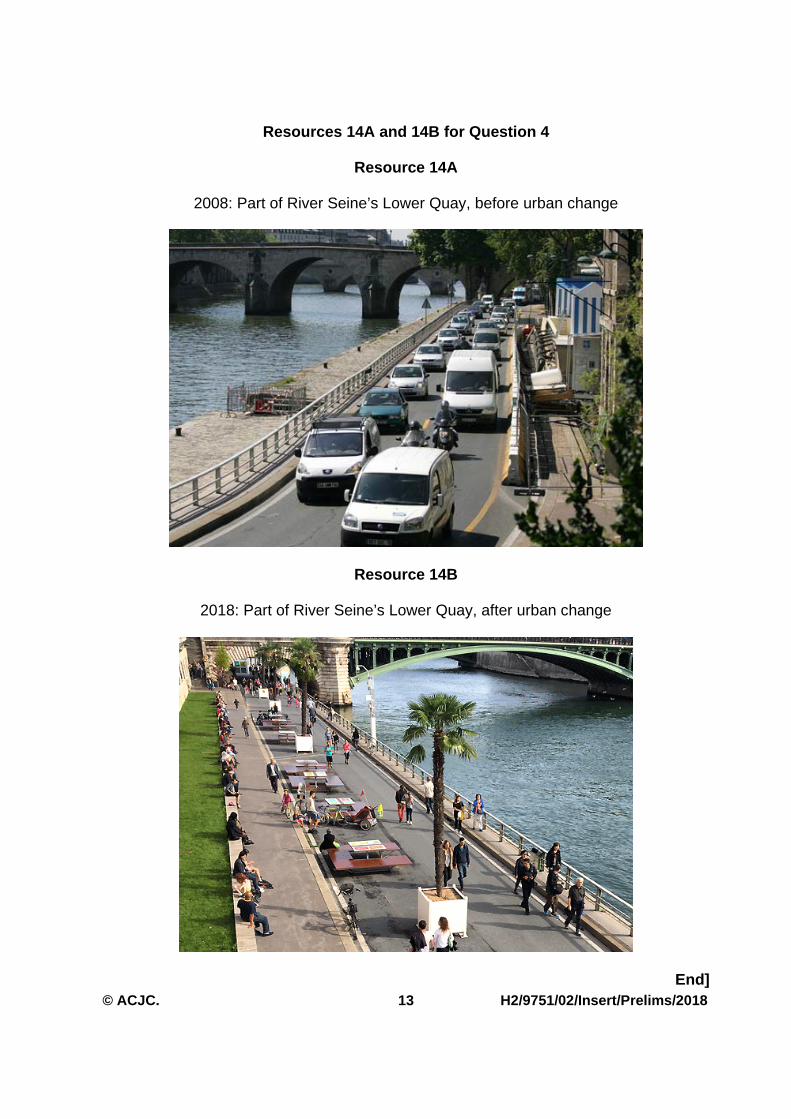
© ACJC. H2/9751/02/Insert/Prelims/2018
13
Resources 14A and 14B for Question 4
Resource 14A
2008: Part of River Seine’s Lower Quay, before urban change
Resource 14B
2018: Part of River Seine’s Lower Quay, after urban change
End]

© ACJC. H2/9751/02/Prelims/2018 1
ANGLO-CHINESE JUNIOR COLLEGE JC 2 Preliminary Examinations 2018
______________________________________________________________________________
GEOGRAPHY 9751/02 Higher 2
Paper 2 Data Response Questions Time: 3 hours 24 August 2018
(Friday)
READ THESE INSTRUCTIONS FIRST Write your Centre number, index number and name on all the work you hand in. Start every question on a fresh piece of writing paper Write in dark blue or black pen. You may use a soft pencil for any diagrams, graphs or rough working. Do not use staples, paper clips, highlighters, glue or correction fluid. Answer four questions. One from each section. You should make reference to appropriate examples studied in the field or the classroom, even where such examples are not specifically requested by the question. Diagrams and sketch maps should be drawn whenever they serve to illustrate an answer. The world outline map may be annotated and handed in with relevant answers. You are reminded of the need for good English and clear presentation in your answers. The number of the marks is given in brackets [ ] at the end of each question or part question. On the cover sheet provided, include:
• Your name and index no. • The question numbers of the question you have attempted in the boxes provided, and
place the cover sheet as the top page over your answers to Section A. Start each question on a fresh piece of paper. At the end of the examination, fasten your answers to each question separately; with the cover page fastened as the top page for Question 1. Submit your answers to each section separately; with four bundles submitted.
This Question Paper consists of 5 printed pages, including this cover page. The Insert consists of 13 printed pages.
Department of Geography Anglo-Chinese Junior College 25 Dover Close East Singapore 139745 [Turn Over

© ACJC. H2/9751/02/Prelims/2018 2
Section A – Geographical Investigation
1 A group of 20 18-year-old students undertook an investigation along the River Wye in the United Kingdom to ascertain the flood risk around the village of Winforton. The group wanted to find out the infiltration rates at two selected sites – Site P (1 kilometre away from and southwest of the Winforton village) and Site Q (1 kilometre away from and south of the Winforton village) – to determine the flood risk in these areas. They have also obtained the information from the local hydrology office that the area south of the Winforton Village where Site Q is located has experienced six floods in past five years.
The following hypothesis was selected for their investigation:
Hypothesis: The lower the infiltration rates, the higher the flood risk.
The students carried out the primary investigation at Sites P and Q in the study area in Resource 1 on 14 August 2017. The group also wanted to determine the effectiveness of the flood mitigation methods found along the River Wye. The group prepared the bi-polar analysis to determine the effectiveness of the levees and gabions for flood management. In order to support their analysis, the group also prepared a questionnaire survey for the residents of the Winforton Village to find out their perception of the effectiveness of the flood mitigation methods. Resource 2 shows the recording sheet for their bi-polar analysis for levees. Resource 3 shows the questionnaire survey the group has prepared for the pilot test for the survey.
(a) With reference to Resource 1, evaluate the suitability of the given
hypothesis.
[4]
(b) Explain how this group of students would minimise the impacts of their primary investigation at Sites P and Q shown in Resource 1.
[4]
(c) Explain how the students might have carried out their primary fieldwork on investigating infiltration rates at Sites P and Q in Resource 1.
[7]
(d) Suggest four field evidence that the students could look out for when examining the levees that would correspond to the scoring shown in the recording sheet in Resource 2.
[4]
(e) During the pilot test for the questionnaire survey, the students concluded that they needed to improve their survey questions shown in Resource 3. Suggest how the survey questions in Resource 3 can be further improved.
[6]
[Turn Over

© ACJC. H2/9751/02/Prelims/2018 3
Section B
Theme 1: Tropical Environments
Climate, Fluvial Processes and Landforms in Niger
2 Resource 4 shows the location and climograph of Niamey, the capital of Niger. Resource 5 shows the long profile of the Upper, Middle and Lower Niger River. Resource 6 shows a satellite image of the city of Niamey and the Middle Niger River. X is one of the gauging stations along the Middle Niger River in Resource 6.
(a) Describe and account for climatic characteristics of Niamey as shown in Resource 4.
[5]
(b) Using information from Resource 5, describe the long profile of the Middle Niger River and suggest reasons for your description of the long profile.
[6]
(c) Sketch a storm hydrograph for the Middle Niger River at Gauging Station X in Resource 6 following a rainfall event in August and explain its key features.
[6]
(d) Using Resources 4, 6 and your own knowledge, to what extent does discharge play an important role in the development of the river pattern of the Middle Niger River in Area A in Resource 6?
[8]
[Turn Over

© ACJC. H2/9751/02/Prelims/2018 4
Theme 2: Development, Economy and Environment
Water Scarcity
3 Resource 7 shows the relationship between GNP per capita and access to
clean water in 10 less developed countries. Resource 8A shows the available water per person in Africa while Resource 8B shows the annual rainfall for Africa. Resource 9 shows a water conservation programme implemented in Nevada, a western U.S. state with a vast expanse of desert. Resource 10 shows the presence and construction of dams along the Mekong River in 2015.
(a) Describe the relationship between GNP per capita and the population with access to clean water as seen in Resource 7. Note: Relationship Most students could not describe strength of relationship although exceptions were accepted. Another possible answer is the differing extent of change at different GNP levels. 2m: Positive/direct relationship + evidence (-1m if evidence is not provided OR if the accurate term for description – positive/direct is not used) 2m: Strength of rs weak + evidence (-1m if evidence is not provided. A good piece of evidence- Between the range of US$7200 to US$10000, countries have similar % access to clean water e.g. Guatemala at US$7200 with 94% access and Sri Lanka with approx. US$9600 and a 95% access to clean water.)
[4]
(b) Using Resource 7 and 8, and your own knowledge, evaluate the contribution of physical factors towards water scarcity.
[9]
(c) Explain the benefits and limitations of water conservation programmes such as that shown in Resource 9.
[6]
(d) Using evidence from Resource 10, and your own knowledge, explain why the construction of additional dams may not be a good solution to water scarcity issues for China.
[6]

© ACJC. H2/9751/02/Prelims/2018 5
[Turn Over

© ACJC. H2/9751/02/Prelims/2018 6
Theme 3: Sustainable Development
Traffic congestion in Paris, France
4 Resource 11 shows the top ten most congested cities in the world in 2017. Resource 12 shows the level of car dependence in Paris in 2001. Various efforts have been taken to combat traffic congestion in Paris. Resource 13 shows a station of Vélib’, a large-scale public bicycle-sharing scheme in Paris, launched in 2007. Resources 14A and 14B are photographs of the Lower Quay along River Seine, before and after a recent urban policy change in 2017 to ban vehicles on selected roads.
(a) Compare the ranks of cities as shown in Resource 11.
[4]
(b) With reference to Resource 12, describe the pattern of car-dependence for Paris.
[4]
(c) Suggest reasons for the pattern of car dependence for Paris as seen in Resource 12.
[4]
(d) With reference to Resources 11, 13 and your own knowledge, evaluate whether public bicycle-sharing scheme aid in reducing car-dependence for a developed city like Paris.
[7]
(e) Using evidence from Resources 14A and 14B, explain possible effects of the urban change shown in Resource 14B on urban liveability for Paris.
[6]
End]