
Catalytic Reforming of Methylcyclopentane. - LSU Digital ...
287
Louisiana State University Louisiana State University LSU Digital Commons LSU Digital Commons LSU Historical Dissertations and Theses Graduate School 1972 Catalytic Reforming of Methylcyclopentane. Catalytic Reforming of Methylcyclopentane. Douglas Maurice Selman Louisiana State University and Agricultural & Mechanical College Follow this and additional works at: https://digitalcommons.lsu.edu/gradschool_disstheses Recommended Citation Recommended Citation Selman, Douglas Maurice, "Catalytic Reforming of Methylcyclopentane." (1972). LSU Historical Dissertations and Theses. 2242. https://digitalcommons.lsu.edu/gradschool_disstheses/2242 This Dissertation is brought to you for free and open access by the Graduate School at LSU Digital Commons. It has been accepted for inclusion in LSU Historical Dissertations and Theses by an authorized administrator of LSU Digital Commons. For more information, please contact [email protected].
-
Upload
khangminh22 -
Category
Documents
-
view
8 -
download
0
Transcript of Catalytic Reforming of Methylcyclopentane. - LSU Digital ...

Louisiana State University Louisiana State University
LSU Digital Commons LSU Digital Commons
LSU Historical Dissertations and Theses Graduate School
1972
Catalytic Reforming of Methylcyclopentane. Catalytic Reforming of Methylcyclopentane.
Douglas Maurice Selman Louisiana State University and Agricultural & Mechanical College
Follow this and additional works at: https://digitalcommons.lsu.edu/gradschool_disstheses
Recommended Citation Recommended Citation Selman, Douglas Maurice, "Catalytic Reforming of Methylcyclopentane." (1972). LSU Historical Dissertations and Theses. 2242. https://digitalcommons.lsu.edu/gradschool_disstheses/2242
This Dissertation is brought to you for free and open access by the Graduate School at LSU Digital Commons. It has been accepted for inclusion in LSU Historical Dissertations and Theses by an authorized administrator of LSU Digital Commons. For more information, please contact [email protected].
INFORMATION TO USERS
This dissertation was produced from a microfilm copy of the original document. While the most advanced technological means to photograph and reproduce this document have been used, the quality is heavily dependent upon the quality of the original submitted.
The following explanation of techniques is provided to help you understand markings or patterns which may appear on this reproduction.
1. The sign or "target" for pages apparently lacking from the document photographed is "Missing Page(s)". If it was possible to obtain the missing page(s) or section, they are spliced into the film along with adjacent pages. This may have necessitated cutting thru an image and duplicating adjacent pages to insure you complete continuity.
2. When an image on the film is obliterated with a large round black mark, it is an indication that the photographer suspected that the copy may have moved during exposure and thus cause a blurred image. You will find a good image of th e page in the adjacent frame.
3. When a map, drawing or chart, etc., was part of the material being photographed the photographer fo llow ed a definite method in "sectioning" the material. It is customary to begin photoing at the upper left hand corner of a large sheet and to continue photoing from left to right in equal sections with a small overlap. If necessary, sectioning is continued again - beginning below the first row and continuing on until complete.
4. The majority of users indicate that the textual content is of greatest vaiue, however, a somewhat higher q u a lity reproduction could be made from "photographs" if essential to the understanding of the dissertation. Silver prints of "photographs" may be ordered at additional charge by writing the Order Departm ent, giving the catalog number, title, author and specific pages you wish reproduced.
University Microfilms300 North Zeeb RoadAnn Arbor, M ichigan 48106
A Xerox Education Company
Reproduced with permission of the copyright owner. Further reproduction prohibited without permission.
II
72-28,377
SELMAN, Douglas Maurice, 19M-2-CATALYTIC REFORMING OF METHYLCYCLOPENTANE.
The Louisiana State University and Agricultural and Mechanical College, Ph.D., 1972Engineering, chemical
University Microfilms, A XEROX Company, Ann Arbor, Michigan
© 1972
Douglas Maurice Selman
ALL RIGHTS RESERVED
----.— ^ ^ - r - n w K o m r i ; a o n n n r T t r m
Reproduced with permission of the copyright owner. Further reproduction prohibited without permission.
CATALYTIC REFORMING OF METHYLCYCLOPENTANE
A Dissertation
Submitted to the Graduate Faculty of the Louisiana State University and
Agricultural and Mechanical College in partial fulfillment of the requirements for the degree of
Doctor of Philosophy
in
The Department of Chemical Engineering
byDouglas Maurice Selman
B.S., The University of Texas, 1965 M.S., The University of Texas, 1967
May, 1972
Reproduced with permission of the copyright owner. Further reproduction prohibited without permission.
PLEASE NOTE:
Some pages may have
i n d i s t i n c t p r i n t .
F i lmed as r e c e i v e d .
U n i v e r s i t y M i c r o f i l m s , A Xerox Educat ion Company
Reproduced with permission of the copyright owner. Further reproduction prohibited without permission.

"In all thy ways acknowledge Him, and He
shall direct thy paths." - Proverbs 3;6
ii
Reproduced with permission of the copyright owner. Further reproduction prohibited without permission.

ACKNOWLEDGEMENTS
This author wishes to first acknowledge Professor Alexis Voorhles,
Jr. who provided the opportunity for this undertaking. Association
with a man of his scientific reasoning and organizing ability has
provided perhaps the greatest learning experience for this author.
His example of dedication and diligence will always be remembered.
The financial support from Esso Research and Engineering Company
is gratefully acknowledged as well as analytical support from the Esso
Research Laboratories in Baton Rouge.
This author is indebted to Mamerto Luzarraga and Ken Clem who as
project associates contributed to this work through numerous informal
discussions.
Mrs. Arlene C. Smith is acknowledged for her diligent efforts in
typing this dissertation.
Finally, special acknowledgement is given to my wife, Jo Karen, who
cheerfully took over many of my duties at home and who provided
encouragement and motivation at times when these were needed.
ill
Reproduced with permission of the copyright owner. Further reproduction prohibited without permission.

TABLE OF CONTENTS
PAGE
LIST OF TABLES ......................................................
LIST OF FIGURES .....................................................
ABSTRACT .............................................................
CHAPTER ..............................................................
I. INTRODUCTION ............................................... 1
II. LITERATURE SURVEY ......................... 4
A. Introduction......................... 4
B. Reforming Catalysts .................................. 8
1. Reforming Catalyst Development ................. 9
2. Dual-Function Reforming Catalysts ............. 11
a. Hydrogenation-Dehydrogenation Component ... 11
b . Acidic Component ............ 14
c. Relationship Between Acidic and Metal Sites 16
3. "Bimetallic" Dual- Function Catalysts ......... 18
C. Methylcyclopentane Reforming Reaction Mechanisms .. 19
1. Ring Isomerization-Dehydrogenation Reactions .. 20
2. Ring Opening Reactions .......................... 22
3. Composite Reaction Scheme ...................... 25
List of References - Chapter II ....................... 28
III. EXPERIMENTAL EQUIPMENT AND PROCEDURE ................... 33
iv
Reproduced with permission of the copyright owner. Further reproduction prohibited without permission.
PAGE
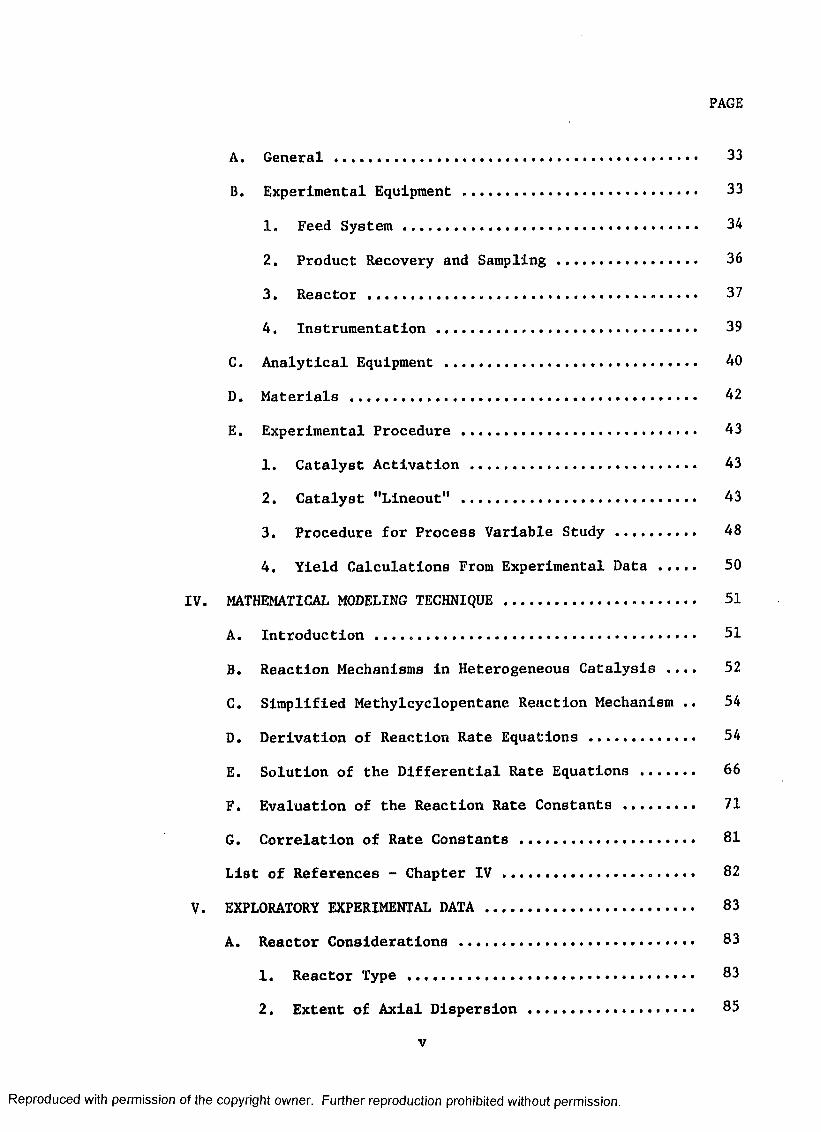
A. General ...................................... 33
B. Experimental Equipment ............................... 33
1. Feed S y s t e m ................. 34
2. Product Recovery and Sampling................... 36
3. Reactor ................. ................... 37
4. Instrumentation.................................. 39
C. Analytical Equipment ................................. 40
D. Materials ............................................. 42
E. Experimental Procedure ............................... 43
1. Catalyst Activation ............................. 43
2. Catalyst "Lineout" .............................. 43
3. Procedure for Process Variable Study ........... 48
4. Yield Calculations From Experimental Data .... 50
IV. MATHEMATICAL MODELING TECHNIQUE ......................... 51
A. Introduction .................................... 51
B. Reaction Mechanisms In Heterogeneous Catalysis .... 52
C. Simplified Methylcyclopentane Reaction Mechanism .. 54
D. Derivation of Reaction Rate Equations ............. 54
E. Solution of the Differential Rate Equations ....... 66
F. Evaluation of the Reaction Rate Constants ......... 71
G. Correlation of Rate Constants ...................... 81
List of References - Chapter I V ......................... 82
V. EXPLORATORY EXPERIMENTAL D A T A ........................... 83
A. Reactor Considerations .......................... 83
1. Reactor Type ..................................... 83
2. Extent of Axial Dispersion ..................... 85
v
Reproduced with permission of the copyright owner. Further reproduction prohibited without permission.

PAGE
3. Axial Temperature P r o f i l e ........ .............. 86
4. Catalytic Effects of Reactor W a l l s ...... 88
B. Catalyst "Llneout" Behavior ......................... 88
C. Test for Mass Transfer Limitations ................. 97
1. External Mass Transfer .......................... 98
2. Pore Diffusion ............. 102
List of References - Chapter V .......................... 108
VI. EXPERIMENTAL EFFECT OF SPACE T I M E ........................ 109
A. Introduction ...................... 109
B. Effect of Space Time on Reaction Products ......... 110
C. Evaluation of Kinetic Model .......................... 122
D. Kinetic Model Predictions ...................... 133
List of References - Chapter VI ......................... 137
VII. EXPERIMENTAL EFFECT OF PRESSURE AND TEMPERATURE........ 138
A. Introduction.......................................... 138
B. Pressure-Temperature Effect on Product Selectivity 142
C. Correlation of the Reaction Rate Constants ........ 170
List of References - Chapter VII ........ 194
VIII. CONCLUSIONS ................................................ 195
A. Reaction Mechanism for Catalytic Reforming of
Methylcyclopentane ................................... 195
B. Kinetic Model for Methylcyclopentane Reforming .... 197
G. Comparison of Ft and Ft-Re Catalysts ............... 198
D. Practical Implications of Experimental Data ...... 199
IX. RECOMMENDATIONS ............................................ 201
vi
Reproduced with permission of the copyright owner. Further reproduction prohibited without permission.

PAGE
APPENDICES
A. NOMENCLATURE ............................................... 203
B. EXPERIMENTAL DATA WITH PT-RE CATALYST ................... 208
C. EXPERIMENTAL DATA WITH PT CATALYST ...................... 230
D. CATALYST PROPERTIES ....................................... 257
E. NAPHTHA FEEDSTOCK PROPERTIES ........................... 259
SAMPLE CALCULATIONS .................................. 261
vii
Reproduced with permission of the copyright owner. Further reproduction prohibited without permission.
L IS T OF TABLES
TABLE PAGE
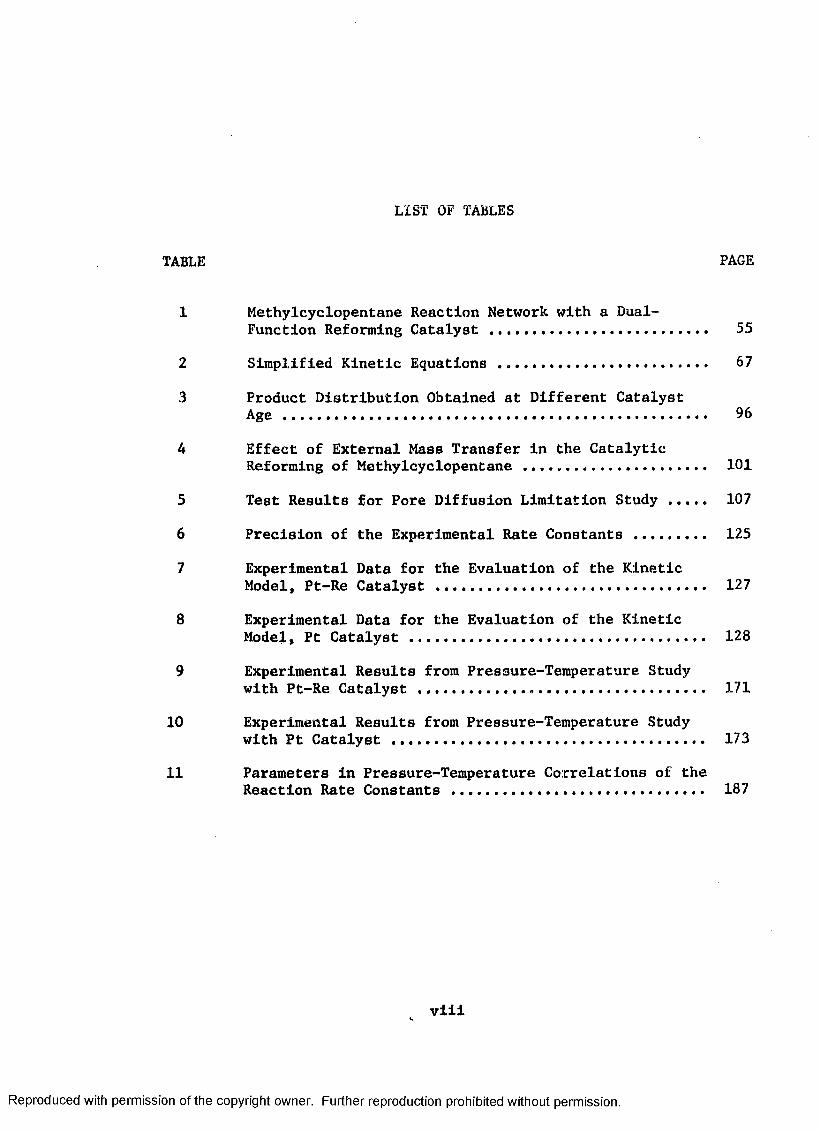
1 Methylcyclopentane Reaction Network with a Dual-Function Reforming Catalyst ............................ 55
2 Simplified Kinetic Equations ............................ 67
3 Product Distribution Obtained at Different CatalystAge ........................................................ 96
4 Effect of External Mass Transfer In the CatalyticReforming of Methylcyclopentane ........................ 101
5 Test Results for Pore Diffusion Limitation Study ..... 107
6 Precision of the Experimental Rate Constants .......... 125
7 Experimental Data for the Evaluation of the KineticModel, Pt-Re Catalyst ................................... 127
8 Experimental Data for the Evaluation of the KineticModel, Pt Catalyst ....................................... 128
9 Experimental Results from Pressure-Temperature Studywith Ft-Re Catalyst ..................................... 171
10 Experimental Results from Pressure-Temperature Studywith Pt Catalyst ......................................... 173
11 Parameters in Pressure-Temperature Correlations of theReaction Rate Constants ................................. 187
viii
Reproduced with permission of the copyright owner. Further reproduction prohibited without permission.

LIST OF FIGURES
FIGURE PAGE
1 Reaction Scheme for the Catalytic Reforming ofMethylcyclopentane ..................................... 27
2 Flow Diagram of Experimental Equipment ................ 35
3 Cross Sectional View of Experimental Reactor inFluldlzed Heating Bath ................................. 38
4 Schematic Flow Diagram for "RTCONST" Computer Program 76
5 Convergence of Optimization Procedure ................. 80
6 Reactor Temperature Profile - Llneout Operation ..... 87
7 Reactor Axial Temperature Profile - MCP Feed ......... 89
8 Activity Change During Catalyst Lineout .............. 92
9 Product Selectivity During Pt Catalyst Lineout ...... 93
10 Product Selectivity During Pt-Re Catalyst Lineout ... 94
11 Test for Pore Diffusion Limitations - Pt Catalyst,200 psig ................................................. 106
12 Benzene Yields with Pt-Re Catalyst, 850°F, 200 psig . Ill
13 Paraffin Yields with Pt-Re Catalyst, 850°F, 200 psig 112
14 Minor Product Yields with Pt-Re Catalyst, 850°F,200 psig ................................................. 113
15 Benzene Yields with Pt Catalyst, 850°F, 200 psig .... 119
16 Paraffin Yields with Pt Catalyst, 850°F, 200 psig ... 120
17 Minor Product Yields with Pt Catalyst, 850°F,200 p s i g ................................................. 121
18 Evaluation of the Kinetic Model with Pt-Re Yield Data 131
19 Evaluation of The Kinetic Model With Pt Yield Data .. 132
lx
Reproduced with permission of the copyright owner. Further reproduction prohibited without permission.
F7.GURE PAGE
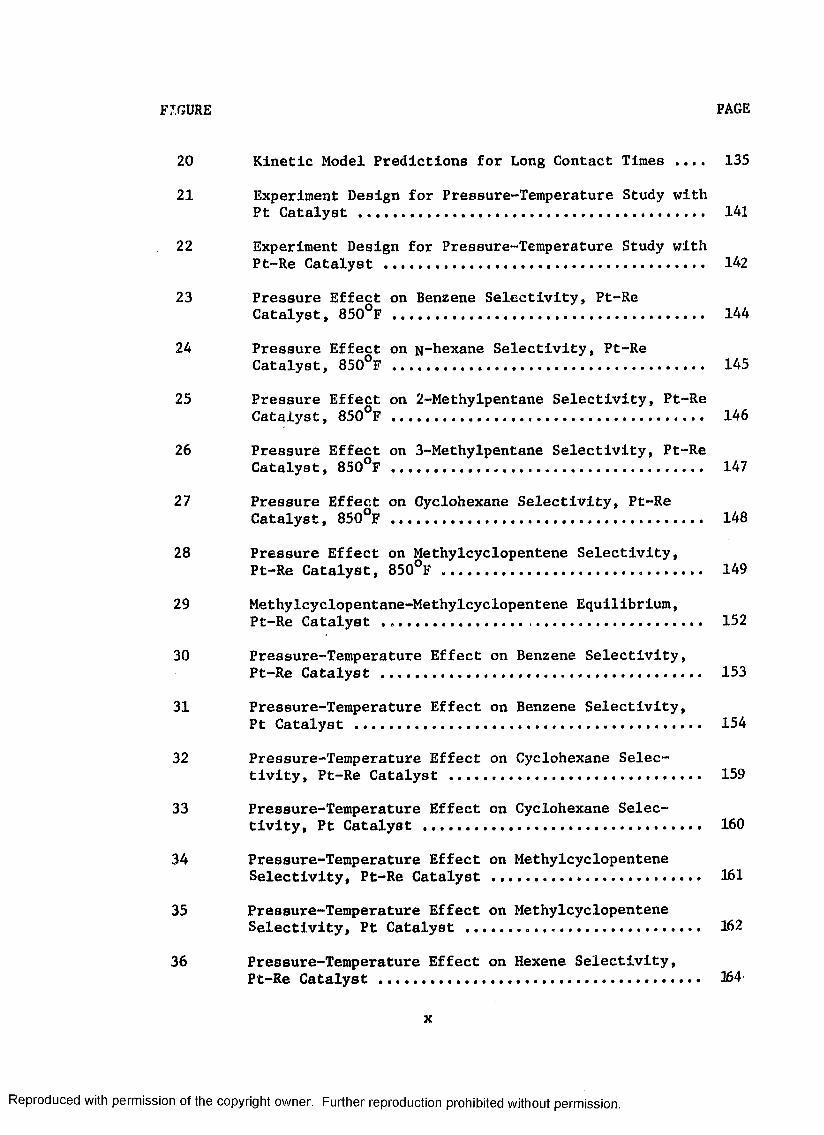
20 Kinetic Model Predictions for Long Contact Times .... 135
21 Experiment Design for Pressure-Temperature Study withPt Catalyst ............................................. 141
22 Experiment Design for Pressure-Temperature Study withPt-Re Catalyst .................... ..................... 142
23 Pressure Effect on Benzene Selectivity, Pt-ReCatalyst, 850°F ......................................... 144
24 Pressure Effect on N “hexane Selectivity, Pt-ReCatalyst, 850°F ......................................... 145
25 Pressure Effect on 2-Methylpentane Selectivity, Pt-ReCatalyst, 8 5 0 ° F ................. ....................... 146
26 Pressure Effect on 3-Methylpentane Selectivity, Pt-ReCatalyst, 850°F ......................................... 147
27 Pressure Effect on Cyclohexane Selectivity, Pt-ReCatalyst, 850°F ......................................... 148
28 Pressure Effect on Methylcyclopentene Selectivity,Pt-Re Catalyst, 850°F .................................. 149
29 Methylcyclopentane-Methylcyclopentene Equilibrium,Pt-Re Catalyst .................. ,...................... 152
30 Pressure-Temperature Effect on Benzene Selectivity,Pt-Re Catalyst .................................... . 153
31 Pressure-Temperature Effect on Benzene Selectivity,Pt Catalyst ............................................. 154
32 Pressure-Temperature Effect on Cyclohexane Selectivity, Pt-Re Catalyst ................................. 159
33 Pressure-Temperature Effect on Cyclohexane Selectivity, Pt Catalyst 160
34 Pressure-Temperature Effect on MethylcyclopenteneSelectivity, Pt-Re Catalyst ........................... 161
35 Pressure-Temperature Effect on MethylcyclopenteneSelectivity, Pt Catalyst ......... ..................... 362
36 Pressure-Temperature Effect on Hexene Selectivity,Pt-Re Catalyst ............................ ............. 164
x
Reproduced with permission of the copyright owner. Further reproduction prohibited without permission.

FIGURE PAGE
37 Pressure-Temperature Effect on Hexene Selectivity,Pt Catalyst ............................................ I65
38 Pressure-Temperature Effect on N-hexane Selectivity,Pt-Re Catalyst ......................................... 166
39 Pressure-Temperature Effect on N-hexane Selectivity,Pt Catalyst ............................................ 167
40 Pressure-Temperature Effect on 2MP Selectivity,Pt-Re Catalyst ......................................... 168
41 Pressure-Temperature Effect on 2MF Selectivity,Pt Catalyst ............................................ 169
42 Pressure Effect on Rate Constant K , Pt-Re Catalyst,850°F .............................. ? ...... 176
43 Pressure Effect on Rate Constant K, , Pt-Re Catalyst,8 5 0 ° F .............................. 7................... 177
44 Pressure Effect on Rate Constant K„, Pt-Re Catalyst,8 5 0 ° F ................................................... 178
45 Pressure Effect on Rate Constant K,, Pt-Re Catalyst,850°F .............................. ?!.................... 179
46 Effect of Temperature on Rate Constants from Pt-ReCatalyst ............................................... 184
47 Effect of Temperature on Rate Constants from PtCatalyst ............................................... 185
48 Comparison of Experimental Data with ModelPredictions for K .................................... 190a
49 Comparison of Experimental Data With ModelPredictions for .......... 191
50 Comparison of Experimental Data with ModelPredictions for K ................................. 192c
51 Comparison of Experimental Data with MedalPredictions for Kj .................................... 193
xi
Reproduced with permission of the copyright owner. Further reproduction prohibited without permission.

ABSTRACT
The catalytic reforming of methylcyclopentane (MCP) with
commercial platinum and platinum-rhenium reforming catalysts has been
investigated in an integral fixed-bed reactor. Both of the catalysts
had an activated alumina base which contained 0.6 per cent chloride.
The platinum catalyst was impregnated with 0.3 per cent of this metal
while the "bimetallic" catalyst contained 0.3 per cent of both platinum
and rhenium.
Both of these catalysts were aged with a virgin naphtha at rather
severe reforming conditions until their activity and selectivity "lined
out." An experimental program was conducted with these equilibrated
catalysts, which contained about 1.5 per cent coke, in which the reform
ing reactions of MCP were investigated. Data were obtained over a range
of pressures (100-400 psig) at each of three temperatures, 800°, 850°
and 900°F. An extensive investigation of contact time was made at 850°F,
200 psig and 10 moles hydrogen/mole MCP with the result that MCP con
versions from 10 to 90 per cent were studied. These tests were all made
in the absence of either pore diffusion or external mass transfer
limitations.
Fresh catalysts had an excessive hydrogenolysis activity with the
result that initial selectivity to benzene was low due to the large
amount of MCP ring-opening reactions which occurred. With increasing
catalyst age the hydrogenolysis activity rapidly declined and approached
a low, steady value.
xii
Reproduced with permission of the copyright owner. Further reproduction prohibited without permission.

Even with the equilibrated catalysts a significant amount of ring-
opening occurred. The data suggest that ring-opening proceeds through
two different mechanisms, one primarily responsible for isohexanes
while the other causes selective formation of n-hexane. Based on
experimental observations, it is postulated that ring-opening to
n-hexane is an acidic-site promoted reaction that is possibly related to
the carbonium ion mechanism responsible for ring isomerization.
Experimental data support the theory that the reaction to benzene
proceeds through olefin intermediates with the rate-limiting-step being
the isomerization of methylcyclopentene to cyclohexene.
Experimental results indicated that there are several types of
metal catalytic sites which have different susceptibilities to
deactivation.
The generally accepted reaction scheme for MCP over dual-function
where each reaction path is a first-order reversible reaction with
constant reaction rate constants. Solution of the set of differential
equations for this scheme resulted in a kinetic model which was validated
by the experimental data over a wide range of space times. Rate con
stants in the non-linear yield equations were determined from experi
mental data using a four-dimensional "Pattern Search" optimization
technique. A correlation of the four forward rate constants with
pressure and temperature was successfully developed.
The data indicated that the equilibrated Pt and Pt-Re catalysts
catalysts was simplified to the scheme
xiii
Reproduced with permission of the copyright owner. Further reproduction prohibited without permission.

produce nearly the same product distribution from MCP. Activity of
the Pt-Re catalyst was slightly lower due to the longer time required
for Its "lineout."
Activation energies for the four reactions in the above scheme were
all lower for the Pt catalyst.
At 900°F and 100 psig the Pt catalyst deactivated in such a way
that more olefins and cyclohexane were produced at the expense of benzene
yield. The Pt-Re catalyst maintained activity at these conditions. An
explanation is postulated for the better activity maintenance demon
strated for the Pt-Re catalyst.
xiv
Reproduced with permission of the copyright owner. Further reproduction prohibited without permission.

CHAPTER I
INTRODUCTION
Catalytic reforming is a petroleum refining conversion process
designed to substantially improve the octane of virgin naphtha boiling
in the gasoline range. This process has grown from its infancy in the
early 1950's to the point that reforming capacity accounted for nearly
22 per cent of all the petroleum processed in the U.S.A. by the end of
1970. The growth of this process will probably continue at a rapid
pace as lead restrictions in gasoline become progressively tighter.
Catalytic reforming is a complex conversion process in which many
types of reactions occur. The most important, however, are those which
produce higher octane products from the feed, such as the conversion of
naphthenes and paraffins to aromatics and the isomerization and hydro-
cracking of paraffins.
The reaction of cyclopentane homologues to aromatic products is an
important reforming reaction because of the large amounts of these
compounds in reformer feeds and because of the significant octane
Improvement to be gained by their conversion. A reaction of this type
is the conversion of methylcyclopentane to benzene and other by-products.
While this particular reactant is not usually present in reformer feeds
in significant amounts, the reactions it undergoes are very similar to
those for the higher molecular weight cyclopentanes which comprise a
considerable portion of the naphtha. Methylcyclopentane, because it. is
1
Reproduced with permission of the copyright owner. Further reproduction prohibited without permission.

2
readily available In a purified form, Is, therefore, the most
convenient cyclopentane which can be used to Investigate this general
type of reforming reaction.
The catalytic reforming of methylcyclopentane is an interesting
reaction scheme to study because reactions occur on both acidic and on
hydrogenation-dehydrogenation catalytic sites. In addition, several
types of reactions occur both simultaneously and sequentially:
dehydrogenation, ring isomerization, and ring-opening. This particular
reaction scheme should, therefore, be one which will provide a
considerable amount of information about the nature of reforming
catalysts. Although, the catalytic reforming of methylcyclopentane has
been investigated by numerous researchers, extensive data over a wide
range of conditions are nott available. Also, very little attention has
been given to all the reforming reactions that occur with this compound.
Since the early 1950’s most catalytic reforming has been performed
with a dual-function catalyst in which a small amount of platinum is
highly dispersed on an alumina base. Acidity is imparted to the
catalyst by activating the base with halogens. Over 90 per cent of
reforming capacity installed as early as 1958 used this type of catalyst.
The first significant development in reforming catalysts since the
introduction of the Pt-Al203~halogen catalyst has just recently been
revealed. A halogen-activated alumina-base catalyst containing not only
platinum but rhenium as well is now being used commercially. This
’’bimetallic" catalyst supposedly is more resistant to deactivation than
the P t - A ^ O ^ catalyst. All indications are that this catalyst will find
extensive use in the future as reforming conditions are pushed to higher
severities where deactivation is of prime concern.
Reproduced with permission of the copyright owner. Further reproduction prohibited without permission.
3
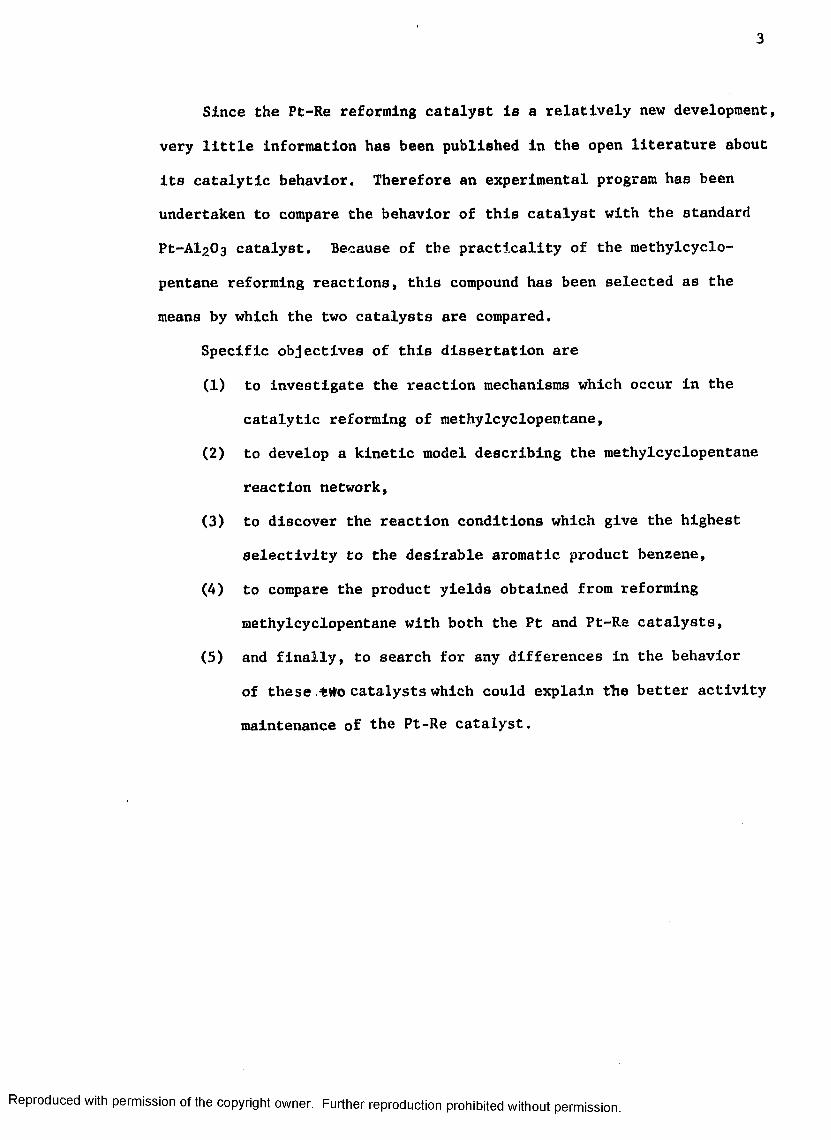
Since the Pt-Re reforming catalyst Is a relatively new development,
very little information has been published in the open literature about
its catalytic behavior. Therefore an experimental program has been
undertaken to compare the behavior of this catalyst with the standard
Pt~Al203 catalyst. Because of the practicality of the methylcyclo
pentane reforming reactions, this compound has been selected as the
means by which the two catalysts are compared.
Specific objectives of this dissertation are
(1) to investigate the reaction mechanisms which occur in the
catalytic reforming of methylcyclopentane,
(2) to develop a kinetic model describing the methylcyclopentane
reaction network,
(3) to discover the reaction conditions which give the highest
selectivity to the desirable aromatic product benzene,
(4) to compare the product yields obtained from reforming
methylcyclopentane with both the Pt and Pt-Re catalysts,
(5) and finally, to search for any differences in the behavior
of these .ttto catalysts which could explain the better activity
maintenance of the Pt-Re catalyst.
Reproduced with permission of the copyright owner. Further reproduction prohibited without permission.

CHAPTER II
LITERATURE SURVEY
A. Introduction
Since its beginning three decades ago catalytic reforming has
developed into one of the principal petroleum refining processes for the
conversion of virgin naphtha to high octane gasoline. After a period of
slow development during the 1940*s new reforming capacity has been con
tinuously added at a very rapid rate with U.S. capacity Increasing from
only 10,000 barrels per day in 1 9 5 0 ^ ^ to nearly 2 million by 1 9 6 0 . ^ ^
Expansion during the 1960's was equally rapid with U.S. reforming(12)capacity reaching over 3 million barrels per day by the end of 1970.
This amount represents about 22 percent of all the petroleum processed
in the U.S.^*^ All present indications are that catalytic reforming
will grow at an even faster pace in the future due to the lead restric
tions being placed on gasoline. Reforming is one of the available pro
cesses with the potential for producing the high octane product which
will be needed in the absence of lead.
Catalytic reforming is a process which converts low octane, virgin
naphtha into a high octane "reformate." The octane rating, which is
related to the fuel's performance in an engine, is increased by virtue
of chemical reactions that produce aromatics as well as lower molecular
weight and more isomeric paraffins.
4
Reproduced with permission of the copyright owner. Further reproduction prohibited without permission.
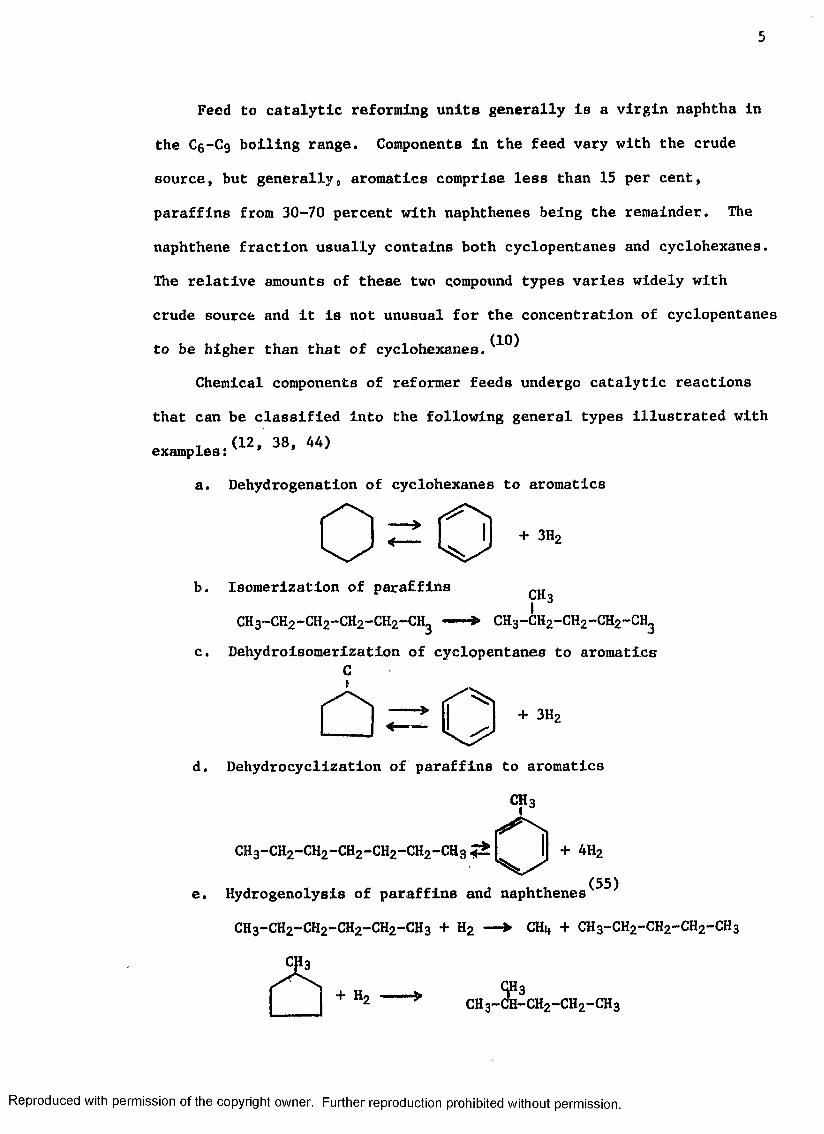
Feed to catalytic reforming units generally is a virgin naphtha in
the C6-C9 boiling range. Components in the feed vary with the crude
source, but generally, aromatics comprise less than 15 per cent,
paraffins from 30-70 percent with naphthenes being the remainder. The
naphthene fraction usually contains both cyclopentanes and cyclohexanes.
The relative amounts of these two compound types varies widely with
crude source and it is not unusual for the concentration of cyclopentanes
to be higher than that of cyclohexanes.
Chemical components of reformer feeds undergo catalytic reactions
that can be classified into the following general types illustrated with
examples:<12- 38> «*>
a. Dehydrogenation of cyclohexanes to aromatlcs
b. Isomerization of paraifins
c. Dehydrolsomerizatlon of cyclopentanes to aromatlcsC
d. Dehydrocyclization of paraffins to aromatlcs
CH3
CH3-CH2-CH2-CH2-CH2-CH2-CH3
e. Hydrogenolysis of paraffins and naphthenes (55)
CH3-CH2“ CH2-CH2-CH2-CH3 + H2 — ► CHi+ + CH3-CH2-CH2-CH2-CH3
Reproduced with permission of the copyright owner. Further reproduction prohibited without permission.
6
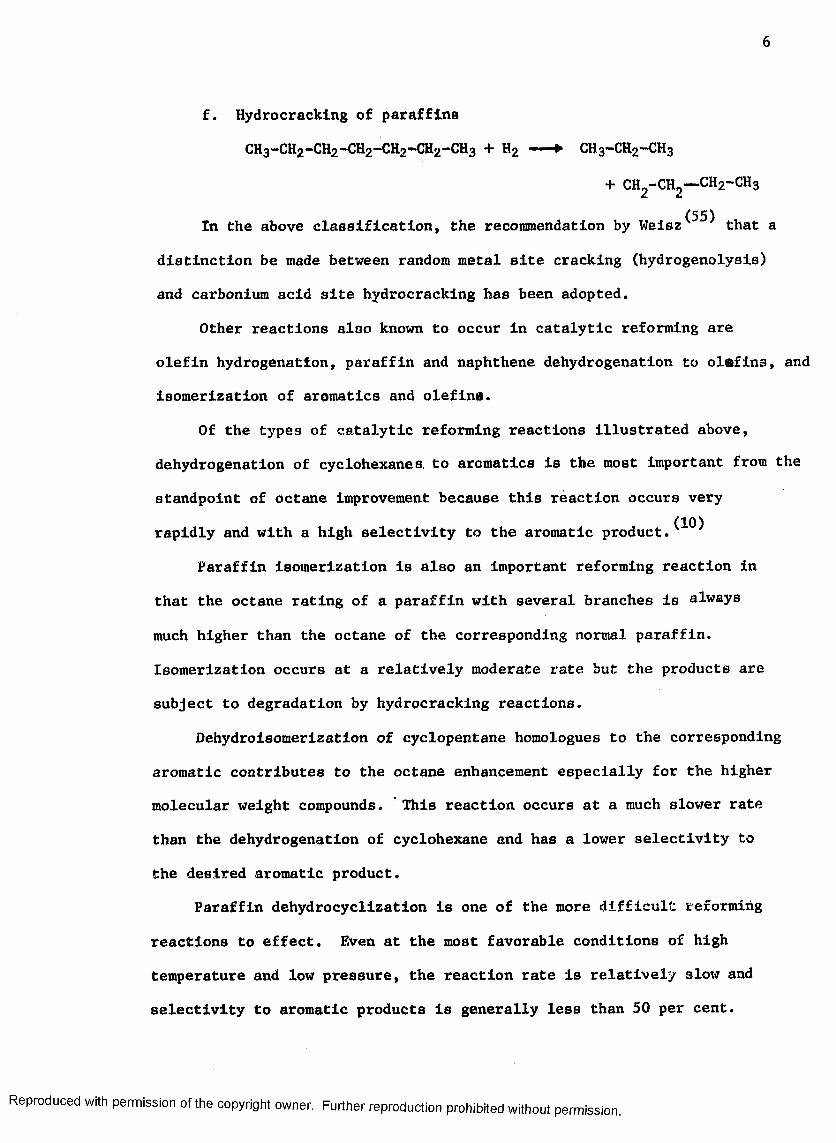
f. Hydrocracking of paraffins
CH3-CH2-CH2-CH2-CR2-CH2-ch3 + H 2 ---► CH3-CH2-CH3
+ ch2-ch2— ch2~ch3
(55)In the above classification, the recommendation by Weisz that a
distinction be made between random metal site cracking (hydrogenolysis)
and carbonium acid site hydrocracking has been adopted.
Other reactions also known to occur in catalytic reforming are
olefin hydrogenation, paraffin and naphthene dehydrogenation to olaflns, and
isomerization of aromatlcs and olefins.
Of the types of catalytic reforming reactions illustrated above,
dehydrogenation of cyclohexanes. to aromatlcs is the most important from the
standpoint of octane improvement because this reaction occurs very
rapidly and with a high selectivity to the aromatic product.
Paraffin isomerization is also an Important reforming reaction in
that the octane rating of a paraffin with several branches is always
much higher than the octane of the corresponding normal paraffin.
Isomerization occurs at a relatively moderate rate but the products are
subject to degradation by hydrocracking reactions.
Dehydroisomerization of cyclopentane homologues to the corresponding
aromatic contributes to the octane enhancement especially for the higher
molecular weight compounds. This reaction occurs at a much slower rate
than the dehydrogenation of cyclohexane and has a lower selectivity to
the desired aromatic product.
Paraffin dehydrocyclization is one of the more difficult reforming
reactions to effect. Even at the most favorable conditions of high
temperature and low pressure, the reaction rate is relatively slow and
selectivity to aromatic products is generally less than 50 per cent.
Reproduced with permission of the copyright owner. Further reproduction prohibited without permission.

7
This reaction has, therefore, the most potential for improvement of any
of the catalytic reforming reactions.
Hydrogenolysis of paraffins results in the formation of low molecu
lar weight hydrocarbons which cannot be put in the gasoline fraction.
Decyclizing the naphthene ring produces paraffins which have a much
smaller probability of being converted to aromatlcs than the corres
ponding naphthenes. Both of these reactions are obviously undesirable
in reforming operation.
The last reaction type illustrated above, hydrocracking, is very
prevalent particularly’, at severe reforming conditions. Hydrocracked
products cause a much smaller improvement in octane than could have been
realized by the formation of aromatlcs. Yet this reaction does enhance
the octane of the liquid reformate by cracking out the relatively low
octane paraffins, thus concentrating the aromatlcs. This benefit is,
however, at the expense of gasoline yield, making hydrocracking a
generally undesirable reforming reaction.
The catalytic reforming of cyclopentanes is one of the most interest
ing and important reforming reactions. It is interesting in that
reforming of a pure cyclopentane homologue (all but cyclopentane) can
eventually result in the occurrence of everyone of the reaction types
described above. This complex network of reactions represents an
extremely challenging area for investigation. Reforming of C5 ring-
naphthenes is an important reaction because of the significant amount of
these compounds usually present in reformer feeds. Furthermore, a better
understanding of these reactions might contribute to the development of
catalysts or the selection of reaction conditions that will produce higher
aromatic yields from cyclopentane compounds. For these reasons, the
Reproduced with permission of the copyright owner. Further reproduction prohibited without permission.

8
catalytic reforming of cyclopentanes has been selected as the topic for
this dissertation.
The remainder of this chapter discusses (1) the types and nature of
catalysts used to reform C5 ring naphthenes and (2) the reaction
mechanisms that have been proposed for these reactions with present-day
reforming catalysts.
B. Reforming Catalysts
Catalysts which promote the reforming reactions described in the
previous section need a hydrogenation-dehydrogenation capability as well
as an acidic component to promote carbonium ion type reactions. Hydro
genation-dehydrogenation reactions are catalysed by many of the transi
tional elements either in the metallic, oxide or sulfide forms. Even
though the pure transition metal or metal oxide can be an effective
catalyst, they are usually supported on some base. The following
catalystsfor hydrogenation reactions have been reported in the
literature:
Transition Metals
Pt,(51) Pd,(51* G o / 51* Re, M , (57>
Oxide-Supported Transition Metals
Cu-Cr20 3/ 3* N l ~ B e o / 20* Ni-ZnO,(2* Pd-Al20 3/ 23* Pt-Al20 3,(7)
Pt-Ti02 ,(37) Pt-Mgo/37* Re-Al20 3/ 23* Rh-Al20 3/ 35*
Transition Metal Oxides_ „ (7, 27) M (16) .. n (8)Cr20 3, Mo20 3, V20 3
Supported Transition Metal Oxides
Cr20 3-Al20 3/ 7* Mo02-Al20 3,(52) N i W O ^ - A l ^ / 7*
In general the transition metals are better hydrogenation catalysts
than the transition oxides possibly because the active sites for both
Reproduced with permission of the copyright owner. Further reproduction prohibited without permission.
9
catalyst types are free metal Ions, which are few In number in the
oxides. It is thought that the hydrogenation ability of a catalyst is
related to the electronic structure of the transition metals, particu-_ too)larly to the partially-filled d orbital.
The other catalytic property needed to promote reforming reactions
is the presence of acidic sites on which carbonlum ions are formed and
react. These sites generally occur on compounds classified as acidic
chalcides which include both oxides and sulfides. Silic?.-alumina
mixtures, halogen activated aluminas j and crystalline
z e o l i t e s ^ are the most common examples.
1. Reforming Catalyst Development
The first commercial reforming unit, which went on stream in(10 )1940, employed a molybdena-alumina catalyst (M02O 3 supported on AI2O 3).
At this early stage of reforming history only the transition metal oxides
supported on alumina were being considered as reforming catalysts.
Extensive investigation of both chromla-alumina (0 ^ 0 3 on AI2O 3) and
molybdena-alumina had revealed that the latter was the best catalyst.
The chromia catalysts have the best selectivity for dehydrogenation of(15cyclohexanes and paraffin dehydrocyclization at atmospheric pressure. »
16 ) However, at the higher hydrogen pressures (20 atm.) required to
prevent excessive coke formation, the chromia catalysts are definitely
inferior in activity presumably because of preferential hydrogen adsorp
tion. Also the chromia catalysts have no activity for isomerization of
paraffins or cyclopentanes, while the molybdenium oxide catalysts(15)effectively promote both of these reactions.
The principal disadvantages of molybdena-alumina as a reforming
catalyst is low activity and the necessity for frequent regeneration-
Reproduced with permission of the copyright owner. Further reproduction prohibited without permission.
10
to restore activity lost due to coke formation. During the 1940's
scientists were, therefore, searching for a new type of catalyst that
would have not only better activity maintenance but a higher selectivity
to desirable products as well. Out of this search emerged a new class
of dual-functional reforming catalysts that have been almost universally
adopted in present technology. The hydrogenation and acidic properties
of these catalysts are recognized to come from separate components of
the catalyst, as in the case of molybdena supported catalysts.
Platinum has emerged as the principal hydrogenation component of
these dual-functional catalysts while halogen activated aluminas
provide the acidic function.
The first commercial application of the new dual-function
catalyst was made by Universal Oil Products Company in 1949 Their
process, called Flatforming, has continually led all others in installed
reforming capacity and by 1970 it still accounted for nearly 50 per cent(41)of catalytic reforming conducted in the U.S. As early as 1958 at
least 90 per cent of reforming was based on the dual-function catalyst
using platinum supported on activated alumina. These catalysts
continued to be used with little modification until the late 1960's when
the Chevron Research Company announced the successful commercial
demonstration of a "bimetallic" catalyst containing platinum as well as(25)rhenium supported on a halogenated alumina. In the demonstration
this new catalyst gave higher selectivity to C^+ products as well as
better activity maintenance than conventional platinum catalysts. It
now appears that the next generation of reforming catalysts will be of
the "bimetallic" tj^pe. The better activity maintenance of these cata
lysts will be needed for the low pressure operation that will probably
Reproduced with permission of the copyright owner. Further reproduction prohibited without permission.

11
become necessary as lead restrictions in gasoline become more severe.
(Low pressure favors Increased aromatlcs production, hence higher
octane reformate.)
2. Dual-Function Reforming Catalysts
It is generally thought that the mechanism for many reforming
reactions Involves a sequence of reaction steps with Intermediate pro^
ducts being formed on different catalytic sites. For example, isomeri
zation of paraffins probably occurs through olefin intermediates formed
on dehydrogenation sites followed by carbonium ion formation and
rearrangement on acidic sites. As will be discussed later, there is
conclusive evidence that two distinct catalytic centers exist and are
both necessary for reaction to occur.
a. Hydrogenation-Dehydrogenation Component
Different transition metals such as Co, Ir, Ni, Pd, Pt,
and Re have been used as the source of hydrogenation activity in re
forming catalysts, but platinum is by far the most common because it
appears to have the best hydrogenation activity.
Platinum is normally added to the alumina base by
impregnation of a solution of chloroplatinic acid (I^FtClg). After
drying, platinum is reduced to the metal with hydrogen according to the
reaction:
H2PtCl6 + 2R2 ---- ► Pt + 6HC1.
Generally, the amount of platinum added to the support is(43)0.3-0.6 weight per cent. Sinfelt has shown the effect of platinum
contents from 0.0 to 0.6 percent upon several different reforming
reactions. In these tests made with a nonacldic alumina base, no
reactions occurred in the absence of platinum. Little difference was
Reproduced with permission of the copyright owner. Further reproduction prohibited without permission.

12
observed in the Isomerization rate of heptane or raethylcyclopentane as
the platinum content was increased above 0.3 per cent. The rate of
heptane dehydrocyclization, however, continued to increase as the
platinum content was raised from 0.1 to 0.6 per cent.
In order for this small amount of platinum to be effec-(47)tive, it must be in a highly dispersed form. Spendel and Boudart
concluded from hydrogen adsorption studies that the platinum on fresh
catalyst (r^-alumina support) is present in the form of two-dimensional
crystallites that are less than 10 £ in diameter. A lower dehydrogena
tion activity for platinum on silica-alumina as opposed to an alumina(14)support has been observed. Cusumano has attributed this lower
activity to the poorer platinum dispersion which he measured for the
silica-alumina support. Platinum surface area was 10 times smaller on
the silica base and,.crystallite size was estimated to be 85 R.
There is strong evidence to indicate that significant catalyst
deactivation is associated with growth or agglomeration of the platinum(28)crystallites. Sintering experiments by Meat demonstrated that as
crystallite size increases from 10 to 500 X, the dehydrocyclization rate
of heptane steadily decreases while hydrocracking and isomerization rates/Q » \
remain nearly constant. Mills has pointed out that crystal growth
can occur under the influence of heat bdth before and during reduction
and that growth is accelerated in the presence of small amounts of oxygen
or water. The most likely time for crystal growth is during catalyst
regeneration where the possibility of high localized temperatures is
great as coke is burned off the catalyst. Extreme precautions are
usually taken at this step to control combustion.
Platinum sites are particularly susceptible to certain
Reproduced with permission of the copyright owner. Further reproduction prohibited without permission.

1 3
catalyst polaons not the leaat of which is sulfur, which if present in
large enough quantities can completely eliminate the dehydrogenation(11)capability of reforming catalysts. Clapetta has noted that
temporary sulfur poisoning is reversible, that is, the activity can be
restored by removal of the sulfur from the feed stream. Continuously
high sulfur levels are to be avoided since irreversible damage can
occur. On the other hand, some refiners purposely maintain a low sulfur
concentration in their reformers expecially during startup with a fresh
catalyst. This sulfur takes the hydrocracking edge off the catalyst.
Nitrogen is not normally considered a Pt-site poison be-(32)cause of its much stronger effect on acid sites. Meisel, however,
states that nitrogen does poison metal sites, but the extent is usually
small and the effect is seldom seen because of the excess hydrogenation
capability which most catalysts have.
Before concluding this discussion of the hydrogenation
component of reforming catalysts, it seems appropriate to consider the
role of this part of the catalyst in reforming reactions. Quite obvious-
ly'TLt is the platinum sites which promote dehydrogenation of Ce ring
naphthenes to benzene. These metal sites also initiate olefin interme
diates which are important in many of the reforming reactions. It is
generally felt that the platinum sites play an important role in main
taining catalyst activity by hydrogenatlisg polymeric compounds that would/g\
otherwise have been converted to coke. In fact, Beuther postulates
that the only effective acidic sites are those which surround active
metal crystallites. Proximity of the two sites should be critical since
high molecular weight polymers formed on the acid sites must migrate to
the metal centers for hydrogenation.
Reproduced with permission of the copyright owner. Further reproduction prohibited without permission.
14
The metal catalytic centers are also responsible for the
undesirable hydrogenolysis reactions which can be quite prevalent. This
type of reaction Is a random cracking of molecules as opposed to the
orderly cracking on acid sites by a carbonium ion mechanism.
Finally, it should be mentioned that data have been
obtained which suggest that metal sites may have an even more signifies)cant role than indicated above. Barron obtained data with reforming
type catalysts at temperatures generally below 600°F which furnish
strong evidence that hexane Isomerization is a metal site catalyzed
reaction at these conditions. Furthermore, the mechanism is postulated
to involve a triadsorbed intermediate as opposed to a carbonium ion.
Barron and co-worker conclude their discussion with these remarksi
"-The platinum certainly catalyzes by itself for a large
part Isomerization and aromatization, and cannot be considered as a(5)simple hydrogenating-dehydrogenating agent."
b. Acidic Component
The base material for dual-function reforming catalyst
with a platinum hydrogenation component is usually alumina (AI2O 3).
Silica-alumina mixtures have been used in the past, but as mentioned(36)above better platinum dispersion occurs with alumina. Also, Myers
has shown that less hydrogenolysis (metal-site cracking) occurs when
alumina is used as the support especially for catalysts which have a high
hydrogenation activity.
It has been shown that alumina exists in seven crystalline
forms. However, reforming catalyst manufacturers generally use only
two types - gamma and eta. In a recent reforming catalyst review,/■j p\
Ciapetta * has presented data which show that these two forms of
Reproduced with permission of the copyright owner. Further reproduction prohibited without permission.

15
alumina have different properties. Eta alumina while having about the
same total acidity as the gamma form displays a higher activity for both
double bond and skeletal isomerization of pentene-1. This higher
activity could be the result of stronger acid sites for the eta form.
In this same article Clapetta presents further data which show that
gamma alumina is the most stable form with the result that catalysts
using this support deactivate at a slower rate when subjected to severe
treatment.
Alumina by itself has appreciably less acidity than (15 44)silica-alumina mixtures. * Therefore, it is usually activated with
halogens such as chloride or fluoride. It is felt that addition of HC1,
for instance, results in the formation of Bronsted sites (acidic sites
which can donate a proton to a reacting species). One theory is that the
halogens with their large electron affinity cause residual hydrogen atoms(39)at the catalyst surface to become more acidic. In another investi
gation reviewed by Ciapetta^^' it was concluded that HC1 dissociates
as it is adsorbed causing the formation of acidic hydroxyl groups which
can catalyze isomerization reactions.
The acidity of alumina activated with HF or HC1 has been(49)found to be proportional to the amount of halogen added. Alumina
acidity in turn affects the rate of different reforming reactions. In an(11)earlier reforming review Clapetta presents data showing the effect of
different chloride levels on an alumina-base catalyst with 0.25 per cent
platinum. These data show that isomerization rates of heptane and cyclo-
hexane increase significantly as the chloride level is increased from
0.06 to 0.49 per cent. Further increase of chloride to 1.2 per cent re
sults in Increased heptane isomerization activity but also an appreciable
Reproduced with permission of the copyright owner. Further reproduction prohibited without permission.

16
hydrocracking activity. Thus, there appears to be an optimum chloride
level. If; the chloride level Is too low, Isomerization activity is
insufficient. Too high of a chloride level, on the other hand, will
result in excessive hydrocracking. In commercial operation, particular
ly with wet feeds, there is a tendency for the chlorides to be stripped
off the catalyst. This effect is compensated for by the addition of
small amounts of organic chlorides to the feed, so that the optimal/ \
chloride level will be maintained on the catalyst.(53)Weisz has presented data which show that catalyst
acidity rather than the hydrogenation component is usually the control
ling factor of overall reforming activity. At a given acidity level,
naphtha reforming is unaffected by decreasing dehydrogenation activity
up to some lower limit. Above this threshold level activity bears a
definite relationship to the acidity level. The explanation for this
behavior is that many of the reforming reactions proceed by a carbonium4
ion mechanism. Many of these reactions typically occur on the acidic
catalyst sites. Isomerization of paraffins and naphthenes as well as
paraffin hydrocracking are examples of reactions promoted by the acidic
sites on the alumina base. Dehydrocyclization of paraffins apparently
depends on both acidic and metal sites.
c. Relationship Between Acidic and Metal Sites
Early studies of the mechanisms of reforming reactions
demonstrated the need for both acidic and metallic catalytic sites. For
instance, in 1953 Mills published data which show that under other
wise identical conditions only 3 percent benzene appears in the product
from reaction of methylcyclopentane over a catalyst with only isomeriza
tion (acidic) capability; 7 per cent benzene is obtained with a
Reproduced with permission of the copyright owner. Further reproduction prohibited without permission.
17
dehydrogenation catalyst, while 49 percent is obtained with a catalyst(21)having both components. Hindin performed essentially the same
experiment except a Pt-Si02 catalyst with only dehydrogenation cap
ability and a Si02-Al203 catalyst with only an acidic function were
mechanically mixed together. Whereas, the dehydrogenation catalyst
produced little benzene from methylcyclopentane, when it was mixed with
the acidic catalyst, appreciable conversion to benzene occurred.
Furthermore, the degree of acidity of the second catalyst governed the
rate at which benzene was formed. The significant point of this investi
gation is that "the D. F. (dehydrogenation function) and the A. F.
(acidic function) need not be present at the same adsorption site, not(21)even on the same catalyst s u r f a c e . / This observation stands as
evidence that reforming of methylcyclopentane proceeds through lnterme*
diates which can diffuse through the gas phase from one type of site to
another.
A question naturally arises about the physical distance
separating the two types of sites. Is a certain intimacy required for(54)reaction to occur? Weisz and Swegler present heptane isomerization
data in which the isomerization rate is shown to decrease as the
particles comprizing the catalyst mixture are increased from 5 to 1000
microns. This topic has been considered in an excellent exposition by
W e i s z w h i c h deals specifically with reforming reactions. It is
shown that a diffusion criteria for the reaction intermediates must be
satisfied in order to have the proper particle intimacy. For a typical
reforming reaction it is estimated that component particle sizes must be
less than 10 microns if the partial pressure pf the reaction intermediate
is as low as 1Q“5 atm. If the intermediate is present in larger
Reproduced with permission of the copyright owner. Further reproduction prohibited without permission.
18
concentration, such as 0.1 atm. partial pressure, then particle sizes
as large as 0.5 mm can be tolerated. Normal reforming catalysts are
prepared by Impregnating a solution containing the platinum component
on the alumina base. Therefore, one would not expect any intimacy
problems since the distance separating the two sites is certainly very
small.
3. “Bimetallic1* Dual-Function Catalysts
The latest development in reforming catalysts is the addition
of a second metal on Pt-Al203 catalysts. Chevron Research Company in(58)
1968 was granted the first patent on a catalyst of this type. Data
were presented in that patent which show that a platlnum-rhenium
catalyst has better dehydrogenation activity than a catalyst with only
the platinum metal component. Results of a commercial plant test with(25)the Pt-Re catalyst are described in a paper by Jacobson and others.
The advantage noted for the new catalyst is a greater resistance to
deactivation which can be utilized by operating at conditions at which
higher octane and/or yields are obtained. Later patents on the Pt-Re(59)catalyst have been issued to Chevron for naphtha operation, catalyst
pretreatment with aromatics^*^ and with sulfur and for dehydrogena
tion of isobutane.
Since this bimetallic catalyst is such a recent development,
it is not surprising that very little information has been published.
No doubt the results from many investigations will be forthcoming which
hopefully will explain the beneficial role of the rhenium component.
Also other metal combinations will certainly be tested and discussed.
The research discussed in this dissertation was performed with both Pt
and Pt-Re reforming catalysts. Hopefully, the results presented in a
Reproduced with permission of the copyright owner. Further reproduction prohibited without permission.

19
later chapter will ahed some light on the role of the second metal.
C. Methylcyclopentane Reforming Reaction Mechanisms
As described earlier in this chapter, one of the major reforming
reactions is dehydroisomerizatlon of cyclopentane homologues to aroma-
tics. Virgin naphtha feed to catalytic reformers contains an appre-(29)ciable amount of C5 ring naphthenes. Analyses reveal that most of
these compounds are methylcyclopentanes such as the trlmethylcyclopen-
tanes, dlmethylcyclopentanes and methylcyclopentane. The latter com
pound is usually present in smaller amounts than the other two homo
logues.
Furthermore, ethylcyclopentanes and propylcyclopentanes frequently/ o o
represent an even smaller fraction. Keulemans and Voge studied the
reactions of C5-C8 cyclopentanes over a Pt-Al203 reforming catalyst at
660°F and atmospheric pressure. An interesting point about their results
is that all the Cg-Cg methylcyclopentane compounds reacted at about the
same rate. The timjor reaction for all these compounds was ring
isomerization followed by dehydrogenation to the aromatic compound. With
these results one would hope that a study of methylcyclopentane, the only
one of these compounds readily available, will provide information that
can be applied to commercial operation.
One of the earliest studies of the reforming reactions of methyl-(19)cyclopentane was published by Heinemann and co-workers in 1953.
This study revealed that the major products from catalytic reforming of
methylcyclopentane are benzene and hexane isomers. These products
indicate that three major reactions are occurring - ring isomerization,
dehydrogenation and ring opening. Proposed mechanisms for each of these
reactions will be presented in the following sections.
Reproduced with permission of the copyright owner. Further reproduction prohibited without permission

20
1. Ring Isomerization - Dehydrogenation Reactions
As has been previously mentioned, there is ample evidence
that dehydroisomerization of methylcyclopentane to benzene requires a(33)catalyst with both acidity and dehydrogenation capability. Mills,
Hindin, and Weisz have all shown this to be the case./1fl\
In an excellent study, Haensel has shown that a primary
product from the catalytic reforming of methylcyclopentane with a Pt-
Al203~halogen catalyst is the cyclic olefin, methylcyclopentene.
Furthermore, in the work cited above it was demonstrated that the cyclic
olefin is formed on the metal component while the isomerization step to
a Cg ring only occurs with the acidic function of the catalyst present.
These results suggest the following mechanism for conversion of methyl-
cyclopentane to benzene which has been proposed by numerous. (10, 11, 18, 33)researchers: ' * *
Bz
Mm c p — — T MCP.
CH
In this scheme M and A designate metal and acidic catalytic sites,
respectively. At normal reforming conditions the reaction intermediates,
methylcyclopentene and cyclohexene, are present in small concentrations.
The amount of cyclohexane by-product is normally small, but is a function
of reactor conditions.
The opinion of most researchers is that the rate-limiting-step
in the above reaction sequence is ring isomerization on acidic catalytic
Reproduced with permission of the copyright owner. Further reproduction prohibited without permission.

(18)sites. Haenselv reaches this conclusion based on the observation
that cyclohexene is present in extremely small concentrations indicating
that it is rapidly converted to benzene and cyclohexane, whereas the
methylcyclopentene concentration is generally much higher. The
relatively high concentration of the latter intermediate can only be
explained if the Isomerization step is rate limiting. The fact that/p/\
Keulemans and Voge ' are able to explain reaction rates and product
yields from Cg-Cs cyclopentan® by a carbonium ion mechanism gives strong(42)support that the isomerization step is rate limiting. Sinfelt also
agrees with this mechanism but points out that at very low hydrogen
partial pressure the rate-limiting-step might change to the initial
olefin formation reaction.
The rate-limiting, isomerization step can best be explained by
a carbonium ion mechanism as follows:
C ? C(+)C G CI I Ic c v c c (+ ) c _ c
/ \ © A + ) \ © / \ ® I ©c ' c -C C — »-C c 1\ / — \ /— \ /c ---- c C ---- C C ---- C C C C G
Nv.c
Formation of a carbonium ion from an olefin is a well-known reaction.
Before isomerization can occur the tertiary ion must be converted to the
less stable primary ion. The third step is simply an alkyl shift
reaction where the carbonium ion and alkyl group exchange carbon atoms.
Last step on the catalytic site is formation of the cyclohexene
intermediate which must diffuse to a metal site for further reaction.(18)Haensel has proposed the above mechanism in favor of initial forma
tion of a primary carbonium ion because it represents a lower activation
energy route.
Reproduced with permission of the copyright owner. Further reproduction prohibited without permission.
22
Several Interesting points about the methylcyclopentane/ I O N
reaction scheme to benzene have been made. Data obtained by Haensel
indicate dehydrogenation of cyclohexene to benzene might occur on
platinum sites different from those metal sites which hydrogenate cyclo
hexene. This speculation is based on data in which the yield of benzene
decreases much faster than that of cyclohexane with catalyst age and/or(45)sulfur exposure. Another point is that Smith and Prater have shown
that for the cyclohexane-cyclohexene-benzene reaction scheme, direct
reaction from cyclohexane to benzene is indicated by experimental data
provided that the limiting step is reaction at the catalyst surface.
While the carbonium ion mechanism considered above appears to(5)be the most accepted, other mechanisms have been proposed. Barron
and co-workers have postulated a mechanism for ring isomerization on
platinum films which involves a polyadsorbed intermediate. A group of
Russian s c i e n t i s t s o b t a i n e d data with "tagged" methylcyclopentene
which indicate that this compound is not a reaction intermediate.
Rather they propose a scheme where methylcyclopentane is converted
directly to cyclohexane.
2. Ring Opening Reactions
Even though the kinetics of methylcyclopentane reforming have
been extensively investigated, comparatively little attention has been
given to the ring opening reactions until rather recently. This is(19)despite the fact that early data presented by Heinemann and
(9)Clapetta show that a very significant amount of methylcyclopentane is
converted to Cg paraffins at reforming conditions. In a later publica- (18)tion by Haensel data obtained with a Pt-Al203-halogen catalyst at
970°F, 300 psig and with a benzene-methylcyclopentane feed are presented
Reproduced with permission of the copyright owner. Further reproduction prohibited without permission.

2 3
which indicate that paraffins are primary reaction products accounting
for 30-40 percent of the naphthene disappearance.(55)Experimental results reported by Weisz with a Pt-Si02-
AI2O 3 catalyst and by H a e n s e l w i t h a Pt-Al203 catalyst indicate that
the presence of sulfur in the reactant greatly reduces decyclization
reaction products. Since sulfur preferentially poisons hydrogenation
sites, one must conclude that the metal catalytic sites play a signifi
cant role in opening the naphthene ring. This reaction is more
appropriately called hydrogenolysis, a name used to designate cracking
on hydrogenation sites.
At least two theories have been proposed for hydrogenolysis
of methylcyclopentane. Malre and a s s o c i a t e s e x a m i n e d this reaction
at low temperatures with a 0.2 percent Pt-Al203 catalyst. They observed
random cracking of the different ring bonds as indicated by a statistical
distribution of n-hexane, 2-methylpentane, and 3-methylpentane products
(40/40/20). This distribution is explained in terms of a mechanism
involving a triadsorbed reaction intermediate.
H
H —
U H H /\\ / \ /VI
This species which is ir-bonded to platinum sites would afford any bond
in the ring an equal chance of being broken. This same mechanism is also
used by Barron and M a i r e ^ to successfully explain their observations
that isomerization of either n-hexane, 2-methylpentane, or 3-methyl-
Reproduced with permission of the copyright owner. Further reproduction prohibited without permission.
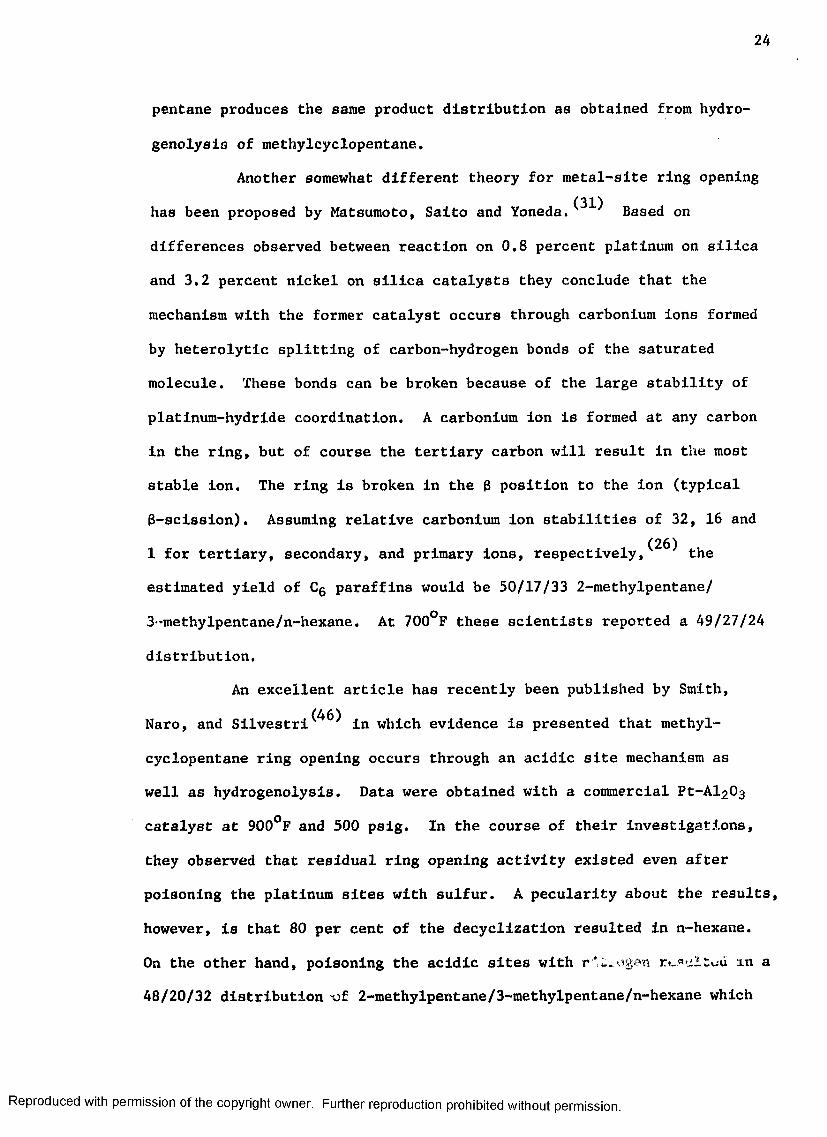
2 4
pentane produces the same product distribution as obtained from hydro
genolysis of methylcyclopentane.
Another somewhat different theory for metal-site ring opening(31)has been proposed by Matsumoto, Salto and Yoneda. Based on
differences observed between reaction on 0.8 percent platinum on silica
and 3.2 percent nickel on silica catalysts they conclude that the
mechanism with the former catalyst occurs through carbonium ions formed
by heterolytic splitting of carbon-hydrogen bonds of the saturated
molecule. These bonds can be broken because of the large stability of
platinum-hydride coordination. A carbonium ion is formed at any carbon
in the ring, but of course the tertiary carbon will result in the most
stable ion. The ring is broken in the 8 position to the ion (typical
3-scission). Assuming relative carbonium ion stabilities of 32, 16 and/o/:\
1 for tertiary, secondary, and primary ions, respectively, the
estimated yield of Cg paraffins would be 50/17/33 2-methylpentane/
3-methylpentane/n-hexane. At 700°F these scientists reported a 49/27/24
distribution.
An excellent article has recently been published by Smith,
Naro, and Silvestri^*^ in which evidence is presented that methyl
cyclopentane ring opening occurs through an acidic site mechanism as
well as hydrogenolysis. Data were obtained with a commercial Pt-A^Og
catalyst at 900°F and 500 pslg. In the course of their investigations,
they observed that residual ring opening activity existed even after
poisoning the platinum sites with sulfur. A pecularity about the results,
however, is that 80 per cent of the decycllzation resulted in n-hexane.
On the other hand, poisoning the acidic sites with r'ixogen r^ultviu xn a
48/20/32 distribution -of 2-methylpentane/3-methylpentane/n-hexane which
Reproduced with permission of the copyright owner. Further reproduction prohibited without permission.

is the distribution from reaction on the non-*poisoned platinum sites.
The decyclization on acidic sites is explained by these researchers in
terms of a carbonium ion mechanism. Furthermore, they explain their
observed effect of hydrogen pressure upon the acidic site reactions
(decyclization and ring isomerization) with the following reaction
scheme:
Paraffins, mainly n-hexane, are formed from both methylcyclopentane and
the olefin in equilibrium with it on the acidic sites.
3. Composite Reaction Scheme
Putting the information discussed in the two previous sections
together results in the reforming reaction scheme for methylcyclopentane
shown in the top of Figure 1. Horizontal reaction paths proceed on
platinum hydrogenation-dehydrogenation sites while vertical reaction
paths occur on alumina acidic sites. Decyclization is shown to occur on
both types of sites. Isomerization of Cg paraffins also takes place as
shown by the diagonal arrows which represent acidic and/or platinum site
reactions.
If one makes the following assumptions this scheme can be some
what simplified as shown in the bottom of Figure 1.
• Methylcyclopentane-methylcyclopentene reaction is at
equilibrium.
Cg ring products
Paraffins
with permission of the copyright owner. Further reproduction prohibited without permission.
2 6
• Isohexane formed by the acidic route can be neglected.
• N-hexane formed by hydrogenolysis can be neglected in
comparison to that formed by the acidic route.
• Cyclohexene concentration can be neglected.
This simpler reaction scheme will form the basis of the kinetic model
developed in Chapter IV.
Reproduced with permission of the copyright owner. Further reproduction prohibited without permission.

27
Figure 1. Reaction Scheme for the Catalytic Reforming of Methylcyclopentane.
CO0)■u•HC/3U
•r*CT3•HO<!
O tl
N*C,I-C
N-Cfc+
I-C.
Hydrogenation-Oehydrogenation Sites
I*C
Simplified Scheme
62. i t .
CH
Reproduced with permission of the copyright owner. Further reproduction prohibited without permission.
LIST OF REFERENCES - CHAPTER II
1. Allan, D. E., "The Dehydrogenation and Isomerization of CyclohexaneOver a Platinum Alumina Mordenite Catalyst," Ph.D. Dissertation, Department of Chemical Engineering, Louisiana State University, 1970.
2. Andreev, A. A., Shopov, D. M . , and Kiperman, S. L., "Kinetics ofCyclohexane Dehydrogenation in a Gradientless System," Kinet.Katal. (U.S.S.R.) 7_» 1092 (1966); Chemical Abstracts. 66, 85291 (1967).
3. Balandin, A. A. and Kostin, F. L. , "Kinetic Study on the Dehydrogenation of Cyclohexane," Acta Physlcochim. (U.S.S.R.), 17, 211 (1942); Chemical Abstracts. 37. 4615 (1943).
4. Balandin, A. A., Karpeiskaya, E. I. and Tolstopyatova, A. A.,"Catalytic Dehydrogenation of Hydrocarbons and Alcohols over Metallic Rhenium," Doklady Akad. Nauk (U.S.S.R.) 122. 227 (1958); Chemical Abstracts. 53, 837 (1959).
5. Barron, Y., Malre, G . , Muller, J. M. and Gault, F. G . , "TheMechanisms of Hydrogenolysis and Isomerization of Hydrocarbons on Metals," Journal of Catalysis. 5_, 428 (1966).
6 . Beuther, H. and Larson, 0. A., "Role of Catalytic Metals in Hydro-cracking," Industrial and Engineering Chemistry Process Design andDevelopment. h_ (No. 2), 177 (1965).
7. Bridges, J. M. and Houghton, G . , "The Evaluation of ActivationEnergies Using a Rising Temperature Flow Reactor. The Dehydrogenation of Cyclohexane over WS2 , Pt/Al2C>3, Cr203/Al2C>3, NiWOi*/ AI2O 3, and Cr2C>3," Journal of the American Chemical Society. 81, 1334 (1959).
8 . Briggs, R. A. and Taylor, H. S., "The Dehydrogenation of NormalHeptane and Cyclohexane on Cerium, Vanadium, and Thorium Oxide Catalysts," Journal of the American Chemical Society. 63. 2500 (1941).
9. Clapetta, F. G. and Hunter, J. B., "Isomerization of SaturatedHydrocarbons in the Presence of Hydrogenation - Cracking CatalystsIndustrial and Engineering Chemistry. 45 (No. 1), 147 (1953).
10. Clapetta, F. G . , Dobres, R. M. and Baker, R. W. , "Catalytic Reforming of Pure Hydrocarbons and Petroleum Naphthas." Catalysis, _6 , 495, Reinhold Publishing Corp., New York, New York, 1958.
28
Reproduced with permission of the copyright owner. Further reproduction prohibited without permission.
29
11. Clapetta, F. G. , "Special Report - Catalytic Reforming," Petro/Chem Engineer. 33 (No. 5), C-19 (1961).
12. Clapetta, F. G. and Wallace, D. N . , "Catalytic Naphtha Reforming,"Catalysis Reviews. £ (1), 67, Marcel Dekker, Inc. New York,New York, 1971.
13. Clark, A., "Oxides of the Transition Metals as Catalysts,"Industrial and Engineering Chemistry. 45 (No. 7), 1476 (1953).
14. Cusumano, J. A., Dembinskl, G. W . , and Sinfelt, J. H., "Chemisorp-tlon and Catalytic Properties of Supported Platinum," Journal of Catalysis. 5_, 471 (1966).
15. Greensfelder, B. S., Archibald, R. C . , and Fuller, D. L . , "CatalyticReforming - Fundamental Hydrocarbon Reactions of Petroleum Naphthas with Molybdena-Alumina and Chromina-Alumina Catalysts," Chemical Engineering Progress. 43 (No. 10), 561 (1947).
16. Grosse, A. V., Morrell, J. C . , and Mattox, W. J., "CatalyticCyclization of Aliphatic Hydrocarbons to Aromatics," Industrial and Engineering Chemistry. 32 (No. 4), 528 (1940).
17. Haensel, V, and Donaldson, G. R . , "Platforming of Pure Hydrocarbons,"Industrial and Engineering Chemistry. 43 (No. 9), 2102 (1951).
18. Haensel, V., Donaldson, G. R . , and Riedl, F. J., "Mechanisms ofCyclohexane Conversion Over Platinum-Alumina Catalysts,"Proceedings of the Third International Congress of Catalysis,294 (1964).
19. Heinemann, H., Mills, G. A., Hattman, J. B., and Kirsch, F. W . ,"Houdrlforming Reactions - Studies with Pure Hydrocarbons," Industrial and Engineering Chemistry, 45 (No. 1), 130 (1953).
20. Herbo, C., "Research on the Mechanism of Catalytic Reactions. IIKinetic Studies on the Dehydrogenation of Cyclohexane,"Bulletin of the Chemical Society Belgium. 51, 44 (1942);Chemical Abstracts. 3 7 . 5307 (1943).
21. Hindin, S. G., Weller, S. W . , and Mills, G. A., "Mechanically MixedDual-Function Catalysis," Journal of Physical Chemistry, 62, 244 (1958).
22. Innes, W. B., "Classification of Heterogeneous Catalytic VaporPhase Reactions," Catalysis. 2_, 1, Reinhold Publishing Corp.,New York, New York, 1955.
23. Isagluyants, G. V., Ryashentseva, M. A,, Derbentsev, Yu. I.,Minachev, Kh. M . , and Balandin, A. A., "The Role of Cyclohexene in Cyclohexane Dehydrogenation and Isomerization Under Reforming Conditions," Neftekhlmiya (U.S.S.R.), 4_ (No. 2), 229 (1964); Chemical Abstracts. 6 1 , 8103 (1964).
Reproduced with permission of the copyright owner. Further reproduction prohibited without permission.
30
24. Isagulyants, G. V., Ryashentseva, M. A., Derbentsev, Yu. I.,Minachev, Kh. M . , and Balandin, A. A., Neftekhlmlya, _5 (4),501 (1965). (English Translation by Associated Technical Service, Inc., Glenn Ridge, N. J.)
25. Jacobson, R. L . , Kluksdahl, H. E., McCoy, C. S., Davis, R. W. ,"Platinum - Rhenium Catalysts: A Major New Catalytic ReformingDevelopment," presented at the 34th Midyear Meeting of the American Petroleum Institute," Division of Refining, Chicago, Illinois, May 13, 1969.
26. Keulemans, A. I. and Voge, II. H. , "Reactivities of Naphthenes overa Platinum Reforming Catalyst by a Gas Chromatographic Technique," Journal of Physical Chemistry, 63, 476 (1959).
27. Lazier, W. A. and Vaughen, J. V. , "Non-Metalllc Catalysts forHydrogenation and Dehydrogenation. II. The Catalytic Properties of Chromium Oxide," Journal of the American Chemical Society,54, 3080 (1932).
2B. Maat, H. J. and Moscou, L., "A Study of the Influence of Platinum Crystallite Size on the Selectivity of Platinum Reforming Catalysts," Proceedings of the Third International Congress of Catalysis, Section II. 5, 1277 (1964).
29. Malr, B. J., "Hydrocarbons Isolated from Petroleum" Oil and GasJournal, 62, (37).130 (1964).
" 1 1" ~ f
30. Maire, G . , Plouidy, G., Prudhomme, J. C., Gault, F. G., "TheMechanisms of Hydrogenolysis and Isomerization of Hydrocarbons on Metals," Journal of Catalysis, 4, 556 (1965).
31. Matsumoto, H., Saito, Yoneda, "Contrast Between Nickel and PlatinumCatalysts in Hydrogenolysis of Saturated Hydrocarbons," Journal of Catalysis, 19, 101 (1970),
32. Meisel, S. L., Koft, E., Jr., and Clapetta, F. G., "Effect ofNitrogen Compounds on Platinum Acidic Oxide Catalysts," American Chemical Society Preprints, Division of Petroleum Chemistry, _2 (No. 4), A-45 (1957).
33. Mills, G. A., Heinemann, H., Milliken, T. H. , and Oblad, A. G.,"Houdriforming Reactions - Catalytic Mechanism," Industrial Engineering Chemistry, 45 (No. 1), 134 (1953).
34. Mills, G. A., Weller, S., and Cornelius, E. B., "The State ofPlatinum in a Reforming Catalyst," Proceedings of the SecondInternational Congress of Catalysis, Section II, No. 113, 1 (1960).
35. Minachev, Kh. M . , Shuikin, N. I., and Rozhdestrenskaya, I. D. ,"Hydro- and Dehydrogenation of Hydrocarbons in the Presence ofRuthenium and Rhodium Catalysts with a Low Content of the Metal,"
Reproduced with permission of the copyright owner. Further reproduction prohibited without permission.

3 1
Izvest. Akad. Nauk (U.S.S.R.), 338 (1954); Chemical Abstracts.48, 10259 (1954).
36. Myers, C. G., Munns, G. W., Jr., "Platinum Hydrocracking of Pentane,Hexanes, and Heptanes," Industrial and Engineering Chemistry, 50 (12), 1727 (1958).
37. Nehring, D. and Dreyer, H . , "Influence of Various Catalyst Supportson the Catalytic Properties of Pt," Chemical Technology. (Berlin) 12, 343 (1960); Chemical Abstracts. 55, 3159 (1961).
38. Oblad, A. G., Shalit, H . , and Tadd, H. T., "Catalytic Technology inthe Petroleum Industry," Proceedings of the First International Congress of Catalysis, 510 (1956).
39. Pines, H. and Haag, W. 0., "Alumina: Catalyst and Support. I.Alumina, Its Intrinsic Acidity and Catalytic Activity," Journal of the American Chemical Society. 82, 2471 (1960).
40. Plate, A. F., "Mechanism of Catalytic Transformations of Hydrocarbons on a Vanadium Catalyst. V. Simultaneous Hydrogenation and Dehydrogenation of Cyclic Olefins," Journal of General Chemistry (U.S.S.R.), 15, 156 (1945); Chemical Abstracts. 40, 3409 (1946).
41. Schwarzenbek, E. F., "Catalytic Reforming," presented at JointConference of the Chemical Institute of Canada and The American Chemical Society, Toronto, Canada, May 24, 1970.
42. Sinfelt, J. H., Hurwitz, H. and Rohrer, J. C., "Kinetic of n-PentaneIsomerization Over Pt-Al203 Catalysts, Journal of Physical Chemistry. 64, 892 (1960).
43. Sinfelt, J.H., Hurwitz, H., Rohrer, J. C., "Role of DehydrogenationActivity in Catalytic Isomerization and Dehydrocyclization of Hydrocarbons," Journal of Catalysis, 1 (No. 5), 481 (1962).
44. Sinfelt, J. H., "Bifunctional Catalysis," Advances in ChemicalEngineering, 5 , 37, Academic Press, New York, New York, 1964.
45. Smith, R. L. and Prater, C. D . , "Some Capabilities and Limitationsof Kinetic Studies in Heterogeneous Catalysis as Illustrated by Cyclohexane-Cyclohexene'-Benzene Inter-conversion Over a Supported Platinum Catalyst," Chemical Engineering Progress Symposium Series, 63 (No. 73), 105 (1967).
46. Smith, R. L . , Naro, P. A., and Silvestri, A. J., "Reaction Paths forDecyclization of Methylcyclopentane Over Pt/Al203 Catalyst," Journal of Catalysis. 20, 359 (1971).
47. Spenadel, L. and Boudart, M . , "Dispersion of Platinum on SupportedCatalysts," American Chemical Society Preprints, Division ofPetroleum Chemistry, k_ (No. 2-C), C-5 (1959).
Reproduced with permission of the copyright owner. Further reproduction prohibited without permission.

3 2
48. Stumpf, H. C., Russell, A. S . , Newsome, J. W . , and Tucker, C. M . ,"Thermal Transformations of Aluminas and Alumina Hydrates," Industrial and Engineering Chemistry, 42 (No. 7), 1398 (1950).
49. Tanaka, N. and Ogasawara, S. "n-Butene Isomerization on HC1-Treated Alumina," Journal of Catalysis. 16, 164 (1970).
50. Thomas, C. L . , "Chemistry of Cracking Catalysts," Industrial andEngineering Chemistry, 41 (No. 11) 1949.
51. Tutumi, S., "Differences Among the Catalytic Actions of Cobalt,Palladium, and Platinum," Science Papers Institute Physics Chemical Research (Tokyo), 36, 352 (1939); Chemical Abstracts.33, 9104 (1939).
52. Varga, J., Rabo, G., and Zalal, A., "Comparative Study of thePromoters for Dehydrogenation Catalysts," Acta Chim. Hung., 1 ,137 (1951); Chemical Abstracts. 45, 10022 (1951).
53. Weisz, P. B. and Prater, C. D., "Basic Activity Properties forPt-Type Reforming Catalysts," Proceedings of the First International Congress of Catalysis. 575 (1956).
54. Weisz, P. B. and Swegler, E. W . , "Stepwise Reactions on SeparateCatalytic Centers: Isomerization of Saturated Hydrocarbons,"Science. 126, 31 (1957).
55. Wei, J. and Prater, C. D., "Analyses of Complex Reaction Systems,"Advances in Catalysis, 13. 203, Academic Press, Inc., New York New York, 1962.
56. Western Petroleum Refiners Association Meeting, El Dorado, Arkansas,Oil and Gas Journal, 57 (No. 9), 120 (1959).
57. Zelinskii, N. D. and Balandin, A. A., "Kinetics of DehydrogenationCatalysis," Bulletin of the Academy of Science (U.S.S.R.), 29 (1929); Chemical Abstracts. 24. 774 (1930).
Patents
58. U. s. Patent 3, 415, 737
59. u. s. Patent 3, 434, 960
60. u. s. Patent 3, 438, 888
61. u. s. Patent 3, 535, 402
62. u. s. Patent 3, 578, 582
Reproduced with permission of the copyright owner. Further reproduction prohibited without permission.

CHAPTER III
EXPERIMENTAL EQUIPMENT AND PROCEDURE
A. General
The experimental work for this research project was conducted in
the Petroleum Processing Laboratory, which is a part of the Chemical
Engineering Department. This facility is sponsored by Esso Research
and Engineering Company through the Division of Engineering Research at
Louisiana State University, and is under the direction of Professor
Alexis Voorhies, Jr. A full-time staff uses the facility to conduct
proprietary catalyst research for Esso Research and Engineering Company.
The laboratory contains two similar bench scale pilot units which
were designed for the purpose of testing petroleum processing catalysts
in a flxed-bed operation. The units were originally constructed at
Esso Research Laboratories in Baton Rouge, Louisiana under the super
vision of Dr. P. A. Bryant, who was one of the pioneer researchers of the
project. Numerous modifications have been made under the direction of
subsequent project members. Esso Research Laboratories has furnished
the laboratory with all the necessary equipment and instruments needed
to support the research effort.
B. Experimental Equipment
Most of the experimental equipment for a single unit is mounted on
a steel frame about six feet high which rests on a pallet about three
33
Reproduced with permission of the copyright owner. Further reproduction prohibited without permission.
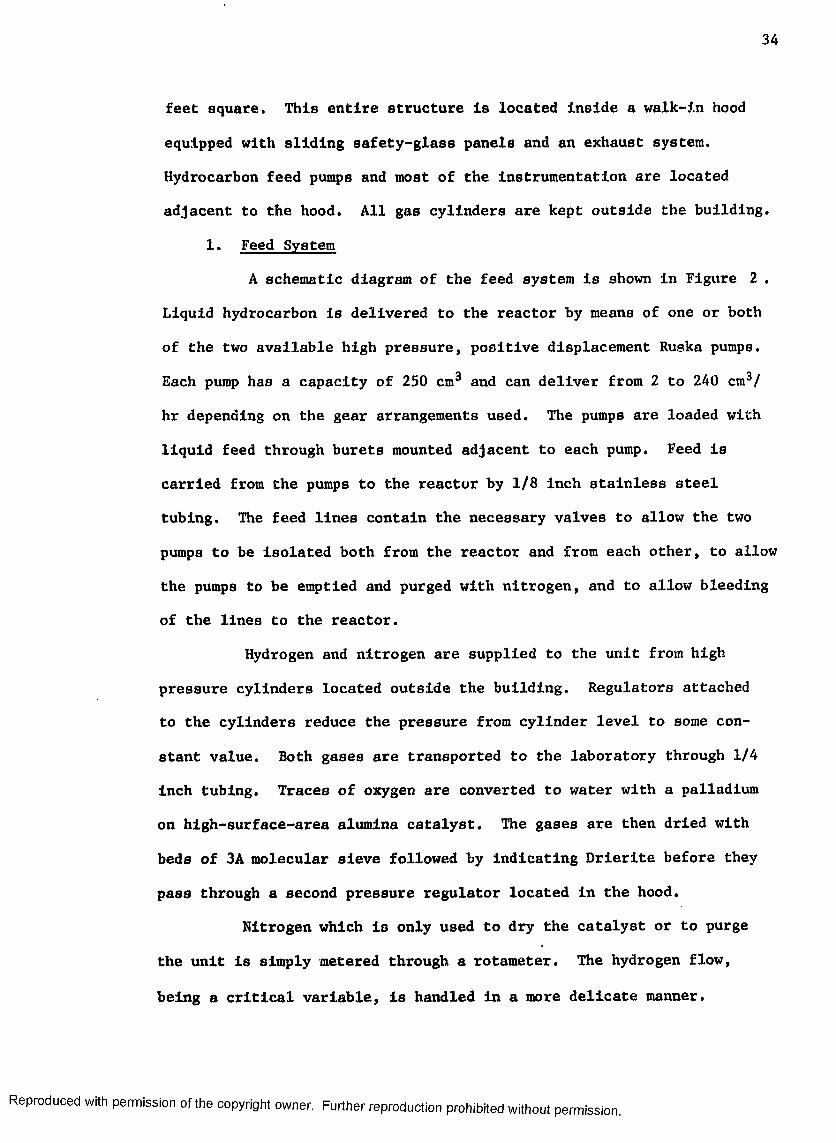
3 4
feet square. This entire structure is located inside a walk-in hood
equipped with sliding safety-glass panels and an exhaust system.
Hydrocarbon feed pumps and most of the instrumentation are located
adjacent to the hood. All gas cylinders are kept outside the building.
1. Feed System
A schematic diagram of the feed system is shown in Figure 2 .
Liquid hydrocarbon is delivered to the reactor by means of one or both
of the two available high pressure, positive displacement Ruska pumps.
Each pump has a capacity of 250 cm3 and can deliver from 2 to 240 cm3/
hr depending on the gear arrangements used. The pumps are loaded with
liquid feed through burets mounted adjacent to each pump. Feed is
carried from the pumps to the reactor by 1/8 inch stainless steel
tubing. The feed lines contain the necessary valves to allow the two
pumps to be isolated both from the reactor and from each other, to allow
the pumps to be emptied and purged with nitrogen, and to allow bleeding
of the lines to the reactor.
Hydrogen and nitrogen are supplied to the unit from high
pressure cylinders located outside the building. Regulators attached
to the cylinders reduce the pressure from cylinder level to some con
stant value. Both gases are transported to the laboratory through 1/4
inch tubing. Traces of oxygen are converted to water with a palladium
on high-surface-area alumina catalyst. The gases are then dried with
beds of 3A molecular sieve followed by Indicating Drierlte before they
pass through a second pressure regulator located in the hood.
Nitrogen which is only used to dry the catalyst or to purge
the unit is simply metered through a rotameter. The hydrogen flow,
being a critical variable, is handled in a more delicate manner.
Reproduced with permission of the copyright owner. Further reproduction prohibited without permission.

Reactor Section Product Recovery SectionFeed SectionLiquidBuret
GASRuskaPump
ControlValve Safety
ValveFlowContr
TemperatureController Wet
TestMeter
DPCell Gas
DensityAnalyzerI Back Pressure
Gauge | Regulator — ^Drier Back-upNeedleValve
GaugeGAS _
SAMPLERegulator
CondenserRotameterReactor Strip
HeatersFluidized Sand Bath Saturator
De-oxoUnits
LIQUID
Regulators
CylindersFigure 2 : Schematic Flow Diagram
Hydrogen Nitrogen
3 6
After passing through a back-up sieve drier, it flows through a Foxboro
integral-orifice differential pressure (DP) cell, a 1/4 inch micrometer
needle valve, and a Grove back-pressure regulator. The DP cell
provides an air signal to the flow recorder, the needle valve is used
to adjust the flow rate and the pressure regulator maintains a con
stant back pressure regardless of the reactor pressure.
A feedback flow control system employing a Foxboro flow
controller and a 1/4 inch Research Control Valve is also available, but
the author found that the manual control valve gives the best overall
performance over the wide range of flow rates needed. Control was more
than adequate due to the good pressure regulation available.
After passing through the back pressure regulator, the
hydrogen stream joins the liquid feed stream in a tee just before
entering the reactor.
2. Product Recovery and Sampling
The combined gas and liquid stream passes through a preheat
coil and then into the reactor. Both the preheat section and reactor
are immersed in a fluidlzed bed of sillca-alumina particles ("sand
bath") which provides nearly isothermal conditions in the reactor. A
detailed description of the reactor is given in a following section.
The product gases leave the reactor as depleted in Figure 2
and flow through a Groves back-pressure regulator which is used to
control reactor pressure. Pressure gauges located at the reactor inlet
and outlet provide the needed pressure information. The product is
partially condensed in a small vessel (2500 cm3 capacity) which is
cooled in an ice bath and maintained at 9 psig with another back
pressure regulator. Liquid product collected in the accumulator vessel
Reproduced with permission of the copyright owner. Further reproduction prohibited without permission.
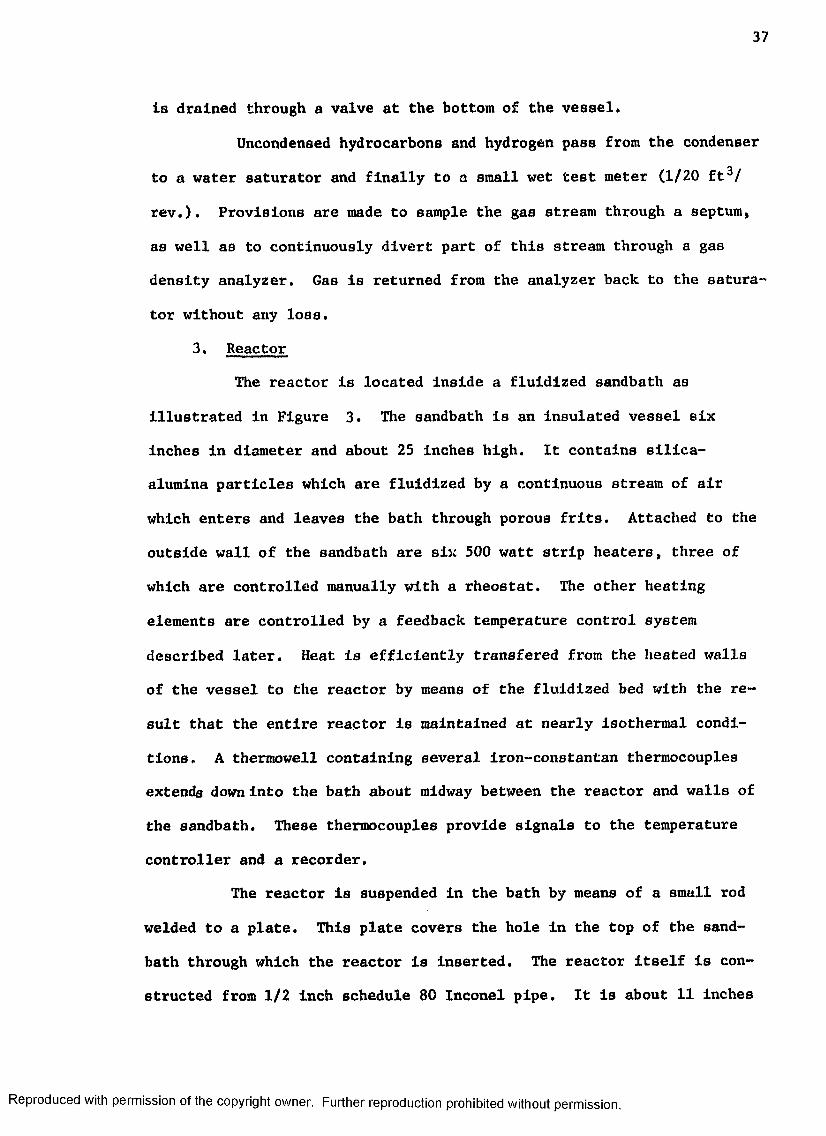
3 7
is drained through a valve at the bottom of the vessel.
Uncondensed hydrocarbons and hydrogen pass from the condenser
to a water saturator and finally to a small wet test meter (1/20 ft3/
rev.). Provisions are made to sample the gas stream through a septum,
as well as to continuously divert part of this stream through a gas
density analyzer. Gas is returned from the analyzer back to the satura
tor without any loss.
3. Reactor
The reactor is located inside a fluldized sandbath as
illustrated in Figure 3. The sandbath is an insulated vessel six
inches in diameter and about 25 inches high. It contains silica-
alumina particles which are fluldized by a continuous stream of air
which enters and leaves the bath through porous frits. Attached to the
outside wall of the sandbath are six 500 watt strip heaters, three of
which are controlled manually with a rheostat. The other heating
elements are controlled by a feedback temperature control system
described later. Heat is efficiently transfered from the heated walls
of the vessel to the reactor by means of the fluldized bed with the re
sult that the entire reactor is maintained at nearly isothermal condi
tions. A thermowell containing several iron-constantan thermocouples
extends down into the bath about midway between the reactor and walls of
the sandbath. These thermocouples provide signals to the temperature
controller and a recorder.
The reactor is suspended in the bath by means of a small rod
welded to a plate. This plate covers the hole in the top of the sand-
bath through which the reactor is Inserted. The reactor itself is con
structed from 1/2 inch schedule 80 Inconel pipe. It is about 11 inches
Reproduced with permission of the copyright owner. Further reproduction prohibited without permission.

3 8
Side ThermocoupleBath
Thermocouple Product L l noFeed Line
PorousFrit
Fluidizing Air
Thermocouple Well Cor Bath Temperature
Control Sand Bath
Axial Thermocouple
Catalyst
actor
Glass Wool
Temperature Compensated Coupling
Porous Frit///////7/77/?7/////7?>////j:iiniInle
Fluidit for zing Air
Air Distributor
Figure 3. Cross Sectional View of Reactor in Fluldized Heating Bath.
Reproduced with permission of the copyright owner. Further reproduction prohibited without permission.
3 9
long, but the space for catalyst Is only 7 Inches in length or about 30
cm3. The top of the reactor is permanently sealed while the bottom is
sealed with a special temperature compensating coupling manufactured by
the D.S.D. Company of East Granby, Connecticut. A pressure tight seal
is formed with a hollow steel—ring which seats in a V-groove on the face
of both flanges. The two flanges are held together with a special
clamp.
Feed enters the top of the reactor from the preheat coil,
passes through a micrometallic porous frit, over the catalyst bed which
is supported with a small piece of glass wool, and out the bottom of the
reactor through another metallic frit welded in the special coupling.
Product is carried from the reactor out through the sandbath by means of
1/8 inch tubing.
The reactor contains two 1/16 inch sheathed IC thermocouples.
One enters the side of the reactor through a 1/4 inch Conax fitting that
is located in the middle of the catalyst space with respect to length.
The other thermocouple is housed in a thermowell that enters the top of
the reactor and passes down the centerline to the bottom of the catalyst
bed. This thermowell has a 1/8 inch O.D. and is just large enough so
that the 1/16 inch thermocouple fits snugly in it. This latter thermo
couple allows one to measure axial temperature profiles which even in
this reactor can be quite significant for highly endothermic or exo
thermic reactions.
4. Instrumentation
This pilot unit contains instrumentation which allows it to be
operated with "minimum attention" if desired.
Sandbath temperature is controlled with a Leeds and Northrup
Reproduced with permission of the copyright owner. Further reproduction prohibited without permission.
4 0
Electromax C.A.T. (current-adjusting-type) solid state controller that
Is equipped with both proportional and reset modes of control. An
emf signal generated by a sandbath thermocouple Is feed to the con
troller which transmits a control current signal to a 220 V phaser
power controller (R.I. Controls). The phaser supplies a variable RMS
voltage to three of the strip heaters. This system Is able to control
temperatures from 100° to 1000°F to within 1-2°F. Normally adjustment
of the rheostat controlling the other three heaters is not necessary.
Reactor temperatures are Indicated on a Leeds and Northrup
Speedomax H Temperature Indicator that is accurate to within 1°F.
Sandbath temperature is recorded on a Foxboro recorder (Model 58P4) by
first converting the emf thermocouple signal to a pressure signal.
The hydrogen flow rate to the reactor Is measured with an
Integral-orifice DP cell and recorded on a Foxboro strip chart recorder.
The unit is equipped with an alarm system which shuts off
flows and heat to the sandbath, should one of the following situations
arise:
» low sandbath air pressure
• low instrument air pressure
• high sandbath temperature
• power failure
C. Analytical Equipment
Density of the product gas stream is measured by diverting part of
the flow through a Beckman Model F3 Oxygen Analyzer that has been con
verted to a gas density analyzer. This instrument is capable of
measuring the molecular weights of gases ranging from hydrogen to air.
It is calibrated each day with both hydrogen and nitrogen. Normally,
Reproduced with permission of the copyright owner. Further reproduction prohibited without permission.

4.1
the product gas has a molecular weight from 4.5 to 5.
Gas and liquid samples are analyzed on a F&M Scientific Corpora
tion gas chromatograph model No. 810. This Instrument has a thermal
conductivity cell detector that has given practically trouble-free
operation. The oven which contains the columns can be operated either
isothermally or in a programmed temperature mode.
Three different columns are needed to completely analyze the
reaction products. A five-foot, .1/4 inch column containing 5A molecular
sieve is used to trap and separate methane and ethane in the gas samples.
The other compounds in the gas and all those in the liquid are analyzed
on a ten-foot, 1/4 inch column containing 20 per cent UCON 50HB - 280X
on 60/80 mesh chromosorb W support. This column separates the following
compounds which appear in the reaction product:
propane normal hexane
isobutane metliylcyclopentane
normal butane cyclohexane
i so pont ane methylcyclopentene
normal pentane cyclohexene
2,2-dlmethylbutane benzene
2-methylpentane toluene
3-methylpentane xylenes.
The only linear olefin present in significant amounts, hexene-2, comes
out with methylcyclopentane in the above column. All liquid samples were,
therefore, re-analyzed using a column which separates hexene-2 but not all
of the other compounds (10% silicon rubber on 80/100 mesh chromosorb).
The separate analyses are blended together to obtain the final liquid
product composition.
Reproduced with permission of the copyright owner. Further reproduction prohibited without permission.

42
Since the chromatograph does not analyze for hydrogen, the yield
of this compound Is calculated from the gas molecular weight and the
hydrocarbon composition as illustrated in the appendix.
D. Materials
Hydrogen used in this study was electrolytic grade (99.95%) and the
nitrogen was prepurified to 99.99%. These gases were deoxygenated and
dried before use as discussed previously. Methylcyclopentane feed was
Phillips pure grade (99 mole %). It was dried by storing over 3A sieve.
Analyses revealed that feed stored over the sieve contained 10 ppm
water, 0.5 ppm nitrogen and less than 1 ppm sulfur.
All the catalysts tested in this research were equilibrated with a
wide-cut virgin naphtha designated FS 2880. Properties of this feed are
tabulated in Appendix E .
Two reforming catalysts were examined in this study. One was a
standard platinum-alumina catalyst similar to those that have been used
commercially for a number of years. The other was a platinum-rhenium-
alumlna catalyst that is representative of the new generation of reform
ing catalysts that are more resistant to deactivation. Both of these
catalysts were obtained from commercial batches manufactured by
American Cyanamid Company. Some pertinent properties of these catalysts
are tabulated below.
Catalyst
Pt Pt-Re
Platinum, wt.% 0.30 0.33
Rhenium, wt.% — 0.32
Chloride, wt.% 0.55 0.65
Pore Volume, cc/gm 0.52 0.512Surface Area, m /gm 183 218
Reproduced with permission of the copyright owner. Further reproduction prohibited without permission.

43
E. Experimental Procedure
Before any meaningful process studies can be undertaken, the
catalysts have to be treated as discussed below.
1. Catalyst Activation
Both catalysts investigated in this study are originally In the
form of 1/16 inch extrudate. These pellets are crushed and screened to a
smaller size before activation; 40/65 mesh is the standard particle size
used in all but the mass transfer studies.
The first step in the activation procedure is to thoroughly dry
the catalyst. This step is accomplished by placing a 25-50 cm3 batch in
a vertical glass tube about 1/2 inch in diameter. This tube is heated by
means of a resistance wire heating element coiled around the tube. In
sulation is provided by an outer concentric glass tube covered by 1 inch
of asbestos. With a flow of nitrogen through the tube, the temperature
is gradually raised to 1000°F and maintained there for at least 3 hours.
After lowering the bed temperature to 900°F, hydrogen is substituted for
nitrogen and the catalyst is held at these conditions for 1 hour. This
is sufficient time for the metals on the catalyst to be reduced from the
oxide to the metallic state. Finally, the catalyst is cooled to about
250°F, removed from the glass tube under a nitrogen purge, and trans
ferred to a previously dried glass bottle. The catalyst is sealed in the
bottle under a nitrogen atmosphere until it is needed.
2. Catalyst Lineout
The nature of the reactions taking place on many catalysts
often undergo very significant and rapid change during the early life of
the catalyst. This behavior is probably caused by modification of some
Reproduced with permission of the copyright owner. Further reproduction prohibited without permission.
44
of the moat active catalytic sitea and usually takes the form of de
creasing activity as well as changing product distribution. This be
havior may last from a few minutes to many hours depending on the nature
of the catalyst, feed, and reactor conditions. Data collected during
this period might give valuable information about the catalyst. It
should be obvious, however, that a systematic study of the effect of
temperature, pressure, reaction time, or some other process variable
would be impracticable because of the changing nature of the catalyst
itself. Of course, most catalysts will continue to change during their
entire life, but process variable data should only be obtained when the
rate of change becomes small with respect to the length of time required
for the study.
The "lineout" problem discussed above is particularly acute
with the two catalysts examined in this study. The nature of the re
actions of methylcyclopentane undergo significant change for the first
50-100 hours in contact with the feed. (Data obtained during the line
out period are discussed in a later chapter). A study of the type en
visioned for this research effort requires that many separate charges of
catalyst be made to the reactor. Quite obviously, it would not be
practical to wait 50-100 hours after each charge before obtaining the
necessary data. Therefore, it was decided that several large batches of
each catalyst would be "lined-out." Each of these batches would provide
enough catalyst for several reactor charges. In fact, only three 25
cm3 batches of catalyst had to be prepared for this study. The first
of these contained Pt catalyst that had been crushed and sized to three
different particle size ranges: 14/20, 40/65, 100/200 mesh. This
particular batch provided all the catalyst needed for the mass transfer
Reproduced with permission of the copyright owner. Further reproduction prohibited without permission.

studies. The other two hatches, one of Pt and one of Pt-Re catalyst,
contained 25 cm3 of 40/65 mesh particles that provided the catalyst
needed for the rest of the studies.
In order to closely simulate catalyst in commercial operation,
the catalytic "edge" of these catalysts was removed by treatment with a
typical reforming feedstock and at typical commercial reforming condi
tions. The feed was a wide-cut virgin naphtha described in Appendix E .
Reactor conditions were 900°F E.I.T. (equivalent isothermal temperature),
100 psig, 3400 SCF/bbl feed, and 1.8-2.0 w/hr/w. The 100 psig pressure
was selected over more conventional higher pressures in order to
accelerate the "line out" period. Liquid C5+ product produced at these
conditions had approximately a 104 clear research octane number. Carbon
analyses revealed that these " lined out" catalysts contained 1.5-2.0
wt. per cent coke.
Periodically interspersed in the operation described above,
were tests with methylcyclopentane made at a standard set of conditions
in order to determine when the catalyst had reached a reasonably con
stant activity and product selectivity.
The procedure followed during the initial operation with the
naphtha feed is described below:
a. About 25 cm3 of catalyst which had been previously
calcined and reduced is weighed and transferred to the reactor.
b. The reactor is sealed, pressure tested in a water bath
with nitrogen at 200 psig, and then purged with a small nitrogen flow
for at least 1/2 hour while the unit is also being purged with nitrogen.
c. The reactor is placed in the sandbath, which at this time
is near 900°F. Tubing and thermocouple connections are made and a
with permission of the copyright owner. Further reproduction prohibited without permission
46
nitrogen flow at atmospheric pressure is started.
d. The sandbath is raised to 1000°F and maintained at this
level for 1 hour in order to drive off any moisture that may have been
inadvertently adsorbed during loading.
e. After lowering the temperature to 900°F, a hydrogen flow
is substituted for the nitrogen. After 1 additional hour, the reactor
is pressure tested at 300 psig.
f. The temperature, pressure, and hydrogen flow rate are set
at the proper level and conditions are allowed to stabilize while the
liquid feed system is being prepared and the product separator is being
cooled with wet ice.
g. Highly exothermic hydrocracking reactions generally pre
dominate when feed is first introduced over the fresh catalyst. Tempera
ture "hot spots" several hundred degrees higher than the sandbath
temperature can develop in the catalyst bed with the possible result of
permanent damage to the catalyst. This occurrence is prevented by
tripling the naphtha feed rate during the first 15-30 minutes of opera
tion while maintaining all other conditions constant, including the
hydrogen flow rate. At the high feed rate and low hydrogen partial
pressure, hydrocracking reactions are greatly reduced, thereby elimina
ting the "hot spots."
Deactivation of the extremely active catalytic sites is
accelerated with the result that at the end of the period with the high
feed rate normal operation can be resumed without any temperature con
trol problems. This particular start-up step is accomplished with the
use of 2 feed pumps, one having twice the feed rate of the other.
h. Continuous operation with the naphtha feed is maintained
Reproduced with permission of the copyright owner. Further reproduction prohibited without permission.

47
with frequent collection of gaa and liquid samples.
i. Catalyst activity during the line out period is monitored
by periodic tests with methylcyclopentane at a standard set of condi
tions: 800°F, 200 psig, 10 moles hydrogen/mole feed, 2.5 w/hr/w.
These tests are made by the following procedures:
• Naphtha feed is stopped, the sandbath temperature is
lowered to 800°F, reactor pressure is raised to 200 psig,
and the new hydrogen rate is set.
• Catalyst is stripped with hydrogen for several hours
while the temperature stabilizes and all traces of naphtha
feed and product are being purged from the unit. Density
of the gas stream serves as a good indication of complete
removal of past products.
• Operation is begun with methylcyclopentane. After about
2 hours, a material balance period is made in the manner
described later.
• Reactor conditions are then changed back to those for the
naphtha operation and the catalyst "lineout" continues
with additional activity checks as described above.
j , When methylcyclopentane conversion and the product
selectivities of the standard test approach a reasonably constant value,
the "lineout" operation is terminated by stripping the catalyst with
hydrogen until the gas density indicates that all volatile material on
the catalyst and in the product recovery system has been removed. This
step usually lasts several hours.
k. The reactor is then removed from the sandbath and cooled
under a small hydrogen flow. The Lined-out” catalyst is discharged from
Reproduced with permission of the copyright owner. Further reproduction prohibited without permission.

48
the reactor under a nitrogen purge into a dried glass bottle. The
catalyst is blanketed with nitrogen, the bottle is sealed with tape and
finally stored in a desiccator. 1
3. Procedure for Process Variable Study
The experimental procedure followed for studying the effect of
temperature, pressure, and contact time is similar to that described
above. In this part of the study, however, anywhere from 1 to 12
grams of previously "lined out" catalyst is charged to the reactor. The
amount of catalyst needed for each "run" is weighed and then diluted
with 65/100 mesh mullite so that the total bed volume is always 25 cm3.
Mullite of a smaller size is used so that the catalyst can later be
Isolated for analysis. Separation is accomplished with a 65 mesh screen;
the smaller mullite particles pass through while the catalyst particles
remain on top.
After the catalyst is charged to the reactor, steps b through
f described under "Catalyst Lineout" are carried out.
Once the reactor temperature and hydrogen flow have stabilized,
methylcyclopentane feed is started at the desired rate. Slight adjust
ments are made as necessary to reactor conditions so that at steady state,
the conditions are the same as those specified. Gas samples are taken
periodically to determine when the system has stabilized. (Gas composi
tion gives a good indication of the total product composition since 25-60
per cent of the hydrocarbons remain in the gas stream.) Generally, 2-4
hours is required for stabilization when the "lined out" catalyst is
first put back in the reactor. Subsequent experiments with the same
*"Run" is defined as the set of experiments made with a given charge of catalyst.
Reproduced with permission of the copyright owner. Further reproduction prohibited without permission
4 9
catalyst charge require only 1-1 1/2 hours for product stabilization.
Once the gas samples indicate steady state operation a
material balance period is made following the procedure below:
a. The product accumulator vessel is drained and depressured.
The balance period is then Initiated by closing the drain valve on this
vessel and recording the time.
b. After the pressure in the product accumulator has built
back up to operating level, 9 psig, measurement of the product gas rate
is begun by recording the time and the wet test meter (WTM) reading.
c. Pressure, gas density, sandbath, and WTM temperature are
recorded as well as the axial reactor temperature profile.
d. The gas stream is sampled and analyzed before the balance
period is terminated.
e. Towards the end of the balance period which is usually 1/2 to
1-1/2 hours long, the WTM reading and time are again recorded. From the
initial and this final reading the average gas rate is calculated.
f. Just before the end of the balance period, the liquid
product is drained into a cooled, sealed sample bottle equipped with a
very small diameter vent line that allows displaced air to escape from
the bottle. As the balance period ends, the product accumulator vessel
is completely drained and depressured.
g. The liquid product is weighed and analyzed on the gas
chromatograph. A portion of the liquid is stored in a sealed bottle in
case the analysis needs to be repeated.
After the balance period has ended conditions are changed for
the next experiment. If only pressure is changed, flows of liquid and
gas feeds are maintained while the pressure is adjusted, allowing yields
Reproduced with permission of the copyright owner. Further reproduction prohibited without permission.

50
to become stabilized in a short period. If either hydrocarbon or
hydrogen feed ratea need changing, liquid feed is stopped, the system
is purged with hydrogen, and new feed rates are established.
When all the experiments with a given catalyst charge have
been completes,, the catalyst is stripped with hydrogen for several hours.
The reactor is removed from the sandbath, cooled and the catalyst dis
charged.
4. Yield Calculations From Experimental Data
Experimental data collected during the material balance periods
are used to calculate the product yields from each experiment. Gas and
liquid feed rates as well as gas and liquid product rates and composi
tions are the input data to a computer program ("Slavex") which calcu
lates complete product yields as well as material balances on both
hydrogen and carbon. This program also punches all the yield data for
a single run as well as the reactor conditions on a set of 4 computer
cards. These cards then serve as the input to other computer programs
which calculate rate constants (RTCONST") and plot the data ("RVPLT").
Sample yield and material balance calculations are illustrated in
Appendix F .
Reproduced with permission of the copyright owner. Further reproduction prohibited without permission.

CHAPTER IV
MATHEMATICAL MODELING TECHNIQUE
A. Introduction
A desirable result from most investigations of chemical reactions
is a mathematical expression which relates product yields or reaction
rates to experimental reaction conditions such as temperature, pressure,
feed rate and composition. An expression of this type represents a
concise way of recording a vast amount of experimental data. It also
provides a means for Interpolating experimental results at a different
set of conditions, but within the range of the original data. Such an
expression might even be used to extrapolate results to conditions out
side the range of the experimental data, but this is only done, and then
with extreme precaution, when the mathematical expression is based on(4)fundamental reaction considerations.
Equations of the type described above are commonly called kinetic
models for they frequently are intended to serve as a mathematical
description of the reaction rate of some specific mechanism. Kinetic
models can either be developed from theoretical considerations or they
can be no more than empirical correlations of the experimental results.
Models based strictly on the reaction mechanism are obviously most
desirable, but they frequently are so complicated that they cannot be
conveniently handled mathematically. Also, theoretical models usually
contain a large number of constants which can only be evaluated with
51
Reproduced with permission of the copyright owner. Further reproduction prohibited without permission.
52
great difficulty. Empirical models, on the other hand, have no basis
for extrapolation to new reaction conditions and provide no confirmation
or denial of reaction mechanism. An intermediate approach that might
be taken to kinetic modeling is to base the model upon theoretical
considerations and then to make whatever simplifing assumptions are
needed to give an expression that can be handled mathematically and that
adequately describes the data. This is the approach that has been taken
in the development of a kinetic model for catalytic reforming of methyl
cyclopentane.
In the remainder of this chapter the reaction mechanism developed
in the previous chapter is simplified to include only four components.
A system of differential rate equations for an integral reactor is then
derived for the simplified reaction model. Next, the four simultaneous
differential equations are solved for product yields as an explicit
function of the rate constants, initial concentrations, and space time.
Finally, a procedure for solving the four nonlinear kinetic equations
for the rate constants is developed.
B. Reaction Mechanisms in Heterogeneous Catalysis
Solid catalyzed reactions occur when molecules from the fluid phase
become activatedly adsorbed on the surface of the catalyst. Prior to
this step, however, both reactant and product molecules must be trans
ported between the fluid phase and the catalyst surface. At the surface,
adsorption of the reacting molecules and desorption of the products are
both necessary for continuation of the reaction. The mass transfer steps
may have a profound effect on the overall reaction rate, but experimental
conditions can usually be selected so that these steps do not hinder the
reaction rate. This being the case, the reaction mechanism depends on
Reproduced with permission of the copyright owner. Further reproduction prohibited without permission.
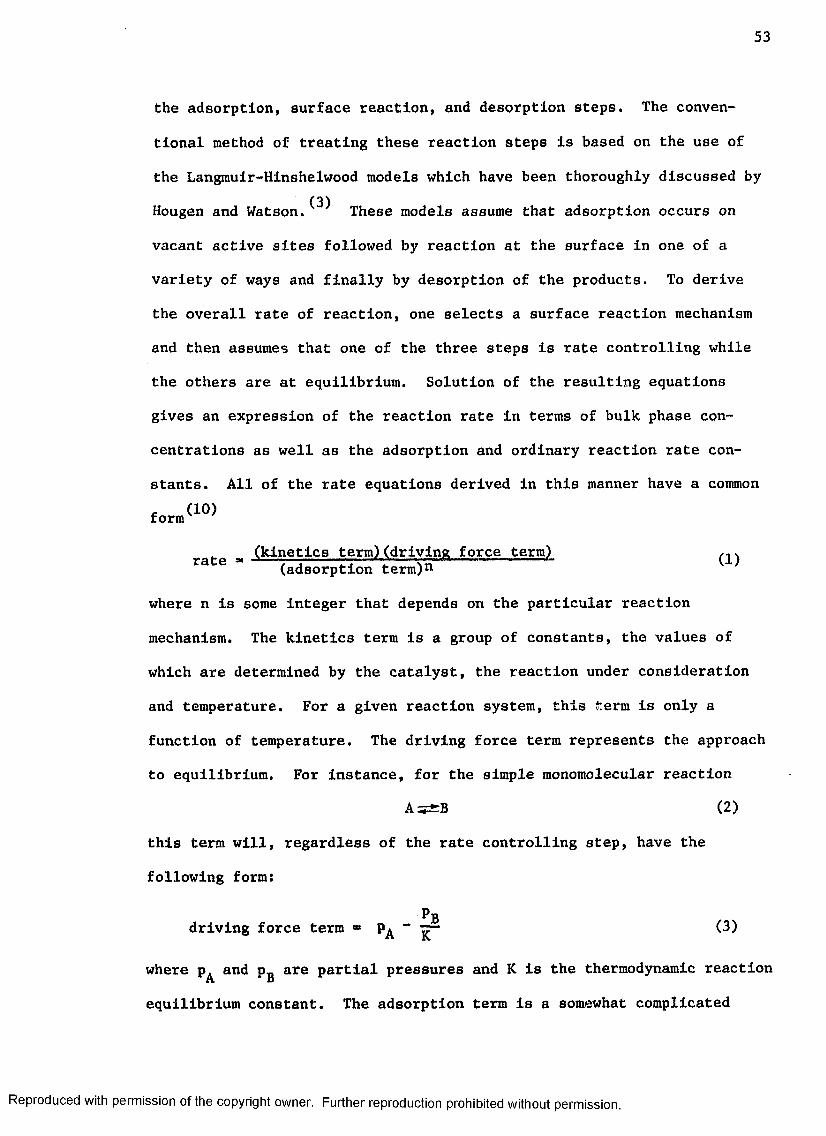
53
the adsorption, surface reaction, and desorption steps. The conven
tional method of treating these reaction steps is based on the use of
the Langmuir-Hinshelwood models which have been thoroughly discussed by(3)Hougen and Watson. These models assume that adsorption occurs on
vacant active sites followed by reaction at the surface in one of a
variety of ways and finally by desorption of the products. To derive
the overall rate of reaction, one selects a surface reaction mechanism
and then assumes that one of the three steps is rate controlling while
the others are at equilibrium. Solution of the resulting equations
gives an expression of the reaction rate in terms of bulk phase con
centrations as well as the adsorption and ordinary reaction rate con
stants. All of the rate equations derived in this manner have a common
(kinetics term)(driving force term) ^ra e (adsorption term)n
where n is some integer that depends on the particular reaction
mechanism. The kinetics term is a group of constants, the values of
which are determined by the catalyst, the reaction under consideration
and temperature. For a given reaction system, this term is only a
function of temperature. The driving force term represents the approach
to equilibrium. For Instance, for the simple raonomolecular reaction
A ^ B (2)
this term will, regardless of the rate controlling step, have the
following form:
Pgdriving force term » **A ” k ” ^
where p^ and pB are partial pressures and K is the thermodynamic reaction
equilibrium constant. The adsorption term is a somewhat complicated
Reproduced with permission of the copyright owner. Further reproduction prohibited without permission.

54
function of the partial pressures and the adsorption equilibrium con
stants for each component in the reacting fluid.
Before one can derive reaction rate equations in the above manner,
a mechanism for the surface reactions must be postulated as is done in
the following section.
C. Simplified Methylcyclopentane Reaction Mechanism
At the conclusion of the literature survery in Chapter II, a
reaction sequence is given for the catalytic reforming of methylcyclo
pentane. This scheme is given again in Table 1 along with the surface
reactions which must occur in this network. It has been assumed that
all n-hexane is formed from methylcyclopentane by the acidic route while
all isohexane produced from the reactant occurs by hydrogenolysis.
Isomerization of C6 paraffins is assumed to proceed through olefin
intermediates. The reaction path from normal hexane to cyclohexane has
been eliminated since results from early exploratory experiments indicate
that even at the most severe conditions investigated in this study very
little reaction proceeds by this route.
D. Derivation of Reaction Rate Equations
With the assumption that the reactions in Table 1 represent the
surface reactions, one can next proceed to develop the Langmuir-Hinshel-
wood rate equations for each catalytic reaction step. At this point,
however, one should first stop and consider that data were obtained in
this study with an Integral reactor, which means that the rate equations
will have to be integrated. If at all possible the form of the rate
equations should be simple enough to allow analytic integration as opposed
to graphical or numerical integration. One will only be able to mathe
matically integrate this system of rate equations if they can be expressed
Reproduced with permission of the copyright owner. Further reproduction prohibited without permission.

55
Table 1: Methylcyclopentane Reaction Network with a Dual-FunctionReforming Catalyst
Reaction Schematic
CH:
1C6:
•CH*U
-B,
»MCPa-zr-gMCPic6- . J 6- = „ c 6
Surface Reactions
MCP
Metal Sites
kl- T - MCP + H2k lk2
H2 + CH 5 = ^ = k2
CH
k 3CH" ~ B z + 2H2
k 3k/t
h2 + 1C6= ^===P=*-1C6ki* k 5s
H2 + nC6“ ^ = f = ^ : nCg k 5
k6H2 + MCP '*= - , =£riC6
k6
MCP
Acid Sites
it 7
1k7
CH
k8H2 + MCP -« ■, nC6c
k8k 9
nC6k 9
iC<
Reproduced with permission of the copyright owner. Further reproduction prohibited without permission.

56
in terms of first-order monomolecular reactions with constant reaction
rate constants. (All the Latigmuir-Hinshelwood models are first order.)
Some of the reactions steps on the previous page involve both a
hydrocarbon and hydrogen molecule . and clearly are not monomolecular.
This problem can be alleviated if the hydrogen concentration remains
constant down the length of the reactor. In practice this can be
accomplished by using a large excess of hydrogen so that production or
consumption of hydrogen by chemical reaction will not appreciably change
the hydrogen concentration. By maintaining a constant hydrogen partial
pressure, one is able to incorporate terms for the hydrogen concentration
into the equilibrium constant and all the above rate equations can be
treated as if they are first order. Another consequence of this experi
mental procedure is that the driving force terms for all the different
mechanisms will be the same, so one does not at this stage have to decide
whether adsorption, desorption, or surface reaction is the rate con
trolling step. This particular information will be available as the
effect of hydrogen concentration is investigated.
The second condition necessary in order to be able to integrate the
rate equations is that of unchanging rate constants. As discussed above,
the first order constant is actually the Langmuir-Hinshelwood kinetics
term divided by the adsorption term raised to the appropriate power. The
kinetic term being only a function of temperature presents no problem
since the reactor profile is nearly isothermal. The adsorption term,
however, depends on the concentrations of the various species present,
namely hydrogen, methylcyclopentane and all its reaction products. The
hydrogen concentration is nearly constant as described above, but clearly
the concentrations of all the different hydrocarbon species vary to a
Reproduced with permission of the copyright owner. Further reproduction prohibited without permission

57
large extent down the reactor bed. However, because the total number
of moles of hydrocarbon remains constant throughout the reaction zone
(very little C 5- was ever observed), the adsorption term will be con
stant provided the adsorption equilibrium constants for all hydrocarbons
have nearly the same value. In other words, the following relationship
must hold for a typical adsorption term, which is actually the denomi
nator of the first order rate constant:
t1 + KH2pB2 + KMCPPMCP + KBzPB2 + KiC6plC6 + KnC6pnC6 '2
“ 11 + V H 2 + KH C <pMCP + pBz + piC6+ pnC6)]Z
“ [1 + V h , + KHCpHC 12 W
where K^c is the common adsorption equilibrium term for all hydrocarbon
components. The assumption of similar adsorption properties for these
particular hydrocarbons is not unreasonable. One might question whether
benzene would be adsorbed to a greater extent than the other molecules,
but the fact that A l l a n ^ successfully made this same approximation for
the cyclohexane-benzene system suggests that this is not the case.
Now that it has been established that the surface reactions can be
treated as monomolecular reactions with constant reaction rate constants,
the Langmuir-Hinshelwood models can be expressed in the simple form
reaction rate - (] + 1 ^ , " + < ^ FHC)n [PA - ^ B 1 ' k [pA - f g 1
- k pA ' (K )pB (5)
where the reaction equilibrium constant K contains any hydrogen pressure
terms needed in the rate expression. In the equations which follow, the
hydrogen partial pressure terms will not initially be incorporated into
the equilibrium constant.
Reproduced with permission of the copyright owner. Further reproduction prohibited without permission.

58
In catalytic reactions, rates are usually based on catalyst weight
or surface area as opposed to homogeneous reactions which are expressed
on a basis of reactor volume. The rate expression for a tubular
catalytic reactor can be obtained from a simple material balance on a
differential weight of catalyst which results in an equation of the form
- NA „ . „„ + r. (AW )W |W + AW A ' cc I c c
where
■ gm moles component A flowing through the packed bed per hour,
W£ » gms of catalyst at beginning of differential element,
AW£ ■ differential weight of catalyst,
r^ ■ gm moles component A reacted/hr-gm catalyst.
In the limit as AWc -*■ o, the above equation becomesdNA
X m -----—A dWc.
Using this form of the reaction rate one can then write the differential
rate equations for all the reacting species. The terms on the right-
hand-side of the rate equations have the form of equation (5) and are
based on the reactions given in Table 1. This set of rate equations is
given below. To simplify the form of these equations, the partial
pressures of each of the reacting components are denoted as follows:
m " PMCP« M ° PMCP
c ■ pc ir c ■ pCH
1 " P p c r 1 ■ PiC .6 6” ■ PnCJ? K - PnC,6 6H ■ pH2 B ■ Plte
where p^ is the partial pressure of component i expressed in atmospheres.
The rate constants in the equations on the following page have the units
Reproduced with permission of the copyright owner. Further reproduction prohibited without permission.

59
k « gra moles/gm catalyst-hr-atm.
dN , , ,“ kjM + k; C + kg n - (kjH + k7 + kgH)m (6)dWc
dNCH a IdWc
k2C + k 3 BH2 + k 7m - (k2H + k3+ k7)c (7)
dNiC6= ,dWc
ki*! + kg n - (k^H + kg)l (8)
dN »n C 6 9 f 9
"dW— “ kg N 4- kg mH + kg i - (kgH + kg + kg)n (9)
dN„„ fm k2cH - k2 C (10)
c
dNic6dWc
dNnC6dWc
dNBz
dWc
- k^ iH + k6M - (ki» + k6)I (11)
k5 nH - k5 « (12)
k3c - k 3 BH2 (13)
dNMCP dNMCP“ dNCH“ dNlCR= dNnCR^ dNCH dNiCfi dNnCK“ diJ "dw + ~ ir + ~di) + "dW + "dir + + T w “c c c c c c c c
dNt(14)B*.
dWcThe Cg olefins and cyclohexene reaction Intermediates are present In
very small concentrations, so one can simplify the rate equations by
making the steady state approximation
dN#_ m dN — m dNpU<B— i£6- „ — aSfi. » . o (15)dW dW dW
C C C
and solve equations (7), (8), and (9) for the concentration of these
Reproduced with permission of the copyright owner. Further reproduction prohibited without permission.

6 0
intermediates. This approximation cannot be made for the other
unsaturated Intermediate, methylcyclopentene, since its concentration
is appreciable. This component, however, is in equilibrium with
methylcyclopentane and can be expressed as
From experimental data presented in a later chapter it is obvious
that the yield of cyclohexane is constant over a very wide conversion
range. This result can be expressed as
Equations (10) and (17) together imply that cyclohexane and cyclohexene
are in equilibrium. Thus, the yield of cyclohexene must also be constant
over a wide conversion range as implied by the steady state approximation
for this component.
Equations (15), (16) and (17) can be used to simplify the 9 rate
expressions given as equation (6)-(14) to just 4 equations expressed in
terms of the major reacting components, methylcyclopentane, iso and
normal hexane and benzene. This procedure is illustrated below for the
benzene rate expression.
The rate of formation of benzene is given by the expression
(16)
(17)c
(13)
where
c - partial pressure of cyclohexene, atm,
B - partial pressure of benzene, atm,
H » partial pressure of hydrogen, atm.
k3, k 3 ■* Lamgmuir-Hinshelwood rate constants
Reproduced with permission of the copyright owner. Further reproduction prohibited without permission.
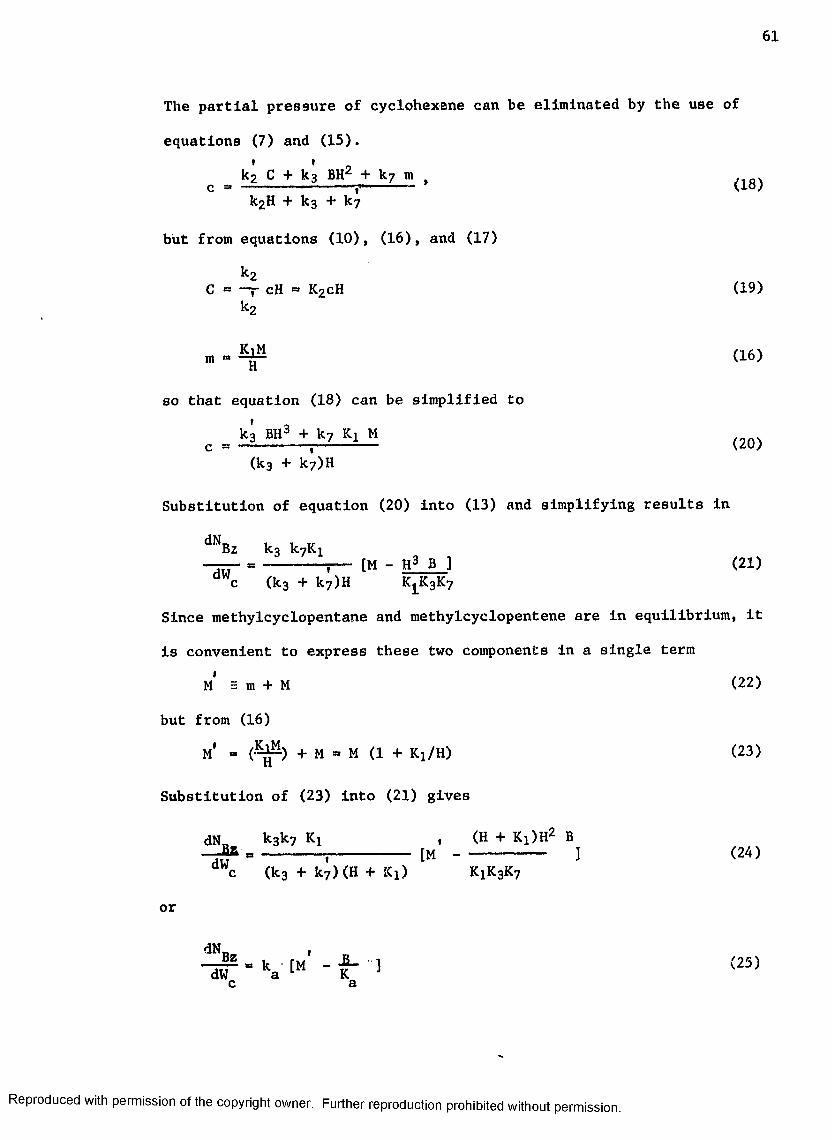
61
The partial pressure of cyclohexene can be eliminated by the use of
equations (7) and (15).
c » k* C + k3 BHV+ k? » . (18)k2H + IC3 + k 7
but from equations (10), (16), and (17)
k2C - — cH - KzcH (19)
k2
m ~ (16)
so that equation (18) can be simplified to
c . k3 » (20)(k3 + k7)H
Substitution of equation (20) into (13) and simplifying results in
Bz ko k 7Ki-------- ;-- [M - H 3 B ] (21)
dWc (k3 + k7)H K1K 3K7
Since methylcyclopentane and methylcyclopentene are in equilibrium, it
is convenient to express these two components in a single term
M = m + M (22)
but from (16)
M “ (~"A~ ) + M *» M (1 + Kj/H) (23)n
Substitution of (23) into (21) gives
dN k 3k 7 Kx , (H + Kj)H2 B— „ -------- j---------- [M ---------------- ] (24)dWc (k3 + k7)(H + Ki) KiK3K 7
or
dN_ ,— M » k [M - -2 - 1 (25)dW a LW K J c a
Reproduced with permission of the copyright owner. Further reproduction prohibited without permission
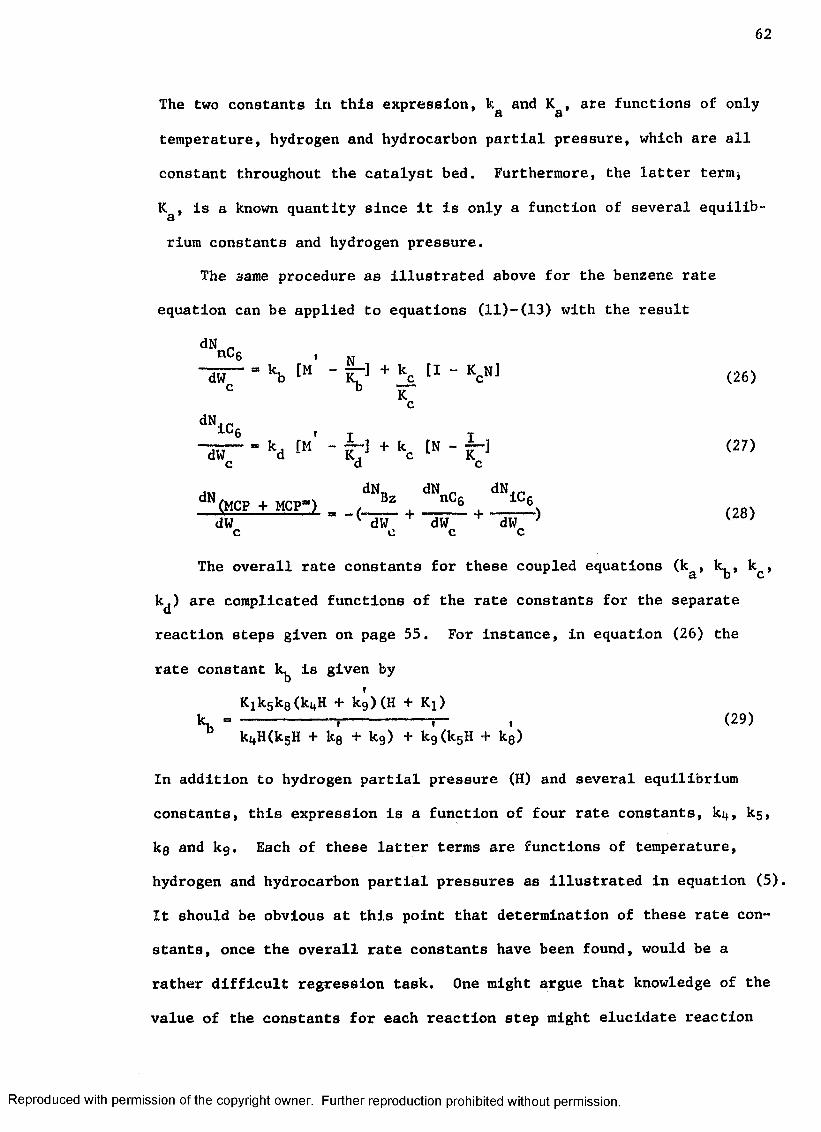
6 2
The two constants in this expression, k and K , are functions of only
temperature, hydrogen and hydrocarbon partial pressure, which are all
constant throughout the catalyst bed. Furthermore, the latter term*
K , is a known quantity since it is only a function of several equilib-
rium constants and hydrogen pressure.
The 3ame procedure as illustrated above for the benzene rate
equation can be applied to equations (11)-(13) with the result
dNnu6 ,s8 ir r m —
*b
nCg , ^dW— - “b - IT 1 + ko » - V 1 (26)
dN- Kc
iC6 ,- k. [M - + k [N - ~ ] (27)dW d 1 K, c 1 ’ Kc d c
m dNn, dNnr dN<r(MCP + MCP") ( Z 6 6vdw a “ ( + ’d w ~ + "dir’) (28)c c c c
The overall rate constants for these coupled equations (ka , k^, kc ,
kj) are complicated functions of the rate constants for the separate
reaction steps given on page 55. For Instance, in equation (26) the
rate constant k^ is given by
K 1k5k8 (kifH + kg)(H + K X) k. ------------ i------------s , (29)
kttH(k5H + k8 + kg) + kg (kgH + kg)
In addition to hydrogen partial pressure (H) and several equilibrium
constants, this expression is a function of four rate constants, kt , ks,
kg and kg. Each of these latter terms are functions of temperature,
hydrogen and hydrocarbon partial pressures as illustrated in equation (5).
It should be obvious at this point that determination of these rate con
stants, once the overall rate constants have been found, would be a
rather difficult regression task. One might argue that knowledge of the
value of the constants for each reaction step might elucidate reaction
Reproduced with permission of the copyright owner. Further reproduction prohibited without permission.

6 3
mechanisms at the catalyst surface and, therefore, the effort is
worthwhile. On the other hand, it should be recalled that the Langmuir-
Hinshelwood rate equations are only models for what is thought to
happen at the catalyst surface. Also, numerous examples have been
given for very simple reactions in which several reaction mechanisms
described the data equally well. If one cannot pinpoint the exact
mechanism for even the simplest of reactions, it seems highly unlikely
that surface mechanisms can be established for such a complex reaction
system as exists for methylcyclopentane. For these reasons, it does not
appear worthwhile to even attempt determination of the individual rate
constants in the equations developed above. The overall reaction rate
constants in equations (25)-(27) will be determined and correlated with
temperature and pressure in the manner discussed in another chapter.
The final step in the derivation of the differential rate equations
is to convert them to a form where terms for the reacting components are
expressed as hydrogen-free mole fractions. Assuming that Dalton's law
holds, then
P1 “ yi#rf (30)
where
Pj *» partial pressure of component i, atm,
it ® total pressure, atm,
y^ ** mole fraction of component i.f
Defining a hydrogen-free mole fraction, y^
H H V nhc (3l)where
Nj, * total gm-moles of gas/hr,
N„p « gm-moles hydrocarbon/hr,
Reproduced with permission of the copyright owner. Further reproduction prohibited without permission.

64
results In
Pt = » y± Nhc^ t (32)
«= y^ NHC (33)
Substitution of equations (32) and (33) into (25) gives
flS. . k (y' . (34)dWc a Nt (yM' Ka'I
where the subscripts B and M refer to benzene and methylcyclopentane
plus methylcyclopentene, respectively.
It is also convenient to define a space time, 0
0 = Wc/F (35)
where
F - hydrocarbon feed rate, gms/hr,
Wc ■ catalyst weight, gms.
(37)
Making this final substitution as well as those in equations (32) and
(33) into the four reaction rate equations given in (25)-(28) gives the
following expressions:« io (iJL) k (y' ' _ Zl) (36)
d0 N„, a y M K T aV f^yN ,tt F s , , ' , yNv /it F y kc r ' nd0 * Nt y M " ^ Nx * Kc tyI ” cyNi » i
^yT irF 1 yi irF , y i— L m (lU L ) k (v • ___ -) + (i-i.) k ( v -) (38)d0 N_ ; Kd y M K. % ' \ N KT a i. c
dyM ' ^ ^d0 " d0 * d0 d6
where the hydrogen-free mole fractions refer to the following compounds: »
yn * benzene mole fraction,D9
yj = isohexane mole fraction,
Reproduced with permission of the copyright owner. Further reproduction prohibited without permission.
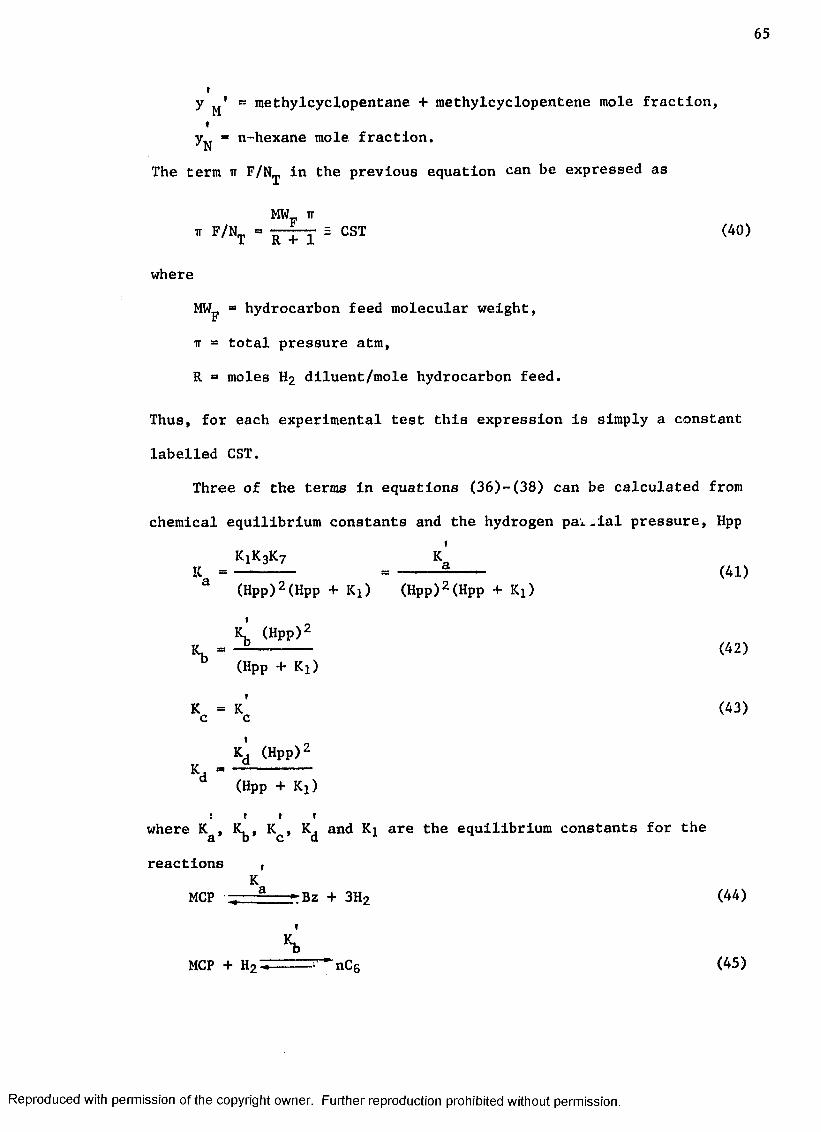
6 5
y ' « methylcyclopentane + methylcyclopentene mole fraction,I
y„ - n-hexane mole, fraction.
The term it F/N^, in the previous equation can be expressed as
MW„ it
TT F/NT - y t j b cst (40)
where
MWp “ hydrocarbon feed molecular weight,
ir « total pressure atm,
R *» moles H 2 diluent/mole hydrocarbon feed.
Thus, for each experimental test this expression is simply a constant
labelled CST.
Three of the terras in equations (36)-(38) can be calculated from
chemical equilibrium constants and the hydrogen pai-ial pressure, Hpp
K 1K 3K 7 k'K -------- « 2- (41)
(Hpp) 2 (Hpp + Ki) (Hpp) 2 (Hpp + K X)
K (Hpp)2K_ **» ------ (42)
(Hpp + Ki)
K = k ' (43)c c
KdKd (Hpp)2
(Hpp + Kj)# v » »
where Kfl, K^, Kc , Kj and Kj are the equilibrium constants for the
reactions 9K
MCP a ► Bz + 3H2 (44)V
sMCP + h2 - r— nc6 (45)
Reproduced with permission of the copyright owner. Further reproduction prohibited without permission.
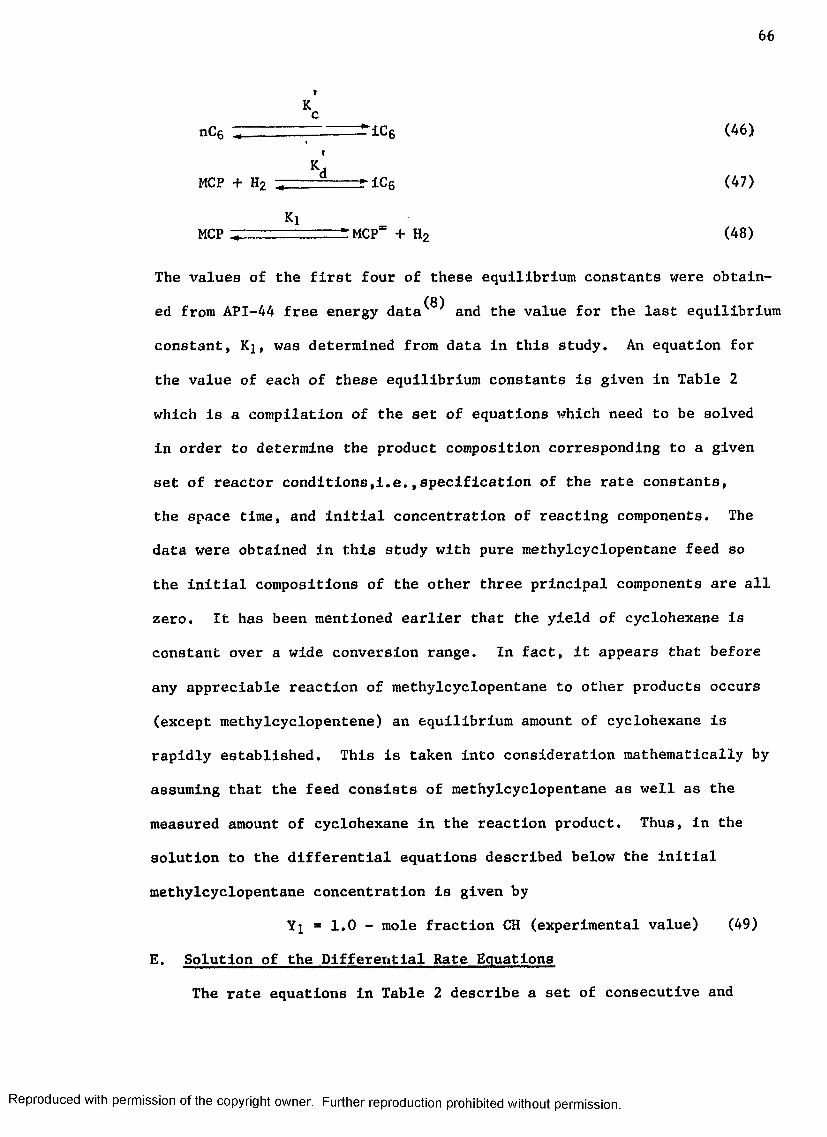
The values of the first four of these equilibrium constants were obtain-(8)ed from API-44 free energy data and the value for the last equilibrium
constant, Ki, was determined from data in this study. An equation for
the value of each of these equilibrium constants is given in Table 2
which is a compilation of the set of equations which need to be solved
in order to determine the product composition corresponding to a given
set of reactor conditions,i.e.,specification of the rate constants,
the space time, and initial concentration of reacting components. The
data were obtained in this study with pure methylcyclopentane feed so
the initial compositions of the other three principal components are all
zero. It has been mentioned earlier that the yield of cyclohexane is
constant over a wide conversion range. In fact, it appears that before
any appreciable reaction of methylcyclopentane to other products occurs
(except methylcyclopentene) an equilibrium amount of cyclohexane is
rapidly established. This is taken into consideration mathematically by
assuming that the feed consists of methylcyclopentane as well as the
measured amount of cyclohexane in the reaction product. Thus, in the
solution to the differential equations described below the initial
methylcyclopentane concentration is given by
Yi “ 1.0 - mole fraction CH (experimental value) (49)
E. Solution of the Differential Rate Equations
The rate equations in Table 2 describe a set of consecutive and
Reproduced with permission of the copyright owner. Further reproduction prohibited without permission.

67
Table 2
Simplified Kinetic Equations
Simplified Reaction Rate Expressions
dyiW ■ k21y2 " k12yl + k31y3 - k13yl + k41y4 ' k14yl
dy2de~ = k12yi " k21y 2 + k32y3 “ k23y2
dy3W = k13yl “ k3ly3 + k23y2 ” k32y3
dy4de~ " k14yl - k41y4
Rate Constants
k. „ (HPP •+ K )k, CST k , k.12 d 21 (HPP)2
k13 - CSTk- » (HPP + K J
1, k a — --- —° 31 (HPP)2
k- .(HPP)2 (HPP + K.)k - . - C S T k 14 a 41 K'a
k32k_9 - CST k k09 -J z C Z j __ |Kc
Equilibrium Constants
Kx = Exp ( + 16.850)
- Exp ( ~^6^ 60, + 42.860)
Reproduced with permission of the copyright owner. Further reproduction prohibited without permission.
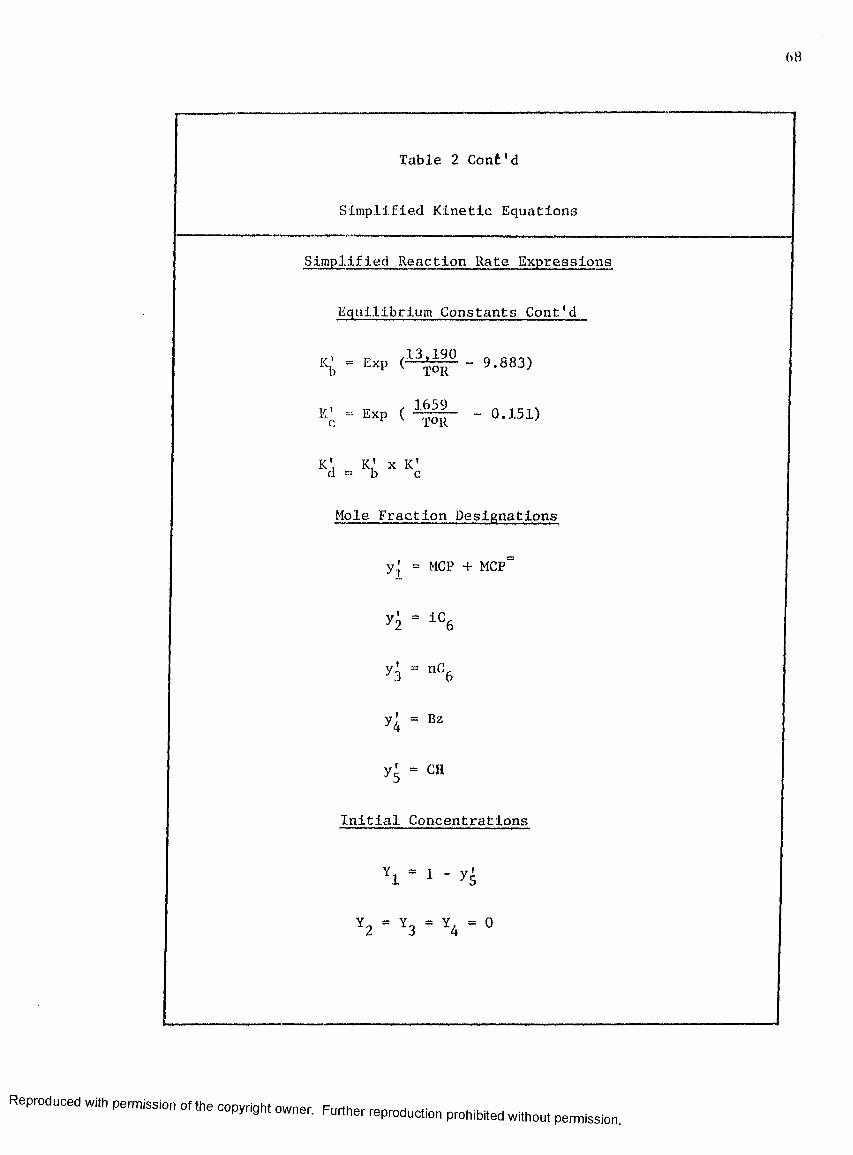
<>8
Table 2 Cont'd
Simplified Kinetic Equations
Simplified Reaction Rate Expressions
Equilibrium Constants Cont'd
IS 19f)K ’ = Exp - 9.883)
163910 « Exp ( - 0.151)
Kd - K x K
Mole Fraction Designations
y' = MCP + MCP^
= bz
y* = c h
Initial Concentrations
Reproduced with p e n s i o n o , the copyright owner. Further reproduction p r o v e d without permission

6 9
simultaneous, first-order, reversible chemical reactions. The solution
to this system of equations, which mathematioally is described as a set
of linear, first-order, coupled, ordinary differential equations, has
been discussed in a book by Rodiguin and R o d i g u i n a . ^ These investigators
consider the solution of the differential equations describing many
different complex first-order reaction schemes. All these equations
are conveniently solved through the use of Laplace-Carson transforms
which differ slightly from the ordinary Laplace transform
00
L {f(0)} - / e-s0f(e)d8 (50)o
in that the integral is multiplied by the parameter s
00
LC (f(0)} =>s/ e-s0f(9)d0. (51)o
This latter transformation is sometimes preferable because the transform
of a constant is simply the same constant whereas the Laplace transform
of a constant A is
L {A} ** ~ . (52s
Solution of a set of differential equations using this procedure in
volves the steps outlined below:
1. Transform each differential equation into a new domain where
the parameter s replaces the independent variable. The equation
then becomes one which can be treated algebraically. Examples
of several transformation are
LC {k y . (0)) ■ k y.(s) (53)dyi (0)
LC *deT * " 8 yi(®) “sYio ^5^
Reproduced with permission of the copyright owner. Further reproduction prohibited without permission.

7 0
LC {k} - k (55)
where
k “ a constant
s ■ parameter in new domain
yi (8) ■ transformed variable
*» initial value of y (0) at 0 a 0
2. Solve foreach transformed variable y^(s) in terms of constants
in the original differential equation, initial values of the
variables, and the parameter s. This step is simply finding
the solution to a set of algebraic equations. In order to
proceed to the final step, it is first necessary to put these
solutions into the proper form. Typically, this step involves
the finding of roots of the variable s for the expression which
appears in the denominator of the algebraic solutions of y^(s).
For a 3 component system this expression is a quadratic while
it is a cubic equation for a four component system.
3. Obtain the inverse transforms to convert the variable y from
the s domain back to the 0 domain. This step is usually carried
out with the aid of transformation tables such as those present-(7)ed by Rodiguin and Rodiguina.
When the procedure discussed above is applied to the set of equations
in Table 2 the result is a set of very complex algebraic equations which
are of the form
y± - f ± (K, 9 , y0) ( 5 6 )
where K is the set of all possible k ^ , i ■ 1-4; j ■ 1-4
0 » space time
Y ■ set of initial concentrations of all componentso
Reproduced with permission of the copyright owner. Further reproduction prohibited without permission.
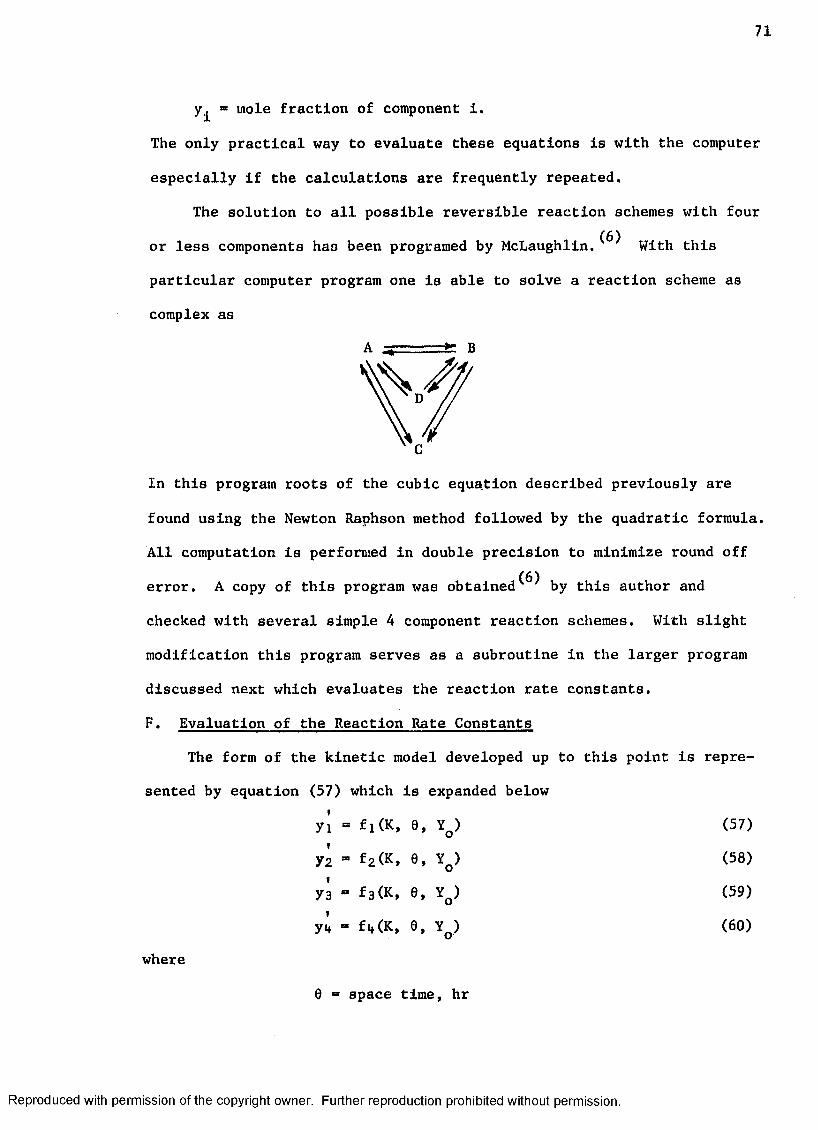
7 1
■ mole fraction of component 1.
The only practical way to evaluate these equations is with the computer
especially if the calculations are frequently repeated.
The solution to all possible reversible reaction schemes with four
or less components has been programed by M c L a u g h l i n . ^ With this
particular computer program one is able to solve a reaction scheme as
complex as
¥' C
In this program roots of the cubic equation described previously are
found using the Newton Raphson method followed by the quadratic formula.
All computation is performed in double precision to minimize round off
error. A copy of this program was o b t a i n e d ^ by this author and
checked with several simple 4 component reaction schemes. With slight
modification this program serves as a subroutine in the larger program
discussed next which evaluates the reaction rate constants.
F. Evaluation of the Reaction Rate Constants
The form of the kinetic model developed up to this point is repre
sented by equation (57) which is expanded below
yi - fl(K, 0, V (57)»
y2 - f2 (K, e, V (58)t
y3 - f3<K, 0, V (59)*
y4 =* f<+(K, 0, V (60)
where
0 ■ space time, hr
Reproduced with permission of the copyright owner. Further reproduction prohibited without permission.

72
K » set of rate constants - ki2 , kj3, k m , k23,
k 21> k 31» k41» k 32
Y “ set of initial concentrations oand subscripts 1, 2, 3, 4 refer to methylcyclopentane, Isohexane,
n-hexane, and benzene, respectively. The functions fj, f£, f3, fit are
complex express Lons containing the initial concentrations, space time,
and the set of 8 rate constants (4 forward and 4 reverse). Thus, one
needs to know the value of the rate constants at different reactor
conditions in order for the model to be complete. Since the rate con
stants are functions of temperature, hydrogen and hydrocarbon partial
pressures, a necessary part of the kinetic model is a set of correlations
of the reaction rate constants with these reaction parameters. In order
to develop these correlations one first needs to solve equations (57)-
(60) for the rate constants in terms of the experimental product yields,
space time, and initial concentrations. Because of the extremely complex
nature of these equations, however, an explicit solution for the rate
constants is out of the question even though an exact solution exists.
(There are 4 equations and only 4 unknown rate constants. The 4 reverse
constants are known from equilibrium data.)
The solution to a set of non-linear equations can be obtained with
Iterative methods of which a simple example is the classical Newton-
Raphson method for finding the roots of a polynomial. Solving a set of
non-linear equations can be considered an optimization problem in which
one seeks to minimize the objective function which represents the
difference between experimental and calculated results. For the problem
at hand, the following equations describe such an optimization problem
Reproduced with permission of the copyright owner. Further reproduction prohibited without permission.

7 3
Minimize: <J> ■ Rj2 + R? 2 + R 3 2 + R4 2
( 6 1 )Subject to: k fc-0, k ^ O , * ^ 0
where
Rl = yi - f1 (K, 0, Yo)
R2 = Y2 ~ f2<K, 0, Yq)
R 3 - Y3 “ f3(K, 0, Yo ) (62)
R4 = y l - f4 (K, 0, Yo )
In this optimization scheme the values of 4 of the rate constants are
varied until the objective function reaches its minimum value, which in
this case will be zero since an exact solution to the set of 4 equations
exists.
There are many programing techniques which use multivariable search
methods to find optimum values of non-linear functions. Some of these
methods such as "Steep-Ascent Partan," "Deflected Gradient," and(9)"Pattern Search" have been discussed by Wilde and Belghtler. The
last of these methods has proven to be one of the most effective and(2)easily programmed search techniques. Hooke and Jeeves, the origi
nators of "Pattern Search," found that the computation time is propor
tional to the first power of the number of variables whereas with
classical techniques the number of computations is proportional to the
cube of the dimensionality. "Pattern Search" was, therefore, selected
as the search technique to be used to solve the problem specified in
equation (61) since this particular problem is four dimensional. Also
Allan and L u z a r r a g a ^ both successfully used this technique in
similar but two dimensional problems.
"Pattern Search" is a logical as opposed to a random multivariable
Reproduced with permission of the copyright owner. Further reproduction prohibited without permission.
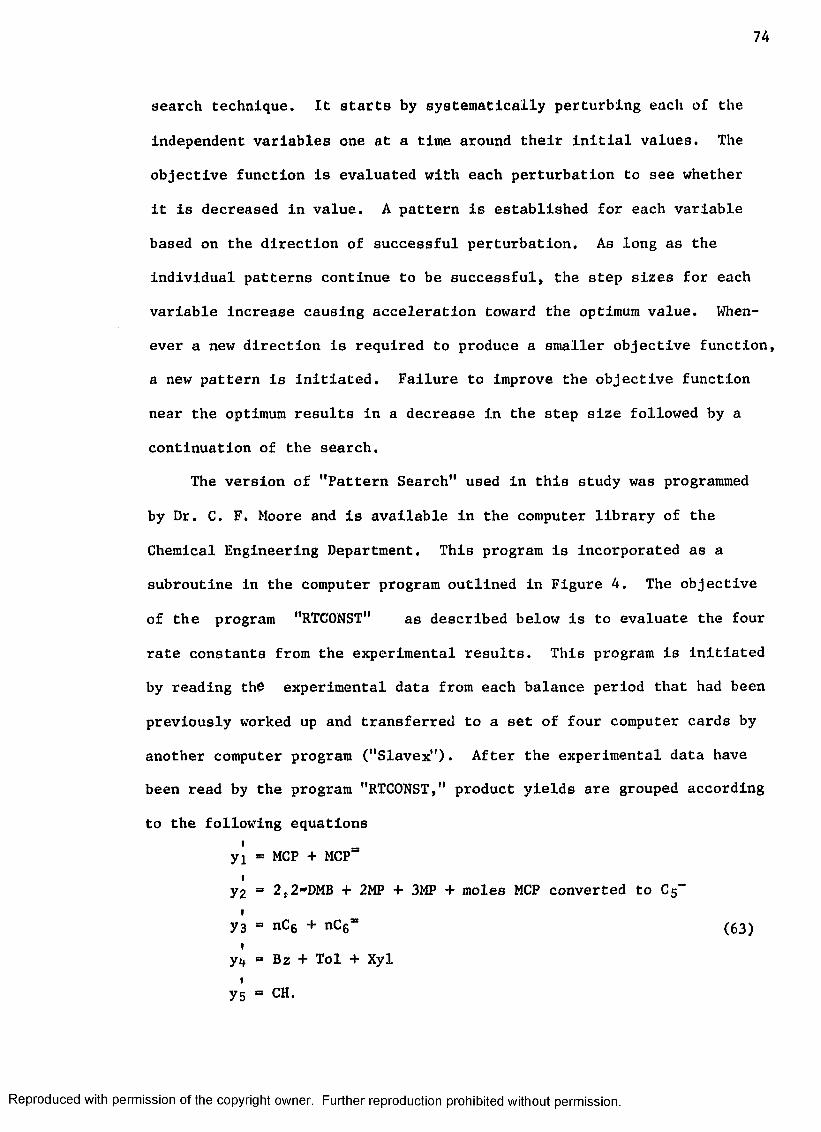
7 4
search technique. It starts by systematically perturbing each of the
independent variables one at a time around their initial values. The
objective function is evaluated with each perturbation to see whether
it is decreased in value. A pattern is established for each variable
based on the direction of successful perturbation. As long as the
individual patterns continue to be successful, the step sizes for each
variable increase causing acceleration toward the optimum value. When
ever a new direction is required to produce a smaller objective function,
a new pattern is initiated. Failure to improve the objective function
near the optimum results in a decrease in the step size followed by a
continuation of the search.
The version of "Pattern Search" used in this study was programmed
by Dr. C. F. Moore and is available in the computer library of the
Chemical Engineering Department. This program is incorporated as a
subroutine in the computer program outlined in Figure 4. The objective
of the program "RTCONST" as described below is to evaluate the four
rate constants from the experimental results. This program is initiated
by reading the experimental data from each balance period that had been
previously worked up and transferred to a set of four computer cards by
another computer program ("Slavex"). After the experimental data have
been read by the program "RTCONST," product yields are grouped according
to the following equationsi
y! - MCP + MCP"
y'2 = 2,2-DMB + 2MP + 3MP + moles MCP converted to C5“t
y 3 ■ nC6 + nC6" (63)t
yn - Bz + Tol + Xyl
y5 = CH.
Reproduced with permission of the copyright owner. Further reproduction prohibited without permission.

75
The main program makes Initial estimates of the forward rate constants
from the equations below
» i72 i 1-Y5
k12 =---- j----- r)-(— ) In (— i ) (64)y2 + y 3 + y k yi
t »
Y3 1 1"Y5kl3 . ( _----- .-----r)(i) ln ( _ _ ) (65)y2 + Y3 + y4 yi
I f
y4 i i-yskllt . (_.----- ,---- r)(A) in (— J-) (6 6 )y2 + y3 + y»t yi
These estimates are based on a simplified model where reaction from
methylcyclopentane to each of the three products is assumed to be
irreversible and the reaction path between iso and normal Cg is neg
lected. An initial estimate of k 32 , the rate constant for isomerization
of normal hexane, is arbitrarily made as the same value as that calcu
lated for kj3. It should be mentioned at this point that the only
effect the starting values have on the final results is the length of
computation time required for convergence to the optimum. The possi
bility of multiple solutions or local minima was frequently checked by
variation of the initial values over a wide range. In every case the
search technique converged to the same set of rate constants, indicating
the absence of local minima.
After the main program has performed the calculations Indicated
above, control is transferred to the subroutine "Pat^rn", which after
the first iteration, makes the successive adjustments to the rate con
stants that causes convergence. With each change made in the value of a
single rate constant (1) "Bounds" is called to check constraint
Reproduced with permission of the copyright owner. Further reproduction prohibited without permission.
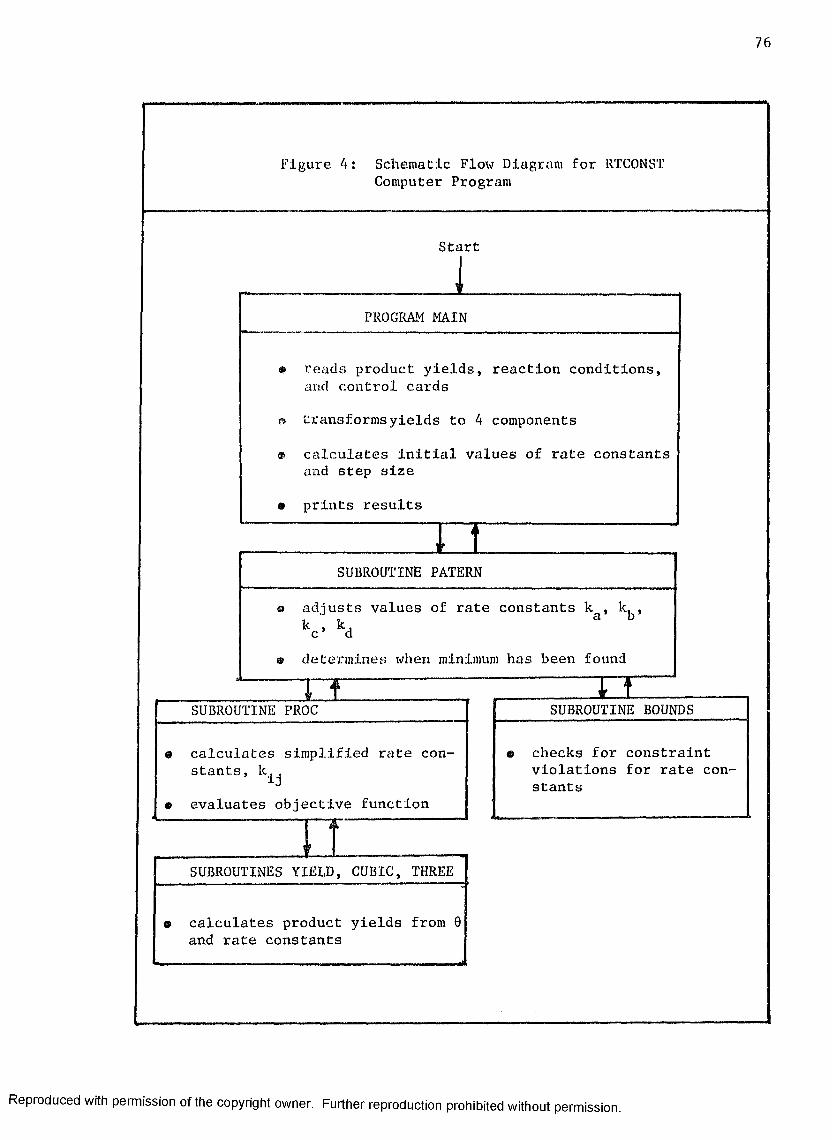
76
Figure 4: Schematic Flow Diagram for RTCONSTComputer Program
Start
a checks for constraint violations for rate constants
SUBROUTINE BOUNDS
e calculates product yields from and rate constants
SUBROUTINES YIELD, CUBIC, THREE
evaluates objective function
calculates simplified rate constants, k. .
SUBROUTINE PROC
determines when minimum has been found
adjusts values of rate constants k , k.
SUBROUTINE PATERN
transforms yields to 4 components
prints results
calculates initial values of rate constants and step size
reads product yields, reaction conditions arid control cards
PROGRAM MAIN
Reproduced with permission of the copyright owner. Further reproduction prohibited without permission.
77
violation, (2) "Proc" is called to calculate the simplified rate con
stants k , ,, (3) "Yield" is called to calculate product yields andJ(4) "Proc" then evaluates the objective function <J> before control is
passed back to "Patern" for another perturbation. This cycle is
repeated until the optimum value of each of the four rate constants has
been determined. When this happens the final results are transferred to
the main program from where they are printed. Whenever the objective
function ip becomes smaller than 10- 7 the search is terminated. With
this criteria for <j>, calculated yields differ from the measured yields
by no more than 0.02 mole percent of feed, which is well within the
precision of the experimental data.
The computer program "RTCONST" as described above is not really
being used as an optimization technique in the strictest sense. Rather,
it serves as a means of solving a set of non-linear equations which have
an exact solution for each experimental test. This same program, how
ever, can be used to find the single set of rate constants which gives
the best "fit" to a number of experimental tests taken as a group. In
this case, no exact solution is possible due to the presence of random
experimental error. Instead, the program converges to the set of con
stants which minimizes the sum of the squares of the differences between
predicted and measured yields. This optimization problem can be stated
asN
Minimize: tp - E Rj^ + r2 -I- R 3 2 + R^?j_i J J J 3~ 1 (67)
Subject to: k 0 , k ^ O , k ^ O , 0
where
R, . = y' - f . (K, 0. Y )ij ij i j o
Reproduced with permission of the copyright owner. Further reproduction prohibited without permission.

78
= yield of component i in test j
* space time for test j
N » number of experimental tests.
In the optimization problem as stated above the only Independent
variable which is different in each experimental test is the space time.
Rate constants and initial concentrations would have the same value for
each test. This is the type optimization problem used in this research
to find the set of rate constants which best "fit" the data obtained
over a range of conversion levels, but at a constant temperature,
pressure, and initial concentration.
There is no reason why one could.not extend this problem to also
evaluate parameters in the correlations for the rate constants as well.
A simpler procedure, however, is used in this work to correlate the rate
constants with temperature and pressure.
Before concluding this discussion of the technique for calculating
reaction rate constants from experimental data, a few comments might be
appropriate about the efficiency of this optimization technique,
especially since this particular problem represents a four dimensional
search.
In the "Pattern Search" routine each parameter being optimized is
sequentially perturbed around its best value in search for the optimum
direction. In other words, parameter number one is increased by its
step size and the effect on the objective function is calculated. If
this step does not improve the objective function, the parameter is
decreased by the step size. If still no improvement is gained, then the
best value of the parameter from the last step is retained. This same
procedure is repeated for the second parameter and continued until all
Reproduced with permission of the copyright owner. Further reproduction prohibited without permission.

79
parameters have been perturbed. One might not consider the order in
which parameters to be optimized are assigned to the search technique,
but this author has found that it makes a difference in the efficiency
of the search procedure, especially if some parameters have a larger
effect on the value of the function being evaluated than do other
parameters. For instance, the rate constant for the conversion of
methylcyclopentane to benzene is several times larger than the rate
constant for conversion to isohexane or any other of the products from
MCP. The search procedure was found to be more efficient when the first
parameter to be perturbed in each iteration was the constant for benzene
production as opposed to the isohexane rate constant. This observation
is entirely logical when one considers the intricacies of "Pattern
Search." For this reason, the four rate constants were assigned to the
search technique in approximate order of decreasing value, ie,
p(l) « ka
P (2) - kj
p (3) - kc
p(4) » kd
where p(i) is the 1th variable to be perturbed in each iteration of the
search procedure and the k's are defined in equations (36)-(38).
An example of the convergence of this search technique to the
optimum set of rate constants is shown in Figure 5 for two of the con
stants. Two sets of starting values quite different from the final
answers were used to see if the optimization procedure converged to the
same set of values. As Indicated earlier and in this figure, no local
minima are encountered and the program converges to the same results
regardless of initial values. It appears from this figure that
Reproduced with permission of the copyright owner. Further reproduction prohibited without permission.

8 0
F I G U R E 5CONVERGENCE OF OPTIMIZATION PROCEDURELEGEND
s - -
ooOCO
ooo .to
X oSt*
ooo .
oo20.0000 >4.00 1 2 .0 08. 00
NUMBER OF ITERATIONS
Reproduced with permission of the copyright owner. Further reproduction prohibited without permission.

8 1
convergence occurs at about the same rate for both cases, which is
surprising. However, a better indication of efficiency is the number
of times the four complex yield equations below are evaluated:
y± - fA (K, 6, Yq ) i * 1, 2, 3, 4 (56)
For the case with the largest starting values, equation (56) was
evaluated 134 times as opposed to only 124 times for the other case.
(Computing time on IBM-360 averages about 8 sec/100 evaluations of
equation (56).) When the starting values are calculated for this same
set of data from equations (64)-(66) convergence is much more rapid
requiring only 86 functional evaluations.
Optimization of the objective function in equation (66) for a set
of experimental tests naturally requires more computing time. In one
instance optimization with data from 14 different tests required 3150
function evaluations, or about 4 minutes of computing time.
G. Correlation of Rate Constants
The last step in analyzing the data from this experimental program
is to correlate the reaction rate constants in the kinetic model with
pressure and temperature. A procedure for meeting this objective is
used in this study r.hich requires only the use of stepwise multiple
regression techniques. One of the BMD programs (BMD 02R) on disc at the
Louisiana State University Computer Center served this purpose well.
This particular program allows one to perform the independent variable
transformations that are needed to make the regression problem linear.
Further discussion of the development of correlations for the rate con
stants is postponed until Chapter VII.
Reproduced with permission of the copyright owner. Further reproduction prohibited without permission.
L IS T OF REFERENCES - CHAPTER I V
1. Allan, D. E . , "The Dehydrogenation and Isomerization fo CyclohexaneOver a Platinum Alumina Mordenlte Catalyst," Ph.D. dissertation, Department of Chemical Engineering, Louisiana State University, 1970.
2. Hooke, R., and Jeeves, T. A., "Direct Solution of Numerical andStatistical Problems," Journal Association of Computing Machinery, 8 (No. 2), 212 (1961).
3. Hougen, 0. A., and Watson, K. M . , Chemical Process Principles. PartIII. Kinetics and Catalysis, John Wiley and Sons, New York, New York, 1947.
4. Levenspiel, 0., Chemical Reaction Engineering. John Wiley and Sons,New York, New York, 1962.
5. Luzarraga, M. G., "Hydroisomerization and Hydrocracking of Cyclohexane Over a Faujasite Catalyst," Ph.D. dissertation, Department of Chemical Engineering, Louisiana State University, 1971.
6. McLaughlin, E. and Rozett, R. W . , "Kinetics of Complex SystemsTending to Equilibrium," Chemical Technology, 120 (1971).
7. Rodiguln, N. M. and Rodigulna, E. N., Consecutive Chemical Reactions,D. Van Nostrand Company, Inc., New York, New York, 1964.
8. Rossini, F. D., et al. Selected Values of Physical and ThermodynamicProperties of Hydrocarbons and Related Compounds, Carnegie Press, Pittsburgh, Pennsylvania, 1953.
9. Wilde, D. J. and Beightler, C. S., Foundations of Optimization,Prentice-Hall, Englewood Cliffs, New Jersey, 1967.
10. Yang, K. H. and Hougen, 0. A., "Determination of Mechanism ofCatalyzed Gaseous Reactions," Chemical Engineering Progress, 46 (No. 3), 146 (1950).
Reproduced with permission of the copyright owner. Further reproduction prohibited without permission.

CHAPTER V
EXPLORATORY EXPERIMENTAL DATA
Before any attempt was made to study the kinetics of this reaction
system, certain preliminary items had to be considered and investigated.
The type of reactor to be used, whether temperature profiles in the
reactor would be significant, whether mass transfer would be important
and whether catalyst activity and selectivity would be constant were
primary questions of concern. The studies described below were of an
exploratory nature and were designed to answer these questions.
A. Reactor Considerations
1. Reactor Type
Any program to study reaction kinetics should begin by selection
of the reactor type in which the investigation will be made. The nature
of the experimental equipment already in use in this project dictated
that the reactor would be one of plug flow type as opposed to either
batch or back-mix flow. The next question for consideration was whether
to operate it as a differential or an integral reactor. With a differen
tial reactor, conversion is held to a very low level so that concentra
tions in the reactor can be considered constant. The reaction rate is
then easily calculated from the experimental data. Knowing the rates
associated with a range of initial concentrations allows one to test
different kinetic models. Catalytic reforming of methylcyclopentane has
been studied in the past by several different researchers and most of83
Reproduced with permission of the copyright owner. Further reproduction prohibited without permission.
8 4
these studies have taken the differential reactor approach presumably
because of the simplicity of data analysis.
There are several disadvantages, however, to the differential
reactor approach. The one most commonly cited is the analytical problem
of analyzing for the small changes which occur in feed composition.
Another disadvantage is that many different feed compositions must be
prepared and tested in order to get the proper rate-concentration data
necessary for model evaluation. Perhaps the most serious problem with
this method occurs when reaction Intermediates are significant in the
kinetic scheme. As described in an earlier chapter, most of the
methylcyclopentane reactions are thought to proceed through olefin
intermediates. Feeds truly representative of partial methylcyclopentane
conversion should, therefore, contain all these intermediate products.
Preparation of such feeds would be extremely difficult especially since
some of the most important intermediates are present in very low concen
trations.
The integral reactor approach is not plagued with the problems
mentioned above and is, in fact, the preferred method to use for scaleup
because of the similarity between the experimental and commercial
reactors. The main weakness of this method of attack is that one must
be able to integrate the differential reaction rate equation corres
ponding to the kinetic model being tested. In a few Instances integra
tion is simple; for some kinetic models integration can be performed
using sophisticated mathematics, while the equation for many models just
cannot be integrated analytically. Another possible weakness is that due
to the greater extent of reaction in an integral reactor, isothermal
operation may be difficult to achieve. With both of these possible
Reproduced with permission of the copyright owner. Further reproduction prohibited without permission.
85
sources of difficulty In mind, It was decided to pursue the Integral
reactor approach In light of the following. From the review of kinetic
mechanisms postulated In the literature, a kinetic model was envisioned
that could be Integrated. Also, exploratory tests revealed that nearly
Isothermal operation could in fact be achieved, The success with which
previous researches in this project have been able to model other reac
tions from Integral reactor data also had bearing on this decision.
2. Extent of Axial Dispersion
Having selected a tubular reactor, the next question becomes
whether the flow will actually be plug flow. Deviations from plug flow
behavior due to axial dispersion greatly complicate the kinetic
equations and must be avoided if possible. A dlmensionless group known
as the Peclet number arises out of the differential equation describing
chemical reaction in a flow reactor with axial dispersion. The signi
ficance of this number is that it is a measure of the bulk mass transfer
as compared with diffusive mass transfer. A Peclet number of 0
corresponds to a perfectly mixed reactor while an ideal plug flow reactor
has an infinite Peclet number.(3)Levensplel gives a correlation for flow in packed beds that
relates the Peclet number to the particle Reynolds1 number. This(2)correlation has been confirmed from data by Bryant which was obtained
in a reactor nearly identical to the one used in this research. From
Levensplel's correlation and a Reynolds number calculated from typical
experimental conditions used in this study (Repra 1.0), one can estimate
the value of the Peclet number to be 200.(3)Levensplel also shows the analytic solution to the differen
tial equation describing a first order reaction with axial dispersion.
Reproduced with permission of the copyright owner. Further reproduction prohibited without permission.
86
For small values of the "reactor dispersion number," which is the in
verse of the Peclet number, this same reference shows that the ratio
of unconverted reactant In a reactor with dispersion to unconverted
reactant in an ideal plug flow reactor of the same size is given by the
following expression:
c ~ - 1 + (kx)2 <k>Ap
where
* unconverted reactant concentration with dispersion
cAp*» unconverted reactant concentration in ideal plug flow reactor
k « first order rate constant
x « time
Pe ■ peclet number.
Using the Peclet number estimated above and a value for kt corresponding
to 50 percent conversion, the ratio is calculated to be 1.0024.
One can conclude, therefore, that axial dispersion will not be a signifi
cant factor In this experimental study.
3. Axial Temperature Profiles
Previous studies in this experimental reactor have shown that
very significant axial temperature profiles can exist depending upon the
nature of the chemical reactions and the reactor conditions. For
instance, a typical profile measured in this study during one of the
catalyst "llneout" runs with a virgin naphtha feed is shown In Figure 6 .
The large drop in temperature is caused by rapid dehydrogenation of the
Cg naphthene compounds in the feed. These reactions are highly endo-
thermlc and require heat at a much faster rate than can be transferred
Reproduced with permission of the copyright owner. Further reproduction prohibited without permission.

8 7
F I G U R E 6REACTOR TEMPERATURE PROFILE - LINEOUT OPERATION
PT-RE CAT.. NAPHTHA PEED
oooCM-cn
oLl °
Qcn-'.ia ° >UJCLGoUJQ°oO --OJ
•— IXCC oQ
Qr-_oo
oooa?.
5 . 0 000 1.00 2.00 REACTOR LENGTH, INCHES
3 . 0 0
Reproduced with permission of the copyright owner. Further reproduction prohibited without permission.
88
through the reactor walla.
Fortunately, this problem Is not as severe with methylcyclo-
pentane feed since It reacts at a much slower rate than the cyclohexane
compounds. Also the overall heat of reaction for all the reactions that
methylcyclopentane undergo Is not as great due to the large amount of
ring opening reactions which occur. These particular reactions are
exothermic and partially compensate for the highly endothermic dehydro
genation reaction.
Several experimental procedures were adopted which aid
isothermal operation. High dilution of the catalyst with mullite helps
heat transfer as does a high hydrogen diluent rate through the reactor.
LimitJLng the degree of conversion in most of the experiments to 30-40
percent contributes further to isothermal operation. Following these
practices very nearly Isothermal operation is achieved as shown in
Figure 7 . The slight rise in temperature towards the bottom of the
reactor actually reflects a small temperature gradient in the sandbath
itself. For practical purposes, however, one can consider that operation
at these conditions is Isothermal.
4. Catalytic Effects of Reactor Walls
A standard experiment usually conducted in catalysis studies
is one designed to measure the extent of reaction caused by either
thermal reactions or a catalytic effect of the reactor wall. Such an
experiment was conducted in this study with the reactor filled with
mullite. Reactor conditions selected correspond to the most severe
examined. With methylcyclopentane feed no reactions were observed.
B. Catalyst "Lineout" Behavior
While reforming methylcyclopentane in some early exploratory studies,
Reproduced with permission of the copyright owner. Further reproduction prohibited without permission.

8 9
F I G U R E 7REACTOR AXIAL TEMPERATURE PROFILE - MCP FEED
n-nt cut. , mcp feed
ooo
p=B.LUflo - CL.3C f JUJ-, '► - §
m jOdm'X<x oo
oo .m
ooo0.00 S.001 .0 0
REACTOR LENGTH, INCHES2.00 9 . 0 0
Reproduced with permission of the copyright owner. Further reproduction prohibited without permission.
9 0
it was observed that both activity and product selectivity change
rapidly with age during initial catalyst life. Since kinetic studies
cannot be made on catalysts until they demonstrate reasonably constant
behavior, it became necessary to kinetically equilibrate several large
batches of catalyst for further use. The procedure for "lining out"
these catalysts has been discussed in Chapter III.
In between "lineout" operation with the naphtha feed, several
short experiments were made with methylcyclopentane at a standard set of
experimental conditions in order to determine when the nature of the cata
lytic reactions ceased to change. These experiments, while not a direct
part of the kinetic model development, are interesting in that they shed
light on the changing nature of the catalyst surface during initial
deactivation and provide some indication of reaction mechanism. All of
these tests were conducted at nearly the set of experimental conditions,
namely
800°F
200 psig
10 moles H2/mole MCP
2.4-2.5 w/hr/w.
The only variable in these experiments is the length of time the
catalyst has been in contact with the feed which probably corresponds to
the level of coke on the catalyst or perhaps the level of some adsorbed
poison such as sulfur.
It probably should be rfr-emphasized at this point that during the
first 1/2 hour of "lineout" operation both of these catalysts were sub
jected to rather severe conditions in order to reduce the high initial
hydrocracking activity. This step was followed so that temperature
Reproduced with permission of the copyright owner. Further reproduction prohibited without permission.
9 1
"hot spots" in the bed would be prevented*
The extent of conversion of methylcyclopentane feed in each test
at the standard set of conditions is shown as a function of catalyst age
in Figure 8 . Since reactor conditions are the same for each test, this
plot reflects catalytic activity for converting methylcyclopentane.
Several observations from this plot are obvious.
• Activity of each catalyst changes rapidly during initial
catalyst life.
• The Pt-Re catalyst appears to start with a higher activity and
definitely takes longer to stabilize.
• Both catalyst appear to "line out" at the same activity level.
One would conclude from these results that the Pt-Re catalyst is more
resistant to deactivation. It is difficult to tell from these data
whether the initial activities are the same. It is quite possible that
the Pt catalyst being less resistant to deactivation underwent relatively
severe deactivation during the initial 1/2 hour operation at low hydro
gen pressure. In fact, in other studies made without this initial period
of severe operation, initial activity of these two catalysts were nearly
the same.
If all the different types of catalytic sites were deactivated to
the same extent, one would not expect any change in product selectivity
to occur with deactivation. Figures 9 , and 10, however, Indicate that
this is not the case with these catalysts and methylcyclopentane feed.
The large changes in product selectivity with decreasing catalyst
activity indicate that certain sites are indeed being preferentially
deactivated. This observation is particularly apparent with the Pt-Re
catalyst. (One might question whether the changing selectivity is caused
Reproduced with permission of the copyright owner. Further reproduction prohibited without permission.
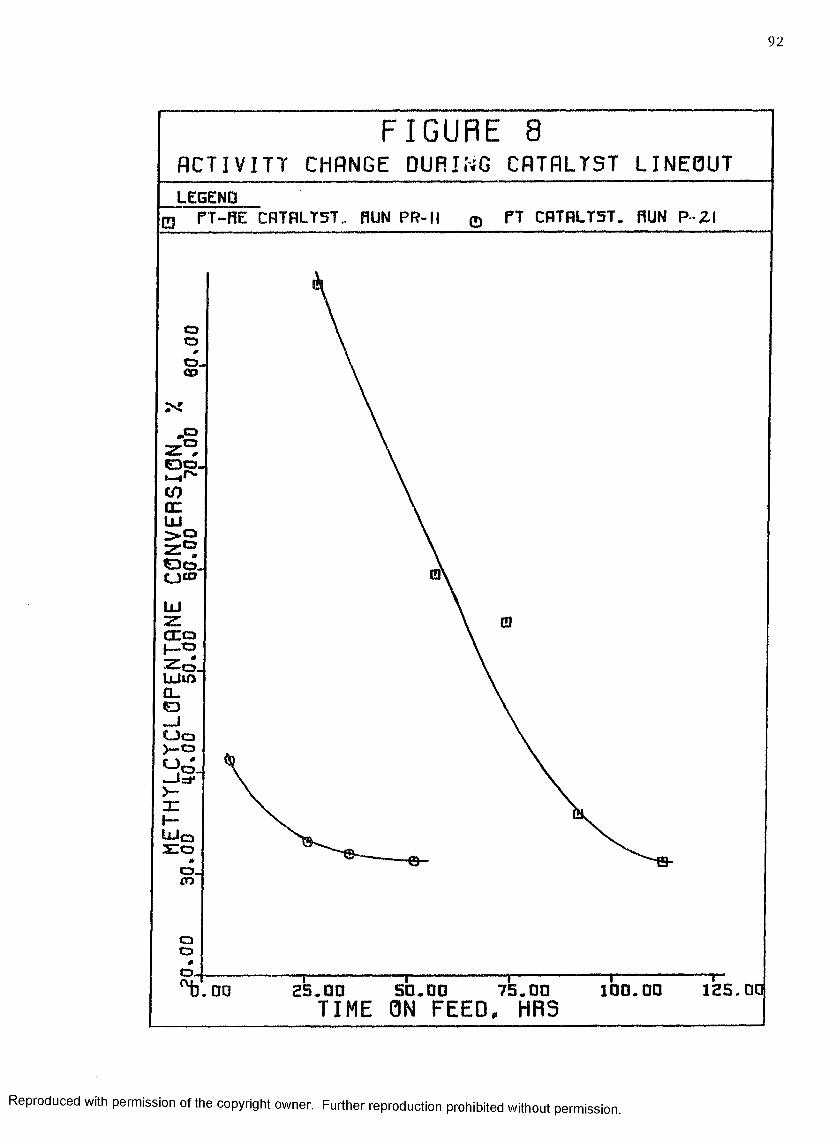
92
F I G U R E 8ACTIVITY CHANGE DURING CATALYST LINEOUTLEGEND
PT CRTRLT5T. RUN P -Z IPT-RE CRTRLT5T. RUN PR-11
ootarn
.o
CLUJ> 2Z 2
UJ
U o >— o
— In*
o _CO
QOO.
7 5 . 0 050.00TIME ON FEED, HRS 100 .00.00
Reproduced with permission of the copyright owner. Further reproduction prohibited without permission.
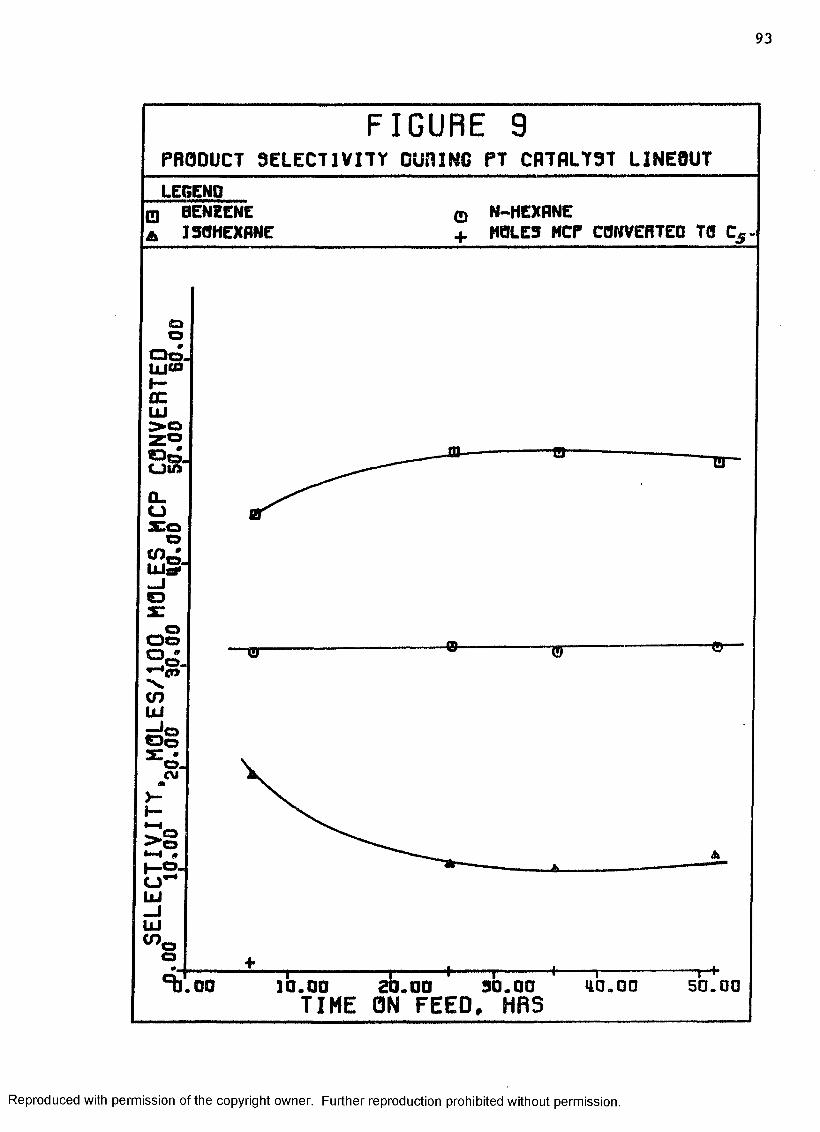
9 3
F I G U R E 9PRODUCT SELECTIVITY DURING PT CATALYST LINEOUTLEGEND
0 BENZENE A I30HEXANE
0+N-HEXANEMOLES MCP CONVERTED TO C5
Q O□o,UJ®I—ocUJ> o2°S s JQ.(J aco o
UJrfOo Oo
o *o.-v.<nUJ— J oOo"g- «o.CM *>“I—J o >•0•H # 1—0.LsJ-JUJcn—
tar -0- -QT
*^.00 1 0 . 0 0 2 0 . 0 0 ' 3 0 . 0 0 *40 .00TIME ON FEED, HRS
5 0 .0 0
Reproduced with permission of the copyright owner. Further reproduction prohibited without permission.
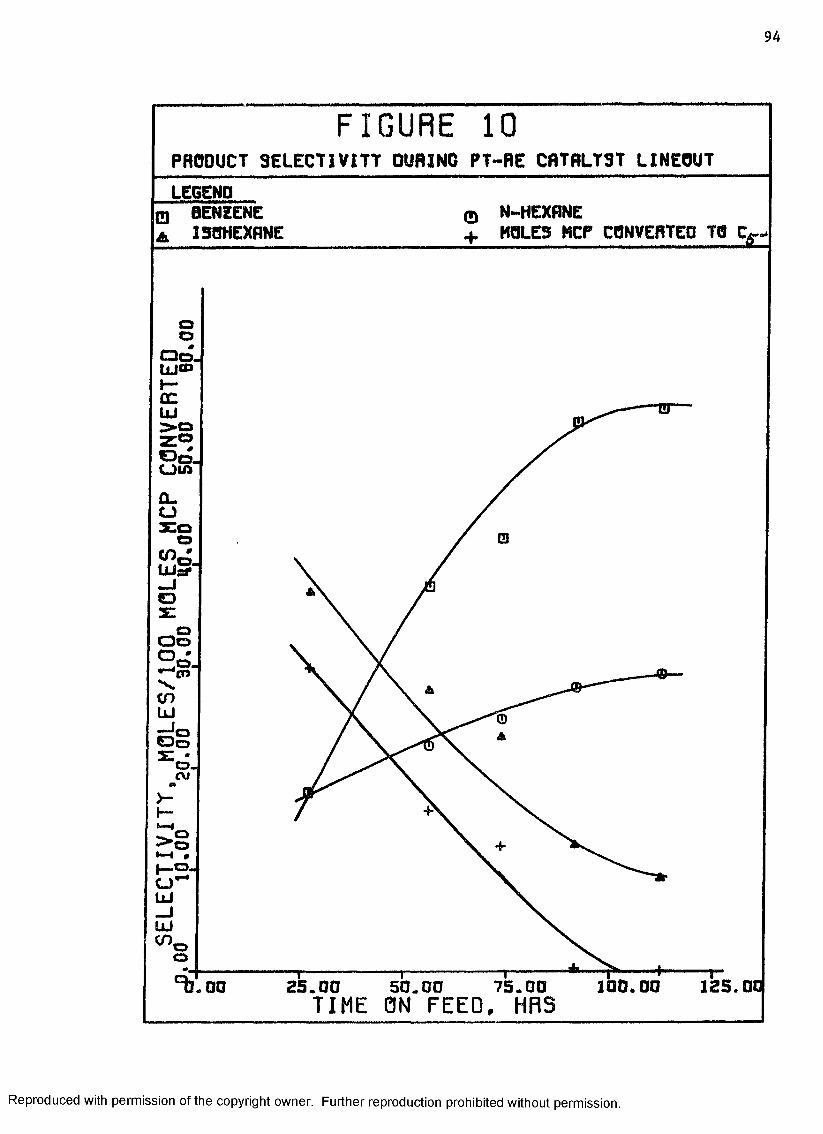
9 4
F I G U R E 1 0PRODUCT SELECTIVITY DURING PT-RE CRTRLTST LINEOUTLEGEND
N-HEXRNEHOLES MCP CONVERTED TO C*--
oo□o.UJSO
QOoo •w o -.... -a*—*~4co
CDUJIpO o
£ o .ru
UJ
oo100.00 1 2 5 . 0C2 5 . 0 0TIME 0N FEED, HRS7 5 . 0 05 0 . 0 000
Reproduced with permission of the copyright owner. Further reproduction prohibited without permission.
9 5
by the different conversion levels rather than catalyst activity. As
discussed later, this is not the case.) Detailed product compositions
are given in Table 3 for the first and last tests made during "line
out" of the Pt-Re catalyst. It is apparent from this table and Figure 10
that the catalytic sites responsible for the ring opening reactions are
the ones that have undergone the most significant deactivation.
Furthermore, it appears that one ring opening product, normal
hexane, is not as much affected by deactivation as are the isohexanes.
This result perhaps indicates that a significant part of the normal
hexane product is produced on catalytic sites different from the sites
that produce the lsohexanes. This result is in agreement with a theory(7)postulated by Smithv that ring opening occurs on two types of cata
lytic sites. On an acid-type site, reaction proceeds through a car-
bonium ion mechanism to predominately normal hexane, while on a hydro
genation-type site reaction is simply cleavage of the ring at different
locations giving a statistical Cg paraffin distribution which results(4)in 70 percent lsohexane. Another researcher has proposed that ring
opening reactions on the Pt-hydrogenation sites proceed through carbcn-
ium ions formed by heterolytic splitting of carbon-hydrogen bonds of
a saturated molecule. These carbonium ions react according to the 0
scission rule to also give a high selectivity to isohexanes. If ring
opening does indeed occur on both types of sites, one can reasonably
conclude that it is the metal hydrogenation-dehydrogenation sites that
are being preferentially deactivated over the acidic sites. Results
from Pt-poisoning experiments with sulfur support this theory in that
ring-opening products are found to decrease as Pt sites are progressively (9 )deactivated. Since the rate-limiting-step in the formation of benzene
Reproduced with permission of the copyright owner. Further reproduction prohibited without permission.

96
Table 3 : Product Distributions Obtained at Different Catalyst Age
Operating Conditions
Feed Me thy1eyelopentaneTemperature, F 800°FPressure, psig 200Moles ^/rnole MCP 10W/hr/W 2.50
Experimental Results*
Balance No. PR-11A P R - H ETime on Feed, hrs 26.7 112.2
Product Yields, moles/100 moles MCP
Methane 24.3 0.0Ethane 3.8 0.0Propane 9.8 0.0Isobutane 1.7 0.0N-butane 3.6 0.0Isopentane 5.5 0.0N-pentane 5.6 0.02 ,2-Dimethylbutane 1.5 0.02-Methylpentane 18.5 1.83-Methylpentane 12.7 1.1N-hexane 15.5 9.1Methylcyclopentane 12.1 68.8Methylcyclopentane 0.0 0.5Cyclohexane 1.0 1.4Benzene 15.4 17.2
* « Detailed data are given in Appendix B .
Reproduced with permission of the copyright owner. Further reproduction prohibited without permission.

97
from methylcyclopentane is thought to proceed on acidic as opposed to
Pt sites, still further support is given to this postulation by the fact
that the yield of benzene remains nearly constant with deactivation.
The presence of a large amount of methane in the product from the
fresh catalyst indicates that much of the C5-products result from
successive cleavage of methyl groups from paraffins produced as a
result of ring opening reactions. It is thought that this type of
reaction occurs on metal hydrogenation sites. Virtual elimination of
any C5” products from a "lined-out" catalyst is another indication that
the hydrogenation sites have undergone significant deactivation.
In another study of the kinetics of methylcyclopentane with a(o)similar Pt catalyst, Vidaurri observed initial deactivation very
similar to the type described above. In his study based on differential
reactor data, rates of formation of the isohexane decreased by a factor
of 4-5, normal hexane rate was reduced by a factor of 2 while the benzene
rate remained unchanged.
The results from this phase of the investigation should emphasize
the Importance of obtaining kinetic data on catalysts that have been
properly equilibrated. Unfortunately there are numerous kinetic studies
with methylcyclopentane reported in the literature that obviously were
made on fresh, unequilibrated catalysts as evidenced by the high selec-
tivities to isohexane products. One might question not only the value of
such data but also the conclusions, for the experimental results could
quite possibly have been complicated by changing catalyst selectivity.
C. Test for Mass Transfer Limitations
Catalytic reactions are thought to take place on the catalyst sur
face where the reactant molecule is adsorbed in some activated state.
Reproduced with permission of the copyright owner. Further reproduction prohibited without permission.
9 8
Quite obviously several steps are involved to get the reactant mole
cules from the bulk stream to the catalyst surface and back out into
the stream. As a result, chemical reaction actually consists of a
number of sequential and simultaneous steps, as described below:
a. Mass transfer of reactants from the bulk gas stream through
the boundary layer adjacent to the external surface of the catalyst
particle.
b. Diffusion of the reactant molecules into the pores of the
catalyst particle.
c. Activated adsorption of the reactant on the catalytic sites.
d. Surface reaction.
e. Desorption of the products from the catalytic sites.
f. Diffusion of the products out through the catalyst pores.
g. Mass transfer of the products through the boundary layer
surrounding the particle into the bulk stream.
Not all these steps may be important in a given reaction system.
In fact, the assumption is frequently made that one of the above steps
is so much slower than all the others that the overall rate of reaction
is equal to the rate of this slow step. Most frequently the rate-limit-
ing-step is assumed to be the surface reaction. This assumption can be
somewhat substantiated by experimentation, at least to the extent that
steps involving external mass transfer and pore diffusion are eliminated
as possible rate determining steps. The experiments in this study
designed to investigate mass transfer effects are described below.
1. External Mass Transfer
The first and last steps which must occur with reactions on
solid catalysts is molecular diffusion of reactants and products through
Reproduced with permission of the copyright owner. Further reproduction prohibited without permission.

9 9
the laminar film at the fluid-solid interface. The rate at which these
two steps occur depends upon the concentration gradient across the film
and values of the mass transfer coefficient. This second parameter is
a function of the bulk gas velocity and can be varied experimentally by
changing the feed rate. As the fluid velocity increases, the film
thickness should decrease offering less resistance to diffusion and a
higher rate of mass transfer across the film.
One can test whether the overall reaction rate is influenced
by this mode of mass transfer by varying the gas velocity through the
reactor while maintaining all other conditions constant, including
catalyst contact time. Such experiments necessitate loading the reactor
with different amounts of catalyst so that feed rate per unit weight of
catalyst remains constant. If the overall reaction rate as measured by
reactant conversion does not change with gas velocity, one can conclude
that within the range of conditions examined the external mass transfer
rate must be large compared with the rate-limiting step.
Before the experiments described below were conducted, there
was legitimate concern that external mass transfer might indeed be a
significant factor in the reaction rate. Allan^ discovered a masso (8)transfer effect with a cyclohexane feed at 900 F. Vidaurrl concluded
in his study of methylcyclopentane kinetics with a similar catalyst that
correlations for the reaction rates to methylcyclopentene and benzene
had to include a term for external mass transfer.
The Importance of external mass transfer in the reaction scheme
should be examined at those conditions corresponding to the largest
reaction rate for it is here that this step is probably most significant.
Therefore, this phase of the investigation was conducted at the highest
Reproduced with permission of the copyright owner. Further reproduction prohibited without permission.

100
temperature examined in this study-900°F. The catalyst used had been
previously equilibrated with a naphtha feed as described in Chapter III.
The experimental results are presented in Table 4 . These data indi
cate that over the range investigated mass velocity does not affect the
reaction rate. One may reasonably conclude, therefore, that at these
conditions the external mass transfer rate is faster than the rate-
limiting step. This conclusion should be valid over the range of condi
tions examined in this study because both pressure and temperature have
little effect on the mass transfer rate.
It appropriate to reconcile these experimental results
with the previously expressed concern that external mass transfer might
be rate limiting. This concern was based on results from two other(1)investigations. One of these studies was made with cyclohexane which
in general reacts at a much faster rate than methylcyclopentane. Due to
the fact that the rate-limiting-step with this reactant is faster, it
is reasonable that the rate of external mass transfer could have an
effect on the overall rate. Discrepancy with results reported in the ( 8second study is more difficult to reconcile. That particular study
was made with methylcyclopentane, a similar catalyst and at conditions
similar to those in this investigation. After reviewing the data in
that study in light of some of the observations discussed later, it
appears that some of the experimental results were not interpreted
correctly, particularly the results obtained at different feed rates.
For instance, it is concluded in that work that mass velocity effects
were present even though pore diffusion effects were calculated to be
insignificant. This cond-usion violates a general rule stated by
P e t e r s e n ^ as follows:
Reproduced with permission of the copyright owner. Further reproduction prohibited without permission.

1 0 1
Table 4 : Effect of External Maas Transfer In the CatalyticReforming of Methylcyclopentane.
Operating Conditions
Feed MethylcyclopentaneCatalyst Pt-Al20 3Catalyst Particle Size, mm 0.833-1.168Catalyst Bed Volume, cm3 25Temperature, F 900Pressure, psig 200Moles H2/mole MCP 10.1W/hr/W 13.0
Experimental Results*
Balance Mo. Mass Velocity, lbm /hr-ft2
MCP Feed MethylcyclopentaneRate, cm3/hr Conversion, %
P-13A 20.4 16.3 47.6F-13B 20.4 16.3 48.8
P-12A 38.4 30.6 53.6P-12B 38.4 30.6 53.8
P-14A 63.9 50.9 49.9P-14D 63.9 50.9 47.5
*Detailed data are given in Appendix C .
Reproduced with permission of the copyright owner. Further reproduction prohibited without permission.

102
"Whenever mass transfer external to a pellet Influences the kinetic behavior of the system, Internal mass transfer must also influence the kinetic behavior to a greater extent."
2. Pore Diffusion
By far, most of the surface area of catalysts Is located in
the interior of the particles as the wall area of the many pores that
permeate the catalyst structure. This interior surface area cannot be
utilized unless the reactants and products are continuously transferred
into and out of the pores. Because of chemical reaction in the Interior
of the catalyst, concentration gradients are established in the pores
that cause mass transfer to occur by means of diffusion. Depending upon
the reaction, catalyst, and conditions, diffusion may be one of three
types:ordinary, Knudsen, or surface diffusion.
Due to the finite rate at which diffusion occurs, the concen
tration of reactants is lower in the particle interior, with the result
that the average reaction rate will be somewhat lower than if there were
no mass transfer step. If the surface reaction step is much slower than
the pore diffusion step, however, concentration gradients will be small
and the reaction rate will not be significantly affected. On the other
hand, surface reaction rates that are fast with respect to pore diffusion
rates will result in average reaction rates that are much lower than
those calculated using bulk stream compositions.
The effect of pore diffusion on the reaction rate is taken in
to account by the use of a catalyst "effectiveness factor," that is
defined as the ratio of the actual reaction rate to the rate that would
occur if all the catalyst interior were exposed to the same conditions
that exist at the external particle surface. An "effectiveness factor"
Reproduced with permission of the copyright owner. Further reproduction prohibited without permission.

1 0 3
of 1 indicates that pore diffusion effects are insignificant while, for
instance, an "effectiveness factor" of 0.1 indicates significant pore
diffusion limitations.
The "effectiveness factor" has traditionally been correlated
with a dimensionless set of parameters that depend on the catalyst,
reaction, and experimental conditions. This dimensionless number,
commonly known as the Thiele modulus, arises out of the differential
equation describing simultaneous reaction and diffusion. An analytic
relationship can be developed between the "effectiveness factor" and the
Thiele modulus by assuming some particle geometry. For values of the
modulus less than 1.0, the "effectiveness factor" is essentially unity,
while for large values the "effectiveness factor" is Inversely related
to the modulus.
Before actually testing for the Influence of pore diffusion an
estimation of the "effectiveness factor" was made following a procedure(6)outlined by Satterfield. A modulus is defined whose value can be
determined from experimental data:
a, - R2x(Experimental reaction rate) s = Deff CO
where
$s - diffusion modulus, dimensionless
R ■ average particle radius, cm
Deff - effective diffusivity, cm2/sec.
Cs ■ reactant concentration at catalyst surface,
gm moles/cm,3
and the reaction rate is expressed as gm moles/cm3-sec. Values of this
modulus less than 1.0 correspond to an "effectiveness factor" of unity.
Reproduced with permission of the copyright owner. Further reproduction prohibited without permission.
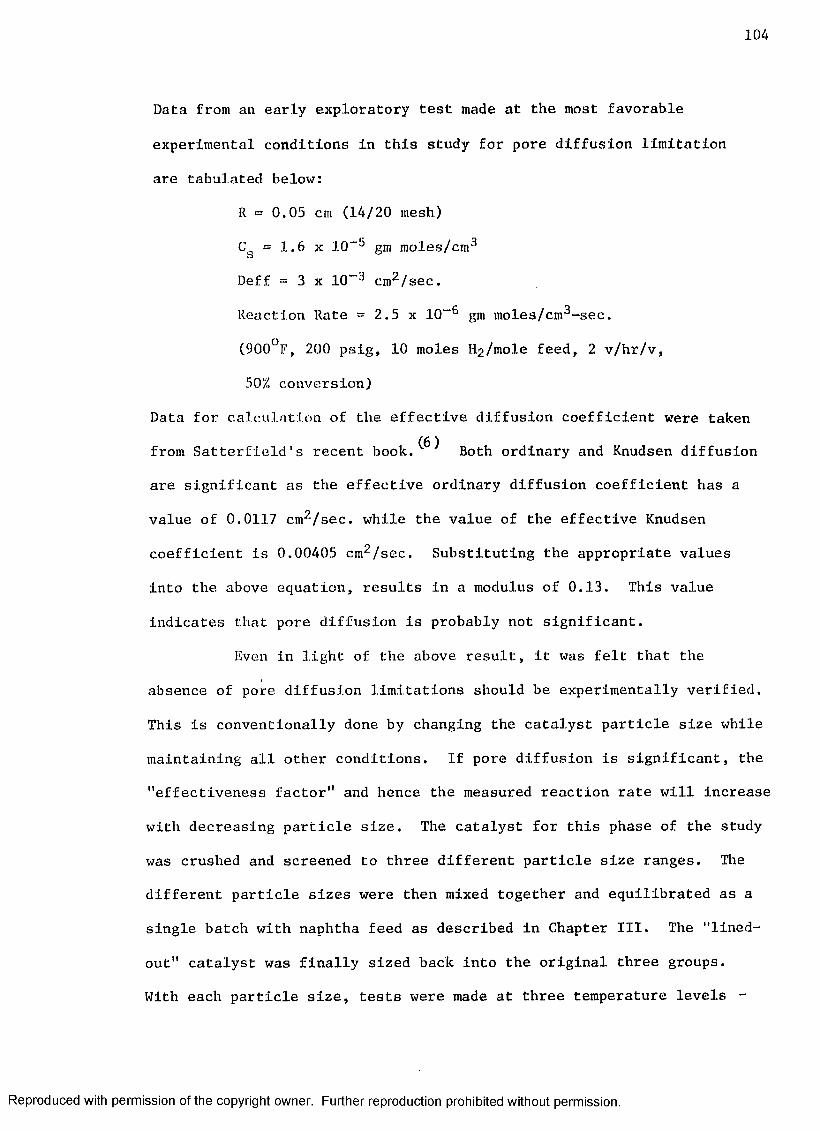
104
Data from an early exploratory test made at the most favorahle
experimental conditions in this study for pore diffusion limitation
are tabulated below:
R ■= 0.05 cm (14/20 mesh)
Cg = 1.6 x IQ-3 gm moles/cm3
Deff = 3 x 10“ 3 cm2/sec.
Reaction Rate = 2.5 x IQ-6 gm moles/cm3-sec.
(900°F, 200 psig, 10 moles H 2 /mole feed, 2 v/hr/v,
50% conversion)
Data for calculation of the effective diffusion coefficient were taken(fl )from Satterfield’s recent book. Both ordinary and Knudsen diffusion
are significant as the effective ordinary diffusion coefficient has a
value of 0.0117 cm2/sec. while the value of the effective Knudsen
coefficient is 0.00405 cm2/sec. Substituting the appropriate values
into the above equation, results in a modulus of 0.13. This value
indicates that pore diffusion is probably not significant.
Even in light of the above result, it was felt that the
absence of pore diffusion limitations should be experimentally verified.
This is conventionally done by changing the catalyst particle size while
maintaining all other conditions. If pore diffusion is significant, the
"effectiveness factor" and hence the measured reaction rate will increase
with decreasing particle size. The catalyst for this phase of the study
was crushed and screened to three different particle size ranges. The
different particle sizes were then mixed together and equilibrated as a
single batch with naphtha feed as described in Chapter III. The "lined-
out" catalyst was finally sized back into the original three groups.
With each particle size, tests were made at three temperature levels -
Reproduced with permission of the copyright owner. Further reproduction prohibited without permission.
1 0 5
800°, 850°, and 900°F. The reason for this procedure was that if pore
diffusion proved to be important, one could determine from this set of
experiments the temperature range and particle size that would have to
be used in order to avoid diffusion limitations. Little additional
effort was required to obtain the results at the two lower temperature
levels since the catalyst was already in the reactor.
Results from this part of the investigation are summarized in
Table 5 and plotted in Figure 11 . One must conclude from these data
that even at the highest temperature, 900°F, pore diffusion does not
affect the reaction rate as long as the average catalysts size is below
1 mm. The smallest particle size catalyst appears to be slightly less
active than the two other sizes as evidenced by the consistently lower
conversion level. Correcting the activity of this batch so that at
800° and 850°F it has the same activity as the other batches and then
making this same correction to the activity at 900°F does not change
the above conclusion.
In summary, the results of the mass transfer studies have
shown that within the experimental conditions of this study, neither
external mass transfer nor pore diffusion affect the rate of catalytic
reforming of methylcyclopentane. It is safe to assume, therefore, that
the results obtained in this study reflect behavior at the catalyst
surface only.
Reproduced with permission of the copyright owner. Further reproduction prohibited without permission.

1 0 6
F I G U R E UIE5T FOR PORE DIFFUSION LIH1TR7IONS - PI CRTRLT5T. 200 P31G
IEGENO□ BOO OEG.F. »I.S W/HR/W 0 850 OEG.F. 7 .B W/HR/WA 900 OEG.F. 1 3 .0 W/HR/W
oo9
oin
o•o
Z wo =*M lCD0CU J o> o
CJUJz : oCEOtr inUJCLO-IqU dy - #Z ? °>--jzi— __u j g z .in.CVJ
A
AA
© 0
©
□ 0
AVERAGE P.flR.T.ICLE 0 1 A R E T O ._JIM.
Reproduced with permission of the copyright owner. Further reproduction prohibited without permission.

Reproduced
with perm
ission of the
copyright ow
ner. Further
reproduction prohibited
without
permission.
Table 5 : Test Results for Pore Diffusion. Limitation Study
Operating Conditions
FeedCatalystCatalyst Bed Volume, cm3 Pressure, psig Moles H 2/mole MCP
Methylcyclopentane Pt-Al203 (Run P-ll lineout) 25.200.10.
Experimental Results*
Balance No. Temperature, °F W/hr/W Particle Size Average MCPRange, mm Particle Size, mm Conversion,
P-14B 800 4.2 0.833-1.168 1.000 25.1P-16B 800 4.2 0.208-0.420 0.314 25.0P-15B 800 4.2 0.074-0.147 0.110 21.8
P-14C 850 7.8 0.833-1.168 1.000 37.2P-16C 850 7.8 0.208-0.420 0.314 37.4P-15C 851 7.8 0.074-0.147 0.110 34.8
P-14A 900 13.0 0.833-1.168 1.000 49.4P-16A 900 13.0 0.208-0.420 0.314 52.8P-15A 900 13.0 0.074-0.147 0.110 48.2
Detailed data are given in Appendix C
107
LIST OF REFERENCES - CHAPTER V
1. Allan, D. E., "The Dehydrogenation and Isomerization of CyclohexaneOver a Platinum Alumina Mordenite Catalyst," Ph.D. dissertation, Department of Chemical Engineering, Louisiana State University, 1970.
2. Bryant, P. A., "Hydroisomerization of Normal Pentane Over a ZeoliteCatalyst," Ph.D. dissertation, Department of Chemical Engineering, Louisiana State University, 1966.
3. Levensplel, 0., Chemical Reaction Engineering. John Wiley and Sons,New York, New York, 1962.
4. Matsumoto, H., Saito, Y . , Yoneda, Y . , "Contrast Between Nickel andPlatinum Catalysts in Hydrogenolysls of Saturated Hydrocarbons," Journal of Catalysis, 19, 101 (1970).
5. Petersen, E. E . , Chemical Reaction Analysis, Prentlce-Hall, Inc.,Englewood Cliffs, New Jersey, 1965.
6. Satterfield, C. N . , Mass Transfer in Heterogeneous Catalysis, M.I.T.Press, Cambridge, Massachusetts, 1970.
7. Smith, R. L. , Naro, P. A. and Sllvestri, A. J., "Reaction Paths forDecycllzatlon of Methylcyclopentane Over Pt/Al203 Catalyst," Journal of Catalysis, 20, 359 (1971).
8. Vidaurri, F. C. , "The Kinetics of Methylcyclopentane Reactions Overa Platinum on n-Alumina Catalyst," Ph.D. dissertation, Department of Chemical Engineering, Texas Technological College, 1968.
9. Weisz, P. B., "Polyfunctional Heterogeneous Catalysis," Advances inCatalysis, 13. 137, Academic Press, Inc., New York, New York, 1962.
Reproduced with permission of the copyright owner. Further reproduction prohibited without permission.
CHAPTER V I
EXPERIMENTAL EFFECT OF SPACE TIME
A. Introduction
A reaction scheme for the catalytic reforming of methylcyclopentane
has been Introduced in Chapter II and developed into a kinetic model in
Chapter IV. Perhaps the safest and most simple way to investigate all
the reaction paths in this scheme is to vary the space time (contact
time) in an integral reactor at otherwise constant conditions and
observe the changing product distributions. Such a study comprises a
considerable part of the experimental program reported in this
dissertation.
There is considerable justification for obtaining the type of
experimental data described above. For one reason this kind of
information can shed light on reaction mechanisms as one is able to
observe the yields of certain reaction products and intermediates
change with increasing contact time. This kind of information is not
available from most differential reactor studies because of the
difficulty encountered in preparing feeds with compositions correspond
ing to different conversion levels. Due to the complex data analysis
problem one encounters with the integral reactor, very few studies of
contact time with this type reactor are found in the literature. Another
justification for investigating the effect of space time is that only
this type of information from an integral reactor can be used to evaluate
109
Reproduced with permission of the copyright owner. Further reproduction prohibited without permission.

110
a proposed kinetic model.
The effect of space time was investigated in this experimental
study with both the platinum (Pt) and the platlnum-rhenium (Pt-Re)
catalysts at the following conditions:
850*F
200 psig
10 moles H^/mole MCP
0.7-35.0 W/Hr/W
Both catalysts had been previously equilibrated during a long period of
operation with a naphtha feed as described in the previous chapter.
(The equilibrated Pt catalyst contained 1.3 per cent coke as opposed to
1.7 per cent for the Pt-Re catalyst). Space time was varied by changing
either the feed rate or the weight of catalyst charged to the reactor.
In the remainder of this chapter the experimental data are presented
and discussed. These same data are then used to evaluate the kinetic
model proposed in Chapter IV.
B. Effect of Space Time on Reaction Products
The experimental data obtained with the Pt-Re catalyst are presented
in Figures 12-14 in which product yields are plotted against the con
version of methylcyclopentane (MCP). Liquid feed rates were varied from
0.7 to 35.2 gms/hr-gm cat. in order to produce this conversion range,,
Figure 12 illustrates that benzene is a primary reaction product and is
produced at a constant selectivity (58 percent) over a very wide
conversion range. The line through the data does not extrapolate to
zero percent MCP conversion because of the very rapid formation of olefin
intermediates and cyclohexane which both precede benzene formation.
The yields of ring-opening products are shown in Figure 13. The
Reproduced with permission of the copyright owner. Further reproduction prohibited without permission.
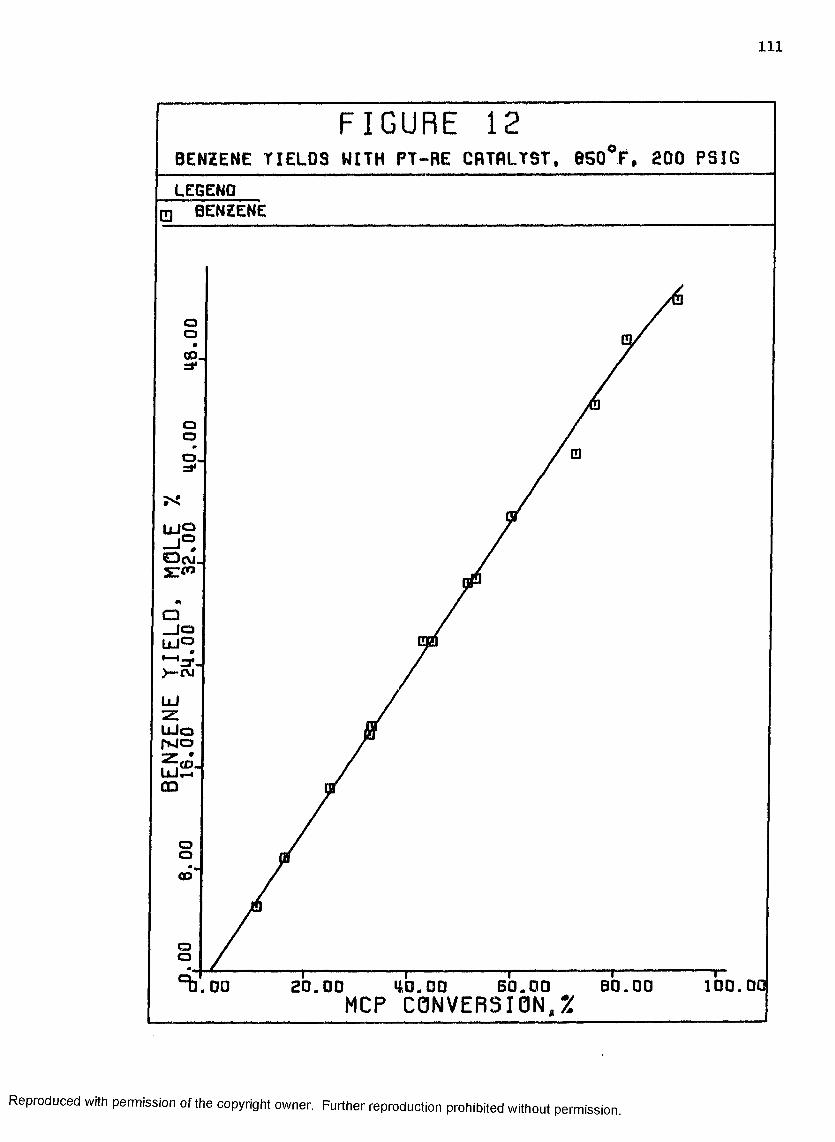
Ill
F I G U R E 1 2BENZENE YIELDS WITH PT-RE CRTBLYST, 850°F, 200 PSIG
LEGENDBENZENE
ooCO.=v
QOo .=f*
IxJ
ooCO
oQ
100.DCBO. DO20.00 40.00 60.00 MCP CONVERSION,%00
Reproduced with permission of the copyright owner. Further reproduction prohibited without permission.

112
F I G U R E 1 3PARAFFIN YIELDS WITH PT-RE CATALYST, 850°F, 200 PSIG
LEGEND2-METHYLPENTANEN-HEXRNE
3-METHYLPENTANE
oo
oomo_X <U
O qs : omCD.
( f)
CVI-
Q_
COOoo= 1*
oo100. D00 20.00 H O .00 , 6 0 .0 0
MCP CONVERSION,#
Reproduced with permission of the copyright owner. Further reproduction prohibited without permission.
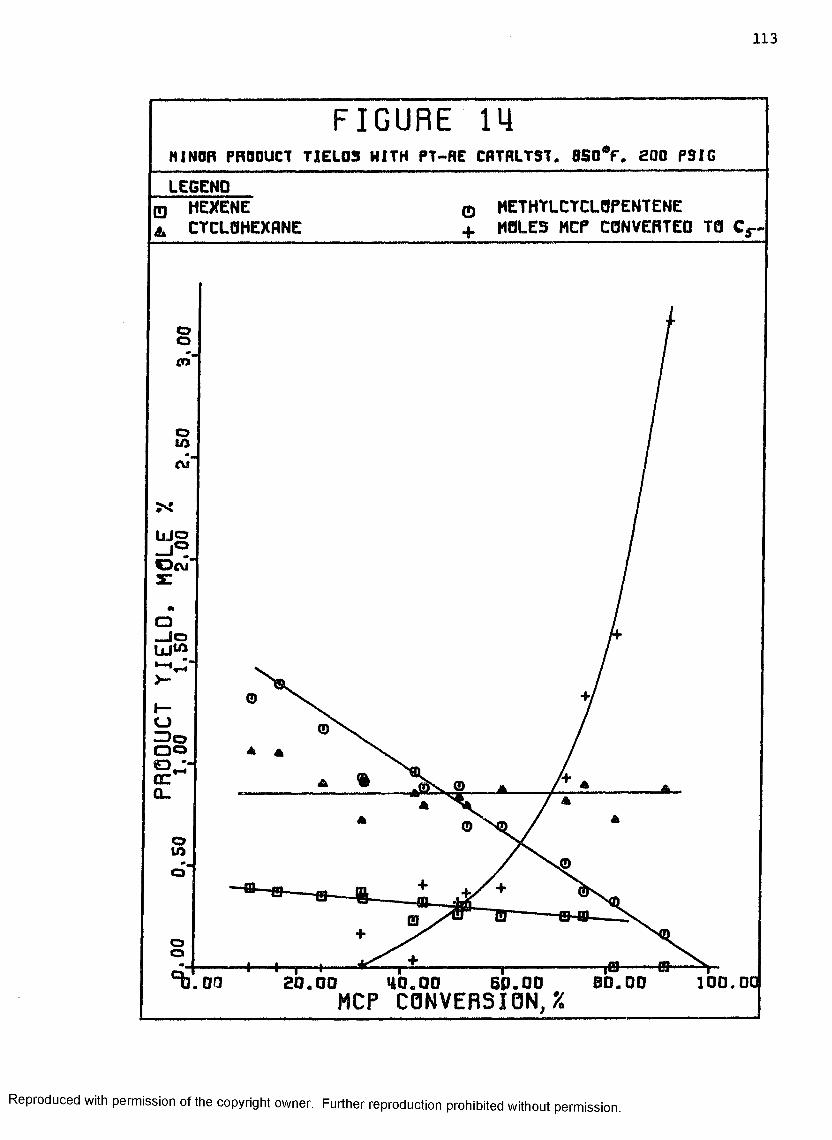
113
F I G U R E mMINOR PROOUCT T1EL03 WITH PT-RE CRTRLTST. 8SCTF. 200 P3IG
LEGEND0 METHYLCYCLOPENTENE + MOLES MCP CONVERTED TO C,
q HEXENE A CYCLOHEXflNE
oQto
tu
CCCL.
OU>o
ooBO. DO 100.0020.00 >10.00 BP. 0 0
MCP CONVERSION,K00
Reproduced with permission of the copyright owner. Further reproduction prohibited without permission.

1 1 4
major paraffin product is normal hexane. Quite obviously the reaction
rates from MCP to the different isohexanesar* much smaller as judged by
the small slope at low conversion levels. It should be re-emphasized
that this is only characteristic of an "aged" catalyst. As discussed
in Chapter V, fresh catalyst produces a significant amount of Isohexanes
because of a high initial hydrogenolysis activity. Isomerization of
n-hexane to the other Cg isomers is evident by the changing slopes of
the yield curves. The 2-methylpentane yield increases at a faster rate
probably because 2,3-dimethylbutane is included with this component
because the latter cannot be isolated on the gas chromatograph. A
final note of Interest is that even at 90 per cent MCP conversion the Cg
paraffins still have not reached equilibrium. At these conditions the
equilibrium iso-to-normal ratio is about 3 while the experimental ratio
at 90 per cent conversion is only 1.2.
Yields of some of the more significant minor products are presented
in Figure 14. Other products were present in much smaller amounts but
these were not routinely analyzed. It has been stated in earlier
chapters that methylcyclopentene is in equilibrium with MCP. This
statement is based on the data in Figure 14 which show a definite
relationship between the amount of MCP unreacted and the olefin
concentration. The latter decreases linearly as the former is converted.
It is interesting to consider the yield of methylcyclopentene at low
conversion levels typical of differential reactor studies. Obviously
this yield has to approach zero as MCP conversion approaches zero. One
would expect, however, that the rate of reaction to the olefin is
extremely fast compared with the other reactions and that equilibrium is
rapidly established. Therefore, measurement of the rate of formation of
Reproduced with permission of the copyright owner. Further reproduction prohibited without permission.

1 1 5
the olefin can only be accomplished at extremely high feed rates. The
results in Figure 14 indicate that MCP conversion must be below 10 per
cent before a meaningful measurement of the rate of formation of
methylcyclopentene can be made. At high conversions, equilibrium has
already been established. With this Information one can review the
somewhat puzzling results presented by Vidaurri ^ that have been
briefly considered in Chapter V (page 100). It was observed in that
investigation that the rate of formation of methylcyclopentene, as
measured in a differential reactor, Increased as the feed rate was
increased. From this observation it was concluded that external mass
transfer was limiting the reaction rate. Since MCP conversions in that
study were near 10 per cent, it appears that a more probable explanation
of the rate observation is that methylcyclopentene was present in
equilibrium amounts with the MCP feed. As the feed rate was substan
tially increased, only a relatively small decrease in MCP concentration
occurred. As a result, nearly the same amount of the olefin was present
at the higher feed rate. The differential reaction rate calculated from
FAXr = ---W
where F « feed rate
AX'■ conversion
5? ■ catalyst weight
would, therefore, indicate a higher but meaningless reaction rate. This
is probably but one example of difficulties that can be encountered with
differential reactor studies.
The yield of cyclohexane as shown in Figure 14 is constant over
nearly the entire conversion range. A possible explanation for this
somewhat surprising result is that cyclohexane is in equilibrium with the
Reproduced with permission of the copyright owner. Further reproduction prohibited without permission.

1 1 6
reaction intermediate cyclohexene. A constant amount of the latter
compound conceivably exists throughout the reactor because its
formation and disappearance rates are nearly equal. It has been
consistently observed in this study that as the catalyst "ages" the
yield of cyclohexane at a given set of conditions increases slightly.
An explanation consistent with the above mechanism exists. As metal
catalytic sites responsible for the dehydrogenation of cyclohexene to
benzene deactivate^ a larger concentration of the former compound builds
up causing the equilibrium amount of cyclohexane to also increase.
Yield of hexene is low and nearly constant as indicated by the
data in Figure 14. As the concentration of Cg paraffins all increase
with conversion, it is obvious that hexene is not in equilibrium with
the saturated compounds for its yield would also increase with conver
sion. This is a startling observation in light of the fact that
hydrogenation of olefins is an extremely rapid reaction when compared
with normal reforming reactions. Another interesting observation is
that nearly all the hexene product is hexene-2 as opposed to other Cg
olefins such as hexene-1 or hexene-3. In fact, the product from a
balance made at 900°F and 100 psig, conditions which favor olefin
formation, was submitted for a detailed analysis. Over 90 per cent of
the hexene yield was found to hexene-2 . This same result was found with
other samples. One normally assumes that the reaction between the
normal hexene isomers is so rapid that equilibrium nearly always exists.
The findings in this study cast doubt on this assumption, at least when
a well-aged catalyst is involved.
The other yield plotted in Figure 14 represents the amount of MCP
that is converted to C 5” products. These products are a result of
Reproduced with permission of the copyright owner. Further reproduction prohibited without permission.
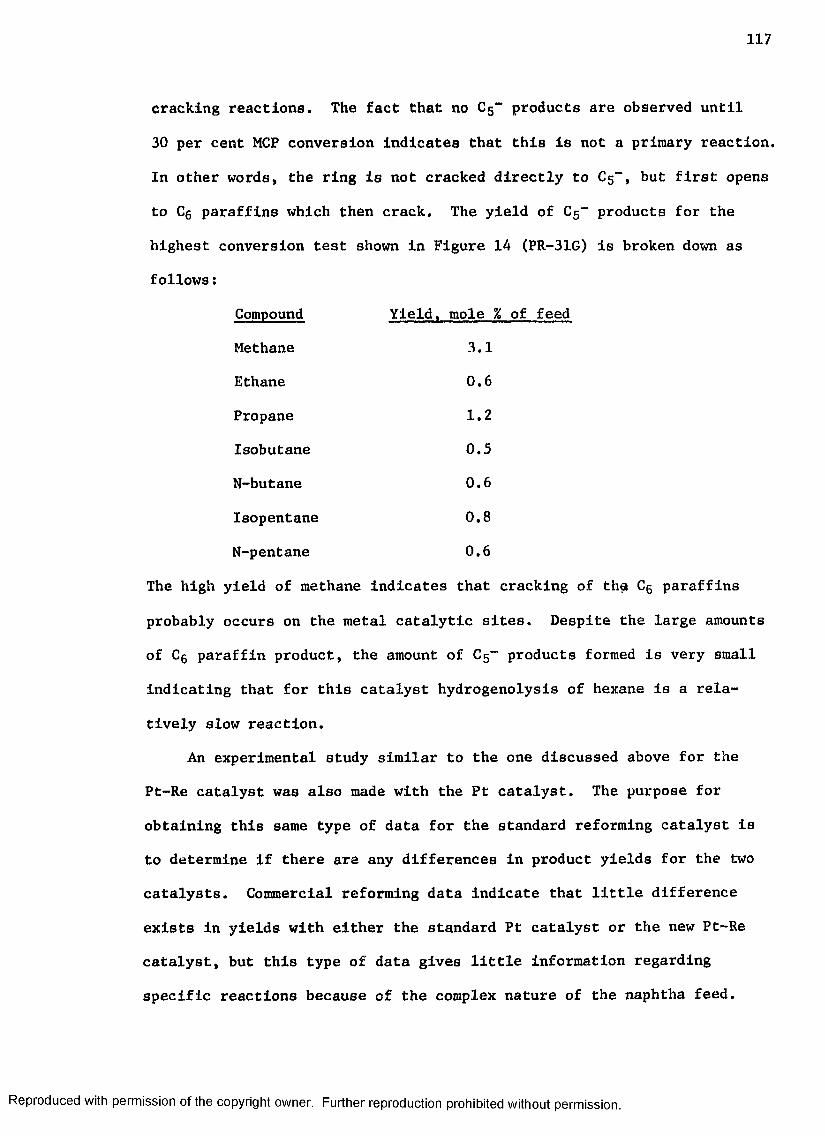
1 1 7
cracking reactions. The fact that no 05“ products are observed until
30 per cent MCP conversion indicates that this is not a primary reaction.
In other words, the ring is not cracked directly to Cs-", but first opens
to Cg paraffins which then crack. The yield of 05“ products for the
highest conversion test shown in Figure 14 (PR-31G) is broken down as
follows:
Compound Yield, mole !
Methane 3.1
Ethane 0.6
Propane 1.2
Isobutane 0.5
N-butane 0.6
Isopentane 0.8
N-pentane 0.6
The high yield of methane indicates that cracking of the Cg paraffins
probably occurs on the metal catalytic sites. Despite the large amounts
of Cg paraffin product, the amount of C5” products formed is very small
indicating that for this catalyst hydrogenolysis of hexane is a rela
tively slow reaction.
An experimental study similar to the one discussed above for the
Pt-Re catalyst was also made with the Pt catalyst. The purpose for
obtaining this same type of data for the standard reforming catalyst is
to determine if there are any differences in product yields for the two
catalysts. Commercial reforming data indicate that little difference
exists in yields with either the standard Pt catalyst or the new Pt-Re
catalyst, but this type of data gives little information regarding
specific reactions because of the complex nature of the naphtha feed.
Reproduced with permission of the copyright owner. Further reproduction prohibited without permission.
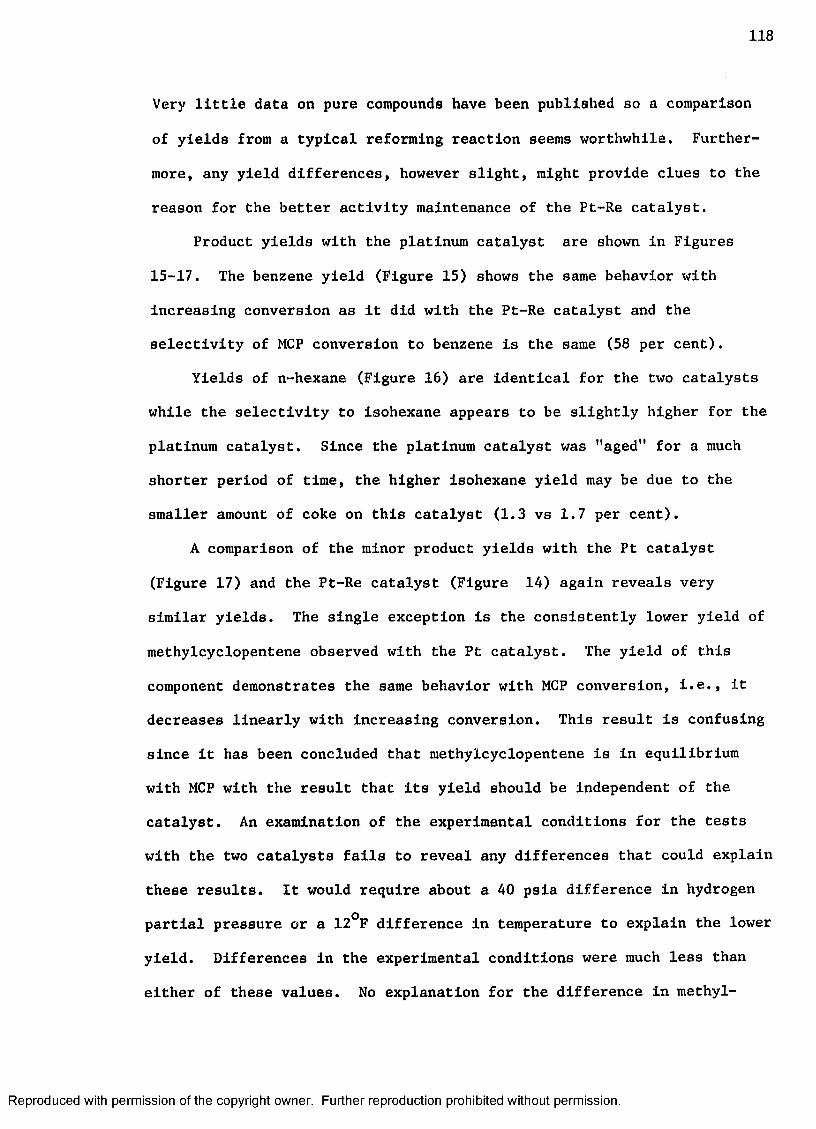
1 1 8
Very little data on pure compounds have been published so a comparison
of yields from a typical reforming reaction seems worthwhile. Further
more, any yield differences, however slight, might provide clues to the
reason for the better activity maintenance of the Pt-Re catalyst.
Product yields with the platinum catalyst are shown in Figures
15-17. The benzene yield (Figure 15) shows the same behavior with
increasing conversion as it did with the Pt-Re catalyst and the
selectivity of MCP conversion to benzene is the same (58 per cent).
Yields of n-hexane (Figure 16) are identical for the two catalysts
while the selectivity to lsohexane appears to be slightly higher for the
platinum catalyst. Since the platinum catalyst was "aged" for a much
shorter period of time, the higher isohexane yield may be due to the
smaller amount of coke on this catalyst (1.3 vs 1.7 per cent).
A comparison of the minor product yields with the Pt catalyst
(Figure 17) and the Pt-Re catalyst (Figure 14) again reveals very
similar yields. The single exception is the consistently lower yield of
methylcyclopentene observed with the Pt catalyst. The yield of this
component demonstrates the same behavior with MCP conversion, i.e., it
decreases linearly with increasing conversion. This result is confusing
since it has been concluded that methylcyclopentene is in equilibrium
with MCP with the result that its yield should be independent of the
catalyst. An examination of the experimental conditions for the tests
with the two catalysts falls to reveal any differences that could explain
these results. It would require about a 40 psla difference in hydrogen
partial pressure or a 12°F difference in temperature to explain the lower
yield. Differences in the experimental conditions were much less than
either of these values. No explanation for the difference in methyl-
Reproduced with permission of the copyright owner. Further reproduction prohibited without permission.
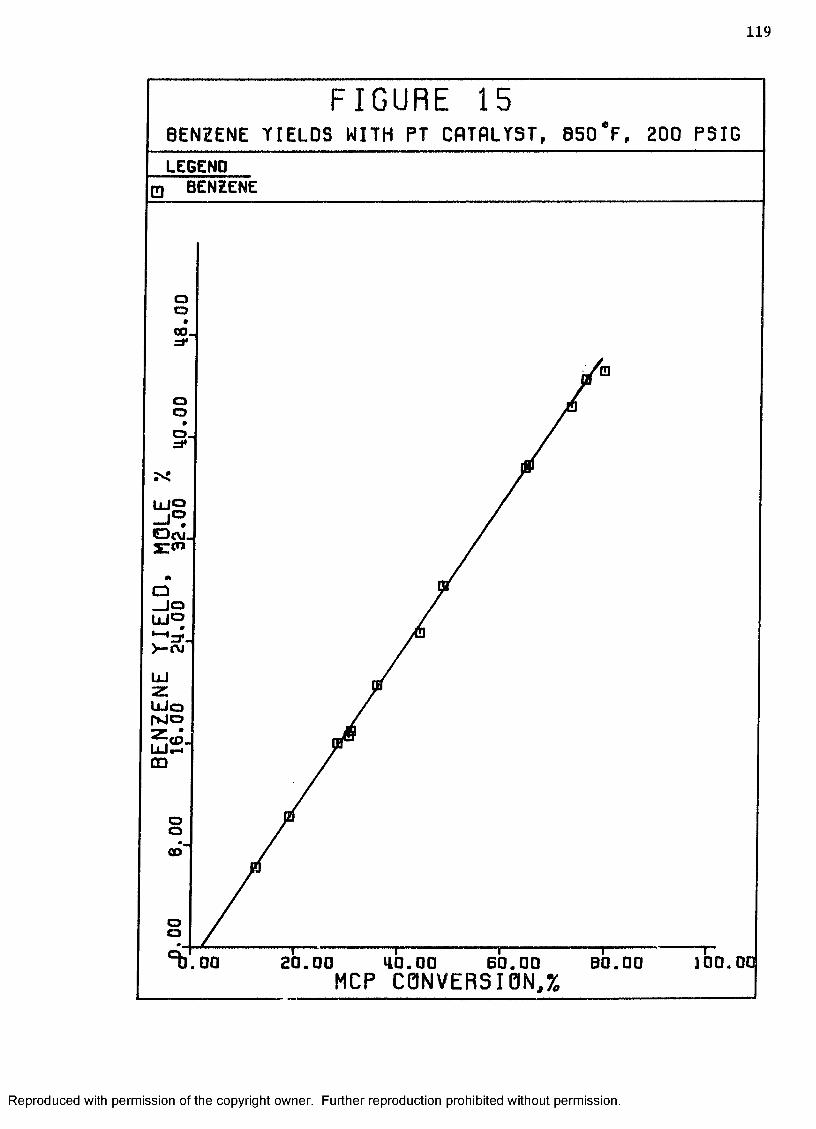
1 1 9
F I G U R E 1 5BENZENE YIELDS WITH PT CATALYST, 850®F, 200 PSIGLEGEND
BENZENE
oo00-
ooO -=f
ooCO
oo
100.0.00 20.00 B 0 .004 0 . 0 0MCP CONVERSION^
6 0 . 0 0
Reproduced with permission of the copyright owner. Further reproduction prohibited without permission.

120
F I G U R E 1 6PARAFFIN YIELDS WITH PT CATALYST, 8S0°F, 200 PSTG
LEGEND2-METHTLPENTANED N-HEXANE
A 3-METHYLPENTRNE
oo
ooO J(M
yj— loO o
COo
oQsH
OO
.00 4 0 .0 0 6 0 .0 0 MCP CONVERSION,X
Reproduced with permission of the copyright owner. Further reproduction prohibited without permission.

121
F I G U R E 1 7HINOR PRODUCT YIELDS WITH PT CATALYST. BSO°F. 20D PSIG
METHYLCYCLOPENTENE HOLES MCP CONVERTED TO Cj-
HEXENECYCLOHEXANE
oQ
Oin
LUj o
h-O3 oQ O
azQ_
oWo
oQ
300.0D O 2 0 . 0 0 >40.00MCP CONVERSION, %
60.00 B0. DO
Reproduced with permission of the copyright owner. Further reproduction prohibited without permission.

122
cyclopentene yields is apparent. These results do not change the
mathematical significance of assuming equilibrium since a linear
relationship between MCP and its unsaturated counterpart exists for both
catalysts. Since the absolute difference in methylcyclopentene yield is
very small (< 0.3 mole percent)*am1 average value for the two catalysts
has been used to calculate the equilibrium constant Kj given in Table 2
(page 67). This section is concluded with the now obvious statement
that yields obtained from reforming MCP with either Pt or Pt-Re catalysts
are practically the same at 850°F and 200 psig.
C. Evaluation of Kinetic Model
The kinetic model developed in Chapter IV for the catalytic reform
ing of MCP is shown in the simplified diagram, below:
ZZ MCPB,z
Solving the set of first order Langmuir-Hinshelwood reaction rate
equations for this reaction scheme results in a set of complex algebraic
equations which give the four product yields as a function of the rate
constants, space time, and initial concentration
yt - £*_(£, 0. Yq) (56)where
» mole fraction of component 1 in product^hydrogen-free basis
K = set of rate constants
YQ “ set of initial concentrations
0 » space time, 1/w/hr/w.
Reproduced with permission of the copyright owner. Further reproduction prohibited without permission.
1 2 3
The assumptions Inherent In this model are
• Langmuir-Hlnshelwood kinetics apply (first order reactions).
No particular rate controlling step specified.
• Dynamic adsorption equilibrium constants for all hydrocarbon
components are nearly equal.
• Steady state approximation can be made with cyclohexene (cyclo
hexane), as well as iso and normal hexenes.
e Equilibrium between methylcyclopentane and methylcyclopentene
exists.
In addition to these assumptions about the reaction mechanism, it is also
assumed that the reactor is plug flow and isothermal with a constant
hydrogen partial pressure down its length. Experimental data show that\
these latter assumptions are closely approximated.
The validity of the kinetic model described above can only be
established by comparing its predictions with actual experimental data.
At constant temperature, pressure, hydrogen diluent ratio and initial
composition, the model is a function of only space time. Therefore,
experimental data in which only the space time is varied should provide
the most straightforward test of the model's validity.
Since this is a complex reaction model, no simple graphical means
of testing the model is available such as one uses to test whether a
reaction is first order. Instead, two approaches can be taken. One can
calculate reaction rate constants from the experimental yields obtained
at different space times by using the kinetic model under consideration.
(A procedure for evaluating the rate constants has been discussed in
Chapter IV). If the rate constants do not vary with contact time, then
it is safe to assume that the model is valid. Another perhaps simpler
Reproduced with permission of the copyright owner. Further reproduction prohibited without permission.

1 2 4
approach Is to compare the experimental yields with those predicted by
the kinetic model at the same space time. Both of these methods are
used below.
Before any decision can be made as to whether the rate constants
are actually constant over a wide conversion range, one needs to know
something about the precision with which rate constants can be deter
mined. This information can come from a series of experiments repeated
at the same experimental conditions such as those reported in Table 6.
These tests were made with the same type of catalyst, at a constant
catalyst age, and at the same reactor conditions. There was a con
siderable length of time, however, between each test. Furthermore,
these tests represent 5 separate charges of the same catalyst, so any
imprecision due to the method of putting the catalyst into the reactor
will be included in the results. Actually the mass velocity and catalyst
particle size are different in these tests, but it has been concluded in
Chapter V that these parameters are irrelevant since mass transfer
effects are absent. Since all other reaction parameters are the same,
the test results reflect only the precision of the data. Calculated
rate constants are tabulated for each test in Table 6. Also included in
the table are estimates of the standard deviation and variance of each
rate constant. The standard deviation is expressed as a percentage of
the mean value as well. The reproducibility data shown in Table 6 were
obtained at a different temperature than the data for the space time
study and, therefore, have different values for the rate constants. This
should not present any difficulty if one uses the standard deviation
expressed as a percentage of the mean value as the estimate for data
precision. For results in Table 6 the standard deviation of the rate
Reproduced with permission of the copyright owner. Further reproduction prohibited without permission.

1 2 5
Table 6: Precision of the Experimental Rate Constants
Operating Conditions
Catalyst Q Pt-Al20 3Temperature, F 900Pressure, psig 200Moles H2/mole MCP 10.1Space Time, w/hr/w 13.0
Experimental Results
Rate Constants, gm moles/hr-gm cat-atm (X103)
Balance No.
ka ^ kc kdP-12A 60.68 15.60 29.06 11.09P-12B 60.44 17.26 40.33 10.48P-13A 48.54 15.65 30.30 9.24P-13B 51.87 14.97 30.67 10.20P-14A 50.64 19.00 27.58 9.19P-14D 44.37 18.36 31.31 8.98P-15A 45.76 18.95 26.65 8.74P-16A 55.72 20.71 34.53 9.30
Statistical Parameters
ka \ kc kd
Mean, k X103 52.25 17.56 31.30 9.65
Variance, S2X106 39.31 4.12 19.12 0.69
Standard Deviation, SX103 6.27 2.03 4.37 0.83
Percentage Standard Deviation, 12.0 11.6 14.0 8.6s/fcxioo
Reproduced with permission of the copyright owner. Further reproduction prohibited without permission.
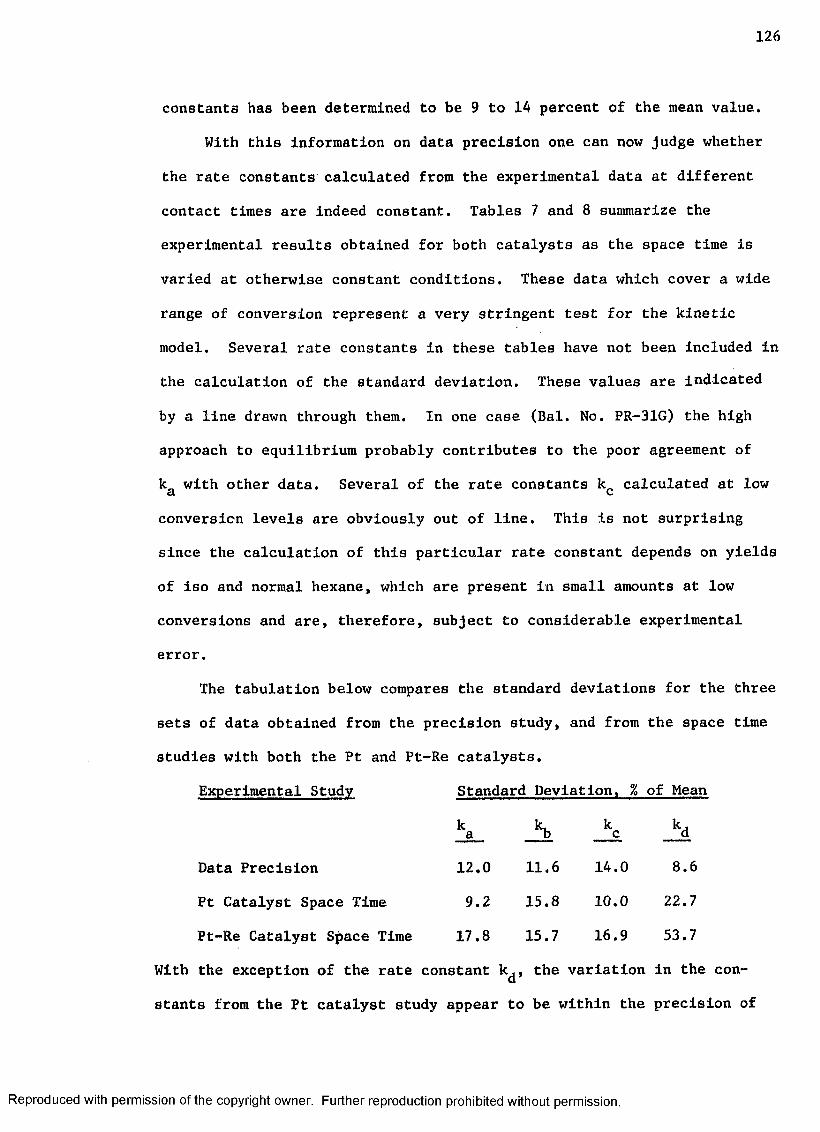
1 2 6
constants has been determined to be 9 to 14 percent of the mean value.
With this information on data precision one can now judge whether
the rate constants calculated from the experimental data at different
contact times are indeed constant. Tables 7 and 8 summarize the
experimental results obtained for both catalysts as the space time is
varied at otherwise constant conditions. These data which cover a wide
range of conversion represent a very stringent test for the kinetic
model. Several rate constants in these tables have not been included in
the calculation of the standard deviation. These values are indicated
by a line drawn through them. In one case (Bal. No. PR-31G) the high
approach to equilibrium probably contributes to the poor agreement of
k„ with other data. Several of the rate constants k„ calculated at lowa C
conversion levels are obviously out of line. This is not surprising
since the calculation of this particular rate constant depends on yields
of iso and normal hexane, which are present in small amounts at low
conversions and are, therefore, subject to considerable experimental
error.
The tabulation below compares the standard deviations for the three
sets of data obtained from the precision study, and from the space time
studies with both the Pt and Pt-Re catalysts.
Experimental Study Standard Deviation, % of Mean
ka A k__c J^d
Data Precision 12.0 11.6 14.0 8.6
Pt Catalyst Space Time 9.2 15.8 10.0 22.7
Pt-Re Catalyst Space Time 17.8 15.7 16.9 53.7
With the exception of the rate constant kj, the variation in the con
stants from the Pt catalyst study appear to be within the precision of
Reproduced with permission of the copyright owner. Further reproduction prohibited without permission.
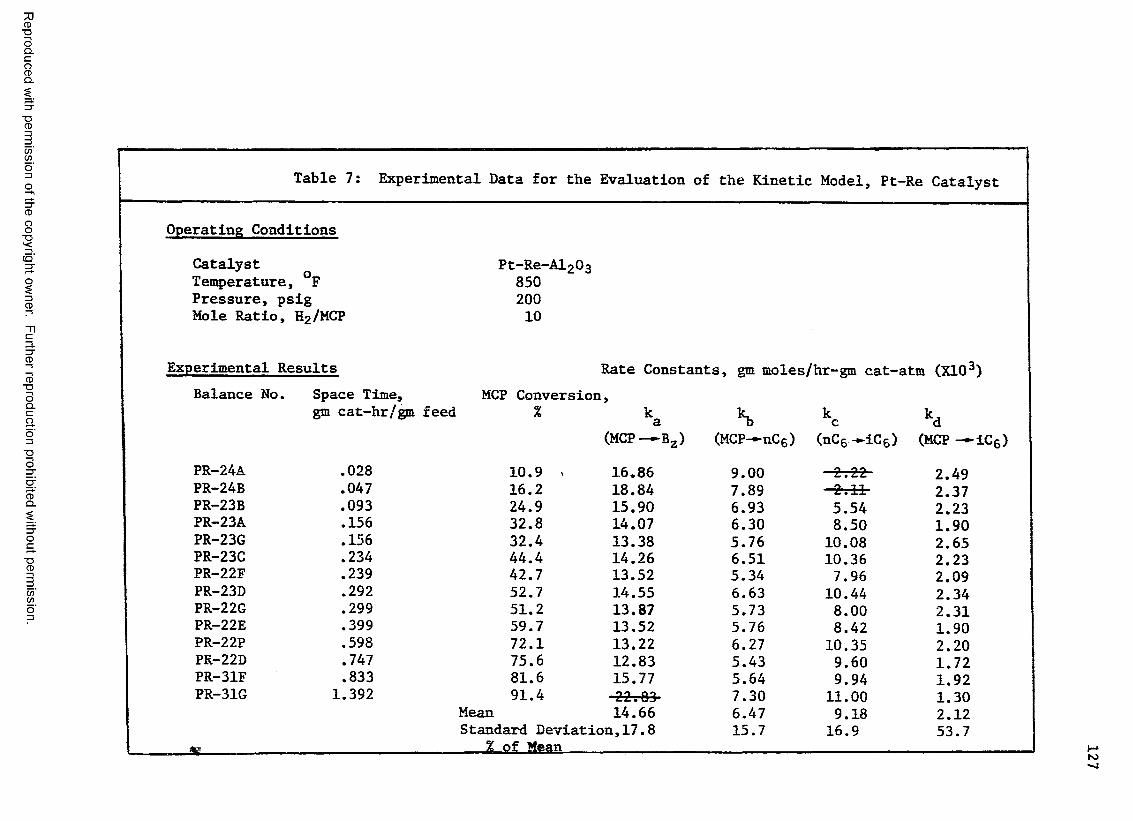
Reproduced
with perm
ission of the
copyright ow
ner. Further
reproduction prohibited
without
permission.
Table 7: Experimental Data for the Evaluation of the Kinetic Model, Pt-Re Catalyst
Operating Conditions
Catalyst Pt—Re—AI2O 3Temperature, °F 850Pressure, psig 200Mole Ratio, H 2/MCP 10
Experimental Results Rate Constants, gm moles/hr-gm cat-atm (X103)Balance No. Space Time, MCP Conversion,
gm cat-hr/gm feed % ka kc kd(MCP-~BZ) (MCP-o-nCg) (nCg -►iCg) (MCP — iC6)
PR-24A .028 10.9 » 16.86 9.00 -■2.22 2.49PR-24B .047 16.2 18.84 7.89 -2-. 11 2.37PR-23B .093 24.9 15.90 6.93 5.54 2.23PR-23A .156 32.8 14.07 6.30 8.50 1.90PR-23G .156 32.4 13.38 5.76 10.08 2.65PR-23C .234 44.4 14.26 6.51 10.36 2.23PR-22F .239 42.7 13.52 5.34 7.96 2.09PR-23D .292 52.7 14.55 6.63 10.44 2.34PR-22G .299 51.2 13.87 5.73 8.00 2.31PR-22E .399 59.7 13.52 5.76 8.42 1.90PR-22P .598 72.1 13.22 6.27 10.35 2.20PR-22D .747 75.6 12.83 5.43 9.60 1.72PR-31F .833 81.6 15.77 5.64 9.94 1.92PR-31G 1.392 91.4 -23^83 7.30 11.00 1.30
Mean 14.66 6.47 9.18 2.12Standard Deviation,17.8 15.7 16.9 53.7
* ......- % of Mean 127

Reproduced
with perm
ission of the
copyright ow
ner. Further
reproduction prohibited
without
permission.
Table 8: Experimental Data for the Evaluation of the Kinetic Model, Pt Catalyst
Operating Conditions
Catalyst A Pt-Al20 3Temperature , °F 850Pressure, psig 200Mole Ratio, h 2/m c p 10
Experimental Results' Rate Constants, gm moles/hr-gm cat--atm (X103)
Balance No. Space Time MCP Conversion,gm cat-hr/gm feed % ka \ , kc kd
(MCP— Bz) (MCP— nC5) (nC6 — iC6) (MCP— iC6)
P-24A .032 12.6 18.31 9.45 —24.67 3.03P-23B .056 19.1 18.21 8.71 10.73 3.44P-23A .112 30.8 17.00 8.33 9.43 3.21P-23G .112 28.2 15.45 6.61 9.18 2.95P-23S .112 30.4 16.31 8.04 8.80 3.33P-23C .168 35.9 14.09 5.98 10.43 2.81P-22C .200 48.5 18.37 7.79 8.91 3.56P-23D .209 44.0 14.47 6.75 11.73 3.12P-22E .335 64.2 18.05 7.59 11.17 3.32P-22(j> .401 64.8 15.92 6.37 9.72 3.25P-22F .502 73.1 16.97 6.82 10.06 3.19P-22D .627 75.8 14.70 5.38 8.60 2.82P-22P .627 79.4 17.35 6.97 10.24 3.17
Mean 16.55 7.29 9.92 3.17Standard Deviation, 9.2 15.8 10.0 22.7
% of Mean 128
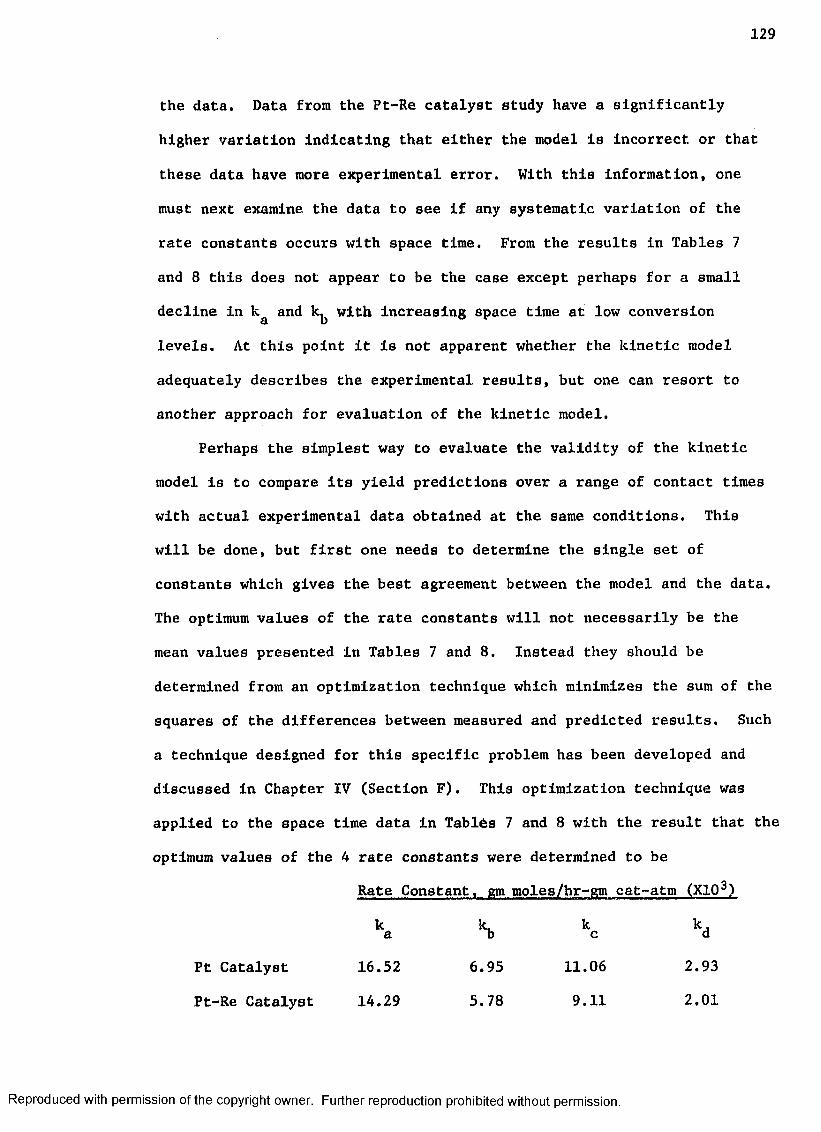
1 2 9
the data. Data from the Pt-Re catalyst study have a significantly
higher variation indicating that either the model is incorrect or that
these data have more experimental error. With this Information, one
must next examine the data to see if any systematic variation of the
rate constants occurs with space time. From the results in Tables 7
and 8 this does not appear to be the case except perhaps for a small
decline in kfl and with increasing space time at low conversion
levels. At this point it is not apparent whether the kinetic model
adequately describes the experimental results, but one can resort to
another approach for evaluation of the kinetic model.
Perhaps the simplest way to evaluate the validity of the kinetic
model is to compare its yield predictions over a range of contact times
with actual experimental data obtained at the same conditions. This
will be done, but first one needs to determine the single set of
constants which gives the best agreement between the model and the data.
The optimum values of the rate constants will not necessarily be the
mean values presented in Tables 7 and 8. Instead they should be
determined from an optimization technique which minimizes the sum of the
squares of the differences between measured and predicted results. Such
a technique designed for this specific problem has been developed and
discussed in Chapter IV (Section F). This optimization technique was
applied to the space time data in Tables 7 and 8 with the result that the
optimum values of the 4 rate constants were determined to be
Rate Constant, gm moles/hr-gm cat-atm (X103)
ka kb kc kd
Pt Catalyst 16.52 6.95 11.06 2.93
Pt-Re Catalyst 14.29 5.78 9.11 2.01
Reproduced with permission of the copyright owner. Further reproduction prohibited without permission.

1 3 0
With these rate constants one can use the kinetic model to generate
yield-spaca time curves for each reacting component which can be
compared with the experimentally determined yields. Such a comparison
is made for the Pt-Re catalyst in Figure 18 and for the Pt catalyst in
Figure 19. It is evident from these figures that the model does a
remarkable job of predicting product yields at different contact times.
A better way to determine how well the kinetic model predicts the
yield data is to calculate multiple correlation coefficients for each
product. These coefficients are defined by the equation
N N. 2 i!i < n r V 2 - w (yij~4’ii)2Rj ■ N2 (y-n-y.,)2
i«i J J
where
y^j *■ experimental yield of component j in test i
y"j « average yield of component j in all tests
“ predicted yield of component j in test i
N *» number of tests
Rj = yield correlation coefficient for component j.
Correlation coefficients indicate how well the data are correlated by
the kinetic model. A coefficient of one represents a perfect
correlation while a value of zero indicates no correlation.
Multiple correlation coefficients for each of the four major
reacting components in the reforming of MCP have been calculated for the
tests presented in Tables 7 and 8 and the results shown in Figures 18
and 19. The results shown on the following page confirm the previous
statement that the kinetic model adequately correlates the experimental
effect of contact time.
Reproduced with permission of the copyright owner. Further reproduction prohibited without permission.
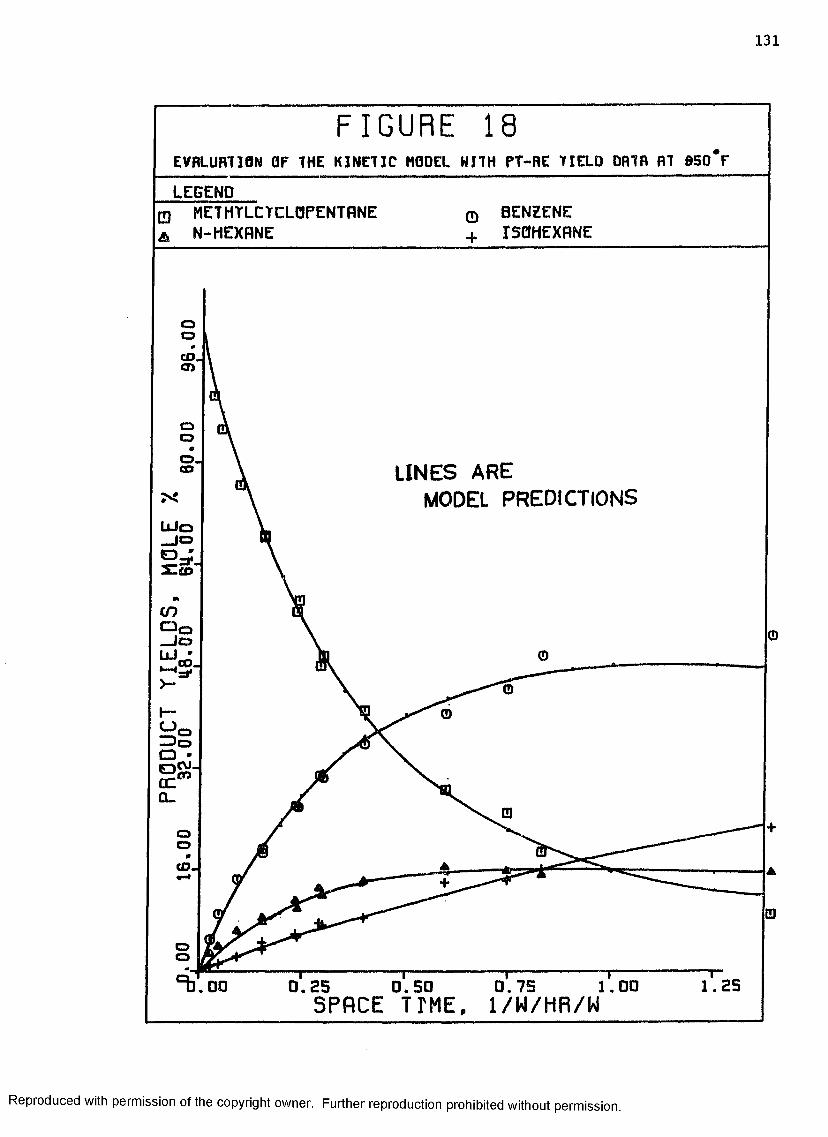
1 3 1
F I G U R E 1 8EVRLUR710N OF THE KINETIC MODEL HJTH PT-RE TIELD DRTR AT 850 F
LEGENDMETHTLCTCLOFENTflNEN-HEXHNE
ooco.cn
ooo.CD LINES ARE
MODEL PREDICTIONS
coQ oJ oUJ '. .CP- *^=1* >-
ooCO.
oQ
0 . 2 5 0 . 7 5 1.000 . 5 0SPACE TTME, 1/H/HR/W
Reproduced with permission of the copyright owner. Further reproduction prohibited without permission.

1 3 2
F I G U R E 1 9EVALUATION OF THE K IN E T IC MODEL WITH PT Y IE LD DATA
LEGENDMETHTLCTCLQPENTANEN-HEXANE
ooCD.CTi
QO
CD LINES AREMODEL PREDICTIONS
co□ o_JOUJ *““ CO..
OOCO.
OO0 . 6 0 0. 750 .U 50 . 1 5 0 . 3 0
SPACE TIME, 1/H/HR/W
Reproduced with permission of the copyright owner. Further reproduction prohibited without permission.
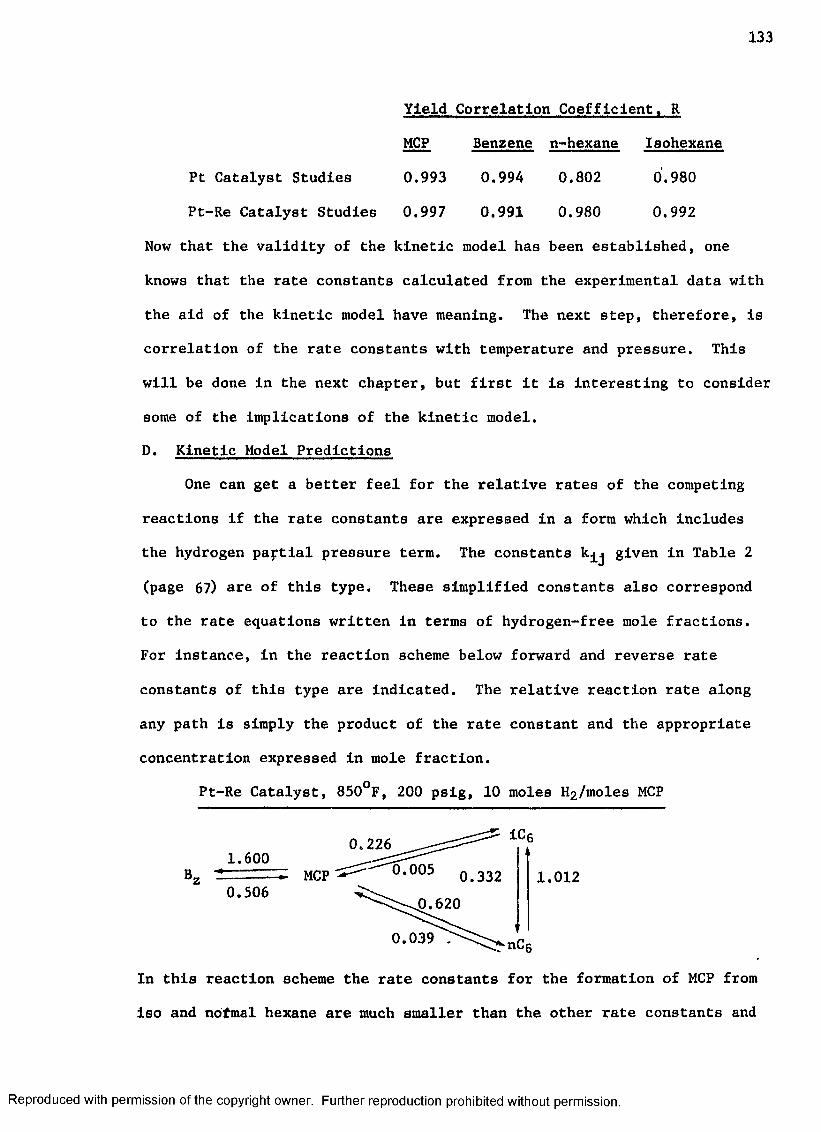
1 3 3
Yield Correlation Coefficient. R
MCP Benzene n-hexane Isohexane
Pt Catalyst Studies 0.993 0.994 0.802 0.980
Pt-Re Catalyst Studies 0.997 0.991 0.980 0.992
Now that the validity of the kinetic model has been established, one
knows that the rate constants calculated from the experimental data with
the aid of the kinetic model have meaning. The next step, therefore, is
correlation of the rate constants with temperature and pressure. This
will be done in the next chapter, but first it is interesting to consider
some of the implications of the kinetic model.
D. Kinetic Model Predictions
One can get a better feel for the relative rates of the competing
reactions if the rate constants are expressed in a form which includes
the hydrogen partial pressure term. The constants k^j given in Table 2
(page 67) are of this type. These simplified constants also correspond
to the rate equations written in terms of hydrogen-free mole fractions.
For instance, in the reaction scheme below forward and reverse rate
constants of this type are indicated. The relative reaction rate along
any path is simply the product of the rate constant and the appropriate
concentration expressed in mole fraction.
Pt-Re Catalyst, 850°F, 200 psig, 10 moles I^/moles MCP
1CG0.2260.005 o.332MCP 1.012
0.620
0.039 .
In this reaction scheme the rate constants for the formation of MCP from
iso and nofmal hexane are much smaller than the other rate constants and
Reproduced with permission of the copyright owner. Further reproduction prohibited without permission.

1 3 4
could probably be safely neglected. It Is interesting to note the size
of the rate constant from benzene to MCP. This term has a very
significant value because of the fact that it contains the hydrogen
partial pressure raised to the third power.
With the above rate constants one can determine from the kinetic
model yield behavior at long contact times-much longer than any of those
investigated in the experimental part of this investigation. (Space
time equal to 1.4 is the highest studied in the experimental program).
The curves in Figure 20 illustrate how the product yields will vary as
the contact time is increased to 10 hours, which is still not long
enough for equilibrium to become completely established. (This model
does not consider C5T products which will obviously become important at
very long contact times.) The model predicts, as one can determine from
equilibrium calculations, that considerable destruction of benzene occurs
as the holding time is increased. Benzene is converted to MCP which is
cracked to paraffins, so in effect benzene is being converted to hexanes.
This result indicates that an optimum space time exists for maximizing
benzene production. The equilibrium conversion of MCP is about 98 per
cent. Had not the ring opening reactions been present only 74 percent
of the MCP would be converted at equilibrium.
Another interesting point from these predictions is the curve at the
top of Figure 20 which predicts the ratio of benzene to MCP as a function
of space time. This ratio increases as one expects when MCP is being
converted. But instead of asymptotically approaching the equilibrium
ratio it exceeds this value by a considerable amount and only approaches
the equilibrium ratio at very long contact times. At first this result
seems puzzling, but it can be explained by consideration of the relative
Reproduced with permission of the copyright owner. Further reproduction prohibited without permission.
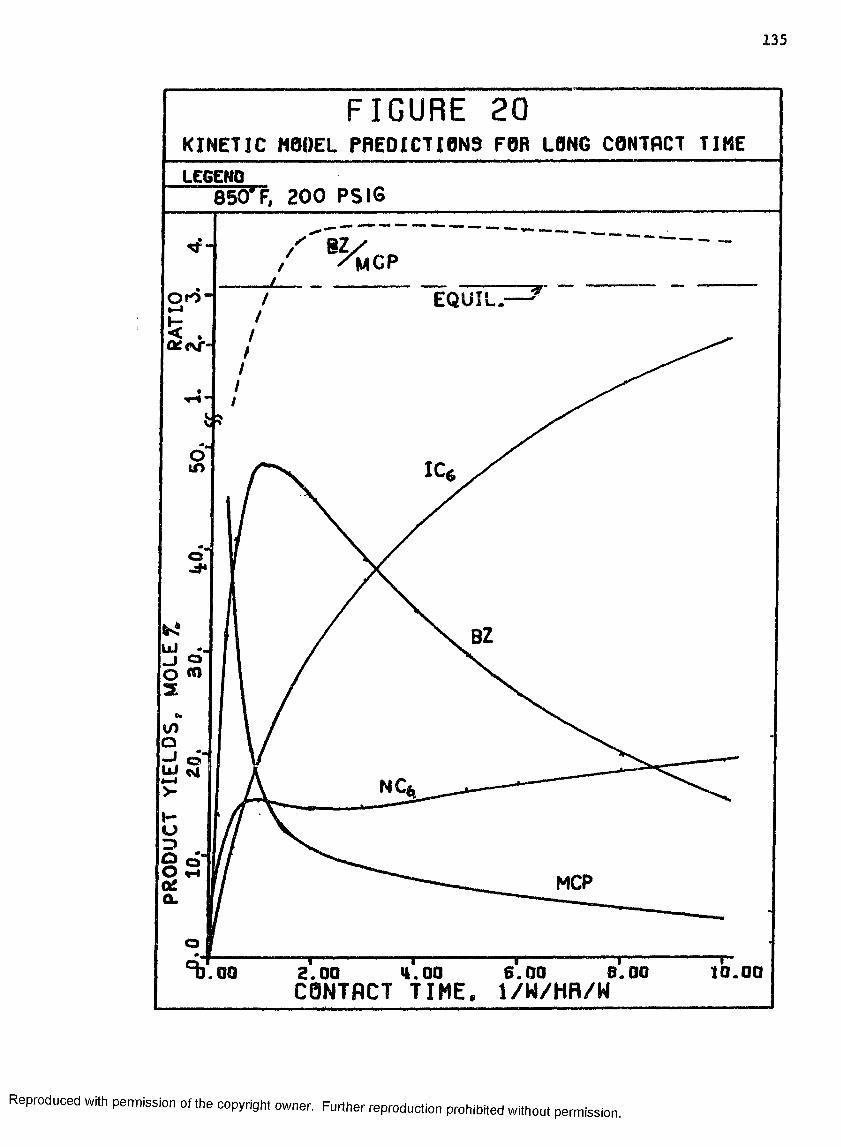
1 3 5
F I G U R E 2 0KINETIC MODEL PREDICTIONS FOB LONG CONTACT TIKE LEGEND
200 PS IS
«fr~
O f O
< .ce<\rH
MCP
EQUT!IL,
^ . 0 0 2.00 11.00 6.00 B. 00CONTACT TIME, 1/W/HR/W
10.00
Reproduced with permission of the copyright owner. Further reproduction prohibited without permission.
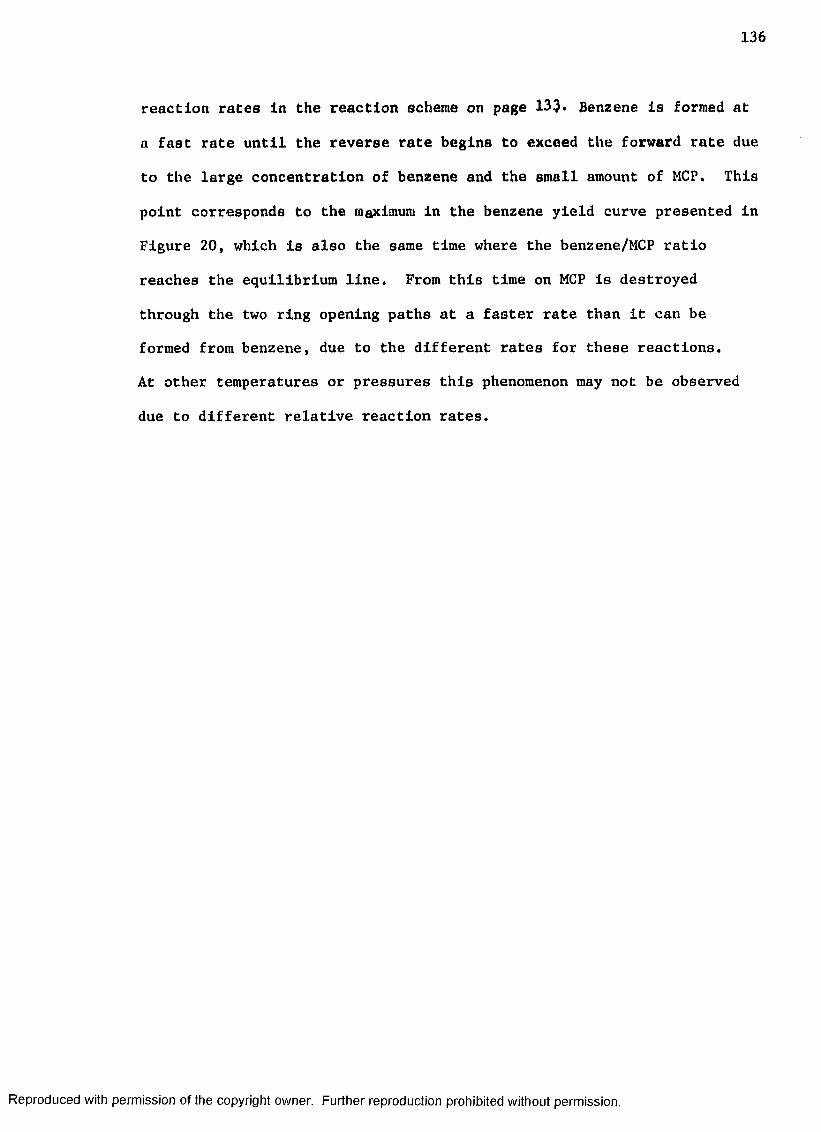
1 3 6
reaction rates In the reaction scheme on page 133* Benzene Is formed at
a fast rate until the reverse rate begins to exceed the forward rate due
to the large concentration of benzene and the small amount of MCP. This
point corresponds to the maximum in the benzene yield curve presented in
Figure 20, which is also the same time where the benzene/MCP ratio
reaches the equilibrium line. From this time on MCP is destroyed
through the two ring opening paths at a faster rate than it can be
formed from benzene, due to the different rates for these reactions.
At other temperatures or pressures this phenomenon may not be observed
due to different relative reaction rates.
Reproduced with permission of the copyright owner. Further reproduction prohibited without permission.

LIST OF REFERENCES - CHAPTER VI
1. Vidaurri, F. C . , "The Kinetics of Methylcyclopentane Reactions Over a Platinum on n-alumina Catalyst," Ph.D. dissertation, Department of Chemical Engineering, Texas Technological College, 1968.
137
Reproduced with permission of the copyright owner. Further reproduction prohibited without permission.

CHAPTER VII
EXPERIMENTAL EFFECT OF PRESSURE AND TEMPERATURE
A. Introduction
A kinetic model for the catalytic reforming of methylcyclopentane
has been developed in Chapter IV and has been validated in Chapter VI.
This model gives the product yields as a function of space time, initial
concentrations and a set of four reaction rate and equilibrium constants.
The kinetic model is not really complete, however, until correlations are
developed for the values of the reaction rate constants which as shown in
Chapter IV depend upon temperature, hydrogen and hydrocarbon partial
pressures. The basis for these correlations is experimental data
obtained over a range of partial pressure and temperature. Using the
kinetic model and techniques developed in Chapter IV a set of four rate
constants can be calculated for each experimental test. The effect of
reactor conditions upon the calculated rate constants can then be
observed and the appropriate correlations developed.
Another incentive for investigating the effect of pressure is that
this type of experimental data normally elucidates reaction mechanisms.
For simple reactions which can be described by the Langmuir-Hinshelwood
kinetic models, one decides which of the three steps, adsorption,
surface reaction, or desorption, is the rate-llmiting-step by examining
the effect of the partial pressures of reacting species upon the reaction(5 )rate constants. Smith and Prater have pointed out an example
138
Reproduced with permission of the copyright owner. Further reproduction prohibited without permission.
1 3 9
involving the reaction of cyclohexane to benzene In which only a
knowledge of the effect of hydrogen partial pressure can elucidate one
of several possible reaction mechanisms. Because of the complex nature
of the reactions investigated in this study, one cannot hope to pinpoint
specific reaction mechanisms, such as dual or single site. Rather, one
might hope that the response of the various products to a change in
pressure would at least indicate that the several products are formed by
somewhat the same or different mechanisms.
Perhaps the biggest incentive for systematically examining a wide
range of pressures and temperatures is that reforming conditions will be
found which result in the maximum yield of the desirable product benzene.
For these reasons the largest part of the experimental data in this
investigation have been obtained at different pressures and temperatures.
These reaction parameters were Investigated with the same Pt and Pt-Re
catalysts which were used in the space time study. These catalysts had
been previously "aged" as described in Chapter V so that the Pt catalyst
contained 1.3 percent coke while the Pt-Re catalyst contained 1.7 percent.
At each of the three temperature levels investigated, 800°, 850°, and
900°F, the hydrocarbon feed rates were maintained at a constant value
while total pressure and the hydrogen diluent ratio were varied. Liquid
feed rates were selected at each of the three temperature levels so that
all the pressure-temperature data were obtained at about the same MCP
conversion level (30-40 percent).
Figures 21 and 22 show specific conditions that were investigated.
The range of conditions are outlined below:
800°, 850°, 900°F
98-380 psia hydrogen partial pressure
Reproduced with permission of the copyright owner. Further reproduction prohibited without permission.
1 4 0
10-51 psla hydrocarbon partial pressures
5, 7, 10, 15 moles H 2/mole MCP
The same partial pressure combinations were investigated at all three
temperature levels. Several additional tests at 850°F were also made at
other pressures. Lines in these figures correspond to a constant
hydrogen diluent ratio. The notation next to each symbol Identifies the
particular experimental test corresponding to the conditions indicated
by the symbol and its location. If one were interested in results at
some specific set of conditions, he merely consults the appropriate
figure for the balance number and then locates the detailed experimental
results for that particular balance in Appendix B or C.
In the remainder of this chapter the experimental results will
first be presented in such a way as to show the effect of pressure and
temperature upon the product selectivities. Later in the chapter
correlations of the rate constants with pressure and temperature will be
developed.
B. Pressure-Temperature Effect on Product Selectivity
From a practical standpoint interest in the effect of pressure and
temperature lies in the effect that these reaction parameters have on
product selectivity (moles product formed/mole feed reacted). In this
section the role that temperature, hydrogen and hydrocarbon partial
pressures play in determining the selectivity to various reaction
products of MCP will be examined. Considering the large amount of
experimental data obtained in this investigation, this chapter could be
cluttered with a very large number of figures showing the results at all
temperatures and pressures for both catalysts. Rather, the approach
taken is to present only those figures which indicate the general effect
Reproduced with permission of the copyright owner. Further reproduction prohibited without permission.

m
F I G U R E 2 1ExrcnjHCNT oc3]on run rncasuflE-TCNfenRTunc aiuor hith n crtplt tLEGEND
0 RUN P22, BOO F, 2.5M/HR/N ® BUN P23, BSD F, 9.0W/HB/HA BUN PgMty 9 0 0 % 23.W/HB/W
oo■
QU5on
ccoM *tn gCL.cn
UJ0Q C or) -m Oto.LUac
o_I "
a g .JZ!CVI(DCa :
Z QKJU>-CDOQCno> ~ °l oo.
oo0o*“b . o o 1 0 .0 0 2 0 . 0 0 3 0 . 0 0 4 0 . 0 0 5 0 . 0 0HYDROCARBON PARTIAL PRESSURE, PSIA
Reproduced with permission of the copyright owner. Further reproduction prohibited without permission.

1 4 2
F I G U R E Z Z
exrenjHewr design fob pBEssuBE-TeNraiBTune sroor with ft-be crtrujtLEGEND
q RUN PR22, BOO Ff2.1W/HR/W 0 RUN PR23, BSD F,6.4W/HR/W A RUN PH24, 90a*Fj 21 - N/HR/W _______________
oo*o
U>-Jcn
C C o
«)o,CLIO
UJ0CCo ZD *<ng<nKju jaz
J °CE°r^o,H-ac
EgZ Ooooc Qgl otSPa
CDCD
>A P
■'b.OO 1 0 . 0 0 2 0 . 0 0 3 0 . 0 0 4 0 . 0 0 5 0 . 0 0HYDROCARBON PARTIAL PRESSURE, PSIR
Reproduced with permission of the copyright owner. Further reproduction prohibited without permission

1 4 3
of the reaction parameters.
The first set of figures presented, Figures 23-28, Illustrate the
effect of hydrogen and hydrocarbon partial pressures upon the major
products obtained from reforming MCP at 850°F with the Pt-Re catalyst.
The first and most obvious observation of the data in these figures is
that hydrocarbon partial pressure has little effect upon the selectivity
of any reaction product. Hydrocarbon partial pressure is a strong
function of thd* H2/MCP ratio, much more so than is the hydrogen partial
pressure. Therefore, the practical implication of this observation is
that at a given total pressure the "hydrogen-to-oil ratio" or the
"recycle gas rate" has little effect upon product selectivity. This
observation applies to other temperatures as well as to the Pt catalyst.
The data in Figures 23-28 indicate that hydrogen partial pressure
plays a significant role in determining product selectivity. This is
especially true for benzene (Figure 23) where an increase in hydrogen
pressure causes a lower selectivity to the aromatic product. This
observation is not unexpected since the rate for the reverse reaction
(benzene to MCP) depends on the hydrogen pressure raised to the third
power (equation 24, page 61).
Figure 24 shows that n-hexane selectivity has almost as> strong a
dependence on hydrogen pressure as does benzene, but in the opposite
direction. In fact one can say that the drop in benzene selectivity with
increasing hydrogen partial pressure almost exactly corresponds to the
increased n-hexane selectivity. This observation might indicate some
relationship between the reaction mechanisms which form these products-
possibly a common intermediate.
The effect of hydrogen partial pressure upon selectivities to
Reproduced with permission of the copyright owner. Further reproduction prohibited without permission.

144
F I G U R E 2 3PRESSURE EFFECT ON BENZENE SELECTIVITY. PT-RE CRT.. BSD F
LEGEND19-20 PSIfl HCPP 37-10 PSIfl HCPP
a 10-13 PSIfl HCPP A 27-29 PSIfl HCPP x 51-52 PSIfl HCPP
oo
v j o r o
UJS
oo
390.0150.00 210.00 270.00 330.00HYDROGEN PARTIAL PRESSURE, PSIA
Reproduced with permission of the copyright owner. Further reproduction prohibited without permission.
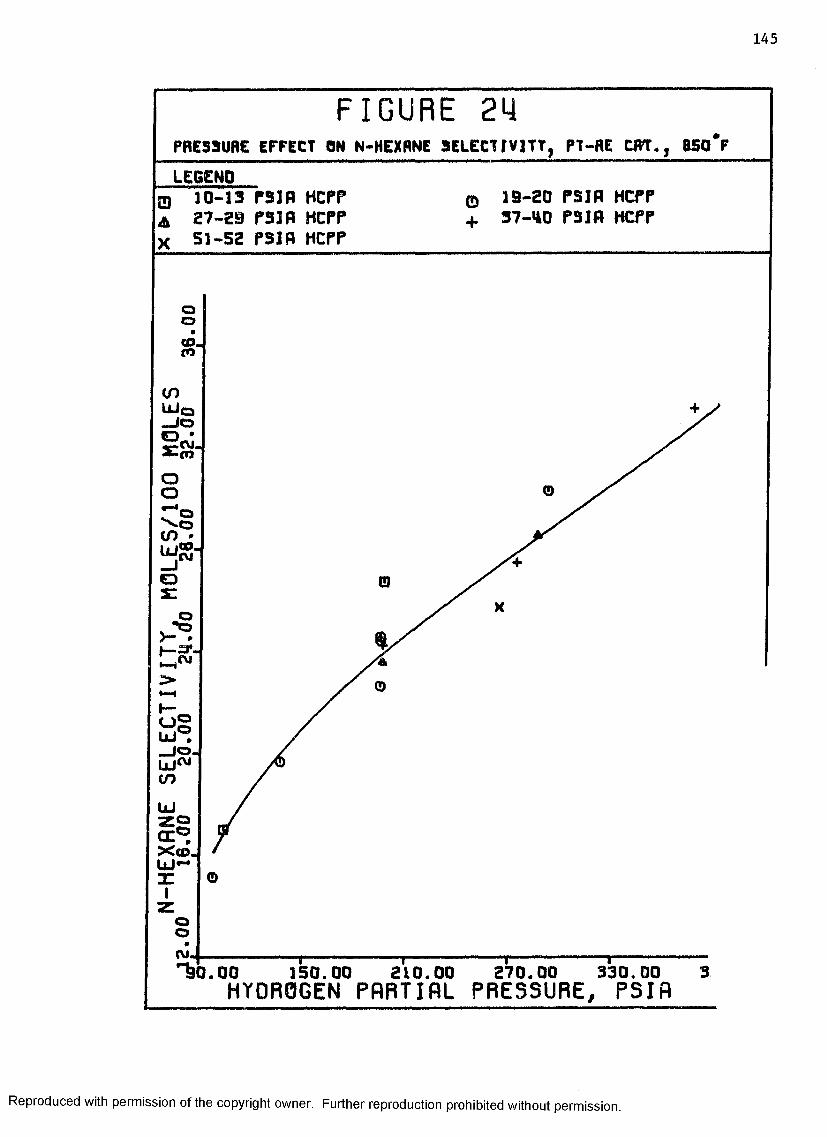
1 4 5
F I G U R E 2 4PRESSURE EFFECT ON N-HEXRNE SELECT[V1TT, PT-RE CRT,, 850*FLEGEND
0 10-13 P31R HCPPA 27-29 PSIfl HCPP x 51-52 PSIfl HCPP
0+
19-20 PSIfl HCPP 37-HO PSIfl HCPP
oo•
<o>iCO
CO UJ q -JO O *
o o's.O tn •1,1 CO.
oSI
I— S3T.
O g UJ .J O .U J ~COUJzoa c ®Xco.XIz o o0J.
o
"ho.00 150.00 210.00 270.00 330.00HYDROGEN PARTIAL PRESSURE, PSIA
Reproduced with permission of the copyright owner. Further reproduction prohibited without permission.
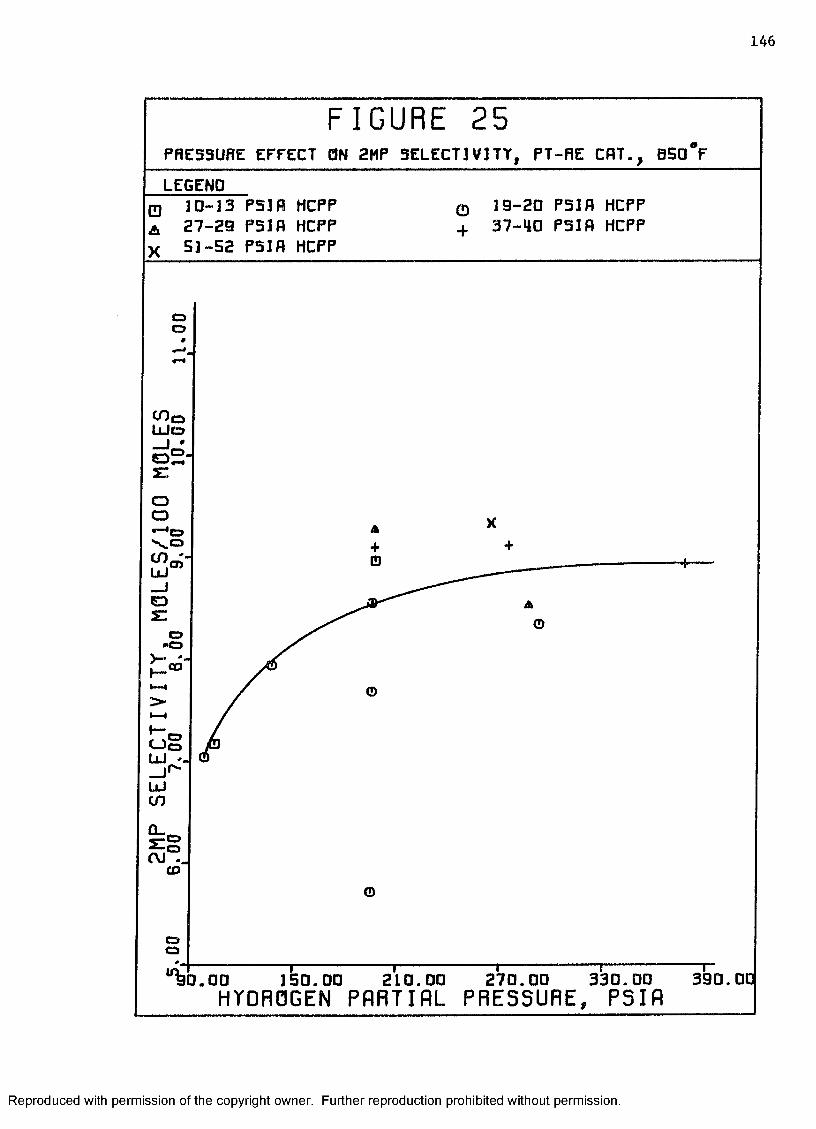
1 4 6
F I G U R E 2 5PRESSURE EFFECT ON 2MP SELECTIVITY, PT-RE CRT-, BSD FLEGEND
19-20 PSIfl HCPP 37-HO PSIfl HCPP
10-13 P51fl HCPP 27-29 PSIfl HCPP 53-52 PSIfl HCPP
oo
OO'o
UJO
»— i
O o 111
LUcnQ_5 C gOJCO
oo
150.00 210.00 270.00 330.00HYDROGEN PARTIAL PRESSURE, PSIA
390.DC
Reproduced with permission of the copyright owner. Further reproduction prohibited without permission.

147
F I G U R E 2 6PRESSURE EFFECT ON 3HP SELECTIVITY, PT-RE CRT., B SoV LEGEND
□ 10-13 PSIfl HCPP 0 19-20 PSIfl HCPPA 27-29 PSIfl HCPP + 37-HO PSIfl HCPPx 51-52 PSIfl HCPP
oo*CO
toUJOj °O f Cs:o
^co'UJ
>h-0 O © UJ --
CO
• ■ O* • 0CO
oo
^ 0 . 0 0 150.00 210.00 270.00 330.00HYOR0GEN PRRTIRL PRESSURE, PSIR
390.0
Reproduced with permission of the copyright owner. Further reproduction prohibited without permission.

1 4 8
F I G U R E 2 7PRESSURE EFFECT 0N CTCL0HEXRHE SELECTIVITY, PT-RE CRT., BSO°FLEGEND
19-20 PSIfl HCPP 37-HO PSIfl HCPP
0 10-33 PSIfl HCPPA 27-29 PSIfl HCPP x 51-52 PSIfl HCPP
ooCO CDUJ
OUJ
QZXUJ -f-o i o O ..-J*-"o>-uoo
390.0C150.00 210.00 270.00HYDROGEN PARTIAL PRESSURE, PSIA
330.00
Reproduced with permission of the copyright owner. Further reproduction prohibited without permission.

1 4 9
F I G U R E 2 8HKsauM erreci bm HtTHTicTciopciucNe acuecnvm , n -ne cut. , bso* p
LEGEND q 10-13 PSJR HCPP A 27-29 PSIR HCPP x 51-52 P31R HCPP
inu j o
O c o
Os:
V** *'1
UJinU J _z g uj *-i— ^ ZUJCL.o „•Jqo
£ g l^ ^ Q . O O 150.00 210.00 270.00 330.00
HYDROGEN PART Ifit PRESSURE, PSIA390.01
® 19-20 P5JR HCPP+ 37-HO P3JR HCPP
Reproduced with permission of the copyright owner. Further reproduction prohibited without permission.

1 5 0
2-methylpentane (Figure 25) and 3-methylpentane (Figure 26) is quite
different from the effect on n-hexane. These former compounds show
little dependence on hydrogen pressure above about 200 psla. Even
below this pressure the dependence is not nearly as large as was
observed for n-hexane. These results indicate that both of the iso
hexanes are probably formed by a similar reaction mechanism which is,
however, quite different from the one which forms the other ring-opening
product, n-hexane. This observation agrees with the reaction scheme
proposed in Chapters II and IV in which iso and normal hexanes are
formed by different reaction mechanisms.
Cyclohexane selectivity is plotted in Figure 27. It Increases with
hydrogen pressure. This observation does not refute the assumption that
cyclohexane is in equilibrium with cyclohexene because the concentration
of the latter compound could possibly increase at higher hydrogen
pressure due to the higher rate of reaction of benzene back to the
intermediate cyclohexene.
The last figure in this series (Figure 28) shows the selectivity of
methylcyclopentene as a function of hydrogen pressure. It decreases with
pressure just as one would expect for an olefin in equilibrium with its
saturated counterpart. This equilibrium relationship can be expressed in
the form
yMCP » “ K PHyMCP" 2
where
y 1 ** mole fraction, hydrogen free basis
^H2 83 hydrogen partial pressure, psia
Ki ■ equilibrium constant.
Reproduced with permission of the copyright owner. Further reproduction prohibited without permission.

1 5 1
The equation on the previous page suggests that a plot of the ratio of
MCP to methylcyclopentene should be a linear relationship with hydrogen
partial pressure. Furthermore, the slope of this line should depend on
the value of Ki which is only a function of temperature. The fact that
the data plotted in Figure 29 can be described by an equation of the
previous form suggests that methylcyclopentene is indeed in equilibrium
with MCP. An equation for the value of the equilibrium constant Kj can
be developed from the data in this figure. Actually this set of data
plus another similar set with the Pt catalyst were used to determine the
following expression:
p h 2 PMCP“ 24 314Kl = --------- . EXP(- "yfe-- + 16.850) (2)
PMCP
The next set of figures (30-41) shows the effect of hydrogen par
tial pressure at different temperature levels. Since hydrocarbon
partial pressure has little effect on any of the product selectivities
no distinction is made of this parameter. Data are presented for both
the Pt and Pt-Re catalysts so one can distinguish any basic differences
between these two catalysts.
The selectivity to benzene at 800°, 850°, and 900°F as a function
of hydrogen pressure is shown for the Pt-Re and the Pt catalysts in
Figures 30 and 31, respectively. At each temperature level selectivity
to benzene decreases with increasing pressure for the Pt-Re catalyst,
but the decline is much sharper at lower temperatures. These observa
tions should be expected since the equilibrium constant for the MCP —
benzene reaction is much lower at the lower temperature with the result
that the driving force for benzene production is not nearly as large.
This is illustrated in the following tabulation where the forward and
Reproduced with permission of the copyright owner. Further reproduction prohibited without permission.

152
F I G U R E 2 9HETHTLCTfCiaPENIRNE - METHYLGrCLflPENTENE EQUILIBRIUM, PT-RE CRT.LEGEND
oo
|— CMccCO
oLlJo
tug.F-CMZUJ9 r oO o
s— ' tn
U oo
a*
UJX oa
50.0030.0020.00u. 00HYDROGEN PflRTIRt PRESSURE, PSIR
1 0 .0 0
Reproduced with permission of the copyright owner. Further reproduction prohibited without permission.

.153
F I G U R E 3 0PRE39URE-TENPERBTURE EFFECT BN BENZENE SELECTIV]TT, PT-RE CAT
850 F
ootoCO
CDUJO oS2gq__oOcoO
O KSu
> - o I— o> o to
3 9 0 . 0C1 5 0 .0 0 2 1 0 . 0 0 _ .HYDR0GEN PARTIAL PRESSURE'SIA3 3 0 .0 02 7 0 .0 0
Reproduced with permission of the copyright owner. Further reproduction prohibited without permission.

154
F I G U R E 3 1PRESSURE-TEMPERRTURE EFFECT ON BENZENE SELECTIVITY. PT CRT.LEGEND
BSD FBOO F 900 F
ooID-CD
if )LU
2E
o -
ULUqJ o UJ -cn!2-UJ
oo0ID------^ Q . O O 39D.DC150.DO 210.00 270.00
HYDROGEN PARTIAL PRESSURE, PSIA330.00
Reproduced with permission of the copyright owner. Further reproduction prohibited without permission.

155
reverse simplified reaction rate constants are shown at different
conditions. These constants are based on experimental tests made at
a constant hydrocarbon partial pressure.
Hydrogen Partial Pressure, psia
Temperature, °F _______98__________ 292_____
800 MCP— B? M C P ^ = = ^ B Z0.10 1.405 93 A 74900 MCP ;rr±r~=rirBz MCP = = = = f c Bz
• 0.07 1.45
These rate constants include the appropriate hydrogen pressure terms,
so the reaction rate in either direction is simply the product of the
simplified constant and the appropriate hydrocarbon concentration. The
lower forward rate constants measured at higher pressure possibly
reflect. lower concentration of the reaction intermediate methylcyclo
pentene as well as a hydrogen inhibition effect.
At low hydrogen partial pressure, temperature appears to have little
effect on selectivity to benzene. This could be caused by the fact that
at all three temperatures the reverse rate constants (benzene «>“MCP)
are much lower than the forward rate constant at low hydrogen pressure.
As a result the selectivity is more controlled by competing reactions of
MCP to other products. A small difference in activation energy for
these different reactions completes the explanation of the constant
selectivity over a wide temperature range.
The first real difference between the behavior of the Pt and Pt-Re
catalysts can be seen by comparing Figures 30 and 31. In the latter
figure the selectivity to benzene for the Pt catalyst is lower at high
temperatures and low pressure than the corresponding selectivity for the
Pt-Re catalyst, while at high_pressures there appears to be little
Reproduced with permission of the copyright owner. Further reproduction prohibited without permission.

1 5 6
difference in selectivity. One can get a better picture of the
different behavior of these two catalysts by examining the total
product distributions at conditions where the yields are the most
different-— 900°F, 102 pslg, and 5 moles ^/ m o l e feed. Product selec-
tivlties at these conditions are tabulated below:
_______Catalyst______
Pt-Re Pt
Balance No. PR-241 P-24G
Selectivity, %
2MP 4.8 5.1
3MP 3.0 2.8
nC6 11.6 13.7
nCg” 3.8 4.7
MCP" 8.4 12.4
CH 2.3 8.0
CH” , MCP"” 0.6 1.4
Bz 65.0 51.7
MCP Conversion, % 35.5 25.5
These data indicate that at the same reaction conditions the Pt catalyst
produces a larger amount of olefins and cyclohexane and a correspondingly
lower yield of benzene. Yields of the ring-opening products are not
substantially different for the two catalysts. A possible explanation
of this behavior is that some of the platinum catalytic sites on the Pt
catalyst, particularly those responsible for dehydrogenating cyclohexene
to benzene, have been preferentially deactivated. Deactivation could be(4 )caused by the formation of a surface residue or polymer. Sinfelt
postulates that at low hydrogen pressures the rate-limiting-step in the
Reproduced with permission of the copyright owner. Further reproduction prohibited without permission.
1 5 7
reaction of MCP may change from an acidic step to a dehydrogenation
step. This change occurs because a large portion of the metal sites
are covered with polymer which at higher pressures is quickly hydro
genated off the catalyst surface. The larger cyclohexane yield for the
Pt catalyst could be due to a higher cyclohexene concentration.
It should be mentioned that the platinum catalyst apparently
suffered a permanent loss in activity during the brief period of
operation at 900°F and 102 psig for a later duplication of a prior test
failed to give as high a conversion of MCP. These experimental results
indicate that the Pt-Re catalyst is more resistant to deactivation of
its metal sites at severe operating conditions. This observation is in
agreement with commercial experience with these two catalysts which
demonstrates that the Pt-Re catalyst has better activity maintenance.
From the experimental results in this study, one could postulate that
the reason for its better activity maintenance is that hydrogen
deficient hydrocarbons are not as strongly adsorbed on the metal sites
in a Pt-Re catalyst or else they are more rapidly hydrogenated. There
fore, the metal sites are less likely to be deactivated by formation of
coke from polymers.
The selectivity to cyclohexane is shown as a function of both
hydrogen pressure and temperature in Figures 32 and 33. It has been
postulated earlier that this compound is in equilibrium with the reaction
intermediate cyclohexene. If this is the case than the yield of this
component must reflect the behavior of cyclohexene concentration at
different reaction conditions, -be steady state concentration of the
Intermediate was derived in equation (20) of Chapter IV (page 61 ):
Reproduced with permission of the copyright owner. Further reproduction prohibited without permission.

1 5 8
k 3 BH3 + k7 Ki Mc „ ----------- .------ (3)
(k3 + k7)H
where
c » cyclohexene partial pressure,
B = benzene partial pressure,
H => hydrogen partial pressure,
M » methylcyclopentane partial pressure,
k 3, k7 = reaction rate constants defined on page 55,
Kj ■ equilibrium constant for MCP/MCP“/H2 reaction.
It is not to be inferred here that this expression is thought to be the
proper form. The purpose of stating this equation again is to illustrate
the many variables which probably influence the cyclohexene yield.
Certainly this equation is complicated enough to explain the weird
selectivity behavior for cyclohexane shown in Figures 32 and 33.
The only statement that will be made about the dependence of cyclo
hexane selectivity upon temperature and pressure is that for each catalyst
a definite pattern exists with changing temperature. Only at 800°F is the
dependence on hydrogen pressure anywhere near what one would expect.
Selectivity to methylcyclopentene is illustrated in Figures 34 and
35. Since all the data in these figures were obtained at about the same
conversion level, MCP is present in nearly the same amount for each test.
Therefore, the declining selectivity of methylcyclopentene with increasing
hydrogen partial pressure is expected since the product of hydrogen and
methylcyclopentene partial pressures should remain constant at a given
temperature level. Furthermore, the yield of this product with increasing
temperature is expected since increasing olefins are normally favored at
high temperatures. What is surprising is that at a given MCP conversion
Reproduced with permission of the copyright owner. Further reproduction prohibited without permission.
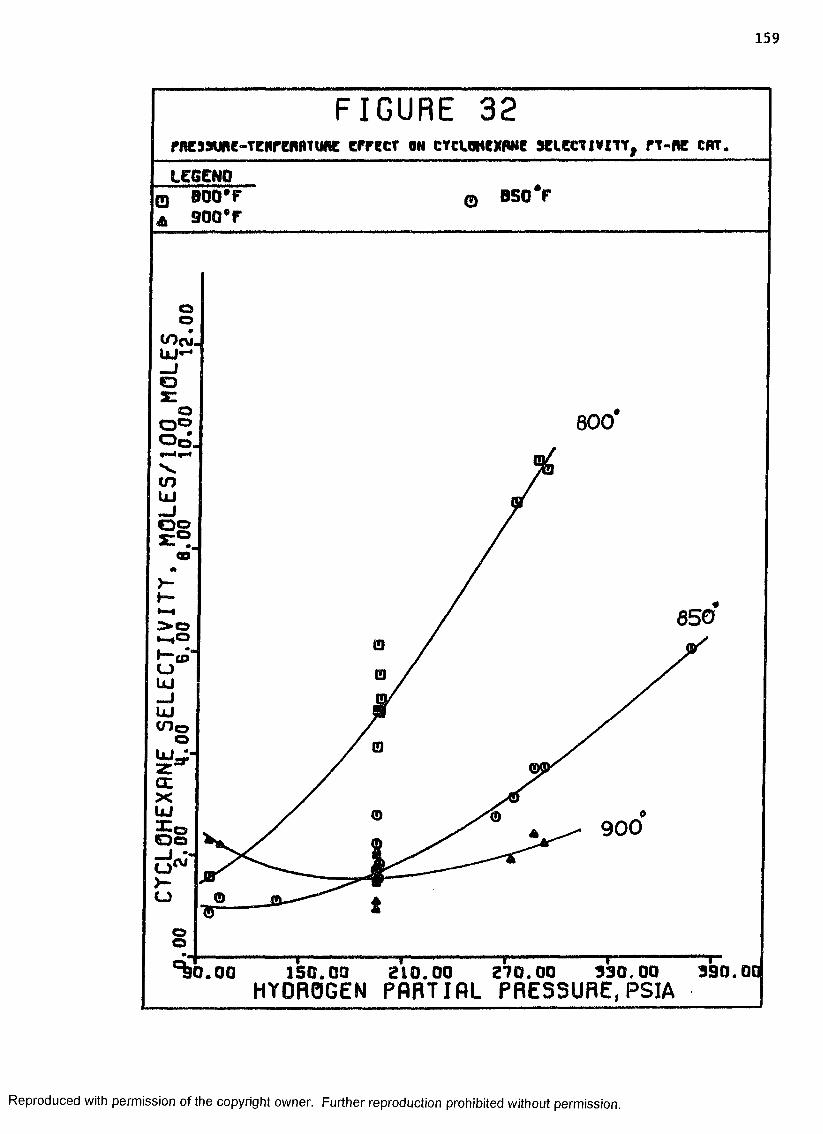
1 5 9
F I G U R E 3 2rftEjaunc-TenreftRTUfte crrcct on cvcuoHexwe w i c c i i v m , rr-n e crt
B 5 0 F
oov>oi-ii i«—
o
800
y—
850> o
OUJMMJUJ<n©
0 uj *■ at a :XUJX oO o1 *■ C J ™o
900
oo3 9 0 . QC1 5 0 .0 0 2 1 0 .0 0 2 7 0 .0 0
HYDROGEN PARTIAL PRESSURE,PSIA
Reproduced with permission of the copyright owner. Further reproduction prohibited without permission.
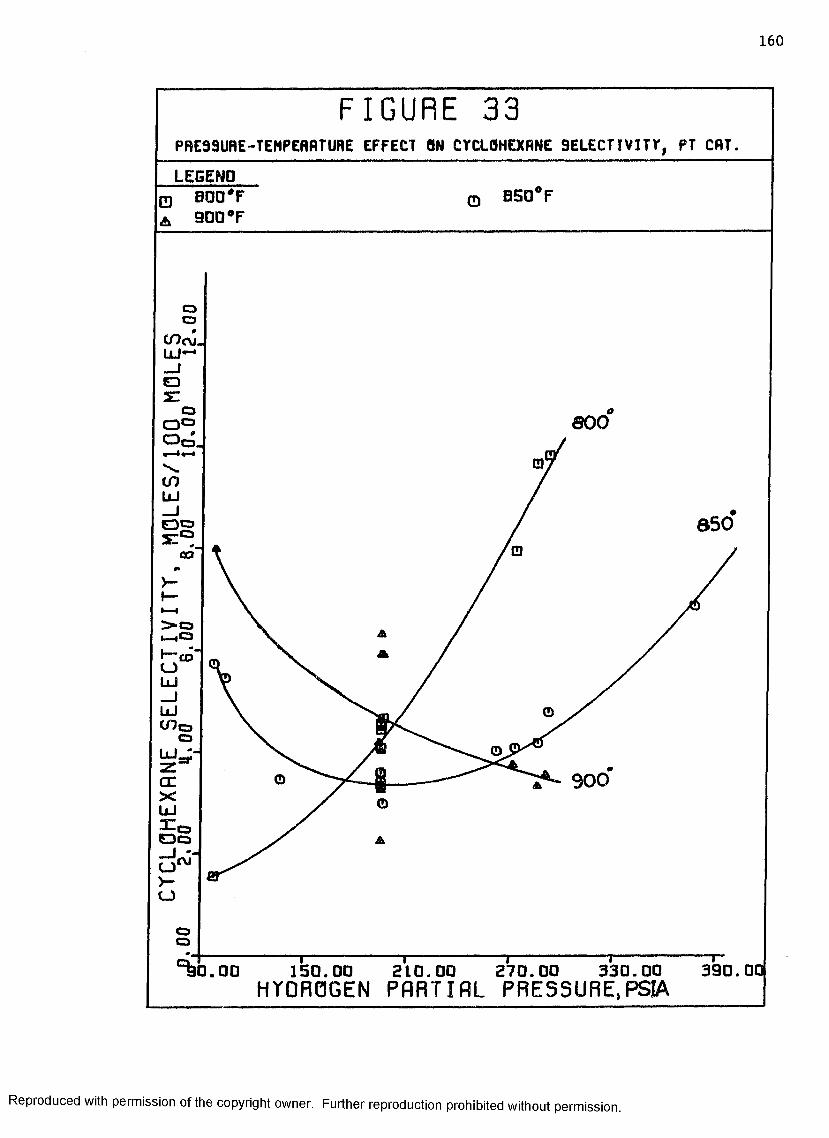
1 6 0
F I G U R E 3 3PRES9URE-TENPERRTURE EFFECT 0N CrCLflHEXRNE SELECTIVITY, PT CRT.
LEGENDQ6.
B00-F 900 *F
© B50°F
ooCOrvj.
Os :
oQ OO q ,
if) UJ _J O g
co
> * C 5 i— iOF-COOUJ_IUJ t O o ol u =;-za: xUJl oO oO>-u
fVI
oo
800
^ 0 . 0 0 150.00 210.00 270.00 330.00HYDROGEN PARTIAL PRESSURE,PSIA
390.01
Reproduced with permission of the copyright owner. Further reproduction prohibited without permission.

16.1
F I G U R E 3 4rnessune-Tcurepuvune ermt mi «rtim .crct.arwtwe mecrmrr, pt-nc jcflT
B50F
O
ZUJ
330.00 390.01150.00 210.00HYDROGEN PARTIAL PRESSURE, PSIA270.00
Reproduced with permission of the copyright owner. Further reproduction prohibited without permission.

162
F I G U R E 3 5PRE5SURE-TEHPERRTURE EFFECT ON METHTLCYCLOPENTENE SELECT I V I T T f PT CRT.
LEGENDB 5 0 F
Os :
- O
f— co”»—I
I— I(—U oU J O— Ifp~IxJtn
Z oU jo
390.OC150.00 210.00HYDROGEN PflRTIRL PRESSURE,PSIA
330.00270.00
Reproduced with permission of the copyright owner. Further reproduction prohibited without permission.

1 6 3
level, the Pt catalyst gives a higher yield of methylcyclopentene at
temperatures above 850°F and hydrogen pressures below 200 psia. At
lower temperature or higher pressure the Pt catalyst produces the same
or possibly a little less of this compound than does the Pt-Re catalyst.
This behavior may somehow be related to deactivation of the Pt catalyst's
dehydrogenation sites at high temperature and low pressure.
The selectivity to n-hexene (Figures 36 and 37) demonstrates neatly
the same behavior with hydrogen pressure as observed for methylcyclo
pentene. The Pt catalyst also gives higher yields of this olefin at high
temperature and low pressure. Both catalysts produce appreciably larger
amounts of this compound as temperature is increased.
The effect of temperature on the selectivity to n-hexane is
demonstrated in Figures 38 and 39. With both catalysts n-hexane selec
tivity increases with decreasing temperature and increasing hydrogen
pressure. At 900°F the Pt-Re catalyst produces slightly less n-hexane.
Both the Pt and Pt-Re catalysts produce the same amount of
2-methylpentane as shown in Figures 40 and 41. Increasing the tempera
ture tends to reduce the amount of this component while higher hydrogen
partial pressure causes a somewhat higher yield. The selectivity
behavior of the other major isohexane, 3-methylpentane, is very much the
same except at a lower level.
From the data presented above in which the effect of temperature,
hydrocarbon and hydrogen partial pressures have been examined, the
following conclusions can be made:
• Hydrocarbon partial pressure has little effect on the product
distribution.
• Temperature and hydrogen partial pressure have a significant
Reproduced with permission of the copyright owner. Further reproduction prohibited without permission.

164
F I G U R E 3 6PRE39URE-TEMPERRTURE EFFECT AN HEXENE SELECTIVITY, PT-RE CRT.LEGEND0&
000 F 300* F
© 05O*F
o oCO
COUJ
| sID
Oo
fm ■PTO^ O . O O 150. DO 210.00 270.00 330.00
HYDROGEN PARTIAL PRESSURE,PSIA
Reproduced with permission of the copyright owner. Further reproduction prohibited without permission.
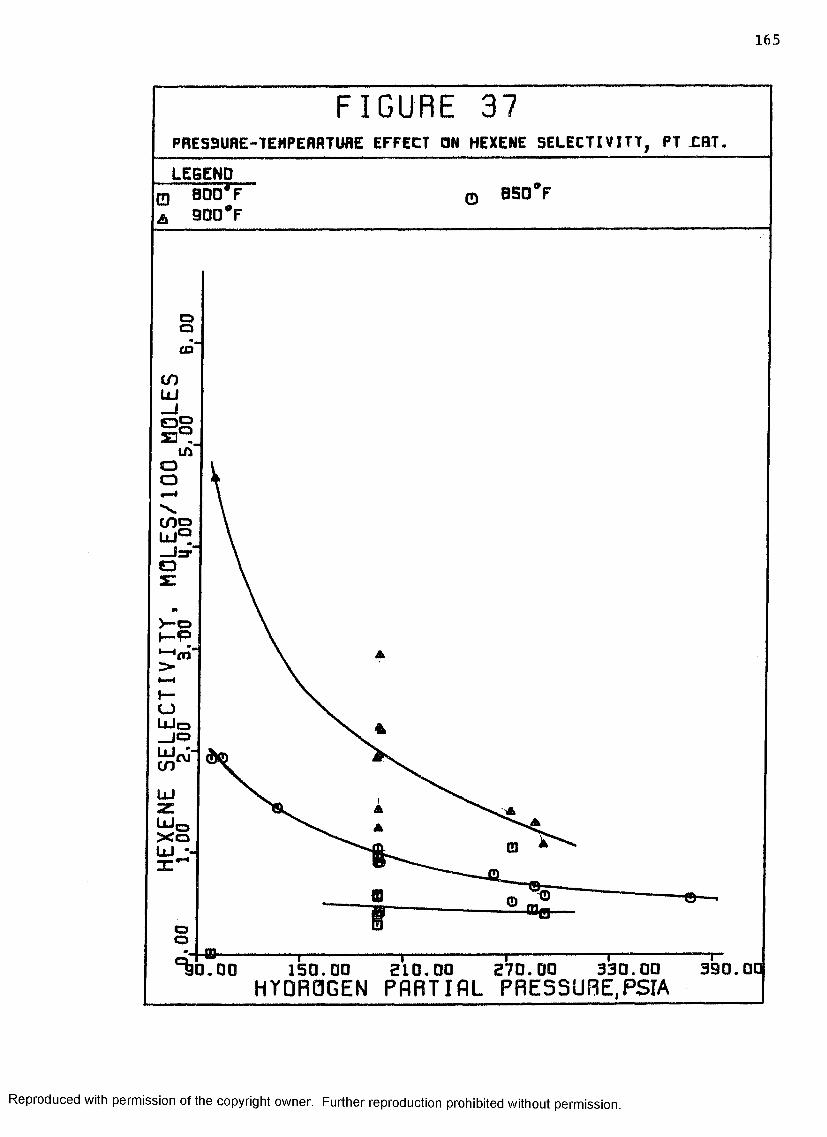
165
F I G U R E 3 7PRES3URE-TEHPERRTURE EFFECT ON HEXENE SELECTIVITT, PT HftT.LEGEND
BSD F
oQCD
COLUO gaainoO
> - o
'~4tn>t— <
UJzX o UJ --
oo390.DC150.DO 210.00 270.00 330.00
HYDROGEN PflRTIRL PRE55URE.PSIA0 . 0 0
Reproduced with permission of the copyright owner. Further reproduction prohibited without permission.
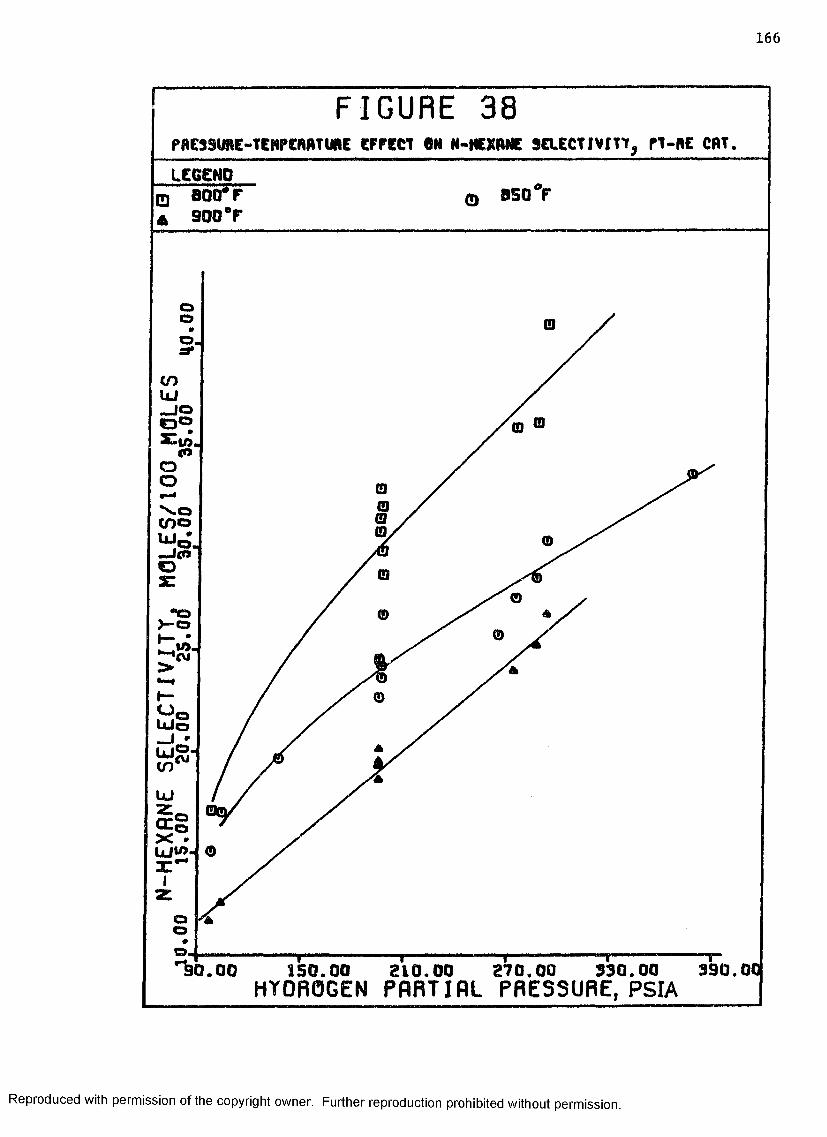
1 6 6
F I G U R E 3 8Pft£39UAE~TCMPCRflTURE CFFCCt ON N-tCXftNE S C U C T W T lf , F1-RC CRT
B 5 0 F
oo
" O
u>-<vi>
U 0Uio_I *W gto
z oo
z
390.OC150.00 210.00 270.00 330.00HYOR0GEN PflRTIRL PRESSURE, PSIA
Reproduced with permission of the copyright owner. Further reproduction prohibited without permission.

1 6 7
F I G U R E 3 9PRES3URE-TEMPEHRTURE EFFECT ON N-HEXANE SELECTIVITY. PT CRTLEGEND
BSD FBO O T 900 °F
QOO -=*•
cnUJ- J O
coOO
o.150.00
HYDROGEN PflRTIRL PRESSURE,PSIA270.00
Reproduced with permission of the copyright owner. Further reproduction prohibited without permission.
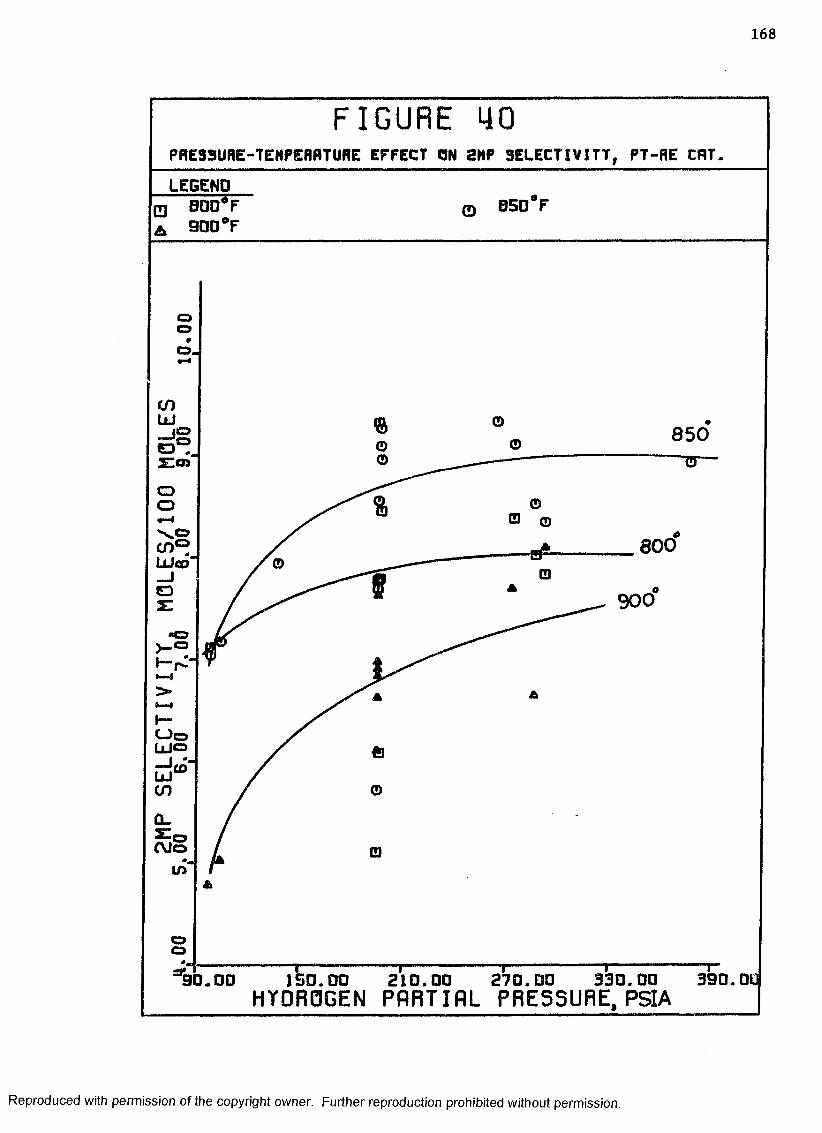
1 6 8
F I G U R E 4 0PRE33URE-TEHPERRTURE EFFECT ON 2HP SELECTIVITY. PT-RE CRTLEGEND
BSD F
ooo .•H
850
800G>x: 900■o
H f v "
i— i
a .
O J oin'
oo
90.00 ISO.00 210.00 270.00 330.00HYDROGEN PflRTIRL PRESSURE, PSIA
390.01
Reproduced with permission of the copyright owner. Further reproduction prohibited without permission.
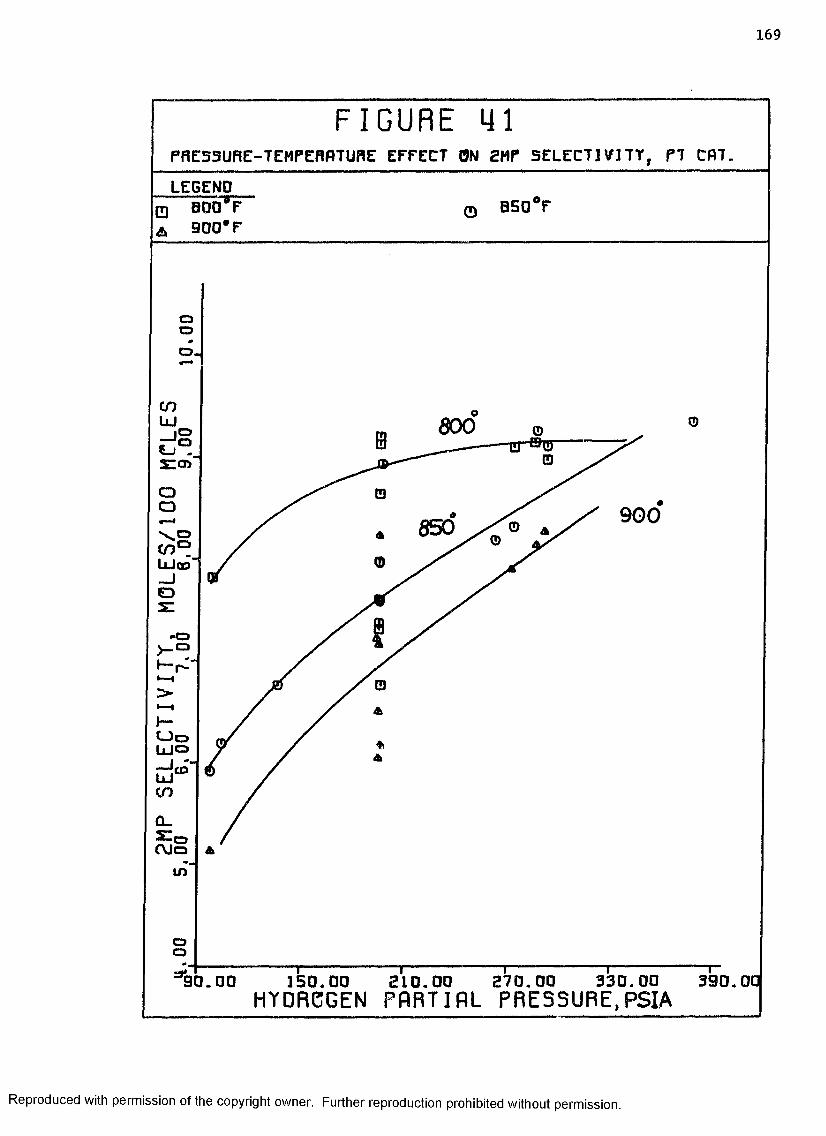
169
F I G U R E mPRESSURE-TEMPEfWTURE EFFECT ON 2MP S E LE C T IV ITY , PT CRT.
LEGEND
oo
O -
600
oo 900850c o °UJoo”
Q_
in
oo
1 5 0 .0 0HYDRCGEN PflRTIRL PRESSURE,PSIA
330.00 3 9 0 .0 0270.0090.00 2 1 0 . 0 0
Reproduced with permission of the copyright owner. Further reproduction prohibited without permission.
1 7 0
effect on the relative amounts of most of the products.
• Benzene selectivity with the Pt-Re catalyst Is maximized by
operating at low hydrogen partial pressure and high temperature.
At low pressure the effect of temperature is not nearly as great
as at high pressures.
• At low hydrogen partial pressures (100 psia) benzene selectivity
with the Pt catalyst decreases with increasing temperature due
apparently to deactivation of dehydrogenation sites.
• At low hydrogen pressure and high temperature the Pt catalyst
produces considerably more olefins than does the Pt-Re catalyst.
Having considered the significance of temperature and pressure upon
product yields, the next and final step in the analysis of the experi
mental data is to complete the kinetic model by correlating the four
rate constants with temperature and pressure.
C. Correlation of the Reaction Rate Constants
The development of correlations for the four reaction rate constants
with temperature and pressure is discussed in this section. The experi
mental data from which these correlations are developed were presented in
the previous section and are summarized in Tables 9 and 10. These data
include only the experimental tests designed to investigate the effect of
pressure and temperature. The tests examining space time are not in
cluded, since all these tests were made at a single temperature and
pressure. Inclusion of this large number of experiments at a single set
of conditions would cause too much weight to be given to one set of con
ditions. Rather, the data which are correlated should be well-spaced
throughout the range of conditions investigated as demonstrated in
Figures 21 and 22.
Reproduced with permission of the copyright owner. Further reproduction prohibited without permission.

Table
9: Ex
peri
ment
Results
from
Pres
sure
-Tem
pera
ture
Study
with
Pt-Re
Cata
lyst
____
____
____
1 7 1
A04JOOa o« r l4-1 1*0(00 •o S
u 4-1to<D 1
4-1 4-1<3 (0w u
rHtO a4-1 ia MSJ xta
•H (0M <ua) rH
f i* iw
i n « n o H m o H o o \ ' t f l H N * H > j o a ( 0 < t o o < r i nioioooinNiNinLno>h«oi)voo«oorsrsoc^ooN^oin<fJ j| « • • • • • • • * • « • • • • • • • • • • • • •
O O O O O O O O O O r l N N r l l f l N 'J ' J r l N N H f ' l M
O C O O C ' 4 O O i O C H v O ' T C ' l v 0 c n « T < t O O ' T V O < N v O K | - v O H O H H o < t o ^ i n ^ r i M j i o o a i N N o o > J ^ o o \ H i n ^ ( n v o H o \rlHNNH(OOHlOMmOCO'D(Orl'<fNinO"0«t<f>J
r H n l i—I i—I f—I i—I i—I
<TioooooorHOvoor'>or»oot'-cot'-iot'xOOrHiOf>»ovco«Tl r t H s M 1 0 M ! 0 ' < f < f 0 0 ' J f 0 N ( 0 « H O O H ' J < t ^ N O O^ M N N H N H H H H C ' | v O U ,|tf)>4,HOOr-]|V'<flOvt(ilvDOO
O O O M n ( f ) O C O e S f n < f V O O O ' O N N I O v O r l m O N r l « ( J ' c n o O N N H i n n i O r l O \ 0 ( ,1 < f O O H ^ < f < f M H ( T i | N O O m • • * • • • • • « • • • • • • • • • • • • • • •-id >9’fO<CM(n<ONMvOC*1StCOO>^OinNOaiCOiNffnOHvD
r l H r o H <N H H C M iH
.0
rHtO•H4-1 0l-l•rltO to04 P0 •01 •00 too COM 0T) M>> CMw
0’r l0
0 POX> •M 00 0o 00 uM CM
TJ>» rH
H I 0•r l4JM0
CM
*a)M04.1
H
a)o§H<8
in «x> m r-» o\ o\ Ol 00 r l H r l M
ch vo < r r ^ ON ON O '. (Tv N H M H
oo in m mCTN CTv ON CTvH H H
vO In N oo r - o <T«CM (O r ) N
r«. t" \oa\ fO N Ov H r l N H
vo -sf oo inON VO ON ON rH CH rH
O O N O O O O N N O O N O N O O N O O N N O O t O O N O O N O O r l O N OM r | C N | P ) H N ( 0 ( O H N r l C M C N | ( < l r l C N | r l r l m C N | ( » | i n r l N
O O o o o o o oo o o o o o o oOO oo 0 0 0 0 00 00 00 oo
CTn r H o o o o o oOV o m • n m i n m mr— 0 0 0 0 0 0 00 00 00 00
o o o o o o o om m m m i n m m i n00 oo 0 0 0 0 00 00 00 00
< d M W H h W hJ S i Z ’e-<!0fflHhWiJaizi'6-ft(0,(Ki(nN N N M M N N N N N n c o f o n n M n n n n r o n n nN N O J C M C v | M M C N | ( V l M ( S N C S C S f N | N N N N ( N M O J C v | NI I, I J, I I I I I I I I I I I I I I I I I I I Ipe|pi$p£ii*iptStfpcifsJpsip$<xjctfo$i*jp{ip!{a$C0f*!C0ia£iCtfefiil*J(l4pL4CMCMP^fllPL»pL|pMP-lP^PM^CMCUP^P-lPu«fLjP^PMpHP4pM
Reproduced with permission of the copyright owner. Further reproduction prohibited without permission.

Reproduced
with perm
ission of the
copyright ow
ner. Further
reproduction prohibited
without
permission.
Table 9 cont'd: Experiment Results from Pressure-Temperature___________________ Study with Pt-Re Catalyst_____________________
Balance No. Temgerature, Hydrocarbon________________ F____ Partial Press.fpsia
PR-24C 900 19PR-24D 900 28PR-24E 900 20PR-24F 900 28PR-24G 900 39PR-24H 900 39PR-241 900 20PR-24J 900 19PR-24K 900 10
Experimental Rate Constants, Hydrogen.Partial gm moles/hr-gm cat-atm. XI0^
195 49.56 18.72 20.44 7.61286 31.47 15.74 22.84 4.81292 42.35 24.13 34.28 9.57195 38.34 14.56 28.04 6.33273 24.68 11.75 16.84 4.61195 28.79 10.33 19.23 4.9197 52.74 13.42 24.72 5.86
195 46.38 18.45 41.28 7.52104 94.05 25.26 49.76 11.12
172

Table
10:
Expe
rime
ntal
Results
from
Pres
sure
-Tem
pera
ture
Study
with
Pt Ca
taly
st__
____
____
____
____
____
____
_
1 7 3
w*
o a u utd<u i4J W r t id PC otd M d M
•H 0) M <D <U He jw _
A!
.d
id _ •H id ±J *rl M 01 tt) P,
P-l "
a0)oo 9 O toM m -d <u >> MW cm
do,pm a)to MO PL«om i—iTO to!±) +J
MtO
PM
0)MSJ4JtO Pm MO <U P«H
O55a)oa
ato
< f t s o ^ a i n v o < r i n H i n g } t £ £ t N H t £ t N t N < NHO\oo\ooinfninrlN9\(*i<tO'NfOoomo'vD# # # • • • • • • • • • • • • • • • * •H H O O O O H O H n M M ^ H i O C O f N N H M
m o M N r N v o v o m o ^ c o o o c o N p ^ H ^ ^ ^ o o N N O O O O O N r s N H i n ^ f H C n ^ N v O N O O O H O • • • • • • • • • • * • • • * * • • • •c o < f m r o c v i c M t n c s i < j , O N O N O N c * 4 c o i n o o < i ; i n * s r r ^_| iwJ m J
vO'jD‘<f<NootNas>a-MfOHr^r>.inohr^.oooHOs O ' O ’y H o o y i r i O f O ' O N y H o o o y t o ' o* # • * • • • • « * • • • • • • • • • •n n N C O N H W H O O O O v O v O O f l N P M n - O t OH rH
trjoocntnoovovocoHfomcyvovovooinoooovom t f i P M O v o H « ® o y t o t n ' O O N i n N t o v o# # • • • • • • • * • • • • * • • * • •^Dinrn'jstnoocoinrsifioo\ts Htooooicooq
H H r I N CM H rH H H
u-tmmcMinfr)oo'omtntn'X><ti>'M3cMvo^icn^'c j \ C T > o o c r v a > t ^ c r . c r . o > a \ c r i O O o r ^ a N a N c o o \ r ^ . o \rH H CM CM H CM H H r H H C M r l f O r H C M r H r H c M
o o o i o c o o N m o o p P O t J ' O o o t o o o o o g j O 'CMCMCMCMCMCOrHnHrHCMCMrHOOHCMCMtMOOH
H O O O O O O O O O O O O O O O O O O Oo o o o o o o o o m t n m t n t n i r i i n m m i n t ncooooooooooooooooooooocooooooooocooooooo
< | O W H h « t J CM CM CM CM CM
a < i o r t H h W j j j c zvn im i'. vm cj cm n n cn to n cn n to n to co oo n C M C M C M C M C M C M C M C M C M C M C M C M C M C M C M C M C M C M C M C MI I I I I I I I I I I i I I ■ I I I 1 1PL)(MCUPh CMP<Ph CMCMCMP*CMPMP4Pm CMI:HCMP<Pi
Reproduced with permission of the copyright owner. Further reproduction prohibited without permission.
P-23Q
850
39 195
9.59
3.64
5.02
1.62
P-23R
850
52 262
6.94
3.14
3.16
1.40
P-23S
850
20 195
16.31
8.04
8.80
3.33
P-23E
901
20 195
46.30
20.07
28.18
9.09
P-23P
900
20 195
45.63
19.85
25.18
9.88

Reproduced
with perm
ission of the
copyright ow
ner. Further
reproduction prohibited
without
permission.
Table 10 cont*d: Experimental Results from Fressure-Temperature____________________ Study with Pt Catalyst_______
Experimental Rate Constants, Balance No. Temperature, Hydrocarbon Hydrogen Partial gm moles/br-pjm cat-atm TIP3
F Partial Pressure, psia Pressure, psia . . . .------- ------------------ *— e ---------- 1— k k k, k k,a b c d
P-24B 900 20 195 44.73 20.02 18.95 8.26P-24C 900 29 286 31.06 16.39 15.83 6.58P-24D 900 19 291 42.05 24.00 26.51 9.21P-24E 900 28 194 32.44 14.25 24.63 5,58P-24F 900 40 272 22.61 11.53 11.65 4.79P-24G 900 19 98 32.46 12.06 18.52 4.63P-24H 900 38 196 20.69 8.78 9.20 3.49P-24I 900 20 97 37.45 17.55 19.30 6.66P-24J 900 19 195 33.09 18.60 16.91 5.28
174

1 7 5
Of the experimental parameters examined the pressure parameter Is
the most difficult to correlate for one can usually correlate the
temperature effect with an Arrhenius type equation. There is no such
standard type of correlation for hydrogen and hydrocarbon partial
pressures. In fact, even with the relatively simple Langmuir-Hinshelwood
models the equation describing the relationship between the rate constant
and partial pressures can have many different forms as noted by Hougen
and W a t s o n . ^
Before considering the exact mathematical form of the correlation,
it is appropriate to examine graphically how the rate constants are
related to the pressure parameters. Figure 42-45 show the effect of
hydrocarbon partial pressure upon each of the four reaction rate
constants at a single temperature (850°F). The parameter in the figures
is hydrogen partial pressure. All four rate constants show a significant
relationship to the hydrocarbon partial pressure. On the other hand,
only ka , the rate constant for benzene production, (Figure 42) appears
to be affected by the hydrogen partial pressure. Each rate constant
increases sharply at low hydrocarbon pressures indicating that very
significant adsorption effects are present.
The data shown in Figure 42-45 indicate that the rate constants are
decreased by increasing hydrocarbon partial pressure and in one case the
hydrogen pressure. These results suggest that perhaps an equation of the
form below will correlate the data:. kp________
U + k H2PH2+ KHCPH2>n (4)
Where
k0 » Constant depending on temperature
Kh 2 ■ Hydrogen adsorption constant
Reproduced with permission of the copyright owner. Further reproduction prohibited without permission.

176
F I G U R E 4 2PRESSURE EFFECT ON RATE CONSTANT KA> PT-RE C R T ., BSoV LEGEND
0 10D P5JA H2 PflRTIRL PRESS. 0 200 P S lfl H2 PARTIAL PRESS. A 280 P S lfl H2 PARTIAL PRESS.
inmo
otoo
O
in(VI
EDCD
C E OQC
o
ino_ r -
5 0 .0 020.00 3 0 .0 0.00HYDROCARBON PARTIAL PRESSURE, PSIA
Reproduced with permission of the copyright owner. Further reproduction prohibited without permission.

1 7 7
F I G U R E 4 3PRESSURE EFFECT ON RATE CONSTANT Kg, PT-RE C flT .j B 50°F
LEGEND0 100 P S lfl H2 PARTIAL PRESS. © 200 P S lfl H2 PARTIAL PRESS. A 200 P S lfl H2 PARTIAL PRESS.
cv»
o
o.o
IO
c o °ZoCJt u g h- .. C C O DC
CJoo
oo
‘l l .O O 1 0 .0 0 2 0 .0 0 3 0 .0 0 4 0 .0 0 S O .0 0HYDROCARBON PARTIAL PRESSURE, PSIA
Reproduced with permission of the copyright owner. Further reproduction prohibited without permission.
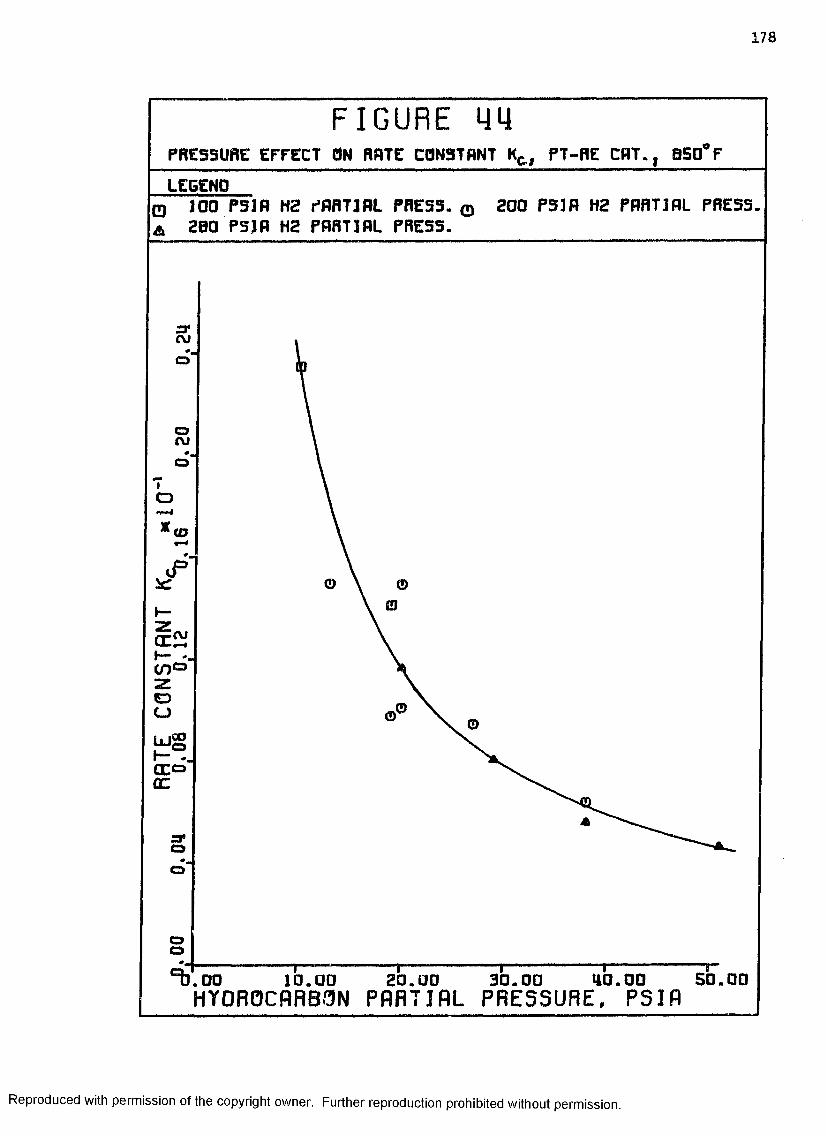
1 7 8
f i g u r e y yPRESSURE EFFECT ON RATE CONSTANT Kfr, PT-RE C A T ., 0 5 0 ° F
LEGENDD 100 PSIA H2 PARTIAL PRESS. 0 200 PSIA H2 PARTIAL PRESS. A 2B0 PSJA H2 PARTIAL PRESS.
src\»*.o
o(VI
OX CD
c e £I—cn0 z©ou j g I— C E O CC
a*o
l i^ b .o o 1 0 .0 0 2 0 .0 0 3 0 .0 0 4 0 .0 0 5 0 .0 0HYDROCARBON PARTIAL PRESSURE. PSIA
Reproduced with permission of the copyright owner. Further reproduction prohibited without permission.

1 7 9
F I G U R E 4 5PRE55URE EFFECT 3N RATE CONSTANT K0 , PT-AE C R T ., 0 5 0 °F
LEGEND0 100 P 5IR H2 PflRTIRL PRESS. 0 20 0 P5JR H2 PARTIAL PRESS. & 2 0 0 P S lfl H2 PARTIAL PRESS.
too
ino
O<r—«* =ro
maoo
e r gs~~c n °2 :©oU J ~ h- ..CE<=>OC
o • ao
oo
^ . 0 0 1 0 .0 0 2 0 .0 0 3 0 .0 0 4 0 .0 0 5 0 .0 0HYDROCARBON PARTIAL PRESSURE, PSIA
Reproduced with permission of the copyright owner. Further reproduction prohibited without permission.
1 8 0
K^c ■ Hydrocarbon adsorption constant
Ph 2 ■ Hydrogen partial pressure
Pr c " Hydrocarbon partial pressure
n ■ a constant depending on mechanism.
The form of this equation Is probably familar since it Is very similar to one
of the popular Langmuir-Hinshelwood models.
One might be tempted at this point to try all the equations
describing the many different Langmuir-Hinshelwood reaction models to
see which one gives the best "fit" to the experimental data. Then some
conclusion could be drawn about the most probable reaction mechanism.
However, as discussed in Chapter IV the particular reactions under
consideration are complex, involving several different reaction steps.
The four pseudo rate constants which are being correlated in this
chapter are probably complex functions of several single-step rate
constants. Equations (25) and (29) in Chapter IV illustrate the type of
functions one would expect two of these constants to be if the reaction
steps proposed in that chapter are correct. Even though the form of the
rate constant equations is probably very complex one would hope that a
simple correlation will adequately describe the data. Therefore, the
approach taken is to try several simple equations similar to the one on
page 57 and determine which one describes the data best.
A l l a n ^ in a study of the simultaneous dehydrogenation and
isomerization of cyclohexane concluded that either a single or dual site
type of equation describes his results equally well. His particular
equations had the form
k . h l ™ -------- (5)(1 + w “
Reproduced with permission of the copyright owner. Further reproduction prohibited without permission.

1 8 1
where n la one for a single site and two for a dual site form of the(3)correlation. Luzarraga In a study of the simultaneous Isomerization
and hydrocracking of MCP concluded that a dual site type of an equation
given by
ko KHCU + (6)
does an adequate job of correlating the observed pressure effects.
Because of the previous success with the equations above, they served
as the basis for the first attempt to develop the correlations needed
to describe pressure effects.
Equations of the form
k .ol (7)
1 + “h C PHC + V PH2)1 i
k .0l 72 (8)i (1 + Kyc PHC + Kjj PH )■
1 i
can be evaluated using linear regression techniques if they are
rearranged to the linear forms given by
h e h *1 1 , i . 2i /n\k, ~ k , k . PHC k , PH2 i oi oi oi A
i i + . noiv£~ V & T V U HC v^i 1,2
The next step is to regress all the pressure data at each temperature
level to determine which if either of the above equations adequately
describes the experimental data. The stepwise multiple regression
program described in Chapter IV was used. This program performs the
Reproduced with permission of the copyright owner. Further reproduction prohibited without permission.
1 8 2
inverse and the Inverse square root transformations necessary to
regress the experimental data. The program determines the most signifi
cant independent variable, either p ^ or p ^ , and then calculates the
least squares values of the two constants in the one-parameter equation.
Other statistical data are calculated including a multiple regression
coefficient. The program then calculates the least squares constants
when the second independent variable is included in the correlation as
well as the new correlation coefficient. With this stepwise regression
technique the user can decide whether or not both partial pressure terms
are necessary in the correlation.
All four rate constants were regressed at each temperature (800°,
850°, 900°F) using equations (9) and (10). The results from the
regression include three constants for equation (9) and three for
equation (10) at each temperature level for each of the four rate con
stants being regressed. The intercept constant in equation (9), 1/k
frequently had a negative value, forcing this form of the correlation to
be discarded. In the few cases in which this constant vat* not negative,
equation (9) did not produce a significantly better correlation than
equation (10). Therefore, equation (10) which corresponds to equation
(8) was the form selected to correlate all four constants at each
temperature.
All the sets of data correlated with equation (10) gave positive
values for the intercept and the constant associated with the hydrocarbon
partial pressure. In a few cases a negative hydrogen pressure coefficient
gave a slightly better "fit." When this happened or when the correlation
was not improved by the hydrogen pressure term, the third term on the
right side of equation (10) was dropped.
Reproduced with permission of the copyright owner. Further reproduction prohibited without permission.

1 8 3
Having determined the three constants in equation (10), one can
calculate values for the two adsorption equilibrium constants and the
rate constant, k ^ . After performing these calculations for 12 sets of
data (4 rate constants at 3 temperatures) it was observed that the
values of the adsorption equilibrium constants calculated for each of
the tour rate constants showed little variation with temperature.
Therefore, the data were regressed again using equation (10), but this
time the values of the adsorption equilibrium constants were forced to
retain the average values calculated from the previous regression
(average of the value obtained at the three temperatures). As a result
of this last regression the value of was determined at each of the
three temperatures. These results are plotted in Figures 46 and 47
which are Arrhenius type plots. Each data point in these figures
corresponds to a constant regressed from a set of experimental tests at
a given temperature but with different pressures. The rate constants
plotted in these figures correspond to the term in the numerator of the
equationkoi (8)
1 (1 + kbc / hc + * h 2 Ph 2 >1 i
As determined earlier, the adsorption equilibrium constants K^c and
Kjj are independent of temperature? therefore, all temperature depen-
dence of the experimental rate constant k^ must be incorporated in kQ^.
Figures 46 and 47 then are really Arrhenius plots of the four reaction
rate constants in the kinetic model. The fact that straight lines can
generally be drawn through the data indicates that the constant k ^ can
be correlated with temperature using the Arrhenius type equation
k » k Exp (— E*/RT) (11)oi oi
Reproduced with permission of the copyright owner. Further reproduction prohibited without permission.

1 8 4
F I G U R E 4 6EFFECT OF TEMPERATURE ON RATE C0N9TRNT3, PT-RE CRT
LEGENDOBOD
CVJ-
■E ^ E
0 , 7 8 0 . 0 00 . 7 2
Reproduced with permission of the copyright owner. Further reproduction prohibited without permission.

1 8 5
F I G U R E 4 7EFFECT 8F TEMPERATURE BN RATE CONSTANT9 , PT CRT.
LEGENDCD Q jjoeA ^©c 4* " O D
m-
09-00-r -(0in
tn-
Ofrx S • r -
to »■ Z in-
m -iX w ' IOCLen-oo-r -« -inor-fiO-
W H
0 .7 0 O'. 72 0.1H 0 o' 76l/T R xKXX).
0 .7 8 0 .8 0
Reproduced with permission of the copyright owner. Further reproduction prohibited without permission.
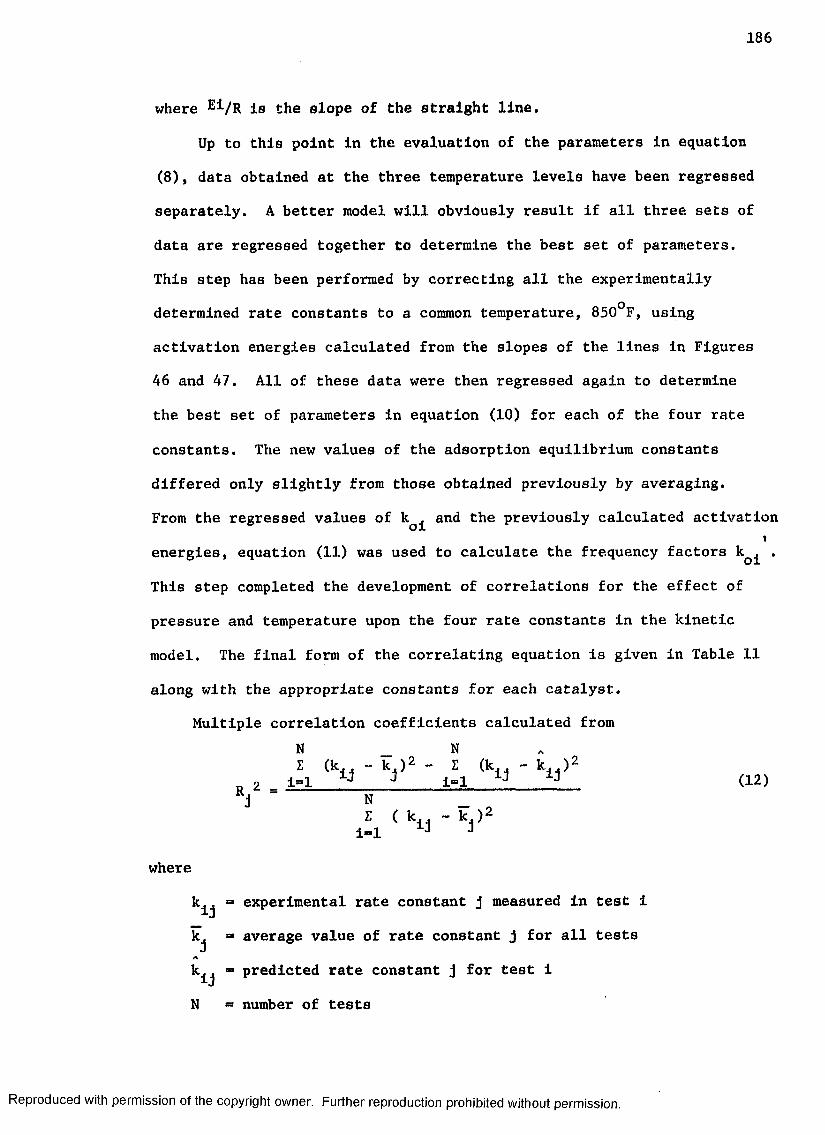
1 8 6
where eV r Is the slope of the straight line.
Up to this point in the evaluation of the parameters in equation
(8), data obtained at the three temperature levels have been regressed
separately. A better model will obviously result if all three sets of
data are regressed together to determine the best set of parameters.
This step has been performed by correcting all the experimentally
determined rate constants to a common temperature, 850°F, using
activation energies calculated from the slopes of the lines in Figures
46 and 47. All of these data were then regressed again to determine
the best set of parameters in equation (10) for each of the four rate
constants. The new values of the adsorption equilibrium constants
differed only slightly from those obtained previously by averaging.
From the regressed values of k ^ and the previously calculated activationf
energies, equation (11) was used to calculate the frequency factors .
This step completed the development of correlations for the effect of
pressure and temperature upon the four rate constants in the kinetic
model. The final form of the correlating equation is given in Table 11
along with the appropriate constants for each catalyst.
Multiple correlation coefficients calculated from N NE (k,. - k.)2 - E (k,. - k,.) 2
„ , 1=1 « J 1=1 1J « (12)j -----5----- 1-------£ ( k, - k )2
i=l J 3
where
kjj =* experimental rate constant j measured in test i
kj - average value of rate constant j for all tests
k^j ■ predicted rate constant j for test i
N " number of tests
Reproduced with permission of the copyright owner. Further reproduction prohibited without permission.
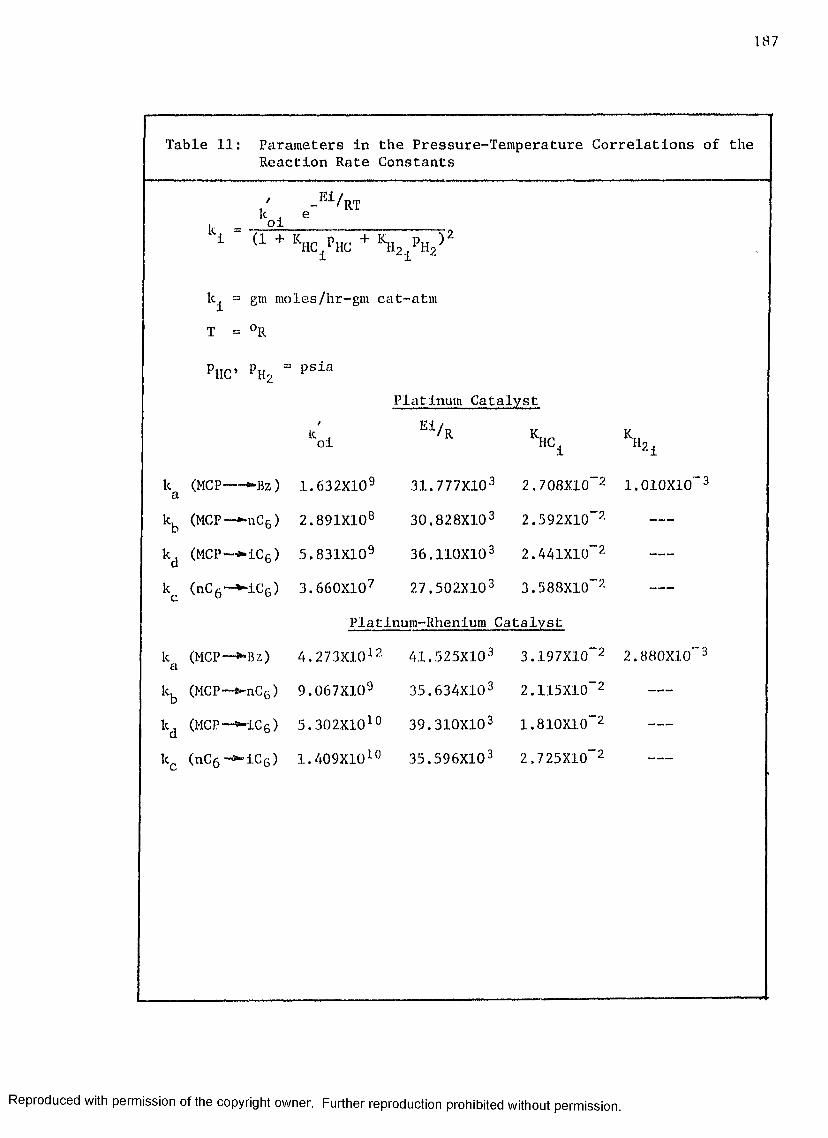
187
Table 11: Parameters in the Pressure-Temperature Correlations of theReaction Rate Constants
-H11
_E1/RTe1 ( 1 +
1SlCiPHC + ^ 2
k^ = gm mo les/hr-gm cat-atm
T = °R
PHC’ PHZ 1 psia
Platinum Catalyst/
k . oi E 1 / r ^Cj, V
ka (MCP---**Bz) 1.632.X109 31.777X10³ 2.708X10"’2 1.010X10" 3
kb (MCP— **nC6) 2.891X10⁸ 30.828X10³ 2.592X10"'2 ---
kd (MCP— **iC6) 5.831X10⁹ 36.110X10³ 2.441X10""2 ---
kc (nC 6 ~*-iC6) 3.660X10⁷ 27.502X10³ 3.588X10"•2 ---
Platinum-Rhenium Catalyst
ka (MCP— **Bz) 4.273X10¹² 41.525X10³ 3.197X10"'2 2.880X10"3
kb (MCP— »~nC6) 9.G67X1G9 35.634X10³ 2.115X10”2 ---
kd (MCP *“iC6) 5.302X10¹⁰ 39.310X10³ 1.810X10" 2 ---
kc (nC6 ~*~iC6) 1.409X10¹⁰ 35.596X10³ 2,725X10" 2 ---
Reproduced with permission of the copyright owner. Further reproduction prohibited without permission.

1 8 8
are tabulated below for the four rate constants calculated with each
catalyst.
Rate Constant Correlation Coefflcient .Rk k, k k,a d c d
Pt Catalyst Pressure Studies 0.964 0.956 0.920 0.928
Pt-Re Catalyst Pressure Studies 0.991 0.972 0.909 0.951
The high values of these correlation coefficients indicate that the
model in Table 11 adequately describes the effect of pressure and
temperature upon the kinetic model rate constants.
Parity plots which are a comparison between the predicted and
experimental rate constants are presented in Figures 48-51. All the
data obtained in the pressure-temperature studies are included in these
figures. These figures confirm the conclusion stated above that the
pressure-temperature effect on the rate constants has been adequately
correlated.
Before concluding this chapter several observations about the
values of the parameters in Table 11 need to be made. Activation
energies for the Pt-Re catalyst are consistently higher than those for
the Pt catalyst. The hydrocarbon adsorption parameters , are about
the same size for each catalyst. The hydrogen adsorption parameter in
the rate constant for the reaction of MCP to benzene, however, is much
larger for the Pt-Re catalyst. This indicates that hydrogen has a larger
inhibition effect with the Pt-Re catalyst which could mean that hydrogen
is more strongly adsorbed on this catalyst. More hydrogen adsorbed on
the catalytic surface could tend to keep the surface free of heavy
unsaturated hydrocarbons that are coke precursors. This could be a par
tial explanation of the better activity maintenance observed with the
Reproduced with permission of the copyright owner. Further reproduction prohibited without permission.

1 8 9
Pt-Re catalyst.
The value of the term kQi In the correlating equation (11) repre
sents the catalyst activity for a specific reaction. The value of this
constant for each of the four reactions is consistently lower for the
Pt-Re catalyst indicating that this catalyst has a slightly lower
activity. This result is not unreasonable when one considers that the
Pt-Re catalyst had to be subjected to a much longer lineout operation
before its selectivity ceased to change with further age. The somewhat
higher coke level (1.69 vs. 1.34 percent) on the equilibrated Pt-Re
catalyst reflects this more severe lineout operation.
Reproduced with permission of the copyright owner. Further reproduction prohibited without permission.
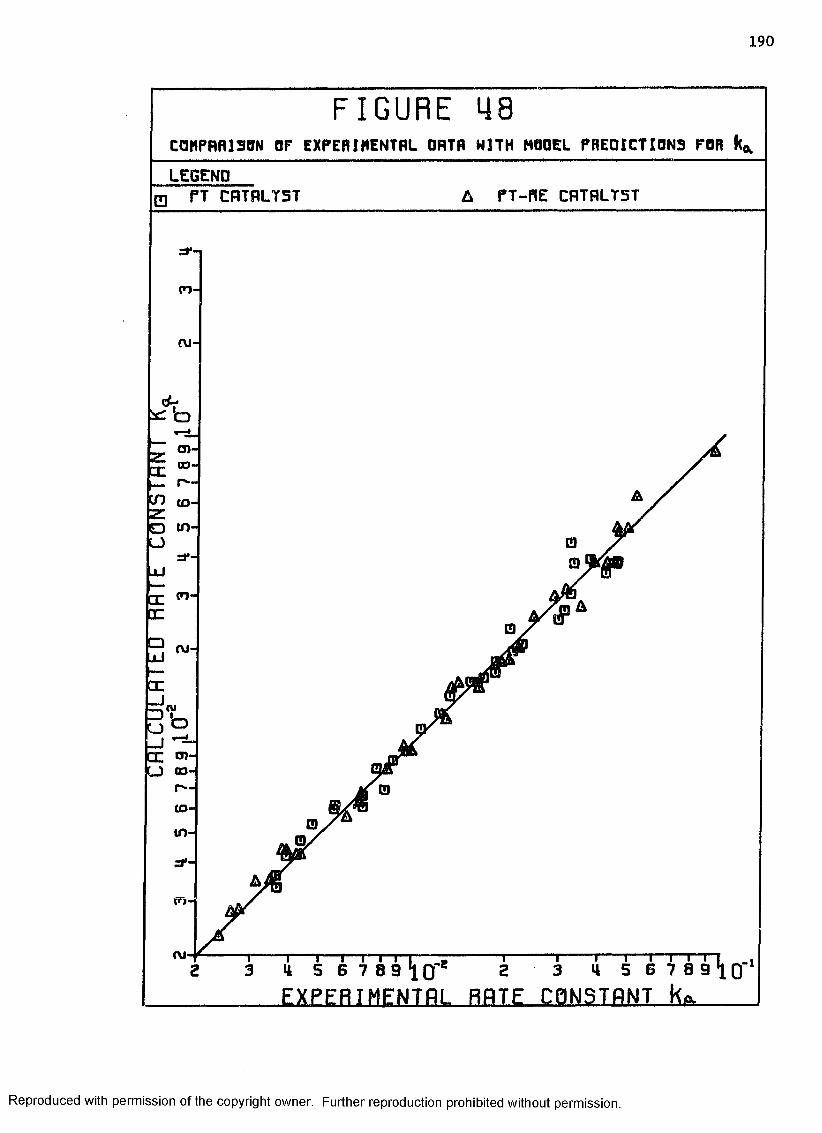
190
FIGURE 48CQMPRR1S0N OF EXPERIMENTAL ORTR N1TH MODEL PREDICTIONS FORLEGEND
Q PT CRTRLT5T A PT-RE CRTRLT5T
(n-
tu>
ctD
— CT)-z:X 00-_ r —in ta zED in -U
zr-xJ
X <n-DC
CD rvi-xJ
X__. CM
.j «-dL.X cou in-
t— i— n r i— —5 6 7 8 9 1 0 "
i— i— i— !— r~t5 B 7 8 9 1 0 '
EXPERIMENTAL RATE CONSTANT Ka
Reproduced with permission of the copyright owner. Further reproduction prohibited without permission.

1 9 1
F I G U R E 4 9COMPRRJSON OF EXPERIMENTAL DATA M1TH MODEL PREDICTIONS FOR K|LEGEND
A PT-flE CATALYSTPT CATALYST
o>-03-r—<30
1C
r lf1’CC
ru H AUJ
__ cn~ X_j i—ID to-U I in-
cn-
cu-
,-sEXPERIMENTAL RATE CONSTANT k
Reproduced with permission of the copyright owner. Further reproduction prohibited without permission.
1 9 2
FIGURE 50COMPARISON OF EXPERIMENTAL ORTR HJTH MODEL PREDICTIONS FOR k,LEGEND
□ PT CRTRLT5T A PT-RE CRTRLT5T
J i on
t— i— r"" r 1I I— *5 6 7 8 9 ] 0EXPERIMENTAL RATE CONSTANT Kc.
Reproduced with permission of the copyright owner. Further reproduction prohibited without permission.

1 9 3
FIGURE 51COMPARISON OF EXPERIMENTAL ORTR H3TH HOOEL PREDICTIONS FORLEGEND
CD PT CRTRLTST PT-RE CflTflLTST
oo-r--uoin-=r-
cn-'Tj
_ <V-zXT)zMb
o «-SLU 0>-
00-JL»r—X to-X tn-EDJjX cn--JZDU_J CVJ-Xu
m ciA
&
T H l-TTl -S 6 7 B 9 1QT
I1 i r~r i-i— Zi5 B 7 0 9 1 0
EXPERIMENTAL RATE CBNSTANT K
Reproduced with permission of the copyright owner. Further reproduction prohibited without permission.
LIST OF REFERENCES - CHAPTER VII
1. Allan, D. E., "The Dehydrogenation and Isomerization of CyclohexaneOver a Platinum Alumina Mordenite Catalyst," Ph.D. dissertation, Department of Chemical Engineering, Louisiana State University.
2. Hougen, 0. A. and Watson, K. M . , Chemical Process Principles. PartIII. Kinetics and CatalyslBfJohn Wiley and Sons, New York, New York, 1947.
3. Luzarraga, M. G . , "Hydroisomerization and Hydrocracking of Cyclohexane Over a Faujasite Catalyst," Ph.D. dissertation, Department of Chemical Engineering, Louisiana State University, 1971.
4. Sinfelt, J. H. and Rohrer, J. C., "Kinetics of the CatalyticIsomerization-Dehydroisomerization of Methylcyclopentane,"Journal of Physical Chemistry, 65, 978 (1961).
5. Smith, R. L. , Naro, P. A. and Silvestrl, A. J., "Reaction Paths forDecyclization of Methylcyclopentane Over Pt/Al203 Catalyst," Journal of Catalysis, 20. 359 (1971).
194
Reproduced with permission of the copyright owner. Further reproduction prohibited without permission.

CHAPTER V I I I
CONCLUSIONS
Several primary objectives have been the guiding force behind the
Investigation discussed in the previous chapters. Experimental data were
obtained which hopefully would
1. Elucidate further the reaction mechanisms occurring in the
catalytic reforming of methylcyclopentane,
2. Provide the necessary information for the development of a
kinetic model,
3. Illustrate basic differences between Pt and Pt-Re reforming
catalysts,
4. Provide practical information that could be utilized to optimize
aromatic production from C^ naphthenes.
The principal conclusions reached in each of the above four areas are
summarized in the remainder of this chapter.
A. Reaction Mechanism for Catalytic Reforming of Methylcyclopentane
The experimental program was initiated by searching for the presence
of either external mass transfer or pore diffusion effects. These
reaction steps were found to be unimportant ever the range of conditions
investigated, so one can conclude that the data measured in this study
reflect the behavior at the catalyst surface only.
In the course of equilibrating the fresh catalyst several obser
vations were made which have a bearing on reaction mechanism. The
195
Reproduced with permission of the copyright owner. Further reproduction prohibited without permission.
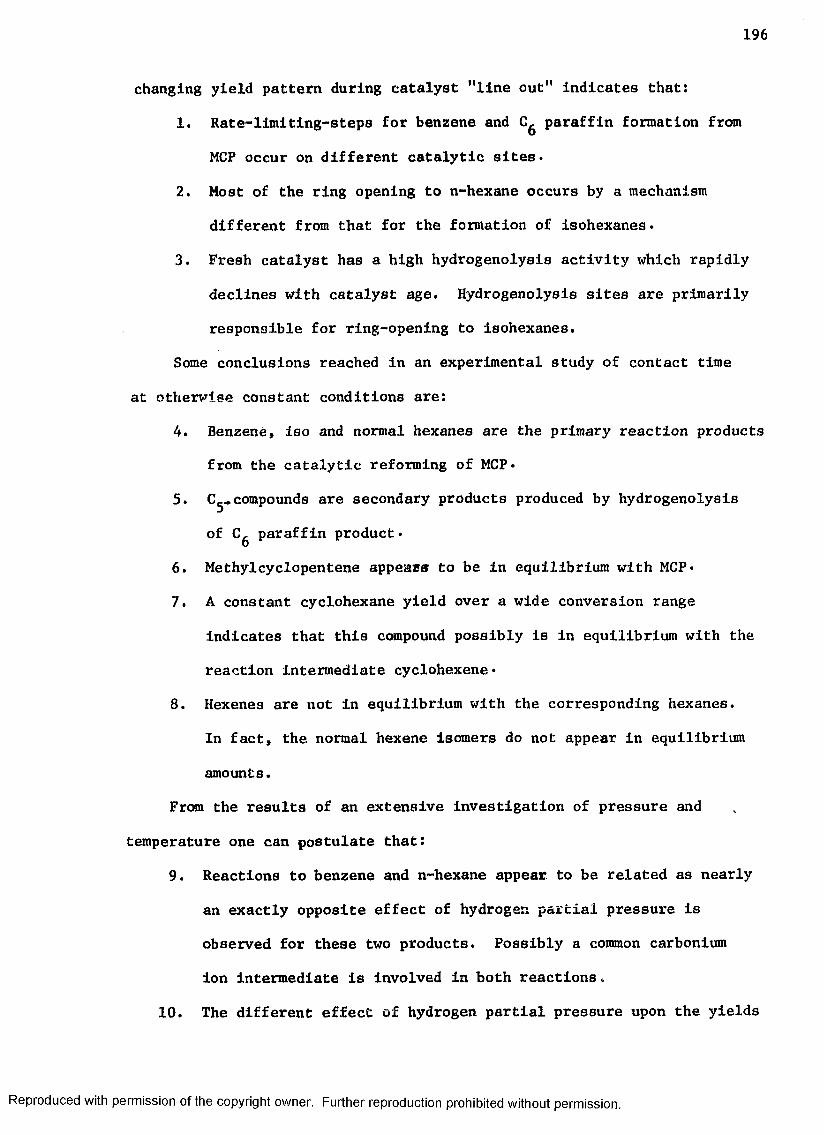
196
changing yield pattern during catalyst "line out" Indicates that:
1. Rate-limiting-steps for benzene and paraffin formation from
MCP occur on different catalytic sites •
2. Most of the ring opening to n-hexane occurs by a mechanism
different from that for the formation of lsohexanes.
3. Fresh catalyst has a high hydrogenolysis activity which rapidly
declines with catalyst age. Hydrogenolysis sites are primarily
responsible for ring-opening to isohexanes.
Some conclusions reached in an experimental study of contact time
at otherwise constant conditions are:
4. Benzene, iso and normal hexanes are the primary reaction products
from the catalytic reforming of MCP.
5. Cg.compounds are secondary products produced by hydrogenolysis
of Cg paraffin product*
6. Methylcyclopentene appears to be in equilibrium with MCP*
7. A constant cyclohexane yield over a wide conversion range
indicates that this compound possibly is in equilibrium with the
reaction intermediate cyclohexene *
8. Hexenes are not in equilibrium with the corresponding hexanes.
In fact, the normal hexene isomers do not appear in equilibrium
amounts.
From the results of an extensive investigation of pressure and
temperature one can postulate that:
9. Reactions to benzene and n-hexane appear to be related as nearly
an exactly opposite effect of hydrogen partial pressure is
observed for these two products. Possibly a common carbonium
ion intermediate is involved in both reactions„
10. The different effect of hydrogen partial pressure upon the yields
Reproduced with permission of the copyright owner. Further reproduction prohibited without permission.

of n-hexane and the various lsohexanes offers further evidence
that at least two ring-opening mechanisms exist.
11. There appears to be several different types of metal catalytic
sites which undergo substantially different deactivation behavior.
Operating the Pt catalyst at low pressure and high temperature
causes deactivation which reduces benzene yield, increases olefin
yields, but does not affect the yield of lsohexanes. This result
suggests that the metal sites on which cyclohexene is dehydro
genated to benzene are very susceptible to deactivation while
the metal hydrogenloysis sites resist deactivation.
B. Kinetic Model for Methylcyclopentane Reforming
In the development of a kinetic model, the following steps have been
sucessfully implemented:
1. The generally accepted reaction scheme for MCP with dual
function catalysts has been simplified to the scheme
where each path is a first order, reversible reaction with
constant reaction rate constants.
2. The solution to this reaction network has been obtained through
the use of Laplace-Carson transforms. The result is a set of
four very complex equations expressing yields of the four major
components as a function of space time, initial concentrations,
and the set of rate constants.
3. The validity of this kinetic model has been confirmed with
experimental data covering a wide range of contact times .
with permission of the copyright owner. Further reproduction prohibited without permission.
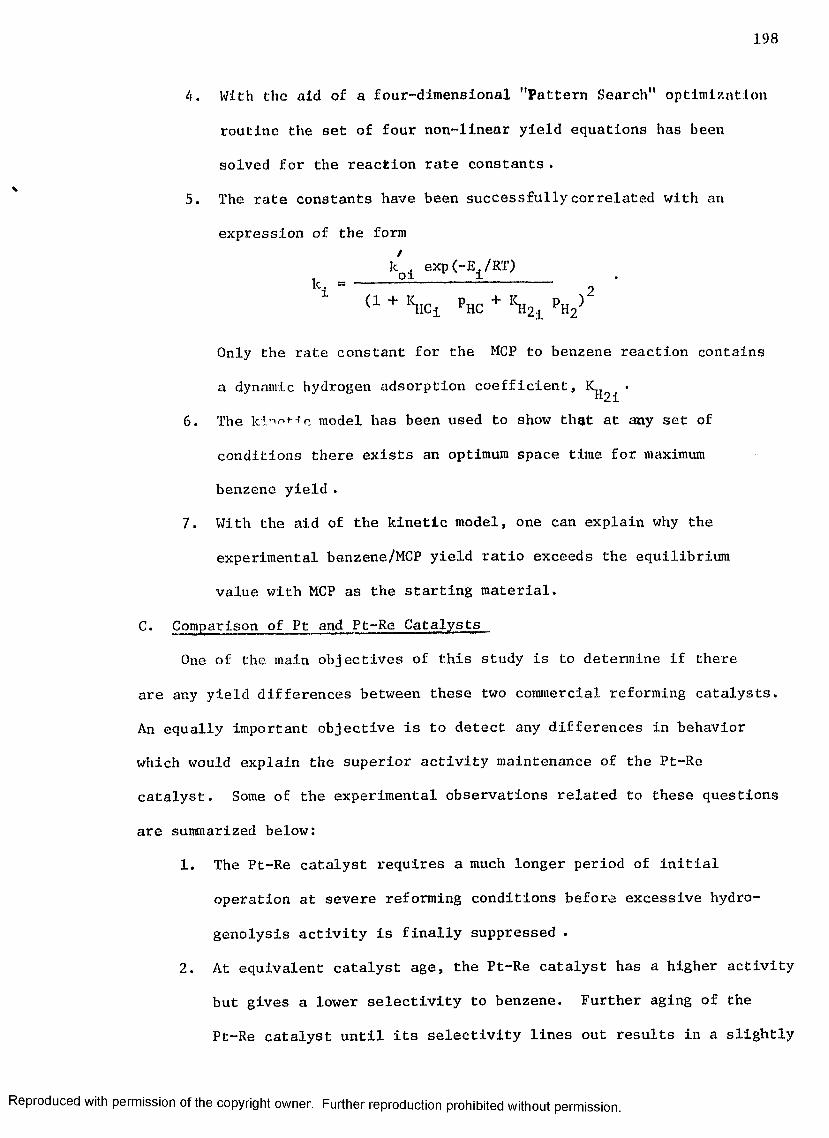
198
4. With the aid of a four-dimensional "Pattern Search" optimization
routine the set of four non-linear yield equations has been
solved for the reaction rate constants .
5. The rate constants have been successfully correlated with an
expression of the form
kol exp(-Ei/RT)lc
1 <1 + V l PHC + %
Only the rate constant for the MCP to benzene reaction contains
a dynamic hydrogen adsorption coefficient, '
6 . The k:! r**-?r. model has been used to show that at any set of
conditions there exists an optimum space time for maximum
benzene yield .
7. With the aid of the kinetic model, one can explain why the
experimental benzene/MCP yield ratio exceeds the equilibrium
value with MCP as the starting material.
C. Comparison of Pt and Pt-Re Catalysts
One of the main objectives of this study is to determine if there
are any yield differences between these two commercial reforming catalysts.
An equally important objective is to detect any differences in behavior
which would explain the superior activity maintenance of the Pt-Re
catalyst. Some of the experimental observations related to these questions
are summarized below:
1. The Pt-Re catalyst requires a much longer period of initial
operation at severe reforming conditions before excessive hydro
genolysis activity is finally suppressed .
2. At equivalent catalyst age, the Pt-Re catalyst has a higher activity
but gives a lower selectivity to benzene. Further aging of the
Pt-Re catalyst until its selectivity lines out results in a slightly
Reproduced with permission of the copyright owner. Further reproduction prohibited without permission.
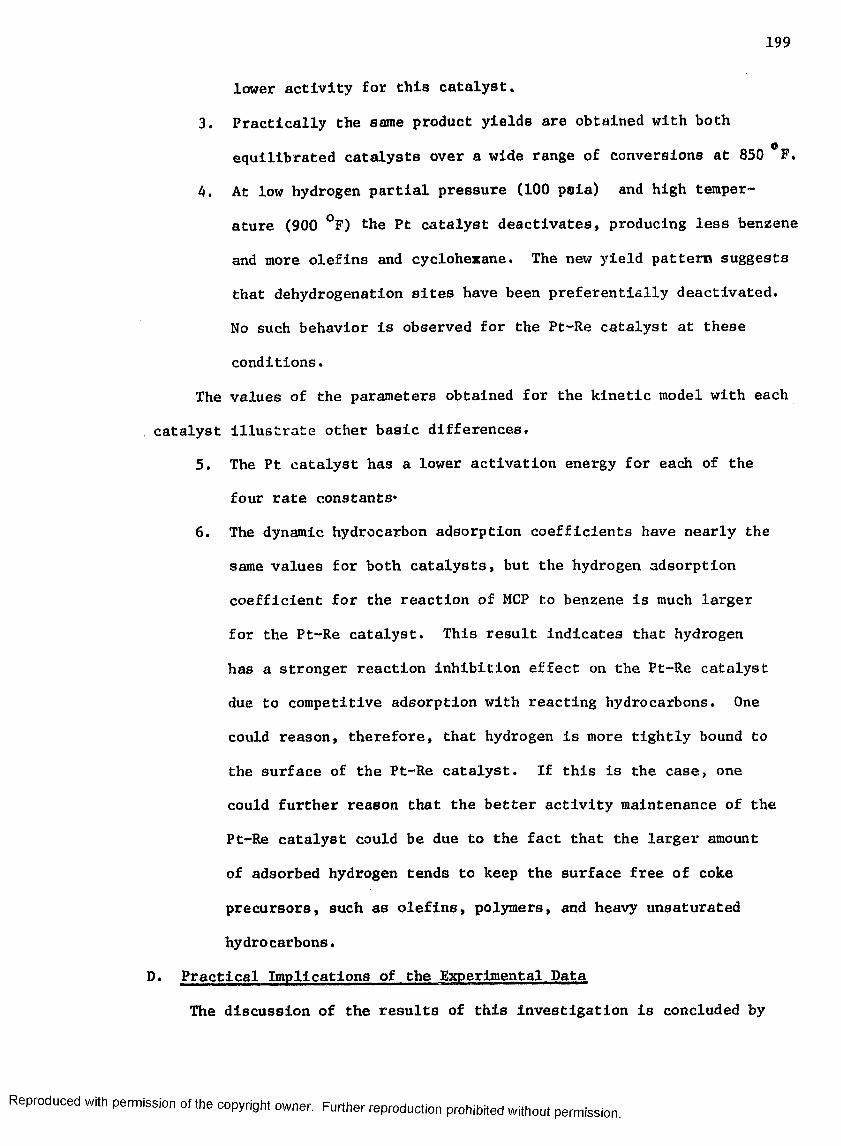
lower activity for this catalyst.
3. Practically the same product yields are obtained with both0equilibrated catalysts over a wide range of conversions at 850 F,
4. At low hydrogen partial pressure (100 psia) and high temper
ature (900 °F) the Pt catalyst deactivates, producing less benzene
and more olefins and cyclohexane. The new yield pattern suggests
that dehydrogenation sites have been preferentially deactivated.
No such behavior is observed for the Pt-Re catalyst at these
conditions.
The values of the parameters obtained for the kinetic model with each
catalyst illustrate other basic differences.
5. The Pt catalyst has a lower activation energy for each of the
four rate constants*
6. The dynamic hydrocarbon adsorption coefficients have nearly the
same values for both catalysts, but the hydrogen adsorption
coefficient for the reaction of MCP to benzene is much larger
for the Pt-Re catalyst. This result indicates that hydrogen
has a stronger reaction inhibition effect on the Pt-Re catalyst
due to competitive adsorption with reacting hydrocarbons. One
could reason, therefore, that hydrogen is more tightly bound to
the surface of the Pt-Re catalyst. If this is the case, one
could further reason that the better activity maintenance of the
Pt-Re catalyst could be due to the fact that the larger amount
of adsorbed hydrogen tends to keep the surface free of coke
precursors, such as olefins, polymers, and heavy unsaturated
hydrocarbons.
D. Practical Implications of the Experimental Data
The discussion of the results of this investigation is concluded by
with permission of the copyright owner. Further reproduction prohibited without permission.

200
stating some practical aspects of the experimental findings discussed
in previous chapters.
1. Selectivity for the conversion of naphthenes to aromatlcs
may be low until 1-2 per cent coke is deposited on the fresh
catalyst. This is due to the high initial hydrogenolysis activity
that these catalysts have, especially the Pt-Re catalyst.
2. Both catalysts eventually "line out" at the same level of selectiv
ity to aromatlcs from naphthenes.
3. A high aromatic selectivity is favored by low hydrogen partial
pressure and high temperature. Little effect of temperature,
however, is observed at low hydrogen pressures (100 psia).
4. An optimum contact time exists for maximum aromatlcs yield fro®
naphthenes in a once-through operation.
5. The hydrogen/feed mole ratio has little effect upon product
selectivity.
6. The Pt catalyst deactivates at 900 °F, 100 psig, and 5 moles
hydrogen/mole feed with MCP feed, whereas the Pt-Re catalyst has
better activity maintenance at these conditions.
7. Operation with the Pt-Re catalyst at lower hydrogen partial
pressures and higher temperature than for conventional reforming
is probably practicable from an activity maintenance standpoint.
Reproduced with permission of the copyright owner. Further reproduction prohibited without permission.

CHAPTER IX
RECOMMENDATIONS
It indeed would be nice if every experimental program undertaken
provided all the answers to all the questions. Quite frequently, how
ever, the difficulty is not one of finding the answer, so much as it is
asking the proper questions. Many times the relevant questions are only
developed after a better understanding of the problem has been gained
through experimental studies. A very worthwhile outcome of any experi
mental program, therefore, 16 the definition of areas which need further
investigation. This is the purpose of this chapter.
A principal difference between the Pt-Re and Pt reforming catalysts
is that the former apparently is more resistant to deactivation. This
study has shown that a great part of a dual-function catalyst's lost
activity is due to deactivation of the metal catalytic sites. Further
more, this study has indicated that the Pt-Re catalyst has better
activity maintenance possibly because hydrogen, which keeps the catalyst
surface clean, is more strongly adsorbed on this catalyst. Additional
studies designed to investigate this hypothesis seem worthwhile. For
instance, hydrogen adsorption studies with "aged" Pt and Pt-Re catalysts
might provide some revealing results.
Other data obtained In this study suggest that there are several
different types of metal catalytic sites that are responsible for
different reactions. For instance, hydrogenolysis, dehydrogenation of
201
with permission of the copyright owner. Further reproduction prohibited without permission.
202
cyclohexane and hydrogenation of cyclohexfcne apparently occur on
different metal sites. An experimental program designed to charac
terize these different types of sites seems very likely to contribute
to a better understanding of the complex reactions on these catalysts.
Such a program could probably utilize the observation made in this
study that some of the metal sites are preferentially deactivated over
the others.
An experimental study similar to the one discussed in this
dissertation, except with a different reforming reaction might provide
further distinctions between the Pt aijid Pt-Re catalysts. A good candi
date for such a study would be the catalytic reforming of either heptane
or octane since dehydrocyclization occurs through a different type of
reaction mechanism.
An obvious area for further investigation is alumina base catalysts
with different metal components. The study of a series of different
metals with platinum could possibly provide clues for the role of the
second metal. Metal combinations not including platinum could possibly
provide interesting results.
Reproduced with permission of the copyright owner. Further reproduction prohibited without permission.
^EPENDIX A
NOMENCLATURE
Reproduced with permission of the copyright owner. Further reproduction prohibited without permission.

A P P E N D IX A
NOMENCLATURE
A - Designation for acid reaction sitet, - AngstromB - Benzene partial pressure symbolC - Cyclohexane partial pressure symbolC. - Unconverted reactant concentration in reactor withA
dispersionC^p - Unconverted reactant concentration in ideal plug flow
reactorCg - Reactant concentration at catalyst surface, gm mole/cmCST - Symbol for constant fTF/N^c - Cyclohexene partial pressure symbol
2De££ - Effective diffusivity, cm /secE^ - Activation energy for reaction iF - Hydrocarbon feed rate, gm/hr-f^ - function expressing yield of component iH,HPP - Hydrogen partial pressure symbolsI - Isohexane partial pressure symboli - Isohexene partial pressure symbolK - Equilibrium constantK - Set of rate constants k . .t J _Kj - Equilibrium constant for reaction MCP MCP Ka - Simplified equilibrium constant for reaction
I(MCP + MCP") t-Bz
- Equilibrium constant for reaction MCP *»Bz- Simplified equilibrium constant for reaction
(MCP + MCP=) * n C 6- Equilibrium constant for reaction MCP— ►nC^
Kc ,Kc - Equilibrium constant for reaction nC^ iC^- Simplified equilibrium constant for reaction
(MCP + MCP=) *»iC6
204
Reproduced with permission of the copyright owner. Further reproduction prohibited without permission.
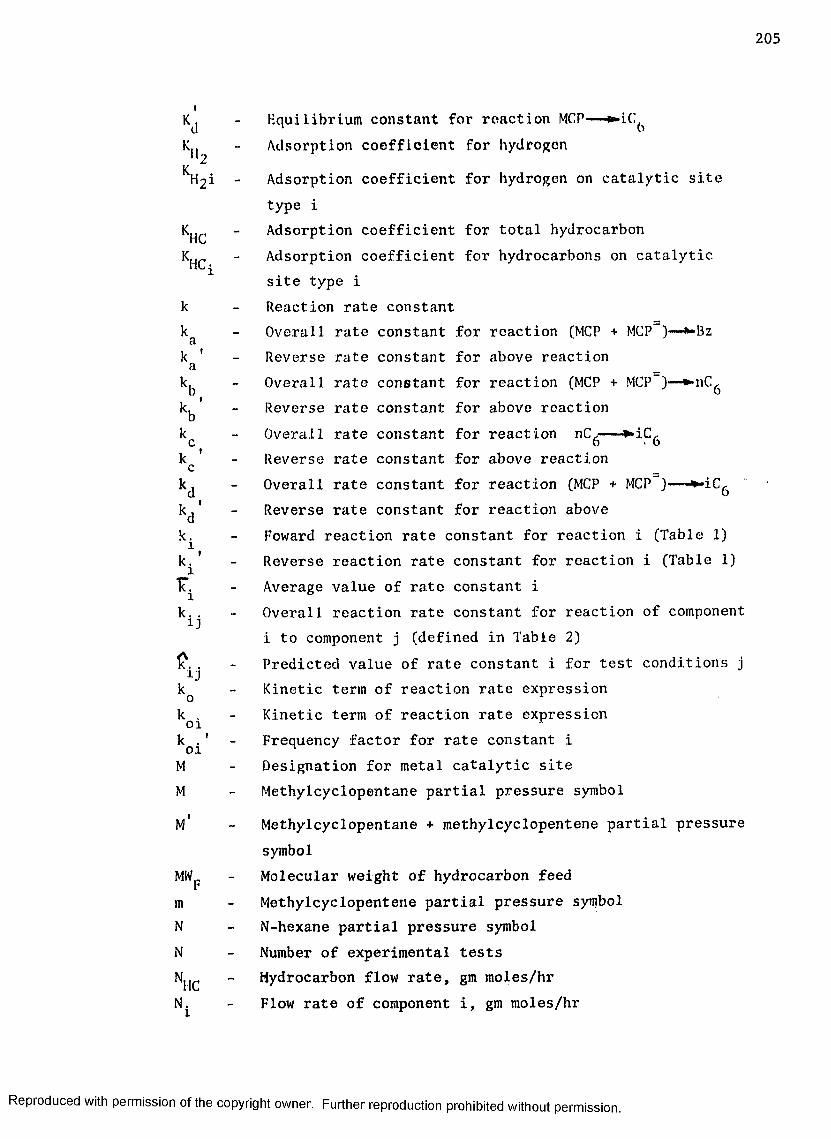
205
tK i - Equilibrium constant for reaction MCP—K., - Adsorption coefficient for hydrogen
2H2i - Adsorption coefficient for hydrogen on catalytic site
type iK |c - Adsorption coefficient for total hydrocarbonKj , - Adsorption coefficient for hydrocarbons on catalytic
site type i k - Reaction rate constantk - Overall rate constant for reaction (MCP + MCP-)— **Bz3.k ' - Reverse rate constant for above reactionak^ - Overall rate constant for reaction (MCP + MCP-)—k ' - Reverse rate constant for above reactionbk - Overall rate constant for reaction nC, ^iC,-c o • ok - Reverse rate constant for above reactionc
- Overall rate constant for reaction (MCP + MCP )—k,* - Reverse rate constant for reaction abovedk^ - Foward reaction rate constant for reaction i (Table 1)k^' - Reverse reaction rate constant for reaction i (Table 1)T<\ - Average value of rate constant ik ^ - Overall reaction rate constant for reaction of component
i to component j (defined in Table 2)1?. . - Predicted value of rate constant i for test conditions jkQ - Kinetic term of reaction rate expressionk . - Kinetic term of reaction rate expressionoi rkQ^ 1 - Frequency factor for rate constant iM - Designation for metal catalytic siteM - Methylcyclopentane partial pressure symbol
M* - Methylcyclopentane + methylcyclopentene partial pressuresymbol
MW - Molecular weight of hydrocarbon feedr
m - Methylcyclopentene partial pressure symbolN - N-hexane partial pressure symbolN - Number of experimental testsNfic ~ Hydrocarbon flow rate, gm moles/hrN. - Flow rate of component i, gm moles/hr
Reproduced with permission of the copyright owner. Further reproduction prohibited without permission.

2 0 6
Nrf - Total flow rate, gm moles/hrn - N-hexene partial pressure symboln - Bxponent adsorption term in rate constant correlation P (1) - Symbol for rate constant k in optimization programclP(2) - Symbol for rate constant k^ in optimization programP(3) - Symbol for rate constant k in optimizaion programcP(4) - Symbol for rate constant k^ in optimization programPj - Partial pressure of component iPe - Peclet numberr - Reaction rate of component A, gm moles/hr-gm cat.R - Moles hydrogen diluent/ mole hydrocarbon feedR - Average particle radius, cmR - Correlation coefficientR^ - Redidual difference between experimental and predicted
valuesR ^ - Residual difference between experimental and predicted
valuesRe^ - Particle Reynold's numberT - Temperature, °RW,Wc - Catalyst weightx - ConversionY^ - Concentration of component i in feed, hydrogen-free basisY - Set of all Y.o xyj,y^f- Methylcyclopentane + methylcyclopentene mole fraction,
hydrogen-free basis y^t Yj ~ Isohexane mole fraction, hydrogen-free basis^3 ’ N ~ N-hexane mole fraction, hydrogen-free basis
^4*^8 - Benzene mole fraction, hydrogen-free basisy£ - Cyclohexane mole fraction, hydrogen-free basisy. - Mole fraction of component iyf - Mole fraction of component i, hydrogen-free basisy! - Average value of mole fraction of component i in the
product of a number of tests $!j - Predicted mole fraction of component i in test jy ^ ' - Mole fraction of component i in test j
Reproduced with permission of the copyright owner. Further reproduction prohibited without permission.
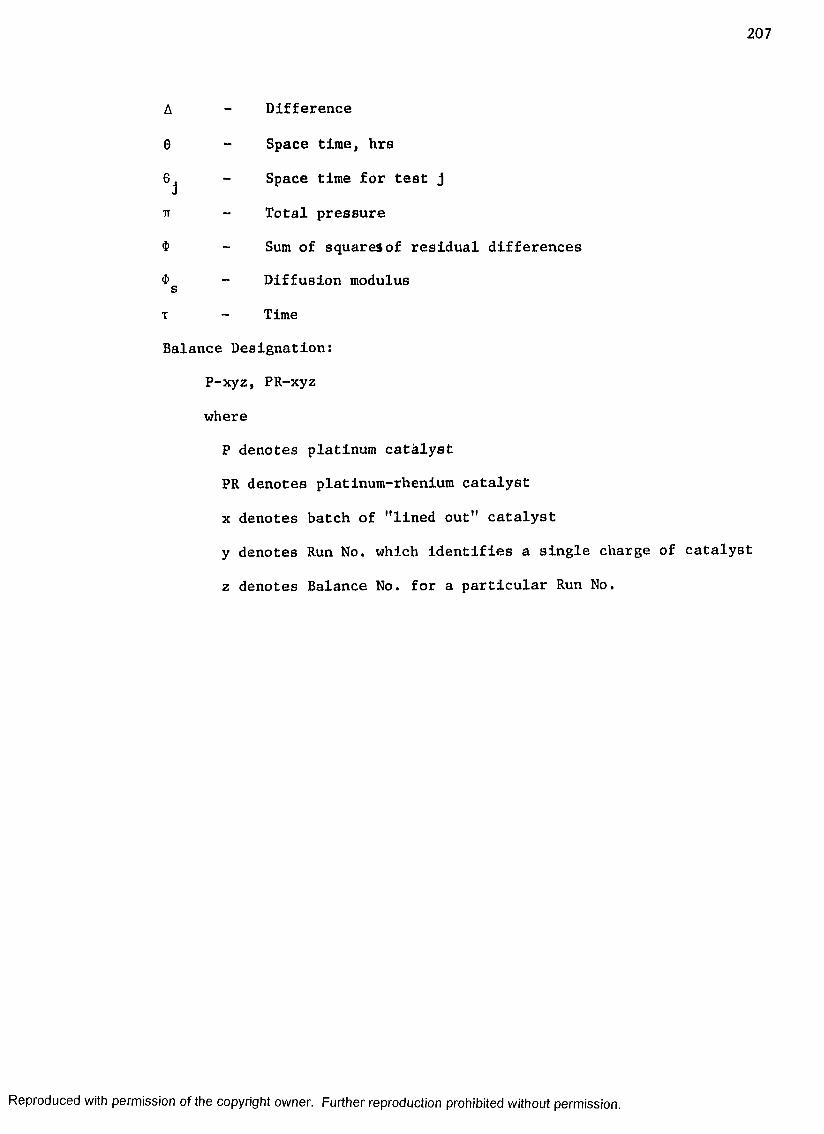
2 0 7
A — Difference
8 ~ Space time, hrs
6j - Space time for test j
IT - Total pressure
<s> _ Sum of squares of residual differences
$s - Diffusion modulus
T Time
Balance Designation:
P-xyz, PR-xyz
where
P denotes platinum catalyst
PR denotes platinum-rhenium catalyst
x denotes batch of "lined out" catalyst
y denotes Run No. which identifies a single charge of catalyst
z denotes Balance No. for a particular Run No.
Reproduced with permission of the copyright owner. Further reproduction prohibited without permission.

APPENDIX
EXPERIMENTAL DATA WITH
B
PT-RE CATALYST
Reproduced with permission of the copyright owner. Further reproduction prohibited without permission.
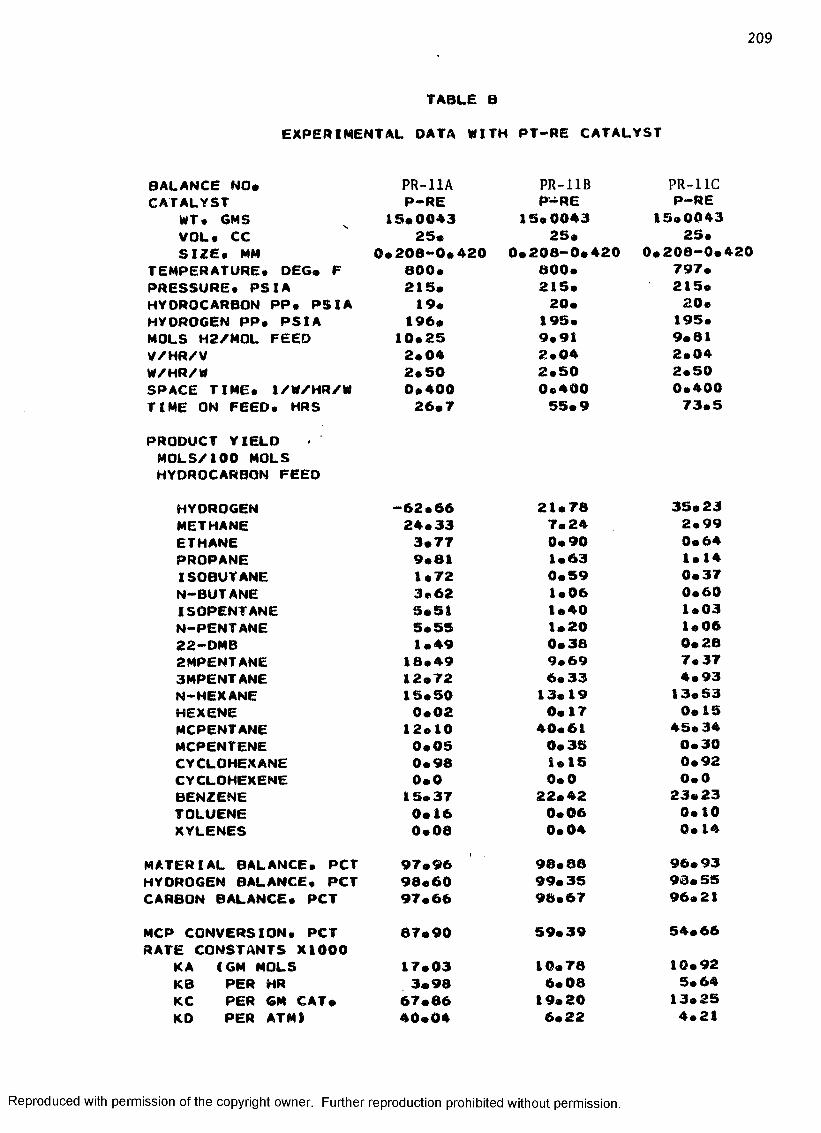
2 0 9
TABLE B
EXPERIMENTAL OATA WITH PT-RE CATALYST
BALANCE NO*CATALYST
WT• GMS VOL* CC SIZE* MM
TEMPERATURE* DEC* F PRESSURE* PS IA HYDROCARBON PP* PSIA HYDROGEN PP* PSIA MOLS H2/MOL FEED V/HR/V W/HR/WSPACE TIME* I/W/HR/W TIME ON FEED* HRSPRODUCT YIELD MOLS/100 MOLS HYDROCARBON FEED
HYDROGENMETHANEETHANEPROPANEISOBUTANEN~BUTANEISOPENTANEN-PENTANE22-DMB2MPENTANE3MPENTANEN-HEXANEHEXENEMCPENTANEMCPENTENECYCLOHEXANECYCLOHEXENEBENZENETOLUENEXYLENES
MATERIAL BALANCE* PCT HYOROGEN BALANCE* PCT CARBON BALANCE* PCTMCP CONVERSION* PCT RATE CONSTANTS XI000
KA <GM MOLS KB PER HRKC PER GM CAT*KD PER ATMI
PR-11AP-RE
15*004325*
0*206-0*420800*215*19*
196*10*252*042*500*40026*7
-62*6624*333*779*811*723*625*515*551*49
18*4912*7215*500*02
12*100*050*980*0
15*370*160*08
97*9698*6097*6687*9017*033*98
67*8640*04
PR-11BP-RE
15*004325*
0*208-0*420800*215*20*
195*9*912*042*500*40055*9
21*787*240*901*630*591*061*401*200*389*696*3313*190*17
40*610*351*150*0
22*420*060*04
98*8899*3598*6759*3910*786*08
19*206*22
PR-11C P-RE
15*0043 25*
0*208-0*420797*215*20*
195*9*812*042*500*40073*5
35*232*990*641*140*370*601*031*060*287*374*9313*530*15
45*340*300*920*0
23*230*100*14
96*9398*5596*2154*6610*925*64
13*254*21
Reproduced with permission of the copyright owner. Further reproduction prohibited without permission.

210
TABLE 0
EXPERIMENTAL OATA WITH PT-RE CATALYST
BALANCE NO* PR-11D PR-11E PR-21ACATALYST P-RE P-RE P-RE
WT• GMS 15*0043 15*0043 15*5243VOL* CC 25* 25* 25*SIZE* MM 0*208-0*420 0*208-0*420 0*208-0*420
TEMPERATURE* DEG* F 801* 800* 800*PRESSURE* PSIA 215* 215* 215*HYDROCARBON PP* PSIA 20* 20* 20*HYDROGEN PP* PSIA 195* 195* 195*MOLS H2/MOL FEED 9*89 9*77 9*87V/HR/V 2*04 2*04 2*04W/HR/W 2*50 2*50 2*42SPACE TIME* 1/W/HR/W 0*400 0*400 0*413TIME ON FEED* HRS 91*4 112*2 26*4PRODUCT YIELD MOLS/I00 MOLS HYDROCARBON FEED
HYDROGENMETHANEETHANEPROPANEISOBUT ANEN-BUTANEISOPENTANEN-PENTANE22-DMB2MPENT ANE3MPENT ANEN-HEXANEHEXENEMCPENT ANEMCPENTENECYCLOHEXANECYCLOHEXENEBENZENETOLUENEXYLENES
36*570*00*00*00*00*00*030*020*022*801*639*990*21
64*220*401*230*0
19*280 * 0 50*10
34*86 0*0 0*0 0*0 0*0 0*0 0*0 0*0 0*01 1*78 1*06 9*10 0*09
68*85 0*48 1*38 0*0
I 7* 19 0*01 0*04
9*31 7*68 1*26 0*06 0*41 0*71 1*49 1*22 0* 16 7*27 5* 17 13*12 0* 19
50*01 0*31 0*97 0*0
16*08 0*0 0*0
MATERIAL BALANCE* PCT 98*15HYDROGEN BALANCE* PCT 98*77CARBON BALANCE* PCT 97*87
97*3398*5296*30
94*0896*9392*82
MCP CONVERSION* PCT 35*78RATE CONSTANTS X1000
KA <GM MOLS 6*44KB PER HR 3*07KC PER GM CAT* 3*76KD PER ATM) 1*02
31*155*312*531*530*67
49* 996*654*9412*814*29
Reproduced with permission of the copyright owner. Further reproduction prohibited without permission.
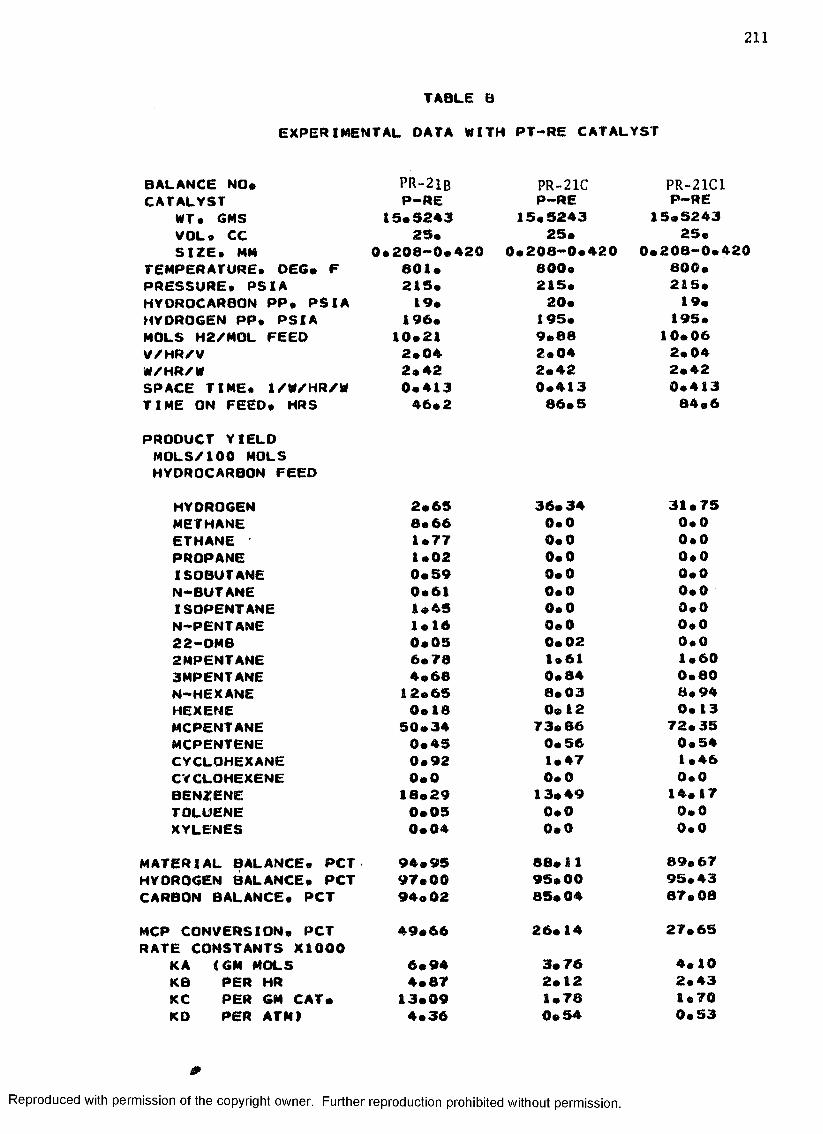
211
TABLE B
EXPERIMENTAL DATA WITH PT-RE CATALYST
BALANCE NO* PR-21B PR-21C PR-21C1CATALYST P-RE P-RE P-RE
WT• 6MS 15*9243 15*5243 15*5243VOL• CC 25* 25* 25*SIZE* MM 0*208-0*420 0*208-0*420 0*208-0*420
TEMPERATURE. DEG* F 601* 800* 800*PRESSURE. PS IA 215* 215* 215*HYDROCARBON PP. PS IA 19* 20* 19*HYDROGEN PP. PSIA 196* 195* 195*MOLS H2/MOL FEED 10*21 9*88 10*06V/HR/V 2*04 2*04 2*04W/HR/W 2*42 2*42 2*42SPACE TIME. 1/W/HR/W 0*413 0*413 0*413TIME ON FEED. HRS 46*2 86*5 84*6
PRODUCT YIELD MOLS/100 MOLS HYDROCARBON FEED
HYDROGEN 2*65 36* 34 31*75METHANE 8* 66 0*0 0*0ETHANE 1*77 0*0 0*0PROPANE 1*02 0*0 0*0ISOBUTANE 0*59 0* 0 0*0N—BUT ANE 0*61 0*0 0*0ISOPENTANE 1*45 0*0 0*0N—PENT ANE 1*16 0*0 0*022-DMB 0*05 0*02 0*02MPENTANE 6*78 1*61 1*603MPENTANE 4*68 0*84 0*80N-HEXANE 12*65 8*03 8*94HEXENE 0*18 0*12 0*13MCPENT ANE 50*34 73*66 72*35MCPENTENE 0*45 0*56 0*54CYCLOHEXANE 0*92 1*47 1*46CYCLOHEXENE 0*0 0*0 0*0BENZENE 18*29 13*49 14*17TOLUENE 0*05 0*0 0*0XYLENES 0*04 0*0 0*0
MATERIAL BALANCE. PCT 94*95 68*11 89*67HYDROGEN BALANCE. PCT 97*00 95*00 95*43CARBON BALANCE. PCT 94*02 85*04 87*08
MCP CONVERSION. PCT 49*66 26*14 27*65RATE CONSTANTS XIOOO
KA (GM MOLS 6*94 3* 76 4*10KB PER HR 4*87 2*12 2*43KC PER GM CAT* 13*09 1*78 1*70KD PER ATM} 4*36 0*54 0*53
0
Reproduced with permission of the copyright owner. Further reproduction prohibited without permission.

212
TABLE B
EXPERIMENTAL OATA WITH PT-RE CATALYST
BALANCE NO* PR-21D PR-22A PR-22BCATALYST P-RE P-RE P-RE
WT* GMS 15*5243 8*9685 8*9685VOL* CC 25* 25* 25*SIZE* m m 0*208-0*420 0*208-0*420 0*208-0*420
TEMPERATURE* DEG* F 800* BOO* 800*PRESSURE* PSIA 215* 215* 215*HYDROCARBON PP* PSIA 19* 20* 19*HYDROGEN PP* PSIA 196* 195* 196*MOLS H2/M0L FEED 10*34 9*94 10*34V/HR/V 2*04 1*23 0* 82W/HR/W 2*42 2*51 1*67SPACE TIME* 1/W/HR/W 0*413 0*398 0*598TIME ON FEED* HRS 105*4 111*9 113*7
PRODUCT YIELD MOLS/100 MOLS HYOROCARBON FEED
HYDROGEN 35*32METHANE 0*0ETHANE 0*0PROPANE 0*0ISOBUTANE 0*0N-BUTANE 0*0ISOPENTANE 0*0N-PENTANE 0*022-DMB 0*02MPENT ANE 1*973MPENT ANE 0*67N-HEXANE 10*43HEXENE 0*13MCPENT ANE 68*84MCPENTENE 0*49CYCLOHEXANE 1*53CYCLOHEXENE 0*0BENZENE 15*94TOLUENE 0*0XYLENES 0*0
MATERIAL BALANCE* PCT 90*88HYDROGEN BALANCE* PCT 96*03CARBON BALANCE* PCT 88*53MCP CONVERSION* PCT 31*16RATE CONSTANTS XI000
KA (GM MOLS 4*96KB PER HR 2*96KC PER GM CAT* 1*67KD PER ATM) 0*60
20*80 0*0 0*0 0*0 0*0 0*0 0*01 0* 0 0*02 1*47 0*87 9*46 0*0
71*20 0*63 1*76 0*0
14*58 0* 0 0*0
98*5198*7098*4328*804*382*591*400*55
25*120*00*00*00*00*00*020*020*032*051*30
10*790*0
66*280*581*870*0
17*080*00*0
98*0598*4997*8533*723*802*131*080*58
Reproduced with permission of the copyright owner. Further reproduction prohibited without permission.

213
TABLE B
EXPERIMENTAL DATA WITH PT-RE CATALYST
BALANCE NO* PR-22D PR-22E PR-22FCATALYST P-RE P-RE P-RE
WT. GMS 8*9685 8*9685 8*9685VOL. CC 25* 25* 25.SIZE. MM 0*208-0*420 0*208-0*420 0.208-0*
TEMPERATURE. DEG* F 850* 850* 850*PRESSURE. PSIA 215* 215* 215*HYDROCARBON PP. PS IA 19* 20* 19*HYDROGEN PP. PSIA 195* 195* 195*MOLS H2/M0L FEED 10*02 9*84 10*04V/HR/V 0*65 1*22 2*04W/HR/W 1*34 2*51 4*19SPACE TIME. I/W/HR/W 0* 747 0*399 0*239TIME ON FEED. HRS 120.0 122*2 123*8
PRODUCT YIELD MOLS/100 MOLS HYDROCARBON FEED
HYDROGEN 92*03 76*56 48*10METHANE 1*27 0*69 0*0ETHANE 0* 16 0*0 0*0PROPANE 0*56 0*14 0*0ISOBUTANE 0*19 0*0 0*0N—BUT ANE 0*26 0*13 0*0ISOPENTANE 0*26 0*07 0*02N-PENTANE 0*32 0*07 0*0222-0M8 0*93 0*24 0*112MPENT ANE 7*10 4*66 3*013MPENT ANE 4*89 3*06 2*06N-HEXANE 15*46 13*76 9*58HEXENE 0*25 0*25 0*23MCPENT ANE 24*38 40*32 57*33MCPENTENE 0*37 0*69 0*96CYCLOHEXANE 0*89 0*87 0.85CYCLOHEXENE 0*0 0*15 0*0BENZENE 44*30 35*59 25.81TOLUENE 0*08 0*02 0*02XYLENES 0*0 0*0 0*0
MATERIAL BALANCE. PCT 96*25 96*90 98*29HYDROGEN BALANCE. PCT 97*96 98*26 98*43CARBON BALANCE. PCT 95*48 96*29 98*22
MCP CONVERSION. PCT 75*62 59*68 42*67RATE CONSTANTS XI000
KA (GM MOLS 12*83 13*52 13*52KB PER HR 5*43 5* 76 5*34KC PER GM CAT* 9*60 8*42 7*96KD PER ATM) 1*72 1*90 2*09
Reproduced with permission of the copyright owner. Further reproduction prohibited without permission.

214
TABLE B
EXPERIMENTAL DATA WITH PT-RE CATALYST
BALANCE NO* PR-22G PR-22H PR-221CATALYST P-RE P-RE P-RE
WT* GMS 8*9683 8*9685 8*9685VOL* CC 23* 25* 25*SIZE* MM 0*208-0*420 0*208-0*420 0*208-0*420
TEMPERATURE* DEG* F 630* 800* 800*PRESSURE* PS IA 213* 213* 313*HYDROCARBON PP* PS IA 20* 20* 28*HYDROGEN PP* PSIA 195* 195* 287*MOLS H2/MOL FEED 9*99 9*96 10*25V/HR/V 1*63 1*02 1*02W/HR/W 3*34 2*09 2*09SPACE TIME* 1/W/HR/W 0*299 0*478 0*478TIME ON FEED. HRS 126*3 128*6 131*1
PRODUCT YIELD MOLS/100 MOLS HYDROCARBON FEED
HYDROGEN 49*76 17*75 -27*11METHANE 0*0 0*0 0*0ETHANE 0*0 0*0 0*0PROPANE 0*23 0*0 0*0ISOBUTANE 0*0 0*0 0*0N-BUTANE 0*13 0*0 0*0ISOPENTANE 0*08 0*0 0*0N-PENTANE 0*06 0*02 0*022-DMB 0*34 0*09 0*012MPENTANE 3*97 2*54 2*403MPENT ANE 2*39 1*64 1*74N-HEXANE 11*58 10* 06 10*80HEXENE 0*26 0*15 0*0MCPENT ANE 48*75 67*30 70*08MCPENTENE 0*89 0*41 0*40CYCLOHEXANE 0*83 1*38 2*91CYCLOHEXENE 0*0 0*01 0*0BENZENE 30*40 16*20 11*64TOLUENE 0*03 0*0 0*0XYLENES 0*0 0*0 0*0
MATERIAL BALANCE* PCT 98*42 98*16 97*85HYDROGEN BALANCE* PCT 98*06 98*27 96*52CARBON BALANCE* PCT 98*59 98*12 98*45
MCP CONVERSION* PCT RATE CONSTANTS X1000
51*23 32*70 29* 92
KA (GM MOLS 13*87 4*27 2*75KB PER HR 5*73 2*47 1*88KC PER GM CAT* 8*99 2*40 2*52KD PER ATM! 2*31 0*83 0*50
Reproduced with permission of the copyright owner. Further reproduction prohibited without permission.

21S
TABLE B
EXPERIMENTAL OATA WITH PT-RE CATALYST
BALANCE NO* PR-22J PR-22K PR-22LCATALYST P-RE P-RE P-RE
WT. GMS 8*9685 8*9685 8*9685VOL. CC 25* 25* 25*SIZE, MM 0*208-0*420 0*208-0*420 0* 208—Oe 420
TEMPERATURE. DEG* F 800* 800* 800*PRESSURE. PSIA 312* 223* 312*HYDROCARBON PP. PSIA 19* 27* 38*HYDROGEN PP. P S IA 292* 196* 274*MOLS H2/M0L FEED 15*12 7*19 7*22V/HR/V 1*02 1*02 1*02W/HR/W 2*09 2*09 2.09SPACE TIME. 1/W/HR/W 0*478 0*478 0*478TIME ON FEED. HRS 133*0 135*6 137*2
PRODUCT YIELD MOLS/I00 MOLS HYDROCARBON FEED
HYDROGEN 2*70METHANE 0*0ETHANE 0*0PROPANE 0*0ISOBUTANE 0*0N-BUTANE 0*0ISOPENTANE 0*01N-PENTANE 0*0122-DMB 0*012MPENTANE 2*193MPENT ANE 1**2N-HEXANE 11*44HEXENE 0*0MCPENT ANE 72*02MCPENTENE 0*30CYCLOHEXANE 2*67CYCLOHEXENE 0*0BENZENE 9*93TOLUENE 0*0XYLENES 0*0
MATERIAL BALANCE. PCT 96*47 HYDROGEN BALANCE. PCT 98*16 CARBON BALANCE. PCT 99*47MCP CONVERSION. PCT 27*98RATE CONSTANTS XIOOO
KA (GM MOLS 3*13KB PER HR 2*71KC PER GM CAT* 1*66KD PER ATM) 0*71
35*01 0*0 0*0 0*0 0*0 0*0 0* 03 0*02 0*06 2*74 1*76
10*48 0*15
64*82 0*53 1*69 0*0
17*68 0*04 0*0
98*61 99* 06 98*4435*183*501*800* 32 0*75
21*640*00*00*00*00*00*020*050*092.751*71
11.770*0
67*170*332*920*0
13*140*040*0
97.9498*8197*6132*832*38 1 *46 0*72 0*50
Reproduced with permission of the copyright owner. Further reproduction prohibited without permission.

216
TABLE B
EXPERIMENTAL DATA WITH PT-RE CATALYST
BALANCE NO* PR-22M PR-22N PR-220CATALYST P-RE P-RE P-RE
WT* GMS 8*9685 8*9685 8*9685VOL* CC 25* 25* 25*SIZE* MM 0*208-0*420 0*208-0*420 0*208-0*420
TEMPERATURE* DEG* F 800* 799* 801*PRESSURE* PSIA 234* 117* 215*HYDROCARBON PP* PSIA 37* 19* 20*HYDROGEN PP. PSIA 197* 98* 195*MOLS H2/M0L FEEO 5*32 5*25 9*89V/HR/V 1*02 1*02 0*65W/HR/W 2*09 2*09 1*34SPACE TIME* 1/W/HR/W 0*478 0*478 0*747TIME ON FEED* HRS 139*3 140* 8 142*8PRODUCT YIELD MOLS/I00 MOLS HYDROCARBON FEED
HYDROGENMETHANEETHANEPROPANEISOBUTANEN~BUT ANEISOPENTANEN-PENTANE22-DMB2MPENTANE3MPENT ANEN-HEXANEHEXENEMCPENT ANEMCPENTENECYCLOHEXANECYCLOHEXENEBENZENETOLUENEXYLENES
37*730*00*00*00*00*00*09o *o a 0* 1 2 3*01 I *85
10*21 0*12
64*39 0*52 1*80 0*0
17*86 0*0 0 *0
65*110*00*00*00*00*00*020*030*152*661*756*390*33
62*630*910*590*0
24*510*020*0
42* 63 0*0 0*0 0*0 0*0 0*0 0*02 0*03 0*22 3*98 2*42
13*42 0*12
57*29 0*37 1*76 0*0
20*36 0*01 0*0
MATERIAL BALANCE* PCT 97*33HYDROGEN BALANCE* PCT 98*41CARBON BALANCE* PCT 96*99
96*73 98* 34 96*23
97*1498*8196*39
MCP CONVERSION* PCT 35*61RATE CONSTANTS XI000
KA (GM MOLS 2*62KB PER HR 1*40KC PER GM CAT* 1*96KD PER ATM) 0*51
37*376*131*875*840*90
42*713*932*402*920*79
Reproduced with permission of the copyright owner. Further reproduction prohibited without permission.

217
TABLE B
EXPERIMENTAL OATA WITH PT-RE CATALYST
BALANCE NO* PR-22P PR-23A PR-23BCATALYST P-RE P-RE P-RE
WT. GMS 8* 9689 3*5071 3*5071VOL* CC 25* 25* 25*SIZE* MM 0*208— 0*420 0*208-0*420 0*208-0*420
TEMPERATURE* DEG* F 850* 850* 850*PRESSURE* PSIA 2IS* 215* 215*HYDROCARBON PP* PSIA 19* 19* 20*HYDROGEN PP* PSIA 195* 195* 195*MOLS H2/M0L FEED 10*15 10*06 9*82V/HR/V 0*62 1*22 2*04W/HR/W 1*67 6*41 10*71SPACE TIME* 1/W/HR/W 0*596 0*156 0*093TIME ON FEED* HRS 145*1 110*0 111*8
PRODUCT YIELD MOLS/100 MOLS HYDROCARBON FEED
HYDROGEN 90*00 49*97 29*59METHANE 0*0 0*0 0*0ETHANE 0*0 0*0 0*0PROPANE 0*42 0*0 0*0ISOBUTANE 0*13 0*0 0*0N-BUTANE 0*26 0*0 0*0ISOPENTANE 0*23 0*01 0*0N-PENTANE 0*32 0*01 0*022-DMB 0*76 0*03 0*022MPENTANE 7*43 1*87 1*443MPENT ANE 4*78 1*38 0*79N-HEXANE 16*10 8*04 5*89HEXENE 0*25 0*34 0*35MCPENTANE 27*93 67*24 75*11MCPENTENE 0*51 0*91 1*17CYCLOHEXANE 0*81 0*91 0*90CYCLOHEXENE 0*0 0*0 0*0BENZENE 40*45 19*24 14*32TOLUENE 0*05 0*01 0*0XYLENES 0*0 0*0 0*0
MATERIAL BALANCE* PCT 97*76 96*73 98*86HYDROGEN BALANCE* PCT 99*01 99*59 99*14CARBON BALANCE* PCT 97*20 98*34 98*74
MCP CONVERSION* PCT RATE CONSTANTS X1000
72*07 32*76 24*89
KA (GM MOLS 13*22 14*06 15*90KB PER HR 6*27 6*37 6*93KC PER GM CAT* 10*35 9* 76 5*54KD PER ATM) 2*20 1*84 2*23
Reproduced with permission of the copyright owner. Further reproduction prohibited without permission.
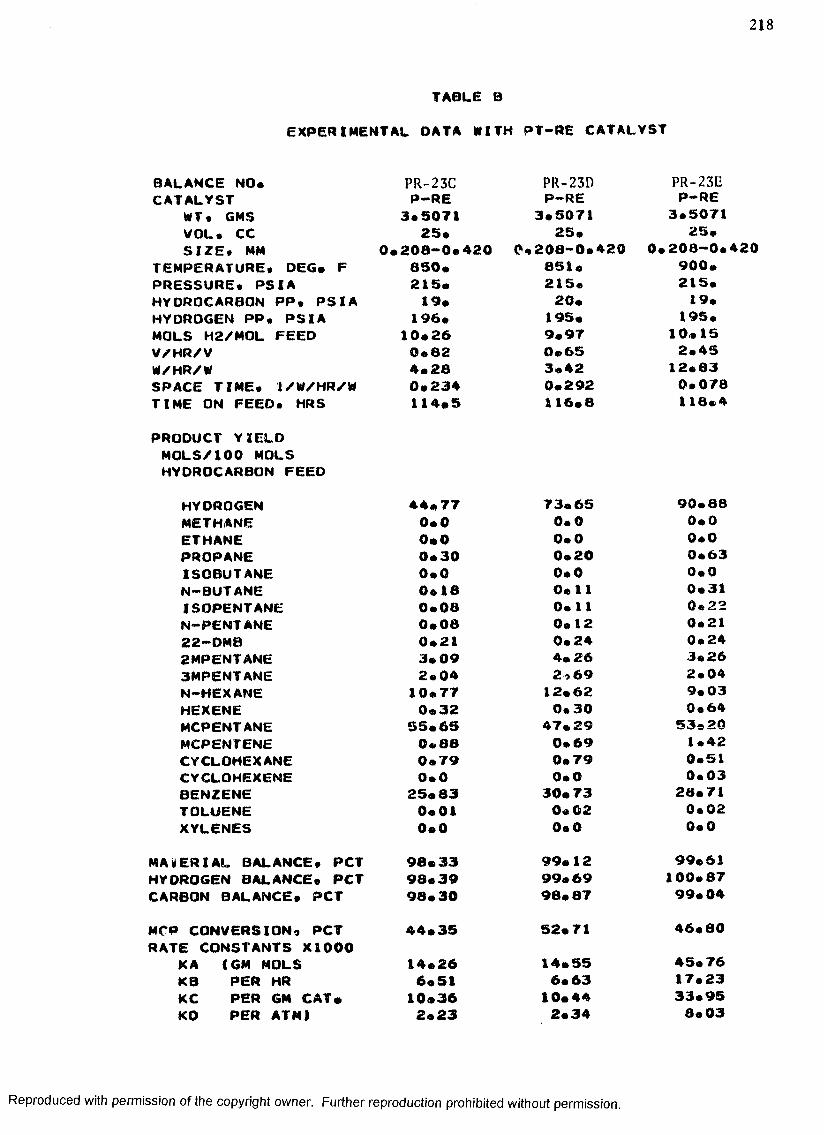
2 1 8
TABLE B
EXPERIMENTAL DATA WITH PT-RE CATALYST
BALANCE NO* PR-23C PR-23D PR-230CATALYST P-RE P-RE P-RE
WT• GMS 3*5071 3*5071 3*5071VOL. CC 25* 25* 25*SIZE. MM 0*208-0*420 0*208-0*420 0*208-0*
TEMPERATURE. DEG* F 850* 851* 900*PRESSURE. PSIA 215* 215* 215*HYDROCARBON PP. PSIA 19* 20* 19*HYDROGEN PP. PSIA 196* 195* 195*MOLS H2/M0L FEED 10*26 9*97 10*15V/HR/V 0*62 0*65 2*45W/HR/W 4*28 3*42 12*83SPACE TIME. 1/W/HR/W 0*234 0*292 0.078TIME ON FEED. HRS 114*5 116*8 118*4
PRODUCT YIELD MOLS/I00 MOLS HYDROCARBON FEED
HYOROGEN 44*77 73*65 90*88METHANE 0*0 0*0 0*0ETHANE 0*0 0*0 0*0PROPANE 0*30 0*20 0*63ISOBUTANE 0*0 0*0 0*0N-BUTANE 0*18 0*11 0*31ISOPENTANE 0*08 0* 11 0*22N-PENTANE 0*08 0*12 0*2122-DMB 0*21 0*24 0*242MPENTANE 3*09 4* 26 3*263MPENTANE 2*04 2.69 2*04N-HEXANE 10*77 12*62 9*03HEXENE 0*32 0.30 0*64MCPENT ANE 55*65 47*29 53*20MCPENTENE 0*88 0*69 1*42CYCLOHEXANE 0*79 0*79 0*51CYCLOHEXENE 0*0 0*0 0*03BENZENE 25*83 30*73 26*71TOLUENE 0*01 0* 02 0*02XYLENES 0*0 0*0 0*0
MATERIAL BALANCE. PCT 96*33 99*12 99*61HYOROGEN BALANCE. PCT 98*39 99*69 100*87CARBON BALANCE. PCT 98*30 98*87 99*04
MCP CONVERSION. PCT 44* 35 52*71 46*80RATE CONSTANTS XI000
KA (GM MOLS 14*26 14*55 45* 76KB PER HR 6*51 6*63 17*23KC PER GM CAT* 10*36 10*44 33*95KD PER ATM) 2*23 2*34 8*03
Reproduced with permission of the copyright owner. Further reproduction prohibited without permission.
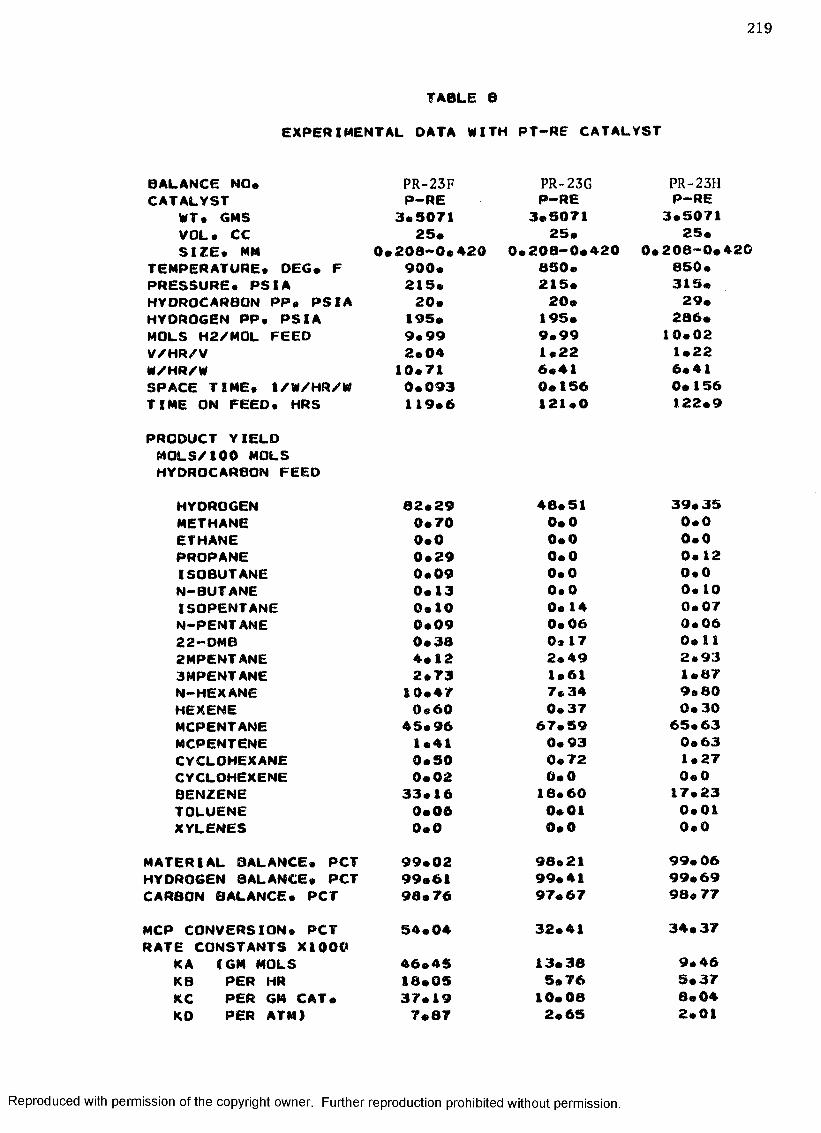
TABLE BEXPERIMENTAL DATA WITH PT-RE CATALYST
BALANCE NO* PR-23F PR-23G PR-23HCATALYST P-RE P-RE P-RE
WT* GMS 3*5071 3*5071 3*5071VOL* CC 25* 25* 25*SIZE* MM 0*208-0*420 0*208-0*420 0*208-0*420
TEMPERATURE* DEG* F 900* 850* 850*PRESSURE* PSIA 215* 215* 315*HYDROCARBON PP* PSIA 20* 20* 29*HYOROGEN PP* PSIA 195* 195* 286*MOLS H2/M0L FEED 9*99 9*99 10*02V/HR/V 2*04 1*22 1*22W/HR/W 10*71 6*41 6*41SPACE TIME* 1/W/HR/W 0*093 0*156 0*156TIME ON FEED • HRS 119*6 121*0 122*9
PRODUCT YIELD MOLS/100 MOLS HYDROCARBON FEED
HYOROGEN 82*29 48*51 39*35METHANE 0*70 0*0 0*0ETHANE 0*0 0*0 0*0PROPANE 0*29 0*0 0* 12ISOBUTANE 0*09 0*0 0*0N-BUTANE 0*13 0*0 0* 10ISOPENTANE 0*10 0* 14 0*07N-PENTANE 0*09 0*06 0*0622-DMB 0*38 0* 17 0*112MPENTANE 4*12 2*49 2*933MPENT ANE 2*73 1*61 1*87N-HEXANE 10*47 7*34 9*80HEXENE 0*60 0*37 0*30MCPENTANE 45*96 67*59 65*63MCPENTENE 1*41 0*93 0*63CYCLOHEXANE 0*50 0*72 1*27CYCLOHEXENE 0*02 0*0 0*0BENZENE 33*16 16*60 17*23TOLUENE 0*06 0*01 0*01XYLENES 0*0 0*0 0*0
MATERIAL BALANCE* PCT 99*02 98*21 99*06HYDROGEN BALANCE* PCT 99*61 99*41 99*69CARBON BALANCE* PCT 98*76 97*67 98*77
MCP CONVERSION* PCT RATE CONSTANTS XI000
54*04 32*41 34*37
KA (GM MOLS 46*45 13*36 9*46KB PER HR 18*05 5*76 5*37KC PER GM CAT* 37*19 10*08 8*04KO PER ATM) 7*87 2*65 2*01
Reproduced with permission of the copyright owner. Further reproduction prohibited without permission.
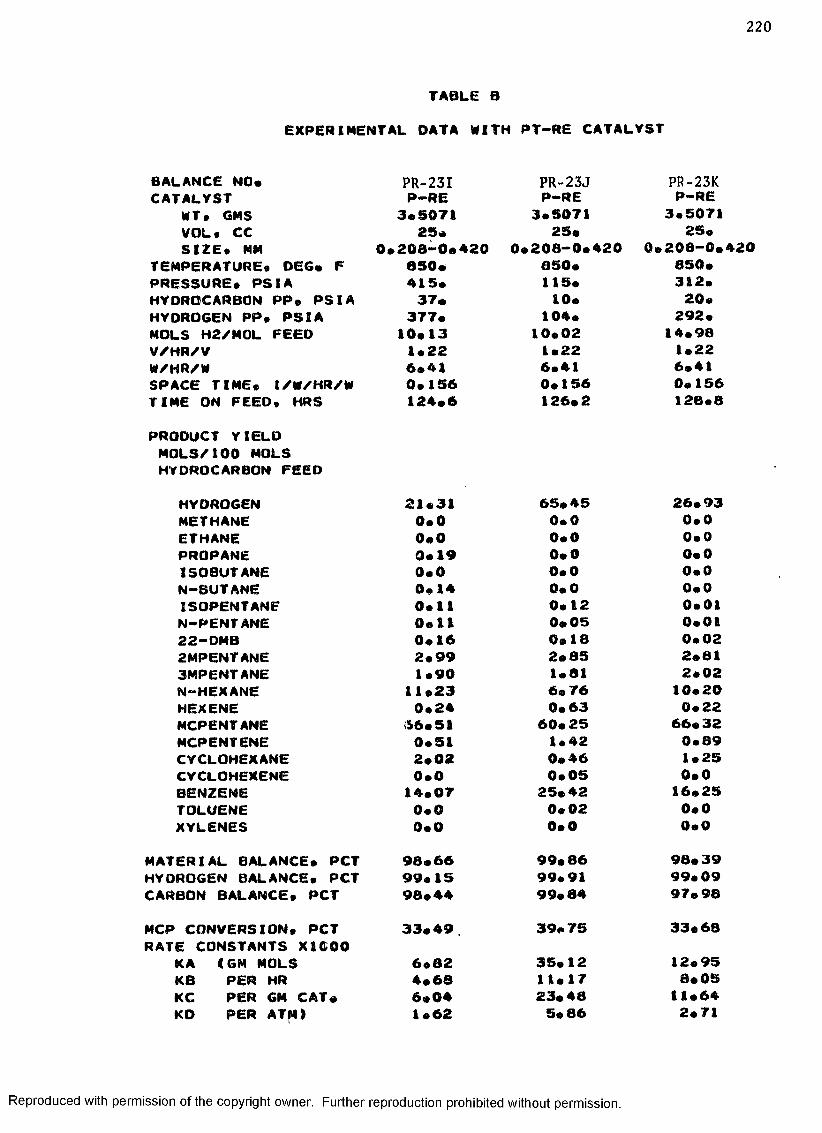
220
TABLE BEXPERIMENTAL DATA WITH PT-RE CATALYST
BALANCE NO*CATALYST
WT* GMS VOL* CC SIZE* MM
TEMPERATURE* DEG* F PRESSURE* PSIA HYDROCARBON PP* PSIA HYOROGEN PP* PSIA MOLS H2/M0L FEED V/HR/V W/HR/WSPACE TIME* 1/W/HR/W TIME ON FEED* HRSPRODUCT YIELD MOLS/100 MOLS HYDROCARBON FEED
HYDROGENMETHANEETHANEPROPANEISOBUTANEN-BUTANEISOPENTANEN-PENTANE22-DMB2MPENT ANE3MPENT ANEN-HEXANEHEXENEMCPENTANEMCPENTENECYCLOHEXANECYCLOHEXENEBENZENETOLUENEXYLENES
MATERIAL BALANCE* PCT HYDROGEN BALANCE* PCT CARBON BALANCE* PCTMCP CONVERSION* PCT RATE CONSTANTS X1G00
KA (GM MOLS KB PER HRKC PER GM CAT*KD PER ATM)
PR-231P-RE
3*507125*
0*208-0*420850.415*37*
377*10*131*226*410*156124*6
21*310*00*00*190*00*140*110*110*162*991*90
11*230*24
66*510*512*020*0
14*070*00*0
98*6699*1598*4433*49.6*824*686*041*62
PR-23J PR-23KP-RE P-RE
3*5071 3*507125* 25*
208-0*420 0*208-0*420850* 850*115* 312*10* 20*
104* 292*10*02 14*981*22 1*226*41 6*410*156 0*156126*2 128*8
65*45 0*0 0*0 0*0 0*0 0*0 0*12 0*05 0*18 2*85 1*81 6* 76 0*63
60*25 1*42 0*46 0*05
25*42 0*02 0*0
99*8699*9199*8439*7535*12 11*17 23*48 5* 86
26*930*00*00*00*00*00*010*010*022*812*02
10*200*22
66*320*891*250*016*250*00*0
98*39 99*09 97* 9833*6812*958*05
11*642*71
Reproduced with permission of the copyright owner. Further reproduction prohibited without permission.

221
TABLE B
EXPERIMENTAL DATA WITH PT-RE CATALYST
BALANCE NO* PR-23L PR-23M PR-23NCATALYST P-RE P-RE P-RE
WT• GMS 3*5071 3*5071 3*5071VOL* CC 25* 25* 25*SIZE* MM 0*208-0*420 0*208-0*420 0*208-0*420
TEMPERATURE. DEG* F 850* 850* 850*PRESSURE* PSIA 210* 156* 312*HYDROCARBON PP. PSIA 13* 19* 38*HYDROGEN PP* PSIA 197* 137* 274*MOLS H2/M0L FEED 14*98 7*16 7*24V/HR/V 1*22 1*22 1*22W/HR/W 6*41 6* 41 6*41SPACE TIME* 1/W/HR/W 0*156 0*156 0*156TIME ON FEED. HRS 132*5 134*3 136*0
PRODUCT YIELD MOLS/I00 MOLS HYDROCARBON FEED
HYDROGEN 38*78 57*90 36*28METHANE 0*0 0*0 0*0ETHANE 0*0 0*0 0*0PROPANE 0*0 0*27 0*14ISOBUTANE 0*0 0*0 0*0N-BUTANE 0* 0 0* 19 0*11ISOPENTANE 0*01 0*13 0*13N-PENTANE 0*06 0*13 0*0822—OMB 0*18 0*19 0*172MPENT ANE 3*16 3*32 3*483MPENT ANE 1*88 2*10 2*26N-HEXANE 9*42 8*22 10*49HEXENE 0*32 0*46 0*31MCPENTANE 64*73 58*20 61*82MCPENTENE 0*89 1*30 0*66CYCLOHEXANE 0*64 0*46 1*19CYCLOHEXENE 0*0 0*0 0*0BENZENE 18*69 25*25 19* 29TOLUENE 0*01 0*02 0*02XYLENES 0*0 0* 0 0*0
MATERIAL BALANCE. PCT 97*61 98*16 99*16HYDROGEN BALANCE. PCT 98*98 98*80 99*22CARBON BALANCE. PCT 96*80 97*93 99*14
MCP CONVERSION. PCT RATE CONSTANTS X1000
35*25 41*80>
38*18
KA (GM MOLS 20*46 19*41 8*25KB PER HR 11*07 7*18 4*41KC PER GM CAT* 14* 96 12*12 5*56KD PER ATM) 4*74 4*00 1*99
Reproduced with permission of the copyright owner. Further reproduction prohibited without permission.

222
TABLE B
EXPERIMENTAL DATA WITH PT-RE CATALYST
BALANCE NO* PR-230 PR-23P PR-23QCATALYST P-RE P-RE P-RE
WT. GMS 3*S07t 3*5071 3*5071VOL. CC 25* 25* 25*SIZE. MM 0*208-0*420 0*208-0*420 0*208-0*
TEMPERATURE. DEG* F 850* 850* 850*PRESSURE. PSIA 223* 234* 315*HYDROCARBON PP. PSIA 27* 38* 51*HYDROGEN PP. PSIA 196* 196* 264*MOLS H2/M0L FEED 7*24 5*18 5*19V/HR/V 1*22 1*22 1*22W/HR/W 6*41 6*4) 6*41SPACE TIME. 1/W/HR/W 0*156 0*156 0*156TIME ON FEED. HRS 137*5 138*9 140*5
PRODUCT YIELD MOLS/100 MOLS HYOROCARBON FEED
HYOROGEN 44*53 54*30 42*92METHANE 0*0 0*0 0*0ETHANE 0*0 0*0 0*0PROPANE 0*12 0*11 0*20ISOBUTANE 0*0 0*0 0*0N-BUTANE 0*10 0*07 0*13ISOPENTANE 0*12 0*09 0*09N-PENTANE 0*13 0*09 0*1022-DMB 0*18 0*18 0*192MPENT ANE 3*63 3*95 3*723MPENTANE 2*21 2*45 2*44N-HEXANE 9*24 10*53 10*26HEXENE 0*16 0*36 0*32MCPENTANE 60*81 56*53 60*11MCPENTENE 0*85 0*86 0*65CYCLOHEXANE 0*68 0*67 1*09CYCLOHEXENE 0*0 0*0 0*0BENZENE 21*90 24*22 20*85TOLUENE 0*0 0*02 0*02XYLENES 0*0 0*0 0*0
MATERIAL BALANCE. PCT 96*68 101*38 101*30HYDROGEN BALANCE. PCT 97*95 100*62 100*47CARBON BALANCE. PCT 96*22 101*61 101*56
MCP CONVERSION. PCT 39*19 43*47 39*89RATE CONSTANTS XIOOO
KA (GM MOLS 12*10 9*97 6*71KB PER HR 5*46 4*67 3*29KC PER GM CAT* 9*44 6*36 4*61KD PER ATM) 2* £3 2*24 1*61
Reproduced with permission of the copyright owner. Further reproduction prohibited without permission.
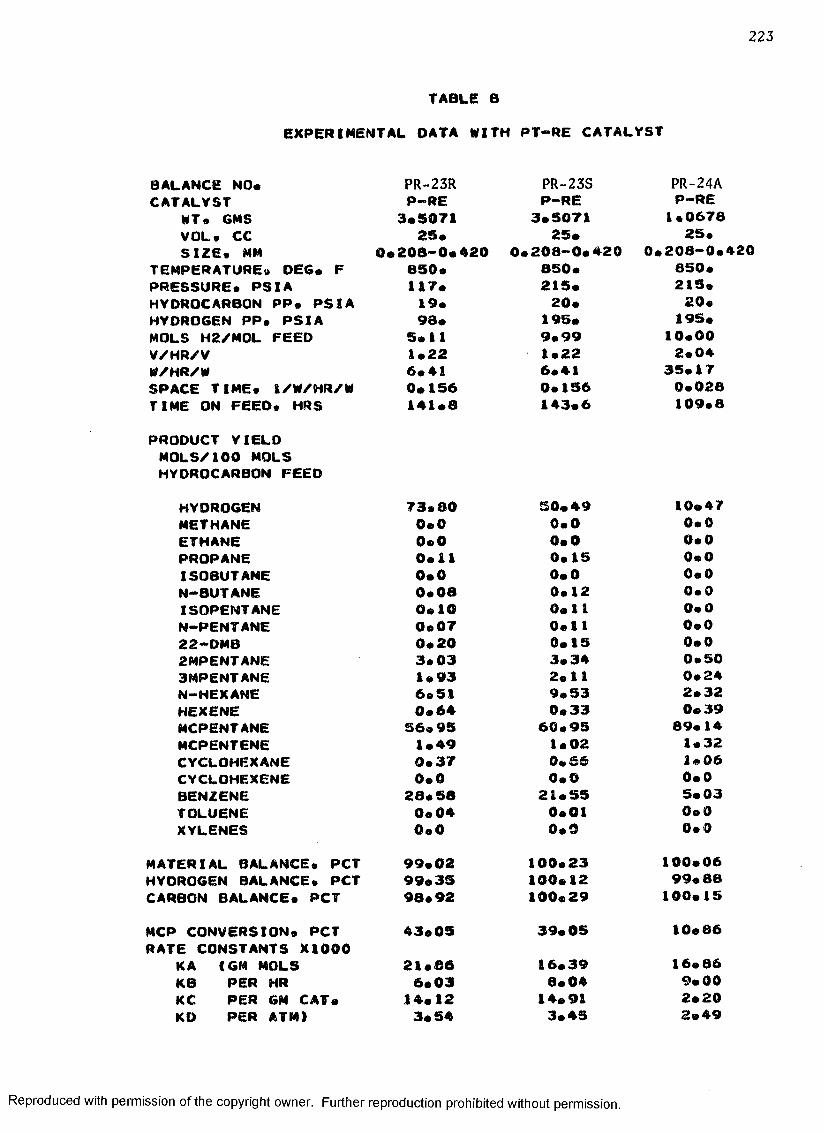
223
TABLE B
EXPERIMENTAL OATA WITH PT-RE CATALYST
BALANCE NO* PR-23R PR-23S PR-24ACATALYST P-RE P-RE P-RE
WT* GMS 3*5071 3*S071 1*0678VOL* CC 25* 25* 25*SIZE* MM 0*208-0*420 0*208-0*420 0*208-0*420
TEMPERATURE* DEG* F 850* 850* 850*PRESSURE* PSIA 117* 215* 215*HYDROCARBON PP* PSIA 19* 20* 20*HYOROGEN PP* PSIA 98* 195* 195*MOLS H2/M0L FEED 5*11 9*99 10*00V/HR/V 1*22 1*22 2*04W/HR/W 6*41 6*41 35*17SPACE TIME* I/W/HR/W 0*156 0*156 0*028TIME ON FEED* HRS 141*8 143*6 109*8
PRODUCT YIELD MOLS/I00 MOLS HYDROCARBON FEED
HYDROGEN 73*80 50*49 10*47METHANE 0*0 0*0 0*0ETHANE 0*0 0*0 0*0PROPANE 0*11 0*15 0*0ISOBUTANE 0*0 0*0 0*0N-BUTANE 0*08 0*12 0*0ISOPENTANE 0*10 0*11 0*0N-PENTANE 0*07 0*11 0*022-DMB 0*20 0*15 0*02MPENTANE 3*03 3*34 0*503MPENT ANE 1*93 2*11 0*24N-HEXANE 6*51 9*53 2*32HEXENE 0*64 0*33 0*39MCPENTANE 56*95 60*95 89*14MCPENTENE 1*49 1*02 1*32CYCLOHEXANE 0*37 0*66 1*06CYCLOHEXENE 0*0 0*0 0*0BENZENE 28*58 21*55 5*03TOLUENE 0*04 0*01 0*0XYLENES 0*0 0*9 0*0
MATERIAL BALANCE* PCT 99*02 100*23 100*06HYDROGEN BALANCE* PCT 99*35 100*12 99*88CARBON BALANCE* PCT 98*92 100*29 100*15
MCP CONVERSION* PCT RATE CONSTANTS XI000
43*05 39*05 10*86
KA (GM MOLS 21*86 16*39 16*86KB PER HR 6*03 8*04 9*00KC PER GM CAT* 14*12 14*91 2*20KD PER ATM) 3*54 3*45 2*49
Reproduced with permission of the copyright owner. Further reproduction prohibited without permission.

2 2 4
TABLE 8
EXPERIMENTAL OATA WITH PT-RE CATALYST
BALANCE NO*CATALYST
WT* GMS VOL* CC SIZE* MM
TEMPERATURE* DEG* F PRESSURE* PSIA HYDROCARBON PP* PSIA HYOROGEN PP* PSIA MOLS H2/M0L FEED V/HR/V W/HR/WSPACE TIME* 1/W/HR/W TIME ON FEED* HRSPRODUCT YIELD MOLS/I00 MOLS HYDROCARBON FEED
HYDROGENMETHANEETHANEPROPANEISOBUTANEN-BUTANEISOPENTANEN-PENTANE22-DMB2MPENT ANE3MPENT ANEN-HEXANEHEXENEMCPENTANEMCPENTENECYCLOHEXANECYCLOHEXENEBENZENETOLUENEXYLENES
MATERIAL BALANCE* PCT HYDROGEN BALANCE* PCT CARBON BALANCE* PCTMCP CONVERSION* PCT RATE CONSTANTS X1000
KA 4 GM MOLSKB PER HRKC PER GM CAT*KD PER ATM)
PR-24B PR-24C PR-24DP-RE P-RE P-RE
1*0678 1*0678 1*067825* 25* 25*
0*208-0*420 0*208-0*420 0*208-0*420850* 900* 900*215* 215* 315*19* 19* 28*
195* 195* 286*10*15 10*15 10*151*22 1*22 1*22
21*06 21*06 21*060*047 0*047 0*047111*3 114*0 115*5
14*360*00*00*00*00*00*00*00*00*700*443*400*37
83*751*391*050*08*900*00*0
99*4499*2699*5216*2518*847*892*112*37
46*45 0*0 0*0 0 *0 0*0 0*0 o* oa0* 07 0* 08 2*11 1*346c 95 0*65
65*40 1*61 0*71 0*06
20*94 0*01 0*0
99* OS 99*18 98* 9334*6049*5618*7220*447*61
40*78 0 *0 0*0 0*0 0*0 0*0 0* 02 0*02 0*03 2*27 1*44 8*62 0*47
65*79 1*40 0*82 0*04
19*06 0*01 0*0
99*0699*2998*9534*2131*4715*7422*844*81
Reproduced with permission of the copyright owner. Further reproduction prohibited without permission.
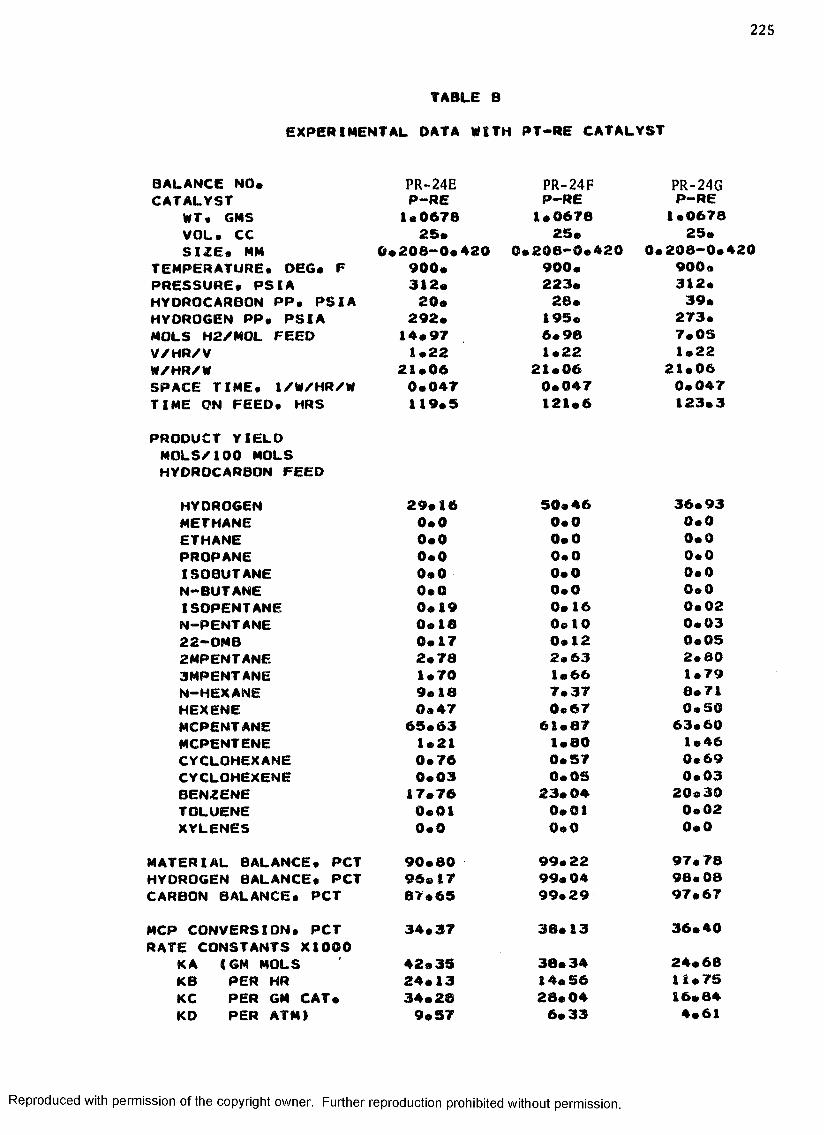
2 2 5
TABLE B
EXPERIMENTAL DATA WITH PT-RE CATALYST
BALANCE NO* PR-24E PR-24F PR-24GCATALYST P-RE P—RE P-RE
WT« GMS 1*0678 1*0678 1*0678VOL. CC 2S* 25* 25*SIZE. MM 0*208-0*420 0*208-0*420 0*208-0*
TEMPERATURE. DeG* F 900* 900* 900*PRESSURE. PSIA 312* 223* 312*HYDROCARBON PP. PSIA 20* 28* 39*HYDROGEN PP. PSIA 292* 195* 273*MOLS H2/MOL FEED 14*97 6*98 7.05V/HR/V 1*22 1*22 1*22W/HR/W 21*06 21*06 21*06SPACE TIME. 1/W/HR/W 0*047 0*047 0*047TIME ON FEED. HRS 119*5 121*6 123*3
PRODUCT YIELD MOLS/100 MOLS HYDROCARBON FEED
HYOROGEN 29*16 50*46 36*93METHANE 0*0 0*0 0*0ETHANE 0*0 0*0 0*0PROPANE 0*0 0*0 0*0ISOBUTANE 0*0 0*0 0*0N-BUTANE 0*0 0*0 0*0ISOPENTANE 0*19 0*16 0*02N-PENTANE 0*18 0*10 0*0322-DMB 0*17 0*12 0*052MPENT ANE 2*78 2*63 2*803MPENT ANE 1*70 1*66 1*79N-HEXANE 9*18 7*37 8*71HEXENE 0*47 0*67 0*50MCPENTANE 65*63 61*87 63*60MCPENTENE 1*21 1*80 1*46CYCLOHEXANE 0*76 0*57 0*69CYCLOHEXENE 0*03 0*05 0*03BENZENE 17*76 23* 04 20*30TOLUENE 0*01 0*01 0*02XYLENES 0*0 0*0 0*0
MATERIAL BALANCE. PCT 90*80 99*22 97*78HYDROGEN BALANCE. PCT 96*17 99*04 98*08CARBON BALANCE. PCT 87*65 99*29 97*67
MCP CONVERSION. PCT RATE CONSTANTS X1000
34*37 38*13 36*40
KA (GM MOLS 42*35 38*34 24*68KB PER HR 24*13 14* 56 11« 75KC PER GM CAT* 34*28 28*04 16*84KD PER ATM) 9*57 6*33 4*61
Reproduced with permission of the copyright owner. Further reproduction prohibited without permission.

2 2 6
TABLE B
EXPERIMENTAL DATA WITH PT-RE CATALYST
BALANCE NO* PR-24H PR-241 PR-24JCATALYST P-RE P-RE P-RE
WT. GMS 1*0678 1*0678 1*0678VOL. CC 25* 25* 25*SIZE. MM 0*208—0*420 0*208-0*420 0*208-0*420
TEMPERATURE. DEG* F 900* 900* 900*PRESSURE. PSIA 234* 117* 215*HYDROCARBON PP. PSIA 39* 20c 19*HYDROGEN PP. PSIA 195* 97* 195*MOLS H2/M0L FEED 4*99 4*96 10*06V/HR/V 1 • 22 1*22 1*22W/HR/W 21*06 21*06 21*06SPACE TIME. 1/W/HR/W 0*047 0*047 0*047TIME ON FEED. HRS 124*7 126*3 127*7
PRODUCT YIELD MOLS/100 MOLS HYDROCARBON FEED
HYDROGEN 85*89 60*37 47*30METHANE 0*0 0*0 0*0ETHANE 0*0 0*0 0*0PROPANE 0*15 0*0 0*0ISOBUTANE 0*06 0*0 0*0N-BUTANE 0*10 0*0 0*0ISOPENTANE 0*09 0* 05 0*08N-PENTANE 0*08 0*05 0*0822-DMB 0*12 0*06 0*082MPENT ANE 2*67 1*70 2*243MPENT ANE 1*75 1*06 1*55N-HEXANE 7*28 4*14 6* 61HEXENE 0*67 1*37 0* 66MCPENTANE 60*90 64*46 66*14MCPENTENE 1*67 3*00 1*93iCYCLOHEXANE 0*56 0*81 0.67CYCLOHEXENE 0*07 0*20 0*05BENZENE 23*96 23*10 19*93TOLUENE 0*01 0*02 0*0XYLENES 0*0 0*0 0*0
MATERIAL BALANCE. PCT 96*99 98*22 97*06HYOROGEN BALANCE* PCT 97*86 98*60 98*53CARBON BALANCE. PCT 96*67 98*10 96*40
MCP CONVERSION. PCT RATE CONSTANTS X1000
39*10 35* 54 33*86
KA (GM MOLS 28*79 52*74 46*38KB PER HR 10*33 13*42 18*45KC PER GM CAT* 19*23 24*72 41*28KO PER ATM) 4*91 5*86 7*52
Reproduced with permission of the copyright owner. Further reproduction prohibited without permission.
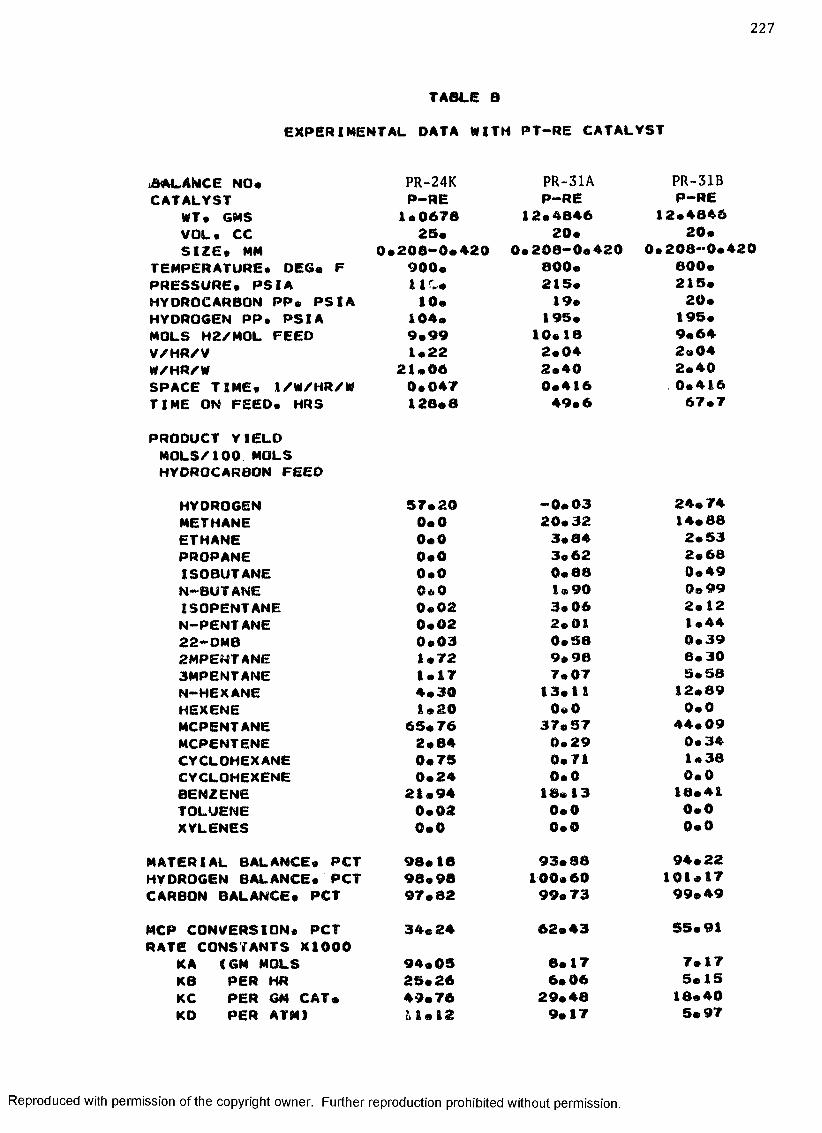
227
TABLE BEXPERIMENTAL OATA WITH PT-RE CATALYST
u&ALANCE NO* PR-24K PR-31A PR-31BCATALYST P-RE P-RE P-RE
WT* GMS 1*0670 12*4846 12*4846VOL* CC 25* 20* 20*SIZE* MM 0*206-0*420 0*208-0*420 0*208-0*420
TEMPERATURE* DEG* F 900* 800* 800*PRESSURE* PSIA 1IL* 215* 215*HYDROCARBON PP* PSIA 10* 19* 20*HYDROGEN PP. PSIA 104* 195* 195*MOLS H2/M0L FEED 9*99 10*18 9*64V/HR/V 1*22 2*04 2*04W/HR/W 21*06 2*40 2*40SPACE TIME* 1/W/HR/W 0*047 0*416 0*416TIME ON FEED* HRS 128*0 49*6 67*7
PRODUCT YIELD MOLS/100 MOLS HYDROCARBON FEED
HYOROGEN 57*20 -0*03 24*74METHANE 0*0 20*32 14*88ETHANE 0*0 3*84 2*53PROPANE 0*0 3*62 2*68ISOBUTANE 0*0 0*88 0*49N-BUTANE 0« 0 1 * 90 0*99ISOPENTANE 0*02 3*06 2*12N-PENTANE 0*02 2*01 1*4422-DMB 0*03 0*58 0*392MPEWT ANE 1*72 9*98 8*303MPENT ANE 1*17 7.07 5*58N-HEXANE 4*30 13*1 1 12*89HEXENE 1*20 0*0 0*0MCPENTANE 65*76 37*S7 44*09MCPENTENE 2*84 0*29 0*34CYCLOHEXANE 0*75 0*71 1*38CYCLOHEXENE 0*24 0*0 0*0BENZENE 21*94 18*13 18*41TOLUENE 0*02 0*0 0*0XYLENES 0*0 0*0 0*0
MATERIAL BALANCE* PCT 98*18 93*88 94*22HYDROGEN BALANCE* PCT 96*98 100*60 101*17CARBON BALANCE* PCT 97*82 99*73 99*49
MCP CONVERSION* PCT RATE CONSTANTS X1000
34*24 62*43 55*91
KA (GM MOLS 94*05 6*17 7*17KB PER HR 25*26 6*06 5*15KC PER GM CAT* 49*76 29*48 18*40KO PER ATM) U 1 * 12 9*17 5*97
Reproduced with permission of the copyright owner. Further reproduction prohibited without permission.

2 2 8
TABLE B
EXPERIMENTAL DATA WITH PT-RE CATALYST
BALANCE NO* PR-31C PR-31D PR-31ECATALYST P-RE P-RE P-RE
WT* GMS 12*4646 12*4846 12*4846VOL* CC 20* 20* 20*SIZE* MM 0*208-0*420 0*208-0*420 0*208-0*420
TEMPERATURE* DEG* F BOO* 800* 800*PRESSURE* PSIA 215* 215* 215*HYDROCARBON PP* PSIA 19* 19* 20*HYDROGEN PP* PSIA 196* 195* 195*MOLS H2/M0L FEED 10*25 10*13 9*86V/HR/V 2*04 2*04 2*04W/HR/W 2*40 2*40 2*40SPACE TIME* 1/W/HR/W 0*416 0*416 0*416TIME ON FEED* HRS 86*6 105*1 127*2
PRODUCT YIELO MOLS/100 MOLS HYDROCARBON FEED
HYDROGEN 10*91 6*11 44*02METHANE 8*47 4*55 0*0ETHANE 1*00 0*31 0*0PROPANE 1*57 0*61 0*0ISQBUT ANE 0*42 0*23 0*0N-BUTANE 1*08 0*35 0*0ISOPENTANE 1*23 0*52 0*02N-PENTANE 1*22 0*28 0*0122-DMB 0*06 0*02 0*022MPENT ANE 5*69 3*50 1*853MPENT ANE 4*22 2*38 1*17N-HEXANE 11*55 9*70 8*98HEXENE 0*0 0*0 0*0MCPENTANE 53*15 64*57 69*04MCPENTENE 0*48 0*70 0*72CYCLOHEXANE 1*16 1*54 1*88CYCLOHEXENE 0*0 0*0 0*0BENZENE 18*02 15*18 16*32TOLUENE 0*07 0*0 0*0XYLENES 0*0 0*0 0*0
MATERIAL BALANCE* PCT 91*78 96*31 96*74HYDROGEN BALANCE* PCT 99*60 99*06 100*35CARBON BALANCE* PCT 100*18 100*42 99*85
MCP CONVERSION* PCT RATE CONSTANTS X1000
46*85 35*43 30*96
KA < GM MOLS 6* 63 4*72 4*82KB PER HR 4*30 3*00 2*40KC PER GM CAT* 13*93 6*94 1*83KD PER ATM) 3*84 1*91 0*69
Reproduced with permission of the copyright owner. Further reproduction prohibited without permission.
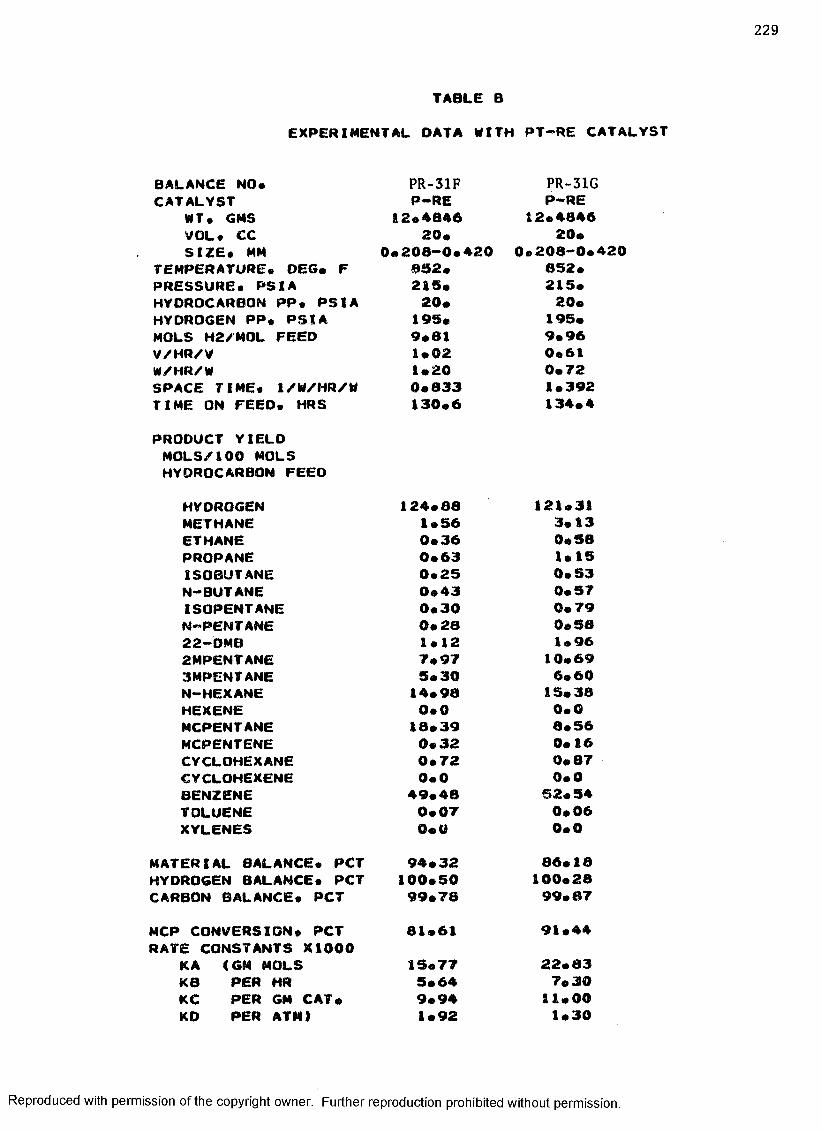
TABLE B
EXPERIMENTAL DATA WITH PT-RE CATALYST
BALANCE NO* PR-31F PR-31GCATALYST P-RE P-RE
WT* GMS 12*4846 12*4846VOL* CC 20* 20*SIZE* MM 0*208-0*420 0*208-0*420
TEMPERATURE* DEG* F 852* 852*PRESSURE* PSIA 215* 215*HYDROCARBON PP* PSIA 20* 20*HYDROGEN PP* PSIA 195* 195*MOLS H2/M0L FEED 9*81 9*96V/HR/V 1*02 0*61W/HR/W 1*20 0*72SPACE TIME* 1/W/HR/W 0*833 1*392TIME ON FEED* HRS 130*6 134*4
PRODUCT YIELD MOLS/100 MOLS HYDROCARBON FEED
HYDROGEN 124*88 121*31METHANE 1*56 3*13ETHANE 0*36 0*58PROPANE 0*63 1*15ISOBUTANE 0*25 0*53N-BUTANE 0*43 0*57ISOPENTANE 0*30 0*79N-PENTANE 0*28 0*5822-DMB 1*12 1*962MPENTANE 7*97 10*693MPENT ANE 5*30 6*60N-HEXANE 14*98 15*38HEXENE 0*0 0 *0MCPENTANE 18*39 8*56MCPENTENE 0*32 0*16CYCLOHEXANE 0*72 0*87CYCLOHEXENE 0*0 0*0BENZENE 49*48 52*34TOLUENE 0*07 0*06XYLENES 0 * 0 0*0
MATERIAL BALANCE* PCT 94*32 86*18HYDROGEN BALANCE* PCT 100*50 100*28CARBON BALANCE* PCT 99*78 99*87
MCP CONVERSION* PCT 81*61 91*44RATE CONSTANTS X1000
KA (GM MOLS 15*77 22*83KB PER HR 5*64 7*30KC PER GM CAT* 9*94 11*00KD PER ATM) 1*92 1*30
Reproduced with permission of the copyright owner. Further reproduction prohibited without permission.
APPENDIX C
EXPERIMENTAL DATA WITH PT CATALYST
Reproduced with permission of the copyright owner. Further reproduction prohibited without permission.
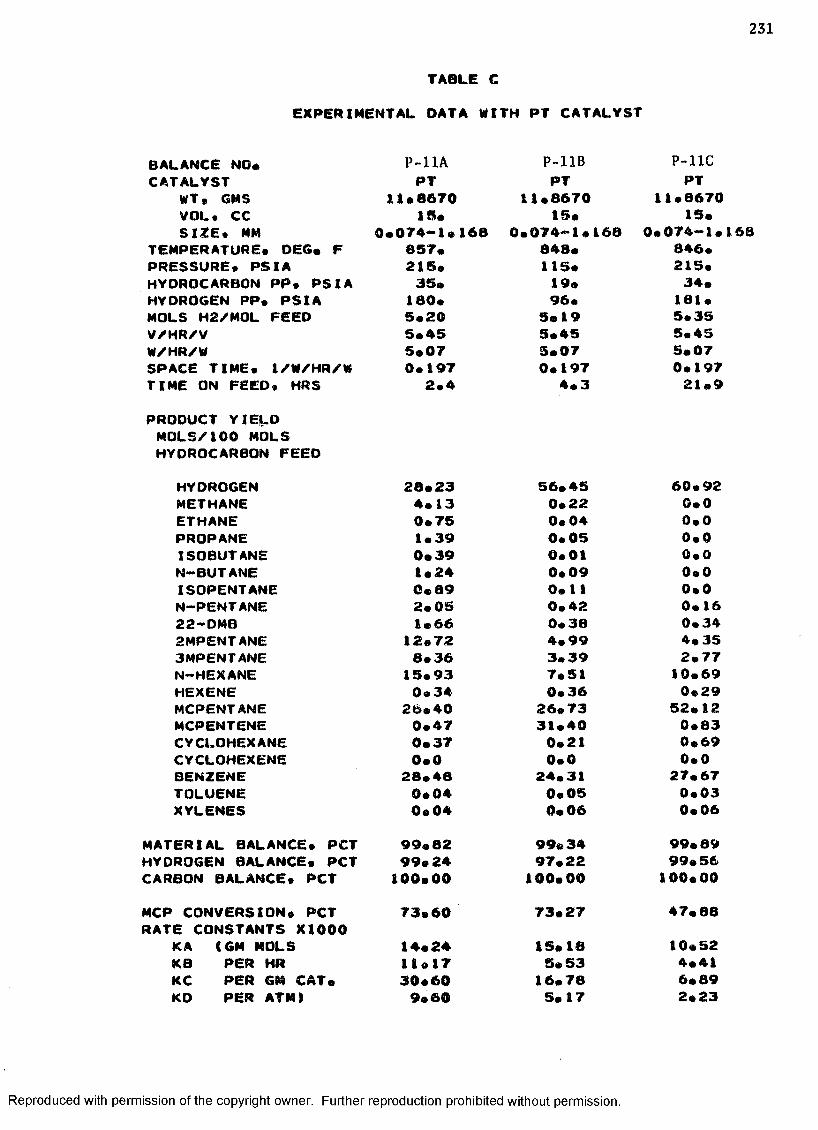
TABLE C
EXPERIMENTAL DATA WITH PT CATALYST
BALANCE NO* P-11A P-11BCATALYST PT PT
WT• GMS 11*8670 11*8670VOL. CC 15* 15*SIZE* MM 0*074-1*168 0*074-1*
TEMPERATURE* DEG* F 857* 848*PRESSURE* PSIA 215* 115*HYDROCARBON PP* PSIA 35* 19*HYDROGEN PP* PSIA 180* 96*MOLS H2/M0L FEED 5*20 5*19V/HR/V 5*45 5*45W/HR/W 5*07 5*07SPACE TIME* 1/W/HR/W 0*197 0*197TIME ON FEED* HRS 2*4 4*3PRODUCT YIEL.D MOLS/100 MOLS HYDROCARBON FEED
HYDROGEN 28*23 56*45METHANE 4*13 0*22ETHANE 0*75 0*04PROPANE 1*39 0*05ISOBUTANE 0*39 0*01N-BUTANE 1*24 0*09ISOPENTANE 0*89 0*11N-PENTANE 2*05 0*4222-DMB 1*66 0*382MPENT ANE 12*72 4*993MPENT ANE 8*36 3*39N-HEXANE 15*93 7*51HEXENE 0*34 0*36MCPENTANE 26*40 26.73MCPENTENE 0*47 31*40CYCLOHEXANE 0*37 0*21CYCLOHEXENE 0*0 0*0BENZENE 28*48 24*31TOLUENE 0*04 0*05XYLENES 0*04 0*06
MATERIAL BALANCE* PCT 99*82 99*34HYDROGEN BALANCE* PCT 99*24 97*22CARBON BALANCE* PCT 100*00 100*00MCP CONVERSION* PCT 73*60 73*27RATE CONSTANTS X1000
KA (GM MOLS 14*24 15*18KB PER HR 11*17 5*53KC PER GM CAT* 30*60 16*78KD PER ATM} 9*60 5* 17
P-11C PT
11*8670 15*
0*074— 1*1 846* 215* 34* 181* 5*35 5*45 5*07 0*197 21*9
60*920*00*00*00*00*00*00*160*344*352*77
10*690*29
52*120*830*690*0
27*670*030*06
99*8999*56
100*00
47*8810*524*416*892*23
Reproduced with permission of the copyright owner. Further reproduction prohibited without permission.

2 3 2
TABLE C
EXPERIMENTAL OATA WITH PT CATALYST
BALANCE NO* P-11D P-11ECATALYST PT PT
WT* GMS 11*8670 11*8670VOL* CC IS* 15*SIZE* MM 0<*074— I* 168 0*074-1*
TEMPERATURE* DEG* F 848* 853*PRESSURE* PSIA 115* 2 IS*HYDROCARBON PP* PSIA 18* 34*HYOROGEN PP* PSIA 97* 181*MOLS H2/M0L FEED 5*35 3*34V/HR/V 5*45 5*45W/HR/W 5*07 5*07SPACE TIME* 1/W/HR/W 0*197 0*197TIME ON FEED* HRS 24*0 42*5
P-11FPT
11.867015.
0*074-I*168 850*IIS*18*97*
5® 34 5*45 5*07 0*197 44*9
PRODUCT Y I E L D MOLS/100 MOLS HYDROCARBON FEED
HYDROGEN 72*90 58*14 69*07METHANE 0*0 0*0 0*0ETHfNE 0*0 0*0 0*0PROPANE 0*34 0*19 0*15ISOBUTANE 0*0 0* 06 0*09N-BUTANE 0*11 0*10 0*09ISOPENTANE 0*06 0*0 0*04N-PENTANE 0*21 0*0 0*0422-DMB 0*38 0* 34 0*202MPENT ANE 3*64 3*65 3*023MPENTANE 2*33 2*12 1*72N-HEXANE 7*31 9*33 6*33HEXENE 0*59 0*31 0*55MCPENTANE 51*99 53*14 54*33MCPENTENE 1*77 0*90 1*37CYCLOHEXANE 0*61 0*82 0*77CYCLOHEXENE 0*03 0*0 0*0BENZENE 30*86 29*08 30*75TOLUENE 0*0 0*03 0*02XYLENeS 0*0 0*05 0*05
MATERIAL BALANCE* PCT 99*83 99*69 99*72HYDROGEN BALANCE* PCT 99*37 98*72 98*84CARBON BALANCE* PCT 100*00 100*00 100*00
MCP CONVERSION* PCT RATE CONSTANTS X1000
48*01 46*86 45*47
KA (GM MOLS 20*51 10*64 20*07KB PER HR 5*89 3*72 4* 95KC PER GM CAT* 14*18 5*24 8*81KD PER ATM) 3*86 1*92 3*01
Reproduced with permission of the copyright owner. Further reproduction prohibited without permission.

TABLE C
EXPERIMENTAL DATA WITH PT CATALYST
BALANCE NO* P-11G P-12A P-12BCATALYST PT PT PT
WT• GMS 11*8670 1*7312 1*7312VOL* CC IS* 2S* 25*SIZE. MM 0*074-1*168 0*833— 1* 168 0*833-1*163
TEMPERATURE. DEG. F 800* 900* 900*PRESSURE. PSIA 115* 215* 215*HYDROCARBON PP. PSIA 18* 19* 19*HYDROGEN PP. PSIA 97* 195* 195*MOLS H2/MOL FEED 5*34 10*08 10*08V/HR/V 5*45 1*23 1*23W/HR/W 5*07 13*00 13*00SPACE TIME, a/W/HR/W 0*197 0.077 0*077TIME ON FEED. HRS 47*6 95*4 56*4
PRODUCT YIELD MOLS/100 MOLS HYDROCARBON FEED
HYDROGEN 27*16 91*22 86*45METHANE 0*0 0*0 0*0ETHANE 0*0 0*0 0*0PROPANE 0*0 0*0 0*0ISOBUTANE 0*0 0*0 0*0N-BUTANE 0*0 0*0 0*0ISOPENTANE 0*0 0*02 0*0N-PENTANE 0*0 0* 03 0*2122—OMB 0*03 0*31 0*222MPENTANE 1*50 4*48 4*243MPENTANE 0*74 2*64 2*92N-HEXANE 3*98 8*02 8*34HEXENE 0*33 0*39 0*49MCPENTANE 77*15 46*36 46*20MCPENTENE 1*12 1*43 1*24CYCLOHEXANE 0*84 1*15 1*23CYCLOHEXENE 0*0 0*0 0*0BENZENE 14*31 39*22 34*95TOLUENE 0*0 0*0 0*0XYLENES 0*0 0*0 0*0
MATERIAL BALANCE. PCT 99*77 97*41 98*12HYOROGEN BALANCE. PCT 99*06 98*94 99*04CARBON BALANCE* PCT 100*00 96*73 97*71
MCP CONVERSION. PCT RATE CONSTANTS X1000
22*89 93*64 53*80
KA (GM MOLS 8*01 60*68 60*44KB PER HR 2*46 19*60 17*26KC PER GM CAT* 3*98 29*06 40*33KO PER ATM! 1*17 11*09 10*43
Reproduced with permission of the copyright owner. Further reproduction prohibited without permission.

TABLE CEXPERIMENTAL DATA MITH PT CATALYST
BALANCE NO* P-13A P-13B P-14ACATALYST PT PT PT
WT« GMS 0*9250 0*9250 2*8916VOL* CC 25* 25* 25*SIZE* MM 0*833-1*168 0*833-1*168 0*833-1*168
TEMPERATURE* OEG* F 900* 900* 900*PRESSURE* PS3A 219* 215* 215*HYDROCARBON PP* PSIA 19* 19* 19*HYDROGEN PP* PSIA 195* 196* 195*MOLS H2/M0L FEED 10*13 10*35 10*11V/HR/V 0*65 0*65 2*04W/HR/W 12*98 12*98 12*99SPACE TIME* 1/W/HR/W 0*077 0*077 0*077TIME ON FEED* HRS 56*1 63*4 55*0
PRODUCT YIELDMOLS/I00 MOLSHYDROCARBON FEED
HYDROGEN 89*40 72*60 70*51METHANE 0*0 0*0 0*0ETHANE 0*0 0*0 0*0PROPANE 0*51 0*46 0*0ISOBUTANE 0*17 0* 11 0*0N-BUTANE 0*23 0*17 0*0ISOPENTANE 0*0 0*01 0*0N-PENTANE 0*01 0*01 0*0622-OMR 0*24 0*14 0*222MPENTANE 3*63 3*99 4*123MPENTANE 2*37 2*55 2*42N—HEXANE 8*22 7.70 9*96HEXENE 0*55 0*52 0*52MCPENTANE 52*35 51*23 50*08MCPENTENE 1*33 1*34 1*30CYCLOHEXANE 0*96 1*06 0*81CYCLOHEXENE 0*07 0*04 0*0BENZENE 29*77 30*93 30*51TOLUENE 0*0 0*04 0*02XYLENES 0*0 0*03 0*0
MATERIAL BALANCE* PCT 98*75 97*15 100*38HYDROGEN BALANCE* PCT 100*24 98*49 99*85CARBON BALANCE* PCT 98*07 96*54 100*62
MCP CONVERSION* PCT RATE CONSTANTS X1000
47*65 48*77 49*92
KA (GM MOLS 48*54 51*87 50*64KB PER HR 15*65 14*97 19* 00KC PER GM CAT* 30*30 30*67 27*58KD PER ATM) 9*24 10*20 9* 19
Reproduced with permission of the copyright owner. Further reproduction prohibited without permission.

2 3 5
TABLE C
EXPERIMENTAL DATA WITH PT CATALYST
BALANCE NO* P-14B P-14C P-14DCATALYST PT PT PT
WT• GMS 2*0916 2*8916 2*8916VOL* CC 2S* 25* 25*SIZE* MM 0*833-1*166 0*833-1*166 0*833-1*168
TEMPERATURE* DEG* F 600* 850* 900*PRESSURE* PSIA 21S* 215* 215*HYOROCARBON PP* PSIA 19* 20* 20*HYDROGEN PP* PSIA 195* 195* 195*MOLS H2/MOL FEED 10* 10 9*82 9*96V/HR/V 0*65 1*22 2*04W/HR/W A* IS 7*78 12*99SPACE TIME* 1/W/HR/W 0*241 0*129 0*077TIME ON FEED* HRS 59*3 62*2 65*0
PRODUCT YIELO MOLS/100 MOLS HYDROCARBON FEED
HYDROGEN 30*71 47*20 67*79METHANE 0*0 0*0 0*0ETHANE 0*0 0*0 0*0PROPANE 0*0 0*0 0*0ISOBUTANE 0*0 0*0 0*0N-BUTANE 0*0 0*0 0*0ISOPENTANE 0*0 0*0 0*01N-PENTANE 0*0 0*0 0*0222-DMB 0*02 0*04 0*292MPENTANE 1*90 2*78 4*013MPENTANE 1*17 1.77 2*67N-HEXANE 7*03 8*51 9*70HEXENE 0*17 0*30 0*57MCPENTANE 74*75 62*57 52*47MCPENTENE 0*56 0*73 1*13CYCLOHEKAME 1*31 0*82 1*10CYCLOHEXENE 0*0 0*0 0*15BENZENE 12*99 22*49 27*78TOLUENE 0*0 0*0 0*02XYLENES 0*0 0*0 0*0
MATERIAL BALANCE* PCT 98*59 90*70 97*97HYDROGEN BALANCE* PCT 99*44 99*00 99*14CARBON BALANCE* PCT 98*20 98*57 97*45
MCP CONVERSION* PCT RATE CONSTANTS X1000
25*25 37*43 47*53
KA (GM MOLS 6*27 20*27 44*37KB PER HR 3*29 6*25 18* 36KC PER GM CAT* 3*60 13*14 31*31KD PER ATM) 1*25 3*26 8*98
Reproduced with permission of the copyright owner. Further reproduction prohibited without permission.

236
TABLE C
EXPERIMENTAL DATA KITH PT CATALVST
BALANCE NO* P-15A P-15B P-15CCATALYST PT PT PT
WT* GMS 2* 8960 2*8966 2*8968VOL* CC 25* 25* 23*SIZE* MM 0*074-0*147 0*074-0*147 0*074-0*
TEMPERATURE* DEG* F 900* 800* 891*PRESSURE* PSIA 213® 215* 213*HYDROCARBON PP* PSIA 20* 20* 20*HYDROGEN PP* PSIA 195* 195* 195*MOLS H2/MOL FEED 9*90 9*90 9*82V/HR/V 2*04 0*63 1*22V/HR/V 12*96 4*15 7*76SPACE TIME* 1/V/HR/V 0*077 0*241 0*129TIME ON FEED* HRS 93*6 61*1 63*6
PRODUCT YIELD MOLS/100 MOLS HYDROCARBON FEED
HYDROGEN 65*21 24*91 41*15METHANE 0*0 0*0 0*0ETHANE 0*0 0*0 0*0PROPANE 0*19 0*0 0*0ISOBUTANE 0*08 0*0 0*0N-BUTANE 0*14 0*0 0*0ISOPENTANE 0*0 0*0 0*0N-PENTANE 0*03 0*0 0*022-DMB 0*17 0*02 0*022MPENTANE 3*92 1*48 2*513MPENTANE 2*36 0*61 1*34N-HEXANE 10*17 6*31 8*57HEXENE 0*64 0*20 0*31MCPENTANE 31*11 77*51 64*95MCPEKTENE 1*49 0*67 0*97CYCLOHEXANE 1*29 1*42 1*11CYCLOHEXENE 0*0 0*0 0*0BENZENE 28*57 11*59 20*21TOLUENE 0*02 0*0 0*0XYLENES 0*0 0*0 0*0
MATERIAL BALANCE* PCT 100*03 98*62 98*92HYDROGEN BALANCE* PCT 99*73 99*23 99*09CARBON BALANCE* PCT 100*16 98*20 98*84
MCP CONVERSION* PCT RATE CONSTANTS X1000
48*89 22*49 35*05
KA SGM MOLS 45*76 5*29 17*73KB PER HR 18*95 2*84 7*86KC PER GM CAT* 26*65 3*24 7*16KD PER ATMI 8*74 0*85 2*88
Reproduced with permission of the copyright owner. Further reproduction prohibited without permission.

237
TABLE C
EXPERIMENTAL OATA WITH PT CATALYST
BALANCE NO* P-16A P-16B P-16CCATALYST PT PT PT
WT• GMS 2*8947 2*8947 2*8947VOL« CC 25* 25* 25*SIZE* MM 0*208-0*420 0*208-0*420 OcL08-0*420
TEMPERATURE* DEG* F 900* 800* 850.PRESSURE* PSIA 215* 215* LI 5*HYDROCARBON PP* PSIA 20* 20* 20*HYDROGEN PP* PSIA 195* 195* 195*MOLS H2/M0L FEED 9*93 9*96 9*70V/HR/V 2*04 0*65 1*22W/HR/W 12*97 4*15 7*77SPACE TIME* l/W/HR/W 0.077 0*241 0*129TIME ON FEED* HRS 55*4 38*2 62*7PRODUCT YIELD MOLS/100 MOLS HYDROCARBON FEED
HYDROGENMETHANEETHANEPROPANEISOBUTANEN-BUTANEISOPENTANEN-PENTANE22—DMB2MPENTANE3MPENTANEN-HEXANEHEXENEMCPENT ANEMCPENTENECYCLOHEXANECYCLOHEXENEBENZENETOLUENEXYLENES
67*620*00*00*400*00*250*00*00*224*122*52
10*470*51
46*631*210*760*0
33*060*020*06
28*310*00*00*00*00*00*00*00*021*310*897*120*14
74*860*431*350*0
13*880*00*0
40*800*00*00*00*00*00*00*00*112*691*509*090*32
62*280*810*890*0
22*310*00*0
MATERIAL BALANCE* PCT 98*80 96*55 97*76HYDROGEN BALANCE* PCT 98*68 98*23 98*28CARBON BALANCE* PCT 98*86 95*80 97*54
MCP CONVERSION* PCT RATE CONSTANTS XI000
53*35 25*14 37*72KA (GM MOLS 53*72 6*64 19*91KB PER HR 20*71 3*22 8*76KC PER GM CAT* 34*53 2*56 12*79KD PER ATM) 9*30 0*85 2*92
Reproduced with permission of the copyright owner. Further reproduction prohibited without permission.

238
TABLE C
EXPERIMENTAL DATA WITH PT CATALYST
BALANCE NO* P-J6D P-16E P-16FCATALYST PT PT PT
WT• GMS 2.8947 2*8947 2.8947VOL* CC 25. 25. 25.SIZE. MM 0.208-0®420 0.208-0.420 0.208—0*^
TEMPERATURE. OEG. F 850. 830. 800.'PRESSURE. PSIA 2 1 5 . 215. 213.HYDROCARBON PP. PSIA 20. 20. 20.HYDROGEN PP. PSIA 195. 193. 193.MOLS H2/M0L FEED 10.00 9.89 9.96V/HR/V 2.04 0.65 1.22W/HR/W 12.97 4.13 7.77SPACE TIME. I/W/HR/W 0.077 0.241 0.129TIME ON FEED. MRS 64.7 66. 3 69.6PRODUCT YIELD MOLS/I00 MOLS HYDROCARBON FEED
HYDROGEN 36.34 69.20 1.05METHANE 0.0 0.0 0.0ETHANE 0.0 0.0 0.0PROPANE 0.0 0.0 0.0ISOBUTANE 0.0 0.0 0.0N-BUTANE 0.0 0.0 0.0ISOPENTANE 0.0 0.0 0.0N-PENTANE 0.0 0.0 0.022—OMB 0.02 0.22 0.02MPENTANE 1.61 3.84 0.433MPENTANE 0.97 2.30 0.19N-HEXANE 5.99 12.27 2.34HEXENE 0.33 0.29 0.18MCPENTANE 74.16 48.21 90.71MCPENTENE 0.96 0.61 0.65CYCLOHEXANE 1.20 0.99 1.14CYCLOHEXENE 0.0 0.0 0.0BENZENE 14.74 31.27 4.36TOLUENE 0.0 0.0 0.0XYLENES 0.0 0.0 0.0
MATERIAL BALANCE. PCT 99.73 96.91 99.19HYDROGEN BALANCE* PCT 99.89 98.35 99.10CARBON BALANCE. PCT 99.69 96.27 99.22
MCP CONVERSION. PCT RATE CONSTANTS X1000
25.84 51.79 9.29
KA (GM MOLS 20.33 17.72 3.25KB PER HR 9.00 7.20 1.83KC PER GM CAT. 13.26 6.90 0.03KD PER ATM) 3.02 2.71 0.47
Reproduced with permission of the copyright owner. Further reproduction prohibited without permission.

TABLE CEXPERIMENTAL DATA WITH PT CATALYST
BALANCE NO* P-16G P-16H P-21ACATALYST PT PT PT
WT• GMS 2*8947 2*8947 15*4473VOL* CC 29* 25* 22*SIZE* MM 0*208-0*420 0*208-0*420 0*208-0*420
TEMPERATURE* DEG* F 800* 902* 797*PRESSURE* PSIA 215* 215* 215*HYDROCARBON PP* PSIA 20* 20* 20*HYDROGEN PP* PSIA 195* 195* 195*MOLS H2/MOL FEED 9*70 9*80 9*86V/HR/V 2*04 2*04 2*32W/HR/W 12*97 12*97 2*43SPACE TIME* i/W/HR/W 0*077 0*077 0*411TIME ON FEED* HRS 70*8 72*8 6*3PRODUCT YIELD MOLS/100 MOLS HYDROCARBON FEED
HYDROGEN 7*63 56*86 3*31METHANE 0*0 0*0 0*0ETHANE 0*0 0*0 0*0PROPANE 0*0 0*0 0*10IS08UTANE 0*0 0*0 0*0N-BUTANE 0*0 0*0 0*0ISOPEN? ANE 0*0 0*0 0*0N-PENTANE 0*0 0*02 0*1022-DMB 0*0 0* 13 0*152MPENT ANE 0*20 3a 26 4*963MPENT ANE 0*18 2*08 2*30N-HEXANE 1*94 9*03 12*88HEXENE 0*20 0*27 0*11MCPENTANE 92*42 58* 19 58*79MCPENTENE 0*77 1*60 0*37CYCLOHEXANE 0*95 1*46 1*24CYCLOHEXENE 0*0 0*09 0*0BENZENE 3*34 23*89 18*46TOLUENE 0*0 0*02 0*02XYLENES 0*0 0*0 0*06
MATERIAL BALANCE* PCT 96*74 97*87 87*71HYDROGEN BALANCE* PCT 98*44 98*98 92*81CARBON BALANCE* PCT 96*00 97.38 85*44MCP CONVERSION* PCT 7*58 41*81 41*21RATE CONSTANTS X1000
KA 4GM MOLS 3*99 35*96 6*38KB PER HR 2*50 14*86 4*12KC PER GM CAT* 0*05 20*19 5*80KD PER ATM) 0*48 6*98 1*79
with permission of the copyright owner. Further reproduction prohibited without permission.

2 4 0
TABLE C
EXPERIMENTAL DATA WITH PT CATALYST
BALANCE NO* P-21B P-21C P-21DCATALYST PT PT PT
WT* GMS 15*4473 15*4473 15*4473VOL* CC 22* 22* 22*SIZE* MM 0*206-0*420 0*208-0*420 0*208-0*420
TEMPERATURE* DEG* F 802* 800* 849*PRESSURE* PSIA 215* 215* 215*HYDROCARBON PP* PSIA 20* 20* 20*HYDROGEN PP* PSIA 195* 195* 195*MOLS H2/MOL FEED 9*69 9*86 9*87V/HR/V 2*32 2*32 1*85W/HR/W 2*43 2*43 1*94SPACE TIME* 1/W/HR/W 0*411 0*411 0*515TIME ON FEED* HRS 25*6 35*0 49*9
PRODUCT YIELD MOLS/I00 MOLS HYDROCARBON FEED
HYDROGENMETHANEETHANEPROPANEISOBUTANEN BUTANEISOPENTANEN-PENTANE22—OMB2MPENT ANE3MPENT ANEN-HEXANEHEXENEMCPENTANEMCPENTENECVCLOHEXANECYCLOHEXENEBENZENETOLUENEXYLENES
34*00 0*0 0*0 0*0 0*0 0*0 0*0 0*0 0*03 2*29 1*17
10*57 0*12
66*90 0*47 1*57 0*0
16*68 0*0 0*0
33*46 0*0 0*0 0*0 0*0 0*0 0*0 0*0 0*02 2*04 1*14 9* 98 0 * 1 2
66* 12 0*49 1*70 0*0
16*24 0*03 0*09
99*66 0*60 0* 13 0*10 0*24 0*34 0*20 0*21 0*64 7*66 4*91
15*44 0*22
23*34 0*34 0*74 0*0
45*30 0*06 0*14
MATERIAL BALANCE* PCT 96*33HYDROGEN BALANCE* PCT 90*26CARBON BALANCE* PCT 95*47
94*7097*4993*46
96*7798*3796*06
MCP CONVERSION* PCT 33*10RATE CONSTANTS X1000
KA IGM MOLS 5*13KB PER HR 2*96KC PER GM CAT* 1*96KD PER ATM) 6*79
31*084*932*741*650*74
76*6619*667*079*593*38
Reproduced with permission of the copyright owner. Further reproduction prohibited without permission.
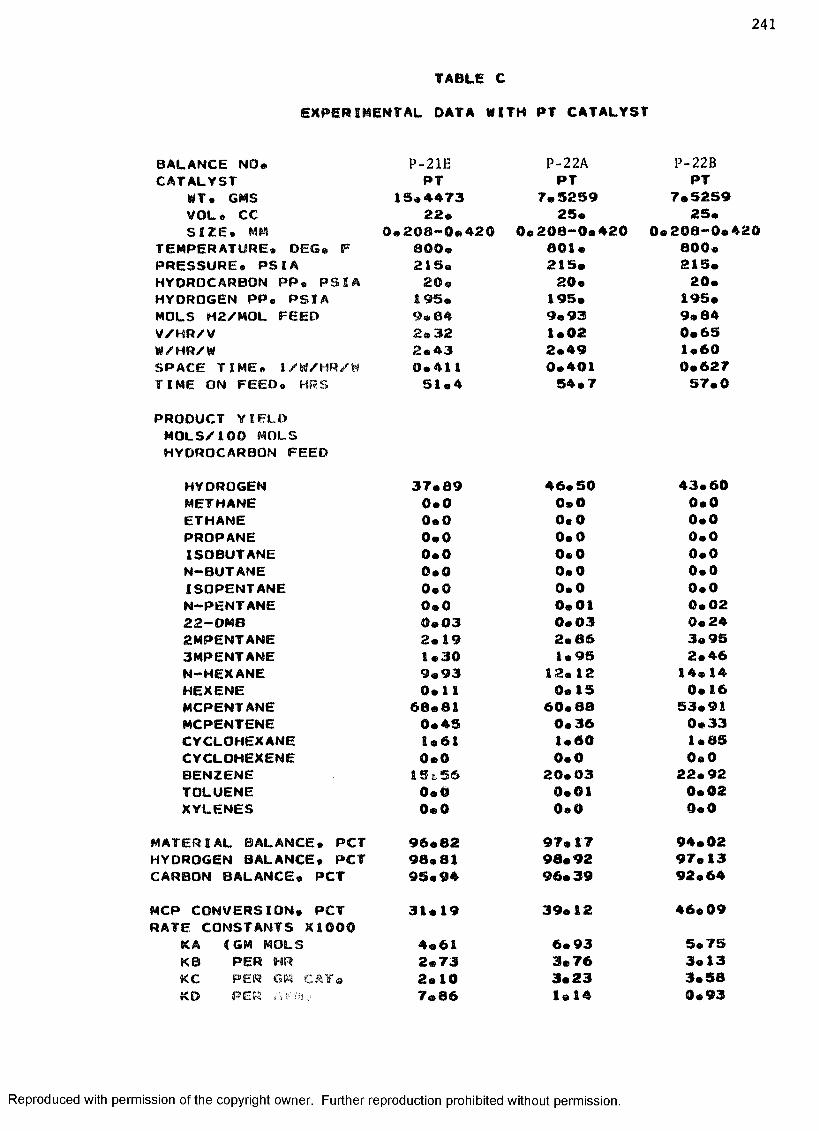
2 4 1
TABLE CEXPERIMENTAL DATA WITH PT CATALYST
BALANCE NO* P-21E P-22A P-22BCATALYST PT PT PT
WT. GMS 15*4473 7*5259 7*5259VOL. CC 22* 25* 25*SIZE. MM 0* 208—0®420 0*208-0*420 0* 208-0**
TEMPERATURE. OEG* F 800* 801* 800*PRESSURE. PSIA 215® 215* 215*HYDROCARBON PP. PSIA 20® 20* 20*HYOROGEN PP. PSIA 195* 195* 195*MOLS H2/MOL FEED 9*84 9*93 9*84V/HR/V 2® 32 1*02 0*65W/HR/W 2*43 2*49 1*60SPACE TIME. 1/ W / H R / W 0*411 0*401 0*627TIME ON FEED. HRS 51*4 54*7 57*0PRODUCT Y I E L D MOLS/100 MOLS HYDROCARBON FEED
HYDROGEN 37*89 46*50 43*60METHANE 0*0 0*0 0*0ETHANE 0*0 0*0 0*0PROPANE 0*0 0*0 0*0ISOBUTANE 0*0 0*0 0*0N-BUTANE 0*0 0*0 0*0ISOPENTANE 0*0 0*0 0*0N-PENTANE 0*0 0*01 0*0222-DMB 0*03 0*03 0*242MPENT ANE 2*19 2*86 3*953MPENT ANE 1*30 1*95 2*46N-HEXANE 9*93 12* 12 14*14HEXENE 0*11 0*15 0*16MCPENTANE 68*81 60*88 53*91MCPENTENE 0*49 0*36 0*33CYCLOHEXANE 1*61 1*60 1*85CYCLOHEXENE 0*0 0*0 0*0BENZENE I St. 56 20*03 22*92TOLUENE 0*0 0*01 0*02XYLENES 0*0 0*0 0*0
MATERIAL BALANCE. PCT 96*82 97* 17 94*02HYDROGEN BALANCE. PCT 98*81 98*92 97*13CARBON BALANCE. PCT 95*94 96*39 92*64MCP CONVERSION. PCT 31*19 39*12 46*09RATE CONSTANTS XI000
KA (GM MOLS 4*61 6*93 5*75KB PER HR 2*73 3* 76 3*13KC PER GM CAT® 2*10 3*23 3*58KD PER AfHS 7*86 1*14 0*93
Reproduced with permission of the copyright owner. Further reproduction prohibited without permission.
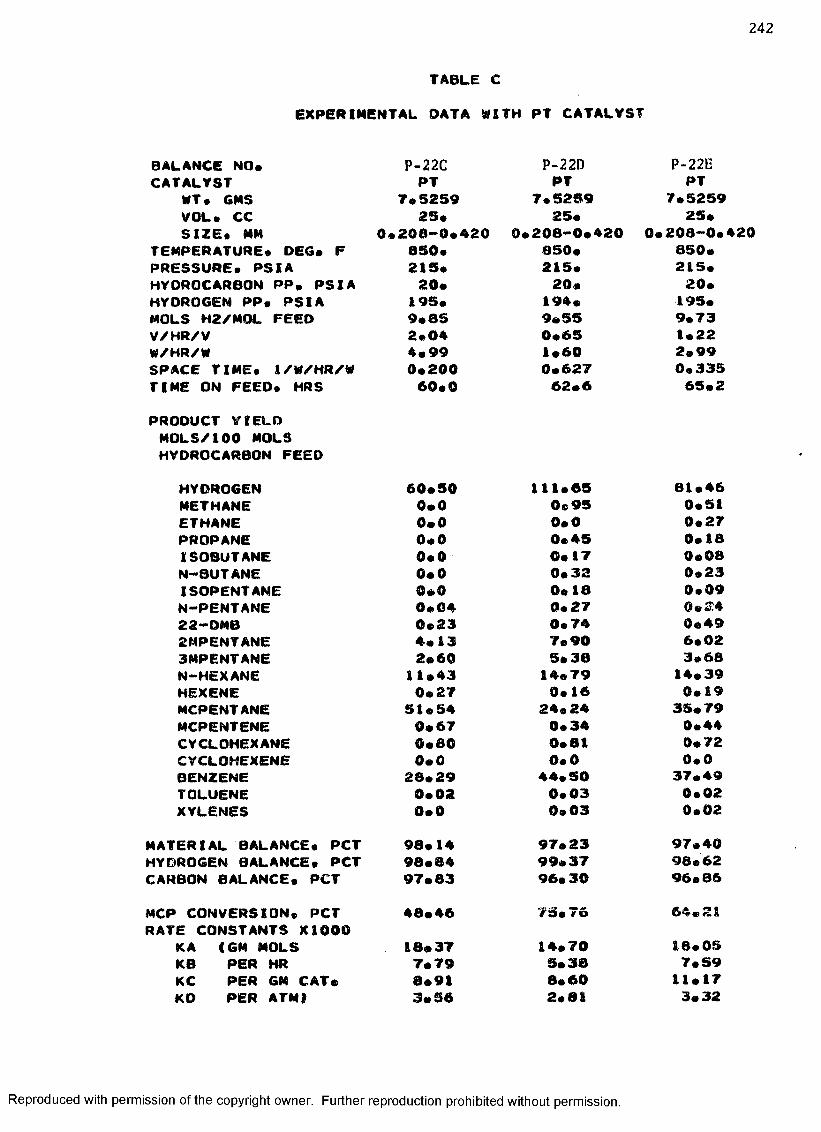
2 4 2
TABLE C
EXPERIMENTAL DATA WITH PT CATALYST
BALANCE NO* P-22C P-22D P-22ECATALYST PT PT PT
WT* GMS 7*5259 7*5259 7*5259VOL* CC 25* 25* 25*SIZE* MM 0*200-0*420 0*208-0*420 0*208-0*420
TEMPERATURE* DEG* F 050* 850* 850*PRESSURE* PSIA 215* 215* 215*HYDROCARBON PP. PSIA 20* 20* 20*HYDROGEN PP* PSIA 195* 194* 195*MOLS H2/MQL FEED 9*85 9*55 9*73V/HR/V 2*04 0*65 1*22W/HR/W 4*99 1*60 2*99SPACE TIME* 1/W/HR/W 0*200 0*627 0*335TIME ON FEEO* HRS 60*0 62*6 65*2PRODUCT YIELD MOLS/I00 MOLS HYDROCARBON FEED
HYDROGEN 60*50 111*65 81*46METHANE 0*0 0*95 0*51ETHANE 0*0 0*0 0*27PROPANE 0*0 0*45 0*18ISOBUTANE 0*0 0*17 0*08N—BUT ANE 0*0 0*32 0*23ISOPENTANE 0*0 0*18 0*09N-PENTANE 0*04 0*27 0 * 2 422-DMB 0*23 0*74 0*492MPENTANE 4* 13 7*90 6*023MPENT ANE 2*60 5*38 3*68N-HEXANE 11*43 14*79 14*39HEXENE 0*27 0*16 0*19MCPENTANE 51*54 24*24 35*79MCPENTENE 0*67 0*34 0*44CYCLOHEXANE 0*60 0*81 0*72CYCLOHEXENE 0*0 0*0 0*0BENZENE 28*29 44*50 37*49TOLUENE 0*02 0*03 0*02XYLENES 0*0 0*03 0*02
MATERIAL BALANCE* PCT 98*14 97*23 97*40HYDROGEN BALANCE* PCT 98*84 99*37 98*62CARBON BALANCE* PCT 97*83 96*30 96*86MCP CONVERSION* PCT 48*46 7 5 * 76 6 4 *2 1RATE CONSTANTS X1000
KA < GM MOLS 18*37 14*70 18*05KB PER HR 7*79 5*3B 7*59KC PER GM CAT* 8*91 8*60 11*17KO PER ATM! 3*56 2*81 3*32
Reproduced with permission of the copyright owner. Further reproduction prohibited without permission.
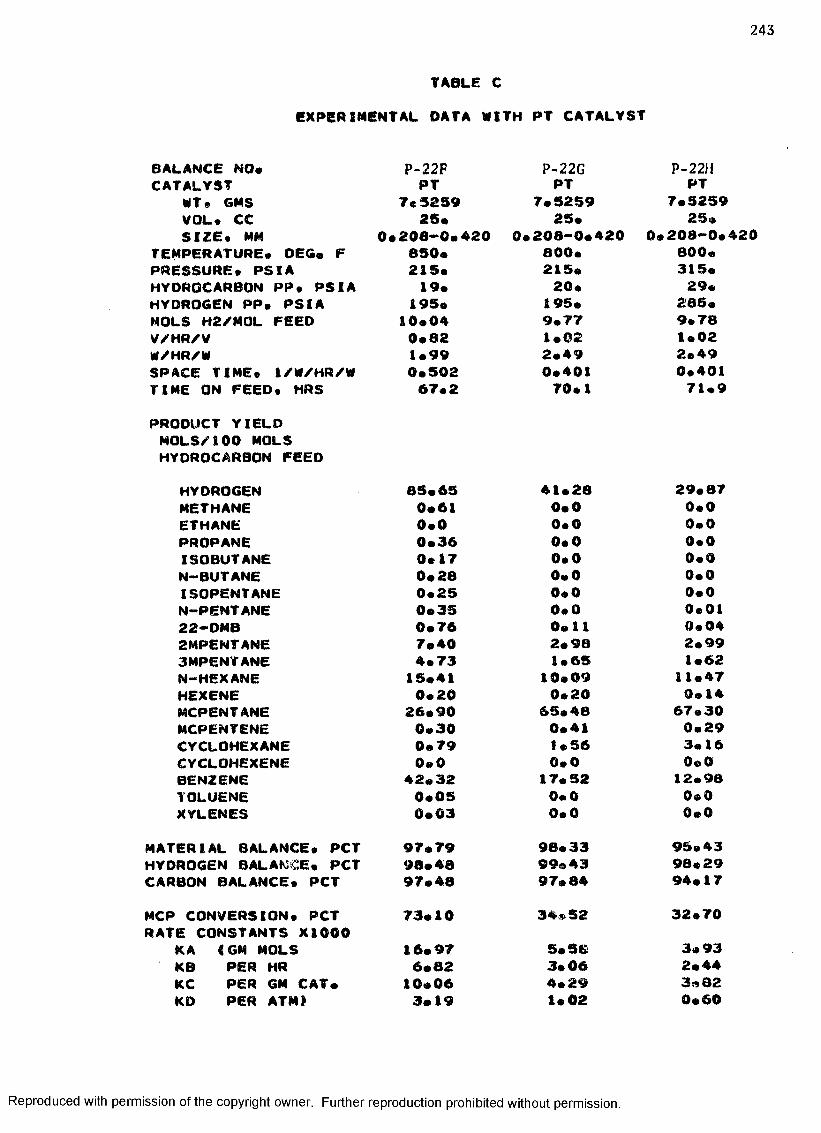
2 4 3
TABLE CEXPERIMENTAL DATA WITH PT CATALYST
BALANCE NO* P-22F P-22G P-22HCATALYST PT PT PT
WT 9 GMS 7c 5259 7*5259 7*5259VOL* CC 25* 25* 25*SIZE* MM 0*208-0.420 0*208-0*420 0*208-0*420
TEMPERATURE* OEG* F 650* 800* 800*PRESSURE* PSIA 215* 215* 315*HYDROCARBON PP* PSIA 19* 20* 29*HYDROGEN PP* PSIA 195* 195* 285*MOLS H2/M0L FEED 10*04 9*77 9*78V/HR/V 0*82 1*02 1*02W/HR/W 1*99 2*49 2*49SPACE TIME* 1/W/HR/W 0*502 0*401 0*401TIME ON FEED* HRS 67*2 70*1 71*9PRODUCT YIELD MOLS/100 MOLS HYDROCARBON FEED
HYDROGEN 85*65 41*28 29*87METHANE 0*61 0*0 0*0ETHANE 0*0 0*0 0*0PROPANE 0*36 0*0 0*0ISOBUTANE 0*17 0*0 0*0N-BUTANE 0*28 0*0 0*0ISOPENTANE 0*25 0*0 0*0N-PENTANE 0*35 0*0 0*0122—OMB 0*76 0*11 0*042MPENT ANE 7*40 2*98 2*993MPENY ANE 4*73 1*65 1*62N-HEXANE 15*41 10*09 11*47HEXENE 0*20 0*20 0*14MCPENTANE 26*90 65* 48 67*30MCPENTENE 0*30 0*41 0*29CYCLOHEXANE 0*79 1*56 3*16CYCLOHEXENE 0*0 0*0 0*0BENZENE 42*32 17*52 12*98TOLUENE 0*05 0*0 0* 0XYLENES 0*03 0*0 0*0
MATERIAL BALANCE* PCT 97*79 98*33 95*43HYDROGEN BALANCE* PCT 98*48 99*43 98*29CARBON BALANCE* PCT 97*48 97*84 94*17MCP CONVERSION* PCT RATE CONSTANTS X1000
73*10 34*52 32*70KA (GM MOLS 16*97 5*58 3*93KB PER HR 6*82 3*06 2*44KC PER GM CAT* 10*06 4*29 3*82KD PER ATM) 3*19 1*02 0*60
Reproduced with permission of the copyright owner. Further reproduction prohibited without permission.
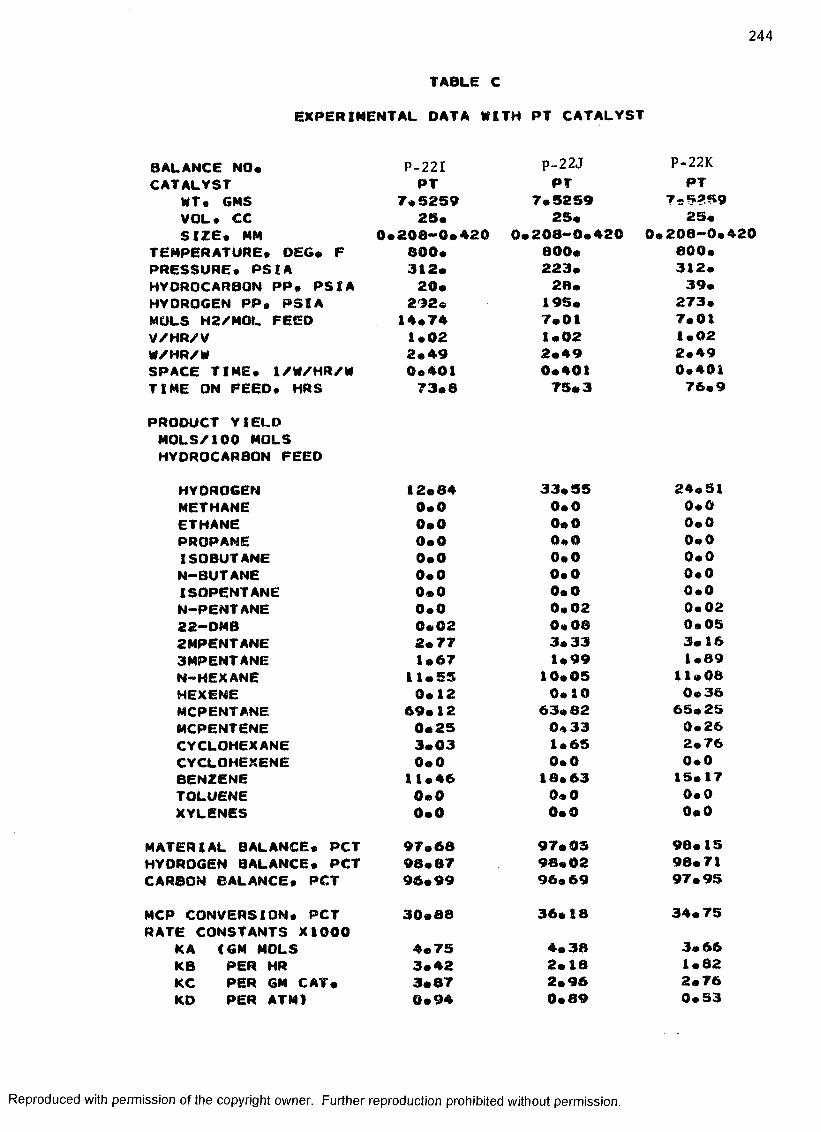
2 4 4
TABLE C
EXPERIMENTAL DATA WITH PT CATALYST
BALANCE NO* P-22I P-22J P-22KCATALYST PT PT PT
WT * GMS 7*5259 7*5259 7 .59,59VOL* CC 25* 25* 25*SIZE* MM 0*208-0*420 0*208-0*420 0*208-0*
TEMPERATURE* OEG* F 800* 800* 800*PRESSURE* PSIA 312* 223* 312*HYDROCARBON PP* PSIA 20* 28* 39*HYDROGEN PP* PSIA 292* 195* 273*MOLS H2/M0L FEED 14*74 7*01 7*01V/HR/V 1*02 1*02 1*02W/HR/W 2*49 2*49 2*49SPACE TIME* l/W/HR/W 0*401 0*401 0*401TIME ON FEED* HRS 73*8 75*3 76*9
PRODUCT YIELD MOLS/lOO MOLS HYDROCARBON FEED
HYDROGEN 12*84 33*55 24*51METHANE 0*0 0*0 0*0ETHANE 0*0 0*0 0*0PROPANE 0*0 0* 0 0*0ISOBUTANE 0*0 0*0 0*0N—BUTANE 0*0 0*0 0*0ISOPENTANE 0*0 0*0 0*0N—PENT ANE 0*0 0*02 0*0222-DMB 0*02 0*08 0*052MPENTANE 2* 77 3*33 3*163MPENT ANE 1*67 1*99 1*89N-HEXANE 11*55 10*05 11*08HEXENE 0*12 0*10 0*36MCPENTANE 69*12 63*82 65* 25MCPENTENE 0*25 0*33 0*26CYCLOHEXANE 3*03 1*65 2*76CYCLOHEXENE 0*0 0*0 0*0BENZENE 11*46 18*63 15*17TOLUENE 0*0 0*0 0*0XYLENES 0*0 0*0 0*0
MATERIAL BALANCE* PCT 97*68 97*05 98*15HYOROGEN BALANCE* PCT 98*87 98*02 98*71CARBON BALANCE* PCT 96*99 96*69 97*95
MCP CONVERSION* PCT 30*88 36*18 34*75RATE CONSTANTS XI000
KA (GM MOLS 4*75 4*38 3*66KB PER HR 3*42 2*18 1*82KC PER GM CAT* 3*87 2*96 2*76KD PER ATM) 0*94 0*89 0*53
Reproduced with permission of the copyright owner. Further reproduction prohibited without permission.

2 4 5
TABLE CEXPERIMENTAL DATA WITH PT CATALYST
BALANCE NO. P-22L P-22M P-22NCATALVST PT PT PT
WT» GMS >.5259 7*5259 7.5259VOL. CC 25. 25. 25.SIZE. MM 0.208-0.420 0.206-0.420 0.208-0.420
TEMPERATURE. DEG. F 800. 800. 800.PRESSURE. PSIA 117. 234. 215.HYDROCARBON PP. PSIA 19. 38. 19.HYDROGEN PP. PSIA 98. 196. 195.MOLS H2/MOL FEED 5.09 5.12 10.06V/HR/V 1.02 1.02 1.02W/HR/W 2.49 2.49 2.49SPACE TIME. I/W/HR/W 0.401 0.401 0.401TIME ON FEED. HRS 78.6 80.2 81.6
PRODUCT YIELO MOLS/100 MOLS HYDROCARBON FEED
HYDROGEN 69.66 49.11 34.18METHANE 0.0 0.0 0.0ETHANE 0.0 0.0 0.0PROPANE 0.0 0.0 0.0ISOBUTANE 0.0 0.3 0.0N-BUTANE 0.0 0.0 0.0ISOPENTANE 0.0 0.0 0.0N-PENTANE 0.07 0.04 0.022-DMB 0.12 0.17 0.102MPENT ANE 3.25 2. SO 3. 123MPENT ANE 2.00 1.89 1.85N-HEXANE 7.66 9.58 9.70HEXENE 0.0 0.15 0.19MCPENTANE 58.46 63.03 65.80MCPENTENE 0.75 0. 44 0.44CYCLOHEXANE 0.65 1.72 1.52CYCLOHEXENE 0.0 0.0 0.0BENZENE 27.04 20.48 17.27TOLUENE 0.0 0.0 0.0XYLENES 0.0 0.0 0.0
MATERIAL BALANCE. PCT 96.37 100.56 98.21HYDROGEN BALANCE. PCT 99.19 100c42 99.03CARBON BALANCE. PCT 98. 12 100.60 97.84
MCP CONVERSION. PCT 41.34 36.97 34.20RATE CONSTANTS X1000
KA iGM MOLS 8.16 3.63 5.63KB PER HR 2.49 1.54 3.02KC PER GM CAT. 5.25 2.10 4. 54KD PER ATM) 1.33 0.54 1. 15
Reproduced with permission of the copyright owner. Further reproduction prohibited without permission.

2 4 6
TABLE C
EXPERIMENTAL OATA WITH PT CATALYST
BALANCE NO* P-220 P-22P P-23ACATALYST PT PT PT
WT* GMS 7*5259 7*5259 2*5143VOL* CC 25* 25* 25*SIZE* MM 0*208-0*420 0*208-0*420 0*208-0*
TEMPERATURE* OEG* F 850* 850* 850*PRESSURE* PSIA 215* 215* 215*HYDROCARBON PP* PSIA 19* 20* 19*HYDROGEN PP* PSIA 195* 195* 195*MOLS H2/M0L FEED 10*06 10*00 10*10V/HR/V 1*02 0*65 1 • 23W/HR/W 2*49 1*60 8*95SPACE TIME* i/W/HR/W 0*401 0*627 0* 112TIME ON FEED* HRS 84*2 86*1 57*2
PRODUCT YIELD MOLS/100 MOLS HYDROCARBON FEED
HYDROGEN 80*34 94*77 42*43METHANE 0*0 1*48 0*0ETHANE 0*0 0* 0 0*0PROPANE 0*17 0*40 0*0ISOBUTANE 0*0 0*25 0*0N—BUTANE 0*12 0*39 0*0ISOPENTANE 0*12 0*19 0*0N—PENT ANE 0* 19 0*26 0*0122—DM0 0*44 0*90 0*022MPENT ANE 6*51 8*93 2*333MPENT ANE 4* 3 4 5*59 1*38N-HEXANE 13*89 16*17 7*83HEXENE 0*22 0*18 0*29MCPENTANE 35*16 20*65 69*25MCPENTENE 0*38 0*29 0*88CYCLOHEXANE 0*81 0*83 1*02CYCLOHEXENE 0*0 0*0 0*03BENZENE 37*79 45*12 16*96TOLUENE 0*02 0*03 0*0XYLENES 0*01 0*03 0*0
MATERIAL BALANCE* PCT 96*77 97*42 97* 52HYOROGEN BALANCE* PCT 98*27 98*61 99* 04CARBON BALANCE* PCT 96*10 96*89 96*84
MCP CONVERSION* PCT 64*84 79*35 30*75RATE CONSTANTS X1000
KA (GM MOLS 15*92 17*35 17*00KB PER HR 6*37 6*97 8*33KC PER GM CAT* 9*72 10*24 9*43KD PER ATM) 3*25 3*17 3*21
420
Reproduced with permission of the copyright owner. Further reproduction prohibited without permission.
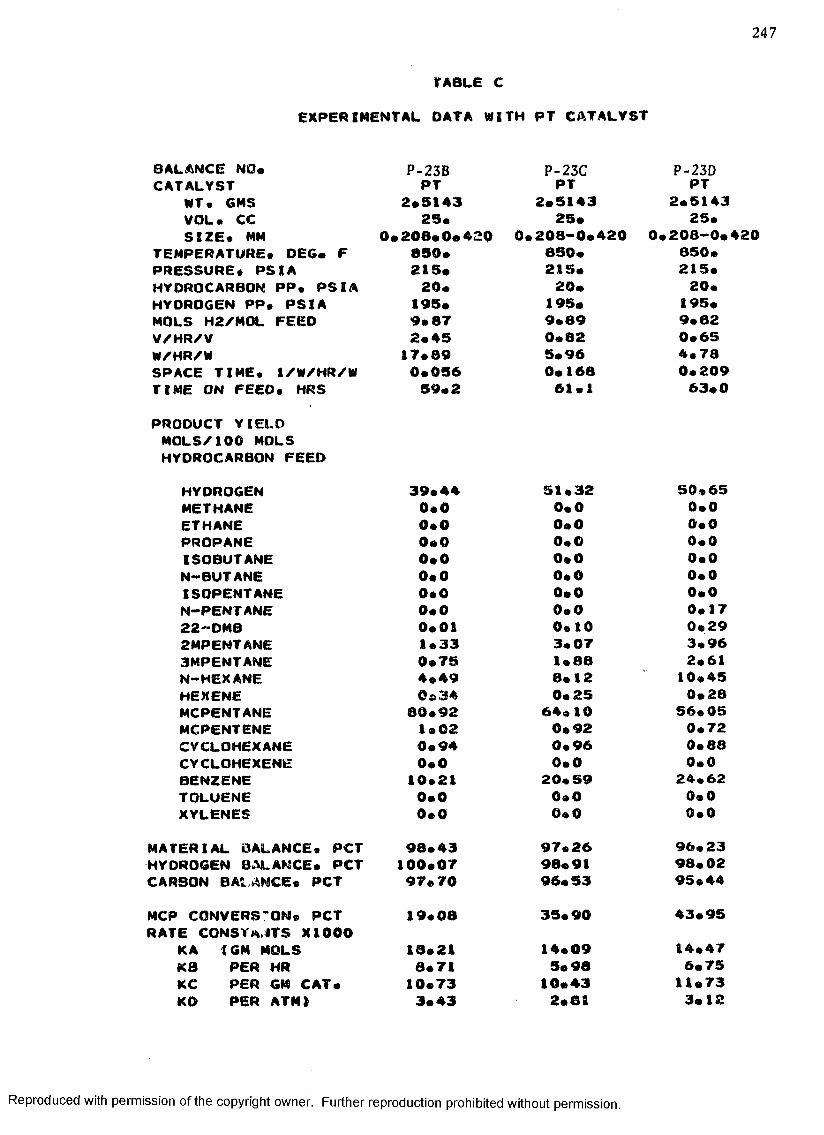
2 4 7
TABLE C
EXPERIMENTAL DATA WITH PT CATALYST
BALANCE NO* P-23B P-23C P-23DCATALYST PT PT PT
WT* GMS 2*5143 2*5143 2*5143VOL* CC 25* 25* 25*SIZE* MM 0*208*0*420 0*208-0*420 0*208—O*1
TEMPERATURE* DEG* F 850* 850* 850*PRESSURE* PSIA 215* 215* 215*HYDROCARBON PP* PSIA 20* 20* 20*HYDROGEN PP* PSIA 195* 195* 195*MOLS H2/M0L FEED 9*87 9*89 9*82V/HR/V 2*45 0*82 0*65W/HR/W 17*89 5*96 4*78SPACE TIME* 1/W/HR/W 0*056 0*168 0*209TIME ON FEEO* HRS 59*2 61*1 63*0
PRODUCT YIELD MOLS/100 MOLS HYDROCARBON FEED
HYDROGEN 39*44 51*32 50*65METHANE 0*0 0*0 0*0ETHANE 0*0 0*0 0*0PROPANE 0*0 0*0 0*0ISOBUTANE 0*0 0*0 0*0N-BUTANE 0*0 0*0 0*0ISOPENTANE 0*0 0*0 0*0N-PENTANE 0*0 0*0 0*1722-DMB 0*01 0*10 0*292MPENTANE 1*33 3*07 3*963MPENTANE 0*75 1*88 2*61N-HEXANE 4*49 8*12 10*45HEXENE 5 *3 0*25 0*28MCPENTANE 80*92 64* 10 56*05MCPENTENE 1*02 0*92 0*72CYCLOHEXANE 0*94 0*96 0*88CYCLOHEXENE 0*0 0*0 0*0BENZENE 10*21 20*59 24*62TOLUENE 0*0 0*0 0*0XYLENES 0*0 0*0 0*0
MATERIAL BALANCE* PCT 98*43 97*26 96*23HYDROGEN BALANCE* PCT 100*07 98*91 98*02CARBON BALANCE* PCT 97*70 96*53 95*44
MCP CONVERSION* PCT 19*08 35*90 43*95RATE CONST*,ITS X1000
KA t GM MOLS 13*21 14*09 14*47KB PER HR 8*71 5*98 6*75KC PER GM CAT* 10*73 10*43 11*73KD PER ATM) 3*43 2*81 3*12
Reproduced with permission of the copyright owner. Further reproduction prohibited without permission.

2 4 8
TABLE C
EXPERIMENTAL DATA WITH PT CATALYST
BALANCE NOa P-23E P-23F P-23GCATALYST PT PT PT
WT* GMS 2*5143 2*5143 2*5143VOL* CC 25* 25* 25*SIZE* MM 0*200*0*420 0*200-0*420 0*208-0*420
TEMPERATURE* OEG* F 901* 900* 850*PRESSURE* PSIA 215* 215* 215*HYDROCARBON PP* PSXA 20* 20* 20*HYDROGEN PP* PSIA 195* 195* 195*MOLS H2/MOL FEED 9*98 9*93 9*91V/HR/V 2*45 2*04 1*23W/HR/W 17*89 14*94 8*95SPACE TIME* I/W/HR/W 0*056 0*067 0*112TIME ON FEED* HRS 65* 4 66*9 67*9
PRODUCT YIELD MOLS/I00 MOLS HYDROCARBON FEED
HYDROGEN 52*84 51*90 29*90METHANE 0*0 0*0 0*0ETHANE 0*0 0*0 0*0PROPANE 0*11 0*21 0*0ISOBUTANE 0*0 0*13 0*0N-BUTANE 0*05 0*13 0*0ISOPENTANE 0*0 0*13 0*0N-PENTANE 0*02 0*13 0*0122-DMB 0*08 0*16 0*022MPENT ANE 3*01 3*68 2* 253MPENT ANE 2*01 2*19 1*25N-HEXANE 8*58 9* 82 6*46HEXENE 0*56 0*55 0*27MCPENTANE 60*38 55*25 71*78MCPENTENE 1*45 1*25 0*91CYCLOHEXANE 1*20 1*P© 1*01CYCLOHEXENE 0*0 0 * 0 0*0BENZENE 22*52 25*59 16*04TOLUENE 0*02 0*02 0*0XYLENES 0*0 0*0 0*0
MATERIAL BALANCE* PCT 99*32 96*92 99*36HYDROGEN BALANCE* PCT 99*50 98*16 99*22CARBON BALANCE* PCT 99*21 96* 36 99*42
MCP CONVERSION* PCT RATE CONSTANTS X1000
39*62 44*75 28*22
KA IGM MOLS 46*30 45*63 15*45KB PER HR 20*07 19*85 6*61KC PER GM CAT* 20*10 25*18 9*18Kft PER ATM) 9 * 0 9 9*87 2*95
Reproduced with permission of the copyright owner. Further reproduction prohibited without permission.

249
TABLE CEXPERIMENTAL DATA WITH PT CATALYST
BALANCE NO* P-23H P-23I P-23JCATALYST PT PT PT
WT• GMS 2*5143 2*5143 2*5143VOL. CC 23* 25* 25*SIZE* MM 0*208-0*420 0*208-0*420 0*208-0*420
TEMPERATURE* OEG* F 850* 850* 850*PRESSURE. PSIA 315* 115* 415*HYDROCARBON PP. PSIA 29* 10* 38*HYDROGEN PP. PSIA 286* 104* 377*MOLS H2/M0L FEED 9*86 9*93 9*93V/HR/V 1*23 1*23 1*23W/HR/W 8*95 8*95 8*95SPACE TIME. I/W/HR/W 0*112 0*112 0*112TIME ON FEED. HRS 70*3 72*0 73*8
PRODUCT YIELD MOLS/100 MOLS HYDROCARBON FEED
HYDROGEN 19*45 29*65 10*34METHANE 0*0 0*0 0*0ETHANE 0*0 0*0 0*0PROPANE 0*0 0*0 0*0ISOBUTANE 0*0 0*0 0*0N-BUTANE 0*0 0*0 0*0ISOPENT ANE 0*0 0*0 0*0N-PENTANE 0*01 0*01 0*0122-DMB 0*02 0*02 0*012MPENTANE 2*79 1*76 2*753MPENT ANE 1*63 0*97 1*63N-HEXANE 8*75 5*17 9*83HEXENE 0*20 0*55 0*16MCPENTANE 69*83 71*57 70*56MCPENTENE 0*64 1*65 0*54CYCLOHEXANE 1*26 1*55 2*02CVCLOHEXENE 0*0 0*05 0*0BENZENE 14*88 16* 72 12*49TOLUENE 0*0 0*0 0*0XYLENES 0*0 0*0 0*0
MATERIAL BALANCE. PCT 96*95 100*67 96*25HYDROGEN BALANCE. PCT 97*95 99*52 97*50CARBON BALANCE. PCT 9<t>*51 101*19 95*65MCP CONVERSION. PCT 30*17 28*43 29*44RATE CONSTANTS XI000
KA (GM MOLS 10*62 29*56 7*66KB PER HR 6*27 10*47 5*15KC PER GM CAT* 9*98 12*97 3*70KD PER ATM) 2*39 4*49 1*97
Reproduced with permission of the copyright owner. Further reproduction prohibited without permission.

2 5 0
TABLE CEXPERIMENTAL DATA WITH PT CATALYST
BALANCE NO* P-23K P-23L P-23MCATALYST PT PT PT
WT* GMS 2*5143 2*5143 2*5143VOL* CC 25* 25* 25*SIZE* MM 0*208-0*420 0*208-0*420 0*208-0*420
TEMPERATURE* OEG* F 850* 830* 850*PRESSURE* PSIA 210* 312* 156*HYDROCARBON PP* PSIA 13* 20* 20*Hy d r o g e n p p . p s i a 196* 292* 136*MOLS H2/K0L FEED 14*73 14*67 6*87V/HR/V 1*23 1*23 1*23W/HR/W 8*95 8*95 8*95SPACE TIME* 1/W/HR/W 0*112 0*112 0* 112TIME ON FEED. HRS 75*8 76*8 79*9PROOUCT YIELD MOLS/100 MOLS HYOROCARBON FEED
HYDROGEN 34*77 26*13 38*73METHANE 0*0 0*0 0*0ETHANE 0*0 0*0 0*0PROPANE 0*0 0*0 0*0ISOBUTANE 0*0 0*0 0*0N—BUT ANE 0*0 0*0 0*0ISOPENTANE 0*0 0*0 0*0N—PENT ANE 0*0 0*0 0*0222-DMB 0*01 0* 02 0*032MPENT ANE 2*57 2*57 2*173MPENT ANE 1*67 1*45 1*40N-HEXANE 7*92 9*13 6*39HEXENE 0*26 0*16 0*46MCPENTANE 71*21 71*76 67*89MCPENTENE 0*73 0*39 1*25CYCLOHEXANE 0*86 1*35 1*11CYCLOHEXENE 0*0 0*0 0*0BENZENE 14*74 12*97 19*28TOLUENE 0*0 0*0 0*0XYLENES 0*0 0*0 0*0
MATERIAL BALANCE* PCT 96*51 97*60 97*76HYDROGEN BALANCE* PCT 98*78 99*08 98*17CARBON BALANCE* PCT 95*19 96*74 97*61MCP CONVERSION* PCT 28*79 28*24 32*11RATE CONSTANTS X1000
KA (GM MOLS 21*06 13*20 18*55KB PER HR 12*09 9*07 7*08KC PER GM CAT* 15*66 8*21 14*84KD PER ATM) 5*22 3*31 2*89
Reproduced with permission of the copyright owner. Further reproduction prohibited without permission.

251
TABLE C
EXPERIMENTAL DATA WITH PT CATALYST
BALANCE NO* P-23N P-230CATALYST PT PT
WT* ©MS 2*5143 2*5143VOL* CC 29* 25*SIZE* MM 0*208-0*420 0*208-0*4
TEMPERATURE* OEG* F 850* 850*PRESSURE* PSIA 223* 312*HYDROCARBON PP* PSIA 28* 39*HYDROGEN PP* PSIA 195* 273*MOLS H2/M0L FEED 6*93 6*98V/HR/V 1*23 1*23W/HR/W 8*95 8*95SPACE TIME. 1/W/HR/W 0*112 0*112TIME ON FEED* HRS 81*8 83*4
PRODUCT YIELDMOLS/100 MOLSHYDROCARBON FEED
HYDROGEN 32*78 25*93METHANE 0*0 0*0ETHANE 0*0 0*0PROPANE 0*0 0*0ISOBUTANE 0*0 0*0N-BUTANE 0*0 0*0ISOPENTANE 0*0 0*0N-PENTANE 0*02 0*0722-DMB 0*03 0* 062MPENT ANE 2*37 2*593MPENT ANE 1*44 1*66N-HEXANE 7*37 8*36HEXENE 0*32 0*16MCPENTANE 68*83 68*82MCPENTENE 0*84 0*65CYCLOHEXANE 1*04 1*27CYCLOHEXENE 0*0 0*0BENZENE 17*75 16*36TOLUENE 0*0 0*0XYLENES 0*0 0*0
MATERIAL BALANCE* PCT 98*05 98*08HYDROGEN BALANCE* PCT 93*33 98*28CARBON BALANCE* PCT 97*95 98*01MCP CONVERSION* PCT 31*17 31*18RATE CONSTANTS X1000
KA (GM MOLS 12*28 8*68KB PER HR 5*40 4*31KC PER GM CAT* 5*94 4*19KD PER ATM) 2*32 1*91
P-23PPT
2*514325*
0*208-0*420 850*117*19*97*
4*991*238*950*11285*2
15*170*00*00*00*00*00*00*040*031*851*004*860*60
68*771*811*790*0
19*250*00*0
98*2096*0998*8431*2318*66 5*50 7*08 2* 62
Reproduced with permission of the copyright owner. Further reproduction prohibited without permission.

2 5 2
TABLE C
EXPERIML.4TAL DATA WITH PT CATALYST
BALANCE NO* P-23Q P-23R P-23SCATALYST PT PT PT
WT. GMS 2*5143 2*5143 2*5143VOL. CC 25* 23* 25*SIZE. MM 0* 208-0.420 0.208-0*420 o • N 0 <8 1 e *
TEMPERATURE. DEG* F 030* 830* 830*PRESSURE. PSIA 234* 313. 213.HYDROCARBON PP. PSIA 39* 52* 20*HYDROGEN PP. PSIA 195* 262* 195.MOLS H2/M0L FEED 5*02 3*02 9*98V/HR/V 1.23 1*23 1*23W/HR/W 8.95 8*95 8.95SPACE TIME. 1/W/HR/W 0*112 0*112 0.112TIME ON FEED. HRS 87*1 88*8 90.6
PRODUCT YIELD MOLS/100 MOLS HYOROCARBON FEED
HYDROGEN 10.71 9.77 31.42METHANE 0.0 0.0 0.0ETHANE 0*0 0*0 0.0PROPANE 0*0 0.0 0.0ISOBUTANE 0*0 0*0 0.0N-BUTANE 0.01 0.0 0.01SOPENTANE 0.01 0.0 0.0N-PENTANE 0*02 0.04 0*0122-DMB 0.07 0.05 0.022MPENT ANE 2.33 tS . Ci 1 2*423MPENT ANE 1.29 1*36 1.45N-HEXANE 6*79 7.98 7.74HEXENE 0.31 0.23 0.27MCPENTANE 68.12 68. 10 69*59MCPENTENE 0.91 0.68 0.90CYCLOHEXANE 1.15 1.28 1.04CYCLOHEXENE 0.0 0.0 0.0BENZENE 18*97 17*45 16*56TOLUENE 0.0 0.0 0.0XYLENES 0*0 0*0 0*0
MATERIAL BALANCE. PCT 97.97 74*02 98.23HYDROGEN BALANCE. PCT 93.97 82.63 98.82CARBON BALANCE. PCT 98*39 71.36 97*99
MCP CONVERSION. PCT RATE CONSTANTS X1000
31*88 31.90 30.41
KA C GM MOLS 9*39 6*94 16*31KB PER HR 3.64 3.14 8. 04KC PER GM CAT. 3*02 3*16 8*80KD PER ATM1 1*62 1.40 3*33
Reproduced with permission of the copyright owner. Further reproduction prohibited without permission.

2 5 3
TABLE C
EXPERIMENTAL DATA WITH PT CATALYST
BALANCE NO*CATALYST
WTe GMS VOL* CC SIZE* MM
TEMPERAT'JRE* DEG. F PRESSURE* PSIA HYDROCARBON PP* PSIA HYDROGEN PP* PSIA MOLS H2/MOL FEED V/HR/V W/HR/WSPACE TIME* 1/W/HR/W TIME ON FEEO* HRS
P-24APT
0.965!25*
0.208-0.420BSO.21S*20.
195.9.821.63
31.070.03256.3
P-24BPT
0.96S125.
0.208-0.420900.215.20.
195.10.001.23
23.33 0.043 SB. 2
P-24CPT
0.965!25*
0.208-0.420900.315.29.
286.1 0 . 0 11.23
23.330.04360.2
PRODUCT YIELD MOLS/100 MOLS HYDROCARBON FEED
HYDROGEN 19.66 33.14 32.63METHANE 0.0 0.0 0.0ETHANE 0.0 0.0 0.0PROPANE 0.0 0.0 0.0ISOBUTANE 0.0 0.0 0.0N-BUTANE 0.0 0.0 0.0ISOPENTANE 0.0 0.0 0.0N-PENTANE 0.0 0.01 0.0122-DMB 0.0 0.02 0.022MPENT ANE 0.76 2.27 2.673MPENTANE 0.40 1.31 1.57N-HEXANE 2.82 7.05 8.60HEXENE 0.33 0.62 0.42MCPENTANE 87.36 68.23 67.14MCPENTENE 1.14 1.49 1.05CYCLOHEXANE 0.96 1.28 1.09CYCLOHEXENE 0.0 0.0 0.0BENZENE 6.22 17.73 17.42TOLUENE 0.0 0.0 0.0XYLENES 0.0 0.0 0.0
MATERIAL BALANCE. PCT 98.60 98.19 96.59HYDROGEN BALANCE. PCT 99.57 98.62 98.08CARBON BALANCE* PCT 98.17 98.00 95. 92
MCP CONVERSION* PCT RATE CONSTANTS XI000
12.64 31.77 32.86
KA <GH MOLS 18.31 44.73 31.06KB PER HR 9.55 20.02 16.39KC PER GM CAT. 24.67 18.95 15.83KD PER ATM) 3.03 8.26 6.57
Reproduced with permission of the copyright owner. Further reproduction prohibited without permission.

2 5 4
TABLE C
EXPERIMENTAL DATA WITH PT CATALYST
BALANCE NO. P-24D P-24E P-24FCATALYST PT PT PT
WT• GMS 0*9651 0*9651 0*9651VOL* CC 25* 25* 25*SIZE* MM 0*208—0*420 0*208-0*420 0*208-0*420
TEMPERATURE* DEG* F 900* 900* 900*PRESSURE* PSIA 311* 223* 312*HYDROCARBON PP* PSIA 19* 28* 40*HYDROGEN PP* PSIA 291* 194* 272*MOLS H2/M0L FEED 14*94 6*84 6*84V/HR/V 1*23 1*23 1*23W/HR/W 23*33 23*33 23*33SPACE TIME* 1/W/HR/W 0*043 0*043 0*043TIME ON FEED* HRS 62*3 64*1 65*4
PROOUCT YIELD MOLS/IOO MOLS HYDROCARBON PEED
HYDROGEN 7*80 35*49 38*80METHANE 0*0 0*0 0*0ETHANE 0*0 0* 0 0*0PROPANE 0*0 0*0 0*0ISOBUT ANE 0*0 0*0 0*0N-BUTANE 0*0 0*0 0*0ISOPENTANE 0*0 0*0 0*0N-PENTANE 0*01 0*03 0*1022-DMB 0 * 0 2 0*03 0*102MPENTANE 2 * 62 2*37 2*623MPENT ANE 1*55 1*37 1*51N-HEXANE 8*64 6*94 8*31HEXENE 0*34 0*63 0*46MCPENTANE 68*30 67*15 66*79MCPENTENE 1*20 1*59 1*20CYCLOHEXANE 1*12 1*37 1*24CYCLOHEXENE 0 * 0 2 0*04 0*0BENZENE 16*19 18*49 17*69TOLUENE 0* 0 0*0 0*0XYLENES 0*0 0*0 0*0
MATERIAL BALANCE* PCT 95*47 96*92 101*34HYDROGEN BALANCE* PCT 97* 13 97*70 100*49CARBON BALANCE* PCT 94*50 96*64 101*64
MCP CONVERSION* PCT RATE CONSTANTS X1000
31*70 32*85 33*21KA (GM MOLS 42*05 32*44 22*61KB PER HR 24*00 14*25 11*53KC PER GM CAT* 26*51 24*63 11*65KD PER ATM) as9ir v w * 5*58 4*79
Reproduced with permission of the copyright owner. Further reproduction prohibited without permission.

255
TABLE CEXPERIMENTAL DATA WITH PT CATALYST
BALANCE NO* P-24G P-24H P-24ICATALYST P-RE PT PT
NT. CMS 0*9651 0*9651 0*9651VOL* CC 25* 25* 28*SIZE* MM 0*206-0*420 0*203-0*420 0*208-0*420
TEMPERATURE* DEG® F 900* 900* 900*PRESSURE* PSIA 117* 234* 215*HYDROCARBON PP* PSIA 19* 38* 19*HYDROGEN PP* PSIA 96* 196* 195*MOLS H2/M0L FEED 5*16 5*20 10*05V/HR/V 1*23 1*23 1*23W/HR/W 23*33 23*33 23*33SPACE TIME* 1./W/HR/W 0*043 0*043 0*043TIME ON FEED* HRS 67*2 68*5 69*8
PRODUCT YIELD MOLS/100 MOLS HYDROCARBON FEED
HYDROGEN 34*27 40*81 27*11METHANE 0* 0 0*0 0*0ETHANE 0*0 0*0 0*0PROPANE 0*0 0*0 0*0ISOBUTANE 0 * 0 0*0 0*0N-BUTANE 0*0 0*0 0*0ISOPENTANE 0 * 0 0*0 0*0N-PENTANE 0 * 0 2 0*02 0*0122-DMB 0 * 0 2 0*03 0*032MPENT ANE 1*31 1*80 1*843MPENTANE 0*72 1*13 1*11N-HEXANE 3*51 5*99 6*18HEXENE 1*19 0*64. 0*63MCPENTANE 74*46 70*82 71*68MCPENTENE 3*17 1*65 1*72CYCLOHEXANE 2*04 1*72 1*67CYCLOHEXENE 0*35 0*11 0*08BENZENE 13*21 16*09 15*05TOLUENE 0*0 0*0 0*0XYLENES 0 * 0 0 * 0 0*0
MATERIAL BALANCE* PCT 97*56 96*77 95*79HYOROGEN BALANCE* PCT 98* 3S 98*14 97*58CARBON BALANCE* PCT 97*32 96*33 94*99
MCP CONVERSION* PCT 25*54 29*18 28*32RATE CONSTANTS XI000
KA (GM MOLS 32*46 20*69 37*45KB PER HR 12*06 8*78 17*55KC PER GM CAT* 10*52 9*20 19*30KD PER ATM) 4*63 3*49 6*66
Reproduced with permission of the copyright owner. Further reproduction prohibited without permission.
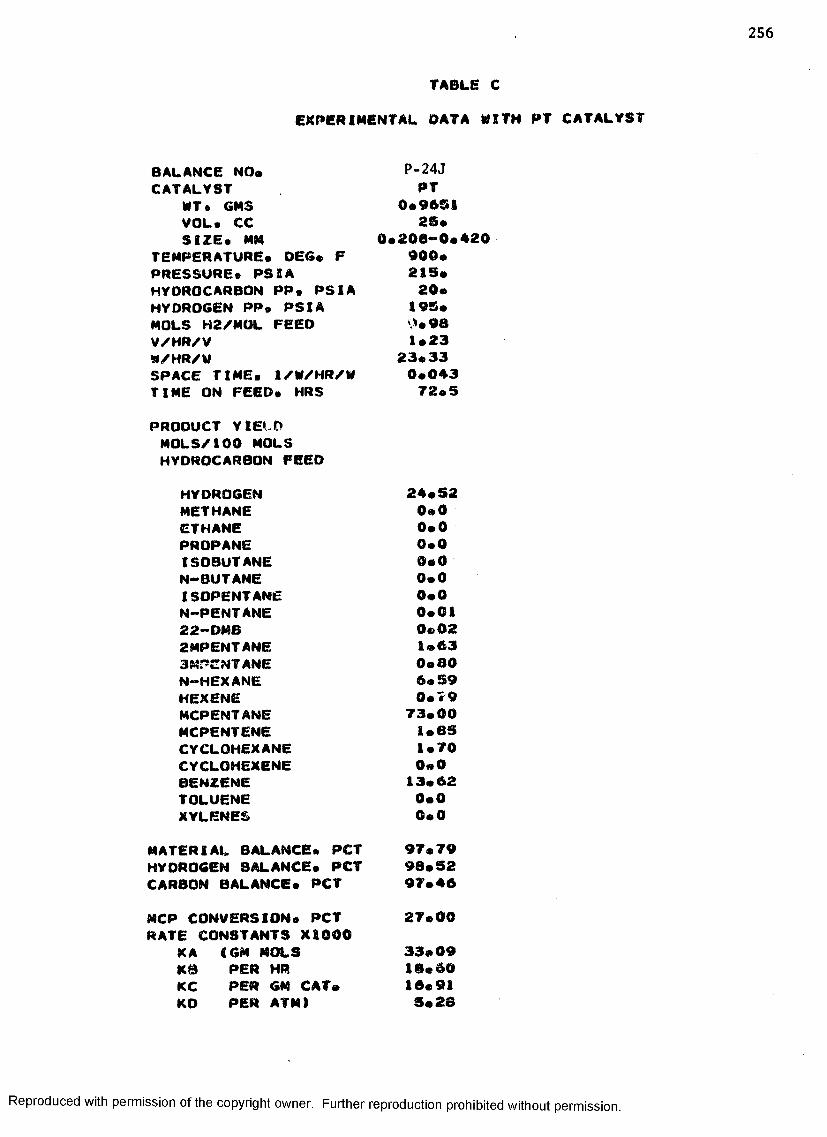
TABLE C
EXPERIMENTAL DATA WITH PT CATALYST
BALANCE NO.CATALYST
WT* GMS VOL* CC SIZE* MM
TEMPERATURE* OEG* F PRESSURE* PSIA HYDROCARBON PP* PSIA HYDROGEN PP* PSIA MOLS H2/MOL FEEO V/HR/V W/HR/WSPACE TIME* 1/W/HR/W TIME ON FEED* HRS
P-24JPT
0*965126*
0*206-0*420000*215*20*
195*'.>•981*23
23*330*04372*5
PRODUCT YIELD MOLS/100 MOLS HYDROCARBON FEED
HYOROGEN 24*52METHANE 0*0ETHANE 0*0PROPANE 0*0tSOBUTANE 0*0N-BUTANE 0*0ISOPENTANE 0*0N-PENTANE 0*0122-DMB 0*022MPENTANE 1*633MPENTANE 0*80N-HEXANE 6*59HEXENE 0*79MCPENTANE 73*00MCPENTENE 1*85CYCLOHEXANE 1*70CYCLOHEXENE 0*0BENZENE 13*82TOLUENE 0*0XYLENES 0*0
MATERIAL BALANCE* PCT 97*79HYDROGEN BALANCE* PCT 98*52CARBON BALANCE* PCT 97*46MCP CONVERSION* PCT 27*00RATE CONSTANTS XI000
KA (GM MOLS 33*09KB PER HR 18*60KC PER GM CAT* 16*91KD PER ATM) 5*28
Reproduced with permission of the copyright owner. Further reproduction prohibited without permission.
APPENDIX D
CATALYST PROPERTIES
Reproduced with permission of the copyright owner. Further reproduction prohibited without permission.
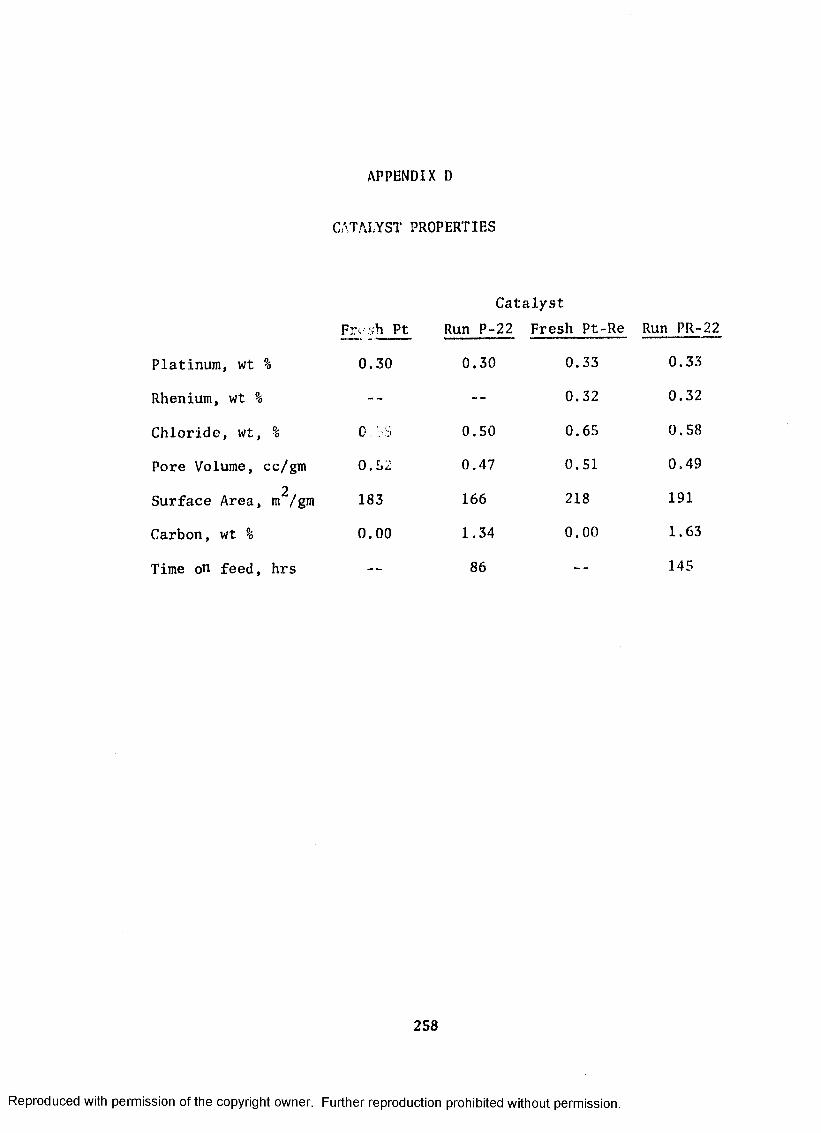
A P P E N D IX D
CATALYST PROPERTIES
Fr. . h Pt
Platinum, wt % 0.30
Rhenium, wt %
Chloride, wt, % O S
Pore Volume, cc/gm 0.522Surface Area, m /gm 183
Carbon, wt % 0.00
Time on feed, hrs
CatalystRun P-22 Fresh Pt-Re Run PR-22
0.30 0.33 0.33
0.32 0.32
0.50 0.65 0.58
0.47 0.51 0.49
166 218 191
1.34 0.00 1.63
86 -- 145
258
Reproduced with permission of the copyright owner. Further reproduction prohibited without permission.
■APPENDIX E
NAPHTHA FEEDSTOCK PROPERTIES
Reproduced with permission of the copyright owner. Further reproduction prohibited without permission.
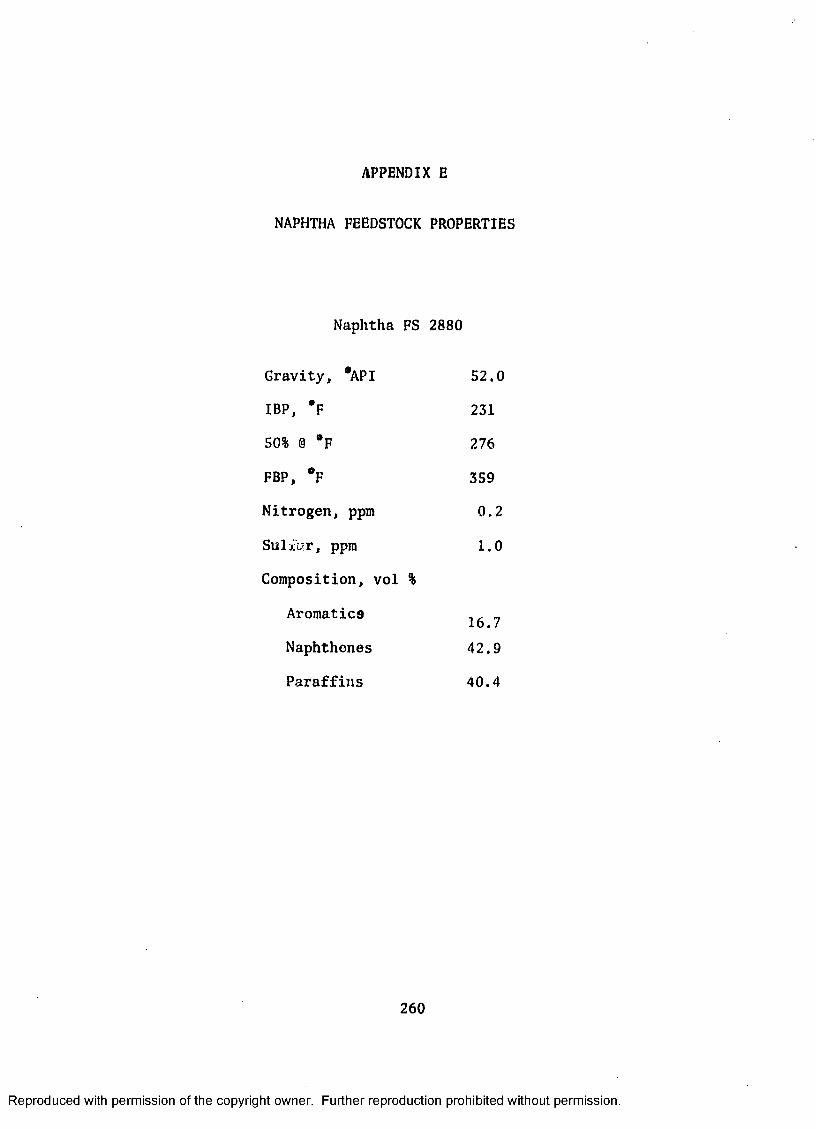
APPENDIX E
NAPHTHA FEEDSTOCK PROPERTIES
Naphtha FS 2880
Gravity, ®API 52.0
IBP, *F 231
50% 0 *F 276
FBP, °F 359
Nitrogen, ppm 0.2
Sulxwr, ppm 1.0
Composition, vol %
Aromatics ,. _16.7Naphthenes 42.9
Paraffins 40.4
Reproduced with permission of the copyright owner. Further reproduction prohibited without permission.

APPENDIX F
SAMPLE CALCULATIONS
Reproduced with permission of the copyright owner. Further reproduction prohibited without permission.
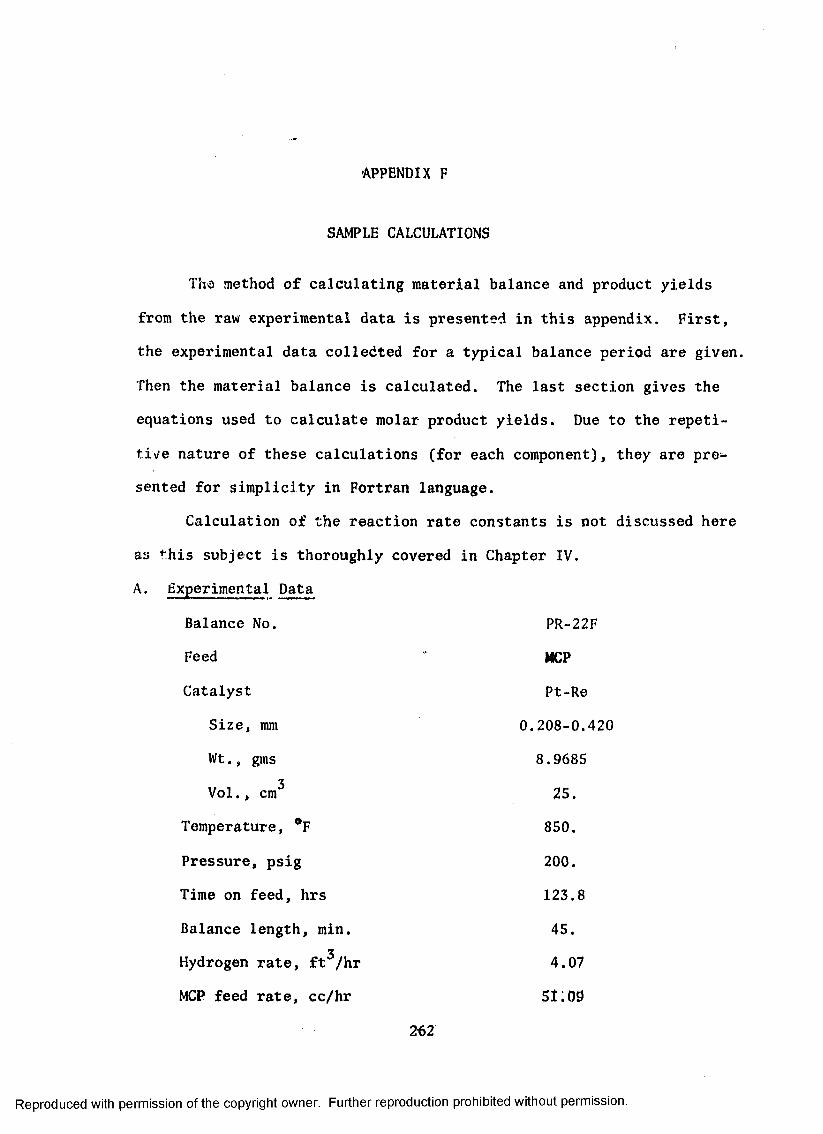
•APPENDIX F
SAMPLE CALCULATIONS
The method of calculating material balance and product yields
from the raw experimental data is presented in this appendix. First,
the experimental data colledted for a typical balance period are given.
Then the material balance is calculated. The last section gives the
equations used to calculate molar product yields. Due to the repeti
tive nature of these calculations (for each component), they are pre
sented for simplicity in Fortran language.
Calculation of the reaction rate constants is not discussed here
as this subject is thoroughly covered in Chapter IV.
A. Experimental Data
Balance No. PR-22F
Feed MCP
Catalyst Pt-Re
Size, mm 0.208-0.420
W t ., gms 8.9685
Vol., cm2* 25.
Temperature, #F 850.
Pressure, psig 200.
Time on feed, hrs 123.8
Balance length, min. 45.3
Hydrogen rate, ft /hr 4.07
MCP feed rate, cc/hr 51; 09
262
Reproduced with permission of the copyright owner. Further reproduction prohibited without permission.
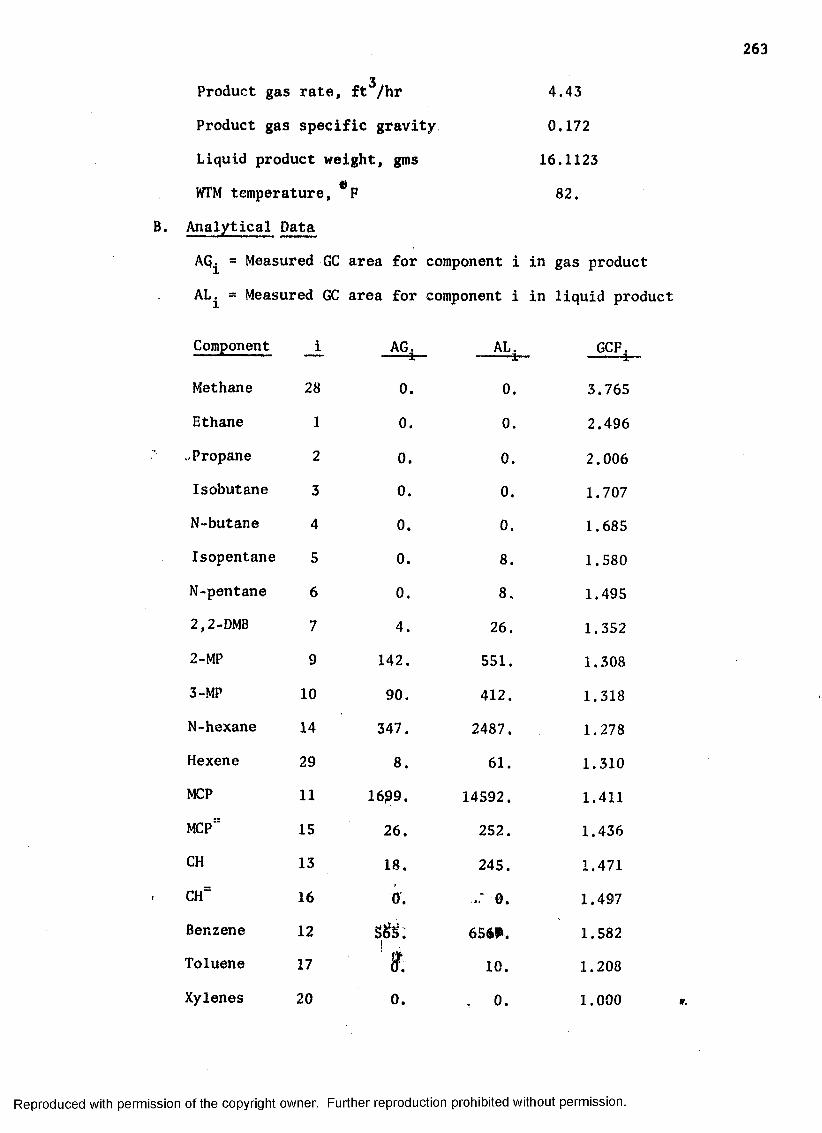
3Product gas rate, ft /hr 4.43
Product gas specific gravity 0.172
Liquid product weight, gins 16.1123
WTM temperature, 82.
B. Analytical Data
AG^ = Measured GC area for component i in gas product
AL^ = Measured GC area for component i in liquid product
Component i AG, AL. GCF.
Methane 28 0. 0.
1 1
3.765
Ethane 1 0. 0. 2.496
Propane 2 0. 0. 2.006Isobutane 3 0. 0. 1.707N-butane 4 0. 0. 1.685
Isopentane 5 0. 8 . 1.580
N-pentane 6 0. 8 . 1.4952,2-DMB 7 4. 26. 1.352
2-MP 9 142. 551. 1.308
3-MP 10 90. 412. 1.318
N-hexane 14 347. 2487. 1.278
Hexene 29 8 . 61. 1.310
MCP 11 1699. 14592. 1.411
MCP™ 15 26. 252. 1.436
CH 13 18. 245. 1.471
CH= 16 0. 0. 1.497
Benzene 12 ! 6569. 1.582Toluene 17 ft 10. 1.208
Xylenes 20 0. . 0. 1.000
Reproduced with permission of the copyright owner. Further reproduction prohibited without permission.
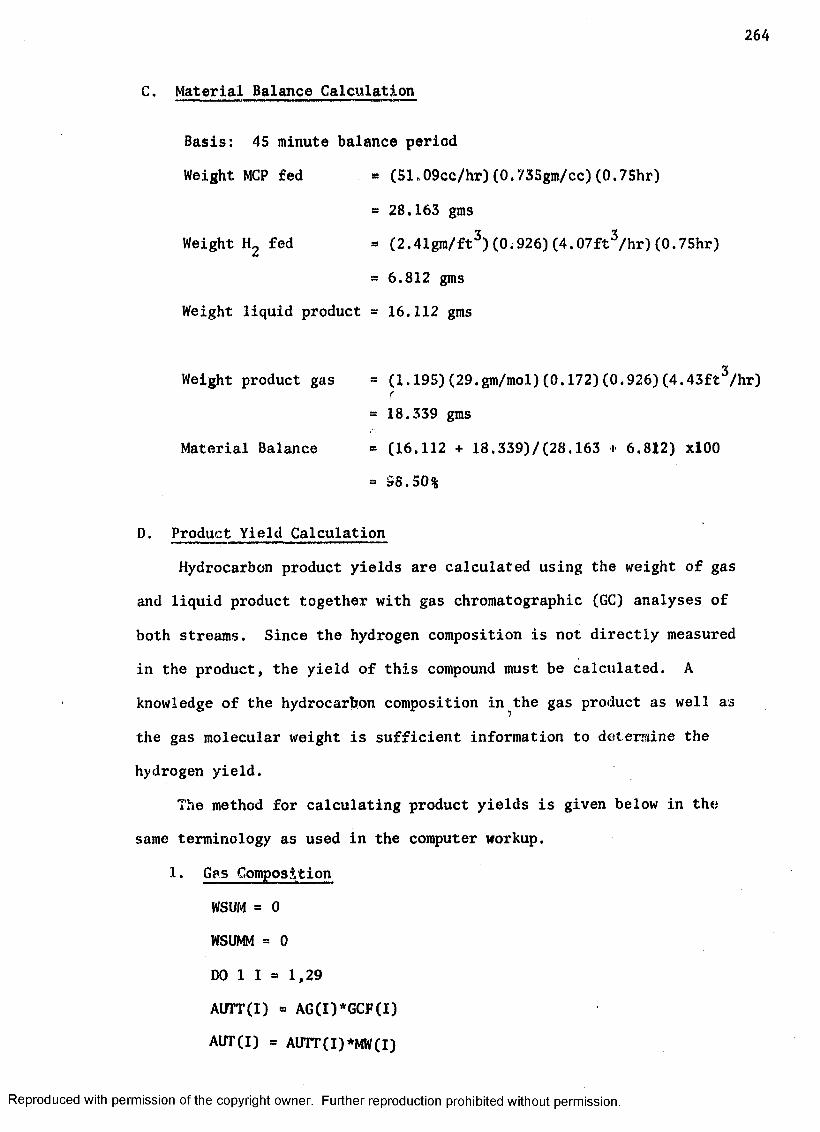
2 6 4
C. Material Balance Calculation
Basis: 45 minute balance period
Weight MCP fed - (51,09cc/hr)(0.735gm/cc)(0.75hr)
= 28.163 gms
Weight H 2 fed = (2.41gm/ft3) (0.926)(4.07ft3/hr)(0.75hr)
= 6.812 gms
Weight liquid product = 16.112 gms
Weight product gas = (1.195)(29.gm/mol)(0.172)(0.926)(4.43ft3/hr)r
- 18.339 gms
Material Balance « (16.112 + 18.339)/(28.163 + 6.812) xlOO
- 9 8 .50%
D. Product Yield Calculation
Hydrocarbon product yields are calculated using the weight of gas
and liquid product together with gas chromatographic (GC) analyses of
both streams. Since the hydrogen composition is not directly measured
in the product, the yield of this compound must be calculated. A
knowledge of the hydrocarbon composition in the gas product as well as
the gas molecular weight is sufficient information to determine the
hydrogen yield.
The method for calculating product yields is given below in the
same terminology as used in the computer workup.
1. Gas Composition
WSUM = 0
WSUMM = 0
DO 1 I » 1,29
AWT(I) ® AG(I)*GCF(I)
AUT(I) = AUTT(I) *MW(I)
Reproduced with permission of the copyright owner. Further reproduction prohibited without permission.
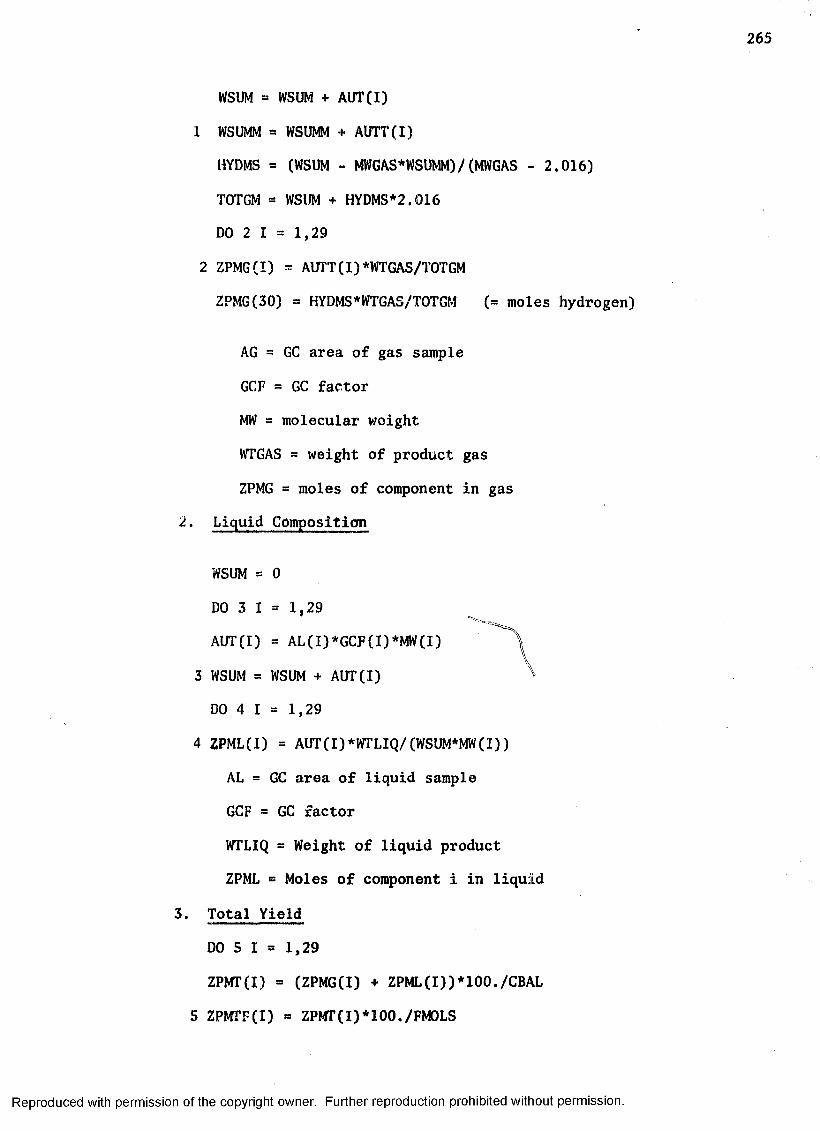
WSUM ■ WSUM + AUT(I)
1 WSUMM * WSUMM + AUTT(I)
HYDMS =■ (WSUM - MWGAS*WSUMM)/ (MWGAS - 2.016)
TOTGM = WSUM + HYDMS*2.016
DO 2 I = 1,29
2 ZPMG(I) = AUTT(I)*WTGAS/TOTGM
ZPMG(30) ■ HYDMS*WTGA3/TOTGM (= moles hydrogen)
AG = GC area of gas sample
GCF = GC factor
MW = molecular v/oight
WTGAS = weight of product gas
ZPMG = moles of component in gas
2. Liquid Composition
WSUM = 0
DO 3 I = 1,29
AUT(I) = AL(I)*GCF(1)*MW(I)
3 WSUM = WSUM + AUT(I)
DO 4 I = 1,29
4 ZPML(I) = AUT(I)*WTLIQ/(WSUM*MW(I))
AL = GC area of liquid sample
GCF = GC factor
WTLIQ = Weight of liquid product
ZPML = Moles of component i in liquid
3. Total Yield
DO 5 I = 1,29
ZPMT(I) = (ZPMG(I) + ZPML(I))*100./CBAL
5 ZPMTF(I) - ZPMT(I)*100,/FMOLS
Reproduced with permission of the copyright owner. Further reproduction prohibited without permission.

2 6 6
ZPMTF(30) = ZPMG(3Q)*100./FMOLS - 100.*RM0LS (hydrogen yield)
ZPMfP * Total moles of component in product
CBAL = Carbon balance, %
FMOLS = Moles of MCP fed during balance period
RMOLS = Moles hydrogen/mole MCP
ZPMTF = Moles of product/100 moles MCP fed.
Performing the calculations indicated above with the experimental
data given for Balance No. PR-22F results in the following yield
distribution:
Component Product Yield,Name Mols/100 mols MCP
Hydrogen 48.10
Methane 0.00
Ethane 0.00
Propane 0.00
Isobutane 0.00
N-butane 0.00
Isopentane 0.02
N-pentane 0.02
2,2-DM8 0.11
2-Mpentane 3.01
3-MPentane 2.06
N-hexane 9.58
Hexene 0.23
MCPentane 57.33
MCPentene 0.96
Cyclohexane 0.85
Cyclohexene 0.00
Reproduced with permission of the copyright owner. Further reproduction prohibited without permission.

Component Product Yield, Name Mofa/ioo mois mcp
Benzene
Toluene
Xylenes
25.810.020.00
Reproduced with permission of the copyright owner. Further reproduction prohibited without permission.
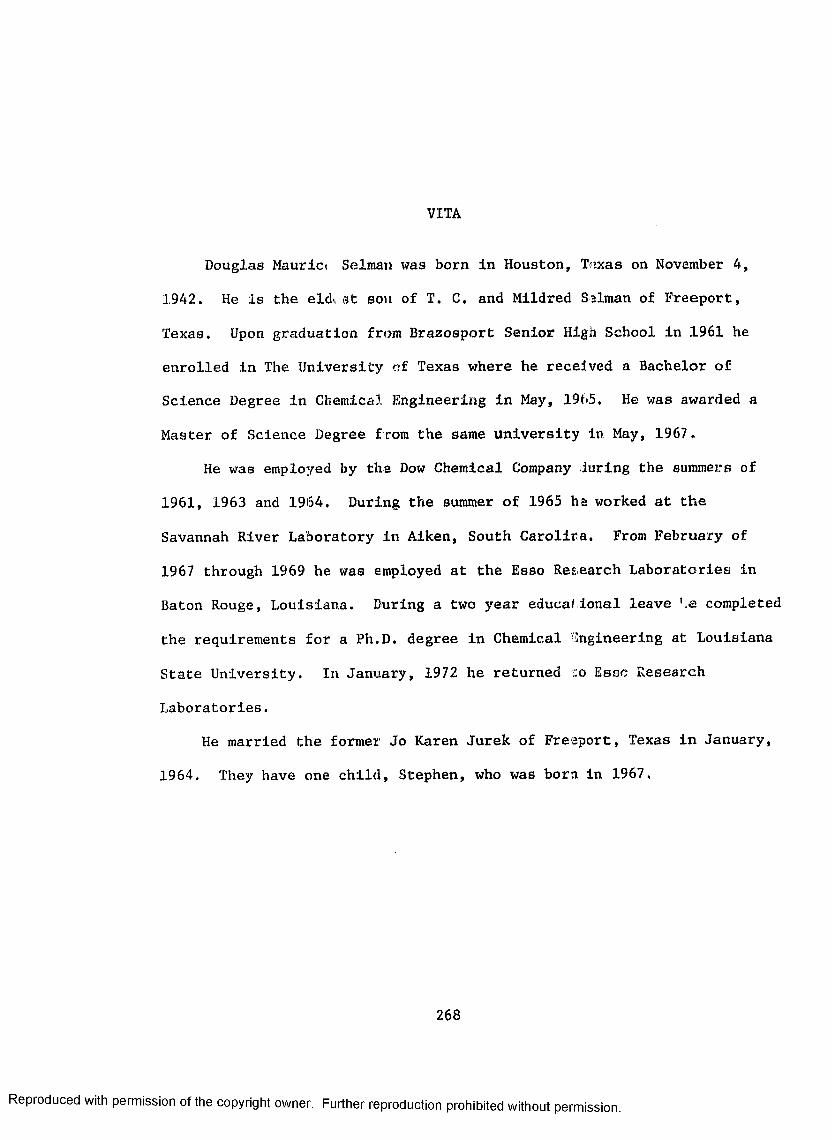
VITA
Douglas Maurlct Selman was born In Houston, Texas on November 4,
1942. He Is the eldest son of T. C. and Mildred Salman of Freeport,
Texas. Upon graduation from Brazosport Senior High School in 1961 he
enrolled In The University of Texas where he received a Bachelor of
Science Degree in Chemical Engineering in May, 1965. He was awarded a
Master of Science Degree from the same university in May, 1967.
He was employed by the Dow Chemical Company during the summers of
1961, 1963 and 1964. During the summer of 1965 ha worked at the
Savannah River Laboratory in Aiken, South Carolina. From February of
1967 through 1969 he was employed at the Esso Research Laboratories in
Baton Rouge, Louisiana. During a two year educational leave >.e completed
the requirements for a Ph.D. degree in Chemical Engineering at Louisiana
State University. In January, 1972 he returned :o Esse Research
Laboratories.
He married the former Jo Karen Jurek of Freeport, Texas in January,
1964. They have one child, Stephen, who was born in 1967.
268
Reproduced with permission of the copyright owner. Further reproduction prohibited without permission.
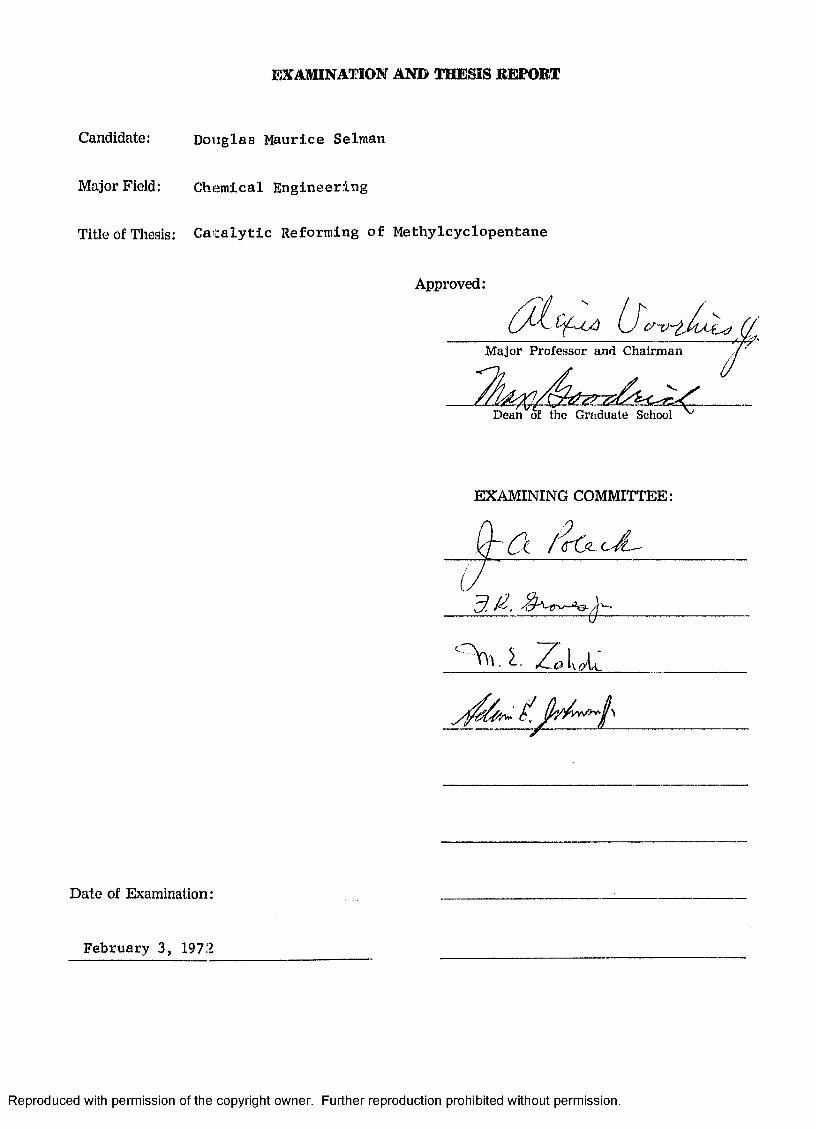
EXAMINATION AND THESIS REPORT
Candidate: Douglas Maurice Selrnan
Major Field: Chemical Engineering
Title of Thesis: Catalytic Reforming of Methylcyclopentane
Approved:
7 ' s
Major Professor and Chairman
Dean of the Graduate School
EXAMINING COMMITTEE:
Ct U L
c).
Date of Examination:
February 3, 1972
Reproduced with permission of the copyright owner. Further reproduction prohibited without permission.