Optimizing aconitate removal during clarification - LSU Digital ...
123
Louisiana State University LSU Digital Commons LSU Master's eses Graduate School 2003 Optimizing aconitate removal during clarification Niconor Nocony Reece Louisiana State University and Agricultural and Mechanical College Follow this and additional works at: hps://digitalcommons.lsu.edu/gradschool_theses Part of the Engineering Commons is esis is brought to you for free and open access by the Graduate School at LSU Digital Commons. It has been accepted for inclusion in LSU Master's eses by an authorized graduate school editor of LSU Digital Commons. For more information, please contact [email protected]. Recommended Citation Reece, Niconor Nocony, "Optimizing aconitate removal during clarification" (2003). LSU Master's eses. 1818. hps://digitalcommons.lsu.edu/gradschool_theses/1818
-
Upload
khangminh22 -
Category
Documents
-
view
2 -
download
0
Transcript of Optimizing aconitate removal during clarification - LSU Digital ...

Louisiana State UniversityLSU Digital Commons
LSU Master's Theses Graduate School
2003
Optimizing aconitate removal during clarificationNiconor Nocony ReeceLouisiana State University and Agricultural and Mechanical College
Follow this and additional works at: https://digitalcommons.lsu.edu/gradschool_theses
Part of the Engineering Commons
This Thesis is brought to you for free and open access by the Graduate School at LSU Digital Commons. It has been accepted for inclusion in LSUMaster's Theses by an authorized graduate school editor of LSU Digital Commons. For more information, please contact [email protected].
Recommended CitationReece, Niconor Nocony, "Optimizing aconitate removal during clarification" (2003). LSU Master's Theses. 1818.https://digitalcommons.lsu.edu/gradschool_theses/1818
OPTIMIZING ACONITATE REMOVAL DURING CLARIFICATION
A Thesis
Submitted to the Graduate Faculty of the Louisiana State University and
Agricultural and Mechanical College in partial fulfillment of the
requirements for the degree of Master of Science in Biological and Agricultural Engineering
in
The Department of Biological and Agricultural Engineering
by Niconor Niconey Reece
B.S., Louisiana State University, 2001 December 2003

ii
ACKNOWLEDGEMENTS
The author expresses his sincere appreciation to the staff of the Audubon Sugar Institute
that had an input in the project; special thanks to his advisors Dr. M. Saska, Dr. P.W.Rein, Dr. S.
Hall and Dr. R. Price for their invaluable advice. He wishes to extend thanks to all his friends and
family that inputted moral an emotional support over the years, and thanks to God who gave him
the grace and will to finish this project.

iii
TABLE OF CONTENTS
ACKNOWLEDGEMENTS……………………………………………………………….. ii LIST OF TABLES………………………………...……………………………………….. v LIST OF FIGURES………………………………..………………………………………. vi GLOSSARY OF TERMS…………………………………………………………………. viii ABSTRACT…………………………………………..…………………………………….ix CHAPTER 1.INTRODUCTION……………………………………………………………………….. 1
1.1 Raw Sugar Mill Process ……………………………………………………… 1 1.2 Research Objectives…………………………………………………………... 2
2.BACKGROUND………………………………………………………………………… 4
2.1 Cane Juice…………………………………………………………...……. 4 2.2 Clarification …………………….……………..…………………………. 4 2.3 Effects of pH in Juice Clarification..…………..…………………………. 8 2.4 Effects of Time in Clarification.….. ……………………..……………….8 2.5 Effects of Temperature in Juice Clarification………………………….….8 2.6 Chemical Reactions of Clarification……………………………………… 9 2.7 Physical Chemistry of Clarification………….…………………………… 12 2.8 Clarification Control……………………………………………………… 14 2.9 Aconitic Acid..…………………………………………………………….15 2.10 Aconitic Acid in Sugarcane………………………………………….…… 16 2.11 Role of Aconitic Acid in Sugar Processing………………………………. 17 2.12 Aconitic Acid in Scale.…………………………………………………… 18 2.13 Methods of Aconitic Acid Extraction…………………………………….. 18 2.14 Quantifying Aconitic Acid Content. …………………………………….. 20 2.15 Aconitic Acid as a Byproduct…………………………………………….. 23
3 MATERIALS AND METHODS………………………………………………………. 24
3.1 General Experimental Procedures…………………………………….….. 24 3.2 Specific Experimental Procedures………………………………………... 25 3.3 Sample Analysis Techniques ……………………………………………30 3.4 Statistical Analysis………………………………………………………... 34
4 RESULTS AND DISCUSSION………………………………………………………... 37
4.1 Aconitic Acid Removal in Mill Clarification.……………………………. 37 4.2 Solubility of Salts of Aconitic Acid…………………………………….… 37 4.3 pH Effects on Aconitic Acid Removal…..………………………………. 38 4.4 Temperature Effects on Aconitic Acid Removal………………………… 42 4.5 Effect of Time on AAR..…………………………………………………. 44 4.6 Effects of Defecant and Defecant Concentration ………………………... 45 4.7 Effects of Sucrose Concentration………………………………………… 48 4.8 Cis-aconitic Acid Formation and Aconitic Acid Removal……… ……… 49 4.9 Reactions of Other Compounds …..……….…………………………….. 51
iv
4.10 Relationship between Parameters………………………………………… 55 4.11 Aconitate as a Precipitate………………………………………………… 56 4.12 Raw Juice Trials…..…………………………………………………….... 67
5 SUMMARY AND CONCLUSION……………………………………………………. 69 5.1 Effects of the Different Parameters on Aconitic Acid Removal…………. 69 5.2 XRD of Aconitates……………………………………………………….. 70 5.3 Optimum Precipitation Conditions…………………………………….…. 71 5.4 Optimal Conditions Applied to Raw Juice……………………………….. 71 5.5 Industry Implications…………………………………………………….. 71 5.6 Future Research…………………………………………………………... 72
REFERENCES…………………………………………………………………………….. 73 APPENDIX A CALCULATIONS……….………………………………………………... 76 APPENDIX B pH EFFECTS……..……………………………………………………….. 79 APPENDIX C TEMPERATURE EFFECTS…..…………………………………………. 82 APPENDIX D BATCH ACONITIC ACID REMOVAL…………..……………………… 85 APPENDIX E DEFECANT CONCENTRATIONS..……………………………………... 99 APPENDIX F X-RAY DIFFRACTION RESULTS…..…………………………………... 101 APPENDIX G SUMMARY OF STATISICS OUTPUT………………………………….. 106 APPENDIX H X-RAY DIFFRACTION RESULTS…..………………………………….. 109 VITA……………………………………………………………………………………….. 113

v
LIST OF TABLES
2.1. Cane Juice Composition on Soluble Dry Substance..………………………………… 4
3.1. Outline of the Different Combinations of Parameters Undertaken in each Experimental Set..…………………………………………………………….. 30
3.2. Gradient Method for Anion Separation..……………………………………………… 32
4.1. Pairwise Comparison for Temperature Effects on Aconitic Acid Removal…………... 43
4.2. Pairwise Comparisons on Time.………………………………………………………. 45
4.3. Pairwise Comparison of Defecant Levels for Overall Aconitic Acid Removal.…..….. 47
4.4. Pairwise Comparison between Defecants.……………………………………………. 48
4.5. Significance of Interactions among Parameters.……………………………………… 56
4.6. Summary of Statistics Results for Optimal Aconitic Acid Removal from SJ and CSJ.……………………………………………………………..67

vi
LIST OF FIGURES
1.1. Raw Sugar Mill Process………………………………………………………………. 1
3.1.Typical Chromatogram of Cation Analysis Results from Sample 69-50-C..…………. 31
3.2. Schematic of Cation HPLC Setup……………………………………………………. 31
3.3. Typical Chromatogram of Anion Results from Sample 78-150-D……………………. 33
4.1. Plot of Solubility Results for CaAA and CaMgAA in Deionized Water and Ethyl Alcohol (EtOH) at 25 oC……………..…………………. 37 4.2. Plot of AAR vs pH from SJ with Calcium Defecant Experiment Set 1………………. 39 4.3. Effect of pH on AAR from SJ with calcium + magnesium Defecant Experiment Set 2………...……………………………………………………………..40 4.4. pH Effect on Aconitic Acid Removal From CSJ across all Levels of Calcium (Experiment Set 3)………………………..……………………………….. 40 4.5. pH Effect on AAR from CSJ with Calcium +Magnesium (Experiment Set 4)………………..…..……………………………………………….. 41 4.6. Temperature Effect on AAR (Experiment Set 5)..……………………………………. 42 4.7. Change in AAR for SJ with time (Experiment Set 6)………………………………… 44 4.8. Effect of Defecant Concentrations on Average Overall AAR (Experiment Set 7)……………………………………………………………………. 46 4.9. Effect of Defecant Type on AAR (Set 7)..……………………………………………. 47 4.10.Plot of the Change in AAR with Concentration (Experiment Set 7)..………..………………………….……………………………… 49 4.11.Plot of AAR with Cis-aconitic Acid Formation………….………………………….. 50 4.12.Plot of the Change in Cis-aconitic Acid Formation at Different Temperature Regimes…………………………………………50 4.13.Plot of Overall AAR against AACF………………………………..………………… 51 4.14.Overall AAR Plotted against SOR…………………………………………………… 52 4.15.Change in Phosphate Removal with Overall Aconitic Acid Removal……………….. 53 4.16.Calcium Removal Plotted against Overall Aconitic Acid Removal………………….. 54 4.17.Change in Magnesium Removal with Aconitic Acid Removal..…………………….. 54

vii
4.18.Change in Magnesium Removal with Calcium Removal……………………………. 55
4.19.Diffraction Pattern for CaMgAA.6H2O..…………………………………………….. 57
4.20.Diffraction Pattern for CaAA.3H2O.…………………………………………………. 58
4.21.Comparative X-ray Patterns of CaAA and CaMgAA………………………………… 59
4.22.X-ray Pattern of CaMgAA Plotted against Molasses Sediment………………………60
4.23.X-ray Pattern CaAA Plotted against Molasses Sediment..…………………………... 61
4.24.Comparative X-ray Patterns of CaMgAA and SJ Sediment (45-100-A)..…………… 64
4.25.Comparative X-ray Patterns for CaAA and SJ Sediment (45-100-A)…………..…… 65
4.26.Comparative X-ray Diffraction Pattern of CaAA and SJ Sediments (68-150-B)………………………………………………………………… 66

viii
GLOSSORY OF TERMS AA Aconitic acid
AAR Aconitic acid removed
AAC Cis-aconitic acid
AACF Cis-aconitic acid formed
CaAA Calcium aconitate
CaMgAA Calcium magnesium aconitate
CaR Calcium removed
Clarification Process of juice purification and settling
CSJ Concentrated synthetic juice
Def Defecant (compound added to cane juice to aid in purification)
HPLC High performance liquid chromatography
MgR Magnesium removed
Mol Molasses
POR Phosphate removed
SJ Synthetic juice
SOR Sulfate removed
Defc Defecant concentration
XRD X-ray diffraction

ix
ABSTRACT
The inadequate removal of aconitic acid from sugar cane juice during the clarification
process results in the acid contributing to processing difficulties, sucrose loss and extended down
time. However, very few attempts have been made to remove the acid during normal factory
operations.
Batch clarification techniques were used in this study to investigate the effect of sucrose
concentration, temperature, pH, time, defecant, and defecant concentration on aconitic acid
removal from a synthetic juice solution. Methodology for determining the significance of each
parameter to aconitic acid removal involved setting up a multiple factorial experiment looking at
aconitic acid removal across all the parameters and their sublevels using the mixed linear
modeling procedure in SAS (statistics analysis software) and applying results to raw juice.
Results indicated that sucrose concentration, temperature and defecant concentration
were the most significant parameters contributing to Aconitic acid removal, since aconitic acid
removal was limited by cis-aconitic acid formation, the solubility of aconitates and competing
compounds.
Optimizing aconitic acid removal form synthetic juice points to reducing cis-aconitic
acid formation by clarifying at low temperatures, reducing solubility of aconitates by increasing
sucrose concentration and providing adequate reactants for competing compounds. Optimal
conditions for aconitic acid removal from synthetic juice, when applied to raw juice resulted in a
marginal increase in aconitic removal. However, prospects for increased aconitic acid removal
from raw juice points to clarification of raw juice at the concentrated levels.
1
CHAPTER 1 INTRODUCTION
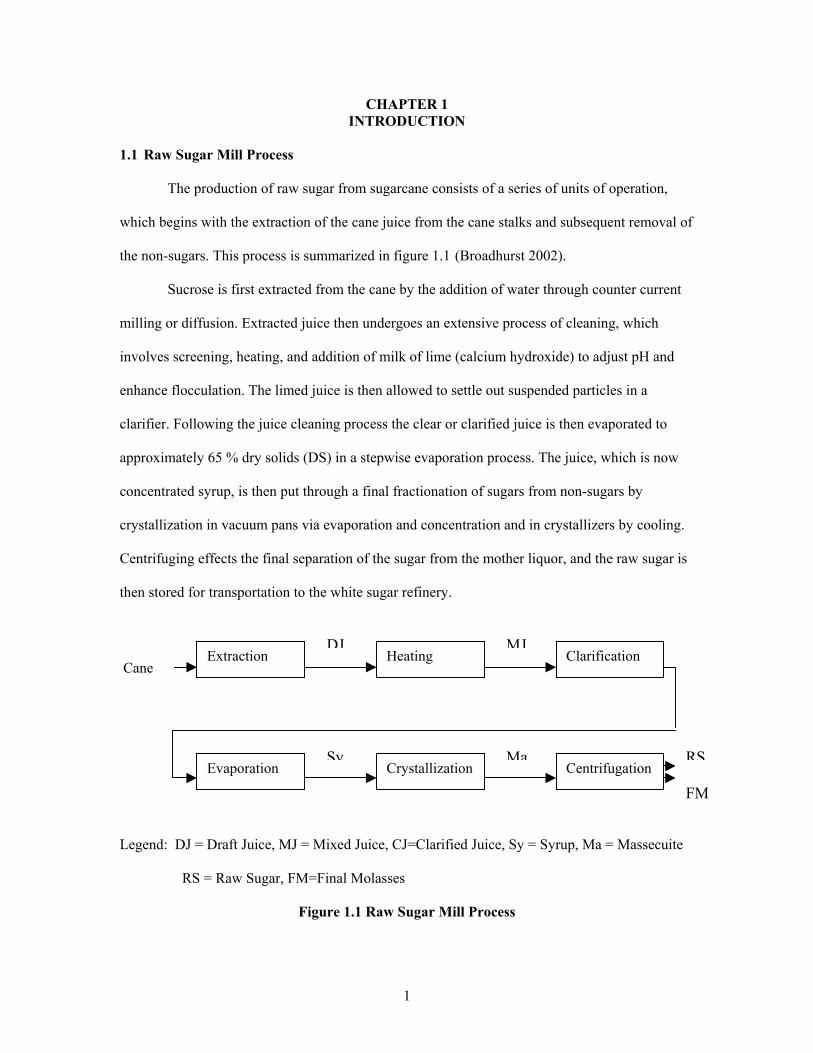
1.1 Raw Sugar Mill Process
The production of raw sugar from sugarcane consists of a series of units of operation,
which begins with the extraction of the cane juice from the cane stalks and subsequent removal of
the non-sugars. This process is summarized in figure 1.1 (Broadhurst 2002).
Sucrose is first extracted from the cane by the addition of water through counter current
milling or diffusion. Extracted juice then undergoes an extensive process of cleaning, which
involves screening, heating, and addition of milk of lime (calcium hydroxide) to adjust pH and
enhance flocculation. The limed juice is then allowed to settle out suspended particles in a
clarifier. Following the juice cleaning process the clear or clarified juice is then evaporated to
approximately 65 % dry solids (DS) in a stepwise evaporation process. The juice, which is now
concentrated syrup, is then put through a final fractionation of sugars from non-sugars by
crystallization in vacuum pans via evaporation and concentration and in crystallizers by cooling.
Centrifuging effects the final separation of the sugar from the mother liquor, and the raw sugar is
then stored for transportation to the white sugar refinery.
Legend: DJ = Draft Juice, MJ = Mixed Juice, CJ=Clarified Juice, Sy = Syrup, Ma = Massecuite RS = Raw Sugar, FM=Final Molasses
Figure 1.1 Raw Sugar Mill Process
Extraction Heating Clarification
Centrifugation Crystallization Evaporation
Cane
RS
FM
DJ MJ -
Sy Ma

2
For the sugar process to be profitable attention must be given to the quality of sugar
produced, the overall recovery of sugar, and the use of products in molasses (Fletcher et al.,
2001). Processes prior to evaporation are paramount to achieving good sugar recovery and have
a serious impact on the composition of final molasses. Of interest is the clarification process,
which represents the unit of operation where major juice cleaning takes place, and where major
non-sugar components are precipitated. However the major organic acid, aconitic acid eludes the
clarification process, remains in the juice and is accumulated in final molasses, and contributes to
reduced recovery of sucrose, reduced process efficiency due to scaling in evaporators, and
affecting sugar crystallization by formation of complex bonds with the sugar crystals (Mane et al
2002;Walthew et al 1995; Balch 1945). In addition aconitic acid also contributes to an increase in
lime required for clarification due to its buffering capacity (Honig 1963).
Apart from the obvious benefit of increased sugar recovery, aconitic acid removal prior to
crystallization would improve process efficiency due to reduced down time for cleaning
evaporators and pans, and improve crystal quality (Balch et al 1945). In addition it would
improve the quality of final molasses as a feed supplement and for use in fermentors, because
aconitic acid in molasses has been cited as source of Tetany in cattle, and a contributor to scaling
problems in fermentors (Stuart et al 1973).
1.2. Research Objectives
This research will be geared at investigating and quantifying the precipitation process of
aconitate from a synthetic juice solution and, therefore examine the applicability of data and
mechanism for precipitation to cane juice clarification. The specific objectives of the research
will be to:
• Investigate effects of pH, temperature and reaction time on aconitic acid removal.
• Study the effects of varying defecant (compound added to juice for clarification)
concentration on aconitic acid removal

3
• Establish any correlations between pH, temperature, time and defecant
concentration effects on aconitic acid removal.
• Establish the optimum precipitation conditions for salts of aconitic acid based on
the effect that each parameter has on aconitic acid removal.

4
CHAPTER 2 BACKGROUND
2.1. Cane Juice Sugar cane juice composition is a complex matter. Cane juice composition may vary
according to cane variety, geographical location, cultural practices, maturity at harvest, and also
mechanical treatment during harvesting and transportation. The principal constituents of cane
juice are shown in table 2.1 (Poel et al 1998).
Table 2.1: Cane Juice Composition on Soluble Dry Substance.
Juice constituent g/100g soluble dry substance
Sugars 75.0-94.0 Sucrose 70.0-90.0 Glucose 2.0-4.0 Fructose 2.0-4.0
Oligosacchaides 0.001-0.05 Salts 3.0-4.5
of inorganic acids 1.5-4.5 of organic acids 1.0-3.0 Organic acids 1.5-5.5
Carboxylic acids 1.1-3.0 Amino acids 0.5-2.5
Other organic non-sugars Protein 0.5-0.6 Starch 0.001-0.18
Soluble polysaccharides 0.03-0.50 Waxes, fats, phosphatides 0.04-0.15
2.2 Clarification
Clarification as used in the sugar industry refers to the precipitation and removal of all
possible non-sugars, organic and inorganic, and the preservation of the maximum sucrose and
reducing sugars possible in clarified juice (Baikow 1982). The raw sugar process over the years
have seen many methods applied to juice clarification these includes (Hugot 1972):
• Defecation
• Magnesia

5
• Sulphitation
• Carbonation
• Phosphatation
The overall objectives of these methods are to produce rapid settling of suspended particles in the
clarifiers, raise juice pH while lowering the percent volume of sediments or “mud” and producing
a clear liquid. In addition, clarification should also produce a juice of high clarity with minimum
unfavorable effects on the subsequent recovery of sucrose from the clarified juice through
maximum removal of non-sugars at the earliest possible stage in the process.
2.2.1. Defecation
Defecation is the addition of milk of lime (Ca (OH)2) to mixed juice or lime saccharates;
which is by far the most commonly used method in the sugar industry. Lime is added to raise
juice pH from approximately 5.2 to around 7.5-7.8; lime reacts with inorganic phosphates present
in juice to form calcium phosphate floc which sweep insoluble impurities from the juice mixture.
Lime may be added batch wise or as a continuous mixture to juice. The lime addition may be to
cold juice (35-40oC), intermediate juice (72-76oC) or to hot juice (100oC).
The overall chemical reactions of defecation involve (Doherty et al 2002):
• The precipitation of amorphous calcium phosphate
• Denaturing of proteins (and other organics, such as gums pectins and waxes).
• Inversion of sucrose due to the combined effect of pH and temperature.
• Degradation of reducing sugars to organic acids due to high pH and temperature.
• Precipitation of organic and inorganic salts.
• Hydrolysis of starch by natural amylase in the juice.
• Formation of color bodies due to the ploymerisation of flavonoids and phenolic
compounds.

6
2.2.2 Magnesia
There are conflicting results concerning the use of magnesium oxide as a clarifying agent.
Hugot (1972) sees the use of magnesium oxide in a similar fashion as done with calcium oxide in
defecation as significantly superior to lime, producing juice that had good clarity with purity rise
of more than 2 points, but points out that if magnesium oxide is used in excess it may result in
increased scaling in heaters and evaporators. Baikow (1982) on the other hand outlines that lime
can be replaced with magnesium oxide to reduce scaling of evaporators, but noted that
clarification with magnesium oxide is not as good as with lime.
The reaction of magnesium is slower than that of calcium and increases with temperature
and pH. Hugots clarification with magnesium was done at an initial pH of 9.2 and temperature of
90oC while, Baikow used an initial pH of 8.0-8.5 but did not outline the temperature used. The
time of clarification is also important but neither authors outlined the clarification time.
Magnesium reacts slower and therefore would require a longer clarification time. If clarification
time is not long enough reactions with magnesium still occurring may contribute to scaling in
clarified juice heaters and evaporators. On the other hand if juice is heated adequately and
allowed to completely react in clarifiers, magnesium will precipitate out and consequently result
in clarified juice of a better quality.
2.2.3. Sulphitation
Sulphitation is an auxiliary process that may accompany defecation. This process is
carried out with lime and sulphur dioxide as the clarifying agents. In sulphitation more lime is
added to raw juice than in normal defecation, this excess lime is neutralized by the sulphur
dioxide added (Honig 1963).
Methods of sulphitation take similar form as in defecation, with the addition of lime and
sulphur dioxide being carried out while the juice is in its hot or cold stage. The order in which
sulphitation is carried out is also of interest as the sulphur is often added before the lime or vice
versa. Each method has its advantages, but the addition of sulphur dioxide first is normally

7
preferred because it provides better coagulation especially in the case of processing juice from
immature cane (Hugot 1972). Overall advantages of sulphitation as compared to ordinary
defecation includes, better settling juice which is less viscous and faster boiling with lower color
and better elimination of waxes and phosphates leading to a better quality sugar. However, the
use of sulphitation has shown to result in heavier deposits in heaters, higher ash content of sugar
produced and overall, sulphitation has proven to be a more expensive process (Hugot 1972).
2.2.4. Carbonation
Carbonation, like sulphitation is used in conjunction with liming. It is the addition of
carbon dioxide and lime to the juice; this reaction precipitates calcium carbonate in the juice that
entraps coloring matter, gums and other non-sugars. Carbonation is generally carried out at
temperatures below 55oC as higher temperatures result in the destruction of reducing sugars. The
method by which carbonation is done varies and may be single (one addition of carbon dioxide to
the juice either before or after the addition of lime), double (where carbon dioxide is added to the
juice and it is then filtered then a second stage of carbonation is carried out) or de Haan
carbonation which is the addition of lime and carbon dioxide simultaneously. The difference
between each method has to do with how many times carbon dioxide is added to the juice mixture
and the way in which it is added (Hugot 1972).
2.2.5. Phosphatation
Posphatation is the addition of phosphoric acid to juice to aid in clarification. The
phosphoric acid is generally added before liming, the acid precipitates part of the colloids and
coloring matter in the juice while the lime mainly precipitates tricalcium phosphate which is
difficult to filter. The method of posphatation normally results in the use of more lime due to the
drop in the pH from the phosphoric acid addition. The amount of phosphoric acid added depends
on the phosphate content of the juice and this normally varies between 50-200ppm as P2O5
(Hugot 1972).

8
2.3 Effects of pH in Juice Clarification
Rein (2002) outlined the importance of pH in clarification, indicating that a pH of about
7 is necessary to neutralize the charge on the fine suspended particle in the juice to facilitate
coagulation and settling. In addition, pH is important to the rate at which certain reaction occurs
especially the precipitation of calcium phosphate. The juice pH was shown to have implications
on the inversion losses, color formation, loss of sugar, sugar quality, and scaling in subsequent
processes. Studies conducted by Saska (2002) also indicated that sucrose loss as a percentage of
total sucrose per hour in clarifiers increase as the pH increases, and range from 3% at a pH of 5 to
0.1% at a pH of 6.5.
2.4. Effects of Time in Clarification
The retention time of juice in the clarifiers has a great effect on the juice and its
components. If the juice is refractory or contains a large proportion of suspended matter it may be
logical to hold the juice in the clarifier for a longer period of time. However excessive capacity
clarifiers that hold juice for long periods result in higher levels of inversion (Baikow 1982). The
minimum retention time recommended for the RapiDorr 444 clarifier is 2 hours and a maximum
of 3 hours. The retention time may vary according to the type of liming technique utilized as
some methods may result in a slower settling juice or the reactions of the defecant in the juice
may be slower and require more time than other methods.
2.5. Effects of Temperature in Juice Clarification
The effect of temperature in juice clarification is multifaceted as it not only prohibits
microbial activity but also accelerates the rate at which chemical reactions occur in the juice. The
effect of temperature in juice clarification is best described as a comparison between hot and cold
liming although intermediate liming is sometimes practiced (liming at juice temperature of 72-76
oC). Cold liming as carried out in some Louisiana factories is the continuous addition of lime to
lime tanks as water slurry at ambient temperature. The limed juice is then heated to about 105 oC
where it is flashed and then goes into the clarifier for settling. In hot juice liming the lime slurry is

9
added when the juice is at the heated juice temperature of 103 oC - 105 oC after which it goes on
to settling in the clarifiers.
Investigations carried out into the effects of cold versus hot liming done in two
Louisiana raw sugar factories over the course of the 1998 milling season, indicated that hot
liming was more favorable as it removed more color, dextran, oligosaccharides and produced
clarified juice with lower calcium levels, but results in higher mud levels and a slower floc
settling rate (Eggleston 2000). Doherty et al (2002) confirmed some of the findings by Eggleston
regarding mud volumes and settling rate of juice clarified by hot liming, but points to the main
advantage of hot liming as being a reduction of scale formation in juice heaters and evaporators
as a result of increased calcium removal.
There is still ongoing debate about which liming technique is most effective since the
literature has failed to examine the underlying chemistry of the clarification process, and there are
speculations about the validity of results presented on the efficacy of the different liming
methods.
2.6. Chemical Reactions of Clarification
The chemical reactions that occur during cane juice clarification are not fully understood.
It is fundamental however that those reactions with lower free energy content would take place
preferentially, with reactions requiring lower energy completing first.
Defecation as outlined earlier is the most used method of clarification; therefore in
looking at the reactions in clarification, defecation will be the clarification method of choice.
The solubility of calcium oxide in water is about 0.12% at 25 oC, but it is greatly
increased in a solution of sucrose. The solubility however decreases with an increase in
temperature. Calcium hydroxide being a relatively strong base of a divalent metal ionizes in
solution to give CaOH+ and OH-. The secondary ionization is low, with less than 10 % of calcium
as Ca++ in sucrose solution containing 0.3-0.5 % calcium oxide (Honig 1963).

10
The reaction of lime and phosphate in juice precipitate calcium phosphate. This reaction
is rather complex due to the reactions of phosphoric acid, calcium hydroxide, and the presence of
other organic and inorganic compounds. Calcium phosphate reaction rate has been shown to be
very low and the precipitate formed in two forms, tri-calcium phosphate Ca3(PO4 )2 , and calcium
hydrogen phosphate CaHPO4. The formation of calcium hydrogen phosphate has been shown to
have a faster reaction rate, and as it approaches completion the rate of the formation of tri-
calcium phosphate increases. The rates of both reactions are greatly increased at high
temperatures and result in an increase in the hydrogen ion (H+) concentration, which has been
suggested as a contributor to the drop in the pH observed when juice is heated. Approximately
80-90% of the phosphate present in juice is precipitated with lime. It was shown that at a pH of
about 8.5, about 99% of the phosphate present in juice is precipitated (Mead 1963).
Other calcium salts are precipitated in clarification, these may include sulfate, aconitate,
oxalate, tartrate, and citrate salts. These salts are normally precipitated in small quantities, but
variations do occur depending on the quality of the juice. The sulfate content of cane juice is
highly variable and approximately 20% is removed by liming to pH in the range 7-8 (Honig
1963).
The organic acids in juice are responsible for the natural pH of the juice (5.2 - 5.4) as
well as the buffering capacity of the juice, which is mainly due to the juice aconitic acid content.
The aconitate concentration of raw juice range from 0.6 to 2% on dry solids (DS) with an average
of 1.1% DS, less than 10% of aconitate is removed during clarification. The presence of other
organic acids such as lactic, formic, acetic, propionic, and butyric acids are generally a result of
microbial or chemical decomposition of sugars (Saska 2002).
Another component of cane juice is silica. Silica is present in the juice in the form of
dissolved silica, colloidal or suspended silica or as silicates. On average it is 0.42% of solids in
mixed juice. Most of the suspended silica is removed by liming (Fort 1939).

11
Magnesium, iron and aluminum occur in juice to a lesser extent. The magnesium
composition may however sometimes exceeds the calcium content of the raw juice. Saska and Gil
(2002) found that the magnesium content in juice appear to increase as the season progressed.
The magnesium content of raw juice starts at about half that of calcium and become about equal
at the middle of the season, but become substantially higher towards the end of the season.
During clarification magnesium is not precipitated totally; results show that magnesium
precipitation is only about 21% (Fort 1939). It was shown by Bond (1925) that at higher pH the
increase in calcium ion concentration is paralleled by the decrease in magnesium ion, indicating
that the magnesium precipitated is replaced by calcium.
Other inorganic elements present in the juice are potassium, sodium, and chlorine. These
are found in ionic forms and are unchanged by the process of clarification with lime.
Reactions of organic substances such as sucrose and reducing sugars are undesirable in
the clarification process. Reaction of sucrose that may occur includes the hydrolysis of sucrose to
reducing sugars (D-fructose and D-glucose) as follows:
C12 H 22 O11 + H2O → C6 H12 O6 + C6 H12 O6
The reaction is irreversible and is accelerated at low pH and at high temperatures. However, this
reaction is negligible at pH above 7.2. The sucrose loss during hydrolysis is irreversible and
hence it is important that this reaction be kept to a minimum during clarification.
Reducing sugars on the other hand are naturally occurring in cane juice as glucose,
fructose and mannose. Mannose is found only in minute quantities, but together the reducing
sugars are the second most abundant component in juice calculated on dissolved solids. Unlike
sucrose, reducing sugars are very stable at low pH, but are readily oxidized under alkaline
conditions of pH at or above 8. The oxidation of reducing sugars is undesirable since the products
D-Glucose D-Fructose

12
of the oxidation are acids and brown color compounds that impart color to the crystals (Honig
1963).
The remaining compounds existing in juice are mainly nitrogenous in nature of which
amino acids represent the largest percentage (0.0122 % of juice) (Honig 1963). Other components
include gums, pectins, waxes resins and fats. These components are generally present in very
small proportions. Gums may represent form 0.02-0.05 % of juice while pectins may be as low as
0.1%. Pectins however have a pronounced effect on the increase in viscosity of syrup and
molasses. Waxes, resins and fats are found in the cane juice in suspension, and may rise to the
surface of the juice as scum while a part may be precipitated during clarification (Honig 1963).
2.7. Physical Chemistry of Clarification
From a practical point of view the following results are desirable for good clarification (Honig V1
1963):
• Complete precipitation and coagulation
• Rapid rate of settling
• Minimum volume of settling
• Dense settling
• Clear juice
The temperature, pH, quantity of lime, mechanism of the process, coagulants and any other
expedients added determine the final physical characteristic of the process. Ultimately settling is
determined by the physical characteristics of the precipitate formed and the sweeping effect of the
solid-liquid medium.
The precipitate present in the juice may be coarse suspended matter or colloids. The
coarse suspended particles in cane juice consist primarily of soil, bagacillo and wax. The rate of
settling of these particles is governed by the particle size, shape density and the electrical charge

13
of the particles as well as the density and viscosity of the medium. If the charge on the particle is
assumed negligible then the settling velocity is given by the Stokes law as:
Where V = velocity of settling (m/s)
Dp = diameter of the particle (m)
ρs =density of the solid (kg/m3)
ρl = density of the liquid (kg/m3)
µ = viscosity of the liquid (kg /m.s)
Settling rate of the coarse suspended particle will depend on the effective diameter of the particle,
the difference between the density of the particle and the liquid it is suspended in, and the
viscosity of the liquid. Therefore the greater the density differential the faster the particle will
settle (Honig 1963).
Colloids present in cane juice may be lyophylic (colloid having strong affinity for the
liquid in which is dispersed) and lyophobic (colloid lacking affinity for the liquid in which it is
dispersed). Their presence in cane juice is highly unfavorable as they may prevent coalescence of
suspended particles during clarification. Lyophylic types are mainly organic compounds that may
be pectins pentosans and proteins, and are characterized by their strong affinity for the liquid.
This results in a high degree of hydration, swelling and viscosity.
Lyophobic colloids on the other hand are less hydrated and represent a more stable
dispersion having little effect on the liquid viscosity. The main lyophobic colloids present in the
cane juice are fats and waxes, soil particles and other extraneous materials derived from milling
operations. However if juice was exposed to heightened microbial activity then additional
undesired lyophobic colloids might be found. These may include glucosans and levulosans
(Honig 1963).
( )µ
ρρ
18*2
lsp gDV
−=

14
Colliodal particles in sugar cane juice normally carry a negative charge. These charges
stabilize the colloidal system and prevent quick sedimentation by causing particles to repel each
other. To initiate precipitation Bennett (1973) outlines three methods.
Firstly, the neutralization of the negative charge, as the magnitude of the charge is pH
dependent, and can be neutralized by the addition of organic surface-active cations or polyvalent
inorganic cations.
Secondly, the reduction of the degree of hydration may be used to foster precipitation.
When juice is heated to the boiling point a dehydration of colloidal particles and denaturing of
proteinaceous matter occurs. This proteinaceous matter coagulates and deposits on the colloidal
particles.
Thirdly, the introduction of a bridging mechanism such as a synthetic polymer (polyacrylamide)
may aid precipitation as each site on the polymer chain can attach a cluster of particles.
2.8. Clarification Control
Sugar factories normally employ several techniques for process control and automation.
These range from pneumatic controllers, analog electronic controllers, and digital controllers to
programmable logic controllers. However in some sugar mills the operator still has to perform
some operations manually.
Clarification control involves primarily the control of juice pH, which is affected by juice
and lime flow, and juice temperature. The basic type of control used in clarification is continuous
control. Continuous control is divided into open loop and closed loop control. In open loop
control the signal is derived dependent on the variations of the main disturbing variables. In juice
clarification the variation in the juice flow rate and density of milk of lime are used to determine
the flow rate of the milk of lime. In closed loop control, the system compares the controlled
signal to the set point (control desired) and generates a command signal to an actuator. In
temperature control a closed loop controller drives the steam control valve. Juice temperature
sensor send continuous signals to the controller which in turn signals the actuator which opens or

15
close a steam valve depending on the signal. The most important closed loop controller is a PID
controller. In a PID control the signal is equal to the sum of the Proportional, and an Integral and
Differential term of the controlled error (difference between the controlled value and the set
point).
Lime addition has traditionally being done through an automatic adjusted splitter box,
but factories are now moving towards using a static mixer installed in the juice line. A peristaltic
pump fitted with a variable speed drive, is used to pump the lime into the stream, but these have a
disadvantage in that these drives have operating limits and juice flow rates may vary resulting in
over liming or under liming of the juice (Meadows 1996).
Control of pH is almost universally done by using a standard control loop where lime
flow is controlled based on the pH of the limed juice. Signals from the pH probe are used to
control the flow of lime via a controller and actuator. It is important that the pH probe is located
at a point were the lime and juice is properly mixed, not to close or to far from the lime addition
point. This will help to prevent erratic changes in juice pH and provide for better pH control
(Meadows 1996).
2.9.Aconitic Acid
Aconitic acid is the major non-nitrogenous acid found in extracted cane juice. Being an
unsaturated acid (carbon-carbon double bond) it can exist in two geometric forms, the trans
isomer (1,2,3-propenetricarboxylic acid, C6H6O6) and the cis isomer, which is formed from
increasing the temperature and buffer capacity of the juice. In solution the trans converts to the
cis isomer until an equilibrium state is attained (Walford 1998).
Aconitic acid has physiological effects similar to those of citric acid, from which it can
be derived by dehydration. It is a white-to-yellowish crystal-line solid, melting at about 195oC, is
soluble in water and alcohol, and is corrosive. The solubility in water increases from 18.6g/100ml
at 13oC to 110.7g/100ml at 90oC (Paturau 1989).

16
Properties of the complex calcium and magnesium salts of aconitic acid shows that the
hexahydrate of the calcium salt which is soluble in water to about 1%, is transformed to the much
less soluble trihydrate at temperatures above 80 oC. The hexahydrate of the calcium magnesium
salt is less soluble than either form of the calcium salt and is formed most readily on heating.
Amorphous precipitate exhibit similar characteristics of becoming less soluble at elevated
temperatures and reconversion to the soluble hexahydrate is gradual. The solubility of these salts
are lower in sugar solution than in water, that of the calcium salt decreases from about 1% to only
0.2% in a 50% sugar solution at 27 oC (Honig 1963).
2.10. Aconitic Acid in Sugarcane
Behr established the natural origin of aconitic acid in sugarcane in 1877. It was
established by Balch in 1945 that aconitic acid content vary widely in different parts of the
sugarcane plant; starting with a low concentration at the base of the stalk and increasing along the
length of the stalk to the shoot where the concentration of the acid is the highest. It was also
found that the Aconitic acid content of sugar cane varied according to soil type, geographical
locations, and sugarcane variety.
The concentration of aconitic acid appear to decrease with increase maturity of the sugar
cane plant and is about 1% on DS at full maturity. The physiological function of aconitic acid in
sugar cane is not clear, it is postulated that it acts as a stabilizer for reactions of juice in various
plant tissues (Balch 1945). It was observed by Mane et al (2002) that cane varieties exhibiting
high aconitic acid content normally have lower purities and vice versa. Sugar cane with a high
aconitic acid content usually contains less recoverable sugar (Honig 1963). Cane exceptionally
high in aconitic acid usually gives low yields. As a result of the short growing season in
Louisiana and Florida cane harvested from this region have aconitic acid content of between 0.1
and 0.2 % on cane, with the resulting molasses containing 3-7% aconitic acid on dry solids (DS)
(Honig 1963).

17
2.11. Role of Aconitic Acid in Sugar Processing
Sugar processing streams contains from 1% to 1.8% of aconitic acid on DS, adversely
affecting process economics (Balch 1945). Organic acids are a probable cause of the formation of
mellasigenic substances in the sugar manufacturing process, inhibiting sugar crystallization by
entering into complex reactions with sugars and other organic constituents of sugarcane juice
(Shahabaz and Qureshi 1980; Hanine, Mourgues et al. 1992). Clarification of juice result in a
reduction of total aconitic acid present; small proportion of the organic acid is precipitated during
processing when lime is added to mixed juice, which increases the amount of lime required to
attain the necessary final pH (Hanine, Mourgues et al. 1990; Honig 1963; Gupta and Chetal 1966;
Fournier and Vidaurreta 1971). The method of clarification also seems to have a significant effect
on the amount of aconitic acid removed. French researchers Hanine, Mourgues and Molinier in
1990 claimed that clarification by double carbonatation removes the largest quantity of aconitic
acid (78.8%), while defecation removes 73.8%, phosphatation by addition of calcium
superphosphate removes 10.2%, phosphatation by use of phosphoric acid and milk-of-lime
removes 18.7%, and sulphitation removes 16.3%. Claims made by the French researchers
concerning aconitic acid removal during defecation are inconsistent with results observed by
Saska (2002) and reports by Honig (1963). Both reported aconitic acid removals of less than
10%, which is significantly different from the French results. These disparities in results points to
possible varying clarification conditions or a result of the source and quality of the juice used in
the testing. The French report was not detailed enough in outlining the conditions which resulted
in the increased aconitic acid removal thus an interest in how higher percentage removals could
be achieved in the mill was raised.
Aconitic acid is also removed during evaporation in the form of salts of aconitate which
produces a scale on heating surfaces thus having an adverse effect on the rate of heat transfer
(Honig 1963; Doolan 1953). It may be concluded that most of the aconitic acid which enters with
the juice becomes concentrated in the syrup and eventually in the molasses. There is evidence that

18
the aconitic acid in molasses exists in part as an insoluble compound and sediments, which
separate from diluted molasses by centrifuging, and have been found to contain from 16% to 35%
aconitic acid (Balch 1945). The solubility of the salts of the organic acids are sufficiently high
that large quantities remain dissolved in solution and are carried through subsequent steps of the
process to accumulate in the molasses (Honig 1963; Gupta and Chetal 1968). Thus making
molasses a possible source for the recovery of aconitic acid for commercial purposes.
2.12. Aconitic Acid in Scale
Scaling takes place when the scaling components become supersaturated in the
concentration process, as is the case with calcium aconitate. Scaling from organic
substances results from coagulation effects caused by high temperatures and
concentration not achieved in the clarifiers. Composition of evaporator scale varies from
factory to factory and from season to season or even within each season .The composition
of the scale is determined by the concentration of the scaling components in the
evaporator juice and the concentration and temperature of the juice in successive
evaporator vessels. It was found by Walthew (1995) that scales in the last bodies
contained more aconitates than earlier bodies. Scales formed, as salts of aconitate can
prove difficult to remove by manual scrapers and have to be removed by mechanical or
chemical means. Aconitates are present in scale as calcium aconitate trihydrate (CaAA)
or calcium magnesium aconitate hexahydrate (CaMgAA) and have very low heat
conductivity.
2.13. Methods of Aconitic Acid Extraction
In Louisiana aconitic acid was first recovered from molasses in the 1950’s. Ventre (1940)
demonstrated the possibility of removing the dicalcium magnesium aconitate hexahydrate by a
precipitation method involving:
19
• Molasses dilution to 55 %DS
• Adjusting pH to 7 with lime slurry
• Limed molasses heated to 93 oC
• Controlled addition of calcium chloride to complete precipitation
• Centrifuging to separate aconitate slurry
• Dilution and further centrifuging of aconitate slurry
• Dry and crush solid aconitate
Regna and Bruins (1956) proposed improvement of the precipitation process involved the
addition of methanol to decrease the solubility of the aconitate. This precipitation method
involved the following basic steps:
• Dilution of molasses with water
• Addition of lime, magnesium chloride and methanol
• Heating to precipitate insoluble dicalcium magnesium aconitate hexahydrate
• Dissolution of filtered crystals in sulphuric acid followed by re-crystallization.
This process was estimated to yield aconitic acid in the range of 70-75% of initial Aconitic acid
in molasses.
Direct extraction of aconitic acid from molasses was also considered using ion-exchange
resins and solvent extraction (Hanine et al 1992; Barnes et al 2000; Malmary et al 1995; Hill et al
2001).
The method of solvent extraction proposed by Regna and Bruins involves:
• Dilution of molasses
• Acidification of molasses with sulphuric acid
• Centrifugation to remove calcium sulphate
• Centrifuged molasses to extractor (packed bed counter current flow of molasses and
methyl ethyl ketone in 12 % water solution as the extracting solvent).

20
• Settling of extract
• Evaporation and concentration of extract under partial vacuum
• Concentrated liquor/solid is centrifuged to remove crude aconitic acid solids.
• Re-dissolving and decolorizing of aconitic acid with carbon
• Re-crystallization of aconitic acid in batch vacuum crystallizers
• Centrifugal removal of aconitic acid crystals.
Regna and Bruins summarized the ion exchange method as:
• Dilution of molasses to 50% solid
• Diluted molasses is passed through ion exchange columns containing Amberlite 1R-4B,
which remove aconitate ions.
• Elution of resin with sulphuric acid to give aconitic acid rich fraction.
• Vacuum evaporation of aconitic acid rich solution
• Dilution and rinsing with bentonite and pumped through a resin bed to remove color.
• Preheating and concentration under vacuum.
• Centrifuging of resulting solid /liquid solution to remove aconitic acid crystals.
The solvent extraction method yielded aconitic acid recovery of over 90%, while the use of
the ion exchange method gave yields of over 97%. These methods have not been employed due to
the cost of setup and operation. It is generally considered that unless the aconitic acid content of
the molasses is 3 % or higher, the recovery of aconitic acid would not be economical (Paturau
1989).
2.14. Quantifying Aconitic Acid and Aconitates
Aconitic acid may be determined by titrating a known quantity of pure aconitic acid
against standard aqueous potassium permanganate (KMnO4) at boiling temperature under strong
acidic conditions. The aconitic acid is separated as lead aconitate from molasses, followed by
decomposition of the latter with hydrogen sulphide (H2S). The aconitic acid liberated is estimated

21
by titrating it under strong acid conditions at boil, against standard potassium permanganate
solution (Mane et al 2002).
More contemporary techniques of analysis for aconitic acid involve the use of High
Performance Liquid Chromatograph (HPLC) and x-ray diffraction (XRD) techniques.
HPLC is a method of separating one chemical from another based on their functional
group interaction with the analytical column substrate. HPLC techniques involve pumping a
solution at high pressure and precise flow rate through a tightly packed column of particles that
are less than 10µm in diameter. Components in a mixture are separated by migration rates, which
result from differing interactions with mobile and stationary phases. Components are detected
bases on their absorption of ultra violet (UV) light using a UV detector or detected based on their
conductivity using an electrochemical detector, which results in a peak recorded on a strip-chart
recorder or an integrator. The recorded peaks will always occur at the same retention time for a
given component, and the area or height of each peak is proportional to the concentration of that
particular species in the sample.
HPLC techniques are widely used in the sugar industry for the analysis of sugar and
organic acids. Of interest are analysis done by Celestine et al (1988) and White (Personal
communication, April 2002). Celestine et al illustrated that organic acids in sugar cane juice
could be successfully separated and quantified using HPLC. White successfully used HPLC
technique to quantify organic acids and sugars for mills across Louisiana. Celestine et al showed
that the different organic acid separated in fifteen minutes or less. However the time for complete
analysis was around 90 minutes. The method utilized by Celestine et al was considered
satisfactory, as all the nine organic acids tested were successfully quantified. White illustrated
that the organic acids in addition to other major anions amounting to sixteen components, can be
completely analyzed in 65 minutes. Both results confirm trans-aconitic acid as the major organic
acid in cane juice and molasses.

22
XRD techniques are founded on the basis of Bragg’s principle, which states that X-rays
reflected from the surface of a substance has traveled less distance than X-rays reflected from the
plane of atoms inside the crystal. The penetrating X-ray travels down to the internal layer,
reflects, and travels back over the same distance before it gets back to surface. The distance
traveled depends on the separation of the layers and the angle at which the X-ray entered the
material. Bragg expressed this in an equation known as Bragg’s law (Nesse 2000):
When X-ray strikes an atom, the wave like character of the X- ray causes electrons,
protons and neutrons to vibrate. The oscillating electrons reemit radiation at almost the same
frequency and wavelength as the incoming beam. This process is called scattering, and is
different for all elements. As X-ray scatter in different directions, they interact with electron
clouds in various ways. Overall those scattered at high angles to the incident beam are less
intense than those scattered at low angles.
An X-ray diffractometer measures the intensity of the diffracted beam, thereby providing
information on the atomic level spacing (d-spacing) of crystal planes within the lattice of a
sample. The d-spacing is used to discover specific information about a crystal structure of the
phases (phase is commonly used in mineralogy to refer to the particular crystal structure in which
a compound is found) formed by the components in the specimen. Each d-value corresponds to
sets of planes, and the intensity is a measure of how many atoms are on those planes. Because
each mineral has a different crystal structure, each yields a different pattern. For mineral
identification, measured d-spacing and intensities are compared to reference database of the Joint
)sin(2 θλ dn =
λ = wave length of the rays θ = angle between the incident rays and the surface of the crystal. d = spacing between layers of atoms. n = integer (whole number)

23
Committee on Powder Diffraction Standards (JCPDS). XRD may give quantitative measurement
through standardized measurement of the relative height of the peaks produced by the
diffractogram. In the absence of standards however, it is commonly used to indicate species of
compounds.
Walthew (1995) used XRD to analyze scales from South African sugar mills, illustrating
that calcium aconitate trihydrate and calcium magnesium aconitate hexhydrate were major
components of evaporator scales collected from mills across the crushing season. No
corresponding pattern matched in the official JCPDS index, therefore samples of calcium
aconitate and magnesium aconitate were made and the patterns correspond to that obtained from
the mills.
2.15. Aconitic Acid as a Byproduct
Paturau (1989) outlines the use of aconitic acid in the preparation of plasticizers and
wetting agents. Aconitic acid is also used as an antioxidant, and is used in organic synthesis and
as a flavoring agent. Honig (1963) points out more specific uses of aconitic acid, which sparked
attempts to recover the acid from molasses in the 60s. Esterification of aconitic acid with higher
alcohols produces derivatives of high molecular weight and very low volatility, which found uses
in plasticizers, particularly in vinyl plastic where aconitic acid is used to stabilize the product
against darkening on exposure to light. Aconitic acid was also found to be a very effective
surface-active agent, and detergents are prepared by reacting esters of aconitic acid with sodium
bisulfite. Itaconic acid that is also used in the manufacture of plastic can also be prepared from
aconitic acid or calcium aconitate by acidfification to a pH between 2 and 3 with sulfuric acid
when heated under pressure to approximately 121 oC.
Since the 60s no known industrially tried method to extract aconitic acid from molasses
have been undertaken, but there have been continued research on methods to improve its
extraction.

24
CHAPTER 3 MATERILALS AND METHOD
The experimental procedures are presented in two sections as:
1. General experimental procedures
2. Specific experimental procedures
The general experimental procedures cover routine analytic procedures employed in the
laboratory. Specific experimental procedures cover operations relating to aconitic acid removal
trials.
3.1 General Experimental Procedures
A. Collection and Preservation of Samples: Raw juice and filter cake samples were collected
from the Cora Texas sugar mill during the 2001 to 2002 milling season. The samples
were stored in the freezer prior to use. The samples were thawed and thoroughly mixed
before each experiment.
B. Synthetic Juice
Synthetic juice at 15 % Dry solids (DS) was prepared for batch trials with the following
composition:
1. Sucrose 150g/ L
2. Trans-aconitic acid 1.5g/L
3. Sulfate 0.3g/L
4. Phosphate 0.15g/L
Concentrated synthetic juice at 60% DS was prepared for batch trials with the following
composition:
1. Sucrose 600g/L
2. Trans –aconitic acid 6g/L
3. Sulfate 1.2g/L
4. Phosphate 0.6g/L
25
C. pH adjustment for synthetic and concentrated synthetic juice was done with potassium
hydroxide prepared at concentrations of 1, 3, 6, and 12 normal.
D. DS (soluble solids in Juice): DS was determined using a Bellingham and Stanley
Refractometer model number RFM340.
E. pH: Sample pH was determined using a Orion glass electrode pH meter (electrode model
number 5993-28) . The instrument was calibrated before each experiment and the measurements
taken at known temperatures.
F. Cation: Determination of calcium and magnesium components in each sample was carried out
using high performance liquid chromatography (see section 3.3.1.).
G. Anions: Determination of the anionic content of the sample was done using high performance
liquid chromatography (see section 3.3.2.).
H. Aconitates: Salts formed during batch clarification trials were determined by x-ray diffraction
techniques.
I. Dilution. Samples for HPLC analysis were diluted to 0.3% DS. That is samples that were in the
range of 15% DS were diluted to 4g/200ml and samples that were approximately 60 %DS were
diluted to 1g/ 200ml.
3.2. Specific Experimental Procedures
3.2.1. Aconitic Acid in Filter Cake
The determination of aconitic acid in filter cake was undertaken to quantify the extent to
which aconitic acid was removed during standard mill clarification process. The extent to which
the acid salt dissolved in water was first established and the solubility results are illustrated on
page 37.
A. Approximately 5g of raw filter cake was weighed and dissolved in 100 ml of de-
ionized water.
B. Solution was mixed on a stir plate for about 20 minutes.
C. 20 ml of the solution was filtered with a 0.45µm filter for analysis.
26
3.2.2. Aconitic Acid in Raw Juice
A. Raw juice was thawed, properly mixed and filtered with Whatman 185mm filter.
B. 5ml of juice was collected for analysis
C. 4g of sample was weighed and diluted to 200ml for HPLC analysis.
3.2.3. Preparation of Tricalcium Aconitate Trihydrate Ca3(C6H3O6)2.3(H2O)
This salt was prepared by method employed by Doherty et al (1996).
A. Aconitic acid was neutralized with potassium hydroxide to make 0.2 M potassium
aconitate.
B. pH of 0.2 M potassium aconitate was adjusted to 6 .0 with 1N hydrochloric acid.
C. The solution was heated in a water bath to 85 oC.
D. 0.3 M calcium chloride was prepared.
E. Calcium chloride solution was adjusted to a pH of 6.0.
F. Calcium chloride solution was rapidly added to the heated potassium aconitate
solution.
G. The mixture was maintained at 85 oC.
H. Crystallization was induced by rubbing a glass rod on the side of the flask.
I. The precipitate was left in solution for 15 minutes to digest.
J. The solution was filtered and washed repeatedly with hot distilled water.
K. The precipitate was dried over night in vacuum oven at ambient temperature to
constant weight.
3.2.4.Dicalcium Magnesium Aconitate Hexahydrate, Ca2Mg(C6H3O6)2.6(H2O).
This salt was prepared according to methods outlined by Doherty et al 1996.
A. 100 ml of a 0.2 M aconitic acid solution was prepared.
B. 100 ml of a 0.3 M calcium carbonate solution was prepared.
C. 100 ml of 1M magnesium hydroxide solution was prepared.
D. pH of aconitic acid solution was adjusted to 5.4 with calcium carbonate solution.

27
E. pH was further adjusted to 6.5 with magnesium oxide solution.
F. Solution was heated for 3 hours at 95oC in a steam bath.
G. Precipitation was induced by scratching the side of the flask.
H. Precipitate was washed and dried as outlined previously.
3.2.5. Solubility of Salts of Aconitic Acid in Water and Ethyl Alcohol
The solubility of the acid salt was determined to establish the extent to which washing
results in loss of the precipitate. All the solubility experiments were carried out at room
temperature of 25 oC.
3.2.5a. Solubility Test for CaAA Trihydrate 100 % Ethyl Alcohol.
A. 1g of CaAA were weighed in duplicate.
B. 5g of 100% ethyl alcohol was added to each weighed sample.
C. Solution was allowed to shake for 24 hours on a shaker at ambient temperature.
D. The Refractometer DS of the solution was measured.
E. The solution was filtered and the cake weighed.
F. Cake was vacuum dried at ambient temperature for 24 hours.
G. Cake was weighed after drying.
3.2.5b. Solubility Test for CaAA in 50 Trihydrate % Ethyl Alcohol
A. 1g of CaAA were weighed in duplicate.
B. 2.5g of 100 % ethyl alcohol was added to each sample.
C. 2.5g de-ionized water was added to each sample.
C. Steps B through G of 3.2.5a was repeated.
3.2.5c. Solubility Test for CaAA Trihydrate in Water.
A. 1g of CaAA were weighed in duplicate.
B. 5g of de-ionized were water added to each sample.
C. Steps B through G of 3.2.5a were repeated.

28
3.2.5d. Solubility Test for CaMgAA Hexahydrate in Water.
A. 1g of CaMgAA were weighed in duplicate.
B. 5g of de-ionized water were added to each sample.
C. Steps B through G of 3.2.5a was repeated.
3.2.5e.Solubility Test for CaMgAA Hexahydrate in 100 % Ethyl Alcohol
A. 1g of CaMgAA were weighed in duplicate.
B. 5g of 100 % ethyl alcohol were added to each sample.
C. Steps B through G of 3.2.5a were repeated.
3.2.5f. Solubility Test for CaMgAA Hexahydrate in 50 % Ethyl Alcohol
A. 1g of CaMgAA were weighed in duplicate.
B. 2.5g of 100 % ethyl alcohol was added to each sample.
C. 2.5g of de-ionized water was added to each sample.
D. Steps B through G of 3.2.5a was repeated.
3.2.6. Batch Clarification Trials.
Batch clarification trials were conducted to establish the extent to which aconitic acid
was removed by precipitation under varying conditions of pH, temperature, defecant type,
defecant concentration and time. Four pH ranges of 6.5, 7.0, 7.5, and 8.0 were chosen based on
common industry practices, bearing in mind the extent to which pH affects inversion and sucrose
loss.
Temperature ranges of 35, 75 and 95 oC were used in the batch clarification trials to
simulate conditions of cold, intermediate and hot liming conditions as practiced in the sugar mills.
Calcium alone and a calcium magnesium combination on a one to one ratio as calcium chloride
and magnesium chloride were utilized as defecant. Defecant doses of 50, 100 and 150% were
calculated in excess of the balanced stocheiometric requirement. The calculations of the dosage
percentages are outlined in appendix A. The experiments were separated into segments based on
concentrations and defecant used. The first set of experiment was done with calcium as the

29
defecant at the three different calcium levels with temperature held constant at approximately
95oC. pH was then varied across each calcium level and the experiments repeated up to 5 times to
establish consistency.
The second set of experiments was carried out with the calcium/magnesium combination
as the defecant at the three different levels with temperature held constant at 95oC and pH varied
across each defecant level as outlined previously. The third set of experiment was a repeat of set
one but at sucrose concentration of 60g per 100ml de-ionized water. The fourth set of
experiments was a repeat of experiment 2 but at a sucrose level of 60g/100ml. Experiment set
five and six were set up to look at the effect of temperature and time on aconitic acid removal. In
set five a concentration of 15 g/100ml of sucrose was used, with a calcium/magnesium defecant
at a 100% concentration for a time of one hour for each temperature levels. Set six was carried
out in a similar fashion as set five, however temperature was held constant at approximately 95oC
and the experiment repeated across the time levels.
Experiments conducted in set seven represented a combination of all the different
parameters at all the levels, in all a total of one hundred and forty four (144) different
combinations. The experimental sets and the combinations within each set are illustrated in table
3.1.
Procedure for batch experiment:
A. 100ml of synthetic juice or concentrated synthetic juice was measured into a
250ml beaker.
B. The measured juice/syrup was placed into a jacketed beaker and heated to desired
temperature.
C. The measured quantity of defecant was then added.
D. Desired pH was adjusted with potassium hydroxide
E. Solution was allowed to react for the specified time.
F. At the end of the time period 10 ml of solution was pulled off.

30
G. Solution was filtered through a 0.45µm filter into sample vial.
H. Sample was stored for analysis.
I. The remaining solution was filtered through a 0.45µm filter.
J. The precipitate was vacuum dried over night at approximately 60oC.
K. Dry sample was ground and stored for x-ray diffraction analysis.
Table 3.1: Outline of the Different Combinations of Parameters Undertaken in each Experimental Set.
3.3 Sample Analysis Techniques
3.3.1 High Performance Liquid Chromatography (Cations).
HPLC using an Ionpac CS 12 column (Dionex Sunnyvale, CA) and conductivity detector
was used for quantitative analysis of calcium and magnesium concentrations in solution. A
Dionex AS 40 automated sampler was used to inject 10µL of each sample into a mobile phase of
0.22 mM methanesulfonic acid (MSA) solution eluted isocratically at 0.7 ml.min-1.
Concentrations of the cations were calculated from peak areas of HPLC (Figure 3.1) calibrated
against external standards of 2, 5 and 10ppm using the Dionex Peaknet System (Version 4)
SucroseExp. g/100ml oC
15 60 50 100 150 50 100 150 6.5 7 7.5 8 35 75 95 25 60 90
Set 1 X X X X X X X X X X
Set 2 X X X X X X X X X X
Set 3 X X X X X X X X X X
Set 4 X X X X X X X X X
Set 5 X X X X X X X
Set 6 X X X X X X X
Set 7 X X X X X X X X X X X X X X X X
Temp. Timemin% %
Ca++ Ca+++Mg++ pH

31
software. The unit was computer controlled with the Dionex Peaknet System as illustrated in
figure 3.2.
Figure 3.1 Typical Chromatogram of Cation Analysis Results from Sample 69-50-C.
CD- Conductivity Detector
Figure 3.2 Schematic of Cation HPLC Setup.
Computer Interface
Drain
Solvent Reservoir
Gradient Pump
Auto-sampler
Separation Column
Suppressor
CD
Signal Liquid Flow
0 2 4 6 8 10 12 14
Minutes
-2
0
2
4
6
8
10
µs
69-50-C
sodium Unknown
Calcium
Magnesium Potassium
Regenerant

32
3.3.2. High Performance Liquid Chromatography (Anions).
For analysis of aconitic acid, sulfate and phosphate, an AS11-HC column (Dionex,
Sunnyvale, CA) and a conductivity detector were used. Sample volumes of 20µl were
automatically taken via a Spectra System AS 3000 auto sampler and injected into a mobile phase
running a gradient with three eluents over a period of sixty five minutes. The eluents were
composed of sodium hydroxide at 2 levels, a 4mM, and 100mM concentration; de-ionized water
was used as the first eluent. Table 3.2 shows how the different eluents and flows were utilized in
expediting the method. Concentrations of the anions were calculated from peak areas of (Figure
3.3) calibrated against external standards using the Dionex Peaknet System (Version 4) software.
The unit was computer controlled with the Dionex Peaknet System similar to that used for the
cation unit as illustrated in figure 3.2.
Table 3.2 Gradient Method for Anion Separation
Eluent 1 de-ionized water Eluent 2- 100mM Sodium hydroxide Eluent 3- 4mM Sodium hydroxide
Time Flowmin ml/min 1 2 30 0.8 85 0 15
9.6 0.8 85 0 1519.1 0.9 80 0 2023.6 1 90 2 827.6 1.1 84 8 834.8 1.2 85 15 040.8 1.2 68 32 044.1 1.3 67 33 054.7 1.2 67 33 056.5 1.2 85 0 1558.8 1.1 85 0 1560.9 1 85 0 1562.7 0.8 85 0 1565 0.8 85 0 15
Eluent %

33
`
0 10.00 20.00 30.00 40.00 50.00 60.00Minutes
-2
0
2
4
6
8
10
12
14
16uS
78-150-D
1 - l
acta
te
2 - f
orm
ate
4 - s
ilicat
e5
- Unk
now
n 1
6 - S
O4
7 - P
O4
8 - c
itrat
e
9 - c
is-a
coni
tate
10 -
acon
itate
Figure 3.3 Typical Chromatogram of Anion Results from Sample 78-150-D.
3.3.3. X-ray Diffraction
Characterizing components of the precipitate involved the use of x-ray diffraction
techniques. The x-ray diffraction system used in this study was located in the Department of
Geophysics at Louisiana State University. The system was comprised of a Buker/Siemens D5000
automated powder x-ray diffractometer and was configured with a high intensity copper x-ray
tube and a silicon detector. Automation and data collection was accomplished with a
- 5-Cl
trans- aconitate

34
computer running the latest version of Rietveld analysis software. The computer also had the
2002 release of the powder diffraction database files from the JCPDS for data analysis (12
Campus Boulevard, Newton Square, PA, USA). The XRD method involved finely grinding a few
tenths of a gram of the sample and putting it in a sample holder ensuring random orientation of
the crystals. Samples were mounted in the x-ray diffractometer on a holder that pivots relative to
the x-ray tube allowing the angle of incidence of the x-ray beam to be varied from 0 to 90o. An
electronic detector mounted on a concentric goniometer moved at twice the angular speed
between the sample and the x-ray tube, so that the detector was at the angle required to record the
reflection. The detector was ran through a 2θ angle from 5o to 70o allowing detection from atomic
planes whose d-spacing ranged from 17.7*10-10m to 1.3*10-10 m. The sample and detector were
rotated through the desired θ and 2θ angles, and the attached computer continuously recorded the
intensity of the reflected X-rays.
Data obtained from the diffractometer was the 2θ angle and intensity of each peak. From
this data the d-spacing for each peak was calculated, and identification of the compound in the
sample was done by comparing the set of d-spacings and the reflection intensities of the sample,
with d-spacings and intensities of CaAA and CaMgAA made in the laboratory.
3.4. Statistical Analysis
3.4.1. Statistics Procedures
Statistical methods employed in the analysis were t-value, F-value, the P-value, the least
square means (lsmeans), the difference of the lsmeans, and type III test for fixed effects. A brief
description of how these are used to evaluate and interpret out put is given below.
The t statistic (t-value) measures the difference between the response means of two
groups of a classification factor. The t statistic is the difference in means divided by a standard
error quantity. A t statistic near zero indicates no difference in means; a large t statistic in either

35
the positive or negative direction indicates that the two group means are different. The sign of the
t statistic indicates which mean is the larger.
The F statistic (F-value) measures a classification effect on the expected response. The F
statistic is just the ratio of the mean squares for model and error, respectively. The mean square
for the "Error" estimates the intrinsic variation in the data. The mean square for the "Model"
estimates this variation plus the variation between the true group means. If there are no
differences between the true means, then the two mean squares should be about the same (F = 1).
If the Model mean square is much larger than the Error mean square (F >> 1), this indicates a
difference between the underlying true means.
The p-value measures how large the t statistic is for the parameter, by saying how likely
it is to get one this large in absolute value if in fact it is not involved in the true model for the
expected value of the response, assuming a normal (Gaussian) random model for the underlying
variation. Typically, p-values are assessed as follows: p > 3/10 : No evidence of significance ;
3/10 > p > 1/10 : Not much; 1/10 > p > 1/20 : Weak; 1/20 > p > 1/100: Appreciable; 1/100 > p
: Strong significance.
The LSMEANS statement computes least-squares means (LS-means) of fixed effects.
LS-means predict population margins by estimating the marginal means over a balanced
population. For an unbalanced population they calculate the mean, as the mean of means not the
raw mean. In a sense, LS-means are to unbalanced designs as class and subclass arithmetic means
are to balanced designs. Each LS-mean is computed as where L is the coefficient matrix
associated with the least-squares mean and is the estimate of the fixed-effects parameter vector.
The difference of the lsmeans is used to compare values obtained for fixed effects by
comparing P-values. The Tukey’s comparison compare least squares means for equality
(sometimes called the "honestly significant difference test") depends on the distribution of the
maximum absolute value of all k*(k-1)/2 differences between k means.

36
The type III test of fixed effects and the associated hypotheses test all effects in the model
except the one under consideration for their significance to the model. In this test each effect is
adjusted for all the variables in the model.
3.4.2 Treatment of Data
Data obtained from the different experiments was analyzed using SAS statistical analysis
software (SAS Institute Inc. 2002). The data was modeled as a randomized block design (RBD).
In this design the sample of experimental units was divided into groups or blocks and then
treatments were randomly assigned to units in each block. In this study each experiment set was
taken as a block and the treatments were the DS, temperature, pH, defecant, defecant
concentrations, and time.
A linear model procedure (Proc Mixed) was used to analyze the dependent variables.
Throughout the analysis a 5% significance level (P =0.05) was employed. The significance of
each variable was tested using the type III test of fixed effects (htype=3). Levels within each
variable were compared using Tukey’s Pairwise comparison of the means. The relationship
between parameters was tested by looking at the interaction between the variables; these were
also tested using the type III test for fixed effects.
Analysis was also done within each set to establish significance of variables at
that level. The procedure followed for each set was similar to that done at the block level,
except that each set was treated as a completely randomized design with factorial
treatment levels.

37
CHAPTER 4 RESULTS AND DISCUSSION
4.1. Aconitic Acid Removal in Mill Clarification
Results obtained from the analysis of filter cake and mixed juice, indicated that AA
content in filter cake was approximately 0.0481g/100g of total filter cake, while mixed juice had
a composition of approximately 0.1032g/100g. Mass balance around the filter station (Appendix
A) showed that about 3.4% of aconitic acid in mixed juice was removed in filter cake.
According to Monge (2002) the clarification method practiced at the mill was hot liming
at approximately 104 oC, with milk of lime to a pH of about 7.2. The heated juice was then
allowed to settle out in the clarifier for about an hour. During this time the pH dropped to give a
clarified juice pH of approximately 6.8.
4.2. Solubility of Salts of Aconitic Acid
Figure 4.1 illustrates results from duplicate experiments conducted to determine the solubility of
Figure 4.1 Plot of Solubility Results for CaAA and CaMgAA in Deionized Water and Ethyl Alcohol(EtOH) at 25oC.
00.20.40.60.8
11.21.41.61.8
2
CaAA1 W
ater
CaAA2 w
ater
CaAA1 5
0 % EtO
H
CaAA2 5
0% EtO
H
CaAA1 1
00 %
EtOH
CaAA2 1
00%
EtOH
CaMgA
A1 Wate
r
CaMgA
A2 Wate
r
CaMgA
A1 50%
EtOH
CaMgA
A2 50%
EtOH
CaMgA
A1 100
% EtO
H
CaMgA
A2 100
% EtO
H
Solu
bilit
y g/
100g
solv
ent
Refrctometer DS% Measured DS%

38
the salts of aconitic acid in ethyl alcohol and in deionized water. The results showed that both
salts were almost insoluble in ethyl alcohol but became more soluble in water. Of the two salts
CaAA trihydrate was the most soluble in both solvents, and was soluble to about 1.5 –1.7g/100g
water at 25 oC. The solubility of CaMgAA hexahydrate was 1.3-1.5g/100g water at 25 oC. These
solubility results are slightly higher than the 1g/100g water at 27 oC reported in Honig (1963); but
the results indicating that CaAA trihydrate was the most soluble of the two salts was consistent
with the literature. Walford (1998) explains the precipitation of calcium aconitate and calcium
magnesium aconitate as being a result of the inhibitory effect that calcium has on the
isomerisation of the trans to the cis form. This may explains why aconitates are found in
precipitates in scales collected from evaporators, because as the juice move from process stream
to process stream conditions become more favorable for aconitate precipitation, and precipitation
culminate in the final effect evaporator where higher concentrations of aconitates are observed in
some mills.
4.3. pH Effects on Aconitic Acid Removal
Results obtained for batch trial of aconitic acid removal (Appendix A1) are examined for
each set of experiment starting with set one. Experiment set 1 (Table 3.1) as outlined in chapter 3
looks at the removal of aconitic acid from synthetic juice solution at a sucrose concentration of
about 15% DS. This batch trial was done at a fixed temperature of approximately 95 oC across all
three defecant levels with calcium as defecant, while pH was adjusted to within the required
range. pH adjustments proved difficult thus precise pH levels were not obtained on all batches.
Figure 4.2 illustrate the effects of varying initial pH conditions on aconitic acid removal; the
results suggest that pH effect on aconitic acid was not significant across all the defecant levels.
The effect of pH on aconitic acid was also examined at each defecant level for set one (Appendix
B), these individual results also suggested that pH did not contribute to any marked variation in

39
Figure 4.2: Plot of AAR vs pH from SJ with Calcium Defecant Experiment Set 1
R2 = 0.0075
0
5
10
15
20
25
30
6.00 6.50 7.00 7.50 8.00 8.50
pH
AA
R %
AAR Linear (AAR)
the aconitic acid removed at each level within the pH range of 6.5 to 8.5.
Statistical analysis done on the data set resulted in a P-value of 0.4913, which strongly
suggest that pH did not contribute significantly to the aconitic acid removal within set one. A pH
of 7.5 was the most effective at removing the acid under these conditions, recording a maximum
removal of approximately 26% of initial aconitic acid in synthetic juice.
Results of batch trial set 2 involving the use of calcium/magnesium combination as
defecant, at a sucrose level of 15% DS with a fixed temperature of 95oC are illustrated in figure
4.3. These results also suggested that pH did not significantly affect the extent to which aconitic
acid was removed with the calcium/magnesium combination as a defecant. Statistical analysis of
data set 2 reported a P-value of 0.9606, indicating that pH was highly insignificant across all
levels of the defecant concentration. The data set was also analyzed at each defecant level,
however pH did not become significant at these levels (Appendix B). A pH of 8 proved to be the
most effective, with an average aconitic acid removal of 13%. The R-squared values for the
different levels ranged from 0.0019 to 0.069 indicating very poor correlation between aconitic
acid removals at the different pH levels.

40
Figure 4.4 shows the effect of pH on AAR from concentrated synthetic juice (CSJ) with
calcium as defecant (Experiment set 3). Although not proving to be significant with a P-value of
0.0632, the plot depicts a slight downward trend in aconitic acid removal with an increase in pH.
The highest aconitic acid removal of approximately 38% was reported at pH levels between 6.5
and 7. The most significant pH within this set was a pH of 7; this recorded an aconitic acid
removal of approximately 35%. Pairwise comparison of pH showed no significant differences in
aconitic acid removal. Analysis of the data at the different defecant levels also showed a down
ward trend in aconitic acid removal with an increase in pH (Appendix B).
Figure 4.3:Effect of pH on AAR from SJ with Calcium +Magnesium Defecant Experiment Set 2.
R2 = 0.0197
05
10152025
6.80 7.00 7.20 7.40 7.60 7.80 8.00 8.20
pH
AA
R %
AAR Linear (AAR)
Figure 4.4:pH Effect on AAR From CSJ across all Levels of Calcium (Experiment Set 3).
R2 = 0.27280
10
20
30
40
50
6.0 7.0 8.0 9.0 10.0pH
AA
R %
AAR Linear (AAR)
The pH effects on aconitic acid removal at concentrated levels (Experiment set 4)
with calcium and magnesium combination as defecant (Figure 4.5), showed very poor correlation

41
between aconitic acid removal and a change in pH. Statistical analysis of the data showed that pH
was marginally significant across the defecant levels reporting a P-value of 0.0460. Analysis at
each defecant level (Appendix B) showed a similar relationship indicating very poor correlation
between aconitic acid removal and a change in pH. A pH of 8 was the most effective in this set,
having an aconitic acid removal of approximately 34%.
Figure 4.5:pH Effect on AAR from CSJ with Calcium+Magnesium (Experiment Set 4).
R2 = 0.0828
0
10
20
30
40
50
6.00 6.50 7.00 7.50 8.00 8.50 9.00 9.50
pH
AA
R %
AAR Linear (AAR)
Analysis of pH effects on AAR across all levels of defecant, temperature and sucrose
concentration (Experiment set 7) resulted in a P-value of 0.7306. At this P-value the results
strongly suggest that pH within the range tested, did not contribute significantly to the extent to
which aconitic acid was removed during the batch trials.
Overall analysis across all the sets also showed that pH was not significant. A P-value of
0.0697 was determined across all sets. The most effective pH value was 7.5 with an overall
average aconitic acid removal of 26%.
Aconitic acid removal at low sucrose levels showed no distinct change with a change in
pH. However it was shown that at higher sucrose concentrations pH effects became more evident.
The presence of magnesium as a defecant affected the way in which pH influenced the acid
removal. Magnesium inclusion as a defecant resulted in increased aconitic acid removal as pH

42
increased, but when calcium alone was used the aconitic acid removal decreased as the pH
increased. At higher sucrose level it is apparent that the presence of magnesium is affecting how
aconitic acid removal changes with pH.
4.4. Temperature Effects on Aconitic Acid Removal
To investigate the effect of temperature on aconitic acid removal (Experiment set 5), the
overall aconitic acid removal was first examined across all the parameters. The results indicated
that temperature was significant at the 0.05 level since a P-value of 0.003 was reported for
temperature. Figure 4.6 illustrates these results. The results suggested that at the lower
temperature (35oC) there was more aconitic acid removed from the solution.
Pairwise comparison between temperatures indicated that aconitic acid removal at 35 oC
and 75 oC, and 95 oC were significantly different; while removal at 75 oC was not significantly
different form that at 95 oC (Table 4.1).
Figure 4.6 : Temperature Effect on AAR (Experiment Set 5)
0
10
20
30
40
50
60
0 5 10 15 20 25 30 35 40 45 50 55 60 65 70 75 80 85 90 95 100
Temperature oC
AA
R %
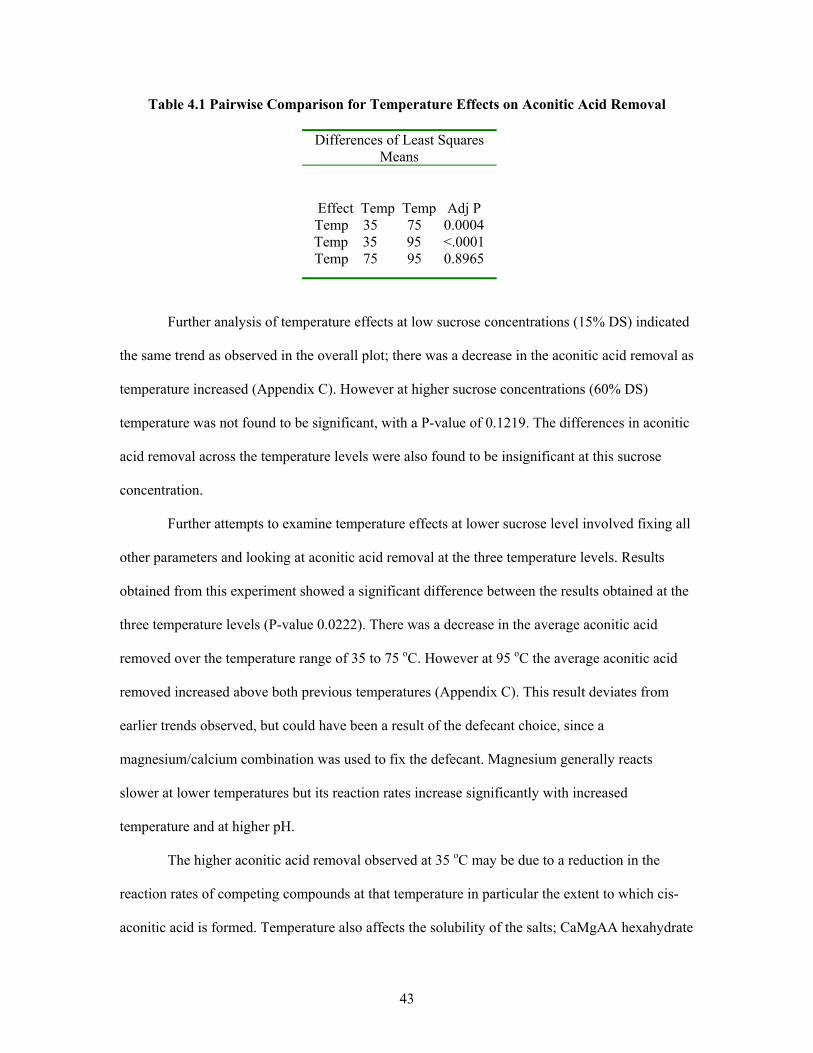
43
Table 4.1 Pairwise Comparison for Temperature Effects on Aconitic Acid Removal
Differences of Least Squares Means
Effect Temp Temp Adj P Temp 35 75 0.0004 Temp 35 95 <.0001 Temp 75 95 0.8965
Further analysis of temperature effects at low sucrose concentrations (15% DS) indicated
the same trend as observed in the overall plot; there was a decrease in the aconitic acid removal as
temperature increased (Appendix C). However at higher sucrose concentrations (60% DS)
temperature was not found to be significant, with a P-value of 0.1219. The differences in aconitic
acid removal across the temperature levels were also found to be insignificant at this sucrose
concentration.
Further attempts to examine temperature effects at lower sucrose level involved fixing all
other parameters and looking at aconitic acid removal at the three temperature levels. Results
obtained from this experiment showed a significant difference between the results obtained at the
three temperature levels (P-value 0.0222). There was a decrease in the average aconitic acid
removed over the temperature range of 35 to 75 oC. However at 95 oC the average aconitic acid
removed increased above both previous temperatures (Appendix C). This result deviates from
earlier trends observed, but could have been a result of the defecant choice, since a
magnesium/calcium combination was used to fix the defecant. Magnesium generally reacts
slower at lower temperatures but its reaction rates increase significantly with increased
temperature and at higher pH.
The higher aconitic acid removal observed at 35 oC may be due to a reduction in the
reaction rates of competing compounds at that temperature in particular the extent to which cis-
aconitic acid is formed. Temperature also affects the solubility of the salts; CaMgAA hexahydrate
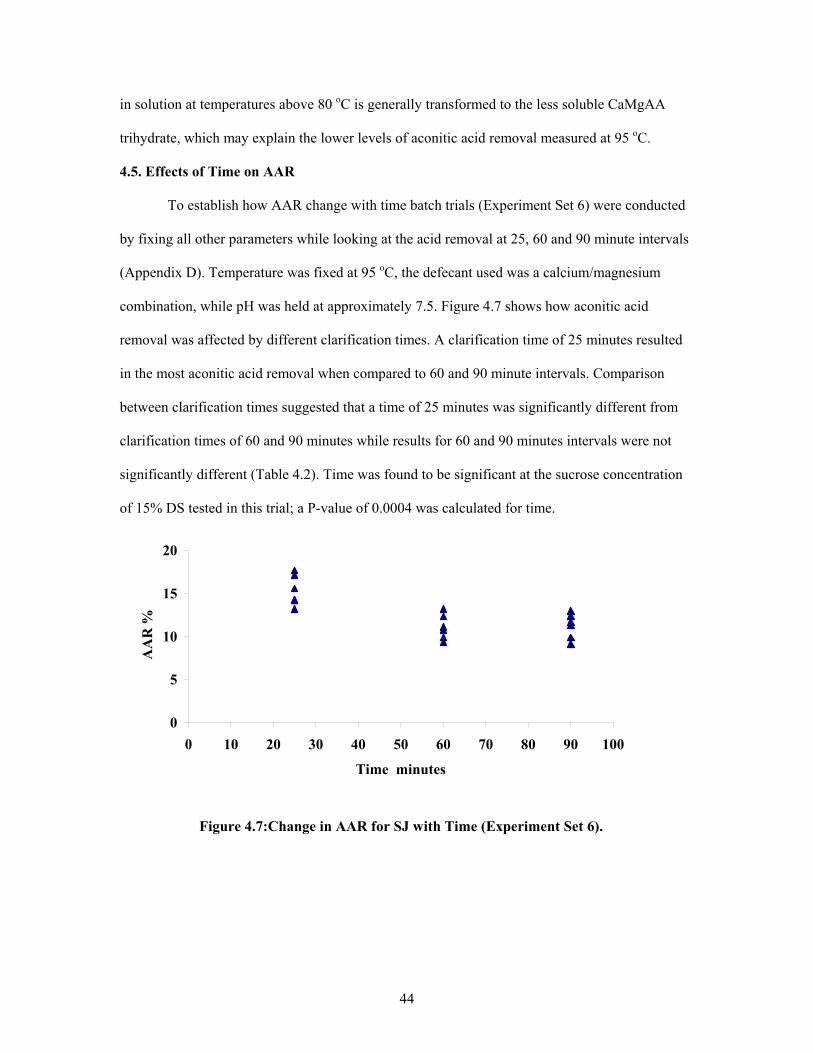
44
in solution at temperatures above 80 oC is generally transformed to the less soluble CaMgAA
trihydrate, which may explain the lower levels of aconitic acid removal measured at 95 oC.
4.5. Effects of Time on AAR
To establish how AAR change with time batch trials (Experiment Set 6) were conducted
by fixing all other parameters while looking at the acid removal at 25, 60 and 90 minute intervals
(Appendix D). Temperature was fixed at 95 oC, the defecant used was a calcium/magnesium
combination, while pH was held at approximately 7.5. Figure 4.7 shows how aconitic acid
removal was affected by different clarification times. A clarification time of 25 minutes resulted
in the most aconitic acid removal when compared to 60 and 90 minute intervals. Comparison
between clarification times suggested that a time of 25 minutes was significantly different from
clarification times of 60 and 90 minutes while results for 60 and 90 minutes intervals were not
significantly different (Table 4.2). Time was found to be significant at the sucrose concentration
of 15% DS tested in this trial; a P-value of 0.0004 was calculated for time.
Figure 4.7:Change in AAR for SJ with Time (Experiment Set 6).
0
5
10
15
20
0 10 20 30 40 50 60 70 80 90 100
Time minutes
AA
R %

45
Table 4. 2: Pairwise Comparisons on Time.
Aconitic acid removal was higher at 25 minutes and dropped to come to equilibrium at 90
minutes. The behavior of the acid under this condition coincides with what happens at higher
temperatures. Due to solubility differences between the acid salts formed at temperatures above
80 oC, over time insoluble CaMgAA hexahydrate is transformed to the more soluble CaMgAA
trihydrate. This explains the drop in aconitic acid removal after the 1 hour interval. The solution
then reaches an equilibrium point resulting in no change in aconitic acid removal over the 90
minute period. Another factor that might have contributed to the drop in aconitic acid removal is
the formation of CaHPO4 and Ca3(PO4)2. Reaction rate of CaHPO4 is generally faster, and as it
approaches completion the rate of formation of Ca3(PO4)2 increases. This reaction consumes
calcium available for aconitic acid removal which further contributes to a fall of in aconitic acid
removal.
The effect of time was examined under fixed conditions, thus the effect of other
parameters in conjunction with time was not examined. A factorial set up looking at all the
parameters across all the time levels would have more accurately represented how time affected
the acid removal.
4.6. Effects of Defecant and Defecant Concentrations
4.6.1 Defecant Concentration
Two defecants were used in the trials, calcium as calcium chloride and a calcium and
magnesium combination as chlorides. The concentrations used were in excess of the balanced
Differences of Least Squares Means Effect Time Time Adjustment P-value Time 25 60 Tukey 0.0010 Time 25 90 Tukey 0.0014 Time 60 90 Tukey 0.9830

46
stocheiometric requirement to provide adequate defecant for competing compounds (Appendix
A).
Figure 4.8 shows the change in the average aconitic acid removed at the different
defecant levels. The results indicated that more aconitic acid was removed at higher defecant
concentrations. Defecant concentrations were found to be significant with a P-value less than
0.0001 for overall aconitic acid removal.
The average aconitic acid removed as a result of a change in the defecant concentration
was observed for set 1 through 4 of the batch trials (Appendix E). It was noted that the average
aconitic acid removed followed a similar trend, increasing with an increase in defecant
concentration regardless of the defecant that was used. The only exception was the batch trials in
set one and two, where there were fluctuations in aconitic acid removal with change in defecant
concentration. However defecant concentration was not found to be significant in these two sets
(P-values 0.647 and 0.5766 for set 1 and 2 respectively).
Pairwise comparison across the defecant levels indicated that aconitic acid removal at
defecant level of 50% was significantly different from those at 100% and 150%; while 100% and
150% was not significantly different form each other (Table 4.3). A defecant concentration of
150% proved to be the most effective.
Figure 4.8:Effect of Defecant Concentrations on Average Overall AAR (Experiment Set 7 ).
05
1015202530
50 100 150
Defecant Concentration
Lsm
eans
of A
AR
%

47
Table 4.3: Pairwise Comparison of Defecant Levels for Overall Aconitic Acid Removal.
The effect defecant concentration has on aconitic acid removal is not strange. With other
competing compounds apart of the solution the more defecant added would mean more defecant
available for reaction with the acid, thus resulting in more acid removed from the solution.
4.6.2 Defecant Type
The type of defecant used did not seem to have a significant effect on the overall aconitic
acid removal. Figure 4.9 shows how AAR changes with defecant type. Results indicate that there
was not much variation in AAR by using calcium or a calcium magnesium combination.
Statistical analysis comparing both defecants showed that they were not significantly different
from each other in the amount of aconitic acid they remove from the synthetic juice solution
(Table 4.4). However calcium alone as defecant proved slightly more effective.
Ca- Calcium CaMg -Calcium+MagnesiumFigure 4.9 : Effect of Defecant Type on AAR (Set 7)
0
5
10
15
20
25
30
Ca CaMg
Defecant
Lsm
eans
of A
AR
%
Differences of Least Squares Means Standard Effect Defc Defc Error DF Pr > |t| Adjustment Defc 50 100 2.1387 146 0.0710 Tukey-Kramer Defc 50 150 2.1600 146 0.0062 Tukey-Kramer Defc 100 150 2.1387 146 0.3256 Tukey-Kramer

48
Table 4.4: Pairwise Comparisons between Defecants.
Differences of Least Squares Means
Standard Effect Def _Def Error DF Pr > |t| Adjustment
Defecant Ca CaMg 1.7724 147 0.0678 Tukey
There was little or no difference in how both defecant affected aconitic acid removal.
This result was unexpected. Salts of aconitic acid containing magnesium are less soluble and
therefore more should precipitate than the more soluble calcium salt. However the results show
that almost the same amount of removal was observed for both salts. This divergence may be a
result of the 1 hour clarification time used, which provided adequate time for the insoluble
hexahydrate salt to transform to the more soluble trihydrate. Other factors contributing to the
deviation might have developed from statistical data analysis. More data point might have been
required to more accurately represent how aconitic acid removal was affected by each defecant.
4.7. Effects of Sucrose Concentration
It is clear from the preceding results that the concentration of synthetic juice has
significant implications for aconitic acid removal. Figure 4.10 shows that a sucrose concentration
of approximately 60% DS, generally results in higher AAR. Increased concentrations means that
aconitic acid is concentrated in the solution and becomes available for removal due to the reduced
water content of the solution or a result of the increased sucrose level, since the solubility of
aconitates decreases with an increase in sucrose concentration. P-values for sucrose concentration
was less than 0.0001, implying that sucrose level was highly significant to aconitic acid removal.
Aconitate solubility also decreases significantly with increased sucrose concentration;
further explaining why more aconitic acid is removed at higher sucrose levels. These results
coincide with studies conducted on evaporator vessels, showing that aconitates are generally
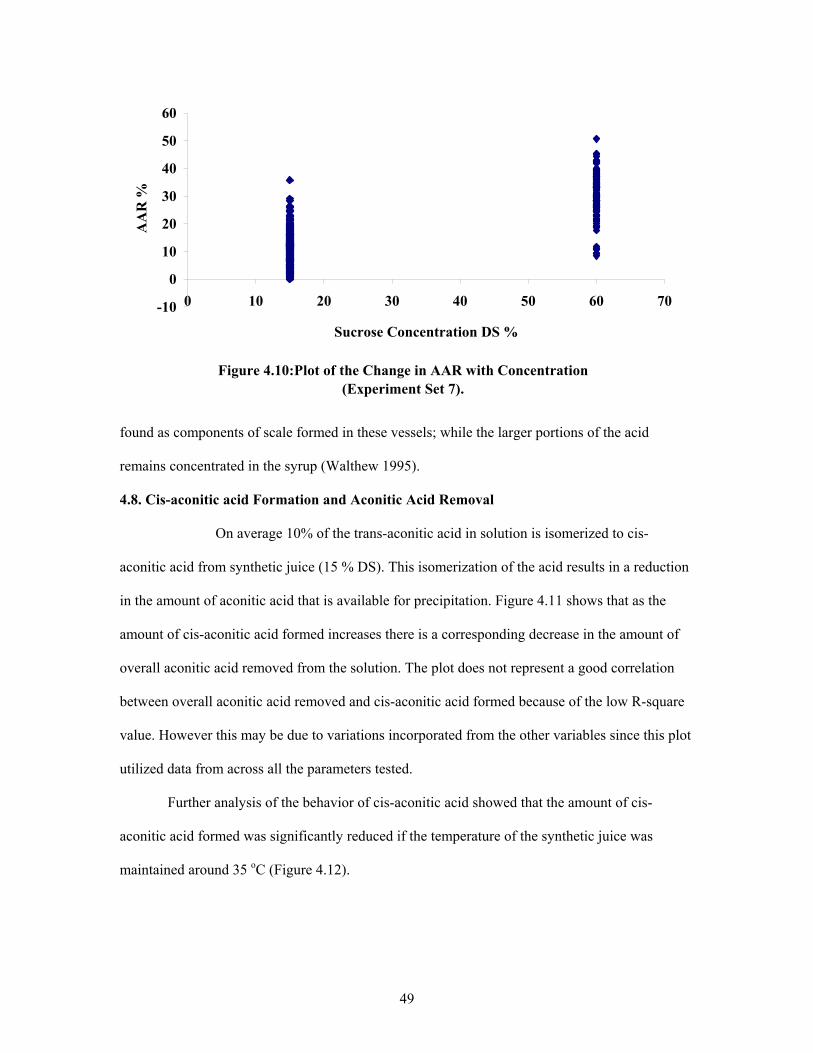
49
Figure 4.10:Plot of the Change in AAR with Concentration (Experiment Set 7).
-10
0
10
20
30
40
50
60
0 10 20 30 40 50 60 70
Sucrose Concentration DS %
AA
R %
found as components of scale formed in these vessels; while the larger portions of the acid
remains concentrated in the syrup (Walthew 1995).
4.8. Cis-aconitic acid Formation and Aconitic Acid Removal
On average 10% of the trans-aconitic acid in solution is isomerized to cis-
aconitic acid from synthetic juice (15 % DS). This isomerization of the acid results in a reduction
in the amount of aconitic acid that is available for precipitation. Figure 4.11 shows that as the
amount of cis-aconitic acid formed increases there is a corresponding decrease in the amount of
overall aconitic acid removed from the solution. The plot does not represent a good correlation
between overall aconitic acid removed and cis-aconitic acid formed because of the low R-square
value. However this may be due to variations incorporated from the other variables since this plot
utilized data from across all the parameters tested.
Further analysis of the behavior of cis-aconitic acid showed that the amount of cis-
aconitic acid formed was significantly reduced if the temperature of the synthetic juice was
maintained around 35 oC (Figure 4.12).

50
Figure 4.11: Plot of AAR vs Cis-aconitic Acid Formation.
R2 = 0.1627
0
10
20
30
40
50
60
0 5 10 15 20 25 30 AACF %
AA
R %
Figure 4.12 : Plot of the Change in Cis-aconitic Acid Formation at Different Temperatures
0
5
10
15
20
25
30
25 30 35 40 45 50 55 60 65 70 75 80 85 90 95 100
Temperature oC.
AA
CF
%
Although temperature seems to be one of the controlling factors in the amount of cis-
aconitic acid formed, the concentration of synthetic juice cannot be over looked. Figure 4.13
shows that at a high temperature (95oC) and high sucrose concentrations (60 % DS) the amount of

51
aconitic acid removed surpasses the amount of cis-aconitic acid formed when compared to lower
concentrations (15 % DS) at the same temperature.
Figure 4.13: Plot of Overall AAR against AACF
0102030405060708090
100
1 11 21 31 41 51 61 71 81 91 101 111 121 131 141 151Observations
Tem
p o C
, Bri
x %
DS,
AA
R %
, an
d A
AC
F %
Temp AAR AACF% Brix
These results points to the solubility of the salts at higher sucrose levels; while the
percent of cis-aconitic acid formed at the 60% DS level is approximately the same, aconitates
formed at this sucrose level precipitates more readily resulting in increased removal when
compared to removal at the lower sucrose concentration.
4.9. Reactions of Other Compounds
4.9.1. Sulfate
Honig (1963) stated that about 20% of the sulfate in cane juice is removed by liming
within a pH range of 7-8. Results obtained from the batch trials do indicate that on average, 20%
of the sulfate was removed with the clarification techniques tested. However the behavior of
sulfate when compared with aconitic acid for the factorial trials drew some attention. Figure 4.14
shows a fairly linear relationship between overall aconitic acid removal and sulfate removal. The

52
correlation was very good, with a R2 of 0.8986.
Figure 4.14: Overall AAR Plotted against SOR
R2 = 0.8986
-10
0
10
20
30
40
50
60
0 10 20 30 40 50 60
AAR %
SO
R %
This trend suggests that conditions that favor aconitic acid removal parallel those that favor
sulfate precipitation. This would suggest that sulfate is a major competing compound for the
defecant and might by inhibiting the precipitation of aconitate.
4.9.2. Phosphate
80- 99% of the phosphate present in juice is precipitated with lime depending on the pH.
Phosphate is known to precipitate more at higher pH around 8.5. Results from the batch trials
show that phosphate is almost always precipitated; ranging from approximately 70 % to 100%
across the batches (Appendix D) regardless of the defecant or the temperature used. A few
outliers were observed in the data set and may have been introduced from manual or analytic
error. There was very little relationship between aconitic acid removal and the extent to which
phosphate was precipitated. Figure 4.15 show that correlation between phosphate removed and
overall aconitic acid removed was highly insignificant, reporting a R2 value of 0.04.

53
Figure 4.15: Change in Phosphate Removal with Overall Aconitic Acid Removal
R2 = 0.0409020406080
100
0 10 20 30 40 50 60
AAR %
PO
R %
4.9.3. Calcium
The calcium ion concentrations as pointed out in chapter 3 are based on the amount of
ions it would take to completely react with 1 mol of aconitic acid to form calcium aconitate. 50,
100 and 150 % of this calcium ion concentration was used to react with the components of the
synthetic juice solution under the varying conditions mentioned in the chapter 3. Since calcium is
used as a defecant it is expected that there should be a linear relationship between aconitic acid
removed and calcium ions removed. That is, as the amount of aconitic acid removed increases
there should be a corresponding increase in the amount of calcium ions removed. Figure 4.16
shows this relationship. The figure shows that as the amount of calcium ions removed increases
there is a corresponding increase in the amount of aconitic acid removed. This correlation is not
as distinct as would have been expected since a fairly low R2 value of 0.28 was reported.
However it is clear that the plot depicts an increasing trend between the two variables.
4.9.4. Magnesium
Magnesium is found in cane juice in varying proportions and its content sometimes
exceeds that of calcium. Magnesium was added to synthetic juice in a similar fashion as calcium
to facilitate the formation of calcium magnesium aconitate. Figure 4.17 shows how magnesium
removal compares to aconitic acid removal. As the amount of aconitic acid removed increases

54
there is a corresponding increase in the amount of magnesium removed. Since magnesium was
used in conjunction with calcium as the second defecant both cations were plotted to observe the
relationship between them (Figure 4.18). It was observed that as the amount of calcium removed
increased the amount of magnesium removed also increased.
Figure 4.16:Calcium Removal Plotted against Overall Aconitic Acid Removal.
R2 = 0.28440
10
20
30
40
50
60
0 10 20 30 40 50 60 70 80
CaR %
AA
R %
.
Figure 4.17 : Change in Magnesium Removal with Aconitic Acid Removal.
R2 = 0.2927
0
10
20
30
40
50
0 5 10 15 20 25 30 35 40 45
MgR %
AA
R %

55
Figure 4.18:Change in Magnesium Removal with Calcium Removal
R2 = 0.7337-10
010203040506070
0 10 20 30 40 50 60 70 80
CaR %
MgR
%
4.10. Relationship between Parameters
For overall aconitic acid removal there were significant interactions among the
parameters. Table 4.5 gives an indication of the significance of the interactions by looking at the
P-value for each interaction.
Nearly all the P-values were less than the 0.05 significance level utilized in the study,
indicating that the presence of the other parameters substantially affected the extent to which the
acid was removed. The most significant interaction was among sucrose concentration, defecant
concentration and temperature (P-value <0.0001); but the interaction between sucrose
concentration and defecant type was also important with a P-value of 0.0005.
These results suggest that to establish optimum aconitate removal the correct
combination of parameters is essential and no one parameter is independent of the others and all
contribute to some extent to the acid removal.

56
Table 4.5: Significance of Interactions among Parameters.
Legend : Temp.-Temperature Defc -Defecant Concentration Def - Defecant Type
DS – Concentration of dissolved solids
4.11. Aconitate as Precipitate
CaAA trihydrate and CaMgAA hexahydrate diffraction patterns generated from
laboratory samples as outlined in chapter 3, were used as the basis for comparing X-ray
diffraction patterns. Figures 4.19 and 4.20 show these patterns, and both patterns were compared
in figure 4.21.
Effect DF DF F Value Pr > F DS*Def 1 5 66.52 0.0005 DS*pH 3 5 22.59 0.0025 DS *pH*Def 3 5 7.19 0.0291 DS * Defc 2 5 12.44 0.0115 DS * Defc *Def 2 5 38.06 0.0009 DS * Defc *pH 6 5 10.66 0.01 DS * Defc *pH*Def 6 5 12.54 0.007 DS * Defc *Temp 4 5 82.09 <.0001 DS * Defc *Temp*Def 4 5 18.25 0.0035 DS * Defc *Temp*pH 12 5 17.67 0.0026 DS *Defc*Temp*pH*Def 12 5 10.36 0.009 DS *Temp 2 5 45.81 0.0006 DS *Temp*Def 2 5 41.27 0.0008 DS *Temp*pH 6 5 10.21 0.011 DS *Temp*pH*Def 6 5 10.05 0.0114 pH*Def 3 5 25.03 0.0019 Defc *Def 2 5 47.33 0.0006 Defc *pH 6 5 19.16 0.0026 Defc *pH*Def 6 5 3.2 0.1116 Defc *Temp 4 5 15.71 0.0049 Defc *Temp*Def 4 5 34.95 0.0008 Defc *Temp*pH 12 5 7.4 0.019 Defc *Temp*pH*Def 12 5 15.52 0.0035 Temp*Def 2 5 25.47 0.0024 Temp*pH 6 5 13.05 0.0064 Temp*pH*Def 6 5 7.07 0.0243

57
Figure 4.19 :Diffraction Pattern of CaMgAA .6H2O
050
100150200250300350400
0 10 20 30 40 50 60 70 80
2-theta
Inte
nsity
(cou
nts)
2θ and d-spacing values of major peaks for CaAA trihydrate and CaMgAA hexahydrate
were used to examine the differences between both compounds; these results are tabulated in
table F2 appendix F. The results indicated that the area of most difference between CaAA
trihydrate and CaMgAA hexahydrate occurs in the 2θ regions of 14.7 to 18.3, where peaks were
present in the CaAA trihydrate pattern but missing in the CaMgAA hexahydrate pattern. Also 2θ
regions of 18.8 to 20.1 where peaks were present in the CaMgAA hexahydrate pattern but
missing in the CaAA trihydrate pattern
The differences in diffraction pattern observed between CaAA trihydrate and CaMgAA
hexahydrate are a result of their molecular make up. The presence of magnesium as part of
CaMgAA hexahydrate molecular structure resulted in the compound diffraction pattern being
different from that of CaAA trihydrate. In addition both compounds exist as hydrates; CaAA a
trihydrate, and CaMgAA a hexahydrate; thus also contributing to the type of x-ray pattern
generated.
Molasses sediments known to have high aconitate composition was used as a
bench mark for comparing aconitate x-ray patterns. Figure 4.22 shows the similarity between x-

58
Figure 4.20:Diffraction Pattern for CaAA.3H2O
050
100150200250300350400450500
0 10 20 30 40 50 60 70 80
2-theta
Inte
nsity
(cou
nts)
ray patterns generated for CaMgAA hexahydrate and molasses sediments. Major peaks of x-ray
pattern of molasses sediment line up very well with peaks of CaMgAA hexahydrate. Further
comparison done by matching up corresponding 2θ and d–spacing values for CaMgAA
hexahydrate and molasses sediment (Table F1, Appendix F) showed that 2θ and d-spacing values
corresponded well with those of CaMgAA hexahydrate. Only a few 2θ and d-spacing values did
not match. Since molasses contain numerous other compounds it was expected that all peaks
generated would not correspond to those of CaMgAA hexahydrate. The results however strongly
suggested that CaMgAA hexahydrate was a major component of molasses sediment, and was
consistent with results of Balch (1945) indicating that molasses sediment contain 16-35%
aconitate.

59
. A similar comparison was made with x-ray patterns for CaAA trihydrate (Figure 4.23), and 2θ
and d-spacing values tabulated in table F1 appendix F. The results showed good 2θ and d-spacing
match up between CaAA trihydrate and molasses sediment; while unmatched values
corresponded well with values matched for CaMgAA hexahydrate. Based on the results obtained
it was clear that CaAA trihydrate like CaMgAA hexahydrate was also a part of molasses
sediment.
Figure 4.21:Comparitive X-ray Patterns of CaAA and CaMgAA.
0
50
100
150
200
250
300
350
400
450
500
2 4 6 8 10 11 13 15 17 19 21 23 25 26 28 30 32 34 36 38 40 41 43 45 47 49 51 53 55
2-theta
Inte
nsity
(cou
nts)
CaAA CaMgAA

60
Figure 4.22 :X-ray Pattern of CaM gAA Plotted against M olasses Sedim ent
0
100
200
300
400
500
600
700
800
2 5 7 10 12 15 17 20 22 25 27 30 32 35 37 40 42 45 47 50 52 55 57 60 62 65 67 70
2-theta
Intensity (coun
CaM gAA M ol 001

61
Figure 4.23:X-ray Pattern of CaAA Plotted against Molasses Sediment
0
100
200
300
400
500
600
700
800
2 4 7 9 11 13 16 18 20 22 25 27 29 31 34 36 38 40 43 45 47 49 52 54 56 59 61 63 65 68 70
2-theta
Inte
nsity
(cou
nts)
CaAA Mol 001

62
Precipitates from selected experiments were analyzed for CaAA trihydrate and CaMgAA
hexahydrate by comparing the generated x-ray patterns against those of the pure aconitates.
Figures 4.24 and 4.25 compares x-ray patterns for sediments from batch experiment 45-100-A
with patterns for CaAA trihydrate and CaMgAA hexahydrate 2θ and d-spacing values for sample
sediment 45-100-A were also compared with values for CaMgAA hexahydrate and CaAA
trihydrate, and are tabulated in table F2 and F3 respectively in appendix F. This batch experiment
was conducted with CSJ at a temperature of 95 oC with a calcium and magnesium combination as
defecant, and at an initial pH of 6.69. Results obtained from matching 2θ and d-spacing values for
CaAA trihydrate, CaMgAA hexahydrate and sample sediment 45-100-A resulted in fairly good
matches for both compounds. Peaks in the 14.7 o to 18.3 o 2θ regions overlaid well with peaks
from the CaAA trihydrate pattern, and peaks in the 2θ regions of 18.8 to 20.1 overlaid well with
peaks of CaMgAA hexahydrate. However, there were areas where distinct deviations could be
seen. These unmatched areas could have been a result of the presence of other compounds such as
phosphates and sulfates which were almost always precipitated in each batch trial. From the
results all indications showed that both CaAA trihydrate and CaMgAA hexahydrate were present
in sediments from the batch experiment. The experiment reagents included both calcium and
magnesium which were needed to form both aconitate salts; therefore the presence of both salts in
the precipitate was expected.
More results from selected samples are illustrated in appendix F. Of interest is the batch
experiment 37-50-A. This experiment was conducted under similar conditions as experiment 45-
100-A except that calcium alone was used as the defecant. Tabulated 2θ and d-spacing values for
the sediment when compared to values for CaAA trihydrate and CaMgAA hexahydrate (Table F2
and F3, Appendix F) showed very good match for CaAA trihydrate. However peaks in the 14.7 to
20.1 2θ region critical to identifying CaAA tihydrate were not evident in this sample. This was
attributed to the high intensities for some of the peaks generated for this sample. These intensities
were more than 10 times that of CaAA trihydrate, and making comparing both patterns proved

63
difficult even after increasing the CaAA trihydrate intensity by 10. The peaks that could be
compared all matched very well with those of the trihydrate calcium salt, which would indicate
that CaAA trihydrate might be present in the sediment analyzed.
Most of the samples examined with x-ray diffraction did not produce a distinct pattern.
Notably, samples that were generated from experiments with lower concentrations (15% DS) did
not produce any readable diffraction patterns. This is evident in figure 4.26 where the result of x-
ray diffraction analysis of experiment 68-150-B is illustrated. This batch trial was done with SJ at
15% DS, a temperature of 75 oC, and pH of 7 with calcium as defecant.
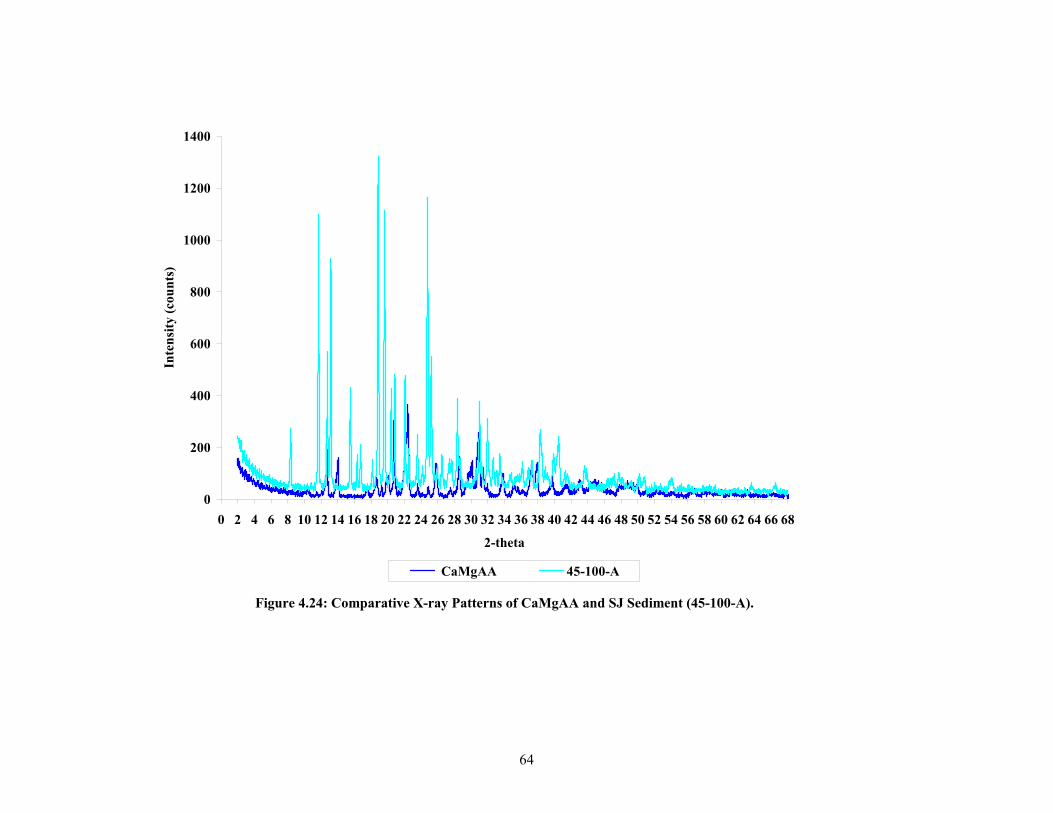
64
Figure 4.24: Comparative X-ray Patterns of CaMgAA and SJ Sediment (45-100-A).
0
200
400
600
800
1000
1200
1400
0 2 4 6 8 10 12 14 16 18 20 22 24 26 28 30 32 34 36 38 40 42 44 46 48 50 52 54 56 58 60 62 64 66 68
2-theta
Inte
nsity
(cou
nts)
CaMgAA 45-100-A

65
Figure 4.25:Com parative X-ray Patterns for CaAA and SJ Sedim ents(45-100-A).
0
200
400
600
800
1000
1200
1400
2 5 7 10 13 16 18 21 24 27 29 32 35 38 40 43 46 49 51 54 57 60 62 65 682-theta
Intensity (coun
CaAA 45-100-A

66
Figure 4.26 : Comparative X-ray Diffraction Pattern of CaAA and SJ Sediments(68-150-B).
0
50
100
150
200
250
300
350
400
450
500
2 4 6 8 10 12 14 17 19 21 23 25 27 29 31 33 35 37 39 42 44 46 48 50 52 54 56 58 60 62 64 66 692-theta
Inte
nsity
(cou
nts)
CaAA 68-150-B

67
Diffraction results not showing distinct patterns are normally a result of the sediments
being non-crystalline or amorphous. This may suggest that sediments formed during clarification
of SJ are more of the amorphous type with very little or no crystalline component. This coincides
with low aconitic acid removal observed at this concentration. While at higher concentrations the
acid was more readily precipitated resulting in more crystalline precipitates showing as a
diffraction pattern.
4.12 Raw Juice Trials
From a statistical standpoint the optimal conditions to remove aconitic acid from
synthetic juice solution was found to be the conditions outlined in table 4.6.
Table 4.6: Summary of Statistics Results for Optimal Aconitic acid Removal for SJ and CSJ.
These conditions were applied to raw juice to test the applicability of synthetic juice results to
mill clarification. Results are tabulated in appendix D. Attempts to examine the acid removal at
Parameters Significance P-value Estimate%
Sucrose Most significant <0.000115g/100ml 1660g/100ml Most effective 33
Defecant Conc. Highly significant <0.0001150% Most effective
Temp. Significant 0.000335 Most effective
Defecant Significant 0.0017Ca++ Not Significant
Ca++/Mg++ Different
pH Not significant 0.06947 Most effective for CSJ without Mg
7.5 Most effective for SJ8 Most effective for CSJ with Mg
Time Significant 0.012625 min Most effective
Overall Sets

68
35oC did not produce much useful results; the juice tended to deteriorate during the trials and
during sample analysis. However, some of the samples analyzed at 35oC showed average aconitic
acid removal of approximately 10%, with no cis-aconitic acid formation. The 10% removal
observed was less than the 16% estimated under the optimal condition. This might have been a
result of other compounds in raw juice utilizing defecant that would have been available for the
acid removal. Also, raw juice used in the trial had a large proportion of magnesium; therefore a
higher pH of 8 might have been more effective. The lack of cis-aconitic acid formation during the
process could be attributed to the low temperature used in the clarification trial since earlier
results indicated that the cis-isomer formed more readily at higher temperatures.
Due to disparities in the results obtained at 95oC attempts were made to examine aconitic
acid removal at this temperature. The results showed that aconitic acid removal of up to 62% was
achieved if a magnesium/calcium combination was used as a defecant at the 100% level with an
initial pH of 8. This coincides with results indicating that when magnesium was present a higher
pH resulted in higher aconitic acid removal. The extent to which cis-aconitic acid was formed
was significantly less in raw juice than in the synthetic juice solution at this temperature. This
might have been a result of cis aconitic acid already present in the juice, which reduced the
amount of cis aconitic acid required for the solution to reach equilibrium.
In general the removal of the acid from raw juice with a calcium/magnesium defecant
was generally higher when compared to removals from synthetic juice under similar conditions.
This may suggest that there are other factors that may facilitate the precipitation of the acid that
require more research.
69
CHAPTER 5 SUMMARY AND CONCLUSION
5.1 Effects of the Different Parameters on Aconitic Acid Removal Sucrose concentration, defecant concentration and temperature were the three most
significant parameters contributing to aconitic acid removal. All three combined represented the
most important interaction contributing to the acid removal. The remaining parameters however,
could not be totally discounted, as they also contributed to aconitic acid removal to some extent.
Sucrose concentration was the most important parameter. A sucrose level of 60 %DS
resulted in up to 33% aconitic acid removal, providing all the other parameters were set to
optimal conditions. Aconitic acid removal at 60% DS was primarily a result of the reduced
solubility of the acid salt at high sucrose concentration as a result of the reduced water content or
increased sucrose level. At such high sucrose level the solubility of the salt decreased to the
extent that effects of parameters such as temperature became less significant.
The temperature effect on the acid removal was more evident at lower sucrose levels.
Results indicated that it was not temperature that affected the acid removal, but rather the cis-
aconitic acid formation that occurred at high temperatures that made the acid unavailable for
removal. A lower temperature of 35 oC proved very effective in limiting the formation of this cis-
isomer.
Defecant concentration was found to be fairly significant, more so at concentrated
synthetic juice levels. Competing anions such as sulfate and phosphate consumed large
proportions of the defecant making less available for the acid removal. Phosphate was more
readily precipitated than any other compound in the juice solution thereby consuming a fair share
of defecant. Sulfate on the other hand was precipitated under conditions similar to those that
favored aconitates making it a major competitor for the defecant. Higher concentrations of the
defecant provided adequate amount of defecant for these reactions.

70
The type of defecant used was found to be significant but removals due to each defecant
was not found to be significantly different from each other. A calcium and magnesium
combination was expected to result in far more aconitic acid removal than the use of calcium
alone. However, the use of calcium alone resulted in a slightly higher removal rate. All
information found on the salts pointed to more removal with calcium and magnesium as a
defecant. The results obtained were attributed to experimental error and inadequate data. Other
effects that the presence of magnesium had on the acid removal were more evident at the
concentrated juice level. Results showed that at the CSJ level when magnesium was present more
aconitic acid was removed from the solution if a pH of 8 was used. While in the presence of
calcium alone a pH of 7 resulted in more aconitic acid removal, pH was not significant for
aconitic acid removal at the 15%DS level but became slightly significant at the 60% DS level.
A time of 25 minutes was found to be the most effective time frame for effectively
removing the acid. Longer time frames showed a reduction in the acid removal, which was
attributed to inversion to the more soluble trihydrate and reactions of phosphate.
5.2.XRD of Aconitates
XRD proved to be a fairly good technique in identifying aconitates, but until XRD
patterns for the aconitates are made part of the general JCDPS databases the use of this technique
will be rather tedious. Both CaAA trihydrate and CaMgAA hexahydrate were found to be present
in molasses sediment. The results also suggested that both salts were present in sediments
analyzed from CSJ trials. Sediments from the less concentrated SJ trials however exhibited no
XRD patterns. Comparison between CaAA trihydrate and CaMgAA hexahydrate suggested that
both compounds were very similar, but distinctions could be made by comparing the XRD
patterns, which showed that the patterns deviated from each other primarily in the 14.7 to 18.3
and 18.8 to 20.1 2θ regions.

71
5.3. Optimum Precipitation Conditions for Aconitic Acid
Based on the preceding results and discussion it is clear that any attempts to remove
aconitic acid from juice must involve increasing the concentration of the solution since overall
aconitic acid removal was higher at higher sucrose levels. At lower sucrose concentration the
optimal condition was to allow juice to clarify for 25 minutes with calcium or a calcium and
magnesium combination as defecant at the 150% level, with a pH of 7.5 and temperature of 35
oC. At concentrated levels aconitic acid removal from synthetic juice was best effected if calcium
was used as defecant at the 150% level, with a pH of 7, and a temperature of 35 oC over a 25
minute period or if a combination of calcium and magnesium defecant was used a higher pH of 8
proved more effective.
5.4. Optimal Conditions Applied to Raw Juice
Trials with raw juice showed that at 35 oC only about a 10% aconitic acid removal was
achievable. This is greater than the 3.4% calculated for present mill clarification, but was less
than the 16% estimated for the clarification of SJ, and far less than the 73.3% estimated by the
French (Hanine et al 1991). Optimal conditions with a temperature of 95oC and a pH of 8 resulted
in more favorable aconitic acid removal of approximately 48%. No attempt was made to
investigate the acid removal from concentrated raw juice, but based on CSJ results higher levels
of removal are expected.
5.5 Industry Implications
To improve aconitic acid removal from the sugar process, mills have to look at
implementing systems that tackle the acid removal at higher sucrose levels. This may involve
modifying present clarification systems to one that involves a second clarifying of the juice after
the sucrose level has been raised, or a single clarification at a more concentrated level to a point
where aconitate precipitation is facilitated. Syrup clarification is practiced in other countries and
is commonly referred to as the Talodura process. No known research looking at the extent of
aconitic acid removal from this process was undertaken but, if this technology is adapted with

72
modifications based on CSJ results and further research with syrup, more aconitic acid removal
could be achieved. Under present mill clarification conditions the results point to marginal
aconitic acid removal if clarification time is minimized, clarifying is done at higher temperature,
and if pH is increased as magnesium content of juice increases with the progression of the season.
5.6. Future Research
This study primarily looked at the removal of the acid from a synthetic juice solution,
which is far less complex than raw juice. The study represents a guide to the approach that should
be taken in looking at raw juice by eliminating some of the parameters that might not contribute
significantly to aconitic acid removal. A study looking at real juice in a factorial setup across
selected parameters would more accurately represent aconitic acid removal during the
clarification process.
Future research must involve looking at raw juice at the concentrated level. An
investigation into aconitic acid removal during the present Talodura process and modification of
the process to improve aconitic acid removal should be undertaken. The benefits of aconitic acid
removal are understood, but to quantify the benefits in terms of sugar recovery, experiments
examining sugar recovery from syrup with different aconitic acid content are necessary. Batch
clarification trials on a larger scale looking at removals at recommended conditions and
examining sugar recovery from the juice would help in answering some of the questions
concerning benefits of the acid removal.
73
REFERENCES
Baikow, V.E. (1982). Manufacture and Refining or Raw Cane Sugar, Elsever Scientific Publishing Company, Amsterdam-Oxford-New York. Balch, R. T., Broeg, C. B., and Ambler, J. A. (1945). Aconitic Acid in Sugar Cane Products, The Sugar Bulletin :32-35. Baniel, A.M. (1982). Process for the Extraction of Organic Acids from Aqueous Solution, Chemical Abstracts, Europe, Miles Laboratories Inc. Barnes, N. G., Gramajo de Doz, M. B., and Solimo, H. N. (2000). Liquid-Liquid Extraction of tarns-Aconitic Acid from Aqueous Solution with Tributyl Phosphate and Mixed Solvent at 303.15, Industrial Engineering Chemistry Research, 39: 3364-3369. Bennett, M.C. (1973). Flocculation Process in Sugar Manufacturing, International Sugar Journal, pp 101-109. Behr, B. (1877). Deut.Chem.Gessell, 10, 351. Bond, J.D. (1925). Industrial Engineering Chemistry, 17: 492 Broadhurst, H.A. (2002). Modeling Adsorption of Cane Sugar Solution Colorant in Packed-Bed Ion Exchangers, Masters Thesis, Louisiana State University. Celestine-Mytril, D., and Parfait, A. (1988). HPLC Determination of Organic Acids in Sugar Cane and its Industrial Byproducts, International Sugar Journal, Vol. 90, No. 1070: 28-31. Doherty, W.O.S., Greenwood, J., Pilaski, D., and Wright, P.G. (1996). The Effect of Liming Conditions in Juice Clarification, Proc. Aust. Soc. Sugar Cane Technology, Vol. 24. Doolan, A. D. (1953). The Aconitic Acid Content of Queensland Molasses, Proceedings of 20th Conference the Queensland Society of Sugar Cane Technologists, 23: 23-28. Drouiche, M., Lounici, H., Mameri, N., Piron, D., and Kharroune M. (2001). Utilization of Factorial Experiments for the UV/H2O2 Process in a Batch Reactor, Water SA, Vol.27 No. 4:551-557. Eggleston, G. (2000). Hot and Cold Clarification in Raw Sugar Manufacture I and II: Lime Addition and Settling Behavior, Int. Sugar Jnl. 102: 453-455. Fectcher, W.L., Kitching, S.M., Rajh, M., Reimann, R.H., Ahmed, F.E., Jensen, C.R.C., Schorn, P.M., and Walthew, D.C. (2001). Direct Production of White Sugar and White Strap Molasses by Applying Membrane and Ion Exchange Technology in a Sugar Mill, Proc. Intl. Soc. Sugar Cane Technol., 24:100-107. Fort, C.A., (1939). Facts about Sugar, 34, No. 9:34. Fournier, L.B., and Vidaurreta, L.E. (1971) Calorimetric Determination of Aconitic Acid in Sugar Cane Juice, Analytuca Chimica Acta, 53: 387-392.
74
Freund, R.J., Wilson W.J. (1997). Statistical Methods revised edition, Academic Press, MA USA. Gupta, S.C., and Chetal, U. (1966). Studies on Removal of Aconitic Acid from B-Heavy Molasses for Better Performance of Low Grade Massecuites in Sugar Factory, 34th Proceedings of the Sugar Technologist Association of India Kanpur: 225-230. Gupta, S. C. and Chetal, U. (1968). Methods of Estimation of Aconitic Acid, International Sugar Journal: 107-110. Gupta, S.C. and Jadhav, S.J. (1987). Aconitic acid Problems and Potentials, Bharatiya Sugar: 33-37. Hanine, H., Mourgues, J., and Conte, T. (1992). Recovery of Calcium Aconitate from Effluents from Cane Sugar Production with Ion-Exchange Resins, Bioresource Technology, 39: 221-227. Hanine, H., Mourgues, J., and Molinier, J. (1990). Aconitic Acid Removal During Cane Juice Clarification, International Sugar Journal, 92 (1103): 219-238. Hanine, H., Mourgues, J.,Conte T., Malmary, G., and Molinier, J. (1991). Optimum Precipitation Conditions for Salts of Aconitic Acid, International Sugar Journal, 93 (1115): 232-237. Hill, A.G., and Pampatwar, M.K. (2001). Partition Coefficients for Aconitic Acid between Aqueous Solutions and Tertiary Amine Containing Solvents, Journal American Society of Sugarcane Technologist, Vol. 21: 172. Honig, P. (1963). Principles of Sugar Technology, Amsterdam, Elsevier Publishing Company. Hugot, E. (1972). Handbook of Cane Sugar Engineering, Amsterdam, Elsevier Publishing Company. Kampen, W. (1997). Improved Clarification with a Cationic Flocculent, International Sugar Journal, Vol. 99, No. 1183, 353-360. Mane, J., Kumbler D.L., Barge, S.C., and Phadnis, S.P. (2002). Relationship between Aconitic Acid Content in Cane Cultivars and Molasses from Various Recovery Zones of Maharastra, Intl. Sugar Jnl., Vol. 104: 177-179. Poel, van der P.W., Schiweck, H., and Schwartz T. (1998). Sugar Technology Beet and Cane Sugar Manufacture, Verlag Dr. Albert Bartens KG, Berlin, Germany. Malmary, G., Monteil, F., Molinier, J., Hanine, H., Conte, T., and Mourgues J. (1995). Recovery of Aconitic Acid from Simulated Aqueous Effluents of the Sugarcane Industry through Liquid-Liquid Extraction, Bioresource Technology, 52: 33-36. Meadown, D.M. (1996). Raw Juice Flow Control, Screening, Heating and Liming, Proc. S. Afr. Sug. Technology Ass., 70: 272-276. Meade, G.P. (1963). Spencer-Mead Cane Sugar Handbook. 9th edition. New York, John Wiley and Son, Inc. Monge, A. (2002) Personal communication, October.

75
Montgomery, D.C. (1997). Designing and Analysis of Experiments. 4th edition, New York, John Wiley and Sons, Inc. Off, R.L., Longnecker, M. (2001). An Introduction to Statistical Methods and Data Analysis 5th edition, Thomson Learning Duxbury, Pacific grove, CA, USA. Nesse, W. D. (2000). Introduction to Mineralogy, New York, Oxford University Press, Inc. Paturau, J. (1989). Byproducts of the Cane Sugar Industry; an Introduction to their Industrial Utilization, Third revised edition Amsterdam, Elsevier Scientific Publishing Company. Regna, E., and Bruins, (1956). Recovery of Aconitic Acid from Molasses, Industrial and Engineering Chemistry, 48(8): 1268-1277. Rein, P. (2002). The Optimum pH for Juice Clarification, The Sugar Bulletin, Vol. 80 No. 12: 17-19. SAS Institute. (2002). SAS/STAT Guide for Personal Computers Version 9, SAS Institute, Inc., Cary, North Carolina. Saska, M. (2002). Comments on Juice Clarification Practice in Louisiana, The Sugar Bulletin, Vol. 81 No.2. Saska, M., and Zapata Gil, N. (2002). Chemical Composition of Cane and its Components and Effects of Clarification Conditions on Processing Characteristics of Extracted Juice, LSU AgCenter, Baton Rouge, LA, USA (Unpublished). Shahabaz, A. M., &. Qureshi, A. R. (1980). Effect of Various Factors on the Aconitic Acid Content of Molasses, Pakistan Journal of Science, 32(1): 87-90. Stuart, D.M., Maryland, H.F., and Grunes D.L. (1973). Seasonal Changes in Trans-Aconitate and Mineral Composition of Crested Wheatgrass in relation to grass Tetany, Journal of Range Management, 26(2): 113-116. Ventre, E.K., (1940). Preliminary Report of the Crystalization of Sucrose from Juice of Sorgo Plant, Sugar Journal, 3(7) : 23-26. Walford, S.N.(1998). A Laboratory Investigation of Aconitic Acid Isomerisation and some Observations on Isomerisation in Factory Processing, Proceeding of South African Sugar Technologist Ass., 72:234-241. Walthew, D.C., and Turner, L.M. (1995). Analysis of Scales from South African Sugar Mills, Proceeding of the South African Sugar Technologist Ass. 138-143.

76
APPENDIX A CALCULATIONS
A1. Aconitic Removal
Aconitic acid removal (AAR) was calculated based on the difference between initial aconitic acid
and final aconitic acid in analyzed sample. Initial aconitic acid was taken to be 1500ppm in
synthetic juice (SJ) and 6000ppm in concentrated synthetic juice (CSJ) based on batch averages.
The acid removal was represented as a percentage of the initial acid concentration. Final aconitic
acid content of the sample was taken as the sum of the trans and cis aconitic acid left in the
sample.
Eq A1 : Aconitic acid removed from SJ.
Cis aconitic acid formed was calculated as follows:
Eq A2: Cis aconitic acid formed in SJ.
Calculation of removal of all other compounds was represented as a percentage of the initial
weight of the compound.
A2 Defecant concentrations were used in excess of the balanced stocheiometric amount.
Calcium:
100% calcium defecant concentration was taken as approximately 0.2870g CaCl2 (0.1043g Ca++)
per 100ml solution of SJ and 1.148g CaCl2 (0.4172g Ca++) per 100ml of CSJ.
100*1500
)1500(%ppmfinalAAppmppmAAR −
=
100*1500
%ppm
AACFAACF =
( )263633
6362 23 OHCCaOHCCa →+ −+
AAtransAAcisfinalAAppm +=
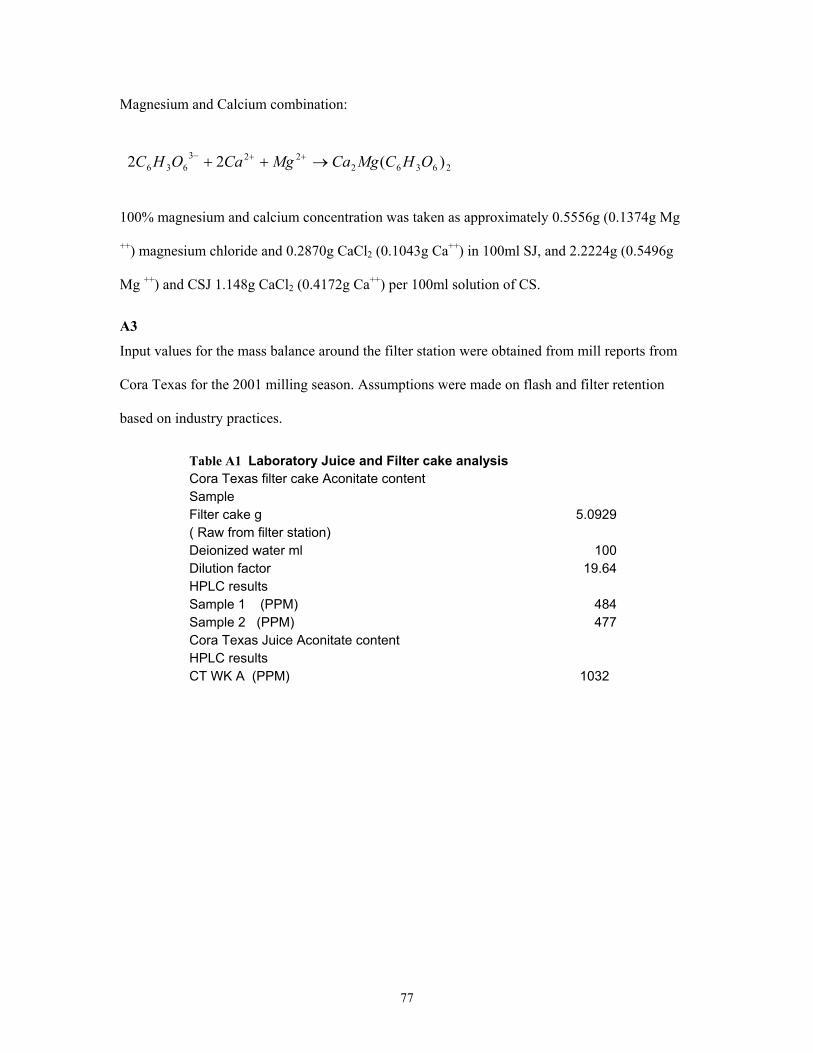
77
Magnesium and Calcium combination:
100% magnesium and calcium concentration was taken as approximately 0.5556g (0.1374g Mg
++) magnesium chloride and 0.2870g CaCl2 (0.1043g Ca++) in 100ml SJ, and 2.2224g (0.5496g
Mg ++) and CSJ 1.148g CaCl2 (0.4172g Ca++) per 100ml solution of CS.
A3
Input values for the mass balance around the filter station were obtained from mill reports from
Cora Texas for the 2001 milling season. Assumptions were made on flash and filter retention
based on industry practices.
Table A1 Laboratory Juice and Filter cake analysis Cora Texas filter cake Aconitate content Sample Filter cake g 5.0929 ( Raw from filter station) Deionized water ml 100 Dilution factor 19.64 HPLC results Sample 1 (PPM) 484 Sample 2 (PPM) 477 Cora Texas Juice Aconitate content HPLC results CT WK A (PPM) 1032
26362223
636 )(22 OHCMgCaMgCaOHC →++ ++−

78
APPENDIX B
Table A2 Mass balance around filters and clarifiers (Cora Texas) Input Cane Flow t/hr Filter wash index 555.7 Bagacillo flow kg/ton cane 100.0 Bagacillo moisture % 12.0 Bagacillo DS % 50.0 Lime kg/ton cane 2.5 Baume 0.5 Filter Cake moisture % 12.0 Filter Cake DS % 73.0 Filter retention % 6.0 Underflow susp solids % 0.9 Mixed Juice quantity % cane 4.0 Mixed Juice DS % 93.1 Mixed Juice susp. Soilds % 15.0 Heated Juice Temp. C 0.8 Flash ton/hr 104.0 Aconitate in draft juice ppm 3.8 Aconitate in cake ppm 1000.0 500.0 Insoluble Solids Draft juice Ton/hr % DS Moisture % % Ton/hr Ton DS/hr % Cane Lime 517.2 15.0 84.2 0.8 4.1 77.8 93.1 Flash 2.7 10.4 89.6 0.0 0.0 0.3 0.5 Flow to Clarifier 3.8 0.7 Bagacillo 630.0 0.8 4.9 121.8 Underflow 6.7 2.5 50.0 47.5 3.2 0.2 1.3 Muds to Filter 123.7 4.0 4.9 23.9 Cake 130.4 6.2 8.1 25.2 Clear juice 34.8 6.0 73.0 21.0 7.3 2.1 6.7 Water 506.3 15.0 85.0 76.1 97.9 Filtrate 18.3 3.5 Aconitate in mixed juice ton/hr 113.9 0.7 0.8 22.0 Aconitate in Cake ton/hr 0.5172 Aconitate removed % 0.0174 3.4

79
pH EFFECTS
Figure B.1 : Plot of AAR vs pH in SJ at Approximately 15 Brix using Calcium Defecant at 50% Defc.
R2 = 0.10740
5
10
15
20
25
30
6.00 6.50 7.00 7.50 8.00 8.50
pH
AA
R %
AAR Linear (AAR)
Figure B.2:Effect of pH on AAR from CSJ at 95oC with Calcium Defecant at 50% Concentration.
R2 = 0.2446
05
10152025303540
6.0 7.0 8.0 9.0 10.0pH
AA
R %
AAR Linear (AAR)

80
Figure B.3: pH Effects onAAR form CSJ with Calcium Defecant at 150% and at 95oC
R2 = 0.149305
10152025303540
6.0 6.5 7.0 7.5 8.0 8.5 9.0 9.5
pH
AA
R %
AAR Linear (AAR)
Figure B.4:Effect of pH on AAR from CSJ with Calcium Defecant at 100% Concentration at 95oC.
R2 = 0.52530
10
20
30
40
50
6.0 6.5 7.0 7.5 8.0 8.5 9.0
pH
AA
R %
AAR Linear (AAR)

81
Figure B.5 :pH Effects on AAR from CSJ with Calcium/Magnesium Defecant at 50% Concentration at 95oC.
R2 = 0.0794
05
10152025303540
6.00 6.50 7.00 7.50 8.00 8.50 9.00 9.50
pH
AA
R %
AAR Linear (AAR)
Figure B.6:pH Effects on AAR with Calcium/Magnesium Defcant at 100% at 95oC.
R2 = 0.1633
0
10
20
30
40
50
6.00 6.50 7.00 7.50 8.00 8.50 9.00
pH
AA
R %
AAR Linear (AAR)
APPENDIX C

82
TEMPERATURE EFFECTS
Figure C 1: Plot of Temperature effects on AAR at Low Sucrose Levels.
0
2
4
6
8
10
12
14
16
18
20
35 75 95Temperature oC
Ave
rage
AA
R%
Figure C2: Temperature Effects on AAR at High Sucrose Levels
27
28
29
30
31
32
33
34
35 75 95
Temperature oC
Ave
rage
AA
R %

83
Figure C4: Contrast of of O verall AAR w ith AACF at the Three Tem perature Levels.
0
20
40
60
80
100
1 14 27 40 53 66 79 92 105 118 131 144 157
O bservations
AAR %, AACF %
and Temperature
oC
Tem p AACF AAR
Figure C3: Effect of Temperature on AAR with all other Variables Fixed.
0
2
4
6
8
10
12
14
35 75 95Temperature oC
Ave
rage
AA
R %

84
Figure C5 :Change in MgR with CaR in CSJ
R2 = 0.196305
1015202530354045
0 10 20 30 40 50
CaR %
MgR
%
Figure C6: Comparitive plot of Overall AAR with AACF
-10
0
10
20
30
40
50
60
0 50 100 150 200
Observations
AA
R %
, A
AC
F %
AAR AACF

85
APPENDIX D
BATCH ACONITIC ACID REMOVAL Table D1: AAR from SJ with varying Defecant Concentration and pH (set1)
Formed
Exp code % Sto. ppm pH Ca++ A.A. A.A.cis SO4-- PO4
--- Ca++ A.A SO4-- PO4
--- AACF2-50A 50 434 7.52 360 1104 9 233 35 17 26 29 73 12-50B 50 489 7.03 482 1368 17 259 8 1 9 21 94 14-50A 50 449 6.64 418 1458 19 266 0 7 3 19 100 14-50B 50 475 6.67 460 1466 16 276 35 3 2 16 74 16-50A 50 435 8.01 337 1393 11 274 51 23 7 16 61 16-50B 50 436 7.50 371 1435 9 253 0 15 4 23 100 17-50A 50 437 7.12 316 1442 4 198 0 28 4 39 100 07-50B 50 448 7.45 368 1412 8 185 0 18 6 43 100 19-50A 50 457 7.34 347 1153 6 301 0 24 23 8 100 09-50B 50 434 7.45 409 1254 2 305 0 6 16 7 100 010-50A 50 435 7.43 341 1274 5 258 0 22 15 21 100 010-50B 50 434 7.81 358 1377 6 271 0 18 8 17 100 02-100-A 100 1254 7.01 1050 1229 6 260 14 16 18 21 89 03-100-A 100 1239 7.27 1109 1401 15 267 2 11 7 18 98 14-100-A 100 1239 6.81 962 1486 6 281 0 22 1 14 100 0
Initial Final RemovedCa++ Conc. Final conc. ppm %

86
Table D1 Cont’d: AAR from SJ with varying Defecant Concentration and pH (Set 1)
Formed
Exp code % Sto. ppm pH Ca++ A.A. A.A.cis SO4-- PO4
--- Ca++ A.A SO4-- PO4
--- AACF4-100-B 100 1211 6.89 405 1302 9 267 0 67 13 18 100 16-100-A 100 1214 7.25 914 1348 15 236 0 25 10 28 100 16-100-B 100 1219 7.08 1028 1385 20 234 0 16 8 28 100 17-100-A 100 1213 8.16 586 1405 15 249 0 52 6 24 100 17-100-B 100 1238 7.46 891 1400 26 84 0 28 7 74 100 29-100-A 100 1248 7.27 612 1267 4 263 0 51 16 20 100 010-100-A 100 1216 7.17 937 1315 7 246 0 23 12 25 100 010-100-B 100 1219 7.26 1041 1323 8 245 0 15 12 25 100 111-150-A 150 1618 7.20 1481 1422 54 265 29 8 5 19 78 411-150-B 150 1610 7.35 1425 1425 19 281 0 12 5 14 100 112-150-A 150 1631 7.81 1420 1471 11 321 55 13 2 2 58 113-150-A 150 1617 7.03 1469 1371 12 102 18 9 9 69 86 114-150-A 150 1606 7.70 1477 1337 9 266 19 8 11 19 86 114-150-B 150 1638 7.94 1479 1389 9 266 13 10 7 19 91 115-150-A 150 1609 7.25 1501 1455 10 301 22 7 3 8 84 115-150-B 150 1612 7.24 1442 1442 10 303 12 11 4 7 91 1
Initial Final RemovedCa++ Conc. Final conc. ppm %

87
Table D2: AAR from SJ with varying Defecant Concentration and pH (Set 2)
FormedMg++ pH
Exp code % Sto. ppm ppm Ca++ Mg++ A.A. AA cis SO4-- PO4
--- Ca++ Mg++ A.A SO4-- PO4
--- AACF19-50-A 50 456 219 7.25 375 140 1246 174 320 54 18 36 5 3 67 1220-50-A 50 450 227 7.35 344 136 1291 175 314 68 24 40 2 5 58 1220-50-B 50 446 223 7.14 348 144 1220 178 321 50 22 35 7 3 69 921-50-A 50 448 232 7.14 373 157 1037 131 275 57 17 32 22 17 65 1221-50-B 50 445 237 7.52 382 153 1020 175 294 57 14 36 20 11 65 1922-50-A 50 462 222 7.34 370 133 1094 283 278 47 20 40 8 16 71 1922-50-B 50 453 236 7.38 346 131 1069 290 299 43 24 44 9 10 74 1023-50-A 50 447 235 7.45 305 134 1176 150 292 24 32 43 12 12 85 1123-50-B 50 454 236 7.25 391 161 1157 161 296 30 14 32 12 10 82 1124-50-A 50 439 218 7.33 303 216 1155 159 299 25 31 1 12 10 84 1124-50-B 50 461 219 7.50 364 187 1159 164 296 54 21 15 12 11 67 1225-50-A 50 452 228 8.00 354 152 1302 176 290 0 22 33 1 12 100 1125-50-B 50 464 220 7.95 390 198 1272 170 266 0 16 10 4 20 100 1226-50-A 50 448 232 8.02 364 187 1082 174 294 26 19 19 16 11 84 1027-50-A 50 472 238 7.99 300 197 1167 149 277 50 36 17 12 16 69 1027-50-B 50 469 222 8.04 281 198 1128 154 265 51 40 11 15 20 69 1128-50-A 50 482 235 8.05 347 221 1158 160 262 43 28 6 12 21 74 1028-50-B 50 450 236 8.06 378 201 1140 154 265 47 16 15 14 20 71 629-50-A 50 476 216 8.00 270 103 1204 97 315 0 43 52 13 5 100 729-50-B 50 464 227 8.03 368 152 1200 104 312 0 21 33 13 6 100 1419-100-A 100 852 443 7.25 815 349 1177 211 325 75 4 21 7 2 54 1319-100-B 100 859 449 7.42 768 331 1090 201 326 66 11 26 14 1 60 1420-100-A 100 866 449 7.35 780 360 1127 205 306 70 10 20 11 8 57 1520-100-B 100 865 448 7.14 788 355 1214 219 319 80 9 21 4 3 51 1421-100-A 100 868 460 7.01 807 378 1025 207 266 57 7 18 18 20 65 2122-100-A 100 852 435 7.34 804 332 1175 311 296 38 6 24 1 11 77 21
Initial Final RemovedCa++ Conc. Final conc. ppm %

88
Table D2 Cont’d: AAR from SJ with varying Defecant Concentration and pH (Set 2)
FormedMg++ pH
Exp code % Sto. ppm ppm Ca++ Mg++ A.A. AA cis SO4-- PO4
--- Ca++ Mg++ A.A SO4-- PO4
--- AACF22-100-B 100 883 441 7.38 783 331 1086 312 307 34 11 25 7 7 79 1123-100-A 100 839 455 7.45 746 360 1098 171 296 45 11 21 15 10 72 1123-100-B 100 847 451 7.25 747 367 1119 172 304 31 12 19 14 8 81 1224-100-A 100 857 454 7.33 796 406 1187 173 304 28 7 11 9 8 83 1124-100-B 100 849 446 7.50 703 371 1159 169 329 0 17 17 12 0 100 1325-100-A 100 848 446 8.00 753 417 1231 202 279 0 11 6 4 15 100 1025-100-B 100 888 422 7.95 750 415 1267 144 291 0 16 2 6 12 100 1326-100-A 100 849 455 8.02 804 418 1119 189 292 0 5 8 13 12 100 1226-100-B 100 854 438 7.97 751 396 1060 176 279 3 12 10 18 16 98 1127-100-A 100 867 456 7.99 804 399 1091 162 286 41 7 12 16 13 75 1127-100-B 100 885 452 8.04 678 409 1090 165 264 44 23 10 16 20 73 1128-100-A 100 843 476 8.05 751 393 1147 167 269 0 11 17 12 19 100 1228-100-B 100 886 450 8.06 784 377 1156 179 261 0 12 16 11 21 100 829-100-A 100 888 462 8.00 726 373 1134 122 329 0 18 19 16 1 100 829-100-B 100 847 444 8.03 749 321 1134 124 326 0 12 28 16 1 100 1319-150-A 150 1267 668 7.34 1191 550 1112 198 289 62 6 18 13 12 62 1319-150-B 150 1252 663 7.25 1176 531 1048 202 291 52 6 20 17 12 68 1420-150-A 150 1302 665 7.85 1276 585 1139 213 311 86 2 12 10 6 48 1320-150-B 150 1306 662 7.35 1235 565 1011 192 305 83 5 15 20 8 50 1921-150-A 150 1286 660 7.98 1245 395 1070 288 293 54 3 40 9 11 67 1921-150B 150 1275 689 7.12 1223 589 1038 289 301 44 4 14 12 9 73 2422-150-B 150 1301 667 7.50 1215 515 1067 365 307 32 7 23 5 7 80 1223-150-A 150 1267 674 7.54 1202 600 1092 179 300 0 5 11 15 9 100 1223-150-B 150 1261 677 7.32 1212 631 1070 187 303 39 4 7 16 8 76 1124-150-A 150 1266 667 7.31 1222 618 1112 169 328 26 3 7 15 1 84 1224-150-B 150 1279 665 7.32 1254 630 1116 179 321 32 2 5 14 3 80 1225-150-A 150 1305 678 7.95 1175 615 1186 174 273 0 10 9 9 17 100 1225-150-B 150 1329 676 7.99 1232 614 1191 186 299 0 7 9 8 9 100 1226-150-A 150 1281 692 7.95 1224 639 985 173 280 0 4 8 23 15 100 1226-150-B 150 1278 667 7.93 1125 644 1028 175 271 0 12 4 20 18 100 1227-150-A 150 1323 676 8.03 1302 635 1088 177 263 90 2 6 16 20 45 1227-150-B 150 1310 673 8.00 1262 637 1090 182 270 40 4 5 15 18 76 1228-150-A 150 1265 694 8.00 1201 592 1150 180 288 0 5 15 11 13 100 1128-150-B 150 1241 625 8.03 1101 598 1108 170 262 0 11 4 15 21 100 929-150-A 150 1319 665 8.03 1250 626 1096 133 329 0 5 6 18 0 100 829-150-B 150 1323 680 8.00 1234 611 1092 126 330 0 7 10 19 0 100 0
Initial Final RemovedCa++ Conc. Final conc. ppm %

89
Table D3: AAR from CSJ with varying Calcium Defecant Concentration and pH (Set 3)
Formed
Exp code % Sto. ppm pH Ca++ A.A.trans. A.A. cis. SO4-- PO4
--- Ca++ A.A SO4-- PO4
--- AACF36-50-A 50 2095 8.1 1032 3247 525 761 146 51 37 42 78 936-50-B 50 2079 8.1 1944 4188 1255 850 233 7 9 36 64 2137-50-A 50 2096 9.0 1349 4517 813 924 0 36 11 30 100 1437-50-B 50 2100 8.0 1349 4258 1173 474 0 36 9 64 100 2038-50-A 50 2051 8.5 1382 4326 1001 907 0 33 11 31 100 1747-50-A 50 2077 6.5 1022 2978 834 840 56 51 36 37 91 1447-50-B 50 2094 6.7 1202 3116 785 1097 169 43 35 17 74 1348-50-A 50 2116 7.0 974 4120 169 1147 179 54 29 13 73 348-50-B 50 2120 9.6 1050 3902 469 1160 161 50 27 12 75 836-100-A 100 4181 8.1 2834 3156 773 737 0 32 35 44 100 1336-100-B 100 4159 8.1 3326 3618 1169 859 203 20 20 35 69 1937-100-A 100 4161 8.0 3478 4441 917 725 0 16 11 45 100 1537-100-B 100 4170 8.1 2850 3880 1065 465 0 32 18 65 100 1838-100-A 100 4192 8.5 2895 3890 956 556 0 31 19 58 100 1647-100-A 100 4183 7.0 2930 2946 759 1070 161 30 38 19 75 1347-100-B 100 4178 7.0 2762 3045 812 1076 167 34 36 19 75 1448-100-A 100 4178 6.8 2316 3887 197 1160 197 45 32 12 70 348-100-B 100 4145 7.0 2569 3834 187 1133 187 38 33 14 71 336-150A 150 6239 7.9 4612 3267 1020 744 154 26 29 44 76 1736-150-B 150 6210 7.8 4445 3247 1048 768 129 28 28 42 80 1737-150-A 150 6260 8.2 4731 4288 1203 544 0 24 8 59 100 2037-150-B 150 6225 7.9 4636 4239 1051 529 0 26 12 60 100 1838-150-A 150 6211 8.5 4884 3663 1083 386 0 21 21 71 100 1847-150-A 150 6128 6.8 3879 2961 821 1099 156 37 37 17 76 1447-150-B 150 6129 7.1 4258 2976 852 1070 157 31 36 19 76 1448-150-A 150 6236 8.9 4236 3267 505 1108 0 32 37 16 100 848-150-B 150 6139 7.1 4158 3630 201 1132 0 32 36 14 100 3
RemovedFinalInitialCa++ Conc. PPM %

90
Table D4: AAR from CSJ with varying Calcium + Magnesium Defecant Concentration and pH (Set 4)
FormedMg++ %
Exp code % Sto. ppm ppm pH Ca++ Mg++ A.A. cis A.A.trans SO4-- PO4
--- Ca++ Mg++ A.A SO4-- PO4
--- AACF40-50-A 50 2075 2858 8.01 1147 2288 887 3630 1080 74 45 20 25 18 89 1541-50-A 50 2105 2904 7.95 1340 2111 974 3212 1089 156 36 27 30 17 76 1641-50-B 50 2136 2933 7.93 1304 2083 932 3004 1016 152 39 29 34 23 77 1642-50-A 50 2142 2856 6.81 1633 2434 981 3734 1168 168 24 15 21 12 74 1642-50-B 50 2168 2856 6.96 1351 2138 1028 3587 1092 179 38 25 23 17 73 1743-50-A 50 2065 2851 7.51 1549 2336 821 2960 1064 203 25 18 37 19 69 1443-50-B 50 2126 2847 7.50 1676 2466 907 3119 1129 207 21 13 33 14 68 1544-50-A 50 2152 2864 7.64 1247 1986 365 3960 1134 413 42 31 28 14 37 644-50-B 50 2152 2841 9.22 1377 2268 597 3639 1157 420 36 20 29 12 36 1045-50-A 50 2149 2927 8.56 1315 2308 527 3651 1137 337 39 21 30 14 49 945-50-B 50 2172 2914 6.66 1210 2261 281 3935 1082 311 44 22 30 18 53 540-100-A 100 4257 5667 7.91 2997 4105 1019 2784 914 88 30 28 37 31 87 1741-100-A 100 4107 5713 7.89 2702 3584 958 2728 1024 202 34 37 39 22 69 1641-100-B 100 4400 5674 8.01 2786 3762 975 2766 990 245 37 34 38 25 63 1642-100-A 100 4137 5831 6.67 2947 4490 969 3472 1049 152 29 23 26 21 77 1642-100-B 100 4146 5951 6.86 3143 4786 1037 3456 1164 195 24 20 25 12 70 1743-100-A 100 4214 5764 7.45 2883 4170 879 2810 1068 203 32 28 39 19 69 1543-100-B 100 4069 5718 7.40 2935 4125 897 2813 1086 189 28 28 38 18 71 1544-100-A 100 4202 5704 8.83 3220 4543 383 3237 1077 437 23 20 40 18 33 644-100-B 100 4198 5720 8.47 2890 4201 704 3754 1098 541 31 27 26 17 18 1245-100-A 100 4150 5763 6.69 2750 4454 248 3763 1075 369 34 23 33 19 44 445-100-B 100 3384 5833 7.75 2638 4320 417 3719 1072 366 22 26 31 19 44 741-150-A 150 6264 8639 7.97 3926 5146 992 2602 1003 340 37 40 40 24 48 1741-150-B 150 6296 8478 7.91 3983 5704 1043 2870 952 489 37 33 35 28 26 1742-150-A 150 6210 8544 6.64 4756 6788 1010 3196 1059 183 23 21 30 20 72 1742-150-B 150 6367 8654 6.63 4671 6626 1005 3180 1070 186 27 23 30 19 72 1743-150-A 150 6028 8646 7.42 3776 5639 873 2550 976 214 37 35 43 26 67 1543-150-B 150 6045 8730 7.44 4118 6004 630 2647 1046 243 32 31 45 21 63 1144-150-A 150 6233 8573 8.69 5050 6545 759 2862 1134 201 19 24 40 14 69 1344-150-B 150 6245 8639 8.47 4207 6061 362 3295 1102 233 33 30 39 17 65 645-150-A 150 6232 8484 7.12 4357 6506 510 3453 1033 328 30 23 34 22 50 845-150-B 150 6214 8614 6.37 4413 6776 346 3672 1028 327 29 21 33 22 50 6
Initial Final RemovedCa++ Conc. Final conc. ppm %

91
Table D5: Temperature Effects on AAR (Set 5)
Initial Final Removed Formed Ca++ Mg++ Temp pH Final conc. ppm %
Exp code ppm ppm oC Ca++ Mg++ AA cis A.A. trans SO4-- PO4
--- Ca++ Mg++ A.A SO4-- PO4
--- AACF
57-100-A2 1041 1451 75 7.59 904 1341 204 1267 360 48 13 8 2 0 73 7 57-100-B2 1059 1511 75 7.45 848 1276 156 1024 276 36 20 16 21 23 79 14 57-100-C1 1137 1537 75 7.44 861 1294 142 1100 295 38 24 16 17 18 78 10 58-100-A1 1079 1447 75 7.48 872 1221 172 1165 322 47 19 16 11 10 73 0 58-100-A2 1071 1429 75 7.49 890 1240 176 1229 335 47 17 13 6 6 73 11 58-100-B1 1067 1477 75 7.47 898 1303 203 1228 346 46 16 12 5 3 74 12 58-100-B2 1100 1439 75 7.47 854 1190 197 1195 342 47 22 17 7 4 73 14 58-100-C1 1067 1431 75 7.48 885 1309 220 1202 347 47 17 9 5 3 73 13 58-100-C2 1057 1461 75 7.50 944 1386 226 1219 356 46 11 5 4 0 73 15 59-100-A1 1098 1485 75 7.48 876 1249 142 1025 271 33 20 16 7 6 76 6 59-100-A2 1105 1428 75 7.50 887 1208 175 984 267 33 20 15 7 7 77 9 59-100-B1 1072 1450 75 7.48 932 1344 164 1020 272 32 13 7 5 6 77 12 59-100-B2 1110 1433 75 7.47 937 1304 181 1004 273 32 16 9 5 5 78 11 59-100-C1 1100 1417 75 7.48 929 1273 186 1061 288 32 16 10 0 0 78 12 60-100-A1 1140 1394 35 7.58 930 1199 95 1247 314 41 18 14 11 3 73 7 60-100-B1 1085 1431 35 7.47 913 1293 93 1215 309 40 16 10 13 4 74 6 60-100-B2 1086 1430 35 7.49 865 1220 95 1211 315 49 20 15 13 2 68 6 60-100-C1 1063 1433 35 7.57 840 1243 94 1261 323 37 21 13 10 0 76 6 61-100-B2 1073 1461 35 7.45 970 1360 60 802 209 34 10 7 4 5 70 5 61-100-C1 1084 1495 35 7.56 1002 1429 56 815 210 32 8 4 3 5 72 4 61-100-C2 1137 1431 35 7.48 1030 1343 56 821 212 35 9 6 2 4 69 4 62-100-A1 1066 1429 95 7.41 869 1207 197 984 274 40 19 16 21 23 73 6 62-100-A2 1104 1431 95 7.42 1001 1205 377 1048 328 65 9 16 5 8 57 13 62-100-B1 1081 1483 95 7.43 990 1398 309 951 284 41 8 6 16 20 73 25 62-100-B2 1092 1420 95 7.47 1060 1414 364 950 302 60 3 0 12 15 60 21 62-100-C1 1107 1452 95 7.41 1064 1495 355 959 355 51 4 0 12 0 66 24 62-100-C2 1081 1520 95 7.43 1012 1393 352 950 297 47 6 8 13 16 68 24 63-100-B1 1073 1469 95 7.51 714 1038 360 1141 345 73 33 29 0 1 50 0 63-100-C1 1105 1439 95 7.45 707 989 373 1119 349 69 36 31 1 0 52 23 63-100-C2 1091 1435 95 7.44 687 904 332 1007 313 51 37 37 11 10 65 25

92
Table D6: SJ Trials with varying Times and all other Variables Fixed (Set 6)
Initial Conditions Final Removed Concentration Temp. pH Time Ca++ Mg++ Final conc. ppm % %
Exp code g/100ml % Defc oC min ppm ppm Ca++ Mg++ A.A. cis A.A. SO4
-- PO4--- Ca++ Mg++ A.A SO4
-- PO4--- AACF
64-100-A1 15 100 95 7.45 25 1077 1430 941 1325 293 993 309 41 13 7 14 6 73 20 64-100-A2 15 100 95 7.46 25 1101 1477 1021 1431 314 989 314 38 7 3 13 5 74 21 64-100-B1 15 100 95 7.46 25 1085 1434 950 1292 282 1004 312 37 12 10 14 5 75 19 64-100-B2 15 100 95 7.51 25 1124 1428 995 1299 295 971 307 38 11 9 16 7 75 20 64-100-C1 15 100 95 7.47 25 1102 1433 976 1333 274 961 295 35 11 7 18 10 76 18 64-100-C2 15 100 95 7.61 25 1135 1440 1045 1363 284 959 301 35 8 5 17 9 76 19 65-100-A1 15 100 95 7.45 60 1077 1430 938 1328 309 1051 319 52 13 7 9 3 66 21 65-100-A2 15 100 95 7.46 60 1101 1477 1011 1434 322 1030 321 47 8 3 10 3 69 21 65-100-B1 15 100 95 7.46 60 1085 1434 944 1298 287 1046 315 43 13 9 11 5 72 19 65-100-B2 15 100 95 7.51 60 1124 1428 978 1293 288 1027 311 40 13 9 12 6 73 19 65-100-C1 15 100 95 7.47 60 1102 1433 964 1345 289 1013 310 40 12 6 13 6 73 19 65-100-C2 15 100 95 7.61 60 1135 1440 1043 1374 297 1042 326 66 8 5 11 1 56 20 66-100-A1 15 100 95 7.45 90 1077 1430 959 1347 322 1042 326 66 11 6 9 1 56 21 66-100-A2 15 100 95 7.46 90 1101 1477 1042 1462 336 1016 321 52 5 1 10 3 66 22 66-100-B1 15 100 95 7.46 90 1085 1434 975 1344 290 1016 314 46 10 6 13 5 69 19 66-100-B2 15 100 95 7.51 90 1124 1428 994 1309 316 1009 314 46 12 8 12 5 69 21 66-100-C1 15 100 95 7.47 90 1102 1433 965 1319 293 1021 314 43 12 8 12 5 71 20 66-100-C2 15 100 95 7.61 90 1135 1440 1079 1376 305 1026 321 49 5 4 11 3 67 20
Average 7.49 1104 1440 Standard deviation 0.06 20 17

93
Table D7: AAR from CSJ and SJ across all Parameters at all Levels (Set 7)
FormedCa++ Mg++
Exp code Brix Sto Temp pH Def ppm ppm Ca++ Mg++ A.A.trans A.A. cis SO4-- PO4
--- CaR MgR AAR SOR POR AACF68-50-A 15 50 75 6.5 Ca 578 _ 392 _ 1302 145 338 35 32 _ 3 2 79 1068-50-B 15 50 75 7.0 Ca 618 _ 375 _ 1253 201 341 32 39 _ 3 1 81 1368-50-C 15 50 75 7.5 Ca 530 _ 361 _ 1341 130 350 31 32 _ 2 0 82 968-50-D 15 50 75 8.0 Ca 572 _ 352 _ 1251 189 330 32 38 _ 4 4 81 1368-100-A 15 100 75 6.5 Ca 1084 _ 856 _ 1110 191 276 21 21 _ 13 20 87 1368-100-B 15 100 75 7.0 Ca 1098 _ 639 _ 1099 187 280 15 42 _ 14 19 91 1268-100-CR 15 100 75 7.5 Ca 1101 _ 985 _ 1113 83 272 26 10 _ 20 17 85 668-100-CR 15 100 75 7.5 Ca 1119 _ 1074 _ 1144 79 277 24 4 _ 18 16 86 568-100-DR 15 100 75 8.0 Ca 1175 _ 1115 _ 1062 260 302 25 5 _ 12 8 85 1768-150-A 15 150 75 6.5 Ca 1609 _ 1284 _ 1125 167 299 25 20 _ 14 13 85 1168-150-B 15 150 75 7.0 Ca 1558 _ 1214 _ 1029 99 273 15 22 _ 25 21 91 769-50-A 15 50 75 6.5 CaMg 548 744 514 747 1226 204 329 88 6 0 5 5 48 1469-50-B 15 50 75 7.0 CaMg 557 722 461 649 1198 197 320 55 17 10 7 7 67 1369-50-C 15 50 75 7.5 CaMg 545 731 415 561 1161 186 316 47 24 23 10 8 72 1269-50-D 15 50 75 8.0 CaMg 575 722 443 637 1148 191 313 40 23 12 11 9 76 1369-150-C 15 150 75 7.5 Ca 1559 _ 1137 _ 1102 167 300 24 27 _ 15 13 86 1169-150-D 15 150 75 8.0 Ca 1563 _ 511 _ 1120 190 309 15 67 _ 13 10 91 1370-50-E 15 50 35 6.5 Ca 522 _ 400 _ 1248 20 289 98 23 _ 15 15 42 170-50-F 15 50 35 7.0 Ca 554 _ 398 _ 1265 19 302 58 28 _ 14 11 66 170-50-G 15 50 35 7.5 Ca 558 _ 416 _ 1301 21 307 54 25 _ 12 9 68 170-50-H 15 50 35 8.0 Ca 528 _ 390 _ 1316 18 307 41 26 _ 11 9 76 170-100-A 15 100 75 6.5 CaMg 1063 1437 952 1387 1114 269 322 49 10 3 8 5 71 1870-100-B 15 100 75 8.0 CaMg 1081 1440 899 1300 1115 201 298 39 17 10 12 12 77 1370-100-C 15 100 75 7.5 CaMg 1075 1422 960 1326 1162 144 298 40 11 7 13 12 77 1070-100-D 15 100 75 7.0 CaMg 1101 1448 870 1197 1008 360 312 30 21 17 9 8 82 24
Final RemovedFinal conc. ppm
Initial%

94
Table D7 Cont’d: AAR from CSJ and SJ across all Parameters at all Levels (Set 7)
FormedCa++ Mg++
Exp code Brix Sto Temp pH Def ppm ppm Ca++ Mg++ A.A.trans A.A. cis SO4-- PO4
--- CaR MgR AAR SOR POR AACF70-100-E 15 100 35 6.5 Ca 1043 _ 808 _ 1222 20 291 68 23 _ 17 14 60 170-100-F 15 100 35 7.0 Ca 1054 _ 803 _ 1096 17 260 46 24 _ 26 23 73 170-100-G 15 100 35 7.5 Ca 1051 _ 809 _ 1227 20 291 39 23 _ 17 14 77 170-100-H 15 100 35 8.0 Ca 1041 _ 771 _ 1269 21 300 33 26 _ 14 11 80 170-150-A 15 150 75 6.5 CaMg 1598 2179 1363 1937 1120 243 311 54 15 11 9 8 68 1670-150-B 15 150 75 7.5 CaMg 1571 2158 1376 1975 1127 193 301 41 12 9 12 11 76 1370-150-C 15 150 75 7.0 CaMg 1575 2166 1450 2074 1110 189 300 44 8 4 13 11 74 1370-150-D 15 150 75 8.0 CaMg 1561 2166 1335 2032 1120 196 307 39 15 6 12 9 77 1370-150-E 15 150 35 6.5 Ca 1559 _ 1289 _ 1244 21 297 47 17 _ 16 12 72 170-150-F 15 150 35 7.0 Ca 1583 _ 1446 _ 1212 21 294 78 9 _ 18 13 54 170-150-G 15 150 35 7.5 Ca 1549 _ 1266 _ 1150 13 274 73 18 _ 22 19 57 170-150-H 15 150 35 8.0 Ca 1562 _ 1414 _ 1251 13 294 68 10 _ 16 13 60 171-50-E 15 50 35 6.5 CaMg 580 731 538 660 1279 24 292 149 7 10 13 12 10 271-50-F 15 50 35 7.0 CaMg 527 710 499 676 1272 24 290 109 5 5 14 13 34 271-50-GR1 15 50 35 7.5 CaMg 514 718 501 747 1191 19 265 48 3 0 19 12 68 171-50-H 15 50 35 8.0 CaMg 521 712 458 687 1215 16 285 51 12 3 18 14 69 171-100-E 15 100 35 6.5 CaMg 1064 1437 881 1191 1094 15 244 100 17 17 26 27 39 171-100-F 15 100 35 7.0 CaMg 1056 1421 727 1438 1119 16 252 74 31 0 24 24 55 171-100-G 15 100 35 7.5 CaMg 1040 1344 678 926 1140 17 261 48 35 31 23 22 71 171-100-H 15 100 35 8.0 CaMg 1058 1438 712 1021 1176 16 272 36 33 29 21 18 78 171-150-E 15 150 35 6.5 CaMg 1579 2143 992 906 1204 14 271 123 37 58 19 19 26 171-150-F 15 150 35 7.0 CaMg 1592 2162 1089 993 1211 18 279 68 32 54 18 16 59 171-150-G 15 150 35 7.5 CaMg 1583 2207 1107 1555 1194 18 280 46 30 30 19 16 72 171-150-G-R 15 150 35 7.5 CaMg 1595 2141 1389 1889 1203 19 285 48 13 12 19 14 71 171-150-H 15 150 35 8.0 CaMg 1596 2141 1476 1943 1262 18 292 32 8 9 15 12 81 172-50-A 15 50 95 6.5 Ca 519 _ 324 _ 1132 241 325 31 38 _ 8 2 81 1672-50-B 15 50 95 7.0 Ca 521 _ 351 _ 1051 263 308 29 33 _ 12 8 82 18
Initial Final RemovedFinal conc. ppm %

95
Table D7 Cont’d: AAR from CSJ and SJ across all Parameters at all Levels (Set 7)
FormedCa++ Mg++
Exp code Brix Sto Temp pH Def ppm ppm Ca++ Mg++ A.A.trans A.A. cis SO4-- PO4
--- CaR MgR AAR SOR POR AACF72-50-C 15 50 95 7.5 Ca 521 _ 343 _ 1146 161 301 29 34 _ 13 10 82 1172-50-DR1 15 50 95 8.0 Ca 516 _ 400 _ 1108 241 279 15 23 _ 10 7 90 1672-50-DR2 15 50 95 8.0 Ca 510 _ 440 _ 1082 304 285 15 14 _ 8 5 90 2072-100-A 15 100 95 6.5 Ca 1057 _ 824 _ 1082 234 311 29 22 _ 12 7 82 1672-100-B 15 100 95 7.0 Ca 1048 _ 820 _ 1061 272 311 23 22 _ 11 7 86 1872-100-C 15 100 95 7.5 Ca 1078 _ 920 _ 1042 330 322 21 15 _ 9 3 87 2272-100-D 15 100 95 8.0 Ca 1053 _ 941 _ 880 299 277 22 11 _ 21 17 87 2072-150-A 15 150 95 6.5 Ca 1565 _ 1484 _ 923 293 282 21 5 _ 19 15 87 2072-150-B 15 150 95 8.0 Ca 1559 _ 1380 _ 1063 260 306 21 11 _ 12 8 87 1772-150-C 15 150 95 7.5 Ca 1564 _ 1248 _ 978 299 298 21 20 _ 15 11 87 2072-150-D 15 150 95 7.0 Ca 1601 _ 1287 _ 809 154 224 20 20 _ 36 33 87 1073-50-A 15 50 95 6.5 CaMg 569 732 463 618 1107 299 318 36 19 16 6 5 78 2073-50-B 15 50 95 7.5 CaMg 571 711 486 650 1066 305 312 29 15 9 9 6 82 2073-50-C 15 50 95 7.0 CaMg 536 723 464 671 1006 327 304 30 13 7 11 9 81 2273-50-D 15 50 95 8.0 CaMg 534 711 468 661 1020 385 323 33 12 7 6 3 80 2673-100-AR 15 100 95 6.5 CaMg 1050 1442 915 1315 999 332 296 34 13 9 11 1 77 2273-100-AR 15 100 95 6.5 CaMg 1057 1435 925 1327 1044 336 281 28 12 8 8 6 81 2273-100-B 15 100 95 7.0 CaMg 1044 1446 927 1324 949 358 299 31 11 8 13 10 81 2473-100-C 15 100 95 7.5 CaMg 1071 1455 983 1375 1021 322 302 26 8 5 10 10 84 2173-100-D 15 100 95 7.9 CaMg 1047 1449 1036 1473 1054 407 333 41 1 0 3 0 75 2773-150-A 15 150 95 6.5 CaMg 1584 2117 1183 1626 1074 251 300 28 25 23 12 10 83 17
Initial Final RemovedFinal conc. ppm %

96
Table D7 Cont’d: AAR from CSJ and SJ across all Parameters at all Levels (Set 7)
FormedCa++ Mg++
Exp code Brix Sto Temp pH Def ppm ppm Ca++ Mg++ A.A.trans A.A. cis SO4-- PO4
--- CaR MgR AAR SOR POR AACF73-150-B 15 150 95 7.0 CaMg 1574 2134 1649 2339 1050 333 316 27 0 0 8 5 84 2273-150-C 15 150 95 7.5 CaMg 1540 2135 1464 2118 1046 344 315 25 5 1 7 6 85 2373-150-D 15 150 95 7.9 CaMg 1552 2224 1449 2147 1163 162 296 23 7 3 12 11 86 1174-50-A 60 50 75 6.5 Ca 2082 _ 1163 _ 4329 359 1134 168 44 _ 22 14 75 674-50-B 60 50 75 7.5 Ca 2085 _ 1163 _ 3313 407 930 127 44 _ 38 30 81 774-50-C 60 50 75 7.0 Ca 2093 _ 1110 _ 4115 279 1091 135 47 _ 27 17 80 574-50-D 60 50 75 8.0 Ca 2082 _ 1210 _ 3905 356 1064 133 42 _ 29 19 80 674-100-A 60 100 75 7.0 Ca 4171 _ 2842 _ 3099 326 804 88 32 _ 43 39 87 574-100-B 60 100 75 6.5 Ca 4152 _ 2739 _ 3238 395 852 93 34 _ 39 35 86 774-100-C 60 100 75 8.0 Ca 4104 _ 2769 _ 3461 483 904 88 33 _ 34 32 87 874-100-D 60 100 75 7.5 Ca 4130 _ 2745 _ 3423 491 903 98 34 _ 35 32 85 874-150-A 60 150 75 6.5 Ca 6261 _ 4321 _ 3522 462 907 89 31 _ 34 31 87 874-150-B 60 150 75 7.5 Ca 6219 _ 4230 _ 3604 520 1047 121 32 _ 31 21 82 974-150-C 60 150 75 7.0 Ca 6283 _ 3992 _ 3346 669 1009 135 36 _ 33 24 80 1174-150-D 60 150 75 8.0 Ca 6197 _ 4093 _ 3495 483 966 55 34 _ 34 27 92 875-50-A 60 50 75 6.5 CaMg 2077 2833 1441 2174 3751 659 974 73 31 23 26 26 89 1175-50-B 60 50 75 7.0 CaMg 2108 2882 1497 2362 3831 705 1004 69 29 18 24 24 90 1275-50-C 60 50 75 7.5 CaMg 2078 2891 1330 2062 3040 628 823 69 36 29 39 38 90 1075-50-D 60 50 75 8.0 CaMg 2097 2863 1437 2205 3495 956 997 64 32 23 26 24 91 1675-100-A 60 100 75 6.5 CaMg 4215 5709 2849 4097 3388 913 977 80 32 28 28 26 88 1575-100-B 60 100 75 7.0 CaMg 4221 5681 3071 4382 3478 900 982 70 27 23 27 26 90 1575-100-C 60 100 75 8.0 CaMg 4175 5702 3004 4320 3724 594 980 68 28 24 28 26 90 1075-100-D 60 100 75 7.5 CaMg 4189 5653 2816 4027 3234 697 892 64 33 29 34 32 90 1275-150-A 60 150 75 7.0 CaMg 6236 8555 5037 7108 3982 522 1012 67 19 17 25 24 90 975-150-B 60 150 75 6.5 CaMg 6273 8556 4484 6443 3665 538 955 68 29 25 30 28 90 975-150-C 60 150 75 7.5 CaMg 6292 8575 4394 6245 3635 612 958 82 30 27 29 28 87 10
Initial Final RemovedFinal conc. ppm %
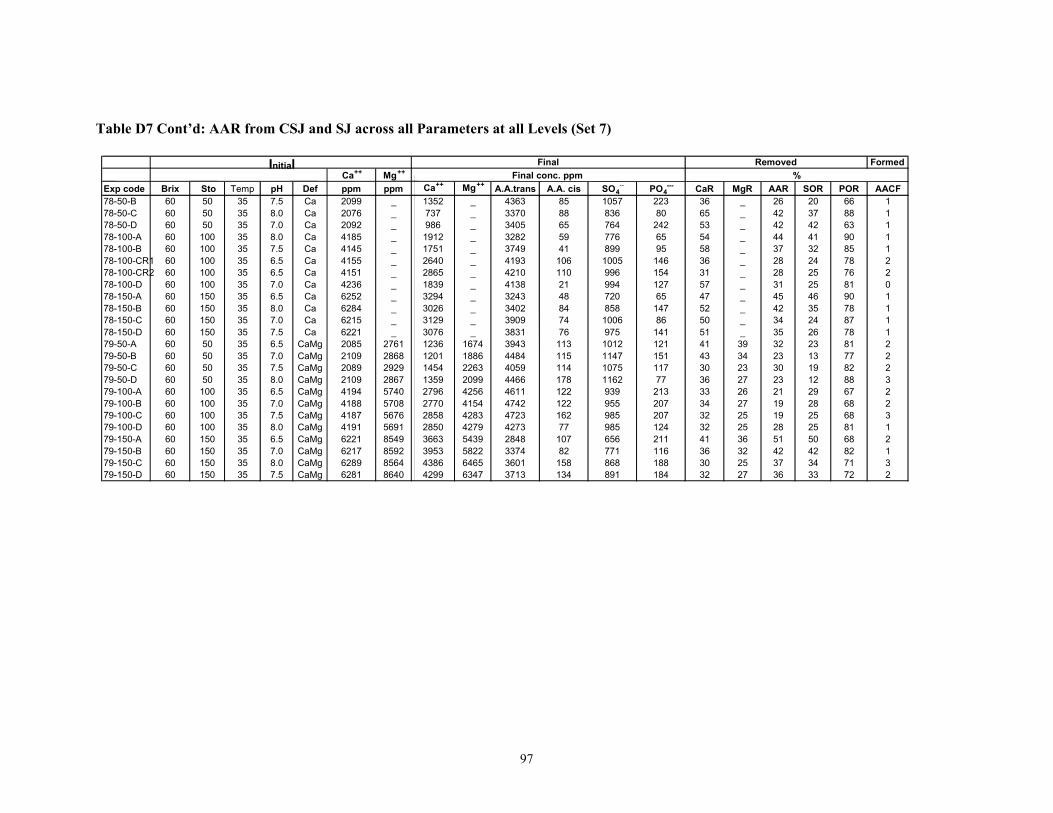
97
Table D7 Cont’d: AAR from CSJ and SJ across all Parameters at all Levels (Set 7)
_ 3243 48 720 65 47 _ 45 46 90 1 78-150-B 60 150 35 8.0 Ca 6284 _ 3026 _ 3402 84 858 147 52 _ 42 35 78 1 78-150-C 60 150 35 7.0 Ca 6215 _ 3129 _ 3909 74 1006 86 50 _ 34 24 87 1 78-150-D 60 150 35 7.5 Ca 6221 _ 3076 _ 3831 76 975 141 51 _ 35 26 78 1 79-50-A 60 50 35 6.5 CaMg 2085 2761 1236 1674 3943 113 1012 121 41 39 32 23 81 2 79-50-B 60 50 35 7.0 CaMg 2109 2868 1201 1886 4484 115 1147 151 43 34 23 13 77 2 79-50-C 60 50 35 7.5 CaMg 2089 2929 1454 2263 4059 114 1075 117 30 23 30 19 82 2 79-50-D 60 50 35 8.0 CaMg 2109 2867 1359 2099 4466 178 1162 77 36 27 23 12 88 3 79-100-A 60 100 35 6.5 CaMg 4194 5740 2796 4256 4611 122 939 213 33 26 21 29 67 2 79-100-B 60 100 35 7.0 CaMg 4188 5708 2770 4154 4742 122 955 207 34 27 19 28 68 2 79-100-C 60 100 35 7.5 CaMg 4187 5676 2858 4283 4723 162 985 207 32 25 19 25 68 3
60 100 35 8.0 CaMg 4191 5691 2850 4279 4273 77 985 124 32 25 28 25 81 1 79-150-A 60 150 35 6.5 CaMg 6221 8549 3663 5439 2848 107 656 211 41 36 51 50 68 2 79-150-B 60 150 35 7.0 CaMg 6217 8592 3953 5822 3374 82 771 116 36 32 42 42 82 1
60 150 35 8.0 CaMg 6289 8564 4386 6465 3601 158 868 188 30 25 37 34 71 3 60 150 35 7.5 CaMg 6281 8640 4299 6347 3713 134 891 184 32 27 36 33 72 2
Initial Final Removed Final conc. ppm %
Formed Ca ++ Mg ++
Exp code Brix Sto Temp pH Def ppm ppm Ca ++ Mg ++ A.A.trans A.A. cis SO 4 -- PO 4 --- CaR MgR AAR SOR POR AACF 78-50-B 60 50 35 7.5 Ca 2099 _ 1352 _ 4363 85 1057 223 36 _ 26 20 66 1 78-50-C 60 50 35 8.0 Ca 2076 _ 737 _ 3370 88 836 80 65 _ 42 37 88 1 78-50-D 60 50 35 7.0 Ca 2092 _ 986 _ 3405 65 764 242 53 _ 42 42 63 1 78-100-A 60 100 35 8.0 Ca 4185 _ 1912 _ 3282 59 776 65 54 _ 44 41 90 1 78-100-B 60 100 35 7.5 Ca 4145 _ 1751 _ 3749 41 899 95 58 _ 37 32 85 1 78-100-CR1 60 100 35 6.5 Ca 4155 _ 2640 _ 4193 106 1005 146 36 _ 28 24 78 2 78-100-CR2 60 100 35 6.5 Ca 4151 _ 2865 _ 4210 110 996 154 31 _ 28 25 76 2 78-100-D 60 100 35 7.0 Ca 4236 _ 1839 _ 4138 21 994 127 57 _ 31 25 81 0 78-150-A 60 150 35 6.5 Ca 6252 _ 3294
79-100-D
79-150-C 79-150-D

98
Table D8a: Raw Juice Trials at 35 oC
Table D8b: Raw Juice Trials at 95 oC
FormedMg++
Exp code % Sto. ppm ppm pH Ca++ Mg++ A.A. SO4-- PO4
--- Cis AA Ca++ Mg++ A.A SO4-- PO4
--- AACFCJ-A1 388 162 5.30 1162 455 183 49
51-50-A 50 914 876 6.59 798 867 1144 379 63 67 13 1 2 17 66 651-50-B 50 958 876 6.56 855 853 1147 374 58 57 11 3 1 18 68 5
51-100-A 100 1455 1662 6.52 1400 1233 1103 375 55 60 4 26 5 18 70 551-100-B 100 1544 1614 6.54 1417 1301 1079 370 62 70 8 19 7 19 66 651-150-A 150 1971 2448 6.59 1643 2143 1100 392 54 65 17 12 5 14 70 551-150-B 150 1993 2289 6.95 1876 1649 1076 387 63 69 6 28 7 15 66 653-50-A 50 512 665 7.48 501 616 740 310 10 72 2 7 32 42 92 1053-50-B 50 541 747 7.49 498 702 878 349 9 78 8 6 19 34 93 10
53-100-A 100 1019 1467 7.54 841 1081 837 344 9 81 17 26 23 35 93 1153-100-B 100 1076 1444 7.46 886 1097 836 349 9 87 18 24 23 34 93 1253-150-A 150 1622 2159 7.47 1246 1519 825 340 9 85 23 30 24 36 93 1153-150-B 150 1562 2203 7.56 1169 1492 844 350 8 89 25 32 22 34 94 1250-50-A 50 1007 878 7.96 772 765 622 352 46 74 23 13 46 23 75 650-50-B 50 1021 880 8.05 742 754 679 370 48 74 27 14 42 19 74 6
50-100-A 100 1498 1603 7.94 1255 1502 620 364 55 68 16 6 47 20 70 650-100-B 100 1504 1702 7.91 874 1078 436 266 59 53 42 37 62 42 68 450-150-B 150 2008 2335 7.94 1706 1988 653 369 0 81 15 15 44 19 100 7
Initial Final RemovedCa++ Conc. Final conc. ppm %
Form ed
Mg++
Exp code % Sto. ppm ppm pH Ca++ Mg++ A.A. SO4-- PO4
--- Cis AA Ca++ Mg++ A.A SO4-- PO4
--- AACFJUICE 998 748 1338 367 306 7184-100-A1 100 2582 748 7.45 1417 178 1223 337 28 55 45 76 13 8 91 084-100-A2 100 2582 748 7.45 1648 198 1279 381 36 65 36 74 9 0 88 084-100-B1 100 2549 748 7.45 1631 171 1259 352 37 60 36 77 11 4 88 084-100-B2 100 2549 748 7.45 1626 164 1265 347 33 59 36 78 10 5 89 084-100-C1 100 2571 748 7.48 1630 171 1270 358 34 59 37 77 10 3 89 084-100-C2 100 2571 748 7.48 1505 154 1251 350 33 58 41 79 11 5 89 0
Initial Final RemovedCa++ Conc. Final conc. ppm %
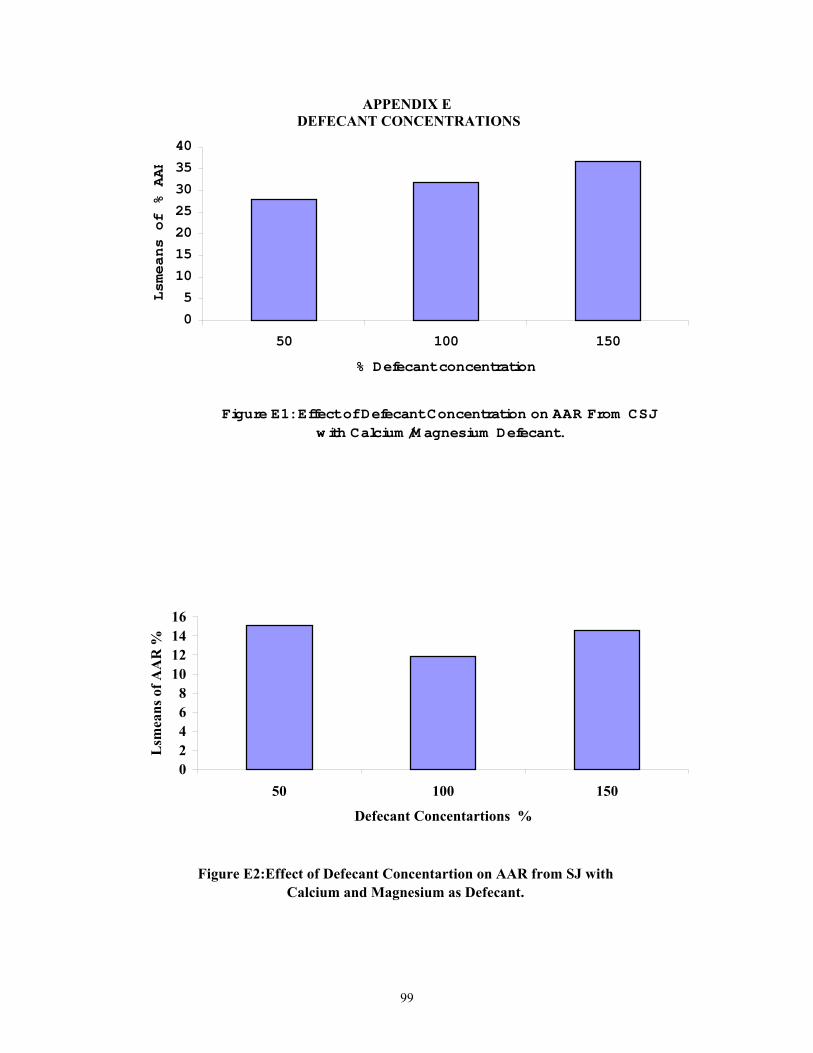
99
APPENDIX E DEFECANT CONCENTRATIONS
Figure E1: Effect of Defecant Concentration on AAR From CSJ w ith Calcium /M agnesium Defecant.
0
5
10
15
20
25
30
35
40
50 100 150
% Defecant concentration
Lsmeans of % AAR
Figure E2:Effect of Defecant Concentartion on AAR from SJ with Calcium and Magnesium as Defecant.
02468
10121416
50 100 150
Defecant Concentartions %
Lsm
eans
of A
AR
%

100
Figure E3: Effect of Defecant Concentration on AAR form CSJ with Calcium Defecant.
05
10152025303540
50 100 150
Defecant Concentrations %
Lsm
eans
of
% A
AR
Figure E4 :Effect of Defecant Concentartions on Aconitic acid Removal from SJ with Calcium as Defecant.
01234567
50 100 150
Defecant Concentrations %
Lsm
eans
of A
AR
%
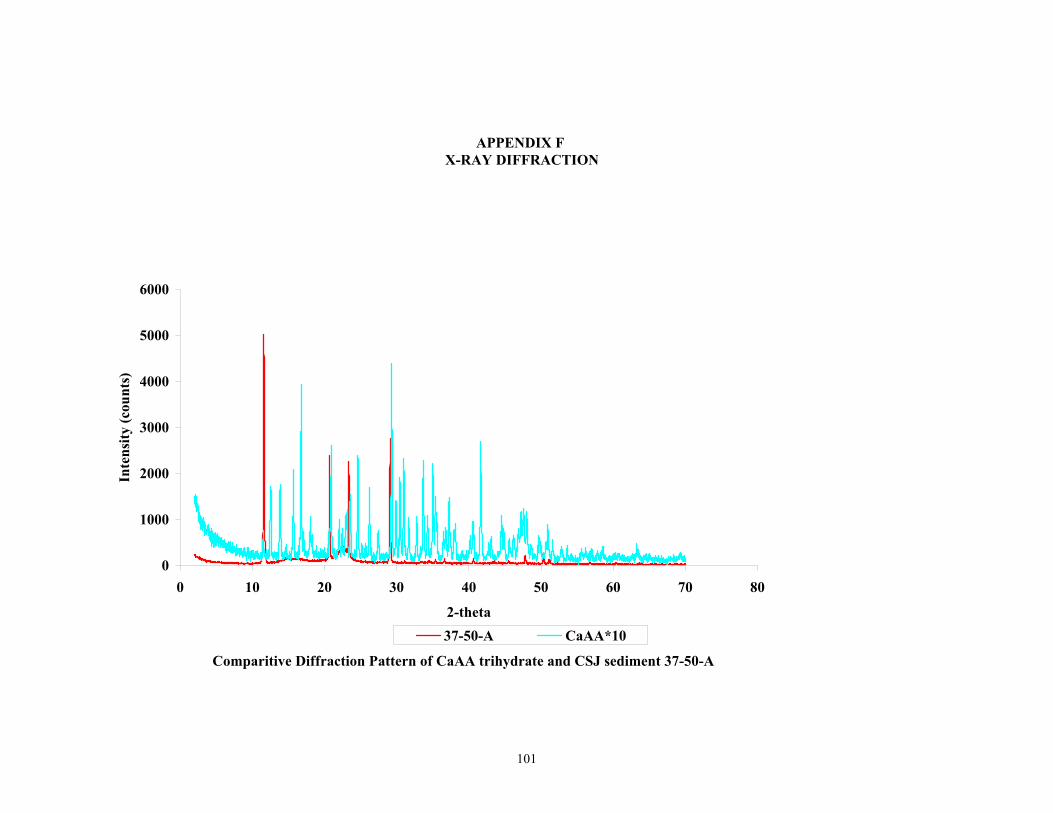
101
Comparitive Diffraction Pattern of CaAA trihydrate and CSJ sediment 37-50-A
0
1000
2000
3000
4000
5000
6000
0 10 20 30 40 50 60 70 80
2-theta
Inte
nsity
(cou
nts)
37-50-A CaAA*10
APPENDIX F X-RAY DIFFRACTION


103
Table F1: 2-theta and d-spacing values for CaAA and CaMgAA contrast against values for Molasses sediment. Shaded areas depict values that correspond with 2-theta and d-spacing values for molasses sediment.
MOLASSES SED.
2-Theta d(A) 2-Theta d(A) 2-Theta d(A) 2-Theta d(A)10.4 8.5 10.3 8.5 11.5 7.7 10.3 8.512.7 7.0 12.0 7.4 12.5 7.1 12.0 7.414.0 6.3 12.6 7.0 13.8 6.4 12.6 7.017.6 5.0 13.7 6.5 14.7 6.0 13.7 6.518.8 4.7 14.0 6.3 15.7 5.6 14.0 6.319.3 4.6 14.3 6.2 16.8 5.3 14.3 6.220.1 4.4 17.5 5.1 17.1 5.2 17.5 5.120.7 4.3 18.7 4.8 18.1 4.9 18.7 4.822.2 4.0 19.2 4.6 18.3 4.8 19.2 4.622.4 4.0 20.0 4.4 20.9 4.2 20.0 4.423.6 3.8 20.7 4.3 22.1 4.0 20.7 4.324.9 3.6 22.1 4.0 22.4 4.0 22.1 4.025.8 3.4 22.4 4.0 23.1 3.8 22.4 4.027.6 3.2 22.8 3.9 23.6 3.8 22.8 3.928.5 3.1 23.5 3.8 24.6 3.6 23.5 3.829.7 3.0 24.2 3.7 25.2 3.5 24.2 3.730.1 3.0 24.8 3.6 25.7 3.5 24.8 3.631.0 2.9 25.8 3.5 26.2 3.4 25.8 3.531.5 2.8 26.6 3.3 27.4 3.2 26.6 3.332.0 2.8 27.5 3.2 29.3 3.0 27.5 3.233.9 2.6 28.5 3.1 29.9 3.0 28.5 3.135.0 2.6 28.9 3.1 30.4 2.9 28.9 3.135.3 2.5 30.0 3.0 31.0 2.9 30.0 3.035.6 2.5 30.4 2.9 31.7 2.8 30.4 2.937.3 2.4 30.9 2.9 32.8 2.7 30.9 2.938.0 2.4 31.4 2.8 33.7 2.7 31.4 2.839.8 2.3 31.9 2.8 34.3 2.6 31.9 2.841.3 2.2 32.2 2.8 35.0 2.6 32.2 2.841.7 2.2 33.8 2.7 35.4 2.5 33.8 2.743.0 2.1 35.2 2.5 36.5 2.5 35.2 2.543.1 2.1 35.5 2.5 36.9 2.4 35.5 2.543.2 2.1 37.2 2.4 37.3 2.4 37.2 2.444.8 2.0 37.9 2.4 38.1 2.4 37.9 2.445.0 2.0 39.7 2.3 40.2 2.2 39.7 2.345.3 2.0 40.2 2.2 40.6 2.2 40.2 2.247.8 1.9 41.3 2.2 41.7 2.2 41.3 2.248.0 1.9 41.5 2.2 42.8 2.1 41.5 2.248.8 1.9 43.3 2.1 43.1 2.1 43.3 2.149.5 1.8 44.2 2.0 44.5 2.0 44.2 2.050.0 1.8 44.8 2.0 44.9 2.0 44.8 2.051.0 1.8 45.1 2.0 45.6 2.0 45.1 2.052.3 1.7 46.4 2.0 46.3 2.0 46.4 2.056.3 1.6 47.9 1.9 46.9 1.9 47.9 1.958.6 1.6 48.9 1.9 47.2 1.9 48.9 1.960.0 1.5 49.7 1.8 47.6 1.9 49.7 1.8
51.0 1.8 48.0 1.9 51.0 1.852.2 1.8 49.8 1.8 52.2 1.8
49.9 1.851.0 1.851.6 1.852.8 1.753.6 1.7
CaMgAA CaAA MOLASSES SED.

104
Table F2: 2-theta and d-spacing values for CaAA and precipitate from CSJ samples
contrast with values for CaMgAA. Shaded areas depict values that correspond with 2-theta and d-spacing values for CaMgAA.
CaM gAA CaAA 45-100-A 37-50-A2-Theta d(A) 2-Theta d(A) 2-Theta d(A) 2-Theta d(A)
10.4 8.5 11.5 7.7 8.4 10.6 11.6 7.612.7 7.0 12.5 7.1 11.7 7.6 16.1 5.514.0 6.3 13.8 6.4 12.8 6.9 20.7 4.317.6 5.0 14.7 6.0 13.2 6.7 22.4 4.018.8 4.7 15.7 5.6 15.5 5.7 22.5 3.919.3 4.6 16.8 5.3 16.3 5.4 22.7 3.920.1 4.4 17.1 5.2 16.7 5.3 22.8 3.920.7 4.3 18.1 4.9 18.2 4.9 23.4 3.822.2 4.0 18.3 4.8 18.9 4.7 29.1 3.122.4 4.0 20.9 4.2 19.6 4.5 31.1 2.923.6 3.8 22.1 4.0 20.4 4.3 33.3 2.724.9 3.6 22.4 4.0 20.9 4.3 34.5 2.625.8 3.4 23.1 3.8 22.1 4.0 35.4 2.527.6 3.2 23.6 3.8 22.5 3.9 36.6 2.528.5 3.1 24.6 3.6 23.6 3.8 40.6 2.229.7 3.0 25.2 3.5 24.1 3.7 43.6 2.130.1 3.0 25.7 3.5 24.8 3.6 45.5 2.031.0 2.9 26.2 3.4 25.2 3.5 47.8 1.931.5 2.8 27.4 3.2 26.5 3.4 50.3 1.832.0 2.8 29.3 3.0 27.4 3.2 51.1 1.833.9 2.6 29.9 3.0 27.7 3.2 56.7 1.635.0 2.6 30.4 2.9 28.4 3.1 60.3 1.535.3 2.5 31.0 2.9 28.7 3.1 63.7 1.535.6 2.5 31.7 2.8 30.6 2.937.3 2.4 32.8 2.7 31.0 2.938.0 2.4 33.7 2.7 31.3 2.939.8 2.3 34.3 2.6 32.0 2.841.3 2.2 35.0 2.6 32.6 2.741.7 2.2 35.4 2.5 33.0 2.743.0 2.1 36.5 2.5 33.5 2.743.1 2.1 36.9 2.4 34.8 2.643.2 2.1 37.3 2.4 36.2 2.544.8 2.0 38.1 2.4 37.0 2.445.0 2.0 40.2 2.2 37.3 2.445.3 2.0 40.6 2.2 38.3 2.347.8 1.9 41.7 2.2 38.9 2.348.0 1.9 42.8 2.1 39.9 2.348.8 1.9 43.1 2.1 40.5 2.249.5 1.8 44.5 2.0 41.3 2.250.0 1.8 44.9 2.0 41.6 2.251.0 1.8 45.6 2.0 43.6 2.152.3 1.7 46.3 2.0 43.9 2.156.3 1.6 46.9 1.9 46.5 2.058.6 1.6 47.2 1.9 47.1 1.960.0 1.5 47.6 1.9 47.7 1.9
48.0 1.9 48.2 1.949.8 1.8 50.2 1.849.9 1.8 50.9 1.851.0 1.8 54.2 1.751.6 1.852.8 1.753.6 1.7

105
Table F3: 2-theta and d-spacing values for precipitates from CSJ samples contrast with values for CaAA. Shaded areas depict values that correspond with 2-theta and d-spacing values for CaAA.
2-Theta d(A) 2-Theta d(A) 2-Theta d(A)11.5 7.7 8.4 10.6 11.6 7.612.5 7.1 11.7 7.6 16.1 5.513.8 6.4 12.8 6.9 20.7 4.314.7 6.0 13.2 6.7 22.4 4.015.7 5.6 15.5 5.7 22.5 3.916.8 5.3 16.3 5.4 22.7 3.917.1 5.2 16.7 5.3 22.8 3.918.1 4.9 18.2 4.9 23.4 3.818.3 4.8 18.9 4.7 29.1 3.120.9 4.2 19.6 4.5 31.1 2.922.1 4.0 20.4 4.3 33.3 2.722.4 4.0 20.9 4.3 34.5 2.623.1 3.8 22.1 4.0 35.4 2.523.6 3.8 22.5 3.9 36.6 2.524.6 3.6 23.6 3.8 40.6 2.225.2 3.5 24.1 3.7 43.6 2.125.7 3.5 24.8 3.6 45.5 2.026.2 3.4 25.2 3.5 47.8 1.927.4 3.2 26.5 3.4 50.3 1.829.3 3.0 27.4 3.2 51.1 1.829.9 3.0 27.7 3.2 56.7 1.630.4 2.9 28.4 3.1 60.3 1.531.0 2.9 28.7 3.1 63.7 1.531.7 2.8 30.6 2.932.8 2.7 31.0 2.933.7 2.7 31.3 2.934.3 2.6 32.0 2.835.0 2.6 32.6 2.735.4 2.5 33.0 2.736.5 2.5 33.5 2.736.9 2.4 34.8 2.637.3 2.4 36.2 2.538.1 2.4 37.0 2.440.2 2.2 37.3 2.440.6 2.2 38.3 2.341.7 2.2 38.9 2.342.8 2.1 39.9 2.343.1 2.1 40.5 2.244.5 2.0 41.3 2.244.9 2.0 41.6 2.245.6 2.0 43.6 2.146.3 2.0 43.9 2.146.9 1.9 46.5 2.047.2 1.9 47.1 1.947.6 1.9 47.7 1.948.0 1.9 48.2 1.949.8 1.8 50.2 1.849.9 1.8 50.9 1.851.0 1.8 54.2 1.751.6 1.852.8 1.753.6 1.7
45-100-A 37-50-ACaAA

106
APPENDIX G SUMMARY OF STATISTICS OUT PUT
Paramters Significance Estimate Std Error P-value Significance Estimate Std Error P-value% %
Sucrose Most significant <0.0001 Most significant <0.000115g/100ml 16 2.3 14 0.660g/100ml most effective 33 2.4 most effective 31 0.6
Decfecant Conc. Highly significant <0.0001 Highly significant <0.000150% 22 2.4 19 0.8
100% 25 2.3 23 0.8150% most effective 26 2.3 most effective 25 0.8
Temp. Significant 0.0003 Highly significant <0.000135 most effective 27 2.5 most effective 25 0.875 23 2.5 21 0.795 23 2.2 21 0.8
Defecant Significant 0.0017 Significant 0.0004Ca++ most effective 26 2.4 most effective 24 0.6
Ca++/Mg++ 23 2.3 21 0.6
pH Not significant 0.0694 not significant 0.73066.5 26 2.5 21 0.97 27 2.4 23 0.9
7.5 most effective 26 2.2 most effective 23 0.98 26 2.3 22 0.9
Time Significant 0.0126 N/A25 min most effective 25 3.460 min 20 190 min 20 3.4
Overall Sets SET 7

107
Paramters Significance Estimate Std Error P-value Significance Estamate Std Error P-value Significance Estimate Std Error P-value
Sucrose N/A N/A N/A15g/100ml60g/100ml
Decfecant Conc. N/A N/A Significant 0.026950% 28 1.6100% most effective 32 1.5150% 37 1.8
Temp. N/A Significant 0.0222 N/A35 9 3.275 7 2.395 most effective 19 3.5
Defecant N/A N/A N/ACa++
Ca++/Mg++
pH N/A N/A Significant 0.0466.5 28 4.17 27 4.1
7.5 39 2.48 most effective 34 1.9
Time Significant 0.0004 N/A N/A25 min Most effective 15 0.760 min 11 0.790 min 11 0.7
Set 6 Set 5 Set 4

108
Paramters Significance Estimate Std Error P-value Significance Estimate Std Error P-value Significance Estimate Std Error P-value
Sucrose N/A N/A N/A15g/100ml60g/100ml
Decfecant Conc. not significant 0.564 not significant 0.1076 not significant 0.647150% 21 4.3 12 1.4 8 5100% 25 4.4 12 1.3 most effective 12 6150% most effective 30 5 most effective 15 1.4 5 4
Temp. N/A N/A N/A357595
Defecant N/A N/A N/ACa++
Ca++/Mg++
pH Not significant 0.0632 not significant 0.8095 not significant 0.5546.5 40 9 3 77 most effective 35 5 19 5.2 11 5
7.5 13 2 most effective 23 78 12 6 most effective 13 1.03 7 7
Time N/A N/A N/A25 min60 min90 min
Set 1Set 3 Set 2

109
APPENDIX H STATISTICAL CODE
H1 Title'AA removal From Synthetic juice with Calcium as defecant (Set1)'; options nodate nocenter nonumber ps=55 ls=78; data set1; input obs Defc pH CAR AAR SOR AACF POR; cards; proc mixed data=set1; class Defc pH ; model AACF=Defc pH/htype=3 outp=residdata; run; proc mixed data=set1 cl covtest; classes Defc pH ; model AAR=Defc pH/htype=3 ddfm=satterthwaite outp=residdata; lsmeans Defc pH /pdiff adjust=tukey; run; H2 Title'AA removal From Synthetic juice with Calcium/Magnesium as defecant (Set1)'; options nodate nocenter nonumber ps=55 ls=78; data set2; input obs Defc pH CAR AAR SOR AACF POR; cards; proc mixed data=set1; class Defc pH ; model AACF=Defc pH/htype=3 outp=residdata; run; proc mixed data=set1 cl covtest; classes Defc pH ; model AAR=Defc pH/htype=3 ddfm=satterthwaite outp=residdata; lsmeans Defc pH /pdiff adjust=tukey; H3 Title'AA Removal from CSJ with Ca Defecant at fixed Temperature (Set 3)'; options nodate nocenter nonumber ps=55 ls=78; data set3; input obs Defc pH CAR AAR SOR AACF POR; cards; proc mixed data=Set3; classes Defc pH ; model AAR=Defc pH ; lsmeans Defc pH /pdiff adjust=tukey; run; proc mixed data=Set3 cl covtest; classes Defc pH ; model AAR=DefcpH/htype=3 ddfm=satterthwaite outp=residdata; random set; run; proc mixed data=set3; class Defc pH ; model AACF=Defc pH/htype=3 outp=residdata;
110
run; H4 Title'AA Removal from SJ with Ca/Mg Defecant at fixed Temperature (Set 4)'; options nodate nocenter nonumber ps=55 ls=78; data set4; input obs Defc pH CAR MgR AAR SOR AACF POR; cards; proc mixed data=Set4; classes Defc pH ; model AAR= Defc pH ; lsmeans Defc pH /pdiff adjust=tukey; run; proc mixed data=Set4 cl covtest; classes Defc pH ; model AAR=Defc pH/htype=3 ddfm=satterthwaite outp=residdata; random set; run; H5 Title'AA Removal from SJ with Ca/Mg Defecant with varying Temp (Set 5)'; options nodate nocenter nonumber ps=55 ls=78; data set5; input obs Temp pH CAR MgR AAR SOR POR AACF ; cards; proc mixed data=set5; classes Temp; model AAR=Temp ; lsmeans Temp /pdiff adjust=tukey; run; proc mixed data=set5 cl covtest; classes Temp ; model AAR=Temp/htype=3 ddfm=satterthwaite outp=residdata; run; H7 Title'Effect of time on % AA removal Set 6'; options nodate nocenter nonumber ps=55 ls=78; data set6; input obs Set DS Defc Temp pH Def$ AAR MgR AACF SOR POR CAR Time; cards; proc mixed data=set6; classes Time; model AAR= Time; lsmeans Time/pdiff adjust=tukey; run; proc mixed data=set6 cl covtest; classes Time; model AAR=Time/htype=3 ddfm=satterthwaite outp=residdata; run;
111
H8 Title'Multiple parameter effect on AA Removal Set 7'; options nodate nocenter nonumber ps=55 ls=78; data set7; input obs DS Defc Temp pH Def $ AAR; cards; proc mixed data=set7; class DS Defc Temp pH Def ; model AAR = DS Defc Temp pH Def/htype=3 outp=residdata; run; proc mixed data=set7; classes DS Defc Temp pH Def ; model AAR= DS Defc Temp pH Def ; lsmeans DS Defc Temp pH Def /pdiff adjust=tukey; run; H9 Title'Multiple parameter effect on AA Removal (15 DS)7A'; options nodate nocenter nonumber ps=55 ls=78; data set7a; input obs DS Defc Temp pH Def $ AAR; cards; proc mixed data=set7a; class DS Defc Temp pH Def ; model AAR = DS Defc Temp pH Def/htype=3 outp=residdata; run; proc mixed data=set7a; class Temp; model AAR=Temp; lsmeans Temp/pdiff adjust=tukey; run; H10 Title'Multiple parameter effect on AA Removal (60 DS)'; options nodate nocenter nonumber ps=55 ls=78; data set7b; input obs DS Defc Temp pH Def $ AAR; cards; proc mixed data=set7b; class DS Defc Temp pH Def ; model AAR = DS Defc Temp pH Def/htype=3 outp=residdata; run; proc mixed data=set7b; class Temp; model AAR=Temp; lsmeans Temp/pdiff adjust=tukey; run; H11 Title'Multiple parameter effect on AA Removal (Overall)'; options nodate nocenter nonumber ps=55 ls=78; data TotalA; input Set DS Defc Temp pH Def$ AAR MgR AACF SOR POR CAR Time; Cards; proc mixed data=Total; classes Set DS Defc Temp pH Def Time;

112
model AAR=Set DS Defc Temp pH Def Time; lsmeans Set DS Defc Temp pH Def Time/pdiff adjust=tukey; run; proc mixed data=Total cl covtest; classes Set DS Defc Temp pH Def Time; model AAR=Set|DS|Defc|Temp|pH|Def|Time/htype=3 ddfm=satterthwaite outp=residdata; random set; run;

113
VITA
Niconor Niconey Reece was born on the 6th of April 1975, in St. Catherine, Jamaica. He
attended the Guy’s Hill High School where he was the deputy head boy. He went on to study at
the College of Agriculture Science and Education where he obtained an associate degree in
general agriculture. At the age of 22 he came to the United States of America where he enrolled
at Louisiana State University for the Bachelor of Science in the department of Biological and
Agricultural Engineering. At the end of his program he enrolled for the Master of Science in
Biological and Agricultural Engineering program through the Audubon Sugar Institute. On
completion of his study he will be working in the Jamaican Sugar Industry.