Clarification of the concept of Ganoderma orbiforme with high morphological plasticity
Upload
khangminh22Category
view
0download
0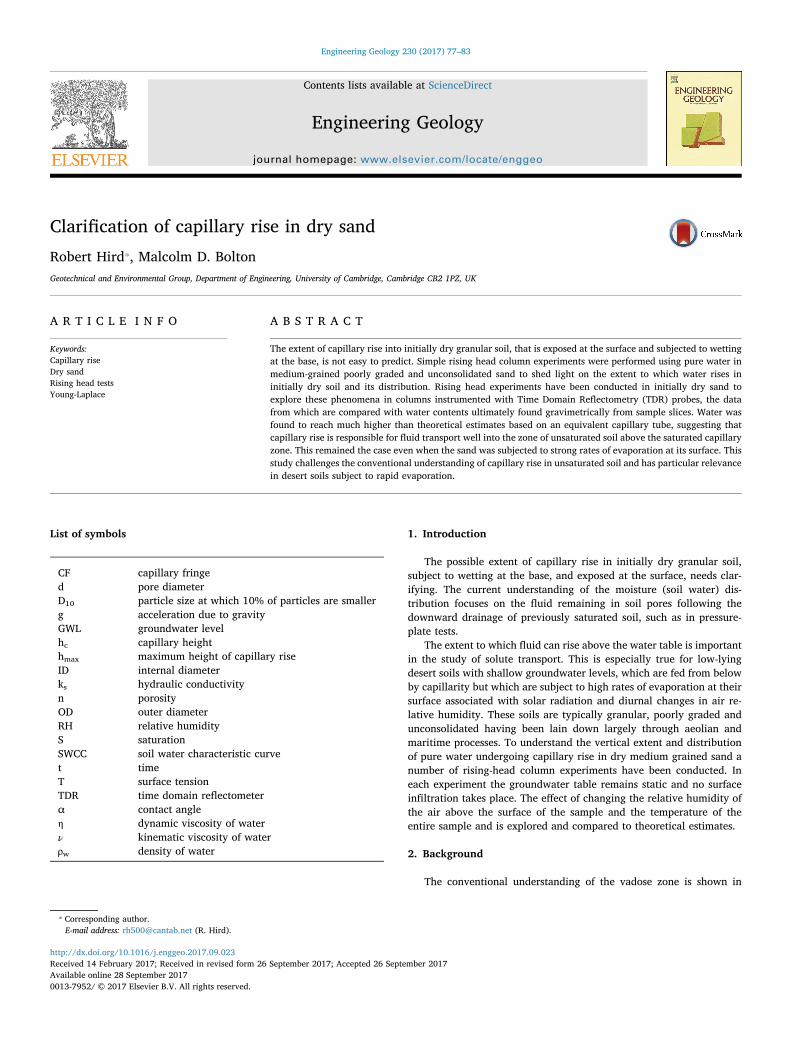
Contents lists available at ScienceDirect
Engineering Geology
journal homepage: www.elsevier.com/locate/enggeo
Clarification of capillary rise in dry sand
Robert Hird⁎, Malcolm D. BoltonGeotechnical and Environmental Group, Department of Engineering, University of Cambridge, Cambridge CB2 1PZ, UK
A R T I C L E I N F O
Keywords:Capillary riseDry sandRising head testsYoung-Laplace
A B S T R A C T
The extent of capillary rise into initially dry granular soil, that is exposed at the surface and subjected to wettingat the base, is not easy to predict. Simple rising head column experiments were performed using pure water inmedium-grained poorly graded and unconsolidated sand to shed light on the extent to which water rises ininitially dry soil and its distribution. Rising head experiments have been conducted in initially dry sand toexplore these phenomena in columns instrumented with Time Domain Reflectometry (TDR) probes, the datafrom which are compared with water contents ultimately found gravimetrically from sample slices. Water wasfound to reach much higher than theoretical estimates based on an equivalent capillary tube, suggesting thatcapillary rise is responsible for fluid transport well into the zone of unsaturated soil above the saturated capillaryzone. This remained the case even when the sand was subjected to strong rates of evaporation at its surface. Thisstudy challenges the conventional understanding of capillary rise in unsaturated soil and has particular relevancein desert soils subject to rapid evaporation.
List of symbols
CF capillary fringed pore diameterD10 particle size at which 10% of particles are smallerg acceleration due to gravityGWL groundwater levelhc capillary heighthmax maximum height of capillary riseID internal diameterks hydraulic conductivityn porosityOD outer diameterRH relative humidityS saturationSWCC soil water characteristic curvet timeT surface tensionTDR time domain reflectometerα contact angleη dynamic viscosity of waterν kinematic viscosity of waterρw density of water
1. Introduction
The possible extent of capillary rise in initially dry granular soil,subject to wetting at the base, and exposed at the surface, needs clar-ifying. The current understanding of the moisture (soil water) dis-tribution focuses on the fluid remaining in soil pores following thedownward drainage of previously saturated soil, such as in pressure-plate tests.
The extent to which fluid can rise above the water table is importantin the study of solute transport. This is especially true for low-lyingdesert soils with shallow groundwater levels, which are fed from belowby capillarity but which are subject to high rates of evaporation at theirsurface associated with solar radiation and diurnal changes in air re-lative humidity. These soils are typically granular, poorly graded andunconsolidated having been lain down largely through aeolian andmaritime processes. To understand the vertical extent and distributionof pure water undergoing capillary rise in dry medium grained sand anumber of rising-head column experiments have been conducted. Ineach experiment the groundwater table remains static and no surfaceinfiltration takes place. The effect of changing the relative humidity ofthe air above the surface of the sample and the temperature of theentire sample and is explored and compared to theoretical estimates.
2. Background
The conventional understanding of the vadose zone is shown in
http://dx.doi.org/10.1016/j.enggeo.2017.09.023Received 14 February 2017; Received in revised form 26 September 2017; Accepted 26 September 2017
⁎ Corresponding author.E-mail address: [email protected] (R. Hird).
Engineering Geology 230 (2017) 77–83
Available online 28 September 20170013-7952/ © 2017 Elsevier B.V. All rights reserved.
MARK
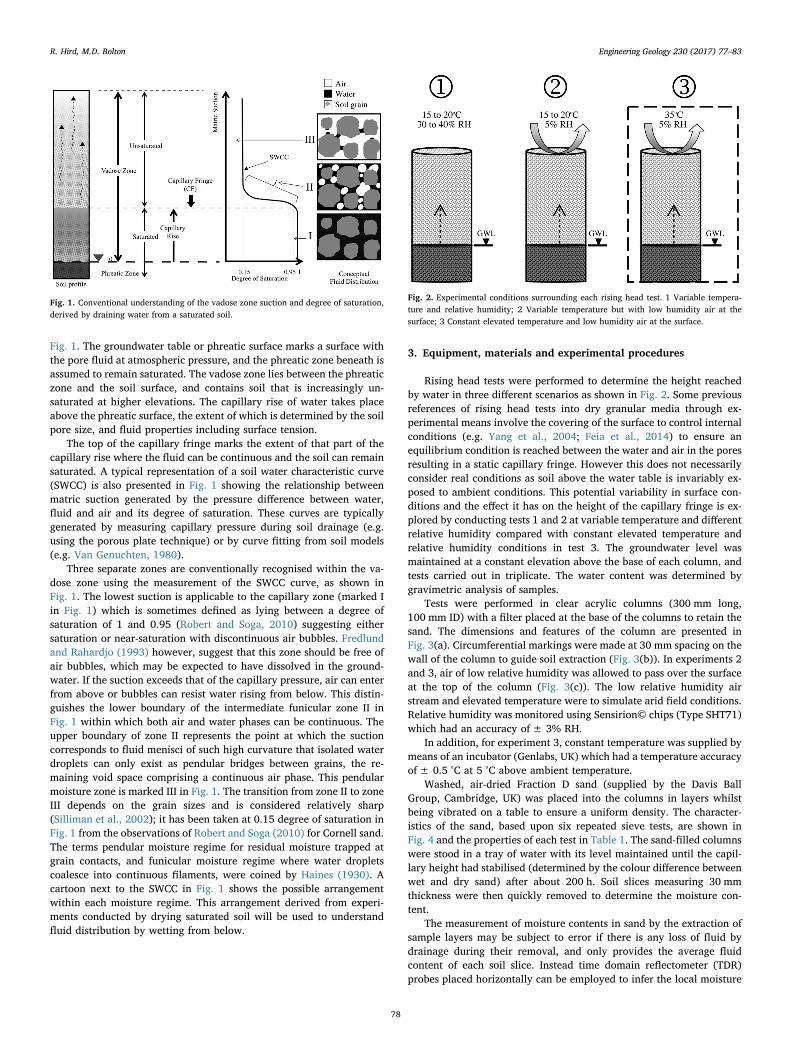
Fig. 1. The groundwater table or phreatic surface marks a surface withthe pore fluid at atmospheric pressure, and the phreatic zone beneath isassumed to remain saturated. The vadose zone lies between the phreaticzone and the soil surface, and contains soil that is increasingly un-saturated at higher elevations. The capillary rise of water takes placeabove the phreatic surface, the extent of which is determined by the soilpore size, and fluid properties including surface tension.
The top of the capillary fringe marks the extent of that part of thecapillary rise where the fluid can be continuous and the soil can remainsaturated. A typical representation of a soil water characteristic curve(SWCC) is also presented in Fig. 1 showing the relationship betweenmatric suction generated by the pressure difference between water,fluid and air and its degree of saturation. These curves are typicallygenerated by measuring capillary pressure during soil drainage (e.g.using the porous plate technique) or by curve fitting from soil models(e.g. Van Genuchten, 1980).
Three separate zones are conventionally recognised within the va-dose zone using the measurement of the SWCC curve, as shown inFig. 1. The lowest suction is applicable to the capillary zone (marked Iin Fig. 1) which is sometimes defined as lying between a degree ofsaturation of 1 and 0.95 (Robert and Soga, 2010) suggesting eithersaturation or near-saturation with discontinuous air bubbles. Fredlundand Rahardjo (1993) however, suggest that this zone should be free ofair bubbles, which may be expected to have dissolved in the ground-water. If the suction exceeds that of the capillary pressure, air can enterfrom above or bubbles can resist water rising from below. This distin-guishes the lower boundary of the intermediate funicular zone II inFig. 1 within which both air and water phases can be continuous. Theupper boundary of zone II represents the point at which the suctioncorresponds to fluid menisci of such high curvature that isolated waterdroplets can only exist as pendular bridges between grains, the re-maining void space comprising a continuous air phase. This pendularmoisture zone is marked III in Fig. 1. The transition from zone II to zoneIII depends on the grain sizes and is considered relatively sharp(Silliman et al., 2002); it has been taken at 0.15 degree of saturation inFig. 1 from the observations of Robert and Soga (2010) for Cornell sand.The terms pendular moisture regime for residual moisture trapped atgrain contacts, and funicular moisture regime where water dropletscoalesce into continuous filaments, were coined by Haines (1930). Acartoon next to the SWCC in Fig. 1 shows the possible arrangementwithin each moisture regime. This arrangement derived from experi-ments conducted by drying saturated soil will be used to understandfluid distribution by wetting from below.
3. Equipment, materials and experimental procedures
Rising head tests were performed to determine the height reachedby water in three different scenarios as shown in Fig. 2. Some previousreferences of rising head tests into dry granular media through ex-perimental means involve the covering of the surface to control internalconditions (e.g. Yang et al., 2004; Feia et al., 2014) to ensure anequilibrium condition is reached between the water and air in the poresresulting in a static capillary fringe. However this does not necessarilyconsider real conditions as soil above the water table is invariably ex-posed to ambient conditions. This potential variability in surface con-ditions and the effect it has on the height of the capillary fringe is ex-plored by conducting tests 1 and 2 at variable temperature and differentrelative humidity compared with constant elevated temperature andrelative humidity conditions in test 3. The groundwater level wasmaintained at a constant elevation above the base of each column, andtests carried out in triplicate. The water content was determined bygravimetric analysis of samples.
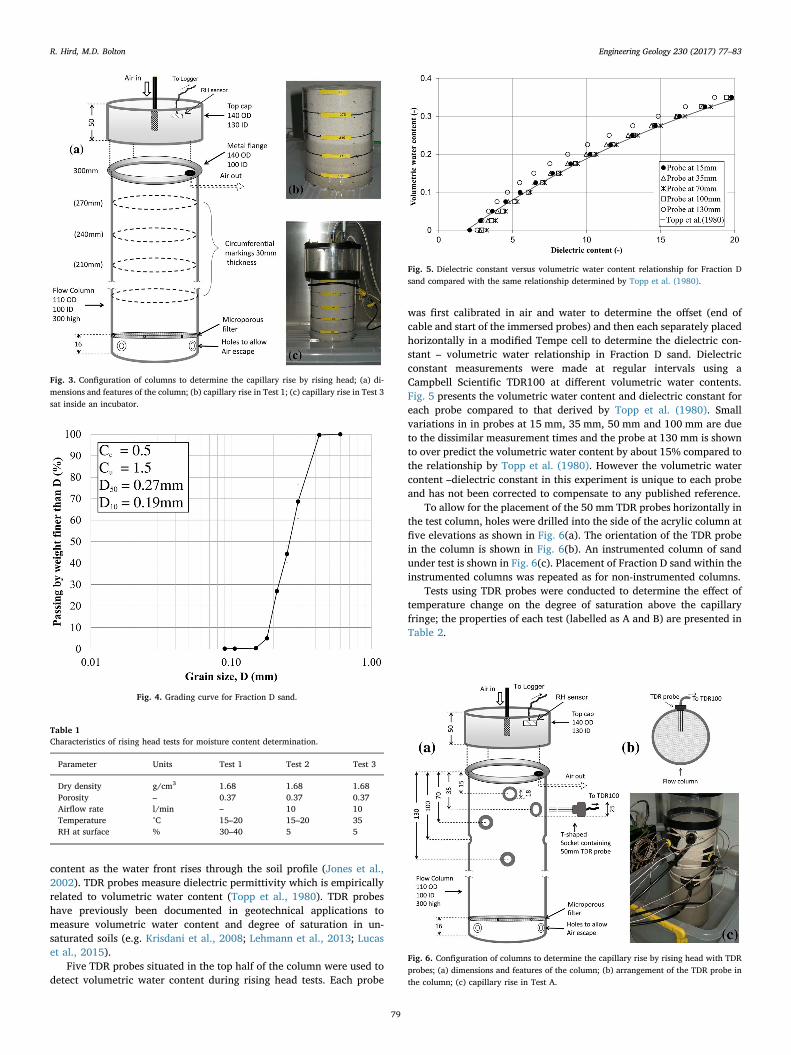
Tests were performed in clear acrylic columns (300 mm long,100 mm ID) with a filter placed at the base of the columns to retain thesand. The dimensions and features of the column are presented inFig. 3(a). Circumferential markings were made at 30 mm spacing on thewall of the column to guide soil extraction (Fig. 3(b)). In experiments 2and 3, air of low relative humidity was allowed to pass over the surfaceat the top of the column (Fig. 3(c)). The low relative humidity airstream and elevated temperature were to simulate arid field conditions.Relative humidity was monitored using Sensirion© chips (Type SHT71)which had an accuracy of± 3% RH.
In addition, for experiment 3, constant temperature was supplied bymeans of an incubator (Genlabs, UK) which had a temperature accuracyof± 0.5 °C at 5 °C above ambient temperature.
Washed, air-dried Fraction D sand (supplied by the Davis BallGroup, Cambridge, UK) was placed into the columns in layers whilstbeing vibrated on a table to ensure a uniform density. The character-istics of the sand, based upon six repeated sieve tests, are shown inFig. 4 and the properties of each test in Table 1. The sand-filled columnswere stood in a tray of water with its level maintained until the capil-lary height had stabilised (determined by the colour difference betweenwet and dry sand) after about 200 h. Soil slices measuring 30 mmthickness were then quickly removed to determine the moisture con-tent.
The measurement of moisture contents in sand by the extraction ofsample layers may be subject to error if there is any loss of fluid bydrainage during their removal, and only provides the average fluidcontent of each soil slice. Instead time domain reflectometer (TDR)probes placed horizontally can be employed to infer the local moisture
Fig. 1. Conventional understanding of the vadose zone suction and degree of saturation,derived by draining water from a saturated soil.
Fig. 2. Experimental conditions surrounding each rising head test. 1 Variable tempera-ture and relative humidity; 2 Variable temperature but with low humidity air at thesurface; 3 Constant elevated temperature and low humidity air at the surface.
R. Hird, M.D. Bolton Engineering Geology 230 (2017) 77–83
78
content as the water front rises through the soil profile (Jones et al.,2002). TDR probes measure dielectric permittivity which is empiricallyrelated to volumetric water content (Topp et al., 1980). TDR probeshave previously been documented in geotechnical applications tomeasure volumetric water content and degree of saturation in un-saturated soils (e.g. Krisdani et al., 2008; Lehmann et al., 2013; Lucaset al., 2015).
Five TDR probes situated in the top half of the column were used todetect volumetric water content during rising head tests. Each probe
was first calibrated in air and water to determine the offset (end ofcable and start of the immersed probes) and then each separately placedhorizontally in a modified Tempe cell to determine the dielectric con-stant – volumetric water relationship in Fraction D sand. Dielectricconstant measurements were made at regular intervals using aCampbell Scientific TDR100 at different volumetric water contents.Fig. 5 presents the volumetric water content and dielectric constant foreach probe compared to that derived by Topp et al. (1980). Smallvariations in in probes at 15 mm, 35 mm, 50 mm and 100 mm are dueto the dissimilar measurement times and the probe at 130 mm is shownto over predict the volumetric water content by about 15% compared tothe relationship by Topp et al. (1980). However the volumetric watercontent –dielectric constant in this experiment is unique to each probeand has not been corrected to compensate to any published reference.
To allow for the placement of the 50 mm TDR probes horizontally inthe test column, holes were drilled into the side of the acrylic column atfive elevations as shown in Fig. 6(a). The orientation of the TDR probein the column is shown in Fig. 6(b). An instrumented column of sandunder test is shown in Fig. 6(c). Placement of Fraction D sand within theinstrumented columns was repeated as for non-instrumented columns.
Tests using TDR probes were conducted to determine the effect oftemperature change on the degree of saturation above the capillaryfringe; the properties of each test (labelled as A and B) are presented inTable 2.
Fig. 3. Configuration of columns to determine the capillary rise by rising head; (a) di-mensions and features of the column; (b) capillary rise in Test 1; (c) capillary rise in Test 3sat inside an incubator.
Fig. 4. Grading curve for Fraction D sand.
Table 1Characteristics of rising head tests for moisture content determination.
Parameter Units Test 1 Test 2 Test 3
Dry density g/cm3 1.68 1.68 1.68Porosity – 0.37 0.37 0.37Airflow rate l/min – 10 10Temperature °C 15–20 15–20 35RH at surface % 30–40 5 5
Fig. 5. Dielectric constant versus volumetric water content relationship for Fraction Dsand compared with the same relationship determined by Topp et al. (1980).
Fig. 6. Configuration of columns to determine the capillary rise by rising head with TDRprobes; (a) dimensions and features of the column; (b) arrangement of the TDR probe inthe column; (c) capillary rise in Test A.
R. Hird, M.D. Bolton Engineering Geology 230 (2017) 77–83
79
4. Results
4.1. Experimental measure of capillary rise height
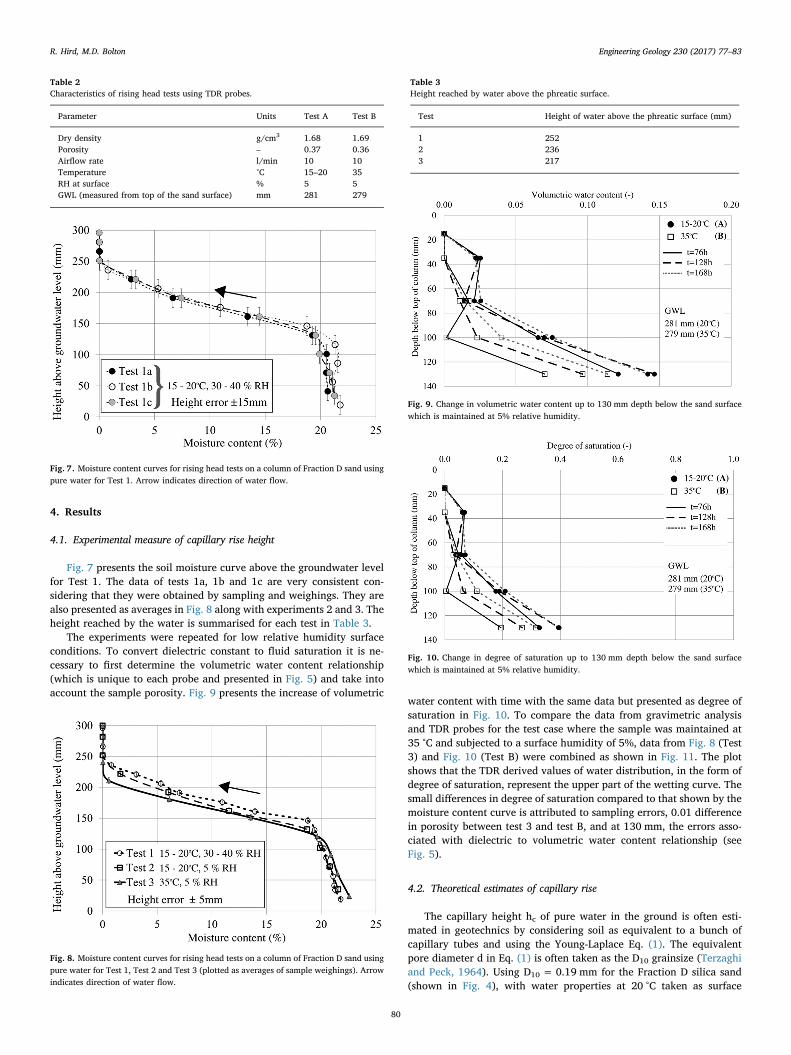
Fig. 7 presents the soil moisture curve above the groundwater levelfor Test 1. The data of tests 1a, 1b and 1c are very consistent con-sidering that they were obtained by sampling and weighings. They arealso presented as averages in Fig. 8 along with experiments 2 and 3. Theheight reached by the water is summarised for each test in Table 3.
The experiments were repeated for low relative humidity surfaceconditions. To convert dielectric constant to fluid saturation it is ne-cessary to first determine the volumetric water content relationship(which is unique to each probe and presented in Fig. 5) and take intoaccount the sample porosity. Fig. 9 presents the increase of volumetric
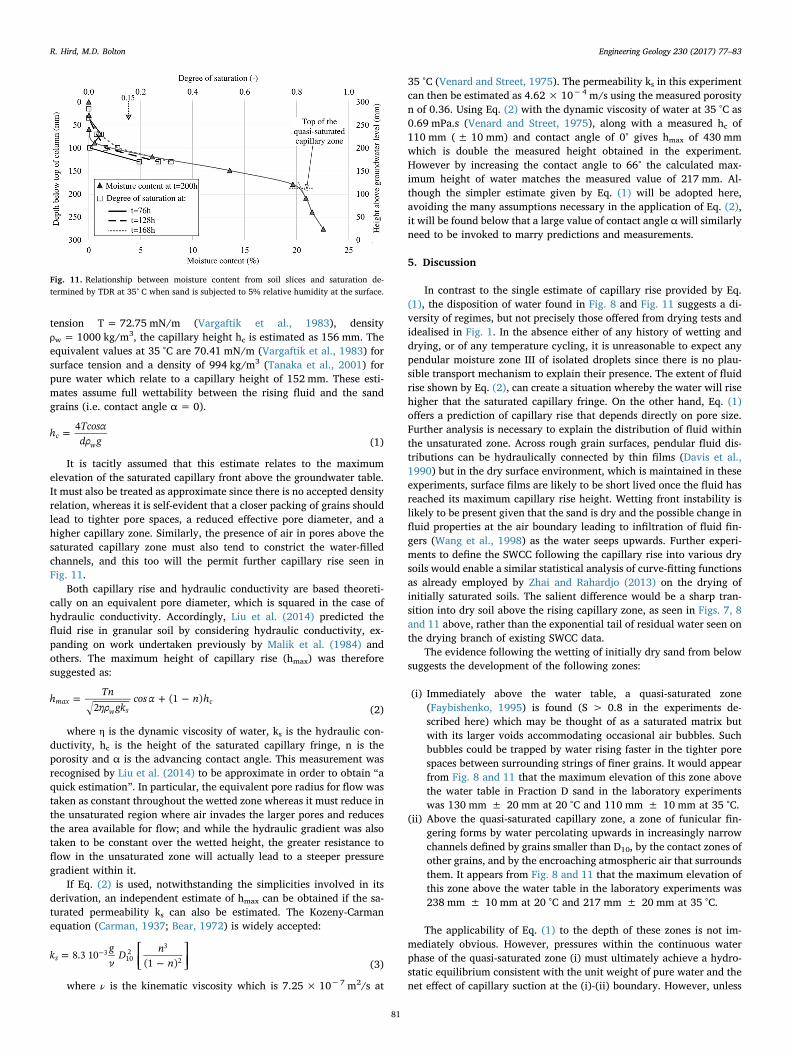
water content with time with the same data but presented as degree ofsaturation in Fig. 10. To compare the data from gravimetric analysisand TDR probes for the test case where the sample was maintained at35 °C and subjected to a surface humidity of 5%, data from Fig. 8 (Test3) and Fig. 10 (Test B) were combined as shown in Fig. 11. The plotshows that the TDR derived values of water distribution, in the form ofdegree of saturation, represent the upper part of the wetting curve. Thesmall differences in degree of saturation compared to that shown by themoisture content curve is attributed to sampling errors, 0.01 differencein porosity between test 3 and test B, and at 130 mm, the errors asso-ciated with dielectric to volumetric water content relationship (seeFig. 5).
4.2. Theoretical estimates of capillary rise
The capillary height hc of pure water in the ground is often esti-mated in geotechnics by considering soil as equivalent to a bunch ofcapillary tubes and using the Young-Laplace Eq. (1). The equivalentpore diameter d in Eq. (1) is often taken as the D10 grainsize (Terzaghiand Peck, 1964). Using D10 = 0.19 mm for the Fraction D silica sand(shown in Fig. 4), with water properties at 20 °C taken as surface
Table 2Characteristics of rising head tests using TDR probes.
Parameter Units Test A Test B
Dry density g/cm3 1.68 1.69Porosity – 0.37 0.36Airflow rate l/min 10 10Temperature °C 15–20 35RH at surface % 5 5GWL (measured from top of the sand surface) mm 281 279
Fig. 7. Moisture content curves for rising head tests on a column of Fraction D sand usingpure water for Test 1. Arrow indicates direction of water flow.
Fig. 8. Moisture content curves for rising head tests on a column of Fraction D sand usingpure water for Test 1, Test 2 and Test 3 (plotted as averages of sample weighings). Arrowindicates direction of water flow.
Table 3Height reached by water above the phreatic surface.
Test Height of water above the phreatic surface (mm)
1 2522 2363 217
Fig. 9. Change in volumetric water content up to 130 mm depth below the sand surfacewhich is maintained at 5% relative humidity.
Fig. 10. Change in degree of saturation up to 130 mm depth below the sand surfacewhich is maintained at 5% relative humidity.
R. Hird, M.D. Bolton Engineering Geology 230 (2017) 77–83
80
tension T = 72.75 mN/m (Vargaftik et al., 1983), densityρw = 1000 kg/m3, the capillary height hc is estimated as 156 mm. Theequivalent values at 35 °C are 70.41 mN/m (Vargaftik et al., 1983) forsurface tension and a density of 994 kg/m3 (Tanaka et al., 2001) forpure water which relate to a capillary height of 152 mm. These esti-mates assume full wettability between the rising fluid and the sandgrains (i.e. contact angle α = 0).
=h Tcosαdρ g
4c
w (1)
It is tacitly assumed that this estimate relates to the maximumelevation of the saturated capillary front above the groundwater table.It must also be treated as approximate since there is no accepted densityrelation, whereas it is self-evident that a closer packing of grains shouldlead to tighter pore spaces, a reduced effective pore diameter, and ahigher capillary zone. Similarly, the presence of air in pores above thesaturated capillary zone must also tend to constrict the water-filledchannels, and this too will the permit further capillary rise seen inFig. 11.
Both capillary rise and hydraulic conductivity are based theoreti-cally on an equivalent pore diameter, which is squared in the case ofhydraulic conductivity. Accordingly, Liu et al. (2014) predicted thefluid rise in granular soil by considering hydraulic conductivity, ex-panding on work undertaken previously by Malik et al. (1984) andothers. The maximum height of capillary rise (hmax) was thereforesuggested as:
= + −h Tnηρ gk
cos α n h2
(1 )maxw s
c(2)
where η is the dynamic viscosity of water, ks is the hydraulic con-ductivity, hc is the height of the saturated capillary fringe, n is theporosity and α is the advancing contact angle. This measurement wasrecognised by Liu et al. (2014) to be approximate in order to obtain “aquick estimation”. In particular, the equivalent pore radius for flow wastaken as constant throughout the wetted zone whereas it must reduce inthe unsaturated region where air invades the larger pores and reducesthe area available for flow; and while the hydraulic gradient was alsotaken to be constant over the wetted height, the greater resistance toflow in the unsaturated zone will actually lead to a steeper pressuregradient within it.
If Eq. (2) is used, notwithstanding the simplicities involved in itsderivation, an independent estimate of hmax can be obtained if the sa-turated permeability ks can also be estimated. The Kozeny-Carmanequation (Carman, 1937; Bear, 1972) is widely accepted:
= ⎡⎣⎢ −
⎤⎦⎥
−kgν
D nn
8.3 10(1 )s
3102
3
2 (3)
where ν is the kinematic viscosity which is 7.25 × 10⁻⁷ m2/s at
35 °C (Venard and Street, 1975). The permeability ks in this experimentcan then be estimated as 4.62 × 10⁻⁴ m/s using the measured porosityn of 0.36. Using Eq. (2) with the dynamic viscosity of water at 35 °C as0.69 mPa.s (Venard and Street, 1975), along with a measured hc of110 mm (± 10 mm) and contact angle of 0° gives hmax of 430 mmwhich is double the measured height obtained in the experiment.However by increasing the contact angle to 66° the calculated max-imum height of water matches the measured value of 217 mm. Al-though the simpler estimate given by Eq. (1) will be adopted here,avoiding the many assumptions necessary in the application of Eq. (2),it will be found below that a large value of contact angle α will similarlyneed to be invoked to marry predictions and measurements.
5. Discussion
In contrast to the single estimate of capillary rise provided by Eq.(1), the disposition of water found in Fig. 8 and Fig. 11 suggests a di-versity of regimes, but not precisely those offered from drying tests andidealised in Fig. 1. In the absence either of any history of wetting anddrying, or of any temperature cycling, it is unreasonable to expect anypendular moisture zone III of isolated droplets since there is no plau-sible transport mechanism to explain their presence. The extent of fluidrise shown by Eq. (2), can create a situation whereby the water will risehigher that the saturated capillary fringe. On the other hand, Eq. (1)offers a prediction of capillary rise that depends directly on pore size.Further analysis is necessary to explain the distribution of fluid withinthe unsaturated zone. Across rough grain surfaces, pendular fluid dis-tributions can be hydraulically connected by thin films (Davis et al.,1990) but in the dry surface environment, which is maintained in theseexperiments, surface films are likely to be short lived once the fluid hasreached its maximum capillary rise height. Wetting front instability islikely to be present given that the sand is dry and the possible change influid properties at the air boundary leading to infiltration of fluid fin-gers (Wang et al., 1998) as the water seeps upwards. Further experi-ments to define the SWCC following the capillary rise into various drysoils would enable a similar statistical analysis of curve-fitting functionsas already employed by Zhai and Rahardjo (2013) on the drying ofinitially saturated soils. The salient difference would be a sharp tran-sition into dry soil above the rising capillary zone, as seen in Figs. 7, 8and 11 above, rather than the exponential tail of residual water seen onthe drying branch of existing SWCC data.
The evidence following the wetting of initially dry sand from belowsuggests the development of the following zones:
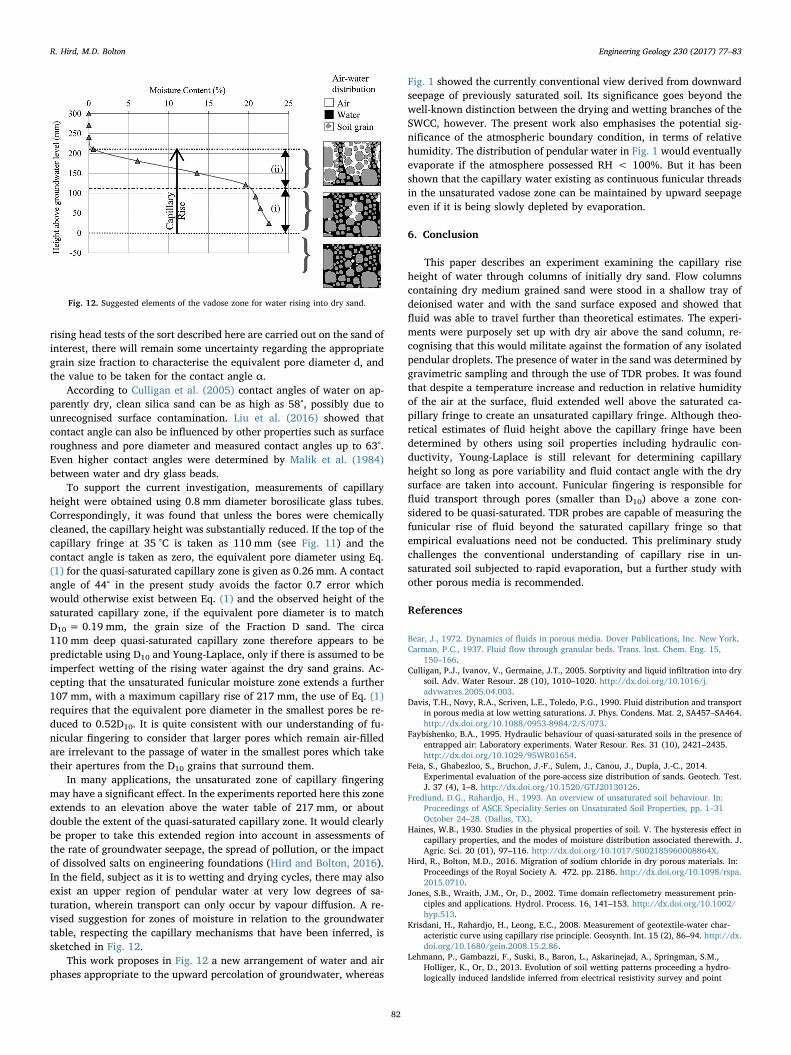
(i) Immediately above the water table, a quasi-saturated zone(Faybishenko, 1995) is found (S > 0.8 in the experiments de-scribed here) which may be thought of as a saturated matrix butwith its larger voids accommodating occasional air bubbles. Suchbubbles could be trapped by water rising faster in the tighter porespaces between surrounding strings of finer grains. It would appearfrom Fig. 8 and 11 that the maximum elevation of this zone abovethe water table in Fraction D sand in the laboratory experimentswas 130 mm ± 20 mm at 20 °C and 110 mm ± 10 mm at 35 °C.
(ii) Above the quasi-saturated capillary zone, a zone of funicular fin-gering forms by water percolating upwards in increasingly narrowchannels defined by grains smaller than D10, by the contact zones ofother grains, and by the encroaching atmospheric air that surroundsthem. It appears from Fig. 8 and 11 that the maximum elevation ofthis zone above the water table in the laboratory experiments was238 mm ± 10 mm at 20 °C and 217 mm ± 20 mm at 35 °C.
The applicability of Eq. (1) to the depth of these zones is not im-mediately obvious. However, pressures within the continuous waterphase of the quasi-saturated zone (i) must ultimately achieve a hydro-static equilibrium consistent with the unit weight of pure water and thenet effect of capillary suction at the (i)-(ii) boundary. However, unless
Fig. 11. Relationship between moisture content from soil slices and saturation de-termined by TDR at 35° C when sand is subjected to 5% relative humidity at the surface.
R. Hird, M.D. Bolton Engineering Geology 230 (2017) 77–83
81
rising head tests of the sort described here are carried out on the sand ofinterest, there will remain some uncertainty regarding the appropriategrain size fraction to characterise the equivalent pore diameter d, andthe value to be taken for the contact angle α.
According to Culligan et al. (2005) contact angles of water on ap-parently dry, clean silica sand can be as high as 58°, possibly due tounrecognised surface contamination. Liu et al. (2016) showed thatcontact angle can also be influenced by other properties such as surfaceroughness and pore diameter and measured contact angles up to 63°.Even higher contact angles were determined by Malik et al. (1984)between water and dry glass beads.
To support the current investigation, measurements of capillaryheight were obtained using 0.8 mm diameter borosilicate glass tubes.Correspondingly, it was found that unless the bores were chemicallycleaned, the capillary height was substantially reduced. If the top of thecapillary fringe at 35 °C is taken as 110 mm (see Fig. 11) and thecontact angle is taken as zero, the equivalent pore diameter using Eq.(1) for the quasi-saturated capillary zone is given as 0.26 mm. A contactangle of 44° in the present study avoids the factor 0.7 error whichwould otherwise exist between Eq. (1) and the observed height of thesaturated capillary zone, if the equivalent pore diameter is to matchD10 = 0.19 mm, the grain size of the Fraction D sand. The circa110 mm deep quasi-saturated capillary zone therefore appears to bepredictable using D10 and Young-Laplace, only if there is assumed to beimperfect wetting of the rising water against the dry sand grains. Ac-cepting that the unsaturated funicular moisture zone extends a further107 mm, with a maximum capillary rise of 217 mm, the use of Eq. (1)requires that the equivalent pore diameter in the smallest pores be re-duced to 0.52D10. It is quite consistent with our understanding of fu-nicular fingering to consider that larger pores which remain air-filledare irrelevant to the passage of water in the smallest pores which taketheir apertures from the D10 grains that surround them.
In many applications, the unsaturated zone of capillary fingeringmay have a significant effect. In the experiments reported here this zoneextends to an elevation above the water table of 217 mm, or aboutdouble the extent of the quasi-saturated capillary zone. It would clearlybe proper to take this extended region into account in assessments ofthe rate of groundwater seepage, the spread of pollution, or the impactof dissolved salts on engineering foundations (Hird and Bolton, 2016).In the field, subject as it is to wetting and drying cycles, there may alsoexist an upper region of pendular water at very low degrees of sa-turation, wherein transport can only occur by vapour diffusion. A re-vised suggestion for zones of moisture in relation to the groundwatertable, respecting the capillary mechanisms that have been inferred, issketched in Fig. 12.
This work proposes in Fig. 12 a new arrangement of water and airphases appropriate to the upward percolation of groundwater, whereas
Fig. 1 showed the currently conventional view derived from downwardseepage of previously saturated soil. Its significance goes beyond thewell-known distinction between the drying and wetting branches of theSWCC, however. The present work also emphasises the potential sig-nificance of the atmospheric boundary condition, in terms of relativehumidity. The distribution of pendular water in Fig. 1 would eventuallyevaporate if the atmosphere possessed RH < 100%. But it has beenshown that the capillary water existing as continuous funicular threadsin the unsaturated vadose zone can be maintained by upward seepageeven if it is being slowly depleted by evaporation.
6. Conclusion
This paper describes an experiment examining the capillary riseheight of water through columns of initially dry sand. Flow columnscontaining dry medium grained sand were stood in a shallow tray ofdeionised water and with the sand surface exposed and showed thatfluid was able to travel further than theoretical estimates. The experi-ments were purposely set up with dry air above the sand column, re-cognising that this would militate against the formation of any isolatedpendular droplets. The presence of water in the sand was determined bygravimetric sampling and through the use of TDR probes. It was foundthat despite a temperature increase and reduction in relative humidityof the air at the surface, fluid extended well above the saturated ca-pillary fringe to create an unsaturated capillary fringe. Although theo-retical estimates of fluid height above the capillary fringe have beendetermined by others using soil properties including hydraulic con-ductivity, Young-Laplace is still relevant for determining capillaryheight so long as pore variability and fluid contact angle with the drysurface are taken into account. Funicular fingering is responsible forfluid transport through pores (smaller than D10) above a zone con-sidered to be quasi-saturated. TDR probes are capable of measuring thefunicular rise of fluid beyond the saturated capillary fringe so thatempirical evaluations need not be conducted. This preliminary studychallenges the conventional understanding of capillary rise in un-saturated soil subjected to rapid evaporation, but a further study withother porous media is recommended.
References
Bear, J., 1972. Dynamics of fluids in porous media. Dover Publications, Inc. New York.Carman, P.C., 1937. Fluid flow through granular beds. Trans. Inst. Chem. Eng. 15,
150–166.Culligan, P.J., Ivanov, V., Germaine, J.T., 2005. Sorptivity and liquid infiltration into dry
soil. Adv. Water Resour. 28 (10), 1010–1020. http://dx.doi.org/10.1016/j.advwatres.2005.04.003.
Davis, T.H., Novy, R.A., Scriven, L.E., Toledo, P.G., 1990. Fluid distribution and transportin porous media at low wetting saturations. J. Phys. Condens. Mat. 2, SA457–SA464.http://dx.doi.org/10.1088/0953-8984/2/S/073.
Faybishenko, B.A., 1995. Hydraulic behaviour of quasi-saturated soils in the presence ofentrapped air: Laboratory experiments. Water Resour. Res. 31 (10), 2421–2435.http://dx.doi.org/10.1029/95WR01654.
Feia, S., Ghabezloo, S., Bruchon, J.-F., Sulem, J., Canou, J., Dupla, J.-C., 2014.Experimental evaluation of the pore-access size distribution of sands. Geotech. Test.J. 37 (4), 1–8. http://dx.doi.org/10.1520/GTJ20130126.
Fredlund, D.G., Rahardjo, H., 1993. An overview of unsaturated soil behaviour. In:Proceedings of ASCE Speciality Series on Unsaturated Soil Properties, pp. 1–31October 24–28. (Dallas, TX).
Haines, W.B., 1930. Studies in the physical properties of soil. V. The hysteresis effect incapillary properties, and the modes of moisture distribution associated therewith. J.Agric. Sci. 20 (01), 97–116. http://dx.doi.org/10.1017/S002185960008864X.
Hird, R., Bolton, M.D., 2016. Migration of sodium chloride in dry porous materials. In:Proceedings of the Royal Society A. 472. pp. 2186. http://dx.doi.org/10.1098/rspa.2015.0710.
Jones, S.B., Wraith, J.M., Or, D., 2002. Time domain reflectometry measurement prin-ciples and applications. Hydrol. Process. 16, 141–153. http://dx.doi.org/10.1002/hyp.513.
Krisdani, H., Rahardjo, H., Leong, E.C., 2008. Measurement of geotextile-water char-acteristic curve using capillary rise principle. Geosynth. Int. 15 (2), 86–94. http://dx.doi.org/10.1680/gein.2008.15.2.86.
Lehmann, P., Gambazzi, F., Suski, B., Baron, L., Askarinejad, A., Springman, S.M.,Holliger, K., Or, D., 2013. Evolution of soil wetting patterns proceeding a hydro-logically induced landslide inferred from electrical resistivity survey and point
Fig. 12. Suggested elements of the vadose zone for water rising into dry sand.
R. Hird, M.D. Bolton Engineering Geology 230 (2017) 77–83
82
measurements of volumetric water content and pore water pressure. Water Resour.Res. 49, 7992–8004. http://dx.doi.org/10.1002/2013WR014560.
Liu, Q., Yasufuku, N., Miao, J., Ren, J., 2014. An approach for the quick estimation ofmaximum height of capillary rise. Soils Found. 54 (6), 1241–1245. http://dx.doi.org/10.1016/j.sandf.2014.11.017.
Liu, Z., Yu, X., Wan, L., 2016. Capillary rise method for the measurement of the contactangle of soils. Acta Geotech. 11, 21–35. http://dx.doi.org/10.1007/s11440-014-0352-x.
Lucas, D.R., Askarinejad, A., Herzog, R., Bleiker, E., Springman, S.M., 2015. Volumetricwater content determination by TDR sensors and decagons in gravelly soils. In: ICEPublishing Conference Proceedings: Investigation, Classification, Testing, andForensics. 116. pp. 3565–3570. Chapter. https://doi.org/10.1680/ecsmge.60678.
Malik, R.S., Kumar, S., Dahiya, I.S., 1984. An approach to the quick determination ofsome water transmission characteristics of porous media. Soil Sci. 137 (6), 395–400.
Robert, D., Soga, K., 2010. Soil-pipeline interaction in unsaturated soils. In: Laloui, L.(Ed.), Mechanics of Unsaturated Geomaterials. John Wiley & Sons, Inc., NJ, pp.303–325.
Silliman, S.E., Berkowitz, B., Simunek, J., Genuchten, M.T., 2002. Fluid flow and solutemigration within the capillary fringe. Ground Water 40 (1), 76–84. http://dx.doi.org/10.1111/j.1745-6584.2002.tb02493.x.
Tanaka, M., Girard, G., Davis, R., Peuto, A., Bignell, N., 2001. Recommended table for the
density of water between 0C and 40C based on recent experimental reports.Metrologia 38, 301–309. http://dx.doi.org/10.1088/0026-1394/38/4/3.
Terzaghi, K., Peck, R.B., 1964. Soil mechanics in engineering practise. Wiley, New York.Topp, G.C., Davis, J.L., Annan, A.P., 1980. Electromagnetic determination of soil water
content: measurement in coaxial transmission lines. Water Resour. Res. 16 (3),574–582. http://dx.doi.org/10.1029/WR016i003p00574.
Van Genuchten, M.T., 1980. A closed-form equation for predicting the hydraulic con-ductivity of unsaturated soils. Soil Sci. Soc. Am. J. 44, 892–898.
Vargaftik, N.B., Volkov, B.N., Voljak, L.D., 1983. International tables of the surface ten-sion of water. J. Phys. Chem. Ref. Data 12 (3), 817–820. http://dx.doi.org/10.1063/1.555688.
Venard, J.K., Street, R.L., 1975. Elementary Fluid Mechanics, 5th ed. Wiley, New York.Wang, Z., Feyen, J., Elrick, D.E., 1998. Prediction of fingering in porous media. Water
Resour. Res. 34 (9), 2183–2190.Yang, H., Rahardjo, H., Leong, E.-C., Fredlund, D.G., 2004. Factors affecting drying and
wetting soil-water characteristic curves of sandy soils. Can. Geotech. J. 41, 908–920.http://dx.doi.org/10.1139/t04-042.
Zhai, Q., Rahardjo, H., 2013. Quantification of uncertainties in soil-water characteristiccurve associated with fitting parameters. Eng. Geol. 163, 144–152. http://dx.doi.org/10.1016/j.enggeo.2013.05.014.
R. Hird, M.D. Bolton Engineering Geology 230 (2017) 77–83
83
Copyright © 2022 FDOKUMEN