Metabolic responses of guava trees irrigated withdifferent N and K levels in São Francisco Valley
Upload
khangminh22Category
view
0download
0
International Journal of Innovative Technology and Exploring Engineering (IJITEE)
ISSN: 2278-3075, Volume-8, Issue-12, October 2019
5266
Published By:
Blue Eyes Intelligence Engineering
& Sciences Publication
Retrieval Number: L32371081219/2019©BEIESP
DOI: 10.35940/ijitee.L3237.1081219
Abstract: Clarified juices are making remarkable place in the
market as these are preferred by a significant portion of the
population apart from making ready to serve drinks, clear juice
cocktails, cordials, clear nectars, translucent jelly products,
candies, clear juice blends, etc. from it. There exist several market
opportunities, not only for the traditional clear juice from apple,
but also for clarified juices produced from fruits with high pulp
content. This study was carried out with an objective of producing
high quality clarified guava juice with high yield by multi enzyme
system. Guava juice was treated with various concentration levels
of commercial enzymes pectinase, cellulase and hemicellulase for
different incubation periods (30-150 min) at 55 0C. The effect of
treatment conditions was studied on turbidity and yield of clarified
juice obtained for each enzyme separately and optimum process
conditions were determined. Based on these findings guava juice
was given simultaneous treatment of all three enzymes with
compromised process conditions (Pectinase 1.00%, Cellulase
0.50%, and Hemicellulase 0.80% with 90 min incubation time at
55 0C) which produced clarified juice with turbidity 18 NTU and
yield 62%. Response Surface Methodology (RSM) employing a
second order central composite design was used to obtain
optimum process conditions for simultaneous treatment with the
range of variables for enzymatic treatment conditions (Enzyme
concentration: 0.20-1.40% w/w, 0.20-0.80% w/w and 0.20-1.00%
w/w for pectinase, cellulase and hemicellulase respectively,
Incubation time: 30-150 min and Incubation temperature 55 0C)
based on previous individual experiments, which showed results
very close to that obtained in previous experiments giving the
optimum values as 0.96%, 0.57% and 0.77% enzyme
concentration for Pectinase, Cellulase and Hemicellulase
respectively, and incubation period of 99 min at incubation
temperature of 55 0C. Under this condition, the juice was obtained
with turbidity value as 17 NTU and 64.7% of yield.
Keywords: Guava Juice, Enzymatic Clarification, Response
Surface Methodology, Pectinase, Cellulase, Hemicellulase.
I. INTRODUCTION
Guava is one of the important commercial tropical fruits in
India. It is known as the poor man's apple of the tropics [1].
Except during the summer season, it is available throughout
the year. It gives an assured crop even with very little care. Its
requirements for fertilizer, irrigation and plant protection are
Revised Manuscript Received on October 05, 2019.
Ravi Kumar, Department of Food Technology, School of Chemical
Technology, Harcourt Butler Technical University, Kanpur, Uttar Pradesh,
India, Email Id: [email protected]
Alak Kumar Singh, Department of Food Technology, School of
Chemical Technology, Harcourt Butler Technical University, Kanpur, Uttar
Pradesh, India, Email Id: [email protected]
not much and so its cost of production is also low. Further it is
of very high nutritive value and so it is often considered as
super fruit. It is rich in vitamins A and C (in the pericarp),
omega-3 and -6 polyunsaturated fatty acids (in the seeds) and
has high levels of dietary fibre. A single guava fruit weighing
160-170 g contains over four times more of vitamin 'C'
compared to a single orange (220-230 mg per 100g) and also
has adequate levels of dietary minerals, potassium, and
magnesium [2]. Along with its nutritional properties, this fruit
is very appetizing due to its sensory (flavour and colour)
properties [3]. Guava is also grown as a backyard fruit to great
extent. India ranks first in production of guavas [4]. In India,
the best quality guavas are produced in Uttar Pradesh,
particularly in Allahabad region. Guava fruits are consumed
either fresh or processed. However, only 0.05% of the
produce is being exported to foreign countries [5]. There is
ample scope for production of high-value clarified juices from
guava to minimize the wastage and to earn higher foreign
revenue by increasing the export of such valuable products.
The ripened guava is highly perishable when kept at ambient
temperature. Therefore, it is processed in various commercial
guava products that include paste, puree, juice, canned slices.
The guava juice has become economically important in the
market among these products. The consumption of tropical
fruit juice like guava juice has been increasing currently as it
is natural, high in nutritional value and may be used as an
alternative to other beverages such as soft drinks, coffee and
tea [6]. A lot of people prefer a grit-free, haze-free and clear
guava juice. Clarified guava juice may be more acceptable by
the general population, and may be used in the manufacturing
of products that are based on clear juice e.g. clear guava
nectar, clear jelly, clear guava powder or a mixed juice blend
[7]. The fruit-based juice market is one of the fastest-growing
categories in the beverage sector. It is growing at a CAGR
(compound annual growth rate) of 25-30 per cent in the past
decade. The juice market in India is estimated to be around
Rs. 10,781.62 crores (16 per cent of the total soft drink market
in India). The fruit juice market in India is projected to grow
at a compound annual growth rate of 22 per cent over the next
five years, and is expected to grow more than double in the
next few years [8]. The flavour and aroma of guava are highly
appreciated and is able to compete in the market, either as
guava juice or as mixtures with other fruit juices.
Clarification of Guava (Psidium Guajava) Fruit
Juice using Multi-Enzyme (Pectinase,
Cellulase and Hemicellulase) Treatment:
Optimization of Processing Parameters
Ravi Kumar, Alak Kumar Singh

Clarification of Guava (Psidium Guajava) Fruit Juice using Multi-Enzyme (Pectinase, Cellulase and
Hemicellulase) Treatment: Optimization of Processing Parameters
5267
Published By:
Blue Eyes Intelligence Engineering
& Sciences Publication
Retrieval Number: L32371081219/2019©BEIESP
DOI: 10.35940/ijitee.L3237.1081219
However, the fresh guava juice is gray in colour, turbid, very
viscous and tends to settle during storage [9]. Fruit juices are
generally extracted by crushing and grinding. Juices obtained
by these operations are viscous, turbid and cloudy. This
happens due to the presence of pulp particles and colloidal
suspensions. Yield of this kind of juices is low and it is very
difficult to concentrate and pasteurize them. The conventional
guava juice processing can be made by mechanical pressing
of guava mash. Raw guava juice is gray in colour, very
viscous and turbid. Pectin substances, that are composed of
partially methyl-esterified galacturonic acid residues linked
by α-1,4-glycosidic bonds, are responsible for the turbidity
and viscosity of guava juice [10]. Juices with unacceptable
cloud and muddy turbidity are undesirable for marketing [11].
A variety of products based on clarified juice such as ready to
serve drinks, sparkling clear beverages (soft drinks, clear
juice cocktails, cordials, clear nectars, alcoholic beverages,
nutritional carbonated beverages, cold teas with clear juice),
translucent jelly products, candies, clear juice blends, fruit
honey or fruit sugar, 100% canned fruit (with clear juice as
syrup) etc. are making place in the market.
Clarification is the process of breaking the semistable
emulsion of colloidal plant carbohydrates that support the
insoluble cloud material in a freshly extracted juice.
Enzymatic treatment of juices results in degradation of pectin
and viscosity reduction which facilitates separation through
filtration or centrifugation giving the juice higher clarity.
Currently pectinases, cellulases and hemicellulases,
collectively called macerating enzymes are used for
extraction and clarification of fruit juices. Pectinases
hydrolyses α-1,4-glycosidic linkages of pectin molecules and
produce polygalacturonic acid monomers [12]. Cellulases
cleaves β-1,4-D-glucan linkages of cellulose to yield
oligosaccharides, cellobiose and glucose [13,14] while
hemicellulases are a diverse group of enzymes that hydrolyse
hemicelluloses, one of the most abundant group of
polysaccharide found in nature [15]. The use of pectinolytic
and cellulolytic enzymes in combination for juice clarification
enhances the yield and clarity because of simultaneous
degradation of polysaccharides [16]. The effect of hydrolytic
enzymes on juice extraction and clarification have been
reported in guava [6,10,17,18,19,20], banana [21,
22,23,24,25,26,27,28,29], litchi [30,11], mango [31,32],
kiwifruit [33,34], papaya [35,36], apple [37,38], pineapple
[39,40], asparagus [41], peach [42], pear [43], carrot [44,45]
and plums [46].
II. MATERIALS AND METHODS
A. Fruits: Fully ripened fresh guavas (Psidium guajava) were
purchased from the local market and used immediately or
stored in a refrigerator (40 C) for not more than 5 days before
being used.
B. Enzyme Source: Commercial enzymes, BL-Pectinase,
BL-Cellulase and BL-Hemicellulase obtained from Biolaxi
Corporation, Bhiwandi, India, were used for enzymatic
treatment of fruit juice. BL-Pectinase was a food grade
enzyme preparation specially designed for cell wall
degradation and pectic substance extraction. The activity of
BL-Pectinase was 1200 PGU/g. The recommended optimum
enzyme reaction conditions were pH 3.5 to 6.0 (Optimum 3.8)
and temperature 40 0C to 60
0C (Optimum 55
0C).
BL-Cellulase and BL-Hemicellulase were also food grade
enzyme preparations designed for cell wall degradation and
extraction, with the enzyme activities of 1,00,000 CMCU/g
and 1,00,000 HCU/g respectively. The recommended
optimum enzyme reaction conditions for BL-Cellulase were
pH 4.5 to 6.0 (Optimum 4.8) and temperature 40 0C to 60
0C
(Optimum 55 0C) and for BL-Hemicellulase were pH 4.5 to
6.5 (Optimum 4.5) and temperature 40 0C to 60
0C (Optimum
50 0C).
C. Juice Preparation: Ripened guavas were washed, peeled
and cut in small pieces. Based on previous works, a ratio of
1:1 (guava: water; w/w) [18] was used for juice preparation in
electric blending and juicing machine. A homogeneous
mixture was obtained free of seeds from juicing machine. The
pH of the juice obtained was 5.3. Figure 1 shows the steps
involved in extraction and clarification of guava juice by
enzyme treatment.
D. Enzymatic Treatment and Optimization: The juice was
treated with each enzyme separately and optimum conditions
for enzyme dose and incubation time were determined. For
optimization of enzyme dose the fruit juice was treated with
different doses (from 0.10% w/w to 1.40% w/w for pectinase,
from 0.10% w/w to 0.80% w/w for cellulase and from 0.10%
w/w to 1.00% w/w for hemicellulase) keeping the incubation
time and temperature fixed (60 min and 55 0C respectively) in
each experiment, and for optimization of incubation time, the
fruit juice was treated for different time periods (from 30 min
to 150 min) keeping the enzyme dose (optimum as obtained
from previous experiment) and incubation temperature (55 0C) fixed in each experiment. The reaction is carried out at
incubation temperature of 55 0C, based on the optimum
temperature recommendations for commercial enzymes. The
fruit juice without addition of enzyme was taken as control for
enzyme dose experiments and fruit juice without addition of
enzyme and no retention time was taken as control for
incubation time experiment. At the end of the enzymatic
treatment, the enzyme in the sample was inactivated by
heating the suspension at 90 0C for 5 min in a water bath and
immediately cooled to room temperature. The treated juices
were centrifuged at 1100 RPM for 20 min and the supernatant
was collected. The effect of simultaneous addition of all the
three enzymes on juice was also studied at the adjusted
optimum conditions obtained from the above experiments.
To obtain optimum process conditions for simultaneous
treatment of all the three enzymes by Response Surface
Methodology (RSM), a four variable (five level of each)
second order central composite rotatable design (CCRD) was
employed. Minitab 17.1.0 (Minitab Inc.) statistical software
(trial version) was used for data analysis. The independent
variables were concentration of pectinase (x1), concentration
of cellulase (x2), concentration of hemicellulase (x3) and
incubation time (x4). Based on the previously mentioned
experiments with the individual enzymes, the ranges of
variables selected are: Enzyme Concentration (Pectinase), X1:
0.20-1.40% w/w, Enzyme Concentration (Cellulase), X2:
0.20-0.80% w/w, Enzyme Concentration (hemicellulase), X3:
0.20-1.00% w/w and Incubation Time, X4: 30-150 min. The
International Journal of Innovative Technology and Exploring Engineering (IJITEE)
ISSN: 2278-3075, Volume-8, Issue-12, October 2019
5268
Published By:
Blue Eyes Intelligence Engineering
& Sciences Publication
Retrieval Number: L32371081219/2019©BEIESP
DOI: 10.35940/ijitee.L3237.1081219
experimental design is shown in Table-1 in coded (x) and
actual (X) levels of variables.
The response functions (y) were the turbidity and juice
yield. The values of response functions were related to the
coded variables (xi, i=1, 2, 3) by a second-degree polynomial
using the equation below (Eq. 1):
Yk= b0+ b1x1 + b2x2+ b3x3+ b4x4+ b11x1 x1+ b22x2 x2+ b33x3
x3+ b44x4 x4+ b12x1x2+ b13x1 x3+ b14x1 x4+ b23x2 x3+ b24x2 x4+
b34x3 x4+ ε …[1]
The coefficients of polynomial were represented by constant
term b0; linear effects b1, b2, b3and b4; quadratic effects b11,
b22, b33and b44; interaction effects b12, b13, b14, b23, b24and b34
and random error ε. The Analysis of Variance was performed
and the effects of individual linear, quadratic and interaction
terms were determined. The significance of all the terms in the
polynomial equation were judged statistically by computing
the probability (p) at level of 0.001, 0.01 and 0.05 [6, 18].
E. Turbidity Determination: Turbidity was determined
using Insif India Digital Turbidity Meter (Labpro
International, Ambala, Haryana). The results were reported
as Nephelometric Turbidity Units (NTU).
F. Percentage Yield Determination: Percent yield was
estimated as percentage of the clarified juice obtained based
on the initial fruit pulp.
III. RESULTS AND DISCUSSION
The guava juice was first treated with each enzyme separately
to study the effect and optimum process conditions for
individual enzymes and then simultaneous treatment was
given to juice based on the optimum conditions obtained for
individual enzymes. Response surface methodology was used
to obtain optimum for simultaneous treatment based on the
range of concentration of enzymes and range of incubation
time obtained during the experiments performed with
individual enzymes.
A. Optimization of enzyme reaction conditions for
individual enzyme treatments
Effect of Enzyme Dose
For determination of optimum enzyme dose of pectinase,
cellulase and hemicellulase, concentrations of the enzymes
were varied starting from 0.10% (w/w), as shown in Table 2, 4
and 6 respectively, at temperature of 55 0C for 60 min of
incubation. Table 2 shows the effect of pectinase
concentration on juice turbidity and yield. On increasing the
pectinase concentration, the turbidity of juice decreased and
minimum value of turbidity 10 NTU was obtained at the
pectinase concentration value of 1.0%. No juice was obtained
at pectinase concentration of 0.10%. The decrease in turbidity
value on increasing the enzyme concentration was due to
decreased amount of pectin in the juice, reducing the turbidity
[47]. Guez et al. [48] also reported negative effect of
pectinase concentration on turbidity for caja-manga
(Spondiascytherea Sonn.) pulp making the juice clearer.
Drastic decrease in turbidity was also reported by Alam et al.
[45] on increase in pectinase concentration for clarification of
carrot juice. Abdullah et al. [49] and Landbo et al. [50] also
used pectinase for reduction in juice turbidity in carambola
and elderberry juice. The variation in turbidity values is due to
breakdown of protein molecules and formation of
pectin-protein flocs that results in removal of colloidal
suspension leaving a clear supernatant [47]. Juice yield
increased with the increasing concentration of pectinase up to
the corresponding pectinase concentration of 1.0% and
remained almost constant thereafter. Based on these results
the optimum pectinase concentration was taken as 1.0%. The
turbidity of control sample which was found to be more than
1000 NTU was reduced to a minimum value of 10 NTU after
the treatment with pectinase. Per cent yield was also
significantly increased after enzyme treatment. These effects
are graphically represented in Fig.2. Akesowan et al. [13],
Sevda et al. [10], Kaur et al. [18] also reported the increase in
guava juice clarity and yield on increasing pectinase enzyme
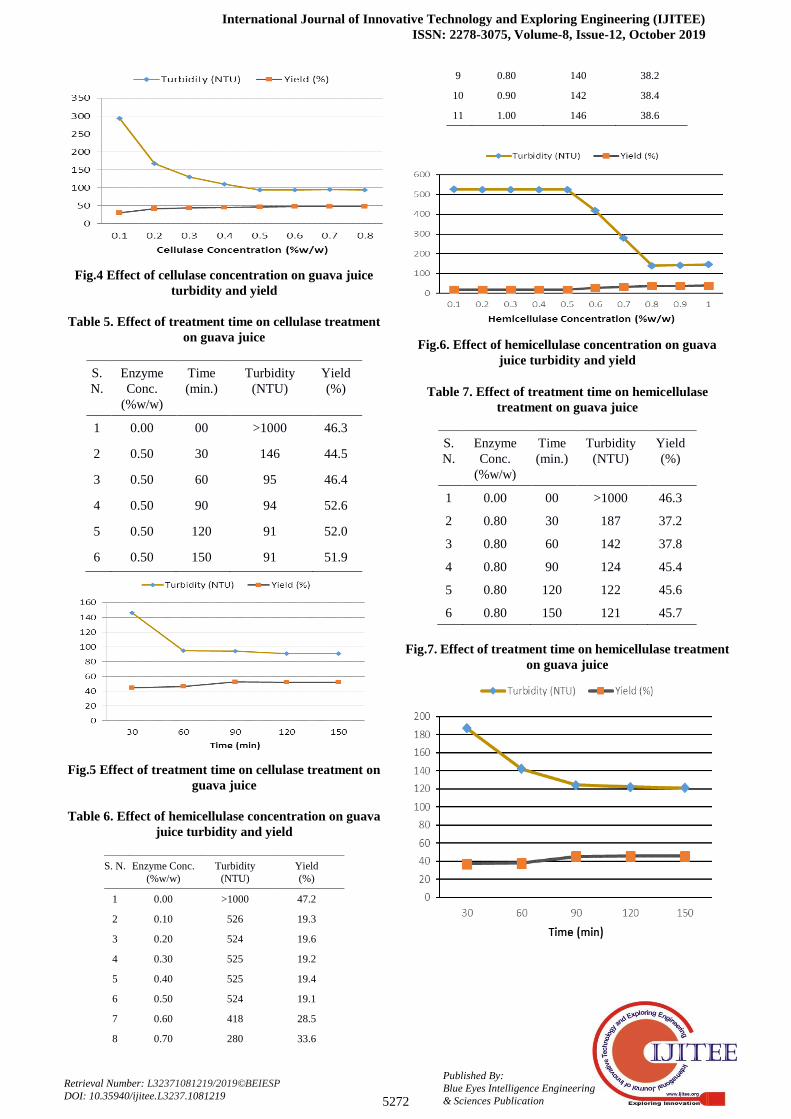
concentration. Table 4 shows the effect of cellulase
concentration on juice turbidity and yield. The turbidity of
juice decreased on increasing the cellulase concentration up
to a minimum value of 94 NTU at the concentration value of
0.50 % and thereafter it remained almost constant. Juice yield
increased markedly with the increasing concentration of
cellulase up to the enzyme concentration of 0.50% and only
slight increase was observed thereafter. As compared to
control the turbidity was greatly reduced from the value
greater than 1000 NTU and to a minimum value of 94 NTU at
the cellulase concentration of 0.5%. Yield was found slightly
decreased as compared to control at this cellulase
concentration. Based on these results the optimum cellulase
concentration was taken as 0.50%. These effects are
graphically represented in Fig.4. Jori et al. [51] studied the
effect of combined treatment of cellulase and pectinase on
blended pineapple and mango pulp and reported increase in
clarity and yield on increasing the enzyme concentration and
juice clarity and yield were found more sensitive with respect
to cellulase. By using the enzymatic pool Cellulase FNC-1.
Sreenath et al. [40] recovered up to 86% pineapple juice by
treatment with cellulase and pectinase. Table 6 shows the
effect of hemicellulase concentration on juice turbidity and
yield. No significant change was observed in turbidity up to
the hemicellulase concentration of 0.50%. After that a
significant decrease in turbidity was observed up to the
enzyme concentration of 0.8% and slight increase thereafter.
Yield was also not markedly changed up to the hemicellulase
concentration of 0.5%. After that it markedly increased up to
the enzyme concentration of 0.8% and remained almost
constant thereafter. Significant decrease in turbidity was
observed in juice as compared to control but there was also a
decrease in yield of juice than that of control. Based on these
results the optimum hemicellulase concentration was taken as
0.80%. These effects are graphically represented in Fig.6.
Shah and Nath [11] reported significant increase in litchi juice
clarity and yield by the treatment of pectinase, cellulase and
hemicellulase. The optimum concentration values for the
enzymes were used in next experiment for optimization of
incubation time.

Clarification of Guava (Psidium Guajava) Fruit Juice using Multi-Enzyme (Pectinase, Cellulase and
Hemicellulase) Treatment: Optimization of Processing Parameters
5269
Published By:
Blue Eyes Intelligence Engineering
& Sciences Publication
Retrieval Number: L32371081219/2019©BEIESP
DOI: 10.35940/ijitee.L3237.1081219
Effect of Incubation Time
Fig 1: Steps for Guava Juice Extraction and Subsequent Clarification by Treatment with Enzymes
The effect of varying incubation time for pectinase, cellulase
and hemicellulase (from 30 min to 150 min as shown in Table
3,5 and 7 respectively), on the efficiency of enzymes was
studied at a fixed enzyme dose of 1.0% (w/w) for pectinase,
0.05% for cellulase and 0.8% for hemicellulase based on
above experiments at temperature of 55 0C. Table 3 shows the
effect of incubation time on juice turbidity and yield for
pectinase. Turbidity was found minimum at 60 min incubation
time. There was a slight decrease in yield at this incubation
time and again increase was observed at 90 min incubation
time that remained almost same at 150 min incubation time.
The turbidity and yield were significantly affected with the
variation of incubation time as compared to control. Based on
minimum turbidity value the compromised optimum
incubation time was taken as 60 min for pectinase. In Fig. 3,
these effects are graphically represented. Table 5 shows the
effect of incubation time on juice turbidity and yield for
cellulase. Turbidity was significantly decreased from the
value of 146 NTU at 30 min incubation time to 95 NTU at 60
min incubation time and a very slight decrease was observed
thereafter.
Ripened Guava Fruits
Washing & Peeling
Cutting into small pieces
Pulping and Mixing
In Ratio 1:1
(Guava: Water; w/w)
Seed Removal
Enzymatic Treatment
Inactivation of Enzyme
Centrifugation
Precipitate (Solid)
Supernatant (Juice)
Filtration
Clear Guava Juice
Guava Juice
International Journal of Innovative Technology and Exploring Engineering (IJITEE)
ISSN: 2278-3075, Volume-8, Issue-12, October 2019
5270
Published By:
Blue Eyes Intelligence Engineering
& Sciences Publication
Retrieval Number: L32371081219/2019©BEIESP
DOI: 10.35940/ijitee.L3237.1081219
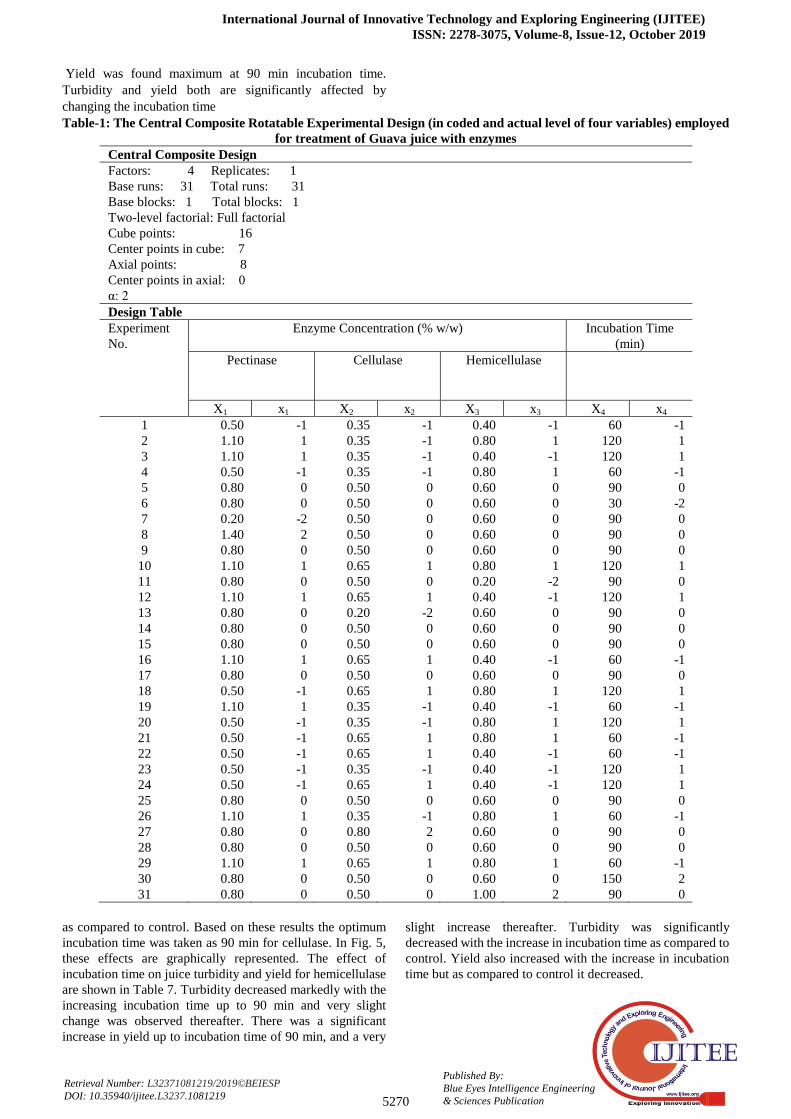
Yield was found maximum at 90 min incubation time.
Turbidity and yield both are significantly affected by
changing the incubation time
Table-1: The Central Composite Rotatable Experimental Design (in coded and actual level of four variables) employed
for treatment of Guava juice with enzymes
Central Composite Design
Factors: 4 Replicates: 1
Base runs: 31 Total runs: 31
Base blocks: 1 Total blocks: 1
Two-level factorial: Full factorial
Cube points: 16
Center points in cube: 7
Axial points: 8
Center points in axial: 0
α: 2
Design Table
Experiment
No.
Enzyme Concentration (% w/w) Incubation Time
(min)
Pectinase Cellulase Hemicellulase
X1 x1 X2 x2 X3 x3 X4 x4
1
2
3
4
5
6
7
8
9
10
11
12
13
14
15
16
17
18
19
20
21
22
23
24
25
26
27
28
29
30
31
0.50
1.10
1.10
0.50
0.80
0.80
0.20
1.40
0.80
1.10
0.80
1.10
0.80
0.80
0.80
1.10
0.80
0.50
1.10
0.50
0.50
0.50
0.50
0.50
0.80
1.10
0.80
0.80
1.10
0.80
0.80
-1
1
1
-1
0
0
-2
2
0
1
0
1
0
0
0
1
0
-1
1
-1
-1
-1
-1
-1
0
1
0
0
1
0
0
0.35
0.35
0.35
0.35
0.50
0.50
0.50
0.50
0.50
0.65
0.50
0.65
0.20
0.50
0.50
0.65
0.50
0.65
0.35
0.35
0.65
0.65
0.35
0.65
0.50
0.35
0.80
0.50
0.65
0.50
0.50
-1
-1
-1
-1
0
0
0
0
0
1
0
1
-2
0
0
1
0
1
-1
-1
1
1
-1
1
0
-1
2
0
1
0
0
0.40
0.80
0.40
0.80
0.60
0.60
0.60
0.60
0.60
0.80
0.20
0.40
0.60
0.60
0.60
0.40
0.60
0.80
0.40
0.80
0.80
0.40
0.40
0.40
0.60
0.80
0.60
0.60
0.80
0.60
1.00
-1
1
-1
1
0
0
0
0
0
1
-2
-1
0
0
0
-1
0
1
-1
1
1
-1
-1
-1
0
1
0
0
1
0
2
60
120
120
60
90
30
90
90
90
120
90
120
90
90
90
60
90
120
60
120
60
60
120
120
90
60
90
90
60
150
90
-1
1
1
-1
0
-2
0
0
0
1
0
1
0
0
0
-1
0
1
-1
1
-1
-1
1
1
0
-1
0
0
-1
2
0
as compared to control. Based on these results the optimum
incubation time was taken as 90 min for cellulase. In Fig. 5,
these effects are graphically represented. The effect of
incubation time on juice turbidity and yield for hemicellulase
are shown in Table 7. Turbidity decreased markedly with the
increasing incubation time up to 90 min and very slight
change was observed thereafter. There was a significant
increase in yield up to incubation time of 90 min, and a very
slight increase thereafter. Turbidity was significantly
decreased with the increase in incubation time as compared to
control. Yield also increased with the increase in incubation
time but as compared to control it decreased.

Clarification of Guava (Psidium Guajava) Fruit Juice using Multi-Enzyme (Pectinase, Cellulase and
Hemicellulase) Treatment: Optimization of Processing Parameters
5271
Published By:
Blue Eyes Intelligence Engineering
& Sciences Publication
Retrieval Number: L32371081219/2019©BEIESP
DOI: 10.35940/ijitee.L3237.1081219
Based on these results the compromised optimum value for
incubation time was taken as 90 min for hemicellulase. In Fig.
7, these effects are graphically represented. Thus decrease in
turbidity and increase in juice yield was observed with
increase in treatment time but high incubation time was not
preferred because of the fact that increased incubation time
can cause the formation of protein-carbohydrate or
protein-tannin complex [52].
Table 2. Effect of pectinase concentration on guava juice
turbidity and yield
S.
N.
Enzyme
Conc.
(%w/w)
Turbidity
(NTU)
Yield
(%)
1 0.00 >1000 47.2
2 0.10 - -
3 0.20 19 10.6
4 0.30 18 21.3
5 0.40 18 31.7
6 0.50 16 40.0
7 0.60 16 46.3
8 0.70 15 47.9
9 0.80 13 50.4
10 0.90 12 52.9
11 1.00 10 55.0
12 1.10 14 55.0
13 1.20 18 55.2
14 1.30 23 55.3
15 1.40 26 55.6
Fig.2. Effect of pectinase concentration on guava juice
turbidity and yield
Fig. 3. Effect of incubation time on pectinase treatment on
guava juice
Table 3. Effect of incubation time on pectinase treatment
on guava juice
S.
N.
Enzyme
Conc.
(%w/w)
Time
(min.)
Turbidity
(NTU)
Yield
(%)
1 0.00 00 >1000 46.3
2 1.00 30 16 56.6
3 1.00 60 11 55.4
4 1.00 90 20 60.3
5 1.00 120 28 60.8
6 1.00 150 28 60.9
Table 4. Effect of cellulase concentration on guava juice
turbidity and yield
S.
N.
Enzyme
Conc.
(%w/w)
Turbidity
(NTU)
Yield
(%)
1 0.00 >1000 47.2
2 0.10 294 29.8
3 0.20 168 41.6
4 0.30 130 44.0
5 0.40 110 45.6
6 0.50 94 46.6
7 0.60 94 47.1
8 0.70 95 47.4
9 0.80 94 47.6
International Journal of Innovative Technology and Exploring Engineering (IJITEE)
ISSN: 2278-3075, Volume-8, Issue-12, October 2019
5272
Published By:
Blue Eyes Intelligence Engineering
& Sciences Publication
Retrieval Number: L32371081219/2019©BEIESP
DOI: 10.35940/ijitee.L3237.1081219
Fig.4 Effect of cellulase concentration on guava juice
turbidity and yield
Table 5. Effect of treatment time on cellulase treatment
on guava juice
S.
N.
Enzyme
Conc.
(%w/w)
Time
(min.)
Turbidity
(NTU)
Yield
(%)
1 0.00 00 >1000 46.3
2 0.50 30 146 44.5
3 0.50 60 95 46.4
4 0.50 90 94 52.6
5 0.50 120 91 52.0
6 0.50 150 91 51.9
Fig.5 Effect of treatment time on cellulase treatment on
guava juice
Table 6. Effect of hemicellulase concentration on guava
juice turbidity and yield
S. N. Enzyme Conc.
(%w/w)
Turbidity
(NTU)
Yield
(%)
1 0.00 >1000 47.2
2 0.10 526 19.3
3 0.20 524 19.6
4 0.30 525 19.2
5 0.40 525 19.4
6 0.50 524 19.1
7 0.60 418 28.5
8 0.70 280 33.6
9 0.80 140 38.2
10 0.90 142 38.4
11 1.00 146 38.6
Fig.6. Effect of hemicellulase concentration on guava
juice turbidity and yield
Table 7. Effect of treatment time on hemicellulase
treatment on guava juice
S.
N.
Enzyme
Conc.
(%w/w)
Time
(min.)
Turbidity
(NTU)
Yield
(%)
1 0.00 00 >1000 46.3
2 0.80 30 187 37.2
3 0.80 60 142 37.8
4 0.80 90 124 45.4
5 0.80 120 122 45.6
6 0.80 150 121 45.7
Fig.7. Effect of treatment time on hemicellulase treatment
on guava juice
Clarification of Guava (Psidium Guajava) Fruit Juice using Multi-Enzyme (Pectinase, Cellulase and
Hemicellulase) Treatment: Optimization of Processing Parameters
5273
Published By:
Blue Eyes Intelligence Engineering
& Sciences Publication
Retrieval Number: L32371081219/2019©BEIESP
DOI: 10.35940/ijitee.L3237.1081219
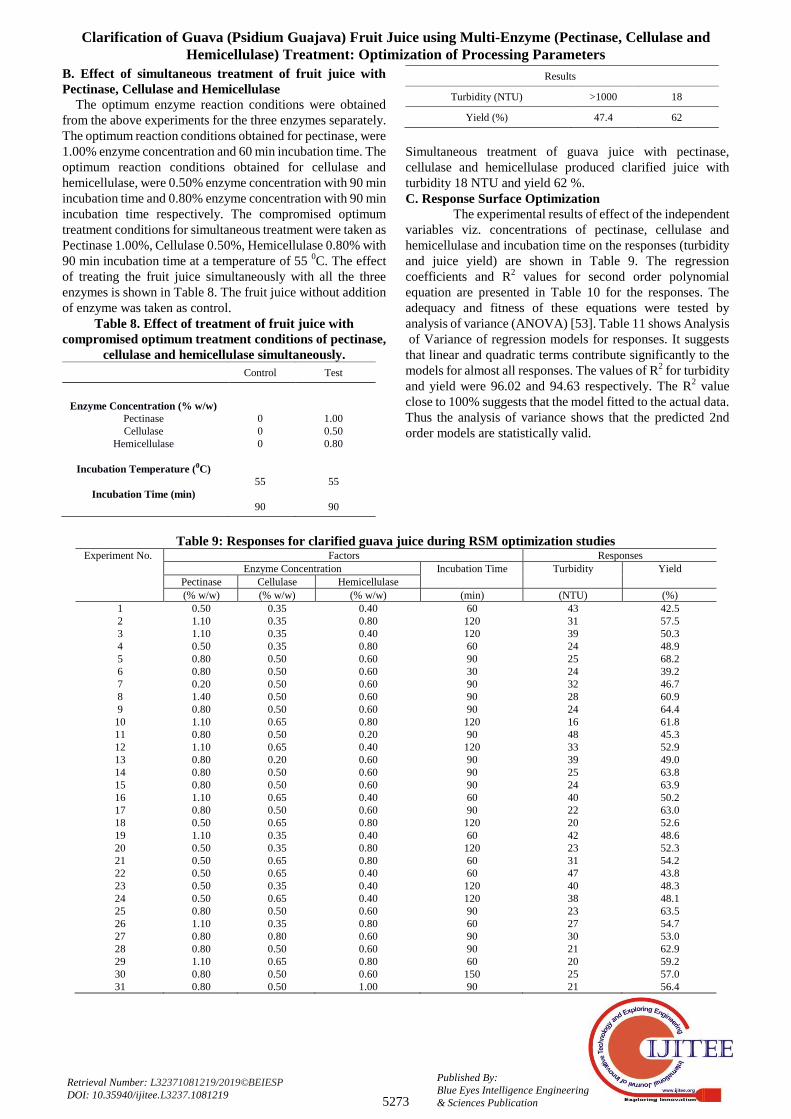
B. Effect of simultaneous treatment of fruit juice with
Pectinase, Cellulase and Hemicellulase
The optimum enzyme reaction conditions were obtained
from the above experiments for the three enzymes separately.
The optimum reaction conditions obtained for pectinase, were
1.00% enzyme concentration and 60 min incubation time. The
optimum reaction conditions obtained for cellulase and
hemicellulase, were 0.50% enzyme concentration with 90 min
incubation time and 0.80% enzyme concentration with 90 min
incubation time respectively. The compromised optimum
treatment conditions for simultaneous treatment were taken as
Pectinase 1.00%, Cellulase 0.50%, Hemicellulase 0.80% with
90 min incubation time at a temperature of 55 0C. The effect
of treating the fruit juice simultaneously with all the three
enzymes is shown in Table 8. The fruit juice without addition
of enzyme was taken as control.
Table 8. Effect of treatment of fruit juice with
compromised optimum treatment conditions of pectinase,
cellulase and hemicellulase simultaneously.
Control Test
Enzyme Concentration (% w/w)
Pectinase
Cellulase
Hemicellulase
Incubation Temperature (0C)
Incubation Time (min)
0
0
0
55
90
1.00
0.50
0.80
55
90
Results
Turbidity (NTU) >1000 18
Yield (%) 47.4 62
Simultaneous treatment of guava juice with pectinase,
cellulase and hemicellulase produced clarified juice with
turbidity 18 NTU and yield 62 %.
C. Response Surface Optimization
The experimental results of effect of the independent
variables viz. concentrations of pectinase, cellulase and
hemicellulase and incubation time on the responses (turbidity
and juice yield) are shown in Table 9. The regression
coefficients and R2 values for second order polynomial
equation are presented in Table 10 for the responses. The
adequacy and fitness of these equations were tested by
analysis of variance (ANOVA) [53]. Table 11 shows Analysis
of Variance of regression models for responses. It suggests
that linear and quadratic terms contribute significantly to the
models for almost all responses. The values of R2 for turbidity
and yield were 96.02 and 94.63 respectively. The R2 value
close to 100% suggests that the model fitted to the actual data.
Thus the analysis of variance shows that the predicted 2nd
order models are statistically valid.
Table 9: Responses for clarified guava juice during RSM optimization studies Experiment No. Factors Responses
Enzyme Concentration Incubation Time Turbidity Yield
Pectinase Cellulase Hemicellulase
(% w/w) (% w/w) (% w/w) (min) (NTU) (%)
1
2
3
4
5
6
7
8
9
10
11
12
13
14
15
16
17
18
19
20
21
22
23
24
25
26
27
28
29
30
31
0.50
1.10
1.10
0.50
0.80
0.80
0.20
1.40
0.80
1.10
0.80
1.10
0.80
0.80
0.80
1.10
0.80
0.50
1.10
0.50
0.50
0.50
0.50
0.50
0.80
1.10
0.80
0.80
1.10
0.80
0.80
0.35
0.35
0.35
0.35
0.50
0.50
0.50
0.50
0.50
0.65
0.50
0.65
0.20
0.50
0.50
0.65
0.50
0.65
0.35
0.35
0.65
0.65
0.35
0.65
0.50
0.35
0.80
0.50
0.65
0.50
0.50
0.40
0.80
0.40
0.80
0.60
0.60
0.60
0.60
0.60
0.80
0.20
0.40
0.60
0.60
0.60
0.40
0.60
0.80
0.40
0.80
0.80
0.40
0.40
0.40
0.60
0.80
0.60
0.60
0.80
0.60
1.00
60
120
120
60
90
30
90
90
90
120
90
120
90
90
90
60
90
120
60
120
60
60
120
120
90
60
90
90
60
150
90
43
31
39
24
25
24
32
28
24
16
48
33
39
25
24
40
22
20
42
23
31
47
40
38
23
27
30
21
20
25
21
42.5
57.5
50.3
48.9
68.2
39.2
46.7
60.9
64.4
61.8
45.3
52.9
49.0
63.8
63.9
50.2
63.0
52.6
48.6
52.3
54.2
43.8
48.3
48.1
63.5
54.7
53.0
62.9
59.2
57.0
56.4
International Journal of Innovative Technology and Exploring Engineering (IJITEE)
ISSN: 2278-3075, Volume-8, Issue-12, October 2019
5274
Published By:
Blue Eyes Intelligence Engineering
& Sciences Publication
Retrieval Number: L32371081219/2019©BEIESP
DOI: 10.35940/ijitee.L3237.1081219
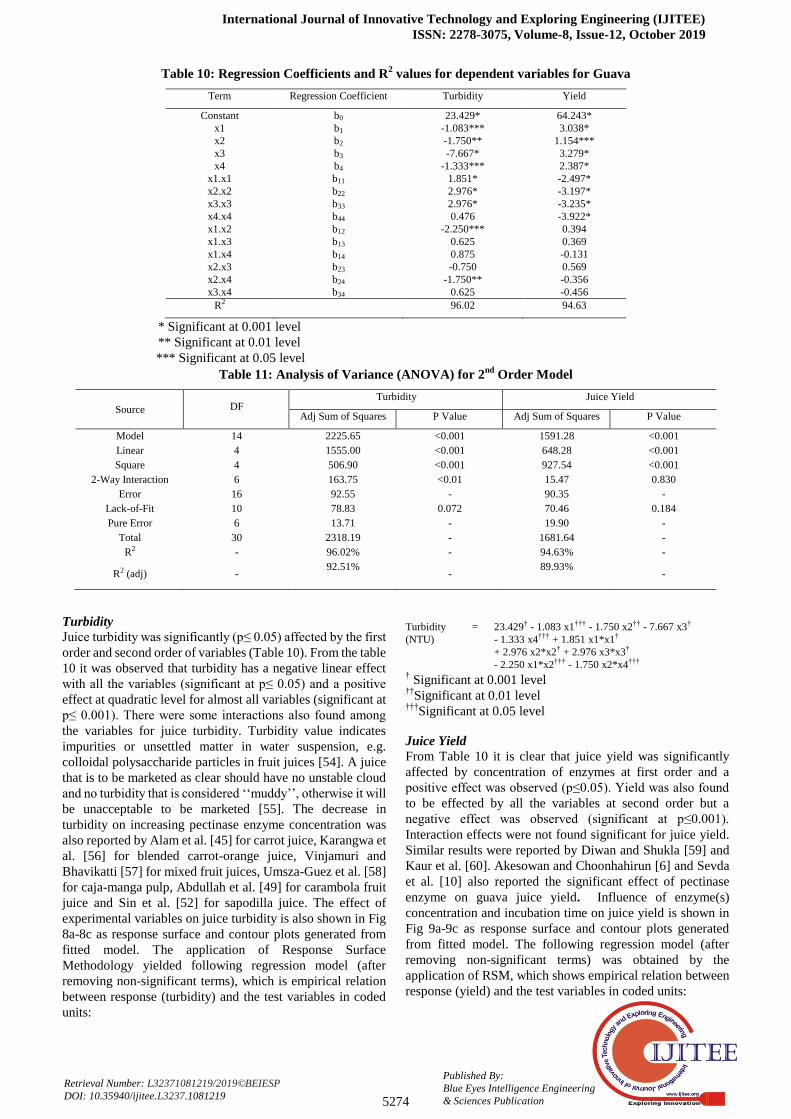
Table 10: Regression Coefficients and R2 values for dependent variables for Guava
Term Regression Coefficient Turbidity Yield
Constant
x1
x2
x3
x4
x1.x1
x2.x2
x3.x3
x4.x4
x1.x2
x1.x3
x1.x4
x2.x3
x2.x4
x3.x4
b0
b1
b2
b3
b4
b11
b22
b33
b44
b12
b13
b14
b23
b24
b34
23.429*
-1.083***
-1.750**
-7.667*
-1.333***
1.851*
2.976*
2.976*
0.476
-2.250***
0.625
0.875
-0.750
-1.750**
0.625
64.243*
3.038*
1.154***
3.279*
2.387*
-2.497*
-3.197*
-3.235*
-3.922*
0.394
0.369
-0.131
0.569
-0.356
-0.456
R2 96.02 94.63
* Significant at 0.001 level
** Significant at 0.01 level
*** Significant at 0.05 level
Table 11: Analysis of Variance (ANOVA) for 2nd
Order Model
Source DF Turbidity Juice Yield
Adj Sum of Squares P Value Adj Sum of Squares P Value
Model 14 2225.65 <0.001 1591.28 <0.001
Linear 4 1555.00 <0.001 648.28 <0.001
Square 4 506.90 <0.001 927.54 <0.001
2-Way Interaction 6 163.75 <0.01 15.47 0.830
Error 16 92.55 - 90.35 -
Lack-of-Fit 10 78.83 0.072 70.46 0.184
Pure Error 6 13.71 - 19.90 -
Total 30 2318.19 - 1681.64 -
R2 - 96.02% - 94.63% -
R2 (adj) - 92.51%
-
89.93%
-
Turbidity
Juice turbidity was significantly (p≤ 0.05) affected by the first
order and second order of variables (Table 10). From the table
10 it was observed that turbidity has a negative linear effect
with all the variables (significant at p≤ 0.05) and a positive
effect at quadratic level for almost all variables (significant at
p≤ 0.001). There were some interactions also found among
the variables for juice turbidity. Turbidity value indicates
impurities or unsettled matter in water suspension, e.g.
colloidal polysaccharide particles in fruit juices [54]. A juice
that is to be marketed as clear should have no unstable cloud
and no turbidity that is considered „„muddy‟‟, otherwise it will
be unacceptable to be marketed [55]. The decrease in
turbidity on increasing pectinase enzyme concentration was
also reported by Alam et al. [45] for carrot juice, Karangwa et
al. [56] for blended carrot-orange juice, Vinjamuri and
Bhavikatti [57] for mixed fruit juices, Umsza-Guez et al. [58]
for caja-manga pulp, Abdullah et al. [49] for carambola fruit
juice and Sin et al. [52] for sapodilla juice. The effect of
experimental variables on juice turbidity is also shown in Fig
8a-8c as response surface and contour plots generated from
fitted model. The application of Response Surface
Methodology yielded following regression model (after
removing non-significant terms), which is empirical relation
between response (turbidity) and the test variables in coded
units:
Turbidity
(NTU)
= 23.429† - 1.083 x1††† - 1.750 x2†† - 7.667 x3†
- 1.333 x4††† + 1.851 x1*x1†
+ 2.976 x2*x2† + 2.976 x3*x3†
- 2.250 x1*x2††† - 1.750 x2*x4††† † Significant at 0.001 level
††Significant at 0.01 level
†††Significant at 0.05 level
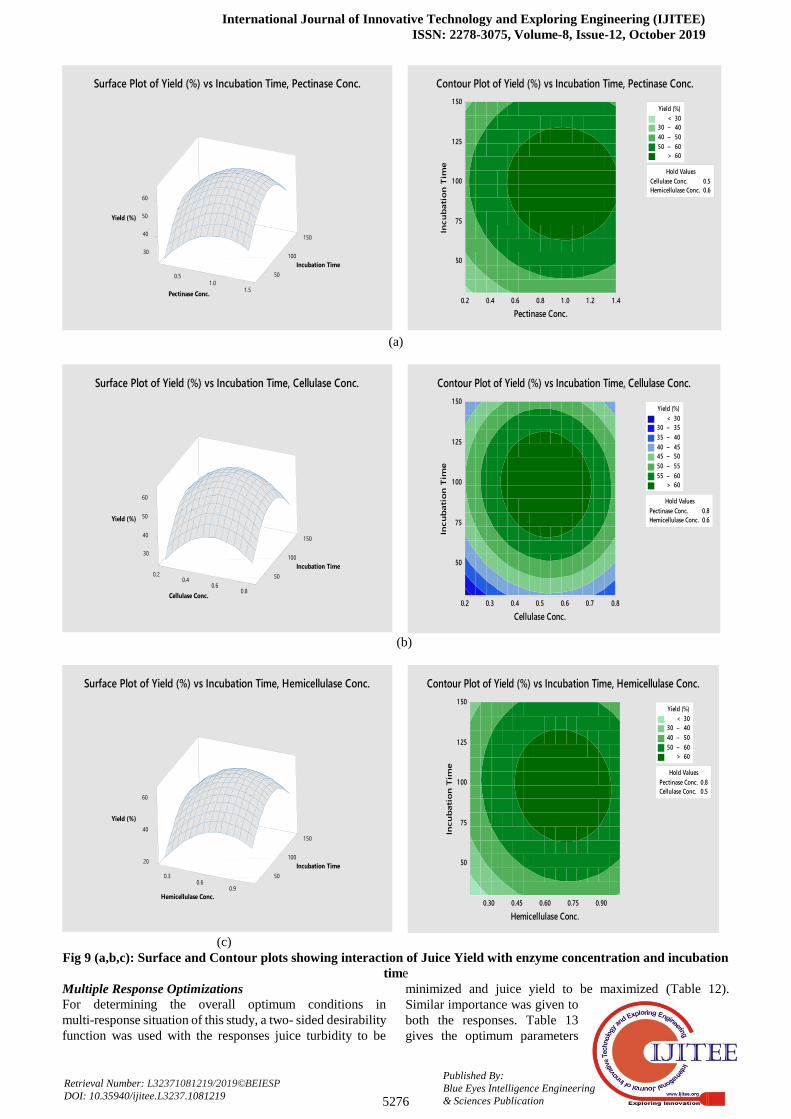
Juice Yield
From Table 10 it is clear that juice yield was significantly
affected by concentration of enzymes at first order and a
positive effect was observed (p≤0.05). Yield was also found
to be effected by all the variables at second order but a
negative effect was observed (significant at p≤0.001).
Interaction effects were not found significant for juice yield.
Similar results were reported by Diwan and Shukla [59] and
Kaur et al. [60]. Akesowan and Choonhahirun [6] and Sevda
et al. [10] also reported the significant effect of pectinase
enzyme on guava juice yield. Influence of enzyme(s)
concentration and incubation time on juice yield is shown in
Fig 9a-9c as response surface and contour plots generated
from fitted model. The following regression model (after
removing non-significant terms) was obtained by the
application of RSM, which shows empirical relation between
response (yield) and the test variables in coded units:

Clarification of Guava (Psidium Guajava) Fruit Juice using Multi-Enzyme (Pectinase, Cellulase and
Hemicellulase) Treatment: Optimization of Processing Parameters
5275
Published By:
Blue Eyes Intelligence Engineering
& Sciences Publication
Retrieval Number: L32371081219/2019©BEIESP
DOI: 10.35940/ijitee.L3237.1081219
Yield
(%)
= 64.243† + 3.038 x1
† + 1.154 x2
†††
+ 3.279 x3 + 2.387 x4†
- 2.497 x1*x1† - 3.197 x2*x2
†
- 3.235 x3*x3† - 3.922 x4*x4
†
† Significant at 0.001 level
††Significant at 0.01 level
†††Significant at 0.05 level
The effect of multi-enzyme treatment on juice clarity and
yield was also studied by Shah and Nath [11] who reported
juice clarity and yield as a function of linear and quadratic
effects of concentrations of pectinase, cellulase,
hemicellulase and incubation time for litchis. Jori et al. [51]
showed the effects of multi-enzyme (Pectinase and cellulase)
treatment for clarification of blended pineapple and mango
pulp. Koffi et al. [29] also reported the effect of different
combinations of pectinase, cellulase and hemicellulase in
reducing viscosity and improving filterability of green and
ripe banana purees.
0.51.0
25
30
35
50
1.5
100
150
35
40
y (NTU)tidibruT
tabucnI i emiT no
.cnoC eectinasP
urface Plot of Turbidity (NTU) vS s Incubation Time, Pectinase Conc.
Cellulase Conc. 0.5
Hemicellulase Conc. 0.6
Hold Values
Pectinase Conc.
Incu
bati
on
Tim
e1 .41 .21 .00.80.60.40.2
1 50
1 25
1 00
75
50
>
–
–
–
< 25
25 30
30 35
35 40
40
(NTU)
Turbidity
Contour Plot of Turbidity (NTU) vs Incubation Time, Pectinase Conc.
(a)
0.20.4
0.6
20
30
50
0.8
100
150
40
y (NTU)tidibruT
tabucnI i emiT no
.cnoC eellulasC
urface Plot of Turbidity (NTU) vS s Incubation Time, Cellulase Conc.
Pectinase Conc. 0.8
Hemicellulase Conc. 0.6
Hold Values
Cellulase Conc.
Incu
bati
on
Tim
e
0.80.70.60.50.40.30.2
1 50
1 25
1 00
75
50
>
–
–
–
–
< 25
25 30
30 35
35 40
40 45
45
(NTU)
Turbidity
Contour Plot of Turbidity (NTU) vs Incubation Time, Cellulase Conc.
(b)
0.30.6
20
40
50
0.9
100
150
60
y (NTU)tidibruT
itbucnI a emiT no
.cnoC esaluemiceH ll
urface Plot of Turbidity (NTU) vs Incubation Time, Hemicellulase ConcS
Pectinase Conc. 0.8
Cellulase Conc. 0.5
Hold Values
Hemicellulase Conc.
Incu
bati
on
Tim
e
0.900.750.600.450.30
1 50
1 25
1 00
75
50
>
–
–
–
< 20
20 30
30 40
40 50
50
(NTU)
Turbidity
Contour Plot of Turbidity (N vs Incubation Time, Hemicellulase Conc.
(c)
Fig 8 (a,b,c): Surface and Contour plots showing interaction of Juice Turbidity with
enzyme (s) concentration and incubation time
International Journal of Innovative Technology and Exploring Engineering (IJITEE)
ISSN: 2278-3075, Volume-8, Issue-12, October 2019
5276
Published By:
Blue Eyes Intelligence Engineering
& Sciences Publication
Retrieval Number: L32371081219/2019©BEIESP
DOI: 10.35940/ijitee.L3237.1081219
0.51.0
30
40
50
150
100
50
1.5
60
eld (%)iY
itaucnI b emiT no
.cnoC eectiP nas
urface Plot of Yield (%) vs IS n ubation Time, Pectinase Conc.c
Cellulase Conc. 0.5
Hemicellulase Conc. 0.6
Hold Values
Pectinase Conc.
Incu
bati
on
Tim
e
1 .41 .21 .00.80.60.40.2
1 50
1 25
1 00
75
50
>
–
–
–
< 30
30 40
40 50
50 60
60
Yield (%)
Contour Plot of Yield (%) vs Incubation Time, Pectinase Conc.
(a)
0.20.4
0.6
30
40
50
50
0.8
100
150
60
eld (%)iY
itaucnI b emiT no
.cnoC eelluC las
urface Plot of Yield (%) vs IS n ubation Time, Cellulase Conc.c
Pectinase Conc. 0.8
Hemicellulase Conc. 0.6
Hold Values
Cellulase Conc.
Incu
bati
on
Tim
e
0.80.70.60.50.40.30.2
1 50
1 25
1 00
75
50
>
–
–
–
–
–
–
< 30
30 35
35 40
40 45
45 50
50 55
55 60
60
Yield (%)
Contour Plot of Yield (%) vs Incubation Time, Cellulase Conc.
(b)
0.30.6
20
40
150
100
50
0.9
60
eld (%)iY
itabunI c emiT no
.cnoC esaluemH icell
urface Plot of Yield (%) vs IncS u ation Time, Hemicellulase Conc.b
Pectinase Conc. 0.8
Cellulase Conc. 0.5
Hold Values
Hemicellulase Conc.
Incu
bati
on
Tim
e
0.900.750.600.450.30
1 50
1 25
1 00
75
50
>
–
–
–
< 30
30 40
40 50
50 60
60
Yield (%)
Contour Plot of Yield (%) vs Incubation Time, Hemicellulase Conc.
(c)
Fig 9 (a,b,c): Surface and Contour plots showing interaction of Juice Yield with enzyme concentration and incubation
time
Multiple Response Optimizations
For determining the overall optimum conditions in
multi-response situation of this study, a two- sided desirability
function was used with the responses juice turbidity to be
minimized and juice yield to be maximized (Table 12).
Similar importance was given to
both the responses. Table 13
gives the optimum parameters

Clarification of Guava (Psidium Guajava) Fruit Juice using Multi-Enzyme (Pectinase, Cellulase and
Hemicellulase) Treatment: Optimization of Processing Parameters
5277
Published By:
Blue Eyes Intelligence Engineering
& Sciences Publication
Retrieval Number: L32371081219/2019©BEIESP
DOI: 10.35940/ijitee.L3237.1081219
for multiple response juice turbidity and yield along with the
predicted responses which are also shown in optimization plot
(Fig 10). The optimization solution for multiple responses
juice turbidity and yield showed treatment of guava juice with
0.96 % (w/w) pectinase, 0.57% (w/w) cellulase and 0.77%
(w/w) hemicellulase for 99 min incubation time at 55° C with
predicted values of turbidity 17.9 NTU and yield 66.09% and
composite desirability as 0.93. These optimum conditions
obtained with the response optimizer were very close to the
compromised optimum conditions obtained for simultaneous
treatment based on the optimum treatment conditions
obtained for individual enzymes as shown in table 8. When
the juice was treated with the optimized set of conditions
obtained with response optimizer, the juice turbidity and yield
were obtained as 17 and 64.7% which were in good
agreement with the predicted values.
Table 12: Desirability Functions:
Response Goal Lower Target Upper Weight Importance
Turbidity (NTU) Minimum 16 48 1 1
Yield (%) Maximum 39.2 68.2 1 1
Table 13: Solution (Uncoded Value)
Variables Multiple Response
Prediction
Composite
Desirability
Pectinase
Concentration
Cellulase
Concentration
Hemicellulase
Concentration
Incubation
Time
Turbidity
(NTU)
Yield
(%)
0.963636 0.569697 0.773737 99.0909 17.929 66.086 0.933380
Fig. 10: Optimization Plot
IV. CONCLUSION
The present study showed the effects of separate treatments
of guava juice with commercial enzymes pectinase, cellulase
and hemicellulase as well as the effect of simultaneous
treatment with all three enzymes. The turbidity and % yield
improved significantly by simultaneous enzymatic treatment
of guava juice. The treatment of guava juice with enzymes
was effectively optimized using response surface
methodology with a four factor and five level central
composite rotatable design which involved thirty-one
experiments. Based on Response Surface Optimization, the
recommended enzymatic clarification conditions for
simultaneous treatment of guava juice were 0.96%, 0.57%
and 0.77% enzyme concentration for Pectinase, Cellulase and
Hemicellulase respectively and incubation period of 99 min,
at incubation temperature of 55 0C. Under these conditions,
the juice obtained experimentally was having turbidity of 17
NTU and yield obtained was 64.7%.
International Journal of Innovative Technology and Exploring Engineering (IJITEE)
ISSN: 2278-3075, Volume-8, Issue-12, October 2019
5278
Published By:
Blue Eyes Intelligence Engineering
& Sciences Publication
Retrieval Number: L32371081219/2019©BEIESP
DOI: 10.35940/ijitee.L3237.1081219
REFERENCES
1. Singh, E. and Puyo, A., Wine production process from guava (Psidium
guajava L.). International Journal of Enology and Viticulture, 1(8),
2014, pp.89–97.
2. Khan, M.I., Awan, M.S. & Khan, A.S., Effect of different levels of pulp
concentration on processing of guava drink. Pakistan Journal of Food
Sciences,23(4), 2013, pp. 194-197.
3. Rahel, R., Chauhan, A.S., Srinivasulu, K., Ravi, R. and Kudachikar,
V.B., Quality Attributes of Various Spray Dried Pulp Powder Prepared
from Low Temperature Stored Calcium Salts Pretreated Guava Fruits.
International Journal of Biological, Biomolecular, Agricultural, Food
and Biotechnological Engineering, 9(7), 2015, pp.838–849.
4. APEDA, Fresh Fruits & Vegetables. [online], Available at:
http://apeda.gov.in/apedawebsite/six_head_product/FFV.htm, 2019,
[Accessed: 20 February 2019]
5. NHB, guava. [online], Available at http://nhb.gov.in/model-project
reports/Horticultur %20Crops/Guava/Guava1.htm, 2017, [Accessed:
30 March 2017]
6. Akesowan, A. & Choonhahirun, A., Effect of Enzyme Treatment on
Guava Juice Production Using Response Surface Methodology. JAPS,
Journal of Animal and Plant Sciences, 23(1), 2013, pp.114–120.
7. Chopda, C. A. & Barrett, D.M., Optimization of Guava Juice and
Powder Production. Journal of Food Processing and Preservation,
25(6), 2001, pp.411–430.
8. Food & Beverage News, Fruit juice market to grow at CAGR of 22%
over five years. [online], Available at:
http://www.fnbnews.com/Interview/fruit-juice-market-to-grow-at-cag
r-of-22-over-five-years-39501, 2016, [Accessed: 04 April 2017].
9. Younis, K., Siddiqui, S., Jahan, K. and Dar, M.S., Production of wine
from over ripe guava (Psidiumguajava L Cv. Safada) and ber
(Ziziphusmauritiana L Cv. Umran) fruits using Saccharomyces
crevices Var. HAU 1. IOSR Journal of Environmental Science,
Toxicology and Food Technology, 8(1), 2014, pp.93–96.
10. Sevda, S., Singh, A., Joshi, C. and Rodrigues, L., Extraction and
Optimization of Guava Juice by Using Response Surface
Methodology. American Journal of Food Technology, 7 (6), 2012, pp
326-339.
11. Shah, N.S. & Nath, N., Optimization of an Enzyme Assisted Process
for Juice Extraction and Clarification from Litchis (Litchi
ChinensisSonn.). International Journal of Food Engineering, 3(2),
2007.
12. Grassin, C., and Fauquembergue, P., Fruit juices. Industrial
Enzymology. pp. 226 -264. Godfrey T, West S (eds). MacMillan Press,
London, UK, 1996.
13. Béguin, P., and Daubert, J, P., The biological degradation of cellulose.
FEMS Microbiol Rev., 13, 1994, pp. 25-58.
14. Henrissat, B., Cellulases and their Interaction with cellulose. In
Cellulose.Vol. 1, 1994, pp. 169-196.
15. Sharma, H.P., Patel, H. & Sharma, S., Enzymatic Extraction and
Clarification of Juice from Various Fruits – A Review. Trends in
Post-Harvest Technology, 2(1), 2014, pp.01–14.
16. Pal, A., and Khanum, F., Efficacy of xylanase purified from
Aspergillus nigerDFR-5 alone and in combination with pectinase and
cellulase to improve yield and clarity of pineapple juice. J Food Sci
Technol., 2011, pp.560-568.
17. ThiThuy Le, Vo PhuThuan Nguyen, V.V.M.L., Application of
cellulase preparation to guava mash treatment in juice processing:
optimization of treatment conditions by RSM. Asian Journal of Food
and Agro-Industry, 5(4), 2012, pp.284–291.
18. Kaur, S., Sarkar, B.C., Sharma, H. K., and Singh, C., Response surface
optimization of conditions for the clarification of guava fruit juice
using commercial enzyme. Journal of Food Process Engineering,
34(4), 2011, pp.1298–1318
19. Brito, B., Rodriguez, M., Samaniego, I., Jaramillo, M., and Vaillan, F.,
Characterizing polysaccharides in pure form and their enzymatic
liquefaction. Food Research Technology, 2008, pp355-361
20. Vaillant, F., Millan, A., Dornier, M., Decloux, M., and Reynes, M.,
Strategy for economical optimisation of the clarification of pulpy fruit
juices using crossflow microfiltration. J. Food Eng., 48(1), 2001,
pp.83–90.
21. Tapre, A.R. and Jain, R.K., Optimization of an enzyme assisted banana
pulp clarification process. International Food Research Journal,
21(5), 2014, pp.2043–2048.
22. Sagu, T.S., Nso, J.E., Karmakar, S. and De, S., Optimisation of low
temperature extraction of banana juice using commercial pectinase.
Food Chemistry, 151, 2014, pp.182–190.
23. Cheirsilp, B. & Umsakul, K., Processing of banana-based wine product
using pectinase and α-amylase. Journal of Food Process Engineering,
31, 2008, pp.78–90.
24. Tadakittisarn, S., Haruthaithanasan, V., Chompreeda, P. and
Suwonsichon, T., Optimization of pectinase enzyme liquefaction of
banana “Gros Michel” for banana syrup production. Kasetsart
Journal: Natural Science, 41(4), 2007, pp.740–750.
25. Lee, W.C., Yusof, S., Hamid, N.S.A. and Baharin, B.S., Optimizing
conditions for enzymatic clarification of banana juice using response
surface methodology (RSM). Journal of Food Engineering, 73(1),
2006, pp.55–63.
26. Yunchalad, M., Ai, J.M. and Surojanamethkul, V., Factors affecting
the production of clarified banana drink. Kasetsart J. (Nat. Sci.) 29,
1995, pp. 231-238.
27. Kotecha, M. P., Adsule, R. N. and Kadam, S. S., Preparation of wine
from over-ripe banana fruits. Beverage Food World 21, 1994, pp28.
28. Pheantaveerat, A. & Anprung, P., Effect of pectinases, cellulases and
amylases on production of banana juice. Food, 23(3), 1993,
pp.188–196.
29. Koffi, E.K., Sims, C.A. & Bates, R.P., Viscosity reduction and
prevention of browning in the preparation of clarified banana juice.
Journal of Food Quality 14, 1991, pp.209–218
30. Vijayanand, P., Kulkarni, S.G., and Prathibha, G.V., Effect of
pectinase treatment and concentration of litchi juice on quality
characteristics of litchi juice. Journal of Food Science and
Technology, 47(2), 2010, pp. 235-239.
31. Anuradha, K., Naga P., Venkateshwar, S. and Gopal, R., Mango juice
clarification with polygalacturonase produced by Aspergillus awamori
MTCC 9166 - Optimization of conditions. International Food
Research Journal 23(1), 2016, pp. 147-151
32. Ndiaye, C., Xu, S.Y., Wang, Z., Ndoye, A.S., Optimization of
processing parameters for natural cloudy mango (Mangifera indica L.)
juice using pectolytic and cellulolytic enzymes. Fruits, 66, 2011, pp.
291-303.
33. Vaidya, D., Vaidya, M., Sharma, S., and Ghanshyam, Enzymatic
treatment for juice extraction and preparation and preliminary
evaluation of kiwifruits wine. Natural Product Radiance, 8(4), 2009,
pp. 380-385.
34. Dawes, H., Struebi, P. and Keene, J., Kiwifruit juice clarification using
a fungal proteolytic enzyme. Journal of Food Science. 59(4), 1994, pp.
859-861.
35. Tu, T. et al., High-yield production of a low-temperature-active
polygalacturonase for papaya juice clarification. Food Chemistry,
141(3), 2013, pp.2974–2981.
36. Dzogbefia, V. P. & Djokoto, D. K., Combined effects of enzyme
dosage and reaction time on papaya juice extraction with the aid of
pectic enzymes – A preliminary report. Journal of Food Biochemistry,
30, 2006, pp. 117–122.
37. Pilnik, W., Voragen, A. G. J. and de Vos, L, Enzymatishe
Verflussingungvonobst und Gemuse. Fluss. Obst. 42(11), 1975, pp.
448-451.
38. VorA.G.J., Heutink, R. and Pilnik, W., Solubilization of apple ceagen,
ll walls with polysaccharide degrading enzymes. J. Applied
Biochemistry. 2, 1980, pp. 452-468.
39. Dzogbefia, V.P., Ameko, E., Oldham, J.H. and Ellis, W.O., Production
and Use of Pectolytic Enzyme from Saccharomyces cerevisiae for the
Extraction of Pineapple Juice. Food Biotechnology, 15(1), 2001, pp.
25-34.
40. Sreenath, H. K., Sudarshan Krishna, K. R. and Santhanam, K.,
Improvement of juice recovery from pine pulp residue using cellulases
and pectinases. J. Ferment. and Bioengg., 78(6), 1994, pp. 486-488.
41. Chen, X., Xu, F., Qin, W., Ma, L., and Zheng, Y., Optimization of
Enzymatic Clarification of Green Asparagus Juice Using Response
Surface Methodology. Journal of Food Science,77(6), 2012, pp.
C665-C670.
42. Santin, M., Treichel, H., Valduga, E.,Cabral, L. MC and Luccio, M.D.,
Evaluation of enzymatic treatment of peach juice using response
surface methodology. Journal of the Science of Food and Agriculture,
88, 2008, pp. 507–512.
43. Joshi, V, K,Parmar, M., and Rana, N., Purification and
characterization of pectinase produced from apple pomace and
evaluation of its efficiency in fruit juice extraction and clarification.
Indian Journal of Natural Products and Resources, 2(2), 2011, pp.
189-197.

Clarification of Guava (Psidium Guajava) Fruit Juice using Multi-Enzyme (Pectinase, Cellulase and
Hemicellulase) Treatment: Optimization of Processing Parameters
5279
Published By:
Blue Eyes Intelligence Engineering
& Sciences Publication
Retrieval Number: L32371081219/2019©BEIESP
DOI: 10.35940/ijitee.L3237.1081219
44. Uzuner, S., and Cekmecelioglu, D., Optimizing clarification of carrot
juice by bacterial crude pectinase. International Journal of Food
Science and Technology, 50, 2015, pp. 2707–2712.
45. Alam, M.S., Ahuja, G., Gupta, K., Enzymatic clarification of carrot
juice by using response surface methodology. Agric Eng Int: CIGR
Journal, 16(3), 2014, pp. 173-179.
46. Chang, T., Siddiq, M., Sinha, N. K. and Cash, J. N., Commercial
pectinases and the yield and quality of Stanley plum juice. Journal of
Food Processing and Preservation, 19, 1995, pp.89–101.
47. Alvarez, S., Alvarez, R, Riera, F.A. and Coca, J., Influence of
depectinization on apple juice ultrafiltration. Colloids and Surfaces A:
Physiochemical and Engineering Aspects, 138 (2-3), 1998, pp.
377-382.
48. Guez, M.A.U., Rinaldi, R., Vanzela, E.S.L., Martin, N., Silva, R.D.,
Gomes, E., and Thomeo. J.C., Effect of Pectinolitic enzymes on the
physical properties of caja-manga (SpondiascynthereaSonn.) Pulp.
Cienc. Tecnol. Aliment., Campinas, 31(2), 2011, pp. 517-526.
49. Abdullah, A. G. L., Sulaiman, N.M., Aroua, M. K., Noor, M.J.M.M.,
Response surface optimization of conditions for clarification of
carambola fruit juice using a commercial enzyme. Journal of Food
Engineering, 81, 2007, pp. 65-71.
50. Landbo, A.K. Kaack, K., Meyer, A.S., Statistically designed two step
response surface optimization of enzymatic prepress treatment to
increase juice yield and lower turbidity of elderberry juice. Innovative
Food Science Emerging Technology,8, 2007, pp 135-142.
51. Jori, D. B, Pawar, A. V., Kudake, D. C., and Kotgirkar, P. G.,
Multienzymatic Clarification of Blended Pineapple and Mango Pulp
Using Response Surface Methodology. International Journal of
Advanced Biotechnology and Research, 6(1), 2015, pp 49-56.
52. Sin, H. N. Yusof, S., Sheikh Abdul Hamid, N., Abd. Rahman, A.,
Optimization of enzymatic clarification of sapodilla juice using
response surface methodology. Journal of Food Engineering, 73,
2006, pp. 313-319.
53. Khuri, A. I. and Cornell, J. A., Response surfaces: designs and
analyses; Marcel Dekker, New York, USA, 1989.
54. Grassin, C.; Fauquembergue. P., Enzymes, Fruit Juice Processing. In
Flickinger, M. C.; Drew, S. W. (Eds.). Encyclopedia of bioprocess
technology, fermentation, biocatalysis, bioseparation. New York:
John Wiley and Sons, Inc., 1999.
55. Floribeth, V., Celsa, L., & Cooke, R. D., A study of the production of
clarified banana juice using pectinolytic enzymes. Food Technology,
16, 1981, pp. 115–125.
56. E. Karangwa, H., Khizar, L., Rao, D.S., Nshimiyimana, M.B.K., Foh,
L., Li, S.Q., Xia and Zhang, X.M., Optimization of Processing
Parameters for Clarification of Blended Carrot-orange Juice and
Improvement of its Carotene Content. Advance Journal of Food
Science and Technology 2(5), 2010, pp 268-278.
57. Vinjamuri, S. and Bhavikatti, S., Optimization Studies on Enzymatic
Clarification of Mixed Fruit Juices. International Journal of Latest
Trends in Engineering and Technology, 5(2), 2015, pp.161-165.
58. Umsza-Guez, M.A., Rinald, R., Lago-Vanzelal, E.S., Martin, N., Da
Silva, R., Gomes, E., Thomeo, J. C., Effect of pectinolitic enzymes on
the physical properties of caja-manga (SpondiascythereaSonn.) pulp.
Cienc. Tecnol. Aliment., Campinas, 31(2), 2011, pp. 517-526.
59. Diwan, A. and Shukla, S.S., Process development for the production of
clarified guava juice. J. Food Sci. Technol. 42, 2005, pp245-249.
60. Kaur, S., B. C. Sarkar and K. Sharma, Optimization of enzymatic
hydrolysis pretreatment conditions for enhanced juice recovery from
guava fruit using response surface methodology. Food Bioprocess
Technol. 2, 2009, pp. 96-100.
AUTHORS PROFILE
Ravi Kumar, M. Tech. in Chemical Technology
with Specialization in Food Technology from HBTI,
Kanpur and pursuing Ph. D. in the Department of
Food Technology at School of Chemical technology,
Harcourt Butler Technical University, Kanpur, Uttar
Pradesh, India. His areas of interest are Fruit and
Vegetable Processing, Value Added Food Products,
Functional and Nutraceutical foods, Beverage
Processing etc. He has one year of industrial and seven years of academic
experience. He is also member of various academic societies such as
AFST(I) [Association of Food Scientists & Technologists (India)], ABEFT
(Association of Biochemical Engineers and Food Technologists), HBTU etc.
Dr. Alak Kumar Singh is presently working as
Professor and Head in Department of Food
Technology, School of Chemical technology,
Harcourt Butler Technical University, Kanpur, Uttar
Pradesh, India. He holds B. Tech in Chemical
Technology (Food Technology) in 1993 and M. Tech
in Chemical Technology, Food Technology in 1995
from HBTI, Kanpur UP, and accomplished Ph.D. in Chemical Technology
from U. P. Technical University, Lucknow in 2013 and has been a passionate
teacher. Prof. Singh possesses more than 24 years of experience in teaching,
researches and academic administration. He is member of academic and
research committees of various Universities. Prof. Singh has published 16
International / National research papers and Supervised 3 Ph.D. & number of
M. Tech, thesis. He is reviewer in various National and international
journals. His research contributions are in the area of Fruit & Vegetables,
Dairy Products, Waste Management and Food Biotechnology. He has
completed two research project of worth Rs 60 Lakhs of U P Council of
Science & Technology and Ministry of Food Processing Industries,
Government of India. He is life member of AFSTI and Oil Technologists
Association of India. He is GATE Score and ranked first in M. Tech program
at HBTI Kanpur. He had delivered many lectures / keynote address and
chaired various technical sessions during nation and international
conferences and training program. He also organized and contributed to
several faculty development programs for teachers and training programs for
students.
Copyright © 2022 FDOKUMEN