Assessing Autophagy with the guava easyCyte™ Benchtop ...
10
Assessing Autophagy with the guava easyCyte ™ Benchtop Flow Cytometer Mark Santos, Kevin Su, Luke Armstrong, Angelica Olcott, Jason Whalley, and Matthew Hsu EMD Millipore Application Note Introduction Autophagy is an intracellular catabolic pathway which causes cellular protein and organelle turnover, and is associated with diverse diseases such as Alzheimer’s disease, cancer, and Crohn’s disease, in addition to aging. It is a tightly regulated process that plays a normal part in cell growth, development, and cellular homeostasis. Autophagy functions as a housekeeping mechanism through disposal of aging and dysfunctional proteins and organelles by sequestering and priming them for lysosomal degradation (Figure 1). Increasing evidence suggests that not only apoptosis, but also autophagy, can contribute to cell death and greatly influence general cell health. Malfunctions of autophagy can adversely impact longevity and the capability of cells to function at full capacity. In cancer cells, autophagy can compensate for hypoxic conditions and nutrient starvation; on the other hand, activation of cell death via autophagy can kill tumor cells. As a result, there is great interest in assays that can efficiently screen for activators and inhibitors of autophagy. EMD Millipore is a division of Merck KGaA, Darmstadt, Germany Figure 1. Autophagy maintains cellular homeostasis. Autophagy is a constitutive and dynamic cellular catabolic process required in living cells. Autophagy is responsible for degrading cellular proteins and is currently the only known process for degrading cellular organelles, recycling them to ensure cell survival. Aging Organelles Cytosolic Proteins for breakdown Nutrient Depletion Cytosolic Proteins (eg. LC3) LC3 Autophagosome Lysosome mTor 1. Induction and LC3 translocation 2. Autophagosome formation 3. Docking & fusion with the lysosyme 4. Autophagosome breakdown PLASMA MEMBRANE
-
Upload
khangminh22 -
Category
Documents
-
view
0 -
download
0
Transcript of Assessing Autophagy with the guava easyCyte™ Benchtop ...

Assessing Autophagy with the guava easyCyte™ Benchtop Flow CytometerMark Santos, Kevin Su, Luke Armstrong, Angelica Olcott, Jason Whalley, and Matthew HsuEMD Millipore
Application Note
IntroductionAutophagy is an intracellular catabolic pathway which
causes cellular protein and organelle turnover, and is
associated with diverse diseases such as Alzheimer’s
disease, cancer, and Crohn’s disease, in addition to aging.
It is a tightly regulated process that plays a normal part
in cell growth, development, and cellular homeostasis.
Autophagy functions as a housekeeping mechanism
through disposal of aging and dysfunctional proteins
and organelles by sequestering and priming them for
lysosomal degradation (Figure 1). Increasing evidence
suggests that not only apoptosis, but also autophagy, can
contribute to cell death and greatly influence general cell
health. Malfunctions of autophagy can adversely impact
longevity and the capability of cells to function at full
capacity. In cancer cells, autophagy can compensate for
hypoxic conditions and nutrient starvation; on the other
hand, activation of cell death via autophagy can kill
tumor cells. As a result, there is great interest in assays
that can efficiently screen for activators and inhibitors
of autophagy.
EMD Millipore is a division of Merck KGaA, Darmstadt, Germany
Figure 1. Autophagy maintains cellular homeostasis. Autophagy is a constitutive and dynamic cellular catabolic process required in living cells. Autophagy is responsible for degrading cellular proteins and is currently the only known process for degrading cellular organelles, recycling them to ensure cell survival.
Aging Organelles
Cytosolic Proteinsfor breakdown
Nutrient Depletion
Cytosolic Proteins (eg. LC3)
LC3
Autophagosome
Lysosome
mTor
1. Induction and LC3 translocation
2. Autophagosome formation
3. Docking & fusion with the lysosyme
4. Autophagosome breakdown
PLASMA MEMBRANE

2
Types of cellular stress, such as nutrient limitation,
hypoxia, oxidative stress, and DNA damage (genotoxic
stress), can induce autophagy, often via inhibition of
mTOR. Autophagy induction signaling prepares cells
to construct a double membrane vesicle known as
the autophagosome by catalyzing the scaffolding of
Atg proteins (such as LC3) to the pre-autophagosome
membrane, which engulfs aging organelles and
recyclable proteins. In the final step of autophagy,
the outer membrane of autophagosome fuses with
the lysosome that provides the hydrolytic enzyme
machinery and the contents are degraded and recycled.
Here we describe several new optimized assay kits
specifically designed for autophagy evaluation by
flow cytometry and/or imaging. Unlike current flow
cytometry assays for autophagy, these assays can
discriminate between cytosolic and autophagosome-
associated LC3, thereby enabling robust, accurate
evaluation of autophagy.
Two reagents make this discrimination possible
as shown in this study. First, using a selective
permeabilization solution to extract cytosolic LC3
and then flushing the extracted LC3 away during
washing steps enables specific quantification of LC3
translocation using flow cytometry (Figure 2).
Moreover, since autophagy is a constitutive cellular
degradation process, we show that a second
proprietary reagent to prevent the lysosomal
degradation of LC3 allows for accurate quantification
of LC3 fluorescence following its accumulation in the
autophagosome. Using the selective permeabilization
solution along with the lysosomal degradation
inhibitor protects autophagosomal LC3 from both
extraction and degradation, which allows its
fluorescence to be measured by flow cytometry or
imaging.
Three of the kits use a model reporter cell line
format to evaluate the impact of compounds on LC3
translocation, while a fourth kit provides a proprietary,
human anti-LC3-FITC antibody conjugate for specific
evaluation of autophagy in primary cells and cell
lines that express detectable LC3. The reporter cell
lines express fusions with monomeric GFP or RFP to
minimize dimer formation and aggregation and to
facilitate translocation and flow cytometry analysis.
The GFP or RFP used in the fusion proteins is attached
on the 5’ end (N-terminal fusion), protecting the
fluorescent tags from Atg4 cleavage, allowing their
visualization within autophagosomes (Figure 3). The
ability to track fluorescently labeled autophagosomes
thus provides a tool for measuring autophagy in
individual cells.
Figure 2. Selective permeabilization aids in discriminating cytosolic from autophagic LC3. Discrimination between cytosolic GFP-LC3-I from autophagosome-associated GFP-LC3-II is achieved by disrupting the plasma membrane with a selective permeabilization solution. Selective permeabilization releases cytosolic LC3, which is then flushed away during washing steps. GFP-LC3-II trapped in the autophagosome remains intact and its fluorescence can be measured.
Accumulation of Autophagosomes
Selective Permeabilization
SelectivePermeabilization

3
Our system utilizes cell lines stably expressing GFP- or
RFP-LC3, transfected either into a Chinese hamster
ovary (CHO) or human osteosarcoma (U20S) cell
background. A stable GFP- or RFP-LC3 reporter system
is ideal for screening of autophagy-modulating
compounds. LC3 tagged at its N-terminus with GFP
or RFP allows tracking the translocation of LC3
from the cytosol and into the autophagosome more
clearly and definitively than monitoring endogenous
protein by antibody-based methods. Especially
when endogenous LC3 levels are below the limits of
immunodetection, using exogenous LC3 constructs
shows a clear benefit. Another advantage of using a
stable GFP- or RFP-LC3 reporter system is the ability to
analyze a larger number of cells, because nearly 100%
of the population expresses tagged LC3. Analyzing
more cells can yield greater statistical significance
to experimental observations, for more productive
research and better decision-making.
Figure 3. N-terminally fused (but not C-terminally fused) GFP-LC3 is a valid marker for autophagy. According to Klionsky (2011), the location of GFP fusion to LC3 is critical for measurement of LC3 translocation to serve as a marker for autophagosomes. If GFP is fused to the C-Terminal (or 3’ end), following Atg4 cleavage GFP is removed and subsequently GFP is now lost. But GFP fusion to the N-terminus (or 5’ end) will retain GFP, making this construct a suitable marker to track autophagic activity.
C-terminal fusion
Free GFP: not a marker of the phagophore or autophagosome
N-terminal fusion
ATG4
LC3
ATG7
LC3
ATG3
LC3
G-PELC3
G
G*
GR GFP
R GFP
ATG4
LC3
ATG7
LC3
ATG3
LC3
G-PELC3
G
G*
GRGFP
GFP
GFP
GFP
GFP-LC3-PE: a marker of the phagophore or autophagosome
Having the ability to measure compound activity is
crucial to screening and rank-ordering compounds in
drug discovery campaigns. Here, we have demonstrated
the utility of our above-described flow cytometry assay
for measuring the autophagy-modulating activity
of compounds. First, we show identification of an
autophagy inducer (rapamycin) or an autophagy inhibitor
(dynasore). Second, we describe the detailed compound
analysis and rank-ordering of autophagy inducers
(STF-62247 and PI-103) based on the mean fluorescence
intensities generated by titration of these known
autophagy inducing compounds. We show quantitative
activity measurement for STF-62247 and PI-103 via dose
response curves to derive EC50 values.
MethodsMonitoring autophagosomes by flow cytometryTo measure autophagy by LC3-II recruitment into the
autophagosomes, we used a variety of adherent and
suspension cell lines as well as cell lines stably expressing
GFP-tagged LC3, transfected either into a CHO or a U20S cell
background. Cells were harvested and placed into a 96-well
assay plate, either in nutrient deprived/starved conditions
or left in normal fed conditions as a control. Cells were then
treated with a lysosomal degradation inhibitor for 2 hours.
Cells were then washed with a selective permeabilization
buffer at room temperature to extract all cytosolic LC3-I,
followed by one wash with assay buffer to remove any
residual permeabilization buffer from the cells. For the cell
lines expressing only endogenous LC3, all cell samples were
resuspended in 95 μL 1X Assay Buffer plus 5 μL of 20X
optimized anti-LC3/FITC antibody for 30 minutes at room
temperature in the dark, then washed once with assay
buffer. Data were acquired using a guava easyCyte™ 8HT
flow cytometer to measure the fluorescence signal from
autophagosome-bound GFP-LC3-II.
RFP-LC3 pH-stable reporter cell line for detecting autophagy within acidic cellular microenvironments As the pH environment of cell can vary, it can also be useful
to evaluate LC3 using a reporter cell line with a monomeric
RFP fusion protein attached to LC3 at the 5’ end (N-terminal
fusion). RFP is typically more pH-stable than GFP. This version
of the LC3 is protected by RFP from Atg4 cleavage, which
allows its visualization within the acidic compartment of
the autophagosome. A monomeric RFP is preferred as a
reporter to facilitate the translocation of the fusion protein,
as other forms of RFP will form dimers and aggregate when
over-expressed in the cells, which prevents their extraction
from the cytoplasm and impairs the ability to measure
translocation by flow cytometry.

4
Identification of an autophagy inducer and inhibitor using the FlowCellect™ GFP-LC3 Reporter Autophagy AssayIn order to demonstrate that a GFP reporter-based
system is a viable tool for compound hit identification
by flow cytometry, GFP-LC3-expressing CHO cells were
pretreated with either rapamycin (to induce autophagy)
or dynasore (to inhibit autophagy) for 48 hours. Also,
RFP-LC3-expressing U2OS cells were pretreated with
80 μM dynasore for 3 hours. A lysosomal degradation
inhibitor was also added to the cells simultaneously
(if treatment with dynasore) or 45 minutes after
rapamycin addition (for a total of 48 hours incubation
time) to prevent the autophagosome degradation by
the lysosome.
After treatment, cells were then washed with a selective
permeabilization buffer at room temperature to extract
all cytosolic LC3-I, followed by one wash with assay
buffer to remove any residual permeabilization buffer
from the cells. Data were acquired using a guava
easyCyte™ flow cytometer to measure the fluorescence
signal from autophagosome-bound GFP-LC3-II.
Small molecule structure-activity relationship (SAR) evaluation using the FlowCellect™ GFP-LC3 Reporter Autophagy AssayThe utility of the GFP-LC3 reporter cell line as a screening
tool was further illustrated by measuring the dose-
dependent activity of specific small molecule autophagy
inducers, STF-62247 and PI-103. STF-62247 and PI-103
were titrated in a 12-point, half-log serial dilution and
incubated for 8 hours at 37°C. A lysosomal degradation
inhibitor was also added to the cells approximately
7 hours into the incubation period for 45 minutes to
prevent autophagosome degradation by the lysosome.
Following treatment, cells were then washed with a
selective permeabilization buffer at room temperature
to extract all cytosolic LC3-I, followed by one wash with
assay buffer to remove any residual permeabilization
buffer from the cells. Data were acquired using a guava
easyCyte™ flow cytometer to measure the fluorescence
signal from autophagosome-bound GFP-LC3-II. The
mean fluorescence values, or MFI, were then determined
and plotted using a curve-fitting algorithm built into
the InCyte™ software module to construct EC50 dose
response curves.
Figure 4. GFP-LC3 stable reporter cell line for detecting the rate of autophagy. In (A), without Selective Permeabilization no shift of GFP-LC3 level is detected using flow cytometry before and after starvation (induction of autophagy). The position of the histograms indicates the high level of GFP-LC3 expression in the cytoplasm. In (B), with Selective Permeabilization GFP-LC3 level remains high in autophagosomes when starved in the presence of lysosome inhibitor (green); even without the inhibitor, a slight shift is observed when starved (blue). All the cytosolic GFP-LC3 is washed away if no autophagy is induced by starvation (gray).
A. Without Selective Permeabilization
B. With Selective Permeabilization
GFP-LC3 WT
Coun
t
040
8012
016
020
0
100 101 102 103 104
GFP-LC3 WT
Coun
t
040
8012
016
020
0
100 101 102 103 104
GFP-LC3 WT
Coun
t
040
8012
016
020
0
100 101 102 103 104
GFP-LC3 WT
Coun
t
040
8012
016
020
0
100 101 102 103 104
Non-starved (control for autophagy)
Starved in the absence of lysosome inhibitor
Starved in the presence of lysosome inhibitor

5
Figure 5. RFP-LC3 pH-stable reporter cell line for detecting autophagy. RFP-LC3 level remains high in autophagosomes when starved in the presence of lysosome inhibitor (yellow). All the cytosolic RFP-LC3 is washed away if no autophagy is induced by starvation (gray).
RFP-LC3 (YEL-HLog)
Plot P02, gated P01.R2
Coun
t
040
8012
016
020
0
100 101 102 103 104
ResultsBy implementing a selective permeabilization step plus
the addition of a lysosomal degradation inhibitor, we
were able to measure autophagy via LC3 translocation
and subsequent lipidation into autophagosomes by flow
cytometry. Combining selective permeabilization with
the lysosomal degradation inhibitor was important for
developing a suitable platform for screening of molecules
for induction or inhibition of autophagy. Figure 4A shows
that, without selective permeabilization, the fluorescence
signal of the cell population does not change upon
autophagy induction, even when a lysosomal
degradation inhibitor was added. In contrast, Figure 4B
shows that, with selective permeabilization, nutrient
deprivation results in an increased localization of LC3
to autophagosome membranes, resulting in a rightward
shift in the peak. Nutrient deprivation, together with
lysosome inhibition, resulted in an even more dramatic
change in the LC3-II signal. Next, we used an RFP-LC3
reporter cell line to measure autophagy within acidic
cellular environments (Figure 5). LC3 translocation to the
autophagosomes was detected only upon starvation and
addition of a lysosome inhibitor.

6
Flow cytometry detection of endogenous LC3 translocation to the autophagosome using anti-LC3-FITC conjugate In this experiment, flow cytometry was used to detect
LC3 translocation under starved and non-starved
conditions for a variety of adherent and suspension
human cell lines. After selective permeabilization and
treatment with lysosomal degradation inhibitor, these
cell lines were treated with anti-LC3-FITC antibody
and analyzed using flow cytometry (Figure 6). Without
selective permeabilization (Figure 6A), no shift of LC3
level is detected using flow cytometry before and after
starvation to induce autophagy. The position of the
histograms indicates low endogenous LC3 expression and
constitutive degradation. With selective permeabilization
(Figure 6B), the shift of LC3 to the right indicates an
increased level of LC3, and is observed during autophagy
only in the presence of the lysosome inhibitor (green),
which delays degradation of LC3 in the autophagosomes
and prolongs the signal.
Small Molecule Analysis #1Demonstrating the utility of the FlowCellect™ GFP-LC3 Reporter Autophagy Assay for drug screening and structure-activity relationship studiesWe evaluated the effects of the autophagy inducer,
rapamycin, and the autophagy inhibitor, dynasore, on
GFP-LC3 translocation using the FlowCellect™ GFPLC3
Reporter Autophagy Assay. Rapamycin is an mTOR
inhibitor and induced autophagy in our assay (Figure 7).
This observation was consistent with the known role of
mTOR in regulating autophagy. mTOR is a member of
the PI3-kinase family and is a central modulator of cell
growth in response to environmental signals. It plays
a critical role in transducing proliferative signals by
activating downstream protein kinases that are required
for both ribosomal biosynthesis and translations. 2000
Nobel Laureate Paul Greengard demonstrated that
a small molecule enhancer of rapamycin, SMER28,
decreased levels of amyloid-b(Ab) peptide, a hallmark
of Alzheimer’s disease. Autophagy is one major cellular
pathway leading to the removal of such proteins,
further suggesting that modulating autophagy can have
therapeutic value for Alzheimer’s disease. By targeting
mTOR, rapamycin mimics the cellular starvation response
by inhibiting signals required for cell cycle progression,
cell growth, and proliferation and leads to the activation
of autophagy.
Dynasore is a cell-permeable inhibitor of dynamin.
Dynamin is essential for clathrin-dependent coated
vesicle formation. Dynasore acts as a potent inhibitor of
endocytic pathways known to depend on dynamin by
rapidly blocking coated vesicle formation within seconds
of dynasore addition. As a result, dynasore can prevent
autophagosome formation, in turn inhibiting autophagy.
Consistent with this model, dynasore inhibited LC3
translocation to autophagosomes in both GFP-LC3 and
RFP-LC3-based assays (Figure 8).
Figure 6. Flow cytometry detection of endogenous LC3 translocation into the autophagosome was evaluated using an anti-LC3-FITC conjugate. Representative histograms for the control non-starved cells and starved cells are shown, with and without selective permeabilization, and with and without lysosomal degradation inhibitor.
B. With Selective Permeabilization
A. Without Selective Permeabilization
Plot P03, gated on P01.R1
Coun
t
040
8012
018
024
0
100 101 102 103 104
Green Fluorescence (GRN-HLog)
Plot P04, gated on P01.R1
Coun
t
040
8012
018
024
0
100 101 102 103 104
Green Fluorescence (GRN-HLog)
Non-starved (control for autophagy)
Starved in the absence of lysosome inhibitor
Starved in the presence of lysosome inhibitor

7
Small Molecule Analysis #2Deep dive evaluation of specific autophagy inducers, STF-62247 and PI-103, by EC50 determinationTo further investigate the effect of small molecule
activity on autophagy, we titrated two well-known
autophagy inducers, STF-62247 and PI-103 on our
GFP-LC3 reporter cell line, demonstrating that the
FlowCellect™ GFP-LC3 Reporter Autophagy Assay was
a viable tool for advancing drug candidates. To achieve
a quantitative structure-activity relationship study, we
quantified the level of autophagosome-associated LC3-II
by flow cytometry by calculating the mean fluorescence
intensity of the compound-treated cells relative to the
baseline negative control. From these values, using the
InCyte™ software module, we were able to derive EC50
values showing that PI-103 was a more potent inducer
of autophagy than STF-62247 (Figure 9).
DiscussionData from EMD Millipore’s optimized FlowCellect™
kits for autophagy provide quantitative assessments
of autophagy by flow cytometry and/or imaging. By
measuring the fluorescence signal of translocated LC3
by a stably expressed GFP- or RFP-LC3 fusion protein,
we could detect and measure the rate of cellular
autophagy using flow cytometry. This was achieved
by using a proprietary selective permeabilization
buffer to remove the cytosolic LC3 from cells. Selective
permeabilization enabled the discrimination between
cytosolic and lipidated LC3, which was sequestered
into the autophagosomes. By the addition of a
lysosomal degradation inhibitor, we achieved prolonged
fluorescence signals, yielding more accurate and reliable
data. Because RFP is a more pH-stable fluorescent
tag, the RFP-LC3-expressing cell line proved useful in
providing robust signals in acidic environments.
We also demonstrated that by using the FlowCellect™
GFP-LC3 Reporter Autophagy Assay, we could
successfully characterize compounds that induced
autophagy (rapamycin) or inhibited it (dynasore).
This novel flow cytometry assay is therefore ideal for
screening small molecules for autophagy modulating
effects and amenable to high-throughput environments.
Moreover, we were also able to successfully implement
this method for making SAR determinations by
generating EC50 curves and rank-ordering compounds.
This was demonstrated by the dose response curves
for selective autophagy inducers, STF-62247 and PI-103.
By implementing this assay, autophagy-modulating
compounds can be rank-ordered to help complement
any SAR campaign during drug development, improving
and accelerating decision-making during the process
of advancing lead compounds further in the
development process.
Ultimately, having the ability to accurately measure
autophagosome activity via LC3 translocation (which is a
hallmark of the autophagic process), as well as perform
deep-dive analysis of small molecule activity by deriving
dose response curves, can greatly enhance studies of
cancer, neurodegeneration, and other diseases affected
by autophagy.
Figure 7. Rapamycin induces autophagy, presumably through the mTOR pathway. Rapamycin is an inhibitor of the mTOR pathway, and by targeting mTOR, rapamycin mimics the cellular starvation response and leads to activation of autophagy as illustrated by the right shift of the histogram (green). Cells were treated with 400 nM rapamycin for 48 hours prior to data acquisition.
Rapamycin Treatment
Dynasore Treatment
Figure 8. Dynasore inhibits autophagy by inhibition of autophagosome formation. Dynasore will inhibit autophagosome formation, as shown in both GFP-LC3 reporter cells (top) and RFP-LC3 reporter cells (bottom). Dynasore will inhibit autophagosome formation, which in effect, will inhibit autophagy as illustrated by the left shift of the histogram relative to the untreated control (gray). Cells were treated with 80 μM dynasore for 3 hours prior to data acquisition.
200
160
120
8040
0
100 101
GFP-LC3 WT102 103 104
Coun
t
Untreated SampleRapamycin Treated
160
100
400
100 101
GFP-LC3 WT102 103 104
Coun
t
Untreated SampleRapamycin TreatedUntreated SampleDynasore Treated
8
Key Aspects of FlowCellect™ Autophagy Kits for Flow CytometryEMD Millipore’s FlowCellect™ GFP-LC3 Reporter
Autophagy Assay Kits provide a quantitative solution
for studying autophagy and measuring the potency of
autophagy inducers using flow cytometry. These kits have
four unique features to aid in the detailed evaluation of
autophagy by flow cytometry:
• Selective permeabilization solution discriminates
between cytosolic LC3 from autophagic LC3 by
extracting the soluble cytosolic proteins, while
protecting LC3 which has been sequestered into the
autophagosome
• Monomeric GFP or RFP is used as a reporter to
facilitate the translocation of the fusion protein.
Other forms of GFP or RFP form dimers and
aggregate when overexpressed in the cells, making it
difficult to extract from the cytoplasm and impossible
to measure translocation by flow cytometry
• Included autophagy detection reagent prevents
lysosomal degradation of LC3, allowing its
quantification by flow cytometry and prolonging the
signaling event for robust measurement.
• The monomeric GFP or RFP used in our LC3 fusion
protein is attached on the 5’ end (N-terminal fusion),
protecting the GFP or RFP from Atg 4 cleavage,
allowing its visualization within the autophagosomes
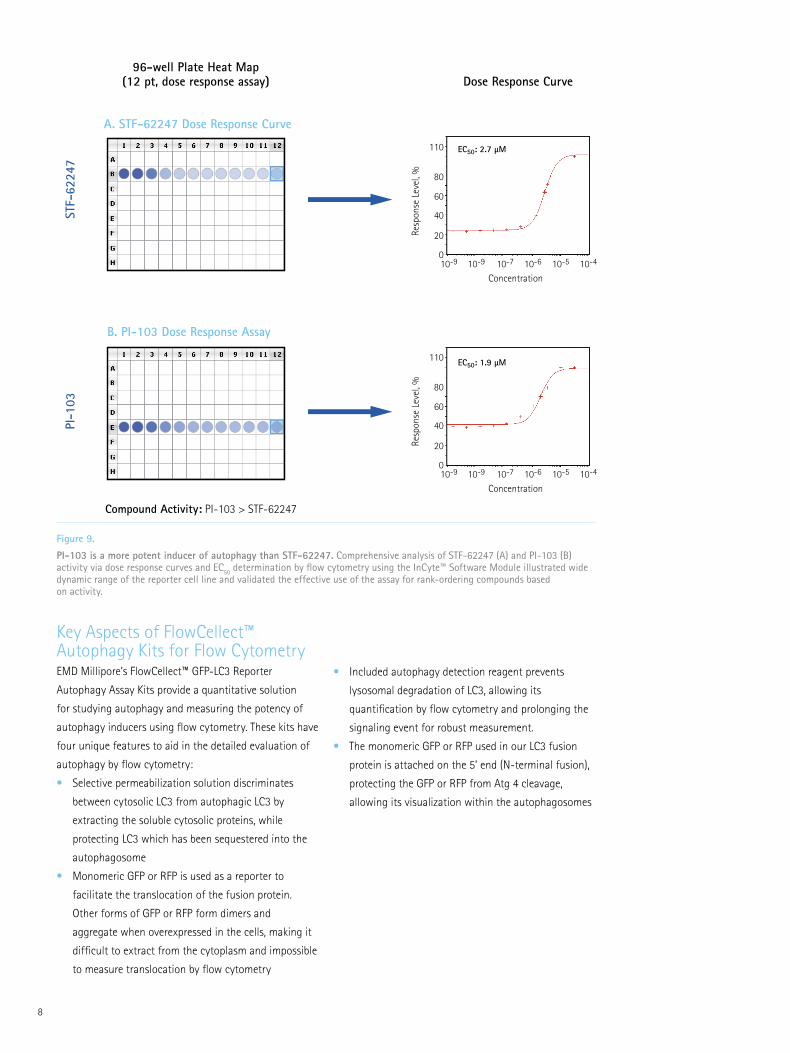
Figure 9. PI-103 is a more potent inducer of autophagy than STF-62247. Comprehensive analysis of STF-62247 (A) and PI-103 (B) activity via dose response curves and EC50 determination by flow cytometry using the InCyte™ Software Module illustrated wide dynamic range of the reporter cell line and validated the effective use of the assay for rank-ordering compounds based on activity.
96-well Plate Heat Map(12 pt, dose response assay) Dose Response Curve
A. STF-62247 Dose Response Curve
STF-
6224
7PI
-103
B. PI-103 Dose Response Assay
110
80
0
20
40
60
10-9 10-9 10-7
Concentration10-6 10-5 10-4
Resp
onse
Lev
el, %
110
80
0
20
40
60
10-9 10-9 10-7
Concentration10-6 10-5 10-4
Resp
onse
Lev
el, %
EC50: 2.7 µM
EC50: 1.9 µM
Compound Activity: PI-103 > STF-62247

9
References
1. Shvets, E., et al. (2008). Utilizing flow cytometry
to monitor autophagy in living mammalian cells.
Autophagy; 4(5): 621-8.
2. Zhang, L., et al. (2007). Small molecule regulators
of autophagy identified by an image-based
high-throughput screen. Proc Natl Acad Sci
USA;104(48):19023-8.
3. Degtyarev, M., et al. (2008). Akt inhibition promotes
autophagy and sensitizes PTEN-null tumors to
lysosomotropic agents. J Cell Biol.;183(1):101-16.
4. Mizushima, N., et al. (2004). Methods for monitoring
autophagy. Int J Biochem Cell Biol.;36(12):2491-502.
5. Fleming, A., et al. (2010). Chemical modulators
of autophagy as biological probes and potential
therapeutics. Nat Chem Biol.;7(1):9-17.
6. Tsien, R., (1998). The Green Fluorescent Protein. Annu.
Rev. Biochem.; 67:509–44.
7. Tian, Y., et al. (2011). A small-molecule enhancer
of autophagy decreases levels of A and APP-CTF
via Atg5-dependent autophagy pathway. FASEB
J.;25(6):1934-42.
8. Turcotte, T., et al. (2008). A molecule targeting
VHL-deficient Renal Cell Carcinoma that induces
autophagy. Cancer Cell; 14(1):90-102.
9. Klionsky, D. J., et al. (2011). For the last time, it is
GFP-Atg8, not Atg8-GFP (and the same goes for LC3).
Autophagy; 7(10):1093-4.

EMD Millipore and the M mark are trademarks of Merck KGaA, Darmstadt, Germany. FlowCellect, easyCyte, and InCyte are trademarks of Millipore Corporation.Lit No. AN4667EN00 BS GEN-12-07256 Printed in the USA. 09/2012 © 2012 Millipore Corporation. All rights reserved.
www.emdmillipore.com
Get Connected!Join EMD Millipore Bioscience on your favorite social media outlet for the latest updates, news, products, innovations, and contests!
facebook.com/EMDMilliporeBioscience
twitter.com/EMDMilliporeBio
Description Catalogue No.
FlowCellect™ GFP-LC3 Reporter Autophagy Assay Kit (CHO), 100 tests (flow cytometry) FCCH100170
FlowCellect™ GFP-LC3 Reporter Autophagy Assay Kit (U2OS), 100 tests (flow cytometry and imaging) FCCH100181
FlowCellect™ RFP-LC3 Reporter Autophagy Assay Kit (U2OS), 100 tests (flow cytometry and imaging) FCCH100183
FlowCellect™ Autophagy Antibody-based Assay Kit, 100 tests (flow cytometry) FCCH100171
FlowCellect™ Histone H2A.X Phosphorylation Assay Kit, 100 tests FCCS100182
FlowCellect™ Autophagy Detection Reagent Pack, 100 tests CF200097
FlowCellect™ DNA Damage Histone H2A.X Dual Detection, 25 tests FCCS025153
FlowCellect™ Multi-Color DNA Damage Response Kit, 25 tests FCCH025104
FlowCellect™ Cell Cycle Checkpoint H2A.X DNA Damage Kit, 25 tests FCCH025142
FlowCellect™ Cell Cycle Checkpoint ATM DNA Damage Kit, 25 tests FCCH025143
Rapamycin 553210
Dynamin Inhibitor I, Dynasore 324410
STF-62247; N-(3-Methylphenyl)-4-(4-pyridinyl)-2-thiazolamine 189497
PI-103 528100
Related Products
To Place an Order or ReceiveTechnical AssistanceIn the U.S. and Canada, call toll-free 1-800-645-5476
For other countries across Europe and the world, please visit www.millipore.com/offices
For Technical Service, please visit www.millipore.com/techservice