Production of guava nectar supplemented with Aloe vera gel
19
1 Production of guava nectar supplemented with Aloe vera gel S. M. Abed, M. A. Elbandy*, S. S.-A. Gad and M. G. Abdel-Fadeel Food and Dairy Science and Technology Dept. Environ. Agric. Sci. Fac., Suez Canal Univ., El Arish, Egypt. ABSTRACT This study was carried out to produce guava nectar with high therapeutic and nutrition properties using guava pulp mixed with Aloe vera gel. Effect of the different levels 5, 10, 15, 20 and 25% of Aloe vera gel used, on the physical, microbial and chemical properties such as total soluble solids, total acidity, pH, ascorbic acid content, total sugars, reducing sugars, viscosity and total bacterial counts were evaluated. The results showed that, there were differences between nectars when different levels of Aloe vera gel were used. When 25% Aloe vera gel was added, total soluble solids increased from 15% in control treatment to 15.5%, total acidity increased from 0.35 to 0.39%, total sugars did not change, viscosity increased from 92 to 114 centibois, pH decreased from 3.93 to 3.65 and vitamin C increased from 138 to 144.9 mg/ 100g. Total bacterial counts (TBC) demonstrated that the high concentrations of Aloe vera gel (20 and 25%) resulted in a dramatic fall in the levels of total bacterial counts. Total bacterial counts decreased from log10 4.02 CFU/ml in control treatment at zero time point to log10 2.05 CFU/ml as a result of Aloe vera gel addition with 20 and 25%. Effect of storage for six months on physical and chemical properties of guava nectars were also studied and the produced guava nectar supported with Aloe vera gel showed good quality attributes, and good stability. So, these results were sufficient to recommend the addition of Aloe vera gel with 20 - 25% to produce functional guava nectar. Key words: Aloe vera, guava, gel, nectar, bioactive compounds, antimicrobial, anti-oxidant, functional foods, therapeutic properties. *To whom correspondence should be addressed. E-mail: [email protected]
Transcript of Production of guava nectar supplemented with Aloe vera gel
1
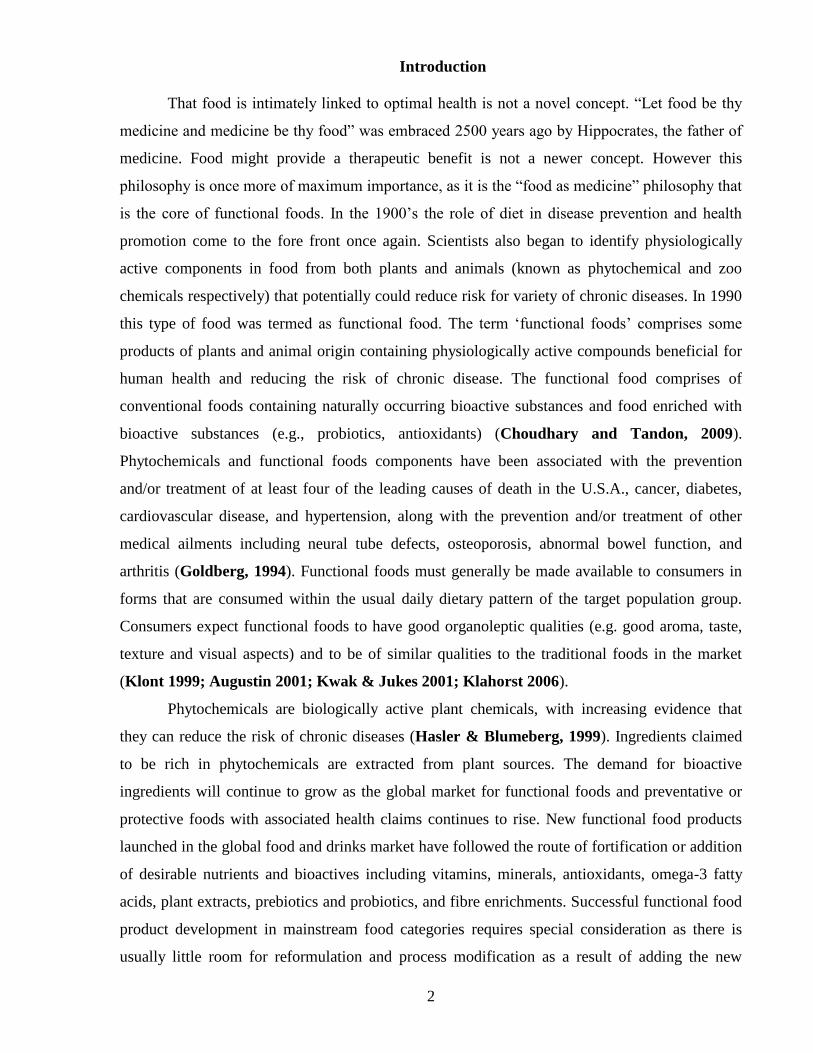
Production of guava nectar supplemented with Aloe vera gel
S. M. Abed, M. A. Elbandy*, S. S.-A. Gad and M. G. Abdel-Fadeel
Food and Dairy Science and Technology Dept. Environ. Agric. Sci. Fac., Suez Canal Univ., El
Arish, Egypt.
ABSTRACT
This study was carried out to produce guava nectar with high therapeutic and nutrition
properties using guava pulp mixed with Aloe vera gel. Effect of the different levels 5, 10, 15, 20
and 25% of Aloe vera gel used, on the physical, microbial and chemical properties such as total
soluble solids, total acidity, pH, ascorbic acid content, total sugars, reducing sugars, viscosity
and total bacterial counts were evaluated. The results showed that, there were differences
between nectars when different levels of Aloe vera gel were used. When 25% Aloe vera gel was
added, total soluble solids increased from 15% in control treatment to 15.5%, total acidity
increased from 0.35 to 0.39%, total sugars did not change, viscosity increased from 92 to 114
centibois, pH decreased from 3.93 to 3.65 and vitamin C increased from 138 to 144.9 mg/ 100g.
Total bacterial counts (TBC) demonstrated that the high concentrations of Aloe vera gel (20 and
25%) resulted in a dramatic fall in the levels of total bacterial counts. Total bacterial counts
decreased from log10 4.02 CFU/ml in control treatment at zero time point to log10 2.05 CFU/ml
as a result of Aloe vera gel addition with 20 and 25%. Effect of storage for six months on
physical and chemical properties of guava nectars were also studied and the produced guava
nectar supported with Aloe vera gel showed good quality attributes, and good stability. So, these
results were sufficient to recommend the addition of Aloe vera gel with 20 - 25% to produce
functional guava nectar.
Key words: Aloe vera, guava, gel, nectar, bioactive compounds, antimicrobial, anti-oxidant,
functional foods, therapeutic properties.
*To whom correspondence should be addressed.
E-mail: [email protected]
2
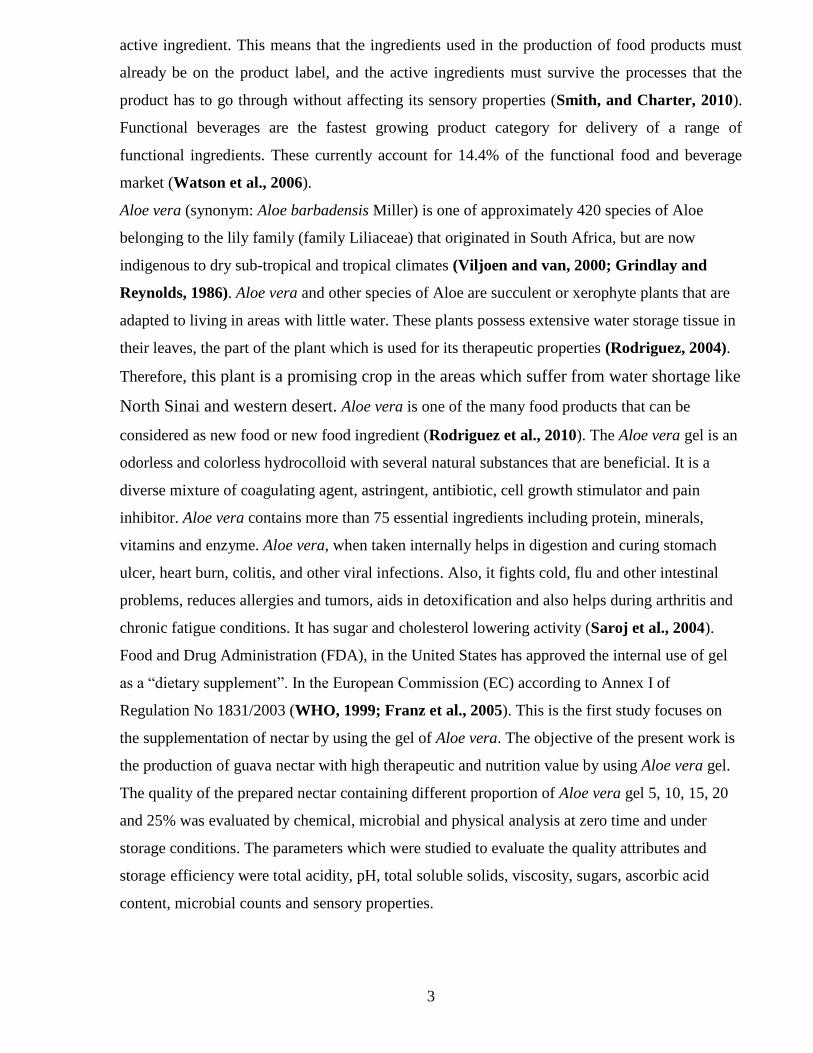
Introduction
That food is intimately linked to optimal health is not a novel concept. “Let food be thy
medicine and medicine be thy food” was embraced 2500 years ago by Hippocrates, the father of
medicine. Food might provide a therapeutic benefit is not a newer concept. However this
philosophy is once more of maximum importance, as it is the “food as medicine” philosophy that
is the core of functional foods. In the 1900’s the role of diet in disease prevention and health
promotion come to the fore front once again. Scientists also began to identify physiologically
active components in food from both plants and animals (known as phytochemical and zoo
chemicals respectively) that potentially could reduce risk for variety of chronic diseases. In 1990
this type of food was termed as functional food. The term ‘functional foods’ comprises some
products of plants and animal origin containing physiologically active compounds beneficial for
human health and reducing the risk of chronic disease. The functional food comprises of
conventional foods containing naturally occurring bioactive substances and food enriched with
bioactive substances (e.g., probiotics, antioxidants) (Choudhary and Tandon, 2009).
Phytochemicals and functional foods components have been associated with the prevention
and/or treatment of at least four of the leading causes of death in the U.S.A., cancer, diabetes,
cardiovascular disease, and hypertension, along with the prevention and/or treatment of other
medical ailments including neural tube defects, osteoporosis, abnormal bowel function, and
arthritis (Goldberg, 1994). Functional foods must generally be made available to consumers in
forms that are consumed within the usual daily dietary pattern of the target population group.
Consumers expect functional foods to have good organoleptic qualities (e.g. good aroma, taste,
texture and visual aspects) and to be of similar qualities to the traditional foods in the market
(Klont 1999; Augustin 2001; Kwak & Jukes 2001; Klahorst 2006).
Phytochemicals are biologically active plant chemicals, with increasing evidence that
they can reduce the risk of chronic diseases (Hasler & Blumeberg, 1999). Ingredients claimed
to be rich in phytochemicals are extracted from plant sources. The demand for bioactive
ingredients will continue to grow as the global market for functional foods and preventative or
protective foods with associated health claims continues to rise. New functional food products
launched in the global food and drinks market have followed the route of fortification or addition
of desirable nutrients and bioactives including vitamins, minerals, antioxidants, omega-3 fatty
acids, plant extracts, prebiotics and probiotics, and fibre enrichments. Successful functional food
product development in mainstream food categories requires special consideration as there is
usually little room for reformulation and process modification as a result of adding the new
3
active ingredient. This means that the ingredients used in the production of food products must
already be on the product label, and the active ingredients must survive the processes that the
product has to go through without affecting its sensory properties (Smith, and Charter, 2010).
Functional beverages are the fastest growing product category for delivery of a range of
functional ingredients. These currently account for 14.4% of the functional food and beverage
market (Watson et al., 2006).
Aloe vera (synonym: Aloe barbadensis Miller) is one of approximately 420 species of Aloe
belonging to the lily family (family Liliaceae) that originated in South Africa, but are now
indigenous to dry sub-tropical and tropical climates (Viljoen and van, 2000; Grindlay and
Reynolds, 1986). Aloe vera and other species of Aloe are succulent or xerophyte plants that are
adapted to living in areas with little water. These plants possess extensive water storage tissue in
their leaves, the part of the plant which is used for its therapeutic properties (Rodriguez, 2004).
Therefore, this plant is a promising crop in the areas which suffer from water shortage like
North Sinai and western desert. Aloe vera is one of the many food products that can be
considered as new food or new food ingredient (Rodriguez et al., 2010). The Aloe vera gel is an
odorless and colorless hydrocolloid with several natural substances that are beneficial. It is a
diverse mixture of coagulating agent, astringent, antibiotic, cell growth stimulator and pain
inhibitor. Aloe vera contains more than 75 essential ingredients including protein, minerals,
vitamins and enzyme. Aloe vera, when taken internally helps in digestion and curing stomach
ulcer, heart burn, colitis, and other viral infections. Also, it fights cold, flu and other intestinal
problems, reduces allergies and tumors, aids in detoxification and also helps during arthritis and
chronic fatigue conditions. It has sugar and cholesterol lowering activity (Saroj et al., 2004).
Food and Drug Administration (FDA), in the United States has approved the internal use of gel
as a “dietary supplement”. In the European Commission (EC) according to Annex I of
Regulation No 1831/2003 (WHO, 1999; Franz et al., 2005). This is the first study focuses on
the supplementation of nectar by using the gel of Aloe vera. The objective of the present work is
the production of guava nectar with high therapeutic and nutrition value by using Aloe vera gel.
The quality of the prepared nectar containing different proportion of Aloe vera gel 5, 10, 15, 20
and 25% was evaluated by chemical, microbial and physical analysis at zero time and under
storage conditions. The parameters which were studied to evaluate the quality attributes and
storage efficiency were total acidity, pH, total soluble solids, viscosity, sugars, ascorbic acid
content, microbial counts and sensory properties.
4
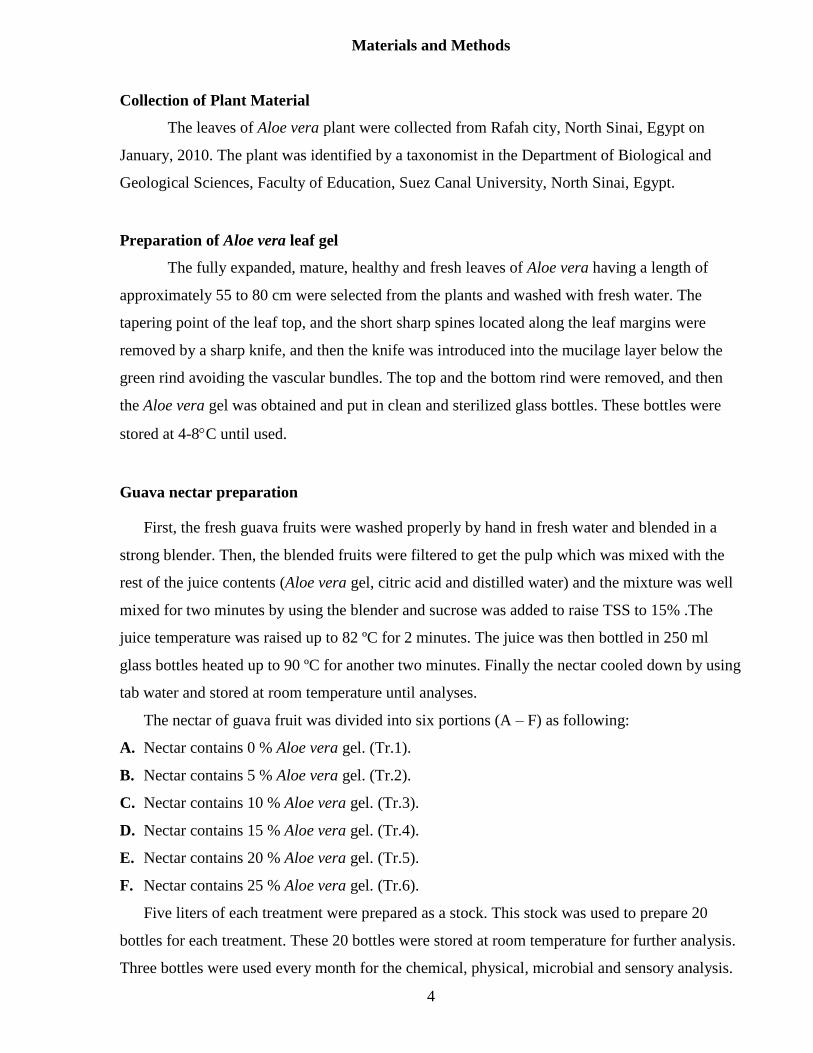
Materials and Methods
Collection of Plant Material
The leaves of Aloe vera plant were collected from Rafah city, North Sinai, Egypt on
January, 2010. The plant was identified by a taxonomist in the Department of Biological and
Geological Sciences, Faculty of Education, Suez Canal University, North Sinai, Egypt.
Preparation of Aloe vera leaf gel
The fully expanded, mature, healthy and fresh leaves of Aloe vera having a length of
approximately 55 to 80 cm were selected from the plants and washed with fresh water. The
tapering point of the leaf top, and the short sharp spines located along the leaf margins were
removed by a sharp knife, and then the knife was introduced into the mucilage layer below the
green rind avoiding the vascular bundles. The top and the bottom rind were removed, and then
the Aloe vera gel was obtained and put in clean and sterilized glass bottles. These bottles were
stored at 4-8C until used.
Guava nectar preparation
First, the fresh guava fruits were washed properly by hand in fresh water and blended in a
strong blender. Then, the blended fruits were filtered to get the pulp which was mixed with the
rest of the juice contents (Aloe vera gel, citric acid and distilled water) and the mixture was well
mixed for two minutes by using the blender and sucrose was added to raise TSS to 15% .The
juice temperature was raised up to 82 ºC for 2 minutes. The juice was then bottled in 250 ml
glass bottles heated up to 90 ºC for another two minutes. Finally the nectar cooled down by using
tab water and stored at room temperature until analyses.
The nectar of guava fruit was divided into six portions (A – F) as following:
A. Nectar contains 0 % Aloe vera gel. (Tr.1).
B. Nectar contains 5 % Aloe vera gel. (Tr.2).
C. Nectar contains 10 % Aloe vera gel. (Tr.3).
D. Nectar contains 15 % Aloe vera gel. (Tr.4).
E. Nectar contains 20 % Aloe vera gel. (Tr.5).
F. Nectar contains 25 % Aloe vera gel. (Tr.6).
Five liters of each treatment were prepared as a stock. This stock was used to prepare 20
bottles for each treatment. These 20 bottles were stored at room temperature for further analysis.
Three bottles were used every month for the chemical, physical, microbial and sensory analysis.
5
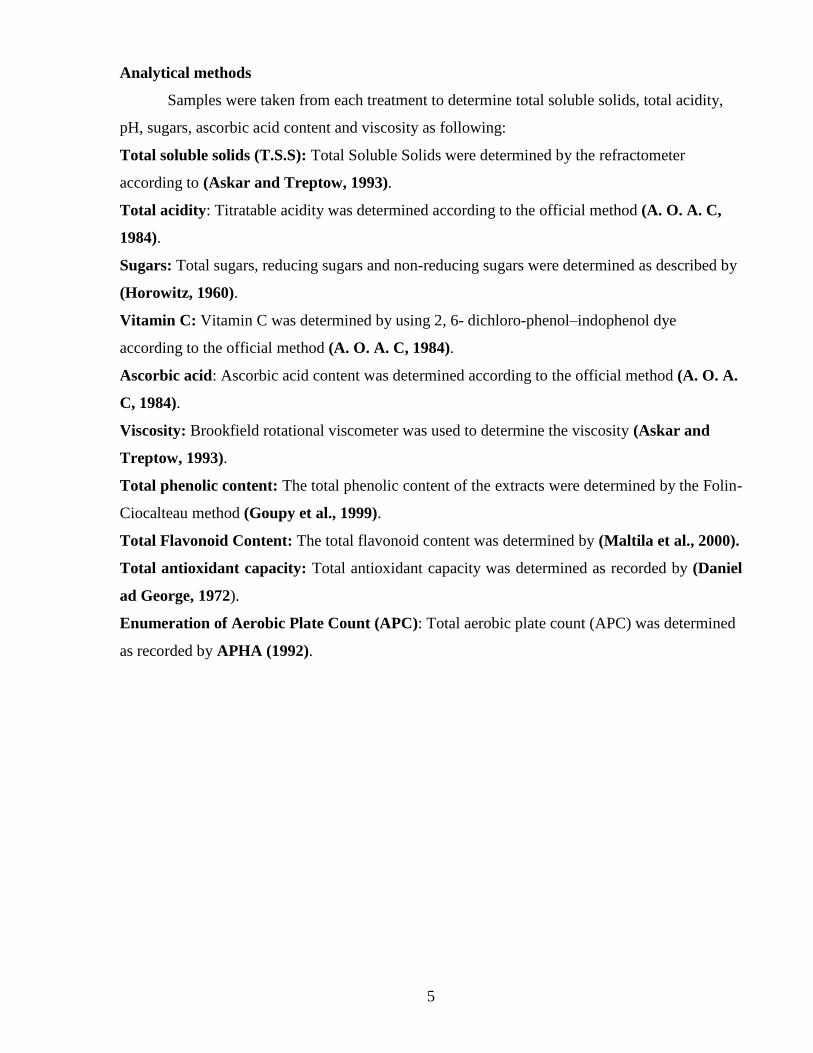
Analytical methods
Samples were taken from each treatment to determine total soluble solids, total acidity,
pH, sugars, ascorbic acid content and viscosity as following:
Total soluble solids (T.S.S): Total Soluble Solids were determined by the refractometer
according to (Askar and Treptow, 1993).
Total acidity: Titratable acidity was determined according to the official method (A. O. A. C,
1984).
Sugars: Total sugars, reducing sugars and non-reducing sugars were determined as described by
(Horowitz, 1960).
Vitamin C: Vitamin C was determined by using 2, 6- dichloro-phenol–indophenol dye
according to the official method (A. O. A. C, 1984).
Ascorbic acid: Ascorbic acid content was determined according to the official method (A. O. A.
C, 1984).
Viscosity: Brookfield rotational viscometer was used to determine the viscosity (Askar and
Treptow, 1993).
Total phenolic content: The total phenolic content of the extracts were determined by the Folin-
Ciocalteau method (Goupy et al., 1999).
Total Flavonoid Content: The total flavonoid content was determined by (Maltila et al., 2000).
Total antioxidant capacity: Total antioxidant capacity was determined as recorded by (Daniel
ad George, 1972).
Enumeration of Aerobic Plate Count (APC): Total aerobic plate count (APC) was determined
as recorded by APHA (1992).
6
Results and Discussion
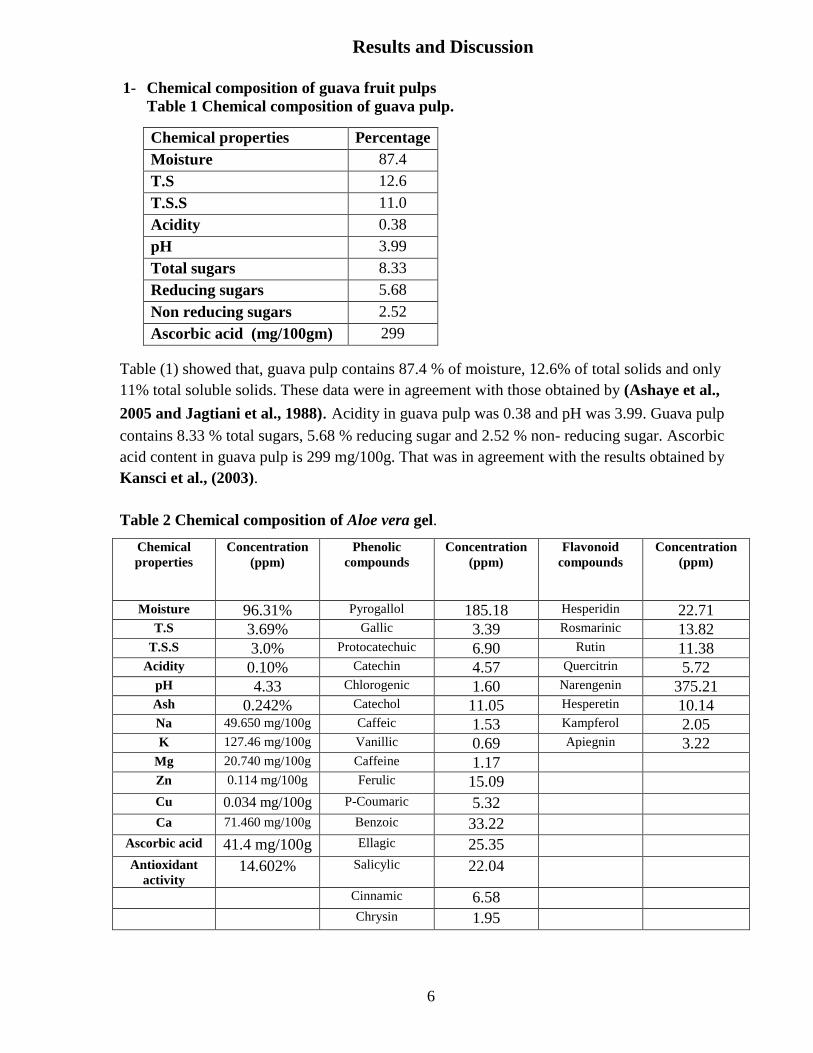
1- Chemical composition of guava fruit pulps
Table 1 Chemical composition of guava pulp.
Table (1) showed that, guava pulp contains 87.4 % of moisture, 12.6% of total solids and only
11% total soluble solids. These data were in agreement with those obtained by (Ashaye et al.,
2005 and Jagtiani et al., 1988). Acidity in guava pulp was 0.38 and pH was 3.99. Guava pulp
contains 8.33 % total sugars, 5.68 % reducing sugar and 2.52 % non- reducing sugar. Ascorbic
acid content in guava pulp is 299 mg/100g. That was in agreement with the results obtained by
Kansci et al., (2003).
Table 2 Chemical composition of Aloe vera gel.
Concentration
(ppm)
Flavonoid
compounds
Concentration
(ppm)
Phenolic
compounds
Concentration
(ppm)
Chemical
properties
22.71 Hesperidin 185.18 Pyrogallol 96.31% Moisture
13.82 Rosmarinic 3.39 Gallic 3.69% T.S
11.38 Rutin 6.90 Protocatechuic 3.0% T.S.S
5.72 Quercitrin 4.57 Catechin 0.10% Acidity
375.21 Narengenin 1.60 Chlorogenic 4.33 pH
10.14 Hesperetin 11.05 Catechol 0.242% Ash
2.05 Kampferol 1.53 Caffeic 49.650 mg/100g Na
3.22 Apiegnin 0.69 Vanillic 127.46 mg/100g K
1.17 Caffeine 20.740 mg/100g Mg
15.09 Ferulic 0.114 mg/100g Zn
5.32 P-Coumaric 0.034 mg/100g Cu
33.22 Benzoic 71.460 mg/100g Ca
25.35 Ellagic 41.4 mg/100g Ascorbic acid
22.04 Salicylic 14.602% Antioxidant
activity 6.58 Cinnamic
1.95 Chrysin
Chemical properties Percentage
Moisture 87.4
T.S 12.6
T.S.S 11.0
Acidity 0.38
pH 3.99
Total sugars 8.33
Reducing sugars 5.68
Non reducing sugars 2.52
Ascorbic acid (mg/100gm) 299
7
Table (2) showed that, the moisture percentage in Aloe vera gel was 96.31%; this was
agree with the result of Eshun and He, (2004) and lower than the result obtained by Goyal and
Sharma, (2009) who found that the moisture percentage in fresh Aloe vera gel was 97.2 %.
Acidity in Aloe vera gel was 0.10 and pH was 4.33, these results were similar to the results of
Bozzi et al., (2007) who found that the pH of Aloe vera gel was between 4.0 - 5.0, the high
acidity of the Aloe vera gel may be due to the accumulation of organic acids. Ascorbic acid
content in Aloe vera gel is 41.4 mg/100g. This result is also in agreement with the result reported
by Mohamed (2011) who stated that; vitamin C in fresh Aloe vera gel was 40 mg/100g. On the
other hand, this result is lower than the result obtained by Goyal and Sharma, (2009) who found
that vitamin C in fresh Aloe vera gel was 53 mg/100g.
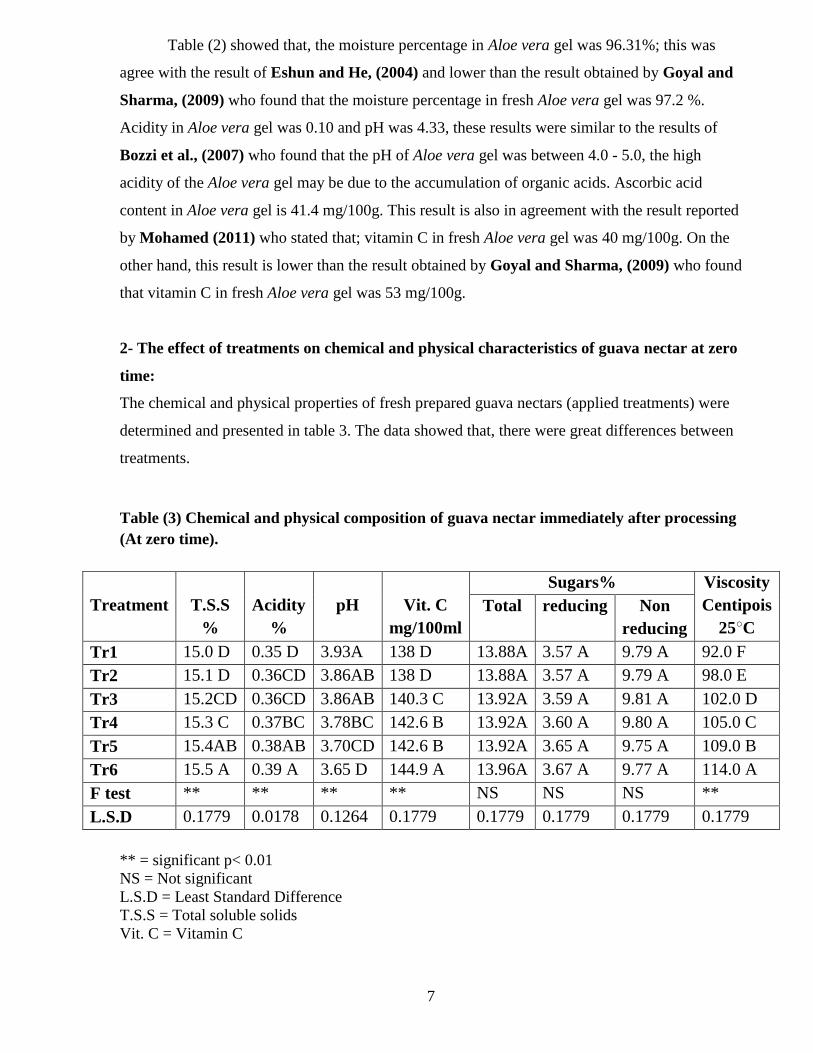
2- The effect of treatments on chemical and physical characteristics of guava nectar at zero
time:
The chemical and physical properties of fresh prepared guava nectars (applied treatments) were
determined and presented in table 3. The data showed that, there were great differences between
treatments.
Table (3) Chemical and physical composition of guava nectar immediately after processing
(At zero time).
** = significant p< 0.01
NS = Not significant
L.S.D = Least Standard Difference
T.S.S = Total soluble solids
Vit. C = Vitamin C
Treatment
T.S.S
%
Acidity
%
pH
Vit. C
mg/100ml
Sugars% Viscosity
Centipois
25○C
Total reducing Non
reducing
Tr1 15.0 D 0.35 D 3.93A 138 D 13.88A 3.57 A 9.79 A 92.0 F
Tr2 15.1 D 0.36CD 3.86AB 138 D 13.88A 3.57 A 9.79 A 98.0 E
Tr3 15.2CD 0.36CD 3.86AB 140.3 C 13.92A 3.59 A 9.81 A 102.0 D
Tr4 15.3 C 0.37BC 3.78BC 142.6 B 13.92A 3.60 A 9.80 A 105.0 C
Tr5 15.4AB 0.38AB 3.70CD 142.6 B 13.92A 3.65 A 9.75 A 109.0 B
Tr6 15.5 A 0.39 A 3.65 D 144.9 A 13.96A 3.67 A 9.77 A 114.0 A
F test ** ** ** ** NS NS NS **
L.S.D 0.1779 0.0178 0.1264 0.1779 0.1779 0.1779 0.1779 0.1779
8
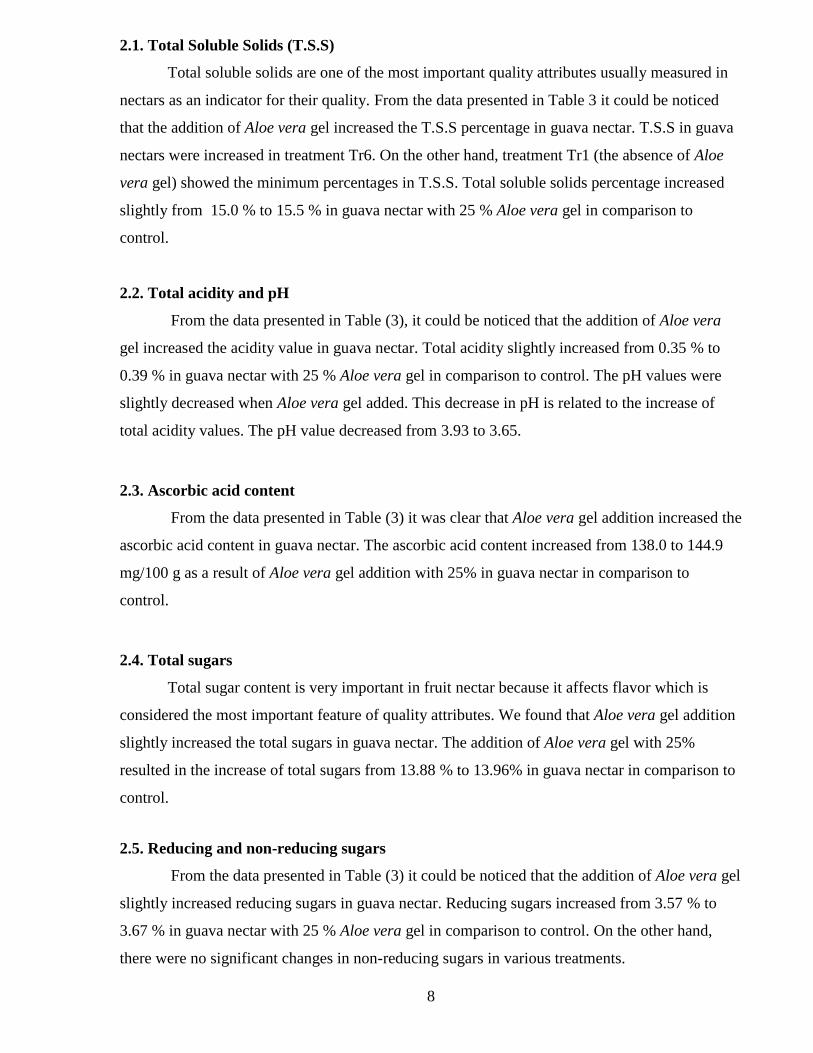
2.1. Total Soluble Solids (T.S.S)
Total soluble solids are one of the most important quality attributes usually measured in
nectars as an indicator for their quality. From the data presented in Table 3 it could be noticed
that the addition of Aloe vera gel increased the T.S.S percentage in guava nectar. T.S.S in guava
nectars were increased in treatment Tr6. On the other hand, treatment Tr1 (the absence of Aloe
vera gel) showed the minimum percentages in T.S.S. Total soluble solids percentage increased
slightly from 15.0 % to 15.5 % in guava nectar with 25 % Aloe vera gel in comparison to
control.
2.2. Total acidity and pH
From the data presented in Table (3), it could be noticed that the addition of Aloe vera
gel increased the acidity value in guava nectar. Total acidity slightly increased from 0.35 % to
0.39 % in guava nectar with 25 % Aloe vera gel in comparison to control. The pH values were
slightly decreased when Aloe vera gel added. This decrease in pH is related to the increase of
total acidity values. The pH value decreased from 3.93 to 3.65.
2.3. Ascorbic acid content
From the data presented in Table (3) it was clear that Aloe vera gel addition increased the
ascorbic acid content in guava nectar. The ascorbic acid content increased from 138.0 to 144.9
mg/100 g as a result of Aloe vera gel addition with 25% in guava nectar in comparison to
control.
2.4. Total sugars
Total sugar content is very important in fruit nectar because it affects flavor which is
considered the most important feature of quality attributes. We found that Aloe vera gel addition
slightly increased the total sugars in guava nectar. The addition of Aloe vera gel with 25%
resulted in the increase of total sugars from 13.88 % to 13.96% in guava nectar in comparison to
control.
2.5. Reducing and non-reducing sugars
From the data presented in Table (3) it could be noticed that the addition of Aloe vera gel
slightly increased reducing sugars in guava nectar. Reducing sugars increased from 3.57 % to
3.67 % in guava nectar with 25 % Aloe vera gel in comparison to control. On the other hand,
there were no significant changes in non-reducing sugars in various treatments.
9
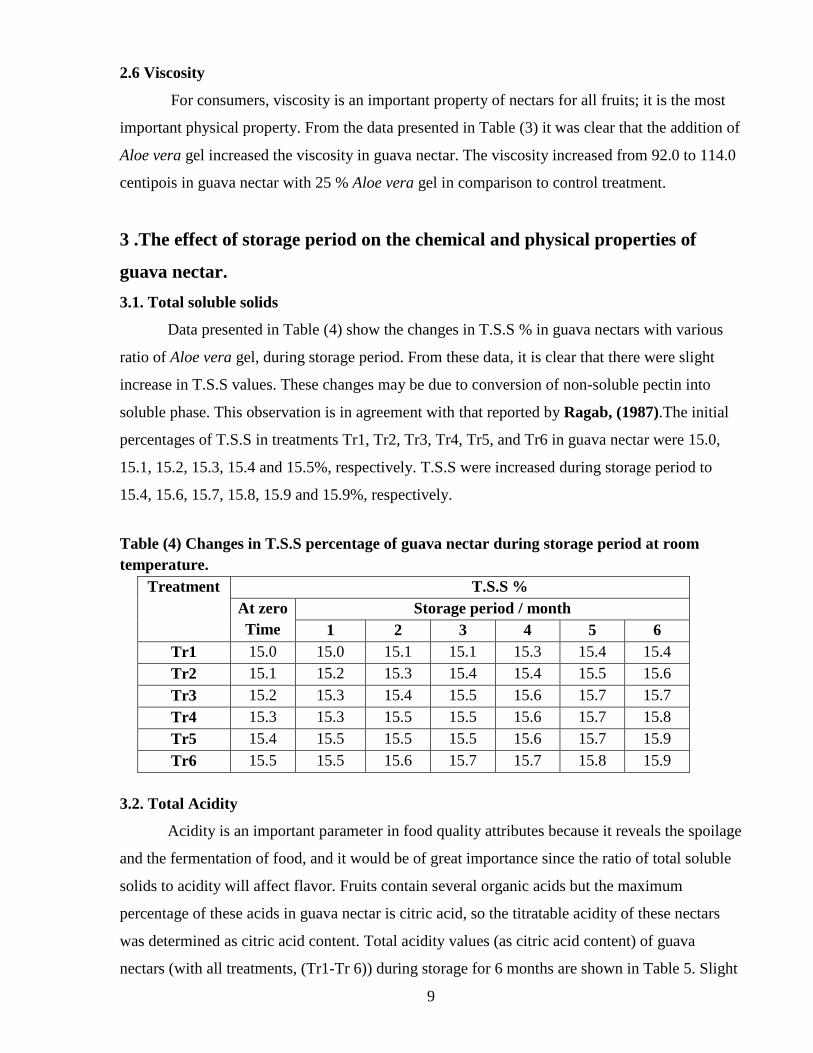
2.6 Viscosity
For consumers, viscosity is an important property of nectars for all fruits; it is the most
important physical property. From the data presented in Table (3) it was clear that the addition of
Aloe vera gel increased the viscosity in guava nectar. The viscosity increased from 92.0 to 114.0
centipois in guava nectar with 25 % Aloe vera gel in comparison to control treatment.
3 .The effect of storage period on the chemical and physical properties of
guava nectar.
3.1. Total soluble solids
Data presented in Table (4) show the changes in T.S.S % in guava nectars with various
ratio of Aloe vera gel, during storage period. From these data, it is clear that there were slight
increase in T.S.S values. These changes may be due to conversion of non-soluble pectin into
soluble phase. This observation is in agreement with that reported by Ragab, (1987).The initial
percentages of T.S.S in treatments Tr1, Tr2, Tr3, Tr4, Tr5, and Tr6 in guava nectar were 15.0,
15.1, 15.2, 15.3, 15.4 and 15.5%, respectively. T.S.S were increased during storage period to
15.4, 15.6, 15.7, 15.8, 15.9 and 15.9%, respectively.
Table (4) Changes in T.S.S percentage of guava nectar during storage period at room
temperature.
Treatment T.S.S %
At zero
Time
Storage period / month
1 2 3 4 5 6
Tr1 15.0 15.0 15.1 15.1 15.3 15.4 15.4
Tr2 15.1 15.2 15.3 15.4 15.4 15.5 15.6
Tr3 15.2 15.3 15.4 15.5 15.6 15.7 15.7
Tr4 15.3 15.3 15.5 15.5 15.6 15.7 15.8
Tr5 15.4 15.5 15.5 15.5 15.6 15.7 15.9
Tr6 15.5 15.5 15.6 15.7 15.7 15.8 15.9
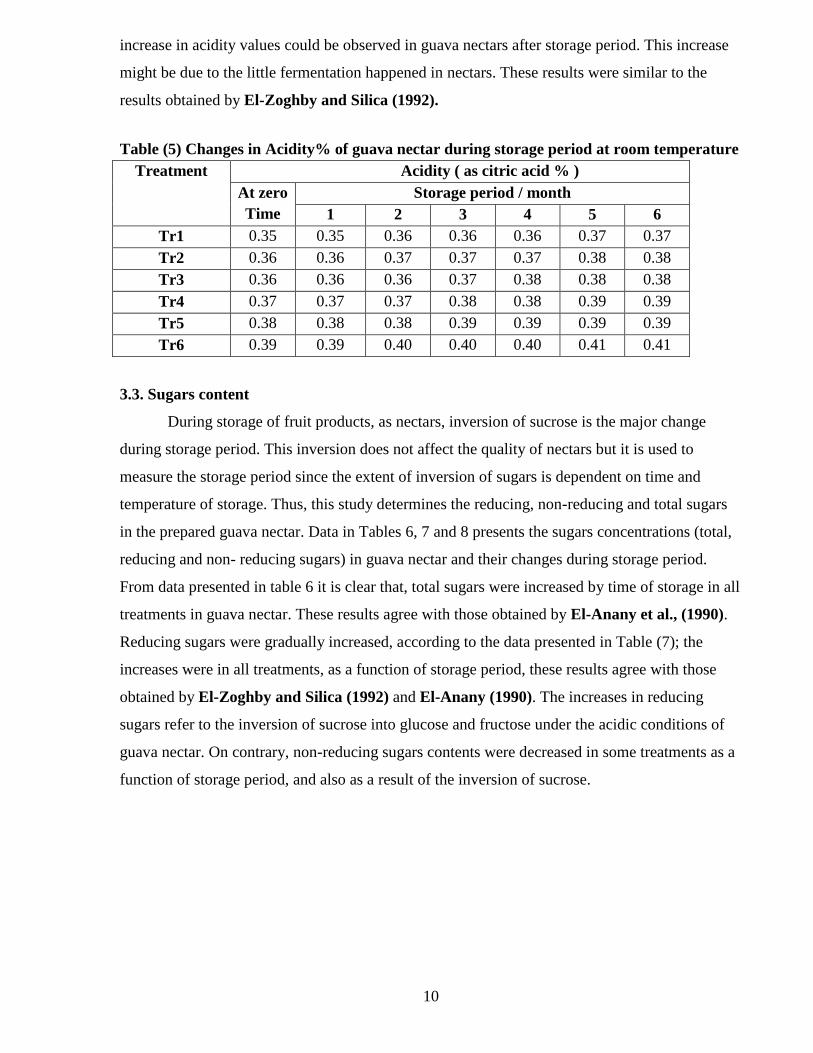
3.2. Total Acidity
Acidity is an important parameter in food quality attributes because it reveals the spoilage
and the fermentation of food, and it would be of great importance since the ratio of total soluble
solids to acidity will affect flavor. Fruits contain several organic acids but the maximum
percentage of these acids in guava nectar is citric acid, so the titratable acidity of these nectars
was determined as citric acid content. Total acidity values (as citric acid content) of guava
nectars (with all treatments, (Tr1-Tr 6)) during storage for 6 months are shown in Table 5. Slight
10
increase in acidity values could be observed in guava nectars after storage period. This increase
might be due to the little fermentation happened in nectars. These results were similar to the
results obtained by El-Zoghby and Silica (1992).
Table (5) Changes in Acidity% of guava nectar during storage period at room temperature
Treatment Acidity ( as citric acid % )
At zero
Time
Storage period / month
1 2 3 4 5 6
Tr1 0.35 0.35 0.36 0.36 0.36 0.37 0.37
Tr2 0.36 0.36 0.37 0.37 0.37 0.38 0.38
Tr3 0.36 0.36 0.36 0.37 0.38 0.38 0.38
Tr4 0.37 0.37 0.37 0.38 0.38 0.39 0.39
Tr5 0.38 0.38 0.38 0.39 0.39 0.39 0.39
Tr6 0.39 0.39 0.40 0.40 0.40 0.41 0.41
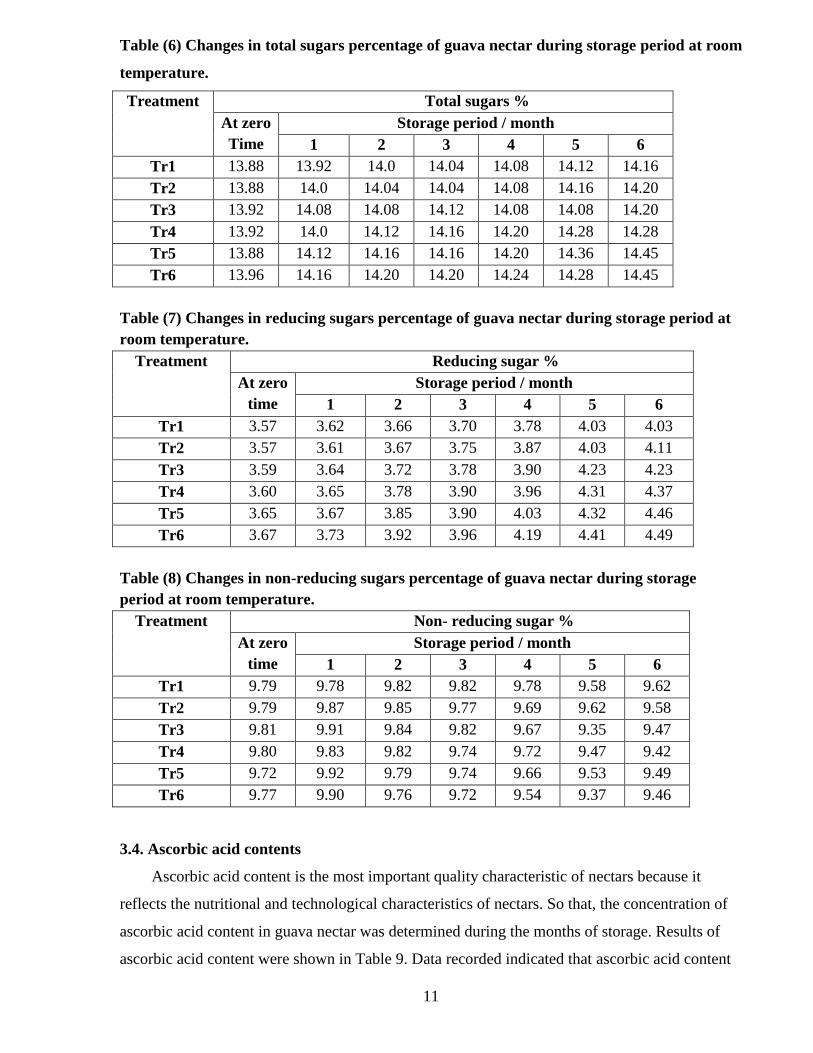
3.3. Sugars content
During storage of fruit products, as nectars, inversion of sucrose is the major change
during storage period. This inversion does not affect the quality of nectars but it is used to
measure the storage period since the extent of inversion of sugars is dependent on time and
temperature of storage. Thus, this study determines the reducing, non-reducing and total sugars
in the prepared guava nectar. Data in Tables 6, 7 and 8 presents the sugars concentrations (total,
reducing and non- reducing sugars) in guava nectar and their changes during storage period.
From data presented in table 6 it is clear that, total sugars were increased by time of storage in all
treatments in guava nectar. These results agree with those obtained by El-Anany et al., (1990).
Reducing sugars were gradually increased, according to the data presented in Table (7); the
increases were in all treatments, as a function of storage period, these results agree with those
obtained by El-Zoghby and Silica (1992) and El-Anany (1990). The increases in reducing
sugars refer to the inversion of sucrose into glucose and fructose under the acidic conditions of
guava nectar. On contrary, non-reducing sugars contents were decreased in some treatments as a
function of storage period, and also as a result of the inversion of sucrose.
11
Table (6) Changes in total sugars percentage of guava nectar during storage period at room
temperature.
Treatment Total sugars %
At zero
Time
Storage period / month
1 2 3 4 5 6
Tr1 13.88 13.92 14.0 14.04 14.08 14.12 14.16
Tr2 13.88 14.0 14.04 14.04 14.08 14.16 14.20
Tr3 13.92 14.08 14.08 14.12 14.08 14.08 14.20
Tr4 13.92 14.0 14.12 14.16 14.20 14.28 14.28
Tr5 13.88 14.12 14.16 14.16 14.20 14.36 14.45
Tr6 13.96 14.16 14.20 14.20 14.24 14.28 14.45
Table (7) Changes in reducing sugars percentage of guava nectar during storage period at
room temperature.
Treatment Reducing sugar %
At zero
time
Storage period / month
1 2 3 4 5 6
Tr1 3.57 3.62 3.66 3.70 3.78 4.03 4.03
Tr2 3.57 3.61 3.67 3.75 3.87 4.03 4.11
Tr3 3.59 3.64 3.72 3.78 3.90 4.23 4.23
Tr4 3.60 3.65 3.78 3.90 3.96 4.31 4.37
Tr5 3.65 3.67 3.85 3.90 4.03 4.32 4.46
Tr6 3.67 3.73 3.92 3.96 4.19 4.41 4.49
Table (8) Changes in non-reducing sugars percentage of guava nectar during storage
period at room temperature.
Treatment Non- reducing sugar %
At zero
time
Storage period / month
1 2 3 4 5 6
Tr1 9.79 9.78 9.82 9.82 9.78 9.58 9.62
Tr2 9.79 9.87 9.85 9.77 9.69 9.62 9.58
Tr3 9.81 9.91 9.84 9.82 9.67 9.35 9.47
Tr4 9.80 9.83 9.82 9.74 9.72 9.47 9.42
Tr5 9.72 9.92 9.79 9.74 9.66 9.53 9.49
Tr6 9.77 9.90 9.76 9.72 9.54 9.37 9.46
3.4. Ascorbic acid contents
Ascorbic acid content is the most important quality characteristic of nectars because it
reflects the nutritional and technological characteristics of nectars. So that, the concentration of
ascorbic acid content in guava nectar was determined during the months of storage. Results of
ascorbic acid content were shown in Table 9. Data recorded indicated that ascorbic acid content
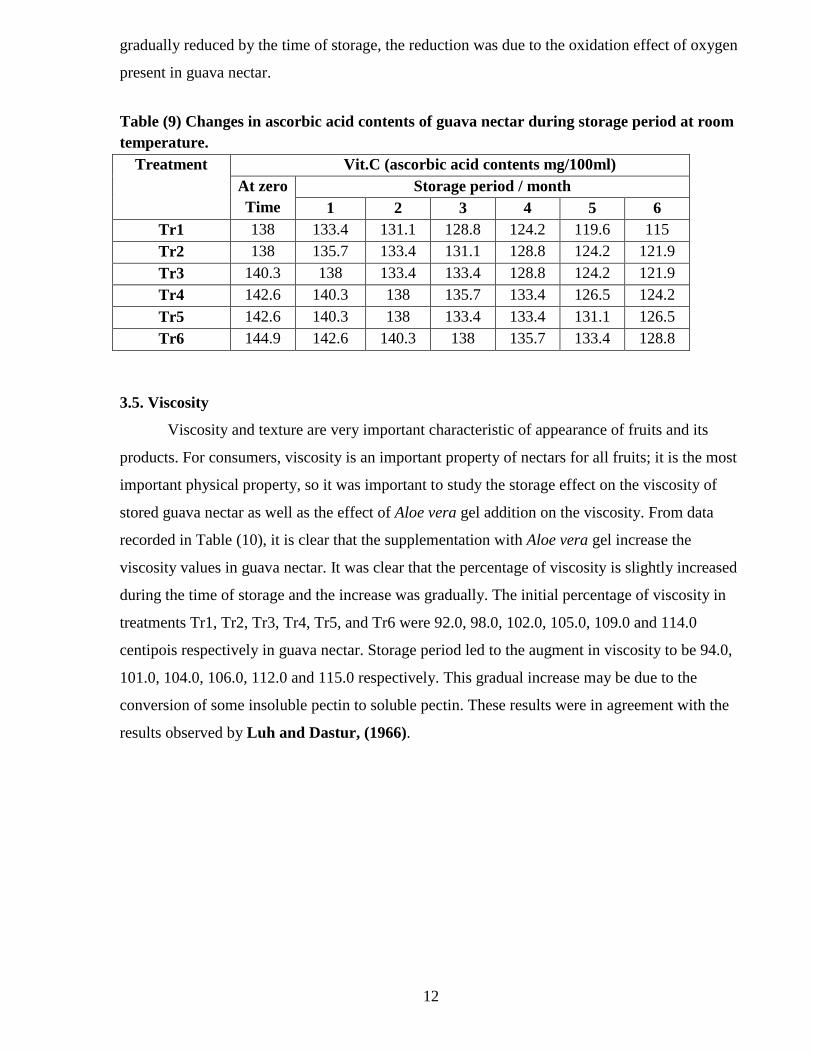
12
gradually reduced by the time of storage, the reduction was due to the oxidation effect of oxygen
present in guava nectar.
Table (9) Changes in ascorbic acid contents of guava nectar during storage period at room
temperature.
Treatment Vit.C (ascorbic acid contents mg/100ml)
At zero
Time
Storage period / month
1 2 3 4 5 6
Tr1 138 133.4 131.1 128.8 124.2 119.6 115
Tr2 138 135.7 133.4 131.1 128.8 124.2 121.9
Tr3 140.3 138 133.4 133.4 128.8 124.2 121.9
Tr4 142.6 140.3 138 135.7 133.4 126.5 124.2
Tr5 142.6 140.3 138 133.4 133.4 131.1 126.5
Tr6 144.9 142.6 140.3 138 135.7 133.4 128.8
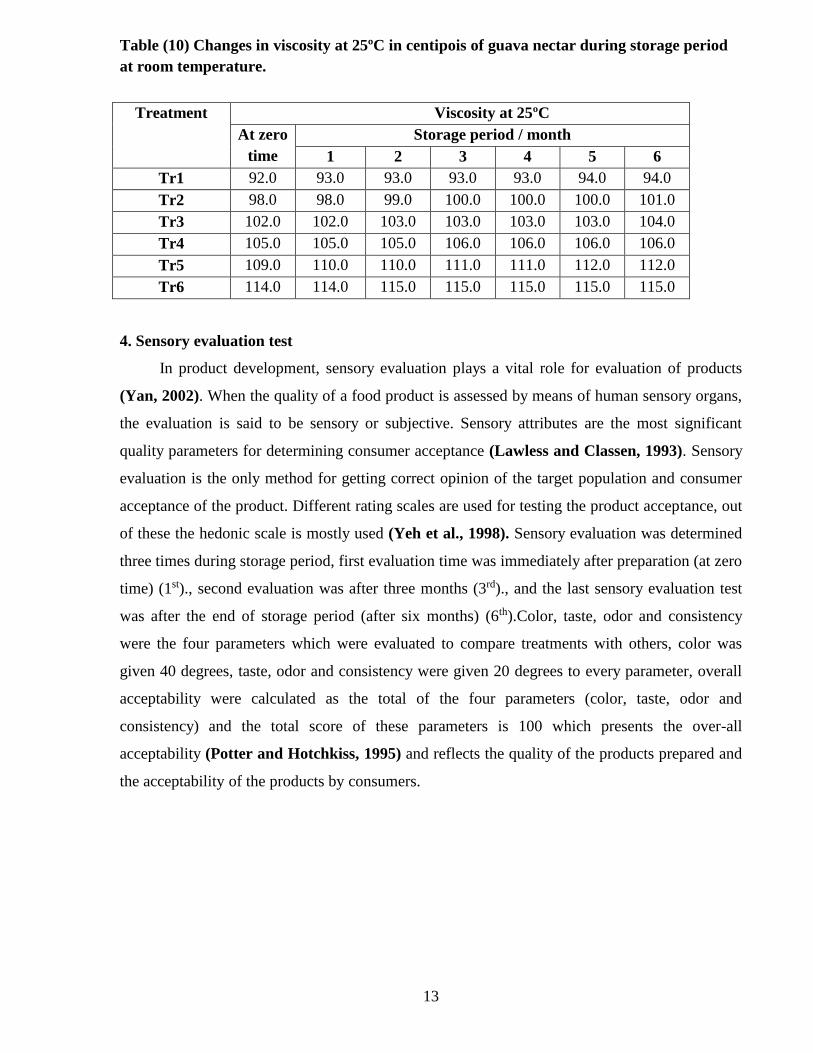
3.5. Viscosity
Viscosity and texture are very important characteristic of appearance of fruits and its
products. For consumers, viscosity is an important property of nectars for all fruits; it is the most
important physical property, so it was important to study the storage effect on the viscosity of
stored guava nectar as well as the effect of Aloe vera gel addition on the viscosity. From data
recorded in Table (10), it is clear that the supplementation with Aloe vera gel increase the
viscosity values in guava nectar. It was clear that the percentage of viscosity is slightly increased
during the time of storage and the increase was gradually. The initial percentage of viscosity in
treatments Tr1, Tr2, Tr3, Tr4, Tr5, and Tr6 were 92.0, 98.0, 102.0, 105.0, 109.0 and 114.0
centipois respectively in guava nectar. Storage period led to the augment in viscosity to be 94.0,
101.0, 104.0, 106.0, 112.0 and 115.0 respectively. This gradual increase may be due to the
conversion of some insoluble pectin to soluble pectin. These results were in agreement with the
results observed by Luh and Dastur, (1966).
13
Table (10) Changes in viscosity at 25ºC in centipois of guava nectar during storage period
at room temperature.
Treatment Viscosity at 25ºC
At zero
time
Storage period / month
1 2 3 4 5 6
Tr1 92.0 93.0 93.0 93.0 93.0 94.0 94.0
Tr2 98.0 98.0 99.0 100.0 100.0 100.0 101.0
Tr3 102.0 102.0 103.0 103.0 103.0 103.0 104.0
Tr4 105.0 105.0 105.0 106.0 106.0 106.0 106.0
Tr5 109.0 110.0 110.0 111.0 111.0 112.0 112.0
Tr6 114.0 114.0 115.0 115.0 115.0 115.0 115.0
4. Sensory evaluation test
In product development, sensory evaluation plays a vital role for evaluation of products
(Yan, 2002). When the quality of a food product is assessed by means of human sensory organs,
the evaluation is said to be sensory or subjective. Sensory attributes are the most significant
quality parameters for determining consumer acceptance (Lawless and Classen, 1993). Sensory
evaluation is the only method for getting correct opinion of the target population and consumer
acceptance of the product. Different rating scales are used for testing the product acceptance, out
of these the hedonic scale is mostly used (Yeh et al., 1998). Sensory evaluation was determined
three times during storage period, first evaluation time was immediately after preparation (at zero
time) (1st)., second evaluation was after three months (3rd)., and the last sensory evaluation test
was after the end of storage period (after six months) (6th).Color, taste, odor and consistency
were the four parameters which were evaluated to compare treatments with others, color was
given 40 degrees, taste, odor and consistency were given 20 degrees to every parameter, overall
acceptability were calculated as the total of the four parameters (color, taste, odor and
consistency) and the total score of these parameters is 100 which presents the over-all
acceptability (Potter and Hotchkiss, 1995) and reflects the quality of the products prepared and
the acceptability of the products by consumers.
14
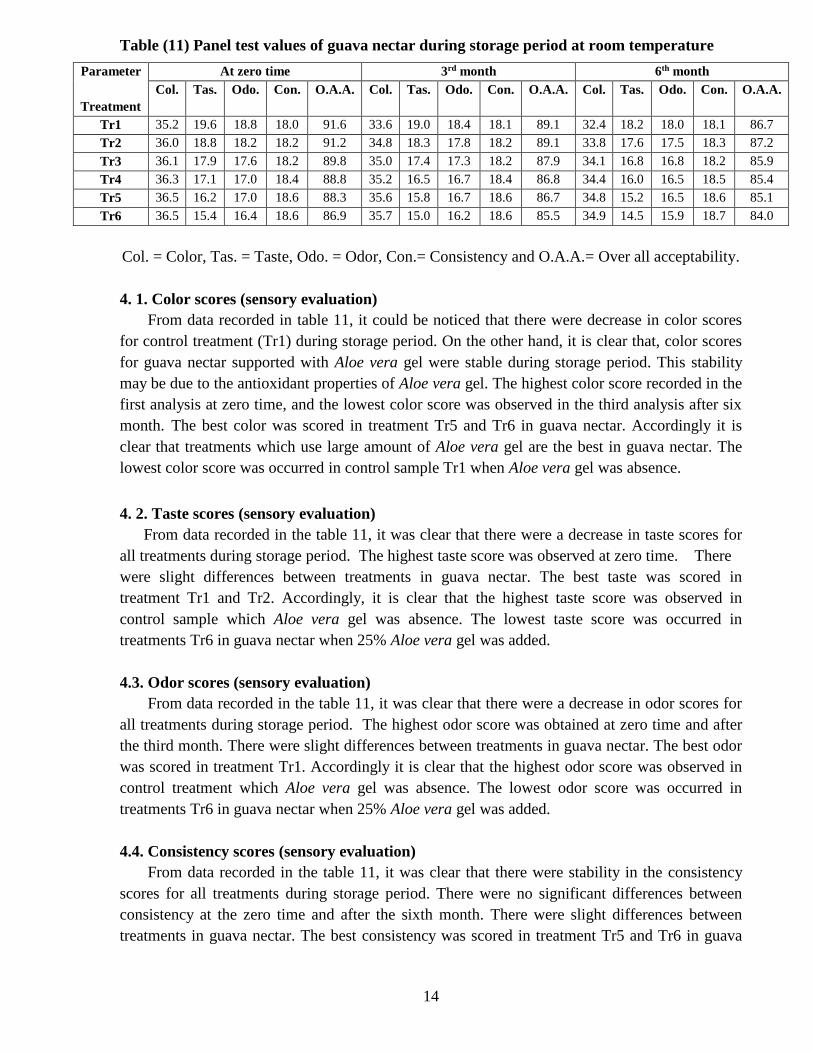
Table (11) Panel test values of guava nectar during storage period at room temperature
Col. = Color, Tas. = Taste, Odo. = Odor, Con.= Consistency and O.A.A.= Over all acceptability.
4. 1. Color scores (sensory evaluation)
From data recorded in table 11, it could be noticed that there were decrease in color scores
for control treatment (Tr1) during storage period. On the other hand, it is clear that, color scores
for guava nectar supported with Aloe vera gel were stable during storage period. This stability
may be due to the antioxidant properties of Aloe vera gel. The highest color score recorded in the
first analysis at zero time, and the lowest color score was observed in the third analysis after six
month. The best color was scored in treatment Tr5 and Tr6 in guava nectar. Accordingly it is
clear that treatments which use large amount of Aloe vera gel are the best in guava nectar. The
lowest color score was occurred in control sample Tr1 when Aloe vera gel was absence.
4. 2. Taste scores (sensory evaluation)
From data recorded in the table 11, it was clear that there were a decrease in taste scores for
all treatments during storage period. The highest taste score was observed at zero time. There
were slight differences between treatments in guava nectar. The best taste was scored in
treatment Tr1 and Tr2. Accordingly, it is clear that the highest taste score was observed in
control sample which Aloe vera gel was absence. The lowest taste score was occurred in
treatments Tr6 in guava nectar when 25% Aloe vera gel was added.
4.3. Odor scores (sensory evaluation)
From data recorded in the table 11, it was clear that there were a decrease in odor scores for
all treatments during storage period. The highest odor score was obtained at zero time and after
the third month. There were slight differences between treatments in guava nectar. The best odor
was scored in treatment Tr1. Accordingly it is clear that the highest odor score was observed in
control treatment which Aloe vera gel was absence. The lowest odor score was occurred in
treatments Tr6 in guava nectar when 25% Aloe vera gel was added.
4.4. Consistency scores (sensory evaluation)
From data recorded in the table 11, it was clear that there were stability in the consistency
scores for all treatments during storage period. There were no significant differences between
consistency at the zero time and after the sixth month. There were slight differences between
treatments in guava nectar. The best consistency was scored in treatment Tr5 and Tr6 in guava
Parameter
Treatment
At zero time month rd3 month th6
Col. Tas. Odo. Con. O.A.A. Col. Tas. Odo. Con. O.A.A. Col. Tas. Odo. Con. O.A.A.
Tr1 35.2 19.6 18.8 18.0 91.6 33.6 19.0 18.4 18.1 89.1 32.4 18.2 18.0 18.1 86.7
Tr2 36.0 18.8 18.2 18.2 91.2 34.8 18.3 17.8 18.2 89.1 33.8 17.6 17.5 18.3 87.2
Tr3 36.1 17.9 17.6 18.2 89.8 35.0 17.4 17.3 18.2 87.9 34.1 16.8 16.8 18.2 85.9
Tr4 36.3 17.1 17.0 18.4 88.8 35.2 16.5 16.7 18.4 86.8 34.4 16.0 16.5 18.5 85.4
Tr5 36.5 16.2 17.0 18.6 88.3 35.6 15.8 16.7 18.6 86.7 34.8 15.2 16.5 18.6 85.1
Tr6 36.5 15.4 16.4 18.6 86.9 35.7 15.0 16.2 18.6 85.5 34.9 14.5 15.9 18.7 84.0

15
nectar. The highest score was achieved by treatment Tr5 and Tr6 when 20 % and 25 % Aloe vera
gel were added in guava nectar.
5. Microbiological evaluation
The effect of Aloe vera gel on total bacterial counts in guava nectar during storage at room
temperature was investigated Figure (1). Guava nectar was placed into six treatments. All
treatments were treated with Aloe vera gel at concentrations 0, 5, 10, 15, 20 and 25 %. Total
bacterial counts were determined as CFU/ml at zero time point then after three and six months of
storage. The high concentrations of Aloe vera (20 and 25 %) resulted in a dramatic fall in the
levels of total bacterial counts. Total bacterial counts decreased from log10 4.02 CFU/ml in
control treatment at zero time point to log10 2.05 CFU/ml as a result of Aloe vera gel addition
with 20 and 25 % Figure (1).
Figure (1) the effect of Aloe vera concentrations on total bacterial counts in guava nectar
during storage at room temperature.
The mechanism of action of the Aloe vera gel on the lysis of bacterial cells may be due to the
pore formation in the cell wall and the leakage of cytoplasmic constituents by the active
components such as alkaloids and saponins present in the gel as revealed by Shelton, (1991). In
general, there are over 75 known ingredients in the Aloe vera leaf gel and they are all contained
in about 3% of the plant, the rest (97%) being water, so they are obviously present only in small
amounts. Their action is thought to arise from the synergistic effect of these substances; they can
be linked to work together as a team so that the total effect is greater than would be expected
16
from the individual effect of each substance (Shelton, 1991). The data obtained in the present
study revealed strong bactericidal activity of Aloe vera gel. This activity may be attributed to a
number of pharmacologically active compounds including tannins, alkaloids, flavonoids
(hesperidin, rosmarinic, rutin, quercitrin, narengenin, hesperetin, kampferol, and apiegnin) ,
phenolics compounds (pyrogallol, gallic acid, protocatechuic, catechin, chlorogenic acid, caffeic
acid, vanillic acid, caffeine, ferulic acid, p-coumaric acid , salicylic acid and cinnamic acid), as
well as saponins have a direct antimicrobial activity (Shafi et al., 2000; Rodrigues et al., 2004;
Kambizi and Afolayan 2008 and Dabai et al., 2007). Despite the fact that, global antibiotic
resistance by bacteria is becoming an interesting public health concern, discovering a new
antibacterial agent with antibacterial activity such as in Aloe vera gel is promising and could be
used as alternative herbal remedy. Depending on the presented results, Aloe vera gel could
represent a new source of potent anti-microbial, nontoxic and less expensive remedy than drugs
and also it can be used as natural preservative agent in some foods.
CONCLUSION
From the obtained results we can conclude that 20 % Aloe vera gel addition in guava nectar
production is safe, economical, has high therapeutic and nutrition values besides increasing TSS
and viscosity. Also, it can expand the storage period for a long time due to its anti-oxidant and
antimicrobial properties. Aloe vera does not appear to affect guava nectar appearance. So, it
seems to be promise as a safe, natural and environmentally friendly alternative solution to
conventional synthetic preservatives.
REFERENCES
A. O. A. C., (1984). Official Methods of Analysis. Association of official analytical chemists.
(Ed.): Williams S. Arlington, Virginia, USA.
APHA (American Public Health Association), (1992). Compendium of methods for the
microbiological examination of foods, (3rd Ed.). (Eds.): Vanderzant, C. and Splittsloesser,
D. F. Washington, DC.APHA
Ashaye, O. A., Babalola. S. O., Babalola. A. O., Aina. J. O. and Fasoyiro S. B. (2005).
Chemical and organoleptic characterization of Pawpaw and Guava Leathers. World
Journal of Agricultural Sciences, 1(1): 50 – 51.
17
Askar, A. and Treptow, H. (1993). Analytical methods. Quality assurance in tropical fruit
processing, (Eds.): Askar, A. and Treptow, H. Springer-Verlag, Berlin, Germany. P.9-10,
19-20, 27-28.
Augustin, M. A. (2001). Functional foods: an adventure in food formulation. Food Australia, 53:
428–432.
Bozzi, A., Perrin, C., Austin, S. and Arce Vera, F. (2007). Quality and authenticity of
commercial Aloe vera gel powders. Food Chemistry, 103: 22 – 30.
Choudhary, R. and Tandon, R. V. (2009). Consumption of functional food and our health.
Pakistan Journal of Physiology, 5(1): 76 – 83.
Dabai, Y. U., Muhammad, S. and Aliyu, B. S. (2007). Antibacterial activity of anthraquinones
fraction of Vitex doniana. Pakistan Journal of Biological Science, 1 – 3.
Daniel, H. D. and George, C. M. (1972). Peach seed dormancy in relation to indogenous
inhibition and applied growth substances. Journal of American Society of Horticulture
Science, 79: 651 – 654.
El-Anany, K. (1990). Studies on the use of some artificial sweeteners in production of juices.
M.Sc Thesis, Faculty of Agric., Zagazig Univ. Egypt.
El-Zoghbi, M. and Silica, H. (1992).The effect of low-calorie sweetener on chemical and
physical properties of apricot nectar. Alimenta, Quality control, 19 – 21.
Mohamed, E. A. K. (2011). Antidiabetic, antihypercholestermic and antioxidative effect of Aloe
vera gel extract in alloxan induced diabetic rats. Australian Journal of Basic and Applied
Sciences, 5(11): 1321– 1327.
Eshun, K. and He, Q. (2004). Aloe vera: a valuable ingredient for the food, pharmaceutical and
cosmetic industries: a review. Critical Reviews in Food Science and Nutrition, 44 (2): 91
– 96.
Franz, Ch., Bauer, R., Carle, R., Tedesco, D., Tubaro, A. and Zitterl- Eglseer, K. (2005).
Study of the assessment of plants/herbs, plant/herb extracts and their naturally or
synthetically produced components as “additives” for use in animal production
CFT/EFSA/FEEDAP/2005/01.
Goldberg, I. (1994). Functional Foods, Designer Foods, Pharmafoods, Nutraceuticals. Chapman
& Hall, New York, NY.
Goupy, P., Hugues, M., Boivin, P. and Joseph, M. J. (1999). Antioxidant and activity of
barley (Hordeum vulgare) and malt extracts and of isolated phenolic compound. Journal
of the Science of Food and Agriculture, 79: 1625 – 1634.
18
Goyal, M. and Sharma, S. K. (2009). Traditional wisdom and value addition prospects of arid
foods of desert region of North West India. Indian journal of Traditional Knowledge, (8)4:
581 – 585.
Grindlay, D. and Reynolds, T. (1986). The Aloe vera phenomenon: a review of the properties
and modern uses of the leaf parenchyma gel. Journal of Ethnopharmacology, 16:117–151.
Hasler C. M. and Blumberg, J. B. (1999). Phytochemicals: biochemistry and physiology.
Introduction. Journal of Nutrition, 129(3):756S – 757S.
Horowitz, W. (1960). Official and tentative methods of analysis. Association of the Official
Agriculture Chemist, (9th Ed.). Washington, D.C. p.320 – 341.
Jagtiani, J., Chan, H. T. Jr. and Saki, W. S. (1988). Tropical fruit processing. Academic press,
San Diego, CA. pp. 9 – 43.
Kambizi, L. and Afolayan, A. J. (2008). Extracts from Aloe ferox and Withania somnifera
inhibit Candida albicans and Neisseria gonorrhoea. African Journal of Biotechnology, 7:
12 – 15.
Kansci, G., Bargui, B. and Mbome, I. (2003). Effect of ripening on the composition and the
suitability for jam processing of different varieties of mango (Mangifera indica). African
Journal of Biotechnology, 2(9): 301– 306.
Klahorst, S. J. (2006). Flavour and innovation meet. World of Food Ingredients, June, 26 – 30.
Klont, R. (1999). Healthy ingredients driving innovation. World of Food Ingredients,
March/April, 43–23.
Kwak, N. S. and Jukes, D. J. (2001). Functional foods. Part 2: the impact on current regulatory
terminology. Food Control, 12: 109–117.
Lawless, H. T. and Claassen, M. R. (1993). Application of central dogma in sensory
evaluation. Food Technology, 47(6): 139 – 146.
Luh, B. S., and Dastur, K. D. (1966). Texture and pectin changes in canned apricots. Journal of
Food Science, 31(2): 178 – 183.
Mattila, P., Astola, J. and Kumpulainen, J. (2000). Determination of flavonoids in plant
material by HPLC with diode- array and electro- array detections. Journal of Agricultural
and Food Chemistry, 28: 5834 – 5841.
Potter, N. N. and Hotchkiss, J. H. (1995). Food Science, (5th Ed.). Chapman & Hall, New
York.
Ragab, M. (1987). Charachterstic of jam sweetened with saccharin and xylitol. Food chemistry,
23: 55 – 64.
19
Rodriguez, S. (2004). How large is the aloe market ? International Aloe Science Council
Website (http://www.iasc.org/aloemarket. html).
Rodriguez E. R., Martin, J. D. and Romero, C. D. (2010). Aloe vera as a functional ingredient
in foods. Critical Reviews in Food Science and Nutrition, 50: 305 – 326.
Saroj, P. L., Dhandar, D. G. and Singh, R. S. (2004). Indian Aloe. Central Institute for Arid
Horticulture, Bikaner. 6 – 10.
Shafi, N., Khan, L. and Khan, G. A. (2000). Commercial extraction of gel from Aloe vera (L)
leaves. Journal of Chemical Society of Pakistan, 22(1): 47 – 48.
Shelton, M. S. (1991). Aloe vera, its chemical and therapeutic properties. International Journal
of Dermatology, 30: 679 – 683.
Smith, J. and Charter, E. (2010). Functional food product development. Part 1:
Microencapsulation in functional food product development. Blackwell Publishing Ltd.,
Charlottetown, Canada. P. 3 – 19
Viljoen, A. M. and van Wyk, B. E. (2000). The chemotaxonomic significance of the phenyl
pyrone, aloenin in the genus Aloe. Biochemical Systematics and Ecology, 28: 1009 –
1017.
Watson, E., Carvalho, A., Green, R., Britton, S. and Scott, S. (2006). Functional ingredients.
Food Manufacture, 81(11): iv–xix.
W. H. O., (1999). Monographs on selected medicinal plants. Vol. 1, World Health Organization,
Geneva.
Yan, N. J. N. (2002). Motives for food choice: A comparison of consumers from Japan, Taiwan,
Malatsia and New Zealand. Food Quality and Preference, 98(3): 119 – 134.
Yeh, L. I. L., Kim, K. O., Chrompreed, A. and Lundahl, D. S. (1998). Comparison of the use
of the 9 point scale between Americans, Chinese, Koreans and Thai. Food Quality and
Preference, 9(6): 413 – 419.