FROZEN GUAVA NECTAR BASE - ScholarSpace
22
Ar:8 ILJ An Economic Analysis of the Market for FROZEN GUAVA NECTAR BASE BUYING PATTERNS AND POTENTIAL SALES Frank S. Scott, Jr . Agricultural Economics Bulletin 14 Hawaii Agricultural Experiment Station University of Hawai i September 1958
-
Upload
khangminh22 -
Category
Documents
-
view
3 -
download
0
Transcript of FROZEN GUAVA NECTAR BASE - ScholarSpace

Ar:8 ILJ
An Economic Analysis of the Market for
FROZEN GUAVA NECTAR BASE BUYING PATTERNS AND POTENTIAL SALES
Frank S. Scott, Jr.
Agricultural Economics Bulletin 14
Hawaii Agricultural Experiment Station
University of Hawai i
September 1958

ACKNOWLEDGMENTS
Survey data in the Kailua, Oahu, T. H., area were collected by Daniel Chun
Ming, Graduate Student in Economics and Research Assistant in Agricultural
Economics. Credit is also due Hawaiian Fruit Growers Exchange, Ltd., and Ha
waiianJuice Industries, Ltd., who supplied the juice for the mainland test markers, to
Mr. P. J. Wegesser of the P. J. Wege.;ser Brokerage Co. , and to distributors, store
managers, demonstrators, and others who assisted with the research in the test areas.
? .

r
INTRODUCTION
PROCEDURE
AW ARE NESS AS TO AV AIL ABILITY
CONTENTS
SOURCES OF INFORM ATION AS TO AVAILABILITY
PERCENTAGE OF CONSUMERS WHO HAD TASTED G UAVA NECTAR .
P ERCENTAGE OF CONSUMERS WHO H AD BOUGHT G UAVA NECTAR.
FREQUENCY OF PURCHASE
SIZE OF PURCHASE
SALES IN RELATION TO COMPETING FROZEN JUICES
COMPARATIVE PURCHASES
SALES IN RELATION TO FROZEN PASSION FRUIT JUICE
POTENTIAL SALES.
MARKET DEVELOPMENT.
SUMMARY AND CONCLUSIONS
PAGE
5
5
6
6
7
7
9
10
11
15
16
17
19
20

TABLES
PAGE
1. How consumers found out that frozen guava nectar base was being sold, by income groups, Kailua, Oahu, T. H ., as of June, 1956... . . . . . . . . . . . . . . . . . . . . . . . . . . . . . . . . 7
2. Percentage of consumers who had tasted and bought frozen, canned, and / or dairy bottled guava nectar, by income groups, Kailua, Oahu, T. H ., as of June, 1956. . . . . . 8
3. Frequency of purchase of frozen guava nectar base during the week and during the month preceding consumer survey, by income groups, Kailua, Oahu, T. H. , 1956. . . . 9
4. Purchases of frozen guava nectar base in 6-ounce cans during the week and during the month preceding consumer survey, by income groups, Kailua, Oahu, T. H., 1956. . . . 10
5. Comparative annual sales of frozen guava nectar base, San Francisco Bay-San Jose Area, California, and Decatur, Illinois, May, 1956, through April, 1957, and Kailua, Oahu, T. H ., 1956.. . . . . . . . . . . . . . . . . . . . . . . . . . . . . . . . . . . . . . . . . . . . . . . . . . . . . . . . . 12
6. Consumer purchases of frozen guava nectar base and competing frozen juice concen-trates per 1,000 capita, specified areas, 1956. . . . . . . . . . . . . . . . . . . . . . . . . . . . . . . 14
7. Percentage of consumers who had ever bought frozen guava nectar base and competing frozen juice concentrates, by income groups, Kailua, Oahu, T. H ., as of June, 1956... 16
8. Comparative sales of frozen guava nectar base and frozen passion fruit juice, San Francisco Bay-San Jose; Sacramento, California; Kailua, Oahu; and Terrirory of Hawaii. 17
9. U. S. sales potentials for frozen guava nectar base as determined by different methods. . 18
FIGURES
1. How consumers first found out about frozen guava nectar base, Kailua, Oahu, T. H... 6
2. Percentage of consumers who had tasted and bought frozen, canned, and /or dairy bottled guava nectar, Kailua, Oahu, T. H. , as of June, 1956. . . . . . . . . . . 8
3. Frequency of purchase of frozen guava nectar base during the week and during the month preceding consumer survey, Kailua, Oahu, T. H. , 1956.......... .. . . ....... 9
4. Purchases of frozen guava nectar base in 6-ounce cans during the week and during the month preceding consumer survey, Kailua, Oahu, T . H ., 1956... . . . . . . . . . . . . . 10
5. Comparative annual sales of frozen guava nectar base and competing frozen juice con-centrates, Kailua, Oahu, T. H., 1956. . . . . . . . . . . . . . . . . . . . . . . . . . . . . . . . 11
6. Consumer purchases of frozen guava nectar base and competing frozen juice concen-trates per 1,000 capita, Kailua, Oahu, T. H. , 1956.... . ..... . . . . . . . . . . . . . . . . 13
7. Percentage of consumers who had ever bought frozen guava nectar base and competing frozen juice concentrates, Kailua, Oahu, T. H., as of June, 1956.. .................. 15

AN ECONOMIC ANALYSIS OF THE MARKET FOR FROZEN GUAVA NECTAR BASE
Buying Patterns and Potential Sales
Frank S. Scott, J r. 1
INTRODUCTION
Hawaiian processed frozen guava nectar base, introduced commercially during the spring of 1956, has rapidly established a place for itself in the local market but has moved slowly in the limited number of mainland areas where distribution has been attained. 2
There is a sufficient supply of wild guava, which is the almost exclusive source of island-produced guava products, to support a considerably larger industry than is now in existence. A very limited acreage in domestic plantings has yielded larger, superior fruit and production is considered feasible in light of the present price-cost structure. As the harvesting of wild guava expands to less accessible areas, more consideration will undoubtedly be given to domestic guava as an orchard crop.
As a guide to orderly expansion in both processing of wild guava and production and processing of domestic guava, it is essential to obtain an early indication of the probable market potential for processed guava products . This study is concerned with the sales potential for frozen guava nectar base in 6-ounce cans . Potentials for other uses such as for canned guava nectar, jams, jellies, and sherbets will receive consideration at a later date.
PROCEDURE
With very limited mainland distribution of frozen guava nectar base at the outset of this research, the only feasible method of obtaining a reliable indication of the market potential was through market development and measurement of sales in test cities. In line with this approach the product was distributed during May, 1956, in the San Francisco Bay-San Jose Area in California and in Decatur, Illinois. A limited amount of advertising and promotion was conducted in the form of spot radio announcements , newspaper ads, store demonstrations , and point-of-sale material. Sales records of frozen guava nectar base and competing frozen juice concentrates were obtained in part through distributors and in part through retail audits. The duration of the test, which varied by areas and by stores within areas, ranged from 10 to 16 months.
1Associare Agricultural Economist, Hawaii Agricultural Experiment Station, and Associate Professor of Agriculture, University of Hawaii.
2The base for frozen guava nectar is composed of full -strength guava puree plus sugar. It is not dehydrated and is technically nor a concentrate. H owever, since the frozen base is diluted with 3 cans of water for consumer use, it is in effect a concentrate insofar as the consumer is concerned.
5

In addition to the mainland tests, a consumer survey was made in K ailua , Oahu, T. H. , during late spring, 1956, and records of sales through stores and dairies were obtained in the K ailua area for the 1956 calendar year. 3 The Kailua population is composed, to a large extent, of recent emigrants ~rom the mainland United States and is considered closely comparable to that of the more rapidly growing areas on the Pacific Coast. It was reasoned that a knowledge of sales and buying habits in an area where people are familiar with guava nectar would be a valuable guide to a study of probable mainland acceptance.
As a supplement to rhe earlier tests, the product was introduced in Sacramento, California, during September, 1957, and sales data were obtained for a 4-month period.
AWARENESS AS TO AVAILABILITY
Sixty-five percent of the consumers interviewed in the 1956 Kailua survey indicated an awareness as to the availability of frozen guava nectar base. Families in the higher income groups showed somewhat greater awareness. Seventy-one percent of the families with incomes of $7,000 or over knew that frozen guava nectar base was being sold in Kailua.
Awareness of the availability of the product also varied by nationality and racial groups, ranging from 67 percent familiarity on the part of Caucasians to 53 percent for Chinese. For other major groups the percentages were: Hawaiian and Part H awaiian, 61 percent; and Japanese, 60 percent.
SOURCES OF INFORMATION AS TO AVAILABILITY
Sixty-six percent of Kailua consumers who were aware that frozen guava nectar base was being offered for sale first found out abou t it by observing it on display in frozen food cabinets . Thirteen percent tasted it during store demonstrations and 12 percent found out about it from other persons. Other means of promotion were nor widely used and reached few consumers (figure 1 and table 1).
3Records were obtained from 25 percent of the approximately 4,100 households rn the Kailua-Lanikai area.
Store display
Store demonstration
From another consumer 11111111111
Newspaper
Other
Percent through each source
FIGURE 1. How consumers first found out about frozen guava nectar base, Kailua, Oahu, T. H .
6
,
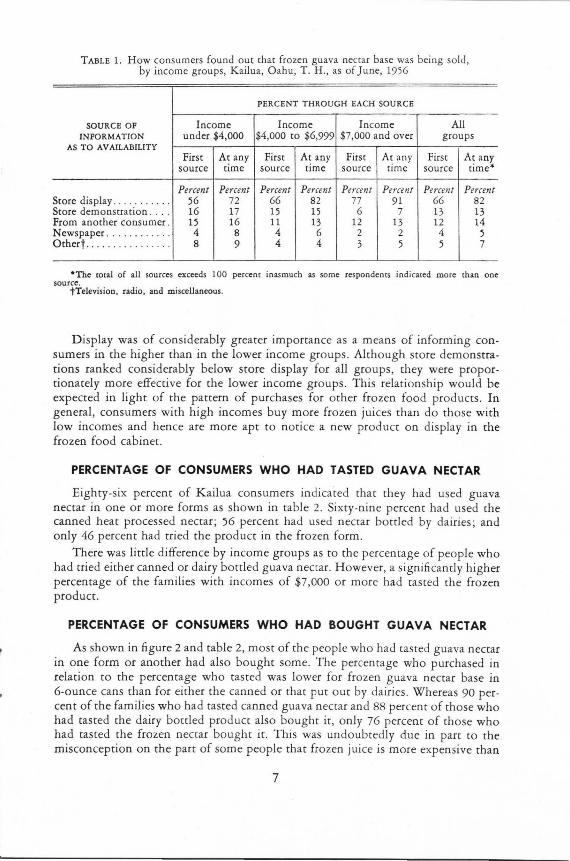
TABLE 1. How consumers found out that frozen guava nectar base was being sold, by income groups, Kailua, Oahu, T . H., as of June, 1956
PERCENT THROUGH EACH SOURCE
SOURCE OP Income Income Income All INFORMATION under $4,000 $4,000 to .$6,999 7,000 and over groups
AS TO AVAILABILITY First At any First At any First At any First At any
source time source time source nme source time*
Percent Percent Percent Percent Percent Percent Percent Percent Store display ..... ... .. . 56 72 66 82 77 91 66 82 Store demonstration . ... 16 17 15 15 6 7 13 13 From another consumer . 15 16 11 13 12 13 12 14 Newspaper . .... . ..... . 4 8 4 6 2 2 4 5 Other t .... . ..... . . . . . . 8 9 4 4 3 5 5 7
•Toe total of all sources exceeds 100 percent inasmuch as some respondents indi cated more than one source.
tTelevision, radio, and miscellaneous.
D isplay was of considerably greater importance as a means of informing consumers in the higher than in the lower income groups. Although score demonstrations ranked considerably below score display for all groups, they were proportionately more effective for the lower income groups . This relationship would be expected in light of the pattern of purchases for ocher frozen food produces. In general, consumers with high incomes buy more fro zen juices than do chose with low incomes and hence are more apt to notice a new product on display in the frozen food cabinet.
PERCENTAGE OF CONSUMERS WHO HAD TASTED GUAVA NECTAR
Eighty-six percent of Kailua consumers indicated that they had used guava nectar in one or more forms as shown in cable 2. Sixty-nine percent had used the canned heat processed nectar ; 56 percent had used nectar bottled by dairies; and only 46 percent had cried the product in the frozen form.
There was little difference by income groups as co the percentage of people who had cried either canned or dairy bottled guava nectar. However, a significantly higher percentage of the families with incomes of $7,000 or more had casted the frozen produce.
PERCENTAGE OF CONSUMERS WHO HAD BOUGHT GUAVA NECTAR
As shown in figure 2 and cable 2, most of the people who had tasted guava nectar in one form or another had also bought some. The percentage who purchased in relation to the percentage who casted was lower for frozen guava nectar base in 6-ounce cans than for either the canned or chat put out by dairies. Whereas 90 percent of the families who had casted canned guava nectar and 88 percent of those who had tasted the dairy bottled product also bought it, only 76 percent of chose who had casted the frozen nectar bought it. This was undoubtedly due in part co the misconception on the part of some people that frozen juice is more expensive than
7

canned. Actually, the cost per unit of volume of the diluted concentrate or nectar base is about the same as that of the canned for the better known juices and nectars.
The percentage of chose who purchased in relation to the number who had tasted the product was higher in the highest income group, with the difference being greater for the frozen than for the ocher forms.
Percent
100
80
60
40
20
0 '----Any form
.Tasted
Dsou9 ht
FIGURE 2. Percentage of consumers who had tasted and bought frozen, canned, and/or dairy bottled guava nectar, Kailua, Oahu, T . H., as of June, 1956.
TABLE 2. Percentage of consumers who had tasted and bought frozen, canned, and / or dairy bottled guava nectar, by income groups, Kailua, Oahu, T. H., as of June, 1956
FORM OF NECTAR
Any form Canned In dairy bottles Frozen in 6-oz . cans
INCOME Percent Percent Percent Perc~nt GROUP no. who no.who no. who no. who
Tasted Bought bought Tasted Bought bought Tasted Bought bought Tasted Bought bought is of is of is of is of
no.who no . who no. who no.who tasted tasted casted tasted
Per- Per- Per- Per- Per- Per- Per- Per- Per- Per- Per- Per-cent cent cent cent cent cent cent cent cent cent cent cent
Under $4,000. . :, 86 77 90 70 62 89 55 49 89 42 30 71
$4,000-$6,999. . . 86 77 90 69 62 90 54 47 87 44 34 77
$7,000 & over. 88 80 91 70 64 91 60 54 90 55 45 82
All groups. 86 78 91 69 62 90 56 49 88 46 35 76
8
..

FREQUENCY OF PURCHASE
Only 9 percent of Kailua consumers indicated that they had purchased frozen guava nectar base during the week preceding the 1956 survey but 23 percent had purchased it during the preceding month (figure 3 and table 3). As previously indicated, 35 percent of the people had bought the product at one time or another since its introduction.
Eighty-five percent of the consumers who made purchases of frozen guava nectar base during the previous week made only one purchase. But of those who bought the product during the previous month, 38 percent made one purchase, 31 percent bought twice during the month, and 31 percent made three or more purchases.
3 or more times
j_ 4%
Frequency of purchase during past week
Frequency of purchase during past month
FIGURE 3. Frequency of purchase of frozen guava necrar base during the week and during the month preceding consumer survey, Kailua, Oahu, T. H., 1956.
TABLE 3. Frequency of purchase of frozen guava nectar base during the week and during the month preceding consumer survey, by income groups, Kailua, O ahu, T. H., 1956
Percent Frequency of purchase Percent Frequency of purchase who pur- by those who made who pur- by those who made
Income group chased purchases during chased purchases during during previous week during previous month
previous prev10us week 3 or more month 3 or more
Once Twice times Once Twice times
Percent Percent Percent Percent Percent Percent Percent Percent Under 4,000 .. 9.7 89 11 0 19.5 41 35 24 $4,000-$6,999 .. 9.2 81 11 8 22.6 35 29 36 $7,000 & over . . 10.5 88 6 6 25.3 40 32 28 All groups . . . .. 9.0 85 11 4 22.7 38 31 31
9

Frequency of purchase during the previous week was highest for the income group of $7,000 and over and lowest for the middle income group. During the previous month, however, frequency of purchase per family varied direccly with size of income for all groups.
SIZE OF PURCHASE
Whereas only 9 percent of the consumers made purchases of frozen guava nectar base during the previous week, 50 percent of those who did buy bought three or more cans; 37 percent bought two cans; and 13 percent bought only one can (figure 4 and table 4). Thus 87 percent of the shoppers bought two or more cans per purchase.
During the longer period of one month, 80 percent of those who bought the product indicated that they had purchased three or more cans; 17 percent had bought two cans; and 3 percent had bought only one can.
Purchases during past week
1 can ,/.
Purchases during past month
FIGURE 4. Purchases of frozen guava nectar base in 6-ounce cans during the week and during the month preceding consumer survey, Kailua, Oahu, T.H., 1956.
TABLE 4. Purchases of frozen guava nectar base in 6-ounce cans during the week and during the month preceding consumer survey, by income groups, Kailua , Oahu, T. H., 1956
Percent Percent buying specified Percent Percent buying specified who pur- numbers of cans by those who pur- numbers of cans by those
Income group chased who made purchases chased who made purchases during during previous week during during previous month
previous previous week 3 or more month 3 or more
l can 2 cans cans l can 2 cans cans
Percent Percent Percent Perc'?nt Percent Percent Percent Percent Under $4,000. 9.7 0 18 82 19.5 3 15 82 $4,000---$6,999 .. 9.2 14 45 41 22.6 5 16 79 $7,000 & over. 10.5 22 28 50 25.3 0 23 77 All groups .. . .. 9.0 13 37 50 22.7 3 17 80
10

It can be concluded from these relationships that the Kailua people who bought frozen guava nectar base were, for the most part, regular customers. There was no significant tendency toward occasional purchases by large numbers of people. Thus, per capita consumption was high for the 9 percent who had bought during the previous week; for the 23 percent who had bought during the previous month; and even when taking into consideration the 35 percent who had at some time ever bought frozen guava nectar base. There would seem to be considerable opportunity for increasing sales through stimulating interest on the part of the 65 percent of the population who had never bought it.
SALES IN RELATION TO COMPETING FROZEN JUICES
Per capita sales of frozen guava nectar base in Kailua, Oahu , during 1956 were less than one-fifth as great as sales of frozen orange juice concentrate but exceeded individual sales of all o ther fro zen juice concentrates.
The 11 percent of rota! sales of frozen juice concentrates and nectar bases represented by frozen guava nectar base as shown in figure 5 and table 5 was closely followed by lemonade and passion fruit, in that order. Combined sales of all frozen juice concentrates other than orange, lemonade, passion fruit, and grape represented less than 2 percent of the total.
Pineapple 1. l %~
Limeade 0.9%
Tangerine 1.6%Grapefruit 0.5%
FIGURE 5. Comparative annual sales of frozen guava nectar base and competing frozen juice concentrates, Kailua, Oahu, T.H., 1956.
11

...... N
TABLE 5. Comparative annual sales of frozen guava nectar base, San Francisco Bay-San Jose Area, California, and Decatur, Illinois, May, 1956, through April, 1957, and Kailua, Oahu, T. H., 1956
AREA Orange and
orangeade
9 Bay Area-San Jose markets* .. 83.4 Entire Bay Area *t .. ... . .... 80.7
5 Decatur markets* . ......... 77.3 Entire Decatur Area *t .. .. ... . 72.2
Kailua, Oahu, T. H.§ . .... .. . 58.1
•May, 1956, through April , 19 57. t Based on distributors' records in each area. t:Noc available in sample. §Calendar year, 1956.
PERCENT SALES OF EACH PRODUCT REPRESENTS OF TOT AL FOR ALL PRODUCTS SHOWN
Lemon Guava and Fr.uit Grape Grape- Tangerine Limeade Pineapple Passion Nectar
lemonade punch fruit fruit Base
7.3 2.2 2.2 1.1 0.7 0.4 0.6 1.3 0.8 7.5 3.3 3.0 1.8 1.22 1.11 1.0 0.22 0.15
15.5 t 2.7 1.2 t 0.5 0.6 t 2.2 19.9 t 4.1 1.2 t 1.3 1.07 t 0.23
10.6 t 6.4 0.5 1.6 0.9 1.1 9.7 11.1
Total
100.0 100.0
100.0 100.0
100.0

During the first 12-month period following introduction, sales of frozen guava nectar base represented only 2.2 percent of total sales of all frozen juice concentrates in five Decatur, Illinois, markets and 0.8 percent in nine San Francisco Bay AreaSan Jose, California, markets . Nevertheless, sales of the frozen guava nectar base exceeded those of grapefruit, pineapple, and limeade concentrates in Decatur test markets and of tangerine, pineapple, and limeade concentrates in the California test markets.
Sales of competing low-volume juices were considerably lower in test scores where frozen guava.nectar base was available than in scores where it was not available both in Decatur and in the San Francisco Bay Area. This would seem co indicate that frozen guava nectar base had a noticeable effect on the sales of the competing low-volume juices and possibly a slight effect on the consumption of frozen lemonade base. There was no indication, however, that the introduction of frozen guava nectar base had any significant effect on sales of frozen orange juice concentrate.
Table 6 supplements the data on comparative sales in table 5 by showing consumer purchases per 1,000 capita for frozen guava nectar base and competing frozen
Gallons
per 1,000 .------------------------------,
capita
160
110
80
40
0 Orange Guava Lemonade Passion Grape Tangerine Pine Limeade Grape
Nectar Fruit apple fruit Base
FIGURE 6. Consumer purchases of frozen guava nectar base and competing frozen juice concentrates per 1,000 capita, Kailua, Oahu, T.H., 1956.
13

juices. Total sales of frozen juice concentrates included in the study averaged 538 cases per 1,000 capita for the mainland United Scates but only 310 cases for Kailua, Oahu , T. H. (figure 6 and cable 6) . Although the high percentage of frozen guava nectar base sales in Kailua was due largely co high per capita sales of the product, it was also partially due to lower per capita sales of frozen orange juice concentrate and frozen lemonade base than was true on the U. S. Mainland.
Inasmuch as the Kailua population is composed to a large extent of recent emigrants from the Mainland , many of whom are Armed Service families, there is some indication that as mainland consumers become more familiar with frozen guava nectar base, sales will tend to approach the level attained in Kailua. However, the greater familiarity with frozen orange juice concentrate and certain ocher juices on the Mainland, coupled with relatively lower prices for these products than in
TABLE 6. Consumer purchases of frozen guava nectar base and competing frozen juice concentrates per 1,000 capita, specified areas, 1956
Orange.
FROZEN CONCENTRATE
Lemonade .. .. ..... .. . ... . . . . .
Punch ... .
Grape . . .
Passion fruit. .... .. . .. ... , .. . .
Guava nectar base ... . ........ .
Tangerine ...... . . ...... .
Grapefruit ............ . .
Pineapple .... . . . . ... . , . ..... .
Limeade . . ... . ..... . . . . .. ... .
AREA
U.S.* Pacific coast* Kailua, Oahu
U.S.* Pacific coast* Kailua, Oahu
U. S.-Bay Area
U. S.-Bay Areat Kailua, Oahu
Redlands , California Kailua, Oahu
U. S.-Bay Area- Redlandst Kailua, Oahu
U. S.-Bay Areat Kailua, O ah u
U.S.* Kailua, Oahu
U. S.-Bay Areat Kailua, Oahu
U. S.-Bay Area Kailua, Oahu
GALLONS PER 1,000 CAPITA
414.1 401.9 179.5
71.1 113.9
32.8
17.1
15.4 19.9
11.4 30.l
7.3 34.3
6.0 5.1
5.7 1.7
4.2 3.5
4 .2 2.9
•consumer Pu.rcha1e1 of Selected FrnitJ and ]11.ice11 by Regions and Retail 011,tletJ, USDA Agricultural Marketing Service, October 1956 through September 195 7.
tPercenrage grape juice and ocher individual juices represented of orange juice sales in the San Francisco Bay-San Jose Area multiplied by U. S. per capi ta consumption of frozen orange juice concentrate.
tPercenrage frozen guava nectar base sales represented of frozen passion fruit juice sales in the San Francisco Bay-San Jose and Sacramento Areas multiplied by Redlands per capita consumption of frozen passion fruit juice.
14

Hawaii, would tend to limit the consumption of frozen guava nectar. Hence, although the per capita consumption of frozen guava nectar as experienced in mainland test areas will in all probability increase as the market is further developed, it would not be expected to reach the level attained in Kailua.
COMPARATIVE PURCHASES
Whereas only 3 7 percent of Kailua residents in 1956 had ever bought frozen guava nectar base in 6-ounce cans, 83 percent had bought frozen orange juice concentrate; 66 percent, frozen grapefruit concentrate ; and 48 percent, frozen grape juice concentrate (figure 7 and table 7). Frozen pineapple juice concentrate had been bought by the same percentage of people as frozen guava nectar base. Fewer people had bought frozen passion fruit juice and frozen grapefruit, limeade, and tangerine concentrates.
Percent
100
80
60
40
20
0 Orange Lemonade Grape Pineapple Guava Passion Grape Limeade Tangerine Nectar Fruit fruit Base
FIGURE 7. Percentage of consumers who had ever bought frozen guava nectar base and com peting frozen juice concentrates, Kailua , Oahu, T. H., as of June, 1956.
15

TABLE 7. Percentage of consumers who had ever bought frozen guava nectar base r.nd competing frozen juice concentrates, by income groups, Kailua, Oahu , T. H ., as of June, 1956
PERCENTAGE OF CONSUMERS WHO EVER BOUGHT FROZEN JUICE PRODUCTS
Frozen Frozen Frozep INCOME Frozen Frozen Frozen pine- Frozen Frozen grape- Frozen ca_nge-GROUP orange lemon- grape ~pple guava passion fruit lime- nne
juice ade juice JUICe nectar fruit juice ade juice concen- base concen- concen- base juice concen- base concen-
crate crate crate trace crate
Percent Percent Percent Percent Percent Percent Percent Percent Percent Under $4,000 ... 71 50 38 33 29 22 31 21 5 $4,000-$6,999 . . 83 68 49 34 37 32 24 25 14 $7,000 & over. .. 94 75 55 49 43 42 35 37 23 All groups ..... 83 66 48 37 37 32 28 27 14
The percentage of people having bought various frozen juice concentrates varied directly with the size of the income. For orange juice the percentage who had bought at one time or another ranged from 71 percent for ·the income group of under $4,000 co 94 percent for the income group of $7,000 and over. For gua.va, the comparable percentages ranged from 29 percent to 43 percent. Similar relationships existed for all other frozen juices as shown in table 7.
SALES IN RELATION TO FROZEN PASSION FRUIT JUICE
Since more is known about the mainland market for frozen passion fruit juice than for frozen gu(lva nectar base and since both are sold as ·companion products by the same companies, certain insight into the market can be gained by relating the sales of the frozen guava nectar base to the sales of frozen passion fruit juice.
Table 8 reveals that whereas in Hawaii sales of frozen guava nectar base made up almost two-thirds of the combined sales of the two juices during 1957, the opposite was true in California rest areas. Yer a slightly higher percentage of California people had bought frozen guava nectar than frozen passion fruit juice, 35 as compared with 32.
Factors rending to explain the differences in sales of the two juices are : (1) the fact that the flavm of passion fruit juice is more comparable to cirrus than is that of guava nectar and consumers are not faced with the need for developing a taste for the product; (2) the name "guava" is far less appealing than the name "passion fruit;" (3) mainland consumers are less familiar than Hawaii consumers with the high vitamin C content and other nutritional qualities of guava as compared with passion fruit ; (4) guava nectar has a thicker base and seems to have a more lasting caste appeal than does passion fruit juice once consumers become accustomed to it; and (5) the price differential between frozen guava nectar base and frozen passion fruit juice, with guava selling at the lower price, has been greater in Hawaii than in mainland test areas .
Not only did frozen guava nectar base sell better than frozen passion fruit juice in Hawaii, but its proportion of the combined sales of the two products increased
16

from 53 percent during 1956 to 62 percent during 1957. It is reasonable to assume, therefore, that mainland sales of frozen guava nectar base would improve in relation to frozen passion fruit juice as consumers become more familiar with it.
TABLE 8. Comparanve sales of frozen guava nectar base and frozen passion fruit juice, San Francisco Bay-San J ose; Sacramento, California; Kailua, Oahu ; and Terri to ry of H awaii
AREA
San Francisco Bay-San Jose May, 1956, through April , 1957 ... ... .. . . . .
Sacramento September- December, 1957 ... .. . ... . .. .. . .
Kailua Calendar year, 1956 . . .. . .............•... .
Territory of Hawaii 1956 .... ... ....... .. . . .. . . . . . . . . . .. .. . . . 1957 .. .. . .... . ....... . ....... ... . . ..... .
PERCENTAGE OF COMBIN ED SALES OF FROZEN GUAVA NECTAR BASE AND FROZEN
PASSION FRUIT JUICE IN 6-0UNCE CANS
Guava
Percent
40.3
33.8
53 .2
53.1 61.9
Passio n fruit
Percent
59.7
66.2
46.8
46.9 38.1
POTENTIAL SALES
An indicated market potential may vary considerably in accordance with the method of determination. It is essential, therefore, to qualify the results in light of all factors having an apparent bearing on the calculations. Ac a retail value of $5.04 per case, or 21 cents per 6-ounce can, potential mainland sales of frozen guava nectar base as determined by expanding data from various test areas would range from 2.6 million dollars at the San Francisco Bay Area test market rate where there was a very limited amount of promotion to 26.9 million dollars at the Kailua, Oahu , race where almost two-thirds of the consumers were aware of the produce and 46 percent had tasted it (cable 9) . Sales were low in the San Francisco Bay Area cesc markets because of lack of sufficient merchandising and promotion and because frozen passion fruit juice was introduced joincly under the same brand, thus tending to narrow the market for either of the new produces individually. Sales at the Kailua rate, on the other hand , would be difficult to attain on the Mainland because of more competition from ocher juices at lower prices and because of an environment less conducive to consumption of tropical produces .
Whereas frozen guava nectar base sells at a lower price than most competing juices in K ailua, the reverse is true on the Mainland. Per capita consumption for the entire Territory of Hawaii at a race of 21.4 cases per 1,000 capita is also somewhat higher than what could be expected on the M ainland.
17

TABLE 9. U.S. sales potentials for frozen guava nectar base as determined by different methods
Basis of determination
Based on Kailua , Oahu, rate of consumption of frozen guava
Consump
tion per
1,000 capita
Cases 24 6-oz.
Consumption,
entire U.S.
Cases 24 6-oz.
Value f.o .b .
Honolulu @ 2.88 per case
Dollars
Retail value
@ $4.56 per case (19¢ per 6-oz. can)
Dollars
R etail value
@$5.04 per case (21¢ per 6-oz. can)
Dollars
nectar base . . . . ..... .. . .. .. .. 30.49 5,335,750 15,366,960 24,331,020 26,892,180
Based on per capita consumption of frozen guava nectar base for entire Territory of Hawaii . . . . . 21.4 3,745,000 10,785,600 17,077,200 18,874,800
Based on 100 percent of Redlands sales of frozen passion fruit juice sales with distribution at level of frozen orange juice concentrate . .......... . .... . .
Based on ratio of frozen guava nectar base to passion fruit consumption in Hawaii X sales of passion fruit in Redlands at 50 percent of level of distribution of frozen orange juice concen-
10.13 1,772,750
trate .. ... ....... . . . .... ..... 8.21 1,436,no
At 63 percent of Redlands sales of frozen passion fruit juice with distribution at level of frozen orange juice concentrate. . . . . 6.49 1,135,750
Based on percentage frozen guava nectar base sales represented of frozen orange juice concentrate sales in D ecatur test markets X national per capita consumption of frozen orange juice con-centrate... ... . ............. . 6.44 1,127,000
Based on 63 percent of Redlands sales of frozen passion fruit juice at 50 percent of level of distribution for frozen orange juice concentrate. . . . . . . . 4.19 733,250
Based on percentage frozen guava nectar base sales represented of frozen orange juice concentrate sales in Bay Area rest markers X national per capita consumption of frozen orange juice concentrate ........ . . . 2.94 514,500
18
5,105,520 8,083,740 8,934,660
4, 137,840 6, 551,580 7,241,220
3,270,960 5,1 79,020 5,724,180
3,245,760 5,139,120 5,680,080
2,111 ,760 3,343,620 3,695,580
1,481,760 2,346, 120 2,593,080

A seemingly more realistic estimate of potential mainland sales of frozen guava nectar base can be derived by relating comparative sales of frozen guava nectar base to sales of frozen passion fruit juice in areas where both are sold to sales of frozen passion fruit juice in Redlands , California, where market tests have been in progress for almost three years . In spite of the fact that frozen passion fruit juice has outsold frozen guava nectar base by a ratio of nearly 2 to 1 in mainland test areas, the reverse has been true in Hawaii as previously mentioned. Thus frozen guava nectar base can be expected co be more difficult to promote than frozen passion fruit juice on the Mainland because of its unfamiliar flavor and uninteresting name. Yet, it has a nutritional value and a lasting flavor appeal that should enable its sales to surpass those of frozen passion fruit juice after consumers have had an opportunity to develop a greater appreciation for it. With distribution equal to 50 percent of that of frozen orange juice concentrate4 and sales per score equal to 63 percent of that of passion fruit juice in Redlands, California, potential retail sales at $5.04 per case would amount to 3. 7 million dollars. Using the K ailua sales ratio of 1.62 cases of frozen guava nectar base for each case of frozen passion fruit juice, the potential based on the above data would amount to 7 .2 million dollars.
These determinations are based on the level of U. S. prosperity existing during 1957. Although the consumption of basic food commodities varies less than the consumption of nonessential products in accordance with changes in general business conditions, the prices , without production control, are apt to fluctuate more. Under the assumption that frozen guava nectar base will make a place for itself in the market along with the more common juices, the general price level would have a bearing on the extent to which the above potential could be realized. However, in making long-run predictions, economists foresee a slowly rising price level, but one which is hampered with occasional declines. The outlook is for an increasi ng national product as influenced by slightly rising prices , a growing popularion, and increasing economic development. A conservative projecrion of frozen guava nectar base sales in light of current price relationships seems reasonable.
Taking all of the above factors into consideration, potential retail sales of frozen guava nectar base in 6-ounce cans after a reasonably thorough exploitation of the mainland market could be expected to amou nt to at least 7 million dollars. With very intensive promorion this potential would likely be exceeded. It is a reasonable goal until more historical data on mainland sales become available. This potential , of course, can be realized only through a marker development program supported by adequate merchandising, promotion, and advertising. A more thorough coverage of the problems of market development is included in a subsequent section of this report.
MARKET DEVELOPMENT
The indicated sales potential for frozen guava nectar base can be realized only through adequate merchandising and promotional programs backed up with a suf-
'Frozen grapefruit juice concentrate during 1956 had a placement of 56 percent of that of frozen orange juice concentrate as related co gross volume of sales of retail scores. Since frozen guava nectar base outsold frozen grapefruit juice in most scores where both were available, an estimated 50 percent placement for frozen guava nectar base would seem conservative.
19

---- -- -------------------------
ficient supply of juice. The cost-price structure must be such as to allow the necessary advertising margin and permit selling the product at competitive prices.
Cursory observation would indicate that the cost-price structure for frozen guava nectar base poses no problem at the present time. Most of the processing machinery used for passion fruit is also used for guava and the cost of processing guava is lower because of a higher yield of frozen nectar base per pound of raw fruit.
It requires 3.05 pounds of oranges, 1 pound of passion fruit, and only .4 pound of guava puree to make one 6-ounce can of the respective concentrates or nectar bases. Approximately .16 pound of sugar is required per 6-ounce can of frozen guava nectar base and .30 pound of sugar per 6-ounce can of concentrate for frozen passion fruit juice.
Yet, since consumers are less apt to appreciate guava than passion fruit when first introduced , the cost of mainland market development may well be higher per unit of sale for frozen guava nectar base than for frozen passion fruit juice. Hence, the expected higher advertising margin necessary for financing market development for frozen guava nectar base would at least in part offset the advantage of a more efficient yield of the frozen base per pound of raw fruit.
An effective initial plan of market development for frozen passion fruit juice has been calculated to cost in the vicinity of 24 cents per case of 24 6-ounce cans or 1 cent per pound of raw fruit. 5 As mentioned previously, the advertising cost per case of guava would be expected to be in excess of that for passion fruit because of the somewhat more difficult problem of consumer education. Yet in view of the higher yield of nectar base per pound of fruit, the expected cost of promoting guava, although higher per case, might well be lower per pound of raw fruit. The analysis of market development for frozen passion fruit juice as presented in HAES Agricultural Economics Bulletin 11 would be, for the most part, also applicable to
frozen guava nectar base. 6
SUMMARY AND CONCLUSIONS
Frozen guava nectar base in 6-ounce cans, introduced commercially during the spring of 1956, constituted over 11 percent of the sales of all frozen juice products in Kailua, Oahu, during 1957. Its sales, although only one-fifth as great as those of frozen orange juice concentrate, exceeded the individual sales of all other competing frozen juice concentrates. The product has not fared this well in mainland test areas but has , nevertheless, made a good showing in relation to lower volume juices. In Decatur, Illinois, test markets, frozen guava nectar base represented 2.2 percent of the sales of frozen juice concentrates and exceeded grapefruit, pineapple, and limeade. In test markets in the San Francisco Bay-San Jose Area of California, the frozen guava nectar base represented only .8 percent of sales of frozen juice concentrates but outsold pineapple, tangerine, and limeade.
In Hawaii, where a substantial percentage of consumers are familiar with both frozen guava nectar base and frozen passion fruit juice, guava nectar base sales
6Scott, Frank S., Jr., An Analy1iJ of Market Development for Frozen Pa11ion Fruit juice, Hawaii Agricultural Experiment Station in cooperation with Economic Planning and Coordination Authority, Territory of Hawaii, Agricultural Economics Bulletin 11, June, 1958.
6/bid.
20

exceeded those of passion fruit by a ratio of almost 2 to 1. In the San Francisco Bay Area , San Jose, and Sacramento, California, test markets where both products were available almost exactly the opposite was true.
Passion fruit juice, because of its citrus-like flavor and exotic name, seems to
be accepted more readily initially than the more bland, unfamiliar tasting guava nectar. Yet, once consumers attain a taste for guava nectar made from the frozen base they are apt to remain repeat users . The guava nectar is more nutritious and is used more consistently as a breakfast drink than is passion fruit juice. It is logical to
assume, therefore, that as mainland consumers become more familiar with frozen guava nectar base its popularity will increase in relation to competing frozen juice concentrates.
With distribution at 50 percent of that of frozen orange juice concentrate, findings based on sales in Hawaii and in mainland test markets indicate that mainland consumption of frozen guava nectar base with proper promotion can be expected to amount to at least 8 cases of 24 6-ounce cans per 1,000 capita. At this rate, the requirement for supplying the entire Mainland would be 1,400,000 cases. At an f.o.b. Honolulu price of $2 .88 per case, this would provide a gross return of $4,032,000 to the territorial economy. At a retail value of $5 .04 per case, gross sales at the national level would amount to $7,056,000. As the U. S. population grows and consumers develop a greater preference for guava nectar in relation to other juices and nectars, this potential would, of course, increase. The $7,000,000 figure is a minimum goal which is indicated to be attainable in light of available sales data as related to U. S. population and purchasing power prevailing during 1957 and assuming a market development program similar to that outlined for frozen passion fruit juice in HAES Agricultural Economics Bulletin 11. 7
1Ibid.
21