1 Fresh or Frozen? Consumer Preferences and Willingness to ...
42
1 Fresh or Frozen? Consumer Preferences and Willingness to Pay for Vegetables Pamela A. Heinrichs, M.S. University of Illinois at Urbana-Champaign 1301 W. Gregory Dr. 326 Mumford Hall Urbana, IL 61801 [email protected] Brenna Ellison, Ph.D.* University of Illinois at Urbana-Champaign 1301 W. Gregory Dr. 321 Mumford Hall Urbana, IL 61801 217-300-0238 [email protected] * indicates corresponding author DRAFT – NOT FOR CITATION – JANUARY, 2016
-
Upload
khangminh22 -
Category
Documents
-
view
3 -
download
0
Transcript of 1 Fresh or Frozen? Consumer Preferences and Willingness to ...

1
Fresh or Frozen? Consumer Preferences and Willingness to Pay for Vegetables
Pamela A. Heinrichs, M.S.
University of Illinois at Urbana-Champaign
1301 W. Gregory Dr.
326 Mumford Hall
Urbana, IL 61801
Brenna Ellison, Ph.D.*
University of Illinois at Urbana-Champaign
1301 W. Gregory Dr.
321 Mumford Hall
Urbana, IL 61801
217-300-0238
* indicates corresponding author
DRAFT – NOT FOR CITATION – JANUARY, 2016

2
ABSTRACT
Americans’ vegetable consumption is below the recommended levels, contributing to obesity and
other health issues. While increased intake is recommended, many obstacles still impede
Americans from reaching vegetable intake goals. Recommendations typically focus on
promoting fresh vegetable consumption, although other forms, namely frozen, are less
expensive, store longer, and are considered nutritionally equivalent to fresh. Using an online
choice experiment, this study examined consumer preferences and willingness to pay for fresh
and frozen vegetables. Additionally, we examined whether providing accurate nutrition
information on fresh and frozen vegetables influenced preferences. Results revealed that
consumers strongly preferred fresh vegetables to frozen and that information about the nutrition
content of fresh and frozen vegetables did not significantly alter preferences. We found that most
consumers steam vegetables, so convenient features like steamable packaging are highly valued
in purchasing decisions. Finally, we found that higher levels of nutrition knowledge lessen the
aversion towards frozen vegetables; however, knowledge varied across socio-demographic
subgroups. Men, younger respondents, and food insecure respondents exhibited significantly
lower knowledge levels. Increasing nutrition knowledge could make these groups more willing
to purchase frozen vegetables.
Key Words: fresh vegetables; frozen vegetables; choice experiment; consumer preference;
information treatment

3
1. INTRODUCTION
Much attention has been given to the state of diet and nutrition in the United States
(U.S.). This has been brought on in part by higher rates of obesity and diet-related diseases.
Recent reports show that 68.5 percent of the U.S. population is overweight or obese (BMI greater
than or equal to 25). The CDC reported in 2012 that the obesity rate in the United States had
grown four percentage points in the past decade to 35.5 percent of the population (Ogden et al.
2014).1 Additionally, the Dietary Guidelines for 2015 state an urgent need to alter food
purchasing and consumption habits, making special note of the role of the food industry to
market and promote healthy foods (USDA-HHS 2015).
One recommendation for reducing the rates of obesity and diet-related diseases is to
increase the consumption of vegetables (WHO 2015).2 Vegetables contribute important vitamins,
minerals, antioxidants, and fiber to support a healthy body and help to lower the risk of
developing certain chronic diseases, and are especially important to growing children (CDC
2013). Vegetables tend to be lower in fat and calories and have lower dietary energy densities
which can help in weight maintenance (Vernarelli et al. 2011; CDC 2009). According to USDA
MyPlate recommendations, vegetables alone should take up approximately 30% of one’s plate at
every meal (USDA 2016; PBH 2012), yet research shows these consumption guidelines are not
being met (Guthrie et al. 2005; CDC 2013); one survey of consumers found that vegetables
accounted for just 16% of respondents’ daily food intake (Mintel 2014).
While increasing vegetable intake is desirable, there is often an accompanying
recommendation to eat fresh vegetables rather than processed varieties. Recommending fresh
vegetables is appropriate for consumers who (1) can afford fresh vegetables and (2) have regular
1 While it is true U.S. obesity and overweight rates are much higher compared to 10-20 years ago, it should be noted that the
Ogden et al. (2014) also shows that these rates are starting to level out.
2 Without question, policymakers, dietitians, and the medical community alike encourage more servings of both fruits and
vegetables; however, the focus of this research is on vegetables.

4
access to them, but this is not the case for all consumers (Pollard, Kirk, and Cade 2002; Blaylock
et al. 1999). Frozen vegetables, on the other hand, are generally more accessible (in terms of
price and availability) to a wider range of consumers and have a longer shelf life, reducing the
likelihood of spoilage. Additionally, frozen vegetables, which are blanched and flash frozen soon
after harvest, have equivalent (or even greater, in some cases) nutrient levels to their fresh
counterparts. On paper, frozen vegetables appear to be an attractive alternative or substitute for
fresh vegetables; however, market research shows consumers clearly prefer the fresh form (PBH
2012).
Consumers perceive fresh vegetables to be superior to frozen on a range of attributes,
including sensory properties, flavor and taste, and nutritional content (PBH 2014); thus,
overcoming these biases may prove challenging for frozen vegetable producers and
manufacturers. Overall, consumer preferences for vegetables are shaped by many factors like
societal or familial environments, familiarity and habit, sensory appeal (including taste, quality,
smell, texture, and appearance), cost, convenience, health, and availability, among others
(Pollard, Kirk, and Cade 2002). Numerous studies have found that for American consumers,
taste preference is an important food attribute and has a large influence on food choice behavior
(Schutz et al. 1984; Gibson, Wardle, and Watts 1998; Glanz et al. 1998; Pollard, Kirk, and Cade
2002; Gunden and Thomas 2012; van der Pol and Ryan 1996; Harker, Gunson, and Jaeger 2003;
Grunert 2005).3 Studies have shown that the preference for taste outweighs other practical
attributes like nutritional value and cost (Gibson, Wardle, and Watts 1998; Sloan 2011).
Knowledge is also a significant component of vegetable choice. Wardle, Parmenter, and
Waller (2000) found that nutrition knowledge was an important factor in food choice and that it
contributed positively to vegetable consumption. Research has shown that consumers with more
3 Other consistently high-valued attributes include texture, freshness, price, and quality attributes like appearance and smell.

5
knowledge about nutrition were more likely to eat the recommended amounts of vegetables,
suggesting that information on nutrient levels in food may contribute towards more vegetable-
rich diets (Parmenter, Waller, and Wardle 2000; Guthrie et al. 2005). Even after controlling for
demographic variables, nutrition knowledge was found to be significantly associated with
healthy eating. Wilcock et al. (2004) suggest that knowledge shapes perceptions and beliefs
about foods, so proper nutrition education has an important role in influencing food preferences.
Based on the relationship between knowledge and vegetable intake, much academic
research has attempted to increase vegetable consumption through information. In a meta-
analysis of studies with treatment and control groups designed to increase fruit and vegetable
consumption in adults, Pomerleau et al. (2005) found that small increases in fruit and vegetable
consumption were possible, especially with individualized telephone or computer-based
interventions or worksite interventions that were geared toward education. However, the largest
impacts were found in interventions that utilized social resources like family members or peers
who acted as social support. Interventions such as tailored printed documents, computer
generated newsletters, and motivational phone calls had little effect on behavior (Pomerleau et
al. 2005). It should be noted, however, that previous studies have strictly focused on educational
efforts to improve overall vegetable consumption levels; none had educational efforts targeted to
specific vegetables forms (fresh, frozen) – a gap the current study aims to address. It is important
to understand consumers’ preferences for different vegetable forms (in addition to vegetables in
general) in order to devise the best strategies for promoting increased vegetable intake.
The overall purpose of this research was to gain a better understanding of consumers’
preferences and willingness to pay for fresh and frozen vegetables. Further, we sought to
determine if providing accurate nutrition information on fresh and frozen vegetables influenced

6
purchase intentions. A secondary objective was to examine the role of nutrition knowledge on
vegetable preferences. To accomplish these goals, we examined consumer preferences for fresh
and frozen vegetables (specifically we examined broccoli, carrots, and green beans) through a
choice experiment – a common tool used in the economics literature for choice and valuation
studies (see Tonsor and Shupp 2011; Brooks and Lusk 2010; Adamowicz et al. 1998).
2. REVIEW OF SCIENTIFIC LITERATURE
A great deal of scientific work has been conducted to compare various nutrient levels
between fresh and frozen vegetables.4 Vitamin C has been a highly studied component because it
is a basic indicator for nutritional value (Giannakourou and Taoukis 2003; Lee and Kader 2000).
Vitamin C is an antioxidant that is important for health; however, it is also easily lost through
handling and storage conditions, which makes it important to examine in the context of fresh and
frozen vegetables (Lee and Kader 2000; Favell 1998; Murcia, Jiménez, and Martínez-Tomé
2009).
Frozen vegetables are processed in two steps: blanching and freezing. The blanching
process uses steam or hot water to heat the vegetables which stops chemical reactions in the plant
that cause it to lose flavor, color, vitamins, and texture (Rickman, Barrett, and Bruhn 2007;
NCHFP 2015). During the freezing process, ice crystals form which damage plant tissues,
causing changes in the texture of the vegetable product. Many times, vegetables preserved using
slower freezing methods will be described as softer or rubbery, depending on the vegetable
(Steinbuch 1976); however, this damage can be lessened in vegetables by using faster processing
methods (Brown 1967). Currently, many processing facilities use the flash freezing method,
4 Nutrient levels have also been examined in canned vegetables. However, since the focus of the present study is on
fresh and frozen vegetables, we only discuss nutrient comparisons between these two vegetable forms.

7
where vegetables are quickly frozen by subjecting them to cryogenic temperatures (like by using
liquid nitrogen). This prevents large ice crystals from forming, decreasing damage to the plant
tissue.
In terms of nutrient damage, scientists have found that the blanching process decreased
the level of vitamin C in vegetables, but there were minimal further reductions in vitamin C
content while the vegetables were frozen. Specific to our study, researchers found that steam
blanching caused small vitamin C losses in carrots and green beans and larger losses (30 percent)
in broccoli (Howard et al. 1999). After this blanching process, however, these vegetables only
exhibited slight vitamin C losses for a year after being frozen. Additional nutrient loss results
from blanching treatments like washing and peeling but, like vitamin C, these levels remain
constant in frozen storage (Lee and Kader 2000; Rickman, Barrett, and Bruhn 2007; Murcia,
Jiménez, and Martínez-Tomé 2009; Hunter and Fletcher 2002).
While not processed, fresh vegetables are also subject to nutrient loss. In a study focused
on peas and spinach, Hunter and Fletcher (2002) found greater antioxidant losses for vegetables
stored chilled or at an ambient temperature, like the fresh produce bought in a supermarket, than
in their frozen counterparts. This is because vegetables begin to lose antioxidants when they are
picked and this loss continues during transportation and storage. The study concluded that the
frozen vegetables they studied had similar levels of antioxidants to fresh vegetables at the time of
purchase from the supermarket (Murcia, Jiménez, and Martínez-Tomé 2009; Hunter and Fletcher
2002).
3. METHODS
3.1 Choice Experiment Methodology

8
To investigate consumer preferences and willingness to pay (WTP) for fresh and frozen
vegetables, an online choice experiment (CE) design was used. Online choice experiments are
popular among researchers because of their fast completion timeframe and low cost (Louviere,
Hensher, and Swait 2000; Gao and Schroeder 2009; Fleming and Bowden 2009). Choice
experiments are an attribute-based modelling technique wherein individuals are presented with a
set of goods and are asked to indicate which of those goods, if any, they would purchase. This is
a common tool used in the economics literature to value choices and choice attributes (Yue and
Tong 2009; Tonsor and Shupp 2011; Brooks and Lusk 2010; Adamowicz, Louviere, and Swait
1998; Lusk and Schroeder 2004; Loureiro and Umberger 2007). Choice experiments are
especially useful in valuing private goods, as they simulate real-life purchasing decisions in the
marketplace that require trade-offs. The CE method avoids yea-saying (so respondents cannot
simply agree to what is being asked, but must actually choose between responses), allows single
attributes to be given value estimates, and can evaluate many attributes at the same time which
results in rich data (Carlsson and Martinsson 2001; Hanley, Wright, and Adamowicz 1998).
Attribute-based modelling techniques like choice experiments rely on Lancaster’s (1966)
theoretical assertion that utility does not come from a good itself, but from the properties and
characteristics of that good. Thus, people make decisions not on the item itself, but on the item’s
attributes. This theory allows researchers to create goods that are “bundles” of attributes that can
be used to study valuation and preferences. Using this theory, we can define utility as a function
of a good’s attributes that benefits the consumer through consuming the good (Louviere,
Hensher, and Swait 2000). WTP estimates derived from choice experiments can serve as a proxy
for demand change that can be applied to real-world applications (Lusk and Anderson 2004;
Lubben 2005).

9
In this study, individuals selected between three choice alternatives. Option A and Option
B were bagged vegetables with a defined set of attributes (fresh or frozen, price, etc.) while
Option C was a ‘No Buy’ option (see figure 1). The no-purchase option allowed participants to
indicate that neither option presented was appealing at the stated price, which mimics market
design (Adamowicz, Louviere, and Swait 1998; Lusk and Schroeder 2004; Louviere, Hensher,
and Swait 2000). Additionally, the ‘No Buy’ option is useful in data analysis because it sets the
base of the utility scale which can be used to compare other choices (Lusk and Schroeder 2004).
One concern with online choice experiments is the potential for hypothetical bias. This is
the concern that respondents will report choices online that they would not make in an actual
purchase context (because there is no transaction mechanism in place), which could result in
overstated willingness to pay values. To address any possible hypothetical bias, an ex-ante cheap
talk script was included before the choice experiment section of the questionnaire (see figure 2).
In general, cheap talk scripts inform participants about the presence of hypothetical bias in past
research. By informing participants that such a bias exists, it ideally makes them more aware of
their actual preferences when making their own choices. The cheap talk script used in this study
has been found to decrease hypothetical bias in online choice experiments (Tonsor and Shupp
2011).
3.2 Data Collection Strategy
During the summer of 2015, three online surveys were distributed to a Qualtrics
participant panel, each collecting roughly 500 responses. Respondents were recruited to match
the U.S. population in terms of age and income, with primary shoppers preferred. To be eligible
for the study, respondents had to indicate that they ate the vegetable in question (broccoli,
carrots, or green beans). This method ensured respondents would be making choice decisions on

10
a product they were at least willing to eat (and likely willing to buy). The questionnaires differed
only in the vegetable employed in the choice experiment section. Broccoli, carrots, and green
beans were selected because (1) they are all among the more commonly purchased vegetables in
both fresh and frozen forms, and (2) products exist in the marketplace with and without the
attributes in question, so the products presented would seem realistic and highly plausible
(Venkatachalam 2004). Additionally, each of these vegetables translates well between their fresh
and frozen states, so no further processing is needed beyond the freezing process itself.5
To examine the role of information about vegetable nutrition on purchase intentions, half
of the respondents in each survey (approximately 250 people per vegetable type) were randomly
assigned to read a page of information about the nutritional content of fresh and frozen
vegetables before completing the choice sets (see figure 3). Respondents in the control groups
received no information.
Within the choice experiment, we considered five product attributes: vegetable form
(frozen or fresh), production method (USDA organic or conventional), branding (private
label/generic or Green Giant), convenient packaging (steamable or non-steamable bag), and price
(four levels ranging from $0.99 to $5.49). The brand employed, Green Giant, was selected
because it is a commonly found brand nationwide and exists for both fresh and frozen
vegetables. Price levels were based on observed market prices. The price variable allows us to
calculate the monetary tradeoffs of each attribute level to keep a constant level of utility. Table 1
provides a full list of attributes and their respective levels.
In total, this design employed four product attributes with two levels each and one
attribute (price) with four levels, resulting in 64 (24*4
1=64) possible product combinations. With
5 Potatoes, for example, do not translate well across fresh and frozen states because fresh potatoes are sold whole
whereas frozen potatoes undergo some sort of processing, like being cut into smaller pieces or seasoned, before they
are frozen.

11
two products presented in each choice set, there was a total of 4,096 possible choice sets
(64*64=4,096). This full factorial was reduced to a fractional factorial design that consisted of
sixteen choice sets for each participant, which represents the optimal D-efficiency experimental
design. The choice sets were randomized within participants to control for ordering effects and
respondent fatigue (Gao and Schroeder 2009; Champ, Boyle, and Brown 2003; Lusk and
Schroeder 2004; Loureiro and Umberger 2007).
Apart from the choice experiment, participants were asked about their vegetable
consumption and purchasing habits as well as the importance of several factors (price, quality,
flavor, etc.) in their vegetable buying decisions. We also included socio-demographic questions
such as age, gender, income, and geographic region as well as questions related to SNAP
participation, food security, and nutrition knowledge level. Food security status was constructed
by using the six-item short form food security module developed by the USDA Economic
Research Service that has been found to be an effective substitute for longer measures in
determining food security status (ERS 2012; Blumberg et al. 1999). Nutrition knowledge was
assessed through a series of twelve questions that were based on information from MyPlate.org
and measures constructed by Parmenter and Wardle (1999). Correct answers to these questions
were tallied to construct a knowledge score, which ranged from 0 to 12. These knowledge scores
were categorized into high and low knowledge levels with high knowledge respondents scoring
in the top quintile of responses, as done in Geaney et al. (2015).
Prior to launching the full-scale survey, a number of checks were conducted to ensure the
survey instrument’s reliability. The factual content of the information treatment was reviewed by
eight human nutrition experts to ensure validity of the nutrition information presented to
participants. Additionally, a pre-test was conducted using the Amazon mTurk platform to assess

12
the survey instrument and vegetable package stimuli. Graphics were designed to represent each
of the different hypothetical products (see figure 1) in order to make the choice decisions more
realistic and to illustrate the different attributes on the packages. In the pre-test, we asked
participants what they liked and disliked about two products from a choice set to make sure there
were no major aesthetic issues (e.g., color, package shape) that were unduly influencing choices.
We analyzed the qualitative responses and found that respondents liked and disliked a wide
variety of product attributes – no single attribute (packaging or otherwise) stood out as
problematic.
3.3 Model and Data Analysis
This experiment relies on Random Utility Theory (RUT) for discrete choice models,
which assumes that individuals make choices that maximize their utility. A random parameter
(mixed) logit (RPL) model was used to analyze the choice experiment data collected in the
survey. This model can capture random taste variation in the sample through estimating the mean
and standard deviation of each random parameter’s distribution (Champ, Boyle, and Brown
2003). The RPL relaxes the assumption of independent and irrelevant alternatives (IIA) and can
allow for correlation of unobserved factors (Wolf, Tonsor, and Olynk 2011; Champ, Boyle, and
Brown 2003). The RPL specification is recommended for models like the present study that use
repeated choices by the same decision-maker.
Based on the random utility framework, an individual’s utility can be modeled as a
function of two components. The first is the systematic portion of the utility function; this
portion is assumed to depend on the attributes of the individual i and the choice option j. The
second component of the utility function is a stochastic error term that captures individual
idiosyncrasies not observable to the researchers and is independently and identically distributed

13
(i.i.d.) over all of the alternatives and choice scenarios. Thus, the random utility function for each
vegetable c, can be expressed as:
(1) 𝑈𝑖𝑗𝑐 = 𝑉𝑖𝑗
𝑐 + 𝜀𝑖𝑗𝑐
Where the systematic, observable portion of the utility function, 𝑉𝑖𝑗𝑐 , is linear in parameters and
specified as:
(2) 𝑉𝑖𝑗𝑐 = 𝛽1
𝑐(𝑃𝑟𝑖𝑐𝑒𝑖𝑗) + 𝛽2𝑐(𝐹𝑟𝑜𝑧𝑒𝑛𝑖𝑗) + 𝛽3
𝑐(𝐺𝑟𝑒𝑒𝑛 𝐺𝑖𝑎𝑛𝑡𝑖𝑗) + 𝛽4𝑐(𝑂𝑟𝑔𝑎𝑛𝑖𝑐𝑖𝑗)
+ 𝛽5𝑐(𝐶𝑜𝑛𝑣𝑒𝑛𝑖𝑒𝑛𝑡 𝑃𝑎𝑐𝑘𝑎𝑔𝑖𝑛𝑔𝑖𝑗) + 𝛽6
𝑐(𝐹𝑟𝑜𝑧𝑒𝑛 ∗ 𝐼𝑛𝑓𝑜𝑖𝑗) + 𝛽7𝑐(𝑁𝑜 𝐵𝑢𝑦𝑖𝑗)
In this specification, 𝛽1 represents the marginal (dis)utility of price, 𝛽2 - 𝛽5 are the marginal
utilities for the attributes, 𝛽6 is an interaction term between the frozen vegetable attribute and the
information treatment, and 𝛽7 represents the base of the utility scale. In the RPL specification,
we allowed 𝛽2 - 𝛽5 to vary normally across consumers (in other words, preferences for these
attributes were assumed to be heterogeneous). We estimated a mean and standard deviation for
each of these coefficients; if the standard deviation was significant, this implied that preference
heterogeneity existed for the product attribute.6
The probability of selecting alternative j is determined because utility cannot be directly
observed. In the RPL model, the probability that alternative j will be selected by the individual i
is shown as:
(3)𝑃𝑖𝑐(𝑗) =
exp(𝜇𝛽𝑋𝑗)
∑ exp(𝜇𝛽𝑋𝑘)𝑘∈𝐴
where β is a vector of parameters, X is a vector of variables representing vegetable product
attributes, k represents competing choice alternatives in the total set of alternatives A, and µ is a
6 Both RPL and multinomial logit (MNL) models were estimated, however likelihood ratio tests suggested that the
RPL was more appropriate for the data. This decision is supported by the statistically significant standard deviation
estimates generated by the RPL model.

14
scale parameter that is inversely related to the error term and is assumed to equal 1 (Olynk, Wolf,
and Tonsor 2012).
From equation (2), we posited the following hypotheses. First, we hypothesized that, all
else constant, respondents would prefer lower-priced options over higher-priced options. Thus,
we expected 𝛽1< 0. Second, we hypothesized that fresh vegetables would be preferred to frozen
(𝛽2< 0.) Mintel (2014) found that consumers largely prefer fresh over processed (e.g. canned,
frozen, dried) vegetables because of health perceptions and the belief that fresh vegetables are
more nutritious and flavorful. Additionally, the same report found that within the last year, 20
percent of respondents reported eating less frozen vegetables than they have in the past, leading
us to expect this coefficient to be negative.
Third, we hypothesized that the national brand (Green Giant) vegetables would be
preferred to the private-label vegetables; thus, 𝛽3>0. Often, national brand products are preferred
over private-label (generic) products because brands are a quality cue and allow consumers to
inform their decisions through past experience (Winer 1986; Grunert 2002). However, fresh
vegetables often have much less branding than packaged goods (meaning less brand recognition
and brand affect) so the relationship between brand and utility may not be as strong as in other
product categories.
Fourth, we hypothesized that both organic and conveniently packaged (steamable)
vegetables would be preferred to their non-organic and non-conveniently packaged counterparts
(𝛽4 > 0 and 𝛽5 > 0). Multiple studies have shown consumers are willing to pay premiums for
organic products, especially organic produce (see Moser, Raffaelli, and Thilmany-McFadden
2011 for a review), so we expected this result to hold in our study. In terms of convenience,
research shows that younger generations demand convenience for food preparation and that

15
“heat-and-eat” options are increasing in popularity, so we expected the steamable attribute to be
positively valued by respondents (Pollard, Kirk, and Cade 2002; Vanhonacker, Pieniak, and
Verbeke 2013).
Finally, while we posited that fresh vegetables will be preferred to frozen, we expected
that those respondents who received information on the similarities in nutritional levels between
fresh and frozen vegetables would have a more favorable attitude toward frozen vegetables, so
𝛽6> 0.
4. RESULTS AND DISCUSSION
4.1 Participant Characteristics
In total, our questionnaire data yielded 1514 usable responses (n=502, 502 and 510 for
broccoli, carrots and green beans, respectively) and 11 incomplete responses that were excluded
from analysis. Table 2 provides characteristics of survey respondents across each of the three
vegetable sub-samples as well as for the pooled sample. Chi-squared analyses revealed there
were no significant differences in demographics across the three samples with the exception of
two variables: the proportion of respondents who eat fresh vegetables daily and the proportion
who reside in the southern United States. Since all other variables were similar across the three
samples, we discuss the demographics of the pooled sample. Our sample was comprised nearly
entirely of primary shoppers (98.08%), which is preferred since the choice experiment mimics
actual purchase decisions. The survey respondents were mostly female (69.55%), with 39.43% of
respondents having a child in the home. In terms of current vegetable consumption behavior,
89.56% and 68.56% of respondents reported eating fresh and frozen vegetables at least once a
week, respectively. The number of nutrition knowledge questions answered correctly represents

16
the knowledge score. The mean of this score for the overall sample was 8.14 (±2.45). Also
related to knowledge, we found that 43.66% of respondents agreed (either somewhat or strongly)
that nutrient levels of fresh and frozen vegetables were the same. Surprisingly, 40.49% of our
sample was considered food insecure, which is well above the 2014 national level of 14.0%
(ERS, 2015). One possible explanation for this result is that individuals who participate in online
survey panels may be inherently different from people who do not participate in such panels,
even though respondents in our sample had household incomes that were representative of the
U.S. population. Lusk and Brooks (2011) found that participants in household scanning panels
were more price sensitive than a random sample of the U.S. population, which could potentially
correlate with food security status.
4.2 Vegetable Preparation and Purchase Decision Factors
Participants were asked how they preferred the assigned vegetable to be prepared. Six
preparation methods were considered: steaming, sautéing, roasting, baking, grilling, and raw.
Using a chi-squared test, we found that there was significant variation (P<0.05) between the
three vegetables in the percentage of respondents who reported liking the vegetable raw,
steamed, sautéed, and roasted (figure 4 provides a graphical comparison of preparation methods
for each vegetable). Specifically, respondents were more likely to prefer green beans sautéed,
carrots raw and roasted, and broccoli steamed. The steamed and raw preparation methods are
important because the convenience attribute in the choice experiment is represented by a
steamable bag. In the case of fresh, if respondents prefer to eat the vegetable raw, then they may
not care about the steamable bag. These vegetable-specific usage characteristics can be used to
inform the results of the choice experiment because the value consumers place on attributes of

17
packaged vegetable products is related to how they envision they would use and prepare that
product.
Participants were then asked to rate the importance of several factors in their vegetable
purchase decision. Each factor could be rated as very, somewhat or not important. These
responses are shown in figure 5. In reviewing the factors that respondents considered to be very
important to their vegetable buying decisions, the most important were freshness and flavor
(indicated to be very important by 91.51% and 87.16% of respondents, respectively). This agrees
with the majority of academic research that found characteristics relating to taste and quality are
highly valued to consumers (Pollard, Kirk, and Cade 2002; Grunert 2005; Viaene, Verbeke, and
Gellynck 1998). These are reported to be even more important than price when purchasing
vegetables. Also directly relevant to this study are the relatively lower (though still important to
the majority of respondents) levels of importance reported for brand, organic, and convenience.
4.3 Choice Experiment Results
Before estimating the RPL model, likelihood ratio tests comparing the pooled and
separate vegetable models rejected the null hypothesis that 𝛽𝑘𝑐𝑎𝑟𝑟𝑜𝑡 = 𝛽𝑘
𝑏𝑟𝑜𝑐𝑐𝑜𝑙𝑖 = 𝛽𝑘𝑔𝑟𝑒𝑒𝑛 𝑏𝑒𝑎𝑛
,
where k>1, meaning that there was significant variation in the estimates between different
vegetable samples. This indicated that the samples should not be pooled, so separate models for
each vegetable were estimated (see table 3). All of the main attribute coefficients were highly
significant (P<0.01) for each model. Each coefficient represents an individual’s marginal utility
for an attribute. While directly interpreting these coefficients is discouraged, the sign of the
coefficient can provide insight as to which attributes contribute positively or negatively to an
individual’s utility (Wolf, Tonsor, and Olynk 2011).

18
Looking at the coefficients, we found that in each model estimated the price attribute (𝛽1)
was negative as hypothesized, indicating that as the price increased, the respondent’s utility
decreased. Also we see that our hypothesis is confirmed that fresh vegetables were preferred
over frozen since 𝛽2< 0. Further, the Green Giant (𝛽3), organic (𝛽4) and convenient (steamable)
packaging (𝛽5) estimates were significantly positive across all models, indicating that these were
preferred to their private label, non-organic and non-steamable counterparts, respectively.
Turning to the interaction term between the information treatment and frozen variable, we
hypothesized that receiving information about the nutritional content of fresh and frozen
vegetables would have a positive effect on the marginal utility of the frozen form (because this
information should correct any misperceptions consumers may have about differing nutritional
content between fresh and frozen vegetables). We found that the interaction term (𝛽6) was
positive; however, this estimate was not statistically significant in any vegetable model. This
suggests the effect of the information was not strong enough to significantly reduce an
individual’s marginal disutility of frozen vegetables. The negative coefficient for the ‘No Buy’
variable (𝛽7) indicated that consumers would prefer to have a given package of vegetables than
not; in other words, not purchasing a vegetable option would decrease an individual’s utility.
Additionally, in all of the main attributes we found highly significant standard deviation
estimates. This supported the decision to use the RPL, as these estimates revealed there was
heterogeneity in preferences.
Using the estimated coefficients, we can calculate a willingness to pay value for each
vegetable attribute. For example, the willingness to pay for frozen vegetables would be
calculated as 𝑊𝑇𝑃𝑓𝑟𝑜𝑧𝑒𝑛 = −𝛽𝑓𝑟𝑜𝑧𝑒𝑛
𝛽𝑝𝑟𝑖𝑐𝑒. If the ratio is positive, this means consumers are willing to
pay a premium for frozen vegetables relative to fresh vegetables. However, if the ratio is

19
negative (which was observed across all three vegetables in this study), this means you would
have to pay a consumer to take frozen vegetables over fresh vegetables. Table 4 provides the
complete set of mean willingness to pay values across all model specifications.
Our first objective was to better understand consumer’s preferences for fresh and frozen
vegetables. The results show that in each vegetable case, consumers were willing to pay $0.79-
1.18, on average, to avoid the frozen option. We found that green bean respondents reported the
lowest aversion to frozen, which could be associated with the low percentage of respondents who
eat this vegetable raw (relative to carrots and broccoli). In other words, a green bean consumer
would most likely be cooking the vegetable in some manner, so perhaps they were less
concerned with whether the product is fresh or frozen. These results correspond with previous
studies which reported that consumers prefer to avoid processed foods (Sloan 2015; PBH 2014).
We found that brand name, an attribute less associated with vegetables (especially fresh
produce) and organic production, an attribute highly associated with vegetables, both had similar
impacts on choice. Participants would pay $0.61-0.71, on average, for a Green Giant product
rather than a private-label (generic) product. Similarly, respondents were willing to pay an
average of $0.68-0.73 for organic vegetables. These findings were not surprising given the lower
importance that respondents placed on both factors in their vegetable purchasing decisions.
Convenient (steamable) packaging was the most highly valued attribute across all
vegetable samples. This corroborates current retail trends and academic studies which have
found that consumers increasingly value convenience in their food choices (Grunert 2005;
Ragaert et al. 2004). Further, respondents indicated that steaming was the most preferred
preparation method overall, so a high valuation of this attribute makes sense. The broccoli
sample reported the highest willingness to pay for convenient packaging ($1.35), followed by

20
green beans ($1.26) and carrots ($0.97). Interestingly, this ordering mirrored the proportion of
respondents who steam each of these vegetables: 93.86%, 88.54% and 78.81% of participants
indicated that steaming was a preferred cooking method for broccoli, green beans and carrots,
respectively. The lower willingness to pay value for carrots was also likely related to the higher
percentage of participants who reported eating carrots raw.
Our secondary objective was to determine if information about the nutrition content of
fresh and frozen vegetables would influence purchase intentions, particularly toward frozen
vegetables. In each vegetable, participants who received this information were willing to pay
more for frozen vegetables. On average, respondents assigned to the information treatment
would pay $0.04, $0.17, and $0.20 more for frozen broccoli, carrots and green beans,
respectively, than respondents who did not receive information, indicating the information had a
mild impact on respondents’ aversion to frozen vegetables. That being said, none of these
interactions were significant; further, the net willingness to pay for each vegetable was still
strongly negative (e.g., willingness to pay for frozen carrots was -$0.88 with no information;
with information, willingness to pay for frozen carrots was -$0.88 + $0.17 = -$0.71). Thus,
participants had a clear preference for fresh vegetables, regardless of information treatment.
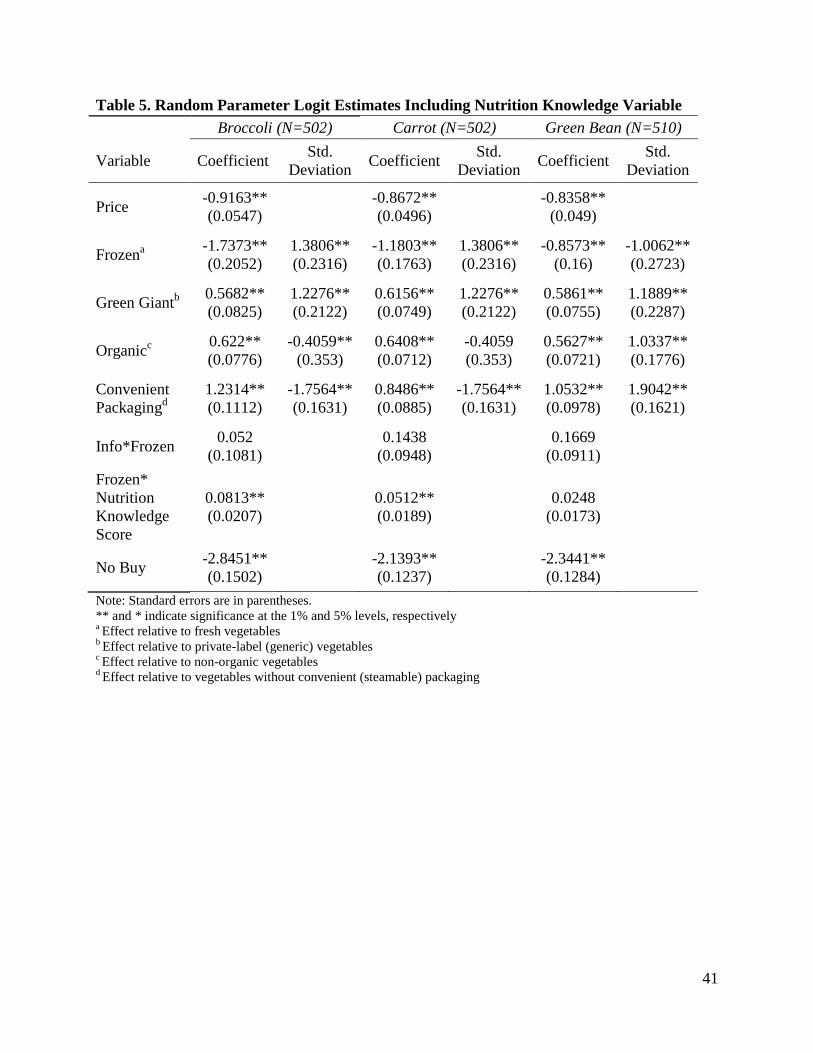
Lastly, we evaluated the role of nutrition knowledge on consumer preferences for fresh
and frozen vegetables. To do this, we included an interaction term between the frozen attribute
and the respondent knowledge score (ranging from 0 to 12) in the RPL model (see table 5). For
each vegetable, this coefficient was positive and highly significant, meaning that as knowledge
score increased, so did the utility received from the frozen vegetable option. Thus, a consumer
who has more knowledge about nutrition would be less averse to a frozen vegetable product than
someone with a lower level of nutrition knowledge. Figure 6 illustrates how the gap between

21
fresh and frozen narrowed as knowledge level increased; however, it should be noted that even at
the highest knowledge level, consumers still preferred fresh to frozen.
Since aversion to frozen vegetables declined as nutrition knowledge increased, we sought
to determine which groups of people exhibited high (low) levels of knowledge. Groups with low
knowledge levels may be good candidates for nutrition education about the benefits of all types
of vegetables. To investigate the determinants of higher levels of nutrition knowledge, we
estimated an Ordinary Least Squares (OLS) regression where knowledge score was the
dependent variable and gender, age, income, education, children in the home, and food security
status were the independent variables (see table 6). We found that women and older participants
(aged 36 years and older) exhibited higher knowledge scores than men and participants aged 18
to 35 years. Higher nutrition knowledge in older age groups could be the result of either more
experience and exposure to nutrition information or more concern over health (Grunert, Wills,
and Fernández-Celemín 2010; Glanz et al. 1998). We also found that respondents with a college
degree had higher knowledge scores than those without a degree, which is consistent with the
literature (see Parmenter, Waller, and Wardle (2000) for a review). Finally, we observed that
being food secure is associated with a higher level of nutrition knowledge; therefore, food
insecure respondents were less knowledgeable about nutrition. This determinant is concerning
because we found that having a lower knowledge score was associated with being more averse to
frozen vegetables. Frozen vegetables offer many accessibility and availability benefits that fresh
vegetables do not, namely lower prices and longer storage life. The ability to store food longer
and buy more nutritious foods with a constrained budget could be beneficial to food insecure
individuals.

22
4.4 Implications and Limitations
This study was designed to improve understanding about consumers’ preferences and
willingness to pay for fresh and frozen vegetables as well as other vegetable attributes.
Additionally, we sought to determine whether providing information about the similarities in
nutritional content between fresh and frozen vegetables would reduce consumers’ aversion to
frozen vegetables. Our results can be used by producers, manufacturers, and marketers in the
frozen vegetable industry in an effort to tailor strategies to improve attitudes toward and increase
consumption of frozen vegetables. Additionally, this research can provide important insights to
policymakers when making recommendations on nutrition education policies.
Ultimately, our study revealed that preferences for fresh vegetables were quite strong,
and information on the nutritional similarities between fresh and frozen vegetables did little to
change them. This could be attributed to other factors, like convenience, playing a larger role in
utility and purchase decisions. Another possible explanation is that participants may view all
forms of vegetables as healthy in general, so more detailed information about how the fresh and
frozen forms compare nutritionally may not have had a significant impact on consumers’ beliefs
and attitudes toward frozen vegetables. Finally, due to the online nature of the study, it is
possible that the information treatment may not have been fully read and/or understood by
participants. Other information interventions designed to increase vegetable intake have had
limited success (see Pomerleau et al. 2005 for a review), so our findings were consistent with
past research. However, we observed that consumers’ aversion to frozen vegetables lessens with
higher nutritional knowledge levels. Thus, interventions designed to improve overall nutritional
knowledge may prove valuable in promoting the consumption of all types of vegetables.

23
When looking at the types of consumers who are likely to have low knowledge levels, we
found that men, younger individuals, and individuals without a college degree had significantly
lower knowledge levels than their female, older, and college-educated counterparts, respectively.
Further, we found that food insecure consumers exhibited significantly lower levels of nutrition
knowledge than food secure individuals.
As discussed earlier, lower knowledge levels correspond with higher levels of aversion to
frozen vegetables. This is especially concerning in the case of food insecure individuals. Frozen
vegetables are a stable, nutritious, and many times cheaper form of vegetables than fresh. They
offer food insecure households a good source of nutrition, and the longer storage life enables
consumers to store nutritious vegetables options without worrying about spoilage. The results of
this study further support education initiatives aimed at teaching people, especially the food
insecure, about nutrition and more generally about healthy food choices. In past research
investigating the role of knowledge on food choice, Worsley (2002) reported that nutrition
knowledge plays a small but pivotal role in embracing new food behaviors and that personal
goals and motivations are highly related to learning about food and nutrition. This implies that
knowledge alone does not necessarily lead to increased vegetable intake and variety but
establishing nutritional frameworks through education can make an important and lasting
contribution to peoples’ overall food behaviors.
Beyond fresh vegetables, we found that consumers also placed a high value on vegetables
that were conveniently packaged (steamable packaging). Research has shown that the time
needed to prepare vegetables can be an important barrier to vegetable consumption (PBH 2012).
Further, for minimally processed vegetable products, convenience and speed have been found to
be the most important purchase motivations for consumers (Ragaert et al. 2004), so the value

24
consumers placed on convenience in this study was not surprising. Interestingly, the choice
experiment revealed a much greater emphasis on convenience than the stated importance ratings
would suggest. Perhaps when faced with more realistic purchase decision contexts, true
preferences are revealed. Based on our results, public health groups may want to highlight
convenience rather than focusing their strategy strictly on nutrition when promoting increased
vegetable intake. Additionally, companies may consider investing in innovative products that
make vegetables more convenient for consumers.
One limitation of this research is that it was conducted online, where there was no
guarantee that respondents read and/or understood all of the information presented. This could
potentially decrease the impact and significance of the information treatment. Additionally, in
the online format, respondents were not held accountable for their choices, so hypothetical bias
could be influencing our results. We provided participants with a cheap talk script to lessen the
likelihood of hypothetical bias, but it could still be present. Another concern is the high
proportion of individuals in our sample who were considered food insecure. While the panel was
representative of the U.S. population based on age and income, the proportion of food insecure
households was more than double the level reported by the Economic Research Service (ERS,
2015). This could be a function of the types of people who agree to serve as panelists for survey
research companies; however, we leave this issue to future research.
5. CONCLUSION
Americans are not meeting vegetable intake recommendations. While fresh vegetables
are often recommended, other forms of vegetables are equally useful in fulfilling daily
consumption levels. The present study examines the role of vegetable form (fresh vs. frozen),

25
price, brand, organic production, and convenience-oriented attributes on consumer choice and
preference for vegetable products. It further determines if providing consumers with information
about the nutrition of the fresh and frozen vegetable forms has a significant impact on consumer
choice. Additionally, we investigate how nutrition knowledge impacts evaluations of frozen
vegetables.
Results of our study confirm that there is a clear aversion toward frozen vegetables and
nutrition information about the similarities between fresh and frozen vegetables did not have a
significant effect on preferences. Since our information treatment only focused on nutritional
aspects of fresh and frozen vegetables, these results suggest there must be other factors at play
(such as taste, texture, quality perceptions) that drive consumers to prefer fresh to frozen. We
observed lower aversion to frozen vegetables by those consumers with higher nutritional
knowledge, though it should be noted that fresh was still dominantly preferred at the highest
knowledge level. Promoting general nutrition knowledge among men, younger individuals, and
food insecure households may help improve perceptions of frozen vegetables, which could
potentially result in increased vegetable intake.
Going forward, research should consider a wider variety of vegetables and examine
consumer choices in a more realistic setting (lab where monetary transactions can occur or in an
actual grocery store). Other interesting extensions of this research would be to include other
vegetable forms (like canned) and to test a different information intervention that focuses on
more than just nutritional qualities of fresh and frozen vegetables. Another useful extension of
this study would be to further investigate the role of nutrition knowledge in food choice and its
relationship with both food insecurity and the food choices made by food insecure individuals.

26
REFERENCES
Adamowicz, Wiktor, Jordan Louviere, and Joffre Swait. 1998. "Introduction to Attribute-Based
Stated Choice Methods." Final Report Submitted to National Oceanic Atmospheric
Administration (NOAA), U.S. Department of Commerce, Retrieved from
http://www.greateratlantic.fisheries.noaa.gov/hcd/statedchoicemethods.pdf.
Blaylock, James, David Smallwood, Kathleen Kassel, Jay Variyam, and Lorna Aldrich. 1999.
"Economics, Food Choices, and Nutrition." Food Policy, 24(2):269-286.
Blumberg, S. J., K. Bialostosky, W. L. Hamilton, and R. R. Briefel. 1999. "The Effectiveness of
a Short Form of the Household Food Security Scale." American Journal of Public Health,
89(8):1231-1234.
Brooks, Kathleen and Jayson L. Lusk. 2010. "Stated and Revealed Preferences for Organic and
Cloned Milk: Combining Choice Experiment and Scanner Data." American Journal of
Agricultural Economics, 92(4):1229-1241.
Brown, Milford S. 1967. "Texture of Frozen Vegetables: Effect of Freezing Rate on Green
Beans." Journal of the Science of Food and Agriculture, 18(2):77-81.
Carlsson, Fredrik and Peter Martinsson. 2001. "Do Hypothetical and Actual Marginal
Willingness to Pay Differ in Choice Experiments?: Application to the Valuation of the
Environment." Journal of Environmental Economics and Management, 41(2):179-192.
Centers for Disease Control and Prevention (CDC). 2013. State Indication Report on Fruits and
Vegetables, 2013. U.S. Department of Health and Human Services, Retrieved from
http://www.cdc.gov/nutrition/downloads/State-Indicator-Report-Fruits-Vegetables-
2013.pdf.
Centers for Disease Control and Prevention (CDC). 2009. State Indicator Report on Fruits and
Vegetables, 2009. U.S. Department of Health and Human Services, Retrieved from
http://www.cdc.gov/nutrition/downloads/StateIndicatorReport2009.pdf.
Champ, Patricia A., Kevin J. Boyle, and Thomas C. Brown. 2003. A Primer on Nonmarket
Valuation, Springer Science & Business Media: New York.
Economic Research Service (ERS). 2012. U.S. Household Food Security Survey Module: Six-
Item Short Form. United States Department of Agriculture, Retrieved from
http://www.ers.usda.gov/datafiles/Food_Security_in_the_United_States/Food_Security_Sur
vey_Modules/short2012.pdf.
Favell, DJ. 1998. "A Comparison of the Vitamin C Content of Fresh and Frozen Vegetables."
Food Chemistry, 62(1):59-64.

27
Fleming, Christopher M. and Mark Bowden. 2009. "Web-Based Surveys as an Alternative to
Traditional Mail Methods." Journal of Environmental Management, 90(1):284-292.
Gao, Zhifeng and Ted C. Schroeder. 2009. "Effects of Label Information on Consumer
Willingness-to-Pay for Food Attributes." American Journal of Agricultural Economics,
91(3):795-809.
Geaney, F., S. Fitzgerald, J. M. Harrington, C. Kelly, B. A. Greiner, and I. J. Perry. 2015.
"Nutrition Knowledge, Diet Quality and Hypertension in a Working Population." Preventive
Medicine Reports, 2:105-113.
Giannakourou, MC and PS Taoukis. 2003. "Kinetic Modelling of Vitamin C Loss in Frozen
Green Vegetables Under Variable Storage Conditions." Food Chemistry, 83(1):33-41.
Gibson, EL, Jane Wardle, and CJ Watts. 1998. "Fruit and Vegetable Consumption, Nutritional
Knowledge and Beliefs in Mothers and Children." Appetite, 31(2):205-228.
Glanz, Karen, Michael Basil, Edward Maibach, Jeanne Goldberg, and DAN Snyder. 1998. "Why
Americans Eat what they do: Taste, Nutrition, Cost, Convenience, and Weight Control
Concerns as Influences on Food Consumption." Journal of the American Dietetic
Association, 98(10):1118-1126.
Grunert, Klaus G. 2002. "Current Issues in the Understanding of Consumer Food Choice."
Trends in Food Science & Technology, 13(8):275-285.
Grunert, Klaus G. 2005. "Food Quality and Safety: Consumer Perception and Demand."
European Review of Agricultural Economics, 32(3):369-391.
Grunert, Klaus G., Josephine M. Wills, and Laura Fernández-Celemín. 2010. "Nutrition
Knowledge, and use and Understanding of Nutrition Information on Food Labels among
Consumers in the UK." Appetite, 55(2):177-189.
Gunden, Cihat and Terrence Thomas. 2012. "Assessing Consumer Attitudes Towards Fresh Fruit
and Vegetable Attributes." Journal of Food, Agriculture & Environment, 10(2):85-88.
Guthrie, Joanne F., Biing-Hwan Lin, Jane Reed, and Hayden Stewart. 2005. "Understanding
Economic and Behavioral Influences on Fruit and Vegetable Choices." Amber Waves,
3(2):36-41.
Hanley, Nick, Robert E. Wright, and Vic Adamowicz. 1998. "Using Choice Experiments to
Value the Environment." Environmental and Resource Economics, 11(3-4):413-428.
Harker, F. Roger, F. Anne Gunson, and Sara R. Jaeger. 2003. "The Case for Fruit Quality: An
Interpretive Review of Consumer Attitudes, and Preferences for Apples." Postharvest
Biology and Technology, 28(3):333-347.

28
Howard, LA, AD Wong, AK Perry, and BP Klein. 1999. "β‐Carotene and Ascorbic Acid
Retention in Fresh and Processed Vegetables." Journal of Food Science, 64(5):929-936.
Hunter, Karl J. and John M. Fletcher. 2002. "The Antioxidant Activity and Composition of
Fresh, Frozen, Jarred and Canned Vegetables." Innovative Food Science & Emerging
Technologies, 3(4):399-406.
Lancaster, Kelvin J. 1966. "A New Approach to Consumer Theory." The Journal of Political
Economy, 74(2):132-157.
Lee, Seung K. and Adel A. Kader. 2000. "Preharvest and Postharvest Factors Influencing
Vitamin C Content of Horticultural Crops." Postharvest Biology and Technology,
20(3):207-220.
Loureiro, Maria L. and Wendy J. Umberger. 2007. "A Choice Experiment Model for Beef: What
US Consumer Responses Tell Us about Relative Preferences for Food Safety, Country-of-
Origin Labeling and Traceability." Food Policy, 32(4):496-514.
Louviere, Jordan J., David A. Hensher, and Joffre D. Swait. 2000. Stated Choice Methods:
Analysis and Applications, Cambridge University Press.
Lusk, Jayson L. and Kathleen Brooks. 2011. "Who Participates in Household Scanning Panels?"
American Journal of Agricultural Economics, 93(1):226-240.
Lusk, Jayson L. and Ted C. Schroeder. 2004. "Are Choice Experiments Incentive Compatible? A
Test with Quality Differentiated Beef Steaks." American Journal of Agricultural Economics,
86(2):467-482.
Mintel. 2014. Fruits and Vegetables-U.S. Mintel.
Moser, Riccarda, Roberta Raffaelli, and Dawn Thilmany-McFadden. 2011. "Consumer
Preferences for Fruit and Vegetables with Credence-Based Attributes: A Review."
International Food and Agribusiness Management Review, 14(2):121-142.
Murcia, Ma Antonia, Antonia Ma Jiménez, and Magdalena Martínez-Tomé. 2009. "Vegetables
Antioxidant Losses during Industrial Processing and Refrigerated Storage." Food Research
International, 42(8):1046-1052.
National Center for Home Food Preservation (NCHFP). "Freezing.", Retrieved from
http://nchfp.uga.edu/how/freeze/blanching.html.
Ogden, Cynthia L., Margaret D. Carroll, Brian K. Kit, and Katherine M. Flegal. 2014.
"Prevalence of Childhood and Adult Obesity in the United States, 2011-2012." Journal of
the American Medical Association, 311(8):806-814.

29
Olynk, Nicole J., Christopher A. Wolf, and Glynn T. Tonsor. 2012. "Production Technology
Option Value: The Case of rbST in Michigan." Agricultural Economics, 43(s1):1-9.
Parmenter, K., J. Waller, and J. Wardle. 2000. "Demographic Variation in Nutrition Knowledge
in England." Health Education Research, 15(2):163-174.
Parmenter, K. and J. Wardle. 1999. "Development of a General Nutrition Knowledge
Questionnaire for Adults." European Journal of Clinical Nutrition, 53(4):298-308.
Pollard, J., SF Kirk, and JE Cade. 2002. "Factors Affecting Food Choice in Relation to Fruit and
Vegetable Intake: A Review." Nutrition Research Reviews, 15(2):373-387.
Pomerleau, Joceline, Karen Lock, Cécile Knai, and Martin McKee. 2005. "Interventions
Designed to Increase Adult Fruit and Vegetable Intake can be Effective: A Systematic
Review of the Literature." The Journal of Nutrition, 135(10):2486-2495.
Produce for Better Health Foundation (PBH). 2014. Moms’ Attitudes and Beliefs Related to
Fruit & Vegetable Consumption 2007-2014, Retrieved from
http://pbhfoundation.org/pdfs/about/res/pbh_res/MomReport2014_WEB.pdf.
Produce for Better Health Foundation (PBH). 2012. Know the Facts: Why all Forms Matter,
Retrieved from
http://pbhfoundation.org/pdfs/pri_sec/retail/mar_tools/all_forms_health_influence/All_Form
s_Health_Influencer_Brochure.pdf.
Ragaert, Peter, Wim Verbeke, Frank Devlieghere, and Johan Debevere. 2004. "Consumer
Perception and Choice of Minimally Processed Vegetables and Packaged Fruits." Food
Quality and Preference, 15(3):259-270.
Rickman, Joy C., Diane M. Barrett, and Christine M. Bruhn. 2007. "Nutritional Comparison of
Fresh, Frozen and Canned Fruits and Vegetables. Part 1. Vitamins C and B and Phenolic
Compounds." Journal of the Science of Food and Agriculture, 87(6):930-944.
Schutz, HG, B. Wilsher, M. Martens, and M. Rødbotten. 1984. "Consumer Perception of
Vegetable Quality." Acta Horticulturae, 163:31-38.
Sloan, A. Elizabeth. 2011. "Top Ten Food Trends." Food Technology, 65(4).
Steinbuch, E. 1976. "Technical Note: Improvement of Texture of Frozen Vegetables by Stepwise
Blanching Treatments." International Journal of Food Science & Technology, 11(3):313-
316.
Tonsor, Glynn T. and Robert S. Shupp. 2011. "Cheap Talk Scripts and Online Choice
Experiments: “Looking Beyond the Mean”." American Journal of Agricultural Economics,
93(4):1015-1031.

30
United States Department of Agriculture (USDA). 2016. "All About the Vegetable Group.",
Retrieved from http://www.choosemyplate.gov/food-groups/vegetables.html.
United States Departments of Agriculture and Health and Human Services (USDA-HHS). 2015.
Scientific Report of the 2015 Dietary Guidelines Advisory Committee. Retrieved from
http://health.gov/dietaryguidelines/2015-scientific-report/.
van der Pol, Marjon and Mandy Ryan. 1996. "Using Conjoint Analysis to Establish Consumer
Preferences for Fruit and Vegetables." British Food Journal, 98(8) 5-12.
Vanhonacker, Filiep, Zuzanna Pieniak, and Wim Verbeke. 2013. "European Consumer
Perceptions and Barriers for Fresh, Frozen, Preserved and Ready-Meal Fish Products."
British Food Journal, 115(4):508-525.
Venkatachalam, L. 2004. "The Contingent Valuation Method: A Review." Environmental Impact
Assessment Review, 24(1):89-124.
Vernarelli, J. A., D. C. Mitchell, T. J. Hartman, and B. J. Rolls. 2011. "Dietary Energy Density is
Associated with Body Weight Status and Vegetable Intake in U.S. Children." The Journal of
Nutrition, 141(12):2204-2210.
Viaene, Jacques, Wim Verbeke, and Xavier Gellynck. 1998. "Quality Perception of Vegetables
by Belgian Consumers."Acta Horticulturae, 524:89-96.
Wilcock, Anne, Maria Pun, Joseph Khanona, and May Aung. 2004. "Consumer Attitudes,
Knowledge and Behaviour: A Review of Food Safety Issues." Trends in Food Science &
Technology, 15(2):56-66.
Winer, Russell S. 1986. "A Reference Price Model of Brand Choice for Frequently Purchased
Products." Journal of Consumer Research, 13(2):250-256.
Wolf, Christopher A., Glynn T. Tonsor, and Nicole J. Olynk. 2011. "Understanding US
Consumer Demand for Milk Production Attributes." Journal of Agricultural and Resource
Economics, 36(2):326-342.
World Health Organization (WHO). 2015. "Increasing Fruit and Vegetable Consumption to
Reduce the Risk of Noncommunicable Diseases", Retrieved from
http://www.who.int/elena/titles/fruit_vegetables_ncds/en/.
Worsley, Anthony. 2002. "Nutrition Knowledge and Food Consumption: Can Nutrition
Knowledge Change Food Behaviour?" Asia Pacific Journal of Clinical Nutrition, 11:S579-
S585.
Yue, Chengyan and Cindy Tong. 2009. "Organic Or Local? Investigating Consumer Preference
for Fresh Produce using a Choice Experiment with Real Economic Incentives."
HortScience, 44(2):366-371.

31
Figure 1. Example choice set

32
Figure 2. Cheap talk script
Please consider the following:
The experience from previous similar surveys is that people often state a higher willingness
to pay than what one is actually willing to pay for a product. For instance, a recent study
asked people whether they would purchase a food product similar to the one you are about to
be asked about. This purchase was hypothetical (as it will be for you) in that no one actually
had to pay money when they indicated a willingness to purchase.
In the study, 80% of people said they would buy the new product, but when a grocery store
actually stocked the product, only 43% of people actually bought the product when they had
to pay for it. This difference (43% vs. 80%) is what we refer to as hypothetical bias.
Accordingly, it is important that you make each of your upcoming selections like you would
if you were actually facing these exact choices in a store. In other words, note that buying a
product means that you would have less money available for other purchases.
If you would not buy either product, select the "I would not buy either of these products"
option.

33
Figure 3. Information treatment slide
Please read the following information regarding fresh and frozen vegetables:
1) The USDA recommends that most people should eat 2-3 cups of vegetables daily as part
of their 5-a-day fruit and vegetable consumption.
2) Health professionals agree that frozen, fresh, and canned vegetables are equally good for
your health.
3) Fresh and frozen vegetables typically have similar levels of nutrients. Frozen vegetables
sometimes have more nutrients than fresh vegetables because fresh vegetables sold in stores
are usually picked before they are ripe. These vegetables may lose nutrients and flavor as
they are stored in stores and in homes.
4) Frozen vegetables are usually flash frozen. This process quickly freezes ripe vegetables
which naturally preserves almost all of the nutrients in the vegetable for up to a year. Flash
freezing preserves the vegetable without using preservatives, sodium, or other ingredients. *
5) The method used to cook vegetables (steaming, microwaving, etc.) does not have a
different effect on nutrient levels for either fresh or frozen vegetables. Nutrient levels in both
fresh and frozen vegetables are affected equally.
*Many frozen vegetable varieties exist that include extra ingredients like butter or sauces. In
stores, make sure to check that the vegetable is the only ingredient listed.
Sources: USDA, FDA, Produce for Better Health Foundation

34
Figure 4. Preferred Preparation Methods by Vegetable Type ** Indicates significant differences between the vegetable samples according to chi-squared tests (P<0.01).
0% 20% 40% 60% 80% 100%
Broccoli
Carrot
Green bean
Roast**
Yes No
0% 20% 40% 60% 80% 100%
Broccoli
Carrot
Green bean
Bake
Yes No
0% 20% 40% 60% 80% 100%
Broccoli
Carrot
Green bean
Grill
Yes No
0% 20% 40% 60% 80% 100%
Broccoli
Carrot
Green bean
Raw**
Yes No
0% 20% 40% 60% 80% 100%
Broccoli
Carrot
Green bean
Sauté**
Yes No
0% 20% 40% 60% 80% 100%
Broccoli
Carrot
Green bean
Steam**
Yes No

35
Figure 5. Importance of Factors in Vegetable Purchase Decision
0% 10% 20% 30% 40% 50% 60% 70% 80% 90% 100%
Brand
Organic
Seasonal
Familiarity
Convenience
Level of Processing
Shelf life
Preservative-free
Texture
Visual Appeal
Price
Nutritional value
Flavor
Freshness
Very Important Somewhat Important Not Important

36
Figure 6. WTP Premium for Fresh over Frozen by Nutrition Knowledge Score and
Vegetable Type*
*all else held constant
$0.00
$0.20
$0.40
$0.60
$0.80
$1.00
$1.20
$1.40
$1.60
$1.80
$2.00
0 1 2 3 4 5 6 7 8 9 10 11 12
WT
P P
rem
ium
fo
r F
resh
over
Fro
zen (
do
llar
s)
Correct Nutrition Knowledge Responses
Broccoli Carrots Green Beans

37
Table 1. Choice Experiment Attributes and Levels
Product Attribute Attribute Levels
Product State Fresh/Frozen
Brand Green Giant/Private Label (Generic)
Convenience Packaging Steamable bag or not
Production Methods Conventional/Organic
Price
$0.99/12 oz.
$1.49/12 oz.
$2.99/12 oz.
$5.49/12 oz.

38
Table 2. Characteristics of survey respondents Percentage of Respondents
Variable Definition Broccoli
(N=502)
Carrot
(N=502)
Green
Bean
(N=510)
Pooled
(N=1514)
Female 1 if female; 0 if male 69.72% 69.72% 69.22% 69.55%
Age 1 1 if age is 18 to 34.99 years; 0 otherwise 29.48% 29.08% 29.02% 29.19%
Age 2 1 if age is 35 to 54.99 years; 0 otherwise 36.25% 36.25% 35.49% 36.00%
Age 3 1 if age is 55 years and older; 0 otherwise 34.26% 34.66% 35.49% 34.81%
Income 1 1 if annual household income is less than
$50,000; 0 otherwise 48.01% 48.80% 49.22% 48.68%
Income 2 1 if annual household income is $50,000 -
$99,999; 0 otherwise 29.68% 29.88% 30.00% 29.85%
Income 3 1 if annual household income is $100,000 or
greater; 0 otherwise 22.31% 20.52% 20.78% 21.20%
College 1 if obtained bachelor's degree; 0 otherwise 33.47% 36.45% 34.51% 34.81%
Midwest 1 if from the Midwest; 0 otherwise 22.51% 20.12% 19.02% 20.54%
Northeast 1 if from the Northeast; 0 otherwise 21.71% 22.11% 20.98% 21.60%
South* 1 if from the South; 0 otherwise 33.86% 39.84% 41.37% 38.38%
West 1 if from the West; 0 otherwise 21.91% 17.73% 18.43% 19.35%
Primary
Shopper 1 if household primary shopper; 0 otherwise 97.41% 98.61% 98.24% 98.08%
Child 1 if has one or more children in household; 0
otherwise 39.84% 39.84% 38.63% 39.43%
SNAP 1 if has received SNAP or WIC in past 12
months; 0 otherwise 22.51% 21.71% 21.96% 22.06%
Food
Insecure
1 if food insecure in past 12 months; 0
otherwise 41.24% 38.05% 42.16% 40.49%
High
Knowledge+
1 if responded correctly to 10 or more
nutrition questions; 0 otherwise 31.87% 31.87% 30.98% 31.57%
Eat Fresh
Daily*
1 if eats fresh vegetables at least once/day; 0
otherwise 40.64% 47.01% 33.53% 40.36%
Eat Frozen
Daily
1 if eats frozen vegetables at least once/day; 0
otherwise 13.15% 14.54% 13.53% 13.74%
Eat Fresh
Weekly
1 if eats fresh vegetables at least once/week; 0
otherwise 89.64% 91.83% 87.25% 89.56%
Eat Frozen
Weekly
1 if eats frozen vegetables at least once/week;
0 otherwise 66.93% 69.12% 69.61% 68.56%
Same
Nutrients
1 if agrees that nutrient levels in fresh and
frozen vegetables are the same; 0 otherwise 43.82% 43.23% 43.92% 43.66%
* Indicates significant differences between the vegetable samples according to chi-squared tests (P<0.05). + This measure was created to assess respondent practical knowledge of nutrition, including portion sizes and food
category recommendations. A score of 10 or more out of 12 was used to determine this high knowledge group.

39
Table 3. Random Parameters Logit Estimates
Broccoli (N=502) Carrot (N=502) Green Bean (N=510)
Variable Coefficient Std.
Deviation Coefficient
Std.
Deviation Coefficient
Std.
Deviation
Price -0.9345**
(0.0564)
-0.87**
(0.05)
-0.8375**
(0.0492)
Frozena -1.1024**
(0.1189)
1.6548**
(0.2446)
-0.7647**
(0.0865)
1.3646**
(0.235)
-0.6578**
(0.0855)
-1.0129**
(0.2719)
Green Giantb 0.5877**
(0.0848)
-1.2368**
(0.2297)
0.6095**
(0.0748)
1.1879**
(0.2183)
0.591**
(0.0758)
1.2028**
(0.2287)
Organicc 0.6392**
(0.0795)
1.2029**
(0.1913)
0.6339**
(0.0719)
-0.5902**
(0.262)
0.5659**
(0.0723)
1.0164**
(0.1799)
Convenient
Packagingd
1.2652**
(0.1148)
-1.9721**
(0.1758)
0.8476**
(0.089)
-1.7605**
(0.1635)
1.0576**
(0.0983)
1.9217**
(0.1625)
Info*frozen 0.0371
(0.1104)
0.1465
(0.0947)
0.1677
(0.0913)
No Buy -2.8863**
(0.1538)
-2.1526**
(0.1247)
-2.3457**
(0.1289
Note: Standard errors are in parentheses.
** and * indicate significance at the 1% and 5% levels, respectively a Effect relative to fresh vegetables
b Effect relative to private-label (generic) vegetables
c Effect relative to non-organic vegetables
d Effect relative to vegetables without convenient (steamable) packaging

40
Table 4. Mean Willingness-to-Pay (WTP) for Vegetable Attributes
Attribute Broccoli Carrot Green Bean
Frozen -$1.18 -$0.88 -$0.79
Green Giant $0.63 $0.70 $0.71
Organic $0.68 $0.73 $0.68
Convenient Packaging $1.35 $0.97 $1.26
Info*frozen $0.04 $0.17 $0.20
No Buy -$3.09 -$2.47 -$2.80
41
Table 5. Random Parameter Logit Estimates Including Nutrition Knowledge Variable
Broccoli (N=502) Carrot (N=502) Green Bean (N=510)
Variable Coefficient Std.
Deviation Coefficient
Std.
Deviation Coefficient
Std.
Deviation
Price -0.9163**
(0.0547)
-0.8672**
(0.0496)
-0.8358**
(0.049)
Frozena -1.7373**
(0.2052)
1.3806**
(0.2316)
-1.1803**
(0.1763)
1.3806**
(0.2316)
-0.8573**
(0.16)
-1.0062**
(0.2723)
Green Giantb 0.5682**
(0.0825)
1.2276**
(0.2122)
0.6156**
(0.0749)
1.2276**
(0.2122)
0.5861**
(0.0755)
1.1889**
(0.2287)
Organicc 0.622**
(0.0776)
-0.4059**
(0.353)
0.6408**
(0.0712)
-0.4059
(0.353)
0.5627**
(0.0721)
1.0337**
(0.1776)
Convenient
Packagingd
1.2314**
(0.1112)
-1.7564**
(0.1631)
0.8486**
(0.0885)
-1.7564**
(0.1631)
1.0532**
(0.0978)
1.9042**
(0.1621)
Info*Frozen 0.052
(0.1081)
0.1438
(0.0948)
0.1669
(0.0911)
Frozen*
Nutrition
Knowledge
Score
0.0813**
(0.0207)
0.0512**
(0.0189)
0.0248
(0.0173)
No Buy -2.8451**
(0.1502)
-2.1393**
(0.1237)
-2.3441**
(0.1284)
Note: Standard errors are in parentheses.
** and * indicate significance at the 1% and 5% levels, respectively a Effect relative to fresh vegetables
b Effect relative to private-label (generic) vegetables
c Effect relative to non-organic vegetables
d Effect relative to vegetables without convenient (steamable) packaging

42
Table 6. OLS Regression Results: Predictors of Nutrition Knowledge Score (N=1514)
Variable Coefficient Standard Error
Intercept 6.3889** 0.1796
Femalea
0.9160** 0.1310
Collegeb
0.2641* 0.1330
Inc2c
-0.0772 0.1428
Inc3c
0.1104 0.1684
Age2d
0.6135** 0.1491
Age3d
1.3864** 0.1637
Childe
-0.1403 0.1370
Food Securef
0.6312** 0.1295
Note: R-squared = 0.1139.
** and * indicate significance at the 1% and 5% levels, respectively a Effect relative to male participants
b Effect relative to individuals without a college degree
c Effect relative to individuals with annual household income less than $50,000
d Effect relative to individuals 18-34 years of age
e Effect relative to individuals without children living in the home
f Effect relative to individuals who are considered food insecure