HOUSEHOLDS WILLINGNESS TO PAY FOR IMPROVED ...
17
45 HOUSEHOLDS WILLINGNESS TO PAY FOR IMPROVED WATER QUALITY AND RELIABILITY OF SUPPLY IN CHOBE WARD, MAUN Moffat. B., Motlaleng. G.R. and Thukuza. A 4 Abstract: This survey investigated the willingness to pay for an improved water quality and reliability in Chobe ward in Maun. On average, 54% of the households are willing to pay for improved water quality. It is therefore apparent that Chobe Ward, Maun residents in general regard water as an economic good as they are willing to pay for its provision. Those with a higher income were willing to pay for an improved water quality and reliability of supply. This finding corroborates the environmental economic theory which assumes that the demand for an improved environmental quality increases with income. The older the person the more they are willing to pay for improved water quality and reliability. Larger families are not willing to pay for an improved provision of water services. Also, educated people are lesser willing to pay for improved water quality and reliability. Keywords: Willingness to Pay, Environmental good, Contingent Valuation Method 1 Introduction The purpose of this paper is to determine whether people in Chobe Ward, Maun are willing to pay for improved water quality and reliability of supply. The survey is in the quest of finding out the monetary value that households are able and willing to attach for an improved water service. The study determines the coping mechanisms adopted by households in Maun to mitigate the impacts of unreliable water supply and poor or unsafe water, and the related costs incurred. Good quality water is vital for health and improvement of the well being of human beings. If the piped water distribution does not provide good quality water continuously, concerned and private agents might intervene. Therefore, this paper brings in the required information on the willingness of people of Chobe Ward, Maun, not only for paying water bills, but also for an improved and sustained service provision. Maun, as a tourist centre and the North-West District headquarters is the centre of many social and economic activities. This has led to the rapid population increase (see, Table 1 below), increased consumption of water and the cost of getting water to the consumers. Therefore, there is need to investigate factors influencing the households‟ water consumption patterns and their wi llingness to pay (WTP) for improved water services, such as quality and reliability. 4 The Authors are, respectively, Lecturer, Senior Lecturer in the Department of Economics, University of Botswana and a former student in the Department of Economics.
-
Upload
khangminh22 -
Category
Documents
-
view
5 -
download
0
Transcript of HOUSEHOLDS WILLINGNESS TO PAY FOR IMPROVED ...

45
HOUSEHOLDS WILLINGNESS TO PAY FOR IMPROVED WATER QUALITY
AND RELIABILITY OF SUPPLY IN CHOBE WARD, MAUN
Moffat. B., Motlaleng. G.R. and Thukuza. A4
Abstract: This survey investigated the willingness to pay for an improved water quality and
reliability in Chobe ward in Maun. On average, 54% of the households are willing to pay for
improved water quality. It is therefore apparent that Chobe Ward, Maun residents in general
regard water as an economic good as they are willing to pay for its provision. Those with a higher
income were willing to pay for an improved water quality and reliability of supply. This finding
corroborates the environmental economic theory which assumes that the demand for an improved
environmental quality increases with income. The older the person the more they are willing to pay
for improved water quality and reliability. Larger families are not willing to pay for an improved
provision of water services. Also, educated people are lesser willing to pay for improved water
quality and reliability.
Keywords: Willingness to Pay, Environmental good, Contingent Valuation Method
1 Introduction
The purpose of this paper is to determine whether people in Chobe Ward, Maun are willing to pay
for improved water quality and reliability of supply. The survey is in the quest of finding out the
monetary value that households are able and willing to attach for an improved water service. The
study determines the coping mechanisms adopted by households in Maun to mitigate the impacts of
unreliable water supply and poor or unsafe water, and the related costs incurred.
Good quality water is vital for health and improvement of the well being of human beings. If the
piped water distribution does not provide good quality water continuously, concerned and private
agents might intervene. Therefore, this paper brings in the required information on the willingness
of people of Chobe Ward, Maun, not only for paying water bills, but also for an improved and
sustained service provision.
Maun, as a tourist centre and the North-West District headquarters is the centre of many social and
economic activities. This has led to the rapid population increase (see, Table 1 below), increased
consumption of water and the cost of getting water to the consumers. Therefore, there is need to
investigate factors influencing the households‟ water consumption patterns and their willingness to
pay (WTP) for improved water services, such as quality and reliability.
4 The Authors are, respectively, Lecturer, Senior Lecturer in the Department of Economics, University of Botswana and
a former student in the Department of Economics.

46
Table 1: Population Growth in Maun between 1964 and 2001
1964 1971 1981 1991 2001
Population Population Annual
growth
rate
Population Annual
growth
rate
Population Annual
growth
rate
Population Annual
growth
rate
4 549 9 614 11.3 % 14 925 4.5 % 26 768 6.0 % 43 776 5.0 %
Source: Republic of Botswana, 2001
There is a concern that water in Maun is of poor quality and its supply is unreliable. Preliminary
investigations have revealed that the water has some of the following characteristics: 1) it is saline,
2) it has bad taste, 3) it has residual sediments and 4) it also stains the surfaces of bathtubs. The
threats for water pollution are due to the fact that the Gomoto and Upper Boro areas have a number
of lodges, whose sewage disposal could be detrimental of the water quality in the neighbouring
rivers in Maun.
Recent investigations have shown that there is evidence to suggest that the capacity of the current
water sources in Maun as a whole is overstretched. For instance, water availability in Maun is
erratic. Furthermore, as a result of poor water quality and unreliability of its supply, residents in
other parts of Maun embark in what Gnedenko, et al (2000), refers to as “avoidance expenditure”.
This is the household‟s expenditure related to reducing health risks from environmental pollution
such as buying and boiling the water and filtration of tap water. This implies that the residents incur
the costs of water bills and personal water treatment costs. This necessitates the improvement of
both water quality and quantity. The foregoing raises the following question to be answered by this
investigation. Are Maun residents Chobe Ward in particular, willing to pay in order to increase
water quality, reliability and improved supply?
The paper is organised as follows. Section 2 summaries water supply and quality in Maun. Section
3, highlights economic valuation of an environmental good. Section 4 provides an overview of
previous studies. Methodological procedures are discussed in Section 5. Empirical findings are
presented in Section 6, while concluding remarks are given in the last section.
2 Water Supply and Water Quality in Maun
Maun is provided with a water reticulation system under the programme of major villages` water
supply. It is planned, constructed, operated and maintained by the department of Water Affairs. All
fresh water in Maun is obtained from boreholes along the northern side of the Thamalakane River
near the central parts of the village. Surprisingly, in Maun water shortage is not a pressing issue
considering the fact that the seasonal floods from the Okavango Delta feeds the Boro River. The

47
problems are, first, the reticulation system and the distribution of water which is an on and off thing.
This therefore constitutes unreliability of water supply. Second, for chemical parameters, the water
quality does not meet the Drinking Water Quality Guidelines set by the World Health Organisation
(WHO) of 1984 and also for Botswana. Third, the Faecal coliforms are generally low implying that
the water is safe for human consumption. For instance, in Botshabelo and Chobe the water does not
pose any threat for bacteria since very low values (0 or 1 faecal coliforms per 100ml of water) were
recorded. Fourth, village pit latrines and industrial sites to an extent have affected some of the
boreholes, hence polluting ground water near rivers. To avoid future pollution problems, Water
Affairs has recommended a protection zone to be reserved free from any land use that could affect
the ground water in this area.
Table 2: Drinking Water Quality Guidelines
Substance Units WHO Botswana
Desired
Botswana
Permissible
Botswana Max
Permissible
PH
Total Dissolved Solids
Sulphate
Chloride
Nitrate
Fluoride
Iron
Manganese
Sodium
Turbidity
Zinc
Copper
Taste and Odour
Dissolved Oxygen
Hydrogen Sulphide
MICROBIOLOGICAL
VARIABLES
Total coliform
Mg/l
Mg/l
Mg/l
Mg/l
Mg/l
Mg/l
Mg/l
Mg/l
NTU
Mg/l
Mg/l
-
Per 100
ml
6.8-
8.5
1000
400
250
45
1.5
0.3
0.1
200
5
5.0
1.0
10
6.5-8.5
1000
400
200
45
1.5
0.3
0.1
200
5
5.0
1.0
Inoffensive to
most consumers
No value set
Not detectable
by consumer
100
6.5-9.2
1500
-
600
100
3.0
1.0
0.5
-
25
15
1.5
6.5-9.2
2000
600
800
100
3.0
3.0
0.5
-
-
15
-
Source: Department of Water Affairs
Total hardness classification 0-50 mg/l soft water; 100-150 mg/l slightly hard water; 150-200 mg/l moderately hard water; Over 200 mg/l hard water;
Over 300 mg/l very hard water; Over 500 mg/l extremely hard water
3 Economic Valuations of Environmental Goods
Economic Valuation is about “measuring the preferences” of people for an environmental good or
against an environmental bad. The economic value of something is measured by a summation of
many individuals` willingness to pay (WTP) for it. The WTP reflects individuals` preferences for

48
the good in question. Valuation is in money terms because of the way in which preference
revelation is sought. i.e., by asking people how much they are willing to pay.
Many of environmental goods and services are provided freely. Therefore, they have zero prices
because no market place exists in which their true values can be revealed through acts of buying
and selling. Water is generally under-priced. Therefore, valuation is important for proper pricing.
Projects and programmes appraisal cannot be ample or adequate without valuation. National
priorities for environmental policies are better informed if economic values are known with a
degree of certainty (Pearce, 1993). Economic valuation of environmental goods has found vast
application in (1) option appraisal, (2) in the design of economic instruments and (3) in determining
compensatory payments for environmental damage (Willis and Corkindale, 1995). Valuation
techniques are also applied to the more immediate human environment, such as water supply and
sanitation.
This paper employs the Contingent Valuation Method (CVM) to determine the willingness to pay
for improved water quality and reliability of supply in Maun. The CVM is a survey-based technique
of monetary valuation used to elicit people‟s preferences expressed in terms of WTP. The CVM
utilises an appropriately designed questionnaire (or experiment) to elicit the valuations or bids of
households about a decrease or increase in the amount of an environmental good, and how much
they are willing to pay or to accept compensation in order to avoid an environmental damage. The
assumption is that a market for environmental goods and services exist (Pearce and Turner, 1990).
It makes use of bidding games for approximating the willingness of households to pay for an
environmental good.
The CVM can be carried out by several ways such as the use of (1) direct questionnaires, (2) face-
to-face interviews, (3) mail surveys, and (4) telephone. Single bid games, also known as the single
open-ended, is used in this study. This is where the respondent is asked to mention the amount he or
she is willing to pay for a good/service described by the interviewee.
A CV study needs three basic things. First, the respondent should be given detailed information
about the commodity to be valued and the hypothetical scenario under which it is made available.
For example, the structure under which the commodity is provided, the range of available
substitutes and the method of payment. Second, a method which elicits respondent‟s willingness to
pay (WTP) is required. The respondents are asked for their maximum WTP (e.g., per month or per
year). Third, demographic information (such as age, gender, income) is needed to estimate the
valuation function for the environmental commodity. The data obtained here are used in regression
analysis to estimate how the values are related to the respective demographic variables based on
theory.
49
A CVM exercise basically involves informing the respondent about the prevailing situation (prices,
environmental conditions, etc), and then informs him/her about a change. The individual is asked to
value an „event‟, or a particular change in environmental conditions in a future hypothetical
scenario. Contingent Valuation evolved as a method to quantify the benefits of non-market
environmental goods and attributes in order to enable them to be entered directly into cost-benefit
calculations. CVM have the following advantages over the other methods of environmental
valuation such as the travel-cost and hedonic pricing techniques. First, it is applicable to all
situations. Second, the method is able to quantify some types of benefits, such as non-use or passive
use benefits, which lie outside the scope of travel-cost and hedonic pricing studies. Third, CVM was
given official recognition by the US Water Resources Council as a recommended valuation
technique. Fourth, CVM is able to measure passive use values and this has led to many applied
environmental economists choosing it (Hanemann, 1991).
However, critics of CVM are critical of the reliability and validity of answers to hypothetical WTP
questions. They argue that the method is prone to a number of difficulties (or biases). First, there is
always the possibility of strategic behaviour. Respondents may understate their willingness to pay if
they feel that they can free-ride or they may overstate their willingness to pay. This can arise if they
feel that the provision of the improved situation is not conditional on their actual payments.
Therefore, a careful design of the questionnaire and description of the good is needed to minimize
this kind of bias.
Second, respondents may become „yea-sayers‟. i.e., the respondents may answer only to please the
interviewer. This behaviour of supporting environmental „good causes‟ without attaching the cost
the individual will incur seems to be quite pervasive in literature. Third, there exist the hypothetical
nature of the process calling for careful structuring of questions to inform respondents about the
salient points, and not overloading them with unnecessary description. It is therefore argued that
precise assessments of the environmental change need appropriate information provision. Fourth, a
variety of other problems that are associated with contingent valuation include responses bias and
starting point biases (Mitchell and Carson (1989)). Additionally, the cross-sectional Contingent
valuation studies have tended to have low R-squared, though, R-squared is used to demonstrate that
WTP amounts are not random responses. Mitchell and Carson have indicated that the reliability of a
CV study which fails to show an R2 of at least 0.15, using only a few key variables, is open to
question. These biases are a result of difficulties for households in perceiving the hypothetical or

50
contingent market or from choice of starting point of bids (Pearce and Turner; 1990, Jimson, 2001).
Despite all these biases, accurate estimates of WTP can be made.
Generally, the CVM has found vast applications in cases especially in developing countries.
It has surpassed other environmental resources valuation techniques. Contingent Valuation can
precisely estimate WTP for an environmental good. The main factors affecting WTP are: income
level, age of the respondent, gender, and availability of information about water quality and
associated health risks.
4 Review of Previous Studies.
Most empirical studies on the WTP for improved water resources and supply indicate that income,
household size, education, age, distance from existing water source, employment status and gender
influence willingness to pay for improved water resources. For instance, Otsetswe (2001) found that
the above parameters were the main determinant for WTP for private water connection in Kanye
village in Botswana. In 2004, Pham Khanh Nam and Tran Vo Hung Son did a study on Household
Demand for Improved Water Services in Ho Chi Minh City, Vietnam. The study assessed the
willingness of people in Ho Chi Minh City to pay for improvements in their water supply system. It
also investigated what aspects of water supply, such as quality and water pressure are most
important. Many households surveyed already had to do a lot and spend lot of money to cope with
unreliable poor quality public water supply they currently use. The study found that people are on
average willing to pay between VND 148,000 and VND 175,000 for improvements in their water
supply. Also, households without piped water are more willing to pay for improved services than
those that already enjoy fixed supply. Non-piped households place more importance on water
quality than water pressure. The studies reviewed above have all employed CVM to solicit WTP for
improved water services.
5 Methodology In this section we focus on data collection, methodological procedures and sampling strategy. Two
methods of Data collection were used to collect household data in the study area. These are
household questionnaire and key informant interviews.
5.1 The Questionnaire
A questionnaire with open-ended questions was administered to households. The questionnaire
consisted of the following five sections: i) introduction, household location, ii) demographic
information, iii) socio-economic information, iv) water quality and willingness to pay, v) water
availability/supply and willingness to pay. Sections four and five are basically Contingent valuation

51
questions which emphasized two aspects of the proposed improved service: good quality water
meeting standards of Drinking water quality, reliable and predictable water supply. The questions
were designed to get the most precise data for econometric analysis of willingness of pay.
Interviews were conducted with the head of the household. Vacant households were
replaced by next one in the list. After entering and cleaning data, the data was ready for analysis.
For individuals who were sharing, that was treated as two households. The interviews lasted 15-30
minutes.
5.2 Key informant interviews
Officers from the Department of Water Affairs and any other relevant authority that was resourceful
were also interviewed in order to get some more information on the ground. For instance, the chiefs
gave information on status of water supply and quality.
5.3 Sampling procedure/strategy
Chobe ward, an area with a high concentration of the working population was purposively selected.
It was thought that Contingent Valuation would be appropriate to apply in this area, as the
population is relatively more educated. This is mainly because Contingent Valuation works
effectively if it is applied to a more educated and informed population. All households in Chobe
ward were listed, and a total of 310 households were estimated. Of the total number of households
in Chobe ward, 30 percent or 92 households were selected for an interview using systematic
sampling.
5.4 Model Specification
The specification of the equation below was primarily motivated by theory and relevant literature.
In the model, WTP is endogenously determined and is a function of the following independent
variables income level, gender, age, education, household size and avoidance expenditures.
Thus,
WTP= β0 + β1INC + β2HHOLD SIZE + β3AGE + β4AE + β5GEN + β6EDU + ε
Where; β1>0, β2< 0, β3<0, β4> 0, β5> 0, β6 > 0
Where,

52
WTP: Willingness of Maun residents to pay for improved water quality and reliable supply (in
monetary terms, Pula)
β0 : Constant
βi: Coefficients where i= 1 to 6
INC: Household income level
HHOLD SIZE: Household size
AGE: Age of the respondent
AE: Avoidance expenditures
GEN: Gender of the respondent where GEN= 1 for male respondent and GEN= 0 if respondent is
female
EDU: Education of the respondent (in terms of number of years at school)
ε: Error Term
Priori Expectations
INC; Income is expected to be positively related to WTP. Environmental economic theory assumes
that the demand for an improved environmental quality increases with income. Consequently, those
with a higher income are expected to be more willing to pay for an improved water quality and
reliability of supply than those who have little or no source of income.
HHOLD SIZE; Household size is expected to be inversely related to WTP. It is assumed that big
households will be willing to pay relatively less due to the associated high running costs (i.e.
budgetary constraints). Thus, the study expects the sign of its coefficient to be negative.
AGE; Respondents were asked their age. A prior, it is not possible to know how a respondent‟s age
may impact WTP. However, in general, it is hypothesized that as people grow older, they become
more politically conservative, and their WTP will decrease. Consequently, the estimation
coefficient of this variable is expected to be negative.
AE; Avoidance expenditures refers to undertaking personal water treatment measures such as
boiling the water, filtering or means of getting water when the supply is down i.e. buying good
quality, storing water in containers etc. The study expects a positive relationship between the
variable WTP as per economic theory. Households will be willing to pay since they incur so many
costs including paying the water bill and hence cannot afford an extra burden.
GEN; Gender (1 = male and 0 otherwise) is suppose to affect WTP. A positive relationship
between WTP and GEN might exist when the respondent is female because they are the ones who
take care of domestic household chores such as travelling to other places to fetch water in times of
need, hence they will be willing to pay.

53
EDU; WTP for improved water quality and reliability of supply is expected to be positively related
to education. The longer time in formal schooling (years), the more people understand better the
consequences of using unsafe water and the need to have reliable water supply. Therefore, the
educated will be more willing to pay than the illiterate.
6 Empirical Findings and Analysis of Data
This section is divided into descriptive analysis and regression results. The findings of this study are
based on the sample data collected from Chobe ward in Maun. Ninety-two (92) households were
covered with three refusals encountered. The survey covered ninety-two (92) households out of a
total of 310 (Population Census, 2001) households in Chobe ward. This means that the survey
covered only 30 percent of the households in Chobe ward. The results of this study show that on
average, 54 percent of the households in Chobe Ward are willing to pay for improved water quality.
Despite the smallest of the sample relative to population size and for the sake of argument,
assuming that the sample is nevertheless representative, it means that 167 households in Chobe
Ward are willing to pay for improved water quality. Consequently, if all households in Chobe Ward
who are willing to pay are going to be charged P54.59 per month, P9138 (167*P54.59) will be
collected from such a service.
6.1 Descriptive Analysis
This sub-section is composed of some descriptive statistics on Willingness to pay for improved
water quality and also on Willingness to pay for improved reliability of water supply.
6.1.1 Perceptions of Households about the water quality
Sample respondents perceived considerable differences in taste, colour and health hazards of water
from boreholes, which are the main water sources in this area. About 95 percent of the respondents
did not find water as of good quality. This is not surprising since 57.6 percent of the interviewed
households said that the water was salty. One would expect it to be so because it is ground water.
Forty-three (43.5) percent of the households reported that the water had residual sediments.
Residual sediments are usually an acute problem during winter. This is the period when the floods
from the Okavango Delta arrive in the village and boreholes along the Boro River start operating.
Sixty five percent of the households reported it was brownish in colour, 19.6 percent were

54
complaining about the surfaces of their bathtubs, which have been stained. The remaining 46.7
percent said the water possessed other characteristics. The findings are summarised in Table 3.
Table 3 Perceptions of households about the water quality
Source: Field Survey Results
Since the quality of the water from the piped distribution system was widely perceived to be poor,
the majority of the households (70.7 percent) embarked on coping strategies (termed as avoidance
expenditures) in order to make the water user-friendly. These strategies include among others
filtering or boiling it, buying good quality water etc. About thirty two percent (31.5%) of the
interviewed households buy good quality water, 27.2 percent boil it and 20.7 percent reported they
just leave it to settle- an opportunity cost time wise. Another 20.6 percent embark on other
mechanisms of treating the water. On average, households spend P71.21 per month as avoidance
cost.
Table 4 Common Coping Strategies amongst households
Source: Field Survey Results
Response
Characteristic
Salty Bad taste Residual
sediments
Brownish in
color
Stains
surfaces of
bath tubs
Other
Freq % Freq % Freq % Freq. % Freq. % Freq. %
Yes
No
53
39
57.6
42.4
20
72
21.7
78.2
40
52
43.5
56.5
60
32
65.2
34.8
18
74
19.6
80.4
43
49
46.7
53.3
Total 92 100 92 100 92 100 92 100 92 100 92 100
Coping Strategy Percentage (%)
Buy good quality water
Boil
Leave it to settle
Other mechanisms
31.5
27.2
20.7
20.6
Total 100

55
Table 5: Total Avoidance Cost Incurred by Households (Avoidance expenditures)
Frequen
cy Percent
Valid P.00 42 45.7
P 10.00 2 2.2
P 20.00 3 3.3
P 30.00 1 1.1
P 40.00 5 5.4
P 50.00 3 3.3
P 54.00 1 1.1
P 60.00 5 5.4
P 65.00 1 1.1
P 74.00 1 1.1
P100.00 5 5.4
P 110.00 2 2.2
P112.50 1 1.1
P 140.00 2 2.2
P150.00 2 2.2
P 170.00 1 1.1
P180.00 1 1.1
P 190.00 3 3.3
P 200.00 4 4.3
P230.00 1 1.1
P260.00 1 1.1
P300.00 1 1.1
P344.00 1 1.1
P 410.00 1 1.1
P 422.00 1 1.1
P 500.00 1 1.1
Total 92 100.0
Source: Field Survey Results
The analysis in Table 5 indicates that more than half of the interviewed households (54.3 percent)
incur various costs on monthly basis. Total monthly avoidance costs ranges from P10 to P500 per
month. This implies that apart from the fixed water bill charged by the Water Affairs Department,
households spend a lot of money through unofficial channels and coping strategies; termed as total
avoidance costs.
The majority (54 percent) of the households confirmed that there was need for an improved water
quality. They were willing to pay because they believed the problem of poor water quality is a
health risk. The mean maximum amount they were willing to contribute is P54.59 per month.
6.1.2 Descriptive statistics on reliability of water supply
Respondents were asked what they liked most about their water service from the piped distribution
system. Out of the 92 respondents interviewed, 89.1 percent reported it is unreliable and

56
unpredictable. The majority (73.9 percent) reported that they experience water shortages all year
round, 18.5 percent reported that they had on and off supply problems during the dry season. Water
supply in Chobe ward in Maun is very much unreliable. Water supply is an on and off thing
especially during weekends, all year round regardless of whether it is winter or summer. This has
led households embarking on certain alternatives in order to mitigate the situation.
Table 6: Alternatives embarked on when there is no water
Alternative Frequency Percentage (%)
Store water in containers only 49 53.3
Store water in containers / Ask from people with jojo tanks /Travel to other places and fetch 31 33.7
Ask from people with jojo tanks only 11 12.0
No Response 1 1.0
Total 92 100
Source: Field Survey Results
In order deal with this unreliability of supply, households engage in storage of water, travelling to
other places in search of water and asking from people with overhead water storage tanks (Jojo
tanks). Fifty three percent of the households have adopted the habit of storing water in containers,
33.7 percent fetch water from other places, 12 percent do ask for water from people with Jojo
tanks5. Such households incur indirect (i.e. “Avoidance”) costs for them to get water.
5 Jojo Tank is a name given to an overhead storage green plastic container that collects rainwater when it is raining.

57
Figure 1: Alternatives embarked on when there is no water
Since Maun water is provided by the water reticulation system there was substantial evidence to
suggest that the Water Affairs Department left much to be desired. The equipment and machinery
dates back to the early 1970s when the first boreholes were drilled, and this adversely affects the
reliability of water supply. The issue of power cuts at some boreholes does affect the continuity of
the water supply. This means breakdowns here and there are really an order of the day. This means
that the consumption and demand for water is at its peak in Maun and yet water supply sources
remain unchanging. This implies that vast pressure is exerted on the available resources to keep up
with the prevailing situation. The Department of Water Affairs spends a lot of money through
maintaining and installing collector reservoirs, additional pipes, booster pumps, water filters and
purifiers.
About eighty-four percent (83.7%) of the households believed that the establishment of a fund to
improve the reliability of supply was necessary. The average maximum WTP for improved
reliability of supply was P76.78 per month. The remaining 15.2 percent did express reservations
because they regarded water services as an entitlement to them that should be provided by the
government. This can be attributed to the fact that people are getting water as a social service from
government. However, due to the problem of sustainability of services, it is vital that people view
water as an economic good (see, Tables 7 and 8 for more information).
54.35%
33.7%
11.96%
Alternatives embarked on when there is no water
store water in containers
go to other places and fetch
ask from people with jojo tanks

58
6.2 Regression Results
The Willingness to pay equation was estimated using SPSS Version 12.0 to determine the
relationship between WTP and each of the variables as earlier discussed.
Table 7: Descriptive Statistics on WTP for improved water quality and reliability of supply
Dependent Variable N Range Minimum Maximum Mean Std.
Deviation
Maximum amount you are willing to contribute for improved reliability of supply (per month)
90 P1,000.00 P.00 P 1,000.00 P 76.7778 P 169.95695
Maximum amount you are willing to contribute for improved water quality (per month)
88 P 1,000.00 P.00 P 1,000.00 P 54.5909 P 125.24455
Source: Field Survey Results
Table 8: Descriptive Statistics In Relation to the Variables
Variable N Range Minimum Maximum Mean Std. Deviation
household size
92 7 1 8 3.16 1.799
age 92 34 21 55 36.28 8.738
Total avoidance cost(
Avoidance expenditures) 92 P500.00 P0.00 P500.00 P71.2120 P105.22337
gender6
92 1 0 1 .47 .502
education level (No. of
years) 92 18 7 25 14.92 4.779
Table 9 Results of the Regression Analysis to the WTP Model
Variable Coefficient Std Error t-statistic p-Value
Constant -16.2440 1.6805 -3.7781**
0.0291
INC 0.4834 1.3990 2.9100**
0.0420
HHOLD SIZE -0.6879 0.9943 -2.1349***
0.0541
AGE 1.0330 2.1630 -4.8219*
0.0021
AE -41.139 5.687 0.7940 0.4293
GEN 0.6658E-3 2.471 1.4823 0.1640
EDU -0.8923 1.0032 2.0473*** 0.0637
R-squared 0.5591 R-Bar-squared 0.4762
Mean WTP2 P76.78 No. of observations 92
DW-statistic 2.040
F-stat 2.521
Source: Field Survey Results
6 Gender was a dummy variable which assumed the following values; 1 for male respondent and 0 otherwise.

59
* Statistically Significant at 1% level
** Statistically Significant at 5% level
*** Statistically Significant at 10% level
The coefficient of determination of the model shows that 55.9 percent of variations in WTP2 is
attributed to the explanatory variables and the remaining 44.1 percent is unexplained.
In Table 9, half of all estimated coefficients had expected signs except Age (AGE), Avoidance
expenditures (AE) and Education (EDU). Furthermore, two of the variables were found to be
statistically insignificant, implying that they do not affect WTP.
Household Income (INC) has the expected positive sign and is statistically significant at 5 percent.
This implies that with increased monthly income, the household WTP2 will increase. From Table 9,
estimation coefficient of income suggests that a unit increase in household income will result in a
P0.4843 increase in WTP .
Household size (HHOLD SIZE) is significant at 10 percent and has the expected negative sign. The
estimation coefficient of household size implies that a unit increase in household size will decrease
WTP by P 0.6879. This suggests that the bigger the family size, the more difficulties encountered in
terms of budgetary constraints, hence the decreased WTP.
Age (AGE) does not have the expected negative sign even though it is the most significant variable
at 1 percent level. The variable age affects willingness to pay for improved reliability of supply
positively. This suggest that the older the person the more she/he is willing to pay for improved
water quality. This was evident since most respondents‟ reason for contributing was for the future
of their children. The coefficient of age can be interpreted as follows, holding everything else
constant; a one-year increase in the respondent‟s age will increase WTP by P 1.0330.
Avoidance Expenditures (AE) are statistically insignificant. The variable does not explain WTP.
Gender (GEN), a dummy variable, is statistically insignificant. According to this model, the
variable does not explain WTP. This might be attributed to the fact that most respondents
interviewed were males; therefore, they were no distinct variations in the dummy to effectively
depict the significance of the variable.
Educational level (EDU) has a negative sign and it is significant at 10 percent level of significance.
This is contrary to expectations. This means that the higher the number of years for schooling, the
lesser the WTP2. The slope coefficient of education can thus be interpreted as follows, holding
everything else constant; a one-year increase in education level will decrease WTP2 by
P0.08923.This might be attributed to those respondents who regarded water services as an
entitlement that should be provided by the government. They were cases where the respondents
60
who are PhD holders were not willing to pay for WTP2 because they strongly believed it is the
responsibility of government.
7 Conclusions
This paper examined the WTP for an improved water quality and reliability in Chobe ward in
Maun. The study‟s findings can be summarized as follows. First, on average, 54% percent of the
households in Chobe Ward Maun are willing to pay for improved water quality. Second, in Chobe
ward in Maun those with a higher income were willing to pay for an improved water quality and
reliability of supply. This finding corroborates the environmental economic theory which assumes
that the demand for an improved environmental quality increases with income. Third, the older the
person the more they are willing to pay for improved water quality and reliability in Chobe ward in
Maun. The aforementioned suggest that Chobe ward residents in general regard water as an
economic good as they are willing to pay for its provision, as opposed to a public good. Fourth,
larger families are not willing to pay much for an improved provision of water services. This
implies that the bigger the family size, the more difficulties are encountered in terms of budgetary
constraints which decrease their WTP. Lastly, in Chobe ward Maun educated people are lesser
willing to pay for improved water quality and reliability. This might be suggesting that they regard
water services as an entitlement that should be provided by the government.
References
Gnedenko, E., Gorbunova, Z., Safonov, G. (2000), Contingent Valuation of drinking water quality
in Samara city, EERC, Samara City.
Hanemann, W.M. (1991), “Willingness to Pay and Willingness to Accept: How Much can they
Differ?” American Economic Review, 81(3): 635-647.
Jimson, L.S (2001), Valuation of Solid Waste Removal Services in Northern Lesotho: Contingent
Valuation Approach, Unpublished, M.A. Dissertation, Dept. of Economics, University of Botswana.
Mmolawa B. And Narayana N. (2006), “Estimating Households‟ Willingness to Pay for Improved
Solid Waste Disposal: A Case of Gaborone City, Botswana,” International Journal of Environment
and Development, 3(1), 115-135.
Otsetswe, M. (2001), Willingness to Pay For Private Water Connection in Kanye; a Contingent
Valuation Approach, Unpublished B.A. Project, Department of Economics, University of
Botswana.
61
Pearce, D. (1993), Economic Values and the Natural World, Earthscan Publications Ltd, London.
Pearce, D., and Barbier, E.B. (2000), Blueprint for a Sustainable Economy, Earthscan Publications
Ltd, London.
Pearce, D.W., and Turner, R.K. (1990), Economics of Natural Resources and Environment,
Harvester Wheatsheaf, London.
Phu Le V. (2004) “Urbanisation and Water Management in Ho Chi Minh City Vietnam – Issues,
Challeges and Pespective” Geojournal, 70(1), 75-89.
Republic of Botswana (1997a), Environmental Health Department Annual Report, Gaborone,
Botswana.
Republic of Botswana (1997b), Environmental Health Department Annual Report, Gaborone,
Botswana.
Republic of Botswana (2001), Population and Housing Census, Gaborone, Botswana.
Warmeant, P. (1997), Review of Water Chemistry and Water Quality in the Okavango Delta,
Department of Water Affairs, Government Printers, Gaborone.
Willis, K.G., and Corkindale, J.T. (1995), Environment Valuation, New Perspectives, CAB
International, Oxon.
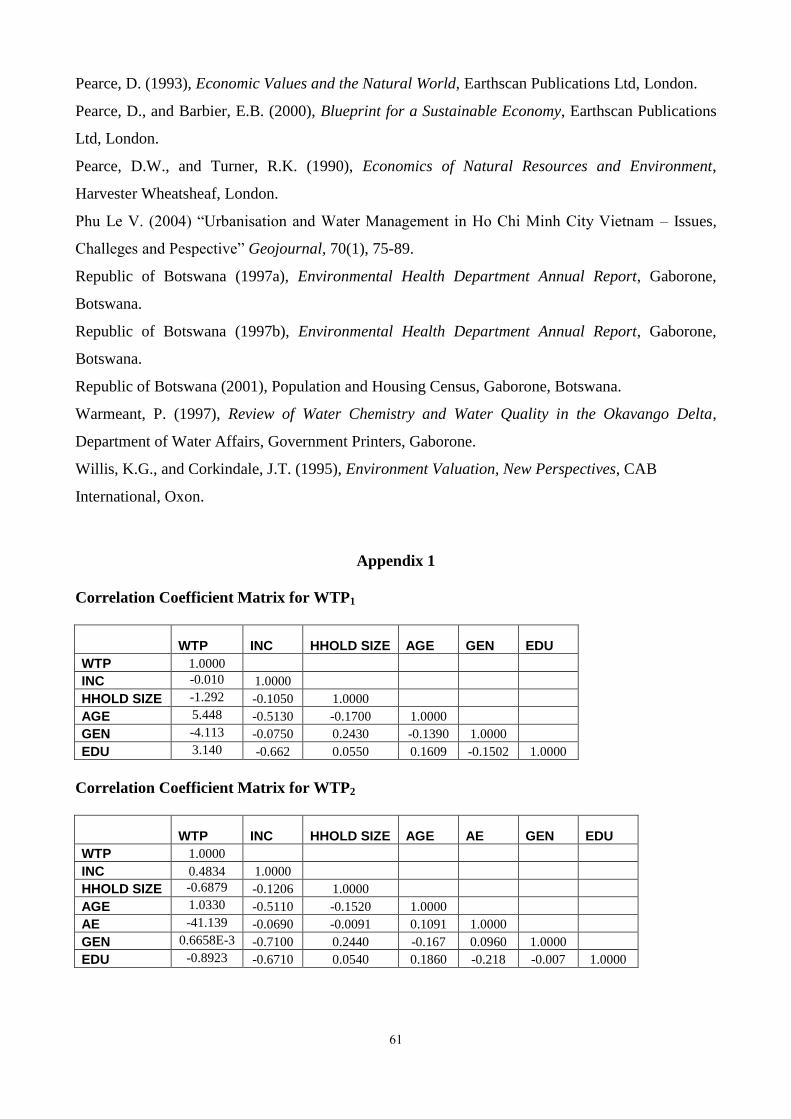
Appendix 1
Correlation Coefficient Matrix for WTP1
WTP INC HHOLD SIZE AGE GEN EDU
WTP 1.0000
INC -0.010 1.0000
HHOLD SIZE -1.292 -0.1050 1.0000
AGE 5.448 -0.5130 -0.1700 1.0000
GEN -4.113 -0.0750 0.2430 -0.1390 1.0000
EDU 3.140 -0.662 0.0550 0.1609 -0.1502 1.0000
Correlation Coefficient Matrix for WTP2
WTP INC HHOLD SIZE AGE AE GEN EDU
WTP 1.0000
INC 0.4834 1.0000
HHOLD SIZE -0.6879 -0.1206 1.0000
AGE 1.0330 -0.5110 -0.1520 1.0000
AE -41.139 -0.0690 -0.0091 0.1091 1.0000
GEN 0.6658E-3 -0.7100 0.2440 -0.167 0.0960 1.0000
EDU -0.8923 -0.6710 0.0540 0.1860 -0.218 -0.007 1.0000