
An Assessment of Consumers' Willingness to pay for Attributes ...
198
+ AN ASSESSMENT OF CONSUMERS’ WILLINGNESS TO PAY FOR ATTRIBUTES OF MILK AND DAIRY PRODUCTS WITH THE 100% CANADIAN MILK SYMBOL Thesis Submitted to the College of Graduate Studies and Research in Partial Fulfillment of the Requirements For the Degree of Master of Science in the Department of Bioresource Policy, Business and Economics, University of Saskatchewan Saskatoon By Shelicia Forbes-Brown © Copyright Shelicia Forbes-Brown, July 2013. All rights reserved. brought to you by CORE View metadata, citation and similar papers at core.ac.uk provided by University of Saskatchewan's Research Archive
-
Upload
khangminh22 -
Category
Documents
-
view
2 -
download
0
Transcript of An Assessment of Consumers' Willingness to pay for Attributes ...
+
AN ASSESSMENT OF CONSUMERS’
WILLINGNESS TO PAY FOR ATTRIBUTES OF
MILK AND DAIRY PRODUCTS WITH THE
100% CANADIAN MILK SYMBOL
Thesis Submitted to the College of
Graduate Studies and Research
in Partial Fulfillment of the Requirements
For the Degree of Master of Science
in the Department of Bioresource Policy, Business and Economics,
University of Saskatchewan
Saskatoon
By
Shelicia Forbes-Brown
© Copyright Shelicia Forbes-Brown, July 2013. All rights reserved.
brought to you by COREView metadata, citation and similar papers at core.ac.uk
provided by University of Saskatchewan's Research Archive

i
PERMISSION TO USE In presenting this thesis in partial fulfillment of the requirements for a Postgraduate degree from the
University of Saskatchewan, I agree that the Libraries of this University may make it freely
available for inspection. I further agree that permission for copying of this thesis in any manner, in
whole or in part, for scholarly purposes may be granted by the professor or professors who
supervised my thesis work or, in their absence, by the Head of the Department or the Dean of the
College in which my thesis work is done. It is understood that any copying or publication or use of
this thesis or parts thereof for financial gain shall not be allowed without my written permission. It
is also understood that due recognition will be given to me and the University of Saskatchewan in
any scholarly use that may be made of any material in this thesis.
Requests for permission to copy or to make other use of the material in this thesis in whole or part
should be addressed to:
Head of the Department of Bioresource, Policy, Business and Economics
University of Saskatchewan
51 Campus Drive
Saskatoon, Saskatchewan
S7N 5A8

ii
ABSTRACT Consumers are becoming increasingly concerned about their foods and more particularly, the origin
of their foods and the ingredients they contain. In light of the demand for additional origin
information, the 100% Canadian milk branding initiative was launched in 2009 as a means of
informing consumers about the origin of milk in their dairy products. The information is indicated
by the presence of the 100% Canadian milk symbol on dairy products and can be characterized a
form of co-branding. The literature on co-branding stipulates that co-branding can result in changed
product perceptions either negatively or positively. In addition, the willingness to pay (WTP)
literature stipulates that WTP is determined by product attributes and individuals’ characteristics.
This thesis therefore seeks to ascertain the factors affecting consumers’ preferences and WTP for
products with the 100% Canadian milk symbol. Specifically, the effects of individual characteristics
such as health consciousness, patriotic values and risk perceptions on preferences for dairy products
with the symbol are evaluated. Concurrently, the study explores the relationship between
respondents’ knowledge of the Canadian dairy industry and WTP for the symbol. Data were
gathered from a total of 1012 milk and ice cream consumers using two nationwide internet surveys.
Estimations are carried out using the Multinomial Logit (MNL) and the Random Parameter Logit
models (RPL).
The results suggest that consumers in general have positive perceptions of milk and ice cream with
the 100% Canadian milk symbol but negatively perceive store brand and organic labels. However,
in some cases, combining a store brand label or organic label with the 100% Canadian milk symbol,
are shown to alter consumers’ perceptions of the product. Some socio-demographic variables and
individual characteristics were also found to be influential in intended purchase behaviours and
WTP for milk and ice cream. The findings from this study provide information on consumers’
perceptions and attribute preferences and are expected therefore to contribute to the marketing
strategies of the Canadian dairy industry as a whole.

iii
ACKNOWLEDGEMENTS
“For I know the plans I have for you, declares the LORD, plans to prosper you and not to harm you,
plans to give you hope and a future.” (Jeremiah 29:11)
I would like to thank the lord who has made this journey possible, my husband for his love and
unyielding support, my mother and sisters for their encouragement and prayers.
I would also like to express my sincere gratitude to my supervisors Dr. Jill Hobbs and Dr. Eric
Micheels for their guidance, suggestions, and most of all their patience. I must also express my
gratitude to the committee members: Dr. Cakir Metin and Professor Rob Roy for advice and
suggestions and for agreeing to be a part of my committee. Professor Kerr and Professor Chaban,
you may not be aware of it, but you encouraged me and gave me hope- for this I would like to
express my thanks.
I would also like to thank the office staff: Barb Burton, Deborah Rousson, and Lori Hagen (former
staff member) for their resourcefulness and kindness.
Finally, I would like to thank the Canadian Dairy Commission and Alliance for Food and
Bioproducts Innovation for their financial support, which made this project possible.
iv
TABLE OF CONTENTS PERMISSION TO USE ...................................................................................................................... i ABSTRACT ........................................................................................................................................ ii ACKNOWLEDGEMENTS ............................................................................................................. iii TABLE OF CONTENTS ................................................................................................................. iv
LIST OF TABLES ........................................................................................................................... vii LIST OF FIGURES ........................................................................................................................ viii Chapter I: Consumers’ Preferences and the 100% Canadian Milk Brand ................................. 1
1.1. Introduction ......................................................................................................................... 1
1.1.1 About the 100% Canadian Milk Brand ..................................................................... 3
1.2 Problem Statement .............................................................................................................. 5
1.3 Objectives ............................................................................................................................. 5
1.4 Methodology ........................................................................................................................ 6
1.5 Outline of the Study ............................................................................................................ 6
Chapter 2: Consumer Preferences, Co-Branding and the Dairy Sector ...................................... 8
2.1. Review of the Consumer Preference Literature ............................................................... 8
2.1.1 Product Attributes Affecting WTP .......................................................................... 10
2.1.2 Risk Preferences and Perceptions ............................................................................ 14
2.1.3 Individuals’ Values, Characteristics and Social Identity ....................................... 17
2.1.4 A Review of Some Country of Origin (COO) Studies ............................................ 20
2.2. The Issue of Co-branding ................................................................................................. 23
2.2.1. What is Co-Branding ................................................................................................. 23
2.2.2. Types of Co-Branding................................................................................................ 23
2.2.3. General Perceptions toward Co-Branded Products ............................................... 24
2.2.4. Advantages and Disadvantages of Co-Branding ..................................................... 25
2.3. International and Domestic Co-Brands with Canada ................................................... 26
2.3.1 The Brand Canada Initiative ......................................................................................... 26
2.1.1. Indicators of Domestic Perceptions .......................................................................... 27
2.4. The Canadian Dairy Industry .......................................................................................... 29
2.4.1 Trends in Dairy Product Consumption ........................................................................ 30
2.5 Chapter Summary ................................................................................................................. 31
Chapter 3: The Theoretical Framework & Research Methodology ........................................... 33
3.1. Conceptual Model ............................................................................................................. 33
3.1.1. Product Attributes ..................................................................................................... 34
v
3.1.2. Individual Factors ...................................................................................................... 35
3.2. The Combination of Product Attributes and Individual Factors: Implications for WTP for Dairy Products Co-Branded with the 100% Canadian milk Brand ........................ 36
3.2.1. Food Safety Component ............................................................................................ 36
3.3. The Impact of Preferences: Assessing Willingness to Pay ............................................. 38
3.3.1 Types of Stated Choice Approach ............................................................................ 39
3.4. Designing the Discrete Choice Experiment ..................................................................... 40
3.4.1 Labelled versus Unlabelled Experiments................................................................. 41
3.4.2 Description of Attributes, Attribute levels and Alternatives ................................. 43
3.5. Chapter Summary ............................................................................................................. 46
Chapter 4: Empirical Approach & Descriptive Statistics ............................................................ 47
4.1 The Foundation of Discrete Choice Models .................................................................... 47
4.1.1 The Random Utility Model ....................................................................................... 47
4.2 Multinomial Logit Models: An Overview ....................................................................... 48
4.2.1 Potential Drawbacks with the Multinomial Logit Model (MNL) .......................... 49
4.2.2 Testing for IID violation ............................................................................................ 50
4.3 Accounting for Consumer Heterogeneity in DCE .......................................................... 51
4.3.1 Generalized Extreme Value Models ......................................................................... 51
4.3.2 Multinomial Probit Model ........................................................................................ 53
4.3.3 Mixed Multinomial logit Approach .......................................................................... 54
4.4 Estimating Willingness to pay .......................................................................................... 56
4.5 The Choice Model Specification ....................................................................................... 57
4.6 Chapter Summary ................................................................................................................. 60
Chapter 5 Descriptive Statistics ...................................................................................................... 61
5.1 The Survey: Development, Piloting and Administration ................................................... 61
5.1.2 Data Description.............................................................................................................. 63
5.1.3 Purchasing Habits ........................................................................................................... 66
5.1.4 Respondents’ Brand Awareness, Brand Perceptions, Level of Patriotism, Attribute Preferences and Industry Awareness ..................................................................................... 68
5.1.5 Industry Knowledge ....................................................................................................... 82
5.2 Factor Analysis: Incorporating the Extracted Factors ...................................................... 85
5.2.1 Factor Reliability Assessment & Factor Score Calculation ........................................ 90
5.3 Chapter Summary ................................................................................................................. 92
Chapter 6: Results: Product Attributes and Individual Factors Affecting WTP for the 100% Canadian Milk Symbol .................................................................................................................... 93

vi
6.1 Coding the Variables ............................................................................................................. 93
6.2 MNL Results: Milk Sample................................................................................................... 95
6.3 Random Parameter Logit Results: Milk Sample ................................................................ 97
6.3.1 Random Parameter Logit Main Effects ........................................................................ 98
6.3.2 Random Parameter Logit with Selected Interactions ............................................... 100
6.3.3 Random Parameter Logit with Interactions, Covariates and Factors ..................... 102
6.4 MNL Results: Ice cream Sample ........................................................................................ 107
6.4.1 Multinomial Logit (MNL) Main Effects ..................................................................... 107
6.5 Random Parameter Logit: Ice cream sample ................................................................... 108
6.5.1 Random Parameter Logit Main Effects ...................................................................... 108
6.5.2 Random Parameter Logit with Selected Interactions ............................................... 111
6.5.3 Random Parameter Logit with Interactions, Covariates and Factors ..................... 112
6.6 The Role of Industry Knowledge in WTP for Milk and Ice cream with the 100% Canadian milk symbol. .............................................................................................................. 116
6.7 General Results Discussion ................................................................................................. 121
6.8 Chapter Conclusion ............................................................................................................. 125
Chapter 7: Conclusions & Implications ....................................................................................... 127
7.1 Implications of the Findings ................................................................................................ 130
7.2 Research Limitations & Future Studies ............................................................................ 132
References ....................................................................................................................................... 134
Appendixes...................................................................................................................................... 144
Appendix A: Examples of Products with the 100% Canadian Milk Symbol ....................... 144
Appendix B: Changes in the Symbol used to Represent Canadian Milk on Dairy products....................................................................................................................................................... 145
Appendix C: The Distribution of Dairy Farms by Province ................................................. 145
Appendix D: Factor Analysis Justification- Milk Survey ...................................................... 146
Appendix E- Factor Analysis Justification- Ice cream ........................................................... 150
Appendix F: The Survey ........................................................................................................... 153
Appendix G: Frequency Distributions ..................................................................................... 170
Appendix H: Descriptive Statistics- Milk Survey ................................................................... 177
Appendix I: Descriptive Statistics- Ice Cream Survey ........................................................... 183
Appendix J: Industry Knowledge and Education .................................................................. 188
Appendix K: Testing for IIA ..................................................................................................... 188
vii
LIST OF TABLES Table 1.1: Selected Foodborne Illnesses by Countries ................................................................... 2 Table 2.1: Selected Willingness to Pay Studies .................................. Error! Bookmark not defined. Table 3.1: Description of Attributes and Attribute Levels .......................................................... 43 Table 3.2a: An Example of a Milk Choice Set .............................................................................. 45 Table 3.2b: An Example of an Ice Cream Choice Set .................................................................. 45 Table 5.1: Percentage Population Represented by Province ....................................................... 64 Table 5.2: Comparative Demographic Characteristics ................................................................ 65 Table 5.3: Extracted Factor Components: Milk Sample ............................................................. 89 Table 5.4: Extracted Factor Components: Ice Cream Sample ................................................... 90 Table 6.1a: Coded Variables ........................................................................................................... 94 Table 6.1b: Interaction Terms ........................................................................................................ 95 Table 6.2: Milk- MNL Main Effects .............................................................................................. 97 Table 6.3: Milk- RPL Main Effects ................................................................................................ 99 Table 6.4: Milk- Preference Distribution .................................................................................... 100 Table 6.5: Milk- RPL with Selected Interactions ....................................................................... 102 Table 6.6: Milk- RPL Accounting for Socio-Economic and Regional Differences .................. 104 Table 6.7: Milk- RPL with Covariates and Factors ................................................................... 106 Table 6.8: Ice Cream- MNL Main Effects ................................................................................... 108 Table 6.9: Ice Cream- RPL Main Effects .................................................................................... 110 Table 6.10: Ice Cream- Preference Distribution ......................................................................... 110 Table 6.11: Ice Cream- RPL with selected Interactions ............................................................ 112 Table 6.12: Ice Cream- RPL Accounting for Socio-Economic and Regional Differences ...... 114 Table 6.13: Ice Cream- RPL with Covariates and Factors ........................................................ 116 Table 6.14: Milk- RPL Accounting for Knowledge .................................................................... 119 Table 6.15: Ice Cream- RPL Accounting for Knowledge .......................................................... 120
viii
LIST OF FIGURES
Figure 3.1: Conceptual Framework ............................................................................................... 34 Figure 5.1: Age Distribution ........................................................................................................... 66 Figure 5.2: Income Distribution ..................................................................................................... 66 Figure 5.3: The Frequency of Canadian Consumers Milk Purchase per Month ...................... 67 Figure 5.4: The Frequency of Canadian Consumers Ice Cream Purchase per Three Month Period ................................................................................................................................................ 67 Figure 5.5: Brand Awareness- Milk Respondents ........................................................................ 69 Figure 5.6: Brand Awareness- Ice Cream Respondents ............................................................... 69 Figure 5.7: 100% Canadian Milk Symbol as an Indication of Higher Quality- Milk Respondents ...................................................................................................................................... 71 Figure 5.8: The 100% Canadian Milk as an Indication of Higher Quality by Location - Milk Respondents ...................................................................................................................................... 71 Figure 5.9: The 100% Canadian Milk Symbol as an Indication of Higher Quality- Ice Cream Respondents ...................................................................................................................................... 72 Figure 5.10: The 100% Canadian Milk Symbol as an Indication of Higher Quality by location- Ice cream Respondents .................................................................................................................... 72 Figure 5.11: Attitudes toward Domestic Products - Milk Respondents ..................................... 74 Figure 5.12: Attitudes toward Domestic Products by Location - Milk Respondents ................ 74 Figure 5.13: Attitudes toward Domestic Products - Ice Cream Respondents ............................ 75 Figure 5.14: Attitudes toward Domestic Products - Ice Cream Respondents (by Location) .... 75 Figure 5.15: Purchasing Habits- Milk Purchased by Label per Month ..................................... 77 Figure 5.16: Purchasing Habits- Ice Cream Purchased by Label per Three Month Period .... 78 Figure 5.17: Most Important Factors when Purchasing Milk ..................................................... 79 Figure 5.18: Most Important Factors when Purchasing Ice Cream ........................................... 80 Figure 5.19: Least Important Factors when Purchasing Milk .................................................... 81 Figure 5.20: Least Important Factors when Purchasing Ice Cream ........................................... 82 Figure 5.21: Industry Knowledge- Milk Respondents .................................................................. 83 Figure 5.22: Industry Knowledge- Ice Cream Respondents ........................................................ 85 Figure 6.1: Concern about the Origin of Food ............................................................................ 121
1
Chapter I: Consumers’ Preferences and the 100% Canadian Milk Brand
1.1. Introduction
Canadian consumers are becoming increasingly concerned about the origin and
production methods used to process their foods including their dairy products (Alberta
Agriculture and Rural Development, 2011; Agriculture and Agri-Food Canada, 2009a;
Kuperis, Veeman, & Adamowicz, 1999). In light of this, marketing strategies are most
frequently geared towards highlighting information on the origins and processing
methods of products.
It is in this vein that in 2009, the Dairy Farmers of Canada launched a national branding
programme aimed at informing consumers about the 100% Canadian milk symbol (Dairy
Farmers of Ontario, 2009). Specifically, they noted that products displaying the symbol
contained milk that is of “high-quality, fresh, safe and containing no antibiotic residues
and hormones” (Dairy Goodness.ca). The symbol appears on several dairy products in
Canada including milk, although all fluid milk (except chocolate milk) is 100%
Canadian. In addition to promoting quality attributes, the 2009 branding initiative was
also aimed at appealing to a certain level of nationalism in consumers by suggesting that
purchasing dairy products with the 100% Canadian milk symbol would be akin to buying
Canadian products that are produced in accordance with the high standard of Canadian
values and would support the Canadian economy.
The branding campaign can be regarded as timely. In light of an increased number of
reported foodborne illnesses in recent times,1 consumers are seeking the assurance that
they are purchasing products that are safe for consumption. Although the issue of
foodborne illnesses is not new, consumers are becoming increasingly aware that 1 In 2008 an outbreak of listeriosis resulted in the death of 23 Canadians (Canadian Food Inspection Agency, 2011)
2
foodborne illnesses are prevalent and can result from the consumption of just about
anything. As seen in Table 1.1 (which for illustrative purposes documents cases back to
the 1980s), both processed and unprocessed foods ranging from bean sprouts to apple
juice and peanut butter have resulted in illnesses.
Table 1.1: Selected Foodborne Illnesses by Countries
Year of
Outbreak
Country Outbreak, Product
Source
Source
2011 Germany E. coli- Bean sprouts BBC News Europe, 2011
2011 USA Salmonella - Ground
Beef
Centers for Disease Control and
Prevention, 2012
2010 USA Salmonella- Eggs Centers for Disease Control and
Prevention, 2010
2008 Canada Listeria - Maple Leaf
foods
Public Health Agency of Canada,
2012
2007 USA Salmonella- Peanut
Butter
Centers for Disease Control and
Prevention, 2007
2006 USA E. coli- Spinach Centers for Disease Control and
Prevention, 2006
2005 United
Kingdom
E. coli- Meat BBC News Wales, 2010
1999 USA Salmonella- Orange
Juice
Marlerclark.com, 1999
1996 USA E. coli- Apple Juice Los Angeles Times, 1996
1985 USA Salmonella- Milk The New York Times, 1985 Source: Compiled by Author
Consumers often seek different preventative methods and means of guarding against food
related illnesses. Willingness to pay (WTP) can reflect differences in preferences and
attitudes towards foodborne illnesses. Essentially, with consumers expressing concern
about the food they purchase, discriminatory preferences are exhibited among similar
products. Discriminatory preferences result in varying WTP based on differences in
3
product attributes such as origin information, product type, and brand. This type of
behaviour however varies from individual to individual given that some consumers may
exhibit higher risk preferences than others. A broad look at the literature on WTP will
show that most of the factors influencing WTP fall into two categories: 1) product
attributes, and 2) individual factors
This thesis primarily intends to ascertain Canadian consumers’ preferences and attitudes
toward products displaying the 100% Canadian milk symbol (depicted in Figure 1.1). By
extension, this research will examine consumers’ WTP in the context of the 100%
Canadian milk symbol by assessing how factors related to attributes of dairy products
(attributes such as the 100% Canadian milk symbol, whether the product is conventional
or organic, and generic brands) and individual characteristics (such as risk preferences
and values) affect WTP for milk and ice cream.
Figure 1.1: The 100% Canadian Milk Symbol
Source: Dairygoodness.ca
1.1.1 About the 100% Canadian Milk Brand
The 100% Canadian milk symbol appears on several dairy products throughout Canada
including: milk, cheese, ice cream and yogurt (see Appendix A for some examples).
Although not a brand in the usual sense of the word, Dairy Farmers of Canada markets
the symbol as a brand used to identify dairy products made from 100% Canadian milk
(Dairy Farmers of Ontario, 2009). The 100% Canadian milk branding initiative provides
a marketing approach for Canadian produced milk and dairy products based on the
explicit representation of country of origin information. With this in mind, there have
been a number of changes to the strategies used to market Canadian dairy products over
4
the years. These strategies have become more conspicuous and less ambiguous with each
modification (see Appendix A). “Prior to 1996, the (Canadian milk) symbol consisted
solely of the cow, from 1996 to 2008 the signature “Quality Milk” was added to qualify
the main ingredient and add meaning to the symbol” (Dairy Goodness.ca). Dairy farmers
of Canada launched the 100% Canadian milk brand in 2009, explicitly reflecting the
origin of milk (as a product and milk as an ingredient in dairy products), and this new
symbol then replaced the “Quality Milk” label. Whereas “Quality Milk” can be regarded
as generic, the 100% Canadian milk symbol provides a more explicit and specific signal
about the product’s origin (in the case of milk) or ingredient origin (for end use products
containing milk). Consumers are then free to determine what the explicit origin
information means to them and how much value should be placed on this extrinsic cue.
The symbols used to identify the 100% Canadian milk products were modified due to
increasing consumer demand for origin information. As Ian MacDonald, National
Director of Marketing and Nutrition with Dairy Farmers of Canada states “The explicit
clarity of the new 100 percent Canadian Milk brand responds to growing consumer
demand to clearly identify the origin of all food products on the package.” (The AgriPost,
2009). However, not all products made from 100% Canadian milk display the symbol. In
light of this, it would be interesting to assess whether consumers are willing to pay more
for products (particularly milk and ice cream) with the symbol as opposed to those
without, and why. Products with the symbol can be thought of as being marketed by two
or more brands (co-branded). Within this context there might be valuable insights from
the co-branding literature that could inform the investigation of the role of the 100%
Canadian milk symbol in preferences for dairy products. In its simplest form, co-branding
refers to the combination of two or more brands to market a single product. Co-branding
is evident in the dairy industry when the 100% Canadian milk symbol is used in
marketing store brand or national brand milk, cheese, ice cream and other dairy products
given that it was launched as a brand.
5
1.2 Problem Statement
While some consumers may be interested in products co-branded with the 100%
Canadian milk symbol, others may be indifferent towards products with and without the
symbol. Such differences in consumers’ preferences are expected as consumers’ are
heterogeneous and different consumer groups will have varying degrees of preferences
towards product attributes. It is therefore expected that factors related to product
attributes and consumers’ characteristics will determine consumers’ preferences for
products with the 100% Canadian milk symbol and by extension explain the conditions
under which co-branding tends to succeed. In addition, consumers’ knowledge about the
dairy industry may also contribute to their WTP for dairy products with the 100%
Canadian milk symbol. A knowledgeable consumer would know that under the supply
management system in Canada, all milk except chocolate milk is 100% Canadian milk.
Being privy to such information may affect preferences and willingness to pay for milk
with the symbol. However, it is uncertain how different factors such as consumers’
perceptions of dairy products with the 100% Canadian milk attribute itself, individual
characteristics and knowledge of the dairy industry influence preferences for products co-
branded with the 100% Canadian milk attribute, therefore, the conditions under which
co-branding tends to succeed in the dairy sector are unclear.
1.3 Objectives
In light of the previous section, an overarching question emerges - what are the drivers of
preferences and WTP in the context of the 100% Canadian milk symbol? In answering
this question, specifically for milk and ice cream co-branded with the 100% Canadian
milk symbol, this research aims to:
1) Assess the attributes/factors affecting consumers’ preferences for milk and ice cream.
2) Ascertain Canadian consumers’ willingness to pay for milk and ice cream co-branded with the 100% Canadian milk symbol.
3) Ascertain how WTP is moderated by consumers’ perceptions of milk and ice cream with the 100% Canadian milk attribute:
6
What does it signal to consumers; is it a health symbol, a national symbol, or a food safety symbol that is influencing WTP by consumers?
4) Identify potential target markets for co-branded dairy products based on socio-
demographic and socio-economic characteristics.
1.4 Methodology
The research utilizes a stated preference approach to examine Canadian consumers’
preferences for dairy products. To this end, two internet surveys were administered to
respondents in both English and French. One version assessed preferences and WTP for
milk co-branded with the 100% Canadian milk symbol, while the other examined
attitudes toward ice cream co-branded with the 100% Canadian milk symbol. The
information obtained from the discrete choice experiment is used in estimating
Multinomial Logit (MNL) and the Random Parameter Logit (RPL) models.
This research is expected to add to the literature on consumers’ perceptions of product
attributes and how this translates into their WTP for Country of Origin Labelling
(COOL). In addition, it is expected to highlight the conditions under which co-branding
in the dairy industry tends to succeed and by extension the possible implications of
creating brand alliances (co-branding) within the dairy food supply chain in Canada.
Therefore, the results obtained are expected to guide future market studies and marketing
strategies in the dairy industry.
1.5 Outline of the Study
The remainder of the study is structured as follows: Chapter 2 reviews the relevant
literature within the area of consumers’ preferences and WTP. Chapter 2 also provides a
general overview of the factors affecting perceptions of co-branded products and
discusses trends in the Canadian dairy industry. Chapter 3 discusses the theoretical
framework as it relates to factors affecting consumers’ purchasing decisions and how
these factors may translate into consumers’ WTP for milk and ice cream with the 100%
Canadian milk attribute. The underlying theoretical constructs involved in the survey
design are also discussed in this chapter. Chapter 4 explains the empirical model. The

7
following chapter presents the demographic and attitudinal results from both surveys.
Chapter 6 presents and analyzes the results from the milk and ice cream estimations. The
final chapter presents the conclusions, implications and limitations of the research.
8
Chapter 2: Consumer Preferences, Co-Branding and the Dairy Sector This chapter provides an overview of the different factors believed to influence
consumers’ willingness to pay (WTP) by examining the consumer preference literature.
In addition, this chapter discusses how co-branding can affect consumers’ product
perceptions and ultimately their WTP for products. Some examples of local and
international co-brands with Canadian brands are also highlighted. In addition, an
overview of the Canadian dairy industry is provided and trends in dairy consumption and
domestic and international perceptions of Canada are discussed.
2.1. Review of the Consumer Preference Literature
A great number of studies address different aspects of consumers’ WTP for various
product attributes and products as a whole. Table 2.1 presents an overview of selected
consumer preference studies and the various WTP techniques they employ. It is clear that
WTP can be estimated for different attributes such as food safety, risk reduction, and
healthy foods per se. The literature points to three main areas influencing consumers’
WTP. These studies suggest that food attributes, risk perceptions, and consumers’ values
are the main factors contributing to preferences and WTP. The literature review
highlights relevant studies with a focus on the impact of product attributes, risk
perception and consumers’ values and how these factors influence WTP.

9
10
2.1.1 Product Attributes Affecting WTP
Lancaster (1966) notes that consumers derive utility from product attributes as opposed to
directly from the product itself. Therefore consumers will likely decide to purchase milk, for
example, because of the attributes embodied in milk such as: freshness, texture, taste, price, and
brand, because consumers are particularly interested in the utility derived from a product’s
attributes rather than the product. Given the relationship between utility and product attributes, a
method that economists use to measure a consumer’s demand or preference is WTP. A demand
curve depicts the link between the price of a product and the amount of it that consumers are
willing and able to purchase at different prices. However, WTP is not just affected by
affordability but also by an individual’s taste and preferences and ultimately their quality
perceptions. In line with the theory of Lancaster (1966), in assessing the quality of a product,
each attribute is likely implicitly evaluated first, only after which the combination of all
attributes is evaluated to formulate an overall perception of the product as a whole. The
assessment of a product is however tempered by a consumer’s subjective perception of “quality”
and by extension which attributes constitutes a “quality” product.
Zeithaml (1988) offers a simple but broad definition of quality to mean “superiority or
excellence” which by extension translates consumers’ quality perceptions to mean “consumers’
judgment about a product’s overall excellence or superiority” (p.2). Consumers rely on various
quality cues in evaluating the quality of a product, as such quality perceptions are based on
consumers’ evaluative judgments (Bredahl, 2004). Therefore, the definition of a “quality”
attribute is quite dynamic with different attributes having varying levels of importance and
signalling different information about quality depending on the product of interest and
consumers’ perceptions and personal preferences. For example, it was noted by Zeithaml that
consumers’ quality perceptions in the beverage industry are affected by what was termed as
higher level abstract dimensions: purity, freshness flavor and appearance. Regardless of the
product in question consumers’ perceptions of the product are based on several product attributes
which have been classified as credence, search, or experience attributes.
11
2.1.1.1 Search, Experience, and Credence Attributes
Given the importance of product attributes in influencing perceptions, preferences, and product
demand, it is important to examine briefly the different categories of product attributes.
2.1.1.1.1 Search Attributes and Willingness to Pay
Search attributes are those that are verifiable at the point of purchase and as such a product can
be evaluated by these attributes before a purchase decision is made. These attributes include
product prices, labelling, package information and product appearance. Country of Origin (COO)
information can also represent an important search attribute if the labelling is credible. The COO
label represents an important attribute that is used by marketers as a differentiating product
characteristic and a strategy to positively influence preferences and demand. According to Phau
and Prendergast (2000) and Chen (2011), COO information and country image represent
important attributes influencing WTP. Chen also notes that COO branding affects a product’s
image because it incorporates political, economic, technological and social factors associated
with a specific country. Intuitively, these cues are incorporated in the value consumers place on a
product and as such affect their resulting WTP.
Chen (2011) however clarifies that consumers do not perceive or judge the quality standards of
all products from the same country equally. Therefore, although COOL in the capacity of a
search attribute affects WTP, consumers’ WTP also depend on other intrinsic and extrinsic
product attributes individuals’ characteristics.
Brand information, can also be classified as a search attribute, depending on how consumers use
this information in their purchasing decisions. Zeithmal (1988) highlights the importance of
brand information in influencing purchasing decisions by positing that a brand represents a
summary of quality and provide consumers with bundled information relevant to the product in
question. Also, Westgren (1999) notes that the success of a particular brand “Label Rouge” in
the poultry industry in France could be attributed to the quality assurance that the brand offered
consumers, this aided in eliciting WTP values exceeding 100% premiums for the Label Rouge
brand in comparison to other brands.

12
2.1.1.1.2 Experience Attributes and Willingness to Pay
Experience attributes, unlike search attributes, cannot be verified before a purchase, this potential
exists only after purchase. Like the name suggests, experience attributes entail attributes that are
verified through consumption experiences. An experience attribute that readily comes to mind is
taste (in the case of consumables). Experience attributes can therefore be thought of as attributes
that guide or influence future purchase decisions through perceptions formed from experiencing
product attributes and hence a product. Information on experience attributes can also be gleaned
from other consumers based on a product’s reputation. This is especially useful in cases when a
product or a certain brand of product is being tried for the first time.
2.1.1.1.3 Credence Attributes and Willingness to Pay
Credence attributes are those which cannot be readily verified either before or after purchasing a
product. Credence attributes are therefore often characterised by a claim such as “made in
Canada”, “organically grown”, “grain fed”, “locally grown”, “fair trade” and “free range” and
similar claims. The credibility of the organization making these claims is therefore very
important since these attributes cannot be verified by the consumer either at the point of purchase
or through consumption. Given that information asymmetry characterizes credence attributes,
this anomaly is addressed through identifying the attributes through labelling, thus turning the
credence attribute into a search attribute. Credence attributes can either be of an extrinsic nature
such as COOL or organic practices, or intrinsic such as calorie content or type of ingredients. In
any case, credence attributes may influence consumers’ purchase intensions either negatively or
positively.
Hobbs, Bailey, Dickinson and Haghiri (2005) evaluate WTP for credence attributes of beef and
pork. In their study an experimental auction is employed to evaluate Canadian consumers WTP
for assurances related to food safety, traceability, and production methods in beef and pork
markets. The results indicated that consumers were inclined to pay more for traceability and food
safety combined as opposed to traceability alone, neither of which is verifiable at point of
purchase in the absence of credible labelling.
13
Peng, West and Wang (2006) also employed a stated preference experiment in the form of a
survey to assess consumers’ purchase intentions and attitudes towards conjugated linoleic acid
(CLA) enhanced milk products given the claim that CLA could reduce the risk of cancer,
cardiovascular diseases, diabetes, and obesity. Consumers in Alberta and British Columbia were
interviewed via telephone, and there were 803 respondents in the final sample. The results were
assessed with the use of an ordered probit model. The results indicated that consumers’
preferences and attitudes toward CLA enhanced milk products were influenced by prior dietary
related illnesses. Existing preferences for functional attributes, age and the presence of children
in the household, among other factors, also affected preferences for this credence attribute.
Dentoni, Tonsor, Clantone and Peterson (2009) examine consumers’ motivations for buying
agri-food products that are locally grown based on the direct and indirect impacts of “locally
grown” on consumers’ purchase intentions. The authors defined the direct effects as those effects
that impact purchase intentions without mediation, while indirect effects are defined as those that
occur due to consumers’ meditated belief that other attributes (whether credence or experience in
nature) are present in the product. To test the differential effects, data was collected in 2008 from
Michigan State University students through an internet survey focused on locally grown apples.
A structural equation model was used to separate the direct and indirect effects. From the results
it was concluded that consumers’ belief in the presence of “locally grown” is influenced by both
direct and indirect effects on their attitudes towards apples. In addition, it was noted that
consumers’ familiarity with apples had a negative impact on their beliefs in the presence of
credence attributes as cues of other attributes, as more familiar respondents rely less on extrinsic
clues than those that are not so familiar with the product.
In addition, a study conducted by Kuperis, Veeman, and Adamowicz (1999) highlights how
product attributes affect consumers’ perceptions and WTP. The authors examine consumers’
responses to the potential use of Recombinant Bovine Somatotropin (rBST) in Canadian milk
although this product attribute is not a component of Canadian milk. Data was collected from
294 respondents through a mail survey administered in Edmonton Alberta. A conditional logit
model was used to analyze consumers’ choices of milk comprising of varying levels and
characteristics, namely, fat content, price, freshness and the presence of rBST. The change in

14
consumers’ economic welfare resulting from the potential use of rBST was calculated based on
how much consumers would have to be compensated to receive the same level of utility as
before the introduction of rBST assuming that milk with rBST is explicitly labelled as such. The
results indicated that the introduction of rBST milk in Canada can be expected to decrease
consumers’ welfare. However, it was also noted that the representative consumer was willing to
make a trade-off between rBST and price as a decreasing price resulted in reduced welfare loss
to the consumer but did not completely offset the welfare loss. The authors concluded that
labelling can lead to negative perceptions. Therefore, if rBST was to be used in Canada the
government and stakeholders in the dairy industry would need to educate consumers about rBST
by providing accurate and clear information.
The preceding discussion on product attributes serves to highlight the importance of product
attributes in consumers’ assessment and evaluation of products and therefore their importance in
influencing WTP. It can be noted that there exists a connection between these three groups of
attributes. In some instances there is but a slight difference between a credence attribute and a
search attribute as many search attributes are merely credence attributes that are transformed
through labels or brands.
2.1.2 Risk Preferences and Perceptions
Based on the previous discussion, it is logical to deduce that product attributes are not the only
factors affecting preferences and WTP. The manner in which product attributes are evaluated can
be subjective and is often influenced by consumers’ perceptions, and personal characteristics or
preferences. Perceptions and personal characteristics affect preferences and consumers’
perceptions of risk. Intuitively, the level of perceived risk is contingent on several factors such as
the magnitude and probability of the potential risk (including but not limited to health and
finances) associated with the product being purchased and therefore is inherently linked to
product attributes. As such, it is expected that the higher the potential risk, the greater risk
perception and hence aversion the purchaser will exhibit. Heslop and Sprott (2007) allude to the
idea that a consumer’s level of risk perception is most likely associated with differences in
product type and price and suggest that more complex and expensive products would heighten
risk aversion.
15
In evaluating the risk associated with product consumption the Canadian Partnership for
Consumer Food Safety Education, estimates that there are approximately 11 million cases of
foodborne illness in Canada every year, resulting in an estimated annual cost of 12 to 14 billion
dollars (Canadian Partnership for Consumer Food Safety Education). Shin, Kliebenstein, Hayes
and Shogren (1992) dissect the general cost associated with foodborne illnesses according to
medical treatment, productivity loss, pain and suffering of affected individuals, food industry
losses, and losses within the public health sector. Shin et al. (1992) also note that the stated
financial cost however usually accounts only for direct individual losses incurred and is therefore
understated. Consumers being aware of the potential costs will likely seek to eliminate or lower
the associated risk to which they are exposed.
The level of risk tolerated is dependent on the individual in question. According to Weber and
Milliman (1997), risk preferences can be likened to a continuum where they range from risk-
avoiding to risk-seeking. However, a consumer’s level of risk preference may vary from
situation to situation as an individual’s risk preference may also be influenced by their risk
perception of the product in question inferred from existing product attribute(s). For example, it
would be unlikely for consumers to knowingly purchase expired milk for the same price as milk
within its expiry date regardless of where one falls on the continuum. However, if the expired
milk is being sold at a discounted price then consumers with lower risk aversion may consider
purchasing this product. Consequently, risk perception, directly and indirectly impacts WTP
based on the potential risk associated with the product and the risk preference inherent within
consumers. An assessment of WTP should therefore account for relative risk preferences.
In evaluating consumers’ risk perceptions, Bernard and Mathios (2005) examine consumers’
WTP for Recombinant Bovine Somatotropin (rBST) free and organic milk products using
weekly scanner data in upstate New York. It was noted that there was an increase in organic milk
purchases following the approval of rBST in the US - an indication of the relative risk aversion
associated with consuming milk produced with the use of synthetic growth hormones. The
results from their study indicate that consumers are willing to pay more for both rBST-free and
organic milk compared to conventionally produced milk.
16
Similarly, Latvala (2010) examined beef consumers’ WTP for increased quality information and
whether they consider the information available on beef labels to be sufficient. Latvala also
hypothesized that the value and willingness to pay for quality information increases with the risk
a consumer associates with food products. Latvala surveyed 1,290 respondents, the data analysis
conducted using a binary logistic model. The results indicate that consumers seek to reduce the
risk that they are exposed to when making a purchase by using several risk reduction strategies,
as a single source of information may not be sufficient. As such, contributing factors found to
influence WTP included risk perception, other individuals’ accounts of their experience, and
trust in the food safety authority.
Risk perceptions may be quite different from actual risk. However, as it relates to WTP, risk
perceptions trump actual risk. A study conducted by Hammitt (1993) explains this. In the study
the author assessed consumers’ WTP to avoid pesticide residues in conventionally and
organically grown fruits and vegetables and posits that consumers may choose organic because
they may perceive the risk reduction to be larger than it is objectively estimated to be. This
argument therefore infers that although actual risk and perceived risk may be different, in reality
WTP is affected by perceived risk. Also, different consumer groups will express different levels
of risk perception based on the fact that heterogeneity is present among consumers. Wang,
Halbrendt, Kolodinsky and Schmidt (1997) found that socio-economic factors were instrumental
in influencing WTP for rBST free milk, as lower educated individuals were willing to pay less
while those with higher incomes and those in urban areas expressed greater willingness to pay.
Tino and Klaus (2003) also examine the relationship between WTP and perceived risk. Their
article analyzed consumers’ WTP to avoid negatively perceived attributes (such as Genetically
Modified Organisms (GMOs) and rBST). The findings suggest that consumers’ perceptions of
the healthiness of functional foods are associated with their perceptions of the nutritional
qualities of the base product used in creating the final product. In essence, consumers’ attitudes
towards negatively perceived attributes such as GMOs and rBST will affect consumers’ view of
products with these attributes if they suspect the presence of these attributes, whether due to pure
speculation or revealed undeclared absence of these attributes.
17
Based on the literature highlighted to reflect the relationship between risk perceptions and WTP,
it can be concluded that there are many interrelated factors which influence consumers’ risk
perceptions and by extension WTP. Consumers therefore use different risk reduction strategies,
whether that entails paying more for certain attributes or paying to avoid some attributes, or by
seeking out additional information or avoiding some products all together. The likelihood of this
type of risk reducing behaviour being observed varies with the risk preference of respondents.
2.1.3 Individuals’ Values, Characteristics and Social Identity
In addition to the previous factors noted to influence consumers’ WTP, it is also believed that
consumers’ values and characteristics are also major contributing factors in determining WTP.
An individual’s values can be associated with their level of patriotism or ethnocentrism. Values
in this sense can influence consumers’ preferences for different product attributes and
particularly those associated with COO. Shimp and Sharma (1987) define ethnocentrism as a
bias towards domestic goods as opposed to foreign goods. It is believed that consumers’
domestic values may help to explain preferences for dairy products identified as being made
from 100% Canadian milk, as indicated by the 100% Canadian milk symbol, because they
identify with the symbol. Lantz and Loeb (1996) describe social identity as an individual's self-
concept that is influenced by membership in a social group and the value and emotional
significance the individual attaches to that membership. This section introduces some of the
literature that indicates a link between consumers’ values, perceptions and WTP and will focus
on those studies surrounding the theme of patriotic or nationalistic values.
Given that the 100% Canadian milk symbol can be considered as COO information, the value
that domestic consumers place on this attribute can be measured from this perspective. Patriotic
consumers are expected to value the 100% Canadian milk symbol more than other consumers,
given that patriotism can be defined as the positive sentiments and loyalty one feels towards a
country (Stearns, Borna, & Oakenfull, 2003). The WTP literature discussed in this section
suggests a possible connection between WTP, nationalism and social values. In this regard it is
noted that it is often the case that consumers exhibit a distinct preference for domestic goods as
opposed to foreign goods, and in some cases express a greater WTP for goods with domestic
18
attributes. This preference may be an indication of patriotism. However, Phau and Prendergast
(2000) refer to this type of preference as “ethnocentrism”.
Vassella, Fountain and Fountain (2010) distinguish and link ethnocentrism to patriotism by
describing the former as having a significant effect on the manifestation of patriotic attitudes and
purchase intentions. Similarly, Çakir (2008) explains the effect of ethnocentrism (which he
defined as consumer beliefs “about the appropriateness or morality of purchasing foreign‐made
products” (p.4)) on patriotic behaviour. Therefore the purchase of foreign products may be seen
as wrong (unpatriotic) if it is perceived to harm the domestic economy by having an adverse
impact on employment or on the profitability of domestic firms. It is also noted that
ethnocentrism will differ across brand and product category (Vassella, Fountain, & Fountain,
2010). Based on the preceding discussion, this research proposes that both terms can be viewed
on a continuum where ethnocentrism is at an extreme end, while patriotism lies somewhere in
the middle and un-patriotism lies at the other extreme2. Therefore ethnocentrism can be regarded
as extreme patriotic tendencies resulting in rejection of anything that does not belong to or that is
in direct support of given cultural and social values.
In an extensive report conducted by Heslop and Sprott (2007) (on behalf of Agriculture and
Agri-Food Canada) to investigate issues surrounding domestic and local food choices, it was
noted that there are several factors contributing to higher levels of domestic preferences. The
authors specifically highlighted two contributing factors: a strong nationalism tendency by the
general population, and a high degree of market openness. The noted preferences by consumers
for domestic products can be viewed broadly as the impact of consumers’ values on preferences
or more narrowly as a dimension of patriotism or nationalism.
On a similar note, Chen (2011), while examining the effect of COO and consumer patriotism on
brand strength, posits that as a result of consumers’ patriotism, there is a tendency for consumers
to have a higher evaluation of their own country’s products than would foreign consumers. As
2 In analyzing the results from this study no distinction will be made between ethnocentric consumers and patriotic consumers. Rather, there will be two groups-patriotic and indifferent consumers. Therefore extremely patriotic consumers (ethnocentric) will be classified only as patriotic consumers.
19
such, it would be expected that consumers’ patriotism will have a negative effect on attitudes
toward foreign products. Consumers having domestic preferences would therefore be more
willing to purchase a domestic good over a foreign good if the prices were within the same
range, in addition consumers with stronger preferences and higher incomes may even be inclined
to pay more for a domestic COO attribute like the 100% Canadian milk symbol.
Stearns et al. (2003) also broached the subject of patriotic values as it relates to preferences and
WTP for domestically produced goods as opposed to imported goods. The article discussed how
marketers capitalize on patriotic sentiments to differentiate brands and alter customer loyalty.
Specifically, it was noted that, after the September 11 2001 terrorist attacks in the United States
(US), there was a noticeable increase in sensational advertising such as “Made in the USA” or
“Proudly made in the USA”. These adverts signal the role of patriotism in inducing willingness
to purchase and by extension WTP. In addition, Loureiro and Umberger (2005) identify a general
perception held by consumers that products originating in their home countries are of higher
quality and also safer for consumption.
Froehlich, Carlberg and Ward (2009) examine Manitobans’ WTP for brand name fresh beef
products. The authors note in their WTP discussion that the desire for consumers to support their
domestic economy results in consumers’ general inclination to exhibit greater willingness to
purchase domestic products as opposed to those that are imported. In support of this theory,
Mahajan and Wind (2002) posit that purchasing decisions are influenced by emotions and that
brands that appeal to consumers’ emotions are more successful than brands that merely use brand
quality and attributes to sell the product (as cited in Froehlich et al. (2009) ). However it may be
faulty to suggest that brand, quality and other attributes are less important to some consumers,
since consumers may infer other quality cues such as product safety from COO information as
well. In fact, Grebitus, Menapace and Bruhn (2011) suggest that consumers’ assessment and use
of cues is influenced by many factors including perceived risk and socio-demographic
characteristics.
The preceding studies attempt to explain the general preferences exhibited towards domestic
products and how they affect WTP. It is noted that WTP often depends on whether or not the

20
product in question was produced domestically or has domestic associations. In essence, factors
affecting WTP can be summed up by noting the conclusions of Peng et al. (2006) in a study
examining Canadian consumers’ willingness to purchase Conjugated Linoleic Acid (CLA)
fortified milk products. According to the study, factors which may affect consumers’ purchasing
decisions, attitudes and product acceptance include product quality, price (attributes) and
consumers’ socio-demographics (which includes social characteristics - risk perception and
patriotism) or a combination of these factors.
2.1.4 A Review of Some Country of Origin (COO) Studies
In assessing consumers’ preferences for COO labelling Loureiro and Umberger (2005) assessed
consumers’ WTP for mandatory COO labelling of beef, chicken and pork chops displaying the
label “certified US”, and the role of socio-demographics in determining WTP for these products.
Responses obtained from 611 mail surveys in 2003 from US households were analyzed using
both a binary logit and random effects logit models. The findings indicated that although
consumers were concerned about food safety issues, WTP for COO labelling was very small but
exceeded the expected implementation costs associated with mandatory labelling. It was also
noted that socio-demographics was an important factor in determining WTP, as WTP was
different across consumer groups.
Lantz and Leob (1996) employ conjoint analysis to assess the value consumers from Canada and
the US place on domestic products as opposed to products from another country. Preferences
were defined in the context of ethnocentrism which implies that consumers will place more value
on goods from their country as opposed to goods from another country due to their strong
national social identity. In this context, the COO effect was explained from two perspectives:
where it is used as a quality cue (an additional credence attribute) and where it ignites a sense of
nationalism. However, the general analysis primarily focused on the country bias effect where
some consumers may feel the need to differentiate their group based on their social identity. The
group of respondents comprised 74 Canadian and 114 US undergraduate students. Respondents
were asked to choose between computer mouse pads from Canada, the US and Mexico. National
social identity was assessed using the Consumer Ethnocentric Tendency Scale (Cetscale) which
was first developed by Shimp and Sharma (1987). The results from both groups indicated a
21
strong COO effect in general. Furthermore, respondents with high ethnocentric tendencies were
less price sensitive. It was therefore concluded that for “low involvement products” with the
same prices, COO is important to all respondents. However, in a similar situation with higher
prices, respondents who were more ethnocentric were willing to pay higher prices while less
ethnocentric respondents were willing to switch to imported products.
Unterschultz, Quaragrainie, Veeman and Kim (1998) examine the importance of the COO of
beef products on buyers in the Korean hotel industry (specifically executive chefs and
purchasing managers). Perceptions and preferences for beef products from Canada, Australia and
the US were assessed through the use of a stated preference methodology (interviews).
Information was gathered from 43 respondents in 1995. The respondents were segmented into
three groups: Korean chefs, non-Korean chefs and purchasing managers. The results indicated
that the probability of choosing a beef product from US origin versus Canadian origin when the
price and quality is exactly the same differed across groups of respondents. Results from the non-
segmented model indicated that there is a 28% probability of a Canadian beef product being
chosen as opposed to a 49% probability of a US product being selected. While the segmented
model indicated that Korean chefs preferred Canadian beef products as opposed to non-Korean
chefs and purchasing managers who exhibited a preference for US beef products. A comparison
between Canadian and Australian beef products revealed there was a general preference for
Canadian beef products. The segmented model however indicated that while Korean chefs and
purchasing managers preferred Canadian beef products non-Korean chefs preferred Australian
beef products. These results imply that different groups have different preferences towards the
same products with an intended use to meet the same objectives. This is so because preferences
are influenced by attributes such as COO based on consumers’ perceptions. Particularly,
preferences may have been influenced by the chef’s experience with beef from different country
of origin.
Another COO study was conducted on beef by Quagrainie, Unterschultz and Veeman (1998). In
this study the authors sought to assess the effect of product attributes (origin information and
bio-preservation in packaging) and individual characteristics on the probability of purchasing
high quality beef cuts, high quality pork cuts and ground beef. Randomly selected households in
22
parts of western Canada (Alberta, Victoria, Winnipeg and Regina) were asked to complete a mail
survey. Data from 530 respondents (from a total of 700) was used in the analysis. Estimation was
conducted using the multinomial logit model. A combined model of the three products was
estimated, as well as separate models for each product. The results indicated that the effect of
“Alberta” was significantly stronger than the effect of “Canada” for high quality beef cuts. The
authors attributed this to the positive image associated with Alberta beef suppliers. As for pork,
the results indicated that consumers were indifferent to high quality pork cuts sourced in Canada
and Alberta but preferred domestic pork to pork imported from the United States, while ground
beef of Canadian origin was preferred to ground beef of Alberta origin. For the combined model,
results indicated that products from Canada or Alberta are generally preferred to fresh meat
products from the US or those without origin information. Respondents in general exhibited a
negative response to the bio-preservation attribute. In addition, demographic characteristics such
as age, family size and household income were noted to have an effect on a consumer’s meat
choice.
Volinskiy, Adamowicz, Veeman and Srivastava (2007) utilize an incentive based compatible
Becker-Degroot-Marschak auction to estimate willingness to pay for Canola oil with either
Canadian, US or no origin information explicitly labelled as either non-GM, GM or without GM
information. An international market company recruited 247 respondents from Edmonton and
the surrounding area. The experimental auctions were conducted at the University of Alberta
between October and November 2005. At the beginning of the auction, respondents were
endowed with a Canola oil with either a US or Canadian origin. Respondents were allowed to
bid to exchange their endowed oil for either one other alternative or two alternatives in order to
test for format effect. The results indicate that participants are willing to pay an additional $0.30-
$0.50 per litre for Canola oil of Canadian origin relative to Canola oil imported from the US.
The preceding studies indicate the importance of the COO attribute in consumers’ purchase
decisions and willingness to pay; these studies indicate that consumers may be inclined to pay
for the COO attribute for a variety of reasons. In general, it can be observed that COO is a very
important attribute in influencing consumers’ choices.

23
2.2. The Issue of Co-branding
This section incorporates co-branding into the discussion under the premise that in addition to
being a COO label the 100% Canadian milk symbol represents a brand. The discussion
commences with a simple definition of co-branding then the different types of co-branding are
highlighted, followed by a discussion of perceptions toward co-branded products and the
implication for products co-branded with the 100% Canadian milk symbol.
2.2.1. What is Co-Branding
Co-branding is generally regarded as the combination of two or more brands to market a product
or service (Leitch & Davenport, 2007). So what is a brand? While several definitions of a brand
can be found in the literature (De Chernatony & Riley, 1998)3, Chen (2011) adopts the definition
of a brand from the American Marketing Association to mean “a name, term, sign, symbol or
design or combination of them, intended to identify the goods and services of one seller or group
of sellers….” (p.1). Hence meaningful insights can be garnered from the co-branding literature as
Dairy Farmers of Canada uses the 100% Canadian milk symbol to identify and market dairy
products. Co-branding can be effectively used to achieve different marketing objectives such as
increasing sales in existing markets (market penetration) or facilitating the marketing of products
in new markets (market development). Ultimately, the expected benefits of co-branding reside in
promoting the marketability of products by creating a double appeal. A double appeal is created
as each partner brand capitalizes on the other brand in an attempt to achieve immediate
recognition and positive evaluation from potential customers (Chang, 2008).
2.2.2. Types of Co-Branding
Two main types of co-branding are described in the co-branding literature: vertical co-branding
and horizontal co-branding. Vertical co-branding defines situations in which the producer of an
input ingredient co-brands with a producer of a final product, for example a wheat company
aligning with a bakery, or a hog farm with a restaurant. In the context of the current study,
vertical co-branding is evident when 100% Canadian milk is used as an ingredient in ice cream 3 Taking into consideration the plethora of definitions for “brand” These authors identified 12 main themes seen in the literature that they believe accurately describe a brand: 1) legal system,2) logo, 3) company, 4) shorthand, 5) risk reducer, 6) identity system, 7) image in consumers’ mind, 8) value system , 9) personality, 10) relationship, 11) adding value, 12) evolving entity

24
(dairy farmers aligning with processors). Because this type of co-branding constitutes the use of
an ingredient to complement a consumer product, it is also known as ingredient co-branding. On
the other hand, there is also horizontal co-branding which exists when producers at the same
production stage combine two or more brands into a single product (Helmig & Leeflang, 2008).
An example of this would be Nike and Air Jordan or store brand milk with the 100% Canadian
milk symbol. This thesis therefore examines the impact of both vertical and horizontal co-
branding in the context of the Canadian dairy industry.
2.2.3. General Perceptions toward Co-Branded Products
Nunes, Dull, and Lynch (2003) advocate that co-branding is a tool that is becoming increasingly
important in generating additional value as it helps to create awareness and build loyalty.
Similarly, Mahajan and Wind (2002) suggest that brands that appeal to consumers’ emotions
rather than the “head” (logic) are likely to gain product positioning in the market. It is more
likely for a brand that has gained product positioning to successfully achieve increased market
share by co-branding with another brand. According to Mahajan and Wind, consumers who have
an emotional link with a brand are less likely to be price sensitive so long as they continue to
derive their emotional satisfaction from the brand.
Co-branding can either create value for a product or result in brand devaluation as it can either
result in positive or negative brand perceptions. Specifically as it relates to this thesis, consumers
may have a positive attitude towards products with the 100% Canadian milk symbol in general.
However, consumers’ perceptions of milk or ice cream with the 100% Canadian milk symbol
may differ depending on the product brand with which it is associated. For example if a
consumer dislikes store brand milk, co-branding that milk with 100% Canadian milk symbol
may change their perception of the final product.
As it relates to two or more different brand labels on a product, (for co-branding purposes) it is
possible that in some cases quality cues (inferred from brand information) may be used as
substitutes for one another. Therefore, consumers may not express greater WTP for a co-branded
product if two strong brands combine (provided that the strength is an indication of how
established a brand is and how well it is liked by consumers) because the overall perception of
25
the product may not change. On the other hand, it may be more beneficial for a weaker brand to
co-brand with a strong brand as this may create added value from the perspective of the
consumer and therefore greater WTP, as in the preceding example between store brand milk and
the 100% Canadian milk symbol. This thesis will show whether the 100% Canadian milk
symbol is a substitute for store brand or national brand labels. Also, the relationship between
organic labels and the 100% Canadian milk symbol will also be assessed.
Branding, and by extension co-branding, can result in beneficial marketing as it creates a means
of product differentiation. In a study conducted by Innes, Kerr, and Hobbs (2008) assessing how
marketers can use country branding as a means of product differentiation, clear distinction
between a logo and a brand is also made. It was suggested that a brand entails more than just the
physical attributes of a product, but more so its intrinsic characteristics such as reputation
associated with the brand, as opposed to a logo which is just a physical label. It is therefore
asserted that the demand for dairy products co-branded with the 100% Canadian milk symbol
will be affected by consumers’ perceptions based on its intrinsic characteristics such as what the
symbol signals to Canadian consumers. In this sense, the 100% Canadian milk symbol can be
considered as more than a physical logo given that the presence of the symbol communicates
additional information relating to country of origin and the production process of milk in dairy
products. As such, it can be reasoned that the 100% Canadian milk symbol embodies elements of
a brand; therefore relevant insights can be garnered from the co-branding literature.
2.2.4. Advantages and Disadvantages of Co-Branding
Both advantages and disadvantages flow from co-branding. As previously indicated, co-branding
can either result in positive or negative perceptions. Helmig and Leeflang (2008) note a possible
advantage with product co-branding in that it provides customers with a greater product
assurance resulting in higher customer evaluation. This could imply that benefits resulting from
co-branding are purely positive. However, it is also possible that co-branding can have negative
implications. For example, while it can be theorized that combining the 100% Canadian milk
symbol with another brand symbol creates positive customer evaluations for these products, it is
also possible that negative brand perceptions can also be associated with the partner brand. A
potential downfall could stem from the level of increased product uncertainty consumers develop
26
due to the brand alliance (Geylani, Ter Hofsted, & Inman, 2005). In addition, Nunes et al. (2003)
posit that co-branding can suffer from “dilution” - which occurs when a brand loses its meaning
to customers. Negative actions of a partner brand can also damage the reputation of the
associated brand(s). On a positive note, co-branding may help to increase the customer base,
thereby strengthening the competitive position that a products holds in the market.
2.3. International and Domestic Co-Brands with Canada
2.3.1 The Brand Canada Initiative
There is a general Canadian branding initiative that generically promotes Canadian foods and
agricultural products both domestically and internationally (Agriculture and Agri-Food Canada,
2012b). The domestic branding initiative serves to assist both consumers and suppliers -
domestic consumers benefit from being able to distinguish domestic retail products from
imports, based on the premise that domestic consumers prefer domestic products to imports.
Domestic producers and processors also benefit from this initiative through free membership that
allows them to be more recognizable as Canadian. On the international front promotional
campaigns are being undertaken in strategic priority markets such as Japan, Mexico and South
Korea through advertising, in-store and restaurant promotions and foreign-language web-sites.
Tools used in the branding process includes: taglines, graphics (such as the Canadian maple
leaf), and brand promise (Agriculture and Agri-Food Canada, 2012a).
The international branding efforts help to identify Canadian ingredients in processed products
and build recognition for Canadian brands in international markets by selling Canada’s country
image. International producer/processors can use the Canada brand graphics under certain
conditions. According to Agriculture and Agri-food Canada the graphics can only be used if “the
ingredient being promoted is 100 percent Canadian and is one of the first two ingredients listed
on the product's label; or is a feature ingredient of the product; or is an iconic Canadian food or
agriculture ingredient, (maple syrup, salmon, ice wine)” (Agriculture and Agri-Food Canada,
2012a). Agriculture and Agri-Food Canada also states that in order for international
organizations to take advantage of the co-branding partnership a co-branding agreement must
signed by a Canada Brand member who will be able to verify the provision of the Canadian
ingredient and the non-Canadian co-branding partner using it.
27
Domestic companies using Canadian ingredients in their products have recognized that there is
additional marketing advantage that can be derived by explicitly highlighting this information as
a means of differentiating their products from those of imports. In seeking to capitalize on this
branding strategy, some domestic organizations have even implemented marketing strategies on
provincial levels for further differentiation. For example “Foodland Ontario” is a long standing
provincial branding initiative that generically promotes the consumption of both fresh and
processed Ontario agricultural products. More recent branding initiatives include “Wild Rose
Meats”, which markets Alberta’s Bison both locally and internationally (Alberta Livestock and
Meat Agency (ALMA), 2012) Since the aim of this study is to ascertain how domestic
consumers respond to a Canadian COO attribute (domestic) on their dairy products, it is
important to evaluate the current general perceptions held by domestic consumers about Canada
and Canadian brands. The following section examines evidence from past studies.
2.1.1. Indicators of Domestic Perceptions
A 2005 survey conducted in Canada by Ipsos Reid, using 414 respondents entitled “What Do
Customers Really Want”, confirmed that health and safety have become particularly important to
Canadian consumers. In addition 90% of the consumers surveyed expressed the belief that foods
produced in Canada are safe. Canadian food is also associated with high quality which,
according to the survey, is mainly associated with freshness, nutritional value and safety
(Johnson, 2005).
In 2011 a survey of Canadian customers conducted by Agriculture and Agri-Food Canada found
a high percentage of Canadian consumers have confidence in products made in Canada (96
percent) and viewed these as relatively superior. Interestingly though, a relatively smaller
percentage (41 percent) of consumers responded that they would be willing to pay a premium for
these products. In addition, 95 per cent of consumers were more willing to purchase locally
produced goods, but of these consumers only 43 per cent indicated that they were willing to pay
more. These WTP estimates were affected by consumers’ personal association with agribusiness
(suggesting that whether or not individuals were associated with the agriculture industry affected
their WTP) (Agriculture and Agri-Food Canada, 2011).
28
As cited in Heslop and Sprott (2007), a study conducted by Heslop and Wall (1986) indicate that
that some Canadian consumers expressed WTP a premium for domestic products. The
respondents who expressed this willingness indicated that their decision was influenced by the
advantage that this would provide for the Canadian economy, Canadian workers and that it was
also driven by national pride. It is also noted that domestic bias is not unique to Canada but also
evident in other countries.
In light of the previous discussion it is believed that domestic consumers will in general exhibit
positive preferences towards products with the 100% Canadian milk attribute. The preference
magnitudes are however expected to vary based on consumer characteristics such as their levels
of patriotism and risk perceptions. In addition, given that Canadian consumers expressed price
sensitivity, it is also anticipated that WTP estimates will be conservative regardless of strong
preferences for the Canadian brands.
In addition to domestic producers, international companies have also sought to capitalize on the
general positive perceptions of Canada as a country and Canadian brands, by co-branding with
various Canadian brands. A case in point: Yeo is a Malaysian company well known for
producing a high quality soy drinks, this company sought to make the fact known that it uses
100% Canadian Soybeans to produce its soy drink. This company has signed a co-branding
partnership agreement with the Canadian Soybean Exporters' Association allowing the use
Canada brand graphics on its products to indicate that they are made from non-GMO Canadian
Soybeans. (Yeo Hiap Seng, 2008) In addition, another company, Guchuan Food Company from
China and Ecuador's Moderna Alimentos flour company both market co-branded products made
from Canadian wheat under the Canadian Wheat Board co-branding program (Canadian Wheat
Board (CWB), 2011)
In some cases, co-branding can be a beneficial strategy, but it depends on the specific product
and the companies involved. As it relates to Canadian co-brands, it is noted that there is a general
positive perception towards Canada as a country and that there are potential and realized benefits
29
in co-branding with Canadian brands both domestically and internationally. Although co-
branding opportunities exist for Canada as a whole, it can be reasoned that the co-branding
potential is particularly feasible in industries where Canadian products or ingredients have
unique attributes in comparison to other competitors. With this being said the discussion now
turns to the Canadian dairy industry which employs unique production and marketing practices
relative to most other countries.
2.4. The Canadian Dairy Industry
The dairy industry dominates a large share of the agricultural sector in Canada and ranks third
behind the grain and red meat sectors in terms of value of sales. Furthermore, it represents over
15% of the Canadian food and beverage sector with respect to sales (Canadian Dairy Information
Centre (CDIC), 2012a). In the Canadian dairy sector, there are two markets for milk: the fluid
milk market and the industrial milk market. The former includes table milk and fresh cream,
while the latter speaks to the portion used to manufacture dairy products such as cheese, butter
and ice cream. Milk supplied to the fluid milk market receives a higher return than milk supplied
to the industrial market as industrial milk is derived from the excess of fluid milk.
The Canadian dairy industry has experienced several changes over the years, but still remains a
strong sector. The dairy processing industry is highly concentrated and dominated by three
companies that control (process) 80% of the fluid milk market and control 15% of the existing
dairy plants (Canadian Dairy Information Centre (CDIC), 2012a). As of 2010, the Canadian
dairy cattle population totaled approximately one million milking cows located on 12, 9654 dairy
farms, which reflects a 33% contraction in the number of farms over a 10 year period. Despite
the reduction in the number of existing farms, this has not adversely affected production, perhaps
due to advances in technology and genetics. Instead, supply has remained stable under the supply
management system governing the industry. The contraction in the number of farms merely
indicates greater concentration as existing farms get larger (Canadian Dairy Information Centre
(CDIC), 2012a) Eighty-two percent of the dairy farms are located in Ontario and Quebec
(Canadian Dairy Information Centre (CIDC), 2012c). Statistics made available from the CDIC
4 See Appendix C for a breakdown.

30
shows that the fluid milk market (table milk and fresh cream) represents 39% of milk production,
while the market for manufactured dairy products such as butter, cheese, yogurt and ice cream
accounts for 61% of production (Dairy Farmers of Canada (DFCa)).
The dairy industry in Canada is supply managed. Supply management is based on three pillars:
production management, import controls, and a pricing mechanism. Production management
deals with the allotment of production quotas to producers, while import controls limit the
quantity of dairy products imported. A pricing mechanism sets the price that producers receive
for milk. Import controls that have been instituted lead to very limited imports, in 2012 total
dairy imports valued approximately 5% of the value of the dairy industry (677 million versus
13.7 billion) (Canadian Dairy Information Centre (CDIC) 2012a; Canadian Dairy Information
Centre (CDIC), 2013). Imported dairy constituents go directly into processed dairy products. As
such, all milk (with the exception of chocolate milk) sold in Canada is 100% Canadian milk.
With this being said, it might be intuitive to conclude that WTP for milk with the 100%
Canadian milk symbol should be zero. However, this assumption can only be made on the
premise that consumers have perfect information (all know and trust that all fluid milk sold in
Canada is produced in Canada), and that factors affecting WTP are all known and observable. To
ascertain whether consumers are fully informed, questions relating to “industry knowledge” were
also included in the surveys that were administered. The results from these questions will help to
determine if attitudes toward products with the 100% Canadian milk symbol as opposed to those
without the symbol is partially driven by “lack of knowledge”.
2.4.1 Trends in Dairy Product Consumption
Consumers are constantly updating their beliefs about desirable food attributes, which often
translates into changes in demand based on consumers’ taste and preferences. Peng et al. (2006)
posit that consumer preferences for dairy products change with medical research findings and
media exposure. In recent years, there has been a growing market for functional food products
aimed at meeting the demand of “health conscious” consumers. Specific evidence of the
emergence of functional products in the dairy industry can be seen in the form of probiotic
yogurts, omega-3 products and organic milk products, to name a few. At the same time products that
31
were common among consumers such as 3.25%, 2% milk and ice cream have seen a falloff in
demand (Dairy Farmers of Canada (DFCb)).
Information obtained from the CDIC website indicates that between 1992 to 2011 there has been
a downward trend in the consumption of 3.25% and 2% fluid milk which declined by 36% in this
period. On the other hand, the consumption of 1% and 0% milk increased by 55% in the same
period. However, when all categories are taken into consideration, there has been a 19% decline
in fluid milk consumption throughout the period. Ice cream consumption also declined by 56%
over the same period. On the other hand, the consumption of yogurt has increased over the same
period by 191% (Canadian Dairy Information Centre (CDIC), 2012a). The observed trends could
perhaps be a result of the increasing demand for healthier alternatives. For example probiotic
yogurts have been recently gaining in popularity and products are now widely available. Indeed,
Agriculture and Agri-Food Canada attributes the shift in consumption patterns to consumers’
increased awareness and health consciousness, with a shift toward dairy substitutes associated
with health benefits such as soy milk and rice milk (Agriculture and Agri-Food Canada, 2009a).
While milk has always been popular among consumers, these products are relatively new on the
market. In addition, some consumers may have changed dietary patterns which could account for
the decline in milk consumption, since some consumers may believe that these substitutes are
healthier alternatives to conventional dairy products. Growth in the sales of this category may
also reflect changing demographics and taste preferences.
2.5 Chapter Summary
This chapter has provided the ground work on which this thesis is based by first looking at some
of the underlying factors influencing consumers’ preferences and WTP. The three main
contributing factors include product attributes, risk preferences and consumers’ values. These
attributes were subsequently discussed in the context of credence, search and experience
attributes and the relationship between these attributes was highlighted. The concept of co-
branding was also introduced and explored in the context of this study by positing how the 100%
Canadian milk symbol relates to co-branding and the possible cost and benefits arising from co-
branding. The Canadian dairy industry was also examined in the context of changing markets
and consumer preferences. The chapter concluded with indications of how the country of origin

32
brand “Canada” is perceived. The following chapter will explore the theoretical framework and
explain the research methodology used in assessing consumers’ preferences and WTP for the
100% Canadian milk symbol.

33
Chapter 3: The Theoretical Framework & Research Methodology The chapter presents the theoretical framework on which this study is based. In addition,
specifics relating to the research methodology employed and the survey design process are also
discussed. Specifically, distinctions are also made between the types of data from which WTP
values can be elicited. Decisions relevant to designing the survey are also discussed.
3.1. Conceptual Model
The research model and the analytical framework are founded on the premise that consumers’
attitudes towards the 100% Canadian milk symbol and their individual preferences and
characteristics influence their purchase decisions towards dairy products with the symbol.
Therefore based on the discussion in Chapter 2, a simple conceptual model is derived and
presented in Figure (3.1). Figure (3.1) illustrates the interrelationship between the main areas
noted as being influential in consumers’ perceptions and WTP. The framework suggests that
WTP is determined by: 1) product attributes and, 2) individual factors or characteristics. Peng et
al. (2006) propose that factors influencing consumers’ attitudes and acceptance of a new product
may include product quality attributes, price, as well as consumer socio-demographics, and
possible interactions between these factors. This study proposes that the same variables influence
preferences for milk and ice cream with the 100% Canadian milk attribute.

34
Figure 3.1: Conceptual Framework
Source: Created by author.
3.1.1. Product Attributes
In accordance with Lancaster (1966), consumers are hypothesized to derive utility from the
attributes of the products they purchase and consume. Additionally, it is assumed that consumers
make decisions based on utility maximization subject to their budget constraint. From this
perspective, it can be deduced that product attributes influence perceptions and by extension
determine WTP.
When dairy products are taken into consideration, several possible attributes may affect
perceptions. These attributes may be important to consumers in varying degrees and in different
combinations. Although some attributes may be considered more important than others, it can be
reasoned that intuitively no single attribute will determine if a good is purchased even though the
relative importance of a particular attribute may dominate. The combined attribute value must be
higher than a minimum level acceptable to that individual. For example, a consumer who places
Willingness - to - pay
Product Attributes
Individual Values and
Characteristics
Ex trinsic Intrinsic
Risk Perception
Social Characteristics
Patriotic Values
Product Perception
35
high value on the COO attribute, may be willing to pay a premium for goods from a specified
origin, however, a deficiency in another attribute may lead to erosion in the expressed WTP for
this particular product. Therefore it is expected that consumers will give preference to one
product over another if the “value” of attribute combination is greater than that of other products.
As depicted in Figure 3.1, product attributes can be characterized as either intrinsic or extrinsic.
Latvala (2010) distinguishes between extrinsic and intrinsic quality cues by defining the former
as those associated with product but not an integral part of the physical product itself. Similarly,
Zeithaml (1988) proposes that extrinsic cues are general (non-product specific) and can serve as
indicators of quality across all types of products. Based on this distinction, cues related to origin,
seals of approval, advertising and pricing information can be classified as extrinsic to the product
in question. These cues merely offer a basis by which consumers gain information and can also
assist in formulating perceptions of food safety. On the other hand, intrinsic cues are an integral
part of the product. These may include taste and the generally functionality of the product. When
consumers are unable (or unwilling) to invest time to infer intrinsic properties at the point of
purchase they rely on extrinsic cues such as brand name and package to form quality perceptions
inferred regarding intrinsic properties (Zeithaml, 1988). The 100% Canadian milk attribute can
be categorized as an extrinsic cue. Therefore, consumers purchasing a dairy product may infer
something about a product with the symbol because of what the symbol signifies to them.
Consumers’ perceptions of product attributes assist in their arrival at a final decision about what
product to choose. In today’s market, there exists a variety of products with small but significant
distinctions such as brand, packaging and origin information. These differences can create value-
added in the minds of consumers as they seek to maximize utility. The different preferences that
exist for attributes suggest that consumers are heterogeneous by nature and this is exemplified in
their choice behaviour. Therefore individual factors contribute significantly to attribute
preference and, by extension, WTP.
3.1.2. Individual Factors
The conceptual model shows that there are several interrelated dimensions comprised in
“individual factors” that impact preferences. These factors include: 1) an individual’s level of
36
risk perception/ risk preference, 2) an individual’s value system, and 3) social and economic
factors (such as age group, education level, income level). Based on economic theory, an
individual’s taste and preferences are key factors influencing choice. Risk perception is also
important in determining choice, and may be affected by an individual’s socio-economic
characteristics such as age, and education level (Wessells & Anderson, 1995) as well as product
attributes including COO information (Lobb, 2006). As seen in Figure 3.1, and discussed in
Chapter 2, both product attributes and individual factors act in concert to influence the
perceptions of a product, which consequently determines consumers’ WTP, ceteris paribus.
3.2. The Combination of Product Attributes and Individual Factors:
Implications for WTP for Dairy Products Co-Branded with the 100%
Canadian milk Brand
In general, a product co-branded with the 100% Canadian milk brand may be perceived as
“better”, as it could be thought of as creating added value to the final product from the
perspective of the consumer. The source of added value could be as a result of consumers’ views
of the 100% Canadian milk attribute given that this milk is marketed as fresh, safe to consume
and hormone free. Under the assumption that these claims are true, products labelled as being
made from 100% Canadian milk constitute potentially desirable attributes to Canadian
consumers. According to Heslop and Sprott (2007), who summarized 17 studies previously
conducted between 2001 and 2007, on Canadian attitudes and perceptions towards foods,
freshness, safety and origin are some of the most desirable attributes to Canadians. These
attributes represent the main characteristics used in promoting dairy products with the 100%
Canadian milk symbol.
3.2.1. Food Safety Component
With food safety being a primary concern for consumers as a whole, Canadian consumers who
purchase 100% Canadian milk products may have reason to believe that they are purchasing
safer products. This is especially true for consumers that have confidence in the Canadian
production system, believe in marketing claims and are particularly interested in Canadian
brands.

37
The 100% Canadian milk branding initiative is anchored by programs such as “Canadian Quality
Milk”. This HACCP-based5 on-farm food safety program was developed by the Dairy Farmers
of Canada and is certified by the Canadian Food Inspection Agency (CFIA) (Canadian Dairy
Information Centre (CDIC), 2012b). The “Quality milk program” primarily aims to keep track of
a dairy farmer’s actions to prevent and minimize the risk of exposing food to safety hazards. This
process entails strict guidelines concerning quality and cleanliness- quality as it relates to the
composition of the milk, and its maintained temperature and cleanliness as it relates to the
general product surrounding including the animals. There are also guidelines in place for the
transportation system and distribution of the milk (Dairy Goodness.ca). In light of these industry
initiatives, incorporating the 100% Canadian milk symbol in a product’s label could act as a risk
reduction signal for consumers.
Though the 100% Canadian milk symbol unambiguously signifies that a product contains milk
produced by Canadian farmers, the absence of this symbol could imply to consumers that the
product is made from imported milk ingredients (Dairy Goodness.ca). If consumers are not
interested in the 100% Canadian milk symbol as a risk reduction strategy the symbol may still
appeal to consumers because of their values and beliefs surrounding origin information. Thus,
products co-branded with the 100% Canadian milk attribute may appeal to consumers who are
patriotic and therefore have an innate desire to support domestic industries. An individual with
this type of characteristic (patriotism) will experience increased utility from choosing a product
with the 100% Canadian milk symbol as opposed to choosing one without the symbol.
Based on the theoretical framework, in the context of the 100% Canadian milk symbol the
following hypotheses are posited:
Health Hypothesis: Health conscious consumers will have a higher WTP for products with the
100% Canadian milk symbol than respondents who are less health conscious.
Values Hypothesis: Respondents with high domestic values will be willing to pay a premium
for ice cream and milk with the 100% Canadian milk symbol
5 Hazard Analysis and Critical Control Points.
38
Risk Hypothesis: Respondents who are relatively risk averse will have a greater WTP for
products with the 100% Canadian milk symbol.
3.3. The Impact of Preferences: Assessing Willingness to Pay
Based on the objectives of this thesis it is important to assess how consumers’ preferences are
affected when milk and ice cream are co-branded with the 100% Canadian milk symbol. By
doing so, factors affecting WTP can also be assessed. WTP is a metric used to evaluate
preferences. There are two approaches to gathering data used in estimating WTP: revealed or
stated preference methodologies. Revealed preference data is derived from real life or market
data and is based on actual purchases. Revealed preference data can be obtained from scanner
information or market observation. On the other hand, stated preference data is obtained via
survey questions (hypothetical questions) in which individuals are asked to imagine that they are
choosing between competing alternatives whether different products or services (car, bus, train)
or between a product differentiated by attributes (conventional, organic). Stated preference
studies can also allow for an examination of hypothetical trade-offs between goods that do not
currently exist in the market. Stated preference methods include survey data or data obtained
from an auction experiment.
A stated choice approach in the form of survey data is used to assess WTP in this study.
Obtaining actual purchase information would have proved more costly and time consuming. In
addition, using the revealed preference method would have been potentially restrictive as it
relates to obtaining information on attitudes, risk preferences, purchase habits and household
characteristics and respondents’ domestic values. The stated preference method proved the better
alternative in this case as it better accommodates the research objectives. Specifically the discrete
choice experiment applied in this thesis facilitates observation of respondent’s choice between
different attribute combinations. It also allows the unique assessment of attribute trade-offs at
different prices and therefore an assessment of relative attribute values. For these, among other
reasons the stated preference method is employed over the revealed preference method. The
stated preference method approach involves a respondent’s hypothetical decision to purchase
milk and ice cream with or without the 100% Canadian milk attribute.

39
3.3.1 Types of Stated Choice Approach
There are several stated preference methods that can be used to assess preferences for different
product attributes and elicit WTP estimates: these include Contingent Valuation (CV),
experimental auction, conjoint analysis and discrete choice experiments (a variant of conjoint
analysis). Of these methods CV, conjoint analysis and discrete choice experiments appear to be
most widely used. On the other hand, hedonic price and travel cost methods constitute revealed
preference data.
The CV technique is appropriate for eliciting WTP measures for goods not traded in the market
(non-market goods) such as natural resources (lakes, ponds, air quality) and nature in general
(wildlife and forestry). This method employs a direct approach to eliciting WTP values, in that
respondents are directly asked to indicate their WTP by stipulating a specific monetary value. On
the other hand, respondents can also be asked how much they would be willing to accept to
forego an existing resource or product attribute. In a similar way, experimental auctions elicit
WTP values by mimicking real life market situations where buying and selling occurs and
allowing respondents to bid for real items with real money to obtain their preferred attribute(s).
Conjoint analysis and discrete choice experiments are however less direct in comparison to CV;
with conjoint analysis, WTP estimates are deduced from respondents’ indirect responses.
This study employs a discrete choice method in the form of a survey. The survey collects
information on a range of issues which helps the analyst to better get to know the respondent as
an individual and evaluate their personal preferences and attitudes. The questions used to assess
willingness to pay are rather indirect, where respondents implicitly indicate their willingness to
pay by trading between alternatives with varying attributes at different prices. The section of the
survey geared towards assessing willingness to pay is known as a choice experiment.
There have been debates about the pros and cons associated with stated preference methods as
opposed to revealed preference methods; see for example Adamowicz, Louviere, & William
(1994) and Morikawa, Ben-Akiva & McFadden (2002). One major shortfall is noted with stated
preference methods as opposed to revealed preference methods. Two major advantages of stated
preference methods are also noted. The major disadvantage of stated preference methods stems
40
from the fact that respondents are presented with hypothetical questions and may answer
differently than they would if they were faced with a real life situation - in that their choices are
non-binding. This can create what is known as hypothetical bias. Manski (2000) however posits
that a well-designed, survey can avoid many potential problems, therefore implying that the
upside offsets the downside.
Despite the noted disadvantage of stated preference methods, one major advantage is evident
from the fact that experiments are not limited to existing products and by extension product
attributes. Therefore, experiments can be modified to accommodate as many attributes as
deemed appropriate by the researcher, both for existing products and those that are not yet on the
market. By incorporating product attributes that are already on the market, stated preference
methods can be used to evaluate consumers’ desired product improvements and assess their
preferences for attribute modifications. Similarly, for products not yet on the market, stated
preference methods can be used to test potential product acceptability, viability and success by
evaluating consumers’ openness to this new product. Another major advantage is that, unlike
revealed preference data, stated preference data provides panel-like data in a single cross-section
(Louviere, Hensher, & Swait, 2000) as it provides more observations from which consumers’
preferences can be evaluated from one set of survey questions.
Another unique advantage of the stated preference technique is that it allows the analyst the
flexibility of eliciting information regarding preferences for specific attributes of the good (“part
worth” utility) in question as opposed to being limited to eliciting preferences for the good as a
whole. Owing to this advantage, stated preference methods, and specifically discrete choice
analysis, have been widely used to evaluate consumers’ preferences for various product
attributes. Several notable authors have employed this method in their work as seen in the
literature review section.
3.4. Designing the Discrete Choice Experiment
In designing a stated preference survey, there are several factors that should be considered. These
factors are discussed concurrently with how the surveys used in this research were designed.

41
This thesis employs a discrete choice experiment, which in essence, is a type of conjoint analysis
representing a combination of conjoint analysis and discrete choice theory. The overall intent of
discrete choice studies is to elicit consumers’ preferences from choices that are made between
different attributes or product alternatives from hypothetical scenarios. The structure of a discrete
choice study is such that it comprises a set of hypothetical questions, each of which is composed
of different alternatives representing different attribute combinations. Consumers’ preferences
are evaluated based on the trade-off between attribute levels among the different alternatives in
each hypothetical scenario. An attribute level refers to a specific characteristic of an attribute, for
example, the attribute “colour” could have levels such as blue, green, red, pink etc.
In this experiment, attributes and attribute levels are varied to present respondents with different
treatment combinations (profiles/alternatives). The combination of two or more profiles is
referred to as choice sets. In this thesis, each choice set is comprised of three profiles
accompanied by a no-choice option, therefore each choice set is effectively comprised of four
alternatives from which respondents choose. The questions included in the surveys were posed in
a behavioural choice context “imagine that you are shopping for milk (ice cream) the alternatives
below are the only ones available, select the one that you would choose”. Respondents were
allowed to choose only one of the existing alternatives and only then could they move on to
another choice context that basically entailed similar alternatives. Respondents were unable to
view or change a choice that was previously selected. Respondents were allowed to choose the
no-choice alternative if they were dissatisfied with the available. In order to mitigate hypothetical
bias respondent were briefed with a cheap talk script. This is generally used as a means of
informing respondents that the analyst is aware of the possibility that they may not reflect their
true preferences through their choices. Emphasis is placed on the importance of respondents’
hypothetical choices being reflective of their true preferences.
3.4.1 Labelled versus Unlabelled Experiments
In general, stated choice experiments can be either labelled or unlabelled. A labelled choice
experiment, as the name suggests, is comprised of alternatives distinguished by names or labels.
For example, if one was interested in assessing consumers’ preferences for different modes of
transportation, the alternatives could be labelled as car, bus, train, plane, etc. Therefore, a
42
labelled choice experiment allows respondents to infer information that has been omitted from
the included attributes but can be deduced from the alternative label. Unlabelled designs avoid
this issue because they are comprised of alternatives where the alternative labels offer no
meaning to the alternative itself, and therefore do not influence choice. In essence, each
alternative is merely a combination of attribute levels and the respondents’ choice of alternative
is solely based on the combination of attribute levels offered. The label associated with the
alternative offers no meaningful insight in the potential utility of the alternative itself. An
example would be choice alternatives labelled as A, B, C and D from a four alternative choice
experiment.
This thesis employs an unlabelled choice experiment. As indicated, the choice experiment
consists of four attributes with attribute levels 2, 2, 2, 4 (as seen in Table 3.1) and four
alternatives. The attributes and their levels were allowed to vary between alternatives except the
alternative specific constant (ASC), which was specific to the fourth alternative and remained
constant. The fourth alternative represented the “opt out” option included in the survey as “I
would not choose any” which gave respondents the opportunity not to select any of the available
combination of attribute levels (profiles). The fourth alternative represents a realistic option that
consumers face on their shopping excursions as they are not obligated to make a purchase if they
do not like the available alternatives. From an economic perspective, the ASC captures the
average effect on utility of all factors that are not included in the model, similar to the constant
used in a general regression model (Kjaer, 2005). Therefore, to avoid the dummy variable trap,
the constant is excluded because of the inclusion of the ASC in the regression analysis.
The number of profiles in an unlabelled design can be represented by 𝐿𝐴. While that of a labelled
design is represented by 𝐿𝑀𝐴, where L represents the number of levels, A, the number of
attributes and as it relates to the labelled design, M represents the number of alternatives. This
study employs a design comprised of 32 choice sets. The choice sets were divided into four
blocks of 8. Each respondent was assigned to one block. As far as possible, blocks were assigned
to an equal number of respondents. Each respondent was given a total of eight choice sets to
complete in order to reduce the risk of fatigue, which is expected to be positively correlated with
the number of choices respondents make.
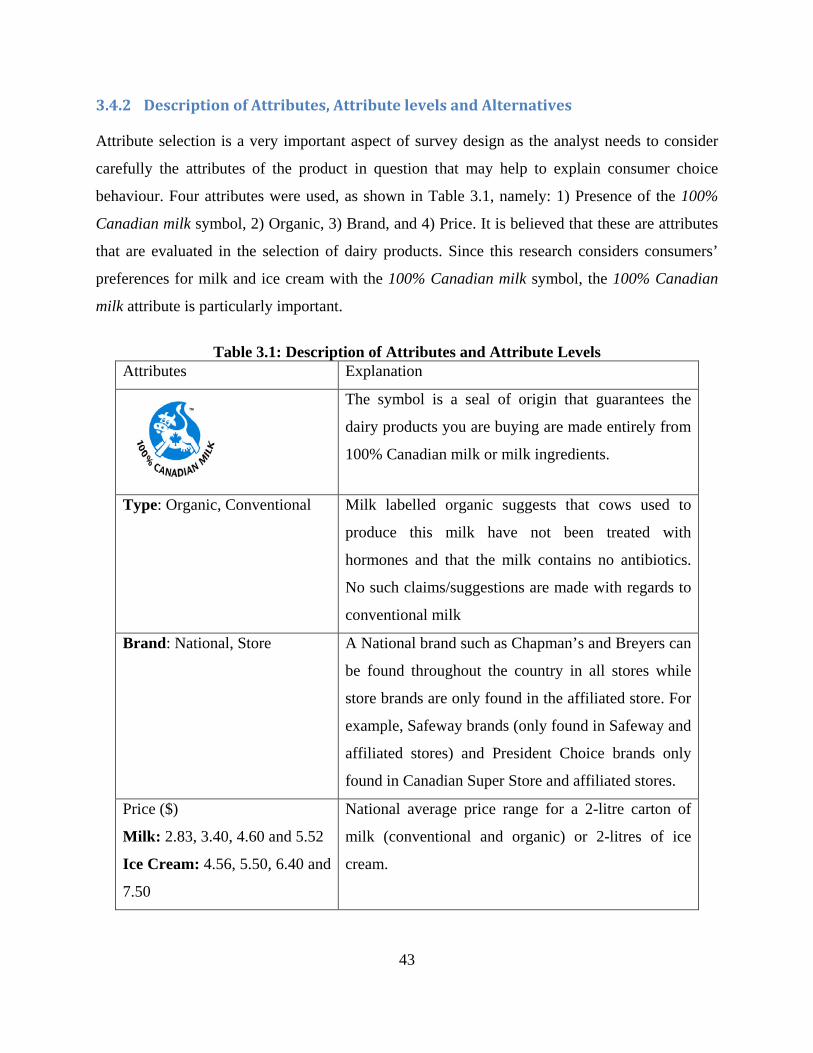
43
3.4.2 Description of Attributes, Attribute levels and Alternatives
Attribute selection is a very important aspect of survey design as the analyst needs to consider
carefully the attributes of the product in question that may help to explain consumer choice
behaviour. Four attributes were used, as shown in Table 3.1, namely: 1) Presence of the 100%
Canadian milk symbol, 2) Organic, 3) Brand, and 4) Price. It is believed that these are attributes
that are evaluated in the selection of dairy products. Since this research considers consumers’
preferences for milk and ice cream with the 100% Canadian milk symbol, the 100% Canadian
milk attribute is particularly important.
Table 3.1: Description of Attributes and Attribute Levels
Attributes Explanation
The symbol is a seal of origin that guarantees the
dairy products you are buying are made entirely from
100% Canadian milk or milk ingredients.
Type: Organic, Conventional Milk labelled organic suggests that cows used to
produce this milk have not been treated with
hormones and that the milk contains no antibiotics.
No such claims/suggestions are made with regards to
conventional milk
Brand: National, Store A National brand such as Chapman’s and Breyers can
be found throughout the country in all stores while
store brands are only found in the affiliated store. For
example, Safeway brands (only found in Safeway and
affiliated stores) and President Choice brands only
found in Canadian Super Store and affiliated stores.
Price ($)
Milk: 2.83, 3.40, 4.60 and 5.52
Ice Cream: 4.56, 5.50, 6.40 and
7.50
National average price range for a 2-litre carton of
milk (conventional and organic) or 2-litres of ice
cream.
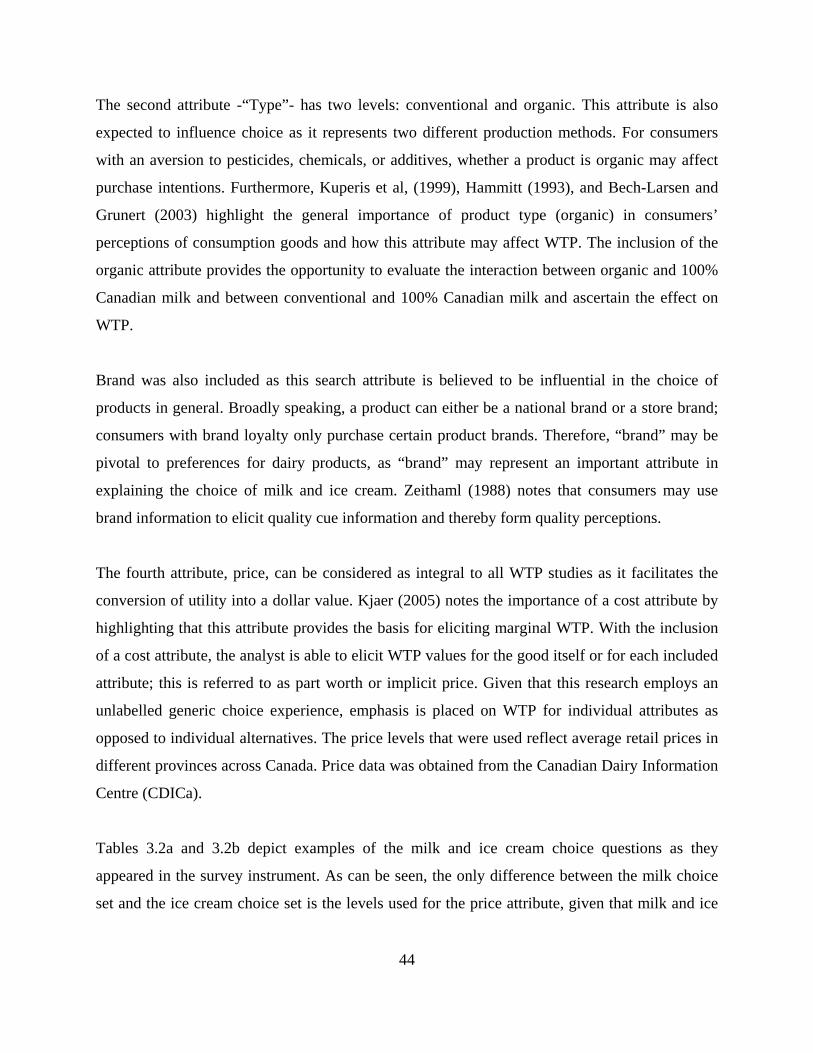
44
The second attribute -“Type”- has two levels: conventional and organic. This attribute is also
expected to influence choice as it represents two different production methods. For consumers
with an aversion to pesticides, chemicals, or additives, whether a product is organic may affect
purchase intentions. Furthermore, Kuperis et al, (1999), Hammitt (1993), and Bech-Larsen and
Grunert (2003) highlight the general importance of product type (organic) in consumers’
perceptions of consumption goods and how this attribute may affect WTP. The inclusion of the
organic attribute provides the opportunity to evaluate the interaction between organic and 100%
Canadian milk and between conventional and 100% Canadian milk and ascertain the effect on
WTP.
Brand was also included as this search attribute is believed to be influential in the choice of
products in general. Broadly speaking, a product can either be a national brand or a store brand;
consumers with brand loyalty only purchase certain product brands. Therefore, “brand” may be
pivotal to preferences for dairy products, as “brand” may represent an important attribute in
explaining the choice of milk and ice cream. Zeithaml (1988) notes that consumers may use
brand information to elicit quality cue information and thereby form quality perceptions.
The fourth attribute, price, can be considered as integral to all WTP studies as it facilitates the
conversion of utility into a dollar value. Kjaer (2005) notes the importance of a cost attribute by
highlighting that this attribute provides the basis for eliciting marginal WTP. With the inclusion
of a cost attribute, the analyst is able to elicit WTP values for the good itself or for each included
attribute; this is referred to as part worth or implicit price. Given that this research employs an
unlabelled generic choice experience, emphasis is placed on WTP for individual attributes as
opposed to individual alternatives. The price levels that were used reflect average retail prices in
different provinces across Canada. Price data was obtained from the Canadian Dairy Information
Centre (CDICa).
Tables 3.2a and 3.2b depict examples of the milk and ice cream choice questions as they
appeared in the survey instrument. As can be seen, the only difference between the milk choice
set and the ice cream choice set is the levels used for the price attribute, given that milk and ice
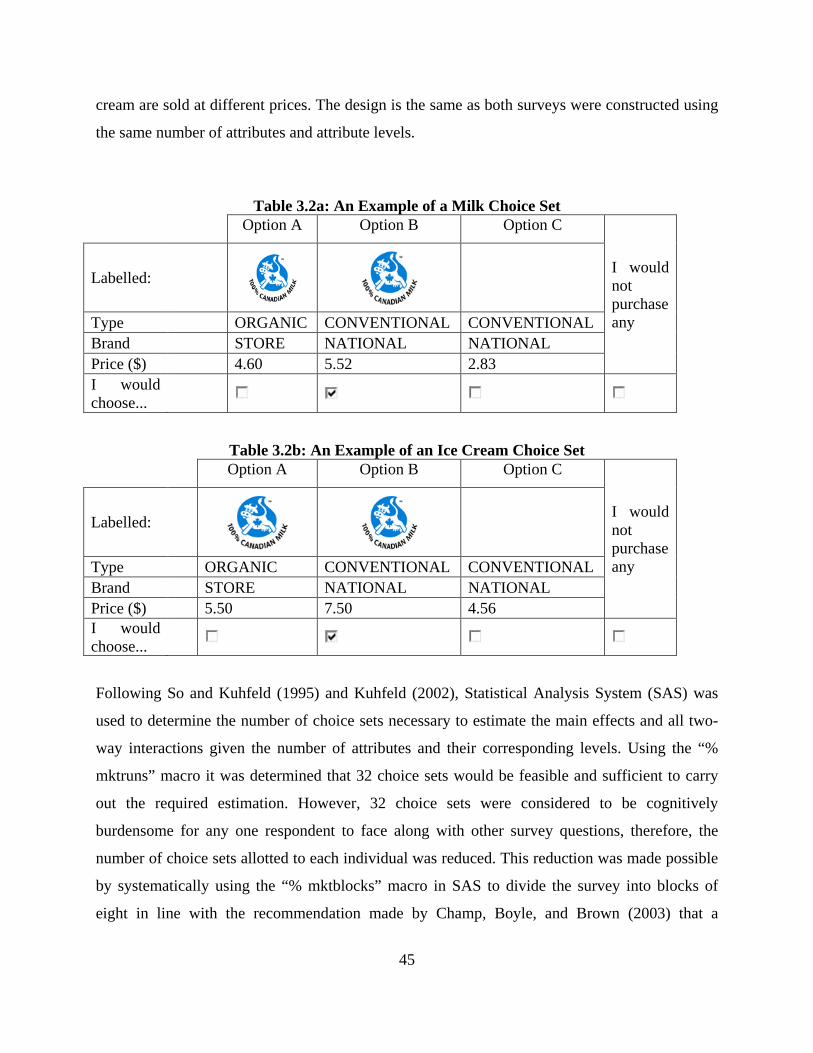
45
cream are sold at different prices. The design is the same as both surveys were constructed using
the same number of attributes and attribute levels.
Table 3.2a: An Example of a Milk Choice Set
Option A Option B Option C
I would not purchase any
Labelled:
Type ORGANIC CONVENTIONAL CONVENTIONAL Brand STORE NATIONAL NATIONAL Price ($) 4.60 5.52 2.83 I would choose...
Table 3.2b: An Example of an Ice Cream Choice Set Option A Option B Option C
I would not purchase any
Labelled:
Type ORGANIC CONVENTIONAL CONVENTIONAL Brand STORE NATIONAL NATIONAL Price ($) 5.50 7.50 4.56 I would choose...
Following So and Kuhfeld (1995) and Kuhfeld (2002), Statistical Analysis System (SAS) was
used to determine the number of choice sets necessary to estimate the main effects and all two-
way interactions given the number of attributes and their corresponding levels. Using the “%
mktruns” macro it was determined that 32 choice sets would be feasible and sufficient to carry
out the required estimation. However, 32 choice sets were considered to be cognitively
burdensome for any one respondent to face along with other survey questions, therefore, the
number of choice sets allotted to each individual was reduced. This reduction was made possible
by systematically using the “% mktblocks” macro in SAS to divide the survey into blocks of
eight in line with the recommendation made by Champ, Boyle, and Brown (2003) that a
46
reasonable number of choice sets for a respondent would be eight and at most 16. Therefore from
a set of 32 choice sets each respondent was assigned to different blocks consisting of 8 questions.
3.5. Chapter Summary
Chapter 3 puts the conceptual model into perspective by examining how product attributes and
individual factors act in concert to influence preferences and WTP. Based on the theoretical
framework three hypotheses pertaining to consumers’ preferences and WTP for the 100%
Canadian milk attribute were introduced. This chapter also discussed the different ways in which
preferences are evaluated by examining different types of data: revealed and stated preference
data. The main methodologies used to obtain stated preference data were also explored. Chapter
3 also discussed the design of the discrete choice experiment used in this thesis. The following
chapter explains the empirical approach taken in evaluating preferences.

47
Chapter 4: Empirical Approach & Descriptive Statistics This chapter introduces the foundation of discrete choice models and some of the different
discrete choice models available for the estimation and analysis of discrete choice data. The
benefits and potential drawbacks associated with each model are also discussed. In addition, this
chapter provides information on the different types of WTP calculations.
4.1 The Foundation of Discrete Choice Models
Louviere et al. (2000) assert that there can be no valid measurement without theory, with that in
mind it is important to explain the theoretical foundation on which discrete choice models are
based. Discrete choice modelling is based on Random Utility Theory (RUT). RUT explains the
basis on which consumer choice is made and why one alternative would be chosen in lieu of
another. RUT stipulates that individuals are expected to choose the alternative with the greatest
level of utility from a finite set of alternatives. The concept of RUT was first developed by
Thurstone in 1927 (Louviere et al. 2008). RUT is used to create a link between observed
consumer behaviour and economic theory by linking observed choices to assumptions made
about consumer behavior (Kjaer, 2005) based on probabilistic theory or choice probabilities to
create a random utility model.
4.1.1 The Random Utility Model
To account for both observed and unobserved factors affecting individuals’ choices, a random
utility model is comprised of two components, namely a systematic component and a random
error component, where the systematic component is observable by the analyst (comprised of
attributes and socio-demographic characteristics in choice modelling) and the random component
is unobserved (preferences, perceptions and taste). The indirect utility associated with this model
can be represented as 𝑈𝑛𝑖 which represents the utility that individual n derives from choosing
alternative i from a set of alternatives. The systematic component is represented as 𝑉𝑛𝑖 and is a
function of product attributes, and the random component is represented by 𝜀𝑛𝑖. In a choice
modelling context where individuals choose between different alternatives, the model
representing the choice of alternative i being chosen from a set of j alternatives can, according to
Hensher, Rose and Green (2005), be represented as:
𝑃𝑛𝑖 = 𝑃𝑟𝑜𝑏 (𝑈𝑛𝑖 > 𝑈𝑛𝑗) = 𝑃𝑟𝑜𝑏 (𝑉𝑛𝑖 + 𝜀𝑛𝑖) > 𝑃𝑟𝑜𝑏 (𝑉𝑛𝑗 + 𝜀𝑛𝑗) (1)
48
Where 𝑃𝑛𝑖 represents the probability that individual n selects alternative i which equates to the
probability that the utility associated with alternative i is greater than the utility associated with
all other competing alternatives. From equation (1) various discrete choice models can be
derived. The model derived however depends on how the error component is assumed to be
distributed. These models range from the simple restrictive Multinomial Logit (MNL) model to
the more complex Mixed Multinomial logit model (MMNL). Some of the most common discrete
choice models are introduced below.
4.2 Multinomial Logit Models: An Overview
The MNL6 model is regarded as the base model used for discrete choice experiments (Hensher et
al. 2005; Louviere et al. 2000; Kjær 2005 ) as it is simple when compared to more advanced
choice models such as the Nested Logit (NL) and the Mixed Logit (MMNL) models. This model
is based on the assumption that the stochastic error term follows a type-1 extreme value
distribution and is independently and identically distributed (IID). The distribution is also known
as Weibull, Gumbel and double exponential.
MNL is the generic name used to describe the generalized logit and the conditional logit models,
but the generalized logit and the conditional logit models are technically different in that the
former associates a choice among alternatives as a function of individual characteristics such as
income, age and gender, while the latter associates the choice with product attributes of the
selected alternative. However, intuitively, it is expected that a better estimation of choice
selection probabilities will be approximated by combining both models since choice is generally
a function of an individual’s characteristics and also the attributes that the choice contains
(Hensher et al. 2005).
Recall from equation (1) above that if the expected utility associated with alternative i is greater
than that of alternative j, then the probability with which an individual n will choose alternative i
will be greater than the probability associated with choosing j. This can be represented as,
6 For a detailed derivation of the MNL see Chapter 3 of Louviere, Hensher & Swait (2000)
49
(𝑃(𝑉𝑛𝑖 + 𝜀𝑛𝑖)) > (𝑃�𝑉𝑛𝑗 + 𝜀𝑛𝑗�) (2)
This implies that:
𝑃𝑛𝑖 = 𝑃(𝑉𝑛𝑖 − 𝑉𝑛𝑗) > (𝜀𝑛𝑗 − 𝜀𝑛𝑖) 𝑓𝑜𝑟 𝑎𝑙𝑙 𝑗≠𝑖 (3)
In other words, equation (3) means that the probability of alternative i being chosen from a set of
j alternatives would indicate that the difference in the utility from the systematic components of
alternatives i and j is greater than the difference between the random component of both
alternatives. Therefore the probability of selecting alternative i approaches one (1), while the
probability of selecting alternative j approaches zero (0).
Since the researcher cannot observe the individual’s true utility function, a probabilistic utility
function is used in the estimation. Therefore, the probability that an individual n chooses
alternative i can be represented as:
𝐿𝑖 = 𝑒𝑉𝑖(𝛽)
∑ 𝑒𝑣𝑗(𝛽)𝑗 (4)
Equation (4) represents the MNL model.
Although there are several statistical approaches that can be used to estimate the parameters in
the utility expression of the MNL, estimation is usually done by maximum likelihood (ML). As
such estimates are obtained by maximizing a probabilistic function with respect to the
parameters or utility estimates (Hensher et al. 2005).
4.2.1 Potential Drawbacks with the Multinomial Logit Model (MNL)
Despite the computational simplicity noted with the MNL model, it is regarded as highly
restrictive mainly because of its assumption of independence from irrelevant alternatives (IIA)
and homogeneity in consumer preferences. The assumption of IIA implies that the ratio of
choosing one alternative over another is unaffected by the presence or absence of any additional
alternative in the choice set (Hensher et al. 2005). The IIA assumption therefore implies that the
relative odds of two categories remain the same when an additional category is added, and the
introduction of an additional category is thereby regarded as an irrelevant alternative. In essence
this model is derived under the assumption that the unobserved factors are uncorrelated over
alternatives and have the same variance for all alternatives (Train, 2009). The logit model
therefore implies proportional substitution across alternatives. This assumption is unrealistic in
50
most cases and especially so in cases where the new alternative is a close substitute to an existing
alternative hence resulting in correlation in the error terms.
Another simplifying assumption of the MNL is that respondents have homogenous preferences.
This assumption implies that different individuals place the same value on product attributes. As
such, this model does not represent random taste variation. Due to the preceding assumptions,
the MNL model is seen as a rather basic, simplistic model for discrete choice analysis. Therefore
more sophisticated extensions of this base model are often used to model choice behaviour
especially when the objective is to capture heterogeneity in attribute preferences. If heterogeneity
is indeed present in a model it must be captured in order to obtain reliable choice model
predictions. In such an event, Train (2009) suggests using more sophisticated models such as
Generalized Extreme Value (GEV) models such as the Nested Logit (NL), Heteroscedastic
Extreme Value (HEV), the Multinomial Probit Model (MNP) or the Mixed Logit model
(MMNL), which are generally less restrictive.
Each of the highlighted models is examined briefly to emphasize the major differences from the
standard logit and to highlight how they improve upon the assumptions of the standard logit
model to create less restrictive models with greater flexibility. However, before deciding to move
to a less restrictive model it is important to first ensure that the MNL does not fit the data, this
can be confirmed by employing the Hausman test (Hensher et al. 2005; Train, 2009).
4.2.2 Testing for IID violation
If IID is violated and the MNL is used, then at best this model will yield biased estimates of an
incorrect model and at worst will yield results from which inferences made will be unreliable and
invalid (Hensher et al. 2005). As an indication of IID violation the random component of
different alternatives may reflect non-constant variances and alternatives may also share
common unobserved attributes which results in non-zero off diagonal covariances. However,
according to Hensher et al. MNL models are rarely appropriate for real life choice models as
most problems involve violations of the IID assumption.
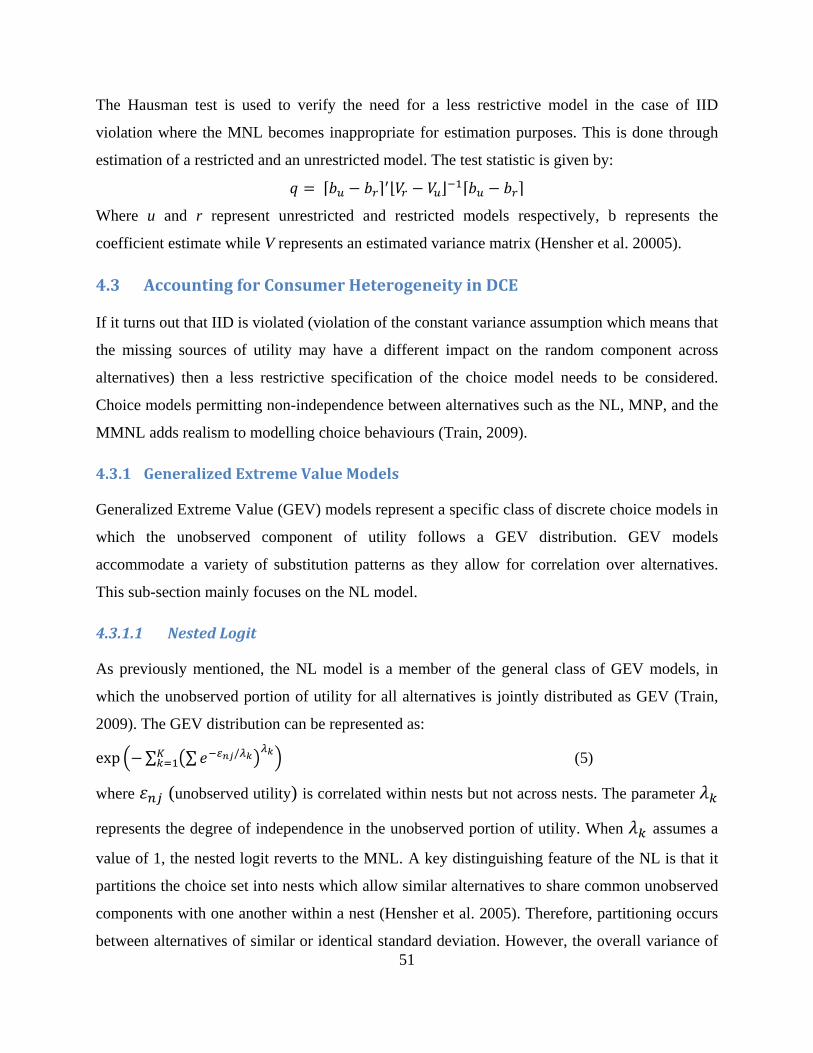
51
The Hausman test is used to verify the need for a less restrictive model in the case of IID
violation where the MNL becomes inappropriate for estimation purposes. This is done through
estimation of a restricted and an unrestricted model. The test statistic is given by:
𝑞 = ⌈𝑏𝑢 − 𝑏𝑟⌉′⌊𝑉𝑟 − 𝑉𝑢⌋−1⌈𝑏𝑢 − 𝑏𝑟⌉
Where u and r represent unrestricted and restricted models respectively, b represents the
coefficient estimate while V represents an estimated variance matrix (Hensher et al. 20005).
4.3 Accounting for Consumer Heterogeneity in DCE
If it turns out that IID is violated (violation of the constant variance assumption which means that
the missing sources of utility may have a different impact on the random component across
alternatives) then a less restrictive specification of the choice model needs to be considered.
Choice models permitting non-independence between alternatives such as the NL, MNP, and the
MMNL adds realism to modelling choice behaviours (Train, 2009).
4.3.1 Generalized Extreme Value Models
Generalized Extreme Value (GEV) models represent a specific class of discrete choice models in
which the unobserved component of utility follows a GEV distribution. GEV models
accommodate a variety of substitution patterns as they allow for correlation over alternatives.
This sub-section mainly focuses on the NL model.
4.3.1.1 Nested Logit
As previously mentioned, the NL model is a member of the general class of GEV models, in
which the unobserved portion of utility for all alternatives is jointly distributed as GEV (Train,
2009). The GEV distribution can be represented as:
exp �−∑ �∑𝑒−𝜀𝑛𝑗/𝜆𝑘�𝜆𝑘𝐾
𝑘=1 � (5)
where 𝜀𝑛𝑗 (unobserved utility) is correlated within nests but not across nests. The parameter 𝜆𝑘
represents the degree of independence in the unobserved portion of utility. When 𝜆𝑘 assumes a
value of 1, the nested logit reverts to the MNL. A key distinguishing feature of the NL is that it
partitions the choice set into nests which allow similar alternatives to share common unobserved
components with one another within a nest (Hensher et al. 2005). Therefore, partitioning occurs
between alternatives of similar or identical standard deviation. However, the overall variance of
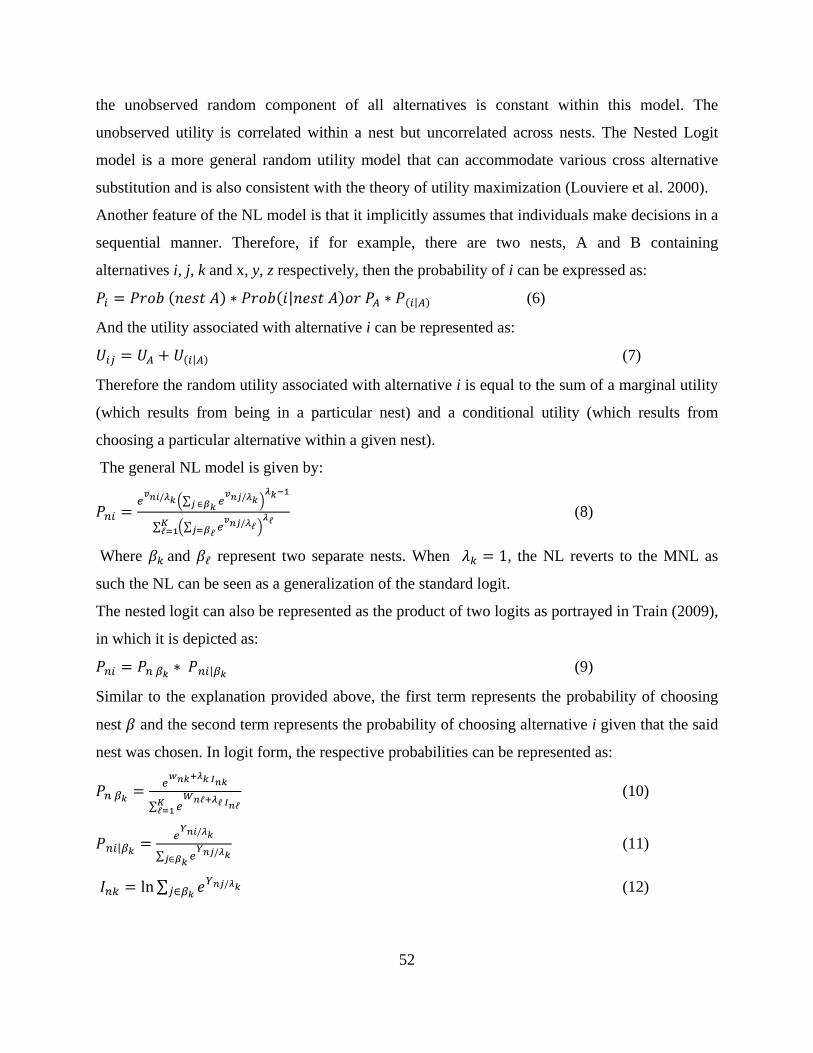
52
the unobserved random component of all alternatives is constant within this model. The
unobserved utility is correlated within a nest but uncorrelated across nests. The Nested Logit
model is a more general random utility model that can accommodate various cross alternative
substitution and is also consistent with the theory of utility maximization (Louviere et al. 2000).
Another feature of the NL model is that it implicitly assumes that individuals make decisions in a
sequential manner. Therefore, if for example, there are two nests, A and B containing
alternatives i, j, k and x, y, z respectively, then the probability of i can be expressed as:
𝑃𝑖 = 𝑃𝑟𝑜𝑏 (𝑛𝑒𝑠𝑡 𝐴) ∗ 𝑃𝑟𝑜𝑏(𝑖|𝑛𝑒𝑠𝑡 𝐴)𝑜𝑟 𝑃𝐴 ∗ 𝑃(𝑖|𝐴) (6)
And the utility associated with alternative i can be represented as:
𝑈𝑖𝑗 = 𝑈𝐴 + 𝑈(𝑖|𝐴) (7)
Therefore the random utility associated with alternative i is equal to the sum of a marginal utility
(which results from being in a particular nest) and a conditional utility (which results from
choosing a particular alternative within a given nest).
The general NL model is given by:
𝑃𝑛𝑖 =𝑒𝑣𝑛𝑖/𝜆𝑘�∑ 𝑒
𝑣𝑛𝑗/𝜆𝑘𝑗 ∈𝛽𝑘 �𝜆𝑘−1
∑ �∑ 𝑒𝑣𝑛𝑗/𝜆ℓ𝑗=𝛽ℓ �
𝜆ℓ𝐾ℓ=1
(8)
Where 𝛽𝑘 and 𝛽ℓ represent two separate nests. When 𝜆𝑘 = 1, the NL reverts to the MNL as
such the NL can be seen as a generalization of the standard logit.
The nested logit can also be represented as the product of two logits as portrayed in Train (2009),
in which it is depicted as:
𝑃𝑛𝑖 = 𝑃𝑛 𝛽𝑘 ∗ 𝑃𝑛𝑖|𝛽𝑘 (9)
Similar to the explanation provided above, the first term represents the probability of choosing
nest 𝛽 and the second term represents the probability of choosing alternative i given that the said
nest was chosen. In logit form, the respective probabilities can be represented as:
𝑃𝑛 𝛽𝑘 = 𝑒𝑤𝑛𝑘+𝜆𝑘 𝐼𝑛𝑘
∑ 𝑒𝑊𝑛ℓ+𝜆ℓ 𝐼𝑛ℓ𝐾
ℓ=1
(10)
𝑃𝑛𝑖|𝛽𝑘 = 𝑒𝑌𝑛𝑖/𝜆𝑘
∑ 𝑒𝑌𝑛𝑗/𝜆𝑘𝑗∈𝛽𝑘
(11)
𝐼𝑛𝑘 = ln∑ 𝑒𝑌𝑛𝑗/𝜆𝑘𝑗∈𝛽𝑘 (12)
53
Where 𝑊𝑛𝑘 represents variables which differ over a nest but not over alternatives and depends
on variables that describe nest k. Therefore, this term represents the expected utility a person
receives just from choosing nest 𝛽𝑘. On the other hand, 𝑌𝑛𝑗 represents variables which vary over
alternatives within nest k. In addition 𝜆𝑘𝐼𝑛𝑘 denotes the expected utility received by respondent n
from the choice among the alternatives in nest 𝛽𝑘 and therefore represents the additional utility
derived from being able to choose the best alternative in the nest. 𝐼𝑛𝑘 is also called the “log sum
term” and 𝜆𝑘 the log sum coefficient (Train 2009). Therefore the combination 𝑊𝑛𝑘 and 𝜆𝑘𝐼𝑛𝑘
provides the total expected utility derived from selecting an alternative from nest 𝛽𝑘.
The preceding discussion shows that the NL is applicable in situations where alternatives can be
separated into distinct groups or nests due to correlation in the error terms.
4.3.2 Multinomial Probit Model
This method is not commonly used due to computational difficulties. The Multinomial Probit
model (MNP) is based on the assumption that the unobserved factors are distributed jointly as
opposed to independently (Train, 2009). Furthermore, unlike the other models that have been
introduced in the preceding section, the MNP totally relaxes the IID assumption. Specifically the
MNP model allows for random taste variation, it relaxes the IIA property, and it can be used in
panel data when unobserved factors are correlated over time for each decision maker (Train
2009).
However, even though the MNP model is less restrictive than the MNL and the NL models, it is
limited in its theoretical application as it dictates that the distribution of the random component
of utility should be normal (Train 2009). This type of distribution is at times inappropriate
depending on the attribute of interest. Train (2009) explains that a normal distribution would
have a positive coefficient for price since it has density on both sides of zero, which would
effectively imply that some persons have a positive price coefficient. A more appropriate
distribution would be the lognormal distribution; however, this distribution cannot be
accommodated by the MNP model.

54
4.3.3 Mixed Multinomial logit Approach
In light of the limitation of the MNP, a more general model can be applied. The Mixed
Multinomial Logit (MMNL) model, also known as the random parameter logit (RPL), the kernel
logit, hybrid logit among other terms, is considered the most general of all choice models. It
relaxes all the assumptions that the MNP does and it is not limited to a normal distribution as it
can assume any distribution specified by the analyst.
The MMNL assumes that parameters are randomly distributed in the population of respondents
as opposed to being fixed as in the MNL model. The heterogeneity in the sample population can
be captured through estimation of the mean and variance of the random parameter distribution
(Champ et al. 2003). The MMNL model has some advantages over other discrete choice models
since it provides the researcher with information pertaining to the interpretation of the
unobserved part of utility, thereby providing unbiased estimates regardless of the presence of
heterogeneity in the data (Kjaer, 2005).
The MMNL model is based on the assumption that the unobserved portion of utility consists of a
part which follows any distribution specified by the researcher and a part which is IID extreme
value. With this in mind, the unobserved factors can be decomposed into a part containing all
correlation and heteroskedasticity and another part that is IID extreme value (Train 2009). As
opposed to the former models (excluding the probit model) the MMNL incorporates random
taste variations appropriately and fully (Train, 2009).
4.3.3.1 Specifications of the Mixed Multinomial Logit (MMNL) Model
The MMNL can be derived from more than one specification, namely the random coefficient
specification and the error component specification. According to Train (2009) the random
coefficient derivation is most widely used.
With the random coefficient specification, the systematic component of utility can be divided
into two parts: an observable and an unobservable portion. The indirect utility can therefore be
represented as:
𝑈𝑛𝑖 = 𝛽𝑛𝑥𝑛𝑖 + 𝜀𝑛𝑖 (13)
Where the observed variables of the alternative and decision maker is represented by 𝑥𝑛𝑖, and 𝛽𝑛
is a vector of coefficients specific to individual n (it varies over individuals with density 𝑓(𝛽) ),
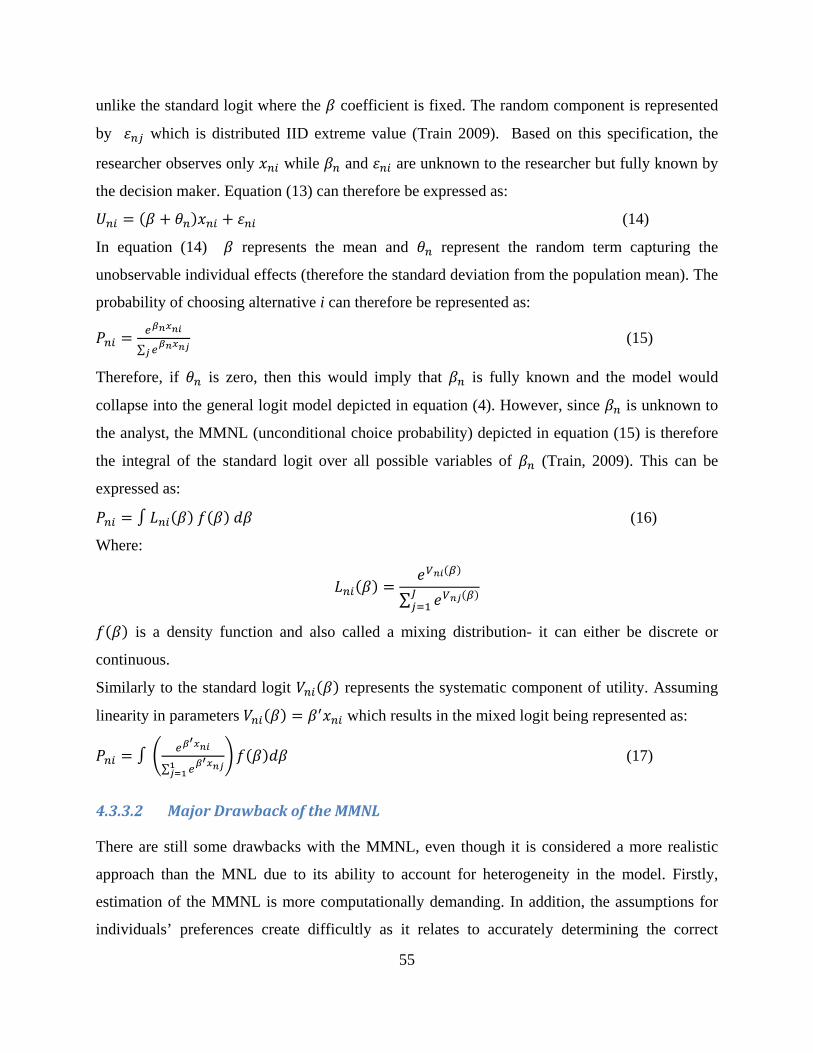
55
unlike the standard logit where the 𝛽 coefficient is fixed. The random component is represented
by 𝜀𝑛𝑗 which is distributed IID extreme value (Train 2009). Based on this specification, the
researcher observes only 𝑥𝑛𝑖 while 𝛽𝑛 and 𝜀𝑛𝑖 are unknown to the researcher but fully known by
the decision maker. Equation (13) can therefore be expressed as:
𝑈𝑛𝑖 = (𝛽 + 𝜃𝑛)𝑥𝑛𝑖 + 𝜀𝑛𝑖 (14)
In equation (14) 𝛽 represents the mean and 𝜃𝑛 represent the random term capturing the
unobservable individual effects (therefore the standard deviation from the population mean). The
probability of choosing alternative i can therefore be represented as:
𝑃𝑛𝑖 = 𝑒𝛽𝑛𝑥𝑛𝑖
∑ 𝑒𝛽𝑛𝑥𝑛𝑗𝑗 (15)
Therefore, if 𝜃𝑛 is zero, then this would imply that 𝛽𝑛 is fully known and the model would
collapse into the general logit model depicted in equation (4). However, since 𝛽𝑛 is unknown to
the analyst, the MMNL (unconditional choice probability) depicted in equation (15) is therefore
the integral of the standard logit over all possible variables of 𝛽𝑛 (Train, 2009). This can be
expressed as:
𝑃𝑛𝑖 = ∫ 𝐿𝑛𝑖(𝛽) 𝑓(𝛽) 𝑑𝛽 (16)
Where:
𝐿𝑛𝑖(𝛽) =𝑒𝑉𝑛𝑖(𝛽)
∑ 𝑒𝑉𝑛𝑗(𝛽)𝐽𝑗=1
𝑓(𝛽) is a density function and also called a mixing distribution- it can either be discrete or
continuous.
Similarly to the standard logit 𝑉𝑛𝑖(𝛽) represents the systematic component of utility. Assuming
linearity in parameters 𝑉𝑛𝑖(𝛽) = 𝛽′𝑥𝑛𝑖 which results in the mixed logit being represented as:
𝑃𝑛𝑖 = ∫ � 𝑒𝛽′𝑥𝑛𝑖
∑ 𝑒𝛽′𝑥𝑛𝑗1
𝑗=1� 𝑓(𝛽)𝑑𝛽 (17)
4.3.3.2 Major Drawback of the MMNL
There are still some drawbacks with the MMNL, even though it is considered a more realistic
approach than the MNL due to its ability to account for heterogeneity in the model. Firstly,
estimation of the MMNL is more computationally demanding. In addition, the assumptions for
individuals’ preferences create difficultly as it relates to accurately determining the correct
56
specification of a parameter’s heterogeneity. Furthermore, it is not possible for the MMNL to
fully capture the source of individuals’ preference heterogeneity.
4.3.3.3 Additional Approaches
The models introduced in the previous sections merely represent some of the approaches that can
be applied to account for consumer heterogeneity. Champ et al. (2003) proposed two additional
applications that can be used to compensate for the restrictions of the MNL: 1) The inclusion of
interaction effects, and 2) estimation of a latent class model.
The inclusion of interaction effects speaks to the combination of product attributes with socio-
demographic characteristics which are expected to add some heterogeneity to the model. The
latent class approach assumes that the population of consumers can be divided into segments
with different preference structures. Therefore, this approach applies to choice situations
influenced by being in a particular segment of the population, that is, consumers within each
class have similar preferences.
For the purpose of this research, the MNL logit model is employed both with and without
interaction terms, as is the MMNL (referred to as the Random Parameter Logit (RPL) model
henceforth). Estimating both models allows for cross comparisons and evaluation of how the
results obtained from employing a simple model compare with those of a more advanced model.
4.4 Estimating Willingness to pay
An important aspect of choice modelling is ascertaining willingness to pay (WTP) estimates for
product attributes. Both marginal and absolute WTP can be elicited from the discrete choice
models: marginal WTP as it relates to a particular attribute and absolute WTP as it relates to a
labelled alternative. In terms of this study, marginal WTP is of interest given that the alternatives
are unlabelled and are merely representations of different attribute levels. Marginal WTP can be
defined and estimated as the marginal change in price that is necessary to keep utility constant
based on a marginal change in the attribute parameters. According to Lusk, Roosen and Fox
(2003), because the attributes are effects coded WTP can be represented as:
𝑊𝑇𝑃= −2 ∗ 𝛽𝑥𝛽𝑝� (18)
57
In equation (18), the numerator represents the attribute coefficient of interest which is derived
through discrete choice methods estimation (Hensher et al. 2005).
The estimation of willingness to pay for interaction variables is slightly different as it takes into
consideration the total effect of the attribute. Therefore to estimate WTP for an attribute all the
relevant interaction terms must be taken into consideration. To accomplish this, WTP can be
calculated as:
𝑊𝑇𝑃=−2(𝛽𝑥 + 𝛽𝐷 ∗ 𝐷)𝛽𝑝� (19)
Where 𝛽𝑥 and 𝛽𝑝 represent the attribute and price coefficient respectively, D represents a vector
of demographic variables (for instance) being interacted with product attributes and 𝛽𝐷 is the
vector of coefficients resulting from the interactions.
Limdep 7.0, a non-linear statistical program, was used to conduct the estimation of the MNL and
the RPL models that were introduced. The MNL and the RPL models outlined above are used to
estimate the survey data on consumers’ preferences for milk and ice cream with the 100%
Canadian milk attribute.
4.5 The Choice Model Specification
The previous section provided a basic overview of the different methods that can be used to
estimate discrete choice experiments. In addition, eliciting willingness to pay estimates was also
discussed. This section outlines the utility specification used in the discrete choice estimations.
Recall that the random utility model can be effectively represented by a systematic and a random
error component. Given the attributes relevant to this study, the indirect utility function which
represents consumer i choosing alternative j can be represented as:
𝑈𝑖𝑗 = 𝛽1𝑁𝑜𝑃𝑢𝑟𝑐ℎ𝑎𝑠𝑒 + 𝑒𝑗 (20)
for the no purchase option represented by the fourth alternative in the choice sets. The “no
purchase” option is a dummy variable, which equals 1 if the “no purchase” option is chosen and
zero otherwise. In addition, the utility obtained from the other three alternatives can be specified
generically as:
𝑈𝑖𝑗 = (1 −𝑁𝑜𝑃𝑢𝑟𝑐ℎ𝑎𝑠𝑒) ∗ (𝛽2𝐶𝑎𝑛 + 𝛽3𝑂𝑟𝑔 + 𝛽4𝑁𝑎𝑡 + 𝛽5𝑃𝑟𝑖𝑐𝑒) + 𝑒𝑗 (21)
58
The attributes included in equation (21) are: 100% Canadian Milk (where the label is either
present or absent), Type (conventional or organic), brand (national or store) and price. These
attributes have been effects coded: The 100% Canadian milk attribute is coded 1 if present and -
1 if absent, Type” is coded 1 if organic and -1 represents the base level- “conventional”, “Brand”
is coded as 1 if it is a national brand and -1 for a store brand. The price attribute is continuous,
and therefore prices are included in the utility function as they appear in the choice sets.
In addition to the main effects, it is expected that there will be two way interactions that are
relevant to this study, as the presence of two attributes levels may have a different impact on
preferences than the presence of one attribute level. The inclusion of main effects and all two
way interactions in the estimation process is expected to account for most of, if not all, variation
in the model. Based on the definition of interaction effect given by Hensher et al. (2005) an
interaction exists between two variables if a consumer’s preference for levels of one attribute is
influenced by the level of another attribute. There are two attribute interactions that may be of
interest to this study: the interaction of the 100% Canadian milk attribute and
organic/conventional and 100% Canadian milk and store/national brand. These interactions are
expected to influence consumers’ preferences and choices of milk and ice cream.
The interaction between 100% Canadian milk and organic for both the milk and ice cream
choice models will show the effect of having an additional quality cue on conventional and
organic milk or ice cream. The interaction between these two attributes may or may not reflect
an increase in WTP. However, either way it will reflect how consumers perceive the combined
attributes in milk and ice cream. In general, it is expected that consumers’ preferences for the
100% Canadian milk attribute may be influenced by whether or not the product is also labelled
as conventional or organic. Consumers who exhibit preferences for organic products may already
view “organic” as a quality cue. Should this be the case, combining milk or ice cream with the
100% Canadian milk symbol may not represent added value to consumers and therefore result in
no statistical difference in the WTP estimates for a product with one or both attributes. On the
other hand, the presence of the 100% Canadian milk symbol on conventional milk or ice cream

59
may positively impact consumers’ preferences as the symbol may represent additional value
added to these products if respondents view the 100% Canadian milk attribute as a quality signal.
On a similar note, the interaction between 100% Canadian milk and “national brand” will
explain the effect of the combination of the 100% Canadian milk symbol on a national brand as
opposed to a store brand milk or ice cream. The 100% Canadian milk attribute may be used to
complement store brand milk or ice cream if consumers have good perceptions of the partner
brand. On the other hand, such a combination could also result in a devaluation of the 100% milk
symbol if consumers overwhelmingly dislike store brands. The effect of co-branding
(interacting) can be assessed by observing the main effects coefficients and the interaction of
main effects and assessing whether the difference is statistically significant. To ascertain if the
effects are statistically different the Wald test is employed (Hensher et al. 2005). These results
are used to assess the impact of “co-branding” milk and ice cream with the 100% Canadian milk
symbol.
The interactions noted above are particularly relevant to this thesis, as one of the main research
interests is to ascertain how the 100% Canadian milk symbol influences preferences and the
choice of milk and ice cream. Therefore, by evaluating the two interactions noted, the effect of
having the different levels of the 100% Canadian milk symbol and type and the 100% Canadian
milk symbol and brand will become apparent. A model that captures the main effects and the
two-way interactions of interest can be outlined as follows:
𝑈𝑖𝑗 = (1 −𝑁𝑜𝑃𝑢𝑟𝑐ℎ𝑎𝑠𝑒) ∗ (𝛽2100%𝐶𝑎𝑛 + 𝛽3𝑂𝑟𝑔 + 𝛽4𝑆𝑡𝑜𝑟𝑒 + 𝛽5𝑃𝑟𝑖𝑐𝑒 + 𝛽6 𝐶𝑎𝑛𝑜𝑟𝑔 +
𝛽7𝐶𝑎𝑛𝑠𝑡𝑜𝑟𝑒 + 𝑒𝑗 (22)
Where the coefficient 𝛽6 represents the interaction between the 100% Canadian milk attribute
and organic and 𝛽7 represents the interaction between the 100% Canadian milk attribute and
brand.
In addition to attribute interactions, there can also be interactions between socio-economic
variables and attributes. These interactions can further assist in explaining heterogeneity in
preferences and perceptions; for example, how preferences for products with the 100% Canadian
60
milk attribute differ between consumers of different age groups, income categories and
educational levels. In addition, a key objective of this research is to ascertain the different target
markets for dairy products by exploring how consumers with different socio-demographic
characteristics respond to the 100% Canadian milk symbol. Therefore, interactions between key
socio-demographics and the 100% Canadian milk symbol are also of interest.
Information on socio-demographics and values, (including preferences and attitudes) were
captured from the general survey responses geared towards eliciting respondents’ perceptions
and beliefs (such as attitudes towards health, level of patriotism, risk perception and socio-
demographic information). The general attitudinal variables are constructed from the survey
responses regarding levels of patriotism, risk perceptions and health consciousness using factor
analysis.
4.6 Chapter Summary
This chapter presented the empirical framework on which the thesis is based and introduced the
different models used to estimate discrete choice data. In presenting the empirical framework,
the Random Utility Theory has been explored; the chapter shows how this theory provides the
framework for the various estimation methods used for discrete choice data. The Multinomial
logit and the Random Parameter logit models which will be applied in Chapter 6 were
introduced. The following chapter provides the descriptive statistics on the survey samples.
Information relevant to respondents’ attitudes and characteristics are also discussed.
61
Chapter 5 Descriptive Statistics This chapter describes the processes that preceded the launching of the surveys and provides the
descriptive statistics of the samples. Data on respondents’ purchasing habits, brand awareness,
brand preferences and general perceptions are discussed. The relative importance of different
characteristics of milk and ice cream in influencing respondents’ purchase intentions are also
highlighted. This chapter also provides information relating to the factor analysis approach used
to incorporate the attitudinal factors into the analysis of consumers’ preferences.
5.1 The Survey: Development, Piloting and Administration
Before administering a survey, it is important to evaluate the instrument’s overall effectiveness
through pre-testing (Hensher et al. 2005). Taking this into consideration, both the milk and ice
cream surveys were piloted in December 2011. The surveys were piloted to ascertain
deficiencies in the instrument and to identify areas that could be modified such as clarity of
questions and length of time to completion. Respondents were asked to time themselves and
record this at the end of the survey. Based on the times reported, respondents took between 20-40
minutes to complete a survey.
It is most effective to have a representative pilot group to ensure feedback is received from a
representative group of respondents. However, ensuring that a representative group was targeted
presented some limitations as the pilot group primarily comprised of Saskatoon residents.
However, respondents were targeted both from within and outside of the university setting.
Respondents were asked to complete a survey that was collected later to allow greater
convenience for respondents. These respondents were also requested to invite a friend or family
member who purchases milk and (or) ice cream to complete a survey. Specifically, consumers of
milk and ice cream were targeted and asked to manually complete one of (or both) the
instruments in accordance to their purchasing profiles7.
Responses from the pilot survey and feedback from thesis advisory committee members guided
further modifications that were made to the survey instruments. Revised versions of the surveys 7 Only persons who purchase milk were asked to complete the milk survey and only those who purchase ice cream and have done so within the last three months were asked to complete the ice cream survey.

62
were subsequently administered online in March 2012 by Insightrix, a market research firm. The
complete version of the first block of the milk survey can be viewed in Appendix F.
The survey targeted Canadian dairy consumers and was administered nationwide in both French
and English. Respondents therefore had the option of responding to either version based on their
language preference. Prior to commencing the survey, potential respondents were briefed on
what the survey was about and were given the option to consent to the terms or opt out of the
survey. The survey was reviewed and received approval8 from the University of Saskatchewan
behavioral ethics review board. After respondents consented to complete the survey, screener
questions were then asked to ensure that only milk and ice cream purchasers completed the
instruments. This was necessary as the surveys primarily intended to obtain the views of persons
who purchase milk or ice cream (depending on the survey), and those who purchase these
products with a certain frequency. The instruments were almost identical except that one was
geared towards evaluating the purchase habits and preferences for milk and the other examined
ice cream.
The first section9 of the surveys was geared towards assessing respondents’ purchasing habits.
Questions such as “do you consume dairy products and how often do you purchase milk/ice
cream” were asked as screener questions. In assessing consumers’ awareness and preferences
toward the 100% Canadian milk symbol, consumers were explicitly asked if they were aware of
the 100% Canadian milk symbol and to indicate on a scale of 1 to 5, with 5 being the most
frequent how often they purchased milk or ice cream with certain labels. Next consumers’
perceptions of milk and ice cream with the 100% Canadian milk symbol were assessed on a five
point likert scale with higher values indicating negative perceptions. For example, respondents
were asked if they would consider a product displaying the 100% Canadian milk symbol to be a
quality product10, while a choice of 1 would indicate that they strongly agree with this statement
a choice of 5 indicates strong disagreement. In addition, the survey also sought to elicit
8 Approval was granted on November 17 2011 (University of Saskatchewan Behavioural Ethics Board project #11-269). 9 Appendices H and I provides descriptive statistics on the responses to the questions in each section of the milk and ice cream survey respectively. 10 Question 1b in the section “ Consumers’ perceptions toward the 100% Canadian milk brand”
63
consumers’ attitudes and views toward risk, primarily because more risk averse consumers may
seek different risk reduction strategies and may consider dairy products with Canadian origin
information as less risky. Views towards domestic values were also elicited with the intention of
evaluating the relationship between consumers’ domestic values and their preferences and
attitudes toward dairy products with the 100% Canadian milk symbol. Therefore, respondents
were asked to indicate their agreement with questions such as: “l always buy a domestic product
over a foreign product if the prices are within the same range”11. These general survey questions
were incorporated in the estimations after factor analysis was used to group similar questions
into factors. Similar questions were combined to create factors representing health
consciousness, domestic values and risk preferences. After responding to these preliminary
questions respondents were introduced to the choice questions through the use of a cheap talk
script. An example of the choice questions was also shown in a behavioural choice context as a
way of explaining the ensuing choice section. Respondents were each assigned 8 choice
questions. Following the hypothetical choices, respondents were asked industry knowledge
questions. Those that responded incorrectly to the questions were asked if they would update
their responses in the choice section given the correct response to the industry knowledge
questions. The final section of the survey covered respondents’ demographic characteristics.
5.1.2 Data Description
The survey targeted a representative population percentage from each province, which was based
on the ratio of the population in each province to Canada’s population (Table 5.1). A total of 510
respondents completed the milk survey while a total of 502 respondents completed the ice cream
survey. Both data sets were cleaned for “straight liners” (respondents who selected the same
answer for all 8 choice questions) and other responses which were cognitively inconsistent.
Thereafter, there were 455 useable responses for the milk survey and 453 useable responses from
the ice cream survey. The survey respondents were granted the option of answering an English or
French version of the surveys. Of the number of responses to the milk survey, 44 were in French,
43 of those respondents were from Quebec. A total of 43 respondents to the ice cream survey
11 Question 4 in the section “Patriotism/ Ethnocentrism”

64
completed the French version, 39 were from Quebec. Most of the Quebec-based respondents
completed both surveys in English (57 and 49 respectively.)
As depicted in Table 5.1, the number of respondents from each province relative to the Canadian
population is reasonably representative of the Canadian population by province (with the
exception of the Territories, where at least one person should have responded to each
instrument).
Table 5.2, Figure 5.1 and Figure 5.2 serve to compare demographics between the Canadian
population and the survey samples. It can be observed from Table 5.2 that both survey samples
provided a good representation by gender. However, a comparison of respondents’ education
levels indicate that, while almost 50% of the Canadian population (based on 2006 census data)
the highest education attainment was at the high school level, a significantly smaller percentage
of the milk and ice cream respondents were in this category with most respondents either having
completed technical college or a bachelors degree.
Table 5.1: Percentage Population Represented by Province
Province Population (%)
Ice Cream Sample
(# of Completes)
Ice Cream Sample (% of
Completes)
Milk Sample
(# of Completes)
Milk Sample (% of
Completes)
British Columbia 13.14% 71 15.67% 57 12.53%
Alberta 10.89% 49 10.82% 51 11.21%
Saskatchewan 3.09% 14 3.09% 11 2.42%
Manitoba 3.61% 17 3.75% 16 3.52%
Ontario 38.39% 180 39.74% 188 41.32%
Quebec 23.61% 88 19.43% 100 21.98% Atlantic (NF,PEI, NS,
NB) 6.95% 34 7.51% 32 7.03%
Territories/Yukon/Nun 0.32% 0 0.00% 0 0.00 Source: Created by author using 2011 census data (Statistics Canada, 2012) and total survey respondents.

65
Table 5.2: Comparative Demographic Characteristics
Comparative Demographic Characteristics
Milk Sample Ice Cream Sample Canadian Population Gender
Male 47.91% 43.93% 49.17% Female 52.09% 56.07% 50.83%
Education Less than high School
25.71% 27.59% 49.3% Completed High School
Some Technical College 34.95% 32.89%
28.1% Completed Technical
College Some University 32.75% 31.35%
16.6% Bachelors Graduate Degree 6.59% 8.17% 6.0%
Based on 2006 census data (Statistics Canada, 2011)
Figure 5.1 provides a comparison of the age distribution in the survey samples with the Canadian
population. Most of the survey respondents were well represented in the different age groups. It
should be noted, however, that the purchase of milk and ice cream products is not necessarily
expected to closely match the age distribution of the Canadian population. As for income, a
greater percentage of survey respondents were earning a household income of $45,000 and more
in comparison to the Canadian population. On the other hand, respondents earning $25,000 or
less were under represented in comparison to the Canadian population.
In general, it can be concluded that respondents for both the milk and ice cream surveys have
higher income, and are more educated than the typical Canadian. These anomalies are typically
seen in internet based surveys as confirmed by Hu, Adamowicz, and Veeman, (2006). As it
relates to this study these potential sources of bias are not major concerns as subsequent analysis
revealed that income and education were not significant12 in influencing preferences for milk and
ice cream with the 100% Canadian milk attribute.
12 Education was marginally significant in the milk model

66
Figure 5.1: Age Distribution
Source: Created by author using 2006 census data (Statistics Canada 2012) and survey data. The number of respondents for the milk and ice cream surveys is 455 and 453, respectively.
Figure 5.2: Income Distribution
Source: Created by author using 2006 census (Statistics Canada, 2006) data and survey data. The number of respondents for the milk and ice cream surveys is 455 and 453, respectively.
5.1.3 Purchasing Habits
In order to ascertain respondents’ purchasing habits, respondents were asked to indicate how
frequently they usually purchase milk in a month and ice cream in a three month period, and the
amount most frequently purchased per period13. Respondents were allowed to choose between
13 Questions 2 and 3 respectively under the “Purchasing Habits” section
0%5%
10%15%20%25%30%
18-19 20-30 31-40 41-50 51-65 Over 66Perc
ent o
f Res
pond
ents
Population Ice Cream Milk
0%
10%
20%
30%
40%
50%
60%
Suvey: < 25 000 25 000-44 999 45 000-64 999 65 000- 84 999 > = 85 000
Pop: < 25 000 25 000 - 44 999 45 000 - 69 999 70 000 -79 999 > = 80 000
Perc
ent o
f Res
pond
ents
Population Ice Cream Milk

67
four sizes and four frequencies. The responses to the milk survey indicate that most respondents
purchase 4-litre containers of milk more than four times per month as seen in Figure 5.3. Most
ice cream respondents purchase 1-litre containers of ice cream once and twice per three month
period as indicated in Figure 5.4. From respondents’ purchasing habits, it can be observed that,
as expected, milk is consumed more frequently and in greater quantities than ice cream.
Figure 5.3: The Frequency of Canadian Consumers Milk Purchase per Month
Source: Created by author using survey data. Number of respondents = 455.
Figure 5.4: The Frequency of Canadian Consumers Ice Cream Purchase per Three Month
Period Source: Created by author using survey data. Number of respondents = 453.
0%
5%
10%
15%
20%
25%
30%
0.25L 0.5L 1L 2L 4L
Perc
ent o
f Res
pond
ents
Once Twice 3 to 4 times > 4 times
0%2%4%6%8%
10%12%14%16%18%20%
Less than 1 litre 1 Litre between 1 and 2litres
2 Litres more than 2Litres
Perc
ent o
f Res
pond
ents
Once Twice 3 - 4 times > 4 times
68
5.1.4 Respondents’ Brand Awareness, Brand Perceptions, Level of Patriotism,
Attribute Preferences and Industry Awareness
In addition to ascertaining respondents’ demographic characteristics, several attitudinal questions
were also included in the surveys to facilitate the analysis of consumers’ awareness and
perceptions towards milk and ice cream with the 100% Canadian milk symbol. In addition,
questions relevant to evaluating consumers’ values and preferences for different attributes of
milk and ice cream were included. Questions geared towards assessing respondents’ attitudes
toward healthy living and risk preferences were included in the surveys. In addition, respondents
were also required to answer industry knowledge questions. These questions strategically
followed the discrete choice experiment section so as to determine if and how knowledge or
industry awareness had influenced choices. Some of the results analyzed from these questions
are presented below.
5.1.4.1 Brand Awareness
To ascertain consumers’ brand awareness respondents were explicitly asked “Are you aware of
the 100% Canadian milk Brand”14 . Based on the responses to this question, it is evident that
most respondents were aware of the 100% Canadian milk brand as depicted in Figure 5.5. Figure
5.5 indicates that approximately 94% of respondents to the milk survey were aware of the 100%
Canadian milk brand. The awareness of respondents to the ice cream survey is comparable with
approximately 91% of respondents indicating brand awareness (see Figure 5.6). The high
percentage of respondents indicating their awareness could be a function of agreement bias, and
therefore should be treated with caution.
14 Based on question 1 in the “Awareness and Brand Preference” section of the survey

69
Figure 5.5: Brand Awareness- Milk Respondents
Source: Created by author using survey data. Number of respondents = 455.
Figure 5.6: Brand Awareness- Ice Cream Respondents
Source: Created by author using survey data. Number of respondents = 453.
5.1.4.2 Brand Perception
Several questions were geared towards assessing respondents’ attitudes towards dairy products
with the 100% Canadian milk symbol. As an example, respondents were queried as to whether
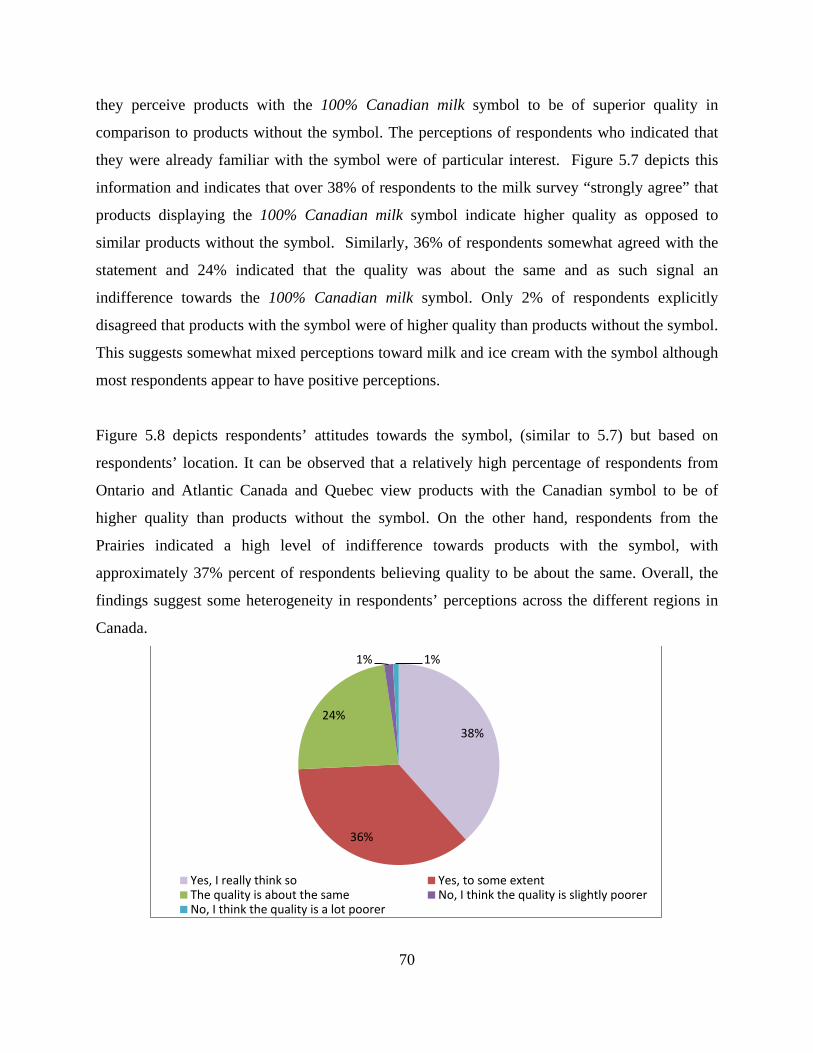
70
they perceive products with the 100% Canadian milk symbol to be of superior quality in
comparison to products without the symbol. The perceptions of respondents who indicated that
they were already familiar with the symbol were of particular interest. Figure 5.7 depicts this
information and indicates that over 38% of respondents to the milk survey “strongly agree” that
products displaying the 100% Canadian milk symbol indicate higher quality as opposed to
similar products without the symbol. Similarly, 36% of respondents somewhat agreed with the
statement and 24% indicated that the quality was about the same and as such signal an
indifference towards the 100% Canadian milk symbol. Only 2% of respondents explicitly
disagreed that products with the symbol were of higher quality than products without the symbol.
This suggests somewhat mixed perceptions toward milk and ice cream with the symbol although
most respondents appear to have positive perceptions.
Figure 5.8 depicts respondents’ attitudes towards the symbol, (similar to 5.7) but based on
respondents’ location. It can be observed that a relatively high percentage of respondents from
Ontario and Atlantic Canada and Quebec view products with the Canadian symbol to be of
higher quality than products without the symbol. On the other hand, respondents from the
Prairies indicated a high level of indifference towards products with the symbol, with
approximately 37% percent of respondents believing quality to be about the same. Overall, the
findings suggest some heterogeneity in respondents’ perceptions across the different regions in
Canada.
38%
36%
24%
1% 1%
Yes, I really think so Yes, to some extentThe quality is about the same No, I think the quality is slightly poorerNo, I think the quality is a lot poorer
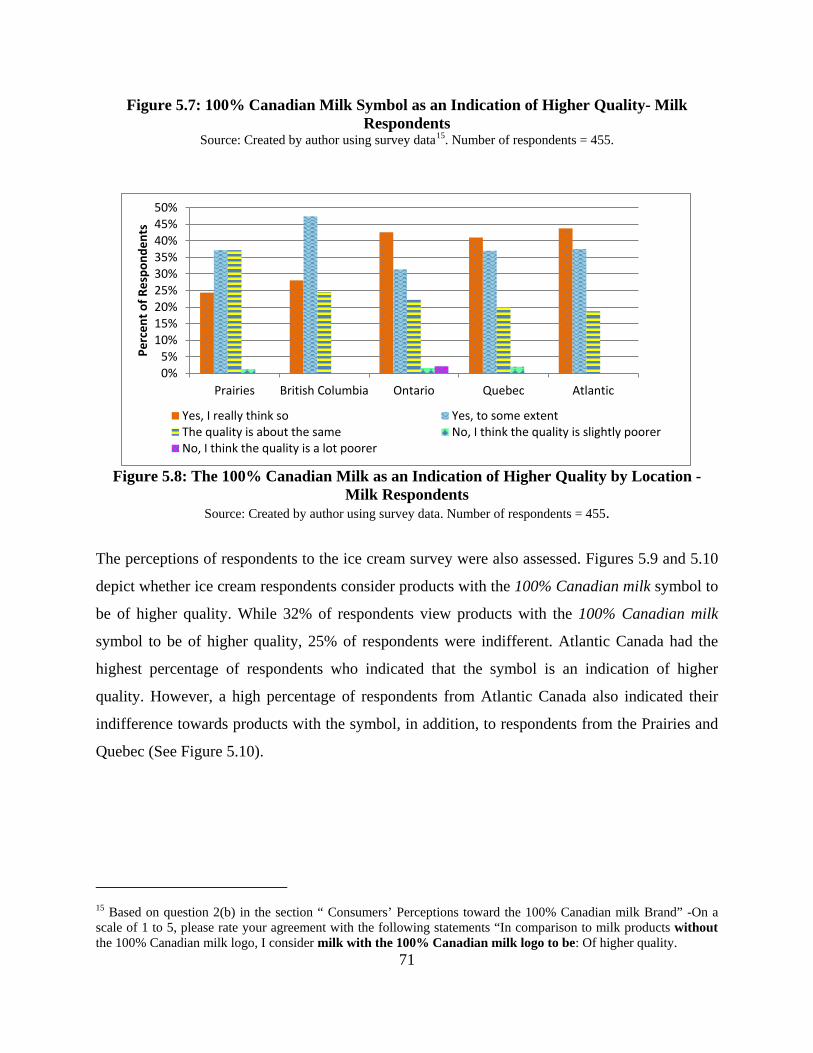
71
Figure 5.7: 100% Canadian Milk Symbol as an Indication of Higher Quality- Milk Respondents
Source: Created by author using survey data15. Number of respondents = 455.
Figure 5.8: The 100% Canadian Milk as an Indication of Higher Quality by Location -
Milk Respondents Source: Created by author using survey data. Number of respondents = 455.
The perceptions of respondents to the ice cream survey were also assessed. Figures 5.9 and 5.10
depict whether ice cream respondents consider products with the 100% Canadian milk symbol to
be of higher quality. While 32% of respondents view products with the 100% Canadian milk
symbol to be of higher quality, 25% of respondents were indifferent. Atlantic Canada had the
highest percentage of respondents who indicated that the symbol is an indication of higher
quality. However, a high percentage of respondents from Atlantic Canada also indicated their
indifference towards products with the symbol, in addition, to respondents from the Prairies and
Quebec (See Figure 5.10).
15 Based on question 2(b) in the section “ Consumers’ Perceptions toward the 100% Canadian milk Brand” -On a scale of 1 to 5, please rate your agreement with the following statements “In comparison to milk products without the 100% Canadian milk logo, I consider milk with the 100% Canadian milk logo to be: Of higher quality.
0%5%
10%15%20%25%30%35%40%45%50%
Prairies British Columbia Ontario Quebec Atlantic
Perc
ent o
f Res
pond
ents
Yes, I really think so Yes, to some extentThe quality is about the same No, I think the quality is slightly poorerNo, I think the quality is a lot poorer
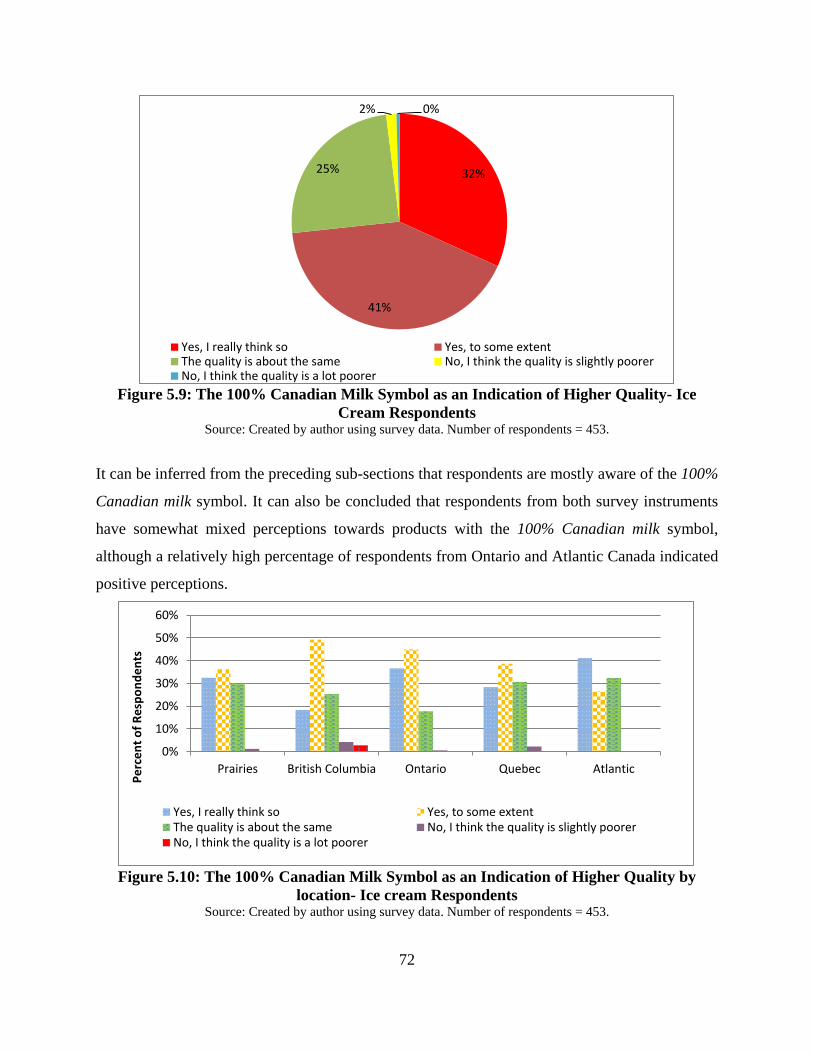
72
Figure 5.9: The 100% Canadian Milk Symbol as an Indication of Higher Quality- Ice
Cream Respondents Source: Created by author using survey data. Number of respondents = 453.
It can be inferred from the preceding sub-sections that respondents are mostly aware of the 100%
Canadian milk symbol. It can also be concluded that respondents from both survey instruments
have somewhat mixed perceptions towards products with the 100% Canadian milk symbol,
although a relatively high percentage of respondents from Ontario and Atlantic Canada indicated
positive perceptions.
Figure 5.10: The 100% Canadian Milk Symbol as an Indication of Higher Quality by
location- Ice cream Respondents Source: Created by author using survey data. Number of respondents = 453.
32%
41%
25%
2% 0%
Yes, I really think so Yes, to some extentThe quality is about the same No, I think the quality is slightly poorerNo, I think the quality is a lot poorer
0%
10%
20%
30%
40%
50%
60%
Prairies British Columbia Ontario Quebec Atlantic
Perc
ent o
f Res
pond
ents
Yes, I really think so Yes, to some extentThe quality is about the same No, I think the quality is slightly poorerNo, I think the quality is a lot poorer
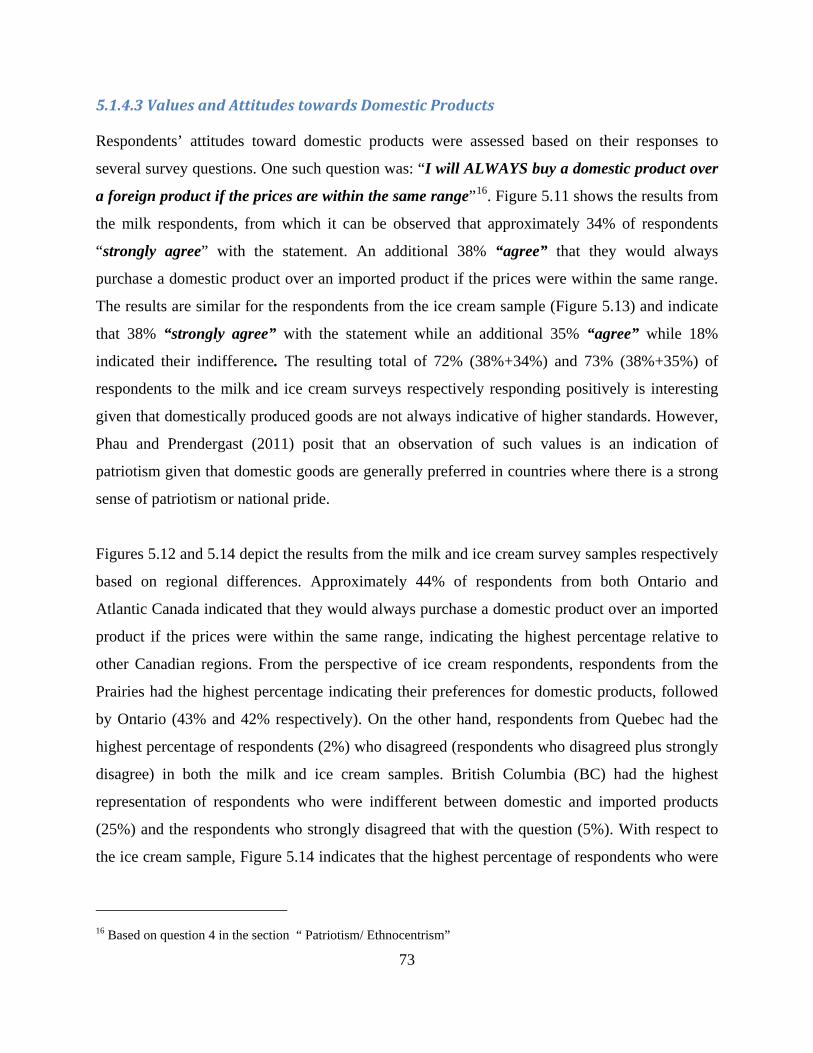
73
5.1.4.3 Values and Attitudes towards Domestic Products
Respondents’ attitudes toward domestic products were assessed based on their responses to
several survey questions. One such question was: “I will ALWAYS buy a domestic product over
a foreign product if the prices are within the same range”16. Figure 5.11 shows the results from
the milk respondents, from which it can be observed that approximately 34% of respondents
“strongly agree” with the statement. An additional 38% “agree” that they would always
purchase a domestic product over an imported product if the prices were within the same range.
The results are similar for the respondents from the ice cream sample (Figure 5.13) and indicate
that 38% “strongly agree” with the statement while an additional 35% “agree” while 18%
indicated their indifference. The resulting total of 72% (38%+34%) and 73% (38%+35%) of
respondents to the milk and ice cream surveys respectively responding positively is interesting
given that domestically produced goods are not always indicative of higher standards. However,
Phau and Prendergast (2011) posit that an observation of such values is an indication of
patriotism given that domestic goods are generally preferred in countries where there is a strong
sense of patriotism or national pride.
Figures 5.12 and 5.14 depict the results from the milk and ice cream survey samples respectively
based on regional differences. Approximately 44% of respondents from both Ontario and
Atlantic Canada indicated that they would always purchase a domestic product over an imported
product if the prices were within the same range, indicating the highest percentage relative to
other Canadian regions. From the perspective of ice cream respondents, respondents from the
Prairies had the highest percentage indicating their preferences for domestic products, followed
by Ontario (43% and 42% respectively). On the other hand, respondents from Quebec had the
highest percentage of respondents (2%) who disagreed (respondents who disagreed plus strongly
disagree) in both the milk and ice cream samples. British Columbia (BC) had the highest
representation of respondents who were indifferent between domestic and imported products
(25%) and the respondents who strongly disagreed that with the question (5%). With respect to
the ice cream sample, Figure 5.14 indicates that the highest percentage of respondents who were
16 Based on question 4 in the section “ Patriotism/ Ethnocentrism”

74
indifferent reside in Atlantic Canada (29%), while again 2% of respondents from Quebec
disagreed.
Figure 5.11: Attitudes toward Domestic Products - Milk Respondents
Source: Created by author using survey data. Number of respondents = 455. Survey Question: “I will ALWAYS buy a domestic product over a foreign product if the prices are within the same
range”
Figure 5.12: Attitudes toward Domestic Products by Location - Milk Respondents
Source: Created by author using survey data. Number of respondents = 455. Survey Question: “I will ALWAYS buy a domestic product over a foreign product if the prices are within the same
range”
38%
35%
18%
7% 2%
Strongly agree Agree Nuetral Disagree Strongly disagree
0%
5%
10%
15%
20%
25%
30%
35%
40%
45%
50%
Prairies BritishColumbia
Ontario Quebec Atlantic
Perc
ent o
f Res
pond
ents
Strongly Agree Agree Neutral Disagree Strongly Disagree

75
Figure 5.13: Attitudes toward Domestic Products - Ice Cream Respondents
Source: Created by author using survey data. Number of respondents = 453. Survey Question: “I will ALWAYS buy a domestic product over a foreign product if the prices are within the same
range”
Figure 5.14: Attitudes toward Domestic Products - Ice Cream Respondents (by Location)
Source: Created by author using survey data. Number of respondents = 453. Survey Question: “I will ALWAYS buy a domestic product over a foreign product if the prices are within the same
range”
39%
32%
23%
5% 1%
Strongly Agree Agree Neutral Disagree Strongly Disagree
0%
5%
10%
15%
20%
25%
30%
35%
40%
45%
Prairies BritishColumbia
Ontario Quebec Atlantic
Perc
ent o
f Res
pond
ents
Strongly Agree Agree Neutral Disagree Strongly Disagree
76
5.1.4.4 Purchasing Habits & Preferences for Characteristics of Milk and Ice cream
Respondents’ purchasing habits and preferences for different characteristics of milk and ice
cream were also evaluated. Respondents’ purchasing habits toward milk and ice cream were
evaluated from survey questions that sought to assess respondents’ frequency in purchasing
different brands and types of milk and ice cream. Preferences toward different characteristics
were evaluated by asking respondents to select from a list of factors17 the most and least
important when purchasing milk or ice cream.
Figure 5.15 shows that approximately 70% of respondents to the milk survey indicated that they
had never purchased store brand milk. The result is also similar for milk with both a store brand
label and the 100% Canadian milk symbol, and milk labelled as organic with the 100%
Canadian milk symbol - approximately 68% and 78% respectively of the total number of
respondents indicated that they have never purchased milk with these labels. These results are
however surprising given high number of respondents that indicated their awareness of the 100%
Canadian milk brand. Also, 52% of the total number of respondents indicated that in a typical
month they purchase milk with the 100% Canadian milk symbol at least three times ((27% - 3 to
4 times and 25% over 4 times). National brand milk and national brand milk with the 100%
Canadian milk symbol also seem to be preferred among respondents in comparison to milk with
other label/brand combinations as shown in Figure 5.15.
17 Eight factors were listed: Price, fat content, brand, country of origin, appearance/packaging, nutritional content, taste, expiry date.
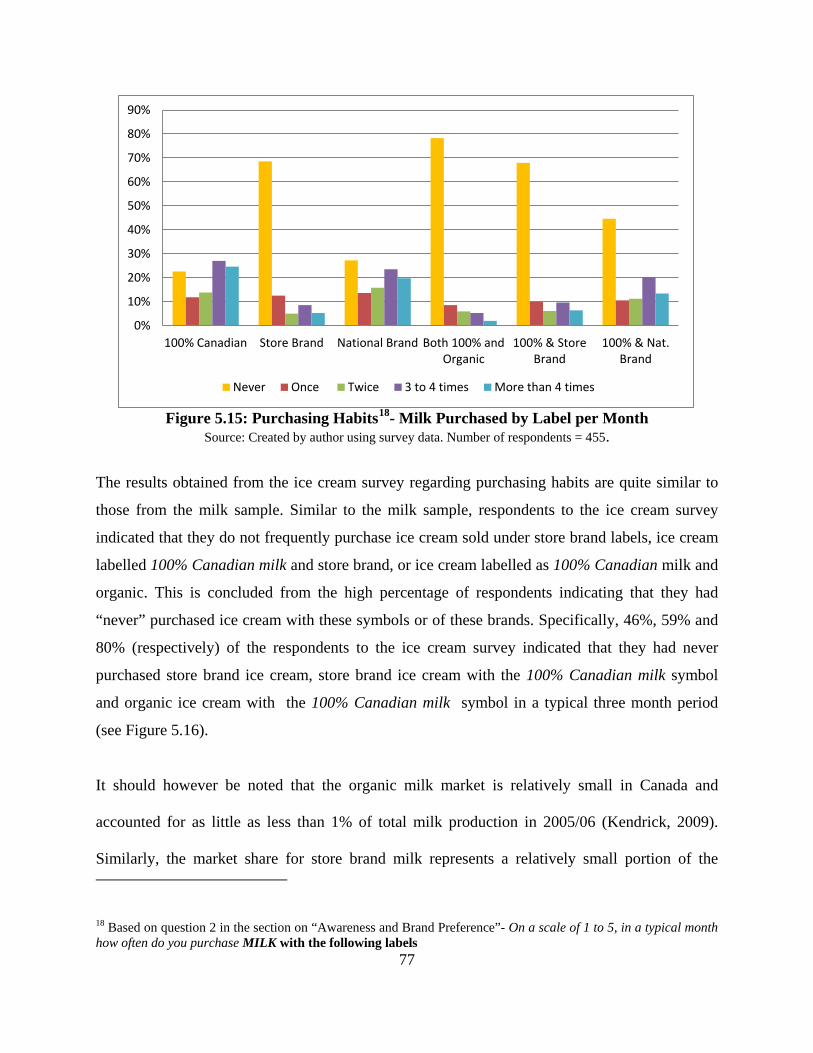
77
Figure 5.15: Purchasing Habits18- Milk Purchased by Label per Month
Source: Created by author using survey data. Number of respondents = 455.
The results obtained from the ice cream survey regarding purchasing habits are quite similar to
those from the milk sample. Similar to the milk sample, respondents to the ice cream survey
indicated that they do not frequently purchase ice cream sold under store brand labels, ice cream
labelled 100% Canadian milk and store brand, or ice cream labelled as 100% Canadian milk and
organic. This is concluded from the high percentage of respondents indicating that they had
“never” purchased ice cream with these symbols or of these brands. Specifically, 46%, 59% and
80% (respectively) of the respondents to the ice cream survey indicated that they had never
purchased store brand ice cream, store brand ice cream with the 100% Canadian milk symbol
and organic ice cream with the 100% Canadian milk symbol in a typical three month period
(see Figure 5.16).
It should however be noted that the organic milk market is relatively small in Canada and
accounted for as little as less than 1% of total milk production in 2005/06 (Kendrick, 2009).
Similarly, the market share for store brand milk represents a relatively small portion of the 18 Based on question 2 in the section on “Awareness and Brand Preference”- On a scale of 1 to 5, in a typical month how often do you purchase MILK with the following labels
0%
10%
20%
30%
40%
50%
60%
70%
80%
90%
100% Canadian Store Brand National Brand Both 100% andOrganic
100% & StoreBrand
100% & Nat.Brand
Never Once Twice 3 to 4 times More than 4 times
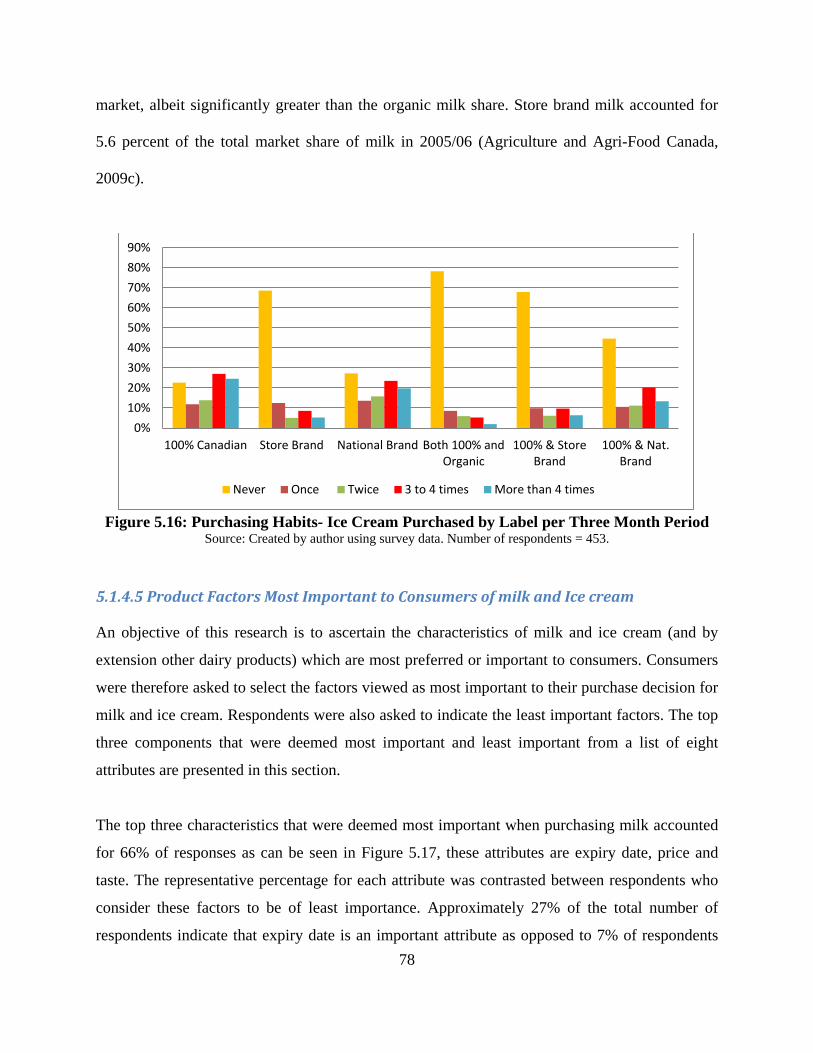
78
market, albeit significantly greater than the organic milk share. Store brand milk accounted for
5.6 percent of the total market share of milk in 2005/06 (Agriculture and Agri-Food Canada,
2009c).
Figure 5.16: Purchasing Habits- Ice Cream Purchased by Label per Three Month Period
Source: Created by author using survey data. Number of respondents = 453.
5.1.4.5 Product Factors Most Important to Consumers of milk and Ice cream
An objective of this research is to ascertain the characteristics of milk and ice cream (and by
extension other dairy products) which are most preferred or important to consumers. Consumers
were therefore asked to select the factors viewed as most important to their purchase decision for
milk and ice cream. Respondents were also asked to indicate the least important factors. The top
three components that were deemed most important and least important from a list of eight
attributes are presented in this section.
The top three characteristics that were deemed most important when purchasing milk accounted
for 66% of responses as can be seen in Figure 5.17, these attributes are expiry date, price and
taste. The representative percentage for each attribute was contrasted between respondents who
consider these factors to be of least importance. Approximately 27% of the total number of
respondents indicate that expiry date is an important attribute as opposed to 7% of respondents
0%10%20%30%40%50%60%70%80%90%
100% Canadian Store Brand National Brand Both 100% andOrganic
100% & StoreBrand
100% & Nat.Brand
Never Once Twice 3 to 4 times More than 4 times
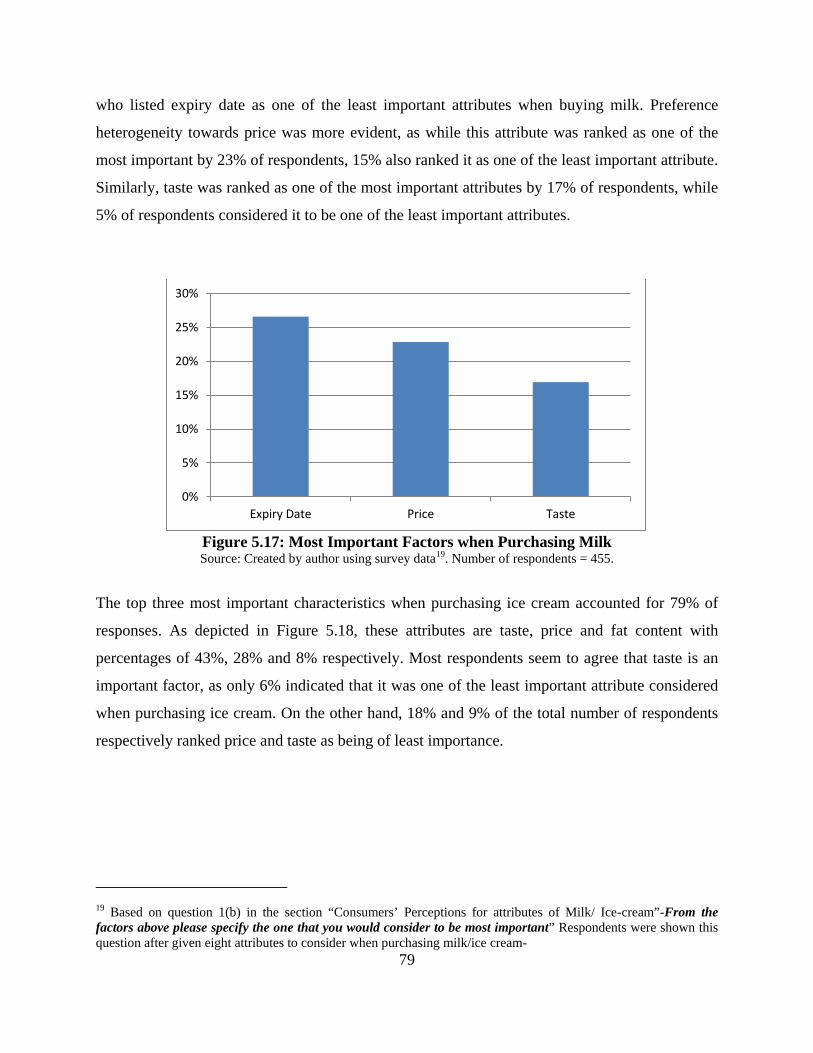
79
who listed expiry date as one of the least important attributes when buying milk. Preference
heterogeneity towards price was more evident, as while this attribute was ranked as one of the
most important by 23% of respondents, 15% also ranked it as one of the least important attribute.
Similarly, taste was ranked as one of the most important attributes by 17% of respondents, while
5% of respondents considered it to be one of the least important attributes.
Figure 5.17: Most Important Factors when Purchasing Milk Source: Created by author using survey data19. Number of respondents = 455.
The top three most important characteristics when purchasing ice cream accounted for 79% of
responses. As depicted in Figure 5.18, these attributes are taste, price and fat content with
percentages of 43%, 28% and 8% respectively. Most respondents seem to agree that taste is an
important factor, as only 6% indicated that it was one of the least important attribute considered
when purchasing ice cream. On the other hand, 18% and 9% of the total number of respondents
respectively ranked price and taste as being of least importance.
19 Based on question 1(b) in the section “Consumers’ Perceptions for attributes of Milk/ Ice-cream”-From the factors above please specify the one that you would consider to be most important” Respondents were shown this question after given eight attributes to consider when purchasing milk/ice cream-
0%
5%
10%
15%
20%
25%
30%
Expiry Date Price Taste
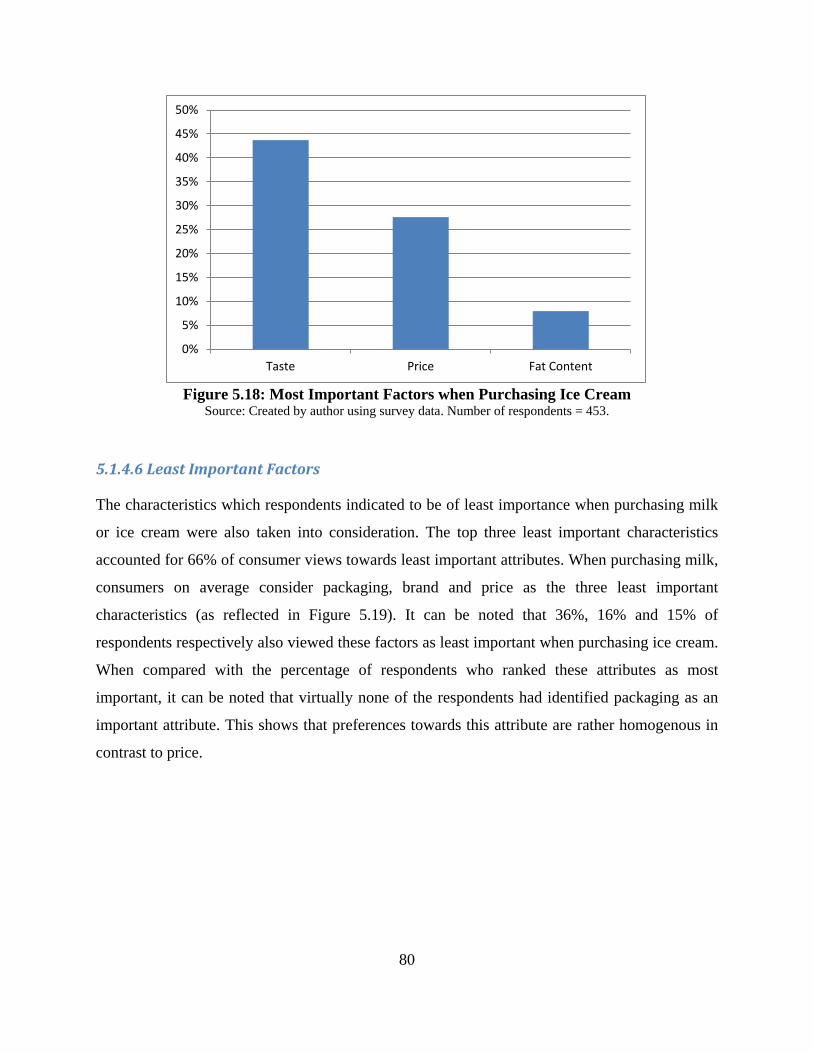
80
Figure 5.18: Most Important Factors when Purchasing Ice Cream
Source: Created by author using survey data. Number of respondents = 453.
5.1.4.6 Least Important Factors
The characteristics which respondents indicated to be of least importance when purchasing milk
or ice cream were also taken into consideration. The top three least important characteristics
accounted for 66% of consumer views towards least important attributes. When purchasing milk,
consumers on average consider packaging, brand and price as the three least important
characteristics (as reflected in Figure 5.19). It can be noted that 36%, 16% and 15% of
respondents respectively also viewed these factors as least important when purchasing ice cream.
When compared with the percentage of respondents who ranked these attributes as most
important, it can be noted that virtually none of the respondents had identified packaging as an
important attribute. This shows that preferences towards this attribute are rather homogenous in
contrast to price.
0%
5%
10%
15%
20%
25%
30%
35%
40%
45%
50%
Taste Price Fat Content

81
Figure 5.19: Least Important Factors when Purchasing Milk Source: Created by author using survey data20. Number of respondents = 455.
The three characteristics (packaging, brand and price) considered to be least important to milk
respondents were also considered to be least important to ice cream respondents although in a
slightly different order (evident from Figure 5.20 below). These three attributes were considered
to be of least importance to 62% of respondents.
Price was ranked as the second least important attribute accounting for 18% of respondents’
views, however as evident above, a greater percentage (28%) of respondents considered it to be
an important attribute. Similar to milk, virtually no-one considered packaging to be important
when purchasing ice cream, while 16% of respondents considered brand to be least important as
opposed to 6% who consider it to be of most importance
20 Question 1(c) in the Survey section “Consumers’ Perceptions for attributes of Milk/ Ice-cream”- “From the factors above please specify the one that you would consider to be least important”. Respondents were shown this question after given eight attributes to consider when purchasing milk/ice cream.
0%
5%
10%
15%
20%
25%
30%
35%
Packaging Price Brand
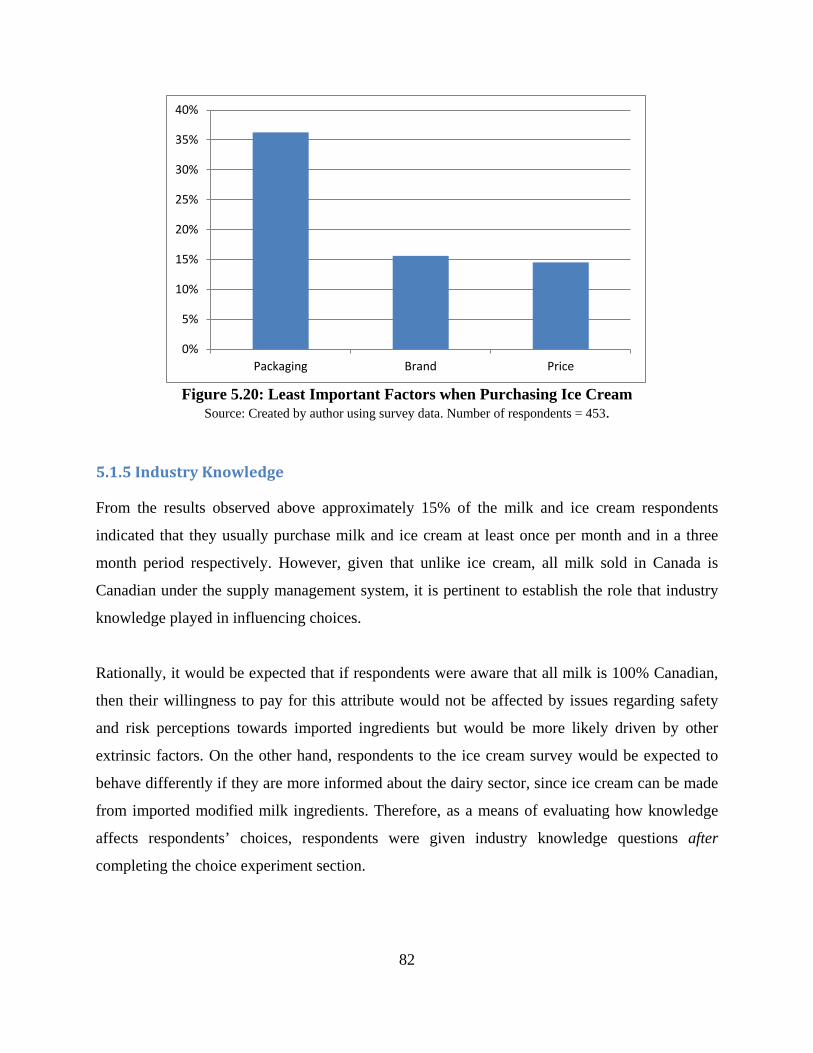
82
Figure 5.20: Least Important Factors when Purchasing Ice Cream
Source: Created by author using survey data. Number of respondents = 453.
5.1.5 Industry Knowledge
From the results observed above approximately 15% of the milk and ice cream respondents
indicated that they usually purchase milk and ice cream at least once per month and in a three
month period respectively. However, given that unlike ice cream, all milk sold in Canada is
Canadian under the supply management system, it is pertinent to establish the role that industry
knowledge played in influencing choices.
Rationally, it would be expected that if respondents were aware that all milk is 100% Canadian,
then their willingness to pay for this attribute would not be affected by issues regarding safety
and risk perceptions towards imported ingredients but would be more likely driven by other
extrinsic factors. On the other hand, respondents to the ice cream survey would be expected to
behave differently if they are more informed about the dairy sector, since ice cream can be made
from imported modified milk ingredients. Therefore, as a means of evaluating how knowledge
affects respondents’ choices, respondents were given industry knowledge questions after
completing the choice experiment section.
0%
5%
10%
15%
20%
25%
30%
35%
40%
Packaging Brand Price
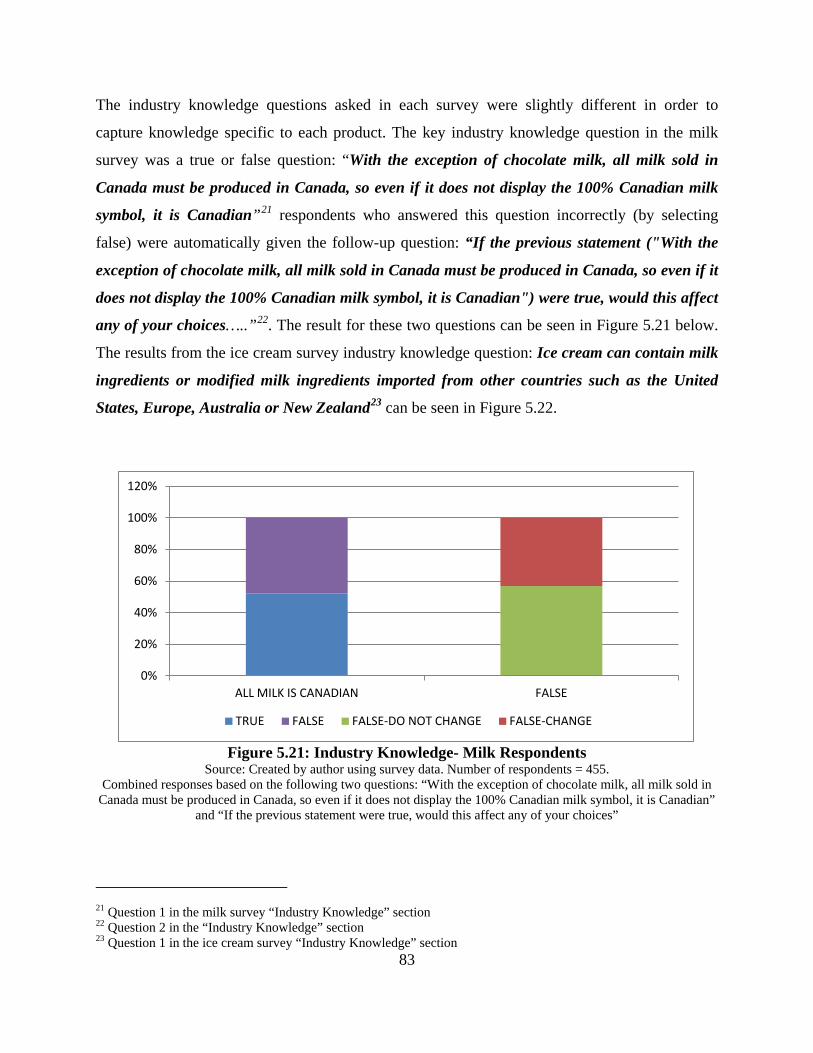
83
The industry knowledge questions asked in each survey were slightly different in order to
capture knowledge specific to each product. The key industry knowledge question in the milk
survey was a true or false question: “With the exception of chocolate milk, all milk sold in
Canada must be produced in Canada, so even if it does not display the 100% Canadian milk
symbol, it is Canadian”21 respondents who answered this question incorrectly (by selecting
false) were automatically given the follow-up question: “If the previous statement ("With the
exception of chocolate milk, all milk sold in Canada must be produced in Canada, so even if it
does not display the 100% Canadian milk symbol, it is Canadian") were true, would this affect
any of your choices…..”22. The result for these two questions can be seen in Figure 5.21 below.
The results from the ice cream survey industry knowledge question: Ice cream can contain milk
ingredients or modified milk ingredients imported from other countries such as the United
States, Europe, Australia or New Zealand23 can be seen in Figure 5.22.
Figure 5.21: Industry Knowledge- Milk Respondents
Source: Created by author using survey data. Number of respondents = 455. Combined responses based on the following two questions: “With the exception of chocolate milk, all milk sold in
Canada must be produced in Canada, so even if it does not display the 100% Canadian milk symbol, it is Canadian” and “If the previous statement were true, would this affect any of your choices”
21 Question 1 in the milk survey “Industry Knowledge” section 22 Question 2 in the “Industry Knowledge” section 23 Question 1 in the ice cream survey “Industry Knowledge” section
0%
20%
40%
60%
80%
100%
120%
ALL MILK IS CANADIAN FALSE
TRUE FALSE FALSE-DO NOT CHANGE FALSE-CHANGE
84
Figure 5.21 indicates that the milk survey respondents were not very knowledgeable of the
Canadian dairy industry as almost 50% of respondents answered the industry knowledge
question incorrectly. On the other hand, respondents to the ice cream survey appeared more
knowledgeable as 71% answered the question correctly (see Figure 5.22).
The implication of the milk respondents being less knowledgeable about the dairy industry than
the ice cream respondents is significant given that respondents’ WTP for milk with the 100%
Canadian milk symbol may be positively influenced due to their lack of knowledge. In essence,
respondents may be willing to pay more because they think they are receiving additional tangible
benefits from buying milk with the symbol while in fact this may not be true as all milk is
already 100% Canadian.
Of the number of respondents who provided an incorrect response to the industry knowledge
question in the milk survey, 43% acknowledged that their choices in the discrete choice section
would change if their answer to the knowledge question was incorrect (see Figure 5.21). The
implication of this is that slightly under 25% of respondents to the milk survey might have
responded differently had they known that milk is Canadian. The implication of the milk results
is that respondents’ WTP a premium for the 100% Canadian milk symbol attribute is perhaps
influenced by their lack of knowledge but clearly not entirely.
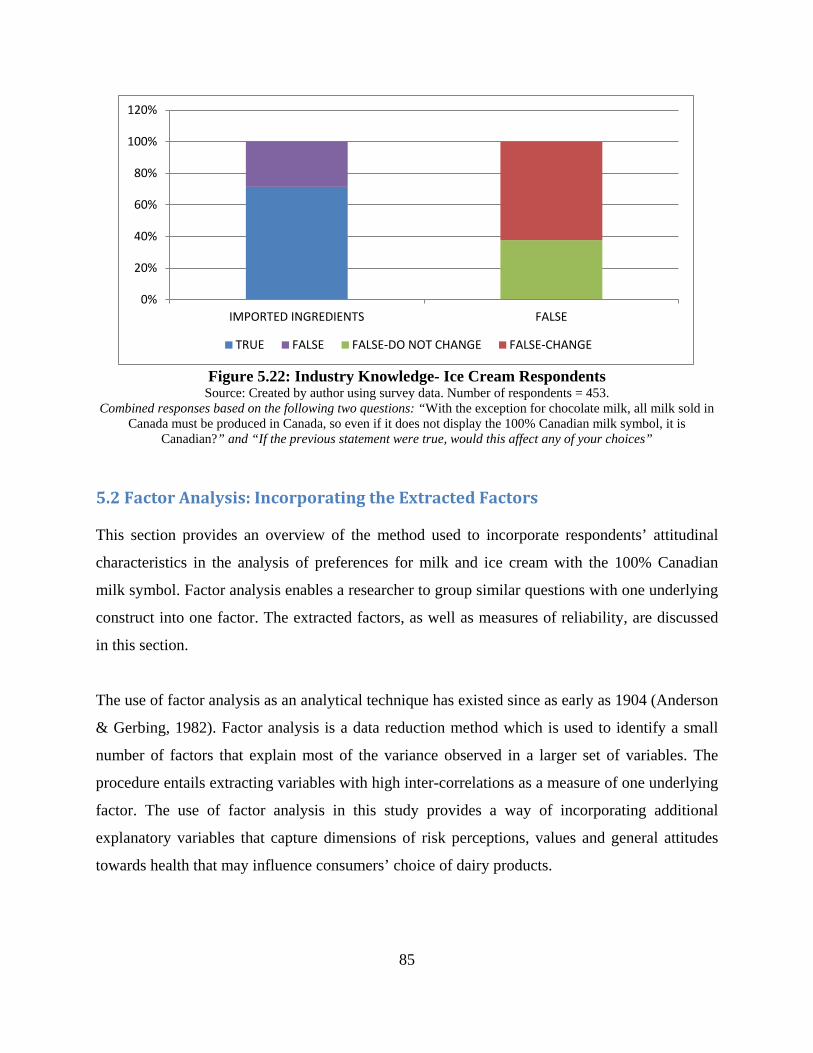
85
Figure 5.22: Industry Knowledge- Ice Cream Respondents
Source: Created by author using survey data. Number of respondents = 453. Combined responses based on the following two questions: “With the exception for chocolate milk, all milk sold in
Canada must be produced in Canada, so even if it does not display the 100% Canadian milk symbol, it is Canadian?” and “If the previous statement were true, would this affect any of your choices”
5.2 Factor Analysis: Incorporating the Extracted Factors
This section provides an overview of the method used to incorporate respondents’ attitudinal
characteristics in the analysis of preferences for milk and ice cream with the 100% Canadian
milk symbol. Factor analysis enables a researcher to group similar questions with one underlying
construct into one factor. The extracted factors, as well as measures of reliability, are discussed
in this section.
The use of factor analysis as an analytical technique has existed since as early as 1904 (Anderson
& Gerbing, 1982). Factor analysis is a data reduction method which is used to identify a small
number of factors that explain most of the variance observed in a larger set of variables. The
procedure entails extracting variables with high inter-correlations as a measure of one underlying
factor. The use of factor analysis in this study provides a way of incorporating additional
explanatory variables that capture dimensions of risk perceptions, values and general attitudes
towards health that may influence consumers’ choice of dairy products.
0%
20%
40%
60%
80%
100%
120%
IMPORTED INGREDIENTS FALSE
TRUE FALSE FALSE-DO NOT CHANGE FALSE-CHANGE
86
There are two types of factor analyses: confirmatory and exploratory factor analysis.
Confirmatory Factor Analysis is employed in situations where the analyst already has some idea
(based on past studies) of the theoretical construct of the variables (Anderson & Gerbing, 1982).
Exploratory Factor Analysis is used when the latent factors affecting the variable in question are
being tested from a set of possibly related variables. Exploratory factor analysis is a statistical
technique widely used in the social sciences (Costello & Osborne, 2005). Exploratory factor
analysis was the approach used to elicit the three initial factors (based on respondents’ health
profiles, risk perceptions and values).
Generally, prior to applying a factor analysis approach it is necessary to determine if the method
is suitable. The viability of using factor analysis can be ascertained through the Kaiser-Meyer-
Olkin Measure of Sampling Adequacy and Bartlett's Test of Sphericity. The Kaiser-Meyer-Olkin
Measure of Sampling Adequacy varies between 0 and 1, with values closer to 1 being better.
This test measures the strength of the relationship between variables, with values closer to 1
indicating greater relationship strength. A value of 0.5 is the suggested minimum (Williams,
Onsman, & Brown, 2010). In addition the Bartlett's test of sphericity can be used to test the null
hypothesis that the correlation matrix is an identity matrix. If the null indicates that the
correlation matrix is an identity matrix then this indicates that the variables in the correlation
matrix are uncorrelated. If the null hypothesis is rejected and the Kaiser-Meyer-Olkin Measure of
sampling adequacy is above .6 then factor analysis can be used. For this thesis the Kaiser-Meyer-
Olkin Measure of Sampling Adequacy was .796 for the milk data and .807 for the ice cream
sample. Also Bartlett's Test of Sphericity was rejected thereby confirming the appropriateness of
factor analysis for the data.
Having verified that factor analysis is appropriate, there are different benchmarks that can be
used to determine the number of factors to extract. The Kaiser Criterion is one such benchmark.
It stipulates that the “optimal” number of factors with eigenvalues greater than one can be
included as a factor. The Kaiser criterion can however cause more factors than necessary to be
retained, in addition, it has been suggested that this is the least accurate method to use (Costello
& Osborne, 2005). Another method that can be used to determine the “optimal” number of
factors to retain is the scree plot, which graphically depicts the magnitude of each extracted

87
factor in descending order and therefore indicates the relative importance of each extracted
factor. As a rule of thumb, the number of factors should be equal to the number of factors that
occur prior to the last major drop in magnitude evident from the scree plot. In this particular
case, the scree plot and prior expectations were used to decide on the number of factors to retain.
However because of prior expectations based on survey question design and research
hypotheses, factor extraction was restricted to three factors24. Factor loadings that are above 0.5
are displayed as those below were suppressed in the output leading to cleaner or less ambiguous
factors being obtained.
The three factor components that were extracted from both the milk and ice cream data and can
be labelled as: 1) Health consciousness, 2) Domestic values, 3) Risk Preference or Risk
perception respectively. The questions defining each factor were all 5 point likert scale
questions.
Tables 5.3 and 5.4 indicate the factors that were extracted from the milk and ice cream survey
data respectively and represent actual survey questions. Values that are closest to 1 are preferred
as it indicates the strength of correlation between all variables defining the factor. As it relates to
the health factor (factor 1), the questions comprising this factor have a likert scale of 1 to 5,
where 1 indicates that respondents strongly agree with the question and 5 indicates strong
disagreement. Six questions define the health consciousness factor for the milk sample, while
seven questions define the same factor for the ice cream survey sample (See Tables 5.3 and 5.4).
Therefore, a respondent who selected one on the five point likert scale for the questions defining
the health factor in the milk sample indicates that they purchase fast-food quite frequently and
would therefore be considered less health conscious than individuals who selected 5 for these
questions.
Similarly, the questions defining factor 2 measure the construct of individuals’ domestic values
relating to patriotism. This factor is defined by five questions for the milk respondents and six
questions for the ice cream respondents. Selecting 1 on the scale of 1 to 5 for any of these 24 The results generated for both the milk and ice cream sample for the three factors can be seen in Appendices D and E respectively.
88
questions is an indication of relatively strong values as opposed to selecting 4 or 5. It is
hypothesized that individuals with strong values (lower likert scale numbers) will have a greater
willingness to pay for products with the 100% Canadian milk attribute.
The third factor measures the underlying construct of respondents’ risk preferences. As can be
observed in Tables 5.3 and 5.4 this factor is relatively weak given that it is defined by three
variables (Table 5.3) and the strength of correlation between the variables is relatively low
(Table 5.4). Nonetheless, respondents selecting low values as opposed to high values have a
higher risk preference, as selecting 1 for any of these questions shows that respondents have high
levels of risk preference as opposed to 5 which indicates a low level of risk preference. It is
expected that respondents with relatively low levels of risk preference will have a greater
willingness to pay for products with the 100% Canadian milk symbol based on the premise that
these individuals may want the reassurance that they are buying domestic products as opposed to
imports.
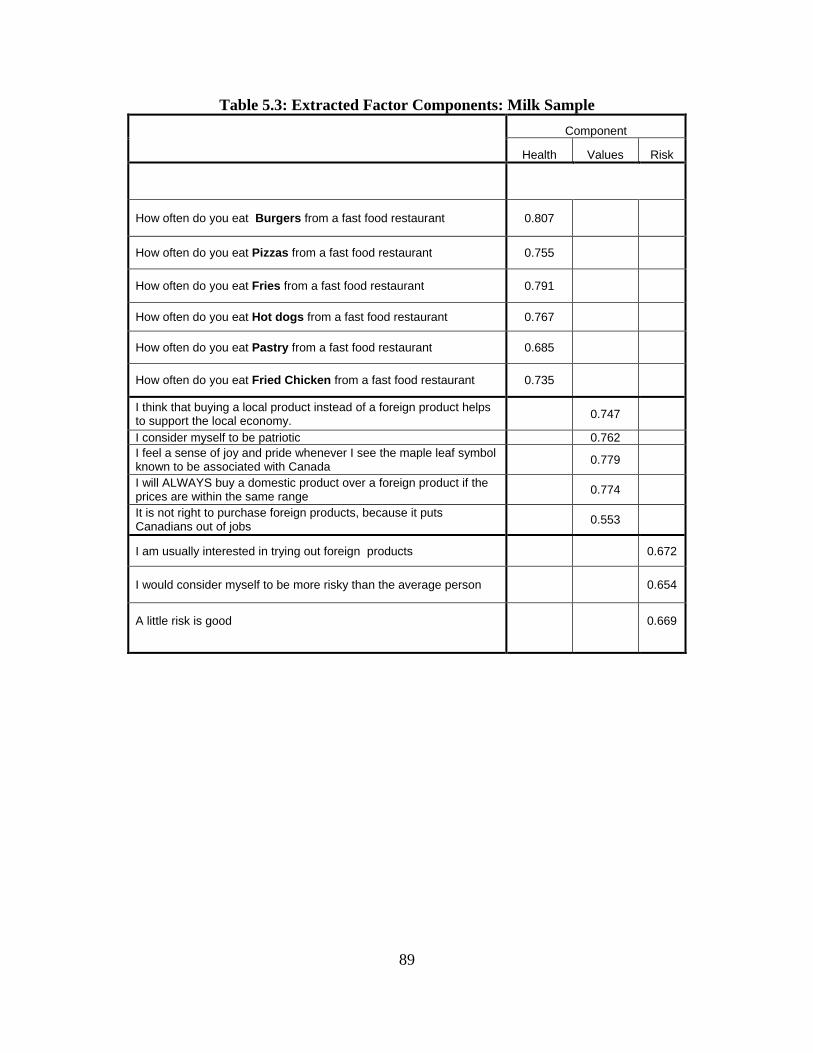
89
Table 5.3: Extracted Factor Components: Milk Sample
Component
Health Values Risk
How often do you eat Burgers from a fast food restaurant 0.807
How often do you eat Pizzas from a fast food restaurant 0.755
How often do you eat Fries from a fast food restaurant 0.791
How often do you eat Hot dogs from a fast food restaurant 0.767
How often do you eat Pastry from a fast food restaurant 0.685
How often do you eat Fried Chicken from a fast food restaurant 0.735
I think that buying a local product instead of a foreign product helps to support the local economy. 0.747
I consider myself to be patriotic 0.762 I feel a sense of joy and pride whenever I see the maple leaf symbol known to be associated with Canada 0.779
I will ALWAYS buy a domestic product over a foreign product if the prices are within the same range 0.774
It is not right to purchase foreign products, because it puts Canadians out of jobs 0.553
I am usually interested in trying out foreign products 0.672
I would consider myself to be more risky than the average person 0.654
A little risk is good 0.669
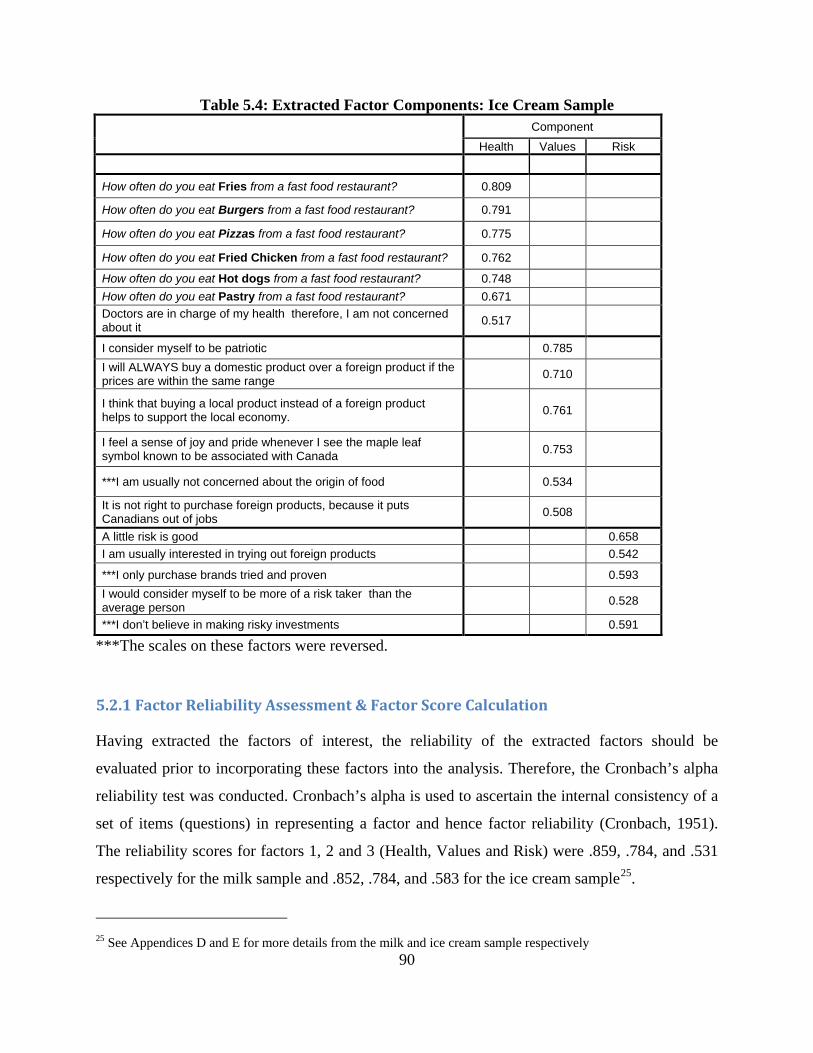
90
Table 5.4: Extracted Factor Components: Ice Cream Sample
Component Health Values Risk
How often do you eat Fries from a fast food restaurant? 0.809
How often do you eat Burgers from a fast food restaurant? 0.791
How often do you eat Pizzas from a fast food restaurant? 0.775
How often do you eat Fried Chicken from a fast food restaurant? 0.762
How often do you eat Hot dogs from a fast food restaurant? 0.748 How often do you eat Pastry from a fast food restaurant? 0.671 Doctors are in charge of my health therefore, I am not concerned about it 0.517
I consider myself to be patriotic 0.785 I will ALWAYS buy a domestic product over a foreign product if the prices are within the same range 0.710
I think that buying a local product instead of a foreign product helps to support the local economy. 0.761
I feel a sense of joy and pride whenever I see the maple leaf symbol known to be associated with Canada 0.753
***I am usually not concerned about the origin of food 0.534
It is not right to purchase foreign products, because it puts Canadians out of jobs 0.508
A little risk is good 0.658 I am usually interested in trying out foreign products 0.542
***I only purchase brands tried and proven 0.593 I would consider myself to be more of a risk taker than the average person
0.528
***I don’t believe in making risky investments 0.591
***The scales on these factors were reversed.
5.2.1 Factor Reliability Assessment & Factor Score Calculation
Having extracted the factors of interest, the reliability of the extracted factors should be
evaluated prior to incorporating these factors into the analysis. Therefore, the Cronbach’s alpha
reliability test was conducted. Cronbach’s alpha is used to ascertain the internal consistency of a
set of items (questions) in representing a factor and hence factor reliability (Cronbach, 1951).
The reliability scores for factors 1, 2 and 3 (Health, Values and Risk) were .859, .784, and .531
respectively for the milk sample and .852, .784, and .583 for the ice cream sample25.
25 See Appendices D and E for more details from the milk and ice cream sample respectively
91
The reliability scores for the risk preference factor from both the milk and ice cream samples
have low levels of internal consistency (below .6) among the variables included, but an
acceptable measure of internal consistency nonetheless. Darren and Mallery (2003) suggests that
an alpha below 0.5 is unacceptable, however, the alpha for the risk preference factor, although
low is greater than 0.5. In addition, the level of unidimensionality for both risk preference factors
can be evaluated to confirm that the factor is measuring one underlying construct. Lack of
unidimensionality is an indication of measurement misspecification (Anderson & Gerbing,
1982). Unidimensionality can be evaluated by conducting a confirmatory factor analysis26 using
only the variables included in defining the risk preference factor in both samples.
Unidimensionality was evident from confirmatory factor analyses which indicated that the risk
preference factor in both samples measure one latent construct, as the eigen values for the first
variable were approximately 52% in the milk sample and 38% in the ice cream sample. This
therefore justifies the inclusion of factor three (risk preference) in the analysis although the alpha
has borderline acceptability. However caution should be applied when making extrapolations
based on this factor given the relatively low reliability.
From the factor components extracted, factor scores were computed for each of the three factors
to facilitate the incorporation of each variable in the analysis. The factor scores are computed by
the multiplication of each factor loading (factor loadings are depicted in Tables 5.3 and 5.4)
relevant to a specific factor component by the respondent’s score (response on the likert scale)
and then summing over all variables to get a factor score for each individual respondent.
Therefore, each individual is assigned their own factor score for each of the extracted factors. If a
respondent has a relatively high factor score for the health factor, for example, then this indicates
that this individual is relatively health conscious based on the premise that health conscious
individuals consume less fast-food (recall that high likert scale values represent relatively low
frequency of consumption for fast food products). Also a high score for domestic values
indicates that these respondents have relatively low domestic values, and a high score for risk
preference can be used as an indication that these respondents are more risk averse. 26 Confirmatory analyses were conducted for all the factors for both the milk and ice cream samples. The relevant tables can be found in Appendices D and E in the tables depicting the Total variance explained.

92
The derived factor scores will facilitate the testing of the hypotheses outlined in Chapter 3,
namely that: health conscious respondents may express significantly different WTP than
respondents who are less health conscious. This hypothesis is based on the premise that health
conscious consumers (high factor scores in this study) may search more for quality cues when
shopping. These individuals may also be more conscious of labelling and more concerned about
the origin of ingredients in their food products. According to Agriculture and Agri-Food Canada,
consumers mainly view freshness, nutrition and food safety as quality cues (Agriculture and
Agri-Food Canada, 2009a). Therefore, these individuals may more readily pay for food that they
perceive as being more nutritious or healthier such as ice cream made from 100% Canadian milk
as opposed to modified milk ingredients. In addition, it is expected that respondents with
relatively high domestic values (low factor scores) will also be willing to pay a premium for ice
cream and milk with the 100% Canadian milk symbol as opposed to respondents with lower
domestic values (based on their factor scores). It was also hypothesized that consumers who are
risk averse (high factor scores) will have a greater WTP for products with the 100% Canadian
milk symbol. The factor scores are used to test these hypotheses through the incorporation in the
discrete choice model estimations of interactions between the factor scores and the 100%
Canadian milk attribute. The interaction between these factors and the 100% Canadian milk
attribute were incorporated as chealth, cpatriot, and crisk, respectively.
5.3 Chapter Summary
The descriptive results from both the milk and ice cream samples were presented in this chapter.
The information offered insights into respondents’ perceptions, purchasing habits and attitudes
toward different characteristics of milk and ice cream and how these factors differed according to
respondents’ location. In addition, the factor analysis approach employed in this study was also
discussed. Three factors relevant to assessing respondents’ choices were extracted: health
consciousness, domestic values and risk preferences. The following chapter will show how these
factors influence preferences and respondents’ willingness to pay for milk and ice cream with the
100% Canadian milk attribute.

93
Chapter 6: Results: Product Attributes and Individual Factors Affecting WTP for the 100% Canadian Milk Symbol This chapter builds on the preceding chapter by introducing the variables used in estimating the
Multinomial logit (MNL) and the Random Parameter Logit (RPL) models. The coding of the
survey data is also discussed. More importantly, results from the estimations are analyzed and
discussed. The results presented are those from the MNL main effects model and various
modifications of the RPL model. Both main effects variables and interaction terms are estimated
using the milk and ice cream survey data. From the models different willingness to pay estimates
are calculated and compared. The hypotheses posited in Chapter 3 are tested and implications are
drawn.
6.1 Coding the Variables
Dummy coding and effects coding were used in coding the variables in the choice experiment.
The attributes in the choice section of the survey (type: organic or conventional, brand: store or
national and 100% Canadian: present or absent) were effects coded, price however remained
continuous. Effects coding was used in contrast to dummy coding because as authors such as
Hensher et al. (2005) and Bech and Gyrd-Hansen (2005) posit, there is an inherent problem with
dummy coding attribute levels. Given that the effect of the base level cannot be separated from
that of the regression constant, such coding potentially results in perfect confoundment with the
grand mean of the regression. Covariates such as gender, income, education and language,
however, were dummy coded. As shown below, Table 6.1a and Table 6.1b provide descriptions
of the variables used in the estimation process and explain how each variable was coded for use
in the estimations.
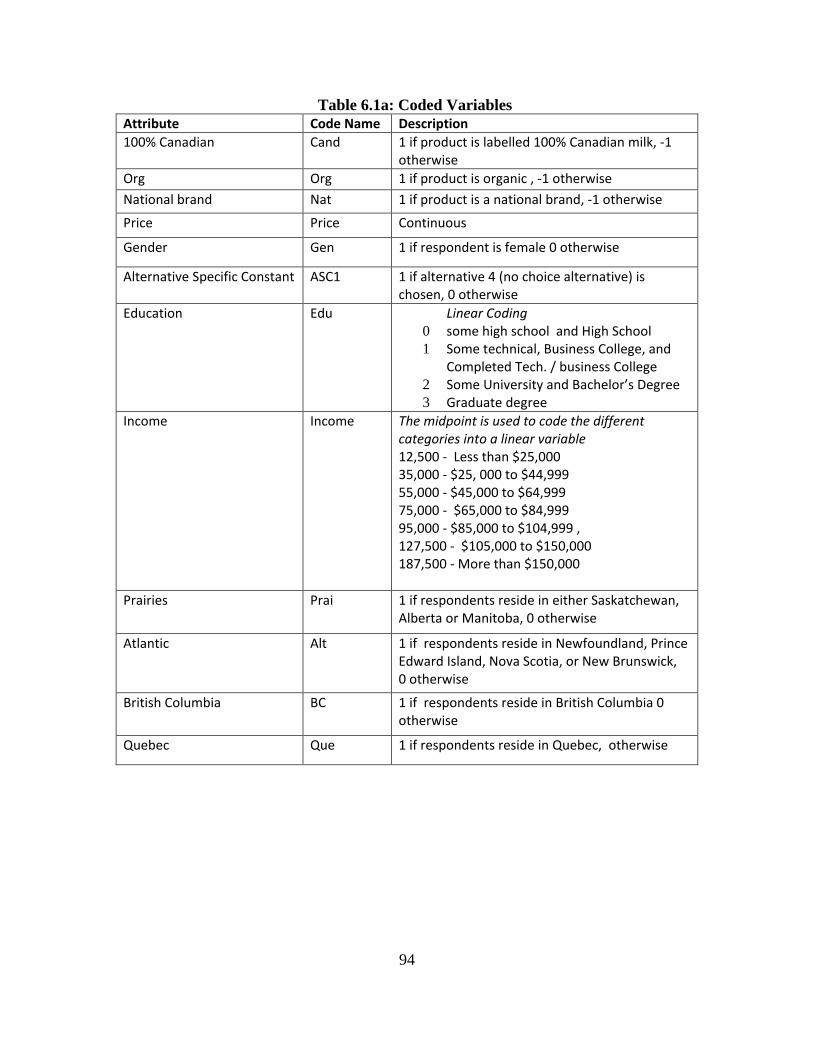
94
Table 6.1a: Coded Variables Attribute Code Name Description 100% Canadian Cand 1 if product is labelled 100% Canadian milk, -1
otherwise Org Org 1 if product is organic , -1 otherwise National brand Nat 1 if product is a national brand, -1 otherwise
Price Price Continuous
Gender Gen 1 if respondent is female 0 otherwise
Alternative Specific Constant ASC1 1 if alternative 4 (no choice alternative) is chosen, 0 otherwise
Education Edu Linear Coding 0 some high school and High School 1 Some technical, Business College, and
Completed Tech. / business College 2 Some University and Bachelor’s Degree 3 Graduate degree
Income Income The midpoint is used to code the different categories into a linear variable 12,500 - Less than $25,000 35,000 - $25, 000 to $44,999 55,000 - $45,000 to $64,999 75,000 - $65,000 to $84,999 95,000 - $85,000 to $104,999 , 127,500 - $105,000 to $150,000 187,500 - More than $150,000
Prairies Prai 1 if respondents reside in either Saskatchewan, Alberta or Manitoba, 0 otherwise
Atlantic Alt 1 if respondents reside in Newfoundland, Prince Edward Island, Nova Scotia, or New Brunswick, 0 otherwise
British Columbia BC 1 if respondents reside in British Columbia 0 otherwise
Quebec Que 1 if respondents reside in Quebec, otherwise
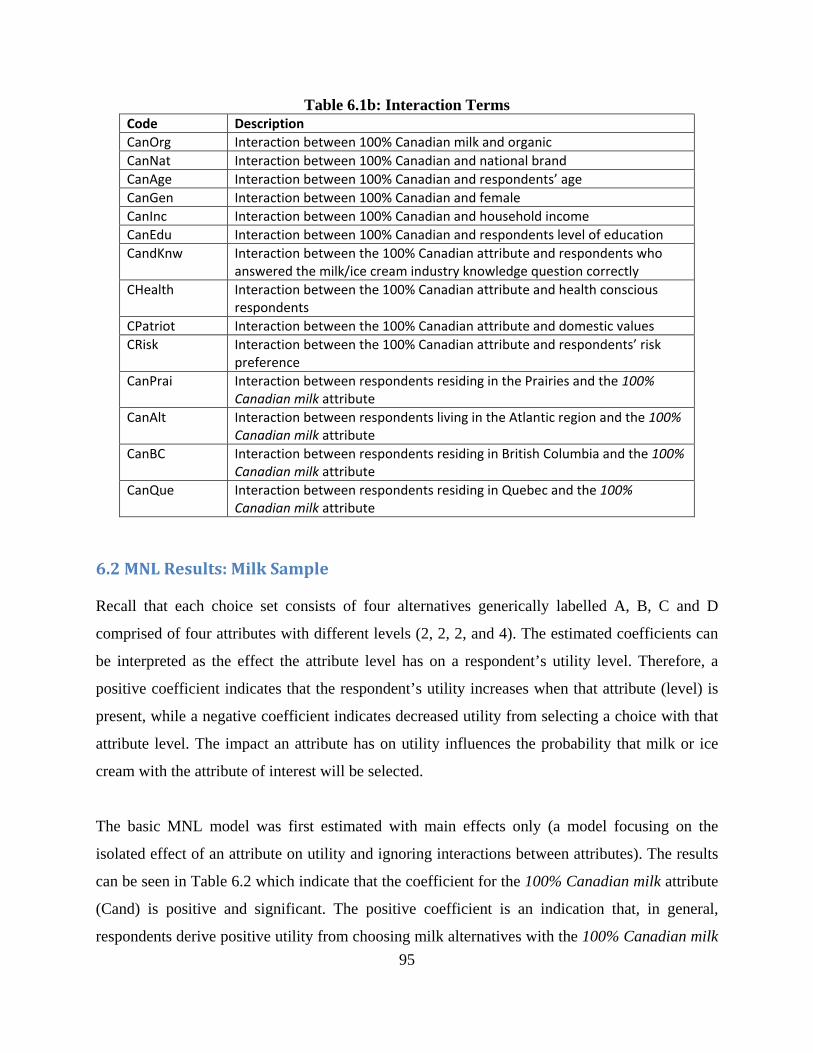
95
Table 6.1b: Interaction Terms Code Description CanOrg Interaction between 100% Canadian milk and organic CanNat Interaction between 100% Canadian and national brand CanAge Interaction between 100% Canadian and respondents’ age CanGen Interaction between 100% Canadian and female CanInc Interaction between 100% Canadian and household income CanEdu Interaction between 100% Canadian and respondents level of education CandKnw Interaction between the 100% Canadian attribute and respondents who
answered the milk/ice cream industry knowledge question correctly CHealth Interaction between the 100% Canadian attribute and health conscious
respondents CPatriot Interaction between the 100% Canadian attribute and domestic values CRisk Interaction between the 100% Canadian attribute and respondents’ risk
preference CanPrai Interaction between respondents residing in the Prairies and the 100%
Canadian milk attribute CanAlt Interaction between respondents living in the Atlantic region and the 100%
Canadian milk attribute CanBC Interaction between respondents residing in British Columbia and the 100%
Canadian milk attribute CanQue Interaction between respondents residing in Quebec and the 100%
Canadian milk attribute
6.2 MNL Results: Milk Sample
Recall that each choice set consists of four alternatives generically labelled A, B, C and D
comprised of four attributes with different levels (2, 2, 2, and 4). The estimated coefficients can
be interpreted as the effect the attribute level has on a respondent’s utility level. Therefore, a
positive coefficient indicates that the respondent’s utility increases when that attribute (level) is
present, while a negative coefficient indicates decreased utility from selecting a choice with that
attribute level. The impact an attribute has on utility influences the probability that milk or ice
cream with the attribute of interest will be selected.
The basic MNL model was first estimated with main effects only (a model focusing on the
isolated effect of an attribute on utility and ignoring interactions between attributes). The results
can be seen in Table 6.2 which indicate that the coefficient for the 100% Canadian milk attribute
(Cand) is positive and significant. The positive coefficient is an indication that, in general,
respondents derive positive utility from choosing milk alternatives with the 100% Canadian milk

96
attribute. The willingness-to-pay column (labelled WTP) represents the premium that consumers
are willing to pay for having an attribute present. It can be noted that respondents are willing to
pay an additional $2.09 for a 2-litre carton of milk with the 100% Canadian milk symbol.
From Table 6.2 it can also be observed that the coefficient of the second attribute representing
organic milk (Org) is negative and significant, indicating that respondents on average derive
negative utility from choosing an organic milk alternative. In addition, it can also be observed
that respondents discount milk labelled as organic by 64 cents as opposed to conventional milk.
This finding is surprising since in reality a market does exist for organic milk, albeit fairly small.
However, it should be noted that the MNL takes into consideration preferences on average and
does not account for heterogeneity in preferences. Therefore the estimated willingness to pay can
be more precisely interpreted as WTP on average which does not mean this attribute is not
valued by some respondents. Another possible explanation for the negative coefficient is
hypothetical bias. Hensher (2010) posits that hypothetical bias is usually a concern in stated
preference studies. He further noted that this occurrence can result in deviations in estimation
results from real market evidence.
The next coefficient presented in Table 6.2 represents national brand milk, which is positive and
significant. The sign of the coefficient indicates that respondents receive higher utility from
choosing milk with the national brand attribute relative to the store brand attribute.
Table 6.2 also shows that the estimated regression produces a negative price coefficient, which
indicates lower utility from higher milk prices. The sign of the coefficient is consistent with a
priori expectations as we generally expect consumers to prefer lower prices. In addition, the
negative sign of the alternative specific constant (ASC1) shows that respondents on average
prefer one of the three milk alternatives (A, B, or C rather than the no purchase option,
alternative D).

97
Table 6.2: Milk- MNL Main Effects Variable Coefficient T-ratio WTP T-ratio Cand .643*** 28.612 2.093*** 21.643 Org -.197*** -9.746 -.64*** -9.069 Nat .09*** 3.571 .292*** 3.596 Price -.615*** -24.926 - - ASC1 -4.1*** -33.898 - - Pseudo R2 0.185 Log likelihood Function -3711.74 ***,** and * represent significance at the 1%, 5% and 10%
Although most of the coefficient signs presented in Table 6.2 are consistent with a priori
expectations, the basic MNL model displays a relatively poor fit for the data. This is evident
from a low McFadden pseudo R2 value of .19. According to Hensher et al. (2005) a pseudo R2
value ranging between .20 and .40 reflects a relatively good fit. As highlighted in Chapter 4,
several adjustments can be made in an attempt to improve the model fit. These modifications
include the use of interaction terms, and the estimation of a more advanced model to account for
heterogeneity. Both of these methods are explored as the RPL model is estimated with both main
and interaction effects. The RPL model is able to accommodate preference heterogeneity among
respondents27.
6.3 Random Parameter Logit Results: Milk Sample
The RPL approach to estimating consumers’ choices provide an opportunity to account for
heterogeneity in consumers’ preferences. Specifically, differences in individuals’ preferences for
various attributes can be taken into consideration. Estimating RPL models is expected to provide
better model fits and higher pseudo R2 values. A RPL was first estimated with main effects only.
In this model price and the alternative specific constant were estimated as fixed parameters while
the other main effects attributes (100% Canadian milk, organic, national brand) were estimated
as random parameters.
27 It is the norm to test for IIA before moving on to a more advanced model such as the RPL. The Hausman test requires the estimation of an unrestricted model – that is a model inclusive of all alternatives, and a restricted model – a model that is estimated with the exclusion of at least one alternative. The Hausman test was conducted and it was confirmed that a model less restrictive than the MNL would be more appropriate for the data. Results for the Hausman test for the milk and ice cream data are located in Appendix K
98
6.3.1 Random Parameter Logit Main Effects
In comparison to the results from the MNL model in Table 6.2, the RPL logit presented in Table
6.3 below provides an improvement in the goodness of fit evident from an improvement in the
pseudo R2 to 0.27 as opposed to .19 in the previous MNL main effects logit model. A pseudo
R2 of 0.27 is an acceptable fit according to the benchmark provided by Hensher et al. (2005).
As previously noted, the parameters of the MNL model were estimated as fixed and as such do
not account for heterogeneity in preferences across respondents. In contrast, the parameters in
the RPL model can be specified to follow various distribution patterns such as normal, triangular,
lognormal or any other specified distribution. In estimating the RPL model, the random
parameters were specified to follow a normal distribution as both negative and positive
preferences and perceptions can easily be accounted for when this distribution is employed.
From observing Table 6.3, it can be noted that the results from the RPL model are consistent
with those from the MNL model - the signs of the parameters remain the same and are also
highly significant. However, the WTP estimate for the 100% Canadian milk attribute was
marginally greater at $2.20 in comparison to the main effects MNL estimate at $2.09, while the
WTP values for organic labelled and national brand milk were also approximately the same at -
68 cents and 21 cents respectively.
The fixed coefficients in the model, namely price and the no-purchase option, represent non-
random or average utility values which suggest that respondents’ preferences for these attributes
are homogeneous and can be ascertained from the mean preferences for these attributes. This
conclusion was drawn from observing that allowing these variables to be random resulted in
insignificant standard deviations. An insignificant standard deviation suggests that there is no
significant dispersion around the mean as it relates to preferences. The significance of the
standard deviation of the random parameters indicate sources of heterogeneity in respondent’s
choices of milk with the 100% Canadian milk symbol, milk labelled as organic or national
brand.

99
Table 6.3: Milk- RPL Main Effects Variable Coefficient T-Ratio WTP T-Ratio
Random Parameters in Utility Function Cand .882*** 16.051 2.196*** 21.266 Org -.273*** -8.751 -.68*** -9.107 Nat .084*** 2.35 .208*** 2.323
Non-random Parameters in Utility Function Price -.803*** -16.724 - - ASC1 -4.756*** -24.262 - -
Derived Standard Deviations of Parameter Distributions NsCand .597*** 4.411 - - NsOrg .604*** 5.078 - - NsNat .832*** 8.079 - - Pseudo R2 0.270 Log likelihood Function -3683.9 ***,** and * represent significance at the 1%, 5% and 10% level respectively
In addition to exhibiting an improved model fit, the results from the RPL model in Table 6.3
have an additional benefit in that, by estimating random variables following a normal
distribution, deeper analysis and more meaningful inferences can be drawn from the results.
Specifically, the number of respondents with either a preference or dislike for the attributes
estimated as random parameters can be evaluated from the distribution. Because the normal
distribution captures a positive and a negative dispersion around the mean, both positive and
negative attribute preferences can be captured. In line with Hu, Veeman, & Adamowicz (2005)
and Train (2009) - for a random parameter that is normally distributed, the probability of 𝛽 < 0
can be represented as Φ {(0-b)/𝜎} and the probability of 𝛽 > 0 can be estimated as 1- Φ {(0-
b)/σ}, the density function of the normal distribution can be represented as Φ(𝛽|𝑏,𝜎2).
In evaluating respondents’ preferences for the randomly estimated attributes it can be noted that
the 100% Canadian milk attribute is strongly preferred among respondents as 93% of
respondents have a positive perception of this attribute. Table 6.4 reveals that the organic and
national brand attributes elicit weaker preferences, as only about one-third of respondents
indicated a preference for organic milk and 54% indicated a preference for national brand milk.
The results of these preferences are indicative of consumers’ WTP for these attributes as
respondents on average discounted organic milk relative to conventional milk. On the other
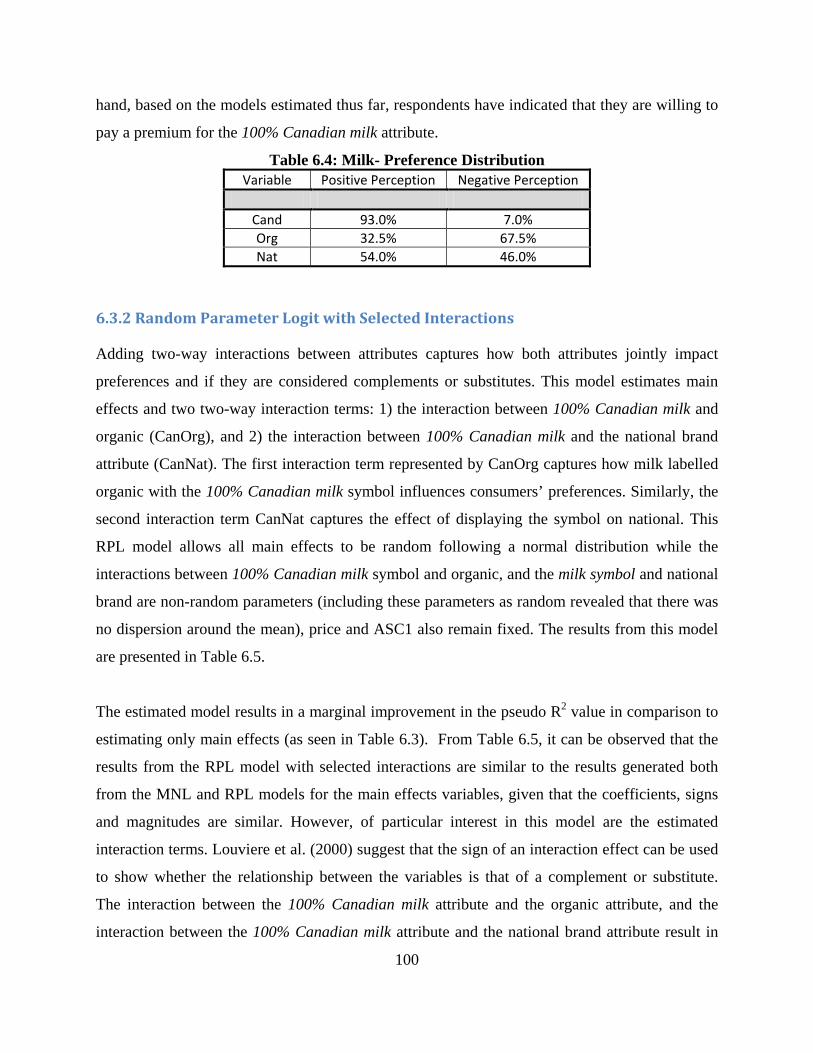
100
hand, based on the models estimated thus far, respondents have indicated that they are willing to
pay a premium for the 100% Canadian milk attribute.
Table 6.4: Milk- Preference Distribution Variable Positive Perception Negative Perception
Cand 93.0% 7.0% Org 32.5% 67.5% Nat 54.0% 46.0%
6.3.2 Random Parameter Logit with Selected Interactions
Adding two-way interactions between attributes captures how both attributes jointly impact
preferences and if they are considered complements or substitutes. This model estimates main
effects and two two-way interaction terms: 1) the interaction between 100% Canadian milk and
organic (CanOrg), and 2) the interaction between 100% Canadian milk and the national brand
attribute (CanNat). The first interaction term represented by CanOrg captures how milk labelled
organic with the 100% Canadian milk symbol influences consumers’ preferences. Similarly, the
second interaction term CanNat captures the effect of displaying the symbol on national. This
RPL model allows all main effects to be random following a normal distribution while the
interactions between 100% Canadian milk symbol and organic, and the milk symbol and national
brand are non-random parameters (including these parameters as random revealed that there was
no dispersion around the mean), price and ASC1 also remain fixed. The results from this model
are presented in Table 6.5.
The estimated model results in a marginal improvement in the pseudo R2 value in comparison to
estimating only main effects (as seen in Table 6.3). From Table 6.5, it can be observed that the
results from the RPL model with selected interactions are similar to the results generated both
from the MNL and RPL models for the main effects variables, given that the coefficients, signs
and magnitudes are similar. However, of particular interest in this model are the estimated
interaction terms. Louviere et al. (2000) suggest that the sign of an interaction effect can be used
to show whether the relationship between the variables is that of a complement or substitute.
The interaction between the 100% Canadian milk attribute and the organic attribute, and the
interaction between the 100% Canadian milk attribute and the national brand attribute result in
101
positive and negative coefficients respectively. These results therefore indicate that the organic
attribute and the symbol are complements but the national brand attribute and the symbol are
substitutes. Recall that estimation of the main effect for the organic attribute resulted in a
negative coefficient and national brand attribute resulted in positive coefficient (as seen in Table
6.2 and Table 6.3 above), which means that respondents discounted organic milk relative to
conventional milk but received higher utility from choosing national brand milk relative to store
brand milk. However, the results presented in Table 6.5 indicate that when milk with the national
brand attribute also displayed the 100% Canadian milk symbol, utility was negatively affected.
However, respondents derived positive utility when milk with the organic attribute also
displayed the 100% Canadian milk symbol. The implication is that the combination of attributes
can have varying impact on consumers’ utility. The results from this model can be used as an
indication that co-branding combining an organic label with the 100% Canadian milk symbol
also adds value to milk.
When interaction terms are estimated in a model the WTP calculation differs from a model with
interactions. Recall from equation 19 in Chapter 4 that in estimating the WTP for an attribute all
interaction effects must be captured. Therefore in estimating the WTP for the national brand
attribute both the main effect and interaction effects with the national attribute are taken into
consideration. The estimate shows that WTP for the national brand attribute is insignificant.
WTP for the symbol remained positive and significant while WTP for the organic attribute
remained negative and significant.
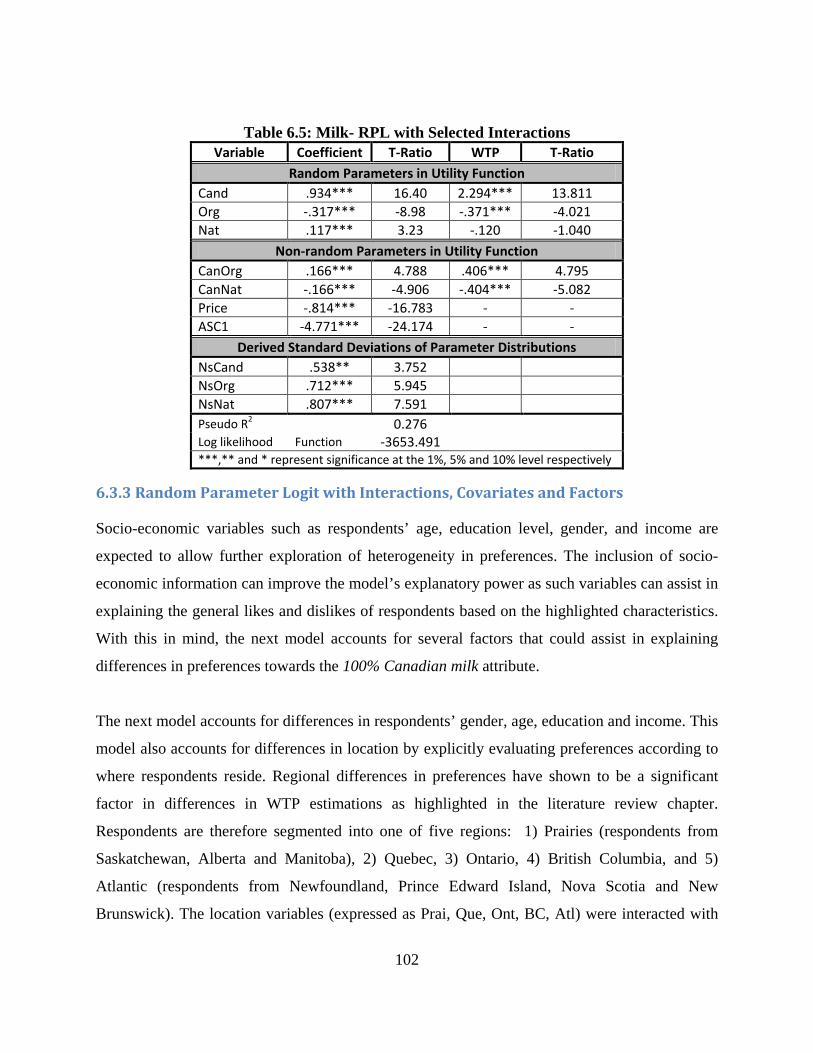
102
Table 6.5: Milk- RPL with Selected Interactions Variable Coefficient T-Ratio WTP T-Ratio
Random Parameters in Utility Function Cand .934*** 16.40 2.294*** 13.811 Org -.317*** -8.98 -.371*** -4.021 Nat .117*** 3.23 -.120 -1.040
Non-random Parameters in Utility Function CanOrg .166*** 4.788 .406*** 4.795 CanNat -.166*** -4.906 -.404*** -5.082 Price -.814*** -16.783 - - ASC1 -4.771*** -24.174 - -
Derived Standard Deviations of Parameter Distributions NsCand .538** 3.752 NsOrg .712*** 5.945 NsNat .807*** 7.591 Pseudo R2 0.276 Log likelihood Function -3653.491 ***,** and * represent significance at the 1%, 5% and 10% level respectively
6.3.3 Random Parameter Logit with Interactions, Covariates and Factors
Socio-economic variables such as respondents’ age, education level, gender, and income are
expected to allow further exploration of heterogeneity in preferences. The inclusion of socio-
economic information can improve the model’s explanatory power as such variables can assist in
explaining the general likes and dislikes of respondents based on the highlighted characteristics.
With this in mind, the next model accounts for several factors that could assist in explaining
differences in preferences towards the 100% Canadian milk attribute.
The next model accounts for differences in respondents’ gender, age, education and income. This
model also accounts for differences in location by explicitly evaluating preferences according to
where respondents reside. Regional differences in preferences have shown to be a significant
factor in differences in WTP estimations as highlighted in the literature review chapter.
Respondents are therefore segmented into one of five regions: 1) Prairies (respondents from
Saskatchewan, Alberta and Manitoba), 2) Quebec, 3) Ontario, 4) British Columbia, and 5)
Atlantic (respondents from Newfoundland, Prince Edward Island, Nova Scotia and New
Brunswick). The location variables (expressed as Prai, Que, Ont, BC, Atl) were interacted with

103
the 100% Canadian milk attribute to ascertain preferences for milk displaying the 100%
Canadian milk symbol according to locations.
Table 6.6 indicates that the coefficients previously estimated remain the same with respect to
signs, magnitudes and levels of significance. As it pertains to the newly added variables (socio-
economic variables and region), it can be observed that there is no significant difference in
preferences for a 2-litre carton of milk with the 100% Canadian milk symbol between
respondents from different age groups (CanAge) or income (CanInc) categories. The interaction
between the 100% Canadian milk attribute and respondents’ education level (CanEdu) indicates
that more educated respondents discount the 100% Canadian milk symbol by 16 cents. This
could perhaps be because they are more knowledgeable28 and know that there is no real
difference in milk, whether or not it displays the 100% Canadian milk symbol.
As it relates to regional differences across Canada, respondents from Quebec and the Prairies
discount milk with the 100% Canadian milk symbol by 76 cents and 52 cents respectively in
comparison to respondents from Ontario. The coefficients for respondents from British Columbia
and Atlantic Canada were statistically insignificant. These coefficients indicate that they were no
statistical differences in willingness to pay with respect to Ontario respondents.
Overall, the model reflects a marginally better fit, as the pseudo R2 improved to .28 as opposed to
the previous models with fits of .27 and .276. The sign of the price coefficient was also
intuitively consistent as it indicates that consumers derive disutility from paying higher prices.
The negative sign of the ASC1 coefficient also indicates that respondents derived disutility from
not purchasing milk as opposed to purchasing milk.
28 As an exploratory analysis a MNL model was estimated with an interaction term between education and industry knowledge. The results indicate that respondents who had a higher level of education were also more knowledgeable. The results can be seen in Appendix J

104
Table 6.6: Milk- RPL Accounting for Socio-Economic and Regional Differences Variable Coefficient T-Ratio WTP29 T-Ratio
Random Parameters in Utility Function Cand 1.184*** 9.24 1.427*** 3.481 Org -.319*** -8.92 -.370** -3.993 Nat .118** 3.22 -.120 -1.068
Non-random Parameters in Utility Function CanOrg .167*** 4.813 .407*** 4.838 CanNat -.167*** -4.958 -.407*** -5.136 CanAge -.001 -0.763 -0.004 -0.763 CanInc 0.000 0.241 0.000 0.241 CanGen -0.011 -0.184 -0.056 -0.184 CanEdu -.068** -1.878 -.164** -1.887 CanQue -.315*** -3.793 -.768*** -3.862 CanPra -.216** -2.429 -.528** -2.442 CanBC -.033 -0.336 -.082 -0.336 CanAtl .014 0.11 .316 0.913 Price -.82*** -16.720 - - ASC1 -4.791*** -24.025 - -
Derived Standard Deviations of Parameter Distributions NsCand .528*** 3.645 - - NsOrg .724*** 5.968 - - NsNat .822*** 7.638 - - Pseudo R2 0.278 Log likelihood Function -3641.1
***,** and * represent significance at the 1%, 5% and 10% level respectively
In order to account for the effects of attitudes toward health, domestic values and risk
preferences on respondents’ preferences for milk, the factors extracted from the factor analysis
were incorporated in the RPL model. The factors were extracted as documented in Chapter 5:
Health Consciousness, Values and Risk Preference. The factors representing respondents’
relative health consciousness, domestic values and risk preferences were interacted with the
100% Canadian milk attribute. The interaction between the 100% Canadian milk attribute and
health consciousness (Chealth) is expected to be positive. This is based on the premise that
health conscious individuals may be inclined to get greater utility from milk with the symbol as it
may be perceived as healthier and more nutritious. This is especially so given that Canadian milk
is advertised as antibiotic/hormone free and produced under specific health and safety standards. 29In this and all subsequent models with interaction terms, the WTP calculations for an attribute that has been interacted only takes into account the coefficients that are significant in influencing preferences.
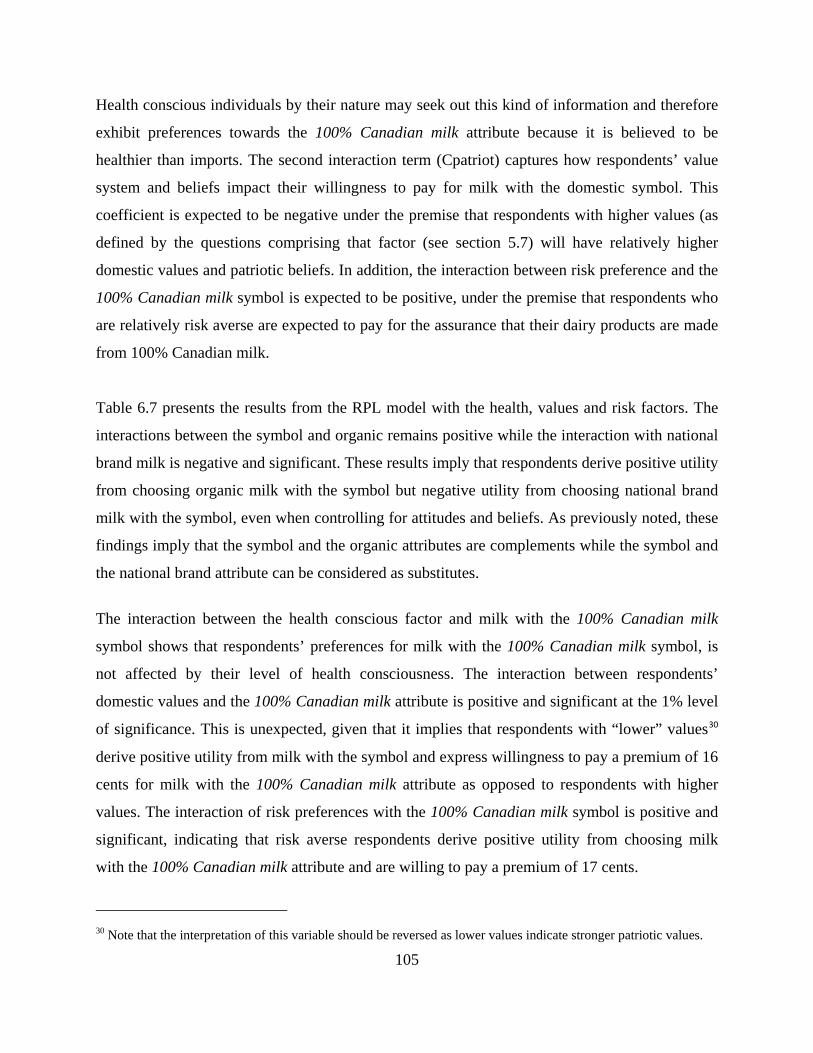
105
Health conscious individuals by their nature may seek out this kind of information and therefore
exhibit preferences towards the 100% Canadian milk attribute because it is believed to be
healthier than imports. The second interaction term (Cpatriot) captures how respondents’ value
system and beliefs impact their willingness to pay for milk with the domestic symbol. This
coefficient is expected to be negative under the premise that respondents with higher values (as
defined by the questions comprising that factor (see section 5.7) will have relatively higher
domestic values and patriotic beliefs. In addition, the interaction between risk preference and the
100% Canadian milk symbol is expected to be positive, under the premise that respondents who
are relatively risk averse are expected to pay for the assurance that their dairy products are made
from 100% Canadian milk.
Table 6.7 presents the results from the RPL model with the health, values and risk factors. The
interactions between the symbol and organic remains positive while the interaction with national
brand milk is negative and significant. These results imply that respondents derive positive utility
from choosing organic milk with the symbol but negative utility from choosing national brand
milk with the symbol, even when controlling for attitudes and beliefs. As previously noted, these
findings imply that the symbol and the organic attributes are complements while the symbol and
the national brand attribute can be considered as substitutes.
The interaction between the health conscious factor and milk with the 100% Canadian milk
symbol shows that respondents’ preferences for milk with the 100% Canadian milk symbol, is
not affected by their level of health consciousness. The interaction between respondents’
domestic values and the 100% Canadian milk attribute is positive and significant at the 1% level
of significance. This is unexpected, given that it implies that respondents with “lower” values30
derive positive utility from milk with the symbol and express willingness to pay a premium of 16
cents for milk with the 100% Canadian milk attribute as opposed to respondents with higher
values. The interaction of risk preferences with the 100% Canadian milk symbol is positive and
significant, indicating that risk averse respondents derive positive utility from choosing milk
with the 100% Canadian milk attribute and are willing to pay a premium of 17 cents.
30 Note that the interpretation of this variable should be reversed as lower values indicate stronger patriotic values.

106
It should be noted, however, that the willingness to pay values for the two statistically significant
factors (respondents’ values and risk preference) are very small (16 and 17 cents respectively)
This suggests that there is no great difference between respondents’ value of the symbol
regardless of whether they have high or low ‘patriotism’ values and whether or not they are risk
averse.
Table 6.7: Milk- RPL with Covariates and Factors Variable Coefficient T-Ratio WTP T-Ratio
Random Parameters in Utility Function
Org -.313*** -8.885 -.320*** -3.476 Nat .12*** 0.037 -.043 -.152
Non-random Parameters in Utility Function
Cand -0.025 -0.087 -.561 -1.587 CanOrg .184*** 5.474 .457*** 5.618 CanNat -.143*** -4.676 -.355*** -4.663 CanInc 0.000 .208 0.000 0.208 CanEdu -0.051 -1.516 -0.126 -1.519 CanAge -.004** -2.482 -.010** -2.485 CanGen -.039 -.647 -.096 -0.647 CanQue -.24*** -3.135 -.596*** -3.146 CanPrai -.155* -1.876 -.384* -1.873 CanBC .029 .31 0.072 0.31 CanAtl -.003 -.028 -.008 -0.028 CHealth .001 .072 .002 0.072 CPatriot .063*** 5.264 .156*** 5.278 CRisk .069*** 2.92 .172*** 2.94 Price -.805*** -18.427 - - ASC1 -4.772*** -25.33 - -
Derived Standard Deviations of Parameter Distributions
NsOrg .808*** 7.165 - -
NsNat .906*** 9.645 - -
Pseudo R2 0.282 Log likelihood Function -3623.05
***,** and * represent significance at the 1%, 5% and 10% level respectively
107
6.4 MNL Results: Ice cream Sample
This section presents the findings from the ice cream survey data. The data was estimated using
the MNL and RPL models. The results presented and discussed follow a sequence similar to the
milk sample discussion. Therefore, the basic MNL model is first examined. In acknowledging
that a less restrictive model such as the RPL model can provide a better fit for the data31, a series
of RPL models are also explored. The estimated models account for two-way interactions
between the 100% Canadian milk attribute and organic and between the 100% Canadian milk
attribute and the national brand attribute. Estimations which account for interactions with
covariates and factors are also discussed.
6.4.1 Multinomial Logit (MNL) Main Effects
The main effects MNL model is first estimated to ascertain the impact of the different attribute
levels on the choice of ice cream. From this estimation, the pseudo R2 has an acceptable fit of
0.25 as seen in (Table 6.8); the pseudo R2 indicates that the model is a relatively good fit for the
data. The signs of the attribute coefficients are similar to those resulting from estimating the milk
data. These similarities in signs indicate that the impact of the estimated attributes on milk
choices affect respondents’ choice of ice cream in a similar manner. Specifically, Table 6.8
indicates that respondents derive positive utility from choosing an ice cream alternative with the
100% Canadian milk attribute and the national brand attribute but negative utility from choosing
ice cream with the organic attribute. The WTP column reflects consumers’ WTP for each
attribute. It can be observed from the first coefficient that respondents were willing to pay a
premium of $1.50 for ice cream with the 100% Canadian milk symbol.
The second coefficient represents ice cream labelled organic, this coefficient is negative and
significant which indicates that respondents derive negative utility from organic ice cream
relative to conventional ice cream and discount a 2-litre carton of organic ice cream by 46 cents.
31 After conducting the Hausman test which showed IIA violation. See Appendix K for the Hausman test results.

108
Positive utility of the same magnitude was however derived from choosing ice cream of a
national brand origin. The model also reflects a negative and significant coefficient for price,
which indicates that respondents derive disutility from choosing ice cream with higher prices.
The ASC1 coefficient is also negative and significant reflecting the disutility derived from not
purchasing ice cream as opposed to purchasing ice cream.
Similar to the approach taken with the milk sample, the RPL model is expected to account for
heterogeneity in respondents’ preferences, different versions of this model are explored next.
Table 6.8: Ice Cream- MNL Main Effects
Variable Coefficient T-ratio WTP T-ratio
Cand .728*** 29.066 1.504*** 27.648 Org -.221*** -10.153 -.458*** -10.039 Nat .223*** 8.555 .46*** 8.725 Price -.969*** -34.335 - - ASC1 -6.73** -38.406 - -
Psuedo R2 0.254 Log likelihood Function -3544.35 ***,** and * represent significance at the 1%, 5% and 10% level respectively
6.5 Random Parameter Logit: Ice cream sample
In an attempt to improve the model fit and account for respondents’ preference heterogeneity, the
survey data from the ice cream sample was also estimated using the RPL. Similar to the milk
sample, the main effects RPL model is first estimated. Extended RPL models that include
interaction terms, covariates and factors are provided in subsequent estimations.
6.5.1 Random Parameter Logit Main Effects
In this model, the organic and national brand attributes were specified as random parameters
following a normal distribution. The 100% Canadian milk attribute was also initially included as
a random parameter. However, the insignificance of the derived standard deviation of the 100%
Canadian milk attribute variable indicated that this attribute should be estimated as non-random.
109
The other variables estimated as non-random were price and the alternative specific constant
(representing respondents’ decisions not to purchase ice cream).
From Table 6.9, it can be observed that results obtained from estimating the main effects RPL
model (ice cream) are similar to those obtained from estimating the MNL model: the signs of the
coefficients remain the same and the magnitudes are also similar. There are however slight
differences: the WTP values for the RPL model are slightly higher for the 100% Canadian milk
attribute. On the other hand, respondents’ willingness to pay for national brand ice cream was
slightly lower in the RPL model. Specifically, respondents were willing to pay $1.56 extra for a
2-litre carton of ice cream displaying the 100% Canadian milk symbol as opposed to ice cream
without the symbol. In addition, respondents discounted organic ice cream by 48 cents opposed
to conventional ice cream but were willing to pay a premium of 43 cents for national brands as
opposed to store brands.
In comparing the main effects MNL model and the main effects RPL model, the RPL model
appears to represent a better fit for the data in light of the pseudo R2 values. There is an
improvement in the pseudo R2 from 0.25 in the MNL main effects to 0.30 for the RPL main
effects model.

110
Table 6.9: Ice Cream- RPL Main Effects
Variable Coefficient T-Ratio WTP T-Ratio
Random Parameters in Utility Function
Org -.294*** -8.387 -.482*** -8.898
Nat .262*** 7.276 .430*** 7.453
Non-random Parameters in Utility Function
Cand .947*** 19.736 1.556*** 27.276 PRICE -1.218*** -22.363 - - ASC1 -8.076*** -25.369 - -
Derived Standard Deviations of Parameter Distributions
NsOrg .944*** 8.866 - -
NsNat .729*** 6.727 - -
Psuedo R2 0.300 Log likelihood Function -3514.51 ***,** and * represent significance at the 1%, 5% and 10% level respectively
Recall that RPL models facilitate estimating preference heterogeneity. In order to account for
differences in respondents’ perceptions and preferences, the distribution and the mean of the
coefficients of the random variables are used in this process. Table 6.10 presents the results for
the preference heterogeneity of the random parameters estimated in the RPL model in Table 6.9.
The results from Table 6.10 indicate that most respondents have a negative perception of the
organic attribute as it relates to ice cream, as only around 38% of respondents exhibited positive
perceptions of organic ice cream. Most respondents exhibited positive perceptions toward
national brand ice cream with only 36% indicating negative perceptions.
Table 6.10: Ice Cream- Preference Distribution Variable Positive Perception Negative Perception
Org 37.8% 62.2% Nat 64.0% 36.0%

111
6.5.2 Random Parameter Logit with Selected Interactions
The RPL model was re-estimated with the inclusion of interaction terms between the 100%
Canadian milk attribute and the organic attribute (CanOrg) and between the 100% Canadian
milk attribute and the national brand attribute (CanNat). The interactions are expected to reflect
how the presence of both attributes as opposed to one affects respondents’ preferences and hence
choice of ice cream. The results from the model with the two interaction terms are presented in
Table 6.11.
It can be observed that the pseudo R2 slightly increases to .301 in contrast to the model without
interactions (Table 6.9), this indicates a marginal improvement in the model fit in comparison to
the main effects only RPL model. The results from the model indicate that the interaction
between the organic attribute and the 100% Canadian milk attribute (CanOrg) is insignificant.
Unlike the milk sample in which having both attribute levels present had a positive and
significant effect on utility. The results also indicate that ice cream choices were unaffected
when national brand ice cream also displayed the 100% Canadian milk symbol. The price
coefficient and the ASC1 coefficient remained negative and significant reflecting respondents’
disutility from higher prices and from not choosing an ice-alternative respectively.
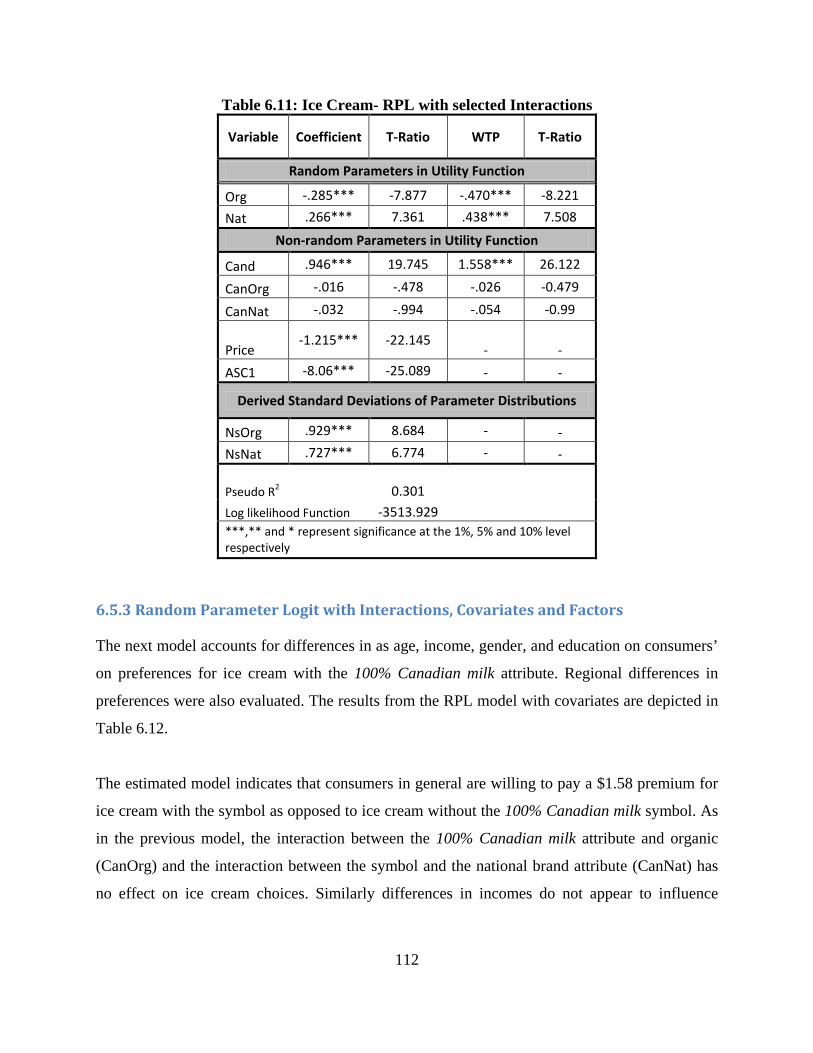
112
Table 6.11: Ice Cream- RPL with selected Interactions
Variable Coefficient T-Ratio WTP T-Ratio
Random Parameters in Utility Function
Org -.285*** -7.877 -.470*** -8.221
Nat .266*** 7.361 .438*** 7.508
Non-random Parameters in Utility Function
Cand .946*** 19.745 1.558*** 26.122
CanOrg -.016 -.478 -.026 -0.479
CanNat -.032 -.994 -.054 -0.99
Price -1.215*** -22.145
- - ASC1 -8.06*** -25.089 - -
Derived Standard Deviations of Parameter Distributions
NsOrg .929*** 8.684 - - NsNat .727*** 6.774 - -
Pseudo R2 0.301 Log likelihood Function -3513.929 ***,** and * represent significance at the 1%, 5% and 10% level respectively
6.5.3 Random Parameter Logit with Interactions, Covariates and Factors
The next model accounts for differences in as age, income, gender, and education on consumers’
on preferences for ice cream with the 100% Canadian milk attribute. Regional differences in
preferences were also evaluated. The results from the RPL model with covariates are depicted in
Table 6.12.
The estimated model indicates that consumers in general are willing to pay a $1.58 premium for
ice cream with the symbol as opposed to ice cream without the 100% Canadian milk symbol. As
in the previous model, the interaction between the 100% Canadian milk attribute and organic
(CanOrg) and the interaction between the symbol and the national brand attribute (CanNat) has
no effect on ice cream choices. Similarly differences in incomes do not appear to influence
113
respondents’ preferences for ice cream with the symbol (CanInc). Also, gender does not account
for differences in choosing milk with the symbol.
The results however indicate that respondents with higher education discount the 100%
Canadian milk symbol on ice cream by 13 cents. Older respondents and respondents from the
Prairies were willing to pay premiums of .6 cents and 28 cents respectively for the presence of
the symbol on a 2-litre container of ice cream. On the other hand, respondents originating from
Quebec and British Columbia discount the symbol relative to the base location (Ontario)
respondents by 18 and 6 cents respectively. There is no difference in willingness to pay for the
symbol between respondents from Atlantic Canada and Ontario. It is of interest to note that the
differences in willingness to pay based on region were very small both in relative and absolute
terms.
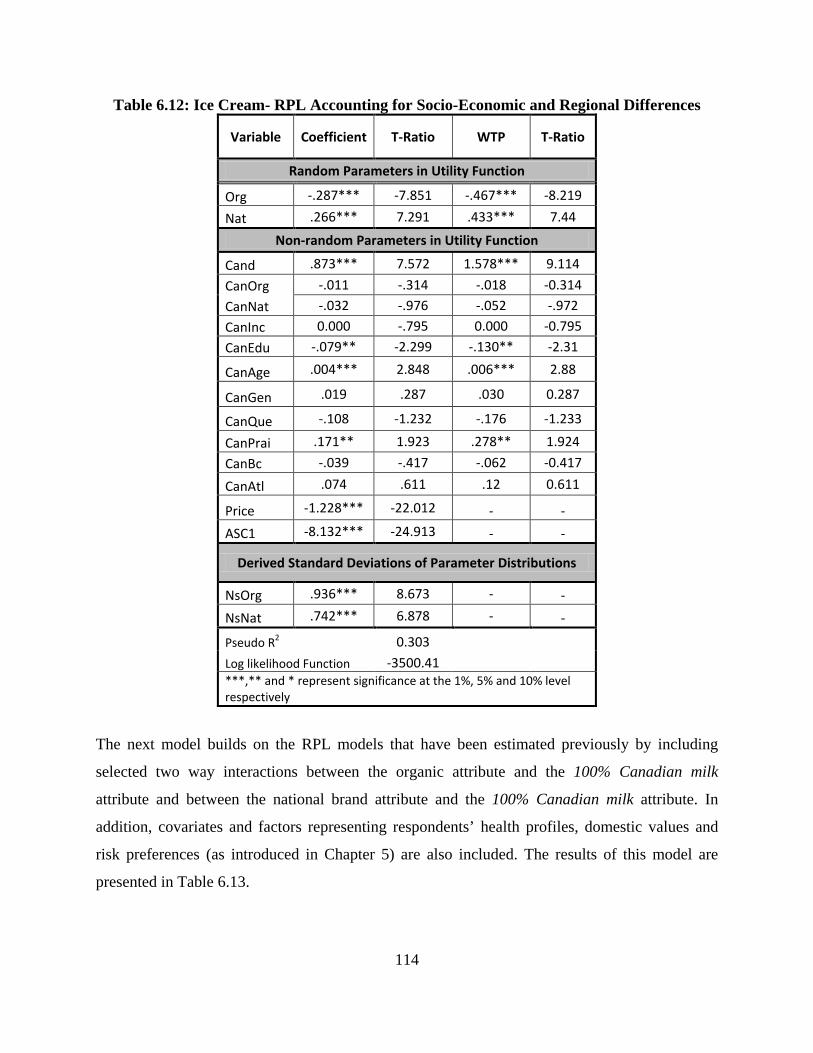
114
Table 6.12: Ice Cream- RPL Accounting for Socio-Economic and Regional Differences
Variable Coefficient T-Ratio WTP T-Ratio
Random Parameters in Utility Function
Org -.287*** -7.851 -.467*** -8.219
Nat .266*** 7.291 .433*** 7.44
Non-random Parameters in Utility Function
Cand .873*** 7.572 1.578*** 9.114 CanOrg -.011 -.314 -.018 -0.314 CanNat -.032 -.976 -.052 -.972 CanInc 0.000 -.795 0.000 -0.795 CanEdu -.079** -2.299 -.130** -2.31
CanAge .004*** 2.848 .006*** 2.88
CanGen .019 .287 .030 0.287
CanQue -.108 -1.232 -.176 -1.233
CanPrai .171** 1.923 .278** 1.924 CanBc -.039 -.417 -.062 -0.417
CanAtl .074 .611 .12 0.611
Price -1.228*** -22.012 - - ASC1 -8.132*** -24.913 - -
Derived Standard Deviations of Parameter Distributions
NsOrg .936*** 8.673 - - NsNat .742*** 6.878 - -
Pseudo R2 0.303 Log likelihood Function -3500.41
***,** and * represent significance at the 1%, 5% and 10% level respectively
The next model builds on the RPL models that have been estimated previously by including
selected two way interactions between the organic attribute and the 100% Canadian milk
attribute and between the national brand attribute and the 100% Canadian milk attribute. In
addition, covariates and factors representing respondents’ health profiles, domestic values and
risk preferences (as introduced in Chapter 5) are also included. The results of this model are
presented in Table 6.13.
115
The coefficient representing the interaction between respondents’ level of health consciousness
and the 100% Canadian milk attribute (CHealth) is expected to be positive as it was
hypothesized that more health conscious respondents would be willing to pay a premium for
dairy products with the symbol. The coefficient displays an unexpected sign but is not
statistically significant at the 5% level of significance.
The second interaction term of interest captures how respondents’ domestic values impact
preferences for ice cream with the 100% Canadian milk attribute. This coefficient is expected to
be negative or insignificant based on the hypothesis that respondents with relatively lower
domestic values are expected to either discount or be indifferent towards dairy products with the
symbol. The coefficient is negative and significant which shows that respondents with lower
values discount ice cream with the symbol by 15 cents relative to respondents with higher values.
The coefficient representing the interaction between respondents’ risk preferences and the 100%
Canadian milk attribute (Crisk) is expected to be positive based on the premise that risk averse
respondents may express willingness to pay a premium for dairy products with the 100%
Canadian milk attribute. The coefficient however turns out to be negative but not significant,
which indicates that there is no difference in preferences and willingness to pay for ice cream
with or without the symbol across respondents with different levels of risk aversion
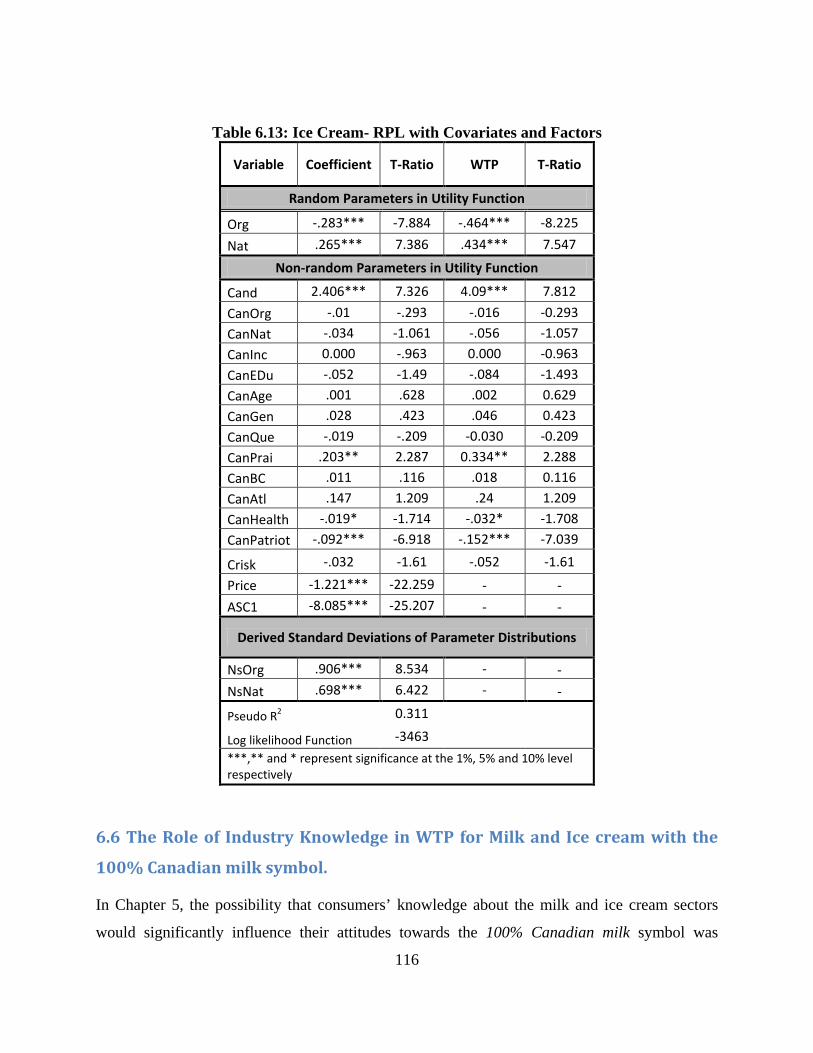
116
Table 6.13: Ice Cream- RPL with Covariates and Factors
Variable Coefficient T-Ratio WTP T-Ratio
Random Parameters in Utility Function
Org -.283*** -7.884 -.464*** -8.225
Nat .265*** 7.386 .434*** 7.547
Non-random Parameters in Utility Function
Cand 2.406*** 7.326 4.09*** 7.812 CanOrg -.01 -.293 -.016 -0.293 CanNat -.034 -1.061 -.056 -1.057 CanInc 0.000 -.963 0.000 -0.963 CanEDu -.052 -1.49 -.084 -1.493 CanAge .001 .628 .002 0.629 CanGen .028 .423 .046 0.423 CanQue -.019 -.209 -0.030 -0.209 CanPrai .203** 2.287 0.334** 2.288 CanBC .011 .116 .018 0.116 CanAtl .147 1.209 .24 1.209 CanHealth -.019* -1.714 -.032* -1.708 CanPatriot -.092*** -6.918 -.152*** -7.039
Crisk -.032 -1.61 -.052 -1.61
Price -1.221*** -22.259 - - ASC1 -8.085*** -25.207 - -
Derived Standard Deviations of Parameter Distributions
NsOrg .906*** 8.534 - - NsNat .698*** 6.422 - -
Pseudo R2 0.311
Log likelihood Function -3463
***,** and * represent significance at the 1%, 5% and 10% level respectively
6.6 The Role of Industry Knowledge in WTP for Milk and Ice cream with the
100% Canadian milk symbol.
In Chapter 5, the possibility that consumers’ knowledge about the milk and ice cream sectors
would significantly influence their attitudes towards the 100% Canadian milk symbol was
117
explored. Accounting for respondents’ knowledge of the dairy industry is important in assessing
willing to pay for the 100% Canadian milk attribute. For example, it cannot be automatically
assumed that because all milk sold in Canada is 100% Canadian, that all consumers should have
a willingness to pay of zero for milk with the symbol as in contrast to milk without because: 1)
not all respondents/consumers may be aware of this information, and 2) even if there was perfect
information there could be other factors affecting preferences for dairy products with the symbol,
and 3) if consumers do suspect that even a very small quantity of milk is imported, the symbol
could perhaps act as further verification.
In order to verify the role of knowledge in influencing WTP for the 100% Canadian milk symbol
on milk and ice cream RPL models which include an interaction term between respondents’
“knowledge” and the 100% Canadian milk attribute (CanKnw) and main effects were estimated.
By incorporating the CanKnw variable in the analysis, the utility derived from purchasing milk
and ice cream with the 100% Canadian milk symbol can be analysed from the perspective of
those who are aware that all milk must be Canadian whether or not it displays the label as
opposed to respondents who are unaware. In addition, the perspective of respondents who are
aware that ice cream can be made from imported milk ingredients as opposed to those who are
not aware of this information is evaluated. It should be noted that the interpretation of the
knowledge variables is opposite in both samples. In the milk sample the variable is analyzed
from the perspective of respondents who are aware that all milk is Canadian, and for ice cream
the CanKnw variable captures the perspective of respondents who are aware that ice cream
may not be Canadian.
From Tables 6.14 and 6.15, specific focus is directed towards the variable representing the
interaction between industry knowledge32 and 100% Canadian milk attribute (CanKnw). An
interesting observation was made in chapter five; it was noted that almost 50% of respondents to
the milk survey were not aware that all milk is Canadian. In addition, approximately 57% of
those unaware respondents indicated that they would not change their choices if they knew
otherwise. Those respondents who were aware that all milk sold in Canada must be 100%
32 The knowledge variable was dummy coded.

118
Canadian milk discounted milk with the symbol by 55 cents, as indicated by the negative and
significant coefficient in Table 6.14. The significant sign of the coefficient is unexpected given
that respondents who are aware should rationally be indifferent towards milk with or without the
symbol. The signs of the other main effects coefficients remained as in previous estimations,
showing that, by controlling for knowledge, while respondents were willing to pay a premium
for milk with the 100% Canadian milk symbol they discounted milk with the organic attribute.
Respondents were also willing to pay a premium for national brand milk.
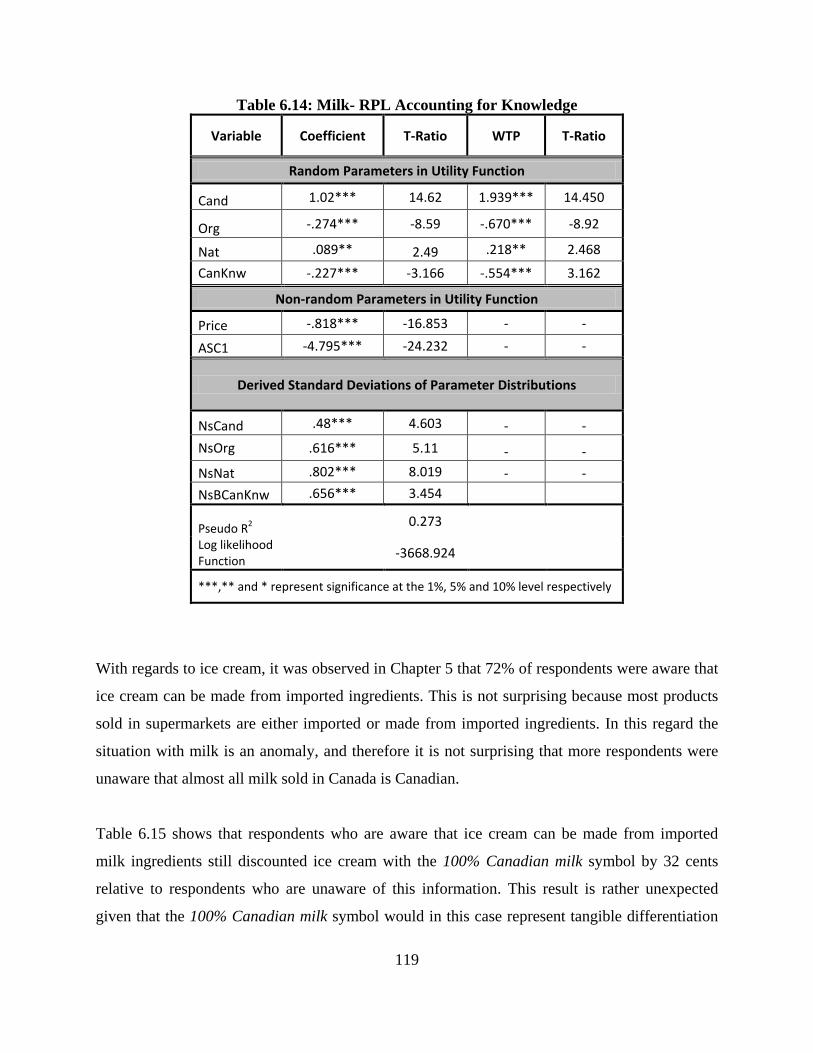
119
Table 6.14: Milk- RPL Accounting for Knowledge
Variable Coefficient T-Ratio WTP T-Ratio
Random Parameters in Utility Function
Cand 1.02*** 14.62 1.939*** 14.450
Org -.274*** -8.59 -.670*** -8.92
Nat .089** 2.49 .218** 2.468
CanKnw -.227*** -3.166 -.554*** 3.162
Non-random Parameters in Utility Function
Price -.818*** -16.853 - -
ASC1 -4.795*** -24.232 - -
Derived Standard Deviations of Parameter Distributions
NsCand .48*** 4.603 - - NsOrg .616*** 5.11 - - NsNat .802*** 8.019 - - NsBCanKnw .656*** 3.454
Pseudo R2 0.273 Log likelihood Function -3668.924
***,** and * represent significance at the 1%, 5% and 10% level respectively
With regards to ice cream, it was observed in Chapter 5 that 72% of respondents were aware that
ice cream can be made from imported ingredients. This is not surprising because most products
sold in supermarkets are either imported or made from imported ingredients. In this regard the
situation with milk is an anomaly, and therefore it is not surprising that more respondents were
unaware that almost all milk sold in Canada is Canadian.
Table 6.15 shows that respondents who are aware that ice cream can be made from imported
milk ingredients still discounted ice cream with the 100% Canadian milk symbol by 32 cents
relative to respondents who are unaware of this information. This result is rather unexpected
given that the 100% Canadian milk symbol would in this case represent tangible differentiation

120
between ice cream made from imported milk ingredients and domestic milk. This result however
could be explained by whether or not these respondents are concerned about the origin of their
foods. With this in mind, the result from the question asking respondents whether or not they are
concerned about the origin of food that they purchase was evaluated from the perspective of
respondents who are “aware”. Figure 6.1 indicates that of the 323 (or 72%) respondents who
were “aware”, approximately 34% were indifferent about the origin of their food another 25%
(strongly agree + agree) indicated that they were not concerned about it, while 41% (disagree +
strongly disagree) of respondents indicate that they were concerned about where their food
comes from. Clearly, most respondents who are “aware” and unwilling to pay a premium for ice
cream with the 100% Canadian milk symbol are not concerned (given that indifference towards
the origin means that it is not important). This partially explains why these respondents are not
willing to pay a premium for ice cream with the symbol, although it is still not clear why
respondents discounted the ice cream with the symbol.
Table 6.15: Ice Cream- RPL Accounting for Knowledge Variable Coefficient T-Ratio WTP T-Ratio Random Parameters in Utility Function
Org -.294*** -8.376 -.48*** -8.89
Nat .262*** 7.266 .428*** 7.441
Non-random Parameters in Utility Function
Cand 1.088*** 19.736 1.463*** 22.297 CanKnw -.194*** -2.846 -.318*** -2.864 Price -1.222*** -22.329 - - ASC1 -8.1*** -25.318 - -
Derived Standard Deviations of Parameter Distributions
NsOrg .944*** 8.864 - - NsNat .735*** 6.776 - -
Psuedo R2
0.301 Log
likelihood Function
-3510.37
***,** and * represent significance at the 1%, 5% and 10% level respectively
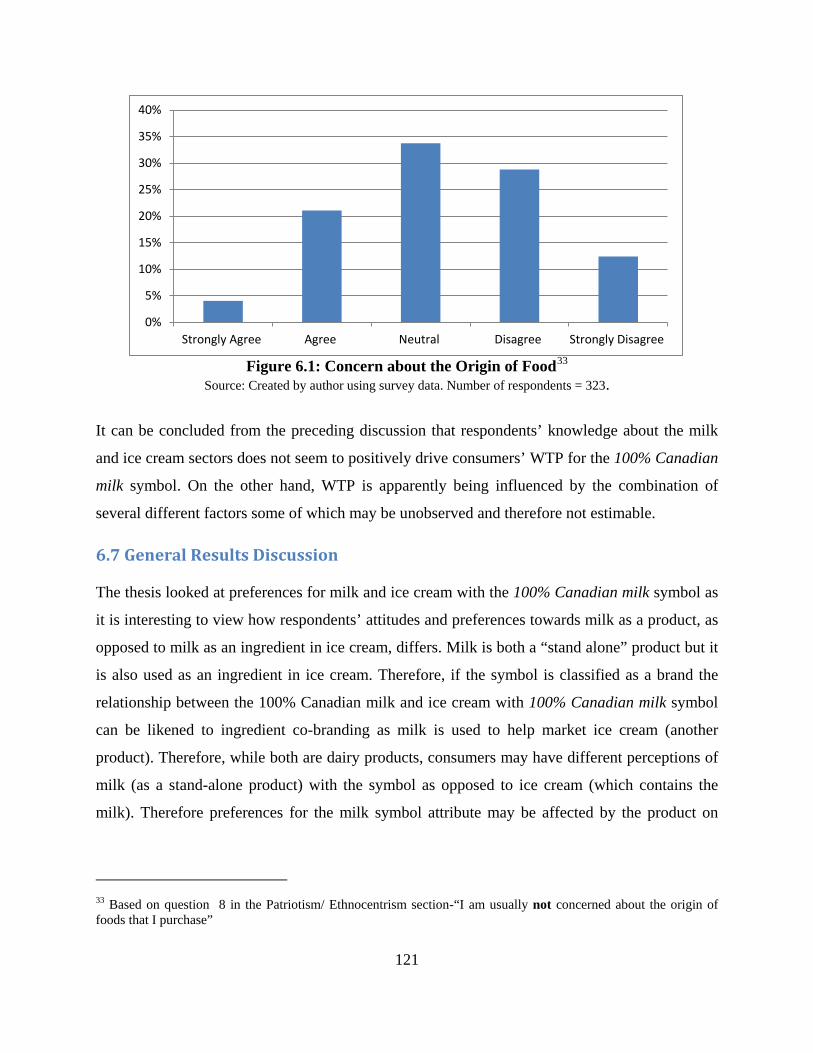
121
Figure 6.1: Concern about the Origin of Food33
Source: Created by author using survey data. Number of respondents = 323.
It can be concluded from the preceding discussion that respondents’ knowledge about the milk
and ice cream sectors does not seem to positively drive consumers’ WTP for the 100% Canadian
milk symbol. On the other hand, WTP is apparently being influenced by the combination of
several different factors some of which may be unobserved and therefore not estimable.
6.7 General Results Discussion
The thesis looked at preferences for milk and ice cream with the 100% Canadian milk symbol as
it is interesting to view how respondents’ attitudes and preferences towards milk as a product, as
opposed to milk as an ingredient in ice cream, differs. Milk is both a “stand alone” product but it
is also used as an ingredient in ice cream. Therefore, if the symbol is classified as a brand the
relationship between the 100% Canadian milk and ice cream with 100% Canadian milk symbol
can be likened to ingredient co-branding as milk is used to help market ice cream (another
product). Therefore, while both are dairy products, consumers may have different perceptions of
milk (as a stand-alone product) with the symbol as opposed to ice cream (which contains the
milk). Therefore preferences for the milk symbol attribute may be affected by the product on
33 Based on question 8 in the Patriotism/ Ethnocentrism section-“I am usually not concerned about the origin of foods that I purchase”
0%
5%
10%
15%
20%
25%
30%
35%
40%
Strongly Agree Agree Neutral Disagree Strongly Disagree
122
which it is displayed, hence the interest in estimating preferences for different products with the
symbol.
Having estimated various models using both the milk and ice cream data some interesting results
were observed as it relates to respondents’ preferences. Inferences drawn from the results and
extrapolations should however be applied with caution given the caveat that the population of
respondents in both samples were older and had higher incomes compared with the Canadian
population. In addition, the reliability score of the factor representing respondents’ risk
perceptions was less than desirable.
With the noted caveats in mind, in general it was observed that the WTP estimates for the
various attributes were more conservative in both absolute and relative terms for the ice cream
sample than the milk sample. Although the prices within the different ice cream choice sets were
higher than those for milk, per unit WTP estimated for the different attributes were higher for
milk. Notably, respondents were willing to pay $2.09 per 2-litres for the 100% Canadian milk
attribute in milk but $1.50 per 2- litres in ice cream. Similarly, in the main effects RPL,
respondents were willing to pay $2.20 for the 100% Canadian milk attribute in milk as opposed
to $1.56 in ice cream. The observed results could have different possible explanations. First it
can be deduced that respondents have a greater value for milk with this attribute because in
general it contains no other modified ingredients as opposed to ice cream comprised of several
different ingredients. Therefore paying a premium for the assurance that ice cream is made from
100% Canadian milk provides no assurance that the other ingredients in the product are
acceptable. Milk is different as there are no additional ingredients.
Another possible explanation for the relatively high WTP estimates is that the milk estimations
were less reliable relative to the ice cream estimations especially given the fact that the pseudo
R2 values were better for the ice cream data than the milk data. Also, it was observed in Chapter
5 that the milk respondents were less knowledgeable about the milk sector relatively to ice cream
respondents. This lack of knowledge may have created some amount of bias in the WTP
estimates. Approximately 25 percent of respondents indicated that their choice selections would
have been different if they were more knowledgeable about the milk sector.

123
The estimated models (both for milk and ice cream) indicated that respondents discounted the
organic attribute. This result was quite unexpected as there are several studies suggesting that
consumers are in general willing to pay premiums for an organic attribute. For example, in a
study conducted between 2004 and 2005, Bernard and Bernard (2009) observed that US
consumers were willing to pay a premium for organic milk. Experimental auctions were used to
obtain information on preferences from 154 respondents from four US states, (Delaware,
Maryland, Pennsylvania, and New Jersey). Participants were allowed to bid for milk of four
varieties: conventional, organic, rBST-free, and no use of antibiotics. In general, the bids were
greatest for organic milk as opposed to the other type of milk auctioned. It was however noted
that there was decreasing marginal WTP for additional organic attributes as the willingness to
pay for rBST-free, and no use of antibiotics attributes combined were greater than the
willingness to pay for the organic attribute itself even though they are component attributes of
the organic attribute. Furthermore, the implied comparison of organic milk with rBST-free milk
(rBST is not approved for use in Canada) comprises a different choice context than the current
study, which may in part explain the difference in results.
In addition, a study conducted by Akaichi, Nayga and Gil (2012) using Multiunit Vickrey
auctions and respondents from Spain shows that respondents were willing to pay for organic
milk. In this experiment, different units of organic milk were auctioned. It was however noted
that WTP decreased with the number of units of milk purchased.
Although the highlighted studies revealed a willingness to pay a premium for organic milk, it
should be noted that: 1) these studies did not take into consideration negative bids, 2) not 100%
percent of consumers were willing to pay a premium for organic milk, similarly, not all Canadian
respondents dislike organic milk and ice cream, and 3) the policies governing the milk industry
in these countries are different from the Canadian industry and respondents are most likely
culturally different. Therefore, the perspectives of Canadian consumers may be different.
It should be noted that while the use of rBST was highlighted in the studies above, the current
study only examines trade-offs between organic and conventional milk/ice cream. Therefore, it is
124
expected that the willingness to pay values for organic in the highlighted studies would be
greater than the current study. Also, given that the policies governing the milk (dairy) sector in
countries such as the US and Spain are different than that of Canada, consumers could also have
differing perspectives towards the value of organic dairy products. The policies governing the
production and importation of milk and dairy products in the US are less rigid than those of
Canada. For example, the use of rBST has been approved for use in the United States by the U.S.
Food and Drug Administration since 1993 (Bernard & Bernard, 2009). The same hormone is not
approved in Canada and cannot be used to enhance the production of milk in cows. Therefore
there may be a market for rBST free milk in the US and a larger market for organic milk. In
addition the majority of dairy farms in Canada are small family farms whereas the United States
dairy farms are larger, often industrial-like farms. Therefore, consumers who are adequately
informed could place a greater value on “organic” milk sold in the US as opposed to “organic”
milk sold in Canada.
Regardless of these points however, a negative WTP is still surprising as there exists a market
for organic milk. In addition only 16 percent of respondents in the milk survey and 13 percent in
the ice cream survey indicated that they usually (always + most of the time)34 purchase food
labelled natural or organic. Also over 85 percent of respondents indicated that they never
purchase national/store brand milk labelled as organic. Similarly, 88 percent of respondents
indicate that they never purchase national/store brand ice cream labelled as organic.35
There may also be other possible explanations specific to this study which resulted in
respondents discounting organic milk and ice cream. One possible explanation could be that the
inclusion of one attribute overshadowed and dominated the milk choices. Specifically, the 100%
Canadian milk attribute may have taken precedence in the mind of respondents, hence the high
willingness to pay for this attribute and the negative willingness to pay for the organic attribute.
34 Based on question 4 in the survey section on “Consumer Health Profile”- How often do you purchase food labelled as Natural or Organic? 35 Based on question 2 in the survey section on “Awareness and brand Preference”- On a scale of 1 to 5, in a typical month how often do you purchase MILK with the following labels?
125
Estimations showed that respondents to the milk survey who are aware that milk is Canadian
whether or not it displays the 100% Canadian milk symbol tended to discount milk with the
symbol. Rationally, it was expected that respondents would be indifferent between milk with and
without the symbol given that they are the same. Respondents may have been reacting negatively
to the presence of a label that they deemed unnecessary. On the other hand, ice cream
respondents who were aware that ice cream can be made from imported modified ingredients
still discounted ice cream with the 100% Canadian milk symbol. This result was unexpected.
Further analysis revealed that on average these respondents were not particularly concerned
about the origin of their food products.
6.8 Chapter Conclusion
The 100% Canadian milk symbol was introduced in 2009 with the aim of explicitly informing
consumers about the origin of milk in their dairy products. Because consumers have different
preferences the importance or value placed on origin information is expected to differ based on
consumer groups. Products also vary on many levels which can result in differences in
preferences for the same attribute depending on the product in which it is embedded. Therefore,
the factors influencing willingness to pay for Canadian origin information on milk and ice cream
were explored. Chapter 6 embarked on various estimations with the intention of answering the
research objectives as described in Chapter 1 with the focus on two dairy products: milk and ice
cream. The two products, while different, are similar in that milk is an ingredient of ice cream.
Hence the estimations were able to highlight willingness to pay for milk as a product and milk as
an ingredient with emphasis on the 100% Canadian milk attribute. Six different estimations for
each sample were used to show how willingness to pay is affected by different factors such as
the presence of other attributes, and socio-demographics. Both the basic Multinomial Logit
(MNL) and the more advanced Random Parameter Logit (RPL) models were estimated. The
RPL models addressed the limitations of the MNL and represented a better fit for the data as
identified by significant improvements in goodness of fits.
While the MNL models presented robust results the level of significance as indicated by the
pseudo R2 were low, especially in the case of the milk sample. The RPL analysis however
proved to have greater explanatory power and was able to account for heterogeneity in
126
preferences towards the various attributes. In general respondents showed strong preferences
towards the 100% Canadian milk attribute and the national brand attribute but significantly
discounted the organic attribute when choosing either milk or ice cream. The effect of attribute
combination, socio-demographics and dairy industry knowledge were also observed to be
influential factors in milk and ice cream choices.
The estimations indicated that respondents’ preferences for attributes of milk and ice cream were
similar, as the RPL models indicated that respondents were willing to pay a premium for the
100% Canadian milk symbol on both milk and ice cream but discounted organic milk and ice
cream. The utility derived from choosing national brand milk or ice cream was positive. On the
other hand, combining the national brand attribute with the 100% Canadian milk symbol showed
that the two attributes are substitutes for one another in milk choices but had no impact on ice
cream choices.
The RPL models showed that there were no significant differences in preferences for milk with
the 100% Canadian milk symbol based on age, income and gender. However, differences in
educational levels and respondents’ location affected preferences. While respondents’ levels of
education, age and location affected their willingness to pay for ice cream with the symbol,
income and gender did not significantly account for differences in willingness to pay.
The effect of respondent’s knowledge of the milk and ice cream sectors was also evaluated, but it
appeared to be inconsequential in explaining attitudes and preferences toward the 100%
Canadian milk symbol. This was especially true in the case of ice cream where respondents who
were aware that ice cream can be made from imported modified milk ingredients (as opposed to
those who were unaware) discounted ice cream with the 100% Canadian milk attribute, which in
effect guarantees that the ice cream contains milk of Canadian origin as opposed to imported
milk ingredients. The following chapter provides the conclusions to the thesis and discusses the
implications of the results.
127
Chapter 7: Conclusions & Implications Consumers’ product perceptions and willingness to pay stem from two main sources: product
attributes and individual characteristics (Hensher et al. 2005). This study examined how
preferences for milk and ice cream are influenced by the 100% Canadian milk symbol,
consumers’ attitudes and socio-demographics. This study not just adds to those that have
examined Canadian consumers’ perceptions and willingness to pay for attributes of dairy
products, it is the first to examine perceptions and willingness to pay for the 100% Canadian milk
attribute. Furthermore, the influence of other attributes such as brand (national versus store),
milk type (conventional versus organic), and the effects of individual factors (such as age,
income, gender and education) on preferences for milk and ice cream with the 100% Canadian
milk attribute were evaluated. Data was gathered through a nationwide internet survey
administered in both English and French. The information gathered was estimated using different
versions of the basic Multinomial Logit (MNL) and the Random Parameter Logit (RPL) models.
The estimations accounted for main effects and interaction effects. Estimations included
interactions between the 100% Canadian milk attribute and other attributes, (organic and
national brand), and socio-demographic and attitudinal variables, with the 100% Canadian milk
symbol being the focal point of the study
The 100% Canadian milk symbol was introduced in 2009. The symbol appears on several dairy
products throughout Canada, including milk. The study theorized that there are several factors
that may affect preferences and consumers’ willingness to pay for the 100% Canadian milk
attribute such as consumers’ patriotic values, risk preferences and their level of health
consciousness. Secondarily, the effect of respondents’ knowledge about the dairy industry on
their perceptions and willingness to pay was also explored. Specifically, the primary objectives
of this study were to:
1) Assess the attributes/factors affecting consumers’ preferences for milk and ice cream.
2) Ascertain Canadian consumers’ willingness to pay for milk and ice cream with the 100% Canadian milk symbol.
3) Ascertain how WTP is moderated by individual characteristics: patriotic values, health consciousness and risk perceptions.
4) Identify potential target markets for co-branded dairy products based on socio-demographic and socio-economic characteristics.

128
This chapter examines in turn how these objectives were met by summarizing the findings of the
study and highlighting inferences that can be drawn from the findings. In addition, implications
of the findings for the Canadian industry and milk supply chain are also discussed. The chapter
closes with a discussion of the limitations inherent to the research methodology and
recommendations for further research.
The choice experiment used to elicit preferences included four alternatives and four attributes:
national brand milk versus store brand, organic versus conventional, 100% Canadian milk
symbol versus no symbol and price. Over 90% of respondents indicated that they were aware of
the 100% Canadian milk symbol. However, there were mixed perceptions towards products with
the symbol versus products without, although estimations show that consumers were in general
willing to pay a premium for products with the symbol. The general results from the MNL
models for both the milk and ice cream samples indicated that consumers on average derive
negative utility from choosing organic milk but positive utility from national brand milk. In
addition, respondents derived positive utility from choosing organic milk that also displayed the
symbol. There was disutility from choosing national brand milk with the symbol. There was
however no difference in WTP for organic or national brand ice cream with the symbol as these
coefficients were found to be statistically insignificant.
To further evaluate attribute preferences respondents were also asked to indicate other factors
that are important when purchasing milk or ice cream. From a list of eight characteristics that
consumers may take into consideration when making a purchase, milk respondents considered
expiry date, price and taste to be the three most important (in that order). On the other hand,
respondents considered taste, price and fat content to be the three most important factors when
purchasing ice cream.
The study also examined how WTP for milk and ice cream is moderated by respondents’ level of
health consciousness, patriotic values and risk preferences. These attitudinal factors were
extracted with the use of SPSS and interacted with the 100% Canadian milk attribute. From these
interactions it was possible to ascertain how perceptions for milk and ice cream with the symbol
129
are altered by these characteristics. Although respondents in general expressed WTP for the
symbol, some characteristics believed to positively influence preferences did not in the case of
milk and ice cream. Specifically, it was hypothesized that respondents who were relatively more
health consciousness, patriotic and risk averse would be willing to pay a premium for products
with the symbol. The results showed that respondents’ level of health consciousness was
insignificant in influencing preferences for milk with the symbol but marginally significant in
negatively influencing preferences for ice cream. Although the interaction between respondents’
patriotic values and the symbol was significant, the sign for the interaction led to the rejection of
the hypothesis that more patriotic respondents are willing to pay a premium for milk with the
symbol. However, in the case of ice cream patriotic respondents were willing to pay marginally
more for ice cream with the symbol. Respondents who were relatively more risk averse were
willing to pay a marginal premium for milk with the symbol, whereas, respondents’ risk aversion
did not influence WTP for ice cream with the symbol.
The literature on consumer behaviour and willingness to pay suggests that purchasing decisions,
and by extension, willingness to pay are influenced by several different factors. Within this study
the impact of respondents’ characteristics on willingness pay for dairy products with the 100%
Canadian milk symbol were identified by estimating RPL models. The RPL models also
exhibited heterogeneity in preferences. The interactions of the 100% Canadian milk symbol with
covariates indicated that individual respondent characteristics were important in influencing
preferences for milk and ice cream with the symbol. Respondents exhibited differences in
willingness to pay when choosing milk based on their level of education and location (region). In
addition to education and location, age influenced preferences for ice cream with the symbol.
Income and gender were insignificant in influencing preferences for both products.
Of secondary interest, this study also assessed the role of industry knowledge in accounting for
differences in willingness to pay for milk and ice cream with the symbol. The results showed that
respondents who were aware that all milk sold in Canada must be 100% Canadian discounted
milk displaying the 100% Canadian milk symbol. With respect to ice cream, respondents who
are aware that ice cream can be made from imported milk ingredients also tended to discount ice
cream with the symbol relative to those who are not aware.
130
Overall the results indicate that preferences for the 100% Canadian milk symbol are influenced
by many factors. It was also observed that the impact of the different factors depends on the
product in which 100% Canadian milk attribute is embedded. While respondents’ level of
patriotism, health conscious and risk preference may influence preferences for the symbol, these
factors did so only marginally. It also appears that the 100% Canadian milk symbol tended to
elicit higher WTP from consumers who were less informed about the Canadian dairy sector.
7.1 Implications of the Findings
Consumers’ perceptions milk and ice cream with the 100% Canadian milk symbol have
implications for the Canadian dairy industry and the supply chain. Results from this study can be
used, to some extent, to guide marketing decisions based on regional differences and types of
consumers.
Although most respondents were aware of the 100% Canadian milk symbol, respondents also
revealed mixed perceptions towards milk and ice cream with the symbol as some respondents
indicated their indifference towards milk and ice cream with the symbol. The implication of this
observation is that the dairy industry can work to achieve greater domestic loyalty as strong
loyalty towards the symbol will likely result in greater consensus regarding preferences for the
symbol. Furthermore, the results in general suggest that consumers on average derived positive
utility from milk and ice cream with the 100% Canadian milk symbol. In light of this, there is a
potential for the milk supply chain and particularly processors to extend the “branding” initiative
to other products made from milk by-products such as frozen pizzas and other “ready to eat
food”. Such an initiative could further promote awareness and strengthen loyalty towards
domestic dairy products. This initiative is potentially important to the dairy industry as a pre-
emptive measure should changes to the current supply management system occur in the future36.
Should this system be dismantled (partially or fully), the 100% Canadian milk symbol would
36 The supply management system was adopted in the early 1970s. Under this system a combination of prohibitive taxes and import restrictions prevent the sale of imported fluid milk and restrict the importation of other commercial dairy products.

131
have greater success and significance if consumers are aware of the symbol and have loyalty
towards the symbol. This could be beneficial to dairy farmers and processors.
Results from the study indicated the relative importance of some characteristics when consumers
consider purchasing milk or ice cream. It was noted that consumers’ preferences toward these
characteristics were heterogeneous. Processors could use information on the three most
important characteristics to ensure that they are satisfying the needs of consumers. For example,
given that respondents considered taste as an important factor, processors should at all times
ensure that their dairy products meet Canadian consumers’ taste preferences.
In addition, results from the RPL models indicated that the symbol is a substitute for national
brand dairy products and a complement for store brand products. The presence of the symbol
also adds value to organic milk. These results would therefore imply that companies
manufacturing organic milk can benefit by forming brand alliances with Dairy Farmers of
Canada for marketing purposes. However, an implication of forming brand alliances is that an
alliance with a poorly perceived brand could potentially result in brand dilution. Therefore, while
increasing awareness towards the symbol is potentially beneficial, precautions should also be
taken to ensure that the image of the 100% Canadian milk brand is not negatively affected. One
way to guard against this is by forming alliances with brands that are already strong and have in
place good quality assurance measures. Such an initiative can serve as a pre-emptive measure in
gaining in building a strong image and hence securing consumers’ loyalty.
Information on how respondents’ level of health consciousness, values and risk preferences
impact their willingness to pay for milk and ice cream with the 100% Canadian milk symbol is
potentially useful. As a marketing strategy, consumers can be targeted based on these attitudinal
relationships (health consciousness, values and risk preferences) in order to increase consumers’
brand loyalty and brand awareness.
Specifically, in order to target consumers based on their attitudes towards health, emphasis can
be placed on the health benefits derived from consuming dairy products in general, with specific
focus on products with the 100% Canadian milk symbol. Also, given that respondents’ views and
132
values affect their preferences for dairy products with the symbol, greater emphasis could also be
placed on the importance of origin information and why this should be of interest to consumers.
In addition, to target respondents based on their level of risk preference, marketing measures
geared toward highlighting the safety standards involved in processing Canadian milk may
appeal to this group of consumers. Specifically, explicit distinction can be made between
Canadian milk and imported milk by highlighting the fact that the use of rBST has not been
approved for use in Canada as opposed to other large scale milk producing countries such as the
United States. It however appears from the results that such a marketing strategy would be more
effective for fluid milk than for ice cream.
7.2 Research Limitations & Future Studies
Characteristic to any study are limitations. The stated preference method that was used to obtain
choice data from respondents has inherent limitations. Given that the choice questions were
based on hypothetical scenarios, respondents’ choices may not truly reflect how they would
actually behave in real market settings as choices were non-binding. To mitigate this
hypothetical bias, a “cheap talk script” was included in the survey. The cheap talk script
informed respondents of the concern about their choices in the choice scenarios not reflecting
their true preferences and the importance of selecting choices as they would in real situations.
Research has shown that cheap talk scripts can be an effective way of reducing hypothetical bias
(Lusk, 2003). Nevertheless, the expressed preferences and WTP estimations may suffer from a
degree of hypothetical bias. In addition, it is possible that the high degree of preferences
exhibited towards the 100% Canadian milk symbol may be a function of what respondents
believed to be appropriate choices based on the overall objective of the survey.
An additional limitation is evident from the way the sample was selected. Although the survey
samples drawn from the general population provided a good representation of the regional
distribution of the Canadian population and on other demographic characteristics, the recruitment
method cannot be considered as random as respondents were recruited by a survey company
from an online panel. Therefore extrapolating findings to the average Canadian should be done
with caution. It should also be noted that the reliability of the third factor representing risk was

133
low. The Cronbach’s alpha was below .6 in both the milk and ice cream factor analysis. This was
perhaps caused by the number of variables that were retained in that factor.
Lastly, although this study considered four attributes of milk, other attributes such as milk fat
content and nutritional content may of course also be important determinants of dairy product
choices. Also, it should be noted that the attributes used in this choice model were by necessity
rather generic, therefore, the results may be limited in their applicability. For example, store
brand and national brands were defined broadly which makes it difficult to capture loyalty to
specific brands, although this was not germane to the study objectives.
Further research is needed in this area using different groups of dairy products to extend the
generalizability of the reported findings. In addition, different models such as the latent class
method could also be used to further examine heterogeneity across consumer segments. Perhaps
this could provide more information on preferences towards the organic attribute. The latent
class method would show how classes of respondents differ in terms of preferences for products
with 100% Canadian milk symbol.
In addition, further research in this area could employ an experimental auction method in which
choices are made binding. This would perhaps result in more conservative WTP estimates for the
100% Canadian milk attribute. Furthermore, the same respondents could be used in an
experimental auction featuring both milk and ice cream with the symbol. This would perhaps
accommodate deeper analysis of how perceptions differ across both products from the perceptive
of the same group of individuals. Further modifications could also include the use of different
information treatments to account for respondents’ knowledge of the dairy industry. Specifically,
two survey treatments could be administered for each product, one in which respondents were
informed about the dairy industry before responding to the choice section of the survey and one
where they received the information after (as in this study). This would perhaps provide a better
indication of the bias caused by respondents’ knowledge of the dairy sector.
134
References Adamowicz, W., Louviere, J., & William, M. (1994). Combining Revealed and Stated
Preference Methods for Valuing Environmental Amenities. Journal of Environmental Economics
and Management, 26(3), 271-292.
Agriculture and Agri-Food Canada. (2009a, February 2). Canadian Consumers. Retrieved
October 8, 2012, from Agriculture and Agri-Food Canada: http://www4.agr.gc.ca/AAFC-
AAC/display-afficher.do?id=1170942402619&lang=eng#n13
Agriculture and Agri-Food Canada. (2009b, December). Branding Matters: Agriculture and
Agri-Food Canada. Retrieved September 30, 2011, from Agriculture and Agri-Food Canada:
http://www.marquecanadabrand.agr.gc.ca/news-nouvelles/5348-eng.htm
Agriculture and Agri-Food Canada. (2009c). Global Private Label Trends. Ottawa: Agriculture
and Agri-Food Canada.
Agriculture and Agri-Food Canada. (2011, July 14). Local food favoured, but not if it costs
more: AgCanada. Retrieved August 23, 2011, from Agriculture and Agri-food Canada:
http://agcanada.com/Article.aspx?ID=38505
Agriculture and Agri-Food Canada. (2012a, December 18). Canada Brand: What is it? Retrieved
March 10, 2013, from www.canadabrand: http://www.marquecanadabrand.agr.gc.ca/what-
quoi/what-quoi-eng.htm
Agriculture and Agri-Food Canada. (2012b, August 8). Canada Brand: How to use it. Retrieved
March 10, 2013, from www.canadabrand.agr.gc.ca:
http://www.marquecanadabrand.agr.gc.ca/how-comment/how-comment-eng.htm
Akaichi, F., Nayga, R. M., & Gil, J. M. (2012). Assessing Consumers' Willingness to Pay for
Different Units of Organic Milk: Evidence from Multiunit Auctions. Canadian Journal of
Agricultural Economics, 60(4), 469-494.
Alberta Agriculture and Rural Development. (2011, March 09). Consumer Trends in Food
Safety. Retrieved August 23, 2011, from Alberta Agriculture and Rural Development:
http://www1.agric.gov.ab.ca/$department/deptdocs.nsf/all/sis8437
Alberta Livestock and Meat Agency (ALMA). (2012, August). Alberta Livestock and Meat
Agency: Industry Development. Retrieved March 10, 2013, from http://alma.alberta.ca:
http://alma.alberta.ca/cs/groups/alma/documents/document/mdaw/mdex/~edisp/agucmint-
011803.pdf
135
Anderson, J. C., & Gerbing, D. W. (1982). Some Methods for Respecifying Measurement
Models to Obain Unidementional Construct Measurement. Journal of Marketing Research,
19(4), 453-460. Retrieved May 06, 2012, from http://www.jstor.org/stable/10.2307/3151719
BBC News Europe. (2011, June 10). German tests link bean sprouts to deadly E. coli. Retrieved
March 12, 2012, from BBC News Europe: http://www.bbc.co.uk/news/world-europe-13725953
BBC News Wales. (2010, November 23). E. coli outbreak butcher 'sold rotten meat for years'.
Retrieved August 21, 2011, from BBC News Wales: http://www.bbc.co.uk/news/uk-wales-
11814600
Bech, M., & Gyrd-Hansen, D. (2005). Effects coding in discrete choice experiments. Journal of
Health Economics, 14(10), 1079–1083. Retrieved May 07, 2012, from
http://onlinelibrary.wiley.com/doi/10.1002/hec.984/abstract
Bech-Larsen, T., & Grunert, K. G. (2003). The perceived healthiness of functional foods A
conjoint study of Danish, Finnish and American consumers’ perception of functional foods.
Appetite, 40(1), 9–14.
Bernard, D. J., & Mathios, A. (2005). Factors Affecting Consumers Choice and Willingness to
Pay for Milk Attributes. American Agricultural Economics Association Annual meeting (pp. 1-
34). Providence: American Agricultural Economics Association. Retrieved from
http://purl.umn.edu/19366
Bernard, J. C., & Bernard, D. J. (2009). What Is It About Organic Milk? An Experimental
Analysis. American Journal of Agricultural Economics, 91(3), 826-836.
Bredahl, L. (2004). Cue utilisation and quality perception with regard to branded beef. 15(1), 65-
75.
Cakir, V. (2008). The Relation of Knowledge of Made In Between Brand Attitude and
Willingness to Purchase. Retrieved 07 07, 2012, from cim.anadolu.edu.tr/pdf/2008/2008_881-
896.pdf
Canadian Dairy Information Centre (CDIC). (2012a, July 11). Canadian Dairy Information
Centre (CDIC): Dairy Facts and Figures. Retrieved August 18, 2011, from Canadian Dairy
Information Centre (CDIC): http://www.dairyinfo.gc.ca/index_e.php?s1=cdi-ilc
Canadian Dairy Information Centre (CDIC). (2012b, March 1). Consumption of Dairy Products.
Retrieved October 5, 2012, from Canadian Dairy Information Centre:
http://www.dairyinfo.gc.ca/index_e.php?s1=dff-fcil&s2=cons&s3=cons
136
Canadian Dairy Information Centre (CDIC). (2013, April 17). Canadian Dairy Information
Centre: Canadian Dairy Trade Balance. Retrieved from Canadian Dairy Information Centre:
http://www.dairyinfo.gc.ca/index_e.php?s1=dff-fcil&s2=imp-exp&page=bal
Canadian Dairy Information Centre (CIDC). (2012c, June 25). Number of Farms, Dairy Cows
and Dairy Heifers. Retrieved from Canadian Dairy Information Centre:
http://www.dairyinfo.gc.ca/index_e.php?s1=dff-fcil&s2=farm-ferme&s3=nb
Canadian Food Inspection Agency. (2011, December). Food Safety Investigations: Canadian
Food Inspection Agency. Retrieved September 15, 2012, from Canadian Food Inspection
Agency: http://www.inspection.gc.ca/food/information-for-consumers/food-safety-
investigations/progress-on-food-safety/weatherill-report-
recommendations/eng/1362425366007/1362425780005
Canadian Partnership for Consumer Food Safety Education. (n.d.). Food Safety Tips facts Sheet.
Retrieved March 15, 2012, from Canadian Partnership for Consumer Food Safety Education:
http://www.canfightbac.org/cpcfse/en/safety/safety_factsheets/foodborne_illness/
Canadian Wheat Board (CWB). (2011, June 23). CWB: Newsroom. Retrieved March 8, 2013,
from http://www.cwb.ca:
http://www.cwb.ca/public/en/newsroom/releases/2011/news_release.jsp?news=062311.jsp
Centers for Disease Control and Prevention. (2006, October 6). Update on Multi-State Outbreak
of E. coli O157:H7 Infections From Fresh Spinach, October 6, 2006. Retrieved from Centers for
Disease Control: http://www.cdc.gov/foodborne/ecolispinach/100606.htm
Centers for Disease Control and Prevention. (2007, June 1). Multistate Outbreak of Salmonella
Serotype Tennessee Infections Associated with Peanut Butter --- United States, 2006--2007.
Retrieved March 19, 2012, from Centers for Disease Control and Prevention:
http://www.cdc.gov/mmwr/preview/mmwrhtml/mm5621a1.htm
Centers for Disease Control and Prevention. (2010, December 2). Investigation Update:
Multistate Outbreak of Human Salmonella Enteritidis Infections Associated with Shell Eggs.
Retrieved Febuary 12, 2012, from Centers for Disease Control and Prevention:
http://www.cdc.gov/salmonella/enteritidis/
Centers for Disease Control and Prevention. (2012, February 1). Investigation Update: Multistate
Outbreak of Human Salmonella Typhimurium Infections Linked to Ground Beef. Retrieved

137
March 6, 2012, from Centers for Disease Control and Prevention:
http://www.cdc.gov/salmonella/typhimurium-groundbeef/020112/index.html
Champ, P. A., Boyle, K. J., & Brown, T. C. (2003). A Primer On Nonmarket Valuation.
Dordrecht: Kluwer Academic Publishers.
Chang, W.-L. (2008). A Typology of Co-branding Strategy: Position and Classification. Journal
of American Academy of Business, 12(2), 220-226.
Chen, H.-L. (2011). Effects of Country-of-Origin, Consumer Patriotism, and Values on Brand
Strength: A Multi-attribute Setting. Management and Economics IPEDR, 3, 267-272.
Costello, A. B., & Osborne, J. W. (2005). Practical Assessment Research & Evaluation. ISSN
1531-7714, 14(20), 1-11. Retrieved May 06, 2012
Cronbach, L. (1951). Coefficient Alpha and the Internal Structure of Tests. Psychometrika,
16(3), 297-334. Retrieved May 06, 2012
Dairy Farmers of Canada (DFCa). (n.d.). Campaigns: Dairy Farmers of Canada. Retrieved May
2, 2011, from Dairy Farmers of Canada: http://www.dairyfarmers.ca/news-
centre/campaigns/100-canadian-milk
Dairy Farmers of Canada (DFCb). (n.d.). Dairy Farmers of Canada: Our Economic
Contribution. Retrieved August 23, 2011, from Dairy Farmers of Canada:
http://www.dairyfarmers.ca/what-we-do/our-economic-contribution
Dairy Farmers of Ontario. (2009, January 14). Retrieved 30 September, 2011, from Dairy
Farmers of Ontario: http://www.marketwire.com/press-release/diary-farmers-of-ontario-100-
canadian-milk-branding-program-announced-937903.htm
Dairy Goodness.ca. (n.d.). What the symbol stands for. Retrieved July 27, 2011, from Dairy
Goodness.ca: http://www.dairygoodness.ca/100-percent-canadian-milk/about-the-100-percent-
canadian-milk-symbol/what-the-symbol-stands-for
Darren, G., & Mallery, P. (2003). SPSS for Windows Step by Step: A Simple Guide and
Reference. Allyn and Bacon, 2003.
De Chernatony, L. d., & Riley, F. D. (1998). Defining a "Brand" : Beyond the Literature with
Experts' Interpretation. Journal of Marketing Management, 14(5), 417-443.
Detoni, D., Tonsor, G. T., Calantone, R. J., & Peterson, H. C. (2009). The Direct and Indirect
Effects of "Locally Grown" on Consumers'Attitudes towards Agri-Food Products. Agricultural
and Resource Economics Review, 38(3), 384-396.
138
Fox, J. A., Hayes, D. J., & Kliebenstein, J. B. (1994). Consumer Acceptability of Milk from
Cows Treated with Bovine Somatotropin. Journal of Dairy Science, 77(3), 703-707.
Fox, J. A., Shogren, J. F., Hayes, D. J., & Kliebenstein, J. B. (1995). Experimental Auctions to
Measure Willingness to Pay for Food Safety. In J. A. Fox, J. F. Shogren, D. J. Hayes, & J. B.
Kliebenstein, Valuing Fod Safety and Nutrition (pp. 115-128). Colorado: Westview Press.
Froehlich, E. J., Carlberg, J. G., & Ward, C. E. (2009). Willingness-to-Pay for Fresh Brand
Name Beef. Canadian Journal of Agricultural Economics, 57(1), 119-137.
Geylani, T., Ter Hofsted, F., & Inman, J. J. (2005). Image Reinforcement or Impairment: The
Effects of Co-Branding on Attribute Uncertainty. Marketing Science, 27(4), 730-744.
Grebitus, C., Menapace, L., & Bruhn, M. (2011). Consumers ' Use of Seals of Approval and
Origin Information: Evidence From the German Pork Market. Agribusiness, 27(4), 478-492.
Groves, M. (1996, November 9). Child's Death Linked to E. Coli From Apple Juice. Retrieved
June 22, 2012, from Los Angles Times: http://articles.latimes.com/1996-11-09/business/fi-
62903_1_apple-juice
Halbrendt, C., Pesek, J., Parsons, A., & Lindner, R. (1995). Contingent Valuation of Consumers’
Willingness to Purchase Pork with Lower Saturated Fat. In Valuing Food Safety and Nutrition
(pp. 319-339). Colorado: West View Press.
Hammitt. (1993). Consumer Willingness to Pay to Avoid Pesticide Residue. Statistica Sinica, 3,
351-366.
Helmig, B. H.-A., & Leeflang, P. (2008). Co-branding: the State-of-the-Art. Schmalenbach
Business Review, 60, 359-377.
Hensher, D. (2010). Hypothetical bias, choice experiments and willingness to pay.
Transportation Research Part B: Methodological, 44(6), 735-752.
Hensher, D., Rose, J. M., & Greene, W. H. (2005). Applied Choice Analysis. New York:
Cambridge University Press.
Heslop, L. A., & Sprott, E. (2007). Literature Review of Canadian Consumer Attitudes and
Perceptions. Agriculture and Agri-Food Canada, Agriculture, Ottawa. Retrieved December 15,
2012, from http://www.marquecanadabrand.agr.gc.ca/domestic-nationale/6303-eng.htm
Heslop, L., & Wall, M. (1986). Two Views of the world: Differences Between Men and Women
on Perceptions of Countries as Producers of Consumer Goods. Marketing (Whistler, BC:
Proceedings, Administrative Sciences Association of Canada-Marketing Division), 7, 179-185.
139
Hobbs, J. E., Bailey, D. V., Dickinson, D. L., & Haghiri, M. (2005). Traceability in the Canadian
Red Meat Sector: Do Consumers Care? Canadian Journal of Agricultural Economics, 53, 47-66.
Hobbs, J. E., Sanderson, K., & Haghiri, M. (2006). Evaluating Willingness-to-Pay for Bison
Attributes: An Experimental Auction Approach. Canadian Journal of agricultural Economics,
54(2), 269-287.
Hu, W. H., Veeman, M. M., & Adamowicz, W. L. (2005). Labelling Genetically Modified
Food:Heterogeneous Consumer Preferences and the Value of Information. Canadian Journal of
Agricultural Economics, 53(1), 83-102.
Hu, W., Adamowicz, W., & Veeman, M. (2006). Labeling Context and Reference Point Effects
in Models of Food Attribute Demand. American Journal of Agricultural Economics, 39(3),
1034-1049.
Huang, C. L. (1993). Simultaneous Equation Model for Estimating Consumer Risk Perceptions,
Attitudes and Willingness-to-pay for Residue-free Produce. Journal of Consumer Affairs, 27(2),
377-396.
Innes, B., Kerr, W. A., & Hobbs, J. E. (2005). International Product Differentiation Through
Country Brand: An Economic Analysis of National Branding as a Marketing Strategy for
Agricultural Products. Saskatoon: Canadian Agriculture Trade Policy Network.
Johnson, C. (2005, April 8). New Thoughts For Food: What Do Consumers Really Want?
Ottawa: Agriculture and Agri-Food Canada. Retrieved October 4, 2011, from
http://www.aic.ca/conferences/pdf/curtis_johnson.pdf
Kendrick, J. (2009, April 9). Statistics Canada: Organic: from niche to mainstream. Retrieved
September 15, 2012, from Statistics Canada: http://www.statcan.gc.ca/pub/96-325-
x/2007000/article/10529-eng.htm
Kjaer, T. (2005). A review of discrete choice experiment- with emphasis on its application in
health care. Odense: University Of Southern Denmark.
Kuhfeld, W. F. (2002). Multinomial Logit, Discrete Choice Modeling. An Introduction to
Designing Choice Experiments, and Collecting, Processing, and Analyzing Choice Data with
SAS. SAS Institute TS-677E.
Kuperis, P., Veeman, M. M., & Adamowicz, W. L. (1999). Consumer's Responses to the
Potential Use of Bovine Somatotrophin in Canadian Dairy Production. Canadian Journal of
Agricultural Economics, 47(2), 151-163.
140
Lancaster, K. J. (1966). A New Approach to Consumer Theory. The Journal of Political
Economy, 74(2), 132-157.
Lantz, G., & Loeb, S. (1996). Country of Origin and Ethnocentrism: an Analysis of Canadian
and American Preferences Using Social Identity Theory. Advances in Consumer Research, 26,
374-378. Retrieved September 29, 2012, from http://www.acrwebsite.org/search/view-
conference-proceedings.aspx?Id=7985
Latvala, T. (2010). Risk, Information, and Trust in the Food Chain: Factors Explaining
Consumer Willingness to Pay. System Dynamics and Innovation in Food Networks , (pp. 691-
705).
Leitch, S., & Davenport, S. (2007). Corporate Brands and Social Brands: Co-branding GM-free
and UK Supermarkets. International Studies in Management and Organisation, 37(4), 45-63.
Lobb, A. E. (2006). The country of origin of food : consumer perceptions of safety & the issue of
trust. 99th EAAE Seminar ‘Trust and Risk in Business Networks’, (pp. 653-661). Bonn.
Los Angeles Times. (1996, November 9). articles.latimes.com. Retrieved March 15, 2012, from
Los Angeles Times: http://articles.latimes.com/1996-11-09/business/fi-62903_1_apple-juice
Loureiro, M. L., & Umberger, W. J. (2005). Assessing Consumer Preferences for Country-of
Origin-Labeling. The Journal of Agricultural and Applied Economics, 37(1), 49-63.
Louviere, J. J., Hensher, D. A., & Swait, J. D. (2000). Stated Choice Methods. Cambridge:
Cambridge University Press.
Louviere, J., Street, D., Burgess, L., Wasi, N., Islam, T., & Marley, A. A. (2008). Modeling the
choices of individual decison-makers by combining efficient choice experiment design with
extra preference information. Journal of Choice Modelling, 1(1), 128-163.
Lusk, J. L. (2003). Effects of Cheap Talk on Consumer willingness to pay for Golden Rice.
American Journal of Agricultural Economics, 85(4), 840-856.
Lusk, J. L., Roosen, J., & Fox, J. (2003). Demand for Beef from Cattle Administered with
Growth Hormones or Fed Genetically Modified Corn: A Comparison of Consumers in France,
Germany, the United Kingdom and the United States. American Journal of Agricultural
Economics, 85(1), 16-29.
Mahajan, V., & Wind, Y. (2002). Got emotional product positioning? There’s more to
positioning than just features and benefits. Marketing Management, 11(3), 36-41.
141
Manski, C. F. (2000, March). Economic Analysis of Social Interactions. Journal of Economic
Perspectives, 14(3), 115-136. Retrieved from http://www.nber.org/papers/w7580
Marlerclark.com. (1999). Sun Orchard Salmonella Outbreak: marlerclark.com. Retrieved
August 11, 2011, from Marlerclark.com: http://www.marlerclark.com/case_news/view/sun-
orchard-salmonella-outbreak-multistate
Morikawa, T., Ben-Akiva, M., & McFadden, D. (2002). Discrete choice models incorporating
revealed preferences and psychometric data. Advances in Econometrics, 16, 29-55.
Nunes, P. F., Dull, S. F., & Lynch, P. D. (2003). When Two Brands Are Better Than One.
Retrieved July 24, 2011, from
http://www.accenture.com/SiteCollectionDocuments/PDF/outlook_crm.pdf
Peng, Y., West, G. E., & Wang, C. (2006). Consumer Attitudes and Acceptance of CLA-
Enriched Dairy Products. Canadian Journal of Agricultural Economics, 54(4), 663-684.
Phau, I., & Prendergast, G. (2000). Conceptualizing the country of origin of brand. Journal of
Marketing Communications, 6(3), 159-170.
Public Health Agency of Canada. (2012, July 30). Lessons Learned: Public Health Agency of
Canada's Response to the 2008 Listeriosis Outbreak. Retrieved August 15, 2012, from Public
Health Agency of Canada: http://www.phac-aspc.gc.ca/fs-sa/listeria/2008-lessons-lecons-
eng.php
Quagrainie, K. K., Unterschultz, J., & Veeman, M. (1998). Effects of Product Origin and
Selected Demographics on Consumer Choice of Red Meats. Canadian Journal of Agricultural
Economics, 46(2), 201-219.
Shimp, T. A., & Sharma, S. (1987). Consumer Ethnocentrism : Construction and Validation of
the CETSCALE. Journal of Marketing and Research, 24(3), 280-289.
Shin, S.-Y., Kliebenstein, J., Hayes, D., & Shogren, J. (1992). Consumer Willingness to pay for
Safer Food Products. Journal of Food Safety, 13(1), 51-59.
So, Y., & Kuhfeld, W. (1995). Multinomial Logit models. SUGI 20 Conference Proceedings.
SAS Institute Inc.
Statistics Canada. (2006). Census of Population, Statistics Canada catalogue no. 97-563-
XCB2006005. Canada. Retrieved September 15, 2012, from http://www12.statcan.ca/census-
recensement/2006/dp-pd/tbt/Rp-
eng.cfm?LANG=E&APATH=3&DETAIL=0&DIM=0&FL=A&FREE=0&GC=0&GID=0&GK
142
=0&GRP=1&PID=94188&PRID=0&PTYPE=88971,97154&S=0&SHOWALL=0&SUB=0&Te
mporal=2006&THEME=75&VID=0&VNAMEE=&VNAMEF=
Statistics Canada. (2011, April 7). Census of Population, Statistics Canada catalogue no. 97-
560-XCB2006008 (Canada, Code01). Retrieved January 9, 2012, from Statistics Canada:
http://www12.statcan.ca/census-recensement/2006/dp-pd/tbt/Rp-
eng.cfm?LANG=E&APATH=3&DETAIL=0&DIM=0&FL=A&FREE=0&GC=0&GID=0&GK
=0&GRP=1&PID=93610&PRID=0&PTYPE=88971,97154&S=0&SHOWALL=0&SUB=0&Te
mporal=2006&THEME=75&VID=0&VNAMEE=&VNAMEF=
Statistics Canada. (2012, September 27). Table 051-0001. Estimates of population, by age group
and sex for July 1, Canada, provinces and territories. Retrieved March 15, 2013, from
http://www5.statcan.gc.ca/cansim/a26?lang=eng&retrLang=eng&id=0510001&pattern=&csid=
Stearns, J. M., Borna, S., & Oakenfull, G. (2003). Buying for Love of Country: Assessing the
Ethics of Patriotic Appeals in Advertising. Business and Society Review, 108(4), 509-521.
The AgriPost. (2009, February 28). Manitoba Agriculture News. Retrieved October 8, 2011,
from Mysteinbach.ca: http://www.mysteinbach.ca/newsblog/1244.html
The New York Times. (1985, April 17). Salmonella Outbreak is Traced. Retrieved August 20,
2011, from The New York Times: http://www.nytimes.com/1985/04/17/garden/salmonella-
outbreak-is-traced.html
Tino, B.-L., & Klaus, G. G. (2003). The perceived healthiness of functional foods A conjoint
study of Danish, Finnish and American consumers’ perceptions of functional foods. Appetite,
40(1), 9-14.
Train, K. (2009). Discrete Choice Methods. New York: Cambridge University Press.
Unterschultz, J., Quagrainie, K. K., Veeman, M., & Kim, R. B. (1998). South Korean Hotel Meat
Buyers’ Perceptions of Australian, Canadian and U.S. Beef. Canadian Journal of Agricultural
Economics, 46(1), 53-68.
Vassella, M. C., Fountain, P. D., & Fountain, U. K. (2010). Consumer Ethnocentrism,
Patriotism, Global Openness and Country of Origin Effect: A Literature Review. ASBBS Annual
Conference. Las Vegas.
Volinskiy, D., Adamowicz, W. L., Veeman, M. M., & Srivastava, L. (2007). Are Country of
Origin and non-GM Premia Invariant to Experimental Auction Structure? Annual Conference,
Australian Agricultural and Resource Economics Society. Queenstown: Department of Rural

143
Economy, University of Alberta, Edmonton, Alberta. Retrieved from
http://ageconsearch.umn.edu/handle/10378
Wang, Q., Halbrendt, C., Kolodinsky, J., & Schmidt, F. (1997). Willingness to pay for rBST-free
milk: a two-limit Tobit model analysis. Applied Economic Letters, 4(10), 619-621.
Weber, E. U., & Milliman, R. A. (1997). Perceived Risk Attitudes: Relating Risk Perception to
Risky Choice. Management Science, 43(2), 123-144.
Wessells, C. R., & Anderson, J. G. (1995). Consumer Willingness to Pay for Seafood Safety
Assurances. The Journal of Consumer Affairs, 29(1), 85-107.
Westgren, R. E. (1999). Delivering Food safety, Food Quality, and Sustainable Production
Practices: The Label Rouge poultry System in France. American Journal of Agricultural
Economics, 81(5), 1107-1111.
Williams, B., Onsman, A., & Brown, T. (2010). Exploratory factor analysis: A five-step guide
for novices. Journal of Emergency Primary Health Care, 8(3), 1-13. Retrieved May 09, 2012,
from http://www.jephc.com/uploads/9900399BW.pdf
Yeo Hiap Seng. (2008). The Natural Choice for Malaysians and Around the World. Retrieved
March 9, 2013, from
http://announcements.bursamalaysia.com/EDMS/subweb.nsf/7f04516f8098680348256c6f0017a
6bf/24cb62714fabd1bd4825758a002393f1/$FILE/YHS-
Cover%20to%20Page%2016%20(2.1MB).pdf
Zeithaml, V. A. (1988). Consumer perceptions of price, quality and value: A means-end model
and Synthesis of Evidence. Journal of Marketing, 52(3), 2-22.
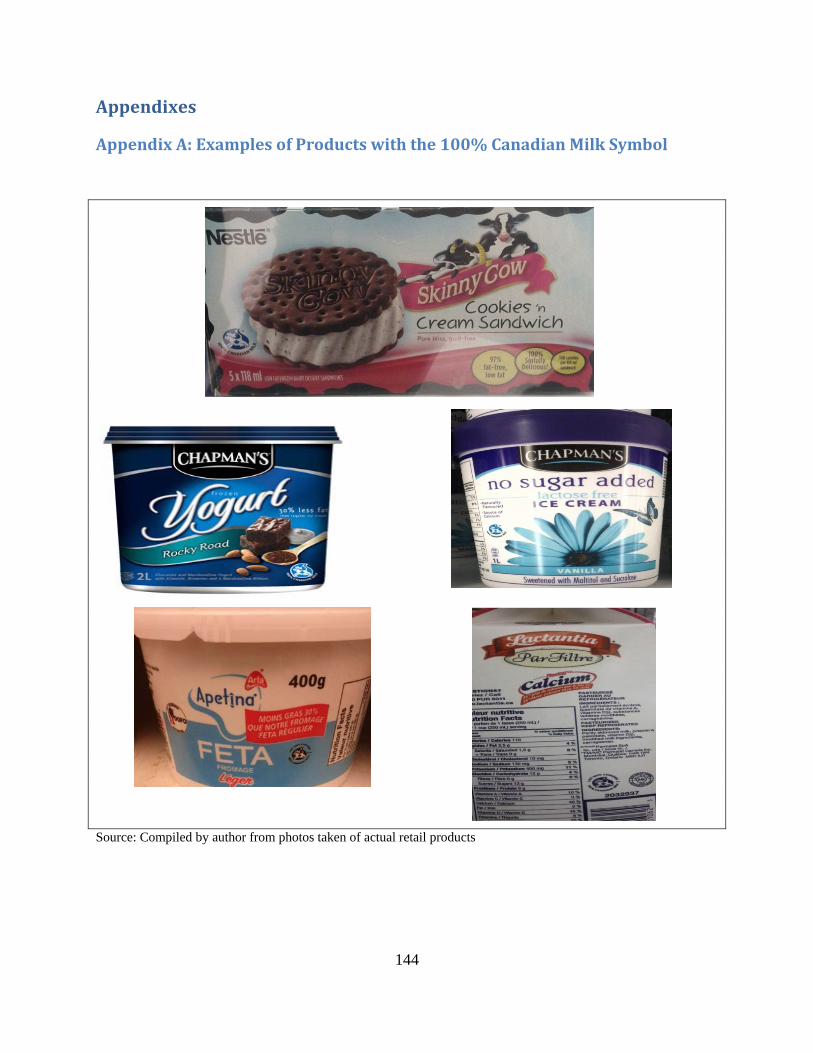
144
Appendixes
Appendix A: Examples of Products with the 100% Canadian Milk Symbol
Source: Compiled by author from photos taken of actual retail products

145
Appendix B: Changes in the Symbol used to Represent Canadian Milk on Dairy
products.
Source: www.Dairygoodness.ca
Appendix C: The Distribution of Dairy Farms by Province
Province Number of Dairy Farms Percentage of Total Alberta 585 4.67 British Columbia 491 3.92 Manitoba 332 2.65 New Brunswick 214 1.71 Newfoundland 33 0.26 Nova Scotia 237 1.89 Ontario 4083 32.59 Prince Edward Island 193 1.54 Quebec 6189 49.40 Saskatchewan 172 1.37 Total 12529 100.00 Source: CDIC, 2012c
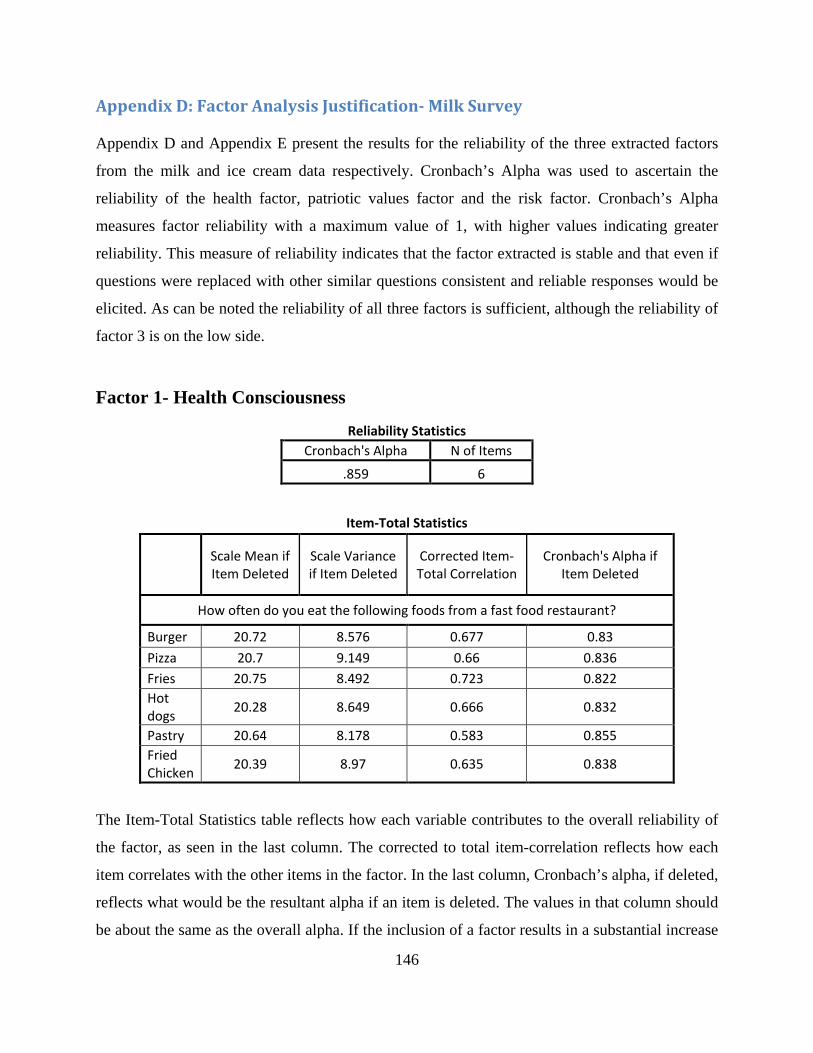
146
Appendix D: Factor Analysis Justification- Milk Survey
Appendix D and Appendix E present the results for the reliability of the three extracted factors
from the milk and ice cream data respectively. Cronbach’s Alpha was used to ascertain the
reliability of the health factor, patriotic values factor and the risk factor. Cronbach’s Alpha
measures factor reliability with a maximum value of 1, with higher values indicating greater
reliability. This measure of reliability indicates that the factor extracted is stable and that even if
questions were replaced with other similar questions consistent and reliable responses would be
elicited. As can be noted the reliability of all three factors is sufficient, although the reliability of
factor 3 is on the low side.
Factor 1- Health Consciousness
Reliability Statistics Cronbach's Alpha N of Items
.859 6
Item-Total Statistics
Scale Mean if Item Deleted
Scale Variance if Item Deleted
Corrected Item-Total Correlation
Cronbach's Alpha if Item Deleted
How often do you eat the following foods from a fast food restaurant?
Burger 20.72 8.576 0.677 0.83 Pizza 20.7 9.149 0.66 0.836 Fries 20.75 8.492 0.723 0.822 Hot dogs 20.28 8.649 0.666 0.832
Pastry 20.64 8.178 0.583 0.855 Fried Chicken 20.39 8.97 0.635 0.838
The Item-Total Statistics table reflects how each variable contributes to the overall reliability of
the factor, as seen in the last column. The corrected to total item-correlation reflects how each
item correlates with the other items in the factor. In the last column, Cronbach’s alpha, if deleted,
reflects what would be the resultant alpha if an item is deleted. The values in that column should
be about the same as the overall alpha. If the inclusion of a factor results in a substantial increase
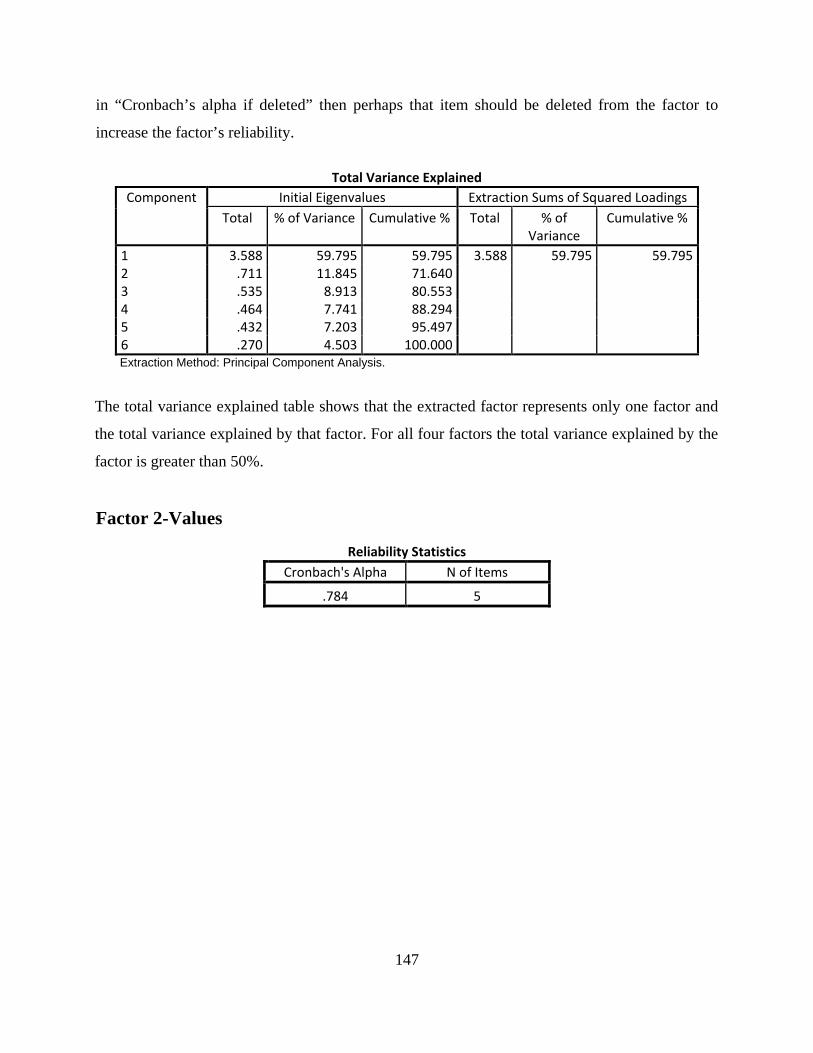
147
in “Cronbach’s alpha if deleted” then perhaps that item should be deleted from the factor to
increase the factor’s reliability.
Total Variance Explained
Component Initial Eigenvalues Extraction Sums of Squared Loadings Total % of Variance Cumulative % Total % of
Variance Cumulative %
1 3.588 59.795 59.795 3.588 59.795 59.795 2 .711 11.845 71.640 3 .535 8.913 80.553 4 .464 7.741 88.294 5 .432 7.203 95.497 6 .270 4.503 100.000 Extraction Method: Principal Component Analysis.
The total variance explained table shows that the extracted factor represents only one factor and
the total variance explained by that factor. For all four factors the total variance explained by the
factor is greater than 50%.
Factor 2-Values
Reliability Statistics Cronbach's Alpha N of Items
.784 5
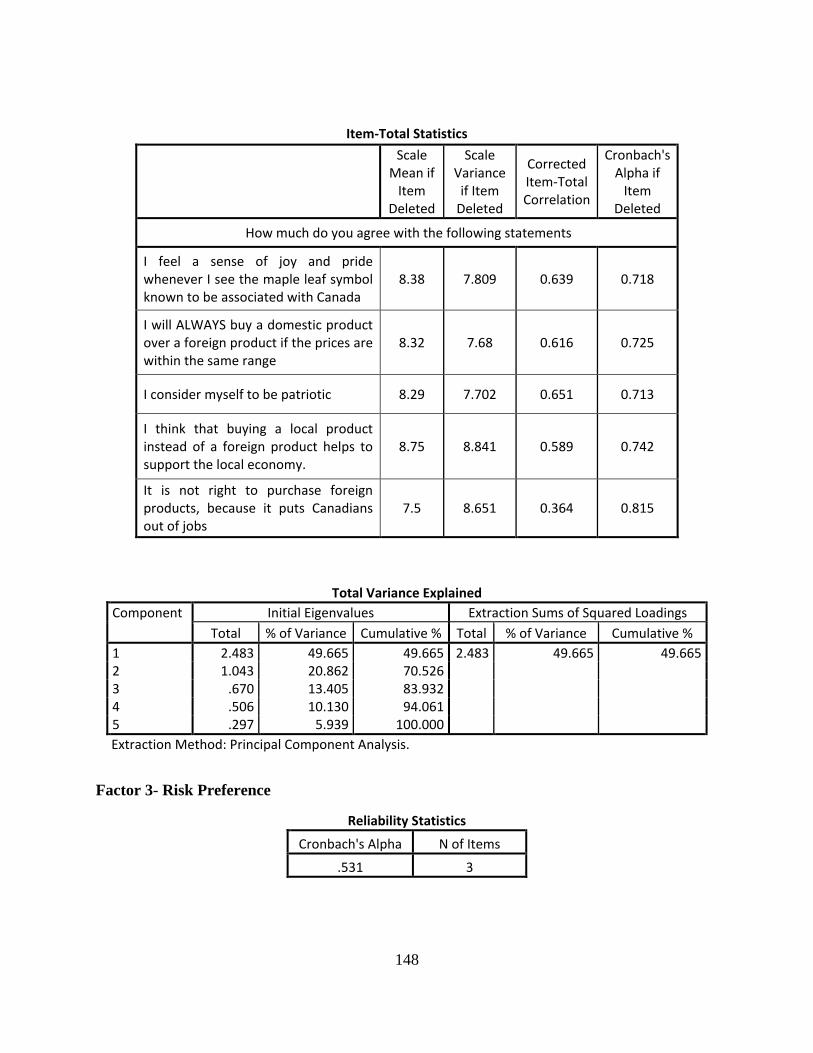
148
Item-Total Statistics
Scale Mean if
Item Deleted
Scale Variance
if Item Deleted
Corrected Item-Total Correlation
Cronbach's Alpha if
Item Deleted
How much do you agree with the following statements
I feel a sense of joy and pride whenever I see the maple leaf symbol known to be associated with Canada
8.38 7.809 0.639 0.718
I will ALWAYS buy a domestic product over a foreign product if the prices are within the same range
8.32 7.68 0.616 0.725
I consider myself to be patriotic 8.29 7.702 0.651 0.713
I think that buying a local product instead of a foreign product helps to support the local economy.
8.75 8.841 0.589 0.742
It is not right to purchase foreign products, because it puts Canadians out of jobs
7.5 8.651 0.364 0.815
Total Variance Explained
Component Initial Eigenvalues Extraction Sums of Squared Loadings Total % of Variance Cumulative % Total % of Variance Cumulative %
1 2.483 49.665 49.665 2.483 49.665 49.665 2 1.043 20.862 70.526 3 .670 13.405 83.932 4 .506 10.130 94.061 5 .297 5.939 100.000 Extraction Method: Principal Component Analysis.
Factor 3- Risk Preference
Reliability Statistics
Cronbach's Alpha N of Items
.531 3

149
Item-Total Statistics
Scale Mean if
Item Deleted
Scale Variance
if Item Deleted
Corrected Item-Total Correlation
Cronbach's Alpha if
Item Deleted
How much do you agree with the following statements
I am usually interested in trying out foreign products 5.36 2.111 0.323 0.463
A little risk is good 5.9 2.208 0.367 0.403 I would consider myself to be more risky than the average person 5.36 1.813 0.35 0.426
Total Variance Explained Component Initial Eigenvalues Extraction Sums of Squared Loadings
Total % of Variance Cumulative % Total % of Variance Cumulative % 1 1.556 51.859 51.859 1.556 51.859 51.859 2 .754 25.122 76.981 3 .691 23.019 100.000 Extraction Method: Principal Component Analysis.
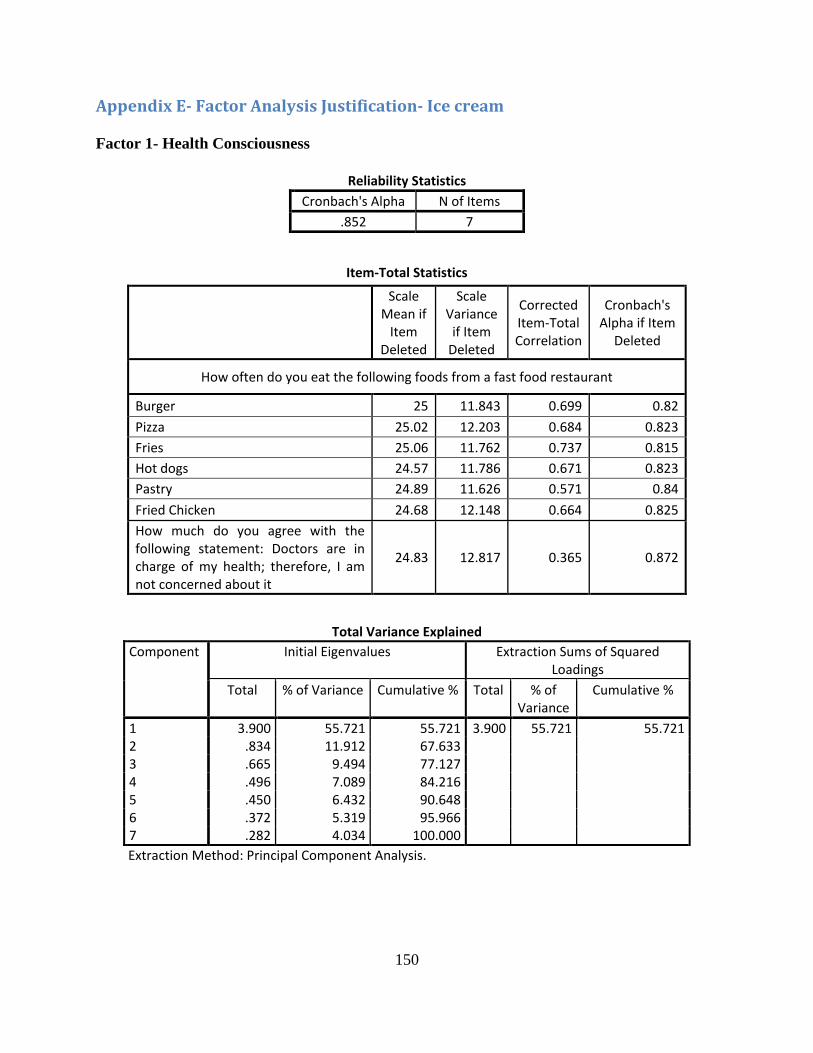
150
Appendix E- Factor Analysis Justification- Ice cream
Factor 1- Health Consciousness
Reliability Statistics Cronbach's Alpha N of Items
.852 7
Item-Total Statistics
Scale Mean if
Item Deleted
Scale Variance
if Item Deleted
Corrected Item-Total Correlation
Cronbach's Alpha if Item
Deleted
How often do you eat the following foods from a fast food restaurant
Burger 25 11.843 0.699 0.82 Pizza 25.02 12.203 0.684 0.823 Fries 25.06 11.762 0.737 0.815 Hot dogs 24.57 11.786 0.671 0.823 Pastry 24.89 11.626 0.571 0.84 Fried Chicken 24.68 12.148 0.664 0.825 How much do you agree with the following statement: Doctors are in charge of my health; therefore, I am not concerned about it
24.83 12.817 0.365 0.872
Total Variance Explained Component Initial Eigenvalues Extraction Sums of Squared
Loadings Total % of Variance Cumulative % Total % of
Variance Cumulative %
1 3.900 55.721 55.721 3.900 55.721 55.721 2 .834 11.912 67.633 3 .665 9.494 77.127 4 .496 7.089 84.216 5 .450 6.432 90.648 6 .372 5.319 95.966 7 .282 4.034 100.000 Extraction Method: Principal Component Analysis.
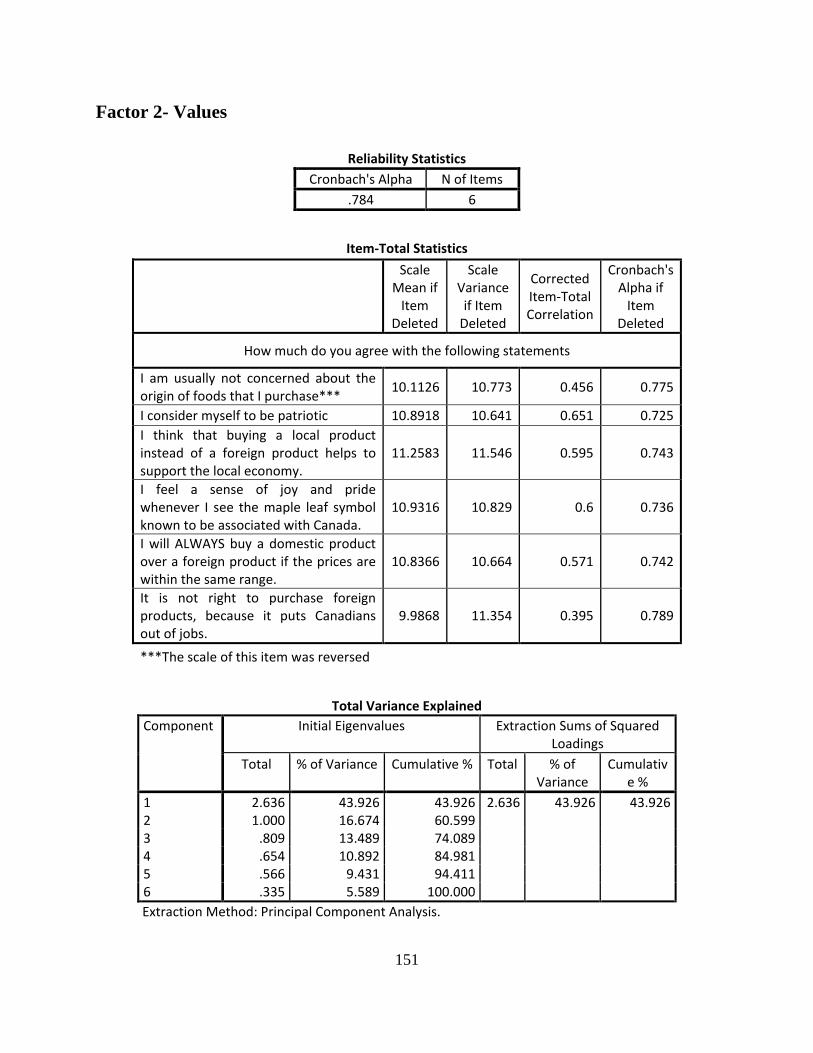
151
Factor 2- Values
Reliability Statistics Cronbach's Alpha N of Items
.784 6
Item-Total Statistics
Scale Mean if
Item Deleted
Scale Variance
if Item Deleted
Corrected Item-Total Correlation
Cronbach's Alpha if
Item Deleted
How much do you agree with the following statements
I am usually not concerned about the origin of foods that I purchase*** 10.1126 10.773 0.456 0.775
I consider myself to be patriotic 10.8918 10.641 0.651 0.725 I think that buying a local product instead of a foreign product helps to support the local economy.
11.2583 11.546 0.595 0.743
I feel a sense of joy and pride whenever I see the maple leaf symbol known to be associated with Canada.
10.9316 10.829 0.6 0.736
I will ALWAYS buy a domestic product over a foreign product if the prices are within the same range.
10.8366 10.664 0.571 0.742
It is not right to purchase foreign products, because it puts Canadians out of jobs.
9.9868 11.354 0.395 0.789
***The scale of this item was reversed
Total Variance Explained Component Initial Eigenvalues Extraction Sums of Squared
Loadings Total % of Variance Cumulative % Total % of
Variance Cumulativ
e % 1 2.636 43.926 43.926 2.636 43.926 43.926 2 1.000 16.674 60.599 3 .809 13.489 74.089 4 .654 10.892 84.981 5 .566 9.431 94.411 6 .335 5.589 100.000 Extraction Method: Principal Component Analysis.
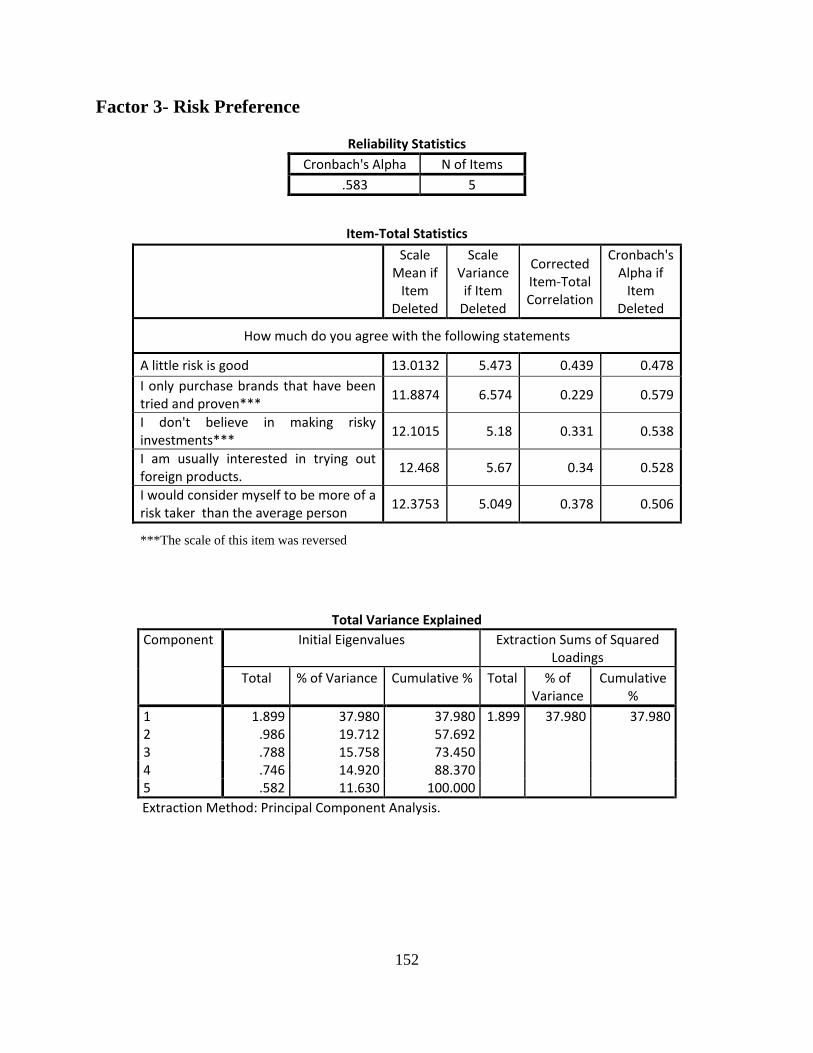
152
Factor 3- Risk Preference
Reliability Statistics Cronbach's Alpha N of Items
.583 5
Item-Total Statistics
Scale Mean if
Item Deleted
Scale Variance
if Item Deleted
Corrected Item-Total Correlation
Cronbach's Alpha if
Item Deleted
How much do you agree with the following statements
A little risk is good 13.0132 5.473 0.439 0.478 I only purchase brands that have been tried and proven*** 11.8874 6.574 0.229 0.579
I don't believe in making risky investments*** 12.1015 5.18 0.331 0.538
I am usually interested in trying out foreign products. 12.468 5.67 0.34 0.528
I would consider myself to be more of a risk taker than the average person 12.3753 5.049 0.378 0.506
***The scale of this item was reversed
Total Variance Explained Component Initial Eigenvalues Extraction Sums of Squared
Loadings Total % of Variance Cumulative % Total % of
Variance Cumulative
% 1 1.899 37.980 37.980 1.899 37.980 37.980 2 .986 19.712 57.692 3 .788 15.758 73.450 4 .746 14.920 88.370 5 .582 11.630 100.000 Extraction Method: Principal Component Analysis.
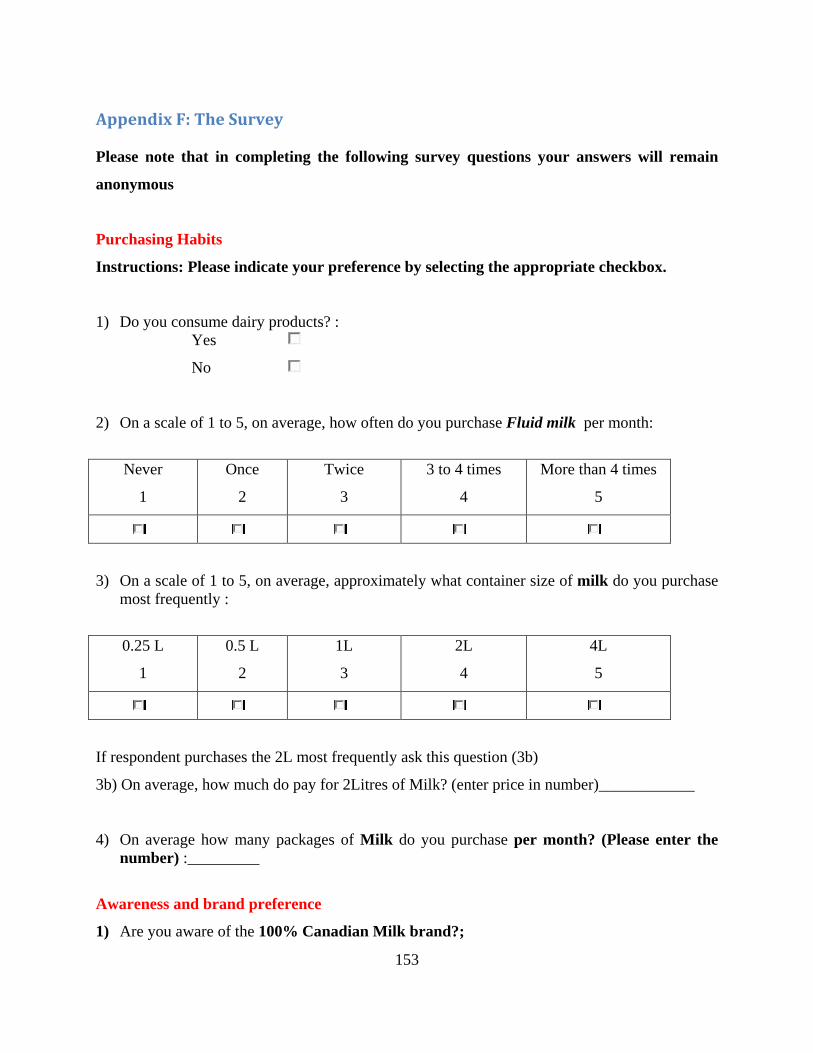
153
Appendix F: The Survey
Please note that in completing the following survey questions your answers will remain
anonymous
Purchasing Habits
Instructions: Please indicate your preference by selecting the appropriate checkbox.
1) Do you consume dairy products? : Yes
No
2) On a scale of 1 to 5, on average, how often do you purchase Fluid milk per month:
Never
1
Once
2
Twice
3
3 to 4 times
4
More than 4 times
5
3) On a scale of 1 to 5, on average, approximately what container size of milk do you purchase most frequently :
0.25 L
1
0.5 L
2
1L
3
2L
4
4L
5
If respondent purchases the 2L most frequently ask this question (3b)
3b) On average, how much do pay for 2Litres of Milk? (enter price in number)____________
4) On average how many packages of Milk do you purchase per month? (Please enter the number) :_________
Awareness and brand preference
1) Are you aware of the 100% Canadian Milk brand?;
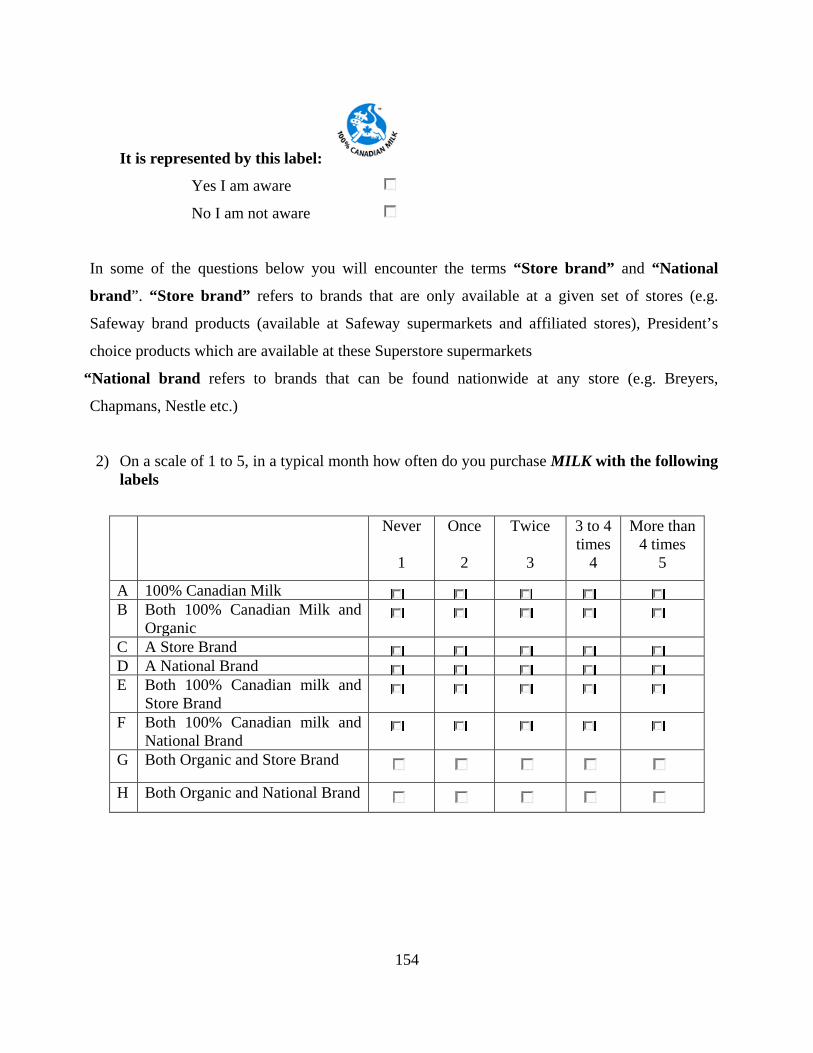
154
It is represented by this label:
Yes I am aware
No I am not aware
In some of the questions below you will encounter the terms “Store brand” and “National
brand”. “Store brand” refers to brands that are only available at a given set of stores (e.g.
Safeway brand products (available at Safeway supermarkets and affiliated stores), President’s
choice products which are available at these Superstore supermarkets
“National brand refers to brands that can be found nationwide at any store (e.g. Breyers,
Chapmans, Nestle etc.)
2) On a scale of 1 to 5, in a typical month how often do you purchase MILK with the following labels
Never 1
Once 2
Twice 3
3 to 4 times
4
More than 4 times
5
A 100% Canadian Milk C C C C B Both 100% Canadian Milk and Organic
C A Store Brand C
D A National Brand C C C C C E Both 100% Canadian milk and
Store Brand C C C C C
F Both 100% Canadian milk and National Brand C C C C C
G Both Organic and Store Brand
H Both Organic and National Brand

155
Consumers’ preferences for attributes of Milk
1) Please tick the attributes that are important to you when purchasing milk a. i. Price
ii. Fat content iii. Brand iv. Country of origin v. Appearance/packaging
vi. Nutritional Content vii. Taste viii. Best Before date b. From the factors above please specify the one that you would consider to be most
important: ________________
c. From those factors above, which would you consider to be the least important; please state: ___________________
d. If there are other factors that you consider to be very important that aren’t listed please list them:_______________ _______________ _______________
Consumers’ perceptions toward the 100% Canadian milk brand
1) On a scale of 1 to 5 please rate your agreement with the following statements “If I saw a product displaying the 100% Canadian milk brand logo, I would consider that product to be…”
Strongly Agree
1
Agree 2
Neutral 3
Disagree 4
Strongly Disagree
5 a A quality product b A local product c A nutritious d An inferior product
C C C C C e An expensive product
f A healthy Product

156
2) On a scale of 1 to 5, please rate your agreement with the following statements “In comparison to milk products without the 100% Canadian milk logo, I consider milk with the 100% Canadian milk logo to be:
Yes I Strongly Agree
1
Yes I Agree
2
I think it is the same
3
I think it is slightly unsafe
4
No I believe that it is very
unsafe to consume
5 a Safer to
consume C
Yes, I really
think so
1
Yes, to some extent
2
The quality is about the
same 3
I think the quality is slightly poorer
4
I think the quality is a lot poorer
5
b Of higher quality
Yes, to a
great extent 1
Yes, somewhat
2
I think it is the same
3
I think it is less
nutritious 4
I think the nutritional content is very poor
5 c More
nutritious C C C C
I strongly
agree 1
I somewhat
agree 2
I think it offers the
same 3
I think it offers
slightly less 4
I think it offers a lot
less 5
d Better value for money C C C C C
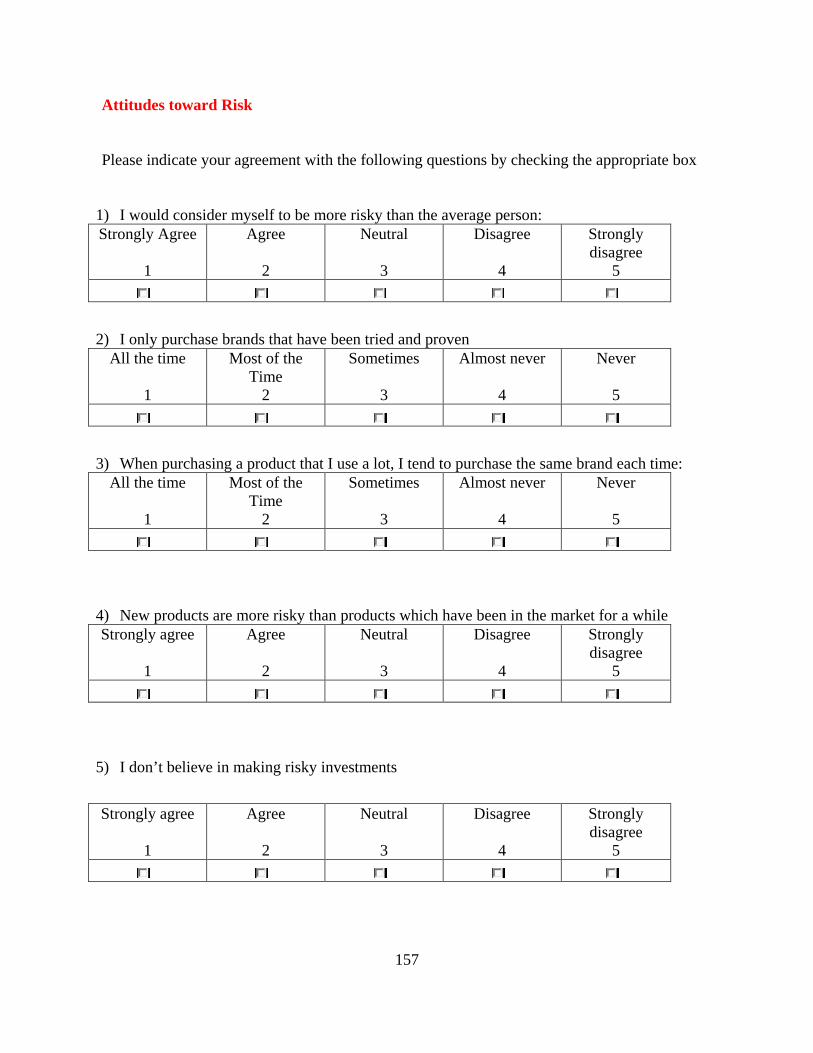
157
Attitudes toward Risk
Please indicate your agreement with the following questions by checking the appropriate box
1) I would consider myself to be more risky than the average person: Strongly Agree
1
Agree 2
Neutral 3
Disagree 4
Strongly disagree
5
C C C C C
2) I only purchase brands that have been tried and proven All the time
1
Most of the Time
2
Sometimes 3
Almost never 4
Never 5
3) When purchasing a product that I use a lot, I tend to purchase the same brand each time: All the time
1
Most of the Time
2
Sometimes 3
Almost never 4
Never 5
4) New products are more risky than products which have been in the market for a while Strongly agree
1
Agree 2
Neutral 3
Disagree 4
Strongly disagree
5 C
5) I don’t believe in making risky investments
Strongly agree 1
Agree 2
Neutral 3
Disagree 4
Strongly disagree
5
C C C C C
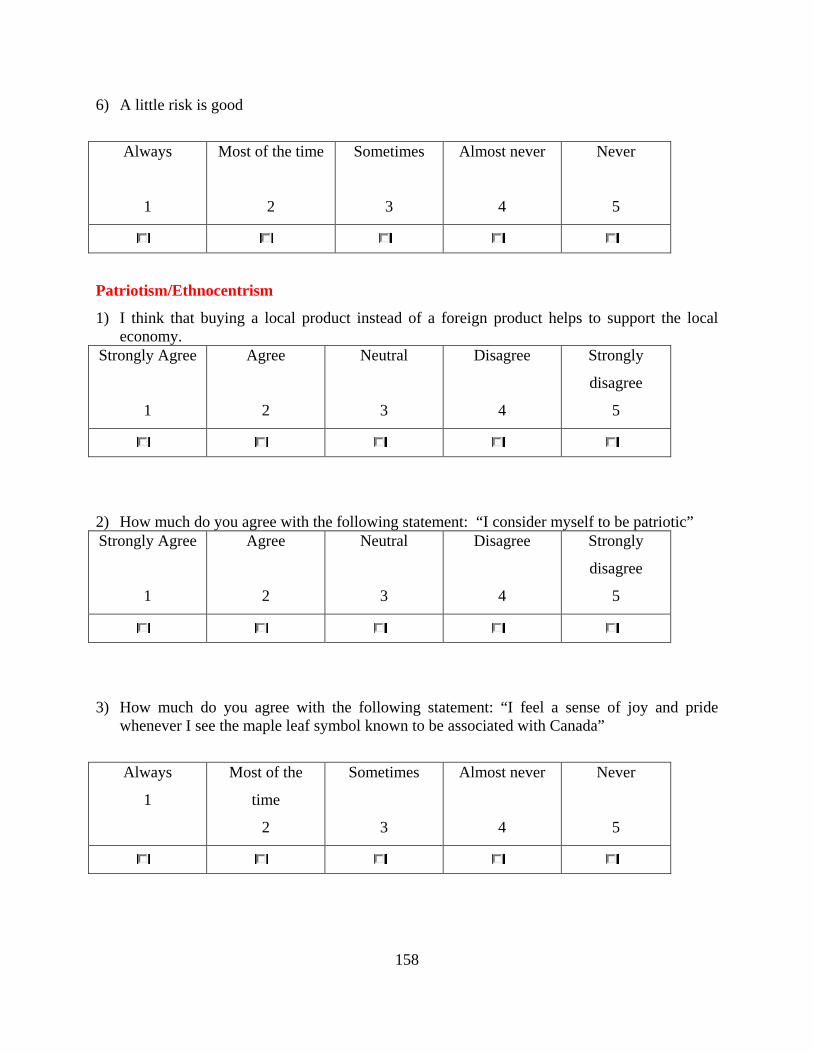
158
6) A little risk is good
Always
1
Most of the time
2
Sometimes
3
Almost never
4
Never
5
Patriotism/Ethnocentrism
1) I think that buying a local product instead of a foreign product helps to support the local economy.
Strongly Agree
1
Agree
2
Neutral
3
Disagree
4
Strongly
disagree
5
C C C
2) How much do you agree with the following statement: “I consider myself to be patriotic” Strongly Agree
1
Agree
2
Neutral
3
Disagree
4
Strongly
disagree
5
C C
3) How much do you agree with the following statement: “I feel a sense of joy and pride whenever I see the maple leaf symbol known to be associated with Canada”
Always
1
Most of the
time
2
Sometimes
3
Almost never
4
Never
5
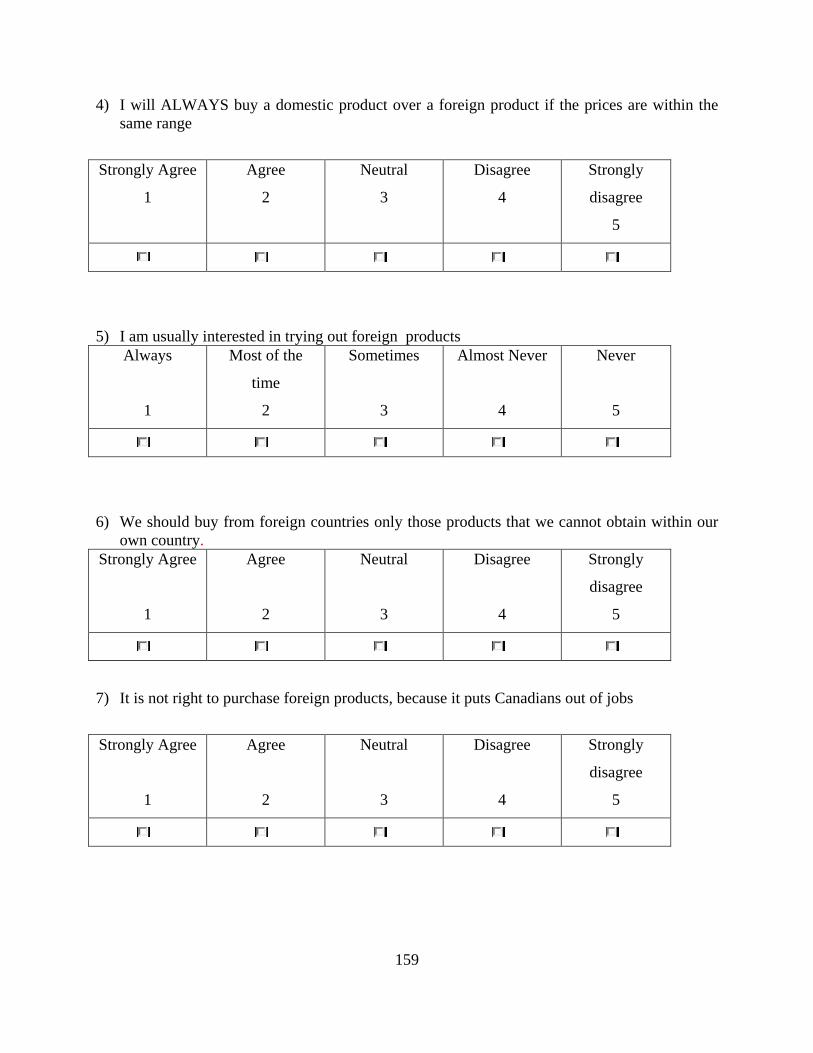
159
4) I will ALWAYS buy a domestic product over a foreign product if the prices are within the same range
Strongly Agree
1
Agree
2
Neutral
3
Disagree
4
Strongly
disagree
5
C C C
5) I am usually interested in trying out foreign products Always
1
Most of the
time
2
Sometimes
3
Almost Never
4
Never
5
C C C
6) We should buy from foreign countries only those products that we cannot obtain within our own country.
Strongly Agree
1
Agree
2
Neutral
3
Disagree
4
Strongly
disagree
5
7) It is not right to purchase foreign products, because it puts Canadians out of jobs
Strongly Agree
1
Agree
2
Neutral
3
Disagree
4
Strongly
disagree
5

160
8) I am usually not concerned about the origin of foods that I purchase
Strongly Agree
1
Agree
2
Neutral
3
Disagree
4
Strongly
disagree
5
9) Have you ever lived or worked on a farm?
Yes
No
10) On average how often do you shop at a farmers’ market per month?
Never
1
Once
2
Twice
3
3 to 4 times
4
More than 4 times
5
C C C C C
11) Imagine that you are at the supermarket shopping for milk; you see a milk brand with which you are unfamiliar. The milk however displays the 100% Canadian milk logo. On a scale of 1 to 5 please rate your agreement with the following statements:
Strongly Agree
1
Agree 2
Neutral 3
Disagree 4
Strongly Disagree
5 a I would never
purchase that milk C C C C C
b I would be reluctant to buy it but would
consider it C C C C C
c I would purchase it if it is cheaper
d I would purchase it if the price is in the
normal range C C C C C
e I would purchase it regardless of the cost
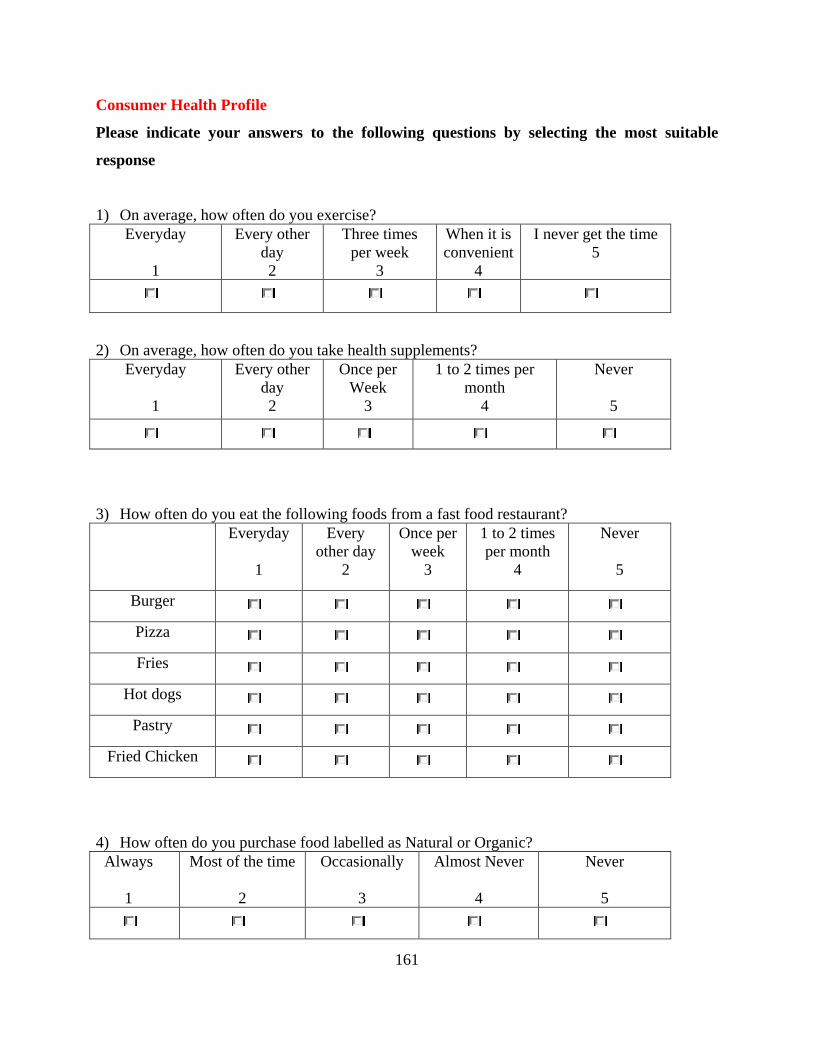
161
Consumer Health Profile
Please indicate your answers to the following questions by selecting the most suitable
response
1) On average, how often do you exercise? Everyday
1
Every other day 2
Three times per week
3
When it is convenient
4
I never get the time 5
C C C C C
2) On average, how often do you take health supplements? Everyday
1
Every other day 2
Once per Week
3
1 to 2 times per month
4
Never 5
C
3) How often do you eat the following foods from a fast food restaurant? Everyday
1
Every other day
2
Once per week
3
1 to 2 times per month
4
Never 5
Burger
Pizza
Fries
Hot dogs
Pastry
Fried Chicken
4) How often do you purchase food labelled as Natural or Organic? Always
1
Most of the time 2
Occasionally 3
Almost Never 4
Never 5

162
5) Life is too short to spend worrying about my health so I just enjoy life and all food in general Strongly Agree
1 Agree
2 Neutral
3 Disagree
4 Strongly disagree
5
C C C C C
6) Doctors are in charge of my health; therefore, I am not concerned about it. Strongly Agree
1 Agree
2 Neutral
3 Disagree
4 Strongly disagree
5
C C
Before you complete the next section, I want to talk to you about a problem that happens in
studies like this one.
The questions presented in this section are hypothetical ones, although they try to mimic the
choices available for purchase on a regular shopping trip. The product in question may have
other attributes that are not included and the available prices may be different from the ones you
now see at the supermarket you shop at. However, we want you to imagine that the prices and
attributes available below are the ones that you see on a shopping trip, and make your choice
based on what you actually believe you would choose. Because you may see different attributes
features when you go shopping for this product, the situation creates what is called a
“hypothetical bias”. This generally occurs when people respond to questions differently in a
hypothetical situation, such as this, versus a real situation involving real products and real
money. So it is important that you answer the questions exactly as you would answer if you
were really going to face these choices at your grocery store and buy the item with real money.
Section B- Consumers’ willingness to pay for co-branded dairy products
Imagine that you are in grocery store shopping, you suddenly remember that you are
almost out of milk and decide to shop for a 2-litre carton of milk. There are different milks
available with varying attributes and at different prices. You can either choose to purchase
one if it suits you or decide against purchasing the available options.

163
In the table below you will find a list of features that will be seen in the next eight questions. The
explanation of each attribute is also provided and is expected to help you to better understand the
questions being asked.
Attributes Explanation
The symbol is a seal of origin that guarantees the dairy products you’re buying are made entirely from 100% Canadian milk or milk ingredients.
Type: Organic, Conventional Milk labelled organic suggests that cows used to produce this milk have not been treated with hormones and that the milk contains no antibiotic. No such claims/suggestions are made with regards to conventional milk
Brand: National, Store A National brand such as Chapman’s and Breyers can be found throughout the country in all stores while store brands are only found in the affiliated store. For example, Safe Way brands (only found in Safe Way and affiliated stores) and President Choice brands only found in Canadian Super Store and affiliated stores.
Price: Range $2.83 to $5.52 National average price range for a 2-litre carton of milk (conventional and organic)
Please preview the example below in order to better understand the upcoming section.
Example: Imagine that you are shopping for milk the alternatives below are the only ones
available for purchase, select the one that you would choose:
Option A Option B Option C
I would not
purchase any
Labelled:
Type ORGANIC CONVENTIONAL CONVENTIONAL Brand STORE NATIONAL NATIONAL Price ($) 4.60 5.52 2.83 I would choose...
I have selected option B. By selecting option B, I have indicated that of the four choices
available, I would purchase a 2-litre carton of milk with the 100% Canadian milk label,
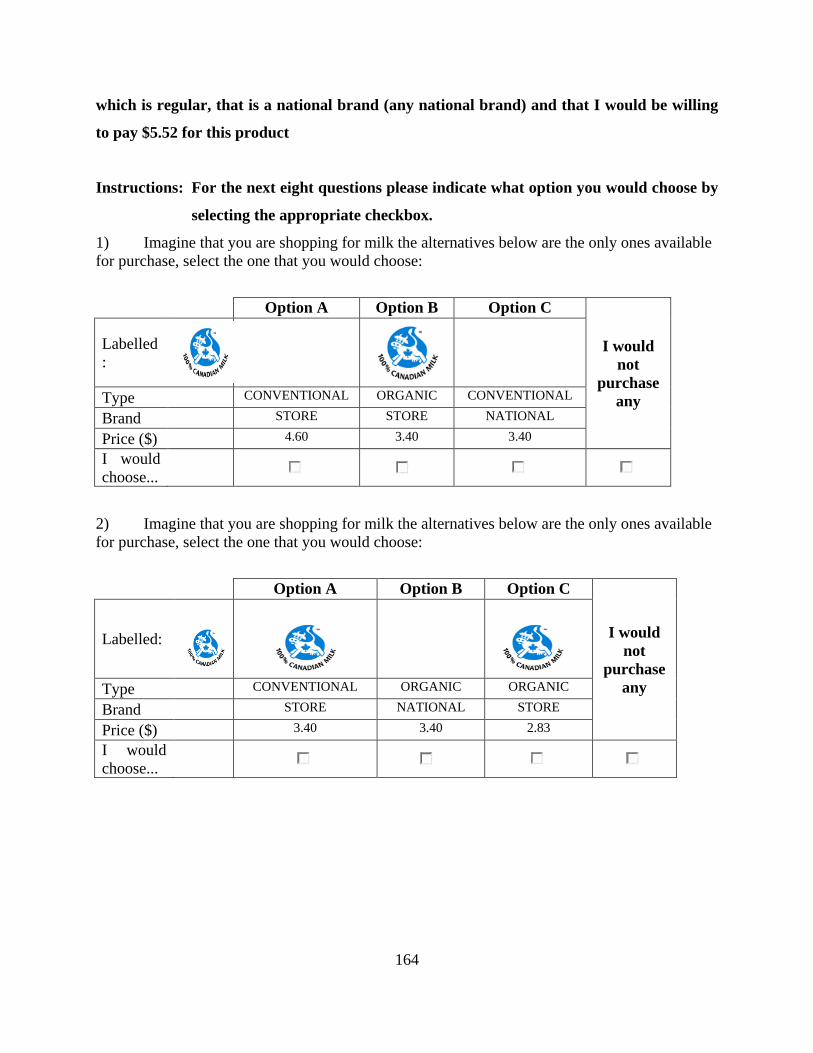
164
which is regular, that is a national brand (any national brand) and that I would be willing
to pay $5.52 for this product
Instructions: For the next eight questions please indicate what option you would choose by
selecting the appropriate checkbox.
1) Imagine that you are shopping for milk the alternatives below are the only ones available for purchase, select the one that you would choose:
Option A Option B Option C
I would not
purchase any
Labelled:
Type CONVENTIONAL ORGANIC CONVENTIONAL
Brand STORE STORE NATIONAL
Price ($) 4.60 3.40 3.40
I would choose...
2) Imagine that you are shopping for milk the alternatives below are the only ones available for purchase, select the one that you would choose:
Option A Option B Option C
I would not
purchase any
Labelled:
Type CONVENTIONAL ORGANIC ORGANIC
Brand STORE NATIONAL STORE
Price ($) 3.40 3.40 2.83
I would choose...

165
3) Imagine that you are shopping for milk the alternatives below are the only ones available for purchase, select the one that you would choose:
Option A Option B Option C
I would not
purchase any
Labelled:
Type ORGANIC CONVENTIONAL ORGANIC
Brand NATIONAL NATIONAL STORE
Price ($) 5.52 4.60 5.52
I would choose...
4) Imagine that you are shopping for milk the alternatives below are the only ones available for purchase, select the one that you would choose:
Option A Option B Option C
I would not
purchase any
Labelled
Type ORGANIC CONVENTIONAL ORGANIC
Brand STORE STORE NATIONAL
Price ($) 4.60 3.40 4.60
I would choose...
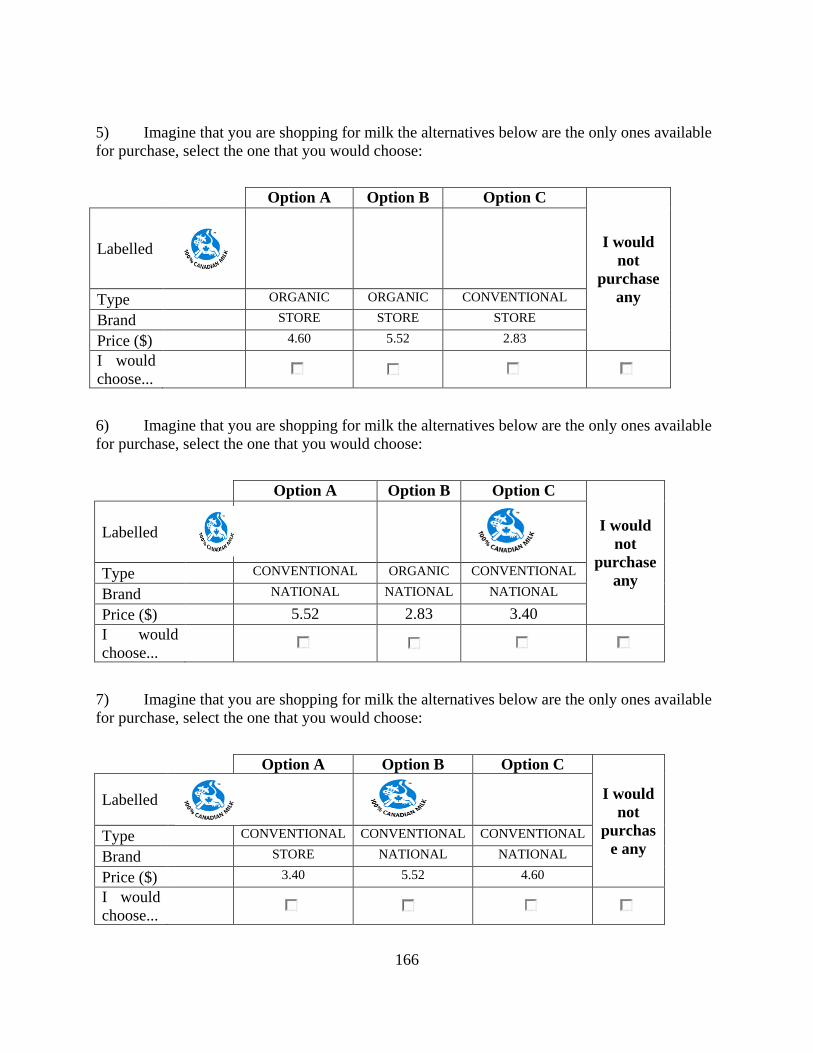
166
5) Imagine that you are shopping for milk the alternatives below are the only ones available for purchase, select the one that you would choose:
Option A Option B Option C
I would not
purchase any
Labelled
Type ORGANIC ORGANIC CONVENTIONAL
Brand STORE STORE STORE
Price ($) 4.60 5.52 2.83
I would choose...
6) Imagine that you are shopping for milk the alternatives below are the only ones available for purchase, select the one that you would choose:
Option A Option B Option C
I would not
purchase any
Labelled
Type CONVENTIONAL ORGANIC CONVENTIONAL
Brand NATIONAL NATIONAL NATIONAL
Price ($) 5.52 2.83 3.40 I would choose...
7) Imagine that you are shopping for milk the alternatives below are the only ones available for purchase, select the one that you would choose:
Option A Option B Option C
I would not
purchase any
Labelled
Type CONVENTIONAL CONVENTIONAL CONVENTIONAL
Brand STORE NATIONAL NATIONAL
Price ($) 3.40 5.52 4.60
I would choose...
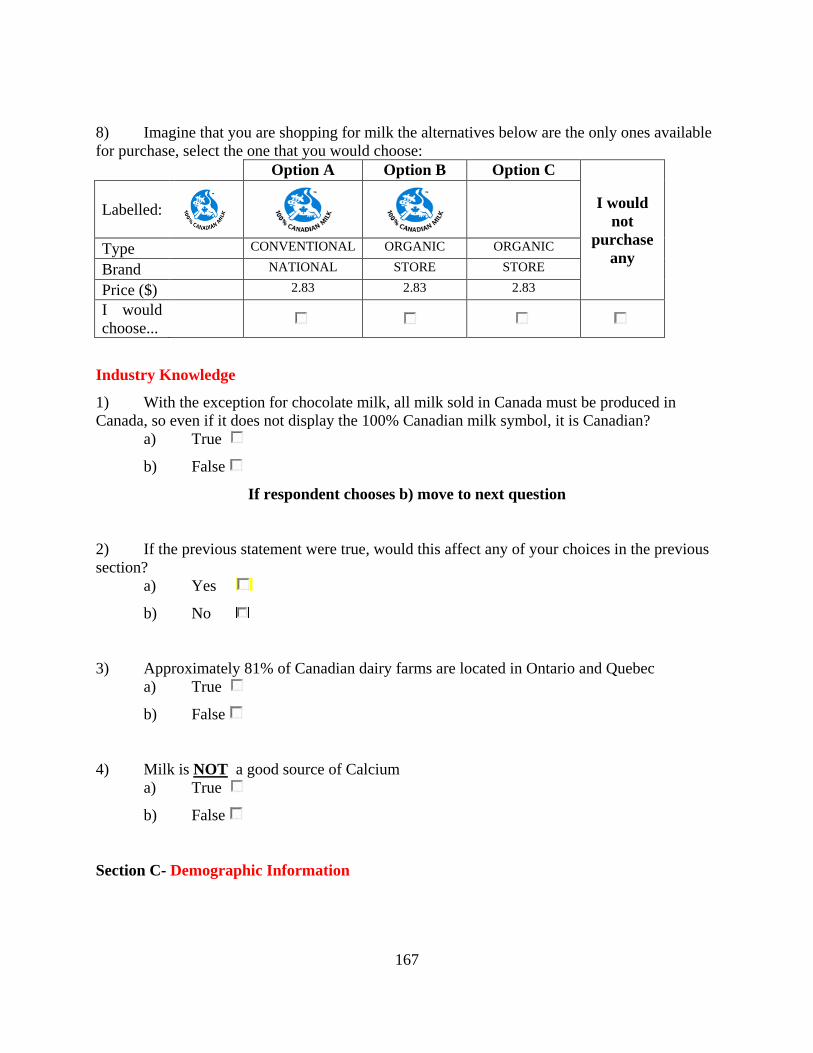
167
8) Imagine that you are shopping for milk the alternatives below are the only ones available for purchase, select the one that you would choose: Option A Option B Option C
I would not
purchase any
Labelled:
Type CONVENTIONAL ORGANIC ORGANIC
Brand NATIONAL STORE STORE
Price ($) 2.83 2.83 2.83
I would choose...
Industry Knowledge
1) With the exception for chocolate milk, all milk sold in Canada must be produced in Canada, so even if it does not display the 100% Canadian milk symbol, it is Canadian?
a) True
b) False
If respondent chooses b) move to next question
2) If the previous statement were true, would this affect any of your choices in the previous section?
a) Yes
b) No
3) Approximately 81% of Canadian dairy farms are located in Ontario and Quebec a) True
b) False
4) Milk is NOT a good source of Calcium a) True
b) False
Section C- Demographic Information

168
The following questions are designed to help us get a better understanding of your
background and the factors that may influence your purchasing decisions relative to other
respondents. Your identity will not be linked to your responses.
Instructions: Please tick the appropriate box or write on the line provided.
1. What is your gender Male
Female
2. What range best describes your household size including yourself? a) 1 b) 2-4 c) 5-7 d) Over 7
3. Do you or any member of your household suffer from any dietary related health issues such as high blood pressure, high cholesterol and heart disease:
Yes
No
4. Are you or any member of your household allergic to dairy products? Yes
No
5. How many children under age 12 currently reside in your household? ________
6. Which of the following group best describes your household’s gross annual income? a) Less than $25 000 b) 25 000- 44 999 c) 45 000-64 999 d) 65 000- 84 999 e) 85 000-104 999 f) 105 000-150 000 g) Over 150 000

169
7. Which of the following categories best describe your role in the grocery shopping for your household?
a) Primary Shopper b) Someone else is the primary shopper c) The shopping is shared
8. What is the highest level of education that you have completed? : a) Less than high school b) High School c) Some College d) Bachelor’s Degree e) Graduate Degree
9. Please indicate which category best describes your age. a) Under 20 b) 20-30 c) 31-40 d) 41-50 e) 51-65 f) 66 and over
10. Please enter the first three digits of your postal code:______________
Thank you very much for participating in this survey!
By completing this survey you have played an integral role towards the completion of my
Master’s thesis, which seeks to assess consumers’ willingness to pay for dairy products co-
branded with the 100% Canadian milk label.
If you have any comments or concerns, pertaining to the survey please feel free to write it in the
box provided below.

170
Appendix G: Frequency Distributions
Frequency Distribution reflecting Milk respondents’ perceptions of products with the
100% Canadian milk symbol
A local product
Frequency Percent Valid Percent Cumulative Percent
Strongly Agree 143 31.4 31.4 31.4 Agree 157 34.5 34.5 65.9 Neutral 119 26.2 26.2 92.1 Disagree 28 6.2 6.2 98.2 Strongly Disagree 8 1.8 1.8 100.0 Total 455 100.0 100.0
Most of the respondents agreed that the symbol helped to identify products as local and that they
would therefore view a product with the 100% Canadian milk symbol as a local product. On the
other hand 26% of respondents neither agreed nor disagreed which shows some uncertainty
about what the symbol represents. 8% of respondents blatantly disagreed.
A nutritious product (D1)
Frequency Percent Valid Percent Cumulative Percent
Strongly Agree 186 40.9 40.9 40.9 Agree 186 40.9 40.9 81.8 Neutral 71 15.6 15.6 97.4 Disagree 5 1.1 1.1 98.5 Strongly Disagree 7 1.5 1.5 100.0 Total 455 100.0 100.0
Most respondents agreed that the 100% Canadian milk symbol on a product signals that the
product is a nutritious product, while approximately 3% of respondents disagreed. Clearly, health
conscious respondents would therefore be expected to be willing to pay a premium to have this
symbol on their dairy products if this represents their view.
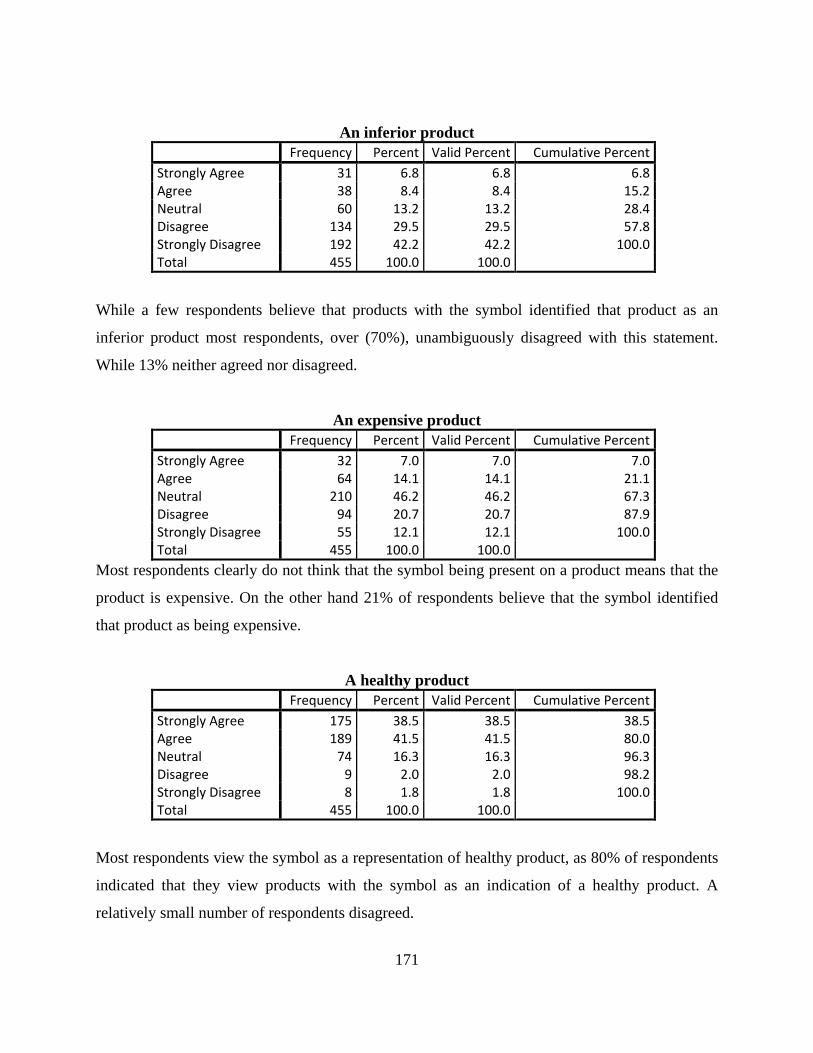
171
An inferior product Frequency Percent Valid Percent Cumulative Percent Strongly Agree 31 6.8 6.8 6.8 Agree 38 8.4 8.4 15.2 Neutral 60 13.2 13.2 28.4 Disagree 134 29.5 29.5 57.8 Strongly Disagree 192 42.2 42.2 100.0 Total 455 100.0 100.0
While a few respondents believe that products with the symbol identified that product as an
inferior product most respondents, over (70%), unambiguously disagreed with this statement.
While 13% neither agreed nor disagreed.
An expensive product Frequency Percent Valid Percent Cumulative Percent Strongly Agree 32 7.0 7.0 7.0 Agree 64 14.1 14.1 21.1 Neutral 210 46.2 46.2 67.3 Disagree 94 20.7 20.7 87.9 Strongly Disagree 55 12.1 12.1 100.0 Total 455 100.0 100.0
Most respondents clearly do not think that the symbol being present on a product means that the
product is expensive. On the other hand 21% of respondents believe that the symbol identified
that product as being expensive.
A healthy product Frequency Percent Valid Percent Cumulative Percent Strongly Agree 175 38.5 38.5 38.5 Agree 189 41.5 41.5 80.0 Neutral 74 16.3 16.3 96.3 Disagree 9 2.0 2.0 98.2 Strongly Disagree 8 1.8 1.8 100.0 Total 455 100.0 100.0
Most respondents view the symbol as a representation of healthy product, as 80% of respondents
indicated that they view products with the symbol as an indication of a healthy product. A
relatively small number of respondents disagreed.

172
Safer to consume Frequency Percent Valid Percent Cumulative Percent Yes, I Strongly Agree 188 41.3 41.3 41.3
Yes, I Agree 151 33.2 33.2 74.5 I think it is about the same 107 23.5 23.5 98.0
No, I think it is slightly unsafe 7 1.5 1.5 99.6
No, I believe that it is very unsafe to consume 2 .4 .4 100.0
Total 455 100.0 100.0
Although most respondents saw the symbol as an indication of a healthy product, the number of
respondents indicating that the symbol identified that product as safer to consume is clearly
significantly less. This indicates that respondents do not believe that healthy means safe.
Of higher quality Frequency Percent Valid Percent Cumulative Percent Yes, I really think so 170 37.4 37.4 37.4
Yes, to some extent 164 36.0 36.0 73.4 The quality is about the same 111 24.4 24.4 97.8
No, I think the quality is slightly poorer 6 1.3 1.3 99.1
No, I think the quality is a lot poorer 4 .9 .9 100.0
Total 455 100.0 100.0
Most respondents indicated that they believe products with the symbol are of higher quality than
products without the symbol. On the other hand quite a number of respondents neither agreed nor
disagreed.
More nutritious Frequency Percent Valid Percent Cumulative Percent Yes, to a great extent 106 23.3 23.3 23.3 Yes, somewhat 135 29.7 29.7 53.0 I think it is about the same 208 45.7 45.7 98.7
No, I think it is less nutritious 6 1.3 1.3 100.0
Total 455 100.0 100.0
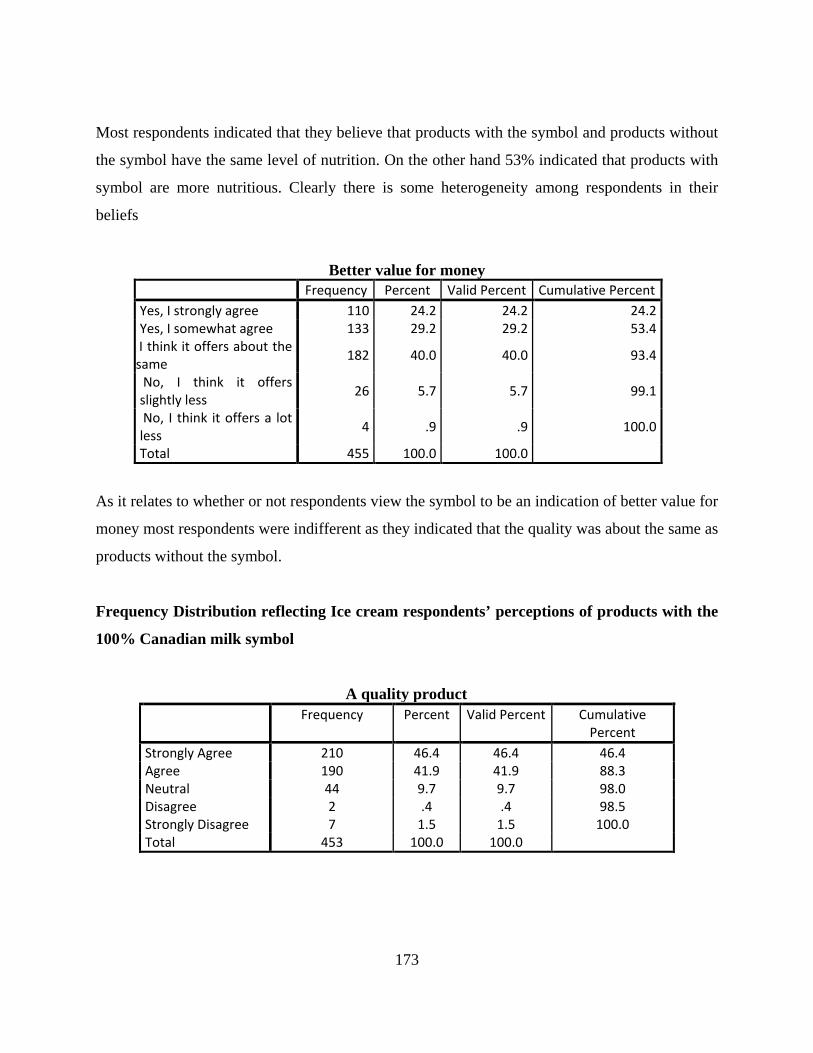
173
Most respondents indicated that they believe that products with the symbol and products without
the symbol have the same level of nutrition. On the other hand 53% indicated that products with
symbol are more nutritious. Clearly there is some heterogeneity among respondents in their
beliefs
Better value for money Frequency Percent Valid Percent Cumulative Percent Yes, I strongly agree 110 24.2 24.2 24.2 Yes, I somewhat agree 133 29.2 29.2 53.4
I think it offers about the same 182 40.0 40.0 93.4
No, I think it offers slightly less 26 5.7 5.7 99.1
No, I think it offers a lot less 4 .9 .9 100.0
Total 455 100.0 100.0
As it relates to whether or not respondents view the symbol to be an indication of better value for
money most respondents were indifferent as they indicated that the quality was about the same as
products without the symbol.
Frequency Distribution reflecting Ice cream respondents’ perceptions of products with the
100% Canadian milk symbol
A quality product
Frequency Percent Valid Percent Cumulative
Percent Strongly Agree 210 46.4 46.4 46.4 Agree 190 41.9 41.9 88.3 Neutral 44 9.7 9.7 98.0 Disagree 2 .4 .4 98.5 Strongly Disagree 7 1.5 1.5 100.0 Total 453 100.0 100.0
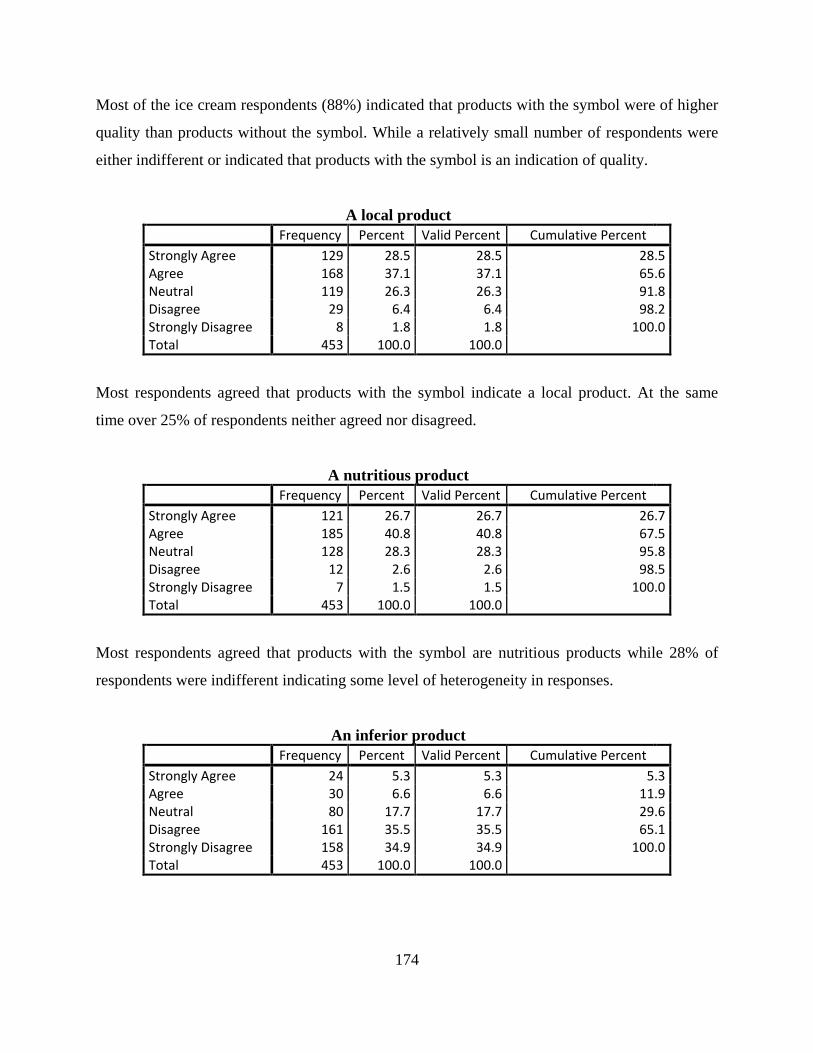
174
Most of the ice cream respondents (88%) indicated that products with the symbol were of higher
quality than products without the symbol. While a relatively small number of respondents were
either indifferent or indicated that products with the symbol is an indication of quality.
A local product Frequency Percent Valid Percent Cumulative Percent Strongly Agree 129 28.5 28.5 28.5 Agree 168 37.1 37.1 65.6 Neutral 119 26.3 26.3 91.8 Disagree 29 6.4 6.4 98.2 Strongly Disagree 8 1.8 1.8 100.0 Total 453 100.0 100.0
Most respondents agreed that products with the symbol indicate a local product. At the same
time over 25% of respondents neither agreed nor disagreed.
A nutritious product Frequency Percent Valid Percent Cumulative Percent Strongly Agree 121 26.7 26.7 26.7 Agree 185 40.8 40.8 67.5 Neutral 128 28.3 28.3 95.8 Disagree 12 2.6 2.6 98.5 Strongly Disagree 7 1.5 1.5 100.0 Total 453 100.0 100.0
Most respondents agreed that products with the symbol are nutritious products while 28% of
respondents were indifferent indicating some level of heterogeneity in responses.
An inferior product Frequency Percent Valid Percent Cumulative Percent Strongly Agree 24 5.3 5.3 5.3 Agree 30 6.6 6.6 11.9 Neutral 80 17.7 17.7 29.6 Disagree 161 35.5 35.5 65.1 Strongly Disagree 158 34.9 34.9 100.0 Total 453 100.0 100.0

175
Most respondents disagreed with the statement that the symbol indicates that a product is
inferior.
An expensive product Frequency Percent Valid Percent Cumulative Percent Strongly Agree 18 4.0 4.0 4.0 Agree 81 17.9 17.9 21.9 Neutral 229 50.6 50.6 72.4 Disagree 102 22.5 22.5 94.9 Strongly Disagree 23 5.1 5.1 100.0 Total 453 100.0 100.0
Respondents were mostly uncertain as to whether or not the symbol means that a product is
relatively expensive. 27% of respondents however disagreed that this was the case.
A healthy product Frequency Percent Valid Percent Cumulative Percent Strongly Agree 91 20.1 20.1 20.1 Agree 190 41.9 41.9 62.0 Neutral 150 33.1 33.1 95.1 Disagree 12 2.6 2.6 97.8 Strongly Disagree 10 2.2 2.2 100.0 Total 453 100.0 100.0
While most respondents indicated that they view products with the symbol as healthy products.
As much as one-third of respondents were indifferent.
Safer to consume
Frequency Percent Valid Percent Cumulative Percent Yes, I Strongly Agree 137 30.2 30.2 30.2 Yes, I Agree 187 41.3 41.3 71.5 I think it is about the same 124 27.4 27.4 98.9
No, I think it is slightly unsafe 3 .7 .7 99.6
No, I believe that it is very unsafe to consume 2 .4 .4 100.0
Total 453 100.0 100.0
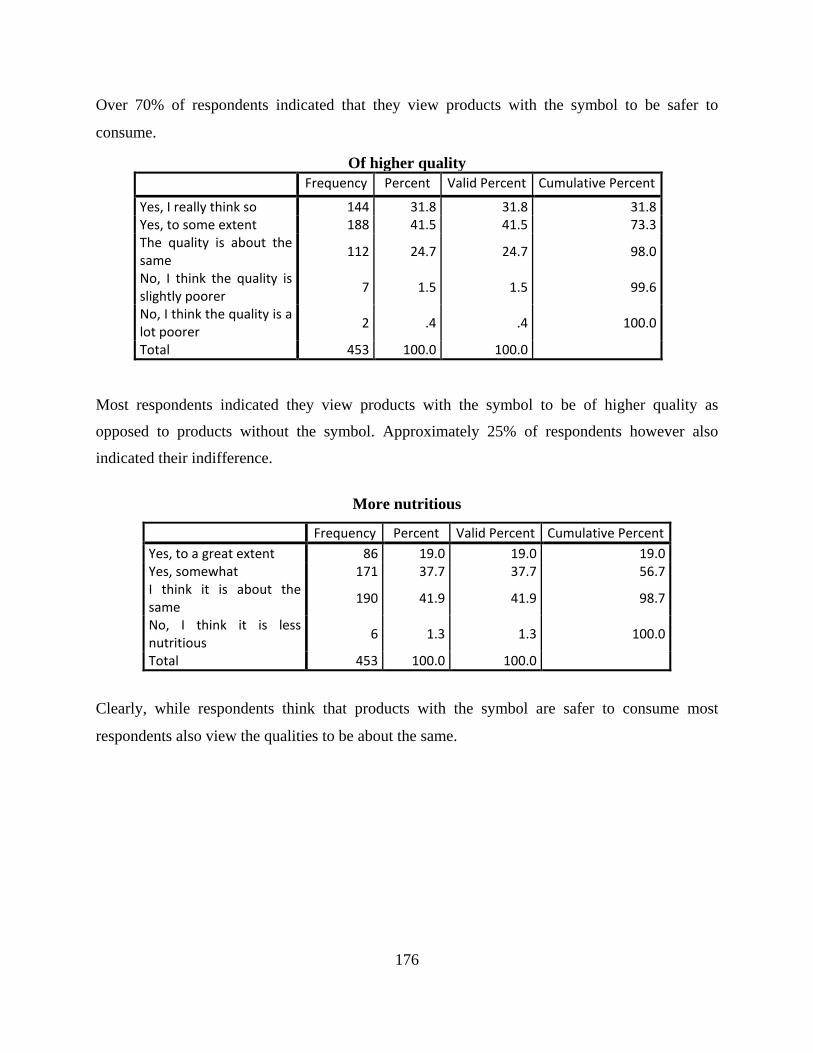
176
Over 70% of respondents indicated that they view products with the symbol to be safer to
consume.
Of higher quality Frequency Percent Valid Percent Cumulative Percent
Yes, I really think so 144 31.8 31.8 31.8 Yes, to some extent 188 41.5 41.5 73.3 The quality is about the same 112 24.7 24.7 98.0
No, I think the quality is slightly poorer 7 1.5 1.5 99.6
No, I think the quality is a lot poorer 2 .4 .4 100.0
Total 453 100.0 100.0
Most respondents indicated they view products with the symbol to be of higher quality as
opposed to products without the symbol. Approximately 25% of respondents however also
indicated their indifference.
More nutritious
Frequency Percent Valid Percent Cumulative Percent Yes, to a great extent 86 19.0 19.0 19.0 Yes, somewhat 171 37.7 37.7 56.7 I think it is about the same 190 41.9 41.9 98.7
No, I think it is less nutritious 6 1.3 1.3 100.0
Total 453 100.0 100.0
Clearly, while respondents think that products with the symbol are safer to consume most
respondents also view the qualities to be about the same.

177
Appendix H: Descriptive Statistics- Milk Survey
Purchasing Habits & Brand Awareness and Preferences Descriptive Statistics
N Minimum Maximum Mean Std. Deviation
On average, how often do you purchase milk (i.e. milk as a liquid not powder form) per month (1=never, 5=more than 4 times)
455 2 5 4.16 0.874
Approximately what container size of milk do you purchase most frequently (1=Smallest, 5= Largest)
455 1 5 4.35 0.795
Are you aware of the 100% Canadian Milk brand? (1=Yes, 2=No) 455 1 2 1.06 0.241
In a typical month period how often do you purchase milk with the 100% Canadian Milk label(1=never, 5=More than 4 times)
455 1 5 3.19 1.499
In a typical month how often do you purchase MILK with both 100% Canadian Milk and Organic labels (1=never, 5=More than 4 times)
455 1 5 1.44 0.96
In a typical month period how often do you purchase milk with a Store Brand label (1=never, 5= more than 4 times)
455 1 5 1.69 1.21
In a typical month period how often do you purchase milk with a National Brand label (1=never, 5= more than 4 times)
455 1 5 2.95 1.502
In a typical month period how often do you purchase milk with both 100% Canadian milk and Store Brand labels (1=never, 5= more than 4 times)
455 1 5 1.77 1.285
In a typical month period how often do you purchase milk with both 100% Canadian milk and National Brand labels (1=never, 5=more than 4 times)
455 1 5 2.47 1.535
In a typical three month period how often do you purchase milk with both Organic and Store Brand labels (1=never, 5= more than 4 times)
455 1 5 1.24 0.71
In a typical month period how often do you purchase milk with both Organic and National Brand labels (1=never, 5= more than 4 times)
455 1 5 1.3 0.829

178
Consumers’ Perceptions towards the 100% Canadian milk Brand
Descriptive Statistics
N Minimum Maximum Mean Std. Deviation
If I saw a product displaying the 100% Canadian milk brand logo, I would consider that product to be a quality product (1= strongly agree, 5=strongly disagree)
455 1 5 1.56 0.791
If I saw a product displaying the 100% Canadian milk brand logo, I would consider that product to be a local product (1= strongly agree, 5=strongly disagree)
455 1 5 2.12 0.983
If I saw a product displaying the 100% Canadian milk brand logo, I would consider that product to be a nutritious product (1= strongly agree, 5=strongly disagree)
455 1 5 1.82 0.845
If I saw a product displaying the 100% Canadian milk brand logo, I would consider that product to be an inferior product (1= strongly agree, 5=strongly disagree)
455 1 5 3.92 1.224
If I saw a product displaying the 100% Canadian milk brand logo, I would consider that product to be an expensive product (1= strongly agree, 5=strongly disagree)
455 1 5 3.17 1.042
If I saw a product displaying the 100% Canadian milk brand logo, I would consider that product to be a healthy product (1= strongly agree, 5=strongly disagree)
455 1 5 1.87 0.877
In comparison to milk products without the 100% Canadian milk logo, I consider milk with the 100% Canadian milk logo to be safer to consume (1= strongly agree, 5=strongly disagree)
455 1 5 1.87 0.856
In comparison to milk products without the 100% Canadian milk logo, I consider milk with the 100% Canadian milk logo to be of higher quality (1= strongly agree, 5=strongly disagree)
455 1 5 1.92 0.863
In comparison to milk products without the 100% Canadian milk logo, I consider milk with the 100% Canadian milk logo to be more nutritious (1= strongly agree, 5=strongly disagree)
455 1 4 2.25 0.826
In comparison to milk products without the 100% Canadian milk logo, I consider milk with the 100% Canadian milk logo to be better value for the money (1= strongly agree, 5=strongly disagree)
455 1 5 2.3 0.928
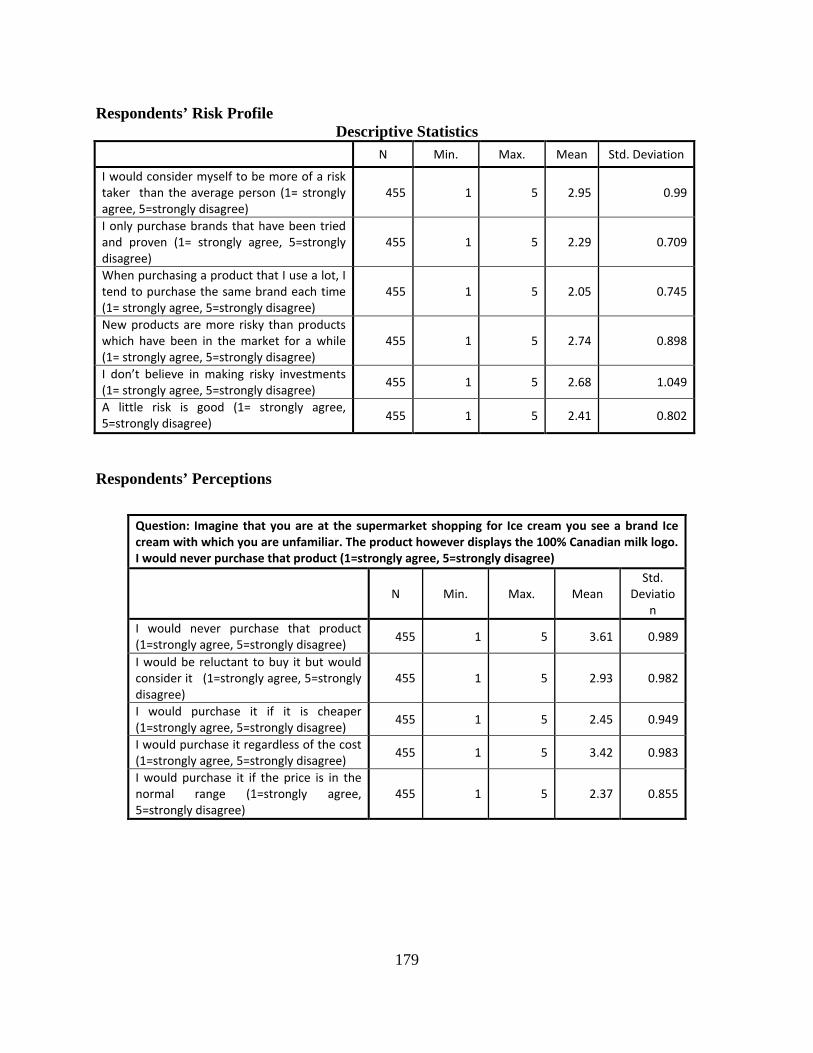
179
Respondents’ Risk Profile Descriptive Statistics
N Min. Max. Mean Std. Deviation
I would consider myself to be more of a risk taker than the average person (1= strongly agree, 5=strongly disagree)
455 1 5 2.95 0.99
I only purchase brands that have been tried and proven (1= strongly agree, 5=strongly disagree)
455 1 5 2.29 0.709
When purchasing a product that I use a lot, I tend to purchase the same brand each time (1= strongly agree, 5=strongly disagree)
455 1 5 2.05 0.745
New products are more risky than products which have been in the market for a while (1= strongly agree, 5=strongly disagree)
455 1 5 2.74 0.898
I don’t believe in making risky investments (1= strongly agree, 5=strongly disagree) 455 1 5 2.68 1.049
A little risk is good (1= strongly agree, 5=strongly disagree) 455 1 5 2.41 0.802
Respondents’ Perceptions
Question: Imagine that you are at the supermarket shopping for Ice cream you see a brand Ice cream with which you are unfamiliar. The product however displays the 100% Canadian milk logo. I would never purchase that product (1=strongly agree, 5=strongly disagree)
N Min. Max. Mean Std.
Deviation
I would never purchase that product (1=strongly agree, 5=strongly disagree) 455 1 5 3.61 0.989
I would be reluctant to buy it but would consider it (1=strongly agree, 5=strongly disagree)
455 1 5 2.93 0.982
I would purchase it if it is cheaper (1=strongly agree, 5=strongly disagree) 455 1 5 2.45 0.949
I would purchase it regardless of the cost (1=strongly agree, 5=strongly disagree) 455 1 5 3.42 0.983
I would purchase it if the price is in the normal range (1=strongly agree, 5=strongly disagree)
455 1 5 2.37 0.855

180
Respondents’ Domestic Values
Descriptive Statistics N Min. Max. Mean Std.
Deviation I think that buying a local product instead of a foreign product helps to support the local economy (1= strongly agree, 5=strongly disagree)
455 1 5 1.56 0.757
I consider myself to be patriotic (1= strongly agree, 5=strongly disagree) 455 1 5 2.02 0.955
I feel a sense of joy and pride whenever I see the maple leaf symbol known to be associated with Canada (1= strongly agree, 5=strongly disagree)
455 1 5 1.93 0.943
I will ALWAYS buy a domestic product over a foreign product if the prices are within the same range (1= strongly agree, 5=strongly disagree)
455 1 5 1.99 0.994
I am usually interested in trying out foreign products (1= strongly agree, 5=strongly disagree) 455 1 5 2.95 0.886
We should buy from foreign countries only those products that we cannot obtain within our own country (1= strongly agree, 5=strongly disagree)
455 1 5 2.49 0.964
It is not right to purchase foreign products, because it puts Canadians out of jobs (1= strongly agree, 5=strongly disagree)
455 1 5 2.81 1.064
I am usually not concerned about the origin of foods that I purchase (1= strongly agree, 5=strongly disagree) 455 1 5 3.41 1.13
Have you ever lived or worked on a farm? (1= yes, 5= no) 455 1 2 1.78 0.415 On average how often do you shop at a farmers’ market per month? (1= never, 5= more than 4 times) 455 1 5 1.83 0.924

181
Health Profiles Descriptive Statistics
N Minimum Maximum Mean Std. Deviation
On average, how often do you exercise? (1= everyday, 5= I never get the time) 455 1 5 3.04 1.259
On average, how often do you take health supplements? (1=everyday, 5=never) 455 1 5 3.11 1.715
How often do you eat burgers from a fast food restaurant? (1=everyday, 5=never) 455 1 5 3.98 0.755
How often do you eat pizza from a fast food restaurant? (1=everyday, 5=never) 455 1 5 4 0.645
How often do you eat fries from a fast food restaurant?) (1=everyday, 5=never) 455 1 5 3.95 0.737
How often do you eat hot dogs from a fast food restaurant?) (1=everyday, 5=never) 455 1 5 4.41 0.748
How often do you eat pastry from a fast food restaurant? (1=everyday, 5=never) 455 1 5 4.06 0.93
How often do you eat fried chicken from a fast food restaurant? (1=everyday, 5=never) 455 1 5 4.31 0.703
How often do you purchase food labelled as Natural or Organic? (1= always, 5=never) 455 1 5 3.38 0.961
Life is too short to spend worrying about my health so I just enjoy life and all food in general (1=strongly agree, 5= strongly disagree)
455 1 5 3.26 1.094
Doctors are in charge of my health therefore, I am not concerned about it (1=agree , 5=strongly disagree)
455 1 5 4.09 0.921
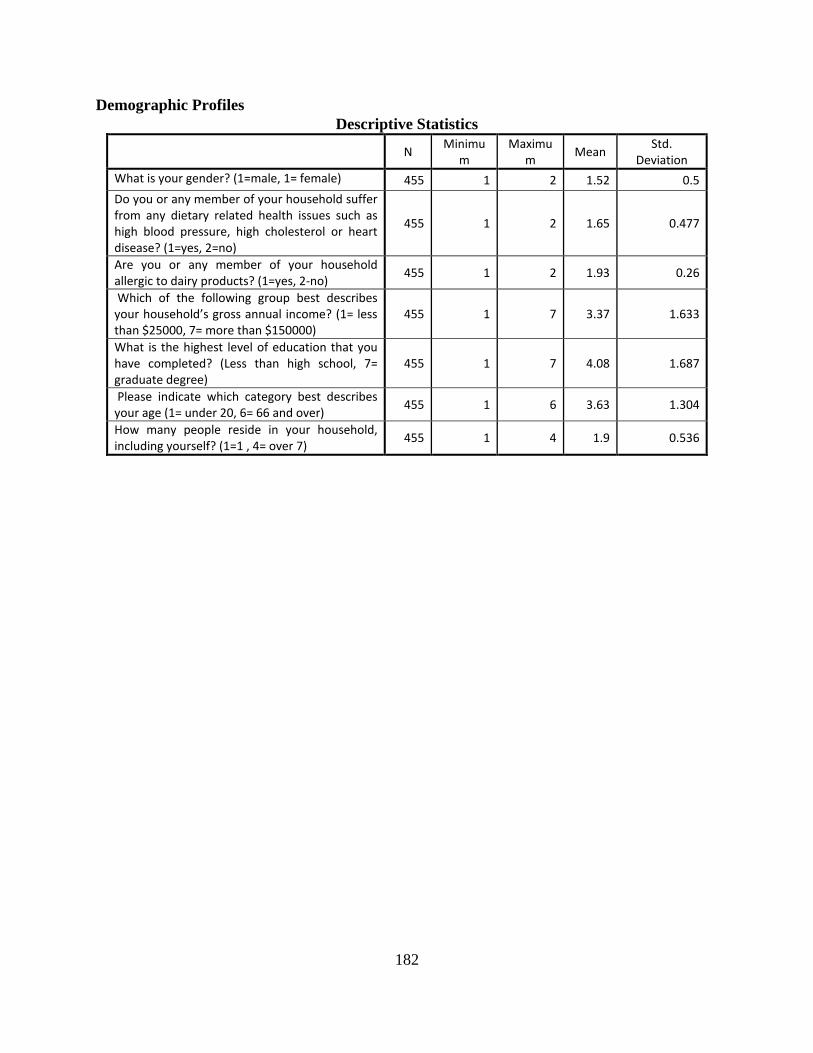
182
Demographic Profiles Descriptive Statistics
N Minimum
Maximum Mean Std.
Deviation What is your gender? (1=male, 1= female) 455 1 2 1.52 0.5 Do you or any member of your household suffer from any dietary related health issues such as high blood pressure, high cholesterol or heart disease? (1=yes, 2=no)
455 1 2 1.65 0.477
Are you or any member of your household allergic to dairy products? (1=yes, 2-no) 455 1 2 1.93 0.26
Which of the following group best describes your household’s gross annual income? (1= less than $25000, 7= more than $150000)
455 1 7 3.37 1.633
What is the highest level of education that you have completed? (Less than high school, 7= graduate degree)
455 1 7 4.08 1.687
Please indicate which category best describes your age (1= under 20, 6= 66 and over) 455 1 6 3.63 1.304
How many people reside in your household, including yourself? (1=1 , 4= over 7) 455 1 4 1.9 0.536
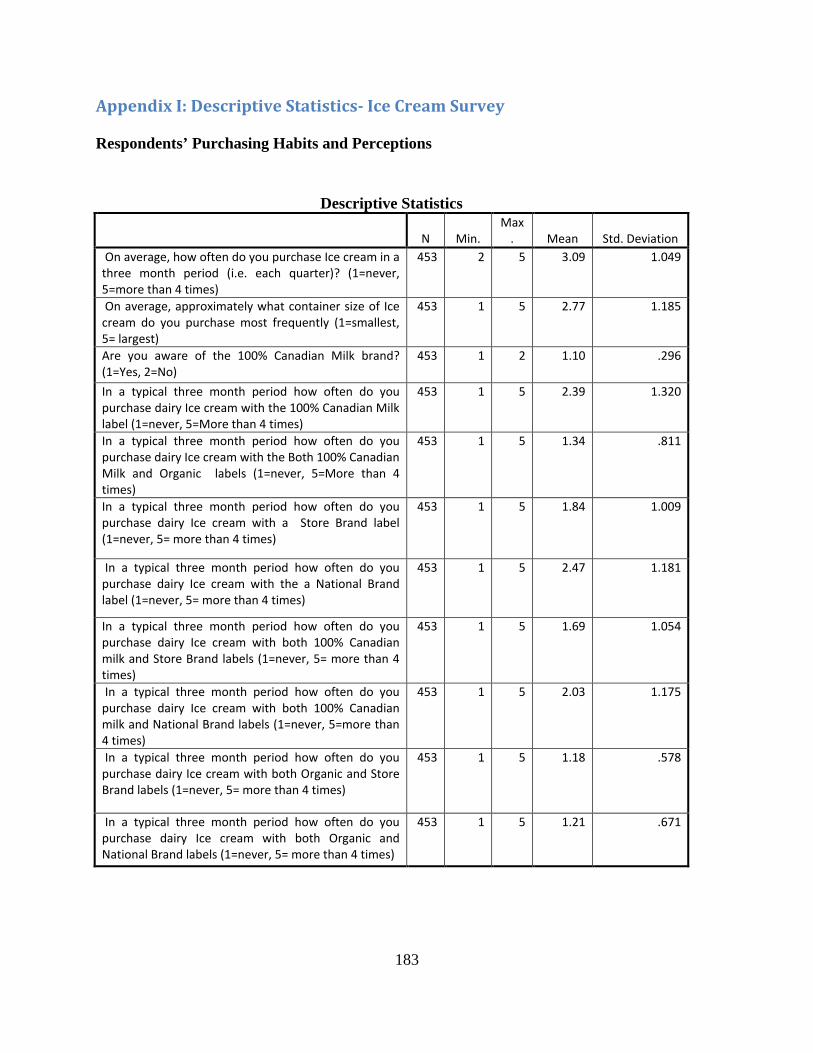
183
Appendix I: Descriptive Statistics- Ice Cream Survey
Respondents’ Purchasing Habits and Perceptions
Descriptive Statistics
N Min. Max
. Mean Std. Deviation On average, how often do you purchase Ice cream in a three month period (i.e. each quarter)? (1=never, 5=more than 4 times)
453 2 5 3.09 1.049
On average, approximately what container size of Ice cream do you purchase most frequently (1=smallest, 5= largest)
453 1 5 2.77 1.185
Are you aware of the 100% Canadian Milk brand? (1=Yes, 2=No)
453 1 2 1.10 .296
In a typical three month period how often do you purchase dairy Ice cream with the 100% Canadian Milk label (1=never, 5=More than 4 times)
453 1 5 2.39 1.320
In a typical three month period how often do you purchase dairy Ice cream with the Both 100% Canadian Milk and Organic labels (1=never, 5=More than 4 times)
453 1 5 1.34 .811
In a typical three month period how often do you purchase dairy Ice cream with a Store Brand label (1=never, 5= more than 4 times)
453 1 5 1.84 1.009
In a typical three month period how often do you purchase dairy Ice cream with the a National Brand label (1=never, 5= more than 4 times)
453 1 5 2.47 1.181
In a typical three month period how often do you purchase dairy Ice cream with both 100% Canadian milk and Store Brand labels (1=never, 5= more than 4 times)
453 1 5 1.69 1.054
In a typical three month period how often do you purchase dairy Ice cream with both 100% Canadian milk and National Brand labels (1=never, 5=more than 4 times)
453 1 5 2.03 1.175
In a typical three month period how often do you purchase dairy Ice cream with both Organic and Store Brand labels (1=never, 5= more than 4 times)
453 1 5 1.18 .578
In a typical three month period how often do you purchase dairy Ice cream with both Organic and National Brand labels (1=never, 5= more than 4 times)
453 1 5 1.21 .671
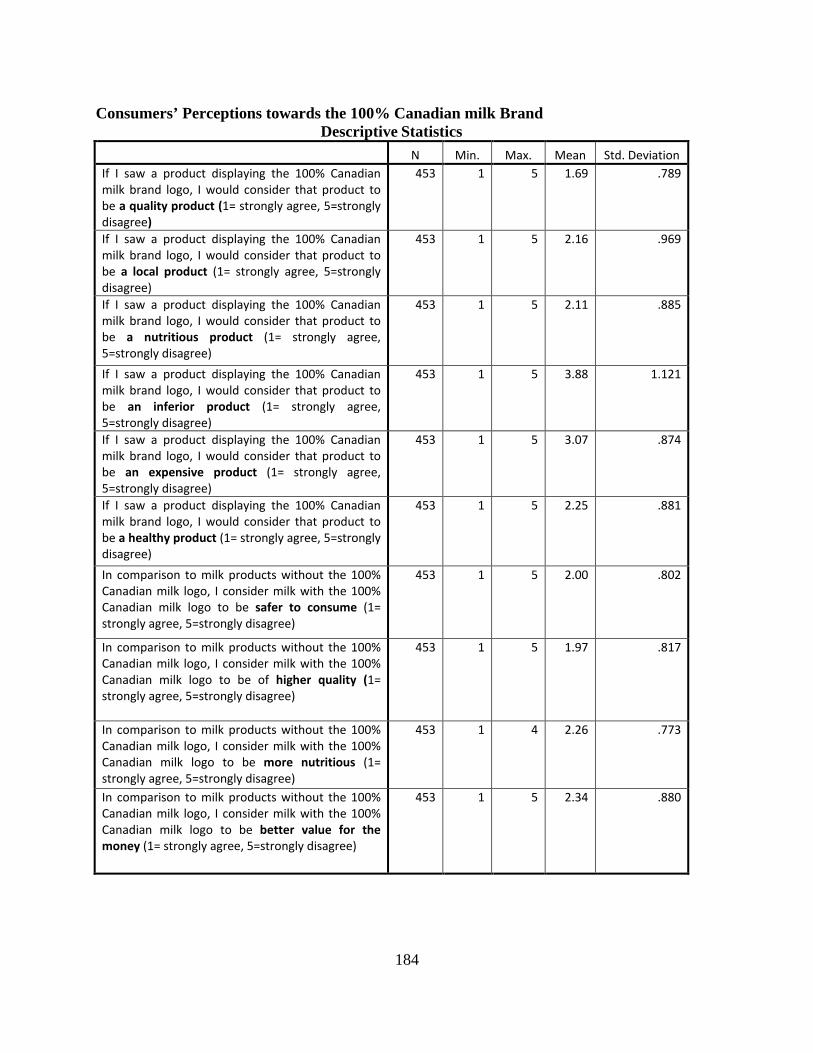
184
Consumers’ Perceptions towards the 100% Canadian milk Brand Descriptive Statistics
N Min. Max. Mean Std. Deviation If I saw a product displaying the 100% Canadian milk brand logo, I would consider that product to be a quality product (1= strongly agree, 5=strongly disagree)
453 1 5 1.69 .789
If I saw a product displaying the 100% Canadian milk brand logo, I would consider that product to be a local product (1= strongly agree, 5=strongly disagree)
453 1 5 2.16 .969
If I saw a product displaying the 100% Canadian milk brand logo, I would consider that product to be a nutritious product (1= strongly agree, 5=strongly disagree)
453 1 5 2.11 .885
If I saw a product displaying the 100% Canadian milk brand logo, I would consider that product to be an inferior product (1= strongly agree, 5=strongly disagree)
453 1 5 3.88 1.121
If I saw a product displaying the 100% Canadian milk brand logo, I would consider that product to be an expensive product (1= strongly agree, 5=strongly disagree)
453 1 5 3.07 .874
If I saw a product displaying the 100% Canadian milk brand logo, I would consider that product to be a healthy product (1= strongly agree, 5=strongly disagree)
453 1 5 2.25 .881
In comparison to milk products without the 100% Canadian milk logo, I consider milk with the 100% Canadian milk logo to be safer to consume (1= strongly agree, 5=strongly disagree)
453 1 5 2.00 .802
In comparison to milk products without the 100% Canadian milk logo, I consider milk with the 100% Canadian milk logo to be of higher quality (1= strongly agree, 5=strongly disagree)
453 1 5 1.97 .817
In comparison to milk products without the 100% Canadian milk logo, I consider milk with the 100% Canadian milk logo to be more nutritious (1= strongly agree, 5=strongly disagree)
453 1 4 2.26 .773
In comparison to milk products without the 100% Canadian milk logo, I consider milk with the 100% Canadian milk logo to be better value for the money (1= strongly agree, 5=strongly disagree)
453 1 5 2.34 .880

185
Respondents’ Risk Preference Descriptive Statistics
N Min. Max. Mean Std. Deviation I would consider myself to be more of a risk taker than the average person (1= strongly agree, 5=strongly disagree)
453 1 5 3.09 1.043
I only purchase brands that have been tried and proven (1= strongly agree, 5=strongly disagree)
453 1 5 2.43 .708
When purchasing a product that I use a lot, I tend to purchase the same brand each time (1= strongly agree, 5=strongly disagree)
453 1 5 2.11 .680
New products are more risky than products which have been in the market for a while (1= strongly agree, 5=strongly disagree)
453 1 5 2.88 .960
I don’t believe in making risky investments (1= strongly agree, 5=strongly disagree)
453 1 5 2.64 1.063
A little risk is good (1= strongly agree, 5=strongly disagree)
453 1 5 2.45 .841
Respondents’ Domestic Values
Descriptive Statistics N Min. Max. Mean Std. Deviation I think that buying a local product instead of a foreign product helps to support the local economy (1= strongly agree, 5=strongly disagree)
453 1 5 1.55 .750
I consider myself to be patriotic (1= strongly agree, 5=strongly disagree)
453 1 5 1.91 .878
I feel a sense of joy and pride whenever I see the maple leaf symbol known to be associated with Canada (1= strongly agree, 5=strongly disagree)
453 1 5 1.87 .891
I will ALWAYS buy a domestic product over a foreign product if the prices are within the same range (1= strongly agree, 5=strongly disagree)
453 1 5 1.97 .955
I am usually interested in trying out foreign products (1= strongly agree, 5=strongly disagree)
453 1 5 2.99 .891
We should buy from foreign countries only those products that we cannot obtain within our own country (1= strongly agree, 5=strongly disagree)
453 1 5 2.53 .920
It is not right to purchase foreign products, because it puts Canadians out of jobs (1= strongly agree, 5=strongly disagree)
453 1 5 2.82 1.026
I am usually not concerned about the origin of foods that I purchase (1= strongly agree, 5=strongly disagree)
453 1 5 3.31 1.073
Have you ever lived or worked on a farm? (1= yes, 5= no)
453 1 2 1.75 .432
On average how often do you shop at a farmers’ market per month? (1= never, 5= more than 4 times)
453 1 5 1.84 .902
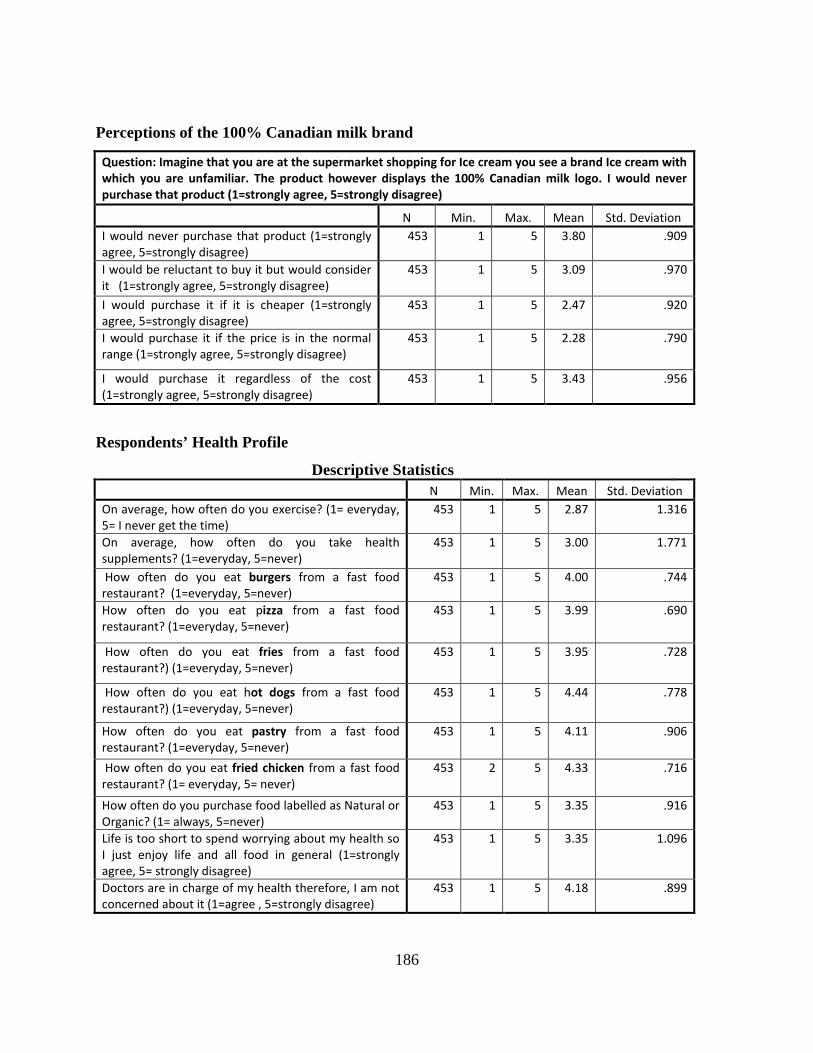
186
Perceptions of the 100% Canadian milk brand
Question: Imagine that you are at the supermarket shopping for Ice cream you see a brand Ice cream with which you are unfamiliar. The product however displays the 100% Canadian milk logo. I would never purchase that product (1=strongly agree, 5=strongly disagree)
N Min. Max. Mean Std. Deviation I would never purchase that product (1=strongly agree, 5=strongly disagree)
453 1 5 3.80 .909
I would be reluctant to buy it but would consider it (1=strongly agree, 5=strongly disagree)
453 1 5 3.09 .970
I would purchase it if it is cheaper (1=strongly agree, 5=strongly disagree)
453 1 5 2.47 .920
I would purchase it if the price is in the normal range (1=strongly agree, 5=strongly disagree)
453 1 5 2.28 .790
I would purchase it regardless of the cost (1=strongly agree, 5=strongly disagree)
453 1 5 3.43 .956
Respondents’ Health Profile
Descriptive Statistics N Min. Max. Mean Std. Deviation On average, how often do you exercise? (1= everyday, 5= I never get the time)
453 1 5 2.87 1.316
On average, how often do you take health supplements? (1=everyday, 5=never)
453 1 5 3.00 1.771
How often do you eat burgers from a fast food restaurant? (1=everyday, 5=never)
453 1 5 4.00 .744
How often do you eat pizza from a fast food restaurant? (1=everyday, 5=never)
453 1 5 3.99 .690
How often do you eat fries from a fast food restaurant?) (1=everyday, 5=never)
453 1 5 3.95 .728
How often do you eat hot dogs from a fast food restaurant?) (1=everyday, 5=never)
453 1 5 4.44 .778
How often do you eat pastry from a fast food restaurant? (1=everyday, 5=never)
453 1 5 4.11 .906
How often do you eat fried chicken from a fast food restaurant? (1= everyday, 5= never)
453 2 5 4.33 .716
How often do you purchase food labelled as Natural or Organic? (1= always, 5=never)
453 1 5 3.35 .916
Life is too short to spend worrying about my health so I just enjoy life and all food in general (1=strongly agree, 5= strongly disagree)
453 1 5 3.35 1.096
Doctors are in charge of my health therefore, I am not concerned about it (1=agree , 5=strongly disagree)
453 1 5 4.18 .899
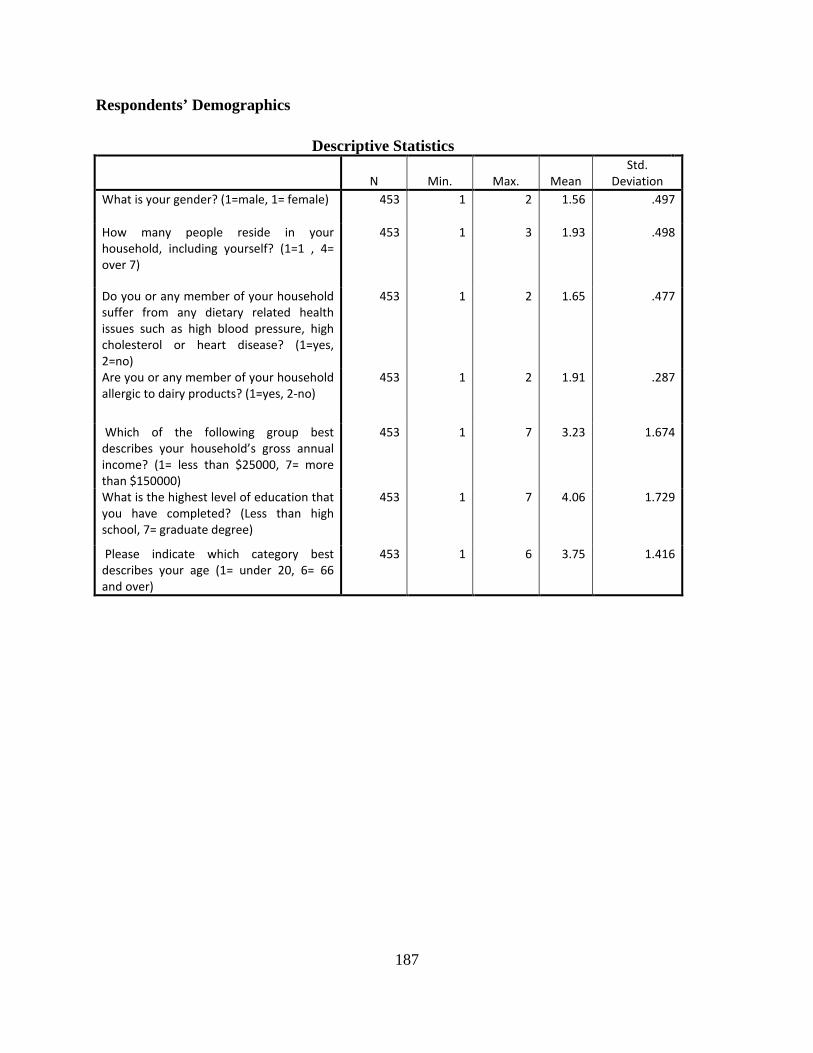
187
Respondents’ Demographics
Descriptive Statistics
N Min. Max. Mean Std.
Deviation What is your gender? (1=male, 1= female) 453 1 2 1.56 .497
How many people reside in your household, including yourself? (1=1 , 4= over 7)
453 1 3 1.93 .498
Do you or any member of your household suffer from any dietary related health issues such as high blood pressure, high cholesterol or heart disease? (1=yes, 2=no)
453 1 2 1.65 .477
Are you or any member of your household allergic to dairy products? (1=yes, 2-no)
453 1 2 1.91 .287
Which of the following group best describes your household’s gross annual income? (1= less than $25000, 7= more than $150000)
453 1 7 3.23 1.674
What is the highest level of education that you have completed? (Less than high school, 7= graduate degree)
453 1 7 4.06 1.729
Please indicate which category best describes your age (1= under 20, 6= 66 and over)
453 1 6 3.75 1.416

188
Appendix J: Industry Knowledge and Education
Variable Coefficient T-ratio WTP T-ratio
CAND .643*** 0.00 1.047*** 0.00
Org -.197*** 0.00 -.32*** 0.00
Nat .09*** 0.00 .146*** 0.00
EDUKNW37 .188** 0.04 .307** 0.04
PRICE -.615*** 0.00 - -
ASC1 -4.*** 0.00 - -
Psuedo R2 0.190
Log likelihood Function -3709.558
***,** and * represent significance at the 1%, 5% and 10%
level respectively
Appendix K: Testing for IIA
Under the null hypothesis (IIA holds), therefore if an alternative is omitted (estimating a
restricted model) the ratio of choosing an alternative over another does not change.
Under the alternative IIA does not hold, excluding an alternative affects the substitution patterns
Hausman’s specification test is distributed as with K degrees of freedom (the number of
independent variables)
37 Interaction between education and knowledge
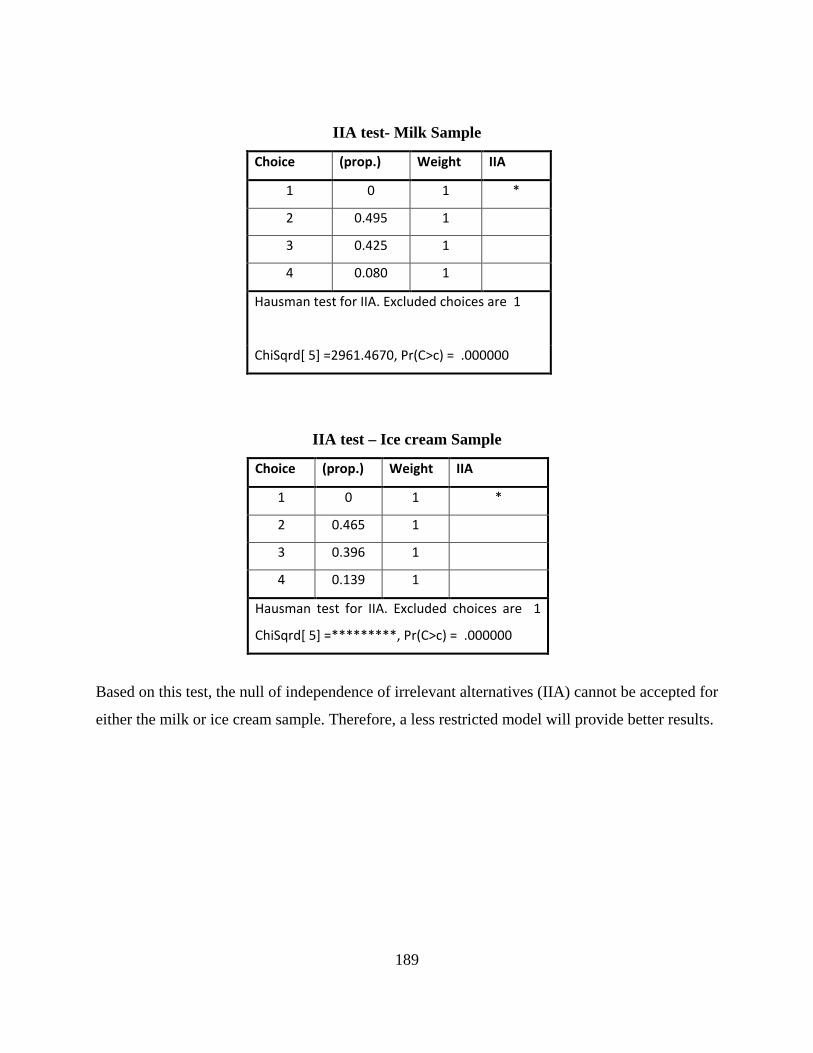
189
IIA test- Milk Sample
Choice (prop.) Weight IIA
1 0 1 *
2 0.495 1
3 0.425 1
4 0.080 1
Hausman test for IIA. Excluded choices are 1
ChiSqrd[ 5] =2961.4670, Pr(C>c) = .000000
IIA test – Ice cream Sample
Choice (prop.) Weight IIA
1 0 1 *
2 0.465 1
3 0.396 1
4 0.139 1
Hausman test for IIA. Excluded choices are 1
ChiSqrd[ 5] =*********, Pr(C>c) = .000000
Based on this test, the null of independence of irrelevant alternatives (IIA) cannot be accepted for
either the milk or ice cream sample. Therefore, a less restricted model will provide better results.