Gender Pay Review - NCPE
327
pp Gender Pay Review Research report for: National Commission for the Promotion of Equality September 2006 This document contains 327 pages
-
Upload
khangminh22 -
Category
Documents
-
view
2 -
download
0
Transcript of Gender Pay Review - NCPE

pp
Gender Pay Review
Research report for:
National Commission for the Promotion of Equality
September 2006
This document contains 327 pages

Gender Pay Review
National Commission for the Promotion of Equality
Malta September 2006 page 2 of 327
Executive Summary
From the time women entered the labour force, they generally received lower earnings than
men. Gender pay inequalities seem to be both universal as well as resistant to social, cultural
and economic changes. They persist despite the changes such as:
� the increase in women’s participation in the labour market
� the various legislative measures taken to protect women from occupational discrimination
� the higher educational levels achieved by women, and
� the various efforts to encourage and implement gender mainstreaming and to foster a culture of
gender parity.
The gender pay gap measures the difference in the average gross hourly earnings between
men and women (aged 15-64 who work at least 15 hours a week), across the whole economy
and all establishments (Commission of the European Communities, 2003). Differences in
earnings between men and women may arise from difference in the:
� composition of the male and female workforce – composition effect;
� remuneration of men and women with similar characteristics – remuneration effect; and
� labour market participation behaviour of men and women – selection effect.
C o n t e x t
Historically women contributed to the economy in roles that were beyond those of wives and
mothers but different in many ways from that of men. In pre-industrial times, all family
members (including women and their children) gave their share within the family unit of
production either within the home or close to it. Maltese women performed a wide range of
work activities that contributed significantly both to the household and to the economy. Despite
their hard work however, their earnings were lower than those of men although they were
necessary for a family’s upkeep.
In the early industrial-period, young unmarried women (and children) were employed in the
cotton and textile mills. Participation of women in the labour market was also remarkably low
compared to that of men. Women’s activities concentrated in a small number of fields,
exemplified by manufacturing (textiles, clothing and tobacco) and services (especially domestic

Gender Pay Review
National Commission for the Promotion of Equality
Malta September 2006 page 3 of 327
services, education, nursing and clerical). Until World War II women’s employment trends did
not change much, with war calling on women to undertake previously male jobs to make up for
the loss of manpower during war times. Since the 19th century, international data show an
upward trend in women’s earnings compared to men’s, with earnings among women in the
1980s equating to well over 70% of men’s income. These ratios are considered fairly stable,
changing only slightly until the present day.
In Malta, trends parallel the above account. After the war and up to the beginning of
industrialisation the participation of women in the labour market in Malta remained at a
remarkably low proportion averaging 17-20% of the working population. The expansion of the
industrial sector in the 1970’s (especially in the textiles and clothing sectors) attracted many
women to the labour market. During the 1960’s and 70’s, the hourly wage rate of female
workers was significantly lower than that of males, although in real terms, women’s hourly pay
rates increased by 9.9% annually between 1966 and 1975 (contrasting against the 6.5%
registered among men’s hourly pay rates for the same period). By 1975, women’s earnings had
increased to around 71% of male earnings.
In female-dominated industries, annual earnings of workers were lower than those paid in
male-dominated sectors. This feature prevailed despite that women’s employment was an
important source of foreign exchange earnings considering that the majority of Malta’s exported
manufactured products came form female-dominated industries.
Women were paid less than men not because they were less productive: less pay was justified
by two assumptions:
� that women did not need to earn as much as men since they were not the breadwinners, and
� an assumed potential threat to the traditional gender roles and balance of power within the family
if women earned as much as men.
C r o s s B o r d e r R e a l i t y
Unequal pay for men and women appears to be a universal phenomenon, at least in the
economically advanced countries. Nevertheless, pay gaps narrowed in all countries since the
1960’s, although increase in women’s earnings did not occur at the same time. The 1995
European Structure of Earnings Study (ESES) established that women in the EU earned around
three-fourths of what men earned. The widest gap at the time featured in the Netherlands and
Gender Pay Review
National Commission for the Promotion of Equality
Malta September 2006 page 4 of 327
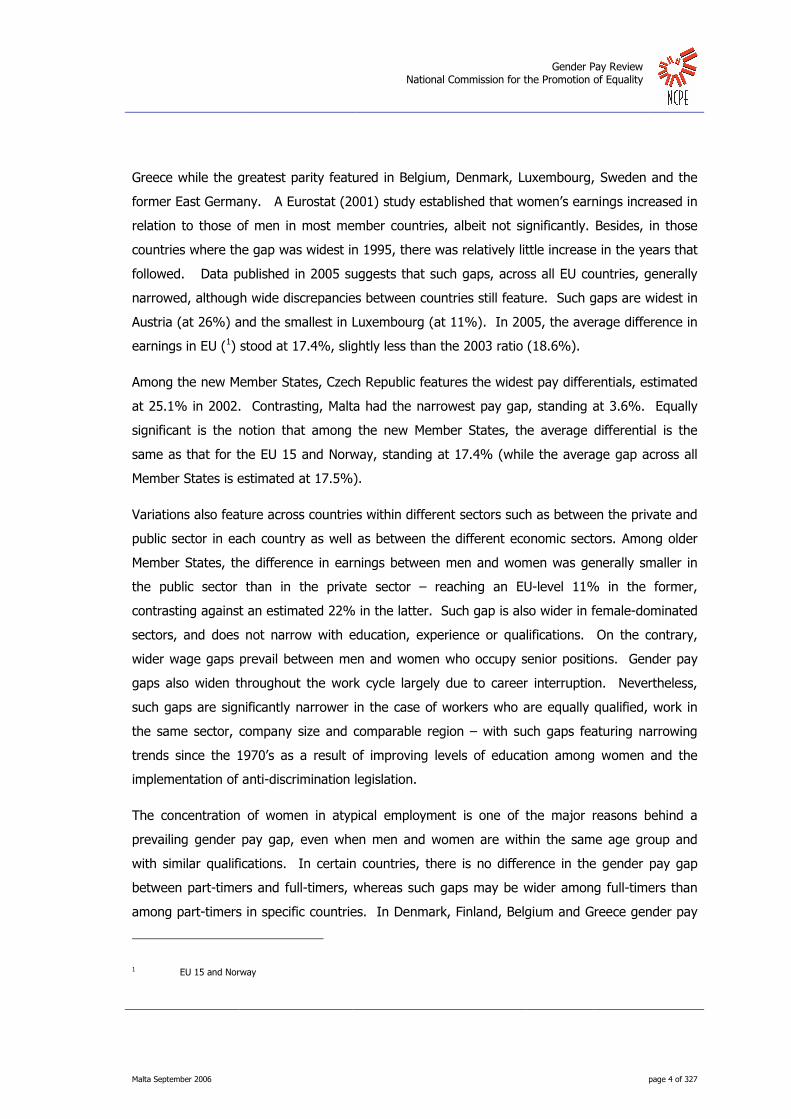
Greece while the greatest parity featured in Belgium, Denmark, Luxembourg, Sweden and the
former East Germany. A Eurostat (2001) study established that women’s earnings increased in
relation to those of men in most member countries, albeit not significantly. Besides, in those
countries where the gap was widest in 1995, there was relatively little increase in the years that
followed. Data published in 2005 suggests that such gaps, across all EU countries, generally
narrowed, although wide discrepancies between countries still feature. Such gaps are widest in
Austria (at 26%) and the smallest in Luxembourg (at 11%). In 2005, the average difference in
earnings in EU (1) stood at 17.4%, slightly less than the 2003 ratio (18.6%).
Among the new Member States, Czech Republic features the widest pay differentials, estimated
at 25.1% in 2002. Contrasting, Malta had the narrowest pay gap, standing at 3.6%. Equally
significant is the notion that among the new Member States, the average differential is the
same as that for the EU 15 and Norway, standing at 17.4% (while the average gap across all
Member States is estimated at 17.5%).
Variations also feature across countries within different sectors such as between the private and
public sector in each country as well as between the different economic sectors. Among older
Member States, the difference in earnings between men and women was generally smaller in
the public sector than in the private sector – reaching an EU-level 11% in the former,
contrasting against an estimated 22% in the latter. Such gap is also wider in female-dominated
sectors, and does not narrow with education, experience or qualifications. On the contrary,
wider wage gaps prevail between men and women who occupy senior positions. Gender pay
gaps also widen throughout the work cycle largely due to career interruption. Nevertheless,
such gaps are significantly narrower in the case of workers who are equally qualified, work in
the same sector, company size and comparable region – with such gaps featuring narrowing
trends since the 1970’s as a result of improving levels of education among women and the
implementation of anti-discrimination legislation.
The concentration of women in atypical employment is one of the major reasons behind a
prevailing gender pay gap, even when men and women are within the same age group and
with similar qualifications. In certain countries, there is no difference in the gender pay gap
between part-timers and full-timers, whereas such gaps may be wider among full-timers than
among part-timers in specific countries. In Denmark, Finland, Belgium and Greece gender pay
1 EU 15 and Norway

Gender Pay Review
National Commission for the Promotion of Equality
Malta September 2006 page 5 of 327
inequalities among part-timers is relatively small suggesting that if most men had to work part-
time, there would only be an insignificant gender pay gap. Nevertheless, comparisons related
to the hourly earnings of women in part-time work and men in full-time jobs provide a clearer
indication of the impact of part-time work on women’s earnings.
Although most countries collate pay statistics regularly, certain difficulties challenge
international comparisons owing to variations in statistical sources and the methodologies
involved in compilation and computation. In different countries, calculations are based on
hourly, weekly, monthly or annual earnings, although most countries calculate hourly wages.
For a number of reasons, the earnings ratio calculated on a weekly or annual basis is higher
than when hourly earnings are taken into consideration. Equally significant is the notion that
certain countries take into consideration only full-time employees, thereby skewing observations
as part-time workers (typically women and associated with lesser-paid jobs) are excluded. This
leads to an underestimation (or possibly the reverse) of the gender pay gap, possibly by as
much as 1% to 3% in most countries.
In addition, countries may differ in how they define wages, with allowances and other benefits
not accounted for uniformly across different countries. Equally significant is the notion that a
number of countries do not have data related to the differences in earnings between men and
women for the whole economy, whilst variations in the way tax and benefit systems operate in
different countries prevail. These aspects allow for only general comparisons to be made
across countries, albeit such provides a fairly representative picture of the existing pay gaps
across nations.
T h e M a l t e s e C o n t e x t
For a number of years gender equality in the labour market featured priorities on the agenda of
social policy makers in Malta, resulting in the implementation of a number of positive steps
intended to strengthen women’s social and economic condition, such as:
� the elimination of the marriage bar which prohibited married women to continue working upon
marriage;
� the introduction of parental leave for government employees;
� the possibility of working flexible hours in a limited number of work places;
� the commitment of the Employment and Training Corporation to encourage and promote gender
mainstreaming;

Gender Pay Review
National Commission for the Promotion of Equality
Malta September 2006 page 6 of 327
� the establishment of the National Commission for the Promotion of Equality for Men and Women
(NCPE)
� a series of legislative measures largely driven by Malta’s obligation as an aspiring EU member to
bring its legislation in accordance with the EU’s acquis communnautaire.
Difference in earnings among men and women witnessed an improvement over the past five
years, wherein wage gaps declined from 11.1% in 2000 to 4.6% in 2005. This decline also
features general improvement in the earnings gap between men and women engaged in the
private sector, falling from 14.2% in 2000 to 6.9% in 2005. The same earnings gap dropped
from 2.6% in 2000 to an almost negligible situation in 2005 among men and women engaged
with the public sector. Remarkable improvements also feature in respect to the gender pay gap
across different economic activities: the gender pay gap dropped from 19.8% in 2000 to
10.1% in 2005 among workers in manufacturing enterprises, while the gender pay gap among
counterpart workers in the services sector dropped from 9.4% in 2000 to 6.1% in 2005. These
figures, however, do not provide a detailed picture of trends among occupations of equal worth
and equal value – and account for an aggregate of trends that tend to conceal important
developments pertaining to narrower worker groups, such as the influences arising from career
breaks, experience and educational attainment. Paralleling European findings, the largest
observed gaps in Malta relate to the better-paid occupations, with a remarkable deterioration in
the gender-pay-gap observable among men and women in senior roles/occupations between
2000 and 2005. This observation is a stark contrast against that related to men and women in
plant / machinery operator roles, wherein the largest drop in the gender pay gap over the same
years was registered.
P a y E q u a l i t y L e g i s l a t i o n
Legislation against pay discrimination on the basis of sex features in a number of countries,
with some enshrining such principles in their respective constitution. In various countries, law
provides for pay equality for work of equal value. In a few countries, most notably France and
Sweden, legislation of a ‘proactive’ type was enacted, obliging employers to provide evidence of
their efforts to implement the concept of equality at their place of work.
In many countries, law provides a right for victims of discrimination (which still exists despite
the legislation) to take their employer to court although the way it is done varies from one
country to another.

Gender Pay Review
National Commission for the Promotion of Equality
Malta September 2006 page 7 of 327
Malta is signatory to various ILO Conventions, including Convention No. 100 (1951) that obliges
equal remuneration (ratified in 1988) and Convention No. 111 (1958, ratified in 1968)
concerning equality of employment opportunity and conditions of work regardless of gender. In
1976 the principle of equal pay for equal work became universally relevant to all workers and
differentiated wage scales for men and women were abolished (Article 14 of the Constitution).
More recently, Malta’s Constitution was amended (in 1991) to include the prohibition of any
form of discrimination on the basis of sex, this in line with the ratification of the UN Convention
on the Elimination of all Forms of Discrimination Against Women. In 2003, Malta enacted the
Equality for Men and Women Act, while the enactment of the Employment and Industrial
Relations Act (at the end of 2002) further set provisions for equal remuneration not only for
equal work but also for work of equal value.
F a c t o r s i n G e n d e r P a y D i f f e r e n t i a l s
Despite gender equality and equal pay legislation, gender pay disparities persist, this largely as
a result of the multi-faceted nature of the gender pay gap, which is attributed to a variety of
factors both inside and outside the labour market, exemplified by:
� women’s lower investment in human capital;
� women’s concentration in certain occupations and economic sectors;
� women’s over-representation in lower paid professions;
� traditional gender stereotypes;
� motherhood and career interruption;
� women’s concentration in part-time employment;
� occupational discrimination.
About three-quarters of the current wage differential between women and men can be
explained by variations in their labour market participation in terms of age and
experience/length of service. Gaps in earnings between women and men of the same age, with
the same education and level of qualifications are largely explained by women availing
maternity and childcare leave, working fewer hours and having lower individual bargaining
power. Contrastingly, men are more likely to have an uninterrupted career with their pay either
unaffected or increased. Often women return to a job with lower status and pay after childbirth
and child rearing – considered as a factor that equates to about 7% ‘penalty’ per child.

Gender Pay Review
National Commission for the Promotion of Equality
Malta September 2006 page 8 of 327
Due to their particular circumstances, women tend to opt for jobs that enable them to combine
their occupational and domestic duties effectively – leading to a relative concentration of
women in jobs that require shallower levels of overtime (if any). Equally significant is the
notion that women tend to feel compelled to pass opportunities linked to extra income.
Women are also more likely to engage in part-time work basis and remain in such for longer
periods compared to men – a significant observation particularly relevant in the case of
organisational cultures that feature long working hours as an integral part of regular work. In
addition, part-time work also tends to offer lower pay largely due to labour market
discrimination rather than to lower levels of human capital among part-time workers. Women
also tend to lose salary and status opportunities by tending to opt and accept flexible work
conditions that are typically tied with lesser-paid jobs/roles. Although flexible/part-time work
assists in reducing the gender pay gap by allowing women to combine work with caring
responsibilities more effectively, this seems not to be the end result. Contrarily, flexible and
part-time work are considered as a way of avoiding more basic changes in traditional gender
roles as they enable women to enter the labour market while still maintaining their
responsibility for unpaid caring work. These trends bear consequences on the entire life’s
propensity of women in work.
Occupational segregation, both horizontal and vertical (Hakim, 1979) also affects women’s
wages by limiting them to lower-paid jobs and by excluding them from certain occupations.
Despite its gradual decline since the 1970’s, occupational segregation remains a significant
reality in various developed economies as women tend to remain concentrated in certain
occupational sectors performing particular jobs (horizontal segregation) that tend to offer lower
financial rewards than those dominated by men. Women, characteristically, are also under-
represented in higher status and more financially rewarding jobs (vertical segregation) even
within female-dominated fields.
The persistence of occupational segregation and consequent gender pay inequalities may be
the result of a number of factors, exemplified by:
� men and women occupying similar posts but employed by different companies with different
human resource strategies (e.g. fine restaurants tend to employ waiters who are well paid while
casual diners are more likely to employ lesser paid waitresses);
� men and women occupying similar posts within different industries e.g. women are more likely to
work in the textiles sector where pay is low, while men are more likely to work in the petroleum
industry which pays higher wages, and

Gender Pay Review
National Commission for the Promotion of Equality
Malta September 2006 page 9 of 327
� men and women appearing to have similar jobs but not having the same degree of authority and
responsibilities.
Within occupations, enterprises or sectors, gendered differences in pay structures exist, even
though these may feature a level of subtlety. These give rise to gender pay inequalities, largely
as a result from:
� earnings beyond the basic pay stipulated in the pay scheme such as through overtime, seniority or
merit. Such systems often tend to disguise the real differences in earnings. It is these ‘additional
payments’ that very often lead to pay differentials between men and women;
� the size and ranking of pay differentials across sectors, industries and occupations (the wider the
pay dispersion, the wider the gender pay gap);
� the nature of wage-fixing systems – centralised wage-fixing systems are known to lead to narrower
gender pay inequalities while fragmented systems provide more opportunity for gender bias to
occur, and
� the system used to grade and evaluate jobs.
A gendered evaluation of jobs is often a significant factor leading to the under-evaluation of
women’s jobs, particularly when occupations tend to be gender oriented. The gendering of
jobs is typically the result of latent behaviour beyond the domain of law, with employers
associating occupations with sex stereotypes in all stages of job design and development – from
internal job characteristics to pay levels and associated rewards. Employers’ devaluation of
women’s work depends on the conscious and unconscious sex stereotypes that both employees
and employers take with them to the workplace – relating to a set of attributes and
characteristics that ‘gender’ the job. Traits typically attributed to female workers include
dexterity, care and the ability to handle emotional situations – all of which are typically assigned
a lower value than those characteristics normally attributed to men. Such features are also
reflected in wage systems that traditionally tend to measure only the physical and mental
aspects of work, excluding considerations related to factors such as caring or working with
people.
Gendered beliefs about men’s greater competence (and status) unconsciously shape the
expectations that participants themselves have of their own competence and performance (self-

Gender Pay Review
National Commission for the Promotion of Equality
Malta September 2006 page 10 of 327
fulfilling prophecy. (2) Gender pay differentials, in turn, may partly be attributed to the
differences in the pay expectations of men and women. Indeed, women’s expected earnings
are typically significantly lower than those of men both at starting point and at career peak,
although the differences at career peak are greater. Such expectations are shaped by various
influences among women, including the perceived salary earned by others in the same job,
women’s awareness of gender pay differentials, women’s recognition that they will be
‘penalized’ for interrupting their career (family development) as well as for having jobs that are
more family friendly.
Equally significant is the notion that women’s lower estimation of their work may be a result of
women’s own attitude towards negotiation and bargaining. Unlike women, men tend to
negotiate better deals than they are originally offered, even at the start of a career. Some
analysts attribute this observation to socialisation: women perceive to be seen as ‘bitchy’ or
pushy if they negotiate on the conditions for a job they wish to occupy.
Women come to the labour market with different tastes, expectations, qualifications and
experience. They are also less likely to invest in training, job search and formal education.
These factors put a justification for a pay differential when women feature a lower level of
formal education, lower qualifications, less work experience and seniority. This set of influences
only explains part of the pay gap – a direct consequence of women’s constrained freedom in
making choices due to social and cultural expectations imposed on them. Such influences,
thus, limit the choice in the development of human capital in a country like Malta, where culture
and society retain a significant influence on the role of women.
While women’s lesser experience, their career interruptions and job tenure have a significant
impact on pay differentials, it is more difficult to explain the gap by gender disparity in
qualifications since women who are as equally qualified as men, still earn less than their male
counterparts.
2 Expectation states theory

Gender Pay Review
National Commission for the Promotion of Equality
Malta September 2006 page 11 of 327
J o b E v a l u a t i o n S y s t e m s
Both trade unions and labour market/gender equality authorities regard such systems as
effective tools in combating gender pay discrimination. Nevertheless, problems associated with
the introduction and implementation of such schemes prevail, exemplified by:
� the time consumption and cost involved in operating such systems;
� the significant training required for persons operating such evaluations to ensure a true
understanding of pay discrimination and a conviction that it needs to be abolished.
� the extent to which it is possible, in practical terms, to compare jobs that fall in different bargaining
areas such as blue- and white-collar occupations;
� methodologies involved in the comparison of very different jobs using common and objective
criteria;
the market value presented by such systems within a perspective wherein men and women are
not equally represented in the public and private sectors of the economy.
E f f e c t i v e P r o t e c t i o n ?
Many are the countries where law permits victims of pay discrimination to seek justice, although
such cases are typically seldom. Nevertheless, situations where women succeeded in
demonstrating that their jobs were evaluated differently from men’s jobs are known. Such,
however, is not the case in Malta, where a review of the decisions taken by the Industrial
Tribunal in Malta between 2003 and 2005 indicates that none of the cases related to gender
pay discrimination. The observations do not imply that all women in Malta are receiving equal
pay for equal work. Court cases may be uncommon for a number of reasons, such as:
� a difficulty to prove discrimination,
� the duration of court proceedings,
� fear of losing one’s job, and
� the fact that in almost all cases, the Industrial Tribunal is chaired and operated by men.
Divergent interpretations prevail in respect to what constitutes discrimination. Discrimination
may be defined as differential treatment that cannot be justified by objective factors such as
level of education, work experience, type of occupation and economic sector. From a different
standpoint, women receive lower wages than men not because they are less productive or less

Gender Pay Review
National Commission for the Promotion of Equality
Malta September 2006 page 12 of 327
skilled but because they are women. Workplaces that are female-dominated offer lower
financial rewards as women make up most of the workforce (supply-demand relationships).
Thus, women remain underrepresented in posts that carry more responsibility and higher pay
not because of some inherent limitation on their part but because of barriers and limitations
imposed by men. This approach also considers the concentration of women in temporary and
part-time employment as a reflection of discriminatory practices.
Despite the protective legislation that is in place, evidence suggests that occupational
discrimination is rife. Indeed, the direct effects of labour market discrimination may explain
more than half the pay gap. Nevertheless, as women’s preferences also play a role in different
occupational choices, the demarcation between choice and discrimination presents a significant
challenge. Yet, evidence points towards a series of institutional barriers that exclude women
from certain positions or that hinder women from being promoted or from receiving training
solely on the basis of gender.
A number of models attempt to elucidate gender disparities in pay as a consequence of
discrimination and why they persist. Nevertheless, empirical research did not determine which
model is closest to labour market realities, although such models are not mutually exclusive.
Models of discrimination try to explain that part of the pay gap that cannot be explained by
gender differences in human capital.
One such model relates to an employer’s ‘taste’ for discrimination (Becker, 1973) wherein male
employers would not hire women to perform certain tasks that are not deemed appropriate for
the ‘weaker’ gender. In addition, male workers may agree to work with women in subordinate
positions but not in similar or superior ones. Such ‘tastes’ also influence behaviour in social
contexts – men may find no problem in buying clothes from a female sales assistant, but may
think twice before buying a car from a woman or hiring a woman as an attorney. The latter
constitutes an additional implication on employers who may not be sexist themselves – but
merely driven by organisational growth and profitability. In such a context, employers
discriminate against women in order to accommodate the tastes of male employees and
targeted customers. Thus, such employers tend to offer lower status and lesser-paid jobs to
women, who, in turn, present a potential (perceived) threat to male employees and undesirable
in providing services to targeted customers.
An additional model (Phelps, 1972) asserts that employers may decide not to employ, promote
or train women on the information that the average woman is less productive and scores less in

Gender Pay Review
National Commission for the Promotion of Equality
Malta September 2006 page 13 of 327
job stability. As a result, individual women may suffer discrimination even if they do not fit the
stereotypical average. Such discrimination often leads to a self-fulfilling prophecy as any
woman who is not provided with the same opportunities as men typically opts to leave her job
for a better opportunity, thus confirming the employer’s set of perceptions about female labour.
F i g h t i n g D i s c r i m i n a t i o n
One significant aspect about discrimination is that discrimination is very often subtle, possibly
unconscious at times. As a result, discriminatory practices are difficult to document and
possibly remove. Women may be denied equality of treatment due to existing gender
stereotypes that are often also embraced by women themselves. One main obstacle remains
the lack of recognition or the refusal to acknowledge such discrimination not only by employers
but also by trade unions. The latter are typically reassured that the law, together with
collective agreements, provide enough protection against gender inequality or discrimination.
Gender Pay Gap in effect, is not the result of sex discrimination but stems from the objective
realities of men and women in the labour market (differences in human capital and labour
market participation). Occupational differences of men and women in the labour market in the
course of their career present an insurmountable issue that effective bargaining cannot
effectively address.
N a t i o n a l S t r a t e g i e s : A n s w e r i n g G e n d e r P a y G a p s
Despite the optimistic impression projected by the EU’s employment strategies and guidelines
imposed among Member States, the National Action Plans (NAPs) of many Member States do
not feature gender pay equity as a central aspect.
Malta’s first NAP recognises the gap that persists among women’s and men’s earnings,
acknowledging its relatively minor level of 10% - or some six percentage points below the
EU 15 average. The same NAP recognises the persistence of both horizontal and vertical
occupational segregation. Nevertheless, Malta’s NAP considers the low rates in women’s
employment and self-employment as more pressing issues. Indeed, Government’s response to
the present labour market situation reflects such concern with the wider picture of gender
discrepancies in the labour market.

Gender Pay Review
National Commission for the Promotion of Equality
Malta September 2006 page 14 of 327
In consequence, there are no specific measures that directly address the gender pay gap within
Malta’s NAP, which assumes that women will ‘automatically’ receive equal earnings once they
have greater access to all areas of the labour market.
For this to happen, a number of challenges need to be overcome:
� Cultural expectations – traditional gender roles and the breadwinner ethic;
� Support structures for ALL mothers (not only those of small children), and.
� Women in the private sector – issues related to parental leave, flexible or reduced hours of work.
Addressing gender pay gaps presents no single or straightforward solution. While the biggest
challenges remain those of attracting more women to full-time employment, rendering gender
neutral atypical work and the reduction of positional inequalities between women and men
during their work life. It is acknowledged that legislation remains effective and important but
not sufficient, as are initiatives that tackle occupational discrimination.
Factors outside the domain of the labour market play a significant role in determining pay
disparities, exemplified by traditional notions about women’s roles that conduce to family/work
conflict. These call for urgent and effective action in being addressed seriously, particularly if a
nation intends to attain sustainable gender pay parity. In addition, it is crucial for initiatives to
be implemented in promoting objective appraisal of jobs, requiring independence from sex
stereotyping that effectively undervalues the tasks performed by women.
In this respect, social partners need to undertake a collective effort in developing an effective
solution to this persistent social injustice. Co-operation in many European countries was weak
and largely futile, indicating that co-operation should extend beyond collective bargaining and
involve joint participation in:
� dealing directly rather than through other policy initiative with matters of pay;
� job evaluation design and application;
� developing national wage and equal pay policies
� analysing centralised versus decentralised bargaining.
� reducing any negative effects in cases of decentralisation, and
� ensuring a more equal balance between men and women at the negotiating table.

Gender Pay Review
National Commission for the Promotion of Equality
Malta September 2006 page 15 of 327
In combating gender pay differential, ILO Committee of Experts acknowledges the need for
more detailed information, in order to establish the extent and nature of gender pay
differentials as a starting point. Such detailed information should relate to women’s
� economic activity
� hours of work
� educational level
� qualifications
� seniority levels
This recommendation translates in a need to compile statistical data of a high quality and that
offers a wide coverage of pay data by:
� ensuring that statistical data cover all industrial sectors and occupational groups (such as part-
timers and other peripheral occupational groups);
� gathering detailed information on occupations that enables full comparisons between what women
and men do;
� providing information on supplementary earnings such as bonuses, fringe benefits and overtime
pay, which might widen the gap if they are more common among men than among women.
R e s e a r c h & F i n d i n g s
In order to address the key issues identified above, a total of 608 computer assisted personal
interviews (CAPI) with randomly selected persons in gainful employment and resident in Malta
and Gozo were conducted during the months of June and July 2006. Complementing this work
was a set of 20 qualitative interviews undertaken with selected (quantitative) interviewees in
order to expound further specific aspects related to the subject under study.
Of the total quantitative interviews and associated records, 21 were invalidated for different
reasons. The findings presented herein relate to the remaining 587 quantitative interview
records and the accompanying 20 qualitative in-depth discussions.
The sample comprised a total of 239 women (40.7%) and 348 (59.3%) men, featuring a mean
age of 33.7 years. Almost 22% of the respondents were engaged with Governmental
institutions while employment with the private sector accounted for 65% of the survey
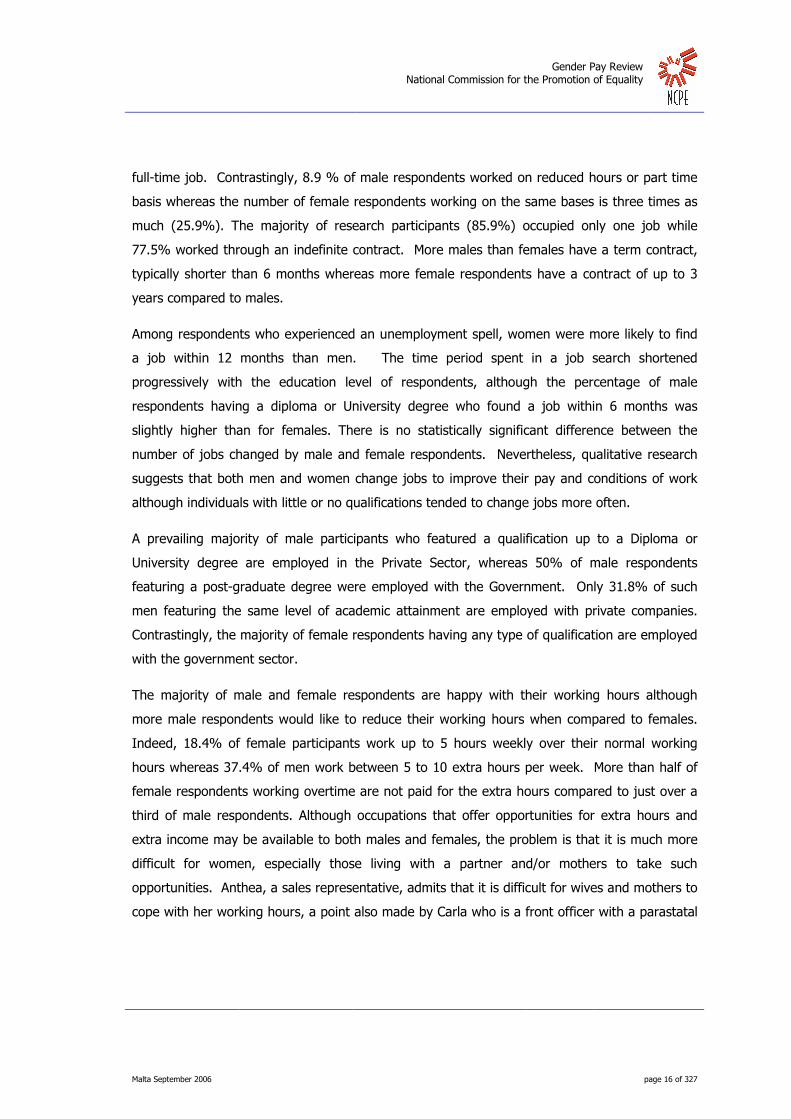
participants. The majority of participants (84.2%) were engaged in a full-time job - 91% of
male respondents work on a full time basis whereas 74.1% of female respondents occupied a
Gender Pay Review
National Commission for the Promotion of Equality
Malta September 2006 page 16 of 327
full-time job. Contrastingly, 8.9 % of male respondents worked on reduced hours or part time
basis whereas the number of female respondents working on the same bases is three times as
much (25.9%). The majority of research participants (85.9%) occupied only one job while
77.5% worked through an indefinite contract. More males than females have a term contract,
typically shorter than 6 months whereas more female respondents have a contract of up to 3
years compared to males.
Among respondents who experienced an unemployment spell, women were more likely to find
a job within 12 months than men. The time period spent in a job search shortened
progressively with the education level of respondents, although the percentage of male
respondents having a diploma or University degree who found a job within 6 months was
slightly higher than for females. There is no statistically significant difference between the
number of jobs changed by male and female respondents. Nevertheless, qualitative research
suggests that both men and women change jobs to improve their pay and conditions of work
although individuals with little or no qualifications tended to change jobs more often.
A prevailing majority of male participants who featured a qualification up to a Diploma or
University degree are employed in the Private Sector, whereas 50% of male respondents
featuring a post-graduate degree were employed with the Government. Only 31.8% of such
men featuring the same level of academic attainment are employed with private companies.
Contrastingly, the majority of female respondents having any type of qualification are employed
with the government sector.
The majority of male and female respondents are happy with their working hours although
more male respondents would like to reduce their working hours when compared to females.
Indeed, 18.4% of female participants work up to 5 hours weekly over their normal working
hours whereas 37.4% of men work between 5 to 10 extra hours per week. More than half of
female respondents working overtime are not paid for the extra hours compared to just over a
third of male respondents. Although occupations that offer opportunities for extra hours and
extra income may be available to both males and females, the problem is that it is much more
difficult for women, especially those living with a partner and/or mothers to take such
opportunities. Anthea, a sales representative, admits that it is difficult for wives and mothers to
cope with her working hours, a point also made by Carla who is a front officer with a parastatal

Gender Pay Review
National Commission for the Promotion of Equality
Malta September 2006 page 17 of 327
organisation (3). She cannot imagine a married woman working the long hours of overtime she
is expected to work. It is not uncommon for Carla to be informed only one hour before that
she has to work overtime. It is even more difficult for women to work the long hours of
security guards. There are guards who work 48 straight hours in remote areas day and night.
Such long hours are even difficult for married men and present an even more significant
challenge for women with young families. As John (a security guard) confesses, there was a
time when he broke himself and nearly broke up his family when he worked from 5.30 in the
morning until 9.00 in the evening six days a week. He hardly ever saw his three children and
he ‘could not take it any longer’.
Caring Responsibilities
Over a third of respondents claimed to have caring responsibilities at home. The vast majority
of respondents claimed to spend time in domestic work with the mean time devoted to such
work being shorter (on a weekly basis) among male respondents than among women. Time
spent on domestic work varied across occupations with professional and associate professional
men devoting the longest time to domestic work while, among women, it was clerical, plant and
machine operator or shop and market service workers or women in elementary occupations
who devoted most time to domestic work. Among women, time spent on domestic work also
varied with age with older women spending more time in domestic work, whereas the same did
not feature among men. As highlighted in the literature, caring responsibilities have a direct
influence on the career prospects and pay structure of workers. The impact of caring
responsibilities on the worker’s careers and remuneration is directly dependant on the number
of hours spent providing for these responsibilities. The higher the respondent’s responsibility at
work the lower the number of hours spent in domestic duties.
Career
Men are more likely to have been employed with the same company and performing the same
role for more than 15 years than females. Indeed, the average stay with any employer varied
between men and women interviewed – standing at 9.9 years among men and 5.7 years
among women. Female respondents working with non-profit making organisations have the
highest means in terms of time spent with the same company whereas male respondents
3 Names of such interviewees are fictitious and intended to conceal the true identity of the research participants.

Gender Pay Review
National Commission for the Promotion of Equality
Malta September 2006 page 18 of 327
working with commercial partnerships have the highest means in terms of time spent with the
same company.
A proportion of men also featured a career break shorter than 1 year, contrasting against the
career break typically availed by women that features a longer duration. Indeed, 6.7 % of
female respondents took a career break ranging between 10 and 15 years, while another
16.7% of female respondents availed of a break longer than 15 Years. Typically, women avail
of such break for child birth/care reasons. Employers react by offering some form of
arrangement, with the most popular being part-time work for both men and women.
Research also established that 13.3% of male respondents and 12.6 % of female respondents
are looking for a new job, this largely with the intention of identifying a new opportunity with
better working conditions.
Equality & Protection at Work
The majority of research participants do not feel that they were unfairly treated by their
employer, particularly when comparing their situation with that of members of the opposite sex.
The majority of respondents who suffered an unfair treatment are those typically working in
private companies (males: 47.3%, females: 52.3%). Men highlighted their basis of contract as
the stronger reason for suffering unfair treatment while females consider their sex as the
stronger reason for unfair treatment from a range of prompted reasons. More than half of
respondents tried to redress an unfair treatment. Of these, both men and women preferred to
complain with the employer on their own (82.1%) or simply adjust to the new conditions
(54.8%). Among men, the majority of those who chose not to redress the unfair treatment did
so because they feared further discrimination from their employer while most women who
chose not to redress the unfair treatment did so because they feared further discrimination
apart from not finding the employer available to discuss the situation.
Qualitative research also supported the observed poor proportions of workers who consider
themselves to have been unfairly treated by their employer or by prospective employers. The
bases of injustice vary, gender discrimination being one of the factors involved. Unfair
treatment is suffered both by those in the private sector as well as by workers engaged in
parastatal or governmental organisations – with workers often opting to do nothing about it.
When deciding to redress a perceived injustice, such action often excludes the industrial
tribunal, although instances of redress action may include legal advice among others. Trade
unions also did not feature much as a protective measure against injustice.

Gender Pay Review
National Commission for the Promotion of Equality
Malta September 2006 page 19 of 327
One of the cases concerned Carla who claimed to have been sexually harassed by a watchman
and reported the case. Instead of transferring the watchman, management transferred her and
she was advised to seek psychological help owing to a suspected psychological condition. Whilst
not wanting the watchman to lose his job, Carla much desired to keep working at the same site,
seeking advice from sources outside the employer (as exemplified by NCPE). Eventually, the
watchman in this case was transferred to another post a year later.
Apart from her experience of sexual harassment, Carla also complained that at work she has
added responsibilities for which she is not paid. Although Carla is the only woman in her
section, and her male colleagues do not accept such conditions, Carla does not consider this as
a gender issue. The difference in treatment is between the old and new employees. Carla is
still on probation (employed on contract with a parastatal organisation) while the older workers
are seconded by the government and their employment is more secure.
Unfair treatment was also evident in relation to promotion and recruitment practices. Although
many of those interviewed opined that employers associate jobs with a specific gender, it was
Anthea who was directly discriminated on the basis of her sex by a well-established food
importing and distributing company. Anthea is a sales representative who claims to have
applied for a job with this company whose policy is to employ male sales persons only. This
was specifically stated in the letter of refusal she received from the company informing her that
her application was not considered on grounds that she is a woman. Anthea did not feel that
she should take any action to defend her case because she accepted that this was company
policy. Paul also mentioned the same company, claiming that a few years ago (when the
company still employed women in sales), management terminated the employment of one of
the female sales representatives simply because she was getting married.
The issue of gender discrimination did not feature much in relation to promotions in the
qualitative research. Gender may feature in an indirect way where promotions are concerned
such as when women are employed on a part-time basis, working reduced hours, or availing of
a career break. Certain cases, however, revealed that promotions are not awarded on the basis
of merit, experience, qualifications or commitment but are a question of personal preference.
This is especially the case in low paying jobs within the private sector.

Gender Pay Review
National Commission for the Promotion of Equality
Malta September 2006 page 20 of 327
Gender Orientation
Women are more likely to consider their job to be suited for both men and women than their
male respondents, with physical strength being the main reason underlying such opinion.
Contrastingly, men identified communication and leading skills as the main reason for which
their job is more appropriate for women while female respondents selected patience as the
main reason for which their job is more appropriate for a woman.
Almost all qualitative research interviewees indicated that certain jobs are more suitable for
either men or women. There were quite a few men who believed their particular job not to be
suitable for women as in the case of deliverymen, security guards, labourers and maintenance
workers. Other interviewees also commented on what they regarded as male work even
though they did not consider their work as gender specific such as Victoria who works at the
bank. The main reasons identified were, as highlighted by the statistical data, that physical and
strenuous work is better performed by men or in other cases because it is more dangerous for
women to be alone in remote areas day and night. There were fewer jobs considered to be
unsuitable for men. Anthea feels that women are better at sales and Corinne argued that
women could be more capable of obtaining certain information as journalists although she did
not consider journalism to be a woman’s job.
Interviewees largely believe that many employers have a specific gender in mind when they
advertise for jobs or recruit workers. Dorian claims that his company never employs women for
delivery work as it involves carrying heavy loads. Joseph does not know of any female drivers
employed with the employer where he works. Sexist recruitment practices do not necessarily
reflect suitability however, because as discussed elsewhere in this document, there are
companies that despite the anti-discrimination legislation, continue to discriminate against
women because of marriage and motherhood. Although Anthea believes that women make
better sales representatives because they have better persuasive skills than men, she was
herself the victim of sex discrimination by a company whose policy it is not to employ female
sales representatives.
Certain jobs, as shown in the review of published works, attract one sex more than the other
even if such jobs are open to both sexes. Such is the case of security work (male) and tourist
guiding (female). Gendered orientations at work do not stop upon recruitment but are also
reflected in the tasks and responsibilities assigned to men and women. For example, Corinne, a
journalist, believes that women have to work harder in order to prove themselves. At her place

Gender Pay Review
National Commission for the Promotion of Equality
Malta September 2006 page 21 of 327
of work, it is common practice for men to be assigned coverage of ‘hard’ news such as politics
and the economy while women are sent to cover the softer news such as entertainment,
fashion and culture - this despite the fact that the head of news is a woman. Corinne does not
feel this is intentional but rather ingrained in our culture.
The majority of respondents highlighted that their employers do not provide support schemes
for workers with caring responsibilities. Employees working with Government organisations are
the ones who benefit most from the different types of caring facilities highlighted in the
quantitative research. A gendered mentality is also reflected by workplaces (apart from
government institutions) that offer unpaid parental leave that is not extended to fathers.
Male research participants are more likely than their female counterparts to consider women to
be less committed to their work. Women, on the other hand opine that part-timers have access
to training and promotion with private sector companies. It is also women who are more likely
to perceive part-timers as being equally interested in training compared to full timers. Less than
half of male respondents and over half the female respondents consider part-timers to be
equally committed to work as their full-time counterparts.
Leave
Female respondents are more likely not to have vacation leave or sick leave when compared to
male respondents. Qualitative research suggests that those workers who do not have vacation
or sick leave are those who work on an hourly basis such as casual workers or in the case of
tourist guides because they are freelancers. Since women make up the majority of casual and
temporary workers, they are less likely to have such benefits compared to men.
As expected, there are employers who adhere strictly to the 19-hour limit to avoid meeting
leave obligations. Celine claims that at the fast food restaurant where almost everyone is
employed on an hourly basis, management is extremely careful not to let any worker exceed
the 19 hours workweek.
Research also showed that some employers abuse the system even further as revealed by John
– a security officer. Some companies employ security guards on a part-time basis when
actually they would be working much longer hours. In order to conceal this, the worker is
issued with three separate payments.
While workers may have the option of availing themselves of vacation and sick leave, they may
still encounter problems such as to get approval for their leave. Others such as Carla who is

Gender Pay Review
National Commission for the Promotion of Equality
Malta September 2006 page 22 of 327
employed with a parastatal organisation complained that vacation leave has to be booked
months before and approval is not given until the last minute. Besides, in order to avail herself
of vacation leave, an employee has to find a replacement – often proving to be a difficult
challenge that results in vacation leave not availed of if such replacement remains not found. A
similar situation is faced by Natasha – a freelancer who does not benefit from vacation or sick
leave benefits but must also find someone else to replace her in her job. Often she faces the
awkward situation when she gets ill (an unplanned situation) requiring her to find a tourist
guide to replace her in a matter of hours.
Parental Leave
Female respondents are more likely to avail of parental leave although the majority of both
female and male respondents are not entitled to such leave. Outside the civil service sector
(where both male and female workers are offered the possibility to take parental leave), certain
workers are offered maternity or other forms of leave at the discretion of the employer. Among
the interviewees, banking or some parastatal organisations’ female workers claimed to be
entitled to parental leave although in none of the cases is such benefit extended to men.
Corinne (the journalist) claims that women are offered one year unpaid maternity leave. Sonia,
who is currently on unpaid maternity leave from the bank, states that a mother can take one
year unpaid leave and in special cases, she can be granted two years instead of one. However,
this is subject to approval and is granted only under certain circumstances such as in the case
of having children with disabilities.
Parental leave has its obvious benefits especially when the alternative is for the parent, usually
the mother, to resign from the job. Research showed how mothers who avail of parental leave
face certain repercussions upon returning – such as reduced opportunities for training and
promotion. Although workers on unpaid parental leave do not lose their job, they may be
transferred to another post – as was the case of interviewed teachers or bank employees.
Sonia is sure that after her maternity leave she will be transferred to another branch according
to the exigencies of the bank although she will not lose her grade or her pay. Sonia does not
regret taking maternity leave because she looked forward both to the break from work as well
as to spending time with her baby daughter. However, since her husband works in the private
sector, she was the only one who could take the unpaid leave option. As Sonia’s salary is
higher than that of her husband, she would have preferred to continue working herself and for
her husband to take parental leave if he had the option.

Gender Pay Review
National Commission for the Promotion of Equality
Malta September 2006 page 23 of 327
Remuneration & Pay
The study established that the mean basic pay (weighted average) stood at Lm 419.00 monthly
(4) – varying across a number of situational contexts as exemplified by gender, education and
employment. Indeed, the weighted average basic pay stood at Lm 444.15 monthly for men
and Lm 374.28 for women. Almost invariably, such pay was higher among men than among
women, with some rare exceptions observable. Significant is the observation that although the
majority of part-timers are female, males engaged in part-time work also earn more than their
female counterparts. These observations, however, differ from the pay differences reported by
other sources as this research pertained to all persons in employment, even if working for less
than 15 hours weekly.
Apart from analysing the basic pay difference between men and women, the study showed how
the majority of both male and female respondents did not negotiate their pay but had their pay
established by the employer alone or in agreement with a trade union – a finding affirmed by
both qualitative and quantitative research. More women than men claim to have had their
salary established by their employer. Contrastingly, more men than women claimed to have
had their pay set in terms of a trade union agreement. A proportion of employees claimed that
upon recruitment they were asked what salary they expected. When Damian applied for work
as security guard, he told the management that he would not work for less than what he is
actually earning. However, his target salary is only reached after long hours of overtime.
Contrastingly, Victoria claims to have managed some negotiation with the bank’s personnel
manager over her pay, even though the bank does not normally negotiate pay – with a
resultant net pay improvement following a consideration by the bank that her job will require
more responsibility, study, travelling abroad and longer hours of work (even during weekends)
as a result of the bank’s automation of processes.
Quantitative research also showed that more men than women were offered a promotion - with
fewer men than women who refused such a promotion. Sonia claimed that now that she has a
baby, she might refuse a promotion if this would entail longer working hours as she prioritises
her family. However, it should also be noted that family responsibilities may not be the only
reason behind women’s refusal to accept promotion. Anthea, a young, unmarried woman who
4 Varying between Lm 402.38 and Lm 435.62 monthly at a 95% confidence interval. This statistic is considered as statistically
close to the quoted average wage of Lm 432.25 (Ministry of Finance, 2005) and Lm 433.09 (National Statistics Office, 2006).

Gender Pay Review
National Commission for the Promotion of Equality
Malta September 2006 page 24 of 327
works as a sales representative was offered a promotion, which entailed office work instead of
work on the roads. Anthea loves her work and did not want to give it up for office work.
Celine had also refused a promotion since at the time she was studying for her exams.
Both male and female respondents having received a promotion consider performance and
commitment as important factors that resulted in them earning their promotion. Men also
associate these factors (commitment and performance) with better pay prospects while women
tend to associate more hours of work with better pay prospects. Commitment was also a factor
mentioned by a number of interviewees during in-depth interviews – quoted as the factor that
employers look for when promoting their employees, in context with the type of work involved.
In the private sector, better pay also depends on how the company is doing financially. In non-
manual occupations, such as those of bank employees, qualifications and promotions are
directly linked with higher pay prospects. In other occupations such as sales, having the
necessary skills to deal with people and persuade customers to buy are more important than
qualifications. In certain places of work, prospects for better pay depend only on promotion.
Yet, other workplaces offer promotions largely in response to personal preferences as the
experiences of some interviewees showed. For certain categories of workers, better pay
depends largely on the number of hours worked as is the case of security guards who work
long hours of overtime, or tourist guides who work freelance. There are others, such as
journalists who may increase their pay by working everyday instead of on alternate days.
There are workers whose prospects for better pay are very bleak and depend only on statutory
cost of living adjustments. Workers such as Maria and Joseph who are employed with
parastatal organisations as a general hand and driver respectively, improving their qualifications
is not an option they consider especially now that they have reached a certain age. They do
not have any opportunity to work extra hours or for promotion. They are both willing to work
more hours if given the chance.
Beyond the Basic Pay
Both men and women employed in lower level occupations such as security guards, delivery
persons, maintenance workers, drivers, general hands, sales persons and labourers claim to
receive a very low income that in certain cases can be significantly enhanced by overtime or
commissions. Certain categories of workers, especially those engaged in elementary
occupations; however, hardly have any opportunity to supplement their basic income,
particularly those who work with government departments or parastatal organisations.

Gender Pay Review
National Commission for the Promotion of Equality
Malta September 2006 page 25 of 327
Within the private sector overtime work depends not only on the nature of work but also on
market demand. For example, Dorian, a deliveryman with a private company used to work
overtime frequently until recently, when his employer started facing stiffer competition from
firms importing similar goods. Yet, security work offers many opportunities for overtime – a
factor that counteracts the prevailingly low pays featuring among security guards especially
those employed by security companies. Such is the response of employers to harsh
competition among security firms that often depend on winning contracts through price-based
awards of competitive tender processes. In securing such contracts, security firms had to cut
down on salaries, offering workers a flat rate that can be as low as Lm1.25 to Lm1.37 per hour,
although some instances of Lm 1.00 hourly are known, pushing such workers into workweeks
of 65 or 80 hours. A basic workweek will earn the security guard little more than Lm 200
monthly.
Commissions and performance bonuses provide another form of supplementary income, a
feature prevailing among workers in the private and parastatal sectors – a feature among
12.8% of the survey participants. Indeed, performance bonuses (averaging Lm 181.91
monthly) form a significant management tool featuring in the case of workers engaged with
Governmental entities, publicly listed companies or employers involved in the service sector.
Commissions (averaging Lm 155.56 monthly) prevailed among private enterprise workers,
particularly those engaged in some form of sales function within manufacturing or service firms.
In-depth interviews, however, revealed no particular differences between males and females
regarding bonuses or commissions awarded to employees although bonuses are more common
among workers with more responsibilities at work. Anthea receives a commission on sales – a
common feature among sales representative and workers engaged in sales functions. Anthea
claims to receive a commission that is equal to her basic pay. Michael, a university student
employed with an exchange bureau on a part-time basis claims to have already benefited from
two of the various incentive schemes offered by the company for workers to earn extra income.
Both incentives are tied to the workers’ ability to convince customers to exchange larger sums
of money. Bank employees also benefit from a number of incentive schemes such as
subsidised loans, sponsored work-related studies, health insurance schemes as well as
performance bonuses. Performance at the bank is tied to the amount of work accumulated,
measured in terms of sale of financial products and number of accounts opened among others.
This may put women employed on reduced hours at a disadvantage as they can devote less
time to accumulate work. Sonia disagrees, claiming that such is not necessarily the case as a

Gender Pay Review
National Commission for the Promotion of Equality
Malta September 2006 page 26 of 327
woman working 30 hours a week may still manage to perform better than an average full-timer
if she works hard enough.
Earnings Difference
A discrepancy between workers’ perceptions concerning the gender pay gap and the social
reality revealed by the statistical data is evident. Almost all workers participating in in-depth
interviews regardless of gender, occupation, social class and level of education denied that men
and women receive different earnings. Michael, a pharmacy student who works as a clerk on a
part-time basis declares that he never encountered any differences in pay in any of the work
places where he was employed during the past five years. Victoria, a bank personnel manager,
claims that there are no pay gaps at the bank across employees of different sexes. James, a
senior tradesman with a parastatal organisation believes that men and women who do the
same work receive the same pay, while Celine, who worked in a fast food chain for two years,
claims that men and women employed in the same grade are paid the same rates.
A quantitative analysis of the gross pays received by research participants, inclusive of
commissions, performance bonuses and overtime (discounted for vacation leave and sickness
leave entitlements) revealed that the weighted mean total earnings stand at Lm 557.31 monthly
(5), varying between men and women. As established earlier, the gross earnings are higher for
men (Lm 608.92 monthly) than for women (Lm 467.33) – a consistent feature across all age
groups, occupations, sectors of activity and basis of employment except for some rare cases.
The same holds when such gross earnings are divided by the hours worked (minimum required
and overtime, less hours potentially availed for vacation or sickness), showing how the
weighted average hourly gross earnings stand at Lm 3.26 hourly for men and Lm 2.79 for
women.
Despite the general perceived ‘equality’, some interviewees (participating in the in-depth
interviews) hinted at gender differences in earnings that result from factors beyond the
standard pay rates of male and female employees occupying similar posts and performing
similar duties. Noel, a project leader, believes that although about 40% of project leaders are
women, these would probably earn less than men because it is men who are assigned the high
profile projects. Women are also more likely to be working on temporary assignments. He
5 Or a range between Lm 524.46 and Lm 590.16 monthly at a 95% confidence interval.

Gender Pay Review
National Commission for the Promotion of Equality
Malta September 2006 page 27 of 327
believes pregnancy to be the main issue, projecting women in a difficult situation. A married
woman may suffer the consequences of motherhood while a single woman may be seen as too
independent and as more likely than men to make an abrupt move such as emigrating or
leaving her job for other reasons.
Differences in the total time worked are also apparent. The study established that male
research participants typically work an estimated 267 hours annually more than their female
counterparts. Such higher annual hours featured among men across all respondent contexts –
education, sector of employment, job basis and occupations, providing one strong contention as
to why women earn less than men.
Natasha, a young freelance tourist guide, also highlighted how women stand in a disadvantaged
position. Although women and men are not paid different rates, the earnings of a tourist guide
depend on the number of hours worked (since most guides work freelance). A guide will lose
work opportunities if she repeatedly refuses assignments. As Natasha explained, if an agent
requests the guide’s services and the guide refuses on repeated occasions, the agent will turn
to someone else. This puts pregnant women and young mothers at a disadvantage since they
are more likely to be unable to work. In certain cases where the guide is employed on a full-
time basis with an agency, she may be offered office work during her pregnancy or early
motherhood although such cases are not common.
Promotions
Promotion opportunities are another source of gender inequality in earnings. Victoria, who
worked her way up from a clerk to a manager over a span of twenty years with the same bank,
believes that the bank offers incentives to all those who want to continue studying. Obtaining
the desired qualifications is very often linked to promotions. Victoria appreciates the
encouragement she receives from the bank – the qualifications she had before simply precluded
her from continuing to advance in her career, which would have been even more hindered if
she availed herself of a career break.
Being a part-timer also reduces one’s chances for promotion. Michael, a part-time worker,
claimed that unless he became a full-time employee, he will never be offered the opportunity
for a promotion – illustrating how women are often in such a disadvantage as part-time work is
a more common situation among women.

Gender Pay Review
National Commission for the Promotion of Equality
Malta September 2006 page 28 of 327
Comparing Salaries of Workers In Similar Occupations
Most of the workers interviewed in qualitative research claimed that there were no differences
in pay among workers doing similar jobs at their place of work. Differences in pay existed
between different grades or between workers who have different levels of seniority. There
were those who compared their salaries to workers employed in similar occupations with other
organisations or those who compared workers doing similar work in different sectors such as
the state or private sectors.
Equally noteworthy is that interviewees often had no perception about what others earned –
possibly a result of being encouraged to ‘mind their own business and not to be bothered with
what others earn’ as Maria explained. Indeed, it was only recently that Maria learned that her
friend (who is also a general hand) earned a higher income than hers. Her friend does exactly
the same work but while Maria is a parastatal employee, her friend works for a government
ministry. On the contrary, Joseph, who works as a driver with a parastatal corporation on
secondment by the government, claims that the corporation’s conditions are slightly better than
those of the government. At the same time, Joseph believes that drivers in the private sector
have a higher income. Maria’s husband is also a low-paid worker, performing maintenance
work within a Government department although his pay is a little higher than hers.
Contrastingly, security guards receive very similar rates of pay largely due to the harsh
competition that exists between companies competing for the award of tenders. Salaries for
such guards, however, may be better among agencies requiring security work – this in response
to their different market contexts. Comparing her job with that of other sales persons in other
companies, Anthea feels she has better working conditions. For those who work on an hourly
basis, such as tourist guides, earnings depend on the number of hours worked, albeit such
hours depend on the demand for languages spoken by the guide. Uncommon languages (like
Japanese or Russian) enable guides to demand higher rates for their services.
Compared to her peers in her newsroom, Corinne has the highest pay – earned as a result of
seniority. Journalists at her place of work receive the same pay regardless of whether they are
graduates or not. Compared to journalists working for Government owned companies, her
salary is lower although she believes that other non-Government journalists receive more or
less a similar salary.
Generally, the issue of pay discrepancy among workers performing similar jobs did not feature
as a controversial issue among interviewees. None of the workers identified pay discrepancy

Gender Pay Review
National Commission for the Promotion of Equality
Malta September 2006 page 29 of 327
especially on the basis of gender as a source of injustice or discrimination although many
workers are still not content with what they earn.
Roles & Responsibility
The study also confirmed how women are typically engaged in clerical roles, whereas more men
than women occupy professional roles. The study also confirmed (as established in other
works) how men are more likely (than women) to occupy a senior managerial occupation.
Males are also more likely than females to have employees reporting to them.
Caring responsibilities are considered to have a huge impact on the role and occupational level
of individuals. Indeed, the proportion of female respondents without caring responsibilities who
have a professional role is more than double that of female respondents having caring
responsibilities.
A total of 26.7% of research participants incur job related expenses exemplified by fuel and
mobile phone. Nevertheless, whilst the proportion of interviewees who receive some refund
was significantly lower, no statistically significant differences can be observed between men and
women in paid employment. Such observations were also affirmed by in-depth interviews, with
workers claiming that some costs incurred are never refunded. Certain security companies
provide uniforms to their guards while others just provide a company tie, while the guard has to
acquire the rest of the uniform from own funds. Security guards also have to pay a license fee
renewable every year. Some employers require their security guards to report to work in Gozo
monthly. Martin was not informed of this during the interview. His employer pays the ticket
and adds 1 hour pay at the end of the month. It costs Martin Lm 5 to go to Gozo and the
management presents challenges in refunding the ticket, while no petrol allowance is awarded.
Anthea, who works as a sales representative is provided with a company car and given a petrol
allowance. This allowance remained unchanged, despite the fact that the employer bought new
cars (that consume more fuel) and that the price of fuel recently increased, with such allowance
becoming insufficient to cover such fuel costs in a short period of time. Anthea is also given a
Lm 10 bonus every three months for mobile calls expenses which she also claims is insufficient.
Unlike Anthea, Dorian (a deliveryman) does not incur expenses on a regular basis. However,
he is not given an allowance for driving heavy vehicles. Neither does his employer insure goods
or Dorian against the possibility of goods being stolen from Dorian’s vehicle. In the case of
theft, Dorian has to pay for the stolen goods himself. Dorian is also responsible for collecting

Gender Pay Review
National Commission for the Promotion of Equality
Malta September 2006 page 30 of 327
money from establishments he visits, posing an additional security risk. Furthermore, if Dorian
is involved in a car accident, all damages have to be paid by him.
Work at Home
Quantitative research suggests that more men than women are able to perform part of their
duties at home. Male respondents claim to dedicate more hours to job-related work at home
compared to their female counterparts. Over half of male respondents and less than half of
female respondents would not request any remuneration from their employer should they be
requested to stop working from home.
C o n c l u s i o n s
Over the past years, policy makers in Malta gave gender equality in the labour market a marked
priority, with various efforts aimed at empowering women and strengthening women’s social
and economic situation. A series of social, economic and legal measures were effected in an
endeavour to promote gender mainstreaming and to ensure that women and men have equal
opportunities in employment with regards to recruitment, training, promotion, responsibilities
and pay.
Although the literature points to a significant improvement in this direction, it also suggests that
what has been done so far both locally and abroad is not enough since women remain
disadvantaged in respect to a number of factors when compared to their male counterparts, not
least where earnings are concerned. As indicated in the international literature, the factors
associated with the persistent inequalities in the earnings of men and women are found both
within the labour market (such as sex discrimination) as well as outside the labour market and
more specifically tied to women’s domestic and caring role within the family. Although both
sets of factors play a determining role in reinforcing the status quo, it is the latter, which
appears to be the more salient feature since very often it also underlies the gendered or sexist
practices within the labour market.
This study suggests that, caring responsibilities bear a direct influence on the career prospects
and consequently on the earnings of individuals. As expected, it is female workers who
dedicate more of their time to domestic and caring responsibilities with over a third of women
spending between 1 and 3 hours daily and a significant 10% dedicating 8 hours or more to
domestic/caring duties every day. Most men spend less than an hour performing such duties

Gender Pay Review
National Commission for the Promotion of Equality
Malta September 2006 page 31 of 327
while only 3% of male workers devote 8 hours or more to domestic or caring responsibilities,
with such times typically shorter when job responsibilities are more intricate.
Both horizontal and vertical occupational segregation is evident in the Maltese labour market.
Published works show how the concentration of women in ‘female’ occupations affects their
earnings by excluding them from other, better-paid occupations while their concentration in
lower level jobs affects their earning in a more direct way. This study affirmed how women
tend to take up clerical roles and are less likely to occupy senior managerial occupations than
men.
Caring responsibilities play a major role, affecting the likelihood of workers occupying higher
status and better paid jobs. Among female respondents, the percentage of those having a
professional role and no caring responsibilities is more than double the proportion of women
with caring responsibilities engaged in professional roles.
Going up the ladder is inevitably tied with either seniority or promotion, the latter often tied to
the perceived level of worker commitment, performance, skills and qualifications. The study
suggests that men often stay longer with the same employer, and are thus more likely to move
up the ladder on the basis of experience and commitment. Men thus not only tend to have
more promotion opportunities than women but are also more inclined to accept them.
Qualitative research showed that, however, workers may not necessarily refuse a promotion
due to caring responsibilities.
Career breaks are one of the major factors influencing the promotion opportunities and
earnings prospects of workers. Not only are women more likely to break their career than men
but their breaks tend to be longer. Firstly, it is noted that women have more opportunity to
avail themselves of parental leave than men. Whereas both men and women employed in the
state sector are entitled to parental leave, in those few workplaces outside the state sector such
option is only open for women. It should also be pointed out that workers may take career
breaks for other purposes such as study or migration leave. Indeed, it is pertinent to note that
none of the men in the sample who broke their career did so in response to childcare
responsibilities, contrasting against the case of women.
This puts women at a disadvantage since during their break from work they lose on training
and promotion opportunities as well as on experience and seniority although there are those
few who take the initiative and seek to follow some form of training or study courses during

Gender Pay Review
National Commission for the Promotion of Equality
Malta September 2006 page 32 of 327
their absence from work. Should they choose to return to the labour market after years away
from work, age is another factor that may work against them.
The most common alternative to career breaks offered by employers is part-time work,
notwithstanding that a few respondents mentioned flexi-time. It is women who generally take
this option, with only 9% of male respondents claim to be working on reduced hours or on a
part-time basis – contrasting against the 25.9% of female respondents. The study also
affirmed how part-timers receive lower rates of pay than full-timers not because of human
capital variables but because they may be perceived by employers as being less committed and
less productive than their full-time counterparts. Furthermore, it is even more difficult for part-
timers to advance in their career since they are less likely to be perceived as career-oriented.
At the same time, it is worth noting that males who work on a part-time basis still earn more
than female part-timers on average – affirming observations made in the review of international
literature.
The study suggests that both men and women consider certain jobs as gender-specific. Among
the respondents, women were more likely to consider their job as gender-neutral. Both men
and women consider physical strength to be the main factor determining the greater suitability
of a job for men. With regards to female-specific jobs, men indicated communication and
leading skills as the main reason considered to make a job more suitable for women while
females considered patience as the main factor which makes a job more appropriate for a
woman. As also indicated in the qualitative research, employers very often have a specific
gender in mind when they recruit workers partly based on gendered perceptions of suitability
such as heavy and strenuous work for men and clerical or caring work for females. Such
gendered perceptions may also have an impact on employers’ decisions to give promotions.
Qualitative research also showed how despite the anti-discrimination legislation, employers may
still employ sexist policies in management, such as excluding women from certain jobs either
because they are married or have children or because they will do so in the future. Interviews
as part of this study also indicated that in certain work places, women are assigned certain
tasks while men are asked to perform others, deemed superior. Women have to work harder
to prove their worth.
Despite the significant plethora of rights and protective mechanisms, it is regrettable that some
categories of workers have their rights trampled on. Of those who claim to have been unfairly
treated, the majority work in the private sector. The contract basis was considered to be the

Gender Pay Review
National Commission for the Promotion of Equality
Malta September 2006 page 33 of 327
strongest source of unfair treatment among men while women indicated sex as the major basis
of discrimination against them. From the qualitative data, some cases of sex discrimination also
emerged. The study also showed how workers may not undertake actions to redress
undesirable conditions of work, particularly among workers in the private sector who feel
powerless in attempting to change things. Workers may still be threatened with redundancy if
they join a trade union. For these workers, particularly in elementary occupations in the private
sector, unfair treatment does not necessarily pertain to sex but to basic rights such as pay,
security and safety as well as union representation.
Within the above context, it is not surprising that despite the measures taken to address gender
inequalities within the labour market, male respondents have higher weighted mean monthly
pay (Lm 444.15) than females (Lm 374.28), with the biggest discrepancy featuring in the
private sector. Men’s higher earnings remain constant regardless of level of education, job level
and basis of employment. Men having a primary level of education earn an average salary of
Lm 362.67 while females earn Lm 268.80 on average monthly. While men having a post
secondary level of education have a weighted mean pay of Lm 426.47, their female
counterparts earn a weighted mean of Lm 330.70 monthly. Males engaged in elementary
occupations have a higher weighted average basic pay (Lm 323.55) than females having the
same type of responsibilities (Lm 254.88). In most cases, both males and females did not
negotiate their pay, which was established as standard generally either by their employer or by
their employer in agreement with a trade union.
The stark discrepancies in the earnings of women and men as revealed by the statistical data
do not appear to be reflected in the perceptions of workers themselves as the qualitative
research suggests. Qualitative research, indeed, established that regardless of sex, occupation,
social class and level of education, people were of the opinion that there are no differences in
the earnings of men and women. Differences in earnings are believed to exist only between
those occupying different grades or levels of seniority. This is probably due to the legal
standardisation of pay rates of men and women occupying the same grade and performing the
same duties within the same organisation or work place. Gender differences in earnings that
emerge out of factors beyond the standard pay rates of males and females occupying similar
posts and performing similar duties are less obvious. The concentration of women in lower-
level and less paid jobs; their concentration in part-time work; employer discrimination based
on stereotyped perceptions in relation to recruitment, promotion and training; career breaks

Gender Pay Review
National Commission for the Promotion of Equality
Malta September 2006 page 34 of 327
and the assignment of lower profile tasks to women are easily overlooked as underlying causes
of gender differences in earnings.
These conclusions are based on a study involving both quantitative and qualitative fieldwork,
exploiting a representative study of Maltese persons in gainful employment with only a marginal
level of sample error (estimated at less than ±5.0%). The use of triangulation further warrants
the reliability of the methodologies used throughout. Nevertheless, the statistics provided
herein cannot be used as a basis for comparison with other statistics relating to the gender pay
gap, as the methodology involved in the measurement of pay is reliant on a completely
different approach. Indeed, the methodology used herein also considers the effect of payments
outside the basic pay – exemplified by commissions and performance bonuses, along with
overtime payments.
Nevertheless, caution should be exercised in the interpretation of pay differences across sexes.
Work of equal value is virtually impossible to identify at a sampling and fieldwork conduct
stage, owing to the unavailability of secondary information relating to personal details of people
in employment. Indeed, such details including years of experience, levels of skill exercised at
work and the availability of pairs of such persons in employment (men against women in same
jobs of equal worth) along with the identity of such persons is not accessible through public
sources.
R e c o mm e n d a t i o n s
Despite the seemingly mistaken perceptions of workers, the statistical data suggest that gender
pay inequalities persist and that eradicating them is not an easy task. The cases of pay
discrepancy are various but the findings, in line with the literature reviewed, seem to suggest
that the biggest challenge is the development or strengthening of structures and schemes,
which enable more women to participate more fully in the labour market on a par with men.
Equality and anti-discrimination legislation is an essential framework for addressing the much
bigger hurdle of bringing about changes in traditional perceptions of gender roles within the
domestic sphere.
If women are to participate equally in the labour market and to have equal labour market
opportunities and consequently equal pay to men, they cannot alone remain burdened with the
conflict of having to combine work and family responsibilities. Providing the necessary
structures to enable an acceptable work-life balance for both men and women are important as

Gender Pay Review
National Commission for the Promotion of Equality
Malta September 2006 page 35 of 327
much as it is crucial for both men and women to recognize the merits of participating equally
both in the domestic and public sphere.
The gender pay gap has to be addressed within a wider framework of attracting more women
to the labour market and enabling them to remain within it if they so wish. Government has
the responsibility to ensure that the general objectives set out in the National Action Plan (ETC,
2004) and the National Reform Programme (MEU, 2005) are attained. However, the National
Action Plan and the National Reform Programme do not target the gender pay gap directly. It
is assumed that gender inequalities in pay will be reduced or eliminated once more women
decide to enter the labour market. However, although a higher percentage of women in the
labour market will probably contribute to reducing the earnings gap between men and women,
it also depends on how women participate in the labour market. Having a higher percentage of
women working on a part-time basis, for example will not significantly reduce the gap. Having
a higher percentage of working women on unpaid parental leave will still put women at a
disadvantage.
Therefore, it is important for policy makers to:
� establish the causes underlying the low level of female participation in the Maltese labour market;
� establish what women themselves consider to be viable incentives to leave their home and enter
the labour market;
� make it more financially viable for both partners to work (although certain incentives are already
being offered;
� enable more women to take up full-time rather than part-time employment;
� encourage more men to avail themselves of parental leave;
� provide incentives to the non-state sector to offer opportunities for parental leave to both female
and male employees;
� develop structures and schemes which offer a real alternative to parental leave, and
� ensure that equality and anti-discrimination laws are respected.
Together with the other social partners, Government should seek to address the gender pay
gap more specifically by:
� encouraging more workers to become unionised;
� ensuring that more workers are covered by collective agreements;

Gender Pay Review
National Commission for the Promotion of Equality
Malta September 2006 page 36 of 327
� giving more priority to addressing the gender pay gap in collective bargaining;
� encouraging the establishment of standardised pay structures outside the public sector;
� seeking to establish a system of job evaluation that enables the objective appraisal of jobs with
special attention to reduce the wage gap between male- and female-dominated sectors of
employment;
� carrying out job evaluation exercises for both full-time and part-time employees;
� introducing measures to increase the pay of jobs that are deemed to be under evaluated;
� discouraging personalised agreements between employers and employees outside collective
agreements, and
� addressing the less obvious, underlying causes of the gender pay gap more seriously.
This involves serious discussions on how to enable more women to participate in the labour
market on a full-time basis without having to interrupt their career due to lack of support
systems. The social partners have to devise ways of making full-time work a feasible option for
both men and women without this being detrimental to:
(i) family needs and responsibilities and
(ii) productivity.
Among the possibilities that have to be considered seriously are the provision of:
� CHILDCARE
For parents to be able to contribute to the economy they have to be partly relieved of the conflict
between the demands of their job and the demands of their family especially in the case of small
children. For childcare to be a viable option, the social partners have to be sensitive to workers’
needs and seek to establish:
– Location that the workers consider to be the most practical – a factor that calls for further
research.
– Affordability: unless childcare is affordable, the labour market will only attract women who
give more priority to their career than to income. Very often, these women are already in
the labour force.
– Opening hours of facilities: This problem is not only faced by parents of pre-school children
but also by those who have school age children below a certain age (such as 12 years).

Gender Pay Review
National Commission for the Promotion of Equality
Malta September 2006 page 37 of 327
� FLEXITIME
this system which is already in practice in certain sectors of employment merits further
investigation in order to evaluate its strengths and limitations and to seek ways of utilising it to the
benefit of both workers and employers.
� HOME WORK AND TELEWORK
Like flexi-time, this system that is still being explored in the Maltese labour market has a number of
benefits for both workers and employers that still have to be exploited.
� LEAVE FOR CHILD SICKNESS
This option should be seriously considered for all workers with young children along with those
parents who provide evidence that they do not have any support from relatives in the case of child
sickness. Workers are very often constrained to avail themselves of vacation leave or (if possible)
to abuse of their own sick leave when their children are sick. It should also be taken into
consideration that for many workers emergency vacation leave is not an option especially if it
involves more than one day. There are also workers such as teachers who do not have vacation
leave.
T a r g e t i n g T r a d i t i o n a l G e n d e r R o l e s
No effort by any policy stakeholder will have the desired effects unless a much more
fundamental hurdle is overcome. Policies dealing with labour market discrimination, equal pay
legislation, and the provision of parental leave, income tax incentives and numerous other
measures aimed at gender mainstreaming cannot be exploited effectively unless factors arising
outside the labour market and more specifically within the domestic sphere are addressed
seriously. Admittedly, equality legislation and anti-discrimination policies have been decisive in
reducing abuse and in promoting greater parity between men and women. However, it is
traditional notions about the role women and men within the family and the conflict between
the demands of work and family responsibilities, which continue to be the major underlying
source of gender inequality in the labour market and consequently of the gender pay gap.
Designing policies and enacting laws are admittedly much easier than changing cultural values
and social expectations tied to the roles of women and men in society, especially when
traditional social forces seek to perpetuate the status quo. However, until women continue to
be perceived as the homemakers/carers and men as the breadwinners, women will be unable
to contribute to the economy and to reap the advantages of paid work equally with men.
Malta experienced rapid social and cultural changes over the past few decades and the seeds
for change were sown. However, this enormous task cannot be the endeavour of the State

Gender Pay Review
National Commission for the Promotion of Equality
Malta September 2006 page 38 of 327
alone. It is a project that involves civic society as well as the private sector. It has to target
various social groups such as:
� children and young people
� young parents
� employers
� educators
� employees as well as
� general audiences
through a nation-wide educational campaign aimed at eradicating gender stereotyped
perceptions and practices both within the domestic and the public sphere.

Gender Pay Review
National Commission for the Promotion of Equality
Malta September 2006 page 39 of 327
Table of Contents
1 BACKGROUND 41
1.1 National Commission for the Promotion of Equality 41 1.2 Objectives of the Study 43 1.3 Project Tasks 46
2 A PAY GAP? 48
2.1 Introduction 48 2.2 Women’s Work & Earnings in History 49 2.3 A Universal Pay Gap: An International Comparison & Its Limitations 53 2.4 The Maltese Setting 59 2.5 Pay Equality Legislation 62 2.6 Explaining Gender Differentials in Pay 67 2.7 Women’s Familial Constraints & Their Impact on Labour Market Patterns 68
3 WORK FOR MEN & WOMEN 73
3.1 Occupational Segregation 73 3.2 Pay Structures 75 3.3 Jobs, Gender & Discrimination 77 3.4 Fighting Occupational Discrimination 85 3.5 Workplace Characteristics 87 3.6 Future Directions? 89
4 KEY ISSUES 96
5 A GENDER PAY REVIEW IN MALTA – FINDINGS FROM FIELD RESEARCH 100
5.1 Job Features 100 5.2 Careers 152 5.4 Leave Entitlements 171 5.5 Costs & Remuneration 177 5.6 Pay Structure & Advancement 207 5.7 Work At Home 222 5.8 Equality & Protection At Work 228 5.9 Gender Orientation of Work 243 5.10 Observed Family Friendly Benefits 247 5.11 Findings from Qualitative Field Research 253
6 DISCUSSION & CONCLUSIONS 269
6.1 A Gender Pay Gap 269 6.2 Labour Market Participation Patterns & Trends 269 6.3 Career Breaks 270 6.4 Caring & Domestic Responsibilities 271 6.5 Hours of Work 271 6.6 Supplementary Earnings – Beyond the Basic Pay 273 6.7 Negotiation of Pay 274 6.8 Occupational Segregation 274 6.9 Discrimination 278 6.10 Recommendations 279 6.11 Strengths & Limitations of the Study 284

Gender Pay Review
National Commission for the Promotion of Equality
Malta September 2006 page 40 of 327
APPENDIX 1 METHODOLOGY – CONSIDERATIONS 286
Data Collection Process 286 Interviewers 286 Participant Contact 287 Interviewing Features 288 Field Research Quality Management 288
APPENDIX 2 INSTRUMENT (ENGLISH VERSION) 289
APPENDIX 3 SAMPLE FEATURES 304
Desired Sample Characteristics 304 Characteristics of Survey Participants 306 Sample Error 320
APPENDIX 4 BIBLIOGRAPHY 321

Gender Pay Review
National Commission for the Promotion of Equality
Malta September 2006 page 41 of 327
1 Background
1.1 National Commission for the Promotion of Equality
Gender mainstreaming features as a significant priority within the Maltese Government’s policies
over the past two decades. This reflects the increased awareness of the need to address
gender-related issues in order to enable women and men to participate fully and on an equal
footing in the various spheres of socio-economic and political life. One of the major challenges
facing Maltese society at the turn of the new millennium is that of transforming the labour
market from one that is largely male-dominated to one that provides access, opportunities and
rewards equally to all workers regardless of their gender.
The Government’s commitment to promote gender equality reflects itself through a number of
policy and legal measures as well as various support initiatives implemented especially over the
past two decades. The removal of the Marriage Bar in 1981; the introduction of parental
(instead of maternal) leave; structures that allow for flexible work patterns; the provision of
responsibility breaks; the extension of maternity leave and the introduction of childcare
provision were undoubtedly steps in the right direction.
Major achievements were also attained within the Maltese legal framework, especially since the
ratification of the United Nations’ Convention on the Elimination of all Forms of Discrimination
Against Women in 1991, involving an associated amendment of the Maltese Constitution. The
recently amended labour legislation (Employment & Industrial Relations Act of 2002, Chapter
452) also addressed a series of gender concerns. Furthermore, the Act to Promote Equality for
Men and Woman (Chapter 456) not only addresses a number of issues in this regard but also
provides for the establishment of a National Commission for the Promotion of Equality for Men
and Women. These important legal structures together with what is commonly referred to as
the Family Law (amended in 1993) provide a strong legal framework, which facilitates the
emergence of a more gender-friendly socio-economic environment.
In order to render the gender equality legislation effective, the National Commission for the
Promotion of Equality for Men and Women (herein termed as the Commission) was set up in
2004, entasked with the implementation of such measures that enable the introduction and
upholding of gender equality as a value in socio, political, economic and legislative spheres.
Within such a context, the Commission absorbed the strategic tasks previously performed by

Gender Pay Review
National Commission for the Promotion of Equality
Malta September 2006 page 42 of 327
the Department for Women in Society and the Commission for the Advancement of Women.
The Commission thus acts as Malta’s equality hub, by:
� identifying, establishing and updating all policies directly or indirectly related to issues of equality
between men and women;
� identifying the needs of persons who are disadvantaged by reasons of their sex and to take such
steps within its power and to propose appropriate measures in order to cater for such needs in the
widest manner possible;
� monitoring the implementation of national policies with respect to the promotion of equality
between men and women;
� liasing with and ensuring the necessary co-ordination between government departments and other
agencies in the implementation of measures, services or initiatives proposed by Government or the
Commission from time to time;
� keeping direct and continuous contact with local and foreign bodies working in the field of equality
issues, and with other groups, agencies or individuals as the need arises;
� working towards the elimination of discrimination between men and women;
� carrying out general investigations with a view to determine whether the provisions of the Equality
for Men & Women Act (Chapter 456) are being complied with;
� investigating complaints of a more particular or individual character to determine whether the
provisions of the above Act are being contravened with respect to the complainant and, where
deemed appropriate, to mediate with regard to such complaints;
� enquiring into and advising or making determinations on any matter relating to equality between
men and women as may be referred to it by the Minister responsible for Social Policy;
� providing, where and as appropriate, assistance, to persons suffering from discrimination in
enforcing their rights under the above Act;
� keeping under review the working of this Act, and where deemed required, at the request of the
Minister responsible for the Family and Social Solidarity or otherwise, submit proposals for its
amendment or substitution;
� performing such other functions as may be assigned by this or any other Act or such other
functions as may be assigned by the Minister responsible for the Family and Social Solidarity.

Gender Pay Review
National Commission for the Promotion of Equality
Malta September 2006 page 43 of 327
1.2 Objectives of the Study
1.2.1 Context
The above context sets out a critical role as part of Malta’s employment strategy – outlined in
the Country’s National Development Plan for Economic and Social Cohesion for 2003-2006.
Within this strategy, significant measures feature as an important component for Malta’s
employment rate targets, set at 71% for men and 60% for women by 2010 – in parallel with
the Lisbon Strategy targets.
Indeed, Malta’s National Action Plan, published in September 2004 as part of the European
Employment Strategy, outlines an approach intended to reach the Lisbon Strategy goals – a
resolution that is intended to render the European Union as the World’s leading economy and
knowledge location that supports a world competitive advantage. Malta’s employment strategy
purports four horizontal areas, comprising:
� Increasing adaptability of workers and enterprises;
� Attracting more people to enter and remain on the labour market by making work a real option for
all;
� Investing more and more effectively in human capital and lifelong learning;
� Ensuring effective implementation of reforms through better governance.
The same Plan sets out a total of 81 initiatives intended to support the development of the
Maltese labour market whilst stimulating a number of trends that reverse the effects of specific
employment characteristics. A total of 30 projects are being financed through the allocation of
finances forming part of the European Social Fund – amounting to € 12.16 million (jointly
funded by the Maltese Government), planned to be implemented between 2005 and 2006.
These projects promote:
� Lifelong learning and social inclusion,
� Human resources development in Gozo,
� Employability & adaptability, and
� Gender equality.

Gender Pay Review
National Commission for the Promotion of Equality
Malta September 2006 page 44 of 327
The effects of these measures purport to the creation of jobs for 42,537 workers over the
period 2001 to 2010 – largely envisaged to relate to women in the private sector. Such
development means an attraction of 4,000 women to the labour market annually – a significant
trend that contrasts against the average of 900 women entering employment annually during
the years 1990 to 1999, and provides additional contentions when the rates at which women
leave the labour market for family responsibilities are considered.
Indeed, the importance of the employability and adaptability objectives is reflected by the
allocation of funds derived from the European Structural Funds – accounting for 51% of the
financing of the thirty different projects approved for funding. This feature of the National
Employment strategy is specifically addressed by three key guidelines:
� Job Creation & Entrepreneurship;
� Address Change & Promote Adaptability & Mobility, and
� Promoting Development of Human Capital & Lifelong Learning
The Commission’s efforts provide a significant role in Maltese society, aiming to render Maltese
organisations capable of competing in world markets by tapping under-utilised resources and
skills, exploiting experience and knowledge of motivated resources who benefit from an
augmented work-life balance. The Commission, thus, intends to build awareness among
Malta’s social partners about the cost-effectiveness and potential returns from investment
directed towards the introduction of family-friendly measures at the work place – exemplified by
flexible work arrangements, childcare and remunerative work through equal value/equal
opportunities policies. Such measures lead to an effective reduction in gender segregation
in the labour market, encouraging women to participate in paid work and aspire for higher
responsibilities.
These objectives are also a central implication of the intents of the European Social Fund – a
financial instrument that aims to augment the social and economic development of the
European Community. The purpose of the European Social Fund, is thus that of providing
financial independence and career progression of women, utilising skills and potential of women
to maximise economic growth and narrow down a Member State’s welfare gap, as is the case of
Malta.
In implementing measures that enable the attainment of the above objectives, the Commission
embarked on a process of research in order to augment its body of knowledge about the

Gender Pay Review
National Commission for the Promotion of Equality
Malta September 2006 page 45 of 327
Maltese equality & employment environment. In this respect, the Commission’s purpose of
increasing the participation and advancement of women in the labour market is primarily
dependent on the identification and promotion of measures towards the advancement of a
work-life balance by addressing the working environment in public and private sectors. In
attaining this objective, the Commission’s research efforts need to:
� identify potential grounds for improvement to render the system of family-friendly conditions of
work more effective for both employee and employer (by sensitising social partners to the cost-
effectiveness and accruing benefits of such approaches);
� identify gender disparities in pay and recommend the elimination of these barriers;
� track career paths of graduates and identify the effects of the absence of family-friendly measures
and their discriminatory effect on women;
� identify how working arrangements can be varied to meet employee and organisational
requirements.
In connection with the above, the Commission, through a competitive tendering process,
engaged Allied Consultants to undertake four independent yet related research projects
involving:
� an investigation in The Introduction of Family-friendly Measures at the Workplace
� a Gender Pay Review
� a Tracer Study to Follow the Career Path and Conditions of Work of Graduates in the Labour
Market
� the conduct of a Teleworking Pilot Project, which relates the efforts undertaken resulting to this
report.
1.2.2 Research Objectives
More specifically, in understanding the features and trends in disparities related to
remuneration provided to men and women in employment, the Commission requires research
involving the conduct of quantitative and qualitative field work that expounds differences (if
any) in pay between men and women in different occupational cohorts as defined by:
� occupation types,
� working time,
� value addition and

Gender Pay Review
National Commission for the Promotion of Equality
Malta September 2006 page 46 of 327
� other aspects related to work.
The findings of the research will form a basis for recommendations intended to remove barriers
that segregate men and women in distinct occupations, whilst exploiting identified opportunities
for equal opportunities and equal pay.
1.2.3 Significance
The research related to this project bears a significant impact on:
� national policies (education, social security, welfare, employment conditions) and
� instruments (such as financial assistance, employment conditions, training, counselling and social
welfare programmes)
availed to people seeking employment or currently gainfully engaged, largely as a result of the
recommendations adopted by the Commission in advising on employment regulations or other
communications that may encourage employers and employees to adopt new approaches in
ensuring equality at work between men and women. In this context, recommendations set out
in this report relate to all Maltese society.
Equally important, apart from influencing employment measures and conditions of employment
as adoperated by employers, recommendations set out in this report pose implications on
Government and the Commission’s policies relating to the allocation of resources (financial and
human), bearing consequences on:
� Government’s structure of earnings (social security contributions and other sources);
� the Commission’s structure of earnings (Government funding);
� Government’s structure of expenditure (education, entrepreneurship support programmes, business
promotion assistance, guidance & counselling services) and
� the Commission’s structure of expenditures (administration of programmes, family assistance
services).
1.3 Project Tasks
In addressing the requirements of the research project, efforts undertaken by Allied Consultants
included:

Gender Pay Review
National Commission for the Promotion of Equality
Malta September 2006 page 47 of 327
� Provide the services of suitably qualified and/or experienced consultants to conduct the research
per project description (as set out in Annex II Par 2.3 (b) of the Tender Document)
� Carry out initial exploratory research in respect to antecedents of differences in pay among
employees of different sexes in Malta, intended to build an initial understanding of the research
area by accessing published/unpublished literature pertaining to the subject;
� Build a research instrument that effectively taps information about pay and work conditions among
Maltese workers of both sexes with a focus on job value, responsibilities, hours of work, schedules,
benefits, learning and pay;
� Administering the instrument in (O) above through the conduct of 600 quantitative face-to-face
interviews with men and women engaged in paid work (n = 600);
� Translate quantitative data into electronic fields, coding of data, weigh and verify responses;
� Conduct additional qualitative interviews (n = 20) in order to expound further the reasons why
women and men as distinct social groups are found within different occupational categories, (aimed
to identify possible barriers to equal pay and equal opportunities);
� Conduct quantitative and qualitative analyses on the data gathered in order to attain the research
objectives set out in Section 1.2.2, quantifying the differences in the corresponding pay between
men and women, along with an identification of the reasons leading to such differences. The same
analyses will identify the reasons why such differences exist through the compilation of case
studies pertaining to 20 selected men and women;
� Submit a report detailing the levels and extent of differences in pay between men and women
across different occupation groups, expounding the antecedents for such differences;
� Develop a communications approach targeting Malta’s social partners, soliciting the implementation
of measures that encourage the adoption equality approaches among employers, presenting
opportunities for women to pursue rewarding careers by eliminating gender oriented barriers;
� Present detailed periodic (quarterly) technical and financial reports to the Project Leader, in a
format as required by the Commission and other project stakeholders with authority.

Gender Pay Review
National Commission for the Promotion of Equality
Malta September 2006 page 48 of 327
2 A Pay Gap?
2.1 Introduction
From the time women entered the labour force, they generally received lower earnings than
men. Gender pay inequalities seem to be both universal as well as resistant to social, cultural
and economic changes. They have persisted despite the changes that have taken place in the
labour market such as the increase in women’s participation. They were not eradicated despite
the various legislative measures taken to protect women from occupational discrimination.
They are still evident despite the higher educational levels achieved by women; despite the
various efforts to encourage and implement gender mainstreaming and to foster a culture of
gender parity.
Women are not paid less than men because they are less productive. For a long time, this
imbalance in the earnings of men and women was justified by the assumption that women did
not need to earn as much as men since they were not the breadwinners. Furthermore, policy
makers and employers alike (these being largely male) generally assumed that women should
earn less than men because otherwise, the traditional balance of power within the family would
be disrupted (Swepston, 2002). However, today the fact that this wage gap has managed to
survive the 20th century is of great concern to policy makers as well as to women themselves
both at local as well as at European and international level especially in the light of the
increased importance which has been given to gender issues and employment in recent years
within the European Union. This is evident in the European Employment Strategy which has
made women’s employment and the gender mainstreaming of employment policy a central
priority. Consecutive EU Employment guidelines also stress the importance for all member
states to tackle the issue seriously if the desired results are to be achieved.
The gender pay gap (in unadjusted form) - one of the structural indicators to monitor progress
in the framework of the Lisbon Strategy - measures the difference in the average gross hourly
earnings between men and women (6), across the whole economy and all establishments
(Commission of the European Communities, 2003).
6 These are paid employees aged 15-64, who work at least 15 hours per week.

Gender Pay Review
National Commission for the Promotion of Equality
Malta September 2006 page 49 of 327
Differences in earnings between men and women could arise from:
� differences in the composition of the male and female workforce (‘composition effect’);
� differences in the remuneration of men and women with similar characteristics (‘remuneration
effect’); and
� differences in the labour market participation behaviour of men and women (‘selection effect’).
(Commission of the European Communities, 2003).
Although a number of explanations have been put forward citing various factors to account for
the persisting gender pay differentials, many studies point to the conclusion that these factors
are responsible for part, not all, of the existing gap. There remains a proportion of the pay gap
which remains unexplained and which can possibly be due to sex discrimination and the
gendered evaluation of jobs. Furthermore, it seems to be generally recognized that part of the
solution lies in the need to further integrate women in the labour market and to equalize as
much as possible their experience of the labour market (Soumeli and Nergaard, 2002).
2.2 Women’s Work & Earnings in History
2.2.1 Pre Industrial Society
Women have contributed to the economy for ages although because of their other predominant
role as mothers and wives, their work history has been different in many ways from that of
men. In pre-industrial times, the world of work was not separated from that of the home.
Families as economic units worked either within the home or close to it and all the family
members including children and grandparents gave their share.
In the US, among the non-slave population, men were largely responsible for agriculture while
women did the rest. There were differences among women though. Slave women also worked
in the fields and single women were at times allotted ‘maid plots’. Widowed women were likely
to take over their late husband’s work. Wealthy women managed rather than worked in the
household. However despite these differences there was one thing which women commonly
shared. Together with their children they contributed to the household within a self-sufficient
economic system (Blau et al, 2002).
In Malta as in other countries, women had both caring and domestic duties as well as other
duties alongside their husbands. Especially in the rural areas of Malta and Gozo, women helped

Gender Pay Review
National Commission for the Promotion of Equality
Malta September 2006 page 50 of 327
in the fields and on farms. They also spun cloth and worked the lace. Especially during the
18th and 19th centuries, rural Maltese women made up the majority of spinners, weavers,
beaters and dyers within the cotton industry while men were involved only in the final stages of
the process. Unfortunately by the first decade of the 20th century the cotton industry died out.
This meant that Malta not only lost in terms of economic wealth but it also suffered the loss of
a skilled female labour force (Camilleri, 1997).
Wives and daughters also contributed to the family income by engaging in various activities
such as sewing, making socks, cotton hats and lace. Others made cane baskets as well as hats
from palm leaves. Those who did not work in the home, sold their wares on the streets or
worked at the harbour close to their husbands. Women, together with the rest of the family
were also involved in wine production both in the fields as well as in the pressing process.
Women’s harsh physical work also extended to the construction industry where women worked
as roof beaters for very long hours (Camilleri, 1997).
Despite the hard work and the significant contribution women gave both to the household and
to the economy, their earnings were lower than those of men although they were necessary for
the family upkeep. Yet women’s income alone was inadequate for women and their children to
live an independent life.
Another female-dominated occupation which involved long hours and poor working conditions
was domestic service. Here again women did not make much in terms of money but the little
they earned was crucial to their family. Domestic service was more common among young
women who were still unmarried and who were very often expected to live in the servants’
quarters of their employer’s house. This may partly explain these women’s lower earnings.
Like married women they were perceived as dependent, in this case on their family, not as
breadwinners (Camilleri, 1997).
2.2.2 Industrial Society
Industrialisation brought with it the separation of the workplace from the home. In the early
industrial period young, unmarried women (and children) were employed in the cotton and
textile mills but once they got married they normally returned to the domestic sphere to start a
family. Still the participation of women in the labour market was very low compared to that of
men. However, many women still earned some money from activities at home (such as taking
boarders or doing piecework) as well as on the farm. The lower percentage of married women

Gender Pay Review
National Commission for the Promotion of Equality
Malta September 2006 page 51 of 327
in the labour market was partly due to the marriage bars imposed from the late 19th century to
the mid 20th century as well as the lack of availability of part-time work (Blau et al, 2002).
Apart from the low labour market participation rates, another feature characterizing women’s
employment is occupational segregation. Men and women have traditionally performed
different tasks and occupied different posts. Women were concentrated in a small number of
fields. They were more likely to work in the service sector than men, especially in domestic
service. Others worked in manufacturing, especially textiles, clothing and tobacco while a few
others worked as school teachers or nurses. The rest performed clerical or sales work. It is
interesting to note that clerical work and teaching, two of the most female-dominated
occupations, were originally purely a male domain (Blau et al, 2002).
Research carried out by Goldin (1990 in Blau et al, 2002) provides a historical perspective of
women’s earnings in relation to men’s in the US. The evidence shows that since the beginning
of the 19th century earnings in agriculture and manufacture increased. Later data for all
economic sectors also show an upward trend with the ratio increasing from 0.46 in 1890 to
0.56 in 1930. Until the 1980, this ratio remained relatively stable although since then the ratio
has gone up to well over 0.70.
In Malta, industrialization did not start before the late 1950’s. Until World War II women’s
employment trends did not change much with the exception of a marked increase in the
number of school teachers. Also popular with women were retail jobs. During the war in Malta
as elsewhere, the role of women changed dramatically. Women who before (and after) the war
were expected to stay away from the male world of work and be content with minding the
house and the children, were urged to take on ‘male jobs’ to make up for the loss of manpower
resulting from conscription and war casualties (Camilleri, 1997).
In the years following the war and up to the beginning of industrialization the participation of
women in the labour market remained at a low of 17-20% of the working population. However
the expansion of the industrial sector in the 1970’s especially the textiles and clothing sector
attracted many women to the labour market (Darmanin, 1992). According to Briguglio (1977)
from the mid 1960’s to the mid 1970’s the number of gainfully employed women rose
significantly from 20% to 25% with the highest increase registered in the sub-period 1966-
1970. Women’s participation rate grew fastest in the private sector. However the rate of
women’s employment at the time was still below the target of 28.4% set in the seven–year
development plan for the period. It is unfortunate to note that the current participation rate is
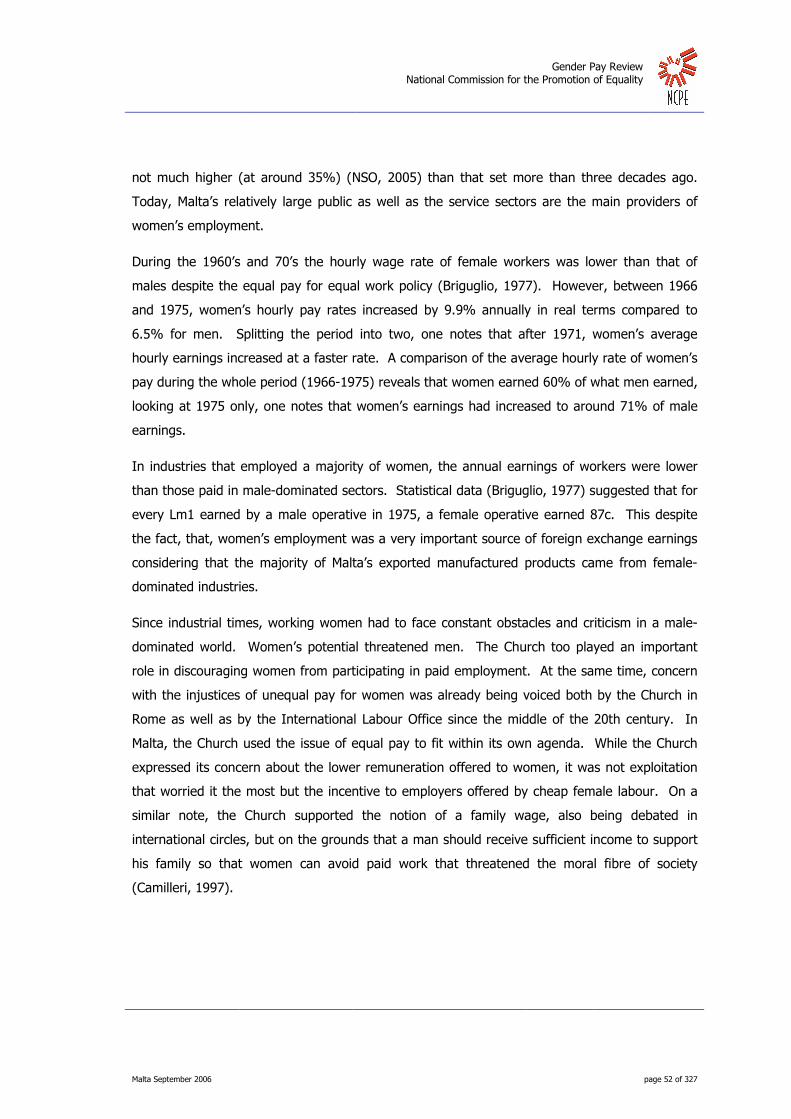
Gender Pay Review
National Commission for the Promotion of Equality
Malta September 2006 page 52 of 327
not much higher (at around 35%) (NSO, 2005) than that set more than three decades ago.
Today, Malta’s relatively large public as well as the service sectors are the main providers of
women’s employment.
During the 1960’s and 70’s the hourly wage rate of female workers was lower than that of
males despite the equal pay for equal work policy (Briguglio, 1977). However, between 1966
and 1975, women’s hourly pay rates increased by 9.9% annually in real terms compared to
6.5% for men. Splitting the period into two, one notes that after 1971, women’s average
hourly earnings increased at a faster rate. A comparison of the average hourly rate of women’s
pay during the whole period (1966-1975) reveals that women earned 60% of what men earned,
looking at 1975 only, one notes that women’s earnings had increased to around 71% of male
earnings.
In industries that employed a majority of women, the annual earnings of workers were lower
than those paid in male-dominated sectors. Statistical data (Briguglio, 1977) suggested that for
every Lm1 earned by a male operative in 1975, a female operative earned 87c. This despite
the fact, that, women’s employment was a very important source of foreign exchange earnings
considering that the majority of Malta’s exported manufactured products came from female-
dominated industries.
Since industrial times, working women had to face constant obstacles and criticism in a male-
dominated world. Women’s potential threatened men. The Church too played an important
role in discouraging women from participating in paid employment. At the same time, concern
with the injustices of unequal pay for women was already being voiced both by the Church in
Rome as well as by the International Labour Office since the middle of the 20th century. In
Malta, the Church used the issue of equal pay to fit within its own agenda. While the Church
expressed its concern about the lower remuneration offered to women, it was not exploitation
that worried it the most but the incentive to employers offered by cheap female labour. On a
similar note, the Church supported the notion of a family wage, also being debated in
international circles, but on the grounds that a man should receive sufficient income to support
his family so that women can avoid paid work that threatened the moral fibre of society
(Camilleri, 1997).

Gender Pay Review
National Commission for the Promotion of Equality
Malta September 2006 page 53 of 327
2.3 A Universal Pay Gap: An International Comparison & Its
Limitations
Unequal pay for men and women appears to be a universal phenomenon, at least in the
economically advanced countries. Women’s average earnings remain below those of men in all
countries although the evidence points to a general narrowing of the gap in the past few
decades. However, in all countries it appears that at present the trend is not for women to
continue bridging the gap between their earnings and those of men. Although women’s pay
disadvantage affects various categories of women, one notes that certain women tend to be
worse hit than others. Wage disparities particularly stand out between part-time and full-time
workers, the former being mostly female. The gap is also more pronounced among older,
better qualified workers and those occupying higher level occupations, while differences are
also pronounced between the public and private sectors of the economy (although certain
countries do not follow the general pattern of having a wider gender differential within the
private sector). Gaps are also wider in traditionally male-dominated sectors.
Other variations are noticeable when comparing different countries. Although women’s
earnings increased in all countries, the process did not take the same course everywhere.
Neither is the earnings differential the same in all countries with disparities ranging from below
5% to over 25%. Although one cannot possibly come to a common explanation for the varying
trends in different parts of the world, certain factors play an important role. These include
changes in wage structures, enforcement of anti-discrimination legislation laws and the better
qualifications of women (Blau et al, 2002).
2.3.1 A General Narrowing of the Gap
Data for a number of selected countries covering a 31-year span from 1967 to 1998 show that
in all countries women receive lower wages, although since the 1960’s the pay gap has also
narrowed in all countries (Blau et al, 2002). The data are used to compare the earnings of men
and women in non-agricultural jobs in Australia, France, Japan, West Germany, Norway,
Sweden, Switzerland, UK and the US. The 1995 European Structure of Earnings Study (ESES)
indicated that the earnings of women working in the service and industrial sectors on a full-time
basis in the European Union amounted to around three-fourths of what men earned. The
widest gap at the time was noted in the Netherlands and Greece while the greatest parity was
found in Belgium, Denmark, Luxembourg, Sweden and the former East Germany (Soumeli and

Gender Pay Review
National Commission for the Promotion of Equality
Malta September 2006 page 54 of 327
Nergaard, 2002). In a study published by Eurostat (2001) based on harmonized national
earnings statistics, it was found that the earnings of women had increased in relation to those
of men in most member countries but not significantly. While in Denmark, Ireland and Finland
the wage gap had remained stable throughout the 1990’s, in Austria, Portugal and Sweden it
had increased by one to two percentage points. One point made in the study is that in those
countries where the gap was widest in 1995, there was relatively little increase in the years that
followed. In central and Eastern Europe the gender pay gap was found to be similar across the
region as well as when compared to Western Europe. Since the fall of Communism the
earnings differential has narrowed although the gap varies across countries (Rangelova, 2002).
More recent data (Carley, 2005) suggest that in all EU countries, women still earn less than
men despite a general narrowing of the gap. However, there are still wide discrepancies
between countries. In the EU 15 and Norway, the largest difference is found in Austria (at
26%) and the smallest in Luxembourg (at 11%). Other countries where the gap is
comparatively narrow include Ireland, Norway, France and Denmark whereas in Portugal, the
Netherlands and Finland, the gap is still relatively wide. The average difference in earnings in
the EU 15 and Norway stood at 17.4%, slightly less than it was in 2003 (18.6%) when the data
were reviewed by the same author. Although consecutive data reviews carried out in previous
years show a slight annual decrease from the 19.2% in 2002 and the 20.4% in 2001, this could
partly be attributed to the sources of data since the drop is unlikely to be that significant over
such a short period. In fact, it has been noted that in countries where national data are
available for many years, these only indicate small decreases in the gender pay gap as in the
case of Belgium, Denmark, Finland, Ireland and the UK (Carley, 2005)
Among the new Member States, the country with the widest pay differentials is the Czech
Republic with a gap of 25.1% while Malta has the narrowest pay gap which stands at 3.6%,
making it the country with the highest gender parity in earnings in the whole EU. Other
countries with a comparatively narrow pay gap among the recently joined EU members we find
Slovenia and Hungary while Estonia, Cyprus and Slovakia still have a relatively wide pay gap.
Among the new Member States, the average differential is the same as that for the EU 15 and
Norway at 17.4%, with the average gap across all member states reading 17.5% (Carley,
2005).
Despite the fact that some progress has been registered in bridging the gender pay gap, it has
been observed that in countries with a relatively small gender gap, this was only achieved by a
small number of well educated women in the higher occupational positions. In others, the

Gender Pay Review
National Commission for the Promotion of Equality
Malta September 2006 page 55 of 327
greatest improvement was observed among clerical workers and those occupying elementary
jobs (Swepston, 2002). Swepston also notes that since there tends to be greater parity of
earnings within the public sector, layoffs in this sector are likely to have a negative impact on
women’s overall earnings in comparison to men who tend to earn higher salaries in the private
sector. Furthermore, narrower gender wage gaps may be masking women’s constraints to quit
the labour market (Swepston, 2002).
2.3.2 Variations Across Countries
Blau et al (2002) note that although the ratio of women’s to men’s earnings has increased in all
countries since the 1960’s, the rise did not occur at the same time. Neither did it reach similar
levels in all countries. For example in the US the ratio of median weekly earnings of full-time
workers rose to .77 between 1975 and 1993. Then it fell but regained its previous level again
in 1999. In Sweden the ratio increase occurred by the early 1980’s and remained stable from
then on at about .90, the highest among the countries examined. In other countries, women’s
earnings increased at an earlier phase, followed by a period of stagnation and a renewed
increase in recent years. Data from Australia shows that as a result of a policy of comparable
worth introduced in the 70’s, women’s wages increased rapidly. In Japan where the gap was
traditionally wider than in other countries, there is some indication of a recent upward trend.
Variations across countries feature within different sectors such as between the private and
public sector in each country as well as between the different economic sectors. In the EU-15,
the difference in earnings between men and women was generally smaller in the public sector
than in the private sector – reaching at EU-level 11% in the former compared to 22% in the
latter (7). In Italy, the wider gap in the private sector is perhaps most significant in the credit
sector (30%) and in the services to persons (25%), while a narrower gap features in sectors
that are more regulated, as exemplified by the transport sector (Paparella, 2005). The gender
pay gap (GPG) also varied with personal and job characteristics as well as across sectors and
occupations (European Commission, 2003).
7 According to data from the ECHP, the only exceptions are Finland, the Netherlands and Germany. In these countries, the gender pay
gap is of a similar magnitude in both public and private sectors, or, as in the case of Finland, even larger in the public sector.

Gender Pay Review
National Commission for the Promotion of Equality
Malta September 2006 page 56 of 327
2.3.3 Gap Widens Along the Work Cycle & Between Generations
For a number of reasons, women tend to start their career in lower paying jobs than those
occupied by men and then find it difficult to overcome their disadvantage throughout their
working life. In fact regardless of the initial pay differential, the gap widens in the course of
one’s work cycle (Dimas and Almunia, 2004). Furthermore, pay differentials are increasing from
one generation to another. A survey carried out in France by Le Minez and Roux in 2002 (cited
in Meilland, 2002) examined the pay paths of men and women from the first job onwards since
the 1970’s. In the 1970’s the pay gap for those entering the labour market for the first time
was 15% while in the 1990’s, women in their first job are likely to earn 22% less than men in
the same situation. Furthermore, these differences in earnings tend to increase throughout the
work cycle. The authors of the survey calculated an increase of 5% after 5 years in the labour
market. However, for workers who at the start of their career are equally qualified, work in the
same sector, company size and comparable region, the gap is narrower and has narrowed since
the 1970’s from 10.3% to 8.5%. Higher qualifications obtained by women explains, at least in
part, this trend (Meilland, 2001).
2.3.4 Age & Qualifications
Evidence suggests that wage gaps perhaps widen in moving from lesser skilled occupations to
professional and senior occupations. According to the National Council of Women Malta (NCW,
2002), the top 10% of female wage earners in the EU receive on average 35% less than the
top 10% male wage earners while women who make up the bottom 10% of female employees
earn 15% less than the males. The gap is notably high among older workers, those having
higher skills and those occupying supervisory positions (Dimas & Almunia, 2004). It is also
evident among high earning professionals (Wood, Corcoran and Courant, 1993; Swepston,
2002).
A report on gender pay differentials in Italy also supports this observation, where, according to
Paparella (2005) the gap increases with age, education and qualifications. The study
established that a much smaller gap among younger workers (5-7%) prevailed than among
40-year olds (20%) and among the over 40’s (25%). The study also indicated that among
those with a tertiary level of education the wage gap was 10% higher (at 30%) than among
those with middle education levels. The reason given for this was the different courses typically
followed by males and females with a concentration of women in the humanities and arts and a
higher representation of men in technical and scientific courses. However, women and men

Gender Pay Review
National Commission for the Promotion of Equality
Malta September 2006 page 57 of 327
having similar vocational qualifications still receive unequal earnings, with a wider gap at
higher-level jobs. In Italy, between 1998 and 2002 the salary of female managers equated to
35% less than that of male managers while for middle managers with the same qualifications
the gap was narrower at 25%. The gap among blue- and white-collar workers was even lower,
estimated at 15-20%. In Canada, highly educated women have a lower income than those with
an adequate level of education whereas women with a lower educational level earn more than
adequately educated women. For men no significant differences were noted (Drolet, 2002).
Comparing the median income of two age cohorts of full-time workers in the US in 1993,
Beeghley (1996) notes that the earnings of women in the younger age cohort (25-34) are
closer to those of men (89%) than the earnings of the older group (45-54) who earn 61% of
what men earn. It is also shown that women in the second group who are at the peak of their
career also do not earn much more than those at the beginning of their career. This suggests
that:
� the position of women in the labour market improved due to factors such as education and anti-
discrimination legislation, and
� women in the second group had probably interrupted their career and suffered more from
discrimination.
2.3.5 The Impact of Part-time Work
Pay inequalities increase with age (Paparella, 2005) because of the concentration of women in
atypical or precarious employment. While for men atypical employment is very often a
temporary phase, women tend to remain in such jobs for longer periods. This tends to widen
the pay gap even between men and women from the same age group and having similar
qualifications. It is pertinent to note that while female participation in the labour market
increased, the rise in female employment has been most significant in the service sector where
precarious, flexible and low-paying jobs are more likely to be found. That part-time employment
is one of the major reasons behind lower earnings has been documented by a number of
studies (e.g. Drolet, 2002; Meilland, 2001; Camilleri, 1997).
Comparing the hourly earnings of full-time and part-time employees, Smith (2003) found that in
certain countries such as Germany, Spain, Luxembourg and Sweden, the gender pay gap is the
same. This implies that in these countries the number of hours worked is a more important
element than gender in determining wage differentials. In other countries, there is a higher

Gender Pay Review
National Commission for the Promotion of Equality
Malta September 2006 page 58 of 327
gender pay gap among full-timers than among part-timers while in a few countries, namely
Austria, Spain and France, there are significantly greater gender pay disparities among part-
timers than among those in full-time employment. In Denmark, Finland, Belgium and Greece,
gender pay inequalities among part-timers is relatively small, suggesting that if men were to
work on a part-time basis, their pay would not be different from that of their female
counterparts. However, Smith does not believe this to be the solution. Comparing the hourly
earnings of female part-timers with those of male full-timers, gives a clearer indication of the
impact of women employed on a part-time basis. The ratio highlights the very large difference
that exists in the pay of female part-timers and male full-timers.
2.3.6 International Comparisons: Challenges
According to an EIRO comparative study (Soumeli & Nergaard, 2002), in most EU countries and
Norway, pay statistics are collected regularly and the main findings are made accessible to the
public. In many countries, detailed national studies on gender pay differentials have also been
carried out. However, there are certain difficulties when one tries to make international
comparisons, largely arising from:
� variations that can be traced to the statistical sources, and
� the methodology involved in the compilation and computation of statistics.
A number of countries do not have data related to the differences in earnings between men and
women for the whole economy, largely as a result of the pertinence of data to sub-groups of
workers. This is also the case in certain countries such as Norway and Germany, and until
recently also Denmark and Sweden, where sectoral statistics (including statistics on the wage
gap) have been available for many years.
Other difficulties arise from whether earnings are calculated on an hourly, weekly, monthly or
annual basis. For example, the data analysed by Blau et al (2002) are for hourly wages for all
countries except for those pertaining to Japan and the US. Data for Japan refer to weekly
earnings and for the US the data pertain to monthly earnings. For a number of reasons, the
earnings ratio calculated on a weekly, monthly or annual basis is higher than when hourly
earnings are taken into consideration.
Another question concerning the validity of gender pay statistics is the absence of certain
groups (especially those which are female-dominated and low paid) such as part-time

Gender Pay Review
National Commission for the Promotion of Equality
Malta September 2006 page 59 of 327
employees. In certain countries data incorporate only full-time employees. This leads to an
underestimation (or possibly the reverse) of the gender pay gap. According to Soumeli and
Nergaard (2002) if part-time employees were included in earnings statistics, the gender pay
gap would rise by 1% to 3% in most countries.
Other difficulties arising from the comparison of data involve the way wages are defined in
different countries e.g. it may not include certain allowances. There are also variations in the
way tax and benefit systems operate in different countries. Using data from the European
Structure of Earnings Survey (ESES) and the European Community Household Panel (ECHP)
Smith (2003) notes that although the lower hourly earnings of women are evident in all
countries, there are some differences between sources. For example, in the case of Germany,
there is a difference of 15 percentage points between the ECHP and the ESES due to tax
deductions. This puts into question comparative studies which base their conclusions on net
earnings data. When comparing annual earnings data, it should also be noted that these may
vary according to the number of hours or days worked.
Considering these limitations one can only note and compare general trends across countries.
At the same time, Soumeli and Nergaard (2002) feel that despite the shortcomings, the general
impression is that wage statistics are considered as being fairly representative of the existing
pay gap.
2.4 The Maltese Setting
For a number of years, gender equality in the labour market featured in the agenda of Maltese
social policy makers. With the intention of strengthening women’s social and economic
conditions, different government administrations implemented a number of positive steps over
the past years, exemplified by (8):
8 In January 2004, the National Commission for the Promotion of Equality for Men and Women (NCPE) was established by the
coming into force of the Equality for Men and Women Act (2003). The new Commission incorporated the former National
Commission for the Advancement of Women and the Department of Women in Society. This was accompanied by a shift in
focus from one based on women’s rights to one based on gender mainstreaming and ensuring that women and men have
equal opportunities. Among its duties, the Commission is responsible for identifying, establishing and updating national
policies dealing with gender equality; for addressing the problem of gender discrimination and for the promotion of gender
equality. A central concern to the NCPE is that women and men are given equal opportunities in employment with regards
pay, training, promotion as well as in advertising for posts (NCPE, 2005).

Gender Pay Review
National Commission for the Promotion of Equality
Malta September 2006 page 60 of 327
� the elimination of the marriage bar (which prohibited married women to continue working upon
marriage);
� the introduction of parental leave for government employees;
� the possibility of working flexible hours in a number (albeit small) of work places, as well as
� the commitment of the Employment and Training Corporation to encourage and promote gender
mainstreaming specifically laid out in its two consecutive Action Plans focusing on gender equality
(2002, 2005).
A series of legislative changes over the past few years, largely driven by Malta’s obligation as an
aspiring EU member to bring its legislation conformant with the EU’s acquis communautaire by
the beginning of 2003, are further evidence of the government’s commitment to enhance
gender equality. The two most important legal instruments enacted within a short time of each
other and both are concerned with making the labour market a more equitable environment
comprised:
� The Employment and Industrial Relations Act (that came into force towards the end of 2002), and
� the Equality for Men and Women Act (passed in 2003).
Statistical data for Malta regarding gender pay differentials is not abundant. A vast amount of
information is available on the internet pertaining to the EU before the enlargement process
took place in 2004 while data on the enlarged EU including Malta is, as expected, more
restricted. Furthermore, reports that relate to most of Europe often exclude Malta as data was
largely unavailable. This renders comparative analysis a challenging task. A case in point is a
report by Hans-Joachim Mittag (2002) on earnings in Europe, presenting survey data from 28
countries in Europe including all EU countries except Malta. These aspects suggest a reliance
on local data, mainly that supplied by the NSO.
In Malta, the difference in earnings among men and women witnessed an improvement over
the past years when it declined from 11.1% in 2000 to 4.6% in 2005 (9) - a noticeable drop of
5.6 percentage points. Data segmented by economic sector also indicates noteworthy
improvements in private sector earnings difference over the period under review. Labour Force
Survey annual averages for employment and earnings figures within the public and private
9 Employment figures include persons who are in full- and/or part-time employment. Quarter 2 data for 2005 LFS data were taken.

Gender Pay Review
National Commission for the Promotion of Equality
Malta September 2006 page 61 of 327
sector show that difference in earnings in the private sector between men and women dropped
from 14.2% in 2000 to 6.9% in 2005; while that in the public sector declined from 2.6% in
2000 to an almost negligible situation in 2005. Differences in earnings according to economic
activity also present a similar setting. A noteworthy improvement within the industry and
services segments (10) is evident as wage gaps improved from 19.8% in 2000 to 10.1% in 2005
(a drop of 9.7 percentage points); while the gap in the services sector improved from 9.4% in
2000 to 6.1% in 2005 (a drop of 3.3 percentage points) (NSO, 2000-05).
Figure 1 - Difference in Earnings for Men & Women In Malta Among Major Occupational Groups (11)
-10.0 -5.0 0.0 5.0 10.0 15.0 20.0
Legislator, Senior Officials & Managers
Professionals
Technicians & Associate Professionals
Clerks
Service Workers & Shop & Market
Sales Workers
Plant & Machine Operators &
Assemblers
Elementary Occupations
Major Occupation Groups
Percentage Difference in Earnings
2000
2001
2002
2003
2004
2005
Figure 1 sets out the difference in earnings for men and women according to the respective
occupational groups (12) of employees. One can correctly argue that under each occupation
10 Data concerning the Agricultural sector was under-represented and so no analytical information could be derived.
11 Source: NSO – Labour Force Survey yearly averages for 2000-2004, and Q2 2005
12 In this data analysis, occupations relating to Armed Forces; Skilled Agriculture & Fisher workers; and Craft and related workers could
not be analysed due to under-representativeness in women data.

Gender Pay Review
National Commission for the Promotion of Equality
Malta September 2006 page 62 of 327
group, one is clustering different (although related) occupations that represent a wide array of
working conditions, different educational attainments and varying years of service (due to
career breaks and loyalty).
These differences give rise to observed variations in earnings when analysing data by
occupation. Over the period under review, some occupations observed both an improvement as
well as deterioration in their earnings difference for men and women.
As observed in the European Commission report (2003), men were both more concentrated in
higher paid sectors and occupations and more likely to hold supervisory responsibilities within
these sectors and occupations. This is also evidenced in the Maltese scenario where the largest
observed gaps are in the highly paid occupations. The only occupational group that registered
a deterioration during the period under review is the Legislators, Senior Officials and Managerial
group, where the difference in earnings fluctuated from 5.6% in 2000 to 11.2% in 2005 (Table
1). The most noticeable improvement was in the Plant and Machinery Operators and
assemblers group where a drop of 13.4 percentage points was registered. The Service
Workers, Shop and Market Sales Workers group remained stable with an earnings difference of
14.5%. However, as illustrated in Figure 1, all occupational groups experienced a fluctuation in
the earnings difference over the period under review.
Table 1 – Gender Pay Gap Trends in Malta (13)
11.73.214.9Elementary Occupations
13.46.119.5Plant & Machine Operators & Assemblers
0.014.714.7Service Workers & Shop & Market Sales Workers
12.40.512.9Clerks
13.11.414.5Technicians & Associate Professionals
5.03.78.7Professionals
-5.611.25.6Legislator, Senior Officials & Managers
Change20052000Occupation Group
2.5 Pay Equality Legislation
In many countries, there is existing legislation against pay discrimination on the basis of sex
while a number of countries, including Finland, France, Germany, Greece, Italy, the
13 Source: NSO – Labour Force Survey yearly averages for 2000 and Q2 2005

Gender Pay Review
National Commission for the Promotion of Equality
Malta September 2006 page 63 of 327
Netherlands, Portugal and Spain have this enshrined in their respective constitutions. In all EU
countries, national legislation prohibits direct and indirect pay discrimination on the grounds of
sex and considers pay discrimination as any form of (prejudicial) pay differentiation that cannot
be objectively justified. Furthermore, the law in various countries provides for pay equality for
work of equal value. In a few countries, most notably France and Sweden, legislation of a
‘proactive’ type enacted, making it obligatory for employers to show evidence of their efforts to
implement the concept of equality at their place of work (Soumeli & Nergaard, 2002).
Minimum wage legislation, which does not exist in all EU countries, is also considered to be an
effective tool in protecting women against wage discrimination. Soumeli and Nergaard (2002)
cite evidence from Ireland that since the introduction of a national minimum wage (NMW) in
2000, the gender wage gap narrowed since women formed part of a large group of low-paid
workers who earned less than the minimum wage when it was established. A 2000 report from
Sweden cited by the same authors also links NMW legislation to the prevention of pay
discrimination claiming however that this also depends on the level at which it is set. If the
minimum wage level is too low, this will not significantly effect the wage gap. Similarly, in the
UK, the authors claim that a strong relationship has been reported between the introduction of
the NMW and the narrowing of the gender pay gap claiming that women were twice as likely to
be affected as men. This aspect is considered to be a direct result of women’s occupying
lowest paying jobs, being heavily concentrated in part-time work. These findings provide a
stark contrast against the conclusions established by Robinson (2002) in a study involving
Labour Force Survey data for the period 1993-2000 in an attempt to establish the impact of the
introduction of the national minimum wage in Britain on the gender pay gap. Robinson
revealed that although the pay gap narrowed, it did not do so uniformly across the different
regions. The study also revealed that the pay gap was not significantly affected by the
introduction of the National Minimum Wage – although the latter, being introduced in April
1999, might have not had the time to establish an effect by the time this study was conducted.
In many countries the law makes it possible for victims of discrimination (which still exists
despite the legislation) to sue their employer, albeit the method varies from one country to
another. In many countries the law also provides for the setting up of equal opportunities
bodies although in many cases these bodies only have consultative and advisory roles.
However, in spite of this, it is only a relatively few cases that are presented to the courts largely
due to the length of time it takes for cases to be resolved. Yet, the role of the courts as a
means of fighting against pay discrimination of the basis of sex should not be dismissed as

Gender Pay Review
National Commission for the Promotion of Equality
Malta September 2006 page 64 of 327
ineffective – there have been successful cases both in individual countries as well as at EU level
that encouraged employers to change their practices (Soumeli & Nergaard, 2002).
The International Labour Organisation is committed to securing equal pay for working men and
women since its foundation in 1919. Indeed, the original text of its constitution attributes a
special importance to this principle, which was confirmed by its inclusion in ILO Convention
No. 100 on Equal Remuneration (1951) as well as into the UN Convention on the Elimination of
all forms of Discrimination against Women (1979). Both the Copenhagen Programme of Action
and the Beijing Platform for Action continued to demonstrate and reiterate the importance of
the concept and in both cases, all States were urged to ratify and apply Convention No. 100.
By the beginning of the 21st century, it occupied second place among the international labour
standards that are among the most highly-ratified of all international standards safeguarding
human rights. All European countries that are members of the ILO ratified the Convention
(Swepston, 2002).
Nowadays, as a result of equality legislation in many countries, rates of pay for women are not
different from rates of pay for men doing the same work and occupying the same grade (at
least on paper). However, the same cannot be said to have been achieved regarding work of
equal value. Equal remuneration for work of equal value implies that some comparison has to
be made between different jobs performed by men and women, and, that corresponding rates
of pay are established without discrimination on the basis of sex. Although neither the ILO
Convention nor European treaty law defines ‘value’ specifically, it refers to ‘the worth of the job
for purposes of computing remuneration’ (Swepston, 2002). Although the Convention does not
restrict the application of the concept to a methodology of comparable worth, it does suggest
that market forces should not be the only determining factors but that systems of job appraisals
be used to measure the ‘worth’ of the job. The concept of comparable worth involves an
administrative element of the job value rather than an economic one, wherein only the forces of
supply and demand determine value.
Furthermore, the Convention suggests that the principle of equal pay for work of equal value
may be put into practice through a variety of means including:
� National laws or regulations;
� Legally established or recognised methods for establishing wages;
� Collective agreements;
� A combination of means.

Gender Pay Review
National Commission for the Promotion of Equality
Malta September 2006 page 65 of 327
The Convention also highlights the importance of the co-operation of the social partners within
each country in implementing the principle of equal pay for work of equal value (Swepston,
2002).
As an ILO member, Malta is covered by the ILO Declaration on Fundamental Principles and
Rights at work 1998 and its follow-up. This requires that Malta be committed to respect,
promote and materialise a set of important principles and rights. Malta is signatory to various
ILO Conventions, the most pertinent to the issue of gender parity in employment and earnings
being Convention No. 100 (1951, ratified in 1988) and Convention No. 111 (1958, ratified in
1968) that is concerned with ensuring equality of employment opportunity and conditions of
work regardless of gender. In 1976 the principle of equal pay for equal work became
universally applied to all workers and differentiated wage scales for men and women were
abolished (Article 14 of the Constitution). Furthermore, the Maltese Constitution was amended
in 1991 to prohibit any form of discrimination on the basis of sex when the UN Convention on
the Elimination of all Forms of Discrimination Against Women was ratified (ETC, 2002).
Of direct relevance to the issue of gender equality is the Equality for Men and Women Act
(2003). Apart from being responsible for the setting up of the National Commission for the
Promotion of Equality, the law protects workers against discrimination by employers on the
basis of sex or family responsibilities. It also stipulates (among other things) that the
differential treatment of women and men in terms of work management, promotion, task
distribution and working conditions is unlawful (ETC, 2005).
Undoubtedly, a very significant piece of legislation concerning the position of working women
and men is the Employment and Industrial Relations Act (Act 22 of 2002), enacted at the end of
2002. This law incorporates revised parts of the two former labour laws that it replaced i.e. the
1952 Conditions of Employment (Regulations) Act and the 1976 Industrial Relations Act and
transposes a number of essential features of the EU Social Policy Regime as set out in a number
of Directives. Among the numerous issues addressed, this Act aims to deal with the gender pay
gap in the labour market by providing for equal remuneration not only for equal work but also
for work of equal value (EU Directive 75/111) (Baldacchino, 2003). Part IV of the Employment
and Industrial Relations Act of Malta (2002) also provides for protection against discrimination
related to employment.

Gender Pay Review
National Commission for the Promotion of Equality
Malta September 2006 page 66 of 327
Under Article 27, the law stipulates that:
‘Employees in the same class of employment are entitled to the same rate of remuneration
for work of equal value. Provided that an employer and a worker or a union or workers as a
result of negotiations for a collective agreement, may agree on different salary scales,
annual increments and other conditions of employment that are different for those workers
who are employed at different times, where such salary scales have a maximum that is
achieved within a specified period of time; and provided further that any distinction between
class of employment based on discriminatory treatment otherwise than in accordance with
the provisions of this Act or any other law shall be null and of no effect’.
Article 30 of the law also provides for recourse to the Industrial Tribunal in cases unfair job
evaluation resulting in unequal pay for work of equal value. According to the law:
‘A person who alleges that the employer is in breach of, or that the conditions of
employment are in breach of [article 27…..], may within three months of the alleged breach,
lodge a complaint to the Industrial Tribunal and the Industrial Tribunal shall hear such
complaint and carry out any investigations as it shall deem fit. If the Industrial Tribunal is
satisfied that the complaint is justified, it may take such measures as it may deem fit
including the cancellation of any contract of service or of any clause in a contract or in a
collective agreement which is discriminatory and may order the payment of reasonable
sums of money as compensation to the aggravated part’.
However, pay equity laws are not in themselves sufficient to close the gender pay gap.
Research conducted by the European Commission evidences, in particular, the complex nature
of gender equality and gender gaps in labour markets as multi-faceted social and economic
phenomena, including the working of education and training, job classification and wage
formation systems as well as social norms and traditions. Specifically, no clear borders exist
between composition effects and remuneration effects, while selection effects tend to
complicate analysis.
Over the past two decades, the increase in women’s accumulated labour market experience and
their movement into higher-paying occupations played a major role in increasing women’s
wages relative to men’s. Change in family status, in industry structure and in unionisation also
contributed to narrow the gender pay gap, while increasing economic benefits from skills and
increasing wage inequality would have, by themselves, widened the pay gap. In addition, the
decrease in the pay gap that remains ‘unexplained’ after controlling for measured differences

Gender Pay Review
National Commission for the Promotion of Equality
Malta September 2006 page 67 of 327
between men and women has been a large contributor to the narrowing of the pay gap
(Council of Economic Advisors, 1998).
2.6 Explaining Gender Differentials in Pay
Despite gender equality and equal pay legislation, disparities in the income of women and men
persist. Numerous research attempts tried to establish the factors that determine the unequal
earnings of men and women to the detriment of the latter. It is understandably not easy to
single out a number of features for policy makers or other concerned authorities to tackle such
aspects since a persistent gender pay gap is a multi-faceted issue that baffled politicians,
worker representatives, academics and gender equality organisations alike for many years. Pay
inequity between women and men is the result of a variety of factors, including:
� women being less qualified,
� occupational sex segregation with women being clustered in certain occupations and economic
sectors;
� over-representation of women in lower paid professions (Grimshaw and Rubery, 2001),
� women being mothers (Budig and England 2001),
� concentration of women in part-time employment (Joshi & Paci, 1998) as well as
� occupational discrimination (Harkness, 1996; Joshi & Paci, 1998).
The causes for inequalities in earnings pertain both within and outside the labour market. Many
of the hurdles that challenge the achievement of equality relate to both to the occupational as
well as the general circumstances of women and men in society. Traditionally women have
been the home-makers and carers in the family, and, despite the social and cultural changes we
witnessed in the last decades of the 20th century, many still associate the woman primarily with
the home rather than with the workplace. As a result, women are still very often regarded as
secondary wage earners; as not worth the investment in training and promotions; and as not
performing work of equal worth as that of men. Consequently, women occupied lower-paid
jobs at the start of their work trajectory and normally found it hard to enhance their earnings
along their career path.

Gender Pay Review
National Commission for the Promotion of Equality
Malta September 2006 page 68 of 327
2.7 Women’s Familial Constraints & Their Impact on Labour
Market Patterns
2.7.1 Constrained to Interrupt their Career
Research by the Economic and Social Research Institute (ESRI, 2000)14 suggests that
approximately three-quarters of the current wage differential between women and men can be
explained by variations in their labour market participation in terms of age and
experience/length of service.
‘About three quarters of the gap between men’s and women’s hourly wages can be attributed to the fact
that women, under current social and economic structures, typically spend less time in labour market than
men and more time as carers in the home’.
According to ESRI, the average female employee has worked for 12 years in the paid labour
market, as against 18 years for the average male. Of the factors influencing the labour market
participation levels, the ESRI data show that it is the arrival of children that is a crucial
determinant. Many women leave the workplace to look after children and to perform other
caring responsibilities. The lack of high-quality, affordable childcare facilities means that in
many cases they are left with little choice.
Paparella (2005) confirms this, claiming that both work experience and the length of service are
key factors influencing the gender pay gap. Reviewing a number of recent reports carried out in
Italy concerning gender pay differentials, he concluded that the persistent gap in earnings
between women and men of the same age, with the same education and level of qualifications
is due to women taking maternity and childcare leave, working fewer hours and having lower
individual bargaining power, along with the absence of a gender mainstreaming policy in the
workplace.
Women’s periods of absence from paid employment due to maternity leave, care of children
and dependents as well as an earlier retirement age leave a significant impact on their seniority
level as opposed to that of men who are more likely to have an uninterrupted career. It has
been shown (Budig and England, 2001) that both in the US and the UK working women’s
14
ESRI forms part of the European Foundation for the Improvement of Living and Working Conditions, Ireland

Gender Pay Review
National Commission for the Promotion of Equality
Malta September 2006 page 69 of 327
earnings are reduced upon becoming mothers while those of men are either unaffected or
increased. Very often women return to a job with lower status and pay after having children.
The study reported a wage penalty of about 7% per child which is suffered by young American
women although one third of this reduction could be attributed to past work experience and
seniority especially if women worked on a part-time basis. The remaining two-thirds, according
to the authors, could be due to working mothers being less productive due to tiredness but also
to discriminatory practices by employers.
2.7.2 Constrained to Reject Opportunities for Extra Income
Due to their particular circumstances especially their family responsibilities, women tend to opt
for jobs which enable them to combine their occupational and domestic duties in an effective
way. Therefore they tend to be found in jobs which require them to work less overtime; where
there is relatively little skill loss and human capital depreciation due to career interruptions
(Swepston, 2002). They also tend to feel compelled to pass opportunities which enable them
to earn extra income. Evidence from Canada (in Drolet, 2002) suggests that in high
performance work systems (HPWS), workers receive a higher pay due to the wider range of
tasks performed as well as because of stronger interpersonal skills. A central feature of HPWS
is participation in self-directed work groups which provide an opportunity for participants to
earn a higher pay. Women tend to participate less in these work groups. They are also less
likely than men to have their pay tied to performance. Parent (1999 in Drolet, 2002) found that
women are disadvantaged when it comes to performance based incentives because they are
constrained by family responsibilities. The Canadian Workplace and Employee Survey (1999)
indicated that although 59% of women worked in firms that offered incentives for
supplementary earnings, this did not result in a significant difference in the extra compensation
received by men and women (30.1% and 27% respectively).
2.7.3 Constrained to Opt for Flexible or Part-Time Work
The gender pay gap is intricately linked to men and women’s different patterns of working, both
in choices of job, and, in employment participation history, including their concentration in
flexible and part-time working (Walby & Olsen, 2002; Warren et al., 2001). While it is
acknowledged that there are distinctions between flexible working and part-time working
(Parker & Allen, 2001), here they are considered together, since part-time work is viewed as
one type of flexible working (Smithson et al., 2004).

Gender Pay Review
National Commission for the Promotion of Equality
Malta September 2006 page 70 of 327
Women are more likely than men to enter the world of work for the first time through part-time
employment that is generally paid less than full-time employment – an augmenting trend over
the past years. Women are also more likely (than men) to remain in part-time employment for
the rest of their working life or for a longer period of time (Meilland, 2002, 2001; Paparella,
2005). The change in organisational culture, specifically the long working hours culture,
contributes towards the crowding of women in part-time employment, as many women are
‘unable to choose to work full-time because of the open-ended nature of the commitment’
(Grimshaw & Rubery, 2002).
Smithson et al. (2004) established that loss of salary and status was sometimes seen as an
acceptable trade-off for flexible working conditions. Besides, as flexible working conditions
usually included giving up expectations for promotion, moving to a less ‘well paid’ job or
working fewer hours, there was a clear impact on both current and future salary. However
people’s `choices’ are shaped by their perception of their options, structured by the socio-
economic context, state policies and other social institutions (Dex, 1988; Pfau-Effinger, 1998;
Rose, 1994). Women’s choices have often been constrained by the need to provide family care.
However, men’s choices are also constrained by organisational and social assumptions about
gender, bread-winning and flexible working.
Part-time work tends to offer lower levels of pay when compared to full-time employment
largely due to labour market discrimination rather than to an inferior part-time labour supply.
Part-time workers continue to be disadvantaged due to the marginalisation of part-time work
within organisations and to the unequal access of part-timers to certain benefits (Grimashaw &
Rubery, 2001). Anderson et al. (2001) demonstrate that the difference in pay for women
working part-time, compared to women and men working full-time cannot be explained on the
basis of human capital variables, suggesting that one possible explanation for this is that
employers believe that part-timers give a `lower return on investment’. In other words, some of
the pay gap is attributable to assumptions about part-timers being less productive.
A number of other studies demonstrated that part-timers earn less than full-timers after
controlling for human capital and job characteristics (Anderson et al., 2001; Blank, 1990; Paci et
al, 1995). This is partly attributable to having fewer prospects for career advancement and
restricted access to training (Arulampalam & Booth, 1997). Smithson et al. (2002) suggest that
the notion that `part-timers’ and those working flexibly are not promotable is taken as obvious
by most labour market participants. The problem of part-timers’ lack of promotion opportunities
is explicitly linked to notions about part-timers being family- rather than career-oriented.

Gender Pay Review
National Commission for the Promotion of Equality
Malta September 2006 page 71 of 327
Therefore it is not the amount of time and commitment given to the organisation that is
considered but their supposedly lack of commitment towards the organisation. In consequence,
part-time and flexible workers face discrimination not for the amount or quality of work they
produce, but for perceptions of commitment and orientation based on gendered evaluations.
Recio (2001) provides evidence that gender is still an important factor in maintaining lower
earnings among part-timers in Spain. He claims that while part-time employment rates are in
most cases lower than full-time rates in the same job category, the difference is greater among
women than it is for men (17% against 8%). Besides, most women did not choose freely to
work part-time but were constrained either by the characteristics of the job or because they
could not find full-time employment.
It is noted in a number of studies (Smithson et al., 2004; Stokoe & Smithson, 2001; Stringer &
Hopper, 1998) that while researchers and writers of official documents use gender-neutral
terms in their reports, very often the gender-neutral talk about flexible working, routinely
becomes talk about female workers. Studies demonstrate that most part-time and flexible
workers continue to be women. Although it has been suggested (Anderson et al, 2001) that
the increase in flexible work may help to reduce the gender pay gap by allowing women to
combine working with caring responsibilities more effectively, this has not in fact happened.
Flexible work policies do not, in themselves, succeed in increasing gender equity in the
workplace (Sirianni & Negrey, 2000; Warren, 2001; Whittock et al., 2002). Indeed, it is argued
that they are `a means of avoiding more basic changes in the relationship between women and
men’ (Scott, 1999) since they enable women to enter the labour market but still maintain their
responsibility for unpaid caring work (den Dulk et al., 1996). Flexible working can therefore
lead to increased gender inequity, as women take on lower-paid and part-time work to fit with
caring commitments (Jacobs, 1999; Whittock et al., 2002). Tam (1997) notes that `part-time
work constitutes a trap that lowers women’s lifetime employment prospects and earning’.
Flexibility and part-time working have thus been credited with the ability to widen, and to
narrow, the gender pay gap, depending on who is working flexibly, why and how.
Rather than finding ways for women to better manage the `double shift’ of paid work and
unpaid work, some approaches aim to change working patterns for both men and women,
breaking down the breadwinner/carer dichotomy that underpins the pay gap (Crompton, 1999).
Such approaches suggest an increase in flexible and part-time working for men as well as
women, together with a corresponding increase in men’s contribution to domestic work and
Gender Pay Review
National Commission for the Promotion of Equality
Malta September 2006 page 72 of 327
parenting (Duncan, 1996; O’Reilly & Fagan, 1998). Flexible working needs to be ‘normalised’
so that people using it are not seen as ‘time deviants’.
2.7.4 Inequalities for Life
Not surprisingly, the injustices suffered by women from the time they take up their first job,
stay with them not only during their career but also persist into their retirement as, for a
number of reasons, women receive a lower pension than men. A study carried out by the
Ministry for Social Affairs in France in 2002 demonstrated that women’s pension typically stood
at 42% of men’s. The pensions were calculated by taking into consideration the length of
contribution period, the pay level or non-wage income subject to pension contributions, and,
the particular pension scheme (France does not have a uniform pension system). The study
also found that although the gap tends to narrow with age (women are more likely to receive
survivor’s benefits) there still remains a significant difference due to the different career paths
taken by men and women (Meilland, 2002).
The structural, poverty and social exclusion indicators published by Malta’s National Statistics
Office in 2002 do not refer directly to pensions. However, comparing the at-risk of poverty rate
of men and women by age, it is evident that in Malta, within the 65+ age group, women’s rate
of at-risk of poverty in 2000 stood 2% higher than that for men while for the EU 15 (1998) it
was 5% higher for women. In all new EU Member States (along with Malta), the at-risk of
poverty rate for women aged 65+ is higher than men’s rate, reflecting women’s lower income
both outside and inside the labour market when they were younger.
Gender Pay Review
National Commission for the Promotion of Equality
Malta September 2006 page 73 of 327
3 Work for Men & Women
3.1 Occupational Segregation
Occupational segregation, both horizontal and vertical (Hakim, 1979), leads to the
concentration of women in certain occupations and this affects their wages in a direct way by
limiting them to lower-paid jobs and in an indirect way by excluding them from certain
occupations. In Eastern Europe for example, the increase in the wage differentials between
men and women, according to a recent UN/ECE report, is largely attributed to the widespread
labour market segregation (NCW, 2002).
In the US, various studies have shown that occupational segregation levels exceeded 60%
throughout the 20th century. It was only in the 1970’s that it started to decline although it
remains significant (Blau et al, 2002). Research suggests (Beeghley, 1996; Blau et al, 2002)
that since the 1970’s the proportion of women increased in many occupations especially in
those that offer high status and pay. As a result, presently women are less segregated from
men than they were in the past. However, despite these shifts, occupational segregation
persists.
Women tend to be concentrated in certain occupational sectors performing particular jobs
(horizontal segregation) that tend to offer lower financial rewards than those dominated by
men. They also tend to have less access to higher status and more financially rewarding jobs
(vertical segregation) even within female-dominated fields. They are also less likely to occupy
positions that offer opportunities for extra pay through overtime, merit and seniority. Women
tend to concentrate in the public sector especially in the health and educational sectors as well
as in clerical, cleaning and sales occupations. Research also suggests that many of these
occupations are a replication of some aspect of women’s traditional role of home-makers (Coyle
& Skinner, 1998; Crompton & Sanderson, 1990; Deguara, 2002; Swepston, 2002). Drolet
(2002) argues that the concentration of women in particular occupations, companies or sectors
has a negative impact on women’s earnings. Jobs and sectors that are traditionally
female-dominated tend to offer lower earnings than those dominated by men. However, the
Canadian studies she reviews do not provide a conclusive measure as to the proportion of the
gender pay gap which can be explained by job segregation.

Gender Pay Review
National Commission for the Promotion of Equality
Malta September 2006 page 74 of 327
Bergmann’s (1974, in Blau et al, 2002) overcrowding model links occupational segregation with
occupational discrimination. She argues that regardless of the reasons behind occupational
segregation (such as personal choice or social pressure), this may result in lower earnings for
women. Women tend to overcrowd in female occupations either out of preference or because
they have no alternative, but there is evidence that female overcrowding lowers wages. This
occurs especially when supply is much bigger than the demand for such jobs. Nevertheless, the
overcrowding model does not explain why women are attracted to these jobs and why
employers tend to discriminate against women in certain occupations and not in others.
While occupations with a strong female concentration tend to offer lower rates of pay for both
women and men, men’s earnings in these female-dominated camps still tend to be higher
(Dimas & Almunia, 2004). Tam (1997 in Tomaskovic-Devey & Skaggs, 2002) suggested that
occupational sex composition does not determine wage differentials since these are largely due
to the devaluation of women’s work and to the lower investment of women in human capital.
However, Tomaskovic-Devey and Skaggs’ study established that sex composition does affect
earnings, albeit this does not happen in a direct manner and the influence is not highly
significant. The impact of sex composition on women’s and men’s income is largely the result
of a lower access to extensive training to women occupying posts in traditionally female
sectors.
Furthermore, although occupational segregation normally results in a low female-male earnings
ratio, this may not always be the case. In cases where women’s earnings are relatively high in
female-dominated fields, women may prefer to remain in these jobs rather than enter a
traditionally male field. This would result in a high level of occupational segregation but a
relatively high earnings ratio. Such is a feature of countries that have strong union policies,
tending to compress the overall wage structure as is the case of Sweden or where ‘comparable
worth’ policies have been implemented (Blau et al, 2002).
Apart from concentrating in ‘women’s’ jobs, women are under-represented in higher paid jobs
in virtually every county. Despite the legal provisions that exist in many countries, gender
inequalities remain in access opportunities to posts that carry higher responsibilities and
rewards (Meilland, 2002, 2001). Men are not only over-represented in sectors and occupations
that offer higher financial rewards, but are more likely to hold supervisory positions within these
sectors and occupations. Women are less likely to occupy supervisory positions in all EU
countries where data are available (Dimas & Almunia, 2004).

Gender Pay Review
National Commission for the Promotion of Equality
Malta September 2006 page 75 of 327
This is also the case where women have a relatively higher level of education, as already shown
(Swepston, 2002). In the US, although more women than men fall within the professional
camp, there are more men working in the higher and more financially rewarding professions
(such as law, medicine and engineering) while women tend to be employed in the lower paid
fields such as school teaching and nursing (Blau et al, 2002).
The persistence of occupational segregation and consequently of gender pay inequalities may
be the result of a number of factors that include:
� men and women occupying similar posts but employed by different companies e.g. fine restaurants
tend to employ waiters who are well paid while casual diners are more likely to employ low paid
waitresses;
� men and women occupying similar posts within different industries e.g. women are more likely to
work in the textiles sector where pay is low, while men are more likely to work in the petroleum
industry, which pays higher wages;
� within a company men and women may appear to have similar jobs but they may not have the
same degree of authority and responsibilities (Reskin and Padavic, 1994 in Beeghley, 1996).
A different approach to explaining occupational segregation is the dual labour market theory
developed by Doeringer and Piore (1971 in Blau et al, 2002), suggesting that the labour market
is divided into two segments. One segment consists of primary jobs that are highly skilled, well
paid, offer high levels of security and promotion as well as training opportunities. Workers
occupying such posts are also more likely to be unionised. On the contrary, secondary jobs are
less skilled, offer lower pay, less training and promotion opportunities and feature high rates of
labour turnover, with low levels of unionisation. Women, together with other disadvantaged
groups (such as people from ethnic minorities) are more likely to concentrate within the
secondary segment. Radical feminists such as Hartmann (1976 in Blau et al, 2002) argue that
labour market segmentation is beneficial not only to capitalists (who are also mostly men) but
also to patriarchy. Males in general benefit from keeping women segregated in low paying and
insecure jobs.
3.2 Pay Structures
Within occupations, enterprises or sectors, gendered differences feature in pay structures even
though these are not always obvious. Furthermore, in certain countries, especially in
agriculture, gendered pay rates are still evident and in some countries, different productivity
rates are still established for women and men (Swepston, 2002).

Gender Pay Review
National Commission for the Promotion of Equality
Malta September 2006 page 76 of 327
Inequality in earnings between men and women may be influenced by the pay structure
depending on:
� The form of payment system: Many payment systems allow for a range of earnings beyond the
basic pay stipulated in the pay scheme such as through overtime, seniority or merit. Such systems
very often tend to disguise the real differences in earnings;
� The size and ranking of pay differentials across sectors, industries and occupations (the wider the
pay dispersion, the wider the gender pay gap);
� The system used to grade and evaluate jobs (Swepston, 2002).
The ILO Convention as well as European treaty law define remuneration as ‘the ordinary, basic
or minimum wage or salary and any additional emoluments whatsoever payable directly or
indirectly, whether in cash or in kind, by the employer to the worker and arising out of the
worker’s employment’. This definition presents a central challenge and a significant contention
in considering gender pay gap. Any additional payments such as travel, housing allowances,
uniforms and other fringe benefits that an employer gives to an employee in addition to the
established basic income are incorporated within the definition. It is these ‘additional’ payments
that lead to pay differentials between men and women (Swepston, 2002). One does not expect
all payments between men and women to be completely the same since this would lead to
inefficient pay structures. Indeed, Swepston (2002) suggests that while the payment of
bonuses or any other supplementary earnings to reward characteristics such as seniority, merit
or productivity are encourageable, often, decisions related to such payments are influenced,
directly or indirectly, by gender.
Swepston (2002) argues that centralised wage structures that offer a wide field of comparison
seem to provide the best guarantee against gender discrimination in pay. Indeed, those
countries that have a centralized wage-fixing system tend to have narrower discrepancies in
earnings between men and women regardless of whether they are established through
regulation or collective bargaining. On the contrary, fragmented pay structures as well as those
characterised by wide disparities in wage bands tend to provide more opportunity for sex bias
to occur. Therefore, where there are strong tendencies towards decentralization of wage fixing,
it is even more important for minimum wage protection to be maintained.

Gender Pay Review
National Commission for the Promotion of Equality
Malta September 2006 page 77 of 327
3.3 Jobs, Gender & Discrimination
3.3.1 Gendered Evaluation of Jobs
Although different pay rates for men and women occupying a similar grade and doing similar
work have largely been abolished (at least on paper), gender neutral job classification and
evaluation still present a challenge for policy makers, trade unions and employers alike. Since
women and men do not always perform similar jobs, this may give rise to a gendered
evaluation of jobs resulting in women’s jobs or skills being under-evaluated (Smith, 2003;
NCW, 2002). In spite of the legal provisions protecting women’s right to receive equal pay not
only for equal work but also for work of equal value, women’s work is still valued differently
from that performed by men perhaps because it is ‘women’s work’. For example, in countries
where the majority of doctors are male, a doctor’s salary is at the higher end of the incomes
scale whereas in Estonia where the majority of doctors are female, doctors’ incomes are closer
to the average (Barr & Boyle, 2001). However, the gendering of jobs is often latent as a result
of the constraints presented by law.
The institutionalisation of gendered beliefs is manifest in the norms and practices of public
settings such as work organisations, bearing important implications for gender inequality
(Ridgeway & Correll, 2004). Acker (1990, 1992) argues that within work organisations,
employers have a crucial role in gendering jobs. Employers very often have the worker’s
gender in mind when they create, design, decide the way work is to be done and organised,
and, set pay levels. Jobs that are essentially gender-neutral become gendered when they are
performed and evaluated.
Employers’ devaluation of women’s work depends on the conscious and unconscious sex
stereotypes that both employees and employers take with them to the workplace (Payne,
2003). Skuratowicz and Hunter (2004) argue that gendered jobs are perpetuated as such
because gender is embedded in organisational assumptions and practices. Inbuilt in every
occupation is a set of attributes and characteristics that also tend to gender it. For example
patience, a caring attitude towards children, gentleness and creativity are all desirable
characteristics for a primary school teacher or kindergarten assistant, meaning that such
occupations are usually associated with women. The traits very often attributed to female
workers such as dexterity, care and the ability to handle emotional situations are given a lower
value than those characteristics normally attributed to men (Swepston, 2002). This is reflected
in wage systems that traditionally tended to measure only the physical and mental aspects of

Gender Pay Review
National Commission for the Promotion of Equality
Malta September 2006 page 78 of 327
work and did not take into consideration factors such as caring or working with people.
Support work and non-managerial work that often women carry out, has also been traditionally
undervalued or completely ignored. Yet, in some countries, new approaches were developed to
carry out gender-neutral job evaluation taking into consideration not only mental and physical
aspects but also human relations skills as well as emotional aspects (Swepston, 2002).
Although in many countries law permits victims of pay discrimination to seek justice, such cases
are generally not numerous. Nevertheless, there were situations where women felt that their
pay was unfairly evaluated and sought redress. Recio (2001) relates to a number of court
cases in Spain where women succeeded in demonstrating that their jobs were evaluated
differently from men’s jobs.
In the UK, female sewing machinists in the furniture sector succeeded in winning a court case
in which they argued that they should be paid as much as male upholsterers. In another
instance, women packers were granted a higher wage similar to that of male labourers while a
cook managed to persuade the legal authorities to grant her equal pay to that of a joiner or a
painter (NCW, 2002). Darmanin (2000) accounts for how the number of cases presented by
women claiming that their jobs were devalued in the UK, decreased over recent years.
Contrastingly, a review of the decisions taken by the Industrial Tribunal in Malta between 2003
and 2005 indicates that none of the cases was concerned with gender pay discrimination.
Nevertheless, this does not necessarily imply that all women in Malta are receiving equal pay for
equal work. Court cases may be uncommon for a number of reasons, such as the difficulty to
prove discrimination, the length of court proceedings or fear of losing one’s job. Another
discouraging factor may be the fact that the Industrial Tribunal is (in almost all cases) presided
and constituted by men.
In avoiding gender discrimination in pay systems, it is essential for the appropriate methods
and procedures to be established for the measurement of the relative value of jobs with varying
content to be carried out. The application of this concept is referred to as ‘comparable worth’
(Swepston, 2002). In many job evaluation systems, job descriptions are often used as the
basis of evaluation. However, more often, systems compare jobs against a number of pre-
selected characteristics such as skill, effort, responsibility and working conditions and base their
evaluation on pre-prepared job descriptions (Swepston, 2002).
A study of the EU 15 and Norway (Soumeli & Nergaard, 2002) shows that many of the
countries are addressing job evaluation and the assessment of the quality of existing

Gender Pay Review
National Commission for the Promotion of Equality
Malta September 2006 page 79 of 327
classification systems, albeit in different ways. Overall, such schemes seem to be regarded by
both trade unions and labour market/gender equality authorities as effective tools against
gender pay discrimination. At the same time, there are problems associated with the
introduction and implementation of such schemes. One challenge in the implementation of job
evaluation schemes is that they may be both time consuming and expensive in terms of wage
adjustments particularly in times of low nominal wage increases. Darmanin (2000) points to
the importance of being vigilant about those who are involved in evaluation schemes. It is
essential for the persons involved in such work to be adequately trained so that there is a true
understanding of pay discrimination and a conviction that it needs to be abolished (Swepston,
2002).
Among the challenges presented by job evaluation schemes is the extent to which it is possible
to compare jobs that fall in different bargaining areas such as blue- and white-collar
occupations. Related to this is the issue of how to compare very different jobs using common
and objective criteria. Then there is the market value that calls for contention since men and
women are not equally represented in the public and private sectors of the economy. In many
countries, men are more likely to be working in the private sector, justifying higher earnings
through market factors (Soumeli & Nergaard, 2002).
Darmanin (2000) also outlines a number of factors that legislators should not overlook since
they may give rise to abuse or may otherwise render the system ineffective. For instance,
there may be situations where a few token men are engaged in the same activity as women
(e.g. sub-contracted cleaners). In such cases, it is to these that women will be compared and
not to higher paid males. It may also be the case that when a comparison has to be made
between two jobs, the wrong comparator is chosen. In some cases, as in small businesses
there may be nobody to compare with although the EU allows for comparison to be made with
employees in other firms. Furthermore, Darmanin questions whether comparisons always have
to be made with a worker of the opposite sex, such as part-time women compared to full-time
women or men. Swepston (2002) believes that gender pay equality is best achieved through
an overall, objective, wage rationalisation process in order to address the limitations of
conducting a comparable worth exercise between men and women.

Gender Pay Review
National Commission for the Promotion of Equality
Malta September 2006 page 80 of 327
3.3.2 Gendered Pay Expectations and their Influence on Job Evaluation
Apart from the practical challenges faced in job evaluation and classification, there are also
psychological and cultural issues involved (Ridgeway & Correll, 2004, 2001). The devaluation of
women’s activities and roles is well ingrained in different cultures and religions to the extent
that they come to be viewed as natural and normal. Gendered beliefs have a hierarchical
element of status inequality. As a result, men are traditionally regarded as being more
competent and better at doing the things that ‘count most’ while women are considered as
‘nicer’ but less competent although they perform better at communal activities (even if these
are attributed a lower value). Although alternative beliefs also exist in society, the hegemonic
beliefs leave a much more significant impact, very often leading to a self-fulfilling prophecy.
From a very young age, boys and girls are brought up with different expectations. Girls get
used to expect less for the same level of performance and to work harder than boys in order to
prove themselves. According to expectation states theory, these gender beliefs about men’s
greater competence and status, unconsciously shape the expectations that participants
themselves have of their own competence and performance (Ridgeway & Correll, 2004, 2001).
There have been some studies focusing on the premise that gender pay differentials may partly
be attributed to the differences in the pay expectations of men and women. Heckert (2002)
refers to a number of studies that based their research on the model developed by Major and
Konar (1984) or on any of the variables contained in the model. Major and Konar’s model
included five factors that are linked to gender differences in estimated salaries:
� differences in career paths (e.g. highest degree envisaged; years in full-time employment);
� one’s perceived job input (e.g. performance expectations; attributions of performance;
� objective job inputs (e.g. qualifications for the post as well as actual job performance);
� estimated pay for comparison with others (i.e. the perceived pay of other persons in a similar
occupation);
� importance given to different job characteristics (e.g. salary, job security, whether the job is
interesting).
Reviewing the various research findings, Heckert (2002) concludes that although among job
characteristics, the career path and job input variables may be important in explaining different
pay expectations by men and women especially at career peak, the most salient feature
appears to be the perceived salary earned by others in the same job. This is especially useful

Gender Pay Review
National Commission for the Promotion of Equality
Malta September 2006 page 81 of 327
in explaining gender differences in pay estimates particularly at career entry. However, Heckert
feels that this evidence is still inconclusive considering that only one study that included all the
components of the model was carried out on a diverse group of college majors – with data
gathered from only one university.
From her own research on a sample of 371 undergraduates from 50 different majors at a US
university, Heckert (2002) confirmed that women’s estimated earnings were significantly lower
than those of men both at starting point and at career peak, although the differences at career
peak were greater. As expected, women gave more importance to job characteristics that
accommodated family life better as well as to pleasant working conditions. There were no
significant differences regarding women and men’s ratings of the importance of pay or job
facets related to promotions and job perks. Neither was there much difference in the estimated
number of years of full-time employment, on degree expectations as well as on self-ratings for
job inputs. The study revealed that on its own, comparison others’ pay was sufficient to explain
gender differences in pay expectations both at entry and at peak. When this variable was
removed from the analysis, gender differences in estimated starting salaries could be attributed
mostly to different career paths. At career peak, gender differences in estimated pay was
significantly reduced by differences in career paths, importance to job characteristics and job
inputs.
Further research is required into why women estimate lower salaries than men for others in
similar occupations. One explanation could be their awareness of gender pay differentials.
Furthermore, women may anticipate lower earnings both at the start and peak of their careers
because they probably recognise that they will be ‘penalised’ for interrupting their career to
have children as well as for having jobs that are more family friendly. Considering the fact that
gendered pay estimates are linked to actual gendered earnings, it could be that the pay
differential stems from a ‘perpetuation of the status quo’ (Heckert, 2002).
Heckert also affirms, as established in other studies, that jobs that feature a lesser pay attract
women (contrasting against better-paid jobs that typically attract men). Yet the reasons for
choices call for more research, possibly establishing whether there is a link between such
choices, gendered socialisation and learned expectations as the expectation states theory (in
Ridegeway and Correll, 2004) seems to suggest.

Gender Pay Review
National Commission for the Promotion of Equality
Malta September 2006 page 82 of 327
3.3.3 Nice Girls Don’t Ask
As the above research findings show, there are both conscious and subconscious biases that
contribute to the gender pay gap. Babcock et al (2003) refer to three separate studies that
revealed another subtle source of pay inequality – possibly a direct consequence of women’s
lower estimation of their work. According to Babcock et al (2003) women do not get what they
deserve because they do not ask for it. Unlike women, men tend to negotiate better deals than
they are originally offered. One study compared male and female MBA graduates and found
that the average initial salary for males was almost $4,000 higher than the average for females
because most of the women had accepted their employers’ initial offer. Unlike women, 57% of
men (or eight times as many as women) had asked for a higher remuneration and consequently
got a better salary. Similar conclusions were reached by two other studies, one in the form of a
lab experiment and another large-scale study on the internet. Both studies revealed the greater
likelihood for men to negotiate for themselves successfully.
Babcock et al (2003) suggest that this could be the result of socialisation where girls are taught
to think of others first before considering their own interests. Women tend to believe that they
will be rewarded for working hard and doing a good job. Another reason could be that women
may be discouraged from negotiating because those who show assertiveness and ambition
often acquire a reputation as ‘bitchy’ or ‘pushy’ with rebounding effects.
3.3.4 Differences in Human Capital Vs Occupational Discrimination
Women’s concentration in certain sectors and occupations as well as the issue of women’s
persistent lower earnings may well be attributed to occupational discrimination. However, there
are divergent interpretations as to what constitutes discrimination (Recio, 2001). From a neo-
classical economic perspective, the idea of discrimination only refers to situations that cannot
be justified by objective factors such as level of education, work experience, type of occupation
and economic sector. Therefore, where women have a lower level of formal education, lower
qualifications, less work experience and seniority and are frequently found working in low-
paying sectors, the pay differential is justified. However, this still only explains about half the
pay gap (Blau et al, 2002).
From a different perspective, the differences in the earnings of men and women reflect the
widespread labour market discrimination suffered by women. From this point of view, women
receive lower wages than men not because they are less productive or less skilled but because

Gender Pay Review
National Commission for the Promotion of Equality
Malta September 2006 page 83 of 327
they are women. Workplaces that are female-dominated offer lower financial rewards because
it is women who make up most of the workforce. Women are underrepresented in posts that
carry more responsibility and higher pay not because of some inherent limitation on their part
but because of barriers and limitations imposed by men. Indeed, there is a high proportion of
females among professionals and technicians but very few of them reach high level positions
when compared to men, explaining the persistence of the pay gap in the public sector where
women with the highest qualifications are largely employed. At the same time among
professionals with high qualifications in the public sector the gap is not as wide as it is for those
in the private sector. This indicates that despite the anti-discrimination legislation and the
higher level of education among women, discriminatory practices still prevail. This approach
also considers the concentration of women in temporary and part-time employment as a
reflection of discriminatory practices (Blau et al, 2002).
Within economics literature both approaches have made significant contributions to explaining
gender wage differentials, with such works calling for a holistic consideration. Taken together
these research works give a more holistic understanding of why women’s and men’s earnings
continue to be differentiated.
Supply-side explanations, in line with human capital theory, argue that women come to the
labour market with different tastes, expectations, qualifications and experience. For example,
women may be more willing to accept repetitive work while men are more likely to accept a
dangerous job. Women are also less likely to invest in training, job search and formal
education. However, societal discrimination (like social attitudes and cultural expectations tied
with women’s traditional gender role) often influence women in making job choices.
Nevertheless, since the impact of our social environment can be neither denied nor quantified,
it is difficult to determine whether women’s choices are voluntary or constrained. Moreover,
while women’s lesser experience, their career interruptions and job tenure have a significant
impact on pay differentials, it is more difficult to explain the gap by gender disparity in
qualifications. This is evident when one takes into consideration that women are as equally
qualified as men, still earn less than their male counterparts (Blau et al, 2002).
Another important factor is that human capital is not always a question of choice. Women may
have less access to on-the-job training than men due to employer discrimination. Regardless of
whether social pressure has a significant impact on what women take with them to the labour
market, societal discrimination is different from occupational discrimination, calling for redress
by policy makers in different ways. Labour market discrimination affects women’s economic

Gender Pay Review
National Commission for the Promotion of Equality
Malta September 2006 page 84 of 327
status directly, producing pay disparities that cannot be justified by differences in either
productivity or human capital (Blau et al, 2002).
Blau et al (2002) cite various studies that suggest that occupational discrimination exists. This
is further reinforced by evidence coming from employment discrimination court cases.
Research findings evidence that pay differences between women and men exist, beyond any
justification through qualifications. The problem lies with estimating the degree of
discrimination. The ESRI (2000) suggests that the ‘unexplained’ wage gap is sometimes treated
as a base for measuring the so-called ‘discrimination index’ that is a calculation of the level of
wage discrimination existing between men and women of equal experience, who, by law,
should receive equal pay for work of equal value. While the ‘discrimination index’ was 15% in
1987, by 1997 it had fallen to about 5%. Walby and Olsen (2002) also found that sex
discrimination was the largest component of the gender pay gap (29% in their analysis).
The direct effects of labour market discrimination may explain more than half the pay gap. It is
true that women’s preference may play a role in different occupational choices and as already
suggested, it is not always easy to distinguish between preference and discrimination.
However, evidence points to institutional barriers that exclude women from certain positions or
hindering them from being promoted, solely on the basis of gender. Research also supports the
existence of discriminatory practices in access to on-the-job training. A study of countries in
Central and Eastern Europe (Rangelova, 2002) found that although in these countries part of
the gap stems from labour market segmentation, most of the differences are due to overt or
covert discrimination practices.
3.3.5 Models of Discrimination
In economics literature, a number of models were developed attempting to explain gender
disparities in pay as a consequence of discrimination and why they have persisted. Empirical
research, nevertheless, failed to determine which model is closest to labour market realities.
These models are not mutually exclusive and each offers a valuable insight into occupational
discriminatory practices. Moreover, such models of discrimination aim to explain that part of
the pay gap that cannot be otherwise explained by gender differences in human capital.
Therefore it is assumed in these explanations that men and women are equally qualified and
equally productive (Blau et al, 2002).

Gender Pay Review
National Commission for the Promotion of Equality
Malta September 2006 page 85 of 327
Developed by Becker (1973 in Blau et al, 2002), one such model assumes that employers as
well as co-workers and customers (all of whom are typically men) may all have a taste for
discrimination. This model argues that:
� male employers would not hire women to perform certain tasks that are not deemed appropriate
for women;
� male workers may agree to work with women in subordinate positions but not in similar or superior
ones; and
� customers who have no problems with buying clothes from a female sales assistant may think
twice before buying a car from a woman or hiring her as an attorney.
One important implication of this model is that even if employers themselves are not sexist,
their profit motive may drive them to discriminate against women if their male employees and
customers have such tastes. In engaging women, such employers offer low status and lesser
paying jobs because women can be a threat to male employees and are less desirable to
customers. Therefore, women are ‘worth less’.
Another model developed by Phelps (1972 in Blau et al, 2002) focuses on statistical
discrimination whereby discriminatory practices are the result of employer decisions made on
the basis of group averages. Employers may decide not to employ, promote or train a woman
on the information that the average woman is less productive and scores less in job stability.
As a result, individual women may suffer discrimination even if they do not fit the stereotypical
average. Such discrimination, nevertheless, may lead to a self-fulfilling prophecy – a woman
who is not given the same opportunities as men, is more likely to leave her job and the
employer’s perception will be confirmed. The authors, indeed, refer to research showing that
when women are offered the same incentives as their male counterparts, their turnover
patterns are similar to those of men.
3.4 Fighting Occupational Discrimination
One problem with discrimination is that it is very often subtle, at times even unconscious. As a
result discriminatory practices are difficult to document, let alone remove. Women may be
denied equality of treatment due to existing stereotypes about their qualifications, abilities,
commitment to the job and personal traits. In business circles, women are believed to make
men uncomfortable, to have difficulties with reconciling work and family demands and to be

Gender Pay Review
National Commission for the Promotion of Equality
Malta September 2006 page 86 of 327
less internationally mobile than men. There is also the perception that men make better bosses
(Blau et al, 2002). Furthermore, these stereotypes are very often embraced by women
themselves, rendering occupational discrimination altogether more difficult to address.
An additional obstacle that hinders the effective addressing of occupational discrimination is its
lack of recognition or the refusal to acknowledge its practice not only by employers but also by
trade unions. People consistently assert that there are no gender pay differences within their
organisation, and are shocked when this assumption is shown to be false (Equal Opportunities
Commission, 2002). In Italy, Paparella (2005) reports that both employers and trade unions do
not prioritise pay inequality adequately. They are apparently reassured that the law, together
with national sectoral collective agreements, provide enough protection against gender
inequality or discrimination. In reality, however, this is not the case and pay differentials are
far from absent. Furthermore, many employers tend to negotiate pay conditions that do not fit
within the boundaries set out in the collective agreements.
Reviewing the situation of gender pay equity in the EU 15 and Norway, Soumeli and Nergaard
(2002) report that although in theory, employers’ organisations support equal opportunities and
favour gender pay equity, in practice, little is the action taken to ensure that these principles
are implemented. In most of the countries examined, employers’ organisations did not consider
it necessary to take action related to gender pay policy. Apparently, the general stand is that
the persistent difference in the earnings of men and women is not the result of sex
discrimination but stems from the objective realities of men and women in the labour market.
In line with human capital theory, the predominating view among employers in Europe is that
women and men do not behave similarly in the labour market and related areas. For example,
employers believe that women tend to invest less in training and education, job search, job
mobility and to make different career choices, thereby justifying differences in earnings.
These findings certainly do not imply a general picture across Europe as a homogenous block.
In specific countries (as is Luxembourg) gender issues are given a high priority by employers,
and, with the exception of Greece, in all other countries examined, gender pay issues are
addressed albeit in an indirect way. In certain cases, more can be done particularly where
collective bargaining is concerned – as evidenced by the 16 European country study (Soumeli &
Nergaard’s, 2002) establishing that gender pay equity is not a central feature in collective
bargaining. Indeed, this lack of prioritisation is considered, to a certain extent, within the
perimeter of politics and the law rather than as a matter that can be solved through
negotiation. Furthermore, since pay inequalities are often attributed to the positional
Gender Pay Review
National Commission for the Promotion of Equality
Malta September 2006 page 87 of 327
differences of men and women in the labour market in the course of their career, this is
perceived as too big an issue to be solved by means of collective bargaining.
A further problem with trade unions when it comes to address gender issues is the lack of
female representation both at membership as well as at executive levels. International and
local studies (Blau et al, 2002; Deguara, 2002, Mallia, 1997) established that male-dominated
trade unions are less likely to consider women’s disadvantaged position in the labour market as
a priority. Such assertion also poses additional challenges for European mainstreaming policies
to be fully implemented (Paparella, 2005).
3.5 Workplace Characteristics
A study that sought to examine the impact of the characteristics of the workplace on the gender
pay gap along with worker attributes is that of Drolet (2002) in Canada. The study used data
from the Workplace and Employee Survey (1999) covering a wide range of characteristics
related to the workplace including human resource practices, workplace performance, business
strategies, technology use and innovation, as well as those related to the worker such as
education and experience. It is claimed that in Canada, this is the first study that examined
gender pay differentials within the context of workplace characteristics, particularly in respect to
the role played by factors such as:
� foreign ownership;
� proportion of part-time workers;
� high performance work practices;
� non-profit organisations;
� training expenditure and
� coincidence needs or family-friendly measures.
The study related to a sample of more than 24,000 responding employees from almost 9,000
private sector non-agricultural workplaces. It revealed that worker characteristics like
education, qualifications and experience, accounted for only one-fourth of the gender pay gap.
When industry and occupation are included, the explained component within the gender pay
gap rises to 58.5%. This research points to the important contribution played by the
distribution patterns of men and women in different occupations and industries. Women’s
concentration in low-paying jobs accounts for 33.8% of the wage gap.

Gender Pay Review
National Commission for the Promotion of Equality
Malta September 2006 page 88 of 327
The same study established that workplace characteristics play an even more important role
than worker characteristics in explaining the wage gap. Estimates involving worker and
workplace characteristics (but excluding industry and occupation) revealed that employee
characteristics account for 10.8% while those of the employer/workplace account for 27.9% of
the wage differential. These aspects suggest that workplace characteristics are a significant
determining force in income differentials. Drolet (2002) also points at the most important
factors that bear a significant role in explaining the gender wage gap:
� part-time employment rate and (more significantly)
� the distribution of men and women across the different industries and occupations.
These ‘new’ workplace variables together further contribute to the gap, although individual
contribution is relatively small. When occupation and industry were included in the model, the
results obtained were 18.6 % and 42.6% respectively (Drolet, 2002), rounding the total
explained component of the pay differentials to 61.2%. This shows that despite the addition of
a wide range of workplace variables, 38.8% of the gender pay gap remains unaccountable.
Drolet (2002) also established that women are more likely than men to be employed by non-
profit making organisations – entities that generally tend to pay lower wages to their managers,
sales and clerical staff even if they are highly qualified. This may in part be due to the lower
levels of unionisation featuring within such entities as well as higher proportions of part-time
workers. However, despite these indications, there seems to be no significant correlation
between earnings and non-profit-making organisations. Drolet (2002) maintains that such
aspects explain only 1.3% of the gender pay gap.
Also relatively insignificant is firm ownership: Drolet (2002) refers to a study by Aitkens et al.
(1996) suggesting that after accounting to firm size, differences in pay differentials related to
foreign ownership remained. These could possibly be attributed to productivity differences in
access to financial assets, technology, innovation as well as to lower rates of turnover and
greater human capital development. Furthermore, the Canadian Workplace and Employee
Survey (1999) indicated that foreign ownership is apparently linked to a wage bonus for men
but not for women. As a variable, this characteristic explained a negligible proportion of wage
differentials.

Gender Pay Review
National Commission for the Promotion of Equality
Malta September 2006 page 89 of 327
3.6 Future Directions?
In a male-dominated society, men feature authority in all aspects of social life including the
world of work. Occupying the top posts and the best paying jobs, men organise and manage
work, selecting and shaping productive activities, associated methods and human resources,
exercising control on the conditions of work. Men determine how jobs are evaluated and paid,
whilst exercising authority in the design, implementation and enforcement of laws.
Industrial Tribunals largely feature men, as is the case of the majority of trade union officials –
who in turn are less likely to put women’s issues at the top of their agenda. Thus, despite a
general apparent consensus on the principle of equal pay between men and women, in reality
society exercises otherwise – women still earn a fraction of men’s pay even for similar work.
Pay parity is thus a challenging goal to achieve considering that the various measures
implemented so far managed to achieve partial success, leaving significant room for further
work.
3.6.1 Role of Social Partners
Comparative research in European countries (Soumeli & Nergaard, 2002) suggests that the
social partners and the national authorities are still working on measures to combat gender pay
inequality other than through legislation. Nevertheless, in many European countries, there is
little (if any) co-operation between the social partners to address the gender pay gap. In most
cases cooperative initiatives deal with matters of pay indirectly through other policy initiatives
such as increasing the participation of women in the labour market (Soumeli & Nergaard,
2002).
In countries like Austria, Belgium, Greece, Ireland, Luxembourg and Spain, this co-operation is
practically absent or is limited to activities of minor importance, exemplified by the setting up of
study groups and the provision of training courses. In other countries, co-operation is still
limited but more developed – as is the case of the UK, Germany, Italy, Norway and Sweden.
Co-operative initiatives between the social partners in Denmark, Finland, France, the
Netherlands and Portugal feature a significant level of development. For example, in France,
the social partners embarked on a joint effort to publish a guidebook for collective bargaining
purposes. Similarly in the Netherlands, the social partners together developed an instrument
for the implementation, application and evaluation of pay systems (Soumeli & Nergaard, 2002).

Gender Pay Review
National Commission for the Promotion of Equality
Malta September 2006 page 90 of 327
Employers’ associations in a number of countries introduced some initiatives in support of
gender equality in earnings. Nevertheless, such initiatives are fragmented or of an isolated
nature or else forming part of a joint initiative with the government or with trade unions. Trade
unions seem to be more conscious than employers of the need to tackle the persistent pay gap.
Indeed, in most of the 16 European countries reviewed (Soumeli & Nergaard, 2002) trade
unions are addressing the problem. Across all countries, the measures taken by trade unions to
achieve greater pay equity were somewhat similar (Soumeli and Nergaard, 2002), involving:
� actions to increase public awareness;
� research to identify the causes and practices of discrimination;
� exchanges of views and information and co-operation in the formulation of measures to tackle
discrimination;
� implementation of procedures to combat gender discrimination, and
� training.
3.6.2 Planning Ahead – Malta’s National Action Plan
Despite the optimistic situation projected by the EU’s employment strategies and guidelines
prevailing in member states, the National Action Plans (NAPs) of many Member States do not
feature gender pay equity as a central aspect. A review of a number of NAPs for 2000 and
2001 reveals that in certain countries, pay equity does not feature at all, while other countries’
NAPs (Belgium, Denmark, Ireland, the Netherlands and the UK) give pay equity more
importance, specifying a number of initiatives aimed at tackling the pay gap (Soumeli &
Nergaard, 2002).
As a young member of the European Union, Malta presented its first National Action Plan on
Employment (NAP) (ETC, 2004) and the National Reform Programme (NRP) (MEU, 2005)15.
This exercise forms part of the European Employment Strategy that outlines a series of
guidelines for Member States to follow as they strive to attain the objectives set out in the
15 The Management Efficiency Unit (MEU) was the coordinating body of the National Reform Programme – Malta’s strategy for
growth and jobs for the period 2005-2008. The NRP replaced the NAP following a revision of the Lisbon targets by the
European Commission. The focus is now on growth and employment, reliant on 24 guidelines.

Gender Pay Review
National Commission for the Promotion of Equality
Malta September 2006 page 91 of 327
Lisbon Agenda. Malta’s NAP sets out both long-term goals to be reached by 2010 as well as a
number of measures to be implemented by 2006.
The 6th employment guideline on which Malta’s NAP is based deals with gender equality and
requires Member States to strive
‘ … through an integrated approach combining gender mainstreaming and specific policy
actions, [to] encourage female labour market participation and achieve a substantial
reduction in gender gaps in employment rates, unemployment rates and pay by 2010. The
role of the social partners is crucial in this respect. In particular, with a view to its
elimination, policies will aim to achieve by 2010 a substantial reduction in the gender pay
gap in each Member State, through a multi-faceted approach addressing the underlying
factors of the gender pay gap, including sectoral and occupational segregation, education
and training, job classification and pay systems, awareness raising and transparency.
Particular attention will be given to reconciling work and private life, notably through the
provision of care services for children and other dependents, encouraging the sharing of
family and professional responsibilities and facilitating return to work after a period of
absence. Member States should remove disincentives to female labour market participation
and strive, taking into account the demand for childcare facilities and in line with national
patterns of childcare provision, to provide childcare by 2010 to at least 90% of children
between three years old and the mandatory school age and at least 33% of children under
three years of age’.
The NAP recognises the gap that prevails in women’s and men’s earnings in Malta, although it
considers it to be relatively low at 10% (or six percentage points below the EU 15 average). It
also acknowledges the persistence of both horizontal and vertical occupational segregation.
However, Malta’s NAP considers the low rates in women’s employment and self-employment as
more pressing issues – reacting to alarmingly low female participation rate in the Maltese labour
market. Malta’s NAP also attempts to address the acknowledged restricted availability of
regulated and affordable childcare facilities – a feature that challenges young mothers who are
willing to work.
The NAP’s and NRP’s response to the present labour market situation reflects the Government’s
concern with the wider picture of gender discrepancies in the labour market. Consequently,
there are no specific measures that directly address the gender pay gap. This position assumes
equal earnings among men and women will be the result once women face the same

Gender Pay Review
National Commission for the Promotion of Equality
Malta September 2006 page 92 of 327
opportunities to join the labour market as men – competing for opportunities on an equal
footing, without having to interrupt their career for childcare responsibilities.
Among the concrete goals set out by the Government, Malta’s NAP sets a female employment
rate fo 40.7% by 2010, while establishing the employment rate of older workers at 35% (up by
2.4 percentage points). By 2010, Government is committed to encourage an increase,
especially among employers, in the availability of childcare provision by 1,800 places for
children under three.
The NAP and NRP also set out details concerning specific measures planned (or are already in
operation), intended to encourage women to remain within, or return to the labour market.
Initiatives within these objectives include those that encourage women not only in seeking work
in traditional female fields but also in traditionally male-dominated areas, attempting to redress
occupational segregation in Malta. Such initiatives include incentives that encourage women to
work whilst benefiting from tax reductions. Other measures aim at enabling more women to
effectively balance work and family obligations. Nevertheless, Malta’s NAP sets targets that are
still well below those set by the EU, albeit probably more realistic.
While Malta’s NAP sets out a number of positive initiatives to attract more women to the labour
market, a number of challenges remain relatively unaddressed, possibly undermining the
potential of strategies set out in the same NAP. Maltese society places an onus of homemaking
and childcare on women, with gender roles at home remaining largely traditional. A prevailing
lack of childcare facilities challenge mothers in their considerations for participation in the
labour market. Women with older children still face childcare challenges during school holidays
and after school hours. Moreover, women engaged in work within the private sector are
seldom entitled (if any) to parental leave or to flexible or reduced working hours (ETC, 2005).
Camilleri-Cassar (2005) asserts that Malta faces a paradoxical situation whereby the
government’s gender mainstreaming policies conflict with the prevailing traditional male
breadwinner model, which, in turn is constantly reinforced not only by informal cultural
elements and the Church but also by politicians themselves.
Furthermore, while planning and design are an essential aspect of policy-making, it is the
implementation phase that produces results. Recognised are the numerous training
programmes that the Employment & Training Corporation organised, along with the remarkable
gender awareness campaigns, gender-related projects and publications, albeit a number of
initiatives remain pending implementation. Such is the case of two projects directly related to

Gender Pay Review
National Commission for the Promotion of Equality
Malta September 2006 page 93 of 327
gender pay equality, forming part of the Corporation’s Gender Equality Action Plan (2003-
2004):
� Pay Equity at Work project, meant to involve a training course for Human Resources personnel on
establishing pay equity and
� Job Evaluation Tool which was meant to help employers ensure that workers, regardless of sex,
receive equal pay for work of equal value (ETC, 2002).
3.6.3 Initial Recommendations
It is evident that gender pay inequalities stem from a wide range of factors, with no single or
simple solution that can address such challenges. However, there are indications that the
biggest challenges lie in attracting more women to the labour market and in reducing the
positional inequalities between men and women during their working life. Legislation is
important – a proven crucial factor in reducing gender discrimination while promoting the
concept of equal pay for work of equal value. Nevertheless, the persistent gender pay gap
remains almost immune to efforts that combat workplace discrimination, largely as a result of
factors outside the labour market. Traditional notions about women’s roles and the conflict
arising from trying to combine work and family responsibilities have to be addressed seriously if
gender pay parity is ever to be achieved (Swepston, 2002).
Significant is the need for countries to promote measures for the objective job appraisal. This
places a priority on the establishing of appropriate techniques and procedures to measure the
relative value of jobs with varying content. As has been noted, subjective elements often play
a role in job evaluation with the consequence that women often fall victims to both conscious/
subconscious discrimination. As recommended in the ILO Convention No. 100 it is important
for the job evaluation process to be free of sex-stereotyping as this ‘may lead to the under-
evaluation of tasks performed largely by women’ (Swepston, 2002). Furthermore, since pay
levels are linked with the gender orientation of an occupational sector, and, since the gender
pay gap is widest is male-dominated sectors, the ILO Committee of Experts suggest that a
system be established to allow for the objective evaluation of jobs comparing the relative value
of jobs in male and female-dominated sectors (Swepston, 2002).
The setting of centralised minimum standards, narrow pay dispersion policies and more
transparent pay structures are likely to contribute to a further decline in gender pay differentials
(Rubery et al, 1997 cited in Swepston, 2002). Indeed, evidence from various countries

Gender Pay Review
National Commission for the Promotion of Equality
Malta September 2006 page 94 of 327
suggests that wage structures play an important role in influencing the gender pay gap,
especially when these rely on centralised wage fixing systems (as opposed to less effective
decentralised wage-fixing systems).
Gender-specific factors remain equally important: in the US where changes in the wage
structures in the 1970’s and 80’s favoured workers in male-dominated occupations, women
whose qualifications improved (when compared to those among men), contributed to a
narrowing of the pay gap. In Sweden, gender-specific factors played an important role in
narrowing the wage gap even though Sweden’s solidarity wage policy also contributed to a
general wage compression and a dramatic narrowing of the pay gap.
These observations also call for a collective effort by social partners in overcoming this
persistent social injustice. The social partners’ co-operation should extend beyond collective
bargaining, possibly taking the form of:
� joint participation in job evaluation design and application;
� joint development of national wage and equal pay policies and
� joint promotion of more centralised wage-fixing systems.
The EU Advisory Committee suggests the following actions for the social partners to take in
achieving pay equity while upgrading low pay:
� analyse centralised versus decentralised bargaining: Studies evidence that decentralised wage
bargaining has a detrimental effect on women’s earnings, thus providing an impetus for social
partners to counteract negative effects when these arise;
� conduct job evaluation exercises for both full-time and part-time occupations with the technical
assistance of government;
� introduce measures, including the creation of special funds at sectoral level, to increase the pay of
jobs which are undervalued; and
� ensure a more equal balance between men and women at the negotiating table (Swepston, 2002).
In 1998 the ILO Committee of Experts issued a General Observation, stating that for an
adequate evaluation of the nature, extent and causes of the gender pay gap and in order to
assess the application of Convention No. 100, more detailed information is required with respect
to women’s:

Gender Pay Review
National Commission for the Promotion of Equality
Malta September 2006 page 95 of 327
� economic activity in each country,
� hours of work of women,
� educational level attained by women and their qualifications, seniority and ages
� statistical information concerning the nature of earnings, overtime and shift differentials,
allowances, bonuses, gratuities and
� remuneration for hours not worked.
This communication constitutes a strong encouragement for Governments to analyse their local
situation in establishing the extent and the nature of gender pay differentials – setting a
starting point in addressing the differences in earnings between women and men (Swepston,
2002). In addressing persistent and unexplained gaps in earnings, Governments were
encouraged to compile high quality statistical information covering wide, pay-related issues by:
� ensuring that statistical data cover all industrial sectors as well as part-timers and other peripheral
groups;
� gathering detailed information on occupations which allows for full comparisons between what
women and men do;
� providing information on supplementary earnings such as bonuses, fringe benefits and overtime
pay which might widen the gap if they are more common among men than among women
(Soumeli & Nergaard, 2002).
It is also important that gender pay gap data is provided at company level since it is here that
negotiations take place. It is at this level that a thorough examination of the work of women
and men is done so that work of equal value will be equally rewarded in order for existing
injustices to be redressed (NCW, 2002).
The sources of gender pay disparities are numerous, rendering effective corrective action reliant
on measures that deal with all the facets together. Equality in job evaluation and remuneration
has to be examined and addressed within the context of the wider scenario. It is the
responsibility of the social partners to show their shared determination and together strive to
achieve the long awaited economic justice for women.

Gender Pay Review
National Commission for the Promotion of Equality
Malta September 2006 page 96 of 327
4 Key Issues
Table 2 presents a set of issues that call for investigation among Maltese men and women in
paid employment – this in response to the research objectives set out in the project and the
issues that arise from the review of different published works pertaining to the subject.
Table 2 – Summary of Key Issues Arising from Sections 2 & 3
Area Issues
Labour Market Participation � Length of service
� Employment history and basis of employment full-time, part-time or other work
conditions.
� The presence of career breaks and their relative importance to the individual.
� Choice/constraints. Factors that influence the career break may include:
o whether the husband considered to take a break break for childcare,
o whether the worker suffered undue pressure by the employer,
o social expectations,
o family or friends to take break,
o whether worker was offered alternatives (such as part-time or work from
home).
� Consequences of break on career and pay such as loss of skills, loss of high
earning, decrease change of employability, decrease of promotion prospects, the
possibility of not finding full-time employment. The perceptions of the worker are
important but consequences should also be quantified.
� Do workers enrol in training or education during the career break to increase their
employability?
Features of Present Occupation � Sector of employment.
� Type of enterprise (private, public; services or manufacturing, male or female
dominated).
� Level of job (1st, 2nd or 3rd job)
� Length of job search prior to engaging in the present job
� Level of occupation
� Full-time or part-time. Choice has to be qualified because it very often masks
constraints.
� Reasons behind the choice of the job: Was choice made in respect to
responsibilities at a social level (e.g. childcare, domestic duties, etc)
� Union representation
Remuneration � Was remuneration negotiated between employers and employees? Or was the pay
package imposed by workers / union or employer?
� The possibility for negotiation,
� Is pay influenced by performance?
� Level of satisfaction with pay?
� Is there a perceived correlation between pay and the workers’ responsibilities,
duties and skills.

Gender Pay Review
National Commission for the Promotion of Equality
Malta September 2006 page 97 of 327
� How does pay compare with workers’ expectations?
� Are workers offered opportunities of extra pay? If yes, in what form? How
acceptable are such forms of extra pay? If workers refuse such offers, what were
the reasons?
� Did workers (personally or through a union) demand a rise in pay? Were such
proposals accepted or refused for a particular reason?
� Potential of pay rises in the future?
� Factors that might be associate by workers for a better pay:
o further training and qualifications
o more hours of work
o seniority
o performance
o government increase for cost of living
o Union negotiation
Inequality & Discrimination � Is the law, on its own, effective in protecting employers?
� Is the law, on its own, effective enough to protect workers? Do workers feel
protected against discrimination by law and/or union membership?
� Were employees subject to unfair treatment by employers? If yes, in which sense?
o discrimination – age, sex, disability, marital status, motherhood, basis of
contract such as part time.
o discrimination following; recruitment, promotion, training, pay,
supplementary benefits, hours of work and conditions of work.
� In cases of unfair treatment, did workers take any action against employer? Was
the action through union representation? Did workers use industrial tribunal?
� Will workers consider any action against the employers if they were to be
discriminated against? For what reasons will workers not take action? Fear of
losing job? Do not have faith in law? Other possible reasons?
� Do workers feel that they receive a pay that is lower/higher/equal to other workers’
equivalent work. (The term equivalent depends on the type of organisation and
also whether workers compare their work to workers of same of opposite gender).
� Do workers believe that their pay is justified and fair according to (for instance)
gender stereotypes? Female workers may justify inequalities in pay especially if
they feel men have more responsibility or that their job requires more strength. In
such cases, females tend to play down their attributes and requirements.
� Attributes that workers perceive to justify higher pay and whether they believe it is
men or women who normally display any of these attributes
� Are workers aware of legal provision to address discrimination through industrial
tribunal.
Payment Systems � Features of payment systems, standardisation (as in case of the public sector) or
unstandardised?
� Are payment systems negotiated with the workers, the union or any other party?
� Are payment systems different in respect to gender or status (such as single young
woman, married dependent woman compared to generally male bread-winner).
� What are the criteria considered for establishing pay schemes:
o qualifications;
o specific skills such as communications, technical, emotional;

Gender Pay Review
National Commission for the Promotion of Equality
Malta September 2006 page 98 of 327
o hours worked,
o full time or part time shifts;
o level of responsibility;
o decision making;
o experience;
o ability to work without supervision;
o seniority;
o health hazards;
o number of workers under one’s charge;
o creativity,
o patience;
o dexterity;
o repetitiveness of work.
� Other forms of payment or fringe benefits offered by employer apart from basic
pay
o The forms these supplementary benefits/payments take
o The person/s who are entitled to such benefits/payments
o The person/s who are at present receiving such supplementary payments
based on grades or gender.
Job Classification � Is the job standardised?
� Is the job negotiated by/with the union?
� Is gender involved in classification scheme?
� What criteria are used for job classification?
� Is the job considered to be exclusively ‘male’ or ‘female’. For what reason?
Job Recruitment / Promotions These issues are aimed at operationalising the concept of discrimination that is obviously
very difficult to measure especially if it is done in an indirect way.
� Are jobs advertised targeted towards a specific gender?
� Is there a preference among employers towards men or women in such job?
� Do employers associate any particular traits with men or women? Such traits may
include:
o responsibility,
o job commitment,
o flexibility,
o ability to show initiative.
The gender that employers associate with such traits must be determined among
employers.
� What are the criteria considered by employers during recruitment?
o age,
o skills,
o experience,
o gender,
o marital status,

Gender Pay Review
National Commission for the Promotion of Equality
Malta September 2006 page 99 of 327
o parenthood,
o appearance,
o attitude towards work?
� Would employers hire a person from the other sex if applicants possess necessary
skills/qualifications but are applying for a sex atypical job?
� Would employers envisage problems with other employees (or with clients) if a
person is recruited for a sex atypical job?
� What factors are considered when it comes to who is offered/given training and
promotion?
� Do employers offer any support/scheme for workers with caring responsibilities e.g.
childcare facilities, flexible hours?
� Do employers consider women to be less/equally/more interested in
training/promotion compared to men?
� Do employers consider women to be less/equally/more committed to their work
compared to men?
� Do part-timer workers have access to training/promotion as other regular workers?
� Are part-time workers less/equally/more interested in training promotion than full-
timers?
� Are part-time workers less/equally/more committed to their work than full-timers?
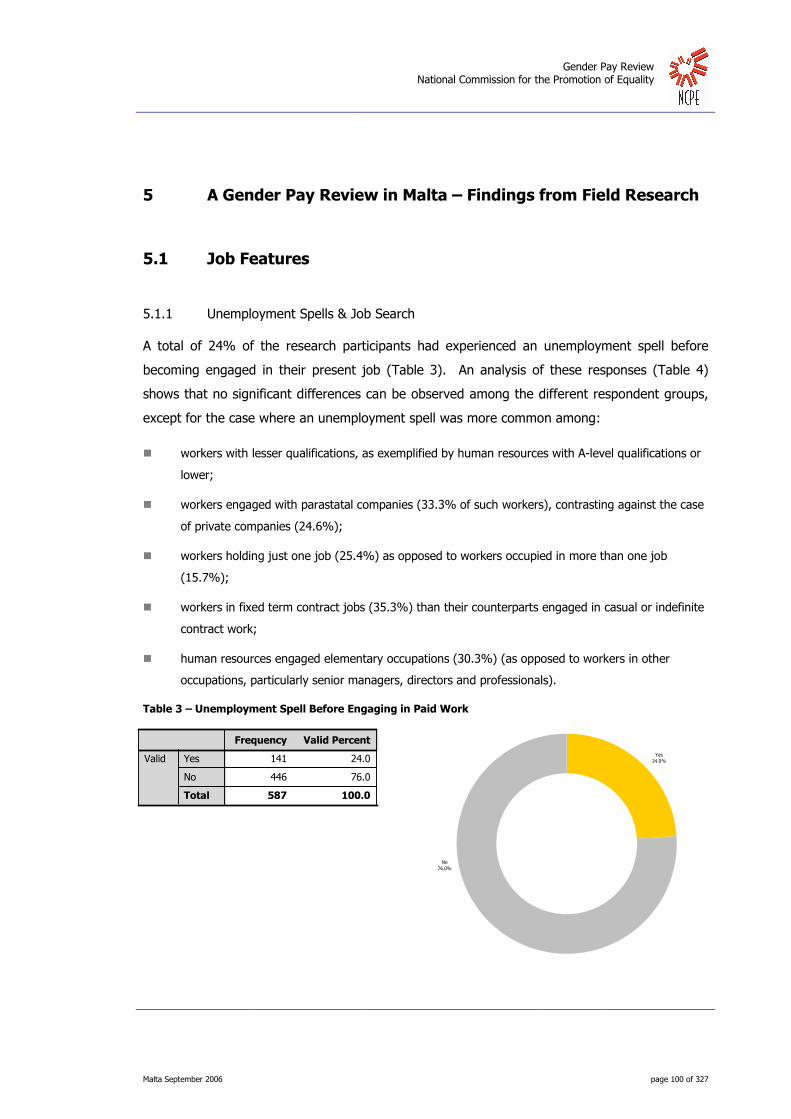
Gender Pay Review
National Commission for the Promotion of Equality
Malta September 2006 page 100 of 327
5 A Gender Pay Review in Malta – Findings from Field Research
5.1 Job Features
5.1.1 Unemployment Spells & Job Search
A total of 24% of the research participants had experienced an unemployment spell before
becoming engaged in their present job (Table 3). An analysis of these responses (Table 4)
shows that no significant differences can be observed among the different respondent groups,
except for the case where an unemployment spell was more common among:
� workers with lesser qualifications, as exemplified by human resources with A-level qualifications or
lower;
� workers engaged with parastatal companies (33.3% of such workers), contrasting against the case
of private companies (24.6%);
� workers holding just one job (25.4%) as opposed to workers occupied in more than one job
(15.7%);
� workers in fixed term contract jobs (35.3%) than their counterparts engaged in casual or indefinite
contract work;
� human resources engaged elementary occupations (30.3%) (as opposed to workers in other
occupations, particularly senior managers, directors and professionals).
Table 3 – Unemployment Spell Before Engaging in Paid Work
141 24.0
446 76.0
587 100.0
Yes
No
Total
Valid
Frequency Valid Percent
Yes
24.0%
No
76.0%

Gender Pay Review
National Commission for the Promotion of Equality
Malta September 2006 page 101 of 327
Table 4 – Analysis of Unemployed/Job Seeking Period Prior to Present Job
81 23.3% 267 76.7% 348 100.0%
60 25.1% 179 74.9% 239 100.0%
47 25.7% 136 74.3% 183 100.0%
33 21.0% 124 79.0% 157 100.0%
27 24.8% 82 75.2% 109 100.0%
21 21.9% 75 78.1% 96 100.0%
11 28.2% 28 71.8% 39 100.0%
56 19.7% 228 80.3% 284 100.0%
5 38.5% 8 61.5% 13 100.0%
0 .0% 2 100.0% 2 100.0%
71 28.4% 179 71.6% 250 100.0%
9 23.7% 29 76.3% 38 100.0%
60 26.7% 165 73.3% 225 100.0%
81 22.4% 281 77.6% 362 100.0%
46 27.1% 124 72.9% 170 100.0%
13 26.5% 36 73.5% 49 100.0%
1 20.0% 4 80.0% 5 100.0%
0 .0% 1 100.0% 1 100.0%
53 24.1% 167 75.9% 220 100.0%
47 23.2% 156 76.8% 203 100.0%
17 30.4% 39 69.6% 56 100.0%
7 23.3% 23 76.7% 30 100.0%
2 18.2% 9 81.8% 11 100.0%
6 26.1% 17 73.9% 23 100.0%
32 24.6% 98 75.4% 130 100.0%
44 29.1% 107 70.9% 151 100.0%
30 32.3% 63 67.7% 93 100.0%
10 17.5% 47 82.5% 57 100.0%
4 16.0% 21 84.0% 25 100.0%
3 10.7% 25 89.3% 28 100.0%
10 17.2% 48 82.8% 58 100.0%
4 14.8% 23 85.2% 27 100.0%
0 .0% 0 .0% 0 .0%
4 22.2% 14 77.8% 18 100.0%
33 25.6% 96 74.4% 129 100.0%
12 33.3% 24 66.7% 36 100.0%
1 2.7% 36 97.3% 37 100.0%
91 24.6% 279 75.4% 370 100.0%
3 37.5% 5 62.5% 8 100.0%
1 14.3% 6 85.7% 7 100.0%
0 .0% 2 100.0% 2 100.0%
2 12.5% 14 87.5% 16 100.0%
31 24.6% 95 75.4% 126 100.0%
8 12.7% 55 87.3% 63 100.0%
62 25.9% 177 74.1% 239 100.0%
38 27.0% 103 73.0% 141 100.0%
118 23.9% 376 76.1% 494 100.0%
2 14.3% 12 85.7% 14 100.0%
21 26.6% 58 73.4% 79 100.0%
13 15.7% 70 84.3% 83 100.0%
128 25.4% 376 74.6% 504 100.0%
18 22.8% 61 77.2% 79 100.0%
19 35.2% 35 64.8% 54 100.0%
104 22.9% 350 77.1% 454 100.0%
6 13.6% 38 86.4% 44 100.0%
14 15.2% 78 84.8% 92 100.0%
13 20.6% 50 79.4% 63 100.0%
36 27.1% 97 72.9% 133 100.0%
0 .0% 0 .0% 0 .0%
2 25.0% 6 75.0% 8 100.0%
14 24.6% 43 75.4% 57 100.0%
23 30.3% 53 69.7% 76 100.0%
33 28.9% 81 71.1% 114 100.0%
Male
Female
Gender
<24
25 - 34 years
35 - 44 years
45 - 54 years
55 +
Participant Age
Married or living with partner
Separated, not living with partner
Widowed, not living with partner
Not married, no partner with parents
Not married, not with partner, alone
Status
Yes
No
Caring Responsibilities
at Home
1
2
3
4
Variety of Caring
Responsibilities At
Home
<1hr
1 - 3 hrs
4 - 5 hrs
6 - 7 hrs
8 - 9 hrs
>9 hrs
How much time do you
spend in domestic
work?
Less than O- Level equivalent
O-Level
A-Level
Vocational Certification (City & Guilds or equivalent)
University Diploma or equivalent -Local
University Diploma or equivalent -Overseas Institution
University Degree- Baccalaureate
University Degree- Masters' Level
University Doctoral
Others
What is your highest
qualification?
Government Organisation/Department
Parastatal Company
Publicly Listed Company
Private Company/Sole Trader
Commercial Partnership
Non-profit Organisation
Describe the company
where you are
employed
Agriculture & Fishery
Stone Quarrying & Construction
Governmental Services
Hotel & Catering
Services
Manufacturing
Sector of Activity
Full time
Ful time (reduced hours)
Part time
What is your present
main job?
More than One Job
One Job Only
Are you engaged in
more then one job?
Casual
Permanent-Fixed Term Contract
Permanent-Indefinite Contract
What is the basis of
your main job?
Senior Managers, Directors
Professionals
Associate Professionals & Technical
Clerical employees
Skilled agriculture & fishery workers
Crafts & related trades
Plant & machine operator, assembly workers
Elementary occupations
Shop & Market services
Your level of
responsibility
N N %
Yes
N N %
No
N N %
Total
Did you experience an unemployment spell?
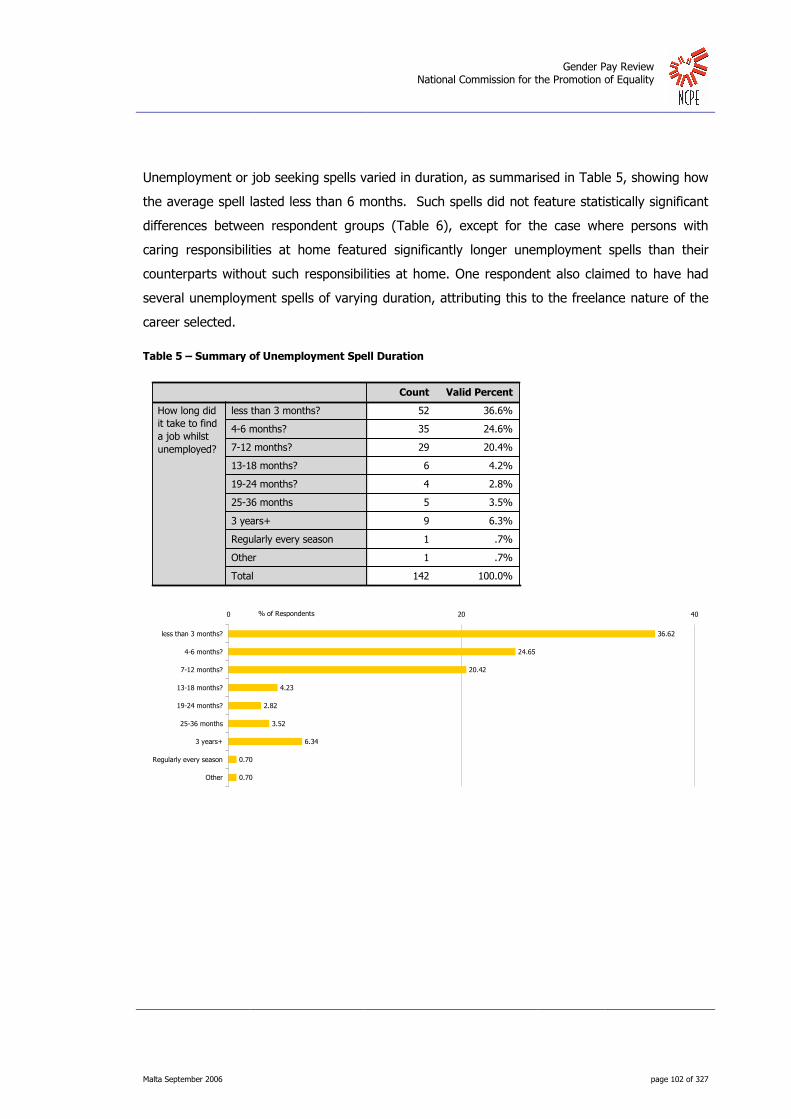
Gender Pay Review
National Commission for the Promotion of Equality
Malta September 2006 page 102 of 327
Unemployment or job seeking spells varied in duration, as summarised in Table 5, showing how
the average spell lasted less than 6 months. Such spells did not feature statistically significant
differences between respondent groups (Table 6), except for the case where persons with
caring responsibilities at home featured significantly longer unemployment spells than their
counterparts without such responsibilities at home. One respondent also claimed to have had
several unemployment spells of varying duration, attributing this to the freelance nature of the
career selected.
Table 5 – Summary of Unemployment Spell Duration
52 36.6%
35 24.6%
29 20.4%
6 4.2%
4 2.8%
5 3.5%
9 6.3%
1 .7%
1 .7%
142 100.0%
less than 3 months?
4-6 months?
7-12 months?
13-18 months?
19-24 months?
25-36 months
3 years+
Regularly every season
Other
Total
How long did
it take to find
a job whilst
unemployed?
Count Valid Percent
36.62
24.65
20.42
4.23
2.82
3.52
6.34
0.70
0.70
0 20 40
less than 3 months?
4-6 months?
7-12 months?
13-18 months?
19-24 months?
25-36 months
3 years+
Regularly every season
Other
% of Respondents

Gender Pay Review
National Commission for the Promotion of Equality
Malta September 2006 page 103 of 327
Table 6 – Analysis of Duration of Unemployment Spell Across Respondent Groups
29 35.4% 19 23.2% 16 19.5% 4 4.9% 3 3.7% 4 4.9% 5 6.1% 1 1.2% 1 1.2% 82 100.0%
23 38.3% 16 26.7% 13 21.7% 2 3.3% 1 1.7% 1 1.7% 4 6.7% 0 .0% 0 .0% 60 100.0%
16 34.0% 15 31.9% 12 25.5% 1 2.1% 0 .0% 1 2.1% 1 2.1% 1 2.1% 0 .0% 47 100.0%
14 42.4% 6 18.2% 9 27.3% 1 3.0% 2 6.1% 0 .0% 0 .0% 0 .0% 1 3.0% 33 100.0%
10 35.7% 8 28.6% 4 14.3% 0 .0% 0 .0% 2 7.1% 4 14.3% 0 .0% 0 .0% 28 100.0%
7 33.3% 2 9.5% 3 14.3% 3 14.3% 1 4.8% 2 9.5% 3 14.3% 0 .0% 0 .0% 21 100.0%
4 36.4% 3 27.3% 1 9.1% 1 9.1% 1 9.1% 0 .0% 1 9.1% 0 .0% 0 .0% 11 100.0%
26 45.6% 13 22.8% 7 12.3% 3 5.3% 2 3.5% 2 3.5% 4 7.0% 0 .0% 0 .0% 57 100.0%
2 40.0% 1 20.0% 0 .0% 1 20.0% 0 .0% 0 .0% 1 20.0% 0 .0% 0 .0% 5 100.0%
0 .0% 0 .0% 0 .0% 0 .0% 0 .0% 0 .0% 0 .0% 0 .0% 0 .0% 0 .0%
22 31.0% 18 25.4% 20 28.2% 2 2.8% 1 1.4% 3 4.2% 3 4.2% 1 1.4% 1 1.4% 71 100.0%
2 22.2% 3 33.3% 2 22.2% 0 .0% 1 11.1% 0 .0% 1 11.1% 0 .0% 0 .0% 9 100.0%
23 38.3% 10 16.7% 12 20.0% 2 3.3% 3 5.0% 3 5.0% 6 10.0% 0 .0% 1 1.7% 60 100.0%
29 35.4% 25 30.5% 17 20.7% 4 4.9% 1 1.2% 2 2.4% 3 3.7% 1 1.2% 0 .0% 82 100.0%
18 39.1% 8 17.4% 10 21.7% 0 .0% 3 6.5% 1 2.2% 5 10.9% 0 .0% 1 2.2% 46 100.0%
5 38.5% 2 15.4% 2 15.4% 2 15.4% 0 .0% 1 7.7% 1 7.7% 0 .0% 0 .0% 13 100.0%
0 .0% 0 .0% 0 .0% 0 .0% 0 .0% 1 100.0% 0 .0% 0 .0% 0 .0% 1 100.0%
17 32.1% 14 26.4% 13 24.5% 1 1.9% 2 3.8% 2 3.8% 3 5.7% 1 1.9% 0 .0% 53 100.0%
20 41.7% 10 20.8% 10 20.8% 2 4.2% 2 4.2% 1 2.1% 2 4.2% 0 .0% 1 2.1% 48 100.0%
5 29.4% 7 41.2% 2 11.8% 1 5.9% 0 .0% 1 5.9% 1 5.9% 0 .0% 0 .0% 17 100.0%
3 42.9% 0 .0% 2 28.6% 1 14.3% 0 .0% 0 .0% 1 14.3% 0 .0% 0 .0% 7 100.0%
0 .0% 1 50.0% 0 .0% 0 .0% 0 .0% 0 .0% 1 50.0% 0 .0% 0 .0% 2 100.0%
5 83.3% 0 .0% 1 16.7% 0 .0% 0 .0% 0 .0% 0 .0% 0 .0% 0 .0% 6 100.0%
8 25.0% 7 21.9% 7 21.9% 2 6.3% 3 9.4% 2 6.3% 3 9.4% 0 .0% 0 .0% 32 100.0%
12 27.3% 11 25.0% 11 25.0% 3 6.8% 0 .0% 3 6.8% 3 6.8% 1 2.3% 0 .0% 44 100.0%
12 40.0% 10 33.3% 4 13.3% 0 .0% 0 .0% 0 .0% 3 10.0% 0 .0% 1 3.3% 30 100.0%
6 54.5% 1 9.1% 2 18.2% 1 9.1% 1 9.1% 0 .0% 0 .0% 0 .0% 0 .0% 11 100.0%
2 50.0% 1 25.0% 1 25.0% 0 .0% 0 .0% 0 .0% 0 .0% 0 .0% 0 .0% 4 100.0%
2 66.7% 1 33.3% 0 .0% 0 .0% 0 .0% 0 .0% 0 .0% 0 .0% 0 .0% 3 100.0%
6 60.0% 2 20.0% 2 20.0% 0 .0% 0 .0% 0 .0% 0 .0% 0 .0% 0 .0% 10 100.0%
3 75.0% 1 25.0% 0 .0% 0 .0% 0 .0% 0 .0% 0 .0% 0 .0% 0 .0% 4 100.0%
0 .0% 0 .0% 0 .0% 0 .0% 0 .0% 0 .0% 0 .0% 0 .0% 0 .0% 0 .0%
1 25.0% 1 25.0% 2 50.0% 0 .0% 0 .0% 0 .0% 0 .0% 0 .0% 0 .0% 4 100.0%
13 38.2% 8 23.5% 6 17.6% 2 5.9% 1 2.9% 2 5.9% 2 5.9% 0 .0% 0 .0% 34 100.0%
3 25.0% 2 16.7% 4 33.3% 0 .0% 2 16.7% 0 .0% 1 8.3% 0 .0% 0 .0% 12 100.0%
1 100.0% 0 .0% 0 .0% 0 .0% 0 .0% 0 .0% 0 .0% 0 .0% 0 .0% 1 100.0%
32 35.2% 25 27.5% 18 19.8% 4 4.4% 1 1.1% 3 3.3% 6 6.6% 1 1.1% 1 1.1% 91 100.0%
2 66.7% 0 .0% 1 33.3% 0 .0% 0 .0% 0 .0% 0 .0% 0 .0% 0 .0% 3 100.0%
1 100.0% 0 .0% 0 .0% 0 .0% 0 .0% 0 .0% 0 .0% 0 .0% 0 .0% 1 100.0%
0 .0% 0 .0% 0 .0% 0 .0% 0 .0% 0 .0% 0 .0% 0 .0% 0 .0% 0 .0%
1 50.0% 0 .0% 0 .0% 0 .0% 0 .0% 0 .0% 1 50.0% 0 .0% 0 .0% 2 100.0%
11 34.4% 7 21.9% 6 18.8% 2 6.3% 1 3.1% 2 6.3% 3 9.4% 0 .0% 0 .0% 32 100.0%
2 25.0% 5 62.5% 0 .0% 0 .0% 0 .0% 0 .0% 1 12.5% 0 .0% 0 .0% 8 100.0%
22 35.5% 15 24.2% 15 24.2% 2 3.2% 2 3.2% 1 1.6% 4 6.5% 1 1.6% 0 .0% 62 100.0%
16 42.1% 8 21.1% 8 21.1% 2 5.3% 1 2.6% 2 5.3% 0 .0% 0 .0% 1 2.6% 38 100.0%
45 37.8% 30 25.2% 24 20.2% 5 4.2% 3 2.5% 4 3.4% 7 5.9% 0 .0% 1 .8% 119 100.0%
1 50.0% 1 50.0% 0 .0% 0 .0% 0 .0% 0 .0% 0 .0% 0 .0% 0 .0% 2 100.0%
6 28.6% 4 19.0% 5 23.8% 1 4.8% 1 4.8% 1 4.8% 2 9.5% 1 4.8% 0 .0% 21 100.0%
5 38.5% 3 23.1% 3 23.1% 1 7.7% 1 7.7% 0 .0% 0 .0% 0 .0% 0 .0% 13 100.0%
47 36.4% 32 24.8% 26 20.2% 5 3.9% 3 2.3% 5 3.9% 9 7.0% 1 .8% 1 .8% 129 100.0%
4 22.2% 4 22.2% 5 27.8% 1 5.6% 1 5.6% 0 .0% 2 11.1% 1 5.6% 0 .0% 18 100.0%
10 52.6% 7 36.8% 2 10.5% 0 .0% 0 .0% 0 .0% 0 .0% 0 .0% 0 .0% 19 100.0%
38 36.2% 24 22.9% 22 21.0% 5 4.8% 3 2.9% 5 4.8% 7 6.7% 0 .0% 1 1.0% 105 100.0%
4 66.7% 1 16.7% 0 .0% 0 .0% 0 .0% 0 .0% 1 16.7% 0 .0% 0 .0% 6 100.0%
8 57.1% 3 21.4% 2 14.3% 0 .0% 0 .0% 0 .0% 1 7.1% 0 .0% 0 .0% 14 100.0%
4 30.8% 1 7.7% 3 23.1% 1 7.7% 0 .0% 1 7.7% 2 15.4% 0 .0% 1 7.7% 13 100.0%
14 38.9% 11 30.6% 6 16.7% 1 2.8% 0 .0% 3 8.3% 1 2.8% 0 .0% 0 .0% 36 100.0%
0 .0% 0 .0% 0 .0% 0 .0% 0 .0% 0 .0% 0 .0% 0 .0% 0 .0% 0 .0%
2 66.7% 0 .0% 1 33.3% 0 .0% 0 .0% 0 .0% 0 .0% 0 .0% 0 .0% 3 100.0%
6 42.9% 1 7.1% 6 42.9% 1 7.1% 0 .0% 0 .0% 0 .0% 0 .0% 0 .0% 14 100.0%
6 26.1% 4 17.4% 5 21.7% 1 4.3% 3 13.0% 1 4.3% 2 8.7% 1 4.3% 0 .0% 23 100.0%
8 24.2% 14 42.4% 6 18.2% 2 6.1% 1 3.0% 0 .0% 2 6.1% 0 .0% 0 .0% 33 100.0%
Male
Female
Gender
<24
25 - 34 years
35 - 44 years
45 - 54 years
55 +
Participant Age
Married or living with partner
Separated, not living with partner
Widowed, not living with partner
Not married, no partner with parents
Not married, not with partner, alone
Status
Yes
No
Caring Responsibilities
at Home
1
2
3
Variety of Caring
Responsibilities At
Home
<1hr
1 - 3 hrs
4 - 5 hrs
6 - 7 hrs
8 - 9 hrs
>9 hrs
How much time do you
spend in domestic
work?
Less than O- Level equivalent
O-Level
A-Level
Vocational Certification (City & Guilds or equivalent)
University Diploma or equivalent -Local
University Diploma or equivalent -Overseas Institution
University Degree- Baccalaureate
University Degree- Masters' Level
University Doctoral
Others
What is your highest
qualification?
Government Organisation/Department
Parastatal Company
Publicly Listed Company
Private Company/Sole Trader
Commercial Partnership
Non-profit Organisation
Describe the company
where you are
employed
Agriculture & Fishery
Stone Quarrying & Construction
Governmental Services
Hotel & Catering
Services
Manufacturing
Sector of Activity
Full time
Ful time (reduced hours)
Part time
What is your present
main job?
More than One Job
One Job Only
Are you engaged in
more then one job?
Casual
Permanent-Fixed Term Contract
Permanent-Indefinite Contract
What is the basis of
your main job?
Senior Managers, Directors
Professionals
Associate Professionals & Technical
Clerical employees
Skilled agriculture & fishery workers
Crafts & related trades
Plant & machine operator, assembly workers
Elementary occupations
Shop & Market services
Your level of
responsibility
N N %
less than 3 months?
N N %
4-6 months?
N N %
7-12 months?
N N %
13-18 months?
N N %
19-24 months?
N N %
25-36 months
N N %
3 years+
N N %
Regularly every
season
N N %
Other
N N %
Total
How long did it take to find a job whilst unemployed?

Gender Pay Review
National Commission for the Promotion of Equality
Malta September 2006 page 104 of 327
5.1.2 Training in Present Job
Table 7 summarises how 43.5% of the research participants undertook some form of training
whilst employed in their present job to increase their employability. An analysis of these
responses across respondent groups is set out in Table 8, showing that training intended to
augment employability was a significantly more common feature among research participants:
� aged between 25 and 54 years, or
� featuring A-level or vocational or University qualifications, or
� employed in parastatal or publicly listed or commercial partnership employers, or
� employed in a full-time job (even with reduced hours), or
� engaged in senior manager or professional or associate professional or clerical occupations.
Table 7 – Summary of Responses: Training Undertaken in Present Job
255 43.5%
331 56.5%
586 100.0%
Yes
No
Total
Did you undergo training
to increase the chance of
employment?
Count Valid Percent
Yes
43.5%
No
56.5%

Gender Pay Review
National Commission for the Promotion of Equality
Malta September 2006 page 105 of 327
Table 8 – Analysis of Training Undertaken in Present Job
152 43.7% 196 56.3% 348 100.0%
103 43.3% 135 56.7% 238 100.0%
68 37.2% 115 62.8% 183 100.0%
80 51.3% 76 48.7% 156 100.0%
54 49.5% 55 50.5% 109 100.0%
39 40.6% 57 59.4% 96 100.0%
11 28.2% 28 71.8% 39 100.0%
128 45.2% 155 54.8% 283 100.0%
9 69.2% 4 30.8% 13 100.0%
0 .0% 2 100.0% 2 100.0%
105 42.0% 145 58.0% 250 100.0%
13 34.2% 25 65.8% 38 100.0%
105 46.9% 119 53.1% 224 100.0%
150 41.4% 212 58.6% 362 100.0%
77 45.6% 92 54.4% 169 100.0%
24 49.0% 25 51.0% 49 100.0%
3 60.0% 2 40.0% 5 100.0%
1 100.0% 0 .0% 1 100.0%
96 43.6% 124 56.4% 220 100.0%
87 42.9% 116 57.1% 203 100.0%
26 46.4% 30 53.6% 56 100.0%
13 43.3% 17 56.7% 30 100.0%
3 27.3% 8 72.7% 11 100.0%
8 36.4% 14 63.6% 22 100.0%
28 21.5% 102 78.5% 130 100.0%
58 38.4% 93 61.6% 151 100.0%
51 54.8% 42 45.2% 93 100.0%
36 63.2% 21 36.8% 57 100.0%
10 40.0% 15 60.0% 25 100.0%
17 60.7% 11 39.3% 28 100.0%
26 45.6% 31 54.4% 57 100.0%
21 77.8% 6 22.2% 27 100.0%
0 .0% 0 .0% 0 .0%
8 44.4% 10 55.6% 18 100.0%
61 47.7% 67 52.3% 128 100.0%
20 55.6% 16 44.4% 36 100.0%
22 59.5% 15 40.5% 37 100.0%
144 38.9% 226 61.1% 370 100.0%
5 62.5% 3 37.5% 8 100.0%
3 42.9% 4 57.1% 7 100.0%
1 50.0% 1 50.0% 2 100.0%
6 37.5% 10 62.5% 16 100.0%
64 51.2% 61 48.8% 125 100.0%
24 38.1% 39 61.9% 63 100.0%
103 43.1% 136 56.9% 239 100.0%
57 40.4% 84 59.6% 141 100.0%
230 46.7% 263 53.3% 493 100.0%
8 57.1% 6 42.9% 14 100.0%
17 21.5% 62 78.5% 79 100.0%
37 44.6% 46 55.4% 83 100.0%
218 43.3% 285 56.7% 503 100.0%
25 31.6% 54 68.4% 79 100.0%
24 44.4% 30 55.6% 54 100.0%
206 45.5% 247 54.5% 453 100.0%
23 52.3% 21 47.7% 44 100.0%
51 55.4% 41 44.6% 92 100.0%
34 54.8% 28 45.2% 62 100.0%
63 47.4% 70 52.6% 133 100.0%
0 .0% 0 .0% 0 .0%
1 12.5% 7 87.5% 8 100.0%
16 28.1% 41 71.9% 57 100.0%
19 25.0% 57 75.0% 76 100.0%
48 42.1% 66 57.9% 114 100.0%
Male
Female
Gender
<24
25 - 34 years
35 - 44 years
45 - 54 years
55 +
Participant Age
Married or living with partner
Separated, not living with partner
Widowed, not living with partner
Not married, no partner with parents
Not married, not with partner, alone
Status
Yes
No
Caring Responsibilities
at Home
1
2
3
4
Variety of Caring
Responsibilities At
Home
<1hr
1 - 3 hrs
4 - 5 hrs
6 - 7 hrs
8 - 9 hrs
>9 hrs
How much time do you
spend in domestic
work?
Less than O- Level equivalent
O-Level
A-Level
Vocational Certification (City & Guilds or equivalent)
University Diploma or equivalent -Local
University Diploma or equivalent -Overseas Institution
University Degree- Baccalaureate
University Degree- Masters' Level
University Doctoral
Others
What is your highest
qualification?
Government Organisation/Department
Parastatal Company
Publicly Listed Company
Private Company/Sole Trader
Commercial Partnership
Non-profit Organisation
Describe the company
where you are
employed
Agriculture & Fishery
Stone Quarrying & Construction
Governmental Services
Hotel & Catering
Services
Manufacturing
Sector of Activity
Full time
Ful time (reduced hours)
Part time
What is your present
main job?
More than One Job
One Job Only
Are you engaged in
more then one job?
Casual
Permanent-Fixed Term Contract
Permanent-Indefinite Contract
What is the basis of
your main job?
Senior Managers, Directors
Professionals
Associate Professionals & Technical
Clerical employees
Skilled agriculture & fishery workers
Crafts & related trades
Plant & machine operator, assembly workers
Elementary occupations
Shop & Market services
Your level of
responsibility
N N %
Yes
N N %
No
N N %
Total
Did you undergo training to increase the chance of employment?

Gender Pay Review
National Commission for the Promotion of Equality
Malta September 2006 page 106 of 327
Table 9 sets out a summary of research participants claimed sources of funding for their
training, wherein a significant 35.5% of the cases mentioned training forming part of a
Government scheme, while 32.0% of the cases asserted to have received training funded by
their employer. Equally noteworthy is the fact that 31.3% of the participants (undertaking
training) funded their own training, while another 22.3% of cases had training funded by their
parents.
An analysis of the responses across research participant groups showed some significant
differences, with the:
� self-funding training being a relatively more common feature among:
– women, or
– workers aged between 25 and 44 years, or
– workers who are single or married, or
– workers with A-level education or University degree (or better), or
– workers engaged with parastatal or publicly listed employers, or
– workers in hotel & catering or services establishments, or
– workers in full-time jobs, or
– workers engaged in more than one job, or
– workers engaged in permanent contracts of work, or
– human resources employed in senior management or professional occupations;
� employer funding training being a relatively more common feature among workers who are;
– men, or
– aged between 45 and 54 years, or
– married & living with a partner or separated, or
– devote between 4 and 5 hours to domestic work daily, or
– employed with publicly listed employers, or
– employed with manufacturing establishments, or
– employed with a permanent contract, or
– engaged in senior management jobs.
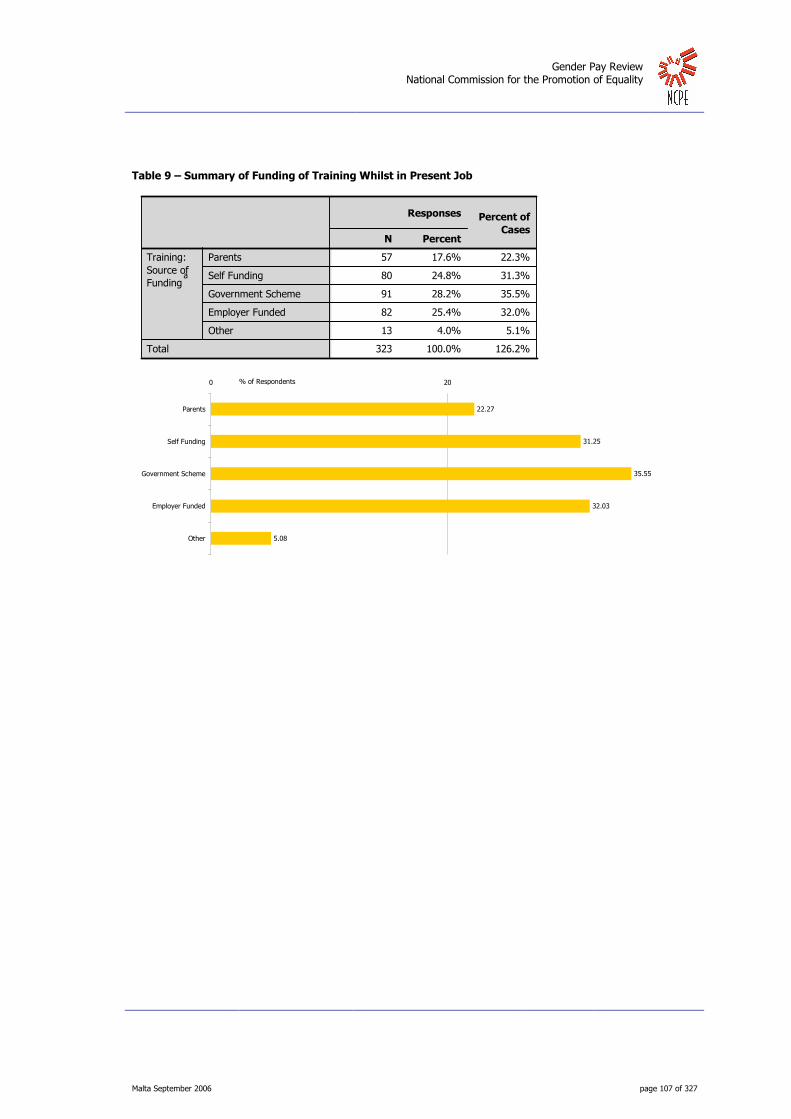
Gender Pay Review
National Commission for the Promotion of Equality
Malta September 2006 page 107 of 327
Table 9 – Summary of Funding of Training Whilst in Present Job
57 17.6% 22.3%
80 24.8% 31.3%
91 28.2% 35.5%
82 25.4% 32.0%
13 4.0% 5.1%
323 100.0% 126.2%
Parents
Self Funding
Government Scheme
Employer Funded
Other
Training:
Source of
Fundinga
Total
N Percent
Responses Percent of
Cases
Dichotomy group tabulated at value 1.a.
22.27
31.25
35.55
32.03
5.08
0 20
Parents
Self Funding
Government Scheme
Employer Funded
Other
% of Respondents

Gender Pay Review
National Commission for the Promotion of Equality
Malta September 2006 page 108 of 327
Table 10 – Analysis of Training Funding Across Respondent Groups
26 38 59 61 9
31 42 32 21 4
29 21 32 4 2
12 25 25 31 8
8 20 18 20
5 10 10 21 3
3 4 6 3
22 43 40 53 8
1 2 1 6
30 32 45 20 4
4 3 5 3 1
21 33 32 46 7
36 47 59 36 6
17 24 26 33 4
4 6 5 11 3
2 2
1 1
22 25 36 30 6
18 34 30 30 3
7 9 11 11
2 4 4 4
1 1 1
1 1 4 2 1
4 5 10 8 1
13 12 24 15 5
17 20 18 10 2
7 6 17 15 1
3 4 3 3
2 9 2 10
6 10 10 8 3
5 12 4 8 1
2 3 5
8 15 30 22 2
4 9 6 7 1
6 12 2 9
37 41 50 41 10
2 3 1 2
2 1
1
1 2 5 1
9 16 33 23 1
7 10 5 3
25 35 36 29 9
15 16 17 22 2
48 74 80 79 11
2 1 4 1
7 5 7 2 2
8 15 11 15 2
49 65 80 67 11
8 7 10 2 2
9 8 10 7 2
40 65 71 73 9
6 9 5 12 1
12 22 18 17 3
4 9 13 14 1
16 21 25 18 2
1
4 4 6 4
2 1 6 6 3
13 14 18 10 3
Male
Female
Gender
<24
25 - 34 years
35 - 44 years
45 - 54 years
55 +
Participant Age
Married or living with partner
Separated, not living with partner
Not married, no partner with parents
Not married, not with partner, alone
Status
Yes
No
Caring Responsibilities
at Home
1
2
3
4
Variety of Caring
Responsibilities At
Home
<1hr
1 - 3 hrs
4 - 5 hrs
6 - 7 hrs
8 - 9 hrs
>9 hrs
How much time do you
spend in domestic
work?
Less than O- Level equivalent
O-Level
A-Level
Vocational Certification (City & Guilds or
equivalent)
University Diploma or equivalent -Local
University Diploma or equivalent -Overseas
Institution
University Degree- Baccalaureate
University Degree- Masters' Level
Others
What is your highest
qualification?
Government Organisation/Department
Parastatal Company
Publicly Listed Company
Private Company/Sole Trader
Commercial Partnership
Non-profit Organisation
Describe the company
where you are
employed
Agriculture & Fishery
Stone Quarrying & Construction
Governmental Services
Hotel & Catering
Services
Manufacturing
Sector of Activity
Full time
Ful time (reduced hours)
Part time
What is your present
main job?
More than One Job
One Job Only
Are you engaged in
more then one job?
Casual
Permanent-Fixed Term Contract
Permanent-Indefinite Contract
What is the basis of
your main job?
Senior Managers, Directors
Professionals
Associate Professionals & Technical
Clerical employees
Crafts & related trades
Plant & machine operator, assembly workers
Elementary occupations
Shop & Market services
Your level of
responsibility
Parents Self FundingGovernment
Scheme
Employer
FundedOther
Source of Funding of Training

Gender Pay Review
National Commission for the Promotion of Equality
Malta September 2006 page 109 of 327
Table 10 – Analysis of Training Funding Across Respondent Groups (continued)
17.1 25.0 38.8 40.1 5.9
29.8 40.4 30.8 20.2 3.8
42.6 30.9 47.1 5.9 2.9
15.0 31.3 31.3 38.8 10.0
14.5 36.4 32.7 36.4
12.8 25.6 25.6 53.8 7.7
27.3 36.4 54.5 27.3
16.9 33.1 30.8 40.8 6.2
11.1 22.2 11.1 66.7
28.8 30.8 43.3 19.2 3.8
30.8 23.1 38.5 23.1 7.7
19.6 30.8 29.9 43.0 6.5
24.2 31.5 39.6 24.2 4.0
21.5 30.4 32.9 41.8 5.1
16.7 25.0 20.8 45.8 12.5
66.7 66.7
100.0 100.0
23.2 26.3 37.9 31.6 6.3
20.5 38.6 34.1 34.1 3.4
26.9 34.6 42.3 42.3
15.4 30.8 30.8 30.8
33.3 33.3 33.3
11.1 11.1 44.4 22.2 11.1
14.3 17.9 35.7 28.6 3.6
22.0 20.3 40.7 25.4 8.5
33.3 39.2 35.3 19.6 3.9
20.0 17.1 48.6 42.9 2.9
30.0 40.0 30.0 30.0
11.8 52.9 11.8 58.8
22.2 37.0 37.0 29.6 11.1
23.8 57.1 19.0 38.1 4.8
25.0 37.5 62.5
12.7 23.8 47.6 34.9 3.2
20.0 45.0 30.0 35.0 5.0
28.6 57.1 9.5 42.9
25.7 28.5 34.7 28.5 6.9
40.0 60.0 20.0 40.0
66.7 33.3
100.0
16.7 33.3 83.3 16.7
13.8 24.6 50.8 35.4 1.5
30.4 43.5 21.7 13.0
24.0 33.7 34.6 27.9 8.7
26.3 28.1 29.8 38.6 3.5
20.9 32.2 34.8 34.3 4.8
25.0 12.5 50.0 12.5
38.9 27.8 38.9 11.1 11.1
21.6 40.5 29.7 40.5 5.4
22.4 29.7 36.5 30.6 5.0
33.3 29.2 41.7 8.3 8.3
36.0 32.0 40.0 28.0 8.0
19.3 31.4 34.3 35.3 4.3
26.1 39.1 21.7 52.2 4.3
23.1 42.3 34.6 32.7 5.8
11.4 25.7 37.1 40.0 2.9
25.4 33.3 39.7 28.6 3.2
100.0
25.0 25.0 37.5 25.0
11.1 5.6 33.3 33.3 16.7
27.1 29.2 37.5 20.8 6.3
R %Male
R %Female
Gender
R %<24
R %25 - 34 years
R %35 - 44 years
R %45 - 54 years
R %55 +
Participant Age
R %Married or living with partner
R %Separated, not living with partner
R %Not married, no partner with parents
R %Not married, not with partner, alone
Status
R %Yes
R %No
Caring Responsibilities
at Home
R %1
R %2
R %3
R %4
Variety of Caring
Responsibilities At
Home
R %<1hr
R %1 - 3 hrs
R %4 - 5 hrs
R %6 - 7 hrs
R %8 - 9 hrs
R %>9 hrs
How much time do you
spend in domestic
work?
R %Less than O- Level equivalent
R %O-Level
R %A-Level
R %Vocational Certification (City & Guilds or equivalent)
R %University Diploma or equivalent -Local
R %University Diploma or equivalent -Overseas Institution
R %University Degree- Baccalaureate
R %University Degree- Masters' Level
R %Others
What is your highest
qualification?
R %Government Organisation/Department
R %Parastatal Company
R %Publicly Listed Company
R %Private Company/Sole Trader
R %Commercial Partnership
R %Non-profit Organisation
Describe the company
where you are
employed
R %Agriculture & Fishery
R %Stone Quarrying & Construction
R %Governmental Services
R %Hotel & Catering
R %Services
R %Manufacturing
Sector of Activity
R %Full time
R %Ful time (reduced hours)
R %Part time
What is your present
main job?
R %More than One Job
R %One Job Only
Are you engaged in
more then one job?
R %Casual
R %Permanent-Fixed Term Contract
R %Permanent-Indefinite Contract
What is the basis of
your main job?
R %Senior Managers, Directors
R %Professionals
R %Associate Professionals & Technical
R %Clerical employees
R %Crafts & related trades
R %Plant & machine operator, assembly workers
R %Elementary occupations
R %Shop & Market services
Your level of
responsibility
Parents Self FundingGovernment
Scheme
Employer
FundedOther
Source of Funding of Training

Gender Pay Review
National Commission for the Promotion of Equality
Malta September 2006 page 110 of 327
5.1.3 Employment Experience
On average, research participants have been in employment for an estimated 155 months (or
12 years 11 months). An analysis of this experience across respondent groups (Table 12)
shows that significant differences between groups can be observed, as summarised in Table 11.
Table 11 – Summary of Employment Experience (Highest & Lowest) Across Respondent Groups
Longest Experience Shortest Experience
Gender Men Women
Participant Age 55 years and older Younger than 24 years
Family Status Married and/or living with partner Single living with parents
Caring Responsibilities at Home Has responsibilities No responsibilities
Variety of Caring Responsibilities at home No Statistically Significant Differences
Time devoted to Domestic Work 4 – 5 hours daily 8 – 9 hours daily
Highest Academic Qualifications No Statistically Significant Differences
Type of Employer Government organisation/department or
Commercial partnership
Private company
Sector of Activity Government Services Hotel & Catering
Present Job Type Full-time job Part-time job
Engaged in more than one job No Statistically Significant Differences
Basis of Main Job Permanent Indefinite Contract Casual
Occupation Type (ISCO 1988) Senior Managers, Directors Clerical

Gender Pay Review
National Commission for the Promotion of Equality
Malta September 2006 page 111 of 327
Table 12 – Analysis of Employment Experience (Months) Across Respondent Groups
190.32
103.30
38.11
108.69
198.20
301.63
407.21
232.43
188.00
360.00
66.61
135.16
211.48
119.78
207.19
222.10
285.60
60.00
134.88
177.75
193.93
147.42
69.27
187.52
195.33
143.45
124.20
168.72
188.08
147.89
106.44
143.15
.
212.33
216.16
173.94
134.12
131.97
216.00
171.14
235.00
280.13
218.47
101.47
133.01
143.29
167.47
122.93
81.63
135.39
158.04
91.44
108.53
171.41
242.42
169.58
192.66
116.77
.
172.90
146.32
186.70
115.13
Male
Female
Gender
<24
25 - 34 years
35 - 44 years
45 - 54 years
55 +
Participant Age
Married or living with partner
Separated, not living with partner
Widowed, not living with partner
Not married, no partner with parents
Not married, not with partner, alone
Status
Yes
No
Caring Responsibilities
at Home
1
2
3
4
Variety of Caring
Responsibilities At
Home
<1hr
1 - 3 hrs
4 - 5 hrs
6 - 7 hrs
8 - 9 hrs
>9 hrs
How much time do you
spend in domestic
work?
Less than O- Level equivalent
O-Level
A-Level
Vocational Certification (City & Guilds or equivalent)
University Diploma or equivalent -Local
University Diploma or equivalent -Overseas Institution
University Degree- Baccalaureate
University Degree- Masters' Level
University Doctoral
Others
What is your highest
qualification?
Government Organisation/Department
Parastatal Company
Publicly Listed Company
Private Company/Sole Trader
Commercial Partnership
Non-profit Organisation
Describe the company
where you are
employed
Agriculture & Fishery
Stone Quarrying & Construction
Governmental Services
Hotel & Catering
Services
Manufacturing
Sector of Activity
Full time
Ful time (reduced hours)
Part time
What is your present
main job?
More than One Job
One Job Only
Are you engaged in
more then one job?
Casual
Permanent-Fixed Term Contract
Permanent-Indefinite Contract
What is the basis of
your main job?
Senior Managers, Directors
Professionals
Associate Professionals & Technical
Clerical employees
Skilled agriculture & fishery workers
Crafts & related trades
Plant & machine operator, assembly workers
Elementary occupations
Shop & Market services
Your level of
responsibility
Mean
How long have
you been in
employment?
(months)

Gender Pay Review
National Commission for the Promotion of Equality
Malta September 2006 page 112 of 327
Table 13 sets out a summary of the claimed job changes by research participants, showing that
on average, each participant changed job once (median response = 2nd job). Nevertheless, an
analysis of these responses across respondent groups (Table 14) showed that whilst most
respondent groups featured a homogenous response, statistically significant differences
included:
� an observation that respondents younger than 34 years were (on average) in their second job,
whilst older research participants were (on average) in their third job;
� an observation that while unmarried respondents were typically in their second job, research
participants who were married and/or living with a partner were in their third job, while research
participants who were separated and not living with a partner were in their fourth job;
� an inference wherein respondents with caring responsibilities at home were typically in their third
job, while respondents without any caring responsibilities at home were typically in their second
job;
� an observation where respondents within the manufacturing or governmental services sectors were
typically in their second job, while respondents in the services or hotel & catering sectors were
typically in their third job.
Table 13 – Summary of Job Changes as Claimed by Research Participants
180 30.7%
135 23.0%
105 17.9%
75 12.8%
36 6.1%
22 3.7%
13 2.2%
6 1.0%
3 .5%
12 2.0%
587 100.0%
Only job ever
2nd job
3rd job
4th job
5th job
6th job
7th job
8th job
9th job
10th or more
Total
How
many
jobs did
you
change?
Count Valid Percent
30.66
23.00
17.89
12.78
6.13
3.75
2.21
1.02
0.51
2.04
0 20
Only job ever
2nd job
3rd job
4th job
5th job
6th job
7th job
8th job
9th job
10th or more
% of Respondents

Gender Pay Review
National Commission for the Promotion of Equality
Malta September 2006 page 113 of 327
Table 14 – Analysis of Job Changes as Claimed by Research Participants
109 31.3% 74 21.3% 55 15.8% 50 14.4% 22 6.3% 14 4.0% 10 2.9% 3 .9% 2 .6% 9 2.6% 348 100.0%
71 29.7% 61 25.5% 50 20.9% 25 10.5% 14 5.9% 8 3.3% 3 1.3% 3 1.3% 1 .4% 3 1.3% 239 100.0%
78 42.6% 47 25.7% 33 18.0% 11 6.0% 6 3.3% 4 2.2% 1 .5% 0 .0% 0 .0% 3 1.6% 183 100.0%
44 28.0% 40 25.5% 23 14.6% 26 16.6% 10 6.4% 7 4.5% 3 1.9% 3 1.9% 0 .0% 1 .6% 157 100.0%
29 26.6% 17 15.6% 19 17.4% 18 16.5% 8 7.3% 5 4.6% 3 2.8% 1 .9% 3 2.8% 6 5.5% 109 100.0%
20 20.8% 20 20.8% 24 25.0% 12 12.5% 8 8.3% 4 4.2% 5 5.2% 2 2.1% 0 .0% 1 1.0% 96 100.0%
9 23.1% 9 23.1% 5 12.8% 8 20.5% 4 10.3% 2 5.1% 1 2.6% 0 .0% 0 .0% 1 2.6% 39 100.0%
70 24.6% 62 21.8% 48 16.9% 40 14.1% 24 8.5% 14 4.9% 8 2.8% 5 1.8% 3 1.1% 10 3.5% 284 100.0%
1 7.7% 1 7.7% 3 23.1% 6 46.2% 1 7.7% 0 .0% 1 7.7% 0 .0% 0 .0% 0 .0% 13 100.0%
0 .0% 2 100.0% 0 .0% 0 .0% 0 .0% 0 .0% 0 .0% 0 .0% 0 .0% 0 .0% 2 100.0%
101 40.4% 59 23.6% 44 17.6% 22 8.8% 11 4.4% 7 2.8% 3 1.2% 1 .4% 0 .0% 2 .8% 250 100.0%
8 21.1% 11 28.9% 10 26.3% 7 18.4% 0 .0% 1 2.6% 1 2.6% 0 .0% 0 .0% 0 .0% 38 100.0%
54 24.0% 46 20.4% 46 20.4% 33 14.7% 14 6.2% 13 5.8% 7 3.1% 4 1.8% 2 .9% 6 2.7% 225 100.0%
126 34.8% 89 24.6% 59 16.3% 42 11.6% 22 6.1% 9 2.5% 6 1.7% 2 .6% 1 .3% 6 1.7% 362 100.0%
40 23.5% 35 20.6% 33 19.4% 25 14.7% 12 7.1% 11 6.5% 5 2.9% 3 1.8% 2 1.2% 4 2.4% 170 100.0%
14 28.6% 11 22.4% 10 20.4% 6 12.2% 2 4.1% 1 2.0% 2 4.1% 1 2.0% 0 .0% 2 4.1% 49 100.0%
0 .0% 0 .0% 2 40.0% 2 40.0% 0 .0% 1 20.0% 0 .0% 0 .0% 0 .0% 0 .0% 5 100.0%
0 .0% 0 .0% 1 100.0% 0 .0% 0 .0% 0 .0% 0 .0% 0 .0% 0 .0% 0 .0% 1 100.0%
83 37.7% 49 22.3% 36 16.4% 23 10.5% 10 4.5% 8 3.6% 4 1.8% 1 .5% 1 .5% 5 2.3% 220 100.0%
58 28.6% 44 21.7% 41 20.2% 24 11.8% 16 7.9% 6 3.0% 6 3.0% 2 1.0% 2 1.0% 4 2.0% 203 100.0%
11 19.6% 14 25.0% 7 12.5% 12 21.4% 5 8.9% 1 1.8% 2 3.6% 2 3.6% 0 .0% 2 3.6% 56 100.0%
8 26.7% 7 23.3% 6 20.0% 2 6.7% 2 6.7% 4 13.3% 0 .0% 1 3.3% 0 .0% 0 .0% 30 100.0%
3 27.3% 5 45.5% 2 18.2% 1 9.1% 0 .0% 0 .0% 0 .0% 0 .0% 0 .0% 0 .0% 11 100.0%
5 21.7% 4 17.4% 5 21.7% 6 26.1% 1 4.3% 1 4.3% 0 .0% 0 .0% 0 .0% 1 4.3% 23 100.0%
29 22.3% 21 16.2% 30 23.1% 27 20.8% 8 6.2% 3 2.3% 2 1.5% 2 1.5% 1 .8% 7 5.4% 130 100.0%
49 32.5% 36 23.8% 34 22.5% 12 7.9% 10 6.6% 4 2.6% 2 1.3% 2 1.3% 0 .0% 2 1.3% 151 100.0%
25 26.9% 27 29.0% 15 16.1% 11 11.8% 5 5.4% 4 4.3% 2 2.2% 1 1.1% 1 1.1% 2 2.2% 93 100.0%
19 33.3% 16 28.1% 5 8.8% 5 8.8% 6 10.5% 1 1.8% 4 7.0% 0 .0% 1 1.8% 0 .0% 57 100.0%
6 24.0% 8 32.0% 4 16.0% 5 20.0% 2 8.0% 0 .0% 0 .0% 0 .0% 0 .0% 0 .0% 25 100.0%
12 42.9% 2 7.1% 4 14.3% 3 10.7% 2 7.1% 3 10.7% 2 7.1% 0 .0% 0 .0% 0 .0% 28 100.0%
25 43.1% 15 25.9% 8 13.8% 4 6.9% 1 1.7% 4 6.9% 1 1.7% 0 .0% 0 .0% 0 .0% 58 100.0%
6 22.2% 8 29.6% 4 14.8% 5 18.5% 1 3.7% 2 7.4% 0 .0% 0 .0% 0 .0% 1 3.7% 27 100.0%
0 .0% 0 .0% 0 .0% 0 .0% 0 .0% 0 .0% 0 .0% 0 .0% 0 .0% 0 .0% 0 .0%
9 50.0% 2 11.1% 1 5.6% 3 16.7% 1 5.6% 1 5.6% 0 .0% 1 5.6% 0 .0% 0 .0% 18 100.0%
43 33.3% 26 20.2% 27 20.9% 17 13.2% 5 3.9% 6 4.7% 1 .8% 1 .8% 0 .0% 3 2.3% 129 100.0%
13 36.1% 9 25.0% 6 16.7% 3 8.3% 2 5.6% 2 5.6% 1 2.8% 0 .0% 0 .0% 0 .0% 36 100.0%
14 37.8% 10 27.0% 6 16.2% 5 13.5% 1 2.7% 1 2.7% 0 .0% 0 .0% 0 .0% 0 .0% 37 100.0%
106 28.6% 88 23.8% 64 17.3% 48 13.0% 26 7.0% 12 3.2% 10 2.7% 4 1.1% 3 .8% 9 2.4% 370 100.0%
2 25.0% 1 12.5% 0 .0% 2 25.0% 1 12.5% 0 .0% 1 12.5% 1 12.5% 0 .0% 0 .0% 8 100.0%
2 28.6% 1 14.3% 2 28.6% 0 .0% 1 14.3% 1 14.3% 0 .0% 0 .0% 0 .0% 0 .0% 7 100.0%
1 50.0% 1 50.0% 0 .0% 0 .0% 0 .0% 0 .0% 0 .0% 0 .0% 0 .0% 0 .0% 2 100.0%
3 18.8% 2 12.5% 3 18.8% 3 18.8% 0 .0% 0 .0% 1 6.3% 0 .0% 2 12.5% 2 12.5% 16 100.0%
43 34.1% 26 20.6% 26 20.6% 18 14.3% 4 3.2% 5 4.0% 1 .8% 0 .0% 0 .0% 3 2.4% 126 100.0%
18 28.6% 14 22.2% 11 17.5% 6 9.5% 2 3.2% 4 6.3% 3 4.8% 2 3.2% 1 1.6% 2 3.2% 63 100.0%
68 28.5% 50 20.9% 44 18.4% 32 13.4% 22 9.2% 9 3.8% 6 2.5% 3 1.3% 0 .0% 5 2.1% 239 100.0%
47 33.3% 42 29.8% 21 14.9% 16 11.3% 8 5.7% 4 2.8% 2 1.4% 1 .7% 0 .0% 0 .0% 141 100.0%
150 30.4% 111 22.5% 93 18.8% 66 13.4% 29 5.9% 18 3.6% 10 2.0% 4 .8% 3 .6% 10 2.0% 494 100.0%
2 14.3% 4 28.6% 4 28.6% 2 14.3% 2 14.3% 0 .0% 0 .0% 0 .0% 0 .0% 0 .0% 14 100.0%
28 35.4% 20 25.3% 8 10.1% 7 8.9% 5 6.3% 4 5.1% 3 3.8% 2 2.5% 0 .0% 2 2.5% 79 100.0%
22 26.5% 20 24.1% 16 19.3% 12 14.5% 5 6.0% 3 3.6% 1 1.2% 2 2.4% 0 .0% 2 2.4% 83 100.0%
158 31.3% 115 22.8% 89 17.7% 63 12.5% 31 6.2% 19 3.8% 12 2.4% 4 .8% 3 .6% 10 2.0% 504 100.0%
23 29.1% 21 26.6% 13 16.5% 8 10.1% 8 10.1% 2 2.5% 2 2.5% 1 1.3% 0 .0% 1 1.3% 79 100.0%
11 20.4% 13 24.1% 13 24.1% 4 7.4% 3 5.6% 4 7.4% 2 3.7% 1 1.9% 1 1.9% 2 3.7% 54 100.0%
146 32.2% 101 22.2% 79 17.4% 63 13.9% 25 5.5% 16 3.5% 9 2.0% 4 .9% 2 .4% 9 2.0% 454 100.0%
11 25.0% 9 20.5% 9 20.5% 7 15.9% 3 6.8% 1 2.3% 2 4.5% 1 2.3% 1 2.3% 0 .0% 44 100.0%
39 42.4% 19 20.7% 10 10.9% 10 10.9% 3 3.3% 6 6.5% 3 3.3% 0 .0% 1 1.1% 1 1.1% 92 100.0%
21 33.3% 16 25.4% 11 17.5% 7 11.1% 3 4.8% 1 1.6% 1 1.6% 1 1.6% 0 .0% 2 3.2% 63 100.0%
41 30.8% 34 25.6% 26 19.5% 14 10.5% 7 5.3% 6 4.5% 1 .8% 1 .8% 1 .8% 2 1.5% 133 100.0%
0 .0% 0 .0% 0 .0% 0 .0% 0 .0% 0 .0% 0 .0% 0 .0% 0 .0% 0 .0% 0 .0%
6 75.0% 1 12.5% 0 .0% 0 .0% 1 12.5% 0 .0% 0 .0% 0 .0% 0 .0% 0 .0% 8 100.0%
16 28.1% 14 24.6% 14 24.6% 6 10.5% 3 5.3% 1 1.8% 1 1.8% 0 .0% 0 .0% 2 3.5% 57 100.0%
15 19.7% 15 19.7% 19 25.0% 15 19.7% 8 10.5% 1 1.3% 1 1.3% 0 .0% 0 .0% 2 2.6% 76 100.0%
31 27.2% 27 23.7% 16 14.0% 16 14.0% 8 7.0% 6 5.3% 4 3.5% 3 2.6% 0 .0% 3 2.6% 114 100.0%
Male
Female
Gender
<24
25 - 34 years
35 - 44 years
45 - 54 years
55 +
Participant Age
Married or living with partner
Separated, not living with partner
Widowed, not living with partner
Not married, no partner with parents
Not married, not with partner, alone
Status
Yes
No
Caring Responsibilities
at Home
1
2
3
4
Variety of Caring
Responsibilities At
Home
<1hr
1 - 3 hrs
4 - 5 hrs
6 - 7 hrs
8 - 9 hrs
>9 hrs
How much time do you
spend in domestic
work?
Less than O- Level equivalent
O-Level
A-Level
Vocational Certification (City & Guilds or equivalent)
University Diploma or equivalent -Local
University Diploma or equivalent -Overseas Institution
University Degree- Baccalaureate
University Degree- Masters' Level
University Doctoral
Others
What is your highest
qualification?
Government Organisation/Department
Parastatal Company
Publicly Listed Company
Private Company/Sole Trader
Commercial Partnership
Non-profit Organisation
Describe the company
where you are
employed
Agriculture & Fishery
Stone Quarrying & Construction
Governmental Services
Hotel & Catering
Services
Manufacturing
Sector of Activity
Full time
Ful time (reduced hours)
Part time
What is your present
main job?
More than One Job
One Job Only
Are you engaged in
more then one job?
Casual
Permanent-Fixed Term Contract
Permanent-Indefinite Contract
What is the basis of
your main job?
Senior Managers, Directors
Professionals
Associate Professionals & Technical
Clerical employees
Skilled agriculture & fishery workers
Crafts & related trades
Plant & machine operator, assembly workers
Elementary occupations
Shop & Market services
Your level of
responsibility
N N %
Only job ever
N N %
2nd job
N N %
3rd job
N N %
4th job
N N %
5th job
N N %
6th job
N N %
7th job
N N %
8th job
N N %
9th job
N N %
10th or more
N N %
Total
How many jobs did you change?

Gender Pay Review
National Commission for the Promotion of Equality
Malta September 2006 page 114 of 327
5.1.4 Choice of Job Basis
A total of 84.2% of research participants occupied a full-time job as their main job, while
another 13.5% of the research participants were engaged in a part-time job as their main
occupation. An analysis of the reasons why participants chose part-time or full-time with
reduced hours basis of employment is set out Table 15, showing how studies account for
37.6% of the part-time employee participants’ reason for choice, while caring responsibilities
are a key consideration in the choice of non full-time work among 32.3% of the participants
engaged in non full-time work.
Table 16 sets out an analysis of these responses across respondent groups, showing how
studies prevailed as a reason for opting for non full-time work among research participants (in
non full-time work) who:
� were men, or
� were younger than 24 years of age, or
� were not married or living with a partner, but living alone, or
� had no caring responsibilities at home, or
� devoted less than 3 hours daily for domestic work, or
� were employed within the hotel & catering or services or manufacturing sectors, or
� were engaged in clerical or shop & market services occupations.
Contrastingly, caring responsibilities at home prevailed as a reason for opting for non full-time
work among research participants (in non full-time work) who:
� were women, or
� were aged between 25 and 54 years, or
� were married and/or living with a partner, or
� devoted between 4 and 7 hours daily for domestic work, or
� were employed within Governmental services sector, or
� were engaged in clerical occupations.

Gender Pay Review
National Commission for the Promotion of Equality
Malta September 2006 page 115 of 327
Table 15 – Summary of Research Participants’ Reason for Choice of Job Basis
35 37.6%
1 1.1%
20 21.5%
18 19.4%
10 10.8%
9 9.7%
93 100.0%
Still studying
Own disability/illness
Caring responsibilities at home
Could not find a full-time job
Other personal/family responsibilities
Other reasons
Total
Why did
you choose
to work on
such a
basis?
Count Valid Percent
37.63
21.51
10.75
9.68
1.08
19.35
0 20 40
Still studying
Caring responsibilities at home
Could not find a full-time job
Other personal/family responsibilities
Other reasons
Own disability/illness
% of Respondents

Gender Pay Review
National Commission for the Promotion of Equality
Malta September 2006 page 116 of 327
Table 16 – Analysis of Research Participants’ Reason for Choice of Job Basis Across Respondent Groups
15 48.4% 1 3.2% 0 .0% 8 25.8% 1 3.2% 6 19.4% 31 100.0%
20 32.3% 0 .0% 20 32.3% 10 16.1% 9 14.5% 3 4.8% 62 100.0%
33 63.5% 0 .0% 0 .0% 13 25.0% 1 1.9% 5 9.6% 52 100.0%
1 9.1% 0 .0% 6 54.5% 3 27.3% 0 .0% 1 9.1% 11 100.0%
1 7.7% 0 .0% 6 46.2% 1 7.7% 5 38.5% 0 .0% 13 100.0%
0 .0% 1 7.7% 8 61.5% 1 7.7% 2 15.4% 1 7.7% 13 100.0%
0 .0% 0 .0% 0 .0% 0 .0% 2 50.0% 2 50.0% 4 100.0%
1 2.7% 1 2.7% 19 51.4% 4 10.8% 9 24.3% 3 8.1% 37 100.0%
0 .0% 0 .0% 0 .0% 0 .0% 0 .0% 1 100.0% 1 100.0%
0 .0% 0 .0% 0 .0% 0 .0% 0 .0% 0 .0% 0 .0%
32 62.7% 0 .0% 0 .0% 13 25.5% 1 2.0% 5 9.8% 51 100.0%
2 50.0% 0 .0% 1 25.0% 1 25.0% 0 .0% 0 .0% 4 100.0%
2 6.7% 0 .0% 20 66.7% 3 10.0% 4 13.3% 1 3.3% 30 100.0%
33 52.4% 1 1.6% 0 .0% 15 23.8% 6 9.5% 8 12.7% 63 100.0%
2 7.1% 0 .0% 19 67.9% 2 7.1% 4 14.3% 1 3.6% 28 100.0%
0 .0% 0 .0% 1 50.0% 1 50.0% 0 .0% 0 .0% 2 100.0%
19 55.9% 1 2.9% 1 2.9% 9 26.5% 1 2.9% 3 8.8% 34 100.0%
10 37.0% 0 .0% 5 18.5% 3 11.1% 5 18.5% 4 14.8% 27 100.0%
2 15.4% 0 .0% 5 38.5% 3 23.1% 3 23.1% 0 .0% 13 100.0%
2 22.2% 0 .0% 4 44.4% 1 11.1% 1 11.1% 1 11.1% 9 100.0%
0 .0% 0 .0% 1 50.0% 0 .0% 0 .0% 1 50.0% 2 100.0%
0 .0% 0 .0% 4 66.7% 2 33.3% 0 .0% 0 .0% 6 100.0%
0 .0% 0 .0% 8 34.8% 11 47.8% 3 13.0% 1 4.3% 23 100.0%
11 34.4% 1 3.1% 6 18.8% 6 18.8% 6 18.8% 2 6.3% 32 100.0%
16 69.6% 0 .0% 3 13.0% 0 .0% 1 4.3% 3 13.0% 23 100.0%
4 50.0% 0 .0% 0 .0% 1 12.5% 0 .0% 3 37.5% 8 100.0%
2 100.0% 0 .0% 0 .0% 0 .0% 0 .0% 0 .0% 2 100.0%
0 .0% 0 .0% 1 100.0% 0 .0% 0 .0% 0 .0% 1 100.0%
2 66.7% 0 .0% 1 33.3% 0 .0% 0 .0% 0 .0% 3 100.0%
0 .0% 0 .0% 0 .0% 0 .0% 0 .0% 0 .0% 0 .0%
0 .0% 0 .0% 0 .0% 0 .0% 0 .0% 0 .0% 0 .0%
0 .0% 0 .0% 1 100.0% 0 .0% 0 .0% 0 .0% 1 100.0%
1 10.0% 0 .0% 5 50.0% 1 10.0% 0 .0% 3 30.0% 10 100.0%
1 25.0% 0 .0% 0 .0% 1 25.0% 1 25.0% 1 25.0% 4 100.0%
1 100.0% 0 .0% 0 .0% 0 .0% 0 .0% 0 .0% 1 100.0%
31 41.3% 1 1.3% 15 20.0% 15 20.0% 8 10.7% 5 6.7% 75 100.0%
1 33.3% 0 .0% 0 .0% 1 33.3% 1 33.3% 0 .0% 3 100.0%
0 .0% 0 .0% 0 .0% 0 .0% 0 .0% 0 .0% 0 .0%
0 .0% 0 .0% 0 .0% 0 .0% 0 .0% 0 .0% 0 .0%
0 .0% 0 .0% 0 .0% 0 .0% 0 .0% 0 .0% 0 .0%
0 .0% 0 .0% 5 55.6% 2 22.2% 0 .0% 2 22.2% 9 100.0%
12 50.0% 0 .0% 3 12.5% 6 25.0% 0 .0% 3 12.5% 24 100.0%
18 39.1% 0 .0% 10 21.7% 8 17.4% 6 13.0% 4 8.7% 46 100.0%
5 35.7% 1 7.1% 2 14.3% 2 14.3% 4 28.6% 0 .0% 14 100.0%
0 .0% 0 .0% 0 .0% 0 .0% 0 .0% 0 .0% 0 .0%
2 14.3% 0 .0% 7 50.0% 2 14.3% 2 14.3% 1 7.1% 14 100.0%
33 41.8% 1 1.3% 13 16.5% 16 20.3% 8 10.1% 8 10.1% 79 100.0%
4 28.6% 0 .0% 1 7.1% 4 28.6% 3 21.4% 2 14.3% 14 100.0%
31 39.2% 1 1.3% 19 24.1% 14 17.7% 7 8.9% 7 8.9% 79 100.0%
22 44.9% 0 .0% 8 16.3% 11 22.4% 7 14.3% 1 2.0% 49 100.0%
2 33.3% 0 .0% 2 33.3% 0 .0% 1 16.7% 1 16.7% 6 100.0%
11 28.9% 1 2.6% 10 26.3% 7 18.4% 2 5.3% 7 18.4% 38 100.0%
0 .0% 0 .0% 0 .0% 0 .0% 1 100.0% 0 .0% 1 100.0%
4 50.0% 0 .0% 0 .0% 2 25.0% 0 .0% 2 25.0% 8 100.0%
1 16.7% 0 .0% 2 33.3% 1 16.7% 1 16.7% 1 16.7% 6 100.0%
8 34.8% 0 .0% 11 47.8% 2 8.7% 0 .0% 2 8.7% 23 100.0%
0 .0% 0 .0% 0 .0% 0 .0% 0 .0% 0 .0% 0 .0%
1 100.0% 0 .0% 0 .0% 0 .0% 0 .0% 0 .0% 1 100.0%
1 25.0% 0 .0% 0 .0% 3 75.0% 0 .0% 0 .0% 4 100.0%
3 23.1% 1 7.7% 4 30.8% 4 30.8% 1 7.7% 0 .0% 13 100.0%
17 45.9% 0 .0% 3 8.1% 6 16.2% 7 18.9% 4 10.8% 37 100.0%
Male
Female
Gender
<24
25 - 34 years
35 - 44 years
45 - 54 years
55 +
Participant Age
Married or living with partner
Separated, not living with partner
Widowed, not living with partner
Not married, no partner with parents
Not married, not with partner, alone
Status
Yes
No
Caring Responsibilities at
Home
1
2
Variety of Caring
Responsibilities At Home
<1hr
1 - 3 hrs
4 - 5 hrs
6 - 7 hrs
8 - 9 hrs
>9 hrs
How much time do you
spend in domestic work?
Less than O- Level equivalent
O-Level
A-Level
Vocational Certification (City & Guilds or equivalent)
University Diploma or equivalent -Local
University Diploma or equivalent -Overseas Institution
University Degree- Baccalaureate
University Degree- Masters' Level
University Doctoral
Others
What is your highest
qualification?
Government Organisation/Department
Parastatal Company
Publicly Listed Company
Private Company/Sole Trader
Commercial Partnership
Non-profit Organisation
Describe the company
where you are employed
Agriculture & Fishery
Stone Quarrying & Construction
Governmental Services
Hotel & Catering
Services
Manufacturing
Sector of Activity
Full time
Ful time (reduced hours)
Part time
What is your present
main job?
More than One Job
One Job Only
Are you engaged in
more than one job?
Casual
Permanent-Fixed Term Contract
Permanent-Indefinite Contract
What is the basis of your
main job?
Senior Managers, Directors
Professionals
Associate Professionals & Technical
Clerical employees
Skilled agriculture & fishery workers
Crafts & related trades
Plant & machine operator, assembly workers
Elementary occupations
Shop & Market services
Your level of
responsibility
N N %
Still studying
N N %
Own disability/illness
N N %
Caring responsibilities
at home
N N %
Could not find a
full-time job
N N %
Other personal/family
responsibilities
N N %
Other reasons
N N %
Total
Why did you choose to work on such a basis?
5.1.5 Binding Contract
A total of 77.5% of the participating respondents claimed to be engaged in job of a permanent
nature with an indefinite contract. A further 13.5% of the research participants were engaged
in a casual job (as their main employment), while the remaining 9.0% of research participants
were engaged in a permanent job with a fixed term contract. Table 18 sets out an analysis of
the durations of fixed term contracts across respondent groups, showing that contract duration
differences were fairly homogenous across respondent groups, except for the observation
wherein contracts among employees engaged in Governmental services featured longer
durations than those among employees engaged in the services and manufacturing sectors.

Gender Pay Review
National Commission for the Promotion of Equality
Malta September 2006 page 117 of 327
Table 17 – Summary of Duration of Fixed Term Contract
6 11.3%
8 15.1%
10 18.9%
0 .0%
2 3.8%
14 26.4%
10 18.9%
3 5.7%
0 .0%
53 100.0%
less than 3 months
4-6 months
7-12 months
13-18 months
19-24 months
25-36 months
3 years+
Regularly every season
Other
Total
What is
the
duration
of the
Contract?
Count Valid Percent
15.09
18.87
3.77
26.42
18.87
5.66
0.00
0 20
4-6 months
7-12 months
13-18 months
19-24 months
25-36 months
3 years+
Regularly every season
% of Respondents

Gender Pay Review
National Commission for the Promotion of Equality
Malta September 2006 page 118 of 327
Table 18 – Analysis of Duration of Fixed Term Contract
4 15.4% 6 23.1% 4 15.4% 0 .0% 1 3.8% 6 23.1% 5 19.2% 0 .0% 0 .0% 26 100.0%
2 7.4% 2 7.4% 6 22.2% 0 .0% 1 3.7% 8 29.6% 5 18.5% 3 11.1% 0 .0% 27 100.0%
3 12.0% 6 24.0% 4 16.0% 0 .0% 1 4.0% 6 24.0% 4 16.0% 1 4.0% 0 .0% 25 100.0%
3 17.6% 0 .0% 4 23.5% 0 .0% 0 .0% 6 35.3% 3 17.6% 1 5.9% 0 .0% 17 100.0%
0 .0% 1 20.0% 2 40.0% 0 .0% 1 20.0% 0 .0% 0 .0% 1 20.0% 0 .0% 5 100.0%
0 .0% 1 25.0% 0 .0% 0 .0% 0 .0% 0 .0% 3 75.0% 0 .0% 0 .0% 4 100.0%
0 .0% 0 .0% 0 .0% 0 .0% 0 .0% 2 100.0% 0 .0% 0 .0% 0 .0% 2 100.0%
1 5.3% 3 15.8% 5 26.3% 0 .0% 1 5.3% 5 26.3% 3 15.8% 1 5.3% 0 .0% 19 100.0%
1 50.0% 0 .0% 0 .0% 0 .0% 0 .0% 0 .0% 1 50.0% 0 .0% 0 .0% 2 100.0%
0 .0% 0 .0% 0 .0% 0 .0% 0 .0% 0 .0% 0 .0% 0 .0% 0 .0% 0 .0%
4 14.8% 5 18.5% 5 18.5% 0 .0% 1 3.7% 7 25.9% 4 14.8% 1 3.7% 0 .0% 27 100.0%
0 .0% 0 .0% 0 .0% 0 .0% 0 .0% 2 40.0% 2 40.0% 1 20.0% 0 .0% 5 100.0%
1 6.3% 3 18.8% 3 18.8% 0 .0% 0 .0% 5 31.3% 3 18.8% 1 6.3% 0 .0% 16 100.0%
5 13.5% 5 13.5% 7 18.9% 0 .0% 2 5.4% 9 24.3% 7 18.9% 2 5.4% 0 .0% 37 100.0%
0 .0% 1 9.1% 3 27.3% 0 .0% 0 .0% 4 36.4% 2 18.2% 1 9.1% 0 .0% 11 100.0%
1 20.0% 2 40.0% 0 .0% 0 .0% 0 .0% 1 20.0% 1 20.0% 0 .0% 0 .0% 5 100.0%
3 15.8% 4 21.1% 5 26.3% 0 .0% 1 5.3% 2 10.5% 3 15.8% 1 5.3% 0 .0% 19 100.0%
2 13.3% 0 .0% 4 26.7% 0 .0% 1 6.7% 6 40.0% 2 13.3% 0 .0% 0 .0% 15 100.0%
0 .0% 1 11.1% 0 .0% 0 .0% 0 .0% 5 55.6% 1 11.1% 2 22.2% 0 .0% 9 100.0%
1 33.3% 0 .0% 1 33.3% 0 .0% 0 .0% 0 .0% 1 33.3% 0 .0% 0 .0% 3 100.0%
0 .0% 0 .0% 0 .0% 0 .0% 0 .0% 0 .0% 0 .0% 0 .0% 0 .0% 0 .0%
0 .0% 0 .0% 0 .0% 0 .0% 0 .0% 0 .0% 1 100.0% 0 .0% 0 .0% 1 100.0%
1 14.3% 3 42.9% 1 14.3% 0 .0% 0 .0% 1 14.3% 0 .0% 1 14.3% 0 .0% 7 100.0%
0 .0% 3 25.0% 2 16.7% 0 .0% 0 .0% 1 8.3% 5 41.7% 1 8.3% 0 .0% 12 100.0%
2 16.7% 0 .0% 1 8.3% 0 .0% 1 8.3% 6 50.0% 2 16.7% 0 .0% 0 .0% 12 100.0%
0 .0% 2 33.3% 3 50.0% 0 .0% 0 .0% 1 16.7% 0 .0% 0 .0% 0 .0% 6 100.0%
1 50.0% 0 .0% 0 .0% 0 .0% 0 .0% 0 .0% 1 50.0% 0 .0% 0 .0% 2 100.0%
1 50.0% 0 .0% 0 .0% 0 .0% 0 .0% 1 50.0% 0 .0% 0 .0% 0 .0% 2 100.0%
1 11.1% 0 .0% 2 22.2% 0 .0% 1 11.1% 3 33.3% 2 22.2% 0 .0% 0 .0% 9 100.0%
0 .0% 0 .0% 1 33.3% 0 .0% 0 .0% 1 33.3% 0 .0% 1 33.3% 0 .0% 3 100.0%
0 .0% 0 .0% 0 .0% 0 .0% 0 .0% 0 .0% 0 .0% 0 .0% 0 .0% 0 .0%
0 .0% 0 .0% 0 .0% 0 .0% 0 .0% 0 .0% 0 .0% 0 .0% 0 .0% 0 .0%
0 .0% 0 .0% 3 27.3% 0 .0% 1 9.1% 4 36.4% 3 27.3% 0 .0% 0 .0% 11 100.0%
1 12.5% 1 12.5% 0 .0% 0 .0% 0 .0% 5 62.5% 0 .0% 1 12.5% 0 .0% 8 100.0%
1 25.0% 0 .0% 2 50.0% 0 .0% 0 .0% 1 25.0% 0 .0% 0 .0% 0 .0% 4 100.0%
4 14.3% 7 25.0% 5 17.9% 0 .0% 1 3.6% 3 10.7% 6 21.4% 2 7.1% 0 .0% 28 100.0%
0 .0% 0 .0% 0 .0% 0 .0% 0 .0% 0 .0% 0 .0% 0 .0% 0 .0% 0 .0%
0 .0% 0 .0% 0 .0% 0 .0% 0 .0% 1 50.0% 1 50.0% 0 .0% 0 .0% 2 100.0%
0 .0% 0 .0% 0 .0% 0 .0% 0 .0% 0 .0% 0 .0% 0 .0% 0 .0% 0 .0%
0 .0% 0 .0% 0 .0% 0 .0% 0 .0% 0 .0% 0 .0% 0 .0% 0 .0% 0 .0%
0 .0% 0 .0% 2 13.3% 0 .0% 0 .0% 8 53.3% 4 26.7% 1 6.7% 0 .0% 15 100.0%
2 33.3% 0 .0% 2 33.3% 0 .0% 0 .0% 1 16.7% 1 16.7% 0 .0% 0 .0% 6 100.0%
1 4.2% 8 33.3% 4 16.7% 0 .0% 2 8.3% 4 16.7% 4 16.7% 1 4.2% 0 .0% 24 100.0%
3 37.5% 0 .0% 2 25.0% 0 .0% 0 .0% 1 12.5% 1 12.5% 1 12.5% 0 .0% 8 100.0%
5 10.9% 7 15.2% 8 17.4% 0 .0% 2 4.3% 13 28.3% 9 19.6% 2 4.3% 0 .0% 46 100.0%
0 .0% 0 .0% 0 .0% 0 .0% 0 .0% 0 .0% 1 100.0% 0 .0% 0 .0% 1 100.0%
1 16.7% 1 16.7% 2 33.3% 0 .0% 0 .0% 1 16.7% 0 .0% 1 16.7% 0 .0% 6 100.0%
2 25.0% 1 12.5% 3 37.5% 0 .0% 0 .0% 0 .0% 1 12.5% 1 12.5% 0 .0% 8 100.0%
4 8.9% 7 15.6% 7 15.6% 0 .0% 2 4.4% 14 31.1% 9 20.0% 2 4.4% 0 .0% 45 100.0%
0 .0% 1 100.0% 0 .0% 0 .0% 0 .0% 0 .0% 0 .0% 0 .0% 0 .0% 1 100.0%
6 11.5% 7 13.5% 10 19.2% 0 .0% 2 3.8% 14 26.9% 10 19.2% 3 5.8% 0 .0% 52 100.0%
0 .0% 0 .0% 0 .0% 0 .0% 0 .0% 0 .0% 0 .0% 0 .0% 0 .0% 0 .0%
0 .0% 0 .0% 1 20.0% 0 .0% 0 .0% 1 20.0% 2 40.0% 1 20.0% 0 .0% 5 100.0%
0 .0% 0 .0% 1 20.0% 0 .0% 1 20.0% 2 40.0% 0 .0% 1 20.0% 0 .0% 5 100.0%
0 .0% 0 .0% 1 20.0% 0 .0% 0 .0% 3 60.0% 1 20.0% 0 .0% 0 .0% 5 100.0%
2 12.5% 1 6.3% 3 18.8% 0 .0% 0 .0% 6 37.5% 4 25.0% 0 .0% 0 .0% 16 100.0%
0 .0% 0 .0% 0 .0% 0 .0% 0 .0% 0 .0% 0 .0% 0 .0% 0 .0% 0 .0%
0 .0% 0 .0% 0 .0% 0 .0% 0 .0% 0 .0% 0 .0% 0 .0% 0 .0% 0 .0%
1 50.0% 1 50.0% 0 .0% 0 .0% 0 .0% 0 .0% 0 .0% 0 .0% 0 .0% 2 100.0%
1 11.1% 5 55.6% 1 11.1% 0 .0% 0 .0% 1 11.1% 0 .0% 1 11.1% 0 .0% 9 100.0%
2 18.2% 1 9.1% 3 27.3% 0 .0% 1 9.1% 1 9.1% 3 27.3% 0 .0% 0 .0% 11 100.0%
Male
Female
Gender
<24
25 - 34 years
35 - 44 years
45 - 54 years
55 +
Participant Age
Married or living with partner
Separated, not living with partner
Widowed, not living with partner
Not married, no partner with parents
Not married, not with partner, alone
Status
Yes
No
Caring Responsibilities at
Home
1
2
Variety of Caring
Responsibilities At Home
<1hr
1 - 3 hrs
4 - 5 hrs
6 - 7 hrs
8 - 9 hrs
>9 hrs
How much time do you
spend in domestic work?
Less than O- Level equivalent
O-Level
A-Level
Vocational Certification (City & Guilds or equivalent)
University Diploma or equivalent -Local
University Diploma or equivalent -Overseas Institution
University Degree- Baccalaureate
University Degree- Masters' Level
University Doctoral
Others
What is your highest
qualification?
Government Organisation/Department
Parastatal Company
Publicly Listed Company
Private Company/Sole Trader
Commercial Partnership
Non-profit Organisation
Describe the company
where you are employed
Agriculture & Fishery
Stone Quarrying & Construction
Governmental Services
Hotel & Catering
Services
Manufacturing
Sector of Activity
Full time
Ful time (reduced hours)
Part time
What is your present
main job?
More than One Job
One Job Only
Are you engaged in
more than one job?
Casual
Permanent-Fixed Term Contract
Permanent-Indefinite Contract
What is the basis of your
main job?
Senior Managers, Directors
Professionals
Associate Professionals & Technical
Clerical employees
Skilled agriculture & fishery workers
Crafts & related trades
Plant & machine operator, assembly workers
Elementary occupations
Shop & Market services
Your level of
responsibility
N N %
less than 3 months
N N %
4-6 months
N N %
7-12 months
N N %
13-18 months
N N %
19-24 months
N N %
25-36 months
N N %
3 years+
N N %
Regularly every
season
N N %
Other
N N %
Total
What is the duration of the Contract?

Gender Pay Review
National Commission for the Promotion of Equality
Malta September 2006 page 119 of 327
5.1.6 Hours in a Work Week
Table 19 sets out a summary of the minimum hours worked by research participants, showing
how the average across the sample stood at 37.8 hours weekly. Table 20 summarises the
inferences made from an analysis of the mean minimum hours worked weekly across different
respondent groups (Table 21). Noteworthy is the observation relating to the lower mean of
minimum hours worked weekly among women or older participants or in the hotel & catering
sector, largely as a result of a significant prevalence of part-time jobs occupied by participants
within these groups. A detailed analysis in this regard is set out in Table 22.
Table 19 – Summary of Mean Minimum Hours Worked in a Week
586 586
2.0
90.0
37.839
9.9813
N
Minimum
Maximum
Mean
Std. Deviation
Minimum Hours
worked weeklyValid N (listwise)
20.0 40.0 60.0 80.0
100
200
300
400
Co
un
t
Table 20 – Summary of Analysis of Minimum Number of Hours Worked Weekly Across Respondent Groups
Highest Mean Minimum Hours Lowest Mean Minimum Hours
Gender Men (39.51) Women (35.41)
Participant Age 25 to 44 years (39.00) 55+ years (36.67)
Family Status No Significant Difference
Caring Responsibilities at Home No Significant Difference
Variety of Caring Responsibilities at home No Significant Difference
Time devoted to Domestic Work 1 - 3 hours daily (38.72) 6 – 7 hours daily (33.24)
Highest Academic Qualifications No Significant Difference
Type of Employer No Significant Difference
Sector of Activity Manufacturing (38.39)
Government Services (38.19)
Hotel & Catering (34.58)
Present Job Type Full-time (40.88) Part-time (20.53)
Engaged in more than one job No Significant Difference
Basis of Main Job Permanent Indefinite Contract (39.39) Casual (28.22)
Occupation Type (ISCO 1988) Senior Managers (42.41) Shop & Market Services (35.89)

Gender Pay Review
National Commission for the Promotion of Equality
Malta September 2006 page 120 of 327
Table 21 – Analysis of Minimum Number of Hours Worked Weekly Across Respondent Groups
39.51
35.41
35.84
39.00
38.99
38.43
36.67
38.32
38.92
35.00
37.09
38.92
38.40
37.49
38.19
38.71
42.00
40.00
38.32
38.72
35.32
33.24
36.73
35.22
38.02
35.99
36.51
39.61
38.32
39.54
39.40
40.56
.
40.89
38.05
37.63
40.97
37.47
35.75
40.00
52.50
43.06
38.19
34.58
37.72
38.39
40.88
26.93
20.53
36.77
38.02
28.22
38.68
39.39
42.41
37.26
39.67
36.74
.
43.75
38.36
38.20
35.89
Male
Female
Gender
<24
25 - 34 years
35 - 44 years
45 - 54 years
55 +
Participant Age
Married or living with partner
Separated, not living with partner
Widowed, not living with partner
Not married, no partner with parents
Not married, not with partner, alone
Status
Yes
No
Caring Responsibilities
at Home
1
2
3
4
Variety of Caring
Responsibilities At
Home
<1hr
1 - 3 hrs
4 - 5 hrs
6 - 7 hrs
8 - 9 hrs
>9 hrs
How much time do you
spend in domestic
work?
Less than O- Level equivalent
O-Level
A-Level
Vocational Certification (City & Guilds or equivalent)
University Diploma or equivalent -Local
University Diploma or equivalent -Overseas Institution
University Degree- Baccalaureate
University Degree- Masters' Level
University Doctoral
Others
What is your highest
qualification?
Government Organisation/Department
Parastatal Company
Publicly Listed Company
Private Company/Sole Trader
Commercial Partnership
Non-profit Organisation
Describe the company
where you are
employed
Agriculture & Fishery
Stone Quarrying & Construction
Governmental Services
Hotel & Catering
Services
Manufacturing
Sector of Activity
Full time
Ful time (reduced hours)
Part time
What is your present
main job?
More than One Job
One Job Only
Are you engaged in
more than one job?
Casual
Permanent-Fixed Term Contract
Permanent-Indefinite Contract
What is the basis of
your main job?
Senior Managers, Directors
Professionals
Associate Professionals & Technical
Clerical employees
Skilled agriculture & fishery workers
Crafts & related trades
Plant & machine operator, assembly workers
Elementary occupations
Shop & Market services
Your level of
responsibility
Mean
Minimum Hours
worked weekly

Gender Pay Review
National Commission for the Promotion of Equality
Malta September 2006 page 121 of 327
Table 22 – Analysis of Minimum Number of Hours Worked Weekly Across Respondent Groups As Distinguished by Their Job Basis
41.2 40.0 21.1
40.3 25.9 20.2
41.8 29.4 19.6
40.2 20.0 24.6
41.0 30.0 22.7
40.9 30.0 21.2
39.0 . 16.5
40.9 25.6 20.0
38.4 . 45.0
35.0 . .
41.1 29.4 20.4
41.2 . 19.8
40.8 25.6 21.3
40.9 29.4 20.2
41.2 25.6 21.5
39.5 . 19.5
42.0 . .
40.0 . .
41.5 29.4 19.6
41.0 28.8 23.4
39.8 26.7 18.7
39.6 5.0 18.3
40.0 . 22.0
39.8 30.0 20.6
41.3 35.0 20.0
40.3 20.0 19.8
41.6 25.7 19.4
41.5 . 28.1
40.1 . 17.5
40.3 . 20.0
40.2 27.5 20.0
40.6 . .
. . .
41.8 25.0 .
38.9 25.4 31.2
39.8 . 19.9
41.6 . 20.0
41.7 27.8 19.8
45.4 . 19.7
40.0 . .
40.9 . .
. 26.9 .
. . 20.5
40.2 . 19.6
41.0 26.9 20.7
42.5 29.2 17.9
40.0 30.0 28.0
40.9 24.6 22.9
42.7 30.0 .
38.9 25.0 19.7
41.1 27.5 25.0
40.1 21.7 18.9
. . .
44.3 . 40.0
39.8 40.0 12.7
41.8 . 20.8
42.7 37.5 20.9
Male
Female
Gender
<24
25 - 34 years
35 - 44 years
45 - 54 years
55 +
Participant Age
Married or living with partner
Separated, not living with partner
Widowed, not living with partner
Not married, no partner with parents
Not married, not with partner, alone
Status
Yes
No
Caring Responsibilities
at Home
1
2
3
4
Variety of Caring
Responsibilities At
Home
<1hr
1 - 3 hrs
4 - 5 hrs
6 - 7 hrs
8 - 9 hrs
>9 hrs
How much time do you
spend in domestic
work?
Less than O- Level equivalent
O-Level
A-Level
Vocational Certification (City & Guilds or equivalent)
University Diploma or equivalent -Local
University Diploma or equivalent -Overseas Institution
University Degree- Baccalaureate
University Degree- Masters' Level
University Doctoral
Others
What is your highest
qualification?
Government Organisation/Department
Parastatal Company
Publicly Listed Company
Private Company/Sole Trader
Commercial Partnership
Non-profit Organisation
Describe the company
where you are
employed
Full time
Ful time (reduced hours)
Part time
What is your present
main job?
More than One Job
One Job Only
Are you engaged in
more than one job?
Casual
Permanent-Fixed Term Contract
Permanent-Indefinite Contract
What is the basis of
your main job?
Senior Managers, Directors
Professionals
Associate Professionals & Technical
Clerical employees
Skilled agriculture & fishery workers
Crafts & related trades
Plant & machine operator, assembly workers
Elementary occupations
Shop & Market services
Your level of
responsibility
Mean
Minimum
Hours
worked
weekly
Full time
Mean
Minimum
Hours
worked
weekly
Ful time
(reduced
hours)
Mean
Minimum
Hours
worked
weekly
Part time
What is your present main job?

Gender Pay Review
National Commission for the Promotion of Equality
Malta September 2006 page 122 of 327
Table 23 sets out a summary of how research participants felt about the hours worked, showing
how an overwhelming 67.0% are happy with the number of hours worked, while 21.6% of
research participants seek to decrease the hours worked. An analysis of these responses is set
out in Table 24, showing how:
� Higher proportions of responses relating to a wish to decrease the hours worked prevailed among
participants who:
– were between 25 and 54 years old, or
– were married and/or living with a partner or separated, or
– spent more than 9 hours daily in domestic work at home, or
– were employed in full-time jobs, or
– were employed in permanent jobs with an indefinite contract.
� Contrastingly higher proportions of responses relating to a wish to increase the hours worked
prevailed among participants who:
– were younger than 24 years old, or
– were not married, living with parents or alone, or
– devoted between 6 and 7 hours daily to domestic work at home, or
– were employed in part-time jobs, or
– were employed in casual jobs.
An analysis of the mean minimum hours worked across the responses and basis of employment
(Table 25) shows that participants wishing to reduce the hours of work typically worked in jobs
with the mean minimum hours of work above the mean for the sample. The converse held in
respect to participants wishing to increase their minimum hours of work – who worked an
average minimum hours of work that was below the sample’s average.

Gender Pay Review
National Commission for the Promotion of Equality
Malta September 2006 page 123 of 327
Table 23 – Summary of Response: Respondents’ Satisfaction with Hours Worked in Main Job
127 21.6%
393 67.0%
46 7.8%
21 3.6%
587 100.0%
In my present main job I seek to decrease the
hours of work
I am happy with the number of hours I work in
my main job
In my present main job I seek to increase the
hours of work
Don't know/No answer
Total
Which of
the
folowing
is true in
your
case?
Count Valid Percent
21.64
66.95
3.58
7.84
0 20 40 60 80
In my present main job I seek to decrease
the hours of work
I am happy with the number of hours I
work in my main job
In my present main job I seek to increase
the hours of work
Don't know/No answer
% of Respondents

Gender Pay Review
National Commission for the Promotion of Equality
Malta September 2006 page 124 of 327
Table 24 – Analysis of Response: Respondents’ Satisfaction with Hours Worked in Main Job Across Respondent Groups
85 24.4% 222 63.8% 25 7.2% 16 4.6% 348 100.0%
42 17.6% 171 71.5% 21 8.8% 5 2.1% 239 100.0%
28 15.3% 126 68.9% 25 13.7% 4 2.2% 183 100.0%
33 21.0% 109 69.4% 10 6.4% 5 3.2% 157 100.0%
32 29.4% 69 63.3% 4 3.7% 4 3.7% 109 100.0%
25 26.0% 59 61.5% 5 5.2% 7 7.3% 96 100.0%
6 15.4% 30 76.9% 2 5.1% 1 2.6% 39 100.0%
72 25.4% 187 65.8% 13 4.6% 12 4.2% 284 100.0%
5 38.5% 5 38.5% 1 7.7% 2 15.4% 13 100.0%
1 50.0% 1 50.0% 0 .0% 0 .0% 2 100.0%
46 18.4% 170 68.0% 27 10.8% 7 2.8% 250 100.0%
3 7.9% 30 78.9% 5 13.2% 0 .0% 38 100.0%
59 26.2% 144 64.0% 12 5.3% 10 4.4% 225 100.0%
68 18.8% 249 68.8% 34 9.4% 11 3.0% 362 100.0%
43 25.3% 110 64.7% 9 5.3% 8 4.7% 170 100.0%
13 26.5% 31 63.3% 3 6.1% 2 4.1% 49 100.0%
3 60.0% 2 40.0% 0 .0% 0 .0% 5 100.0%
0 .0% 1 100.0% 0 .0% 0 .0% 1 100.0%
50 22.7% 146 66.4% 14 6.4% 10 4.5% 220 100.0%
38 18.7% 147 72.4% 13 6.4% 5 2.5% 203 100.0%
13 23.2% 35 62.5% 6 10.7% 2 3.6% 56 100.0%
3 10.0% 21 70.0% 6 20.0% 0 .0% 30 100.0%
2 18.2% 9 81.8% 0 .0% 0 .0% 11 100.0%
11 47.8% 8 34.8% 4 17.4% 0 .0% 23 100.0%
34 26.2% 81 62.3% 10 7.7% 5 3.8% 130 100.0%
33 21.9% 99 65.6% 17 11.3% 2 1.3% 151 100.0%
13 14.0% 64 68.8% 12 12.9% 4 4.3% 93 100.0%
14 24.6% 36 63.2% 3 5.3% 4 7.0% 57 100.0%
6 24.0% 16 64.0% 1 4.0% 2 8.0% 25 100.0%
8 28.6% 19 67.9% 1 3.6% 0 .0% 28 100.0%
10 17.2% 44 75.9% 1 1.7% 3 5.2% 58 100.0%
5 18.5% 20 74.1% 1 3.7% 1 3.7% 27 100.0%
0 .0% 0 .0% 0 .0% 0 .0% 0 .0%
4 22.2% 14 77.8% 0 .0% 0 .0% 18 100.0%
22 17.1% 95 73.6% 4 3.1% 8 6.2% 129 100.0%
7 19.4% 23 63.9% 5 13.9% 1 2.8% 36 100.0%
10 27.0% 23 62.2% 4 10.8% 0 .0% 37 100.0%
83 22.4% 243 65.7% 33 8.9% 11 3.0% 370 100.0%
1 12.5% 6 75.0% 0 .0% 1 12.5% 8 100.0%
4 57.1% 3 42.9% 0 .0% 0 .0% 7 100.0%
0 .0% 2 100.0% 0 .0% 0 .0% 2 100.0%
8 50.0% 7 43.8% 0 .0% 1 6.3% 16 100.0%
23 18.3% 88 69.8% 7 5.6% 8 6.3% 126 100.0%
17 27.0% 36 57.1% 9 14.3% 1 1.6% 63 100.0%
46 19.2% 167 69.9% 20 8.4% 6 2.5% 239 100.0%
33 23.4% 93 66.0% 10 7.1% 5 3.5% 141 100.0%
122 24.7% 329 66.6% 23 4.7% 20 4.0% 494 100.0%
2 14.3% 11 78.6% 0 .0% 1 7.1% 14 100.0%
3 3.8% 53 67.1% 23 29.1% 0 .0% 79 100.0%
20 24.1% 53 63.9% 8 9.6% 2 2.4% 83 100.0%
107 21.2% 340 67.5% 38 7.5% 19 3.8% 504 100.0%
7 8.9% 55 69.6% 17 21.5% 0 .0% 79 100.0%
10 18.9% 36 67.9% 5 9.4% 2 3.8% 53 100.0%
110 24.2% 302 66.4% 24 5.3% 19 4.2% 455 100.0%
10 22.7% 32 72.7% 0 .0% 2 4.5% 44 100.0%
15 16.3% 71 77.2% 3 3.3% 3 3.3% 92 100.0%
14 22.2% 42 66.7% 3 4.8% 4 6.3% 63 100.0%
31 23.3% 82 61.7% 15 11.3% 5 3.8% 133 100.0%
0 .0% 0 .0% 0 .0% 0 .0% 0 .0%
3 37.5% 5 62.5% 0 .0% 0 .0% 8 100.0%
15 26.3% 36 63.2% 5 8.8% 1 1.8% 57 100.0%
19 25.0% 50 65.8% 4 5.3% 3 3.9% 76 100.0%
20 17.5% 75 65.8% 16 14.0% 3 2.6% 114 100.0%
Male
Female
Gender
<24
25 - 34 years
35 - 44 years
45 - 54 years
55 +
Participant Age
Married or living with partner
Separated, not living with partner
Widowed, not living with partner
Not married, no partner with parents
Not married, not with partner, alone
Status
Yes
No
Caring Responsibilities
at Home
1
2
3
4
Variety of Caring
Responsibilities At
Home
<1hr
1 - 3 hrs
4 - 5 hrs
6 - 7 hrs
8 - 9 hrs
>9 hrs
How much time do you
spend in domestic
work?
Less than O- Level equivalent
O-Level
A-Level
Vocational Certification (City & Guilds or equivalent)
University Diploma or equivalent -Local
University Diploma or equivalent -Overseas Institution
University Degree- Baccalaureate
University Degree- Masters' Level
University Doctoral
Others
What is your highest
qualification?
Government Organisation/Department
Parastatal Company
Publicly Listed Company
Private Company/Sole Trader
Commercial Partnership
Non-profit Organisation
Describe the company
where you are
employed
Agriculture & Fishery
Stone Quarrying & Construction
Governmental Services
Hotel & Catering
Services
Manufacturing
Sector of Activity
Full time
Ful time (reduced hours)
Part time
What is your present
main job?
More than One Job
One Job Only
Are you engaged in
more than one job?
Casual
Permanent-Fixed Term Contract
Permanent-Indefinite Contract
What is the basis of
your main job?
Senior Managers, Directors
Professionals
Associate Professionals & Technical
Clerical employees
Skilled agriculture & fishery workers
Crafts & related trades
Plant & machine operator, assembly workers
Elementary occupations
Shop & Market services
Your level of
responsibility
N N %
In my present main
job I seek to decrease
the hours of work
N N %
I am happy with the
number of hours I
work in my main job
N N %
In my present main
job I seek to increase
the hours of work
N N %
Don't know/No answer
N N %
Total
Which of the folowing is true in your case?

Gender Pay Review
National Commission for the Promotion of Equality
Malta September 2006 page 125 of 327
Table 25 – Analysis of Respondent’s Wish about Hours Worked Across Respondent Basis of Employment and Mean Minimum Hours Worked Weekly
43.0 32.5 26.7
40.3 26.5 21.4
37.8 . 17.5
41.6 20.0 .
In my present main job I seek to
decrease the hours of work
I am happy with the number of hours I
work in my main job
In my present main job I seek to increase
the hours of work
Don't know/No answer
Which of
the
folowing
is true in
your
case?
Mean
Minimum
Hours
worked
weekly
Full time
Mean
Minimum
Hours
worked
weekly
Ful time
(reduced
hours)
Mean
Minimum
Hours
worked
weekly
Part time
What is your present main job?
5.1.7 Shift Work
Table 26 shows how 19.8% of the research participants were engaged in shift work as opposed
to non-shift basis. An analysis of the incidence of shift work across different research participant
groups showed No Statistically Significant Differences across such groups except that shift work
was a relatively more common incidence among:
� Workers with vocational qualifications or less, or
� Workers engaged with establishments in hotel & catering or manufacturing sectors, or
� Workers engaged in plant & machine operator or elementary or shop & market service occupations.
Table 26 – Participants Engaged in Shift Work
116 19.8%
471 80.2%
587 100.0%
Yes
No
Total
Do you
work on
shift?
Count Valid PercentShift work
19.8%
Non shift work
80.2%

Gender Pay Review
National Commission for the Promotion of Equality
Malta September 2006 page 126 of 327
Table 27 – Analysis of Shift work Across Participant Groups
74 21.3% 274 78.7% 348 100.0%
42 17.6% 197 82.4% 239 100.0%
48 26.2% 135 73.8% 183 100.0%
28 17.8% 129 82.2% 157 100.0%
19 17.4% 90 82.6% 109 100.0%
17 17.7% 79 82.3% 96 100.0%
4 10.3% 35 89.7% 39 100.0%
49 17.3% 235 82.7% 284 100.0%
3 23.1% 10 76.9% 13 100.0%
1 50.0% 1 50.0% 2 100.0%
53 21.2% 197 78.8% 250 100.0%
10 26.3% 28 73.7% 38 100.0%
43 19.1% 182 80.9% 225 100.0%
73 20.2% 289 79.8% 362 100.0%
28 16.5% 142 83.5% 170 100.0%
14 28.6% 35 71.4% 49 100.0%
1 20.0% 4 80.0% 5 100.0%
0 .0% 1 100.0% 1 100.0%
42 19.1% 178 80.9% 220 100.0%
31 15.3% 172 84.7% 203 100.0%
13 23.2% 43 76.8% 56 100.0%
11 36.7% 19 63.3% 30 100.0%
3 27.3% 8 72.7% 11 100.0%
3 13.0% 20 87.0% 23 100.0%
36 27.7% 94 72.3% 130 100.0%
34 22.5% 117 77.5% 151 100.0%
18 19.4% 75 80.6% 93 100.0%
18 31.6% 39 68.4% 57 100.0%
3 12.0% 22 88.0% 25 100.0%
1 3.6% 27 96.4% 28 100.0%
4 6.9% 54 93.1% 58 100.0%
1 3.7% 26 96.3% 27 100.0%
0 .0% 0 .0% 0 .0%
1 5.6% 17 94.4% 18 100.0%
17 13.2% 112 86.8% 129 100.0%
8 22.2% 28 77.8% 36 100.0%
10 27.0% 27 73.0% 37 100.0%
80 21.6% 290 78.4% 370 100.0%
1 12.5% 7 87.5% 8 100.0%
0 .0% 7 100.0% 7 100.0%
0 .0% 2 100.0% 2 100.0%
0 .0% 16 100.0% 16 100.0%
15 11.9% 111 88.1% 126 100.0%
21 33.3% 42 66.7% 63 100.0%
41 17.2% 198 82.8% 239 100.0%
39 27.7% 102 72.3% 141 100.0%
97 19.6% 397 80.4% 494 100.0%
2 14.3% 12 85.7% 14 100.0%
17 21.5% 62 78.5% 79 100.0%
15 18.1% 68 81.9% 83 100.0%
101 20.0% 403 80.0% 504 100.0%
16 20.3% 63 79.7% 79 100.0%
17 32.1% 36 67.9% 53 100.0%
83 18.2% 372 81.8% 455 100.0%
4 9.1% 40 90.9% 44 100.0%
13 14.1% 79 85.9% 92 100.0%
6 9.5% 57 90.5% 63 100.0%
9 6.8% 124 93.2% 133 100.0%
0 .0% 0 .0% 0 .0%
0 .0% 8 100.0% 8 100.0%
27 47.4% 30 52.6% 57 100.0%
27 35.5% 49 64.5% 76 100.0%
30 26.3% 84 73.7% 114 100.0%
Male
Female
Gender
<24
25 - 34 years
35 - 44 years
45 - 54 years
55 +
Participant Age
Married or living with partner
Separated, not living with partner
Widowed, not living with partner
Not married, no partner with parents
Not married, not with partner, alone
Status
Yes
No
Caring Responsibilities
at Home
1
2
3
4
Variety of Caring
Responsibilities At
Home
<1hr
1 - 3 hrs
4 - 5 hrs
6 - 7 hrs
8 - 9 hrs
>9 hrs
How much time do you
spend in domestic
work?
Less than O- Level equivalent
O-Level
A-Level
Vocational Certification (City & Guilds or equivalent)
University Diploma or equivalent -Local
University Diploma or equivalent -Overseas Institution
University Degree- Baccalaureate
University Degree- Masters' Level
University Doctoral
Others
What is your highest
qualification?
Government Organisation/Department
Parastatal Company
Publicly Listed Company
Private Company/Sole Trader
Commercial Partnership
Non-profit Organisation
Describe the company
where you are
employed
Agriculture & Fishery
Stone Quarrying & Construction
Governmental Services
Hotel & Catering
Services
Manufacturing
Sector of Activity
Full time
Ful time (reduced hours)
Part time
What is your present
main job?
More than One Job
One Job Only
Are you engaged in
more than one job?
Casual
Permanent-Fixed Term Contract
Permanent-Indefinite Contract
What is the basis of
your main job?
Senior Managers, Directors
Professionals
Associate Professionals & Technical
Clerical employees
Skilled agriculture & fishery workers
Crafts & related trades
Plant & machine operator, assembly workers
Elementary occupations
Shop & Market services
Your level of
responsibility
N N %
Yes
N N %
No
N N %
Total
Do you work on shift?

Gender Pay Review
National Commission for the Promotion of Equality
Malta September 2006 page 127 of 327
An analysis of the minimum working hours required to be worked by research participants in
shift work suggested no significant differences in the average minimum hours worked in shift
work as opposed to non-shift work. Table 28 shows how 54.3% of the research participants
engaged in shift work were employed through alternate shift, while a further 32.8% were
employed through a permanent shift. An analysis of the incidence of such types of shift work
across respondent groups (Table 29) showed no significant differences in the incidence of
different types of shift work across different respondent groups.
A total of 50.0% of such participants engaged in shift work were entitled to shift allowance. An
analysis of the incidence of this allowance (Table 30), showing that generally there were no
discernible differences between participant groups and their entitlement to shift allowance,
except for a significantly more common incidence of shift allowance entitlement among participants who:
� were employed with establishments comprising Government organisations/departments or
parastatal companies, or
� were employed in establishments engaged in Governmental services or manufacturing, or
� were employed in full-time positions, or
� were engaged in plant & machine operator or assembly worker roles.
Overall, participants entitled to a shift allowance claimed that such allowance amounted to
Lm 23.86 weekly gross on average – varying from a minimum of Lm 2.00 weekly to a maximum
of Lm 104.00 weekly. Table 31 sets out an analysis of the claimed shift allowances (earned
weekly gross before National Insurance and tax) across respondent groups and across
participant gender. This analysis showed no significant differences except that shift allowances
earned by research participants working in establishments that operate in the hotel and
catering sector featured the highest means, contrasting against the lowest mean shift
allowances earned by participants engaged with manufacturing enterprises. Whilst analysis
also shows that men typically earned higher shift allowances than their female counterparts,
such differences were not statistically valid at a 95% confidence interval.

Gender Pay Review
National Commission for the Promotion of Equality
Malta September 2006 page 128 of 327
Table 28 – Summary of type of Shifts Worked
63 54.3%
15 12.9%
38 32.8%
116 100.0%
Alternate
Split
Permanent
Total
How can you
describe your
shift basis?
Count Valid Percent
Permanent
32.8%
Alternate
54.3%
Split
12.9%

Gender Pay Review
National Commission for the Promotion of Equality
Malta September 2006 page 129 of 327
Table 29 – Analysis of Type of Shifts Worked Across Respondent Groups
39 52.7% 8 10.8% 27 36.5% 74 100.0%
24 57.1% 7 16.7% 11 26.2% 42 100.0%
21 43.8% 4 8.3% 23 47.9% 48 100.0%
19 67.9% 5 17.9% 4 14.3% 28 100.0%
10 52.6% 4 21.1% 5 26.3% 19 100.0%
11 64.7% 2 11.8% 4 23.5% 17 100.0%
2 50.0% 0 .0% 2 50.0% 4 100.0%
26 53.1% 7 14.3% 16 32.7% 49 100.0%
2 66.7% 0 .0% 1 33.3% 3 100.0%
1 100.0% 0 .0% 0 .0% 1 100.0%
26 49.1% 7 13.2% 20 37.7% 53 100.0%
8 80.0% 1 10.0% 1 10.0% 10 100.0%
22 51.2% 7 16.3% 14 32.6% 43 100.0%
41 56.2% 8 11.0% 24 32.9% 73 100.0%
16 57.1% 5 17.9% 7 25.0% 28 100.0%
5 35.7% 2 14.3% 7 50.0% 14 100.0%
1 100.0% 0 .0% 0 .0% 1 100.0%
22 52.4% 5 11.9% 15 35.7% 42 100.0%
17 54.8% 4 12.9% 10 32.3% 31 100.0%
9 69.2% 4 30.8% 0 .0% 13 100.0%
5 45.5% 1 9.1% 5 45.5% 11 100.0%
0 .0% 0 .0% 3 100.0% 3 100.0%
0 .0% 1 33.3% 2 66.7% 3 100.0%
21 58.3% 5 13.9% 10 27.8% 36 100.0%
21 61.8% 3 8.8% 10 29.4% 34 100.0%
8 44.4% 5 27.8% 5 27.8% 18 100.0%
7 38.9% 2 11.1% 9 50.0% 18 100.0%
2 66.7% 0 .0% 1 33.3% 3 100.0%
1 100.0% 0 .0% 0 .0% 1 100.0%
2 50.0% 0 .0% 2 50.0% 4 100.0%
0 .0% 0 .0% 1 100.0% 1 100.0%
0 .0% 0 .0% 0 .0% 0 .0%
1 100.0% 0 .0% 0 .0% 1 100.0%
8 47.1% 2 11.8% 7 41.2% 17 100.0%
3 37.5% 1 12.5% 4 50.0% 8 100.0%
6 60.0% 2 20.0% 2 20.0% 10 100.0%
45 56.3% 10 12.5% 25 31.3% 80 100.0%
1 100.0% 0 .0% 0 .0% 1 100.0%
0 .0% 0 .0% 0 .0% 0 .0%
0 .0% 0 .0% 0 .0% 0 .0%
0 .0% 0 .0% 0 .0% 0 .0%
6 40.0% 1 6.7% 8 53.3% 15 100.0%
10 47.6% 3 14.3% 8 38.1% 21 100.0%
23 56.1% 6 14.6% 12 29.3% 41 100.0%
24 61.5% 5 12.8% 10 25.6% 39 100.0%
55 56.7% 10 10.3% 32 33.0% 97 100.0%
2 100.0% 0 .0% 0 .0% 2 100.0%
6 35.3% 5 29.4% 6 35.3% 17 100.0%
10 66.7% 2 13.3% 3 20.0% 15 100.0%
53 52.5% 13 12.9% 35 34.7% 101 100.0%
8 50.0% 4 25.0% 4 25.0% 16 100.0%
9 52.9% 3 17.6% 5 29.4% 17 100.0%
46 55.4% 8 9.6% 29 34.9% 83 100.0%
4 100.0% 0 .0% 0 .0% 4 100.0%
6 46.2% 1 7.7% 6 46.2% 13 100.0%
2 33.3% 0 .0% 4 66.7% 6 100.0%
3 33.3% 2 22.2% 4 44.4% 9 100.0%
0 .0% 0 .0% 0 .0% 0 .0%
0 .0% 0 .0% 0 .0% 0 .0%
20 74.1% 2 7.4% 5 18.5% 27 100.0%
14 51.9% 4 14.8% 9 33.3% 27 100.0%
14 46.7% 6 20.0% 10 33.3% 30 100.0%
Male
Female
Gender
<24
25 - 34 years
35 - 44 years
45 - 54 years
55 +
Participant Age
Married or living with partner
Separated, not living with partner
Widowed, not living with partner
Not married, no partner with parents
Not married, not with partner, alone
Status
Yes
No
Caring Responsibilities
at Home
1
2
3
Variety of Caring
Responsibilities At
Home
<1hr
1 - 3 hrs
4 - 5 hrs
6 - 7 hrs
8 - 9 hrs
>9 hrs
How much time do you
spend in domestic
work?
Less than O- Level equivalent
O-Level
A-Level
Vocational Certification (City & Guilds or equivalent)
University Diploma or equivalent -Local
University Diploma or equivalent -Overseas Institution
University Degree- Baccalaureate
University Degree- Masters' Level
University Doctoral
Others
What is your highest
qualification?
Government Organisation/Department
Parastatal Company
Publicly Listed Company
Private Company/Sole Trader
Commercial Partnership
Non-profit Organisation
Describe the company
where you are
employed
Agriculture & Fishery
Stone Quarrying & Construction
Governmental Services
Hotel & Catering
Services
Manufacturing
Sector of Activity
Full time
Ful time (reduced hours)
Part time
What is your present
main job?
More than One Job
One Job Only
Are you engaged in
more than one job?
Casual
Permanent-Fixed Term Contract
Permanent-Indefinite Contract
What is the basis of
your main job?
Senior Managers, Directors
Professionals
Associate Professionals & Technical
Clerical employees
Skilled agriculture & fishery workers
Crafts & related trades
Plant & machine operator, assembly workers
Elementary occupations
Shop & Market services
Your level of
responsibility
N N %
Alternate
N N %
Split
N N %
Permanent
N N %
Total
How can you describe your shift basis?

Gender Pay Review
National Commission for the Promotion of Equality
Malta September 2006 page 130 of 327
Table 30 – Shift Allowance Entitlement across Respondent Groups
41 55.4% 33 44.6% 74 100.0%
16 40.0% 24 60.0% 40 100.0%
23 48.9% 24 51.1% 47 100.0%
11 40.7% 16 59.3% 27 100.0%
9 47.4% 10 52.6% 19 100.0%
10 58.8% 7 41.2% 17 100.0%
4 100.0% 0 .0% 4 100.0%
27 56.3% 21 43.8% 48 100.0%
2 66.7% 1 33.3% 3 100.0%
1 100.0% 0 .0% 1 100.0%
21 39.6% 32 60.4% 53 100.0%
6 66.7% 3 33.3% 9 100.0%
23 54.8% 19 45.2% 42 100.0%
34 47.2% 38 52.8% 72 100.0%
13 46.4% 15 53.6% 28 100.0%
9 69.2% 4 30.8% 13 100.0%
1 100.0% 0 .0% 1 100.0%
17 40.5% 25 59.5% 42 100.0%
17 56.7% 13 43.3% 30 100.0%
4 33.3% 8 66.7% 12 100.0%
8 72.7% 3 27.3% 11 100.0%
3 100.0% 0 .0% 3 100.0%
2 66.7% 1 33.3% 3 100.0%
18 50.0% 18 50.0% 36 100.0%
18 52.9% 16 47.1% 34 100.0%
7 43.8% 9 56.3% 16 100.0%
9 50.0% 9 50.0% 18 100.0%
1 33.3% 2 66.7% 3 100.0%
1 100.0% 0 .0% 1 100.0%
2 50.0% 2 50.0% 4 100.0%
1 100.0% 0 .0% 1 100.0%
0 .0% 0 .0% 0 .0%
0 .0% 1 100.0% 1 100.0%
12 75.0% 4 25.0% 16 100.0%
7 87.5% 1 12.5% 8 100.0%
4 40.0% 6 60.0% 10 100.0%
34 43.0% 45 57.0% 79 100.0%
0 .0% 1 100.0% 1 100.0%
0 .0% 0 .0% 0 .0%
0 .0% 0 .0% 0 .0%
0 .0% 0 .0% 0 .0%
11 78.6% 3 21.4% 14 100.0%
7 33.3% 14 66.7% 21 100.0%
10 24.4% 31 75.6% 41 100.0%
29 76.3% 9 23.7% 38 100.0%
53 55.8% 42 44.2% 95 100.0%
0 .0% 2 100.0% 2 100.0%
4 23.5% 13 76.5% 17 100.0%
9 60.0% 6 40.0% 15 100.0%
48 48.5% 51 51.5% 99 100.0%
5 31.3% 11 68.8% 16 100.0%
7 43.8% 9 56.3% 16 100.0%
45 54.9% 37 45.1% 82 100.0%
0 .0% 4 100.0% 4 100.0%
6 50.0% 6 50.0% 12 100.0%
2 33.3% 4 66.7% 6 100.0%
5 62.5% 3 37.5% 8 100.0%
0 .0% 0 .0% 0 .0%
0 .0% 0 .0% 0 .0%
22 81.5% 5 18.5% 27 100.0%
12 44.4% 15 55.6% 27 100.0%
10 33.3% 20 66.7% 30 100.0%
Male
Female
Gender
<24
25 - 34 years
35 - 44 years
45 - 54 years
55 +
Participant Age
Married or living with partner
Separated, not living with partner
Widowed, not living with partner
Not married, no partner with parents
Not married, not with partner, alone
Status
Yes
No
Caring Responsibilities
at Home
1
2
3
Variety of Caring
Responsibilities At
Home
<1hr
1 - 3 hrs
4 - 5 hrs
6 - 7 hrs
8 - 9 hrs
>9 hrs
How much time do you
spend in domestic
work?
Less than O- Level equivalent
O-Level
A-Level
Vocational Certification (City & Guilds or equivalent)
University Diploma or equivalent -Local
University Diploma or equivalent -Overseas Institution
University Degree- Baccalaureate
University Degree- Masters' Level
University Doctoral
Others
What is your highest
qualification?
Government Organisation/Department
Parastatal Company
Publicly Listed Company
Private Company/Sole Trader
Commercial Partnership
Non-profit Organisation
Describe the company
where you are
employed
Agriculture & Fishery
Stone Quarrying & Construction
Governmental Services
Hotel & Catering
Services
Manufacturing
Sector of Activity
Full time
Ful time (reduced hours)
Part time
What is your present
main job?
More than One Job
One Job Only
Are you engaged in
more than one job?
Casual
Permanent-Fixed Term Contract
Permanent-Indefinite Contract
What is the basis of
your main job?
Senior Managers, Directors
Professionals
Associate Professionals & Technical
Clerical employees
Skilled agriculture & fishery workers
Crafts & related trades
Plant & machine operator, assembly workers
Elementary occupations
Shop & Market services
Your level of
responsibility
N N %
Yes
N N %
No
N N %
Total
Are you entitled to a shift allowance?

Gender Pay Review
National Commission for the Promotion of Equality
Malta September 2006 page 131 of 327
Table 31 – Analysis of the Mean Shift Allowance Received among Research Participant Groups and Across Gender
Male Female
Gross shift
allowance
(LM/week)
Gross shift
allowance
(LM/week)
Gross shift
allowance
(LM/week)Mean Mean Mean
Male 25.40 25.40
Female 19.50 19.50
<24 24.24 25.56 23.05
25 - 34 years 28.04 35.68 7.67
35 - 44 years 11.88 11.88
45 - 54 years 22.00 22.00
55 + 43.83 43.83
Married or living with partner 22.08 21.39 24.70
Separated, not living with partner 20.00 20.00
Widowed, not living with partner 3.00 3.00
Not married, no partner with parents 30.11 39.27 15.71
Not married, not with partner, alone 15.68 14.60 20.00
Yes 18.58 20.68 6.67
No 27.40 29.42 23.35
1 25.79 29.35 8.00
2 7.29 7.83 4.00
3 11.00 11.00
4
<1hr 25.75 28.67 17.00
1 - 3 hrs 24.22 31.99 6.75
4 - 5 hrs 5.00 5.00
6 - 7 hrs 14.94 14.75 15.13
8 - 9 hrs 44.00 44.00
>9 hrs 56.50 15.00 98.00
Less than O- Level equivalent 27.46 29.93 9.00
O-Level 25.90 27.56 23.42
A-Level 11.60 16.00 5.00
Vocational Certification (City & Guilds or equivalent) 17.50 10.00 40.00
University Diploma or equivalent -Local 3.00 3.00
University Diploma or equivalent -Overseas Institution 40.00 40.00
University Degree- Baccalaureate 42.50 80.00 5.00
University Degree- Masters' Level 12.00 12.00
University Doctoral
Others
Government Organisation/Department 20.96 22.14 8.00
Parastatal Company 40.17 40.20 40.00
Publicly Listed Company 38.75 38.75
Private Company/Sole Trader 19.50 20.02 18.68
Commercial Partnership
Non-profit Organisation
Agriculture & Fishery
Stone Quarrying & Construction
Governmental Services 21.65 23.17 8.00
Hotel & Catering 47.79 48.50 46.83
Services 25.20 25.88 22.50
Manufacturing 16.97 20.65 8.57
Full time 21.90 23.83 15.77
Ful time (reduced hours)
Part time 46.50 53.00 40.00
More than One Job 26.18 27.90 21.00
One Job Only 23.43 24.92 19.23
Casual 35.50 50.00 30.67
Permanent-Fixed Term Contract 34.29 29.50 40.67
Permanent-Indefinite Contract 20.81 24.12 5.64
Senior Managers, Directors
Professionals 15.00 17.50 5.00
Associate Professionals & Technical 2.50 3.00 2.00
Clerical employees 32.00 30.00 40.00
Skilled agriculture & fishery workers
Crafts & related trades
Plant & machine operator, assembly workers 14.72 17.37 9.42
Elementary occupations 35.05 38.50 4.00
Shop & Market services 33.80 27.43 48.67
Your level of responsibility
OverallGender
Sector of Activity
What is your present main job?
Are you engaged in more than one
job?What is the basis of your main job?
Variety of Caring Responsibilities At
Home
How much time do you spend in
domestic work?
What is your highest qualification?
Describe the company where you are
employed
Gender
Participant Age
Status
Caring Responsibilities at Home

Gender Pay Review
National Commission for the Promotion of Equality
Malta September 2006 page 132 of 327
5.1.8 Additional Hours of Work
A total of 39.9% of research participants claimed that they worked for additional hours on top
of the required minimum hours in their main job (Table 32). An analysis of the incidence of
these responses across respondent groups (Table 33) showed that additional hours of work
were more frequent among:
� men, or
� workers with academic qualifications including a University Diploma or higher, or
� workers engaged in full-time jobs, or
� participants engaged in jobs with permanent, fixed-term contracts.
Table 32 – Summary of Incidence of Additional Hours Worked by Participants on top of Stated Minimum
234 39.9%
353 60.1%
587 100.0%
Yes
No
Total
Did you work for additional
hours on top of hours you
stated?
Count Valid Percent
Yes
39.9%
No
60.1%

Gender Pay Review
National Commission for the Promotion of Equality
Malta September 2006 page 133 of 327
Table 33 – Analysis of Incidence of Additional Hours Worked by Participants on top of Stated Minimum Across Respondent Groups
158 45.4% 190 54.6% 348 100.0%
76 31.8% 163 68.2% 239 100.0%
76 41.5% 107 58.5% 183 100.0%
68 43.3% 89 56.7% 157 100.0%
40 36.7% 69 63.3% 109 100.0%
39 40.6% 57 59.4% 96 100.0%
8 20.5% 31 79.5% 39 100.0%
104 36.6% 180 63.4% 284 100.0%
7 53.8% 6 46.2% 13 100.0%
1 50.0% 1 50.0% 2 100.0%
108 43.2% 142 56.8% 250 100.0%
14 36.8% 24 63.2% 38 100.0%
91 40.4% 134 59.6% 225 100.0%
143 39.5% 219 60.5% 362 100.0%
65 38.2% 105 61.8% 170 100.0%
24 49.0% 25 51.0% 49 100.0%
2 40.0% 3 60.0% 5 100.0%
0 .0% 1 100.0% 1 100.0%
87 39.5% 133 60.5% 220 100.0%
86 42.4% 117 57.6% 203 100.0%
18 32.1% 38 67.9% 56 100.0%
10 33.3% 20 66.7% 30 100.0%
1 9.1% 10 90.9% 11 100.0%
7 30.4% 16 69.6% 23 100.0%
43 33.1% 87 66.9% 130 100.0%
52 34.4% 99 65.6% 151 100.0%
33 35.5% 60 64.5% 93 100.0%
22 38.6% 35 61.4% 57 100.0%
16 64.0% 9 36.0% 25 100.0%
11 39.3% 17 60.7% 28 100.0%
29 50.0% 29 50.0% 58 100.0%
17 63.0% 10 37.0% 27 100.0%
0 .0% 0 .0% 0 .0%
11 61.1% 7 38.9% 18 100.0%
39 30.2% 90 69.8% 129 100.0%
16 44.4% 20 55.6% 36 100.0%
21 56.8% 16 43.2% 37 100.0%
153 41.4% 217 58.6% 370 100.0%
3 37.5% 5 62.5% 8 100.0%
2 28.6% 5 71.4% 7 100.0%
0 .0% 2 100.0% 2 100.0%
10 62.5% 6 37.5% 16 100.0%
38 30.2% 88 69.8% 126 100.0%
27 42.9% 36 57.1% 63 100.0%
98 41.0% 141 59.0% 239 100.0%
61 43.3% 80 56.7% 141 100.0%
213 43.1% 281 56.9% 494 100.0%
1 7.1% 13 92.9% 14 100.0%
20 25.3% 59 74.7% 79 100.0%
39 47.0% 44 53.0% 83 100.0%
195 38.7% 309 61.3% 504 100.0%
20 25.3% 59 74.7% 79 100.0%
26 49.1% 27 50.9% 53 100.0%
188 41.3% 267 58.7% 455 100.0%
22 50.0% 22 50.0% 44 100.0%
38 41.3% 54 58.7% 92 100.0%
26 41.3% 37 58.7% 63 100.0%
48 36.1% 85 63.9% 133 100.0%
0 .0% 0 .0% 0 .0%
2 25.0% 6 75.0% 8 100.0%
30 52.6% 27 47.4% 57 100.0%
30 39.5% 46 60.5% 76 100.0%
38 33.3% 76 66.7% 114 100.0%
Male
Female
Gender
<24
25 - 34 years
35 - 44 years
45 - 54 years
55 +
Participant Age
Married or living with partner
Separated, not living with partner
Widowed, not living with partner
Not married, no partner with parents
Not married, not with partner, alone
Status
Yes
No
Caring Responsibilities
at Home
1
2
3
4
Variety of Caring
Responsibilities At
Home
<1hr
1 - 3 hrs
4 - 5 hrs
6 - 7 hrs
8 - 9 hrs
>9 hrs
How much time do you
spend in domestic
work?
Less than O- Level equivalent
O-Level
A-Level
Vocational Certification (City & Guilds or equivalent)
University Diploma or equivalent -Local
University Diploma or equivalent -Overseas Institution
University Degree- Baccalaureate
University Degree- Masters' Level
University Doctoral
Others
What is your highest
qualification?
Government Organisation/Department
Parastatal Company
Publicly Listed Company
Private Company/Sole Trader
Commercial Partnership
Non-profit Organisation
Describe the company
where you are
employed
Agriculture & Fishery
Stone Quarrying & Construction
Governmental Services
Hotel & Catering
Services
Manufacturing
Sector of Activity
Full time
Ful time (reduced hours)
Part time
What is your present
main job?
More than One Job
One Job Only
Are you engaged in
more than one job?
Casual
Permanent-Fixed Term Contract
Permanent-Indefinite Contract
What is the basis of
your main job?
Senior Managers, Directors
Professionals
Associate Professionals & Technical
Clerical employees
Skilled agriculture & fishery workers
Crafts & related trades
Plant & machine operator, assembly workers
Elementary occupations
Shop & Market services
Your level of
responsibility
N N %
Yes
N N %
No
N N %
Total
Did you work for additional hours on top of hours you stated?

Gender Pay Review
National Commission for the Promotion of Equality
Malta September 2006 page 134 of 327
Of the 234 participants who claimed to work additional hours on top of their minimum weekly
hours, 225 can actually recall an average number of hours worked weekly. A summary of these
responses is set out in Table 34, while Table 35 sets out an analysis of these responses across
different respondent groups, showing how on average, participants spend an additional 9.6
hours of work weekly on top of their required minimum (a feature among 38.3% of research
participants). Variations in the additional time worked across respondent groups were also
apparent, as exemplified by observations like:
� persons with caring responsibilities at home typically worked fewer hours than those without such
responsibilities. A difference in such hours worked is also apparent across the sexes – men with
caring responsibilities at home work an average of 9.4 hours weekly, contrasting with their female
counterparts who work for an average of 4.8 hours weekly;
� the additional hours worked weekly also varied with the extent/variety of caring responsibilities at
home, with differences across the sexes also apparent as above: men with such responsibilities
still devote more additional time for work than women in paid employment;
� the number of additional hours worked weekly declines progressively with the number of hours
research participants devote to domestic work. Women devote an average of 11 additional hours
for their work when they undertake less than 1 hour daily in domestic work (their male
counterparts devote just over 10 additional hours weekly for their work). Contrastingly, when the
hours of domestic work increase among research participants, men still devote longer additional
hours to their work as opposed to their female counterparts.
� the longest additional hours of work featured among participants employed with private companies
(men worked an average of 11.35 hours weekly while women worked an average of 9.43 hours
weekly). Lowest number of additional hours featured among participants engaged with parastatal
companies – where women worked an estimated average of 7.0 additional hours weekly
contrasting against their male counterparts (4.5 hours weekly).
� As expected, the longer additional hours worked weekly featured among participants engaged in
full-time jobs (9.98 hours weekly). A difference across sexes also featured: men in full-time jobs
worked an average of 10.4 additional hours weekly while their female counterparts worked for 8.98
additional hours weekly.
� Additional hours worked weekly also varied across occupation types (ISCO 1988) – with the highest
averages prevailing among workers in plant & machine operator occupations or elementary
occupations (11.57 hours and 14.34 hours weekly respectively). Again, men in these occupations
claimed to work longer additional hours then their female counterparts.

Gender Pay Review
National Commission for the Promotion of Equality
Malta September 2006 page 135 of 327
Table 34 – Summary of Additional Hours worked (on average) Weekly on top of the Required Minimum Hours by Research Participants
225 225
1.0
55.0
9.642
7.9957
N
Minimum
Maximum
Mean
Std. Deviation
Additional hours weekly Valid N (listwise)

Gender Pay Review
National Commission for the Promotion of Equality
Malta September 2006 page 136 of 327
Table 35 – Analysis of Additional Hours worked (on average) Weekly on top of the Required Minimum Hours by Research Participants Across Respondent Groups and Respondent Gender
Male Female
Additional
hours weekly
Additional hours
weekly
Additional hours
weekly
Mean Mean Mean
Male 10.16 10.16 .
Female 8.59 . 8.59
<24 10.77 12.45 8.79
25 - 34 years 10.13 9.74 11.21
35 - 44 years 7.76 8.60 6.00
45 - 54 years 8.72 9.22 6.43
55 + 7.38 8.83 3.00
Married or living with partner 8.67 9.29 6.69
Separated, not living with partner 6.50 5.40 12.00
Widowed, not living with partner 5.00 . 5.00
Not married, no partner with parents 10.55 11.28 9.62
Not married, not with partner, alone 11.64 12.55 8.33
Yes 8.29 9.39 4.83
No 10.49 10.75 10.08
1 7.28 8.13 4.88
2 10.81 12.42 4.70
3 9.00 9.00 .
4 . . .
<1hr 10.38 10.09 11.00
1 - 3 hrs 8.19 8.31 7.97
4 - 5 hrs 6.92 8.20 5.31
6 - 7 hrs 7.11 7.67 6.00
8 - 9 hrs . . .
>9 hrs 5.50 3.67 7.33
Less than O- Level equivalent 10.60 11.85 5.25
O-Level 10.31 11.44 8.42
A-Level 8.40 9.44 7.30
Vocational Certification (City & Guilds or equivalent) 10.73 11.94 5.25
University Diploma or equivalent -Local 9.07 10.40 5.75
University Diploma or equivalent -Overseas Institution 9.64 7.75 14.67
University Degree- Baccalaureate 8.48 7.62 9.29
University Degree- Masters' Level 9.56 6.70 14.33
University Doctoral . . .
Others 7.91 6.70 20.00
Government Organisation/Department 8.22 8.70 6.90
Parastatal Company 5.33 4.50 7.00
Publicly Listed Company 8.38 9.23 7.00
Private Company/Sole Trader 10.70 11.35 9.43
Commercial Partnership 6.67 8.00 4.00
Non-profit Organisation 6.00 6.00 .
Agriculture & Fishery . . .
Stone Quarrying & Construction 9.30 9.30 .
Governmental Services 7.76 8.04 7.17
Hotel & Catering 11.26 9.08 13.00
Services 9.93 11.38 6.31
Manufacturing 9.72 10.08 9.07
Full time 9.98 10.44 8.98
Ful time (reduced hours) 8.00 8.00 .
Part time 6.25 6.40 6.10
More than One Job 11.58 10.90 12.33
One Job Only 9.25 10.05 7.38
Casual 7.45 7.10 7.80
Permanent-Fixed Term Contract 11.60 14.15 8.83
Permanent-Indefinite Contract 9.61 9.99 8.68
Senior Managers, Directors 8.50 10.00 4.50
Professionals 8.53 6.85 10.63
Associate Professionals & Technical 9.13 8.33 11.50
Clerical employees 8.40 9.46 6.86
Skilled agriculture & fishery workers . . .
Crafts & related trades 6.00 6.00 .
Plant & machine operator, assembly workers 11.57 11.78 10.86
Elementary occupations 14.34 15.56 6.75
Shop & Market services 8.21 8.05 8.41
What is your present main job?
Are you engaged in more than one
job?What is the basis of your main job?
Your level of responsibility
How much time do you spend in
domestic work?
What is your highest qualification?
Describe the company where you are
employed
Sector of Activity
Participant Age
Status
Caring Responsibilities at Home
Variety of Caring Responsibilities At
Home
OverallGender
Gender

Gender Pay Review
National Commission for the Promotion of Equality
Malta September 2006 page 137 of 327
Table 36 sets out a summary of how participants are entitled to any remuneration for additional
hours worked, showing how 57.7% of participants who work for additional hours are paid in
monetary terms for their additional effort. Differences in the average additional hours worked
by research participants as distinguished by their overtime entitlement, however, are not
statistically significant.
An analysis of overtime remuneration entitlement across respondent groups (Table 37) showed
some significant differences across research participant groups, wherein overtime remuneration
entitlement was a significantly more common feature among:
� male workers (contrasting against their female counterparts);
� workers with academic qualifications equal to or less than University diploma (contrasting against
University graduates holding Baccalaureate or Master’s degrees);
� workers engaged with establishments operating in governmental services, services or
manufacturing, contrasting against their counterparts working in hotel & catering establishments;
� workers engaged in full-time work, as opposed to workers in part time jobs;
� workers employed in associate professional or clerical or plant & machine operator or elementary or
shop & market service occupations – as opposed to workers engaged in senior managerial or
professional roles.
Table 36 – Summary of Overtime Remuneration Entitlement
135 57.7%
6 2.6%
93 39.7%
234 100.0%
Paid (Monetary)
Paid in Time off in Lieu
Not paid
Total
Overtime
payment
entitlement
Count Valid Percent
135
10.1
8.0
6
7.5
4.5
93
9.1
6.0
N
Mean
Median
Paid (Monetary)
N
Mean
Median
Paid in Time off
in Lieu
N
Mean
Median
Not paid
Overtime
payment
entitlement
Additional hours weekly
Yes
Did you work for
additional hours on top
of hours you stated?
Not paid
39.7%
Paid (Monetary)
57.7%
Paid in Time off in Lieu
2.6%

Gender Pay Review
National Commission for the Promotion of Equality
Malta September 2006 page 138 of 327
Table 37 – Analysis of Overtime Remuneration Entitlement Across Research Participant Groups
101 63.9% 3 1.9% 54 34.2% 158 100.0%
34 44.7% 3 3.9% 39 51.3% 76 100.0%
45 59.2% 1 1.3% 30 39.5% 76 100.0%
43 63.2% 2 2.9% 23 33.8% 68 100.0%
18 45.0% 3 7.5% 19 47.5% 40 100.0%
24 61.5% 0 .0% 15 38.5% 39 100.0%
4 50.0% 0 .0% 4 50.0% 8 100.0%
64 61.5% 2 1.9% 38 36.5% 104 100.0%
4 57.1% 0 .0% 3 42.9% 7 100.0%
0 .0% 0 .0% 1 100.0% 1 100.0%
60 55.6% 4 3.7% 44 40.7% 108 100.0%
7 50.0% 0 .0% 7 50.0% 14 100.0%
55 60.4% 2 2.2% 34 37.4% 91 100.0%
80 55.9% 4 2.8% 59 41.3% 143 100.0%
40 61.5% 2 3.1% 23 35.4% 65 100.0%
13 54.2% 0 .0% 11 45.8% 24 100.0%
2 100.0% 0 .0% 0 .0% 2 100.0%
42 48.3% 1 1.1% 44 50.6% 87 100.0%
48 55.8% 5 5.8% 33 38.4% 86 100.0%
10 55.6% 0 .0% 8 44.4% 18 100.0%
8 80.0% 0 .0% 2 20.0% 10 100.0%
0 .0% 0 .0% 0 .0% 0 .0%
5 71.4% 0 .0% 2 28.6% 7 100.0%
33 76.7% 0 .0% 10 23.3% 43 100.0%
34 65.4% 1 1.9% 17 32.7% 52 100.0%
19 57.6% 1 3.0% 13 39.4% 33 100.0%
14 63.6% 1 4.5% 7 31.8% 22 100.0%
10 62.5% 0 .0% 6 37.5% 16 100.0%
7 63.6% 0 .0% 4 36.4% 11 100.0%
6 20.7% 2 6.9% 21 72.4% 29 100.0%
6 35.3% 0 .0% 11 64.7% 17 100.0%
0 .0% 0 .0% 0 .0% 0 .0%
6 54.5% 1 9.1% 4 36.4% 11 100.0%
24 61.5% 3 7.7% 12 30.8% 39 100.0%
10 62.5% 0 .0% 6 37.5% 16 100.0%
12 57.1% 0 .0% 9 42.9% 21 100.0%
86 56.2% 3 2.0% 64 41.8% 153 100.0%
3 100.0% 0 .0% 0 .0% 3 100.0%
0 .0% 0 .0% 2 100.0% 2 100.0%
0 .0% 0 .0% 0 .0% 0 .0%
9 90.0% 0 .0% 1 10.0% 10 100.0%
23 60.5% 2 5.3% 13 34.2% 38 100.0%
9 33.3% 1 3.7% 17 63.0% 27 100.0%
53 54.1% 3 3.1% 42 42.9% 98 100.0%
41 67.2% 0 .0% 20 32.8% 61 100.0%
132 62.0% 6 2.8% 75 35.2% 213 100.0%
1 100.0% 0 .0% 0 .0% 1 100.0%
2 10.0% 0 .0% 18 90.0% 20 100.0%
15 38.5% 2 5.1% 22 56.4% 39 100.0%
120 61.5% 4 2.1% 71 36.4% 195 100.0%
11 55.0% 0 .0% 9 45.0% 20 100.0%
11 42.3% 0 .0% 15 57.7% 26 100.0%
113 60.1% 6 3.2% 69 36.7% 188 100.0%
4 18.2% 0 .0% 18 81.8% 22 100.0%
14 36.8% 2 5.3% 22 57.9% 38 100.0%
17 65.4% 0 .0% 9 34.6% 26 100.0%
31 64.6% 1 2.1% 16 33.3% 48 100.0%
0 .0% 0 .0% 0 .0% 0 .0%
2 100.0% 0 .0% 0 .0% 2 100.0%
25 83.3% 1 3.3% 4 13.3% 30 100.0%
23 76.7% 0 .0% 7 23.3% 30 100.0%
19 50.0% 2 5.3% 17 44.7% 38 100.0%
Male
Female
Gender
<24
25 - 34 years
35 - 44 years
45 - 54 years
55 +
Participant Age
Married or living with partner
Separated, not living with partner
Widowed, not living with partner
Not married, no partner with parents
Not married, not with partner, alone
Status
Yes
No
Caring Responsibilities
at Home
1
2
3
Variety of Caring
Responsibilities At
Home
<1hr
1 - 3 hrs
4 - 5 hrs
6 - 7 hrs
8 - 9 hrs
>9 hrs
How much time do you
spend in domestic
work?
Less than O- Level equivalent
O-Level
A-Level
Vocational Certification (City & Guilds or equivalent)
University Diploma or equivalent -Local
University Diploma or equivalent -Overseas Institution
University Degree- Baccalaureate
University Degree- Masters' Level
University Doctoral
Others
What is your highest
qualification?
Government Organisation/Department
Parastatal Company
Publicly Listed Company
Private Company/Sole Trader
Commercial Partnership
Non-profit Organisation
Describe the company
where you are
employed
Agriculture & Fishery
Stone Quarrying & Construction
Governmental Services
Hotel & Catering
Services
Manufacturing
Sector of Activity
Full time
Ful time (reduced hours)
Part time
What is your present
main job?
More than One Job
One Job Only
Are you engaged in
more than one job?
Casual
Permanent-Fixed Term Contract
Permanent-Indefinite Contract
What is the basis of
your main job?
Senior Managers, Directors
Professionals
Associate Professionals & Technical
Clerical employees
Skilled agriculture & fishery workers
Crafts & related trades
Plant & machine operator, assembly workers
Elementary occupations
Shop & Market services
Your level of
responsibility
N N %
Paid (Monetary)
N N %
Paid in Time off in Lieu
N N %
Not paid
N N %
Total
Overtime payment entitlement

Gender Pay Review
National Commission for the Promotion of Equality
Malta September 2006 page 139 of 327
Table 38 sets out a summary of the quoted rates of overtime remuneration for each hour
overtime worked (where applicable). Noteworthy was the number of participants who could
not recall or did not have an applicable rate for late night hours or Sundays or Public Holidays
(explaining the reduced number of responses obtained). This analysis shows that whilst the
1:1.50 Hours rate prevailed in respect to overtime work done during workdays and Saturdays,
1:2.00 Hours rate prevailed in respect to overtime work done on Sundays and Public Holidays.
Table 39 through Table 43 set out an analysis of the distribution of such overtime remuneration
rates across respondent groups. This analysis shows that differences across respondent groups
were not pronounced, except where:
� overtime rates for ordinary days’ after hours were typically 1:1.5 hrs among respondents engaged
in establishments within manufacturing, services and governmental services, while rates were
typically lower among respondents engaged in establishments within the hotel and catering sector;
� overtime rates for ordinary days’ night hours were also typically 1:1.5 hrs among respondents
engaged with governmental, parastatal or private sector employees;
� overtime rates for ordinary days’ night publicly listed establishments, while overtime rates for the
same times were typically lower am hours or Saturdays typically prevailed among respondents
working in full-time jobs, while employees in part-time or full-time with reduced hours featured
fewer and/or poorer overtime remuneration rates;
� overtime rates for Saturdays also averaged 1:1.5 hrs among respondents engaged in
establishments within manufacturing, services and governmental services, while rates were
typically higher among respondents engaged in establishments within the hotel and catering
sector;
� while overtime rates for work on Sundays and Public Holidays averaged 1:2.0 hours, respondents
engaged in hotel & catering or services sector establishment featured a more common incidence of
1:1.50 hrs rate than their counterparts in other sectors of activity did.

Gender Pay Review
National Commission for the Promotion of Equality
Malta September 2006 page 140 of 327
Table 38 – Summary of Observed Overtime Remuneration Rates
1 Hr =
Ordinary Work
Day, After Hours
Ordinary Work
Day, Night HoursSaturdays Sundays Public Holidays
1.00 Hrs 31 22 26 13 16
1.20 Hrs 1
1.25 Hrs 1 1 1 1 1
1.30 Hrs 1
1.44 Hrs 1
1.50 Hrs 85 31 72 10 8
1.75 Hrs 1
2.00 Hrs 5 7 8 54 49
2.50 Hrs 1 1 1 1 2
3.00 Hrs 3
4.00 Hrs 1 1 1
Total 125 63 110 80 80
1 Hr =
Ordinary Work
Day, After Hours
Ordinary Work
Day, Night HoursSaturdays Sundays Public Holidays
1.00 Hrs 24.8% 34.9% 23.6% 16.3% 20.0%
1.20 Hrs 1.6%
1.25 Hrs 0.8% 1.6% 0.9% 1.3% 1.3%
1.30 Hrs 0.8%
1.44 Hrs 0.8%
1.50 Hrs 68.0% 49.2% 65.5% 12.5% 10.0%
1.75 Hrs 0.9%
2.00 Hrs 4.0% 11.1% 7.3% 67.5% 61.3%
2.50 Hrs 0.8% 1.6% 0.9% 1.3% 2.5%
3.00 Hrs 3.8%
4.00 Hrs 0.9% 1.3% 1.3%

Gender Pay Review
National Commission for the Promotion of Equality
Malta September 2006 page 141 of 327
Table 39 – Analysis of Incidence of Overtime Rates (Ordinary Day, After Hours) Across Respondent Groups
22 24.7% 1 1.1% 0 .0% 0 .0% 64 71.9% 1 1.1% 1 1.1% 89 100.0%
9 25.0% 0 .0% 1 2.8% 1 2.8% 21 58.3% 4 11.1% 0 .0% 36 100.0%
12 30.0% 0 .0% 1 2.5% 1 2.5% 23 57.5% 2 5.0% 1 2.5% 40 100.0%
4 10.0% 1 2.5% 0 .0% 0 .0% 34 85.0% 1 2.5% 0 .0% 40 100.0%
7 36.8% 0 .0% 0 .0% 0 .0% 11 57.9% 1 5.3% 0 .0% 19 100.0%
6 27.3% 0 .0% 0 .0% 0 .0% 15 68.2% 1 4.5% 0 .0% 22 100.0%
2 66.7% 0 .0% 0 .0% 0 .0% 1 33.3% 0 .0% 0 .0% 3 100.0%
17 29.3% 0 .0% 0 .0% 0 .0% 37 63.8% 4 6.9% 0 .0% 58 100.0%
0 .0% 0 .0% 0 .0% 0 .0% 3 100.0% 0 .0% 0 .0% 3 100.0%
0 .0% 0 .0% 0 .0% 0 .0% 0 .0% 0 .0% 0 .0% 0 .0%
14 23.3% 1 1.7% 1 1.7% 1 1.7% 41 68.3% 1 1.7% 1 1.7% 60 100.0%
0 .0% 0 .0% 0 .0% 0 .0% 4 100.0% 0 .0% 0 .0% 4 100.0%
15 28.8% 1 1.9% 0 .0% 0 .0% 34 65.4% 2 3.8% 0 .0% 52 100.0%
16 21.9% 0 .0% 1 1.4% 1 1.4% 51 69.9% 3 4.1% 1 1.4% 73 100.0%
13 34.2% 1 2.6% 0 .0% 0 .0% 23 60.5% 1 2.6% 0 .0% 38 100.0%
1 8.3% 0 .0% 0 .0% 0 .0% 10 83.3% 1 8.3% 0 .0% 12 100.0%
1 50.0% 0 .0% 0 .0% 0 .0% 1 50.0% 0 .0% 0 .0% 2 100.0%
14 35.0% 1 2.5% 0 .0% 1 2.5% 22 55.0% 1 2.5% 1 2.5% 40 100.0%
13 26.5% 0 .0% 0 .0% 0 .0% 34 69.4% 2 4.1% 0 .0% 49 100.0%
1 12.5% 0 .0% 0 .0% 0 .0% 6 75.0% 1 12.5% 0 .0% 8 100.0%
3 50.0% 0 .0% 0 .0% 0 .0% 3 50.0% 0 .0% 0 .0% 6 100.0%
0 .0% 0 .0% 0 .0% 0 .0% 0 .0% 0 .0% 0 .0% 0 .0%
0 .0% 0 .0% 1 20.0% 0 .0% 3 60.0% 1 20.0% 0 .0% 5 100.0%
13 41.9% 1 3.2% 0 .0% 0 .0% 16 51.6% 0 .0% 1 3.2% 31 100.0%
5 16.1% 0 .0% 0 .0% 0 .0% 23 74.2% 3 9.7% 0 .0% 31 100.0%
2 11.1% 0 .0% 1 5.6% 1 5.6% 12 66.7% 2 11.1% 0 .0% 18 100.0%
3 20.0% 0 .0% 0 .0% 0 .0% 12 80.0% 0 .0% 0 .0% 15 100.0%
3 42.9% 0 .0% 0 .0% 0 .0% 4 57.1% 0 .0% 0 .0% 7 100.0%
1 20.0% 0 .0% 0 .0% 0 .0% 4 80.0% 0 .0% 0 .0% 5 100.0%
2 25.0% 0 .0% 0 .0% 0 .0% 6 75.0% 0 .0% 0 .0% 8 100.0%
1 33.3% 0 .0% 0 .0% 0 .0% 2 66.7% 0 .0% 0 .0% 3 100.0%
0 .0% 0 .0% 0 .0% 0 .0% 0 .0% 0 .0% 0 .0% 0 .0%
1 14.3% 0 .0% 0 .0% 0 .0% 6 85.7% 0 .0% 0 .0% 7 100.0%
1 4.2% 0 .0% 0 .0% 0 .0% 23 95.8% 0 .0% 0 .0% 24 100.0%
1 12.5% 0 .0% 0 .0% 0 .0% 7 87.5% 0 .0% 0 .0% 8 100.0%
1 9.1% 0 .0% 0 .0% 0 .0% 9 81.8% 1 9.1% 0 .0% 11 100.0%
27 34.2% 1 1.3% 1 1.3% 1 1.3% 44 55.7% 4 5.1% 1 1.3% 79 100.0%
1 33.3% 0 .0% 0 .0% 0 .0% 2 66.7% 0 .0% 0 .0% 3 100.0%
0 .0% 0 .0% 0 .0% 0 .0% 0 .0% 0 .0% 0 .0% 0 .0%
0 .0% 0 .0% 0 .0% 0 .0% 0 .0% 0 .0% 0 .0% 0 .0%
9 100.0% 0 .0% 0 .0% 0 .0% 0 .0% 0 .0% 0 .0% 9 100.0%
1 4.2% 0 .0% 0 .0% 0 .0% 23 95.8% 0 .0% 0 .0% 24 100.0%
1 11.1% 0 .0% 0 .0% 0 .0% 5 55.6% 3 33.3% 0 .0% 9 100.0%
12 25.0% 1 2.1% 1 2.1% 1 2.1% 32 66.7% 0 .0% 1 2.1% 48 100.0%
8 22.9% 0 .0% 0 .0% 0 .0% 25 71.4% 2 5.7% 0 .0% 35 100.0%
31 25.4% 1 .8% 1 .8% 0 .0% 84 68.9% 5 4.1% 0 .0% 122 100.0%
0 .0% 0 .0% 0 .0% 0 .0% 0 .0% 0 .0% 1 100.0% 1 100.0%
0 .0% 0 .0% 0 .0% 1 50.0% 1 50.0% 0 .0% 0 .0% 2 100.0%
4 23.5% 0 .0% 0 .0% 0 .0% 12 70.6% 1 5.9% 0 .0% 17 100.0%
27 25.0% 1 .9% 1 .9% 1 .9% 73 67.6% 4 3.7% 1 .9% 108 100.0%
3 30.0% 0 .0% 0 .0% 1 10.0% 5 50.0% 0 .0% 1 10.0% 10 100.0%
3 27.3% 0 .0% 0 .0% 0 .0% 7 63.6% 1 9.1% 0 .0% 11 100.0%
25 24.0% 1 1.0% 1 1.0% 0 .0% 73 70.2% 4 3.8% 0 .0% 104 100.0%
4 100.0% 0 .0% 0 .0% 0 .0% 0 .0% 0 .0% 0 .0% 4 100.0%
4 44.4% 0 .0% 0 .0% 1 11.1% 4 44.4% 0 .0% 0 .0% 9 100.0%
3 17.6% 0 .0% 0 .0% 0 .0% 14 82.4% 0 .0% 0 .0% 17 100.0%
3 10.0% 0 .0% 1 3.3% 0 .0% 24 80.0% 2 6.7% 0 .0% 30 100.0%
0 .0% 0 .0% 0 .0% 0 .0% 0 .0% 0 .0% 0 .0% 0 .0%
0 .0% 0 .0% 0 .0% 0 .0% 2 100.0% 0 .0% 0 .0% 2 100.0%
5 21.7% 0 .0% 0 .0% 0 .0% 16 69.6% 1 4.3% 1 4.3% 23 100.0%
4 21.1% 1 5.3% 0 .0% 0 .0% 14 73.7% 0 .0% 0 .0% 19 100.0%
8 38.1% 0 .0% 0 .0% 0 .0% 11 52.4% 2 9.5% 0 .0% 21 100.0%
Male
Female
Gender
<24
25 - 34 years
35 - 44 years
45 - 54 years
55 +
Participant Age
Married or living with partner
Separated, not living with partner
Widowed, not living with partner
Not married, no partner with parents
Not married, not with partner, alone
Status
Yes
No
Caring Responsibilities
at Home
1
2
3
Variety of Caring
Responsibilities At
Home
<1hr
1 - 3 hrs
4 - 5 hrs
6 - 7 hrs
8 - 9 hrs
>9 hrs
How much time do you
spend in domestic
work?
Less than O- Level equivalent
O-Level
A-Level
Vocational Certification (City & Guilds or equivalent)
University Diploma or equivalent -Local
University Diploma or equivalent -Overseas Institution
University Degree- Baccalaureate
University Degree- Masters' Level
University Doctoral
Others
What is your highest
qualification?
Government Organisation/Department
Parastatal Company
Publicly Listed Company
Private Company/Sole Trader
Commercial Partnership
Non-profit Organisation
Describe the company
where you are
employed
Agriculture & Fishery
Stone Quarrying & Construction
Governmental Services
Hotel & Catering
Services
Manufacturing
Sector of Activity
Full time
Ful time (reduced hours)
Part time
What is your present
main job?
More than One Job
One Job Only
Are you engaged in
more than one job?
Casual
Permanent-Fixed Term Contract
Permanent-Indefinite Contract
What is the basis of
your main job?
Senior Managers, Directors
Professionals
Associate Professionals & Technical
Clerical employees
Skilled agriculture & fishery workers
Crafts & related trades
Plant & machine operator, assembly workers
Elementary occupations
Shop & Market services
Your level of
responsibility
N N %
1.00
N N %
1.25
N N %
1.30
N N %
1.44
N N %
1.50
N N %
2.00
N N %
2.50
N N %
Total
O/t calculation - ordinary day, after hours, 1hr =

Gender Pay Review
National Commission for the Promotion of Equality
Malta September 2006 page 142 of 327
Table 40 – Analysis of Incidence of Overtime Rates (Ordinary Day, Night Hours) Across Respondent Groups
14 29.2% 1 2.1% 1 2.1% 26 54.2% 5 10.4% 1 2.1% 48 100.0%
8 53.3% 0 .0% 0 .0% 5 33.3% 2 13.3% 0 .0% 15 100.0%
10 47.6% 0 .0% 0 .0% 7 33.3% 3 14.3% 1 4.8% 21 100.0%
3 13.6% 0 .0% 1 4.5% 15 68.2% 3 13.6% 0 .0% 22 100.0%
4 50.0% 0 .0% 0 .0% 3 37.5% 1 12.5% 0 .0% 8 100.0%
4 36.4% 1 9.1% 0 .0% 6 54.5% 0 .0% 0 .0% 11 100.0%
1 100.0% 0 .0% 0 .0% 0 .0% 0 .0% 0 .0% 1 100.0%
9 37.5% 1 4.2% 0 .0% 12 50.0% 2 8.3% 0 .0% 24 100.0%
0 .0% 0 .0% 0 .0% 2 100.0% 0 .0% 0 .0% 2 100.0%
0 .0% 0 .0% 0 .0% 0 .0% 0 .0% 0 .0% 0 .0%
13 38.2% 0 .0% 1 2.9% 15 44.1% 4 11.8% 1 2.9% 34 100.0%
0 .0% 0 .0% 0 .0% 2 66.7% 1 33.3% 0 .0% 3 100.0%
8 30.8% 1 3.8% 1 3.8% 15 57.7% 1 3.8% 0 .0% 26 100.0%
14 37.8% 0 .0% 0 .0% 16 43.2% 6 16.2% 1 2.7% 37 100.0%
6 33.3% 1 5.6% 1 5.6% 10 55.6% 0 .0% 0 .0% 18 100.0%
1 14.3% 0 .0% 0 .0% 5 71.4% 1 14.3% 0 .0% 7 100.0%
1 100.0% 0 .0% 0 .0% 0 .0% 0 .0% 0 .0% 1 100.0%
11 55.0% 0 .0% 1 5.0% 6 30.0% 1 5.0% 1 5.0% 20 100.0%
8 32.0% 0 .0% 0 .0% 12 48.0% 5 20.0% 0 .0% 25 100.0%
1 25.0% 1 25.0% 0 .0% 2 50.0% 0 .0% 0 .0% 4 100.0%
1 33.3% 0 .0% 0 .0% 2 66.7% 0 .0% 0 .0% 3 100.0%
0 .0% 0 .0% 0 .0% 0 .0% 0 .0% 0 .0% 0 .0%
0 .0% 0 .0% 0 .0% 2 66.7% 1 33.3% 0 .0% 3 100.0%
11 55.0% 0 .0% 1 5.0% 6 30.0% 1 5.0% 1 5.0% 20 100.0%
4 22.2% 0 .0% 0 .0% 11 61.1% 3 16.7% 0 .0% 18 100.0%
1 16.7% 0 .0% 0 .0% 4 66.7% 1 16.7% 0 .0% 6 100.0%
1 16.7% 1 16.7% 0 .0% 3 50.0% 1 16.7% 0 .0% 6 100.0%
3 60.0% 0 .0% 0 .0% 2 40.0% 0 .0% 0 .0% 5 100.0%
1 50.0% 0 .0% 0 .0% 1 50.0% 0 .0% 0 .0% 2 100.0%
0 .0% 0 .0% 0 .0% 2 100.0% 0 .0% 0 .0% 2 100.0%
0 .0% 0 .0% 0 .0% 1 100.0% 0 .0% 0 .0% 1 100.0%
0 .0% 0 .0% 0 .0% 0 .0% 0 .0% 0 .0% 0 .0%
1 33.3% 0 .0% 0 .0% 1 33.3% 1 33.3% 0 .0% 3 100.0%
1 10.0% 0 .0% 0 .0% 7 70.0% 2 20.0% 0 .0% 10 100.0%
1 20.0% 0 .0% 0 .0% 3 60.0% 1 20.0% 0 .0% 5 100.0%
1 25.0% 0 .0% 0 .0% 3 75.0% 0 .0% 0 .0% 4 100.0%
19 44.2% 0 .0% 1 2.3% 18 41.9% 4 9.3% 1 2.3% 43 100.0%
0 .0% 1 100.0% 0 .0% 0 .0% 0 .0% 0 .0% 1 100.0%
0 .0% 0 .0% 0 .0% 0 .0% 0 .0% 0 .0% 0 .0%
0 .0% 0 .0% 0 .0% 0 .0% 0 .0% 0 .0% 0 .0%
6 100.0% 0 .0% 0 .0% 0 .0% 0 .0% 0 .0% 6 100.0%
1 9.1% 0 .0% 0 .0% 8 72.7% 2 18.2% 0 .0% 11 100.0%
0 .0% 0 .0% 0 .0% 1 33.3% 2 66.7% 0 .0% 3 100.0%
9 34.6% 1 3.8% 1 3.8% 14 53.8% 0 .0% 1 3.8% 26 100.0%
6 35.3% 0 .0% 0 .0% 8 47.1% 3 17.6% 0 .0% 17 100.0%
22 35.5% 1 1.6% 1 1.6% 31 50.0% 7 11.3% 0 .0% 62 100.0%
0 .0% 0 .0% 0 .0% 0 .0% 0 .0% 1 100.0% 1 100.0%
0 .0% 0 .0% 0 .0% 0 .0% 0 .0% 0 .0% 0 .0%
1 16.7% 0 .0% 0 .0% 4 66.7% 1 16.7% 0 .0% 6 100.0%
21 36.8% 1 1.8% 1 1.8% 27 47.4% 6 10.5% 1 1.8% 57 100.0%
2 33.3% 0 .0% 0 .0% 3 50.0% 0 .0% 1 16.7% 6 100.0%
3 33.3% 0 .0% 0 .0% 5 55.6% 1 11.1% 0 .0% 9 100.0%
17 35.4% 1 2.1% 1 2.1% 23 47.9% 6 12.5% 0 .0% 48 100.0%
1 100.0% 0 .0% 0 .0% 0 .0% 0 .0% 0 .0% 1 100.0%
2 40.0% 0 .0% 0 .0% 3 60.0% 0 .0% 0 .0% 5 100.0%
2 33.3% 0 .0% 0 .0% 4 66.7% 0 .0% 0 .0% 6 100.0%
3 27.3% 1 9.1% 0 .0% 7 63.6% 0 .0% 0 .0% 11 100.0%
0 .0% 0 .0% 0 .0% 0 .0% 0 .0% 0 .0% 0 .0%
0 .0% 0 .0% 0 .0% 1 100.0% 0 .0% 0 .0% 1 100.0%
4 33.3% 0 .0% 0 .0% 5 41.7% 2 16.7% 1 8.3% 12 100.0%
4 26.7% 0 .0% 1 6.7% 8 53.3% 2 13.3% 0 .0% 15 100.0%
6 50.0% 0 .0% 0 .0% 3 25.0% 3 25.0% 0 .0% 12 100.0%
Male
Female
Gender
<24
25 - 34 years
35 - 44 years
45 - 54 years
55 +
Participant Age
Married or living with partner
Separated, not living with partner
Widowed, not living with partner
Not married, no partner with parents
Not married, not with partner, alone
Status
Yes
No
Caring Responsibilities
at Home
1
2
3
Variety of Caring
Responsibilities At
Home
<1hr
1 - 3 hrs
4 - 5 hrs
6 - 7 hrs
8 - 9 hrs
>9 hrs
How much time do you
spend in domestic
work?
Less than O- Level equivalent
O-Level
A-Level
Vocational Certification (City & Guilds or equivalent)
University Diploma or equivalent -Local
University Diploma or equivalent -Overseas Institution
University Degree- Baccalaureate
University Degree- Masters' Level
University Doctoral
Others
What is your highest
qualification?
Government Organisation/Department
Parastatal Company
Publicly Listed Company
Private Company/Sole Trader
Commercial Partnership
Non-profit Organisation
Describe the company
where you are
employed
Agriculture & Fishery
Stone Quarrying & Construction
Governmental Services
Hotel & Catering
Services
Manufacturing
Sector of Activity
Full time
Ful time (reduced hours)
Part time
What is your present
main job?
More than One Job
One Job Only
Are you engaged in
more than one job?
Casual
Permanent-Fixed Term Contract
Permanent-Indefinite Contract
What is the basis of
your main job?
Senior Managers, Directors
Professionals
Associate Professionals & Technical
Clerical employees
Skilled agriculture & fishery workers
Crafts & related trades
Plant & machine operator, assembly workers
Elementary occupations
Shop & Market services
Your level of
responsibility
N N %
1.00
N N %
1.20
N N %
1.25
N N %
1.50
N N %
2.00
N N %
2.50
N N %
Total
O/t calculation - ordinary day, night hours, 1hr =

Gender Pay Review
National Commission for the Promotion of Equality
Malta September 2006 page 143 of 327
Table 41 – Analysis of Incidence of Overtime Rates (Saturdays) Across Respondent Groups
20 24.1% 1 1.2% 56 67.5% 1 1.2% 3 3.6% 1 1.2% 1 1.2% 83 100.0%
6 22.2% 0 .0% 16 59.3% 0 .0% 5 18.5% 0 .0% 0 .0% 27 100.0%
9 29.0% 0 .0% 18 58.1% 0 .0% 3 9.7% 1 3.2% 0 .0% 31 100.0%
4 10.5% 1 2.6% 30 78.9% 0 .0% 3 7.9% 0 .0% 0 .0% 38 100.0%
5 26.3% 0 .0% 11 57.9% 1 5.3% 2 10.5% 0 .0% 0 .0% 19 100.0%
6 31.6% 0 .0% 12 63.2% 0 .0% 0 .0% 0 .0% 1 5.3% 19 100.0%
2 100.0% 0 .0% 0 .0% 0 .0% 0 .0% 0 .0% 0 .0% 2 100.0%
14 26.9% 0 .0% 31 59.6% 1 1.9% 5 9.6% 0 .0% 1 1.9% 52 100.0%
0 .0% 0 .0% 3 100.0% 0 .0% 0 .0% 0 .0% 0 .0% 3 100.0%
0 .0% 0 .0% 0 .0% 0 .0% 0 .0% 0 .0% 0 .0% 0 .0%
11 22.0% 1 2.0% 34 68.0% 0 .0% 3 6.0% 1 2.0% 0 .0% 50 100.0%
1 20.0% 0 .0% 4 80.0% 0 .0% 0 .0% 0 .0% 0 .0% 5 100.0%
12 25.5% 1 2.1% 30 63.8% 1 2.1% 3 6.4% 0 .0% 0 .0% 47 100.0%
14 22.2% 0 .0% 42 66.7% 0 .0% 5 7.9% 1 1.6% 1 1.6% 63 100.0%
11 33.3% 1 3.0% 21 63.6% 0 .0% 0 .0% 0 .0% 0 .0% 33 100.0%
0 .0% 0 .0% 8 66.7% 1 8.3% 3 25.0% 0 .0% 0 .0% 12 100.0%
1 50.0% 0 .0% 1 50.0% 0 .0% 0 .0% 0 .0% 0 .0% 2 100.0%
12 33.3% 1 2.8% 22 61.1% 0 .0% 0 .0% 1 2.8% 0 .0% 36 100.0%
11 26.8% 0 .0% 25 61.0% 1 2.4% 3 7.3% 0 .0% 1 2.4% 41 100.0%
1 11.1% 0 .0% 8 88.9% 0 .0% 0 .0% 0 .0% 0 .0% 9 100.0%
1 14.3% 0 .0% 3 42.9% 0 .0% 3 42.9% 0 .0% 0 .0% 7 100.0%
0 .0% 0 .0% 0 .0% 0 .0% 0 .0% 0 .0% 0 .0% 0 .0%
0 .0% 0 .0% 3 75.0% 0 .0% 1 25.0% 0 .0% 0 .0% 4 100.0%
12 38.7% 1 3.2% 15 48.4% 0 .0% 1 3.2% 1 3.2% 1 3.2% 31 100.0%
3 10.0% 0 .0% 23 76.7% 1 3.3% 3 10.0% 0 .0% 0 .0% 30 100.0%
2 16.7% 0 .0% 9 75.0% 0 .0% 1 8.3% 0 .0% 0 .0% 12 100.0%
2 15.4% 0 .0% 9 69.2% 0 .0% 2 15.4% 0 .0% 0 .0% 13 100.0%
4 57.1% 0 .0% 3 42.9% 0 .0% 0 .0% 0 .0% 0 .0% 7 100.0%
1 33.3% 0 .0% 2 66.7% 0 .0% 0 .0% 0 .0% 0 .0% 3 100.0%
1 25.0% 0 .0% 3 75.0% 0 .0% 0 .0% 0 .0% 0 .0% 4 100.0%
0 .0% 0 .0% 3 75.0% 0 .0% 1 25.0% 0 .0% 0 .0% 4 100.0%
0 .0% 0 .0% 0 .0% 0 .0% 0 .0% 0 .0% 0 .0% 0 .0%
1 16.7% 0 .0% 5 83.3% 0 .0% 0 .0% 0 .0% 0 .0% 6 100.0%
1 5.0% 0 .0% 19 95.0% 0 .0% 0 .0% 0 .0% 0 .0% 20 100.0%
2 25.0% 0 .0% 5 62.5% 0 .0% 1 12.5% 0 .0% 0 .0% 8 100.0%
1 14.3% 0 .0% 4 57.1% 0 .0% 1 14.3% 0 .0% 1 14.3% 7 100.0%
21 28.8% 1 1.4% 43 58.9% 1 1.4% 6 8.2% 1 1.4% 0 .0% 73 100.0%
1 50.0% 0 .0% 1 50.0% 0 .0% 0 .0% 0 .0% 0 .0% 2 100.0%
0 .0% 0 .0% 0 .0% 0 .0% 0 .0% 0 .0% 0 .0% 0 .0%
0 .0% 0 .0% 0 .0% 0 .0% 0 .0% 0 .0% 0 .0% 0 .0%
9 100.0% 0 .0% 0 .0% 0 .0% 0 .0% 0 .0% 0 .0% 9 100.0%
1 5.3% 0 .0% 18 94.7% 0 .0% 0 .0% 0 .0% 0 .0% 19 100.0%
1 14.3% 0 .0% 3 42.9% 0 .0% 3 42.9% 0 .0% 0 .0% 7 100.0%
10 24.4% 1 2.4% 28 68.3% 0 .0% 1 2.4% 1 2.4% 0 .0% 41 100.0%
5 14.7% 0 .0% 23 67.6% 1 2.9% 4 11.8% 0 .0% 1 2.9% 34 100.0%
26 24.1% 1 .9% 71 65.7% 1 .9% 8 7.4% 0 .0% 1 .9% 108 100.0%
0 .0% 0 .0% 0 .0% 0 .0% 0 .0% 1 100.0% 0 .0% 1 100.0%
0 .0% 0 .0% 1 100.0% 0 .0% 0 .0% 0 .0% 0 .0% 1 100.0%
2 16.7% 0 .0% 10 83.3% 0 .0% 0 .0% 0 .0% 0 .0% 12 100.0%
24 24.5% 1 1.0% 62 63.3% 1 1.0% 8 8.2% 1 1.0% 1 1.0% 98 100.0%
2 22.2% 0 .0% 6 66.7% 0 .0% 0 .0% 1 11.1% 0 .0% 9 100.0%
2 18.2% 0 .0% 7 63.6% 0 .0% 2 18.2% 0 .0% 0 .0% 11 100.0%
22 24.4% 1 1.1% 59 65.6% 1 1.1% 6 6.7% 0 .0% 1 1.1% 90 100.0%
4 100.0% 0 .0% 0 .0% 0 .0% 0 .0% 0 .0% 0 .0% 4 100.0%
3 30.0% 0 .0% 7 70.0% 0 .0% 0 .0% 0 .0% 0 .0% 10 100.0%
2 14.3% 0 .0% 11 78.6% 0 .0% 1 7.1% 0 .0% 0 .0% 14 100.0%
3 15.0% 0 .0% 14 70.0% 1 5.0% 2 10.0% 0 .0% 0 .0% 20 100.0%
0 .0% 0 .0% 0 .0% 0 .0% 0 .0% 0 .0% 0 .0% 0 .0%
0 .0% 0 .0% 2 100.0% 0 .0% 0 .0% 0 .0% 0 .0% 2 100.0%
4 17.4% 0 .0% 17 73.9% 0 .0% 1 4.3% 1 4.3% 0 .0% 23 100.0%
3 15.0% 1 5.0% 13 65.0% 0 .0% 2 10.0% 0 .0% 1 5.0% 20 100.0%
7 41.2% 0 .0% 8 47.1% 0 .0% 2 11.8% 0 .0% 0 .0% 17 100.0%
Male
Female
Gender
<24
25 - 34 years
35 - 44 years
45 - 54 years
55 +
Participant Age
Married or living with partner
Separated, not living with partner
Widowed, not living with partner
Not married, no partner with parents
Not married, not with partner, alone
Status
Yes
No
Caring Responsibilities
at Home
1
2
3
Variety of Caring
Responsibilities At
Home
<1hr
1 - 3 hrs
4 - 5 hrs
6 - 7 hrs
8 - 9 hrs
>9 hrs
How much time do you
spend in domestic
work?
Less than O- Level equivalent
O-Level
A-Level
Vocational Certification (City & Guilds or equivalent)
University Diploma or equivalent -Local
University Diploma or equivalent -Overseas Institution
University Degree- Baccalaureate
University Degree- Masters' Level
University Doctoral
Others
What is your highest
qualification?
Government Organisation/Department
Parastatal Company
Publicly Listed Company
Private Company/Sole Trader
Commercial Partnership
Non-profit Organisation
Describe the company
where you are
employed
Agriculture & Fishery
Stone Quarrying & Construction
Governmental Services
Hotel & Catering
Services
Manufacturing
Sector of Activity
Full time
Ful time (reduced hours)
Part time
What is your present
main job?
More than One Job
One Job Only
Are you engaged in
more than one job?
Casual
Permanent-Fixed Term Contract
Permanent-Indefinite Contract
What is the basis of
your main job?
Senior Managers, Directors
Professionals
Associate Professionals & Technical
Clerical employees
Skilled agriculture & fishery workers
Crafts & related trades
Plant & machine operator, assembly workers
Elementary occupations
Shop & Market services
Your level of
responsibility
N N %
1.00
N N %
1.25
N N %
1.50
N N %
1.75
N N %
2.00
N N %
2.50
N N %
4.00
N N %
Total
O/t calculation - Saturdays, 1hr =

Gender Pay Review
National Commission for the Promotion of Equality
Malta September 2006 page 144 of 327
Table 42 – Analysis of Incidence of Overtime Rates (Sundays) Across Respondent Groups
11 18.6% 1 1.7% 7 11.9% 38 64.4% 1 1.7% 1 1.7% 59 100.0%
2 9.5% 0 .0% 3 14.3% 16 76.2% 0 .0% 0 .0% 21 100.0%
5 20.0% 0 .0% 5 20.0% 14 56.0% 1 4.0% 0 .0% 25 100.0%
1 3.7% 1 3.7% 4 14.8% 21 77.8% 0 .0% 0 .0% 27 100.0%
2 22.2% 0 .0% 0 .0% 7 77.8% 0 .0% 0 .0% 9 100.0%
4 23.5% 0 .0% 1 5.9% 11 64.7% 0 .0% 1 5.9% 17 100.0%
1 100.0% 0 .0% 0 .0% 0 .0% 0 .0% 0 .0% 1 100.0%
7 20.0% 0 .0% 1 2.9% 26 74.3% 0 .0% 1 2.9% 35 100.0%
0 .0% 0 .0% 0 .0% 3 100.0% 0 .0% 0 .0% 3 100.0%
0 .0% 0 .0% 0 .0% 0 .0% 0 .0% 0 .0% 0 .0%
6 16.7% 1 2.8% 7 19.4% 21 58.3% 1 2.8% 0 .0% 36 100.0%
0 .0% 0 .0% 2 33.3% 4 66.7% 0 .0% 0 .0% 6 100.0%
5 14.7% 1 2.9% 1 2.9% 27 79.4% 0 .0% 0 .0% 34 100.0%
8 17.4% 0 .0% 9 19.6% 27 58.7% 1 2.2% 1 2.2% 46 100.0%
4 15.4% 1 3.8% 0 .0% 21 80.8% 0 .0% 0 .0% 26 100.0%
0 .0% 0 .0% 1 16.7% 5 83.3% 0 .0% 0 .0% 6 100.0%
1 50.0% 0 .0% 0 .0% 1 50.0% 0 .0% 0 .0% 2 100.0%
7 29.2% 1 4.2% 4 16.7% 12 50.0% 0 .0% 0 .0% 24 100.0%
5 16.1% 0 .0% 3 9.7% 22 71.0% 0 .0% 1 3.2% 31 100.0%
1 14.3% 0 .0% 1 14.3% 5 71.4% 0 .0% 0 .0% 7 100.0%
0 .0% 0 .0% 0 .0% 5 100.0% 0 .0% 0 .0% 5 100.0%
0 .0% 0 .0% 0 .0% 0 .0% 0 .0% 0 .0% 0 .0%
0 .0% 0 .0% 0 .0% 3 100.0% 0 .0% 0 .0% 3 100.0%
6 30.0% 1 5.0% 1 5.0% 11 55.0% 0 .0% 1 5.0% 20 100.0%
2 8.7% 0 .0% 2 8.7% 19 82.6% 0 .0% 0 .0% 23 100.0%
1 12.5% 0 .0% 2 25.0% 4 50.0% 1 12.5% 0 .0% 8 100.0%
0 .0% 0 .0% 2 22.2% 7 77.8% 0 .0% 0 .0% 9 100.0%
3 42.9% 0 .0% 1 14.3% 3 42.9% 0 .0% 0 .0% 7 100.0%
0 .0% 0 .0% 1 33.3% 2 66.7% 0 .0% 0 .0% 3 100.0%
0 .0% 0 .0% 1 33.3% 2 66.7% 0 .0% 0 .0% 3 100.0%
0 .0% 0 .0% 0 .0% 3 100.0% 0 .0% 0 .0% 3 100.0%
0 .0% 0 .0% 0 .0% 0 .0% 0 .0% 0 .0% 0 .0%
1 25.0% 0 .0% 0 .0% 3 75.0% 0 .0% 0 .0% 4 100.0%
0 .0% 0 .0% 3 17.6% 14 82.4% 0 .0% 0 .0% 17 100.0%
1 12.5% 0 .0% 1 12.5% 6 75.0% 0 .0% 0 .0% 8 100.0%
1 16.7% 0 .0% 1 16.7% 3 50.0% 0 .0% 1 16.7% 6 100.0%
11 22.9% 1 2.1% 5 10.4% 30 62.5% 1 2.1% 0 .0% 48 100.0%
0 .0% 0 .0% 0 .0% 1 100.0% 0 .0% 0 .0% 1 100.0%
0 .0% 0 .0% 0 .0% 0 .0% 0 .0% 0 .0% 0 .0%
0 .0% 0 .0% 0 .0% 0 .0% 0 .0% 0 .0% 0 .0%
6 100.0% 0 .0% 0 .0% 0 .0% 0 .0% 0 .0% 6 100.0%
0 .0% 0 .0% 2 12.5% 14 87.5% 0 .0% 0 .0% 16 100.0%
0 .0% 0 .0% 1 25.0% 3 75.0% 0 .0% 0 .0% 4 100.0%
5 16.7% 1 3.3% 6 20.0% 17 56.7% 1 3.3% 0 .0% 30 100.0%
2 8.3% 0 .0% 1 4.2% 20 83.3% 0 .0% 1 4.2% 24 100.0%
13 16.3% 1 1.3% 10 12.5% 54 67.5% 1 1.3% 1 1.3% 80 100.0%
0 .0% 0 .0% 0 .0% 0 .0% 0 .0% 0 .0% 0 .0%
0 .0% 0 .0% 0 .0% 0 .0% 0 .0% 0 .0% 0 .0%
1 9.1% 0 .0% 1 9.1% 9 81.8% 0 .0% 0 .0% 11 100.0%
12 17.4% 1 1.4% 9 13.0% 45 65.2% 1 1.4% 1 1.4% 69 100.0%
1 16.7% 0 .0% 1 16.7% 4 66.7% 0 .0% 0 .0% 6 100.0%
1 14.3% 0 .0% 1 14.3% 4 57.1% 1 14.3% 0 .0% 7 100.0%
11 16.4% 1 1.5% 8 11.9% 46 68.7% 0 .0% 1 1.5% 67 100.0%
1 100.0% 0 .0% 0 .0% 0 .0% 0 .0% 0 .0% 1 100.0%
2 18.2% 0 .0% 2 18.2% 6 54.5% 1 9.1% 0 .0% 11 100.0%
1 9.1% 0 .0% 1 9.1% 9 81.8% 0 .0% 0 .0% 11 100.0%
3 23.1% 0 .0% 1 7.7% 9 69.2% 0 .0% 0 .0% 13 100.0%
0 .0% 0 .0% 0 .0% 0 .0% 0 .0% 0 .0% 0 .0%
0 .0% 0 .0% 0 .0% 1 100.0% 0 .0% 0 .0% 1 100.0%
3 17.6% 0 .0% 1 5.9% 13 76.5% 0 .0% 0 .0% 17 100.0%
1 7.1% 1 7.1% 3 21.4% 8 57.1% 0 .0% 1 7.1% 14 100.0%
2 16.7% 0 .0% 2 16.7% 8 66.7% 0 .0% 0 .0% 12 100.0%
Male
Female
Gender
<24
25 - 34 years
35 - 44 years
45 - 54 years
55 +
Participant Age
Married or living with partner
Separated, not living with partner
Widowed, not living with partner
Not married, no partner with parents
Not married, not with partner, alone
Status
Yes
No
Caring Responsibilities
at Home
1
2
3
Variety of Caring
Responsibilities At
Home
<1hr
1 - 3 hrs
4 - 5 hrs
6 - 7 hrs
8 - 9 hrs
>9 hrs
How much time do you
spend in domestic
work?
Less than O- Level equivalent
O-Level
A-Level
Vocational Certification (City & Guilds or equivalent)
University Diploma or equivalent -Local
University Diploma or equivalent -Overseas Institution
University Degree- Baccalaureate
University Degree- Masters' Level
University Doctoral
Others
What is your highest
qualification?
Government Organisation/Department
Parastatal Company
Publicly Listed Company
Private Company/Sole Trader
Commercial Partnership
Non-profit Organisation
Describe the company
where you are
employed
Agriculture & Fishery
Stone Quarrying & Construction
Governmental Services
Hotel & Catering
Services
Manufacturing
Sector of Activity
Full time
Ful time (reduced hours)
Part time
What is your present
main job?
More than One Job
One Job Only
Are you engaged in
more than one job?
Casual
Permanent-Fixed Term Contract
Permanent-Indefinite Contract
What is the basis of
your main job?
Senior Managers, Directors
Professionals
Associate Professionals & Technical
Clerical employees
Skilled agriculture & fishery workers
Crafts & related trades
Plant & machine operator, assembly workers
Elementary occupations
Shop & Market services
Your level of
responsibility
N N %
1.00
N N %
1.25
N N %
1.50
N N %
2.00
N N %
2.50
N N %
4.00
N N %
Total
O/t calculation - Sundays, 1hr =

Gender Pay Review
National Commission for the Promotion of Equality
Malta September 2006 page 145 of 327
Table 43 – Analysis of Incidence of Overtime Rates (Public Holidays) Across Respondent Groups
14 21.5% 1 1.5% 7 10.8% 36 55.4% 2 3.1% 4 6.2% 1 1.5% 65 100.0%
2 10.0% 0 .0% 1 5.0% 13 65.0% 0 .0% 4 20.0% 0 .0% 20 100.0%
4 18.2% 0 .0% 2 9.1% 12 54.5% 1 4.5% 3 13.6% 0 .0% 22 100.0%
3 9.7% 1 3.2% 4 12.9% 20 64.5% 1 3.2% 2 6.5% 0 .0% 31 100.0%
3 23.1% 0 .0% 1 7.7% 8 61.5% 0 .0% 1 7.7% 0 .0% 13 100.0%
5 29.4% 0 .0% 1 5.9% 8 47.1% 0 .0% 2 11.8% 1 5.9% 17 100.0%
1 100.0% 0 .0% 0 .0% 0 .0% 0 .0% 0 .0% 0 .0% 1 100.0%
10 25.0% 0 .0% 3 7.5% 22 55.0% 0 .0% 4 10.0% 1 2.5% 40 100.0%
0 .0% 0 .0% 1 33.3% 2 66.7% 0 .0% 0 .0% 0 .0% 3 100.0%
0 .0% 0 .0% 0 .0% 0 .0% 0 .0% 0 .0% 0 .0% 0 .0%
6 16.7% 1 2.8% 2 5.6% 21 58.3% 2 5.6% 4 11.1% 0 .0% 36 100.0%
0 .0% 0 .0% 2 33.3% 4 66.7% 0 .0% 0 .0% 0 .0% 6 100.0%
8 20.5% 1 2.6% 3 7.7% 22 56.4% 0 .0% 5 12.8% 0 .0% 39 100.0%
8 17.4% 0 .0% 5 10.9% 27 58.7% 2 4.3% 3 6.5% 1 2.2% 46 100.0%
7 24.1% 1 3.4% 2 6.9% 15 51.7% 0 .0% 4 13.8% 0 .0% 29 100.0%
0 .0% 0 .0% 1 12.5% 6 75.0% 0 .0% 1 12.5% 0 .0% 8 100.0%
1 50.0% 0 .0% 0 .0% 1 50.0% 0 .0% 0 .0% 0 .0% 2 100.0%
8 30.8% 1 3.8% 2 7.7% 14 53.8% 0 .0% 1 3.8% 0 .0% 26 100.0%
6 18.8% 0 .0% 1 3.1% 19 59.4% 1 3.1% 4 12.5% 1 3.1% 32 100.0%
1 12.5% 0 .0% 3 37.5% 3 37.5% 0 .0% 1 12.5% 0 .0% 8 100.0%
1 14.3% 0 .0% 1 14.3% 4 57.1% 0 .0% 1 14.3% 0 .0% 7 100.0%
0 .0% 0 .0% 0 .0% 0 .0% 0 .0% 0 .0% 0 .0% 0 .0%
0 .0% 0 .0% 0 .0% 3 100.0% 0 .0% 0 .0% 0 .0% 3 100.0%
8 36.4% 1 4.5% 1 4.5% 11 50.0% 0 .0% 0 .0% 1 4.5% 22 100.0%
3 13.0% 0 .0% 0 .0% 14 60.9% 0 .0% 6 26.1% 0 .0% 23 100.0%
1 14.3% 0 .0% 1 14.3% 4 57.1% 1 14.3% 0 .0% 0 .0% 7 100.0%
0 .0% 0 .0% 1 10.0% 8 80.0% 0 .0% 1 10.0% 0 .0% 10 100.0%
2 33.3% 0 .0% 2 33.3% 2 33.3% 0 .0% 0 .0% 0 .0% 6 100.0%
0 .0% 0 .0% 1 25.0% 3 75.0% 0 .0% 0 .0% 0 .0% 4 100.0%
1 25.0% 0 .0% 0 .0% 2 50.0% 1 25.0% 0 .0% 0 .0% 4 100.0%
0 .0% 0 .0% 2 50.0% 1 25.0% 0 .0% 1 25.0% 0 .0% 4 100.0%
0 .0% 0 .0% 0 .0% 0 .0% 0 .0% 0 .0% 0 .0% 0 .0%
1 20.0% 0 .0% 0 .0% 4 80.0% 0 .0% 0 .0% 0 .0% 5 100.0%
0 .0% 0 .0% 3 15.8% 15 78.9% 1 5.3% 0 .0% 0 .0% 19 100.0%
1 12.5% 0 .0% 1 12.5% 6 75.0% 0 .0% 0 .0% 0 .0% 8 100.0%
1 16.7% 0 .0% 0 .0% 2 33.3% 0 .0% 2 33.3% 1 16.7% 6 100.0%
14 27.5% 1 2.0% 4 7.8% 26 51.0% 1 2.0% 5 9.8% 0 .0% 51 100.0%
0 .0% 0 .0% 0 .0% 0 .0% 0 .0% 1 100.0% 0 .0% 1 100.0%
0 .0% 0 .0% 0 .0% 0 .0% 0 .0% 0 .0% 0 .0% 0 .0%
0 .0% 0 .0% 0 .0% 0 .0% 0 .0% 0 .0% 0 .0% 0 .0%
8 100.0% 0 .0% 0 .0% 0 .0% 0 .0% 0 .0% 0 .0% 8 100.0%
0 .0% 0 .0% 2 11.1% 16 88.9% 0 .0% 0 .0% 0 .0% 18 100.0%
0 .0% 0 .0% 1 25.0% 3 75.0% 0 .0% 0 .0% 0 .0% 4 100.0%
5 17.2% 1 3.4% 5 17.2% 14 48.3% 2 6.9% 2 6.9% 0 .0% 29 100.0%
3 11.5% 0 .0% 0 .0% 16 61.5% 0 .0% 6 23.1% 1 3.8% 26 100.0%
16 18.8% 1 1.2% 8 9.4% 49 57.6% 2 2.4% 8 9.4% 1 1.2% 85 100.0%
0 .0% 0 .0% 0 .0% 0 .0% 0 .0% 0 .0% 0 .0% 0 .0%
0 .0% 0 .0% 0 .0% 0 .0% 0 .0% 0 .0% 0 .0% 0 .0%
2 16.7% 0 .0% 0 .0% 7 58.3% 1 8.3% 2 16.7% 0 .0% 12 100.0%
14 19.2% 1 1.4% 8 11.0% 42 57.5% 1 1.4% 6 8.2% 1 1.4% 73 100.0%
1 16.7% 0 .0% 0 .0% 3 50.0% 0 .0% 2 33.3% 0 .0% 6 100.0%
1 16.7% 0 .0% 0 .0% 4 66.7% 1 16.7% 0 .0% 0 .0% 6 100.0%
14 19.2% 1 1.4% 8 11.0% 42 57.5% 1 1.4% 6 8.2% 1 1.4% 73 100.0%
2 100.0% 0 .0% 0 .0% 0 .0% 0 .0% 0 .0% 0 .0% 2 100.0%
2 18.2% 0 .0% 4 36.4% 3 27.3% 2 18.2% 0 .0% 0 .0% 11 100.0%
1 7.7% 0 .0% 1 7.7% 11 84.6% 0 .0% 0 .0% 0 .0% 13 100.0%
2 15.4% 0 .0% 0 .0% 8 61.5% 0 .0% 3 23.1% 0 .0% 13 100.0%
0 .0% 0 .0% 0 .0% 0 .0% 0 .0% 0 .0% 0 .0% 0 .0%
0 .0% 0 .0% 0 .0% 1 100.0% 0 .0% 0 .0% 0 .0% 1 100.0%
4 21.1% 0 .0% 0 .0% 10 52.6% 0 .0% 5 26.3% 0 .0% 19 100.0%
1 7.7% 1 7.7% 2 15.4% 8 61.5% 0 .0% 0 .0% 1 7.7% 13 100.0%
4 30.8% 0 .0% 1 7.7% 8 61.5% 0 .0% 0 .0% 0 .0% 13 100.0%
Male
Female
Gender
<24
25 - 34 years
35 - 44 years
45 - 54 years
55 +
Participant Age
Married or living with partner
Separated, not living with partner
Widowed, not living with partner
Not married, no partner with parents
Not married, not with partner, alone
Status
Yes
No
Caring Responsibilities
at Home
1
2
3
Variety of Caring
Responsibilities At
Home
<1hr
1 - 3 hrs
4 - 5 hrs
6 - 7 hrs
8 - 9 hrs
>9 hrs
How much time do you
spend in domestic
work?
Less than O- Level equivalent
O-Level
A-Level
Vocational Certification (City & Guilds or equivalent)
University Diploma or equivalent -Local
University Diploma or equivalent -Overseas Institution
University Degree- Baccalaureate
University Degree- Masters' Level
University Doctoral
Others
What is your highest
qualification?
Government Organisation/Department
Parastatal Company
Publicly Listed Company
Private Company/Sole Trader
Commercial Partnership
Non-profit Organisation
Describe the company
where you are
employed
Agriculture & Fishery
Stone Quarrying & Construction
Governmental Services
Hotel & Catering
Services
Manufacturing
Sector of Activity
Full time
Ful time (reduced hours)
Part time
What is your present
main job?
More than One Job
One Job Only
Are you engaged in
more than one job?
Casual
Permanent-Fixed Term Contract
Permanent-Indefinite Contract
What is the basis of
your main job?
Senior Managers, Directors
Professionals
Associate Professionals & Technical
Clerical employees
Skilled agriculture & fishery workers
Crafts & related trades
Plant & machine operator, assembly workers
Elementary occupations
Shop & Market services
Your level of
responsibility
N N %
1.00
N N %
1.25
N N %
1.50
N N %
2.00
N N %
2.50
N N %
3.00
N N %
4.00
N N %
Total
O/t calculation - Public Holidays, 1hr =

Gender Pay Review
National Commission for the Promotion of Equality
Malta September 2006 page 146 of 327
5.1.9 Flexitime
Table 44 sets out a summary of the incidence of flexitime as claimed by research participants,
showing how 14.3% of the employees interviewed benefited from this family friendly
arrangement. An analysis of the incidence of this benefit across research participant groups is
set out in Table 45, which, despite the relative homogenous incidence of flexitime across survey
participants, respondents:
� with wider variety of caring responsibilities at home, or
� working with parastatal or commercial partnership or non-profit organisations, or
� employed in senior management or associate professional or clerical jobs
were likely to feature a relatively higher incidence of such benefit than other respondent
groups. Table 46 sets out an analysis of the incidence of flexitime across different conditions of
work characteristics, showing that flexitime is not associated with:
� the number of hours required to be worked as a minimum,
� the incidence of shift work,
� the benefiting from a shift allowance,
� the earned shift allowance, and
� the number of additional hours worked on top of the required minimum weekly hours.
Table 44 – Summary of Incidence of Flexitime
84 14.3%
503 85.7%
587 100.0%
Yes
No
Total
Do you benefit
from flexitime?
Count Valid Percent
Yes
14.3%
No
85.7%

Gender Pay Review
National Commission for the Promotion of Equality
Malta September 2006 page 147 of 327
Table 45 – Analysis of Incidence of Flexitime Across Research Participant Groups
47 13.5% 301 86.5% 348 100.0%
37 15.5% 202 84.5% 239 100.0%
24 13.1% 159 86.9% 183 100.0%
21 13.4% 136 86.6% 157 100.0%
18 16.5% 91 83.5% 109 100.0%
16 16.7% 80 83.3% 96 100.0%
3 7.7% 36 92.3% 39 100.0%
38 13.4% 246 86.6% 284 100.0%
3 23.1% 10 76.9% 13 100.0%
0 .0% 2 100.0% 2 100.0%
37 14.8% 213 85.2% 250 100.0%
6 15.8% 32 84.2% 38 100.0%
37 16.4% 188 83.6% 225 100.0%
47 13.0% 315 87.0% 362 100.0%
22 12.9% 148 87.1% 170 100.0%
13 26.5% 36 73.5% 49 100.0%
1 20.0% 4 80.0% 5 100.0%
1 100.0% 0 .0% 1 100.0%
25 11.4% 195 88.6% 220 100.0%
35 17.2% 168 82.8% 203 100.0%
4 7.1% 52 92.9% 56 100.0%
6 20.0% 24 80.0% 30 100.0%
3 30.0% 7 70.0% 10 100.0%
5 21.7% 18 78.3% 23 100.0%
10 7.7% 120 92.3% 130 100.0%
18 11.9% 133 88.1% 151 100.0%
17 18.3% 76 81.7% 93 100.0%
10 17.5% 47 82.5% 57 100.0%
4 16.0% 21 84.0% 25 100.0%
7 25.0% 21 75.0% 28 100.0%
12 20.7% 46 79.3% 58 100.0%
4 14.8% 23 85.2% 27 100.0%
0 .0% 0 .0% 0 .0%
2 11.1% 16 88.9% 18 100.0%
9 7.0% 120 93.0% 129 100.0%
7 19.4% 29 80.6% 36 100.0%
5 13.5% 32 86.5% 37 100.0%
58 15.7% 312 84.3% 370 100.0%
2 25.0% 6 75.0% 8 100.0%
3 42.9% 4 57.1% 7 100.0%
0 .0% 2 100.0% 2 100.0%
1 6.3% 15 93.8% 16 100.0%
10 7.9% 116 92.1% 126 100.0%
8 12.7% 55 87.3% 63 100.0%
42 17.6% 197 82.4% 239 100.0%
23 16.3% 118 83.7% 141 100.0%
64 13.0% 430 87.0% 494 100.0%
2 14.3% 12 85.7% 14 100.0%
18 22.8% 61 77.2% 79 100.0%
14 16.9% 69 83.1% 83 100.0%
70 13.9% 434 86.1% 504 100.0%
17 21.5% 62 78.5% 79 100.0%
9 17.0% 44 83.0% 53 100.0%
58 12.7% 397 87.3% 455 100.0%
9 20.5% 35 79.5% 44 100.0%
14 15.2% 78 84.8% 92 100.0%
13 20.6% 50 79.4% 63 100.0%
25 18.8% 108 81.2% 133 100.0%
0 .0% 0 .0% 0 .0%
0 .0% 8 100.0% 8 100.0%
5 8.8% 52 91.2% 57 100.0%
3 3.9% 73 96.1% 76 100.0%
15 13.2% 99 86.8% 114 100.0%
Male
Female
Gender
<24
25 - 34 years
35 - 44 years
45 - 54 years
55 +
Participant Age
Married or living with partner
Separated, not living with partner
Widowed, not living with partner
Not married, no partner with parents
Not married, not with partner, alone
Status
Yes
No
Caring Responsibilities
at Home
1
2
3
4
Variety of Caring
Responsibilities At
Home
<1hr
1 - 3 hrs
4 - 5 hrs
6 - 7 hrs
8 - 9 hrs
>9 hrs
How much time do you
spend in domestic
work?
Less than O- Level equivalent
O-Level
A-Level
Vocational Certification (City & Guilds or equivalent)
University Diploma or equivalent -Local
University Diploma or equivalent -Overseas Institution
University Degree- Baccalaureate
University Degree- Masters' Level
University Doctoral
Others
What is your highest
qualification?
Government Organisation/Department
Parastatal Company
Publicly Listed Company
Private Company/Sole Trader
Commercial Partnership
Non-profit Organisation
Describe the company
where you are
employed
Agriculture & Fishery
Stone Quarrying & Construction
Governmental Services
Hotel & Catering
Services
Manufacturing
Sector of Activity
Full time
Ful time (reduced hours)
Part time
What is your present
main job?
More than One Job
One Job Only
Are you engaged in
more than one job?
Casual
Permanent-Fixed Term Contract
Permanent-Indefinite Contract
What is the basis of
your main job?
Senior Managers, Directors
Professionals
Associate Professionals & Technical
Clerical employees
Skilled agriculture & fishery workers
Crafts & related trades
Plant & machine operator, assembly workers
Elementary occupations
Shop & Market services
Your level of
responsibility
N N %
Yes
N N %
No
N N %
Total
Do you benefit from flexitime?

Gender Pay Review
National Commission for the Promotion of Equality
Malta September 2006 page 148 of 327
Table 46 – Analysis of Flexitime Incidence Against Different Work Aspects
Observation Inference
84 35.9
503 38.2
Minimum Hours
worked weekly
Yes
Minimum Hours
worked weekly
No
Do you benefit
from flexitime?
Count Mean
No significant difference in the
mean minimum hours required to
be worked across workers with or
without flexitime as a benefit
15 12.9% 69 14.6%
101 87.1% 402 85.4%
Yes
No
Do you benefit
from flexitime?
N N %
Yes
N N %
No
Do you work on shift?
No Statistically Significant
Differences in the incidence of
flexitime as a benefit across
workers as distinguished by shift
or non-shift work
10 17.9% 5 8.6%
46 82.1% 53 91.4%
Yes
No
Do you benefit
from flexitime?
N N %
Yes
N N %
No
Are you entitled to a shift allowance?
No Statistically Significant
Differences in the incidence of
flexitime as a benefit across
workers entitled to a shift
allowance or not
84 26.4
503 23.2
Gross shift allowance
(LM/week)
Yes
Gross shift allowance
(LM/week)
No
Do you benefit
from flexitime?
Count Mean
No Statistically Significant
Differences in the gross shift
allowance received across workers
benefiting from flexitime or not
39 16.7% 45 12.7%
195 83.3% 308 87.3%
Yes
No
Do you benefit
from flexitime?
N N %
Yes
N N %
No
Did you work for additional hours on top of hours
you stated?
No Statistically Significant
Differences in the incidence of
flexitime as a benefit across
workers as distinguished by their
working additional hours on top of
minimum requirements.
84 7.6
503 10.1
Additional hours weeklyYes
Additional hours weeklyNo
Do you benefit
from flexitime?
Count Mean
No Statistically Significant
Differences in the additional hours
worked on top of minimum
required work hours across
workers as distinguished by their
benefiting from flexitime

Gender Pay Review
National Commission for the Promotion of Equality
Malta September 2006 page 149 of 327
5.1.10 Total Hours Worked
The total number of hours worked by every research participant in a year was worked out by
multiplying the minimum number of hours required to be worked weekly as stated by the
research participant and multiplied by 52 to annualise the number of such hours along with the
addition of the stated additional hours worked weekly (16) multiplied by 52 weeks. The
resultant addition, termed the gross annual hours of work, was subject to a quantitative
analysis for central tendency, following the application of weights as set out in Appendix 3
enabling the estimation of a truer picture of how many hours workers devote to their main job.
This analysis shows that the weighted average annual hours worked stand at 2,177 hours (or
ranging between 2,125 and 2,229 annually at a 95% confidence interval). An analysis of such
hourly rate estimates across participant groups is summarised in Table 48, showing how such
weighted means varied across different employees as characterised by their employment and
social features. Differences between groups showed a typical pattern wherein men registered a
significantly higher number of hours worked than their female counterparts overall with some
rare exceptions. A summary of these observations is set out in Table 47.
16 This working involved a factoring related to the number of days available to the research participant in terms of vacation and
sickness leave – these being the most often days off availed by research participants.

Gender Pay Review
National Commission for the Promotion of Equality
Malta September 2006 page 150 of 327
Table 47 – Highlights from Analysis of Mean (Weighted) Estimated Hours Worked Annually (17) Across Research Participant Groups (Based on Table 48)
Highest Mean (Weighted) Hours Worked
Annually
Lowest Mean (Weighted) Hours Worked
Annually
Gender Men Women
Participant Age No Statistically Significant Differences between Respondent Groups
Family Status No Statistically Significant Differences between Respondent Groups
Caring Responsibilities at Home No Statistically Significant Differences between Respondent Groups
Variety of Caring Responsibilities at home No Statistically Significant Differences between Respondent Groups
Time devoted to Domestic Work (18) 1 hour or less daily 9 hours or more daily
Highest Academic Qualifications (19) University Master’s Degree O or A Level equivalent
Type of Employer No Statistically Significant Differences between the Respondent Groups
Sector of Activity No Statistically Significant Differences between the Respondent Groups
Present Job Type Full-time Job Part-time Job
Engaged in more than one job No Statistically Significant Differences between the Respondent Groups
Basis of Main Job Permanent Fixed-term Contract Casual
Occupation Type (ISCO 1988) Senior Management Occupations Shop & Market Services or Clerical Occupations
17 Inclusive of Overtime, Commissions & Performance Related Bonuses (where applicable) but exclusive of Statutory Bonuses
and effects of costs borne by employee (refunded or not) in the conduct of work.
18 Weighted mean of hours worked annual declines progressively with increasing hours devoted to domestic work.
19 Progressive increase in the weighted mean gross hourly earnings with increasing level of qualifications observed

Gender Pay Review
National Commission for the Promotion of Equality
Malta September 2006 page 151 of 327
Table 48 – Analysis of Mean (Weighted) Estimated Hours Worked Annually (20) Across Research Participant Groups
Male Female
Total Annual Hours
Worked
Total Annual Hours
Worked
Total Annual Hours
Worked
Mean Mean Mean
Male 2,272.13 2,272.13 .
Female 2,005.60 . 2,005.60
<24 2,125.99 2,249.68 1,989.04 260.63
25 - 34 years 2,262.44 2,356.54 2,124.63 231.91
35 - 44 years 2,176.19 2,265.25 1,973.62 291.63
45 - 54 years 2,192.88 2,317.07 1,729.49 587.58
55 + 1,983.93 2,012.97 1,851.66 161.30
Married or living with partner 2,167.86 2,274.64 1,900.96 373.68
Separated, not living with partner 2,204.67 2,346.02 1,891.61 454.42
Widowed, not living with partner 1,959.88 2,080.00 1,772.00
Not married, no partner with parents 2,177.82 2,249.25 2,078.82 170.43
Not married, not with partner, alone 2,243.92 2,394.73 2,110.84 283.90
Yes 2,187.10 2,334.73 1,851.72 483.01
No 2,170.15 2,223.91 2,086.65 137.25
1 2,144.65 2,306.65 1,842.40 464.24
2 2,314.87 2,409.60 1,894.34 515.27
3 2,318.92 2,318.92 .
4 2,080.00 . 2,080.00
<1hr 2,208.00 2,248.20 2,113.31 134.89
1 - 3 hrs 2,193.79 2,254.64 2,085.23 169.42
4 - 5 hrs 1,977.80 2,182.80 1,736.75 446.05
6 - 7 hrs 1,927.38 2,118.76 1,694.85 423.91
8 - 9 hrs 1,937.89 1,768.41 1,969.36 -200.95
>9 hrs 1,928.84 2,022.80 1,869.71 153.10
Less than O- Level equivalent 2,168.07 2,316.47 1,723.62 592.84
O-Level 2,075.09 2,133.48 1,991.71 141.76
A-Level 2,064.22 2,281.59 1,874.27 407.32
Vocational Certification (City & Guilds or equivalent) 2,320.14 2,379.25 1,921.93 457.31
University Diploma or equivalent -Local 2,214.04 2,262.16 2,078.38 183.78
University Diploma or equivalent -Overseas Institution 2,254.95 2,257.86 2,251.60 6.26
University Degree- Baccalaureate 2,288.54 2,288.30 2,288.80 -0.50
University Degree- Masters' Level 2,357.24 2,225.36 2,633.79 -408.43
University Doctoral . . .
Others 2,293.92 2,416.17 2,032.78 383.39
Government Organisation/Department 2,105.83 2,176.60 1,959.34 217.26
Parastatal Company 2,071.53 2,065.56 2,082.99 -17.43
Publicly Listed Company 2,363.77 2,449.91 2,211.22 238.69
Private Company/Sole Trader 2,195.85 2,308.92 1,999.59 309.33
Commercial Partnership 2,095.75 2,499.10 1,792.11 706.99
Non-profit Organisation 2,167.09 2,246.72 1,998.43 248.29
Agriculture & Fishery 2,749.28 2,749.28 .
Stone Quarrying & Construction 2,478.35 2,478.35 .
Governmental Services 2,106.80 2,152.81 2,022.40 130.41
Hotel & Catering 2,049.01 2,082.70 2,018.91 63.79
Services 2,186.70 2,367.38 1,857.42 509.97
Manufacturing 2,227.57 2,231.79 2,219.65 12.13
Full time 2,338.87 2,374.16 2,262.54 111.62
Ful time (reduced hours) 1,573.27 2,488.00 1,471.70 1,016.30
Part time 1,148.76 1,184.63 1,118.92 65.71
More than One Job 2,179.96 2,165.77 2,200.66 -34.89
One Job Only 2,176.49 2,287.97 1,968.48 319.48
Casual 1,608.95 1,793.80 1,493.71 300.09
Permanent-Fixed Term Contract 2,331.69 2,470.11 2,155.58 314.53
Permanent-Indefinite Contract 2,249.23 2,295.97 2,143.62 152.35
Senior Managers, Directors 2,406.38 2,446.84 2,264.76 182.07
Professionals 2,094.57 2,100.27 2,086.37 13.91
Associate Professionals & Technical 2,215.25 2,223.35 2,198.59 24.76
Clerical employees 2,037.59 2,264.86 1,882.53 382.33
Skilled agriculture & fishery workers . . .
Crafts & related trades . . .
Plant & machine operator, assembly workers 2,282.95 2,289.70 2,261.50 28.20
Elementary occupations 2,278.05 2,433.29 1,722.44 710.85
Shop & Market services 2,024.32 2,132.33 1,882.55 249.79
Your level of responsibility
Sector of Activity
What is your present main job?
Are you engaged in more than one
job?What is the basis of your main job?
Variety of Caring Responsibilities At
Home
How much time do you spend in
domestic work?
What is your highest qualification?
Describe the company where you are
employed
Gender
Participant Age
Status
Caring Responsibilities at Home
OverallGender Difference in Means
(Hrs)
20 Inclusive of Overtime, Commissions & Performance Related Bonuses (where applicable) but exclusive of Statutory Bonuses
and effects of costs borne by employee (refunded or not) in the conduct of work.

Gender Pay Review
National Commission for the Promotion of Equality
Malta September 2006 page 152 of 327
5.2 Careers
5.2.1 Experience with Employer
A total of 17.6% of the research participants were employed for more than 15 years with the
same employer, whereas 17.1% of participants were employed for less than 1 year with their
respective employer (Table 49). Overall, employees featured a median stay with their
respective employer of 5 years. An analysis of the employees’ stay (in terms of number of
years employed) with the same employer across the different respondent groups showed the
some significant differences:
� Employees staying less than 1 year with the same company were more often:
– men, or
– aged younger than 24 years, or
– not married, not living with partner, or
– not having care responsibilities at home, or
– workers occupied in clerical jobs, or
– workers engaged with Private companies, or
– workers engaged in establishments operating within the services sector, or
– workers engaged on a full time basis.
Contrastingly, employees who stayed with the same employer for over 15 years were more
often:
– men, or
– aged between 45 and 54 years, or
– married and/or living with a partner, or
– had care responsibilities at home, or
– worked in professional jobs, or
– were engaged with private companies, or
– were engaged with establishments operating in the services sector, or
– were engaged in full time jobs.

Gender Pay Review
National Commission for the Promotion of Equality
Malta September 2006 page 153 of 327
Table 49 – Summary of Number of Years Employed with same Company
Count Valid Percent
< 1 yr 100 17.1%
1 to 2 yrs 80 13.7%
2 to 4 yrs 99 16.9%
4 to 6 yrs 63 10.8%
6 to 10 yrs 86 14.7%
10 to 15 yrs 54 9.2%
15 + yrs 103 17.6%
How long have you been with this company? (months)
Total 585 100.0%
Statistics in Years
8.1595 5.0000 9.18441 .08 50.00Stay with Present Employer
(Yrs)
Mean Median Std. Deviation Minimum Maximum
An analysis of the means of the research participants’ stay with their respective employers is set
out in Table 52, showing how such stays (varied across respondent groups), as summarised in
Table 50.
Table 50 – Summary of Differences in Mean Stay with Respective Employer Across Respondent Groups (based on means set out in Table 52)
Longest Stay with Same Employer Shortest Stay with Same Employer
Gender Men Women
Participant Age (21) 55 years and older Younger than 24 years
Family Status Married and/or living with partner Single living with parents or alone
Caring Responsibilities at Home Has responsibilities No responsibilities
Variety of Caring Responsibilities at home No Statistically Significant Differences between Groups
Time devoted to Domestic Work No Statistically Significant Differences between Groups
Highest Academic Qualifications Vocational Certification or University Diploma University Baccalaureate Degree
Type of Employer Government organisation/department or
Publicly Listed Company
Private company
Sector of Activity Government Services Hotel & Catering
Present Job Type Full-time job Part-time job
Engaged in more than one job No Statistically Significant Differences between Groups
Basis of Main Job Permanent Indefinite Contract Permanent Fixed-term Contract
Occupation Type (ISCO 1988) Senior Managers, Directors Shop & Market Service Workers
21 Increases progressively with age

Gender Pay Review
National Commission for the Promotion of Equality
Malta September 2006 page 154 of 327
Table 51 – Analysis of Employee Stay with Same Employer Across Research Participant Groups
56.00 33.00 57.00 34.00 50.00 32.00 84.00
44.00 47.00 42.00 29.00 36.00 22.00 19.00
67.00 45.00 47.00 21.00 2.00 1.00 .00
20.00 16.00 24.00 23.00 47.00 23.00 4.00
8.00 5.00 16.00 10.00 16.00 13.00 39.00
4.00 9.00 11.00 6.00 13.00 12.00 41.00
1.00 5.00 1.00 1.00 7.00 5.00 19.00
22.00 24.00 33.00 25.00 49.00 43.00 87.00
.00 3.00 2.00 2.00 2.00 1.00 3.00
.00 .00 .00 .00 .00 .00 2.00
72.00 49.00 57.00 32.00 24.00 7.00 8.00
6.00 4.00 7.00 4.00 11.00 3.00 3.00
19.00 21.00 26.00 21.00 38.00 32.00 66.00
81.00 59.00 73.00 42.00 48.00 22.00 37.00
21.00 13.00 20.00 10.00 20.00 16.00 28.00
24.00 21.00 27.00 16.00 24.00 14.00 25.00
20.00 20.00 13.00 12.00 12.00 7.00 9.00
10.00 7.00 12.00 6.00 4.00 5.00 13.00
6.00 2.00 5.00 .00 2.00 2.00 8.00
3.00 3.00 6.00 3.00 6.00 2.00 5.00
11.00 9.00 10.00 10.00 8.00 4.00 6.00
2.00 2.00 4.00 5.00 7.00 3.00 4.00
.00 .00 .00 .00 .00 .00 .00
3.00 3.00 2.00 1.00 3.00 1.00 5.00
10.00 14.00 23.00 9.00 17.00 17.00 39.00
5.00 4.00 6.00 5.00 6.00 4.00 6.00
4.00 4.00 3.00 5.00 7.00 4.00 10.00
80.00 57.00 62.00 43.00 55.00 26.00 45.00
.00 1.00 3.00 1.00 1.00 1.00 1.00
1.00 .00 2.00 .00 .00 2.00 2.00
.00 .00 .00 .00 .00 .00 1.00
.00 3.00 5.00 2.00 1.00 1.00 4.00
9.00 13.00 25.00 9.00 18.00 18.00 34.00
18.00 17.00 11.00 4.00 5.00 5.00 3.00
47.00 35.00 37.00 25.00 41.00 18.00 35.00
26.00 12.00 21.00 23.00 21.00 12.00 26.00
65.00 58.00 86.00 57.00 77.00 49.00 100.00
3.00 3.00 1.00 1.00 2.00 4.00 .00
32.00 19.00 12.00 5.00 7.00 1.00 3.00
1.00 3.00 6.00 3.00 8.00 8.00 15.00
12.00 8.00 14.00 15.00 15.00 5.00 22.00
11.00 6.00 12.00 5.00 8.00 6.00 15.00
26.00 23.00 22.00 16.00 21.00 13.00 12.00
.00 .00 .00 .00 .00 .00 .00
1.00 .00 1.00 1.00 2.00 .00 3.00
9.00 3.00 14.00 7.00 6.00 6.00 11.00
15.00 9.00 10.00 5.00 9.00 12.00 16.00
25.00 28.00 20.00 11.00 17.00 4.00 9.00
Male
Female
Gender
<24
25 - 34 years
35 - 44 years
45 - 54 years
55 +
Participant Age
Married or living with partner
Separated, not living with
partner
Widowed, not living with
partner
Not married, no partner with
parents
Not married, not with partner,
alone
Status
Yes
No
Caring Responsibilities
at Home
Less than O- Level equivalent
O-Level
A-Level
Vocational Certification (City &
Guilds or equivalent)
University Diploma or
equivalent -Local
University Diploma or
equivalent -Overseas
Institution
University Degree-
Baccalaureate
University Degree- Masters'
Level
University Doctoral
Others
What is your highest
qualification?
Government
Organisation/Department
Parastatal Company
Publicly Listed Company
Private Company/Sole Trader
Commercial Partnership
Non-profit Organisation
Describe the company
where you are
employed
Agriculture & Fishery
Stone Quarrying &
Construction
Governmental Services
Hotel & Catering
Services
Manufacturing
Sector of Activity
Full time
Ful time (reduced hours)
Part time
What is your present
main job?
Senior Managers, Directors
Professionals
Associate Professionals &
Technical
Clerical employees
Skilled agriculture & fishery
workers
Crafts & related trades
Plant & machine operator,
assembly workers
Elementary occupations
Shop & Market services
Your level of
responsibility
N
< 1 yr
N
1 to 2 yrs
N
2 to 4 yrs
N
4 to 6 yrs
N
6 to 10
yrs
N
10 to 15
yrs
N
15 + yrs
How long have you been with this company? (months)

Gender Pay Review
National Commission for the Promotion of Equality
Malta September 2006 page 155 of 327
Table 52 – Analysis of Mean Stay (Years) of Employees with Respective Employer Across Respondent Groups
9.89
5.65
2.07
6.34
11.24
14.82
19.32
12.20
8.17
25.00
3.61
6.95
11.30
6.23
11.14
12.20
9.57
2.00
7.18
9.17
9.67
8.45
4.27
10.47
9.69
8.33
5.87
8.47
11.10
8.25
5.83
8.00
.
10.24
11.11
8.51
10.28
6.84
8.18
10.07
22.00
9.66
10.54
4.16
7.47
8.71
8.97
6.04
3.46
6.93
8.36
4.82
4.13
9.20
13.08
9.52
10.04
6.21
.
15.05
8.61
9.22
4.99
Male
Female
Gender
<24
25 - 34 years
35 - 44 years
45 - 54 years
55 +
Participant Age
Married or living with partner
Separated, not living with partner
Widowed, not living with partner
Not married, no partner with parents
Not married, not with partner, alone
Status
Yes
No
Caring Responsibilities
at Home
1
2
3
4
Variety of Caring
Responsibilities At
Home
<1hr
1 - 3 hrs
4 - 5 hrs
6 - 7 hrs
8 - 9 hrs
>9 hrs
How much time do you
spend in domestic
work?
Less than O- Level equivalent
O-Level
A-Level
Vocational Certification (City & Guilds or equivalent)
University Diploma or equivalent -Local
University Diploma or equivalent -Overseas Institution
University Degree- Baccalaureate
University Degree- Masters' Level
University Doctoral
Others
What is your highest
qualification?
Government Organisation/Department
Parastatal Company
Publicly Listed Company
Private Company/Sole Trader
Commercial Partnership
Non-profit Organisation
Describe the company
where you are
employed
Agriculture & Fishery
Stone Quarrying & Construction
Governmental Services
Hotel & Catering
Services
Manufacturing
Sector of Activity
Full time
Ful time (reduced hours)
Part time
What is your present
main job?
More than One Job
One Job Only
Are you engaged in
more than one job?
Casual
Permanent-Fixed Term Contract
Permanent-Indefinite Contract
What is the basis of
your main job?
Senior Managers, Directors
Professionals
Associate Professionals & Technical
Clerical employees
Skilled agriculture & fishery workers
Crafts & related trades
Plant & machine operator, assembly workers
Elementary occupations
Shop & Market services
Your level of
responsibility
Mean
Stay with
Present
Employer
(Yrs)

Gender Pay Review
National Commission for the Promotion of Equality
Malta September 2006 page 156 of 327
5.2.2 Job Tenure
Table 53 summarises how 20.6% of the respondents were in their job for 1 year or less,
whereas 19.3% of the participants have been in the same role for a period ranging between 2
and 4 years. The same analysis shows that the median job tenure stood at 3 years. An
analysis of the job tenure is set out in Table 54 to Table 56 showing how persons with the more
common job tenures differed in terms of typical characteristics. Such is the case of persons
within the same job for one year or less, who were typically:
� men, or
� aged less than 24 years, or
� not married, not living with partner, or
� not having care responsibilities at home, or
� had an O level standard of education, or
� workers engaged with Private companies, or
� workers engaged in the services sector, or
� workers engaged on a full time basis, or.
� workers engaged in clerical work.
Contrastingly, persons occupying the same job for the past one or two years were typically:
� women, or
� younger than 24 years, or
� not married, not living with partner, or
� without care responsibilities at home, or
� had an O level standard of education, or
� workers engaged with Private companies, or
� workers engaged in the services sector, or
� workers engaged on a full time basis, or.
� workers engaged in shop or market services occupations.
–
This analysis (particularly that of mean job tenure set out in Table 56) shows that women
typically feature shorter job tenures across all work contexts, except where women are engaged

Gender Pay Review
National Commission for the Promotion of Equality
Malta September 2006 page 157 of 327
in senior management occupations or in jobs covered with a permanent fixed-term contract or
when women are engaged in part time jobs as their main occupation.
Table 53 – Summary of Job Tenure in Years by Research Participants
107 20.6%
92 17.7%
100 19.3%
56 10.8%
69 13.3%
39 7.5%
56 10.8%
519 100.0%
< 1 yr
1 to 2 yrs
2 to 4 yrs
4 to 6 yrs
6 to 10 yrs
10 to 15 yrs
15 + yrs
Total
How long
have you
been in
this
present
role?
(months)
Count Valid Percent
Statistic
5.9462 3.0000 7.25087 .08 44.33Present Job Tenure (Yrs)'
Mean Median Std. Deviation Minimum Maximum
Table 54 – Summary Analysis of Job Tenure Across Respondent Groups (based on Analysis set out in Table 56)
Longest Job Tenure Shortest Job Tenure
Gender Men Women
Participant Age (22) 55 years and older Younger than 24 years
Family Status Married and/or living with partner Single living with parents
Caring Responsibilities at Home Has responsibilities No responsibilities
Variety of Caring Responsibilities at home No Statistically Significant Differences between Groups
Time devoted to Domestic Work No Statistically Significant Differences between Groups
Highest Academic Qualifications Less than O-level qualification University Master’s Degree
Type of Employer Government organisation/department or
Commercial Partnership or
Non-profit Organisation
Publicly Listed Company
Sector of Activity Government Services Hotel & Catering
Present Job Type Full-time job Part-time job
Engaged in more than one job No Statistically Significant Differences between Groups
Basis of Main Job Permanent Indefinite Contract Permanent Fixed-term Contract
Occupation Type (ISCO 1988) Elementary Occupations Shop & Market Service Workers
22 Increases progressively with age
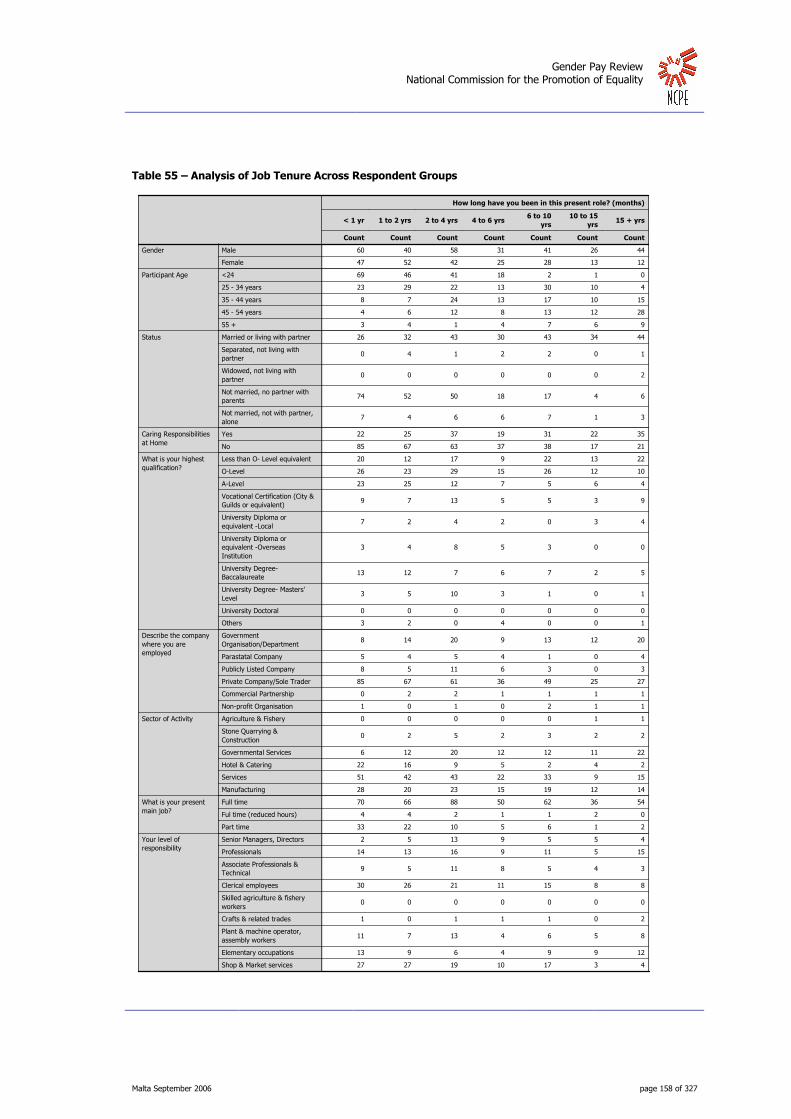
Gender Pay Review
National Commission for the Promotion of Equality
Malta September 2006 page 158 of 327
Table 55 – Analysis of Job Tenure Across Respondent Groups
60 40 58 31 41 26 44
47 52 42 25 28 13 12
69 46 41 18 2 1 0
23 29 22 13 30 10 4
8 7 24 13 17 10 15
4 6 12 8 13 12 28
3 4 1 4 7 6 9
26 32 43 30 43 34 44
0 4 1 2 2 0 1
0 0 0 0 0 0 2
74 52 50 18 17 4 6
7 4 6 6 7 1 3
22 25 37 19 31 22 35
85 67 63 37 38 17 21
20 12 17 9 22 13 22
26 23 29 15 26 12 10
23 25 12 7 5 6 4
9 7 13 5 5 3 9
7 2 4 2 0 3 4
3 4 8 5 3 0 0
13 12 7 6 7 2 5
3 5 10 3 1 0 1
0 0 0 0 0 0 0
3 2 0 4 0 0 1
8 14 20 9 13 12 20
5 4 5 4 1 0 4
8 5 11 6 3 0 3
85 67 61 36 49 25 27
0 2 2 1 1 1 1
1 0 1 0 2 1 1
0 0 0 0 0 1 1
0 2 5 2 3 2 2
6 12 20 12 12 11 22
22 16 9 5 2 4 2
51 42 43 22 33 9 15
28 20 23 15 19 12 14
70 66 88 50 62 36 54
4 4 2 1 1 2 0
33 22 10 5 6 1 2
2 5 13 9 5 5 4
14 13 16 9 11 5 15
9 5 11 8 5 4 3
30 26 21 11 15 8 8
0 0 0 0 0 0 0
1 0 1 1 1 0 2
11 7 13 4 6 5 8
13 9 6 4 9 9 12
27 27 19 10 17 3 4
Male
Female
Gender
<24
25 - 34 years
35 - 44 years
45 - 54 years
55 +
Participant Age
Married or living with partner
Separated, not living with
partner
Widowed, not living with
partner
Not married, no partner with
parents
Not married, not with partner,
alone
Status
Yes
No
Caring Responsibilities
at Home
Less than O- Level equivalent
O-Level
A-Level
Vocational Certification (City &
Guilds or equivalent)
University Diploma or
equivalent -Local
University Diploma or
equivalent -Overseas
Institution
University Degree-
Baccalaureate
University Degree- Masters'
Level
University Doctoral
Others
What is your highest
qualification?
Government
Organisation/Department
Parastatal Company
Publicly Listed Company
Private Company/Sole Trader
Commercial Partnership
Non-profit Organisation
Describe the company
where you are
employed
Agriculture & Fishery
Stone Quarrying &
Construction
Governmental Services
Hotel & Catering
Services
Manufacturing
Sector of Activity
Full time
Ful time (reduced hours)
Part time
What is your present
main job?
Senior Managers, Directors
Professionals
Associate Professionals &
Technical
Clerical employees
Skilled agriculture & fishery
workers
Crafts & related trades
Plant & machine operator,
assembly workers
Elementary occupations
Shop & Market services
Your level of
responsibility
Count
< 1 yr
Count
1 to 2 yrs
Count
2 to 4 yrs
Count
4 to 6 yrs
Count
6 to 10
yrs
Count
10 to 15
yrs
Count
15 + yrs
How long have you been in this present role? (months)

Gender Pay Review
National Commission for the Promotion of Equality
Malta September 2006 page 159 of 327
Table 56 – Analysis of Mean Job Tenure Across Respondent Groups and Across Respondent Gender
Male Female
Present Job
Tenure (Yrs)
Present Job Tenure
(Yrs)
Present Job Tenure
(Yrs)Mean Mean Mean
Male 7.02 7.02 .
Female 4.43 . 4.43
<24 1.88 2.02 1.75
25 - 34 years 4.70 4.80 4.57
35 - 44 years 7.95 8.61 6.78
45 - 54 years 11.17 11.90 9.10
55 + 12.13 12.82 9.48
Married or living with partner 8.51 9.78 6.07
Separated, not living with partner 7.52 10.14 3.33
Widowed, not living with partner 25.00 33.00 17.00
Not married, no partner with parents 2.86 2.96 2.74
Not married, not with partner, alone 5.79 5.81 5.77
Yes 8.07 9.23 6.04
No 4.66 5.48 3.58
1 8.08 9.30 6.29
2 8.41 9.54 4.92
3 5.37 5.37 .
4 2.00 . 2.00
<1hr 5.39 6.75 2.82
1 - 3 hrs 6.64 7.59 5.18
4 - 5 hrs 6.61 8.64 4.98
6 - 7 hrs 7.68 9.44 6.14
8 - 9 hrs 2.92 2.63 2.99
>9 hrs 7.89 8.60 7.58
Less than O- Level equivalent 8.63 9.35 6.94
O-Level 5.61 6.09 5.09
A-Level 3.63 4.17 3.22
Vocational Certification (City & Guilds or equivalent) 7.78 8.98 2.14
University Diploma or equivalent -Local 7.71 7.96 7.07
University Diploma or equivalent -Overseas Institution 3.57 3.75 3.30
University Degree- Baccalaureate 4.86 6.47 3.35
University Degree- Masters' Level 3.47 4.18 2.44
University Doctoral . . .
Others 4.59 5.55 2.68
Government Organisation/Department 8.00 9.05 6.10
Parastatal Company 5.72 7.49 2.59
Publicly Listed Company 4.76 5.73 3.34
Private Company/Sole Trader 5.32 6.18 4.15
Commercial Partnership 7.99 14.47 4.10
Non-profit Organisation 7.93 8.38 7.33
Agriculture & Fishery 16.83 16.83 .
Stone Quarrying & Construction 7.38 7.38 .
Governmental Services 8.11 9.28 6.19
Hotel & Catering 2.97 4.57 1.98
Services 5.21 6.07 3.94
Manufacturing 6.34 6.93 5.45
Full time 6.54 7.53 4.76
Ful time (reduced hours) 4.07 0.67 4.33
Part time 2.71 1.82 3.25
More than One Job 4.97 6.48 3.11
One Job Only 6.13 7.10 4.67
Casual 4.08 4.52 3.86
Permanent-Fixed Term Contract 3.36 2.99 3.72
Permanent-Indefinite Contract 6.59 7.59 4.74
Senior Managers, Directors 6.59 6.30 7.46
Professionals 7.09 8.91 4.52
Associate Professionals & Technical 4.94 5.38 4.00
Clerical employees 4.61 5.13 4.18
Skilled agriculture & fishery workers . . .
Crafts & related trades 13.31 13.31 .
Plant & machine operator, assembly workers 7.12 7.62 5.85
Elementary occupations 8.50 9.93 4.20
Shop & Market services 4.16 4.40 3.96
OverallGender
Gender
Participant Age
Status
Caring Responsibilities at Home
Variety of Caring Responsibilities At
Home
How much time do you spend in
domestic work?
What is your highest qualification?
Describe the company where you are
employed
Sector of Activity
What is your present main job?
Are you engaged in more than one
job?What is the basis of your main job?
Your level of responsibility

Gender Pay Review
National Commission for the Promotion of Equality
Malta September 2006 page 160 of 327
5.2.3 Career Break
A total of 52 research participants experienced a career break during their working life. Of
these, 15 were men (4.3% of men participating in the survey), while 37 were women (15.5%
of women participating in the research). Table 57 sets out an analysis of the incidence of
career groups across respondent groups, showing that women who typically availed of such a
career break featured:
� an age between 25 and 54 years;
� a present or past married/living with a partner status;
� caring responsibilities at home;
� spent between 1 and 7 hours daily in domestic work at home.
Contrastingly, men who availed of such career breaks featured:
� an age younger than 24 years, or
� a single’s life status.
Among the participants who availed themselves of a career break, 23.7% had such a break that
lasted for less than 1 year, whereas another 21.1% of respondents had a career break between
10 and 15 years. An analysis of the duration of such career breaks is set out in Table 58,
showing how the median duration stood at 5 years. An analysis of these durations across
respondent groups is set out in Table 60, showing how the longest and shortest career breaks
featured across respondent groups as summarised in Table 59. Almost across all respondent
groups, the longer breaks featured among women, suggesting that the duration of the career
break is influenced by personal or social factors rather than contractual, job or employer
characteristics.

Gender Pay Review
National Commission for the Promotion of Equality
Malta September 2006 page 161 of 327
Table 57 – Analysis of Incidence of Experienced Career Break Across Respondent Groups Across Gender
5 55.6% 4 44.4%
3 23.1% 10 76.9%
0 .0% 11 100.0%
4 26.7% 11 73.3%
0 .0% 5 100.0%
2 6.5% 29 93.5%
2 40.0% 3 60.0%
0 .0% 0 .0%
9 60.0% 6 40.0%
0 .0% 3 100.0%
1 3.7% 26 96.3%
12 44.4% 15 55.6%
1 4.0% 24 96.0%
0 .0% 2 100.0%
6 66.7% 3 33.3%
4 20.0% 16 80.0%
1 12.5% 7 87.5%
0 .0% 4 100.0%
1 50.0% 1 50.0%
0 .0% 8 100.0%
3 25.0% 9 75.0%
3 21.4% 11 78.6%
1 10.0% 9 90.0%
2 50.0% 2 50.0%
0 .0% 3 100.0%
1 50.0% 1 50.0%
2 40.0% 3 60.0%
0 .0% 0 .0%
0 .0% 0 .0%
1 25.0% 3 75.0%
2 15.4% 11 84.6%
1 25.0% 3 75.0%
0 .0% 1 100.0%
8 25.0% 24 75.0%
1 50.0% 1 50.0%
1 50.0% 1 50.0%
0 .0% 0 .0%
0 .0% 0 .0%
0 .0% 11 100.0%
1 25.0% 3 75.0%
9 28.1% 23 71.9%
3 42.9% 4 57.1%
9 26.5% 25 73.5%
1 14.3% 6 85.7%
3 23.1% 10 76.9%
2 28.6% 5 71.4%
11 23.4% 36 76.6%
1 8.3% 11 91.7%
3 33.3% 6 66.7%
9 27.3% 24 72.7%
1 33.3% 2 66.7%
1 16.7% 5 83.3%
3 37.5% 5 62.5%
3 20.0% 12 80.0%
0 .0% 0 .0%
0 .0% 0 .0%
1 100.0% 0 .0%
3 37.5% 5 62.5%
1 7.7% 12 92.3%
5 27.8% 13 72.2%
2 12.5% 14 87.5%
1 50.0% 1 50.0%
3 30.0% 7 70.0%
2 33.3% 4 66.7%
0 .0% 2 100.0%
<24
25 - 34 years
35 - 44 years
45 - 54 years
55 +
Participant Age
Married or living with partner
Separated, not living with partner
Widowed, not living with partner
Not married, no partner with parents
Not married, not with partner, alone
Status
Yes
No
Caring Responsibilities at
Home
1
2
Variety of Caring
Responsibilities At Home
<1hr
1 - 3 hrs
4 - 5 hrs
6 - 7 hrs
8 - 9 hrs
>9 hrs
How much time do you
spend in domestic work?
Less than O- Level equivalent
O-Level
A-Level
Vocational Certification (City & Guilds or equivalent)
University Diploma or equivalent -Local
University Diploma or equivalent -Overseas Institution
University Degree- Baccalaureate
University Degree- Masters' Level
University Doctoral
Others
What is your highest
qualification?
Government Organisation/Department
Parastatal Company
Publicly Listed Company
Private Company/Sole Trader
Commercial Partnership
Non-profit Organisation
Describe the company
where you are employed
Agriculture & Fishery
Stone Quarrying & Construction
Governmental Services
Hotel & Catering
Services
Manufacturing
Sector of Activity
Full time
Ful time (reduced hours)
Part time
What is your present
main job?
More than One Job
One Job Only
Are you engaged in
more than one job?
Casual
Permanent-Fixed Term Contract
Permanent-Indefinite Contract
What is the basis of your
main job?
Senior Managers, Directors
Professionals
Associate Professionals & Technical
Clerical employees
Skilled agriculture & fishery workers
Crafts & related trades
Plant & machine operator, assembly workers
Elementary occupations
Shop & Market services
Your level of
responsibility
Southern Harbour
Northern Harbour
South Eastern
Western
Northern
Gozo & Comino
Region
N N %
Male
N N %
Female
Gender
Yes
Did you ever avail yourself of a career break?

Gender Pay Review
National Commission for the Promotion of Equality
Malta September 2006 page 162 of 327
Table 58 – Summary of the Duration of Career Breaks
23.7%
10.5%
15.8%
5.3%
10.5%
21.1%
13.2%
100.0%
< 1 yr
1 to 2 yrs
2 to 4 yrs
4 to 6 yrs
6 to 10 yrs
10 to 15 yrs
15 + yrs
Total
How long
did your
career
break
take?
(months)
Valid Percent
23.68 %
10.53 %
15.79 %
5.26 %
10.53 %
21.05 %
13.16 %
0 10 20
< 1 yr
1 to 2 yrs
2 to 4 yrs
4 to 6 yrs
6 to 10 yrs
10 to 15 yrs
15 + yrs
% of Participants who availed a career break
Table 59 – Summary of the Observed Longest and Shortest Career Breaks Across Respondent Groups
Longest Average Career Break Shortest Average Career Break
Gender Women Men
Participant Age 35 to 44 years Younger than 24 years
Family Status Married and/or living with partner Single living with parents
Caring Responsibilities at Home Has responsibilities No responsibilities
Variety of Caring Responsibilities at home Variety = 2 types of responsibilities Variety = 1 type of responsibility
Time devoted to Domestic Work No Statistically Significant Differences between Groups
Highest Academic Qualifications No Statistically Significant Differences between Groups
Type of Employer No Statistically Significant Differences between Groups
Sector of Activity No Statistically Significant Differences between Groups
Present Job Type No Statistically Significant Differences between Groups
Engaged in more than one job No Statistically Significant Differences between Groups
Basis of Main Job No Statistically Significant Differences between Groups
Occupation Type (ISCO 1988) No Statistically Significant Differences between Groups

Gender Pay Review
National Commission for the Promotion of Equality
Malta September 2006 page 163 of 327
Table 60 – Analysis of Career Break Durations Across Respondent Groups
6 1 0 0 1 0 0
3 3 6 2 3 8 5
3 0 1 0 0 0 0
3 1 2 1 0 0 0
0 0 3 1 1 5 1
2 3 0 0 3 1 2
0 0 0 0 0 2 2
2 2 5 1 4 8 5
0 2 0 0 0 0 0
0 0 0 0 0 0 0
7 0 1 0 0 0 0
0 0 0 1 0 0 0
1 2 5 2 4 6 3
8 2 1 0 0 2 2
0 1 0 2 1 4 0
3 2 0 0 2 2 2
3 0 3 0 0 1 1
0 1 0 0 0 1 0
1 0 0 0 0 0 1
0 0 0 0 0 0 0
2 0 1 0 0 0 0
0 0 0 0 0 0 0
0 0 0 0 0 0 0
0 0 2 0 1 0 1
2 0 2 0 2 3 2
2 0 0 0 0 0 0
0 0 0 0 1 0 0
4 2 4 2 1 5 3
0 1 0 0 0 0 0
1 1 0 0 0 0 0
0 0 0 0 0 0 0
0 0 0 0 0 0 0
0 0 2 0 1 3 2
1 0 1 0 0 0 1
6 3 3 1 3 4 1
2 1 0 1 0 1 1
7 2 2 1 2 4 3
0 0 2 0 1 3 0
2 2 2 1 1 1 2
1 0 0 0 0 1 0
1 0 2 0 0 1 2
1 1 1 0 1 1 0
4 1 3 0 2 0 0
0 0 0 0 0 0 0
0 0 0 0 0 0 0
0 0 0 0 0 0 0
1 1 0 0 0 1 1
1 1 0 2 1 4 2
Male
Female
Gender
<24
25 - 34 years
35 - 44 years
45 - 54 years
55 +
Participant Age
Married or living with partner
Separated, not living with
partner
Widowed, not living with
partner
Not married, no partner with
parents
Not married, not with partner,
alone
Status
Yes
No
Caring Responsibilities
at Home
Less than O- Level equivalent
O-Level
A-Level
Vocational Certification (City &
Guilds or equivalent)
University Diploma or
equivalent -Local
University Diploma or
equivalent -Overseas
Institution
University Degree-
Baccalaureate
University Degree- Masters'
Level
University Doctoral
Others
What is your highest
qualification?
Government
Organisation/Department
Parastatal Company
Publicly Listed Company
Private Company/Sole Trader
Commercial Partnership
Non-profit Organisation
Describe the company
where you are
employed
Agriculture & Fishery
Stone Quarrying &
Construction
Governmental Services
Hotel & Catering
Services
Manufacturing
Sector of Activity
Full time
Ful time (reduced hours)
Part time
What is your present
main job?
Senior Managers, Directors
Professionals
Associate Professionals &
Technical
Clerical employees
Skilled agriculture & fishery
workers
Crafts & related trades
Plant & machine operator,
assembly workers
Elementary occupations
Shop & Market services
Your level of
responsibility
Count
< 1 yr
Count
1 to 2 yrs
Count
2 to 4 yrs
Count
4 to 6 yrs
Count
6 to 10
yrs
Count
10 to 15
yrs
Count
15 + yrs
How long did your career break take? (months)

Gender Pay Review
National Commission for the Promotion of Equality
Malta September 2006 page 164 of 327
Table 61 – Analysis of Mean Career Break Duration Across Respondent Group and Respondent Gender
Male Female
Career Break
(Yrs)
Career Break (Yrs) Career Break (Yrs)
Mean Mean Mean
Male 1.31 1.31 .
Female 7.58 . 7.58
<24 0.92 0.21 1.63
25 - 34 years 1.93 0.50 2.50
35 - 44 years 8.57 . 8.57
45 - 54 years 6.50 3.00 7.81
55 + 13.75 . 13.75
Married or living with partner 8.39 3.75 8.76
Separated, not living with partner 1.25 1.50 1.00
Widowed, not living with partner . . .
Not married, no partner with parents 0.63 0.30 1.17
Not married, not with partner, alone 4.00 . 4.00
Yes 7.39 7.00 7.41
No 4.53 0.50 8.06
1 6.82 7.00 6.81
2 20.00 . 20.00
3 . . .
4 . . .
<1hr 0.87 0.36 1.63
1 - 3 hrs 8.65 0.75 10.63
4 - 5 hrs 6.04 7.00 5.85
6 - 7 hrs 8.53 . 8.53
8 - 9 hrs 0.58 0.17 1.00
>9 hrs 5.85 . 5.85
Less than O- Level equivalent 6.78 . 6.78
O-Level 7.02 0.39 9.50
A-Level 5.35 0.08 6.11
Vocational Certification (City & Guilds or equivalent) 7.75 1.50 14.00
University Diploma or equivalent -Local 7.63 . 7.63
University Diploma or equivalent -Overseas Institution . . .
University Degree- Baccalaureate 1.47 0.38 3.67
University Degree- Masters' Level . . .
University Doctoral . . .
Others 7.15 7.00 7.19
Government Organisation/Department 7.66 3.75 8.53
Parastatal Company 0.21 0.17 0.25
Publicly Listed Company 6.00 . 6.00
Private Company/Sole Trader 6.91 0.65 8.38
Commercial Partnership 1.00 . 1.00
Non-profit Organisation 0.63 0.25 1.00
Agriculture & Fishery . . .
Stone Quarrying & Construction . . .
Governmental Services 9.53 . 9.53
Hotel & Catering 6.39 0.17 9.50
Services 5.10 1.95 6.08
Manufacturing 5.93 0.29 8.75
Full time 5.69 1.67 6.94
Ful time (reduced hours) 7.78 . 7.78
Part time 6.54 0.72 8.72
More than One Job 2.63 0.50 3.33
One Job Only 6.69 1.43 8.06
Casual 9.64 . 9.64
Permanent-Fixed Term Contract 2.94 0.38 5.50
Permanent-Indefinite Contract 5.58 1.63 6.83
Senior Managers, Directors 5.25 0.50 10.00
Professionals 8.68 0.50 10.32
Associate Professionals & Technical 4.15 2.92 6.00
Clerical employees 2.64 0.13 3.27
Skilled agriculture & fishery workers . . .
Crafts & related trades . . .
Plant & machine operator, assembly workers . . .
Elementary occupations 6.88 0.50 9.00
Shop & Market services 9.16 . 9.16
What is your present main job?
Are you engaged in more than one
job?What is the basis of your main job?
Your level of responsibility
How much time do you spend in
domestic work?
What is your highest qualification?
Describe the company where you are
employed
Sector of Activity
Participant Age
Status
Caring Responsibilities at Home
Variety of Caring Responsibilities At
Home
OverallGender
Gender

Gender Pay Review
National Commission for the Promotion of Equality
Malta September 2006 page 165 of 327
5.2.4 Alternatives to Career Break
In availing themselves of a career, research participants were often offered family friendly
measures intended as an alternative to such career break. A total of 38 participants quoted
such offers, with the most often offers pertaining to part time work (60.9% of offers) and
flexitime (34.8% of cases). Table 63 sets out an analysis of these offers across respondent
groups, showing how family friendly arrangements offered to men were mostly limited to
flexitime, part-time work, while family friendly arrangements offered to women varied from
parental leave to part-time work, flexitime, short notice leave, emergency child care leave and
annualised hours. The wider range of family friendly arrangements offered pertained to
respondents who featured:
� an age between 25 and 54 years, or
� a married status or living with a partner, or
� caring responsibilities at home, or
� a total time devoted to domestic work between 1 and 5 hours daily, or
� O-level academic attainment, or
� an employment with a governmental organisation/department, or
� an engagement with an establishment operating within Governmental services sector, or
� a job on a full-time basis, or
� a clerical occupation.
Table 62 – Summary of Family Friendly Arrangements Offered by Employers as an Alternative to a Career Break
8 21.1% 34.8%
2 5.3% 8.7%
14 36.8% 60.9%
1 2.6% 4.3%
1 2.6% 4.3%
6 15.8% 26.1%
3 7.9% 13.0%
1 2.6% 4.3%
2 5.3% 8.7%
38 100.0% 165.2%
Flexitime
Annualised Hours
Part time work
Telework
Job Sharing
Parental leave
Short notice leave
Careerbreak with
committed return
Emergency child care
leave
$Careerbreakalternatives a
Total
N Percent
Responses Percent of
Cases
a.

Gender Pay Review
National Commission for the Promotion of Equality
Malta September 2006 page 166 of 327
Table 63 – Analysis of Alternatives to a Career Break Offered to different Research Participant Groups
2 3 1 1
6 2 11 6 3 1 2
2 2 1
1 2 1 3 1
3 7 2 1 1
2 2 3 1 1 1
1
5 2 11 4 3 1 2
3 3 1 1 1
1
4 2 10 5 1 1 2
4 4 1 1 1 2
4 2 9 5 1 1 2
1
2 2 1
2 1 4 1 1 1 1
1 1 2 3 1 1
1 1
1
3 4 2 1
2 4 2
3 2 6 1 1 3 1
1 3 2
1 1
1
1 1 1 1
3 1 2 2 1 1 1
1 1
1
4 10 1 3 2 1
1
1 1
2 1 2 2 1 1 1
1
5 1 9 1 1 3 1
1 2 1 2
5 1 3 1 1 1 1 1
1 1 2 3 1 1 1
2 9 2 1
1 2
8 1 12 1 1 6 3 1 2
2 6 2 1
3 1 2 1 1 1 1 1
3 1 6 3 1 1 1
1 1 1 1
1
1 1
4 1 4 3 1 1 1
1 3
1 1 5 2 2 1
Male
Female
Gender
<24
25 - 34 years
35 - 44 years
45 - 54 years
55 +
Participant Age
Married or living with partner
Separated, not living with partner
Not married, no partner with parents
Not married, not with partner, alone
Status
Yes
No
Caring Responsibilities at
Home
1
2
Variety of Caring
Responsibilities At Home
<1hr
1 - 3 hrs
4 - 5 hrs
6 - 7 hrs
8 - 9 hrs
>9 hrs
How much time do you
spend in domestic work?
Less than O- Level equivalent
O-Level
A-Level
Vocational Certification (City & Guilds or equivalent)
University Diploma or equivalent -Local
University Degree- Baccalaureate
Others
What is your highest
qualification?
Government Organisation/Department
Parastatal Company
Publicly Listed Company
Private Company/Sole Trader
Commercial Partnership
Non-profit Organisation
Describe the company
where you are employed
Governmental Services
Hotel & Catering
Services
Manufacturing
Sector of Activity
Full time
Ful time (reduced hours)
Part time
What is your present
main job?
More than One Job
One Job Only
Are you engaged in
more than one job?
Casual
Permanent-Fixed Term Contract
Permanent-Indefinite Contract
What is the basis of your
main job?
Senior Managers, Directors
Professionals
Associate Professionals & Technical
Clerical employees
Elementary occupations
Shop & Market services
Your level of
responsibility
FlexitimeAnnualised
Hours
Childcare
facilities
After-school
child care
facility
Childcare
allowance
Part time
workTelework Job Sharing Parental leave
Short notice
leave
Careerbreak
with
committed
return
Emergency
child care
leave
Professional
guidance
Career Break Alternative

Gender Pay Review
National Commission for the Promotion of Equality
Malta September 2006 page 167 of 327
Table 63 – Analysis of Alternatives to a Career Break Offered to different Research Participant Groups (continued)
50.0 75.0 25.0 25.0
31.6 10.5 57.9 31.6 15.8 5.3 10.5
50.0 50.0 25.0
20.0 40.0 20.0 60.0 20.0
37.5 87.5 25.0 12.5 12.5
40.0 40.0 60.0 20.0 20.0 20.0
100.0
31.3 12.5 68.8 25.0 18.8 6.3 12.5
50.0 50.0 16.7 16.7 16.7
100.0
26.7 13.3 66.7 33.3 6.7 6.7 13.3
50.0 50.0 12.5 12.5 12.5 25.0
28.6 14.3 64.3 35.7 7.1 7.1 14.3
100.0
66.7 66.7 33.3
28.6 14.3 57.1 14.3 14.3 14.3 14.3
25.0 25.0 50.0 75.0 25.0 25.0
50.0 50.0
100.0
50.0 66.7 33.3 16.7
33.3 66.7 33.3
37.5 25.0 75.0 12.5 12.5 37.5 12.5
20.0 60.0 40.0
100.0 100.0
100.0
50.0 50.0 50.0 50.0
75.0 25.0 50.0 50.0 25.0 25.0 25.0
50.0 50.0
100.0
28.6 71.4 7.1 21.4 14.3 7.1
100.0
100.0 100.0
66.7 33.3 66.7 66.7 33.3 33.3 33.3
100.0
33.3 6.7 60.0 6.7 6.7 20.0 6.7
25.0 50.0 25.0 50.0
55.6 11.1 33.3 11.1 11.1 11.1 11.1 11.1
25.0 25.0 50.0 75.0 25.0 25.0 25.0
20.0 90.0 20.0 10.0
33.3 66.7
40.0 5.0 60.0 5.0 5.0 30.0 15.0 5.0 10.0
25.0 75.0 25.0 12.5
100.0 33.3 66.7 33.3 33.3 33.3 33.3 33.3
25.0 8.3 50.0 25.0 8.3 8.3 8.3
50.0 50.0 50.0 50.0
100.0
100.0 100.0
57.1 14.3 57.1 42.9 14.3 14.3 14.3
33.3 100.0
11.1 11.1 55.6 22.2 22.2 11.1
R %Male
R %Female
Gender
R %<24
R %25 - 34 years
R %35 - 44 years
R %45 - 54 years
R %55 +
Participant Age
R %Married or living with partner
R %Separated, not living with partner
R %Not married, no partner with parents
R %Not married, not with partner, alone
Status
R %Yes
R %No
Caring Responsibilities at
Home
R %1
R %2
Variety of Caring
Responsibilities At Home
R %<1hr
R %1 - 3 hrs
R %4 - 5 hrs
R %6 - 7 hrs
R %8 - 9 hrs
R %>9 hrs
How much time do you
spend in domestic work?
R %Less than O- Level equivalent
R %O-Level
R %A-Level
R %Vocational Certification (City & Guilds or equivalent)
R %University Diploma or equivalent -Local
R %University Degree- Baccalaureate
R %Others
What is your highest
qualification?
R %Government Organisation/Department
R %Parastatal Company
R %Publicly Listed Company
R %Private Company/Sole Trader
R %Commercial Partnership
R %Non-profit Organisation
Describe the company
where you are employed
R %Governmental Services
R %Hotel & Catering
R %Services
R %Manufacturing
Sector of Activity
R %Full time
R %Ful time (reduced hours)
R %Part time
What is your present
main job?
R %More than One Job
R %One Job Only
Are you engaged in
more than one job?
R %Casual
R %Permanent-Fixed Term Contract
R %Permanent-Indefinite Contract
What is the basis of your
main job?
R %Senior Managers, Directors
R %Professionals
R %Associate Professionals & Technical
R %Clerical employees
R %Elementary occupations
R %Shop & Market services
Your level of
responsibility
FlexitimeAnnualised
Hours
Childcare
facilities
After-school
child care
facility
Childcare
allowance
Part time
workTelework Job Sharing Parental leave
Short notice
leave
Careerbreak
with
committed
return
Emergency
child care
leave
Professional
guidance
Career Break Alternative

Gender Pay Review
National Commission for the Promotion of Equality
Malta September 2006 page 168 of 327
5.2.5 Reasons for a Career Break
Table 64 summarises the responses observed relating to the reasons quoted by research
participants in respect to their career break. Childcare/childbirth topped the reasons (55.9%
of the persons availing of a career break) while dismissal from their job ranked as the second
most common reason (17.6% of persons availing of a career break). An analysis of these
reasons across respondent groups is set out in Table 65, showing how a career break for
childcare/child birth reasons prevailed among:
� women, or
� participants aged between 35 and 44 years, or
� participants who were married or living with partner, or
� participants who had caring responsibilities at home, or
� participants engaged with Government, or
� participants engaged in full time job, or
� workers engaged through a permanent work contract.
Table 64 – Summary of Reasons for a Career Break
19 47.5% 55.9%
6 15.0% 17.6%
1 2.5% 2.9%
2 5.0% 5.9%
3 7.5% 8.8%
9 22.5% 26.5%
40 100.0% 117.6%
Childbirth & childcare
Dismissed from previous
employment
Family - adults (disabled or
elderly)
Holiday /break
Study
Others
$careerbreakreason a
Total
N Percent
Responses Percent of
Cases
Dichotomy group tabulated at value 1.a.

Gender Pay Review
National Commission for the Promotion of Equality
Malta September 2006 page 169 of 327
Table 65 – Analysis of the Reasons for Career Break Across Research Participant Groups
0 2 0 1 1 6
19 4 1 1 2 3
0 1 0 1 3 1
3 2 0 0 0 3
7 1 1 0 0 2
6 2 0 1 0 2
3 0 0 0 0 0
18 4 1 0 0 5
0 1 0 1 0 0
0 0 0 0 0 0
0 1 0 1 3 4
1 0 0 0 0 0
17 4 1 0 1 3
2 2 0 2 2 6
16 4 1 0 1 3
1 0 0 0 0 0
0 0 0 0 1 4
10 1 0 1 1 2
2 1 0 0 0 1
1 1 1 0 0 1
0 1 0 1 1 0
6 2 0 0 0 1
5 2 1 0 0 1
4 2 0 1 1 2
4 0 0 0 1 2
1 1 0 0 0 0
1 0 0 0 1 0
0 0 0 0 0 0
1 0 0 1 0 2
0 0 0 0 0 0
0 0 0 0 0 0
3 1 0 0 0 2
9 2 0 0 0 4
0 1 0 0 1 0
1 0 0 0 0 0
9 1 1 1 2 4
0 1 0 0 0 0
0 1 0 1 0 1
10 3 0 2 1 8
5 0 0 0 0 0
4 3 1 0 2 1
1 1 0 0 1 1
18 5 1 2 2 8
4 1 1 0 1 0
1 0 0 1 0 3
14 5 0 1 2 6
0 0 0 0 0 1
4 1 0 0 1 2
2 1 0 1 0 2
5 1 0 1 2 2
0 0 0 0 0 0
0 0 0 0 0 0
0 0 0 0 0 0
2 2 0 0 0 2
6 1 1 0 0 0
Male
Female
Gender
<24
25 - 34 years
35 - 44 years
45 - 54 years
55 +
Participant Age
Married or living with partner
Separated, not living with
partner
Widowed, not living with
partner
Not married, no partner with
parents
Not married, not with partner,
alone
Status
Yes
No
Caring Responsibilities at
Home
1
2
Variety of Caring
Responsibilities At Home
<1hr
1 - 3 hrs
4 - 5 hrs
6 - 7 hrs
8 - 9 hrs
>9 hrs
How much time do you
spend in domestic work?
Less than O- Level equivalent
O-Level
A-Level
Vocational Certification (City &
Guilds or equivalent)
University Diploma or
equivalent -Local
University Diploma or
equivalent -Overseas
Institution
University Degree-
Baccalaureate
University Degree- Masters'
Level
University Doctoral
Others
What is your highest
qualification?
Government
Organisation/Department
Parastatal Company
Publicly Listed Company
Private Company/Sole Trader
Commercial Partnership
Non-profit Organisation
Describe the company
where you are employed
Full time
Ful time (reduced hours)
Part time
What is your present
main job?
More than One Job
One Job Only
Are you engaged in
more than one job?
Casual
Permanent-Fixed Term
Contract
Permanent-Indefinite Contract
What is the basis of your
main job?
Senior Managers, Directors
Professionals
Associate Professionals &
Technical
Clerical employees
Skilled agriculture & fishery
workers
Crafts & related trades
Plant & machine operator,
assembly workers
Elementary occupations
Shop & Market services
Your level of
responsibility
Count
Yes
Childbirth
&
childcare
Count
Yes
Dismissed
from previous
employment
Count
Yes
Family -
adults
(disabled
or elderly)
Count
Yes
Holiday
/break
Count
Yes
Study
Count
Yes
Others

Gender Pay Review
National Commission for the Promotion of Equality
Malta September 2006 page 170 of 327
5.2.6 Seeking a New Job
A total of 77 research participants (13.1%) indicated that they were looking for a new job
(Table 66), with a prevailing reason pertaining to a need to obtain better working conditions
(53.2% of respondents seeking a new job). Other reasons claimed by research participants
included an increase in pay (6.4% of participants seeking a new job) or career advancement
(6.4% of participants seeking a new job).
Table 66 – Summary of Response: Participants Seeking to Change Job
77 13.1%
510 86.9%
587 100.0%
Yes
No
Total
Are you looking
for a new job?
Count Valid Percent
Yes
13.1%
No
86.9%
Table 67 – Summary of Analysis of Reasons for Seeking a New Job
5 6.5%
7 9.1%
5 6.5%
2 2.6%
41 53.2%
3 3.9%
13 16.9%
1 1.3%
Risk or certainty of loss or termination of job
Present job is a temporary one
To work for more hours in total in primary job
To work for less hours in total in primary job
Better work conditions
Additional job to increase hours of work
Other reasons
No answer/Don't know
Why
are you
looking
for a
new
job?
Count Column N %
Yes
Are you looking for a
new job?

Gender Pay Review
National Commission for the Promotion of Equality
Malta September 2006 page 171 of 327
5.4 Leave Entitlements
Table 68 sets out a summary of how 81.8% research participants claimed to be entitled to
some form of days off in their main job. A further analysis of such responses (Table 69)
shows that no significant differences are observable across the different respondent groups
except where the entitlement of days off featured a more common incidence among workers:
� employed in the services industry, or
� featuring a secondary level of education, or
� engaged in clerical occupations, or
� engaged in full-time jobs, or
� engaged through a permanent employment contract.
Table 68 – Days Off Entitlement in Main Job.
Count Valid Percent
Yes 480 81.8%
No 107 18.2%
Are you entitled to any day off in your main job?
Total 587 100.0%
Yes
81.8%
No
18.2%

Gender Pay Review
National Commission for the Promotion of Equality
Malta September 2006 page 172 of 327
Table 69 – Analysis of Entitlement of Days Off in the Main Job Across Respondent Groups
288 82.8% 60 17.2% 348 100.0%
192 80.3% 47 19.7% 239 100.0%
147 80.3% 36 19.7% 183 100.0%
129 82.2% 28 17.8% 157 100.0%
85 78.0% 24 22.0% 109 100.0%
83 86.5% 13 13.5% 96 100.0%
33 84.6% 6 15.4% 39 100.0%
238 83.8% 46 16.2% 284 100.0%
12 92.3% 1 7.7% 13 100.0%
2 100.0% 0 .0% 2 100.0%
199 79.6% 51 20.4% 250 100.0%
29 76.3% 9 23.7% 38 100.0%
188 83.6% 37 16.4% 225 100.0%
292 80.7% 70 19.3% 362 100.0%
1 50.0% 1 50.0% 2 100.0%
15 93.8% 1 6.3% 16 100.0%
101 80.2% 25 19.8% 126 100.0%
54 85.7% 9 14.3% 63 100.0%
188 78.7% 51 21.3% 239 100.0%
121 85.8% 20 14.2% 141 100.0%
24 88.9% 3 11.1% 27 100.0%
185 83.0% 38 17.0% 223 100.0%
28 90.3% 3 9.7% 31 100.0%
101 85.6% 17 14.4% 118 100.0%
31 66.0% 16 34.0% 47 100.0%
76 75.2% 25 24.8% 101 100.0%
34 87.2% 5 12.8% 39 100.0%
34 77.3% 10 22.7% 44 100.0%
62 67.4% 30 32.6% 92 100.0%
57 90.5% 6 9.5% 63 100.0%
111 83.5% 22 16.5% 133 100.0%
0 .0% 0 .0% 0 .0%
6 75.0% 2 25.0% 8 100.0%
52 91.2% 5 8.8% 57 100.0%
66 86.8% 10 13.2% 76 100.0%
92 80.7% 22 19.3% 114 100.0%
414 83.8% 80 16.2% 494 100.0%
12 85.7% 2 14.3% 14 100.0%
54 68.4% 25 31.6% 79 100.0%
55 69.6% 24 30.4% 79 100.0%
47 88.7% 6 11.3% 53 100.0%
378 83.1% 77 16.9% 455 100.0%
Male
Female
Gender
<24
25 - 34 years
35 - 44 years
45 - 54 years
55 +
Participant Age
Married or living with partner
Separated, not living with
partner
Widowed, not living with
partner
Not married, no partner with
parents
Not married, not with
partner, alone
Status
Yes
No
Caring Responsibilities
at Home
Agriculture & Fishery
Stone Quarrying &
Construction
Governmental Services
Hotel & Catering
Services
Manufacturing
Sector of Activity
Primary School or less
Secondary Schooling
Secondary (Vocational)
Post Secondary
Post Secondary (Vocational)
Diploma (University) & First
Degree
Post Graduate
What is your highest
level of education?
Senior Managers, Directors
Professionals
Associate Professionals &
Technical
Clerical employees
Skilled agriculture & fishery
workers
Crafts & related trades
Plant & machine operator,
assembly workers
Elementary occupations
Shop & Market services
Your level of
responsibility
Full time
Ful time (reduced hours)
Part time
What is your present
main job?
Casual
Permanent-Fixed Term
Contract
Permanent-Indefinite
Contract
What is the basis of
your main job?
N N %
Yes
N N %
No
N N %
Total
Are you entitled to any day off in your main job?

Gender Pay Review
National Commission for the Promotion of Equality
Malta September 2006 page 173 of 327
A total of 424 research participants also indicated the types of days off available as part of
their work conditions (Table 70), showing how 92.9% of these participants were entitled to
vacation leave, while another 86.8% of these participants were entitled to sickness leave. An
analysis of these responses across the difference respondent groups (Table 71) showed that:
� Vacation Leave was a more common entitlement among participants who:
– were men, or
– were between 25 and 34 years, or
– did not have care responsibilities at home, or
– were engaged with establishments in the services sector, or
– had attained an O level of education, or
– were engaged in clerical occupations, or
– were engaged in full time jobs, or
– were employed through permanent job contracts.
� Sickness Leave was a more common entitlement among:
– men, or
– participants aged between 25 and 34 years, or
– participants without care responsibilities at home, or
– workers engaged with establishments operating in the services sector, or
– workers engaged with private companies, or
– workers employed in clerical occupations, or
– workers engaged in full time jobs, or
– workers engaged through permanent contracts of work.
� Maternity/Paternity Leave was a more common entitlement among:
– women, or
– participants aged between 25 and 34 years, or
– participants with care responsibilities at home, or
– workers engaged with establishments within the services sector, or

Gender Pay Review
National Commission for the Promotion of Equality
Malta September 2006 page 174 of 327
– workers engaged with private companies, or
– participants employed in clerical occupations, or
– workers engaged in full time jobs, or
– workers engaged through permanent contracts of work.
Table 70 – Breakdown of Leave Entitlement (23)
394 40.0% 92.9%
368 37.3% 86.8%
78 7.9% 18.4%
115 11.7% 27.1%
31 3.1% 7.3%
986 100.0% 232.5%
Vacation leave
Sickness leave
Study/Training leave
Maternity/ Paternity
leave
Other leave
$leave a
Total
N Percent
Responses Percent of
Cases
Dichotomy group tabulated at value 1.a.
92.9 %
86.8 %
18.4 %
27.1 %
7.3 %
0 25 50 75 100
Vacation leave
Sickness leave
Study/Training leave
Maternity/ Paternity leave
Other leave
% of Participants who replied about leave entitlements (n = 424)
23 As indicated by responding participants. n = 424

Gender Pay Review
National Commission for the Promotion of Equality
Malta September 2006 page 175 of 327
Table 71 – Analysis of Leave Availability Across Respondent Groups
250 228 49 45 14
144 140 29 70 17
94 96 20 29 11
113 103 28 45 8
78 72 14 20 4
75 65 11 16 7
31 31 4 5 1
217 206 42 66 16
12 8 2 3 1
1 2
141 130 26 38 12
23 22 8 8 2
169 163 35 61 12
225 205 43 54 19
127 121 25 44 9
37 36 8 15 3
5 5 2 1
1 1
136 127 19 35 9
137 131 27 41 9
42 38 8 14 2
19 19 6 11 4
8 7 3 3
16 14 4 4 3
92 88 3 17 4
93 86 13 24 8
57 55 14 20 4
36 34 11 12 4
18 17 4 3
25 24 12 8 6
35 27 7 13 1
22 21 11 14 3
16 16 3 4 1
94 89 14 22 8
29 25 11 7 3
30 28 16 18 6
234 220 34 65 13
3 3 1 1
4 3 2 2 1
1 1
15 15 2 2
94 86 15 19 6
33 33 5 11 5
156 144 42 54 13
95 90 14 29 6
369 342 72 104 27
8 8 1 6
17 18 5 5 4
52 48 19 22 7
342 320 59 93 24
29 29 3 10 5
41 39 6 16 5
324 300 69 89 21
32 27 6 10 1
52 54 19 22 7
54 47 10 16 2
98 88 29 32 8
5 4
38 41 4 9 4
59 53 2 8 4
56 54 8 18 5
Male
Female
Gender
<24
25 - 34 years
35 - 44 years
45 - 54 years
55 +
Participant Age
Married or living with partner
Separated, not living with partner
Widowed, not living with partner
Not married, no partner with parents
Not married, not with partner, alone
Status
Yes
No
Caring Responsibilities
at Home
1
2
3
4
Variety of Caring
Responsibilities At
Home
<1hr
1 - 3 hrs
4 - 5 hrs
6 - 7 hrs
8 - 9 hrs
>9 hrs
How much time do you
spend in domestic
work?
Less than O- Level equivalent
O-Level
A-Level
Vocational Certification (City & Guilds or equivalent)
University Diploma or equivalent -Local
University Diploma or equivalent -Overseas Institution
University Degree- Baccalaureate
University Degree- Masters' Level
Others
What is your highest
qualification?
Government Organisation/Department
Parastatal Company
Publicly Listed Company
Private Company/Sole Trader
Commercial Partnership
Non-profit Organisation
Describe the company
where you are
employed
Agriculture & Fishery
Stone Quarrying & Construction
Governmental Services
Hotel & Catering
Services
Manufacturing
Sector of Activity
Full time
Ful time (reduced hours)
Part time
What is your present
main job?
More than One Job
One Job Only
Are you engaged in
more than one job?
Casual
Permanent-Fixed Term Contract
Permanent-Indefinite Contract
What is the basis of
your main job?
Senior Managers, Directors
Professionals
Associate Professionals & Technical
Clerical employees
Crafts & related trades
Plant & machine operator, assembly workers
Elementary occupations
Shop & Market services
Your level of
responsibility
Vacation leave Sickness leaveStudy/
Training leave
Maternity/
Paternity
leave
Other leave
Days Off Available

Gender Pay Review
National Commission for the Promotion of Equality
Malta September 2006 page 176 of 327
Table 71 – Analysis of Leave Availability Across Respondent Groups (continued)
95.8 87.4 18.8 17.2 5.4
88.3 85.9 17.8 42.9 10.4
84.7 86.5 18.0 26.1 9.9
96.6 88.0 23.9 38.5 6.8
96.3 88.9 17.3 24.7 4.9
94.9 82.3 13.9 20.3 8.9
93.9 93.9 12.1 15.2 3.0
94.8 90.0 18.3 28.8 7.0
100.0 66.7 16.7 25.0 8.3
50.0 100.0
90.4 83.3 16.7 24.4 7.7
92.0 88.0 32.0 32.0 8.0
92.3 89.1 19.1 33.3 6.6
93.4 85.1 17.8 22.4 7.9
91.4 87.1 18.0 31.7 6.5
97.4 94.7 21.1 39.5 7.9
100.0 100.0 40.0 20.0
100.0 100.0
91.9 85.8 12.8 23.6 6.1
93.8 89.7 18.5 28.1 6.2
91.3 82.6 17.4 30.4 4.3
90.5 90.5 28.6 52.4 19.0
88.9 77.8 33.3 33.3
88.9 77.8 22.2 22.2 16.7
92.0 88.0 3.0 17.0 4.0
92.1 85.1 12.9 23.8 7.9
90.5 87.3 22.2 31.7 6.3
94.7 89.5 28.9 31.6 10.5
94.7 89.5 21.1 15.8
96.2 92.3 46.2 30.8 23.1
92.1 71.1 18.4 34.2 2.6
100.0 95.5 50.0 63.6 13.6
94.1 94.1 17.6 23.5 5.9
91.3 86.4 13.6 21.4 7.8
96.7 83.3 36.7 23.3 10.0
96.8 90.3 51.6 58.1 19.4
92.5 87.0 13.4 25.7 5.1
100.0 100.0 33.3 33.3
100.0 75.0 50.0 50.0 25.0
100.0 100.0
100.0 100.0 13.3 13.3
94.0 86.0 15.0 19.0 6.0
86.8 86.8 13.2 28.9 13.2
92.9 85.7 25.0 32.1 7.7
93.1 88.2 13.7 28.4 5.9
95.1 88.1 18.6 26.8 7.0
80.0 80.0 10.0 60.0
65.4 69.2 19.2 19.2 15.4
88.1 81.4 32.2 37.3 11.9
93.7 87.7 16.2 25.5 6.6
74.4 74.4 7.7 25.6 12.8
95.3 90.7 14.0 37.2 11.6
94.7 87.7 20.2 26.0 6.1
100.0 84.4 18.8 31.3 3.1
91.2 94.7 33.3 38.6 12.3
96.4 83.9 17.9 28.6 3.6
93.3 83.8 27.6 30.5 7.6
100.0 80.0
90.5 97.6 9.5 21.4 9.5
90.8 81.5 3.1 12.3 6.2
90.3 87.1 12.9 29.0 8.1
R %Male
R %Female
Gender
R %<24
R %25 - 34 years
R %35 - 44 years
R %45 - 54 years
R %55 +
Participant Age
R %Married or living with partner
R %Separated, not living with partner
R %Widowed, not living with partner
R %Not married, no partner with parents
R %Not married, not with partner, alone
Status
R %Yes
R %No
Caring Responsibilities
at Home
R %1
R %2
R %3
R %4
Variety of Caring
Responsibilities At
Home
R %<1hr
R %1 - 3 hrs
R %4 - 5 hrs
R %6 - 7 hrs
R %8 - 9 hrs
R %>9 hrs
How much time do you
spend in domestic
work?
R %Less than O- Level equivalent
R %O-Level
R %A-Level
R %Vocational Certification (City & Guilds or equivalent)
R %University Diploma or equivalent -Local
R %University Diploma or equivalent -Overseas Institution
R %University Degree- Baccalaureate
R %University Degree- Masters' Level
R %Others
What is your highest
qualification?
R %Government Organisation/Department
R %Parastatal Company
R %Publicly Listed Company
R %Private Company/Sole Trader
R %Commercial Partnership
R %Non-profit Organisation
Describe the company
where you are
employed
R %Agriculture & Fishery
R %Stone Quarrying & Construction
R %Governmental Services
R %Hotel & Catering
R %Services
R %Manufacturing
Sector of Activity
R %Full time
R %Ful time (reduced hours)
R %Part time
What is your present
main job?
R %More than One Job
R %One Job Only
Are you engaged in
more than one job?
R %Casual
R %Permanent-Fixed Term Contract
R %Permanent-Indefinite Contract
What is the basis of
your main job?
R %Senior Managers, Directors
R %Professionals
R %Associate Professionals & Technical
R %Clerical employees
R %Crafts & related trades
R %Plant & machine operator, assembly workers
R %Elementary occupations
R %Shop & Market services
Your level of
responsibility
Vacation leave Sickness leaveStudy/
Training leave
Maternity/
Paternity
leave
Other leave
Days Off Available

Gender Pay Review
National Commission for the Promotion of Equality
Malta September 2006 page 177 of 327
5.5 Costs & Remuneration
5.5.1 Gross Pay Received
A total of 514 research participants provided a response in respect to their gross monthly pay
received from their main employment. This response featured a median gross pay of Lm 400
monthly and a mean gross pay of Lm 410 monthly (5% trimmed mean varied between
Lm 394.23 and Lm 426.65 monthly).
Upon application of a posteriori cell-by-cell weightings (24), the response within the sample
featured the same median gross pay of Lm 400 monthly and a weighted mean gross pay of
Lm 419.00 monthly (25). Such response is also considered to be very close to the reported
weighted mean wage of Lm 432.25 by the Ministry of Finance (26) and the weighted average
monthly wage of Lm 433.09 as reported by the National Statistics Office (27).
Table 72 sets out a summary of the highest and lowest weighted means as observed across
respondent groups (see Table 74) showing how men typically earn a higher basic pay than
their female counterparts overall with some rare exceptions.
Research participants also featured a median pay (after tax and National Insurance
Contribution) of Lm 347.67 monthly and a weighted mean net pay of Lm 410.01 monthly (28).
Table 73 summarises the key observations from an analysis of the net monthly pay (weighted
average) as featured in detail in Table 75. Differences between groups largely followed the
same patterns as established for the weighted gross pay, showing how men typically earned
a higher net pay than their female counterparts did overall with some rare exceptions.
24 Related to respondent gender and occupation type
25 or between Lm 402.38 and Lm 435.62 monthly at a 95% confidence interval.
26 Economic Survey January – September 2005. Economic Policy Division, Ministry of Finance © 2005
27 Labour Force Survey, December 2005. National Statistics Office © 2006
28 or between Lm 337.65 and Lm 362.37 net monthly at a 95% confidence interval

Gender Pay Review
National Commission for the Promotion of Equality
Malta September 2006 page 178 of 327
Table 72 – Highlights of Mean Basic Pay (Weighted) Across Respondent Groups (Based on Table 74)
Highest Mean (Weighted) Pay Lowest Mean (Weighted) Pay
Gender Men Women
Participant Age Between 35 and 44 years Younger than 24 years
Family Status Separated not living with partner Single, living with parents
Caring Responsibilities at Home With caring responsibilities at home Without caring responsibilities at home
Variety of Caring Responsibilities at home One type Two types
Time devoted to Domestic Work (29) 1 to 3 hours daily 8 to 9 hours daily
Highest Academic Qualifications (30) University Master’s Degree Less than O Level equivalent
Type of Employer Publicly listed companies and
Non-profit making organisations
Private Companies
Sector of Activity Governmental services Hotel & Catering
Present Job Type Full-time Part-time
Engaged in more than one job No Statistically Significant Differences between the Respondent Groups
Basis of Main Job Permanent Indefinite Contract Casual
Occupation Type (ISCO 1988) Senior Management Shop & Market Services Occupations
Table 73 – Highlights of Mean Net Pay (Weighted) Across Respondent Groups (Based on Table 75)
Highest Mean (Weighted) Pay Lowest Mean (Weighted) Pay
Gender Men Women
Participant Age Between 35 and 44 years Younger than 24 years
Family Status Married and/or living with partner Single, living with parents
Caring Responsibilities at Home With caring responsibilities at home Without caring responsibilities at home
Variety of Caring Responsibilities at home Two types Four types
Time devoted to Domestic Work (31) 1 to 3 hours daily 8 to 9 hours daily
Highest Academic Qualifications (32) University Master’s Degree Less than O Level equivalent
Type of Employer Publicly listed companies and
Non-profit making organisations
Private Companies
Sector of Activity Governmental services Hotel & Catering
Present Job Type Full-time Part-time
Engaged in more than one job No Statistically Significant Differences between the Respondent Groups
Basis of Main Job Permanent Fixed Term Contract Casual
Occupation Type (ISCO 1988) Senior Management Shop & Market Services Occupations
29 Progressive decline in the weighted mean Basic Pay with increasing number of hours devoted to domestic work observed
30 Progressive increase in the weighted mean Basic Pay with increasing level of qualifications observed
31 Progressive decline in the weighted mean Net Pay with increasing number of hours devoted to domestic work observed
32 Progressive increase in the weighted mean Net Pay with increasing level of qualifications observed

Gender Pay Review
National Commission for the Promotion of Equality
Malta September 2006 page 179 of 327
Table 74 – Analysis of Mean Basic Pay (Weighted) Across Respondent Groups
Male Female
Monthly Basic Pay
(Lm)
Monthly Basic Pay
(Lm)
Monthly Basic Pay
(Lm)Mean Mean Mean
Male 444.15 444.15 .
Female 374.28 . 374.28
<24 321.81 328.39 315.16 13.24
25 - 34 years 433.24 436.54 428.09 8.46
35 - 44 years 483.58 506.80 430.39 76.41
45 - 54 years 467.77 506.23 332.36 173.87
55 + 456.67 451.71 478.34 -26.63
Married or living with partner 457.83 491.29 374.75 116.54
Separated, not living with partner 472.63 435.73 540.43 -104.71
Widowed, not living with partner 420.00 . 420.00
Not married, no partner with parents 368.83 377.73 356.49 21.23
Not married, not with partner, alone 403.87 394.65 411.70 -17.05
Yes 471.72 519.08 354.83 164.25
No 382.42 381.48 383.79 -2.31
1 441.22 486.93 350.98 135.94
2 565.04 598.03 382.57 215.46
3 540.12 540.12 .
4 350.00 . 350.00
<1hr 390.59 401.57 364.88 36.69
1 - 3 hrs 464.42 497.39 409.60 87.79
4 - 5 hrs 401.95 473.42 323.75 149.66
6 - 7 hrs 416.22 471.93 344.94 126.99
8 - 9 hrs 333.86 446.12 292.93 153.20
>9 hrs 374.98 409.15 355.48 53.67
Less than O- Level equivalent 340.01 362.67 268.80 93.87
O-Level 364.55 375.36 349.61 25.76
A-Level 370.82 426.47 330.70 95.77
Vocational Certification (City & Guilds or equivalent) 428.05 450.06 238.50 211.56
University Diploma or equivalent -Local 516.90 501.77 559.09 -57.32
University Diploma or equivalent -Overseas Institution 526.42 561.20 486.08 75.13
University Degree- Baccalaureate 544.20 619.51 460.16 159.35
University Degree- Masters' Level 650.45 648.10 654.96 -6.86
University Doctoral . . .
Others 549.65 628.90 394.77 234.13
Government Organisation/Department 461.61 485.61 407.81 77.80
Parastatal Company 464.19 465.96 460.21 5.75
Publicly Listed Company 549.58 562.72 520.08 42.63
Private Company/Sole Trader 383.09 407.09 345.24 61.86
Commercial Partnership 425.11 461.25 392.92 68.33
Non-profit Organisation 582.96 619.31 470.74 148.57
Agriculture & Fishery 342.97 342.97 .
Stone Quarrying & Construction 463.73 463.73 .
Governmental Services 463.45 480.56 429.55 51.00
Hotel & Catering 373.09 434.88 317.67 117.21
Services 415.77 443.40 367.35 76.05
Manufacturing 393.86 407.97 369.84 38.14
Full time 456.58 465.79 436.50 29.29
Ful time (reduced hours) 289.46 340.00 283.85 56.15
Part time 180.70 207.18 160.51 46.67
More than One Job 418.21 417.40 419.49 -2.09
One Job Only 419.14 448.55 365.75 82.79
Casual 269.00 295.38 252.73 42.65
Permanent-Fixed Term Contract 443.29 468.12 414.85 53.28
Permanent-Indefinite Contract 440.62 455.31 407.18 48.13
Senior Managers, Directors 648.43 675.79 545.56 130.23
Professionals 538.39 569.74 495.76 73.98
Associate Professionals & Technical 460.42 476.68 422.88 53.80
Clerical employees 397.48 448.13 363.66 84.48
Skilled agriculture & fishery workers . . .
Crafts & related trades . . .
Plant & machine operator, assembly workers 372.48 368.86 384.00 -15.14
Elementary occupations 308.08 323.55 254.88 68.67
Shop & Market services 301.67 323.05 276.44 46.61
Difference in Pay
Means (Lm)
What is your present main job?
Are you engaged in more than one
job?What is the basis of your main job?
Your level of responsibility
How much time do you spend in
domestic work?
What is your highest qualification?
Describe the company where you are
employed
Sector of Activity
Participant Age
Status
Caring Responsibilities at Home
Variety of Caring Responsibilities At
Home
OverallGender
Gender

Gender Pay Review
National Commission for the Promotion of Equality
Malta September 2006 page 180 of 327
Table 75– Analysis of Mean Net Pay (Weighted) Across Respondent Groups
Male Female
Monthly Basic Pay
(Lm) after Tax & NI
deductions
Monthly Basic Pay
(Lm) after Tax & NI
deductions
Monthly Basic Pay
(Lm) after Tax & NI
deductions
Mean Mean Mean
Male 369.56 369.56 .
Female 315.48 . 315.48
<24 278.80 284.28 273.27 11.02
25 - 34 years 359.34 363.71 352.53 11.19
35 - 44 years 399.37 418.30 357.30 61.00
45 - 54 years 384.02 412.90 282.36 130.54
55 + 378.11 377.21 382.05 -4.84
Married or living with partner 378.52 404.21 315.48 88.74
Separated, not living with partner 365.48 335.44 420.67 -85.23
Widowed, not living with partner 365.00 . 365.00
Not married, no partner with parents 314.05 321.83 303.26 18.56
Not married, not with partner, alone 343.46 343.26 343.62 -0.36
Yes 388.41 424.90 299.67 125.23
No 323.64 323.95 323.20 0.74
1 367.85 404.13 297.37 106.76
2 451.69 476.56 315.96 160.60
3 432.02 432.02 .
4 300.00 . 300.00
<1hr 329.24 336.20 313.02 23.19
1 - 3 hrs 385.60 411.20 343.65 67.55
4 - 5 hrs 332.44 384.15 275.86 108.29
6 - 7 hrs 343.04 389.02 284.19 104.83
8 - 9 hrs 282.25 384.07 245.12 138.95
>9 hrs 311.81 348.90 290.66 58.24
Less than O- Level equivalent 295.49 312.45 242.16 70.29
O-Level 313.15 324.15 298.28 25.87
A-Level 314.76 363.19 279.84 83.36
Vocational Certification (City & Guilds or equivalent) 349.82 366.86 204.79 162.07
University Diploma or equivalent -Local 424.55 417.13 445.26 -28.12
University Diploma or equivalent -Overseas Institution 414.22 445.44 378.01 67.43
University Degree- Baccalaureate 440.70 490.02 385.66 104.37
University Degree- Masters' Level 511.21 505.20 522.72 -17.52
University Doctoral . . .
Others 447.34 500.89 342.71 158.18
Government Organisation/Department 381.37 403.07 333.70 69.37
Parastatal Company 387.85 394.66 372.65 22.00
Publicly Listed Company 430.74 439.33 411.43 27.90
Private Company/Sole Trader 324.27 341.55 297.09 44.46
Commercial Partnership 358.13 378.20 340.26 37.94
Non-profit Organisation 480.11 512.73 379.43 133.31
Agriculture & Fishery 327.22 327.22 .
Stone Quarrying & Construction 385.39 385.39 .
Governmental Services 382.07 397.93 351.27 46.66
Hotel & Catering 311.29 353.90 273.07 80.83
Services 346.72 368.03 309.55 58.48
Manufacturing 335.17 344.96 318.49 26.47
Full time 380.06 387.24 364.54 22.70
Ful time (reduced hours) 252.22 300.00 246.92 53.08
Part time 159.26 176.64 146.01 30.63
More than One Job 345.89 339.38 356.08 -16.70
One Job Only 350.72 374.49 307.82 66.67
Casual 239.29 264.58 223.69 40.89
Permanent-Fixed Term Contract 367.91 391.12 341.31 49.80
Permanent-Indefinite Contract 366.06 377.07 341.19 35.89
Senior Managers, Directors 519.54 534.41 463.62 70.80
Professionals 435.94 458.42 405.38 53.04
Associate Professionals & Technical 383.39 398.75 348.82 49.93
Clerical employees 329.00 367.96 303.48 64.48
Skilled agriculture & fishery workers . . .
Crafts & related trades . . .
Plant & machine operator, assembly workers 312.88 309.17 324.71 -15.55
Elementary occupations 270.36 283.73 224.35 59.38
Shop & Market services 266.38 285.44 243.88 41.56
Difference in Pay
Means (Lm)
What is your present main job?
Are you engaged in more than one
job?What is the basis of your main job?
Your level of responsibility
How much time do you spend in
domestic work?
What is your highest qualification?
Describe the company where you are
employed
Sector of Activity
Participant Age
Status
Caring Responsibilities at Home
Variety of Caring Responsibilities At
Home
OverallGender
Gender
The gross hourly pay (derived by dividing the claimed gross pay with the minimum hours of
work the research participant is expected to work) was computed for each case and
subjected to a weighting procedure as discussed earlier. The weighted mean hourly pay
stood at Lm 11.36 (or between Lm 10.85 and Lm 11.86 hourly at a 95% confidence interval),
while the median hourly pay stood at Lm 10.05.
An analysis of the hourly basic pay across respondent groups is set out in Table 77
(summarised in Table 76), showing how women typically also receive a net lower hourly rate
except for some rare participant group cases.

Gender Pay Review
National Commission for the Promotion of Equality
Malta September 2006 page 181 of 327
Table 76 – Highlights of Mean Basic Hourly Pay (Weighted) Across Respondent Groups (Based on Table 77)
Highest Mean (Weighted) Hourly Pay Lowest Mean (Weighted) Hourly Pay
Gender Men Women
Participant Age (33) Older than 55 years Younger than 24 years
Family Status Separated not living with partner Single, living with parents
Caring Responsibilities at Home With caring responsibilities at home Without caring responsibilities at home
Variety of Caring Responsibilities at home Two types Four types
Time devoted to Domestic Work 6 to 7 hours daily 8 to 9 hours daily
Highest Academic Qualifications (34) University Master’s Degree Less than O Level equivalent
Type of Employer Publicly listed companies and
Non-profit making organisations
Private Companies
Sector of Activity Governmental services Manufacturing
Present Job Type Full-time Part-time
Engaged in more than one job No Statistically Significant Differences between the Respondent Groups
Basis of Main Job Permanent Fixed Term Contract Casual
Occupation Type (ISCO 1988) Senior Management Shop & Market Services Occupations
33 Weighted mean Basic Hourly Pay rate increases progressively with participant age

Gender Pay Review
National Commission for the Promotion of Equality
Malta September 2006 page 182 of 327
Table 77 – Analysis of Mean Basic Hourly Pay (Weighted) Across Respondent Groups
Male Female
Gross Pay per Hour
(Lm)
Gross Pay per Hour
(Lm)
Gross Pay per Hour
(Lm)
Mean Mean Mean
Male 11.76 11.76 .
Female 10.63 . 10.63
<24 9.71 10.33 9.09 1.24
25 - 34 years 11.54 11.07 12.26 -1.19
35 - 44 years 12.40 12.74 11.62 1.12
45 - 54 years 11.85 12.38 9.99 2.39
55 + 13.21 13.10 13.69 -0.58
Married or living with partner 12.10 12.62 10.81 1.81
Separated, not living with partner 14.16 10.31 21.23 -10.92
Widowed, not living with partner 14.00 . 14.00
Not married, no partner with parents 10.40 10.70 10.00 0.69
Not married, not with partner, alone 10.32 10.44 10.21 0.23
Yes 12.33 12.99 10.69 2.30
No 10.68 10.74 10.61 0.13
1 11.51 12.20 10.15 2.04
2 14.93 14.99 14.64 0.34
3 13.06 13.06 .
4 8.75 . 8.75
<1hr 10.97 11.29 10.22 1.06
1 - 3 hrs 11.89 12.52 10.83 1.69
4 - 5 hrs 11.25 11.90 10.54 1.36
6 - 7 hrs 13.30 13.27 13.35 -0.08
8 - 9 hrs 9.36 12.98 8.04 4.94
>9 hrs 10.78 12.17 9.98 2.18
Less than O- Level equivalent 9.27 9.59 8.27 1.32
O-Level 10.90 11.15 10.57 0.58
A-Level 10.74 11.59 10.15 1.44
Vocational Certification (City & Guilds or equivalent) 10.77 11.20 7.06 4.15
University Diploma or equivalent -Local 13.18 12.70 14.51 -1.80
University Diploma or equivalent -Overseas Institution 13.40 14.29 12.36 1.93
University Degree- Baccalaureate 13.87 15.59 11.96 3.63
University Degree- Masters' Level 16.26 16.85 15.11 1.74
University Doctoral . . .
Others 13.77 15.28 10.84 4.43
Government Organisation/Department 12.55 12.75 12.10 0.64
Parastatal Company 12.64 12.73 12.43 0.31
Publicly Listed Company 13.74 14.00 13.17 0.83
Private Company/Sole Trader 10.51 10.93 9.85 1.09
Commercial Partnership 10.68 10.84 10.53 0.31
Non-profit Organisation 14.54 15.15 12.67 2.49
Agriculture & Fishery 6.46 6.46 .
Stone Quarrying & Construction 10.86 10.86 .
Governmental Services 12.59 12.78 12.19 0.59
Hotel & Catering 11.66 14.63 8.99 5.65
Services 11.13 11.10 11.17 -0.07
Manufacturing 10.54 11.25 9.34 1.91
Full time 11.47 11.57 11.24 0.33
Ful time (reduced hours) 10.25 8.50 10.45 -1.95
Part time 10.80 14.11 8.33 5.78
More than One Job 11.20 11.10 11.36 -0.25
One Job Only 11.38 11.87 10.50 1.38
Casual 10.39 12.57 9.07 3.50
Permanent-Fixed Term Contract 11.79 11.38 12.26 -0.88
Permanent-Indefinite Contract 11.46 11.73 10.86 0.87
Senior Managers, Directors 15.67 16.37 13.07 3.29
Professionals 14.92 15.57 14.02 1.55
Associate Professionals & Technical 11.69 12.14 10.67 1.47
Clerical employees 11.72 11.73 11.71 0.02
Skilled agriculture & fishery workers . . .
Crafts & related trades . . .
Plant & machine operator, assembly workers 10.07 10.17 9.78 0.38
Elementary occupations 8.90 9.15 8.04 1.12
Shop & Market services 8.69 9.20 8.10 1.10
Difference in Pay
Means (Lm)
What is your present main job?
Are you engaged in more than one
job?What is the basis of your main job?
Your level of responsibility
How much time do you spend in
domestic work?
What is your highest qualification?
Describe the company where you are
employed
Sector of Activity
Participant Age
Status
Caring Responsibilities at Home
Variety of Caring Responsibilities At
Home
OverallGender
Gender
34 Progressive increased in the weighted mean Basic Hourly Pay with increasing level of qualifications observed

Gender Pay Review
National Commission for the Promotion of Equality
Malta September 2006 page 183 of 327
5.5.2 Costs Incurred for Work
A total of 26.7% of research participants claimed to spend money on certain costs related to
their work. An analysis of the incidence of such incurrence (Table 79 and Table 80) shows
how the incidence of such costs was not discernable across sexes, but featured differences
across participant groups as distinguished by their age, qualifications, employer and
occupation type.
Table 78 – Summary of Costs Incurred by Participants in Conduct of Work
157 26.7%
430 73.3%
587 100.0%
Yes
No
Total
Do you spend money on
job related expenses?
Count Valid Percent
Yes
26.7%
No
73.3%
Table 79 – Summary of Analysis of Incurrence of Costs (Incidence) Across Research Participant Groups (Based on Analysis set out in Table 80)
Most Common Incidence Least Common Incidence
Gender No Statistically Significant Differences Among Respondent Groups
Participant Age 35 to 44 year olds Younger than 24 years
Family Status Persons married and/or living with partner Unmarried, single persons
Caring Responsibilities at Home No Statistically Significant Differences Among Respondent Groups
Variety of Caring Responsibilities at home No Statistically Significant Differences Among Respondent Groups
Time devoted to Domestic Work No Statistically Significant Differences Among Respondent Groups
Highest Academic Qualifications University Degree (Baccalaureate) Vocational Certification
Type of Employer Government Organisation / Department Publicly Listed Company
Sector of Activity No Statistically Significant Differences Among Respondent Groups
Present Job Type Full-time Full-time with Reduced Hours
Engaged in more than one job No Statistically Significant Differences Among Respondent Groups
Basis of Main Job No Statistically Significant Differences Among Respondent Groups
Occupation Type (ISCO 1988) Senior Managers, Directors, Professionals Plant & Machine Operators, Assembly Workers

Gender Pay Review
National Commission for the Promotion of Equality
Malta September 2006 page 184 of 327
Table 80 – Analysis of Incurrence of Costs (Incidence) Across Research Participant Groups
93 26.7% 255 73.3% 348 100.0%
64 26.8% 175 73.2% 239 100.0%
31 16.9% 152 83.1% 183 100.0%
46 29.3% 111 70.7% 157 100.0%
41 37.6% 68 62.4% 109 100.0%
28 29.2% 68 70.8% 96 100.0%
8 20.5% 31 79.5% 39 100.0%
91 32.0% 193 68.0% 284 100.0%
3 23.1% 10 76.9% 13 100.0%
0 .0% 2 100.0% 2 100.0%
51 20.4% 199 79.6% 250 100.0%
12 31.6% 26 68.4% 38 100.0%
71 31.6% 154 68.4% 225 100.0%
86 23.8% 276 76.2% 362 100.0%
56 32.9% 114 67.1% 170 100.0%
14 28.6% 35 71.4% 49 100.0%
1 20.0% 4 80.0% 5 100.0%
0 .0% 1 100.0% 1 100.0%
52 23.6% 168 76.4% 220 100.0%
66 32.5% 137 67.5% 203 100.0%
12 21.4% 44 78.6% 56 100.0%
8 26.7% 22 73.3% 30 100.0%
2 20.0% 8 80.0% 10 100.0%
6 26.1% 17 73.9% 23 100.0%
32 24.6% 98 75.4% 130 100.0%
32 21.2% 119 78.8% 151 100.0%
23 24.7% 70 75.3% 93 100.0%
6 10.5% 51 89.5% 57 100.0%
6 24.0% 19 76.0% 25 100.0%
6 21.4% 22 78.6% 28 100.0%
30 51.7% 28 48.3% 58 100.0%
18 66.7% 9 33.3% 27 100.0%
0 .0% 0 .0% 0 .0%
4 22.2% 14 77.8% 18 100.0%
41 31.8% 88 68.2% 129 100.0%
7 19.4% 29 80.6% 36 100.0%
6 16.2% 31 83.8% 37 100.0%
93 25.1% 277 74.9% 370 100.0%
4 50.0% 4 50.0% 8 100.0%
6 85.7% 1 14.3% 7 100.0%
0 .0% 2 100.0% 2 100.0%
2 12.5% 14 87.5% 16 100.0%
37 29.4% 89 70.6% 126 100.0%
13 20.6% 50 79.4% 63 100.0%
73 30.5% 166 69.5% 239 100.0%
32 22.7% 109 77.3% 141 100.0%
142 28.7% 352 71.3% 494 100.0%
1 7.1% 13 92.9% 14 100.0%
14 17.7% 65 82.3% 79 100.0%
21 25.3% 62 74.7% 83 100.0%
136 27.0% 368 73.0% 504 100.0%
19 24.1% 60 75.9% 79 100.0%
18 34.0% 35 66.0% 53 100.0%
120 26.4% 335 73.6% 455 100.0%
18 40.9% 26 59.1% 44 100.0%
40 43.5% 52 56.5% 92 100.0%
20 31.7% 43 68.3% 63 100.0%
24 18.0% 109 82.0% 133 100.0%
0 .0% 0 .0% 0 .0%
1 12.5% 7 87.5% 8 100.0%
9 15.8% 48 84.2% 57 100.0%
15 19.7% 61 80.3% 76 100.0%
30 26.3% 84 73.7% 114 100.0%
Male
Female
Gender
<24
25 - 34 years
35 - 44 years
45 - 54 years
55 +
Participant Age
Married or living with partner
Separated, not living with partner
Widowed, not living with partner
Not married, no partner with parents
Not married, not with partner, alone
Status
Yes
No
Caring Responsibilities
at Home
1
2
3
4
Variety of Caring
Responsibilities At
Home
<1hr
1 - 3 hrs
4 - 5 hrs
6 - 7 hrs
8 - 9 hrs
>9 hrs
How much time do you
spend in domestic
work?
Less than O- Level equivalent
O-Level
A-Level
Vocational Certification (City & Guilds or equivalent)
University Diploma or equivalent -Local
University Diploma or equivalent -Overseas Institution
University Degree- Baccalaureate
University Degree- Masters' Level
University Doctoral
Others
What is your highest
qualification?
Government Organisation/Department
Parastatal Company
Publicly Listed Company
Private Company/Sole Trader
Commercial Partnership
Non-profit Organisation
Describe the company
where you are
employed
Agriculture & Fishery
Stone Quarrying & Construction
Governmental Services
Hotel & Catering
Services
Manufacturing
Sector of Activity
Full time
Ful time (reduced hours)
Part time
What is your present
main job?
More than One Job
One Job Only
Are you engaged in
more than one job?
Casual
Permanent-Fixed Term Contract
Permanent-Indefinite Contract
What is the basis of
your main job?
Senior Managers, Directors
Professionals
Associate Professionals & Technical
Clerical employees
Skilled agriculture & fishery workers
Crafts & related trades
Plant & machine operator, assembly workers
Elementary occupations
Shop & Market services
Your level of
responsibility
N N %
Yes
N N %
No
N N %
Total
Do you spend money on job related expenses?

Gender Pay Review
National Commission for the Promotion of Equality
Malta September 2006 page 185 of 327
Of the 157 research participants, claiming to incur expenses related to their conduct of work,
96 participants (61.1%) claimed fuel as one such expense, while 84 participants (53.5%)
claimed mobile phone as one such expense (Table 81). An analysis of these expenses (Table
82) shows that women typically incur fuel, travel and other costs more frequently than their
male counterparts do. The converse holds for expenses related to mobile phone, internet
subscription and fixed line telephony, where male participants claimed to incur such costs
relatively more frequently than their female counterparts.
An analysis of the different types of costs incurred (Table 82) shows that:
� mobile phone costs were more commonly incurred among participants who:
– were older than 45 years, or
– were married and/or living with a partner, or
– devoted between 1 and 5 hours daily for domestic work, or
– featured vocational qualifications, or
– were employed with a parastatal company, or
– were engaged through a permanent, fixed-term contract, or
– were employed in senior manager occupations;
� fuel costs were more commonly incurred among participants who:
– were 35 to 44 years old, or
– were married and/or living with a partner, or
– had caring responsibilities at home, or
– devoted less than 3 hours daily for domestic work, or
– featured a University Diploma or equivalent, or
– were employed with a private company, or
– were employed through a permanent, fixed-term contract, or
– were engaged in plant & machine operator or elementary occupations.

Gender Pay Review
National Commission for the Promotion of Equality
Malta September 2006 page 186 of 327
Table 81 – Summary of Types of Costs Incurred for Work
37 11.9% 23.6%
84 26.9% 53.5%
37 11.9% 23.6%
96 30.8% 61.1%
34 10.9% 21.7%
24 7.7% 15.3%
312 100.0% 198.7%
Fixed line telephone
Mobile Phone
Internet Subscription
Fuel
Travel
Others
Work
Related
Expensesa
Total
N Percent
Responses Percent of
Cases
a.
53.5 %
61.1 %
21.7 %
15.3 %
23.6 %
23.6 %
0 25 50
Fixed line telephone
Mobile Phone
Internet Subscription
Fuel
Travel
Others
% of Participants who incur costs for work (n = 157)

Gender Pay Review
National Commission for the Promotion of Equality
Malta September 2006 page 187 of 327
Table 82 – Analysis of the Types of Costs Incurred by Research Participants Across Participant Groups
27 56 23 56 17 13
10 28 14 40 17 11
4 12 5 18 7 9
11 27 14 28 13 2
11 23 8 26 8 4
9 17 7 17 6 7
2 4 2 4 2
27 53 20 59 21 14
2 2
6 23 12 30 11 10
4 6 3 7 2
23 45 20 45 18 7
14 39 17 51 16 17
17 32 17 38 12 4
6 12 3 6 5 3
1 1 1
8 28 11 32 9 7
17 36 14 41 15 13
5 8 4 6 3 2
3 2 5 3 3 1
1 1 2
2 4 3 5 1
7 17 4 21 2 1
8 18 5 21 7 7
5 8 5 15 4 6
1 5 1 4 1
2 1 5 2
2 3 4 1 1 2
6 16 12 15 7 7
7 13 4 11 10
1 2 1 3 1
13 19 12 19 7 8
2 5 3 2 2 2
4 4 2
20 51 20 66 22 12
1 2 1 2 1 1
1 3 1 3 1
1 1 1 2 1 1
12 20 11 18 6 3
2 7 3 7 3 3
19 38 16 44 18 16
3 18 6 25 6 1
34 77 34 87 30 21
1
3 7 3 8 4 3
5 14 8 12 4 2
32 70 29 84 30 22
2 6 4 12 3 5
5 13 4 14 4
30 65 29 70 27 19
9 15 5 13 6 2
12 19 16 19 10 11
3 11 4 10 5 2
3 9 4 15 5 3
1
3 2 8 1
3 7 2 12 1 1
7 20 4 18 6 5
Male
Female
Gender
<24
25 - 34 years
35 - 44 years
45 - 54 years
55 +
Participant Age
Married or living with partner
Separated, not living with partner
Not married, no partner with parents
Not married, not with partner, alone
Status
Yes
No
Caring Responsibilities
at Home
1
2
3
Variety of Caring
Responsibilities At
Home
<1hr
1 - 3 hrs
4 - 5 hrs
6 - 7 hrs
8 - 9 hrs
>9 hrs
How much time do you
spend in domestic
work?
Less than O- Level equivalent
O-Level
A-Level
Vocational Certification (City & Guilds or equivalent)
University Diploma or equivalent -Local
University Diploma or equivalent -Overseas Institution
University Degree- Baccalaureate
University Degree- Masters' Level
Others
What is your highest
qualification?
Government Organisation/Department
Parastatal Company
Publicly Listed Company
Private Company/Sole Trader
Commercial Partnership
Non-profit Organisation
Describe the company
where you are
employed
Stone Quarrying & Construction
Governmental Services
Hotel & Catering
Services
Manufacturing
Sector of Activity
Full time
Ful time (reduced hours)
Part time
What is your present
main job?
More than One Job
One Job Only
Are you engaged in
more than one job?
Casual
Permanent-Fixed Term Contract
Permanent-Indefinite Contract
What is the basis of
your main job?
Senior Managers, Directors
Professionals
Associate Professionals & Technical
Clerical employees
Crafts & related trades
Plant & machine operator, assembly workers
Elementary occupations
Shop & Market services
Your level of
responsibility
Fixed line
telephoneMobile Phone
Internet
SubscriptionFuel Travel Others
Work Related Expenses

Gender Pay Review
National Commission for the Promotion of Equality
Malta September 2006 page 188 of 327
Table 82 – Analysis of the Types of Costs Incurred by Research Participants Across Participant Groups (continued) (35)
29.0 60.2 24.7 60.2 18.3 14.0
15.6 43.8 21.9 62.5 26.6 17.2
12.9 38.7 16.1 58.1 22.6 29.0
23.9 58.7 30.4 60.9 28.3 4.3
26.8 56.1 19.5 63.4 19.5 9.8
32.1 60.7 25.0 60.7 21.4 25.0
25.0 50.0 25.0 50.0 25.0
29.7 58.2 22.0 64.8 23.1 15.4
66.7 66.7
11.8 45.1 23.5 58.8 21.6 19.6
33.3 50.0 25.0 58.3 16.7
32.4 63.4 28.2 63.4 25.4 9.9
16.3 45.3 19.8 59.3 18.6 19.8
30.4 57.1 30.4 67.9 21.4 7.1
42.9 85.7 21.4 42.9 35.7 21.4
100.0 100.0 100.0
15.4 53.8 21.2 61.5 17.3 13.5
25.8 54.5 21.2 62.1 22.7 19.7
41.7 66.7 33.3 50.0 25.0 16.7
37.5 25.0 62.5 37.5 37.5 12.5
50.0 50.0 100.0
33.3 66.7 50.0 83.3 16.7
21.9 53.1 12.5 65.6 6.3 3.1
25.0 56.3 15.6 65.6 21.9 21.9
21.7 34.8 21.7 65.2 17.4 26.1
16.7 83.3 16.7 66.7 16.7
33.3 16.7 83.3 33.3
33.3 50.0 66.7 16.7 16.7 33.3
20.0 53.3 40.0 50.0 23.3 23.3
38.9 72.2 22.2 61.1 55.6
25.0 50.0 25.0 75.0 25.0
31.7 46.3 29.3 46.3 17.1 19.5
28.6 71.4 42.9 28.6 28.6 28.6
66.7 66.7 33.3
21.5 54.8 21.5 71.0 23.7 12.9
25.0 50.0 25.0 50.0 25.0 25.0
16.7 50.0 16.7 50.0 16.7
50.0 50.0 50.0 100.0 50.0 50.0
32.4 54.1 29.7 48.6 16.2 8.1
15.4 53.8 23.1 53.8 23.1 23.1
26.0 52.1 21.9 60.3 24.7 21.9
9.4 56.3 18.8 78.1 18.8 3.1
23.9 54.2 23.9 61.3 21.1 14.8
100.0
21.4 50.0 21.4 57.1 28.6 21.4
23.8 66.7 38.1 57.1 19.0 9.5
23.5 51.5 21.3 61.8 22.1 16.2
10.5 31.6 21.1 63.2 15.8 26.3
27.8 72.2 22.2 77.8 22.2
25.0 54.2 24.2 58.3 22.5 15.8
50.0 83.3 27.8 72.2 33.3 11.1
30.0 47.5 40.0 47.5 25.0 27.5
15.0 55.0 20.0 50.0 25.0 10.0
12.5 37.5 16.7 62.5 20.8 12.5
100.0
33.3 22.2 88.9 11.1
20.0 46.7 13.3 80.0 6.7 6.7
23.3 66.7 13.3 60.0 20.0 16.7
R %Male
R %Female
Gender
R %<24
R %25 - 34 years
R %35 - 44 years
R %45 - 54 years
R %55 +
Participant Age
R %Married or living with partner
R %Separated, not living with partner
R %Not married, no partner with parents
R %Not married, not with partner, alone
Status
R %Yes
R %No
Caring Responsibilities
at Home
R %1
R %2
R %3
Variety of Caring
Responsibilities At
Home
R %<1hr
R %1 - 3 hrs
R %4 - 5 hrs
R %6 - 7 hrs
R %8 - 9 hrs
R %>9 hrs
How much time do you
spend in domestic
work?
R %Less than O- Level equivalent
R %O-Level
R %A-Level
R %Vocational Certification (City & Guilds or equivalent)
R %University Diploma or equivalent -Local
R %University Diploma or equivalent -Overseas Institution
R %University Degree- Baccalaureate
R %University Degree- Masters' Level
R %Others
What is your highest
qualification?
R %Government Organisation/Department
R %Parastatal Company
R %Publicly Listed Company
R %Private Company/Sole Trader
R %Commercial Partnership
R %Non-profit Organisation
Describe the company
where you are
employed
R %Stone Quarrying & Construction
R %Governmental Services
R %Hotel & Catering
R %Services
R %Manufacturing
Sector of Activity
R %Full time
R %Ful time (reduced hours)
R %Part time
What is your present
main job?
R %More than One Job
R %One Job Only
Are you engaged in
more than one job?
R %Casual
R %Permanent-Fixed Term Contract
R %Permanent-Indefinite Contract
What is the basis of
your main job?
R %Senior Managers, Directors
R %Professionals
R %Associate Professionals & Technical
R %Clerical employees
R %Crafts & related trades
R %Plant & machine operator, assembly workers
R %Elementary occupations
R %Shop & Market services
Your level of
responsibility
Fixed line
telephoneMobile Phone
Internet
SubscriptionFuel Travel Others
Work Related Expenses
35 Percentages relate to the number of participant with the same characteristics who claimed to incur expenses related to
work. Viz Table 80

Gender Pay Review
National Commission for the Promotion of Equality
Malta September 2006 page 189 of 327
A total of 61 (38.8%) participants from those who claimed to incur expenses related to work
indicated that some (if not all) of the expenses incurred were refunded by the employer.
More significantly, of these costs, the most often refunded comprised fuel and mobile phone
costs, as shown in Table 83 (percent of cases referring to the 61 participants who claimed to
receive a refund. Table 84 sets out how the proportion of costs refunded by employers is low
when compared to the number of participants who incur such costs for the conduct of their
work, with the most often refunded cost relating to travel, fuel, internet subscription and
mobile phone in diminishing order of incidence.
An analysis of the incidence of such refunds across different respondent groups in terms of
effective refund (Table 86) showed that male participants were more often refunded the
costs of mobile phone, fuel, travel and other expenses than their female counterparts, while
the reverse held in respect to internet subscription and fixed line telephony costs. Other
analysis for differences across respondent groups did not features significant differences.
Table 83 – Summary of the Costs Incurred and Refunded by Employer
10 8.5% 16.4%
29 24.8% 47.5%
13 11.1% 21.3%
35 29.9% 57.4%
22 18.8% 36.1%
8 6.8% 13.1%
117 100.0% 191.8%
Fixed line telephone refund
Mobile phone refund
Internet subscription refund
Fuel refund
Travel refund
Others refund
Work
Related
Expenses
Refunda
Total
N Percent
Responses Percent of
Cases
Dichotomy group tabulated at value 1.a.
Table 84 – Summary of Effective Cost Refund Proportion (Proportion of Participants Who Incur Costs for Work and Refunded such monies over Total Participants Who Incur Costs)
Cost Incurred Cost Refunded
Fixed line telephone 37 10 27.0%
Mobile Phone 84 29 34.5%
Internet Subscription 37 13 35.1%
Fuel 96 35 36.5%
Travel 34 22 64.7%
Others 24 8 33.3%
Responses Proportion of
Refunded/Incurred

Gender Pay Review
National Commission for the Promotion of Equality
Malta September 2006 page 190 of 327
Table 85 – Analysis of Refund of Costs Claimed by Research Participants Across Participant Groups
7 21 8 22 12 6
3 8 5 13 10 2
1 4 1 5 5 3
3 10 7 8 9 0
2 7 3 10 6 2
2 6 2 9 2 3
2 2 0 3 0 0
6 17 8 23 14 5
0 0 1 0 0 0
0 0 0 0 0 0
2 7 2 10 6 3
2 5 2 2 2 0
4 15 8 18 11 2
6 14 5 17 11 6
4 11 8 14 7 1
0 3 0 3 3 1
0 1 0 1 1 0
3 9 2 11 6 4
4 15 5 14 8 3
0 1 3 1 3 0
2 1 2 1 2 1
0 0 0 0 1 0
1 1 1 2 1 0
1 6 2 6 1 1
5 8 5 11 5 4
1 2 0 3 2 0
0 2 0 2 0 0
0 2 0 3 1 0
0 1 1 1 0 0
2 6 2 6 6 3
1 2 3 2 6 0
0 0 0 0 0 0
0 0 0 1 1 0
4 3 2 4 5 2
1 3 2 1 0 0
0 1 0 2 2 0
4 22 9 25 15 5
1 0 0 0 0 1
0 0 0 3 0 0
8 27 11 34 21 6
0 0 0 0 0 0
2 2 2 1 1 2
0 2 0 2 1 0
10 27 13 33 21 8
2 3 2 5 1 3
2 6 3 6 2 0
6 20 8 24 19 5
4 8 3 10 6 2
2 4 3 4 5 2
1 5 2 2 3 0
0 3 2 5 3 0
0 0 0 0 0 0
0 0 0 1 0 0
0 1 1 1 1 0
1 1 0 3 0 1
2 7 2 9 4 3
Male
Female
Gender
<24
25 - 34 years
35 - 44 years
45 - 54 years
55 +
Participant Age
Married or living with partner
Separated, not living with partner
Widowed, not living with partner
Not married, no partner with parents
Not married, not with partner, alone
Status
Yes
No
Caring Responsibilities
at Home
1
2
3
Variety of Caring
Responsibilities At
Home
<1hr
1 - 3 hrs
4 - 5 hrs
6 - 7 hrs
8 - 9 hrs
>9 hrs
How much time do you
spend in domestic
work?
Less than O- Level equivalent
O-Level
A-Level
Vocational Certification (City & Guilds or equivalent)
University Diploma or equivalent -Local
University Diploma or equivalent -Overseas Institution
University Degree- Baccalaureate
University Degree- Masters' Level
University Doctoral
Others
What is your highest
qualification?
Government Organisation/Department
Parastatal Company
Publicly Listed Company
Private Company/Sole Trader
Commercial Partnership
Non-profit Organisation
Describe the company
where you are
employed
Full time
Ful time (reduced hours)
Part time
What is your present
main job?
More than One Job
One Job Only
Are you engaged in
more than one job?
Casual
Permanent-Fixed Term Contract
Permanent-Indefinite Contract
What is the basis of
your main job?
Senior Managers, Directors
Professionals
Associate Professionals & Technical
Clerical employees
Skilled agriculture & fishery workers
Crafts & related trades
Plant & machine operator, assembly workers
Elementary occupations
Shop & Market services
Your level of
responsibility
Count
Yes
Fixed line
telephone
refund
Count
Yes
Mobile
phone
refund
Count
Yes
Internet
subscription
refund
Count
Yes
Fuel
refund
Count
Yes
Travel
refund
Count
Yes
Others
refund

Gender Pay Review
National Commission for the Promotion of Equality
Malta September 2006 page 191 of 327
Table 85 – Analysis of Refund of Costs Claimed by Research Participants Across Participant Groups (continued)
17.9 53.8 20.5 56.4 30.8 15.4
13.6 36.4 22.7 59.1 45.5 9.1
10.0 40.0 10.0 50.0 50.0 30.0
17.6 58.8 41.2 47.1 52.9
11.1 38.9 16.7 55.6 33.3 11.1
16.7 50.0 16.7 75.0 16.7 25.0
50.0 50.0 75.0
15.4 43.6 20.5 59.0 35.9 12.8
100.0
13.3 46.7 13.3 66.7 40.0 20.0
33.3 83.3 33.3 33.3 33.3
13.8 51.7 27.6 62.1 37.9 6.9
18.8 43.8 15.6 53.1 34.4 18.8
20.0 55.0 40.0 70.0 35.0 5.0
37.5 37.5 37.5 12.5
100.0 100.0 100.0
15.8 47.4 10.5 57.9 31.6 21.1
16.7 62.5 20.8 58.3 33.3 12.5
16.7 50.0 16.7 50.0
66.7 33.3 66.7 33.3 66.7 33.3
100.0
50.0 50.0 50.0 100.0 50.0
10.0 60.0 20.0 60.0 10.0 10.0
27.8 44.4 27.8 61.1 27.8 22.2
16.7 33.3 50.0 33.3
66.7 66.7
66.7 100.0 33.3
50.0 50.0 50.0
20.0 60.0 20.0 60.0 60.0 30.0
12.5 25.0 37.5 25.0 75.0
100.0 100.0
36.4 27.3 18.2 36.4 45.5 18.2
33.3 100.0 66.7 33.3
25.0 50.0 50.0
10.3 56.4 23.1 64.1 38.5 12.8
100.0 100.0
100.0
50.0 100.0 50.0 50.0
42.9 42.9 28.6 28.6 42.9 14.3
25.0 50.0 25.0 50.0 75.0 25.0
16.7 50.0 16.7 58.3 30.6 11.1
41.7 33.3 66.7 33.3 8.3
13.8 46.6 19.0 58.6 36.2 10.3
66.7 66.7 66.7 33.3 33.3 66.7
66.7 66.7 33.3
17.2 46.6 22.4 56.9 36.2 13.8
25.0 37.5 25.0 62.5 12.5 37.5
22.2 66.7 33.3 66.7 22.2
13.6 45.5 18.2 54.5 43.2 11.4
30.8 61.5 23.1 76.9 46.2 15.4
18.2 36.4 27.3 36.4 45.5 18.2
12.5 62.5 25.0 25.0 37.5
30.0 20.0 50.0 30.0
100.0
50.0 50.0 50.0 50.0
25.0 25.0 75.0 25.0
16.7 58.3 16.7 75.0 33.3 25.0
R %Male
R %Female
Gender
R %<24
R %25 - 34 years
R %35 - 44 years
R %45 - 54 years
R %55 +
Participant Age
R %Married or living with partner
R %Separated, not living with partner
R %Not married, no partner with parents
R %Not married, not with partner, alone
Status
R %Yes
R %No
Caring Responsibilities
at Home
R %1
R %2
R %3
Variety of Caring
Responsibilities At
Home
R %<1hr
R %1 - 3 hrs
R %4 - 5 hrs
R %6 - 7 hrs
R %8 - 9 hrs
R %>9 hrs
How much time do you
spend in domestic
work?
R %Less than O- Level equivalent
R %O-Level
R %A-Level
R %Vocational Certification (City & Guilds or equivalent)
R %University Diploma or equivalent -Local
R %University Diploma or equivalent -Overseas Institution
R %University Degree- Baccalaureate
R %University Degree- Masters' Level
R %Others
What is your highest
qualification?
R %Government Organisation/Department
R %Parastatal Company
R %Publicly Listed Company
R %Private Company/Sole Trader
R %Commercial Partnership
R %Non-profit Organisation
Describe the company
where you are
employed
R %Stone Quarrying & Construction
R %Governmental Services
R %Hotel & Catering
R %Services
R %Manufacturing
Sector of Activity
R %Full time
R %Ful time (reduced hours)
R %Part time
What is your present
main job?
R %More than One Job
R %One Job Only
Are you engaged in
more than one job?
R %Casual
R %Permanent-Fixed Term Contract
R %Permanent-Indefinite Contract
What is the basis of
your main job?
R %Senior Managers, Directors
R %Professionals
R %Associate Professionals & Technical
R %Clerical employees
R %Crafts & related trades
R %Plant & machine operator, assembly workers
R %Elementary occupations
R %Shop & Market services
Your level of
responsibility
Fixed line
telephone
refund
Mobile phone
refund
Internet
subscription
refund
Fuel refund Travel refund Others refund
Work Related Expenses Refund

Gender Pay Review
National Commission for the Promotion of Equality
Malta September 2006 page 192 of 327
Table 86 – Analysis of Effective Cost Refund Proportion Across Participant Groups
Fixed line
telephoneMobile Phone
Internet
SubscriptionFuel Travel Others
Male 25.9% 37.5% 34.8% 39.3% 70.6% 46.2%
Female 30.0% 28.6% 35.7% 32.5% 58.8% 18.2%
<24 25.0% 33.3% 20.0% 27.8% 71.4% 33.3%
25 - 34 years 27.3% 37.0% 50.0% 28.6% 69.2%
35 - 44 years 18.2% 30.4% 37.5% 38.5% 75.0% 50.0%
45 - 54 years 22.2% 35.3% 28.6% 52.9% 33.3% 42.9%
55 + 100.0% 50.0% 75.0%
Married or living with partner 22.2% 32.1% 40.0% 39.0% 66.7% 35.7%
Separated, not living with partner 50.0%
Not married, no partner with parents 33.3% 30.4% 16.7% 33.3% 54.5% 30.0%
Not married, not with partner, alone 50.0% 83.3% 66.7% 28.6% 100.0%
Yes 17.4% 33.3% 40.0% 40.0% 61.1% 28.6%
No 42.9% 35.9% 29.4% 33.3% 68.8% 35.3%
1 23.5% 34.4% 47.1% 36.8% 58.3% 25.0%
2 25.0% 50.0% 60.0% 33.3%
3 100.0% 100.0% 100.0%
<1hr 37.5% 32.1% 18.2% 34.4% 66.7% 57.1%
1 - 3 hrs 23.5% 41.7% 35.7% 34.1% 53.3% 23.1%
4 - 5 hrs 12.5% 75.0% 16.7% 100.0%
6 - 7 hrs 66.7% 50.0% 40.0% 33.3% 66.7% 100.0%
8 - 9 hrs 50.0%
>9 hrs 50.0% 25.0% 33.3% 40.0% 100.0%
Less than O- Level equivalent 14.3% 35.3% 50.0% 28.6% 50.0% 100.0%
O-Level 62.5% 44.4% 100.0% 52.4% 71.4% 57.1%
A-Level 20.0% 25.0% 20.0% 50.0%
Vocational Certification (City & Guilds or equivalent) 40.0% 50.0%
University Diploma or equivalent -Local 100.0% 60.0% 50.0%
University Diploma or equivalent -Overseas Institution 33.3% 25.0% 100.0%
University Degree- Baccalaureate 33.3% 37.5% 16.7% 40.0% 85.7% 42.9%
University Degree- Masters' Level 14.3% 15.4% 75.0% 18.2% 60.0%
Others 33.3% 100.0%
Government Organisation/Department 30.8% 15.8% 16.7% 21.1% 71.4% 25.0%
Parastatal Company 50.0% 60.0% 66.7% 50.0%
Publicly Listed Company 25.0% 50.0% 100.0%
Private Company/Sole Trader 20.0% 43.1% 45.0% 37.9% 68.2% 41.7%
Commercial Partnership 100.0% 100.0%
Non-profit Organisation
Stone Quarrying & Construction 100.0% 100.0% 100.0% 100.0%
Governmental Services 25.0% 15.0% 18.2% 11.1% 50.0% 33.3%
Hotel & Catering 50.0% 28.6% 33.3% 28.6% 100.0% 33.3%
Services 31.6% 47.4% 37.5% 47.7% 61.1% 25.0%
Manufacturing 27.8% 66.7% 32.0% 66.7% 100.0%
Full time 23.5% 35.1% 32.4% 39.1% 70.0% 28.6%
Ful time (reduced hours)
Part time 66.7% 28.6% 66.7% 12.5% 25.0% 66.7%
More than One Job 16.7% 25.0%
One Job Only 31.3% 38.6% 44.8% 39.3% 70.0% 36.4%
Casual 100.0% 50.0% 50.0% 41.7% 33.3% 60.0%
Permanent-Fixed Term Contract 40.0% 46.2% 75.0% 42.9% 50.0%
Permanent-Indefinite Contract 20.0% 30.8% 27.6% 34.3% 70.4% 26.3%
Senior Managers, Directors 44.4% 53.3% 60.0% 76.9% 100.0% 100.0%
Professionals 16.7% 21.1% 18.8% 21.1% 50.0% 18.2%
Associate Professionals & Technical 33.3% 45.5% 50.0% 20.0% 60.0%
Clerical employees 33.3% 50.0% 33.3% 60.0%
Crafts & related trades 100.0%
Plant & machine operator, assembly workers 33.3% 50.0% 12.5% 100.0%
Elementary occupations 33.3% 14.3% 25.0% 100.0%
Shop & Market services 28.6% 35.0% 50.0% 50.0% 66.7% 60.0%
What is the basis of your main
job?
Your level of responsibility
Describe the company where
you are employed
Sector of Activity
What is your present main
job?
Are you engaged in more than
one job?
Effective Work Related Expenses Refund
Gender
Participant Age
Status
Caring Responsibilities at
HomeVariety of Caring
Responsibilities At Home
How much time do you spend
in domestic work?
What is your highest
qualification?
Research participants also claimed that such work related expenses varied between Lm 1 to
Lm 500 monthly (weighted mean response standing at Lm 31.49 monthly, while the median
response standing at Lm 20 monthly36). An analysis of these responses (contributed by 146
research participants, Table 87) featured no significant differences in the amounts claimed
across different respondent groups, except when participants were categorised by their
occupation, wherein participants in management occupations declared a weighted average of
Lm 59.96 monthly incurred as work related costs, contrasting against the Lm 18.01 weighted
average declared to be incurred monthly as work related costs among associate professional
and technical research participants.

Gender Pay Review
National Commission for the Promotion of Equality
Malta September 2006 page 193 of 327
Table 87 – Mean Monthly Costs Incurred for Work by Research Participants Across Respondent Groups
Male Female
Total cost of
expenses monthly
Total cost of
expenses monthly
Total cost of
expenses monthly
Mean Mean Mean
Male 31.81 31.81 .
Female 30.95 . 30.95
<24 29.08 14.08 36.85
25 - 34 years 28.01 30.14 24.96
35 - 44 years 26.12 26.56 25.11
45 - 54 years 44.83 48.85 22.76
55 + 38.32 21.49 104.50
Married or living with partner 31.37 32.26 28.83
Separated, not living with partner 26.83 15.00 37.50
Widowed, not living with partner . . .
Not married, no partner with parents 26.43 31.45 21.70
Not married, not with partner, alone 52.78 31.29 64.91
Yes 34.62 39.10 22.06
No 28.51 22.04 35.61
1 26.77 29.18 22.06
2 65.29 65.29 .
3 25.00 25.00 .
4 . . .
<1hr 27.85 31.24 22.36
1 - 3 hrs 32.07 36.44 20.61
4 - 5 hrs 63.63 24.11 112.97
6 - 7 hrs 15.76 22.48 11.18
8 - 9 hrs 38.57 10.00 70.00
>9 hrs 21.68 40.00 18.24
Less than O- Level equivalent 24.10 21.82 34.31
O-Level 37.14 18.61 55.09
A-Level 43.95 59.81 25.58
Vocational Certification (City & Guilds or equivalent) 20.44 20.44 .
University Diploma or equivalent -Local 22.56 27.18 11.19
University Diploma or equivalent -Overseas Institution 21.20 22.39 20.32
University Degree- Baccalaureate 23.61 26.29 20.58
University Degree- Masters' Level 39.91 50.74 14.65
University Doctoral . . .
Others 52.50 66.59 29.16
Government Organisation/Department 24.20 23.13 25.61
Parastatal Company 29.92 32.28 23.50
Publicly Listed Company 23.46 40.00 16.76
Private Company/Sole Trader 36.74 36.66 36.88
Commercial Partnership 21.06 23.26 17.39
Non-profit Organisation 10.14 7.68 20.00
Agriculture & Fishery . . .
Stone Quarrying & Construction 25.00 25.00 .
Governmental Services 26.20 24.46 28.02
Hotel & Catering 41.59 45.68 35.51
Services 28.39 31.61 21.24
Manufacturing 41.31 34.27 52.26
Full time 32.70 32.88 32.37
Ful time (reduced hours) 30.00 . 30.00
Part time 18.02 15.09 20.61
More than One Job 18.49 17.01 20.22
One Job Only 33.35 33.60 32.91
Casual 29.11 44.33 23.27
Permanent-Fixed Term Contract 58.56 57.23 59.61
Permanent-Indefinite Contract 28.14 28.87 26.38
Senior Managers, Directors 59.96 55.36 78.75
Professionals 36.30 45.33 27.17
Associate Professionals & Technical 18.01 13.75 25.00
Clerical employees 28.05 29.08 27.09
Skilled agriculture & fishery workers . . .
Crafts & related trades . . .
Plant & machine operator, assembly workers 33.06 36.00 27.00
Elementary occupations 23.07 20.73 33.33
Shop & Market services 20.86 18.25 24.13
OverallGender
Gender
Participant Age
Status
Caring Responsibilities at Home
Variety of Caring Responsibilities At
Home
How much time do you spend in
domestic work?
What is your highest qualification?
Describe the company where you are
employed
Sector of Activity
What is your present main job?
Are you engaged in more than one
job?What is the basis of your main job?
Your level of responsibility
36 The weighted mean monthly work related cost ranged between Lm 23.47 and Lm 39.51 at a 95% confidence interval.

Gender Pay Review
National Commission for the Promotion of Equality
Malta September 2006 page 194 of 327
5.5.3 Commissions & Bonuses
A total of 75 (or 12.8%) of the research participants claimed to receive other payments in the
form of performance bonuses and commissions. An analysis of the incidence of such receipts
across respondent groups is set out in Table 90, with the key observations relating to
statistically significant highest and lowest incidences set out in Table 89. Apart from other
statistically significant differences, noteworthy is the fact that women earn such additional
payments more often then their male counterparts.
Table 88 – Summary of Receipt of Additional Payments (Performance Bonuses & Commissions) Claimed by Respondents
75 12.8%
512 87.2%
587 100.0%
Yes
No
Total
Are you paid bonuses
related to performance?
Count Valid Percent
Yes
12.8%
No
87.2%
Table 89 – Summary of Analysis of Receipt of Additional Payments (Performance Bonuses & Commissions) Across Research Participant Groups
Most Common Incidence Least Common Incidence
Gender Women Men
Participant Age 25 to 34 years Younger than 24 years
Family Status No Significant Difference Between Groups
Caring Responsibilities at Home No Significant Difference Between Groups
Variety of Caring Responsibilities at home No Significant Difference Between Groups
Time devoted to Domestic Work No Significant Difference Between Groups
Highest Academic Qualifications University Diploma or University Master’s
Degree
University Baccalaureate Degree
Type of Employer Publicly Listed Company Government Organisation / Department
Sector of Activity Services Hotel & Catering or Government Services
Present Job Type No Significant Difference Between Groups
Engaged in more than one job No Significant Difference Between Groups
Basis of Main Job Permanent, Fixed-term contract Casual
Occupation Type (ISCO 1988) Senior Management Occupations Associate Professional & Technical Occ.

Gender Pay Review
National Commission for the Promotion of Equality
Malta September 2006 page 195 of 327
Table 90 – Analysis of Receipt of Additional Payments (Performance Bonuses & Commissions) Across Research Participant Groups
34 9.8% 314 90.2% 348 100.0%
41 17.2% 198 82.8% 239 100.0%
13 7.1% 170 92.9% 183 100.0%
29 18.5% 128 81.5% 157 100.0%
19 17.4% 90 82.6% 109 100.0%
10 10.4% 86 89.6% 96 100.0%
4 10.3% 35 89.7% 39 100.0%
39 13.7% 245 86.3% 284 100.0%
4 30.8% 9 69.2% 13 100.0%
0 .0% 2 100.0% 2 100.0%
25 10.0% 225 90.0% 250 100.0%
7 18.4% 31 81.6% 38 100.0%
36 16.0% 189 84.0% 225 100.0%
39 10.8% 323 89.2% 362 100.0%
26 15.3% 144 84.7% 170 100.0%
9 18.4% 40 81.6% 49 100.0%
1 20.0% 4 80.0% 5 100.0%
0 .0% 1 100.0% 1 100.0%
27 12.3% 193 87.7% 220 100.0%
29 14.3% 174 85.7% 203 100.0%
5 8.9% 51 91.1% 56 100.0%
4 13.3% 26 86.7% 30 100.0%
2 20.0% 8 80.0% 10 100.0%
2 8.7% 21 91.3% 23 100.0%
13 10.0% 117 90.0% 130 100.0%
14 9.3% 137 90.7% 151 100.0%
12 12.9% 81 87.1% 93 100.0%
7 12.3% 50 87.7% 57 100.0%
5 20.0% 20 80.0% 25 100.0%
9 32.1% 19 67.9% 28 100.0%
4 6.9% 54 93.1% 58 100.0%
8 29.6% 19 70.4% 27 100.0%
0 .0% 0 .0% 0 .0%
3 16.7% 15 83.3% 18 100.0%
5 3.9% 124 96.1% 129 100.0%
9 25.0% 27 75.0% 36 100.0%
15 40.5% 22 59.5% 37 100.0%
44 11.9% 326 88.1% 370 100.0%
2 25.0% 6 75.0% 8 100.0%
0 .0% 7 100.0% 7 100.0%
1 50.0% 1 50.0% 2 100.0%
0 .0% 16 100.0% 16 100.0%
8 6.3% 118 93.7% 126 100.0%
4 6.3% 59 93.7% 63 100.0%
51 21.3% 188 78.7% 239 100.0%
11 7.8% 130 92.2% 141 100.0%
67 13.6% 427 86.4% 494 100.0%
3 21.4% 11 78.6% 14 100.0%
5 6.3% 74 93.7% 79 100.0%
11 13.3% 72 86.7% 83 100.0%
64 12.7% 440 87.3% 504 100.0%
3 3.8% 76 96.2% 79 100.0%
9 17.0% 44 83.0% 53 100.0%
63 13.8% 392 86.2% 455 100.0%
11 25.0% 33 75.0% 44 100.0%
13 14.1% 79 85.9% 92 100.0%
3 4.8% 60 95.2% 63 100.0%
18 13.5% 115 86.5% 133 100.0%
0 .0% 0 .0% 0 .0%
0 .0% 8 100.0% 8 100.0%
5 8.8% 52 91.2% 57 100.0%
6 7.9% 70 92.1% 76 100.0%
19 16.7% 95 83.3% 114 100.0%
Male
Female
Gender
<24
25 - 34 years
35 - 44 years
45 - 54 years
55 +
Participant Age
Married or living with partner
Separated, not living with partner
Widowed, not living with partner
Not married, no partner with parents
Not married, not with partner, alone
Status
Yes
No
Caring Responsibilities
at Home
1
2
3
4
Variety of Caring
Responsibilities At
Home
<1hr
1 - 3 hrs
4 - 5 hrs
6 - 7 hrs
8 - 9 hrs
>9 hrs
How much time do you
spend in domestic
work?
Less than O- Level equivalent
O-Level
A-Level
Vocational Certification (City & Guilds or equivalent)
University Diploma or equivalent -Local
University Diploma or equivalent -Overseas Institution
University Degree- Baccalaureate
University Degree- Masters' Level
University Doctoral
Others
What is your highest
qualification?
Government Organisation/Department
Parastatal Company
Publicly Listed Company
Private Company/Sole Trader
Commercial Partnership
Non-profit Organisation
Describe the company
where you are
employed
Agriculture & Fishery
Stone Quarrying & Construction
Governmental Services
Hotel & Catering
Services
Manufacturing
Sector of Activity
Full time
Ful time (reduced hours)
Part time
What is your present
main job?
More than One Job
One Job Only
Are you engaged in
more than one job?
Casual
Permanent-Fixed Term Contract
Permanent-Indefinite Contract
What is the basis of
your main job?
Senior Managers, Directors
Professionals
Associate Professionals & Technical
Clerical employees
Skilled agriculture & fishery workers
Crafts & related trades
Plant & machine operator, assembly workers
Elementary occupations
Shop & Market services
Your level of
responsibility
N N %
Yes
N N %
No
N N %
Total
Are you paid bonuses related to performance?

Gender Pay Review
National Commission for the Promotion of Equality
Malta September 2006 page 196 of 327
Of the 75 such respondents who claimed to be entitled additional payments (performance
bonuses or commissions), 73 provided responses in respect to the types of such payments
entitled, as summarised in Table 91, showing how the most common of additional payments
involved performance bonuses and commissions (57.5% and 41.1% of participants entitled to
some form of additional payment as part of their working conditions). More significant is the
notion that performance bonuses were entitled to by a net 7.2% of research participants
while commissions were an entitlement among a net 5.1% of research participants.
Whilst an analysis of the incidence of such entitlements across participant groups did not
reveal many significant differences across respondent groups in respect to production
bonuses, one off bonuses and other forms of bonuses, some differences were apparent in
respect to commission and performance bonuses. Commissions were a relatively more
common entitlement among participants who were:
� women, or
� younger than 24 years, or
� single, or
� employed in private companies, or
� engaged with establishments operating in manufacturing and services.
Contrastingly, entitlement to performance bonuses featured a relative prevalence among
participants who:
� were men, or
� were 25 to 54 years old, or
� were married and/or living with a partner, or
� were employed with a parastatal or publicly listed employer, or
� were engaged with establishments operating in Governmental services or services sectors, or
� were employed on a full-time basis.

Gender Pay Review
National Commission for the Promotion of Equality
Malta September 2006 page 197 of 327
Table 91 – Summary of the Types of Performance Bonuses or Commissions Entitled by Research Participants
30 30.9% 41.1%
42 43.3% 57.5%
9 9.3% 12.3%
8 8.2% 11.0%
8 8.2% 11.0%
97 100.0% 132.9%
Commission
Performance Bonus (not statutory)
Production Bonus (not statutory)
One off Bonus (not statutory)
Others
Bonuses &
Commissions
Applicablea
Total
N Percent
Responses Percent of
Cases
a.
11.0 %
11.0 %
57.5 %
12.3 %
41.1 %
0 25 50
Commission
Performance Bonus (not statutory)
Production Bonus (not statutory)
One off Bonus (not statutory)
Others
% of Participants who earn additional payments (n = 73)

Gender Pay Review
National Commission for the Promotion of Equality
Malta September 2006 page 198 of 327
Table 92 – Analysis of Incidence of Entitlement of Bonuses & Commissions Across Research Participant Groups
10 24 4 3 3
20 18 5 5 5
8 4 2 3 2
9 18 4 4 4
9 12 2 1
3 6 2
1 2 1
13 25 2 2 3
2 2 1
11 11 5 4 3
4 4 1 2 2
13 21 2 2 3
17 21 7 6 5
10 12 2 1 3
2 8
1 1 1
10 14 1 3 3
12 18 2 3 2
3 3
2 1 1
1 1
1 1 1
6 2 2 1 2
8 6 4
4 8 1 2
5 3 1
2 5 1 2 1
2 6 2 3 1
1 3 1 1
1 7
1 2
1 2 1 1
3 7 1 2 2
2 14 1
22 18 8 5 4
2 1
1
1 5 1 2
2 2 1
21 30 6 7 5
6 5 2
25 42 8 6 8
1 2
4 1
2 6 2 1 2
28 36 7 7 6
2 1
6 2 1 1
22 40 9 6 7
1 10 1
5 11 2 2 2
1 1 1 1
5 10 2 3 2
1 3 1
2 1 2
17 8 1 1
Male
Female
Gender
<24
25 - 34 years
35 - 44 years
45 - 54 years
55 +
Participant Age
Married or living with partner
Separated, not living with partner
Not married, no partner with parents
Not married, not with partner, alone
Status
Yes
No
Caring Responsibilities
at Home
1
2
3
Variety of Caring
Responsibilities At
Home
<1hr
1 - 3 hrs
4 - 5 hrs
6 - 7 hrs
8 - 9 hrs
>9 hrs
How much time do you
spend in domestic
work?
Less than O- Level equivalent
O-Level
A-Level
Vocational Certification (City & Guilds or equivalent)
University Diploma or equivalent -Local
University Diploma or equivalent -Overseas Institution
University Degree- Baccalaureate
University Degree- Masters' Level
Others
What is your highest
qualification?
Government Organisation/Department
Parastatal Company
Publicly Listed Company
Private Company/Sole Trader
Commercial Partnership
Describe the company
where you are
employed
Agriculture & Fishery
Governmental Services
Hotel & Catering
Services
Manufacturing
Sector of Activity
Full time
Ful time (reduced hours)
Part time
What is your present
main job?
More than One Job
One Job Only
Are you engaged in
more than one job?
Casual
Permanent-Fixed Term Contract
Permanent-Indefinite Contract
What is the basis of
your main job?
Senior Managers, Directors
Professionals
Associate Professionals & Technical
Clerical employees
Plant & machine operator, assembly workers
Elementary occupations
Shop & Market services
Your level of
responsibility
Commission
Performance
Bonus (not
statutory)
Production
Bonus (not
statutory)
One off
Bonus (not
statutory)
Others
Bonuses & Commissions Applicable

Gender Pay Review
National Commission for the Promotion of Equality
Malta September 2006 page 199 of 327
Table 92 – Analysis of Incidence of Entitlement of Bonuses & Commissions Across Research Participant Groups (continued) (37)
30.3 72.7 12.1 9.1 9.1
50.0 45.0 12.5 12.5 12.5
61.5 30.8 15.4 23.1 15.4
32.1 64.3 14.3 14.3 14.3
47.4 63.2 10.5 5.3
33.3 66.7 22.2
25.0 50.0 25.0
34.2 65.8 5.3 5.3 7.9
50.0 50.0 25.0
45.8 45.8 20.8 16.7 12.5
57.1 57.1 14.3 28.6 28.6
37.1 60.0 5.7 5.7 8.6
44.7 55.3 18.4 15.8 13.2
40.0 48.0 8.0 4.0 12.0
22.2 88.9
100.0 100.0 100.0
38.5 53.8 3.8 11.5 11.5
41.4 62.1 6.9 10.3 6.9
60.0 60.0
66.7 33.3 33.3
50.0 50.0
50.0 50.0 50.0
50.0 16.7 16.7 8.3 16.7
61.5 46.2 30.8
33.3 66.7 8.3 16.7
71.4 42.9 14.3
40.0 100.0 20.0 40.0 20.0
22.2 66.7 22.2 33.3 11.1
25.0 75.0 25.0 25.0
12.5 87.5
33.3 66.7
20.0 40.0 20.0 20.0
33.3 77.8 11.1 22.2 22.2
13.3 93.3 6.7
52.4 42.9 19.0 11.9 9.5
100.0 50.0
100.0
12.5 62.5 12.5 25.0
50.0 50.0 25.0
42.9 61.2 12.2 14.3 10.2
54.5 45.5 18.2
37.9 63.6 12.1 9.1 12.1
33.3 66.7
100.0 25.0
18.2 54.5 18.2 9.1 18.2
45.2 58.1 11.3 11.3 9.7
66.7 33.3
75.0 25.0 12.5 12.5
35.5 64.5 14.5 9.7 11.3
10.0 100.0 10.0
38.5 84.6 15.4 15.4 15.4
33.3 33.3 33.3 33.3
27.8 55.6 11.1 16.7 11.1
20.0 60.0 20.0
40.0 20.0 40.0
89.5 42.1 5.3 5.3
R %Male
R %Female
Gender
R %<24
R %25 - 34 years
R %35 - 44 years
R %45 - 54 years
R %55 +
Participant Age
R %Married or living with partner
R %Separated, not living with partner
R %Not married, no partner with parents
R %Not married, not with partner, alone
Status
R %Yes
R %No
Caring Responsibilities
at Home
R %1
R %2
R %3
Variety of Caring
Responsibilities At
Home
R %<1hr
R %1 - 3 hrs
R %4 - 5 hrs
R %6 - 7 hrs
R %8 - 9 hrs
R %>9 hrs
How much time do you
spend in domestic
work?
R %Less than O- Level equivalent
R %O-Level
R %A-Level
R %Vocational Certification (City & Guilds or equivalent)
R %University Diploma or equivalent -Local
R %University Diploma or equivalent -Overseas Institution
R %University Degree- Baccalaureate
R %University Degree- Masters' Level
R %Others
What is your highest
qualification?
R %Government Organisation/Department
R %Parastatal Company
R %Publicly Listed Company
R %Private Company/Sole Trader
R %Commercial Partnership
Describe the company
where you are
employed
R %Agriculture & Fishery
R %Governmental Services
R %Hotel & Catering
R %Services
R %Manufacturing
Sector of Activity
R %Full time
R %Ful time (reduced hours)
R %Part time
What is your present
main job?
R %More than One Job
R %One Job Only
Are you engaged in
more than one job?
R %Casual
R %Permanent-Fixed Term Contract
R %Permanent-Indefinite Contract
What is the basis of
your main job?
R %Senior Managers, Directors
R %Professionals
R %Associate Professionals & Technical
R %Clerical employees
R %Plant & machine operator, assembly workers
R %Elementary occupations
R %Shop & Market services
Your level of
responsibility
Commission
Performance
Bonus (not
statutory)
Production
Bonus (not
statutory)
One off
Bonus (not
statutory)
Others
Bonuses & Commissions Applicable
37 Percentages relate to the number of participant with the same characteristics who claimed to incur expenses related to
work. Viz Table 90

Gender Pay Review
National Commission for the Promotion of Equality
Malta September 2006 page 200 of 327
Of the 73 who indicated their specific entitlement to different types of benefits, 62 indicated
the receipt of such benefits over the 12 months preceding the study (or an effective earning
rate of 84.9%). A summary of these responses is set out Table 93, showing parallel
proportions and findings as set out earlier.
Table 93 – Summary of Claimed Earned Bonuses & Commissions by Research Participants
25 30.5% 40.3%
34 41.5% 54.8%
7 8.5% 11.3%
8 9.8% 12.9%
8 9.8% 12.9%
82 100.0% 132.3%
Commission
Performance Bonus (not statutory)
Production Bonus (not statutory)
One off Bonus (not statutory)
Others
Bonuses &CommissionsReceived
a
Total
N Percent
Responses Percent of
Cases
Dichotomy group tabulated at value 1.a.
12.9 %
12.9 %
54.8 %
11.3 %
40.3 %
0 25 50
Commission
Performance Bonus (not statutory)
Production Bonus (not statutory)
One off Bonus (not statutory)
Others
% of Participants who received additional payments (n = 62)
Table 94 sets out a summary of the amounts declared by research participants received
monthly in the form of any of the commissions or bonuses mentioned earlier. Performance
bonuses featured the highest median (Lm 80 monthly) followed by commission (Lm 70
monthly). An analysis of these declared amounts across research participant groups is also
set out in Table 95, albeit no significant differences can be observed, largely because of the
small number of responses attained from research participants.
Table 94 – Summary of Claimed Benefits Received (Weighted Average, Monthly) by Research Participants
16 155.56 80.00 3.00 950.00
27 181.91 80.00 2.00 900.00
6 43.11 30.00 2.50 120.00
5 269.91 360.00 30.00 500.00
7 238.19 280.00 3.00 520.00
Commission (monthly estimate Lm)
Performance Bonus (not statutory) (monthly estimate Lm)
Production Bonus (not statutory) (monthly estimate Lm)
One off Bonus (not statutory) (monthly estimate Lm)
Others (monthly estimate Lm)
Valid N Mean Median Minimum Maximum

Gender Pay Review
National Commission for the Promotion of Equality
Malta September 2006 page 201 of 327
Table 95 – Analysis of Claimed Benefits Received (Weighted Average, Monthly) by Research Participants
203.47 144.77 46.18 232.75 164.61
121.35 242.28 36.13 295.97 270.15
93.45 11.76 120.00 248.60 367.06
188.53 257.24 20.90 282.85 172.74
87.25 230.96 30.00 . .
459.40 83.06 . . 280.00
70.00 60.00 . . .
197.12 195.38 40.00 30.00 323.21
58.61 20.00 . . .
. . . . .
163.04 43.97 53.06 248.60 411.94
51.22 346.12 3.00 348.09 24.52
191.17 178.56 40.00 30.00 323.21
121.81 187.79 43.83 304.99 205.78
86.04 118.85 40.00 30.00 323.21
567.55 238.16 . . .
150.00 . . . .
. . . . .
177.42 26.74 30.00 248.60 205.94
184.21 179.48 . 369.70 440.00
122.76 755.24 . . .
84.35 80.00 120.00 . .
200.00 20.00 . . .
. 658.00 40.00 . 400.00
98.02 20.00 40.00 360.00 280.00
96.60 30.71 62.02 . .
388.32 122.05 . 30.00 136.19
10.36 20.00 . . 440.00
96.41 50.78 3.00 36.00 3.00
25.00 323.40 2.50 369.70 300.00
200.00 2.00 . . 520.00
500.00 364.19 . . .
. . . . .
65.00 60.00 . . .
100.00 27.95 . 30.00 .
3.88 180.28 3.00 348.09 24.52
25.00 334.04 . . 400.00
169.24 91.57 50.19 248.60 366.71
252.22 . . . .
. . . . .
. . . . 280.00
. . . . .
100.00 187.52 . 500.00 35.00
98.56 60.00 120.00 . .
172.80 198.84 21.13 155.23 318.42
147.32 135.72 25.00 . .
171.27 181.91 22.27 282.85 238.19
30.00 . . 248.60 .
120.97 . 120.00 . .
37.14 138.80 2.50 . 169.46
167.17 190.58 47.61 269.91 276.61
5.00 . . 360.00 .
115.78 370.05 . 500.00 440.00
178.49 162.42 43.11 32.33 212.06
150.00 159.18 . . .
401.08 207.05 3.00 36.00 150.65
. 500.00 . 500.00 35.00
28.52 146.20 17.41 30.00 460.00
. . . . .
. . . . .
. 20.00 31.70 360.00 .
200.00 . . . 280.00
84.99 40.00 120.00 . 440.00
Male
Female
Gender
<24
25 - 34 years
35 - 44 years
45 - 54 years
55 +
Participant Age
Married or living with partner
Separated, not living with partner
Widowed, not living with partner
Not married, no partner with parents
Not married, not with partner, alone
Status
Yes
No
Caring Responsibilitiesat Home
1
2
3
4
Variety of CaringResponsibilities AtHome
<1hr
1 - 3 hrs
4 - 5 hrs
6 - 7 hrs
8 - 9 hrs
>9 hrs
How much time do youspend in domesticwork?
Less than O- Level equivalent
O-Level
A-Level
Vocational Certification (City & Guilds or equivalent)
University Diploma or equivalent -Local
University Diploma or equivalent -Overseas Institution
University Degree- Baccalaureate
University Degree- Masters' Level
University Doctoral
Others
What is your highestqualification?
Government Organisation/Department
Parastatal Company
Publicly Listed Company
Private Company/Sole Trader
Commercial Partnership
Non-profit Organisation
Describe the companywhere you areemployed
Agriculture & Fishery
Stone Quarrying & Construction
Governmental Services
Hotel & Catering
Services
Manufacturing
Sector of Activity
Full time
Ful time (reduced hours)
Part time
What is your presentmain job?
More than One Job
One Job Only
Are you engaged inmore than one job?
Casual
Permanent-Fixed Term Contract
Permanent-Indefinite Contract
What is the basis ofyour main job?
Senior Managers, Directors
Professionals
Associate Professionals & Technical
Clerical employees
Skilled agriculture & fishery workers
Crafts & related trades
Plant & machine operator, assembly workers
Elementary occupations
Shop & Market services
Your level of
responsibility
Mean
Commission
(monthly
estimate Lm)
Mean
Performance
Bonus (not
statutory)
(monthly
estimate Lm)
Mean
Production
Bonus (not
statutory)
(monthly
estimate Lm)
Mean
One off
Bonus
(not
statutory)
(monthly
estimate
Lm)
Mean
Others
(monthly
estimate
Lm)

Gender Pay Review
National Commission for the Promotion of Equality
Malta September 2006 page 202 of 327
5.5.4 Total Earnings
The total earnings realised by each research participant were computed on a case-by-case
basis involving the following process:
� Multiplying the earned gross monthly pay by twelve to attain a gross annual figure;
� Dividing the estimated gross annual pay by 52 weeks and dividing the result by the number of
claimed hours that the research participant has to work as a minimum weekly, obtaining the
gross hourly rate earned by the research participant;
� Multiplying the minimum number of hours required to be worked weekly as stated by the
research participant and multiplied by 52 to annualise the number of such hours (38)
� Multiplying the effective annual number overtime hours with the overtime rate and hourly gross
pay to attain an estimated annual OT pay figure earned by research participant only if the
research participant is entitled to such payment;
� Multiplying the monthly average commissions and bonuses claimed to be earned by the research
participant by 12 to obtain an annual figure for such earnings for each research participant;
� Summing the totals in (L) (L) and (L) above to estimate the total annual gross earnings
claimed by research participants.
This approach does not consider other payments that may be provided by employers and
does not consider the net effect of costs incurred by research participants in the conduct of
their work, which may or may not be refunded by the employer. Equally significant is the
notion that this approach does not consider statutory bonuses.
Such earnings featured a weighted average of Lm 557.31 monthly (or a range between
Lm 524.46 and Lm 590.16 monthly at a 95% confidence interval). An analysis of such
estimates across participant groups is summarised in Table 96, showing how such weighted
means varied across different employees as characterised by their employment and social
features.
38 This working involved a factoring related to the number of days available to the research participant in terms of vacation
and sickness leave – these being the most often days off availed by research participants.

Gender Pay Review
National Commission for the Promotion of Equality
Malta September 2006 page 203 of 327
Table 96 – Highlights from Analysis of Mean (Weighted) Estimated Gross Earnings (39) Across Research Participant Groups
Highest Mean (Weighted) Gross
Earnings
Lowest Mean (Weighted) Gross Earnings
Gender Men Women
Participant Age Between 25 and 34 years Younger than 24 years
Family Status No Statistically Significant Differences between Respondent Groups
Caring Responsibilities at Home With caring responsibilities at home Without caring responsibilities at home
Variety of Caring Responsibilities at home
(40)
One type Four types
Time devoted to Domestic Work (41) 1 to 3 hours daily 8 to 9 hours daily
Highest Academic Qualifications (42) University Master’s Degree Less than O Level equivalent
Type of Employer Publicly listed companies Private Companies
Sector of Activity No Statistically Significant Differences between Respondent Groups
Present Job Type Full-time Part-time
Engaged in more than one job No Statistically Significant Differences between the Respondent Groups
Basis of Main Job Permanent Fixed-term Contract Casual
Occupation Type (ISCO 1988) Senior Management Shop & Market Services Occupations
39 Inclusive of Overtime, Commissions & Performance Related Bonuses (where applicable) but exclusive of Statutory Bonuses
and effects of costs borne by employee (refunded or not) in the conduct of work.
40 Progressive decline in the weighted mean Gross Earnings with increasing variety of caring responsibilities
41 Progressive decline in the weighted mean Gross Earnings with increasing number of hours devoted to domestic work
observed
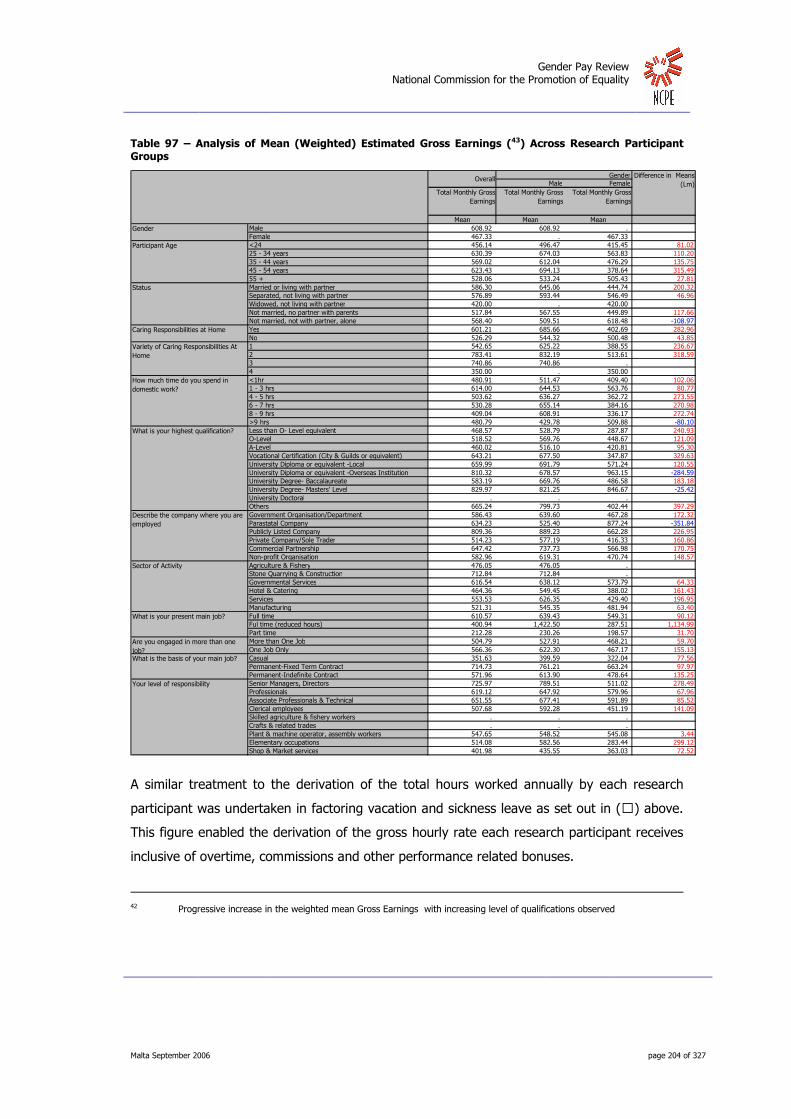
Gender Pay Review
National Commission for the Promotion of Equality
Malta September 2006 page 204 of 327
Table 97 – Analysis of Mean (Weighted) Estimated Gross Earnings (43) Across Research Participant Groups
Male Female
Total Monthly Gross
Earnings
Total Monthly Gross
Earnings
Total Monthly Gross
Earnings
Mean Mean MeanMale 608.92 608.92 .Female 467.33 . 467.33 <24 456.14 496.47 415.45 81.0225 - 34 years 630.39 674.03 563.83 110.2035 - 44 years 569.02 612.04 476.29 135.7545 - 54 years 623.43 694.13 378.64 315.4955 + 528.06 533.24 505.43 27.81Married or living with partner 586.30 645.06 444.74 200.32Separated, not living with partner 576.89 593.44 546.49 46.96Widowed, not living with partner 420.00 . 420.00 Not married, no partner with parents 517.84 567.55 449.89 117.66Not married, not with partner, alone 568.40 509.51 618.48 -108.97Yes 601.21 685.66 402.69 282.96No 526.29 544.32 500.48 43.851 542.65 625.22 388.55 236.672 783.41 832.19 513.61 318.593 740.86 740.86 .4 350.00 . 350.00 <1hr 480.91 511.47 409.40 102.061 - 3 hrs 614.00 644.53 563.76 80.774 - 5 hrs 503.62 636.27 362.72 273.556 - 7 hrs 530.28 655.14 384.16 270.988 - 9 hrs 409.04 608.91 336.17 272.74>9 hrs 480.79 429.78 509.88 -80.10Less than O- Level equivalent 468.57 528.79 287.87 240.93O-Level 518.52 569.76 448.67 121.09A-Level 460.02 516.10 420.81 95.30Vocational Certification (City & Guilds or equivalent) 643.21 677.50 347.87 329.63University Diploma or equivalent -Local 659.99 691.79 571.24 120.55University Diploma or equivalent -Overseas Institution 810.32 678.57 963.15 -284.59University Degree- Baccalaureate 583.19 669.76 486.58 183.18University Degree- Masters' Level 829.97 821.25 846.67 -25.42University Doctoral . . .Others 665.24 799.73 402.44 397.29Government Organisation/Department 586.43 639.60 467.28 172.32Parastatal Company 634.23 525.40 877.24 -351.84Publicly Listed Company 809.36 889.23 662.28 226.95Private Company/Sole Trader 514.23 577.19 416.33 160.86Commercial Partnership 647.42 737.73 566.98 170.75Non-profit Organisation 582.96 619.31 470.74 148.57Agriculture & Fishery 476.05 476.05 .Stone Quarrying & Construction 712.84 712.84 .Governmental Services 616.54 638.12 573.79 64.33Hotel & Catering 464.36 549.45 388.02 161.43Services 553.53 626.35 429.40 196.95Manufacturing 521.31 545.35 481.94 63.40Full time 610.57 639.43 549.31 90.12Ful time (reduced hours) 400.94 1,422.50 287.51 1,134.99Part time 212.28 230.26 198.57 31.70More than One Job 504.79 527.91 468.21 59.70One Job Only 566.36 622.30 467.17 155.13Casual 351.63 399.59 322.04 77.56Permanent-Fixed Term Contract 714.73 761.21 663.24 97.97Permanent-Indefinite Contract 571.96 613.90 478.64 135.25Senior Managers, Directors 725.97 789.51 511.02 278.49Professionals 619.12 647.92 579.96 67.96Associate Professionals & Technical 651.55 677.41 591.89 85.52Clerical employees 507.68 592.28 451.19 141.09Skilled agriculture & fishery workers . . .Crafts & related trades . . .Plant & machine operator, assembly workers 547.65 548.52 545.08 3.44Elementary occupations 514.08 582.56 283.44 299.12Shop & Market services 401.98 435.55 363.03 72.52
Your level of responsibility
Sector of Activity
What is your present main job?
Are you engaged in more than one
job?What is the basis of your main job?
Variety of Caring Responsibilities At
Home
How much time do you spend in
domestic work?
What is your highest qualification?
Describe the company where you are
employed
Gender
Participant Age
Status
Caring Responsibilities at Home
OverallGender Difference in Means
(Lm)
A similar treatment to the derivation of the total hours worked annually by each research
participant was undertaken in factoring vacation and sickness leave as set out in (L) above.
This figure enabled the derivation of the gross hourly rate each research participant receives
inclusive of overtime, commissions and other performance related bonuses.
42 Progressive increase in the weighted mean Gross Earnings with increasing level of qualifications observed

Gender Pay Review
National Commission for the Promotion of Equality
Malta September 2006 page 205 of 327
Such hourly earnings featured a weighted average of Lm 3.09 (or a range between Lm 2.92
and Lm 3.26 at a 95% confidence interval). An analysis of such hourly rate estimates across
participant groups is summarised in Table 98, showing how such weighted means varied
across different employees as characterised by their employment and social features.
Differences between groups largely followed the same patterns as established in the analysis
for the weighted gross annual earnings above, showing how men typically earned a higher
estimated hourly rate than their female counterparts overall with some rare exceptions.
Table 98 – Highlights from Analysis of Mean (Weighted) Estimated Hourly Earnings (44) Across Research Participant Groups (Based on Table 99)
Highest Mean (Weighted) Gross Hourly
Earnings
Lowest Mean (Weighted) Gross Hourly
Earnings
Gender Men Women
Participant Age (45) 55 years and older Younger than 24 years
Family Status No Statistically Significant Differences between Respondent Groups
Caring Responsibilities at Home No Statistically Significant Differences between Respondent Groups
Variety of Caring Responsibilities at home Two types One type
Time devoted to Domestic Work 6 to 7 hours daily 1 hour or less daily
Highest Academic Qualifications (46) University Master’s Degree Less than O Level equivalent
Type of Employer Publicly listed companies Private Companies
Sector of Activity Governmental Services Manufacturing
Present Job Type No Statistically Significant Differences between Respondent Groups
Engaged in more than one job No Statistically Significant Differences between the Respondent Groups
Basis of Main Job Permanent Fixed-term Contract Casual
Occupation Type (ISCO 1988) Professional Occupations Shop & Market Services Occupations
43 Inclusive of Overtime, Commissions & Performance Related Bonuses (where applicable) but exclusive of Statutory Bonuses
and effects of costs borne by employee (refunded or not) in the conduct of work.
44 Inclusive of Overtime, Commissions & Performance Related Bonuses (where applicable) but exclusive of Statutory Bonuses
and effects of costs borne by employee (refunded or not) in the conduct of work.
45 Progressive increase in the weighted mean gross hourly earnings with increasing age of respondent

Gender Pay Review
National Commission for the Promotion of Equality
Malta September 2006 page 206 of 327
Table 99 – Analysis of Mean (Weighted) Estimated Gross Hourly Earnings (47) Across Research Participant Groups
Male Female
Total Gross Earnings
Per Hour
Total Gross Earnings
Per Hour
Total Gross Earnings
Per Hour
Mean Mean MeanMale 3.26 3.26 .Female 2.79 . 2.79 <24 2.72 2.96 2.49 0.4825 - 34 years 3.33 3.35 3.31 0.0435 - 44 years 3.09 3.20 2.84 0.3645 - 54 years 3.25 3.49 2.41 1.0855 + 3.40 3.43 3.25 0.18Married or living with partner 3.23 3.41 2.78 0.63Separated, not living with partner 3.68 3.01 4.93 -1.92Widowed, not living with partner 2.84 . 2.84 Not married, no partner with parents 2.91 3.13 2.60 0.54Not married, not with partner, alone 2.94 2.65 3.17 -0.52Yes 3.24 3.49 2.64 0.85No 2.98 3.07 2.86 0.211 2.98 3.26 2.47 0.782 4.01 4.02 3.98 0.043 3.88 3.88 .4 2.02 . 2.02 <1hr 2.74 2.87 2.44 0.431 - 3 hrs 3.26 3.37 3.08 0.294 - 5 hrs 2.98 3.37 2.57 0.806 - 7 hrs 4.08 4.88 3.19 1.698 - 9 hrs 2.72 4.39 2.10 2.29>9 hrs 2.91 2.67 3.04 -0.37Less than O- Level equivalent 2.64 2.87 1.96 0.90O-Level 3.07 3.25 2.81 0.44A-Level 2.87 3.03 2.76 0.27Vocational Certification (City & Guilds or equivalent) 3.14 3.23 2.32 0.91University Diploma or equivalent -Local 3.37 3.47 3.10 0.37University Diploma or equivalent -Overseas Institution 4.17 3.71 4.72 -1.01University Degree- Baccalaureate 3.16 3.60 2.67 0.93University Degree- Masters' Level 4.26 4.36 4.06 0.29University Doctoral . . .Others 3.51 4.05 2.46 1.59Government Organisation/Department 3.33 3.49 2.98 0.51Parastatal Company 3.44 2.97 4.55 -1.58Publicly Listed Company 4.20 4.51 3.64 0.87Private Company/Sole Trader 2.86 3.08 2.51 0.57Commercial Partnership 3.34 3.59 3.11 0.48Non-profit Organisation 3.21 3.31 2.92 0.38Agriculture & Fishery 2.17 2.17 .Stone Quarrying & Construction 3.38 3.38 .Governmental Services 3.45 3.51 3.33 0.18Hotel & Catering 3.01 3.87 2.23 1.63Services 3.02 3.12 2.84 0.28Manufacturing 2.86 3.05 2.55 0.51Full time 3.15 3.24 2.96 0.28Ful time (reduced hours) 2.89 6.86 2.45 4.41Part time 2.72 3.40 2.21 1.19More than One Job 2.78 2.88 2.63 0.26One Job Only 3.14 3.33 2.82 0.51Casual 2.61 2.84 2.47 0.36Permanent-Fixed Term Contract 3.58 3.41 3.77 -0.36Permanent-Indefinite Contract 3.11 3.29 2.71 0.58Senior Managers, Directors 3.60 3.89 2.64 1.24Professionals 3.71 3.87 3.49 0.38Associate Professionals & Technical 3.39 3.53 3.08 0.45Clerical employees 3.11 3.18 3.07 0.10Skilled agriculture & fishery workers . . .Crafts & related trades . . .Plant & machine operator, assembly workers 3.01 3.08 2.82 0.26Elementary occupations 2.55 2.72 1.96 0.76Shop & Market services 2.53 2.79 2.23 0.56
Your level of responsibility
Sector of Activity
What is your present main job?
Are you engaged in more than one
job?What is the basis of your main job?
Variety of Caring Responsibilities At
Home
How much time do you spend in
domestic work?
What is your highest qualification?
Describe the company where you are
employed
Gender
Participant Age
Status
Caring Responsibilities at Home
OverallGender Difference in Means
(Lm)
46 Progressive increase in the weighted mean gross hourly earnings with increasing level of qualifications observed
47 Inclusive of Overtime, Commissions & Performance Related Bonuses (where applicable) but exclusive of Statutory Bonuses
and effects of costs borne by employee (refunded or not) in the conduct of work.

Gender Pay Review
National Commission for the Promotion of Equality
Malta September 2006 page 207 of 327
5.6 Pay Structure & Advancement
5.6.1 Pay Negotiation
A total of 78.3% of respondents stated that their pay conditions and structure were found as
standard, contrasting against the situation pertaining to 21.7% of respondents who
negotiated their pay upon starting their present employment. Of the negotiated pay
structures, 64% were ‘imposed’ by the employer, while 22.2% were negotiated by the
relevant trade union.
An analysis of the negotiated pay structures is set out in Table 101, showing how employer
imposed structures prevailed among private employers, while union negotiated packages
were a more common feature among Governmental and parastatal employers.
Table 100 – Summary of Pay Negotiation
127 21.7%
459 78.3%
Negotiated
Found as a Standard
Was pay negotiated orfound as a standard?
Count Valid Percent
Standardised
16 12.9%
15 11.8%
4 3.2%
5 3.8%
31 24.8%
54 43.4%
Public Sector
Collective agreement-Public Sector
Wage remuneration Order
Industry Standard
Employer Fixed Scales
Others
Which systembest describesyour paymentsystem?
N N %
Negotiated
3 .6%
289 64.0%
100 22.2%
59 13.1%
Worker
Employer
Union
Others
By whomwas itnegotiated?
N N %

Gender Pay Review
National Commission for the Promotion of Equality
Malta September 2006 page 208 of 327
Table 101 – Analysis of Negotiated Pay Structures Across Respondent Groups
1 .4% 169 60.2% 71 25.4% 39 14.0% 280 100.0%
2 1.0% 120 70.2% 29 17.0% 20 11.7% 171 100.0%
2 1.4% 134 87.5% 9 5.8% 8 5.2% 153 100.0%
1 .6% 60 55.0% 33 30.3% 15 14.1% 109 100.0%
0 .0% 40 46.6% 27 31.1% 19 22.3% 87 100.0%
0 .0% 37 53.9% 20 28.7% 12 17.4% 68 100.0%
0 .0% 15 48.2% 12 37.0% 5 14.8% 31 100.0%
0 .0% 109 52.1% 63 29.9% 38 18.1% 209 100.0%
0 .0% 5 53.2% 1 8.5% 4 38.3% 10 100.0%
0 .0% 0 .0% 1 100.0% 0 .0% 1 100.0%
3 1.4% 153 76.1% 28 14.1% 17 8.4% 201 100.0%
0 .0% 22 72.1% 8 25.2% 1 2.7% 31 100.0%
0 .0% 91 52.5% 55 31.6% 27 15.8% 173 100.0%
3 1.0% 198 71.2% 46 16.4% 32 11.4% 278 100.0%
0 .0% 65 51.5% 40 31.7% 21 16.8% 127 100.0%
0 .0% 24 54.7% 14 31.5% 6 13.8% 44 100.0%
0 .0% 1 60.1% 1 39.9% 0 .0% 1 100.0%
0 .0% 1 100.0% 0 .0% 0 .0% 1 100.0%
3 1.6% 120 69.0% 31 18.0% 20 11.3% 174 100.0%
0 .0% 95 62.0% 35 23.2% 23 14.8% 153 100.0%
0 .0% 29 69.8% 9 21.8% 3 8.4% 41 100.0%
0 .0% 12 55.9% 5 22.9% 4 21.2% 21 100.0%
0 .0% 4 47.8% 4 42.9% 1 9.2% 8 100.0%
0 .0% 8 39.4% 6 31.2% 6 29.4% 19 100.0%
1 1.0% 73 63.0% 23 20.1% 18 15.9% 115 100.0%
2 1.5% 81 72.4% 24 21.4% 5 4.7% 112 100.0%
0 .0% 48 73.5% 13 20.0% 4 6.5% 65 100.0%
0 .0% 32 70.7% 7 16.2% 6 13.0% 46 100.0%
0 .0% 9 71.3% 1 10.7% 2 18.0% 13 100.0%
0 .0% 7 37.0% 8 41.5% 4 21.4% 20 100.0%
0 .0% 25 63.5% 7 18.2% 7 18.3% 40 100.0%
0 .0% 7 31.4% 6 27.2% 9 41.4% 22 100.0%
0 .0% 0 .0% 0 .0% 0 .0% 0 .0%
0 .0% 6 33.7% 10 53.5% 2 12.8% 18 100.0%
0 .0% 29 27.2% 50 47.2% 27 25.6% 107 100.0%
0 .0% 9 30.6% 14 49.7% 6 19.6% 29 100.0%
0 .0% 18 63.0% 7 25.0% 3 12.0% 29 100.0%
3 1.0% 225 81.1% 27 9.7% 23 8.2% 278 100.0%
0 .0% 3 100.0% 0 .0% 0 .0% 3 100.0%
0 .0% 5 77.8% 1 22.2% 0 .0% 7 100.0%
0 .0% 0 .0% 0 .0% 2 100.0% 2 100.0%
1 67.8% 1 32.2% 0 .0% 0 .0% 2 100.0%
0 .0% 28 26.9% 50 48.0% 26 25.1% 104 100.0%
0 .0% 43 89.1% 2 3.6% 4 7.4% 48 100.0%
0 .0% 130 72.8% 30 16.7% 19 10.5% 179 100.0%
2 1.5% 87 75.3% 19 16.2% 8 7.1% 115 100.0%
3 .8% 223 58.8% 99 26.1% 54 14.3% 380 100.0%
0 .0% 9 93.1% 0 .0% 1 6.9% 10 100.0%
0 .0% 57 91.5% 1 1.6% 4 6.9% 62 100.0%
0 .0% 39 59.1% 15 22.4% 12 18.5% 66 100.0%
3 .7% 250 64.9% 85 22.2% 47 12.2% 385 100.0%
0 .0% 56 89.4% 3 4.2% 4 6.4% 63 100.0%
0 .0% 22 73.5% 5 16.3% 3 10.2% 30 100.0%
3 .8% 211 58.8% 93 25.9% 52 14.6% 358 100.0%
0 .0% 22 73.0% 4 13.5% 4 13.5% 31 100.0%
0 .0% 29 51.4% 14 25.0% 13 23.5% 56 100.0%
0 .0% 42 49.2% 28 33.2% 15 17.6% 85 100.0%
1 1.1% 42 69.1% 13 21.3% 5 8.6% 60 100.0%
0 .0% 0 .0% 0 .0% 0 .0% 0 .0%
0 .0% 0 .0% 0 .0% 0 .0% 0 .0%
1 1.8% 36 64.1% 14 25.0% 5 9.1% 57 100.0%
1 1.6% 39 53.2% 20 27.8% 13 17.4% 73 100.0%
0 .0% 79 88.3% 7 7.4% 4 4.3% 89 100.0%
Male
Female
Gender
<24
25 - 34 years
35 - 44 years
45 - 54 years
55 +
Participant Age
Married or living with partner
Separated, not living with partner
Widowed, not living with partner
Not married, no partner with parents
Not married, not with partner, alone
Status
Yes
No
Caring Responsibilitiesat Home
1
2
3
4
Variety of Caring
Responsibilities AtHome
<1hr
1 - 3 hrs
4 - 5 hrs
6 - 7 hrs
8 - 9 hrs
>9 hrs
How much time do youspend in domestic
work?
Less than O- Level equivalent
O-Level
A-Level
Vocational Certification (City & Guilds or equivalent)
University Diploma or equivalent -Local
University Diploma or equivalent -Overseas Institution
University Degree- Baccalaureate
University Degree- Masters' Level
University Doctoral
Others
What is your highestqualification?
Government Organisation/Department
Parastatal Company
Publicly Listed Company
Private Company/Sole Trader
Commercial Partnership
Non-profit Organisation
Describe the company
where you areemployed
Agriculture & Fishery
Stone Quarrying & Construction
Governmental Services
Hotel & Catering
Services
Manufacturing
Sector of Activity
Full time
Ful time (reduced hours)
Part time
What is your present
main job?
More than One Job
One Job Only
Are you engaged in
more than one job?
Casual
Permanent-Fixed Term Contract
Permanent-Indefinite Contract
What is the basis ofyour main job?
Senior Managers, Directors
Professionals
Associate Professionals & Technical
Clerical employees
Skilled agriculture & fishery workers
Crafts & related trades
Plant & machine operator, assembly workers
Elementary occupations
Shop & Market services
Your level ofresponsibility
N N %
Worker
N N %
Employer
N N %
Union
N N %
Others
N N %
Total
By whom was it negotiated or standardised?
5.6.2 Prospects for Better Pay
Research participants pointed at job commitment as the key feature linked to prospects of
better pay (Table 102). Contrastingly, the least important of factors is union negotiation. An
analysis of these responses across respondent groups showed some significant differences,
the more conspicuous being:

Gender Pay Review
National Commission for the Promotion of Equality
Malta September 2006 page 209 of 327
� A prevailing perception about job commitment with highest mean scores featuring among
participants who:
– were women, or
– were between 25 and 34 years old, or
– lived as singles, or
– had no caring responsibilities at home, or
– dedicated less than 1 hour daily for domestic work, or
– featured a University Degree, or
– worked with a publicly listed employer, or
– worked in the manufacturing sector, or
– were engaged in a full-time job.
� Contrastingly, respondents who least believed that union negotiation was important:
– were men, or
– were older than 55 years, or
– were Married and/or living with a partner, or
– had caring responsibilities at home, or
– dedicated more than 9 hours in domestic work daily, or
– featured a University Degree, or
– worked with a parastatal company or were engaged with a Governmental employer, or
– were engaged in a full-time job.

Gender Pay Review
National Commission for the Promotion of Equality
Malta September 2006 page 210 of 327
Table 102 – Analysis of Perceived Impact of Different Participant Characteristics
525 3.37
514 3.47
476 3.23
496 3.34
514 3.57
463 2.58
509 3.28
500 3.33
491 3.56
574 3.88
Further qualifications
Further training
More hours of work
Seniority
Performance
Union negotiation
Government increases for cost of living
Positive attitude towards work
Job Commitment
Others
Valid N Mean
3.37
3.47
3.23
3.34
3.57
2.58
3.28
3.33
3.56
3.88
1 2 3 4 5
Further qualifications
Further training
More hours of work
Seniority
Performance
Union negotiation
Government increases for cost of living
Positive attitude towards work
Job Commitment
Others
Not Important at All Very Important Indeed

Gender Pay Review
National Commission for the Promotion of Equality
Malta September 2006 page 211 of 327
Table 103 – Analysis of Perceived Impact of Different Participant Characteristics Across Participant Groups
3.35 3.48 3.14 3.35 3.51 2.73 3.27 3.34 3.55 4.28
3.40 3.47 3.37 3.33 3.66 2.37 3.28 3.33 3.56 3.30
3.30 3.55 3.32 3.59 3.64 2.47 3.13 3.39 3.65 4.25
3.54 3.59 3.55 3.42 3.75 2.70 3.40 3.47 3.73 4.52
3.40 3.44 2.71 3.17 3.22 2.43 3.27 3.03 3.22 2.07
3.06 3.22 3.20 3.12 3.51 2.65 3.28 3.45 3.54 5.04
3.65 3.23 3.14 2.65 3.56 3.00 3.31 3.08 3.29 2.00
3.28 3.35 3.11 3.15 3.53 2.66 3.28 3.34 3.47 4.10
3.10 2.89 3.00 1.75 3.60 2.44 3.60 2.89 3.30 1.92
3.50 3.50 3.00 5.00 2.50 2.50 5.00 2.50 3.00 2.00
3.45 3.60 3.38 3.54 3.60 2.52 3.26 3.36 3.66 4.05
3.51 3.69 3.22 3.71 3.69 2.50 3.16 3.30 3.58 2.00
3.32 3.29 3.20 3.23 3.48 2.67 3.26 3.28 3.42 3.73
3.40 3.58 3.25 3.41 3.63 2.53 3.29 3.37 3.64 3.98
3.37 3.21 3.21 3.13 3.38 2.74 3.23 3.26 3.34 3.12
3.10 3.48 3.14 3.58 3.74 2.54 3.39 3.41 3.71 6.13
3.20 3.80 3.00 3.20 3.60 1.75 2.60 2.60 2.80 2.00
5.00 5.00 5.00 . 5.00 . 5.00 5.00 5.00 2.00
3.31 3.57 3.38 3.45 3.57 2.55 3.42 3.40 3.65 4.31
3.59 3.39 3.01 3.32 3.62 2.61 3.22 3.36 3.57 2.02
3.22 3.46 3.20 3.16 3.53 2.51 3.13 3.22 3.43 1.96
2.75 3.25 3.73 3.00 3.38 2.39 3.18 3.04 3.52 1.97
2.57 4.00 3.25 3.33 3.57 2.71 3.29 3.00 3.00 2.00
3.56 3.28 2.47 2.94 3.39 2.88 3.44 3.39 3.32 6.35
3.09 3.27 3.41 3.20 3.44 2.61 3.42 3.14 3.47 2.01
3.38 3.70 3.30 3.44 3.70 2.54 3.17 3.45 3.77 6.04
3.24 3.48 3.14 3.17 3.56 2.45 3.23 3.41 3.49 4.21
3.58 3.69 3.33 3.57 3.64 2.78 3.38 3.50 3.46 5.67
3.39 3.13 3.11 2.70 2.65 2.10 2.80 2.63 2.64 2.00
3.58 3.42 3.13 3.26 3.68 2.59 3.08 3.25 3.52 1.89
3.56 3.24 2.53 3.88 3.73 2.41 3.41 3.48 3.70 3.76
3.28 3.54 3.23 3.24 3.77 3.05 3.29 3.56 4.00 1.93
. . . . . . . . . .
4.25 3.44 3.86 3.33 3.46 3.19 3.65 3.14 3.15 1.89
3.57 3.43 2.89 3.48 3.06 3.03 3.37 2.80 2.99 2.74
3.45 3.26 2.89 3.13 3.36 3.14 3.33 3.16 3.26 4.86
3.71 3.71 3.87 3.15 4.21 2.94 3.65 4.03 4.22 2.22
3.26 3.50 3.33 3.34 3.71 2.34 3.21 3.45 3.71 4.43
2.60 2.25 4.00 3.00 4.14 1.00 2.29 4.14 4.14 2.50
3.57 3.33 1.75 3.67 2.50 2.00 3.50 2.50 2.67 1.86
1.00 1.00 1.00 1.00 1.00 1.00 5.00 1.00 1.00 2.00
2.31 2.81 1.94 2.81 3.25 1.71 3.27 3.06 3.63 2.00
3.57 3.43 2.92 3.41 3.13 3.04 3.34 2.83 2.98 3.53
2.95 3.38 3.38 3.11 3.47 2.16 2.96 3.17 3.37 3.71
3.48 3.53 3.27 3.31 3.73 2.50 3.26 3.50 3.73 4.97
3.33 3.56 3.57 3.54 3.81 2.57 3.35 3.61 3.85 2.71
3.42 3.47 3.18 3.36 3.58 2.68 3.34 3.37 3.59 4.23
3.33 3.82 3.50 2.83 3.08 2.00 2.67 3.08 3.42 2.00
3.03 3.41 3.49 3.33 3.62 2.02 2.93 3.15 3.38 2.03
3.42 3.44 3.32 3.83 3.64 2.78 3.40 3.44 3.58 3.13
3.36 3.48 3.21 3.27 3.56 2.55 3.26 3.32 3.55 4.01
3.17 3.46 3.79 3.37 3.72 2.10 3.14 3.53 3.68 2.13
3.49 3.60 3.33 3.42 3.79 2.10 2.86 3.65 3.88 10.26
3.39 3.46 3.11 3.33 3.52 2.71 3.34 3.26 3.50 3.51
3.65 3.51 2.43 3.31 3.53 2.31 3.00 3.66 3.89 2.26
3.51 3.35 2.70 3.14 3.29 2.60 3.39 3.20 3.51 3.04
3.46 3.65 3.31 3.43 3.74 2.60 3.48 3.25 3.47 3.41
3.61 3.56 3.22 3.34 3.66 2.46 3.23 3.32 3.47 4.24
. . . . . . . . . .
2.50 4.13 4.00 3.75 3.86 3.00 3.25 4.17 4.50 2.50
3.45 3.78 3.24 3.50 3.32 3.00 3.49 3.17 3.51 1.96
3.00 3.00 3.39 3.24 3.32 2.84 3.15 3.06 3.38 8.61
3.05 3.44 3.66 3.44 3.85 2.33 3.21 3.57 3.68 2.94
Male
Female
Gender
<24
25 - 34 years
35 - 44 years
45 - 54 years
55 +
Participant Age
Married or living with partner
Separated, not living with
partner
Widowed, not living withpartner
Not married, no partner withparents
Not married, not with partner,
alone
Status
Yes
No
Caring Responsibilitiesat Home
1
2
3
4
Variety of CaringResponsibilities AtHome
<1hr
1 - 3 hrs
4 - 5 hrs
6 - 7 hrs
8 - 9 hrs
>9 hrs
How much time do youspend in domestic
work?
Less than O- Level equivalent
O-Level
A-Level
Vocational Certification (City &
Guilds or equivalent)
University Diploma or
equivalent -Local
University Diploma orequivalent -Overseas
Institution
University Degree-Baccalaureate
University Degree- Masters'Level
University Doctoral
Others
What is your highestqualification?
GovernmentOrganisation/Department
Parastatal Company
Publicly Listed Company
Private Company/Sole Trader
Commercial Partnership
Non-profit Organisation
Describe the companywhere you are
employed
Agriculture & Fishery
Stone Quarrying &
Construction
Governmental Services
Hotel & Catering
Services
Manufacturing
Sector of Activity
Full time
Ful time (reduced hours)
Part time
What is your present
main job?
More than One Job
One Job Only
Are you engaged in
more than one job?
Casual
Permanent-Fixed TermContract
Permanent-Indefinite Contract
What is the basis ofyour main job?
Senior Managers, Directors
Professionals
Associate Professionals &Technical
Clerical employees
Skilled agriculture & fisheryworkers
Crafts & related trades
Plant & machine operator,assembly workers
Elementary occupations
Shop & Market services
Your level ofresponsibility
Mean
Better pay =
further
qualifications
Mean
Better
pay =
further
training
Mean
Better
pay =
More
hours of
work
Mean
Better
pay =
Seniority
Mean
Better pay =
Performance
Mean
Better pay =
Union
negotiation
Mean
Better pay =
Government
increases for
cost of living
Mean
Better
pay =
Positive
attitude
towards
work
Mean
Better pay =
Job
Commitment
Mean
Others

Gender Pay Review
National Commission for the Promotion of Equality
Malta September 2006 page 212 of 327
5.6.3 Experienced Promotion
Only 28.3% of the research participants had actually experienced a promotion offer in their
job (Table 104). Such participants pointed at job commitment as a key impacting factor
(mean of 4.18 on a scale from 1 to 5 48), followed by performance (4.13). Contrastingly,
Government increases featured as the least considered reason for attaining a promotion as
set out in the summary in Table 105.
Table 104 – Summary of Experienced Promotion
165 28.3%
418 71.7%
Yes
No
Have you ever been offereda promotion?
N N %
Yes
28.3%
No
71.7%
Table 106 sets out an analysis of these responses across respondent groups, showing how
job commitment prevailed as a key factor (where highest mean scores were observed)
among participants who:
� were men, or
� were between 45 and 54 years old, or
� were married and/or living with a partner, or
� had caring responsibilities at home, or
� dedicated more than 9 hours to domestic work daily, or
� featured a University Degree, or
� occupied a full-time job.
Contrastingly, government increases scored lowest perceived impact among respondents
who:
� were men, or
48 1 = No Impact At All, 5 = Very High Impact

Gender Pay Review
National Commission for the Promotion of Equality
Malta September 2006 page 213 of 327
� were younger than 24 years, or
� were not married and lived as singles, or
� did not have caring responsibilities at home, or
� dedicated less than 1 hour for domestic work at home, or
� featured a University Degree, or
� worked for a parastatal organisation or
� was engaged in a full-time job.
Table 105 – Summary of Aspects that Impact on Employer in Offering a Promotion
2.80 138
2.90 135
2.84 140
4.13 148
1.71 114
2.32 125
1.77 117
3.96 136
4.18 142
4.00 31
Further Qualification
Further Training
Seniority
Performance
Government increase
More hours worked
Union Negotiation
Attitude towords work
Job Commitment
Others
Mean Valid N
Yes
Have you ever been
offered a promotion?
2.80
2.90
2.84
4.13
1.71
2.32
1.77
4.18
4.00
3.96
1 2 3 4 5
Further Qualification
Further Training
Seniority
Performance
Government increase
More hours worked
Union Negotiation
Attitude towords work
Job Commitment
Others
No Impact at All Very High Impact

Gender Pay Review
National Commission for the Promotion of Equality
Malta September 2006 page 214 of 327
Table 106 – Analysis of Factors affecting an Offer for Promotion Across Respondent Groups
2.91 2.85 3.01 4.14 1.83 2.31 1.89 3.95 4.15 4.12
2.62 3.02 2.53 4.04 1.63 2.39 1.67 3.91 4.16 3.00
2.78 3.08 2.65 4.04 1.92 2.50 1.88 3.70 4.19 3.50
2.98 3.15 2.98 3.94 1.84 2.67 1.61 3.89 4.04 4.17
3.17 3.25 2.97 4.36 1.85 2.14 2.20 4.21 4.33 3.60
2.07 1.96 2.79 4.21 1.29 1.82 1.67 4.15 4.46 4.43
2.80 2.40 2.60 3.80 1.63 2.00 2.00 3.11 3.10 4.00
2.79 2.86 2.88 4.36 1.60 2.13 1.79 4.11 4.23 3.81
1.75 1.33 3.00 1.67 1.67 1.67 1.67 3.00 3.00 .
. . . . . . . . . .
3.06 3.19 2.80 3.95 2.05 2.66 1.91 3.86 4.20 4.09
2.31 2.54 2.85 3.75 1.67 2.33 1.69 3.42 3.75 .
2.65 2.87 2.82 4.33 1.43 1.94 1.56 4.02 4.30 3.95
2.94 2.94 2.88 3.93 2.00 2.61 2.00 3.88 4.05 3.83
2.77 2.97 2.76 4.23 1.50 1.82 1.45 3.85 4.17 3.77
2.38 2.57 2.90 4.55 1.29 2.17 1.72 4.37 4.55 4.00
3.00 4.00 3.00 4.50 1.50 2.00 2.00 4.00 4.50 5.00
. . . . . . . . . .
3.16 3.12 3.00 4.25 1.88 2.81 1.74 4.31 4.49 3.90
2.70 2.76 2.62 4.06 1.70 2.04 1.91 3.75 3.85 4.50
2.69 2.83 3.00 4.23 1.20 1.60 1.40 4.00 4.42 2.33
2.14 2.00 3.00 3.78 1.86 2.00 2.43 3.00 3.43 4.00
. . . 1.00 . . . . . .
2.83 3.17 3.17 4.57 1.25 2.20 1.00 4.50 4.71 3.00
1.92 2.62 3.18 4.21 1.45 2.33 1.92 3.94 4.29 5.00
2.41 2.80 3.09 4.30 1.88 2.32 1.88 4.06 4.11 4.50
3.09 3.33 2.67 3.96 1.78 2.14 1.95 4.00 4.30 3.67
2.40 2.40 3.07 4.00 1.70 1.64 1.36 3.92 4.00 4.50
1.83 1.92 2.58 3.46 1.67 2.08 1.44 3.08 3.54 3.50
3.50 3.20 2.56 4.10 1.88 2.67 2.56 3.80 4.18 4.67
3.31 2.75 2.92 4.00 1.80 3.09 1.33 4.09 4.00 5.00
4.25 4.13 2.75 4.18 2.00 2.85 2.08 4.00 4.50 1.00
. . . . . . . . . .
2.60 2.40 1.80 4.83 1.20 1.80 1.33 4.50 4.50 4.00
2.83 2.64 2.82 3.83 1.50 1.84 2.05 3.50 3.79 4.11
2.92 2.85 2.75 3.50 2.00 1.70 2.11 3.18 3.50 3.67
3.59 2.94 2.56 4.14 1.56 2.71 1.94 4.17 4.32 2.00
2.66 2.99 2.90 4.22 1.87 2.46 1.72 4.06 4.29 4.18
1.00 1.00 3.00 5.00 1.00 1.00 1.00 5.00 5.00 .
3.50 4.50 4.50 4.50 1.00 4.00 1.00 5.00 4.50 .
. . . . . . . . . .
1.00 1.00 4.00 5.00 1.00 2.50 1.00 5.00 5.00 5.00
2.91 2.61 2.78 3.84 1.61 2.05 2.19 3.45 3.80 4.11
2.27 2.70 2.58 4.38 1.30 1.90 1.22 4.08 4.38 4.67
2.97 3.02 2.91 4.03 1.79 2.37 1.77 3.95 4.22 3.60
2.70 3.05 2.82 4.27 1.97 2.53 1.86 4.08 4.16 3.75
2.85 2.94 2.82 4.12 1.78 2.37 1.84 3.91 4.15 4.00
1.33 1.33 2.00 3.67 1.67 1.00 2.33 3.67 3.67 .
2.67 2.89 3.60 4.09 1.63 2.30 1.38 4.30 4.40 2.50
3.18 2.95 3.00 4.43 2.11 2.58 2.16 4.25 4.33 4.14
2.74 2.90 2.83 4.05 1.70 2.29 1.75 3.88 4.13 3.84
2.69 3.69 3.14 4.80 1.54 3.15 1.42 4.71 4.79 3.67
1.91 2.45 2.50 3.69 1.70 2.60 1.90 4.00 4.09 1.00
2.91 2.86 2.86 4.06 1.80 2.21 1.86 3.84 4.09 4.04
2.79 2.78 2.94 4.23 1.67 2.28 1.94 4.15 4.48 4.00
2.90 2.93 2.63 3.75 1.67 2.09 2.20 3.65 3.82 3.00
2.45 2.67 2.84 4.40 1.60 2.18 1.27 3.89 4.11 4.60
3.03 3.11 2.54 3.93 1.75 2.18 1.68 3.78 3.93 3.67
. . . . . . . . . .
1.00 1.00 3.00 5.00 1.00 4.00 1.00 5.00 5.00 5.00
2.33 3.00 3.33 4.00 1.50 1.44 1.44 3.67 4.11 .
3.57 2.86 3.55 4.50 2.17 3.67 2.38 4.36 4.27 5.00
2.78 3.00 2.93 4.17 2.04 2.75 1.88 4.11 4.46 3.75
Male
Female
Gender
<24
25 - 34 years
35 - 44 years
45 - 54 years
55 +
Participant Age
Married or living with partner
Separated, not living withpartner
Widowed, not living withpartner
Not married, no partner withparents
Not married, not with partner,alone
Status
Yes
No
Caring Responsibilitiesat Home
1
2
3
4
Variety of CaringResponsibilities AtHome
<1hr
1 - 3 hrs
4 - 5 hrs
6 - 7 hrs
8 - 9 hrs
>9 hrs
How much time do you
spend in domesticwork?
Less than O- Level equivalent
O-Level
A-Level
Vocational Certification (City &Guilds or equivalent)
University Diploma orequivalent -Local
University Diploma orequivalent -OverseasInstitution
University Degree-Baccalaureate
University Degree- Masters'Level
University Doctoral
Others
What is your highestqualification?
GovernmentOrganisation/Department
Parastatal Company
Publicly Listed Company
Private Company/Sole Trader
Commercial Partnership
Non-profit Organisation
Describe the companywhere you are
employed
Agriculture & Fishery
Stone Quarrying &Construction
Governmental Services
Hotel & Catering
Services
Manufacturing
Sector of Activity
Full time
Ful time (reduced hours)
Part time
What is your presentmain job?
More than One Job
One Job Only
Are you engaged inmore than one job?
Casual
Permanent-Fixed TermContract
Permanent-Indefinite Contract
What is the basis ofyour main job?
Senior Managers, Directors
Professionals
Associate Professionals &Technical
Clerical employees
Skilled agriculture & fishery
workers
Crafts & related trades
Plant & machine operator,assembly workers
Elementary occupations
Shop & Market services
Your level ofresponsibility
Mean
Reason for
your
promotion -
Further
Qualification
Mean
Reason
for your
promotion
- Further
Training
Mean
Reason
for your
promotion
- Siniority
Mean
Reason for
your
promotion -
Performance
Mean
Reason for
your
promotion -
Government
increase
Mean
Reason
for your
promotion
- More
hours
worked
Mean
Reason for
your
promotion -
Union
Negotiation
Mean
Reason
for your
promotion
- Attitude
towords
work
Mean
Reason for
your
promotion -
Job
Commitment
Mean
Reason
for your
promotion
- Others

Gender Pay Review
National Commission for the Promotion of Equality
Malta September 2006 page 215 of 327
5.6.4 Declined Offers for Promotion
Of the respondents offered a promotion, 18.2% claimed to have declined such an offer for a
range of reasons, set out in Table 108. These responses suggest that the key deterrent to
accepting such an offer typically comprised the longer hours required in the job (43.3% of
respondents declining such an offer), followed by nature of tasks related to the job (36.7% of
respondents declining such an offer). An analysis of these responses across respondent
groups featured no significant differences across different respondent groups as defined by
their personal, job or contextual characteristics.
Table 107 – Summary of Responses: Declined Offers for Promotion
30 18.2%
135 81.8%
Yes
No
Have you ever declineda promotion offer
N N %
Yes
Have you ever been
offered a promotion?
Yes
18.2%
No
81.8%
Table 108 – Summary of Reasons for Declining an Offer for a Promotion
9 16.1% 30.0%
2 3.6% 6.7%
13 23.2% 43.3%
11 19.6% 36.7%
2 3.6% 6.7%
2 3.6% 6.7%
4 7.1% 13.3%
13 23.2% 43.3%
56 100.0% 186.7%
Added Responsibilities
New team member
Longer Hours
Nature of Task
New Location
Pressure from family/ friends
New Boss
Others
ReasonforDeclinedPromotionOffer
a
Total
N Percent
Responses Percent of
Cases
a.

Gender Pay Review
National Commission for the Promotion of Equality
Malta September 2006 page 216 of 327
5.6.5 Factors Perceived as Valued by Employers
A series of potential factors that may be considered by employers in providing a promotion or
further training to employees were tested for the perceived importance among research
participants who had been offered a promotion. A summary of the responses is set out in
Table 109, showing how commitment towards the job, positive attitude towards work and
communication skills were perceived as the top most important aspects considered by
employers in awarding promotions or providing training. Religion, social interests, nationality
and friends were considered as the least important aspects considered by employers in
deciding on a promotion of further training.
Table 109 – Summary of Perceived Importance of Different Factors in Giving Promotions or Training to Employees
26 4.23
24 2.58
25 3.32
27 4.52
27 4.67
23 1.70
22 2.77
22 2.14
20 1.80
19 1.47
19 2.37
19 1.37
20 1.45
21 1.43
24 3.79
24 3.75
25 3.44
24 3.83
24 4.25
1 5.00
Skills
Age
Qualifications
Positive attitude tovards work
Commitment towards job
Gender
Mind set / culture
Lifestyle of employee
Family status
Friends
Connections outside company
Religion
Nationality
Social interests
Innovation & Creativity
Logical reasoning skills
Friendly attitude with co-workers
Assertiveness
Communication Skills
Others
Valid N Mean
Legend:
1 = Not Important at all
5 = Very Important indeed
An analysis of these responses across respondent groups (Table 110) showed no significant
differences across such groups, owing to the small response attained in the study.

Gender Pay Review
National Commission for the Promotion of Equality
Malta September 2006 page 217 of 327
Table 110 – Analysis of Responses (Perceived Importance of Factors For Providing a Promotion) Across Respondent Groups
4.50 2.71 3.73 4.50 4.81 1.69 2.69 2.08 2.15 1.67 2.17 1.50 1.46 1.46 4.14 4.00 3.50 3.92 4.43 .
3.80 2.40 2.70 4.55 4.45 1.70 2.89 2.22 1.14 1.14 2.71 1.14 1.43 1.38 3.30 3.45 3.36 3.73 4.00 5.00
4.00 2.67 2.75 4.50 4.75 1.57 3.17 2.17 1.80 1.00 2.40 1.00 1.00 1.00 4.00 3.43 3.43 3.57 4.43 .
4.29 2.71 2.67 4.63 4.38 1.67 2.33 1.83 1.67 1.20 1.60 1.17 1.50 1.17 3.38 3.29 2.88 3.14 3.71 .
4.20 1.80 3.80 4.80 5.00 1.00 3.40 2.20 2.00 1.75 2.00 2.00 1.50 2.00 4.00 4.80 4.40 4.60 4.80 .
4.40 3.20 4.20 4.00 4.60 3.00 2.50 1.75 2.00 2.25 3.00 1.67 2.00 1.75 3.75 3.50 3.00 4.25 4.00 .
. . . . . . . . . . . . . . . . . . . .
4.25 2.60 3.47 4.50 4.56 1.57 2.71 1.71 1.77 1.62 1.92 1.50 1.46 1.57 3.47 3.57 3.33 3.71 4.13 .
. . . . . . . . . . . . . . . . . . . .
. . . . . . . . . . . . . . . . . . . .
4.20 2.56 3.10 4.55 4.82 1.89 2.88 2.88 1.86 1.17 3.33 1.14 1.43 1.14 4.33 4.00 3.60 4.00 4.44 5.00
. . . . . . . . . . . . . . . . . . . .
4.70 2.33 3.67 4.70 5.00 1.78 2.78 1.78 1.89 1.63 1.88 1.75 1.56 1.56 4.20 4.00 3.40 4.11 4.50 .
3.94 2.73 3.13 4.41 4.47 1.64 2.77 2.38 1.73 1.36 2.73 1.09 1.36 1.33 3.50 3.60 3.47 3.67 4.07 5.00
5.00 2.40 3.20 4.83 5.00 1.80 2.60 1.20 1.20 1.00 1.50 1.00 1.20 1.00 4.17 4.20 3.33 3.80 4.33 .
4.67 2.33 4.67 4.33 5.00 2.00 3.33 2.67 3.00 2.67 2.67 3.00 2.33 2.67 4.00 3.33 3.67 4.67 4.67 .
3.00 2.00 3.00 5.00 5.00 1.00 2.00 2.00 2.00 1.00 1.00 1.00 1.00 1.00 5.00 5.00 3.00 4.00 5.00 .
. . . . . . . . . . . . . . . . . . . .
4.09 2.91 3.36 4.50 4.75 1.50 2.78 2.56 2.44 1.89 3.11 1.67 1.56 1.67 4.30 4.09 4.00 4.27 4.70 5.00
4.14 2.17 3.29 4.29 4.43 1.17 2.50 1.67 1.40 1.00 1.50 1.00 1.00 1.33 3.17 3.50 2.50 3.67 4.00 .
5.00 2.25 3.50 5.00 5.00 1.75 3.00 1.00 1.00 1.00 1.50 1.00 1.25 1.00 5.00 4.00 3.50 3.75 4.00 .
5.00 . . 5.00 5.00 . . . . . . . . . 1.00 . 5.00 . 5.00 .
. 1.00 . . . . . . . . . . . . . . . . . .
3.00 3.00 1.00 4.00 4.00 1.00 1.00 1.00 1.00 1.00 1.00 1.00 1.00 1.00 1.00 1.00 1.00 1.00 3.00 .
5.00 5.00 3.00 5.00 5.00 . . . . . . . . . . . . . . .
3.50 2.60 2.75 4.50 3.75 1.75 2.00 1.75 2.25 1.50 1.75 1.50 1.50 1.50 2.25 2.50 2.50 2.75 3.50 5.00
4.40 2.00 3.40 4.20 5.00 1.20 2.20 2.40 1.25 1.00 3.67 1.00 1.00 1.00 3.60 3.40 2.60 4.40 4.80 .
4.00 3.00 4.00 3.50 4.00 3.50 1.50 1.50 1.50 2.50 3.50 1.00 2.00 1.50 4.00 4.50 3.00 4.00 3.50 .
3.00 2.33 2.33 4.00 4.67 1.00 3.33 1.67 2.67 1.00 1.67 1.00 1.00 1.67 4.33 4.00 3.67 3.00 4.00 .
5.00 . 5.00 5.00 5.00 5.00 5.00 5.00 . . . . . . 5.00 5.00 5.00 5.00 5.00 .
4.50 2.80 3.60 4.86 4.86 1.60 4.00 3.00 2.00 2.00 2.25 2.25 2.25 2.00 3.83 4.33 4.43 4.33 4.50 .
5.00 3.00 3.00 5.00 5.00 1.00 3.00 1.00 1.00 1.00 1.00 1.00 1.00 1.00 5.00 3.00 3.00 3.00 4.00 .
. . . . . . . . . . . . . . . . . . . .
5.00 1.00 3.00 5.00 5.00 1.00 2.00 1.00 1.00 1.00 4.00 1.00 1.00 1.00 5.00 5.00 4.00 5.00 5.00 .
5.00 1.00 5.00 5.00 5.00 1.00 5.00 1.00 1.00 1.00 1.00 1.00 1.00 1.00 5.00 5.00 5.00 5.00 5.00 .
. . . . . . . . . . . . . . . . . . . .
4.75 2.67 3.67 5.00 5.00 1.00 2.00 1.00 1.00 1.00 4.00 1.00 1.00 1.00 3.00 4.50 4.33 4.50 5.00 .
4.00 2.72 3.16 4.35 4.55 1.72 2.78 2.22 1.81 1.40 2.27 1.19 1.38 1.35 3.68 3.47 3.16 3.63 4.11 5.00
5.00 2.00 3.00 5.00 5.00 4.00 1.00 1.00 1.00 1.00 3.00 . 2.00 1.00 5.00 5.00 3.00 4.00 3.00 .
5.00 2.00 4.00 5.00 5.00 1.00 3.00 4.00 4.00 4.00 3.00 5.00 3.00 4.00 5.00 5.00 5.00 5.00 5.00 .
. . . . . . . . . . . . . . . . . . . .
. . . . . . . . . . . . . . . . . . . .
5.00 1.00 5.00 5.00 5.00 1.00 5.00 1.00 1.00 1.00 1.00 1.00 1.00 1.00 5.00 5.00 5.00 5.00 5.00 .
3.75 3.00 2.25 4.50 4.75 1.00 2.00 1.67 1.00 1.00 3.00 1.00 1.00 1.00 2.00 2.33 2.33 3.33 4.33 .
4.38 2.40 3.75 4.64 4.93 1.91 3.20 2.10 2.22 1.56 2.00 1.75 1.56 1.78 4.25 3.92 3.85 3.92 4.33 .
4.13 2.78 3.00 4.25 4.13 1.75 2.25 2.50 1.63 1.57 2.86 1.13 1.50 1.25 3.63 3.88 3.00 3.75 4.00 5.00
4.39 2.62 3.45 4.58 4.67 1.80 2.75 2.20 1.67 1.53 2.29 1.41 1.50 1.47 3.77 3.90 3.50 3.95 4.24 5.00
. . . . . . . . . . . . . . . . . . . .
3.00 2.33 2.33 4.00 4.67 1.00 3.00 1.50 3.00 1.00 3.00 1.00 1.00 1.00 4.00 2.67 3.00 3.00 4.33 .
4.67 3.20 3.00 4.86 4.86 1.75 3.75 2.25 1.25 1.25 2.50 1.25 1.75 1.25 3.83 4.40 4.33 4.40 4.40 .
4.10 2.42 3.40 4.40 4.60 1.68 2.56 2.11 1.94 1.53 2.33 1.40 1.38 1.47 3.78 3.58 3.16 3.68 4.21 5.00
2.50 2.50 1.00 3.50 4.50 1.00 3.00 1.50 3.00 1.00 3.00 1.00 1.00 1.00 4.00 2.00 2.50 2.50 4.00 .
4.00 3.50 3.00 4.67 4.67 2.50 2.00 2.00 2.50 2.00 2.50 2.00 2.00 2.00 1.67 2.50 3.67 3.00 4.33 .
4.43 2.50 3.57 4.59 4.68 1.68 2.83 2.22 1.56 1.47 2.27 1.33 1.44 1.41 4.11 4.05 3.50 4.05 4.26 5.00
4.20 2.20 3.60 4.80 5.00 1.00 3.50 2.00 2.00 1.75 2.00 2.00 1.50 2.25 4.75 4.75 4.25 4.50 4.75 .
4.43 3.00 4.14 4.25 4.63 2.50 3.33 2.33 1.40 1.80 2.20 1.20 1.80 1.40 4.14 3.29 3.14 3.71 3.83 .
5.00 3.00 2.00 4.75 5.00 1.33 2.67 2.00 1.33 1.00 2.50 1.00 1.00 1.00 3.75 5.00 3.75 4.67 5.00 5.00
4.50 2.50 3.25 4.75 4.00 1.75 1.50 2.50 1.00 1.00 3.00 1.00 1.33 1.00 3.00 4.00 3.50 3.75 3.50 .
. . . . . . . . . . . . . . . . . . . .
. . . . . . . . . . . . . . . . . . . .
4.00 2.00 4.00 5.00 5.00 1.00 3.00 2.00 3.00 1.00 1.00 1.00 1.00 1.00 4.00 4.00 3.00 4.00 5.00 .
4.00 4.00 5.00 5.00 5.00 4.00 3.00 3.00 4.00 3.00 4.00 3.00 3.00 3.00 3.00 4.00 5.00 5.00 5.00 .
3.00 2.20 2.00 4.00 4.50 1.00 2.33 1.33 2.33 1.00 2.33 1.00 1.00 1.00 3.00 2.25 2.50 2.50 4.00 .
Male
Female
Gender
<24
25 - 34 years
35 - 44 years
45 - 54 years
55 +
Participant Age
Married or living with partner
Separated, not living withpartner
Widowed, not living withpartner
Not married, no partner withparents
Not married, not with partner,alone
Status
Yes
No
Caring Responsibilitiesat Home
1
2
3
4
Variety of CaringResponsibilities AtHome
<1hr
1 - 3 hrs
4 - 5 hrs
6 - 7 hrs
8 - 9 hrs
>9 hrs
How much time do youspend in domesticwork?
Less than O- Level equivalent
O-Level
A-Level
Vocational Certification (City &Guilds or equivalent)
University Diploma orequivalent -Local
University Diploma orequivalent -OverseasInstitution
University Degree-Baccalaureate
University Degree- Masters'Level
University Doctoral
Others
What is your highestqualification?
GovernmentOrganisation/Department
Parastatal Company
Publicly Listed Company
Private Company/Sole Trader
Commercial Partnership
Non-profit Organisation
Describe the companywhere you areemployed
Agriculture & Fishery
Stone Quarrying &Construction
Governmental Services
Hotel & Catering
Services
Manufacturing
Sector of Activity
Full time
Ful time (reduced hours)
Part time
What is your presentmain job?
More than One Job
One Job Only
Are you engaged inmore than one job?
Casual
Permanent-Fixed TermContract
Permanent-Indefinite Contract
What is the basis ofyour main job?
Senior Managers, Directors
Professionals
Associate Professionals &Technical
Clerical employees
Skilled agriculture & fisheryworkers
Crafts & related trades
Plant & machine operator,assembly workers
Elementary occupations
Shop & Market services
Your level ofresponsibility
Mean
Important
factor -
Skills
Mean
Important
factor -
Age
Mean
Important
factor -
Qualifications
Mean
Important
factor -
Positive
attitude
tovards
work
Mean
Important
factor -
Commitment
towards job
Mean
Important
factor -
Gender
Mean
Important
factor -
Mind set /
culture
Mean
Important
factor -
Lifestyle
of
employee
Mean
Important
factor -
Family
status
Mean
Important
factor -
Friends
Mean
Important
factor -
Connections
outside
company
Mean
Important
factor -
Religion
Mean
Important
factor -
Nationality
Mean
Important
factor -
Social
interests
Mean
Important
factor -
Innovation &
Creativity
Mean
Important
factor -
Logical
reasoning
skills
Mean
Important
factor -
Friendly
attitude with
co-workers
Mean
Important
factor -
Assertiveness
Mean
Important
factor -
Communica
tion Skills
Mean
Others

Gender Pay Review
National Commission for the Promotion of Equality
Malta September 2006 page 218 of 327
5.6.6 Factors Catalysing a Promotion
Table 111 sets out a summary of the responses observed among research participants relating
to their perceptions about what factor may encourage their employer to award them a
promotion. Of these factors, job commitment featured as the strongest factor, followed by
performance and positive attitude towards work. These perceptions contrast against those held
about union negotiation and government increases, both considered as relatively weak
determinants.
Table 111 – Summary of Factors Perceived to Encourage an Employer in Awarding a Promotion to Research Participants
480 3.23
477 3.38
470 3.07
495 3.64
419 2.56
445 2.58
418 2.28
483 3.61
480 3.80
111 2.54
Further Qualifications
Further training
Seniority
Performance
Government increase
More hours of work
Union Negotiation
Positive attitude towards work
Job commitment
Others
Valid N Mean
Legend:
1 = Very Unlikely
5 = Very Likely Indeed
3.23
3.38
3.07
3.64
2.56
2.58
2.28
3.80
2.54
3.61
1 2 3 4 5
Further Qualifications
Further training
Seniority
Performance
Government increase
More hours of work
Union Negotiation
Positive attitude towards work
Job commitment
Others
Very Unlikely Very Likely Indeed

Gender Pay Review
National Commission for the Promotion of Equality
Malta September 2006 page 219 of 327
An analysis of the responses obtained is set out in Table 112 across different respondent
groups. More specifically, the responses related to job commitment featured highest mean
scores (49) among participants who:
� were younger than 24 years, or
� dedicated between 4 and 5 hours to domestic work at home, or
� had a vocational level of education, or
� worked for an establishment formed as a commercial partnership, or
� were engaged in a part-time job, or
� were employed on a Casual Basis.
Contrastingly, union negotiation featured the lowest mean scores among participants who:
� women, or
� younger than 24 years, or
� dedicated between 4 and 5 hours daily to domestic work, or
� featured University education, or
� worked with the private sector, or
� worked in the hotel & catering sector, or
� were engaged in a full-time job with reduced hours, or
� were employed in a casual job.
49 On a scale from 1 = Very Unlikely to 5 = Very Likely Indeed

Gender Pay Review
National Commission for the Promotion of Equality
Malta September 2006 page 220 of 327
Table 112 – Analysis of Reasons Considered to be Important in Awarding Promotions by Employers Across Respondent Groups
3.26 3.41 3.18 3.69 2.63 2.61 2.47 3.66 3.83 2.80
3.19 3.33 2.90 3.57 2.45 2.52 1.98 3.55 3.76 2.17
3.42 3.79 3.31 3.68 2.69 2.87 2.22 3.63 3.89 2.00
3.35 3.38 3.22 3.75 2.54 2.50 2.27 3.62 3.80 3.37
3.16 3.36 2.90 3.55 2.41 2.40 2.28 3.58 3.61 2.21
2.76 2.71 2.79 3.47 2.47 2.36 2.36 3.68 3.85 2.47
2.93 2.79 2.33 3.54 2.61 2.38 2.52 3.33 3.63 3.17
3.07 3.10 2.93 3.61 2.38 2.32 2.22 3.58 3.70 2.63
3.44 3.33 2.33 3.44 2.38 2.89 2.38 3.67 4.00 3.00
2.50 1.50 4.00 2.00 3.50 3.00 3.00 3.00 3.00 .
3.42 3.70 3.20 3.66 2.77 2.84 2.27 3.67 3.90 2.45
3.10 3.38 3.34 3.84 2.41 2.39 2.67 3.50 3.75 2.33
3.15 3.14 2.99 3.57 2.35 2.34 2.34 3.62 3.78 2.81
3.28 3.53 3.12 3.68 2.68 2.72 2.24 3.61 3.81 2.41
3.15 3.16 2.97 3.48 2.38 2.38 2.39 3.51 3.67 2.65
3.05 3.05 3.15 3.79 2.23 2.35 2.22 4.02 4.18 3.80
3.60 3.00 2.20 3.80 1.33 1.25 2.00 3.00 3.40 .
5.00 5.00 . 5.00 5.00 1.00 . 5.00 5.00 .
3.35 3.61 3.22 3.79 2.67 2.82 2.19 3.64 3.85 2.24
3.32 3.35 2.93 3.56 2.61 2.44 2.36 3.52 3.73 2.62
2.29 2.73 2.80 3.61 2.55 2.33 2.04 3.76 3.94 2.82
3.00 3.05 3.27 3.00 2.10 2.30 2.59 3.13 3.14 3.20
4.60 4.40 4.00 3.00 2.17 2.40 2.60 3.50 3.40 4.00
3.69 2.93 2.73 3.53 2.27 1.90 2.18 3.87 3.69 3.40
2.50 2.83 2.90 3.32 2.49 2.63 2.34 3.32 3.55 2.34
3.28 3.48 3.18 3.69 2.63 2.49 2.17 3.70 3.86 2.53
3.38 3.73 3.03 3.64 2.69 2.40 2.27 3.66 3.78 2.21
3.62 3.70 3.30 4.04 3.03 3.10 2.73 3.94 4.10 3.75
3.25 3.25 3.32 3.74 2.28 2.63 2.31 3.42 3.74 1.83
3.22 2.96 2.91 3.30 2.05 2.38 2.12 3.09 3.30 2.83
3.54 3.33 2.95 3.60 2.44 2.56 2.14 3.66 3.91 2.71
3.68 3.73 3.09 3.96 2.20 2.86 1.90 3.78 4.00 3.00
. . . . . . . . . .
3.75 3.59 3.06 3.94 2.36 2.08 2.44 4.19 4.19 5.00
3.51 3.34 3.17 3.26 2.64 2.05 2.80 3.46 3.59 3.21
3.34 3.21 2.90 3.55 2.71 2.05 2.85 3.63 3.82 3.60
3.44 3.63 3.27 4.06 2.52 2.32 2.25 3.79 3.84 2.45
3.10 3.39 3.03 3.73 2.54 2.79 2.03 3.64 3.86 2.17
2.00 2.50 3.00 4.75 1.67 3.75 1.00 4.75 4.75 1.00
3.60 4.00 3.00 3.25 2.00 2.67 2.33 3.50 3.50 3.00
1.00 1.00 1.00 3.00 1.00 1.00 1.00 3.00 4.00 1.00
2.36 2.29 2.43 3.13 1.86 1.71 1.36 2.73 3.13 1.00
3.52 3.38 3.13 3.30 2.65 2.01 2.76 3.48 3.59 3.15
3.13 3.52 3.17 3.64 2.02 2.47 2.08 3.27 3.74 1.67
3.20 3.34 3.04 3.80 2.57 2.80 2.19 3.74 3.93 2.65
3.16 3.55 3.10 3.77 2.81 2.91 2.18 3.82 3.90 2.67
3.33 3.39 3.03 3.64 2.54 2.52 2.34 3.64 3.78 2.76
2.00 2.42 2.33 3.08 2.09 2.08 1.60 3.33 3.83 1.00
2.86 3.50 3.47 3.75 2.76 3.00 1.98 3.52 3.89 1.64
3.44 3.52 3.08 3.48 2.78 2.58 2.41 3.63 3.80 2.92
3.20 3.36 3.07 3.66 2.52 2.57 2.26 3.61 3.80 2.49
3.13 3.59 3.34 3.74 2.64 3.09 1.75 3.70 4.05 1.94
3.29 3.41 2.93 3.72 2.38 2.75 2.19 4.12 4.15 1.92
3.24 3.34 3.04 3.61 2.56 2.46 2.38 3.55 3.72 2.76
3.55 3.24 2.65 3.97 2.32 2.39 1.89 3.71 4.03 3.00
3.39 3.26 2.89 3.45 2.42 2.47 2.35 3.44 3.83 2.00
3.08 3.46 3.14 3.90 2.63 2.43 2.26 3.82 4.02 3.77
3.53 3.52 3.05 3.59 2.73 2.40 2.25 3.58 3.70 2.32
. . . . . . . . . .
3.38 3.63 3.63 4.63 3.86 3.83 2.86 4.63 4.63 3.00
3.17 3.87 3.31 3.40 2.61 2.39 2.37 3.48 3.78 1.91
2.69 2.73 3.08 3.58 2.21 2.66 2.64 3.58 3.73 2.78
3.04 3.43 3.15 3.65 2.56 2.92 2.05 3.65 3.67 2.41
Male
Female
Gender
<24
25 - 34 years
35 - 44 years
45 - 54 years
55 +
Participant Age
Married or living with partner
Separated, not living withpartner
Widowed, not living withpartner
Not married, no partner withparents
Not married, not with partner,alone
Status
Yes
No
Caring Responsibilitiesat Home
1
2
3
4
Variety of CaringResponsibilities AtHome
<1hr
1 - 3 hrs
4 - 5 hrs
6 - 7 hrs
8 - 9 hrs
>9 hrs
How much time do youspend in domesticwork?
Less than O- Level equivalent
O-Level
A-Level
Vocational Certification (City &Guilds or equivalent)
University Diploma orequivalent -Local
University Diploma or
equivalent -OverseasInstitution
University Degree-Baccalaureate
University Degree- Masters'Level
University Doctoral
Others
What is your highestqualification?
GovernmentOrganisation/Department
Parastatal Company
Publicly Listed Company
Private Company/Sole Trader
Commercial Partnership
Non-profit Organisation
Describe the companywhere you areemployed
Agriculture & Fishery
Stone Quarrying &Construction
Governmental Services
Hotel & Catering
Services
Manufacturing
Sector of Activity
Full time
Ful time (reduced hours)
Part time
What is your presentmain job?
More than One Job
One Job Only
Are you engaged inmore than one job?
Casual
Permanent-Fixed TermContract
Permanent-Indefinite Contract
What is the basis ofyour main job?
Senior Managers, Directors
Professionals
Associate Professionals &Technical
Clerical employees
Skilled agriculture & fisheryworkers
Crafts & related trades
Plant & machine operator,assembly workers
Elementary occupations
Shop & Market services
Your level ofresponsibility
Mean
Consideration
- Further
Qualifications
Mean
Consideration
- Further
training
Mean
Consideration
- Seniority
Mean
Consideration
- Performance
Mean
Consideration
- Government
increase
Mean
Consideration
- More hours
of work
Mean
Consideration
- Union
Negotiation
Mean
Consideration
- Positive
attitude
towards work
Mean
Consideration
- Job
commitment
Mean
Others

Gender Pay Review
National Commission for the Promotion of Equality
Malta September 2006 page 221 of 327
5.6.7 Part-time Workers
A total of 59.7% of research participants believed that part-time workers do not have access to
training & promotion facilities as usually provided to full-time employees (Table 113). This
opinion was shared among 45.4% of male research participants and 37.7% of women
participating in the research.
Table 113 – Summary of Perceived Access to Training & Promotion to Part-time Employees
236 40.3%
349 59.7%
585 100.0%
Yes
No
Total
Do p/t workers haveaccess to training &promotion?
Count Valid Percent
14 4.0% 13 5.4%
176 50.6% 136 56.9%
158 45.4% 90 37.7%
More
Equal
Less
Interest ofp/t's compared
to f/t's
N N %
Male
N N %
Female
Gender
Nevertheless, a significant 42.2% research participants believed that part-time employees
nurtured a lower interest to training when compared with their full-time counterparts, while
another 53.2% consider part-time employees equally interested in training as their full-time
counterparts.
Table 114 – Perceived Interest of Part-time Employees to Training among Research Participants
27 4.6%
312 53.2%
248 42.2%
587 100.0%
More
Equal
Less
Total
Interestof p/t'scomparedto f/t's
Count Valid Percent
Table 115 sets out a summary about how 50.6% research participants believed that part-time
workers were typically committed to their job as much as their full-time counterparts, while
another staggering 46.2% of research participants believed that part-time workers were less
committed to their job than their full-time counterparts were.

Gender Pay Review
National Commission for the Promotion of Equality
Malta September 2006 page 222 of 327
Table 115 – Summary of Responses: Perceived Commitment of Part-time Employees to their Job Across All Research Participants
19 3.2%
297 50.6%
271 46.2%
587 100.0%
More
Equal
Less
Total
Commitmentof p/t'scompared tof/t's
Count Valid Percent
5.7 Work At Home
A total of 13.5% of the research participants are able to carry out part of their work at home
(Table 116). An analysis of these responses (Table 118) working at home as part of the main
job was a more common incidence among:
� men, or
� participants married or living with a partner, or
� participants working with establishments operating in the services sector, or
� participants featuring a Diploma or University Degree, or
� participants engaged in a Professional occupation
Table 116 – Summary of Research Participants’ Ability to Work at Home as Part of Main Job
79 13.5%
508 86.5%
587 100.0%
Yes
No
Total
Can you work athome as part ofyour main job
Count Valid Percent
Table 117 sets out a summary of the number of weekly hours dedicated to work at home by
research participants, showing how 35.3% of participants devote between 5 and 10 hours to
work at home weekly. This is also the median number of hours devoted to work at home
weekly by the interviewed participants.
An analysis of these responses (Table 119) across research participant groups shows some
significant differences in the number of hours worked wherein:
� working up to 5 Hours weekly at home was more common among;
– men, or

Gender Pay Review
National Commission for the Promotion of Equality
Malta September 2006 page 223 of 327
– participants aged between 25 and 34 years, or
– participants who did not having caring responsibilities at home, or
– workers engaged with the services sector, or
– workers featuring a University Degree or Diploma, or
– workers engaged in a professional occupation, or
– workers engaged in full time jobs, or
– workers engaged in permanent contracts of work.
� working between 5 and 10 hours weekly at home was a more common incidence among;
– men, or
– participants aged between 35 and 44 years, or
– participants who were married or living with partner, or
– workers engaged within the services sector, or
– workers featuring Post Graduate level of education, or
– workers engaged in full time jobs, or
– workers engaged in permanent contracts of work.
Table 117 – Summary of Responses Related to Hours per Week Dedicated to Work at Home
10 29.4%
12 35.3%
1 2.9%
4 11.8%
7 20.6%
34 100.0%
0 to 5 hrs
5 to 10 hrs
10 to 15 hrs
15 to 20 hrs
20 + hrs
Total
Hours per
weekdedicated
to work athome
Count Valid Percent

Gender Pay Review
National Commission for the Promotion of Equality
Malta September 2006 page 224 of 327
Table 118 – Analysis of Research Participants’ Ability to Work at Home as Part of Main Job Across Respondent Groups
51 14.7% 297 85.3% 348 100.0%
28 11.7% 211 88.3% 239 100.0%
11 6.0% 172 94.0% 183 100.0%
25 15.9% 132 84.1% 157 100.0%
19 17.4% 90 82.6% 109 100.0%
18 18.8% 78 81.3% 96 100.0%
5 12.8% 34 87.2% 39 100.0%
49 17.3% 235 82.7% 284 100.0%
1 7.7% 12 92.3% 13 100.0%
0 .0% 2 100.0% 2 100.0%
25 10.0% 225 90.0% 250 100.0%
4 10.5% 34 89.5% 38 100.0%
37 16.4% 188 83.6% 225 100.0%
42 11.6% 320 88.4% 362 100.0%
0 .0% 2 100.0% 2 100.0%
3 18.8% 13 81.3% 16 100.0%
20 15.9% 106 84.1% 126 100.0%
2 3.2% 61 96.8% 63 100.0%
41 17.2% 198 82.8% 239 100.0%
13 9.2% 128 90.8% 141 100.0%
0 .0% 27 100.0% 27 100.0%
16 7.2% 207 92.8% 223 100.0%
2 6.5% 29 93.5% 31 100.0%
15 12.7% 103 87.3% 118 100.0%
2 4.3% 45 95.7% 47 100.0%
28 27.7% 73 72.3% 101 100.0%
16 41.0% 23 59.0% 39 100.0%
16 36.4% 28 63.6% 44 100.0%
25 27.2% 67 72.8% 92 100.0%
16 25.4% 47 74.6% 63 100.0%
12 9.0% 121 91.0% 133 100.0%
0 .0% 0 .0% 0 .0%
0 .0% 8 100.0% 8 100.0%
3 5.3% 54 94.7% 57 100.0%
2 2.6% 74 97.4% 76 100.0%
5 4.4% 109 95.6% 114 100.0%
5 6.3% 74 93.7% 79 100.0%
6 11.3% 47 88.7% 53 100.0%
68 14.9% 387 85.1% 455 100.0%
73 14.8% 421 85.2% 494 100.0%
3 21.4% 11 78.6% 14 100.0%
3 3.8% 76 96.2% 79 100.0%
Male
Female
Gender
<24
25 - 34 years
35 - 44 years
45 - 54 years
55 +
Participant Age
Married or living with partner
Separated, not living withpartner
Widowed, not living withpartner
Not married, no partner withparents
Not married, not withpartner, alone
Status
Yes
No
Caring Responsibilitiesat Home
Agriculture & Fishery
Stone Quarrying &Construction
Governmental Services
Hotel & Catering
Services
Manufacturing
Sector of Activity
Primary School or less
Secondary Schooling
Secondary (Vocational)
Post Secondary
Post Secondary (Vocational)
Diploma (University) & FirstDegree
Post Graduate
What is your highestlevel of education?
Senior Managers, Directors
Professionals
Associate Professionals &Technical
Clerical employees
Skilled agriculture & fisheryworkers
Crafts & related trades
Plant & machine operator,assembly workers
Elementary occupations
Shop & Market services
Your level ofresponsibility
Casual
Permanent-Fixed TermContract
Permanent-IndefiniteContract
What is the basis ofyour main job?
Full time
Ful time (reduced hours)
Part time
What is your presentmain job?
N N %
Yes
N N %
No
N N %
Total
Can you work at home as part of your main job

Gender Pay Review
National Commission for the Promotion of Equality
Malta September 2006 page 225 of 327
Table 119 – Analysis of Responses Related to Hours per Week Dedicated to Work at Home across Respondent Groups
6 11 0 2 5 24
4 1 1 2 2 10
2 2 0 0 0 4
4 0 1 1 4 10
1 5 0 1 2 9
2 2 0 2 1 7
1 3 0 0 0 4
4 10 0 2 5 21
0 0 0 0 0 0
0 0 0 0 0 0
4 2 1 2 2 11
2 0 0 0 0 2
3 6 0 3 5 17
7 6 1 1 2 17
0 0 0 0 0 0
1 0 0 0 0 1
0 3 0 1 3 7
0 0 0 0 0 0
7 8 1 3 4 23
2 1 0 0 0 3
0 0 0 0 0 0
1 1 0 0 0 2
0 1 0 0 0 1
1 1 0 1 1 4
0 0 0 1 0 1
6 4 1 1 3 15
2 5 0 1 3 11
2 3 0 0 2 7
5 5 1 0 2 13
1 2 0 3 1 7
1 0 0 1 1 3
0 0 0 0 0 0
0 0 0 0 0 0
0 0 0 0 0 0
0 1 0 0 0 1
1 1 0 0 1 3
9 12 1 4 7 33
0 0 0 0 0 0
1 0 0 0 0 1
1 0 0 0 0 1
2 0 0 0 0 2
7 12 1 4 7 31
Male
Female
Gender
<24
25 - 34 years
35 - 44 years
45 - 54 years
55 +
Participant Age
Married or living with partner
Separated, not living withpartner
Widowed, not living withpartner
Not married, no partner withparents
Not married, not withpartner, alone
Status
Yes
No
Caring Responsibilitiesat Home
Agriculture & Fishery
Stone Quarrying &Construction
Governmental Services
Hotel & Catering
Services
Manufacturing
Sector of Activity
Primary School or less
Secondary Schooling
Secondary (Vocational)
Post Secondary
Post Secondary (Vocational)
Diploma (University) & FirstDegree
Post Graduate
What is your highestlevel of education?
Senior Managers, Directors
Professionals
Associate Professionals &Technical
Clerical employees
Skilled agriculture & fisheryworkers
Crafts & related trades
Plant & machine operator,assembly workers
Elementary occupations
Shop & Market services
Your level ofresponsibility
Full time
Ful time (reduced hours)
Part time
What is your presentmain job?
Casual
Permanent-Fixed TermContract
Permanent-IndefiniteContract
What is the basis ofyour main job?
Count
0 to 5 hrs
Count
5 to 10
hrs
Count
10 to 15
hrs
Count
15 to 20
hrs
Count
20 + hrs
Count
Total
Hours per week dedicated to work at home

Gender Pay Review
National Commission for the Promotion of Equality
Malta September 2006 page 226 of 327
A total of 47.8% (Table 120) of the respondents currently conducting part of their work at
home would not request any form of remuneration to compensate for the inconvenience should
such form of work be removed by the employer, whereas 26.1% of the respondents would
request a remuneration of Lm 50 + weekly for such a removal. An analysis of the responses
across respondent groups, however, did not feature statistically significant differences.
Table 120 – Summary of Remuneration Asked by Participants in Case Working at Home was Removed
22 47.8%
4 8.7%
2 4.3%
4 8.7%
2 4.3%
12 26.1%
46 100.0%
Lm 0
Lm 1 - Lm 10 weekly
Lm 11 - Lm 20 weekly
Lm 21 - Lm 30 weekly
Lm 31 - Lm 50 weekly
Lm 50+ weekly
Total
To relinquish
work athome, would
ask for?
Count Valid Percent

Gender Pay Review
National Commission for the Promotion of Equality
Malta September 2006 page 227 of 327
Table 121 – Analysis of Remuneration Asked by Participants in Case Working at Home Was Removed Across Respondent Groups
16 50.0% 4 12.5% 2 6.3% 2 6.3% 1 3.1% 7 21.9% 32 100.0%
6 42.9% 0 .0% 0 .0% 2 14.3% 1 7.1% 5 35.7% 14 100.0%
2 33.3% 1 16.7% 0 .0% 2 33.3% 1 16.7% 0 .0% 6 100.0%
8 57.1% 1 7.1% 1 7.1% 0 .0% 0 .0% 4 28.6% 14 100.0%
7 58.3% 0 .0% 0 .0% 2 16.7% 1 8.3% 2 16.7% 12 100.0%
4 40.0% 0 .0% 1 10.0% 0 .0% 0 .0% 5 50.0% 10 100.0%
1 25.0% 2 50.0% 0 .0% 0 .0% 0 .0% 1 25.0% 4 100.0%
14 50.0% 2 7.1% 1 3.6% 2 7.1% 2 7.1% 7 25.0% 28 100.0%
1 100.0% 0 .0% 0 .0% 0 .0% 0 .0% 0 .0% 1 100.0%
0 .0% 0 .0% 0 .0% 0 .0% 0 .0% 0 .0% 0 .0%
5 33.3% 2 13.3% 1 6.7% 2 13.3% 0 .0% 5 33.3% 15 100.0%
2 100.0% 0 .0% 0 .0% 0 .0% 0 .0% 0 .0% 2 100.0%
9 40.9% 0 .0% 1 4.5% 2 9.1% 2 9.1% 8 36.4% 22 100.0%
13 54.2% 4 16.7% 1 4.2% 2 8.3% 0 .0% 4 16.7% 24 100.0%
6 37.5% 0 .0% 1 6.3% 1 6.3% 2 12.5% 6 37.5% 16 100.0%
2 40.0% 0 .0% 0 .0% 1 20.0% 0 .0% 2 40.0% 5 100.0%
1 100.0% 0 .0% 0 .0% 0 .0% 0 .0% 0 .0% 1 100.0%
5 31.3% 1 6.3% 1 6.3% 3 18.8% 2 12.5% 4 25.0% 16 100.0%
11 64.7% 2 11.8% 0 .0% 0 .0% 0 .0% 4 23.5% 17 100.0%
1 33.3% 0 .0% 1 33.3% 0 .0% 0 .0% 1 33.3% 3 100.0%
1 100.0% 0 .0% 0 .0% 0 .0% 0 .0% 0 .0% 1 100.0%
0 .0% 0 .0% 0 .0% 0 .0% 0 .0% 0 .0% 0 .0%
2 40.0% 0 .0% 0 .0% 0 .0% 0 .0% 3 60.0% 5 100.0%
0 .0% 0 .0% 0 .0% 0 .0% 0 .0% 0 .0% 0 .0%
3 60.0% 1 20.0% 1 20.0% 0 .0% 0 .0% 0 .0% 5 100.0%
0 .0% 0 .0% 1 25.0% 0 .0% 0 .0% 3 75.0% 4 100.0%
1 16.7% 2 33.3% 0 .0% 1 16.7% 0 .0% 2 33.3% 6 100.0%
2 66.7% 0 .0% 0 .0% 0 .0% 0 .0% 1 33.3% 3 100.0%
5 71.4% 0 .0% 0 .0% 1 14.3% 0 .0% 1 14.3% 7 100.0%
5 45.5% 1 9.1% 0 .0% 1 9.1% 2 18.2% 2 18.2% 11 100.0%
5 62.5% 0 .0% 0 .0% 1 12.5% 0 .0% 2 25.0% 8 100.0%
0 .0% 0 .0% 0 .0% 0 .0% 0 .0% 0 .0% 0 .0%
1 50.0% 0 .0% 0 .0% 0 .0% 0 .0% 1 50.0% 2 100.0%
7 53.8% 0 .0% 0 .0% 0 .0% 1 7.7% 5 38.5% 13 100.0%
1 20.0% 0 .0% 1 20.0% 1 20.0% 0 .0% 2 40.0% 5 100.0%
1 100.0% 0 .0% 0 .0% 0 .0% 0 .0% 0 .0% 1 100.0%
10 50.0% 3 15.0% 1 5.0% 2 10.0% 1 5.0% 3 15.0% 20 100.0%
1 50.0% 0 .0% 0 .0% 0 .0% 0 .0% 1 50.0% 2 100.0%
2 40.0% 1 20.0% 0 .0% 1 20.0% 0 .0% 1 20.0% 5 100.0%
0 .0% 0 .0% 0 .0% 0 .0% 0 .0% 0 .0% 0 .0%
1 100.0% 0 .0% 0 .0% 0 .0% 0 .0% 0 .0% 1 100.0%
6 54.5% 0 .0% 0 .0% 0 .0% 1 9.1% 4 36.4% 11 100.0%
0 .0% 0 .0% 0 .0% 0 .0% 0 .0% 0 .0% 0 .0%
13 43.3% 3 10.0% 2 6.7% 4 13.3% 0 .0% 8 26.7% 30 100.0%
2 50.0% 1 25.0% 0 .0% 0 .0% 1 25.0% 0 .0% 4 100.0%
22 50.0% 3 6.8% 2 4.5% 3 6.8% 2 4.5% 12 27.3% 44 100.0%
0 .0% 0 .0% 0 .0% 0 .0% 0 .0% 0 .0% 0 .0%
0 .0% 1 50.0% 0 .0% 1 50.0% 0 .0% 0 .0% 2 100.0%
4 44.4% 1 11.1% 0 .0% 1 11.1% 0 .0% 3 33.3% 9 100.0%
18 48.6% 3 8.1% 2 5.4% 3 8.1% 2 5.4% 9 24.3% 37 100.0%
0 .0% 1 50.0% 0 .0% 1 50.0% 0 .0% 0 .0% 2 100.0%
1 25.0% 1 25.0% 1 25.0% 0 .0% 1 25.0% 0 .0% 4 100.0%
21 52.5% 2 5.0% 1 2.5% 3 7.5% 1 2.5% 12 30.0% 40 100.0%
5 55.6% 0 .0% 1 11.1% 2 22.2% 0 .0% 1 11.1% 9 100.0%
9 56.3% 1 6.3% 0 .0% 1 6.3% 1 6.3% 4 25.0% 16 100.0%
5 45.5% 2 18.2% 1 9.1% 0 .0% 0 .0% 3 27.3% 11 100.0%
3 50.0% 0 .0% 0 .0% 1 16.7% 0 .0% 2 33.3% 6 100.0%
0 .0% 0 .0% 0 .0% 0 .0% 0 .0% 0 .0% 0 .0%
0 .0% 0 .0% 0 .0% 0 .0% 0 .0% 0 .0% 0 .0%
0 .0% 0 .0% 0 .0% 0 .0% 0 .0% 0 .0% 0 .0%
0 .0% 0 .0% 0 .0% 0 .0% 0 .0% 1 100.0% 1 100.0%
0 .0% 1 33.3% 0 .0% 0 .0% 1 33.3% 1 33.3% 3 100.0%
Male
Female
Gender
<24
25 - 34 years
35 - 44 years
45 - 54 years
55 +
Participant Age
Married or living with partner
Separated, not living with partner
Widowed, not living with partner
Not married, no partner with parents
Not married, not with partner, alone
Status
Yes
No
Caring Responsibilitiesat Home
1
2
3
Variety of CaringResponsibilities AtHome
<1hr
1 - 3 hrs
4 - 5 hrs
6 - 7 hrs
8 - 9 hrs
>9 hrs
How much time do youspend in domesticwork?
Less than O- Level equivalent
O-Level
A-Level
Vocational Certification (City & Guilds or equivalent)
University Diploma or equivalent -Local
University Diploma or equivalent -Overseas Institution
University Degree- Baccalaureate
University Degree- Masters' Level
University Doctoral
Others
What is your highestqualification?
Government Organisation/Department
Parastatal Company
Publicly Listed Company
Private Company/Sole Trader
Commercial Partnership
Non-profit Organisation
Describe the companywhere you areemployed
Agriculture & Fishery
Stone Quarrying & Construction
Governmental Services
Hotel & Catering
Services
Manufacturing
Sector of Activity
Full time
Ful time (reduced hours)
Part time
What is your presentmain job?
More than One Job
One Job Only
Are you engaged inmore than one job?
Casual
Permanent-Fixed Term Contract
Permanent-Indefinite Contract
What is the basis of
your main job?
Senior Managers, Directors
Professionals
Associate Professionals & Technical
Clerical employees
Skilled agriculture & fishery workers
Crafts & related trades
Plant & machine operator, assembly workers
Elementary occupations
Shop & Market services
Your level ofresponsibility
N N %
Lm 0
N N %
Lm 1 - Lm 10 weekly
N N %
Lm 11 - Lm 20 weekly
N N %
Lm 21 - Lm 30 weekly
N N %
Lm 31 - Lm 50 weekly
N N %
Lm 50+ weekly
N N %
Total
To relinquish work at home, would ask for?

Gender Pay Review
National Commission for the Promotion of Equality
Malta September 2006 page 228 of 327
5.8 Equality & Protection At Work
5.8.1 Perceived Effectiveness of Employment Protection
A number of items tested how research participants perceived the effectiveness of the local
employment protection framework (involving the use of different statements accompanied by a
5 point Likert Type scaling50). Research participants generally saw legal provisions as effective
in protecting workers, perceiving their employer as an organisation that treats all employees
equally, albeit respondents also perceive employers as slightly abusive when it comes to
employees in general (Table 122).
Table 122 – Summary of Response: Perceptions About Employment Protection
505 3.37
510 3.49
493 3.08
509 2.75
526 3.22
526 3.46
467 3.60
464 3.34
448 3.38
Legal provisions protect worker effectively
Legal provisions exist for protection of the worker
Trade Unions are effective for protecting workers
Employers never seek to abuse employees
My employer treats all work equally
My employer is a fair organisation
Industrial tribunals operate in malta
Industrial tribunals protect the rights of workers
Industrial tribunals protect employers
Valid N Mean
1 2 3 4 5
Legal provisions protect worker effectively
Legal provisions exist for protection of the worker
Trade Unions are effective for protecting workers
Employers never seek to abuse employees
My employer treats all work equally
My employer is a fair organisation
Industrial tribunals operate in malta
Industrial tribunals protect the rights of workers
Industrial tribunals protect employers
Strongly DisagreeStrongly Agree
50 1 = Strongly Disagree, 5 = Strongly Agree

Gender Pay Review
National Commission for the Promotion of Equality
Malta September 2006 page 229 of 327
Table 123 – Summary of Top Box (Strongly Agree) Responses for Different Employment Protection Statements
100 10.5% 29.6%
124 13.1% 36.7%
75 7.9% 22.2%
87 9.2% 25.7%
142 15.0% 42.0%
150 15.8% 44.4%
125 13.2% 37.0%
75 7.9% 22.2%
71 7.5% 21.0%
949 100.0% 280.8%
Legal provision protectworker effective
Legal provision exist forprotection of
Trade Unions are effectivefor protectin
Employers never seek toabuse employees
My employer treats all workequally
My employer is a fairorganisation
Industrial tribunals operatein malta
Industrial tribunals protectthe rights
Industrial tribunals protectemployers
StronglyAgree
a
Total
N Percent
Responses Percent of
Cases
a.
Table 124 – Summary of Bottom Box (Strongly Disagree) Responses for Different Employment Protection Statements
43 8.3% 18.0%
32 6.2% 13.4%
72 13.8% 30.1%
152 29.2% 63.6%
95 18.3% 39.7%
57 11.0% 23.8%
20 3.8% 8.4%
28 5.4% 11.7%
21 4.0% 8.8%
520 100.0% 217.6%
Legal provision protectworker effective
Legal provision exist for
protection of
Trade Unions are effectivefor protectin
Employers never seek to
abuse employees
My employer treats all workequally
My employer is a fair
organisation
Industrial tribunals operatein malta
Industrial tribunals protect
the rights
Industrial tribunals protectemployers
StronglyDisagree
a
Total
N Percent
Responses Percent of
Cases
a.

Gender Pay Review
National Commission for the Promotion of Equality
Malta September 2006 page 230 of 327
An analysis of the means of responses across respondent groups (Table 125) showed that
statistically significant differences in responses across respondent groups related to a
perception about the respondents’ employer in treating workers:
� A higher level of perception (agreement) that the respondents’ employer treated all workers equally
prevailed among participants who:
– were 55 years or older, or
– spent between 6 and 9 hours daily in domestic work, or
– featured a vocational certificate as the highest level of academic attainment, or
– were employed with commercial partnership employers, or
– were employed with establishments in manufacturing, or
– were employed on a part-time basis, or
– were engaged by their employer through a casual basis.
� Contrastingly, the lowest level of perception (or highest disagreement) that the respondents’
employer treated all workers equally, prevailed among participants who:
– were 35 to 44 years old, or
– devoted 9 hours or more to domestic work, or
– featured a University diploma as their highest academic attainment, or
– were employed with parastatal companies, or
– were employed with organisations engaged in Governmental services, or
– were employed on a full-time basis, or
– were engaged through a permanent fixed-term contract

Gender Pay Review
National Commission for the Promotion of Equality
Malta September 2006 page 231 of 327
Table 125 – Analysis of Mean Response to Employment Protection Statements Across Respondent Groups
3.39 3.51 3.08 2.79 3.17 3.42 3.63 3.35 3.43
3.34 3.47 3.06 2.70 3.30 3.53 3.56 3.31 3.32
3.38 3.45 3.12 2.75 3.25 3.56 3.57 3.35 3.42
3.36 3.51 3.07 2.79 3.36 3.55 3.50 3.38 3.27
3.37 3.46 2.78 2.85 2.88 3.06 3.66 3.17 3.35
3.27 3.48 3.02 2.47 3.19 3.45 3.54 3.30 3.47
3.53 3.63 3.74 3.06 3.63 3.91 4.10 3.63 3.50
3.36 3.50 3.00 2.67 3.18 3.44 3.64 3.34 3.41
3.00 3.38 2.83 2.33 3.25 3.50 3.80 3.20 3.56
3.00 3.00 3.00 4.00 3.00 3.00 3.00 3.00 3.50
3.40 3.44 3.12 2.77 3.27 3.52 3.58 3.31 3.32
3.42 3.80 3.47 3.36 3.15 3.29 3.35 3.53 3.48
3.30 3.49 2.92 2.63 3.08 3.35 3.68 3.41 3.40
3.41 3.50 3.18 2.84 3.31 3.54 3.54 3.29 3.38
3.23 3.40 2.88 2.64 3.14 3.41 3.67 3.40 3.38
3.60 3.89 3.19 2.57 2.93 3.16 3.65 3.51 3.38
2.80 2.60 1.80 2.80 2.00 2.80 4.20 2.60 4.00
. . . . 5.00 5.00 . 5.00 .
3.46 3.54 3.15 2.83 3.25 3.54 3.61 3.31 3.32
3.41 3.59 3.04 2.85 3.35 3.48 3.77 3.47 3.47
3.14 3.31 3.00 2.46 3.00 3.25 3.46 3.15 3.43
3.18 3.43 3.23 2.81 3.69 4.07 3.62 3.50 3.33
3.83 3.71 3.60 3.43 4.00 3.63 4.00 4.33 4.50
3.12 3.22 2.90 2.18 2.40 3.15 3.77 3.14 3.14
3.21 3.28 3.09 2.94 3.35 3.38 3.35 3.13 3.28
3.40 3.57 3.25 2.96 3.38 3.65 3.57 3.36 3.50
3.49 3.52 3.09 2.59 2.95 3.41 3.59 3.20 3.23
3.33 3.42 2.86 2.73 3.46 3.60 3.64 3.26 3.42
3.00 3.17 2.87 2.68 3.08 3.48 3.86 3.55 3.48
3.59 3.59 2.69 2.00 2.43 2.82 3.42 3.27 3.48
3.33 3.67 2.98 2.49 3.25 3.54 3.85 3.40 3.38
3.38 3.65 3.04 2.74 3.31 3.42 3.72 3.77 3.23
. . . . . . . . .
3.94 3.80 3.53 2.94 2.82 3.22 4.12 4.12 3.59
3.31 3.44 3.25 2.69 3.08 3.20 3.81 3.28 3.26
3.25 3.28 3.06 2.33 2.42 2.91 3.57 2.96 3.34
3.45 3.67 2.91 2.53 2.79 3.36 3.41 3.47 3.50
3.41 3.50 3.04 2.85 3.38 3.60 3.56 3.38 3.44
2.71 3.50 2.38 2.71 3.83 4.43 3.17 3.57 2.57
3.33 4.17 3.17 2.67 3.17 3.50 3.33 3.20 3.40
1.00 1.00 1.00 5.00 4.00 5.00 . . .
3.19 3.94 2.13 3.75 3.44 3.47 4.25 3.44 3.62
3.29 3.46 3.24 2.70 2.95 3.12 3.85 3.29 3.27
3.28 3.23 3.11 2.30 3.00 3.24 3.44 3.28 3.30
3.46 3.44 2.94 2.69 3.21 3.56 3.48 3.32 3.45
3.36 3.70 3.30 2.97 3.56 3.73 3.53 3.44 3.41
3.34 3.49 3.06 2.79 3.11 3.35 3.60 3.31 3.37
3.69 3.69 3.08 1.92 3.67 3.85 3.42 3.30 3.40
3.47 3.45 3.20 2.71 3.84 4.13 3.66 3.49 3.46
3.30 3.62 3.13 2.55 3.12 3.41 3.76 3.51 3.43
3.38 3.47 3.07 2.79 3.24 3.47 3.57 3.31 3.38
3.44 3.73 3.09 2.73 3.65 3.90 3.69 3.43 3.37
3.20 3.41 2.68 2.40 2.98 3.37 3.65 3.10 3.55
3.38 3.46 3.12 2.80 3.18 3.40 3.58 3.35 3.37
3.54 4.03 3.00 2.69 3.38 3.92 4.16 3.69 3.43
3.69 3.56 3.12 2.64 3.40 3.52 3.70 3.51 3.30
3.14 3.56 3.00 2.47 2.95 3.17 3.63 3.27 3.47
3.41 3.53 3.03 2.76 3.19 3.55 3.57 3.41 3.33
. . . . . . . . .
4.00 4.00 3.20 4.00 4.17 3.83 3.80 3.83 3.67
3.34 3.36 3.23 3.11 2.94 3.13 3.54 3.13 3.46
3.32 3.15 3.01 2.81 3.25 3.24 3.39 3.05 3.42
3.13 3.40 3.12 2.77 3.26 3.59 3.46 3.26 3.38
Male
Female
Gender
<24
25 - 34 years
35 - 44 years
45 - 54 years
55 +
Participant Age
Married or living with partner
Separated, not living withpartner
Widowed, not living withpartner
Not married, no partner withparents
Not married, not with partner,alone
Status
Yes
No
Caring Responsibilitiesat Home
1
2
3
4
Variety of CaringResponsibilities AtHome
<1hr
1 - 3 hrs
4 - 5 hrs
6 - 7 hrs
8 - 9 hrs
>9 hrs
How much time do youspend in domesticwork?
Less than O- Level equivalent
O-Level
A-Level
Vocational Certification (City &Guilds or equivalent)
University Diploma orequivalent -Local
University Diploma orequivalent -OverseasInstitution
University Degree-Baccalaureate
University Degree- Masters'Level
University Doctoral
Others
What is your highestqualification?
GovernmentOrganisation/Department
Parastatal Company
Publicly Listed Company
Private Company/Sole Trader
Commercial Partnership
Non-profit Organisation
Describe the companywhere you areemployed
Agriculture & Fishery
Stone Quarrying &Construction
Governmental Services
Hotel & Catering
Services
Manufacturing
Sector of Activity
Full time
Ful time (reduced hours)
Part time
What is your presentmain job?
More than One Job
One Job Only
Are you engaged inmore than one job?
Casual
Permanent-Fixed TermContract
Permanent-Indefinite Contract
What is the basis ofyour main job?
Senior Managers, Directors
Professionals
Associate Professionals &Technical
Clerical employees
Skilled agriculture & fisheryworkers
Crafts & related trades
Plant & machine operator,assembly workers
Elementary occupations
Shop & Market services
Your level ofresponsibility
Mean
Legal
provision
protect
worker
effectively
Mean
Legal
provision
exist for
protection
of the
worker
Mean
Trade
Unions
are
effective
for
protecting
workers
Mean
Employers
never seek
to abuse
employees
Mean
My
employer
treats all
work
equally
Mean
My employer
is a fair
organisation
Mean
Industrial
tribunals
operate in
malta
Mean
Industrial
tribunals
protect
the rights
of
workers
Mean
Industrial
tribunals
protect
employers

Gender Pay Review
National Commission for the Promotion of Equality
Malta September 2006 page 232 of 327
5.8.2 Unfair Treatment by Employer
Table 126 highlights how 72.9% of respondents perceived themselves to have been treated
fairly by their employer whereas 27.1% perceived themselves to have been subject to some
form of unfair treatment. An analysis of the responses collected against the different
respondent groups provided no evidence of statistically significant differences between
respondent groups.
Table 126 – Summary of Response: Perceived Unfair Treatment by Employer
158 27.1%
424 72.9%
582 100.0%
Yes
No
Total
Have you ever been
unfairly treated by
employer?
Count Valid Percent

Gender Pay Review
National Commission for the Promotion of Equality
Malta September 2006 page 233 of 327
Table 127 – Analysis of Responses relating to Perceived Unfair Treatment by Employer Across Respondent Groups
93 27.1% 250 72.9% 343 100.0%
65 27.2% 174 72.8% 239 100.0%
37 20.4% 144 79.6% 181 100.0%
44 28.2% 112 71.8% 156 100.0%
33 30.6% 75 69.4% 108 100.0%
30 31.6% 65 68.4% 95 100.0%
14 35.9% 25 64.1% 39 100.0%
89 31.7% 192 68.3% 281 100.0%
2 15.4% 11 84.6% 13 100.0%
0 .0% 2 100.0% 2 100.0%
62 25.0% 186 75.0% 248 100.0%
5 13.2% 33 86.8% 38 100.0%
77 34.2% 148 65.8% 225 100.0%
81 22.7% 276 77.3% 357 100.0%
0 .0% 2 100.0% 2 100.0%
2 12.5% 14 87.5% 16 100.0%
49 39.2% 76 60.8% 125 100.0%
17 27.0% 46 73.0% 63 100.0%
64 27.0% 173 73.0% 237 100.0%
26 18.7% 113 81.3% 139 100.0%
7 25.9% 20 74.1% 27 100.0%
41 18.6% 179 81.4% 220 100.0%
9 29.0% 22 71.0% 31 100.0%
37 31.6% 80 68.4% 117 100.0%
16 34.0% 31 66.0% 47 100.0%
33 32.7% 68 67.3% 101 100.0%
15 38.5% 24 61.5% 39 100.0%
11 25.6% 32 74.4% 43 100.0%
24 26.4% 67 73.6% 91 100.0%
24 38.1% 39 61.9% 63 100.0%
40 30.1% 93 69.9% 133 100.0%
0 .0% 0 .0% 0 .0%
0 .0% 7 100.0% 7 100.0%
12 21.1% 45 78.9% 57 100.0%
20 26.3% 56 73.7% 76 100.0%
27 24.1% 85 75.9% 112 100.0%
144 29.4% 345 70.6% 489 100.0%
3 21.4% 11 78.6% 14 100.0%
11 13.9% 68 86.1% 79 100.0%
15 19.2% 63 80.8% 78 100.0%
20 38.5% 32 61.5% 52 100.0%
123 27.2% 329 72.8% 452 100.0%
Male
Female
Gender
<24
25 - 34 years
35 - 44 years
45 - 54 years
55 +
Participant Age
Married or living with partner
Separated, not living withpartner
Widowed, not living with
partner
Not married, no partner withparents
Not married, not withpartner, alone
Status
Yes
No
Caring Responsibilitiesat Home
Agriculture & Fishery
Stone Quarrying &Construction
Governmental Services
Hotel & Catering
Services
Manufacturing
Sector of Activity
Primary School or less
Secondary Schooling
Secondary (Vocational)
Post Secondary
Post Secondary (Vocational)
Diploma (University) & FirstDegree
Post Graduate
What is your highestlevel of education?
Senior Managers, Directors
Professionals
Associate Professionals &Technical
Clerical employees
Skilled agriculture & fisheryworkers
Crafts & related trades
Plant & machine operator,assembly workers
Elementary occupations
Shop & Market services
Your level ofresponsibility
Full time
Ful time (reduced hours)
Part time
What is your presentmain job?
Casual
Permanent-Fixed TermContract
Permanent-IndefiniteContract
What is the basis ofyour main job?
N N %
Yes
N N %
No
N N %
Total
Have you ever been unfairly treated by employer?
Respondents who suffered some form of unfair treatment by their employer further indicated
the type of unfair treatment (summarised in Table 128). This analysis shows that respondents
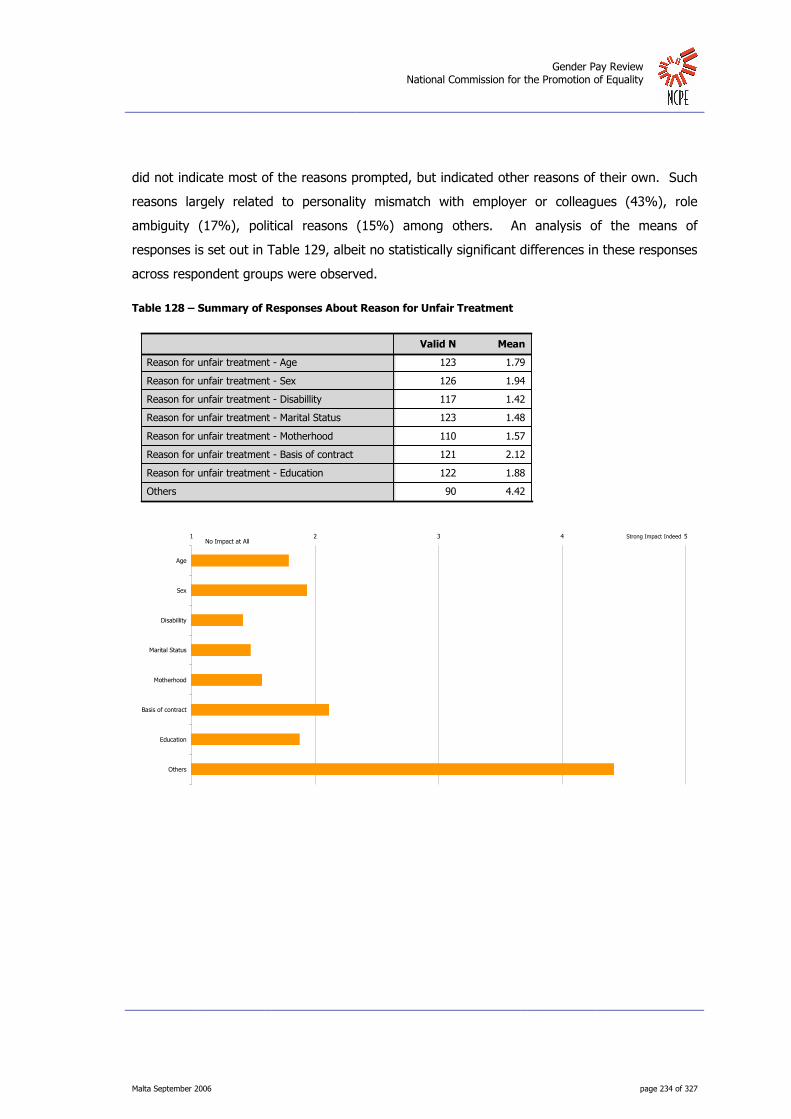
Gender Pay Review
National Commission for the Promotion of Equality
Malta September 2006 page 234 of 327
did not indicate most of the reasons prompted, but indicated other reasons of their own. Such
reasons largely related to personality mismatch with employer or colleagues (43%), role
ambiguity (17%), political reasons (15%) among others. An analysis of the means of
responses is set out in Table 129, albeit no statistically significant differences in these responses
across respondent groups were observed.
Table 128 – Summary of Responses About Reason for Unfair Treatment
123 1.79
126 1.94
117 1.42
123 1.48
110 1.57
121 2.12
122 1.88
90 4.42
Reason for unfair treatment - Age
Reason for unfair treatment - Sex
Reason for unfair treatment - Disabillity
Reason for unfair treatment - Marital Status
Reason for unfair treatment - Motherhood
Reason for unfair treatment - Basis of contract
Reason for unfair treatment - Education
Others
Valid N Mean
1 2 3 4 5
Age
Sex
Disabillity
Marital Status
Motherhood
Basis of contract
Education
Others
No Impact at AllStrong Impact Indeed

Gender Pay Review
National Commission for the Promotion of Equality
Malta September 2006 page 235 of 327
Table 129 – Analysis of Responses About Reason for Unfair Treatment Across Respondent Groups
1.77 1.51 1.41 1.24 1.36 1.93 1.81 4.60
1.81 2.50 1.43 1.82 1.84 2.36 1.96 4.07
1.73 1.97 1.48 1.48 1.55 1.97 1.75 4.11
2.41 2.50 1.60 1.94 2.00 2.82 2.44 4.60
1.63 1.93 1.33 1.07 1.61 1.52 1.78 4.24
1.36 1.39 1.30 1.46 1.29 2.27 1.41 4.43
1.33 1.11 1.11 1.11 1.00 1.33 1.78 5.00
1.62 1.65 1.35 1.42 1.49 2.03 1.71 4.52
2.50 5.00 3.00 3.00 5.00 5.00 4.50 .
. . . . . . . .
2.04 2.10 1.46 1.53 1.65 2.25 2.04 4.29
1.40 3.20 1.60 1.20 1.20 1.40 1.60 3.00
1.71 1.65 1.51 1.54 1.79 2.05 1.77 4.52
1.86 2.20 1.34 1.42 1.38 2.17 1.97 4.30
1.84 1.73 1.41 1.59 1.78 1.95 1.50 4.57
1.35 1.59 1.60 1.53 1.87 2.44 2.29 4.27
2.00 1.00 2.33 1.00 1.00 1.00 2.50 5.00
. . . . . . . .
1.85 1.55 1.26 1.30 1.49 1.90 1.72 4.81
1.62 2.03 1.40 1.58 1.64 2.39 2.08 4.45
1.38 1.94 1.27 1.56 1.36 1.73 1.56 4.33
2.00 2.13 1.43 1.57 2.00 3.14 2.57 2.33
. . . . . . . .
2.11 2.20 1.67 1.44 1.44 1.50 1.70 4.56
1.40 1.25 1.36 1.46 1.55 1.33 1.45 5.00
1.50 1.86 1.31 1.38 1.42 1.93 1.64 4.56
1.77 2.04 1.50 1.73 1.83 2.35 2.00 4.14
1.79 1.57 1.15 1.36 1.40 2.64 2.07 5.00
1.80 1.80 1.00 1.00 1.00 1.80 1.40 4.00
2.38 3.15 2.17 1.54 1.42 2.00 2.46 5.00
2.45 2.33 1.60 1.60 2.22 2.50 2.36 3.82
1.60 1.60 1.20 1.50 1.60 2.40 1.70 3.29
. . . . . . . .
1.75 1.00 1.00 1.00 1.00 1.80 1.00 5.00
2.00 1.97 1.43 1.34 1.50 2.04 1.97 4.63
1.81 2.24 1.88 1.41 1.44 2.39 1.71 4.11
2.22 1.90 1.75 1.89 1.75 2.40 2.80 3.71
1.58 1.89 1.26 1.52 1.62 2.06 1.70 4.44
. . . . . . . .
2.67 1.00 1.00 1.00 . 1.00 3.00 5.00
. . . . . . . .
1.00 1.00 1.00 1.00 . 1.00 1.00 5.00
1.89 2.00 1.41 1.33 1.44 2.06 1.88 4.53
2.00 2.06 1.07 1.63 1.15 2.47 1.81 4.38
1.78 1.87 1.62 1.49 1.72 2.23 1.98 4.26
1.57 2.00 1.25 1.62 1.74 1.70 1.76 4.47
1.81 1.98 1.43 1.49 1.63 2.06 1.94 4.40
1.00 1.00 1.00 1.00 1.00 3.50 1.00 5.00
1.67 1.56 1.33 1.44 1.00 2.44 1.33 4.33
1.70 2.15 1.53 1.85 1.72 2.20 1.95 3.93
1.81 1.90 1.40 1.41 1.54 2.10 1.86 4.51
1.71 1.64 1.27 1.47 1.23 2.40 1.80 4.33
2.00 2.26 1.44 1.68 1.75 1.94 2.06 4.38
1.76 1.91 1.44 1.44 1.59 2.10 1.85 4.43
1.40 1.00 1.00 1.00 1.00 1.22 1.40 4.11
1.78 1.89 1.72 1.44 1.83 2.84 2.42 3.77
2.18 2.45 1.62 1.67 1.63 1.89 1.71 4.73
2.00 2.42 1.57 1.77 1.67 2.55 2.29 4.50
. . . . . . . .
. . . . . . . 5.00
1.44 1.80 1.40 1.00 1.22 1.20 1.30 3.86
1.60 1.50 1.00 1.40 1.57 2.00 2.11 4.83
1.54 1.50 1.14 1.39 1.55 1.91 1.36 4.67
Male
Female
Gender
<24
25 - 34 years
35 - 44 years
45 - 54 years
55 +
Participant Age
Married or living with partner
Separated, not living withpartner
Widowed, not living withpartner
Not married, no partner withparents
Not married, not with partner,alone
Status
Yes
No
Caring Responsibilitiesat Home
1
2
3
4
Variety of CaringResponsibilities At
Home
<1hr
1 - 3 hrs
4 - 5 hrs
6 - 7 hrs
8 - 9 hrs
>9 hrs
How much time do youspend in domestic
work?
Less than O- Level equivalent
O-Level
A-Level
Vocational Certification (City &Guilds or equivalent)
University Diploma orequivalent -Local
University Diploma orequivalent -OverseasInstitution
University Degree-Baccalaureate
University Degree- Masters'Level
University Doctoral
Others
What is your highestqualification?
Government
Organisation/Department
Parastatal Company
Publicly Listed Company
Private Company/Sole Trader
Commercial Partnership
Non-profit Organisation
Describe the company
where you areemployed
Agriculture & Fishery
Stone Quarrying &Construction
Governmental Services
Hotel & Catering
Services
Manufacturing
Sector of Activity
Full time
Ful time (reduced hours)
Part time
What is your presentmain job?
More than One Job
One Job Only
Are you engaged inmore than one job?
Casual
Permanent-Fixed Term
Contract
Permanent-Indefinite Contract
What is the basis ofyour main job?
Senior Managers, Directors
Professionals
Associate Professionals &Technical
Clerical employees
Skilled agriculture & fishery
workers
Crafts & related trades
Plant & machine operator,assembly workers
Elementary occupations
Shop & Market services
Your level ofresponsibility
Mean
Reason
for unfair
treatment
- Age
Mean
Reason
for unfair
treatment
- Sex
Mean
Reason
for unfair
treatment
-
Disabillity
Mean
Reason
for unfair
treatment
- Marital
Status
Mean
Reason for
unfair
treatment -
Motherhood
Mean
Reason
for unfair
treatment
- Basis of
contract
Mean
Reason
for unfair
treatment
-
Education
Mean
Others

Gender Pay Review
National Commission for the Promotion of Equality
Malta September 2006 page 236 of 327
5.8.3 Redressing Unfair Treatment
The respondents who claimed to have suffered an unfair treatment were asked about any
measures they undertook to redress the situation. A total of 53.8% of such research
participants tried to redress the situation (Table 130), with the most frequent action consisting
of a complaint with the employer (82.1% of cases), followed by adjusting oneself to the new
conditions (54.5% of cases). An analysis of these responses across respondent groups is set
out in Table 132, showing no statistically significant differences between such groups.
Table 130 – Summary of Redress Actions Among Respondents Receiving Unfair Treatment
86 53.8%
74 46.3%
160 100.0%
Yes
No
Total
If unfairly treated didyou seek to redresssituation?
Count Valid Percent
Yes
53.8%
No
46.3%
Table 131 – Summary of Redress Actions Taken by Respondents Receiving Unfair Treatment
69 34.3% 82.1%
8 4.0% 9.5%
31 15.4% 36.9%
22 10.9% 26.2%
46 22.9% 54.8%
19 9.5% 22.6%
6 3.0% 7.1%
201 100.0% 239.3%
Complained with employer on my own
Sought legal assistance by lawyer
Sought assistance from trade union
Sought assistance by other people
Adjusted to new conditions
Sought an alternative job and quit
Others
RedressAction
a
Total
N Percent
Responses Percent of
Cases
Dichotomy group tabulated at value 1.a.

Gender Pay Review
National Commission for the Promotion of Equality
Malta September 2006 page 237 of 327
Table 132 – Analysis of Redress Actions Taken by Respondents Receiving Unfair Treatment
43 4 23 11 33 12 4
26 4 8 11 13 7 2
17 1 7 9 8 4 1
19 3 5 8 13 4 2
15 2 8 3 11 6 2
11 6 8 3 1
7 2 5 2 6 2
35 2 16 7 26 8 3
2 1 1
29 5 15 14 19 9 3
3 1 1 1
38 4 13 6 26 11 3
31 4 18 16 20 8 3
26 1 10 3 20 7 2
10 3 3 2 4 3 1
2 1 2 1
15 3 5 9 11 5
30 3 14 5 19 7 6
10 5 2 7 2
2 1 1 1 1
5 1 1 1 3 2
7 2 3 7 3
13 2 5 5 5 3
10 3 8 4
6 2 3 2 4 3
4 1 2 1 2
8 1 3 1 5 2 2
8 2 5 4 1 1
8 2 6 3 4 2 2
5 5 2 7 1 1
19 4 12 6 15 4 3
11 8 3 10 4 2
5 1 2 2 3 1
34 3 9 11 18 11
2 1 2 2 1
20 4 12 6 18 5 3
8 1 3 6 2
25 4 14 8 15 9 3
14 3 3 5 2
66 8 30 21 45 18 6
1 1
2 1 1 1
12 3 9 4 6 2 3
57 5 22 18 40 17 3
1 1
12 3 3 5 3 4
56 5 27 17 43 15 6
6 3 2 3 3 1
11 1 5 2 6 1 3
12 1 4 1 10 2 1
16 4 8 7 11 6
7 3 2 4 1
7 1 6 5 7 2 1
10 1 2 3 5 4
Male
Female
Gender
<24
25 - 34 years
35 - 44 years
45 - 54 years
55 +
Participant Age
Married or living with partner
Separated, not living with partner
Not married, no partner with parents
Not married, not with partner, alone
Status
Yes
No
Caring Responsibilitiesat Home
1
2
3
Variety of CaringResponsibilities AtHome
<1hr
1 - 3 hrs
4 - 5 hrs
6 - 7 hrs
>9 hrs
How much time do youspend in domesticwork?
Less than O- Level equivalent
O-Level
A-Level
Vocational Certification (City & Guilds or equivalent)
University Diploma or equivalent -Local
University Diploma or equivalent -Overseas Institution
University Degree- Baccalaureate
University Degree- Masters' Level
Others
What is your highestqualification?
Government Organisation/Department
Parastatal Company
Publicly Listed Company
Private Company/Sole Trader
Describe the companywhere you are
employed
Stone Quarrying & Construction
Governmental Services
Hotel & Catering
Services
Manufacturing
Sector of Activity
Full time
Ful time (reduced hours)
Part time
What is your presentmain job?
More than One Job
One Job Only
Are you engaged in
more than one job?
Casual
Permanent-Fixed Term Contract
Permanent-Indefinite Contract
What is the basis ofyour main job?
Senior Managers, Directors
Professionals
Associate Professionals & Technical
Clerical employees
Plant & machine operator, assembly workers
Elementary occupations
Shop & Market services
Your level of
responsibility
Complained
with employer
on my own
Sought legal
assistance
by lawyer
Sought
assistance
from trade
union
Sought
assistance by
other people
Adjusted
to new
conditions
Sought an
alternative
job and quit
Others
Redress Action

Gender Pay Review
National Commission for the Promotion of Equality
Malta September 2006 page 238 of 327
Table 132 – Analysis of Redress Actions Taken by Respondents Receiving Unfair Treatment (continued)
84.3 7.8 45.1 21.6 64.7 23.5 7.8
78.8 12.1 24.2 33.3 39.4 21.2 6.1
81.0 4.8 33.3 42.9 38.1 19.0 4.8
79.2 12.5 20.8 33.3 54.2 16.7 8.3
83.3 11.1 44.4 16.7 61.1 33.3 11.1
91.7 50.0 66.7 25.0 8.3
77.8 22.2 55.6 22.2 66.7 22.2
87.5 5.0 40.0 17.5 65.0 20.0 7.5
100.0 50.0 50.0
76.3 13.2 39.5 36.8 50.0 23.7 7.9
75.0 25.0 25.0 25.0
90.5 9.5 31.0 14.3 61.9 26.2 7.1
73.8 9.5 42.9 38.1 47.6 19.0 7.1
86.7 3.3 33.3 10.0 66.7 23.3 6.7
100.0 30.0 30.0 20.0 40.0 30.0 10.0
100.0 50.0 100.0 50.0
78.9 15.8 26.3 47.4 57.9 26.3
88.2 8.8 41.2 14.7 55.9 20.6 17.6
100.0 50.0 20.0 70.0 20.0
66.7 33.3 33.3 33.3 33.3
83.3 16.7 16.7 16.7 50.0 33.3
77.8 22.2 33.3 77.8 33.3
86.7 13.3 33.3 33.3 33.3 20.0
83.3 25.0 66.7 33.3
75.0 25.0 37.5 25.0 50.0 37.5
80.0 20.0 40.0 20.0 40.0
88.9 11.1 33.3 11.1 55.6 22.2 22.2
72.7 18.2 45.5 36.4 9.1 9.1
100.0 25.0 75.0 37.5 50.0 25.0 25.0
71.4 71.4 28.6 100.0 14.3 14.3
73.1 15.4 46.2 23.1 57.7 15.4 11.5
84.6 61.5 23.1 76.9 30.8 15.4
100.0 20.0 40.0 40.0 60.0 20.0
85.0 7.5 22.5 27.5 45.0 27.5
100.0 50.0 100.0 100.0 50.0
71.4 14.3 42.9 21.4 64.3 17.9 10.7
88.9 11.1 33.3 66.7 22.2
83.3 13.3 46.7 26.7 50.0 30.0 10.0
93.3 20.0 20.0 33.3 13.3
81.5 9.9 37.0 25.9 55.6 22.2 7.4
100.0 100.0
100.0 50.0 50.0 50.0
80.0 20.0 60.0 26.7 40.0 13.3 20.0
82.6 7.2 31.9 26.1 58.0 24.6 4.3
50.0 50.0
92.3 23.1 23.1 38.5 23.1 30.8
81.2 7.2 39.1 24.6 62.3 21.7 8.7
85.7 42.9 28.6 42.9 42.9 14.3
91.7 8.3 41.7 16.7 50.0 8.3 25.0
80.0 6.7 26.7 6.7 66.7 13.3 6.7
80.0 20.0 40.0 35.0 55.0 30.0
77.8 33.3 22.2 44.4 11.1
70.0 10.0 60.0 50.0 70.0 20.0 10.0
90.9 9.1 18.2 27.3 45.5 36.4
R %Male
R %Female
Gender
R %<24
R %25 - 34 years
R %35 - 44 years
R %45 - 54 years
R %55 +
Participant Age
R %Married or living with partner
R %Separated, not living with partner
R %Not married, no partner with parents
R %Not married, not with partner, alone
Status
R %Yes
R %No
Caring Responsibilitiesat Home
R %1
R %2
R %3
Variety of Caring
Responsibilities AtHome
R %<1hr
R %1 - 3 hrs
R %4 - 5 hrs
R %6 - 7 hrs
R %>9 hrs
How much time do youspend in domesticwork?
R %Less than O- Level equivalent
R %O-Level
R %A-Level
R %Vocational Certification (City & Guilds or equivalent)
R %University Diploma or equivalent -Local
R %University Diploma or equivalent -Overseas Institution
R %University Degree- Baccalaureate
R %University Degree- Masters' Level
R %Others
What is your highestqualification?
R %Government Organisation/Department
R %Parastatal Company
R %Publicly Listed Company
R %Private Company/Sole Trader
Describe the companywhere you are
employed
R %Stone Quarrying & Construction
R %Governmental Services
R %Hotel & Catering
R %Services
R %Manufacturing
Sector of Activity
R %Full time
R %Ful time (reduced hours)
R %Part time
What is your presentmain job?
R %More than One Job
R %One Job Only
Are you engaged inmore than one job?
R %Casual
R %Permanent-Fixed Term Contract
R %Permanent-Indefinite Contract
What is the basis ofyour main job?
R %Senior Managers, Directors
R %Professionals
R %Associate Professionals & Technical
R %Clerical employees
R %Plant & machine operator, assembly workers
R %Elementary occupations
R %Shop & Market services
Your level ofresponsibility
Complained
with employer
on my own
Sought legal
assistance
by lawyer
Sought
assistance
from trade
union
Sought
assistance by
other people
Adjusted
to new
conditions
Sought an
alternative
job and quit
Others
Redress Action
Contrastingly, the respondents who decided not to redress the suffered unfair treatment by
their employer were requested to quote a reason for so doing. Table 133 summarises the
means of the responses (on a Likert type scaling51) pertaining to a number of prompts, of
which, respondents indicated political connections of the employer and fear of further
discrimination by employer as the stronger reasons. An analysis of these means across
51 1 = Strongly Disagree, 5 = Strongly Agree

Gender Pay Review
National Commission for the Promotion of Equality
Malta September 2006 page 239 of 327
respondent groups (Table 134) featured no statistically significant differences between
respondent groups.
Table 133 – Summary of Reasons that Hindered Respondents from Redressing Unfair Treatment
64 2.80
61 2.95
52 2.94
41 1.95
40 1.53
51 3.78
45 2.42
54 3.04
55 2.29
62 3.45
18 4.17
Fear of losing job
No faith in law
No faith in trade unions
Trade union suggested not to take action
Legal counsel suggested to drop actions
Political connections of employer
Aspect was not in breach of law
Employer would not discuss / was not available
Fear of long term unemployment
Fear of further discrimination by employer
Others
Valid N Mean
1 2 3 4 5
Fear of losing job
No faith in law
No faith in trade unions
Trade union suggested not to take action
Legal counsel suggested to drop actions
Political connections of employer
Aspect was not in breach of law
Employer would not discuss / was not available
Fear of long term unemployment
Fear of further discrimination by employer
Others
Strongly Disagree Strongly Agree

Gender Pay Review
National Commission for the Promotion of Equality
Malta September 2006 page 240 of 327
Table 134 – Analysis of Reasons that Hindered Respondents from Redressing Unfair Treatment Across Respondent Groups
2.83 3.11 3.07 2.09 1.59 2.93 2.96 2.85 2.45 3.50 4.50
2.75 2.73 2.77 1.79 1.44 5.00 1.86 3.33 2.05 3.38 3.90
3.60 2.93 2.67 1.70 1.44 8.30 2.17 3.00 2.42 3.50 4.14
2.88 3.07 3.50 1.75 1.80 2.17 2.55 3.21 2.46 3.43 4.00
2.08 3.69 3.09 2.11 1.33 3.64 2.33 2.83 2.42 3.64 .
2.60 2.36 2.62 2.09 1.45 1.85 2.62 3.23 2.07 3.27 4.20
2.60 2.40 2.75 2.33 1.50 4.00 2.33 2.33 1.75 3.40 5.00
2.38 2.78 2.85 1.93 1.33 2.64 2.55 2.77 2.08 3.31 3.91
. . . . . . . . . . .
. . . . . . . . . . .
3.71 3.29 3.11 2.00 1.92 6.53 2.19 3.53 2.72 3.75 4.57
1.00 . . . . . . . . . .
2.43 2.79 2.74 1.83 1.17 2.58 2.43 2.88 2.11 3.44 4.43
3.12 3.09 3.10 2.04 1.82 5.04 2.42 3.17 2.46 3.47 4.00
2.36 3.00 2.69 1.64 1.00 2.43 2.38 2.94 2.06 3.43 5.00
2.63 2.14 2.86 2.14 1.60 3.20 2.60 2.71 2.22 3.44 3.67
. . . . . . . . . . 5.00
. . . . . . . . . . .
2.93 2.88 2.96 1.95 1.61 2.55 2.47 3.29 2.29 3.64 4.17
2.88 3.06 2.73 2.00 1.22 7.29 2.60 2.79 2.50 3.24 5.00
3.00 3.40 3.40 2.67 2.50 3.80 2.50 3.75 1.75 3.67 1.00
2.33 2.33 3.00 1.40 1.40 1.83 2.00 2.67 2.67 3.00 5.00
. . . . . . . . . . .
1.80 2.60 3.00 2.33 1.00 1.00 2.20 2.75 2.00 3.00 2.00
3.17 2.86 2.33 1.50 1.00 1.80 1.75 2.83 2.67 3.71 5.00
3.25 3.06 3.29 2.25 1.75 2.00 2.27 3.24 2.63 3.74 3.67
2.56 2.50 2.73 1.83 1.40 2.50 2.58 3.25 1.86 2.93 3.80
3.29 3.71 3.50 3.00 2.00 12.86 3.25 3.00 2.80 4.14 5.00
2.50 2.25 3.67 1.00 1.00 2.33 3.67 3.00 2.25 3.00 3.00
2.50 3.67 2.00 2.00 1.50 2.67 2.33 2.00 2.75 3.50 5.00
1.25 3.60 3.00 1.67 2.00 3.00 2.00 1.67 1.25 2.25 5.00
2.50 2.50 3.00 1.00 1.00 3.00 1.00 4.50 2.00 4.00 4.00
. . . . . . . . . . .
1.00 1.00 1.00 1.00 1.00 5.00 1.00 4.00 1.00 5.00 .
2.56 3.00 3.56 2.08 1.58 3.29 2.54 3.50 2.53 3.82 5.00
3.50 3.60 2.50 2.33 2.00 4.20 2.50 3.00 2.00 4.00 .
1.75 3.60 3.50 2.25 1.67 3.25 1.67 3.75 2.50 4.00 5.00
3.03 2.66 2.54 1.81 1.29 4.19 2.38 2.77 2.28 3.12 3.93
. . . . . . . . . . .
1.33 3.67 3.00 1.00 4.00 2.00 4.00 2.50 1.33 3.33 .
. . . . . . . . . . .
. . . . . . . . . . .
2.82 3.00 3.41 2.15 1.58 3.67 2.46 3.33 2.33 4.00 5.00
2.33 3.29 3.25 3.67 2.00 18.75 2.67 3.00 2.33 4.00 3.75
2.94 3.03 2.79 1.44 1.42 2.12 2.50 3.27 2.52 3.37 4.14
2.60 2.25 2.14 2.14 1.57 1.43 2.00 1.89 1.38 2.50 4.00
2.76 3.14 3.18 2.09 1.56 2.65 2.51 2.96 2.40 3.45 4.06
2.00 1.00 1.00 1.00 1.00 1.00 1.00 4.00 1.00 4.00 .
3.25 2.25 1.83 1.25 1.50 12.83 2.33 3.33 1.83 3.29 5.00
2.83 2.80 1.50 1.00 1.00 19.25 1.00 3.17 2.33 3.80 4.67
2.79 2.96 3.00 2.00 1.55 2.47 2.49 3.02 2.29 3.42 4.07
3.33 3.00 3.10 2.13 1.88 8.50 2.20 3.67 2.40 3.82 5.00
2.50 2.83 2.29 1.00 1.75 2.33 2.20 2.60 2.00 4.00 3.00
2.70 2.95 3.03 2.03 1.39 2.69 2.53 2.95 2.30 3.29 4.27
2.00 1.67 3.50 1.00 1.00 3.00 5.00 2.00 2.00 3.00 5.00
2.80 3.00 2.11 2.11 1.25 2.67 2.22 2.60 1.56 3.22 4.80
2.11 2.89 2.00 1.33 1.57 2.67 1.80 2.38 1.50 2.67 5.00
2.50 3.07 3.36 2.55 1.90 3.17 2.33 4.00 2.23 3.60 3.00
. . . . . . . . . . .
. . . . . . . . . . .
3.25 3.00 3.67 2.00 2.00 3.00 4.00 2.00 3.00 4.00 5.00
3.29 3.13 3.00 2.60 2.00 2.50 2.83 2.75 3.25 3.75 5.00
3.43 3.00 3.56 1.00 1.00 7.70 2.00 3.55 2.80 3.79 3.40
Male
Female
Gender
<24
25 - 34 years
35 - 44 years
45 - 54 years
55 +
Participant Age
Married or living with partner
Separated, not living withpartner
Widowed, not living withpartner
Not married, no partner with
parents
Not married, not with partner,
alone
Status
Yes
No
Caring Responsibilitiesat Home
1
2
3
4
Variety of Caring
Responsibilities AtHome
<1hr
1 - 3 hrs
4 - 5 hrs
6 - 7 hrs
8 - 9 hrs
>9 hrs
How much time do you
spend in domesticwork?
Less than O- Level equivalent
O-Level
A-Level
Vocational Certification (City &
Guilds or equivalent)
University Diploma orequivalent -Local
University Diploma orequivalent -OverseasInstitution
University Degree-Baccalaureate
University Degree- Masters'
Level
University Doctoral
Others
What is your highestqualification?
GovernmentOrganisation/Department
Parastatal Company
Publicly Listed Company
Private Company/Sole Trader
Commercial Partnership
Non-profit Organisation
Describe the companywhere you areemployed
Agriculture & Fishery
Stone Quarrying &Construction
Governmental Services
Hotel & Catering
Services
Manufacturing
Sector of Activity
Full time
Ful time (reduced hours)
Part time
What is your present
main job?
More than One Job
One Job Only
Are you engaged inmore than one job?
Casual
Permanent-Fixed TermContract
Permanent-Indefinite Contract
What is the basis of
your main job?
Senior Managers, Directors
Professionals
Associate Professionals &Technical
Clerical employees
Skilled agriculture & fisheryworkers
Crafts & related trades
Plant & machine operator,assembly workers
Elementary occupations
Shop & Market services
Your level of
responsibility
Mean
Fear of
losing job
Mean
No faith in
law
Mean
No faith in
trade
unions
Mean
Trade
union
suggested
not to
take
action
Mean
Legal
counsel
suggested
to drop
actions
Mean
Political
conection
of
employer
Mean
Aspect
was not in
breach of
law
Mean
Employer
would not
discuss /
was not
available
Mean
Fear of
long term
unemploy
ment
Mean
Fear of further
discrimination
by employer
Mean
Others

Gender Pay Review
National Commission for the Promotion of Equality
Malta September 2006 page 241 of 327
5.8.4 Perceived Pay Equality
Research participants were asked to relate to their pay to a series of comparative situations as
set out in Table 135, by relating to a differential scale (-2 = much less paid, +2 = much better
paid). Overall, respondents perceived their pay to be only slightly different than that of other
human resources’ – but featured a significant response in that their pay was much less than
expected. An analysis of means of responses is set out in Table 136, showing that whilst
respondent groups featured statistically non-significant differences, the following were
statistically valid observations:
� Respondents least actually paid when compared to their expectations included respondents with 3
types of domestic care responsibilities or respondents who devote more than 9 hours daily for
domestic work or respondents in full-time work. The converse holds in respect to respondents who
had one type of care responsibility at home, or devoted between 6 and 9 hours daily for domestic
work or were employed in part-time work;
� Women in the same company, with the same role and experience but in a part-time job were
perceived to be better paid than the respondents by respondents who were women or were single
persons.

Gender Pay Review
National Commission for the Promotion of Equality
Malta September 2006 page 242 of 327
Table 135 – Summary of Means of Responses: Comparisons of Pay & Equality
520 -.43
443 -.07
384 -.07
419 -.04
374 -.02
350 .05
329 -.05
393 -.05
367 -.02
394 .03
369 .08
Actual compared to expected
Men, same company role and experience
Women, same company role and experience
Men, same company, role and experience
Women, same company, role and experience in f/t
Men, same company in the same industry, role and experience in p/t
Women, same company, role and experience in p/t
Men, different company, same industry, role, & experience
Women, different company, same industry, same role & experience
Men, different company, different industry, same role & experience
Women, different company, different industry, same role & experience
Valid N Mean
-2 -1 0 1 2
Actual compared to expected
Men, same company role and experience
Women, same company role and experience
Men, same company, role and experience
Women, same company, role and experience in
f/t
Men, same company in the same industry, role
and experience in p/t
Women, same company, role and experience in
p/t
Men, different company, same industry, role, &
experience
Women, different company, same industry, same
role & experience
Men, different company, different industry, same
role & experience
Women, different company, different industry,
same role & experience
Much Less Paid Much Better Paid

Gender Pay Review
National Commission for the Promotion of Equality
Malta September 2006 page 243 of 327
Table 136 – Analysis of Means of Responses: Comparisons of Pay & Equality Across Respondent Groups
-.48 -.10 -.03 -.02 .01 .06 .05 -.04 .00 .10 .14
-.37 -.03 -.11 -.08 -.06 .03 -.16 -.07 -.04 -.08 .01
-.31 -.07 -.08 -.04 -.06 -.02 -.14 -.06 -.11 -.02 .02
-.45 -.03 -.08 -.08 .01 .07 .05 .01 .17 .07 .19
-.61 -.32 -.15 -.15 -.12 .17 .16 -.36 -.28 -.19 -.16
-.35 .12 .06 .09 .10 .06 -.08 .14 .15 .26 .35
-.55 .00 .05 .10 .11 .00 -.39 .07 -.15 .11 -.14
-.48 -.08 -.01 -.06 .00 .08 -.01 -.03 .01 .04 .10
-.42 -.11 -.14 -.25 -.33 1.00 1.20 -.50 .14 .00 .00
.00 .00 .00 .00 .00 .00 .00 .00 .00 .00 .00
-.37 -.06 -.08 -.02 -.02 .03 -.07 -.06 -.04 .05 .09
-.55 -.10 -.29 -.08 -.11 -.19 -.31 -.04 -.15 -.08 -.08
-.52 -.08 -.05 -.12 -.10 .13 -.03 -.04 .04 .04 .14
-.37 -.07 -.07 .00 .01 .01 -.05 -.05 -.05 .03 .05
-.44 -.10 -.07 -.15 -.09 .09 .00 -.10 .03 -.05 .09
-.72 .06 -.07 .06 -.14 .27 -.15 .29 .15 .44 .33
-1.40 -.40 .50 -.60 .00 .33 .00 -1.00 -1.00 -.67 .00
.00 .00 .00 .00 .00 .00 .00 .00 .00 .00 .00
-.46 -.01 -.13 -.07 -.09 -.06 -.13 -.20 -.20 -.18 -.16
-.53 -.23 -.11 -.17 -.13 -.02 -.11 .03 .09 .06 .09
-.21 -.05 .03 .28 .16 .46 -.06 .13 .00 .22 .24
.00 .09 -.05 .05 .16 .28 .21 .14 .23 .05 .38
.00 .00 .17 .00 -.20 .00 -.20 -.20 .20 .00 .40
-.65 -.27 -.13 -.31 .06 .13 .15 .09 .08 .36 .33
-.45 -.04 -.01 .10 .04 .05 -.05 .06 .07 .15 .20
-.31 -.03 -.18 -.02 -.06 .07 -.11 -.02 .00 .09 .13
-.45 -.08 .05 -.08 .04 .02 -.03 .12 .10 .08 .14
-.41 -.07 .00 .09 .03 .39 .20 -.13 .06 .09 .42
-.57 -.11 -.33 -.24 -.24 .00 -.06 -.35 -.31 -.33 -.33
-.36 -.14 .21 -.05 .17 .56 .86 .15 .06 .15 .00
-.60 -.15 -.03 -.26 -.03 -.22 -.23 -.23 -.05 -.25 -.05
-.71 -.30 -.39 -.39 -.44 -.11 -.29 -.70 -.89 -.45 -.70
. . . . . . . . . . .
-.25 .00 .00 -.08 -.11 -.42 -.44 .20 .22 .25 .00
-.62 -.19 -.11 -.12 -.04 .16 .13 -.01 .03 .03 .11
-.43 -.33 -.20 -.09 .00 .22 .13 .26 .30 .46 .52
-.11 .07 .15 .17 .12 .32 .23 .08 .08 .21 .08
-.40 -.02 -.07 -.03 -.04 -.03 -.14 -.10 -.08 -.04 .01
-.33 -1.00 .00 -2.00 .00 -2.00 .00 .20 .40 .75 1.25
-.43 .20 .20 .17 .20 .25 .00 -.50 -.20 -.20 -.20
1.00 1.00 . 1.00 . . . 1.00 . 1.00 .
-.47 -.21 .50 -.25 .00 .14 -.67 -.15 .00 -.27 -.17
-.61 -.20 -.18 -.14 -.06 .25 .17 .08 .18 .11 .22
-.54 -.07 .00 .02 .04 .05 -.12 -.02 .11 .14 .10
-.34 -.02 -.05 .02 .00 -.01 -.08 -.07 -.09 .15 .13
-.38 -.04 -.06 -.08 -.07 -.04 -.12 -.13 -.13 -.23 -.12
-.49 -.09 -.08 -.07 -.05 .04 -.04 -.08 -.03 -.01 .07
-.25 .00 .11 .00 .11 -.11 .00 .13 .13 .38 .25
-.11 .00 -.05 .15 .09 .11 -.07 .14 .02 .26 .10
-.61 .00 -.16 -.06 -.21 -.02 -.21 .05 -.09 .02 -.08
-.40 -.09 -.05 -.04 .00 .06 -.02 -.07 -.01 .04 .11
-.21 .04 -.07 .18 .17 .18 -.10 .22 .26 .18 .27
-.46 -.12 -.02 -.05 -.15 -.03 -.17 -.24 .00 .24 .23
-.47 -.09 -.07 -.08 -.04 .04 -.02 -.07 -.08 -.01 .03
-.38 -.07 .17 .04 .09 -.15 -.21 -.21 -.17 -.11 -.12
-.38 -.22 -.14 -.20 -.06 .08 .07 -.12 .02 -.05 .04
-.45 .00 -.11 -.07 -.19 .27 -.07 -.32 -.39 -.43 -.39
-.49 -.02 -.09 .00 -.03 .02 -.01 .10 .12 .24 .19
. . . . . . . . . . .
-.80 -.40 .00 -.50 .00 .67 -2.00 .00 .00 -.20 .50
-.30 -.11 -.11 -.09 .00 .06 -.04 -.10 -.06 -.13 -.03
-.39 .00 .11 .15 .26 .07 .10 .10 .24 .39 .63
-.50 -.08 -.12 -.07 -.10 -.03 -.15 -.04 -.11 .05 .04
Male
Female
Gender
<24
25 - 34 years
35 - 44 years
45 - 54 years
55 +
Participant Age
Married or living with partner
Separated, not living with partner
Widowed, not living with partner
Not married, no partner with parents
Not married, not with partner, alone
Status
Yes
No
Caring Responsibilitiesat Home
1
2
3
4
Variety of CaringResponsibilities At
Home
<1hr
1 - 3 hrs
4 - 5 hrs
6 - 7 hrs
8 - 9 hrs
>9 hrs
How much time do youspend in domestic
work?
Less than O- Level equivalent
O-Level
A-Level
Vocational Certification (City & Guilds or equivalent)
University Diploma or equivalent -Local
University Diploma or equivalent -Overseas Institution
University Degree- Baccalaureate
University Degree- Masters' Level
University Doctoral
Others
What is your highestqualification?
Government Organisation/Department
Parastatal Company
Publicly Listed Company
Private Company/Sole Trader
Commercial Partnership
Non-profit Organisation
Describe the companywhere you are
employed
Agriculture & Fishery
Stone Quarrying & Construction
Governmental Services
Hotel & Catering
Services
Manufacturing
Sector of Activity
Full time
Ful time (reduced hours)
Part time
What is your present
main job?
More than One Job
One Job Only
Are you engaged in
more than one job?
Casual
Permanent-Fixed Term Contract
Permanent-Indefinite Contract
What is the basis of
your main job?
Senior Managers, Directors
Professionals
Associate Professionals & Technical
Clerical employees
Skilled agriculture & fishery workers
Crafts & related trades
Plant & machine operator, assembly workers
Elementary occupations
Shop & Market services
Your level of
responsibility
Mean
Actual
compared
to
expected
Mean
Men, same
company
role and
experience
Mean
Women, same
company role
and
experience
Mean
Men, same
company,
role and
experience
Mean
Women, same
company, role
and
experience in
f/t
Mean
Men, same
company in
the same
industry, role
and
experience in
p/t
Mean
Women, same
company, role
and
experience in
p/t
Mean
Men, different
company,
same industry,
role, &
experience
Mean
Women,
different
company,
same
industry,
same role &
experience
Mean
Men, different
company,
different
industry, same
role &
experience
Mean
Women,
different
company,
different
industry,
same role &
experience
5.9 Gender Orientation of Work
Survey participants wee asked to indicate for which gender was their job more appropriate
(Table 137), showing how the majority of both men and women perceived their job to be
appropriate for both men and women. Nevertheless, this summary also shows that 44.1% of
men perceived their job to be appropriate only for men, while only 21.8% of women perceived
their job to be appropriate only for women.

Gender Pay Review
National Commission for the Promotion of Equality
Malta September 2006 page 244 of 327
Research participants were further prompted about possible reasons for their response.
Topping the reasons was initiative (mean response: 3.7152) followed by maturity (mean
response: 3.66). Shifts and physical strength featured as the weakest reasons.
Table 137 – Perceived Job Gender Orientation
152 44.1% 5 2.1%
1 .3% 52 21.8%
192 55.7% 182 76.2%
Men
Women
Both
Do you consider your job tobe more appropriate for
Count Column N %
Male
Count Column N %
Female
Gender
Table 138 – Summary of Responses: Reasons for Potential Gender Orientation of Job
411 2.89
458 3.49
459 3.60
302 2.68
449 3.64
439 3.55
459 3.66
460 3.71
431 3.61
58 4.24
Physical Strength
Job commitment
Patience
Shift
Communication Skills
Leading skills
Maturity
Initiative
Flexibility
Others
Valid N Mean
1 2 3 4 5
Physical Strength
Job commitment
Patience
Shift
Communication Skills
Leading skills
Maturity
Initiative
Flexibility
Others
Strongly Disagree Strongly Agree
52 Related to a Likert type scaling: 1 = Strongly Disagree, 5 = Strongly Agree

Gender Pay Review
National Commission for the Promotion of Equality
Malta September 2006 page 245 of 327
Table 139 – Analysis of Responses: Reasons for Potential Perceived Gender Orientation of Job Across Respondent Gender
4.16 . 2.33 4.00 1.95 2.16
3.09 1.00 3.67 3.00 3.39 3.69
3.15 3.00 3.80 2.25 4.15 3.61
2.73 2.00 2.70 2.67 2.36 2.68
3.23 5.00 3.84 1.75 3.79 3.71
3.39 5.00 3.75 2.00 3.32 3.53
3.25 4.00 3.86 2.25 3.64 3.77
3.45 3.00 3.88 2.00 3.47 3.86
3.59 4.00 3.72 2.67 3.02 3.69
4.44 . 4.00 5.00 4.43 4.08
Physical Strength
Job commitment
Patience
Shift
Communication Skills
Leading skills
Maturity
Initiative
Flexibility
Others
Mean
Men
Mean
Women
Mean
Both
Do you consider your job to be
more appropriate for
Male
Mean
Men
Mean
Women
Mean
Both
Do you consider your job to be
more appropriate for
Female
Gender
Table 139 sets out an analysis why respondents think their job may be gender oriented or
otherwise, showing how, male respondents thinking that their job is male oriented largely
respond to the perceived need for physical strength, flexibility and initiative needed by the job.
Contrastingly, men thinking that their job is more oriented for women believe that such is the
result of the job’s needs in terms of communication and leadership skills. Women think that
their jobs may be more suited for men in response to the jobs’ needs in terms of physical
strength and job commitment. Contrastingly, women thinking that their job is more female
oriented believe in such in response to the perceived jobs’ needs in terms of patience and
communication skills.
Table 140 sets out a further analysis of the overall responses across respondent groups.

Gender Pay Review
National Commission for the Promotion of Equality
Malta September 2006 page 246 of 327
Table 140 – Analysis of Responses: Reasons for Potential Gender Orientation of Job Across Respondent Groups
3.30 3.41 3.53 2.73 3.61 3.61 3.62 3.70 3.68 4.24
2.17 3.61 3.72 2.61 3.69 3.45 3.71 3.72 3.51 4.24
2.90 3.33 3.41 2.77 3.44 3.21 3.43 3.49 3.30 3.93
3.02 3.47 3.68 2.75 3.63 3.63 3.70 3.73 3.68 4.36
2.77 3.47 3.69 2.48 3.78 3.69 3.60 3.76 3.81 4.43
2.63 3.58 3.57 2.65 3.56 3.51 3.78 3.79 3.58 4.00
3.26 4.00 3.90 2.36 4.27 4.38 4.32 4.29 4.21 4.67
2.72 3.53 3.57 2.50 3.76 3.71 3.73 3.78 3.77 4.23
3.11 2.50 3.83 2.80 3.43 3.29 3.17 3.71 3.50 5.00
3.00 3.50 3.50 3.50 1.00 4.00 5.00 4.00 3.50 .
3.08 3.51 3.67 2.78 3.54 3.37 3.58 3.61 3.44 4.15
2.76 3.31 3.35 3.05 3.50 3.59 3.59 3.82 3.52 4.67
2.72 3.49 3.54 2.53 3.62 3.55 3.66 3.79 3.72 4.43
3.00 3.49 3.64 2.75 3.65 3.55 3.65 3.66 3.54 4.11
2.77 3.42 3.43 2.49 3.49 3.45 3.55 3.65 3.62 4.53
2.63 3.58 3.74 2.60 3.87 3.76 3.92 4.18 3.95 4.25
1.75 4.60 4.60 3.00 4.80 4.25 4.20 4.20 4.40 .
. 5.00 5.00 . 5.00 5.00 5.00 5.00 . .
3.12 3.61 3.57 2.66 3.58 3.52 3.51 3.62 3.43 4.15
2.71 3.27 3.53 2.38 3.56 3.61 3.70 3.74 3.63 4.43
2.48 3.72 3.89 2.90 4.07 3.39 3.89 3.83 3.87 3.67
2.32 3.65 3.50 3.22 4.04 4.00 3.83 3.73 3.68 3.00
4.00 4.25 3.86 3.33 3.43 3.43 3.71 3.88 3.83 4.00
1.60 3.30 3.64 2.00 3.17 3.18 3.92 4.00 3.60 4.80
3.54 3.55 3.50 3.07 3.19 3.28 3.52 3.61 3.49 4.77
2.78 3.48 3.52 2.91 3.65 3.52 3.51 3.61 3.64 4.00
2.12 3.63 3.92 2.44 4.01 3.72 3.93 4.05 3.76 4.00
3.32 3.25 3.31 2.63 3.32 3.53 3.57 3.64 3.55 4.13
2.40 3.65 3.90 2.31 3.90 3.68 3.65 3.89 3.63 2.50
2.94 2.96 3.70 2.45 3.78 3.38 3.48 3.68 3.73 4.50
1.95 3.50 3.70 1.73 4.00 3.95 4.10 3.85 3.53 5.00
1.94 3.55 3.43 2.07 3.75 3.67 3.63 3.42 3.41 3.67
. . . . . . . . . .
3.60 3.71 3.71 2.00 3.69 3.50 3.73 3.73 3.86 4.50
2.75 3.75 3.94 2.49 3.83 3.72 3.87 3.74 3.63 4.45
2.92 3.42 3.75 2.83 3.61 3.50 4.04 3.88 3.68 4.75
2.00 3.48 3.71 2.73 4.13 3.90 4.03 4.03 3.96 3.83
3.04 3.41 3.44 2.68 3.52 3.46 3.49 3.65 3.57 4.16
2.29 3.63 4.38 4.00 4.14 3.86 3.88 4.13 4.00 .
2.50 2.83 3.50 3.00 3.17 3.17 3.83 3.17 2.80 3.00
2.00 4.00 4.00 . 2.00 4.00 2.00 3.00 4.00 .
3.38 3.50 3.06 1.25 4.00 3.79 3.38 3.50 3.87 5.00
2.62 3.68 3.90 2.38 3.79 3.65 3.82 3.67 3.54 4.57
2.49 3.42 3.33 2.49 3.42 3.18 3.39 3.61 3.28 4.25
2.90 3.41 3.59 2.60 3.74 3.61 3.82 3.82 3.64 4.00
3.18 3.47 3.54 3.12 3.41 3.50 3.42 3.68 3.74 4.13
2.95 3.54 3.62 2.74 3.67 3.63 3.70 3.77 3.70 4.31
1.89 3.50 3.20 1.38 3.91 3.50 3.50 3.20 2.90 .
2.62 3.14 3.53 2.56 3.38 3.02 3.39 3.43 3.19 3.00
3.25 3.45 3.56 3.03 3.69 3.60 3.69 3.65 3.80 4.25
2.84 3.49 3.61 2.63 3.63 3.54 3.65 3.72 3.58 4.24
2.98 3.45 3.47 2.40 3.35 3.03 3.34 3.44 3.17 5.00
2.51 3.73 3.51 2.69 3.87 3.55 3.87 3.84 3.77 3.67
2.92 3.46 3.64 2.73 3.66 3.64 3.68 3.74 3.67 4.27
2.45 3.74 3.72 2.35 4.03 3.89 3.89 4.05 4.03 3.71
2.52 3.73 3.94 1.91 3.88 3.88 3.77 3.89 3.57 4.56
3.15 3.56 3.87 2.52 4.02 3.82 3.84 3.80 3.83 4.88
2.02 3.26 3.54 2.33 3.63 3.42 3.56 3.64 3.59 4.00
. . . . . . . . . .
5.00 3.40 2.60 2.25 1.25 3.20 3.20 3.20 3.75 5.00
3.63 3.38 3.28 3.31 3.15 3.33 3.38 3.60 3.82 3.33
3.89 3.89 3.80 3.56 3.43 3.46 3.85 3.95 3.64 5.00
2.69 3.30 3.39 2.72 3.58 3.35 3.54 3.47 3.28 3.70
Male
Female
Gender
<24
25 - 34 years
35 - 44 years
45 - 54 years
55 +
Participant Age
Married or living with partner
Separated, not living withpartner
Widowed, not living withpartner
Not married, no partner withparents
Not married, not with partner,alone
Status
Yes
No
Caring Responsibilitiesat Home
1
2
3
4
Variety of CaringResponsibilities AtHome
<1hr
1 - 3 hrs
4 - 5 hrs
6 - 7 hrs
8 - 9 hrs
>9 hrs
How much time do youspend in domesticwork?
Less than O- Level equivalent
O-Level
A-Level
Vocational Certification (City &Guilds or equivalent)
University Diploma orequivalent -Local
University Diploma orequivalent -OverseasInstitution
University Degree-Baccalaureate
University Degree- Masters'Level
University Doctoral
Others
What is your highestqualification?
GovernmentOrganisation/Department
Parastatal Company
Publicly Listed Company
Private Company/Sole Trader
Commercial Partnership
Non-profit Organisation
Describe the companywhere you areemployed
Agriculture & Fishery
Stone Quarrying &Construction
Governmental Services
Hotel & Catering
Services
Manufacturing
Sector of Activity
Full time
Ful time (reduced hours)
Part time
What is your presentmain job?
More than One Job
One Job Only
Are you engaged inmore than one job?
Casual
Permanent-Fixed TermContract
Permanent-Indefinite Contract
What is the basis ofyour main job?
Senior Managers, Directors
Professionals
Associate Professionals &Technical
Clerical employees
Skilled agriculture & fisheryworkers
Crafts & related trades
Plant & machine operator,assembly workers
Elementary occupations
Shop & Market services
Your level ofresponsibility
Mean
Physical
Strength
Mean
Job
commitment
Mean
Patience
Mean
Shift
Mean
Communica
tion Skills
Mean
Leading
skills
Mean
Maturity
Mean
Initiative
Mean
Flexibility
Mean
Others

Gender Pay Review
National Commission for the Promotion of Equality
Malta September 2006 page 247 of 327
Table 141 sets out a summary of the responses obtained for question prompting research
participants to indicate how committed women are to work compared with men. A staggering
73% of research participants believed that women and men are equally committed to work,
while almost equal proportions of the remaining 27% perceived differences in such
commitment. Indeed, 18.1% of men thought that women were typically less committed to
their work than men were, while 26.9% of women held that men were less committed to work
than women were.
Table 141 – Commitment of Women to Work compared with Men
Count Valid Percent
More 80 13.7%
Equal 428 73.0%
Less 78 13.3%
Commitment of women compared to men
Total 586 100.0%
16 4.6% 64 26.9%
269 77.3% 159 66.8%
63 18.1% 15 6.3%
More
Equal
Less
Commitment ofwomen comparedto men
N N %
Male
N N %
Female
Gender
5.10 Observed Family Friendly Benefits
A total of 29.2% of respondents observed that their employer provided some form of support
scheme to workers with caring responsibilities. An analysis of these responses (Table 143)
shows that such schemes were more often observed by participants exemplified by:
� men, or
� persons aged between 25 and 34 Years, or
� workers who are married or living with partner, or
� participants not having caring responsibilities at home, or
� workers engaged with the services sector, or
� workers featuring a less than O-level qualifications, or
� workers engaged in a Clerical Occupations, or
� workers having a permanent indefinite contract, or

Gender Pay Review
National Commission for the Promotion of Equality
Malta September 2006 page 248 of 327
� workers engaged in full time jobs.
Table 142 – Summary of Responses relating to Observed Employer Support Schemes for Workers with Caring Responsibilities
Count Valid Percent
Yes 170 29.2%
No 413 70.8%
Does employer offer schemes for workers with caring responsibility? Total 583 100.0%
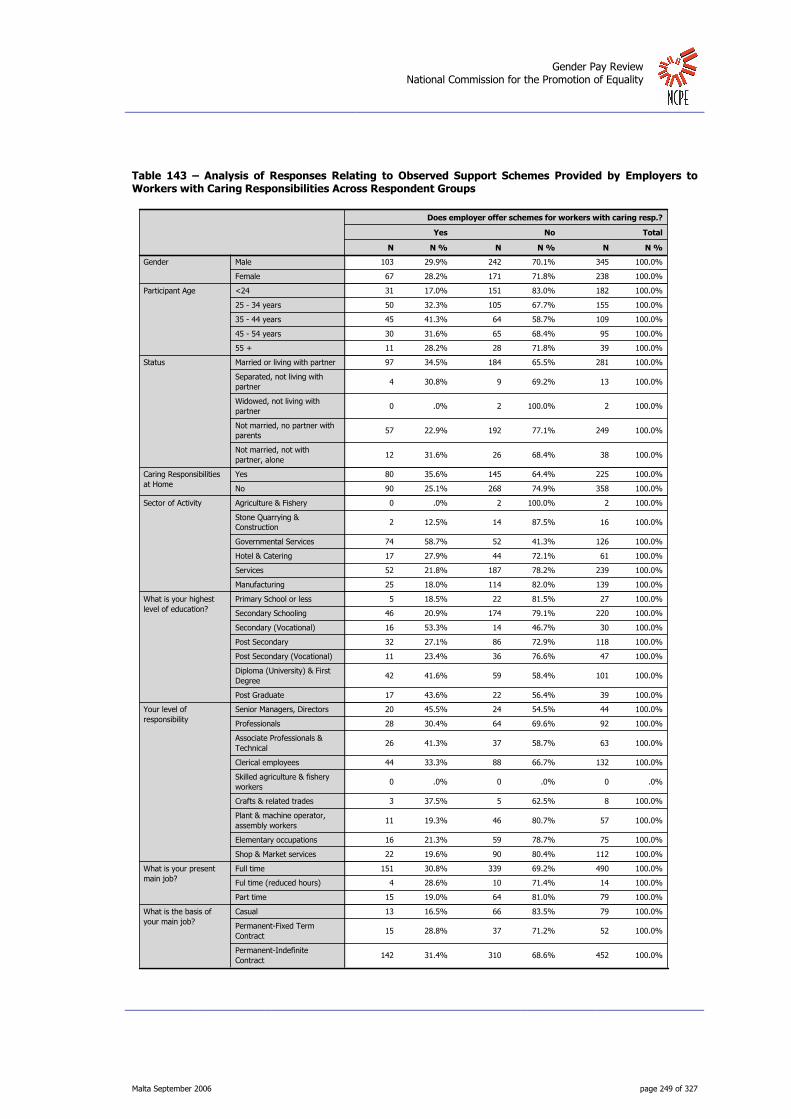
Gender Pay Review
National Commission for the Promotion of Equality
Malta September 2006 page 249 of 327
Table 143 – Analysis of Responses Relating to Observed Support Schemes Provided by Employers to Workers with Caring Responsibilities Across Respondent Groups
103 29.9% 242 70.1% 345 100.0%
67 28.2% 171 71.8% 238 100.0%
31 17.0% 151 83.0% 182 100.0%
50 32.3% 105 67.7% 155 100.0%
45 41.3% 64 58.7% 109 100.0%
30 31.6% 65 68.4% 95 100.0%
11 28.2% 28 71.8% 39 100.0%
97 34.5% 184 65.5% 281 100.0%
4 30.8% 9 69.2% 13 100.0%
0 .0% 2 100.0% 2 100.0%
57 22.9% 192 77.1% 249 100.0%
12 31.6% 26 68.4% 38 100.0%
80 35.6% 145 64.4% 225 100.0%
90 25.1% 268 74.9% 358 100.0%
0 .0% 2 100.0% 2 100.0%
2 12.5% 14 87.5% 16 100.0%
74 58.7% 52 41.3% 126 100.0%
17 27.9% 44 72.1% 61 100.0%
52 21.8% 187 78.2% 239 100.0%
25 18.0% 114 82.0% 139 100.0%
5 18.5% 22 81.5% 27 100.0%
46 20.9% 174 79.1% 220 100.0%
16 53.3% 14 46.7% 30 100.0%
32 27.1% 86 72.9% 118 100.0%
11 23.4% 36 76.6% 47 100.0%
42 41.6% 59 58.4% 101 100.0%
17 43.6% 22 56.4% 39 100.0%
20 45.5% 24 54.5% 44 100.0%
28 30.4% 64 69.6% 92 100.0%
26 41.3% 37 58.7% 63 100.0%
44 33.3% 88 66.7% 132 100.0%
0 .0% 0 .0% 0 .0%
3 37.5% 5 62.5% 8 100.0%
11 19.3% 46 80.7% 57 100.0%
16 21.3% 59 78.7% 75 100.0%
22 19.6% 90 80.4% 112 100.0%
151 30.8% 339 69.2% 490 100.0%
4 28.6% 10 71.4% 14 100.0%
15 19.0% 64 81.0% 79 100.0%
13 16.5% 66 83.5% 79 100.0%
15 28.8% 37 71.2% 52 100.0%
142 31.4% 310 68.6% 452 100.0%
Male
Female
Gender
<24
25 - 34 years
35 - 44 years
45 - 54 years
55 +
Participant Age
Married or living with partner
Separated, not living withpartner
Widowed, not living withpartner
Not married, no partner withparents
Not married, not withpartner, alone
Status
Yes
No
Caring Responsibilitiesat Home
Agriculture & Fishery
Stone Quarrying &Construction
Governmental Services
Hotel & Catering
Services
Manufacturing
Sector of Activity
Primary School or less
Secondary Schooling
Secondary (Vocational)
Post Secondary
Post Secondary (Vocational)
Diploma (University) & FirstDegree
Post Graduate
What is your highestlevel of education?
Senior Managers, Directors
Professionals
Associate Professionals &Technical
Clerical employees
Skilled agriculture & fisheryworkers
Crafts & related trades
Plant & machine operator,assembly workers
Elementary occupations
Shop & Market services
Your level ofresponsibility
Full time
Ful time (reduced hours)
Part time
What is your presentmain job?
Casual
Permanent-Fixed TermContract
Permanent-IndefiniteContract
What is the basis ofyour main job?
N N %
Yes
N N %
No
N N %
Total
Does employer offer schemes for workers with caring resp.?

Gender Pay Review
National Commission for the Promotion of Equality
Malta September 2006 page 250 of 327
Moreover, survey participants indicated the form of support schemes observed to be offered by
their employer, as summarised in Table 144, showing how the most frequent benefit involved
emergency leave for care reasons (78.7% of the cases) and employment on reduced hours
(68.6% of cases). Least observed benefits comprised extended hours’ childcare services (7.7%
of cases) and independent childcare facilities near the employer (8.3% of cases).
An analysis of these responses across respondent groups showed that:
� emergency leave for care reasons was more often observed by participants who were:
– women, or
– younger than 24 years of age, or
– responsible for the care of persons at home, or
– employed with establishments like parastatal companies, publicly listed entities or private
companies, or
– employed with manufacturing concerns, or
– employed in part-time jobs.
� reduced hours were more often observed by participants who were:
– men, or
– between 25 and 34 years of age, or
– independent of caring responsibilities at home, or
– employed with parastatal or publicly listed companies, or
– employed with services companies, or
– employed in full-time jobs.
� Flexitime was more often observed by participants who were:
– men, or
– aged younger than 44 years, or
– independent of caring responsibilities at home, or
– employed with publicly listed companies, or
– engaged with service companies, or
– employed in a full-time job.

Gender Pay Review
National Commission for the Promotion of Equality
Malta September 2006 page 251 of 327
Table 144 – Summary of Support Schemes Offered by Employers to Employees with Caring Responsibilities
36 8.2% 21.3%
14 3.2% 8.3%
92 21.1% 54.4%
116 26.5% 68.6%
21 4.8% 12.4%
13 3.0% 7.7%
133 30.4% 78.7%
12 2.7% 7.1%
437 100.0% 258.6%
Childcare facilities
Childcare facilities nearemployer (but
Flexitime
Reduced hours
Care coundelling
Extended hours childcare services
Emergency leave forcare reasons
Others
ReliefSchemes
a
Total
N Percent
Responses Percent of
Cases
a.

Gender Pay Review
National Commission for the Promotion of Equality
Malta September 2006 page 252 of 327
Table 145 – Analysis of Responses: Observed Family Friendly Benefits Across Respondent Groups
20 9 60 75 14 9 78 7
16 5 32 41 7 4 55 5
13 8 18 21 8 6 31
9 2 27 37 4 2 33 4
8 2 25 29 5 3 33 8
3 1 14 19 3 1 25
3 1 5 8 1 1 9
16 6 42 64 10 5 76 5
1 3 3 1 3 1
15 7 38 41 7 5 47 5
4 1 9 8 4 2 7 1
11 2 39 53 8 4 63 6
25 12 53 63 13 9 70 6
9 2 27 37 6 2 48 5
2 11 15 2 2 14 1
1 1 1
13 5 32 32 8 5 41 1
11 3 38 50 7 4 56 4
2 8 13 3 12 3
2 1 3 3 1 5 1
1 2 3 1 2
4 2 4 8 1 2 9 2
6 1 12 18 3 2 18 1
11 6 17 21 5 4 32 2
4 2 9 18 1 2 16 2
4 1 8 9 1 1 13 1
1 1 9 7 5 1
5 2 10 12 5 1 13 3
4 1 13 14 3 2 22 1
1 6 9 2 1 6 1
8 8 1 8
13 5 36 57 4 5 54 8
3 2 11 17 2 14 2
8 9 4 8 1
19 7 35 32 10 8 52 1
1
1 2 1 1 4
1 1 1
15 7 38 59 4 5 56 8
10 4 10 9 4 4 16
9 2 32 37 11 2 39 3
2 1 12 10 2 2 21
27 10 84 105 17 10 118 12
1 4 1 1 3
9 4 7 7 3 2 12
5 1 13 19 4 1 21 3
31 13 79 97 17 12 112 9
6 3 6 3 2 1 11
4 3 7 10 4 2 13 1
26 8 79 103 15 10 109 11
1 1 10 13 2 1 17 2
9 2 15 17 5 4 22 2
7 3 18 22 5 1 20 4
6 2 21 35 2 1 33 3
3 2 2
2 7 4 1 1 8 1
2 1 9 13 1 1 13
9 5 9 10 5 4 18
Male
Female
Gender
<24
25 - 34 years
35 - 44 years
45 - 54 years
55 +
Participant Age
Married or living with partner
Separated, not living with partner
Not married, no partner with parents
Not married, not with partner, alone
Status
Yes
No
Caring Responsibilitiesat Home
1
2
3
Variety of CaringResponsibilities AtHome
<1hr
1 - 3 hrs
4 - 5 hrs
6 - 7 hrs
8 - 9 hrs
>9 hrs
How much time do youspend in domesticwork?
Less than O- Level equivalent
O-Level
A-Level
Vocational Certification (City & Guilds or equivalent)
University Diploma or equivalent -Local
University Diploma or equivalent -Overseas Institution
University Degree- Baccalaureate
University Degree- Masters' Level
Others
What is your highestqualification?
Government Organisation/Department
Parastatal Company
Publicly Listed Company
Private Company/Sole Trader
Commercial Partnership
Non-profit Organisation
Describe the companywhere you are
employed
Stone Quarrying & Construction
Governmental Services
Hotel & Catering
Services
Manufacturing
Sector of Activity
Full time
Ful time (reduced hours)
Part time
What is your presentmain job?
More than One Job
One Job Only
Are you engaged inmore than one job?
Casual
Permanent-Fixed Term Contract
Permanent-Indefinite Contract
What is the basis ofyour main job?
Senior Managers, Directors
Professionals
Associate Professionals & Technical
Clerical employees
Crafts & related trades
Plant & machine operator, assembly workers
Elementary occupations
Shop & Market services
Your level ofresponsibility
Childcare
facilities
Childcare
facilities near
employer (but
independent)
FlexitimeReduced
hours
Care
coundelling
Extended
hours child
care services
Emergency
leave for
care reasons
Others
Observed Family Friendly Benefits

Gender Pay Review
National Commission for the Promotion of Equality
Malta September 2006 page 253 of 327
Table 145 – Analysis of Responses: Observed Family Friendly Benefits Across Respondent Groups (continued)
19.6 8.8 58.8 73.5 13.7 8.8 76.5 6.9
23.9 7.5 47.8 61.2 10.4 6.0 82.1 7.5
40.6 25.0 56.3 65.6 25.0 18.8 96.9
18.0 4.0 54.0 74.0 8.0 4.0 66.0 8.0
18.2 4.5 56.8 65.9 11.4 6.8 75.0 18.2
10.3 3.4 48.3 65.5 10.3 3.4 86.2
27.3 9.1 45.5 72.7 9.1 9.1 81.8
16.8 6.3 44.2 67.4 10.5 5.3 80.0 5.3
25.0 75.0 75.0 25.0 75.0 25.0
25.9 12.1 65.5 70.7 12.1 8.6 81.0 8.6
33.3 8.3 75.0 66.7 33.3 16.7 58.3 8.3
14.1 2.6 50.0 67.9 10.3 5.1 80.8 7.7
27.5 13.2 58.2 69.2 14.3 9.9 76.9 6.6
15.0 3.3 45.0 61.7 10.0 3.3 80.0 8.3
11.8 64.7 88.2 11.8 11.8 82.4 5.9
100.0 100.0 100.0
25.0 9.6 61.5 61.5 15.4 9.6 78.8 1.9
15.7 4.3 54.3 71.4 10.0 5.7 80.0 5.7
13.3 53.3 86.7 20.0 80.0 20.0
33.3 16.7 50.0 50.0 16.7 83.3 16.7
33.3 66.7 100.0 33.3 66.7
40.0 20.0 40.0 80.0 10.0 20.0 90.0 20.0
26.1 4.3 52.2 78.3 13.0 8.7 78.3 4.3
31.4 17.1 48.6 60.0 14.3 11.4 91.4 5.7
17.4 8.7 39.1 78.3 4.3 8.7 69.6 8.7
21.1 5.3 42.1 47.4 5.3 5.3 68.4 5.3
10.0 10.0 90.0 70.0 50.0 10.0
35.7 14.3 71.4 85.7 35.7 7.1 92.9 21.4
16.0 4.0 52.0 56.0 12.0 8.0 88.0 4.0
10.0 60.0 90.0 20.0 10.0 60.0 10.0
80.0 80.0 10.0 80.0
18.1 6.9 50.0 79.2 5.6 6.9 75.0 11.1
15.8 10.5 57.9 89.5 10.5 73.7 10.5
80.0 90.0 40.0 80.0 10.0
30.2 11.1 55.6 50.8 15.9 12.7 82.5 1.6
100.0
25.0 50.0 25.0 25.0 100.0
50.0 50.0 50.0
20.3 9.5 51.4 79.7 5.4 6.8 75.7 10.8
58.8 23.5 58.8 52.9 23.5 23.5 94.1
17.0 3.8 60.4 69.8 20.8 3.8 73.6 5.7
8.7 4.3 52.2 43.5 8.7 8.7 91.3
17.9 6.6 55.6 69.5 11.3 6.6 78.1 7.9
25.0 100.0 25.0 25.0 75.0
64.3 28.6 50.0 50.0 21.4 14.3 85.7
17.2 3.4 44.8 65.5 13.8 3.4 72.4 10.3
22.1 9.3 56.4 69.3 12.1 8.6 80.0 6.4
50.0 25.0 50.0 25.0 16.7 8.3 91.7
26.7 20.0 46.7 66.7 26.7 13.3 86.7 6.7
18.3 5.6 55.6 72.5 10.6 7.0 76.8 7.7
5.0 5.0 50.0 65.0 10.0 5.0 85.0 10.0
32.1 7.1 53.6 60.7 17.9 14.3 78.6 7.1
25.9 11.1 66.7 81.5 18.5 3.7 74.1 14.8
13.3 4.4 46.7 77.8 4.4 2.2 73.3 6.7
100.0 66.7 66.7
18.2 63.6 36.4 9.1 9.1 72.7 9.1
12.5 6.3 56.3 81.3 6.3 6.3 81.3
47.4 26.3 47.4 52.6 26.3 21.1 94.7
R %Male
R %Female
Gender
R %<24
R %25 - 34 years
R %35 - 44 years
R %45 - 54 years
R %55 +
Participant Age
R %Married or living with partner
R %Separated, not living with partner
R %Not married, no partner with parents
R %Not married, not with partner, alone
Status
R %Yes
R %No
Caring Responsibilitiesat Home
R %1
R %2
R %3
Variety of Caring
Responsibilities AtHome
R %<1hr
R %1 - 3 hrs
R %4 - 5 hrs
R %6 - 7 hrs
R %8 - 9 hrs
R %>9 hrs
How much time do you
spend in domesticwork?
R %Less than O- Level equivalent
R %O-Level
R %A-Level
R %Vocational Certification (City & Guilds or equivalent)
R %University Diploma or equivalent -Local
R %University Diploma or equivalent -Overseas Institution
R %University Degree- Baccalaureate
R %University Degree- Masters' Level
R %Others
What is your highest
qualification?
R %Government Organisation/Department
R %Parastatal Company
R %Publicly Listed Company
R %Private Company/Sole Trader
R %Commercial Partnership
R %Non-profit Organisation
Describe the company
where you areemployed
R %Stone Quarrying & Construction
R %Governmental Services
R %Hotel & Catering
R %Services
R %Manufacturing
Sector of Activity
R %Full time
R %Ful time (reduced hours)
R %Part time
What is your present
main job?
R %More than One Job
R %One Job Only
Are you engaged in
more than one job?
R %Casual
R %Permanent-Fixed Term Contract
R %Permanent-Indefinite Contract
What is the basis ofyour main job?
R %Senior Managers, Directors
R %Professionals
R %Associate Professionals & Technical
R %Clerical employees
R %Crafts & related trades
R %Plant & machine operator, assembly workers
R %Elementary occupations
R %Shop & Market services
Your level ofresponsibility
Childcare
facilities
Childcare
facilities near
employer (but
independent)
FlexitimeReduced
hours
Care
coundelling
Extended
hours child
care services
Emergency
leave for
care reasons
Others
Observed Family Friendly Benefits
5.11 Findings from Qualitative Field Research
5.11.1 Equality & Protection at Work
Qualitative research showed that a proportion of workers consider themselves to have been
unfairly treated by their employer or by prospective employers. The basis of injustice varies,
gender discrimination being one of the factors involved. Unfair treatment is suffered both by

Gender Pay Review
National Commission for the Promotion of Equality
Malta September 2006 page 254 of 327
those in the private sector as well as by those who work in parastatal/state employers. None of
those interviewed sought to redress the perceived injustice through the industrial tribunal.
There were those who chose to take no action while others sought to defend themselves.
There were those who sought legal advice. Trade unions did not feature much as a protective
measure against injustice.
One of the cases concerned Carla, a front officer with a parastatal organisation who was
assigned to work at a particular site where she should not have been alone (not because she is
a woman but because she believes her type of work requires two persons to be present on any
site). She was sexually harassed by the watchman and she reported the case. Instead of
transferring the watchman, the employer transferred her, advising her to seek psychological
help. Whilst not wanting the watchman to lose his job, she wished to continue working at the
same site. She wanted justice and even sought redress through the National Commission for
the Promotion of Equality. The watchman was only transferred a year later.
Apart from her experience of sexual harassment, Carla also complained that at work she has
added responsibilities for which she is not paid. Although Carla is the only woman in her
section, and her male colleagues do not accept such conditions, Carla does not consider this as
a gender issue. The difference in treatment is between the old and new employees. Carla is
still on probation and is employed on contract with a parastatal organisation while Government
seconds the older workers (with a more secure employment). Carla claims that although in the
past, women were given different tasks and responsibilities on the basis of gender, this is no
longer the case nowadays. The demarcation line lies between old and new employees.
Unfair treatment was also evident in relation to promotion and recruitment practices. Although
many of those interviewed were of the opinion that employers associate jobs with a specific
gender, it was Anthea who was directly discriminated on the basis of her sex by a well-
established food importing and distributing company. Anthea is a sales representative who
claims to have applied for a job with this company whose policy is to employ male sales persons
only. This was specifically stated in the letter of refusal she received from the company
informing her that her application was not considered. Anthea did not feel that she should take
any action to defend her case because she accepted that this was company policy. Paul also
mentioned the same company, claiming that a few years ago when the company still employed
women in sales, it terminated the employment of one of its female sales representatives simply
because she was getting married – despite this woman’s sterling quality of work she provided
for her employer.

Gender Pay Review
National Commission for the Promotion of Equality
Malta September 2006 page 255 of 327
The issue of gender discrimination did not feature much in relation to promotions. Gender may
feature in an indirect way where promotions are concerned such as when women are employed
on a part-time basis or working reduced hours, thus reducing their chances for promotion.
Women are also disadvantaged as a result of having to break their careers. Qualitative
interviews revealed that in many cases, promotions are not awarded on the basis of merit,
experience, qualifications or commitment but are a question of personal preference. This is
especially the case in lesser paying jobs within the private sector. Dorian, a delivery-man, sees
promotion as a remote possibility because at his place of work this depends on knowing the
right people. Damian, a security officer also claims that promotions are a question of
preference – with instances recalled relating to persons promoted to senior posts within three
years of employment. Indeed, Damian does not mind working more overtime than that
permitted by law since he feels it is a question of give and take. He is confident that his boss
will make it up to him in terms of leave, roster and promotion.
Celine who worked for two years at a fast food restaurant claimed similar criteria. If the
management likes the way a worker deals with the customers or the way she smiles, she would
be promoted. Celine was never promoted although once she had an opportunity – only to
refuse owing to exams. She was never offered another chance. She claims that even when
training sessions that lead to promotions are held, not all workers are given the opportunity to
attend. A list of names is published of those who have been chosen by the management.
One case of unfair treatment concerned a deliveryman who was involved in a car accident a few
minutes after leaving work driving his own car. The storekeeper sought to dismiss him from
work as a consequence of the accident although he still retained his job since the company
director overruled the storekeeper’s decision. James, a senior tradesman with a parastatal
organisation claims to have had two days’ pay deducted from his salary when he was on sick
leave and the company doctor did not find him at home. He claimed to have been visiting his
doctor although his defence was not accepted during the disciplinary inquiry where he
represented himself. He considered this to be unfair since this was the first time it happened
and he felt he could have been given a warning instead. One has to note that the issue of
fairness or unfairness has a subjective element tied to it. There may be cases where the
worker feels unjustly treated but would not necessarily have a case. For example, James also
claims to have injured himself while on duty. There was an inquiry, which he feels was unjustly
carried out since nobody went on site to make inspections as normally happens. James was
not given any compensation as he was not wearing any safety equipment. He claims that he is

Gender Pay Review
National Commission for the Promotion of Equality
Malta September 2006 page 256 of 327
unable to wear the safety shoes provided by the company due to a skin condition he suffers
from. However although his doctor certified that he suffers from eczema, he did not back up
his argument against wearing safety shoes.
Others may choose to leave their job if they feel they are unfairly treated. Maria is happy at
work and she has never felt discriminated. If she were to be unfairly treated, she would just
quit.
5.11.2 Gender Orientation
Qualitative interviews typically indicated that certain jobs are more suitable for either men or
women. A proportion of men believed that their particular job was unsuited for women as in
the case of deliverymen, security guards, labourers and maintenance workers as well as
electricity and air-conditioning installation. In other cases, interviewees commented on what
they regarded as male work even though they did not consider their work as gender specific.
Such was the case of Victoria, a bank employee – with the main reasons pointing at physical
and strenuous work that is better performed by men or because it may be more dangerous for
women to be alone in remote areas day and night (as in the case of security work or workers
assigned to open heritage sites). Contrastingly, less jobs were considered to be unsuitable for
men. Anthea feels that women are better at sales and Corinne argued that women could be
more capable of obtaining certain information as journalists although she did not consider
journalism to be a woman’s job.
Many of those interviewed believe that many employers have a specific gender in mind when
they advertise for jobs or recruit workers. That is why certain sectors remain male- or female-
dominated. Dorian claims that his company never employs women for delivery work as it
involves carrying heavy loads. Joseph does not know of any female drivers employed with the
parastatal company where he works. Sexist recruitment practices do not necessarily reflect
suitability however, because (as discussed elsewhere in this document) there are companies
that despite the anti-discrimination legislation, continue to discriminate against married women
and/or mothers. Although Anthea believes that females make better sales representatives
(because they have better persuasive skills than men) she was herself the victim of sex
discrimination by a company whose policy it is not to employ female sales representatives.
Gendered perceptions that are manifest in the recruitment practices of employers continue to
reinforce gender stereotypes both among workers and their employers. This is evident when
Gender Pay Review
National Commission for the Promotion of Equality
Malta September 2006 page 257 of 327
one looks at jobs that are open to both males and females but which somehow seem to attract
one sex more than the other such as tourist guidance (female) or security work (male).
Gendered orientations at work do not stop upon recruitment but are also reflected in the tasks
and responsibilities assigned to men and women. Corinne, a journalist, believes that women
have to work harder in order to prove themselves. At her place of work, it is common practice
for men to be assigned coverage of ‘hard’ news such as politics and the economy while women
are sent to cover the softer news such as entertainment, fashion and culture – despite the fact
that the head of news is a woman. Corinne does not feel this is intentional but rather
engrained in our culture.
Carla also encountered gendered practices at her place of work although she claims that they
have now stopped. Up to a year before this study, women were not assigned to certain posts
because they did not drive.
5.11.3 Leave
V a c a t i o n & S i c k n e s s L e a v e
Qualitative research suggests that workers who do not have vacation or sick leave are those
who work on an hourly basis such as casual workers or as in the case of tourist guides
(freelance workers). Since women make up the majority of casual and temporary workers, they
are less likely to have such benefits compared to men.
Some employers were observed to adhere strictly to the 19-hour limit to avoid meeting leave
obligations. Celine claims that at the fast food restaurant, where almost everyone is employed
on an hourly basis, management is extremely careful not to let any worker exceed the 19
hours. If a worker requests to switch shifts with another worker, management first checks
whether this has an impact on the 19-hour limit.
There are also employers that abuse the system even further – as revealed by John who is a
security officer. Security guards may be employed on a part-time basis and required to work
much longer hours. In order to conceal this, the worker is issued with three separate
payments. This benefits the management in more than one way while the worker has to suffer
the consequences. The management avoids having to give vacation and sick leave to these
workers as well as having to pay overtime rates.

Gender Pay Review
National Commission for the Promotion of Equality
Malta September 2006 page 258 of 327
While workers may have the option of availing themselves of vacation and sick leave, they may
still encounter problems. For example, it is not easy for security guards to get their vacation
leave approved especially if it is for more than one day according to John.
Carla, who works as a front officer with a parastatal organisation also complained about
vacation leave, claiming that vacation leave has to be booked months before while approval is
not given before the last minute. Besides, in order to avail herself of vacation leave, an
employee has to find a replacement – often proving to be a very difficult arrangement. If the
employee finds no replacement, vacation leave is not availed.
A similar situation is faced by Natasha. As a freelancer Natasha not only does not have
vacation or sick leave benefits but she also has to find someone else to replace her on
occasions when she cannot work. Since sick leave is not planned, this further complicates
matters since she would have to find a tourist guide to replace her in a matter of hours.
P a r e n t a l L e a v e
Outside civil service employment, where both men and women are offered the possibility to
take parental leave, there are certain workers who are offered maternity or other forms of leave
at the discretion of the employer. Among the interviewees, those working at the bank, some
workers in parastatal organisations as well as a journalist employed with a television station
claimed to have parental leave although in none of the cases is this extended to men. Corinne,
the journalist claims that women are offered one year unpaid maternity leave. They tried to
win more time during the collective agreement negotiations but did not succeed. Sonia, who is
currently on unpaid maternity leave from the bank, states that a mother can take one year
unpaid leave, with two years granted only in special cases. However, this is subject to approval
and is granted only under certain circumstances such as in the case of having children with
disabilities or if the worker proves that she does not have anyone with whom to leave the child.
The bank also offers the possibility of a six-month period of emigration leave to all employees.
Parental leave has its obvious benefits especially when the alternative is for the parent, usually
the mother, to resign from the job. However, when a mother takes parental leave she also has
to face certain consequences such as less opportunities for training and promotion. Although
workers on unpaid parental leave do not lose their job, they may be transferred to another post
such as in the case of teachers or bank employees. Sonia is sure that after her maternity leave
she will be transferred to another branch according to the exigencies of the bank although she
Gender Pay Review
National Commission for the Promotion of Equality
Malta September 2006 page 259 of 327
will not lose her grade or pay. Sonia does not regret taking maternity leave because she looked
forward both to the break from work as well as to spending time with her baby daughter.
However, since her husband works in the private sector, she was the only one who could take
the unpaid leave option. As Sonia’s salary is higher than that of her husband, she would have
preferred to continue working herself and for her husband to take parental leave if he had the
option.
W o r k a t H o m e
None of the participants interviewed worked from home or claimed to dedicate time for work at
home. None of the interviewees expressed an interest in working from home.
5.11.4 Remuneration & Pay.
E n h a n c i n g P a y – O v e r t i m e & O t h e r P a y m e n t s
Both men and women employed in lower level occupations such as security guards, delivery
persons, maintenance workers, drivers, general hands, sales persons and labourers claim to
receive a very low income that in certain cases can be significantly enhanced by overtime or
commissions. Certain categories of workers however hardly have any opportunity to
supplement their basic income especially those who work with government departments or
parastatal organisations.
Joseph works as a driver with a parastatal corporation seconded by the government and works
under the same conditions as the employees of the corporation. His salary, after 38 years in
employment, is in the lowest scales. In the past, his salary was higher because he worked
overtime and shifts which carried allowances. As a result of recent restructuring, however, the
shift system was eliminated and now he just receives his basic pay and has no opportunity for
overtime. Maria, a general hand working with a parastatal organisation, also receives very low
pay, and has no opportunity for extra income. The only time she works overtime is when there
is a social function at her place of work.
Within the private sector, overtime work depends on the nature of work and on market
demand. For example, Dorian who works as a delivery man with a private company used to
work overtime frequently until recently – a consequence of the company’s response to
increased competition from firms importing similar goods. One sector that provides

Gender Pay Review
National Commission for the Promotion of Equality
Malta September 2006 page 260 of 327
opportunities for overtime work is security work. Security guards, especially those employed by
security companies are among the lowest paid employees reviewed within this study. Such
feature is claimed to be result of harsh price competition among security firms that market their
services through competitive bids. In securing contracts, these firms had to cut down on
salaries – with flat rates paid as low as Lm 1.25 to Lm 1.37 per hour. A guard working the
basic hours will earn about Lm 200 monthly. Some companies pay as little as Lm 1 hourly,
pushing security workers to work long hours of overtime with resultant abuse apparent – with
65- to 80-hour work weeks typical for guards when they earn a modest Lm 400 monthly. Even
then, such guards may not be paid at a standard overtime rate for all the hours of overtime
worked. There are companies that issue separate cheques through different establishment
entities, so that it looks as if the employee is not working overtime. There are companies that
pay a certain number of hours at a certain rate (e.g. the first 10 hours) and the rest at a lower
rate. In certain cases, overtime is not taken as that which exceeds the 40-hour week, but a
certain number of hours, such as the case when the total hours worked exceeds 70 hours. Up
to such hours, the employee receives a basic hourly rate. Some companies also distinguish the
overtime rates paid by the sites at which security people are assigned – with some instances
known to be exempt from any overtime rates. Often, workers do not have much choice if they
do not want to take home a low remuneration – with employers often making their security
personnel accept such conditions or opt for a strictly 40-hour week alternative.
B o n u s e s & C o mm i s s i o n s
Another source of supplementary income within the private sector is commission especially in
the retail and wholesale sector.
Nevertheless, qualitative interviews suggest no particular differences between males and
females regarding bonuses or commissions received, although bonuses are relatively more
common among higher-level workers. Anthea was the only interviewee who receives a
commission as a sales representative. She claimed to receive a commission equivalent to her
basic salary. Commission is worked out each year in comparison to the sales made the previous
year. Once she reaches the sales quota of the previous year (or 100% of the sales target) she
receives Lm 200 monthly commission. Otherwise, her employer pays commission on a pro-rata
basis. Apart from commission, she also receives penetration and servicing bonuses.
Penetration bonus depends on the number of shops she enters in her route. Servicing relates
to whether she manages to sell all four product-lines her firm distributes.

Gender Pay Review
National Commission for the Promotion of Equality
Malta September 2006 page 261 of 327
Michael (a university student employed with a currency exchange bureau on a part-time basis)
claims to have benefited from two of the various incentive schemes offered by the company for
workers to earn extra income. These incentives are tied to the workers’ ability to convince
customers to exchange larger sums of money.
Bank employees also benefit from a number of incentive schemes such as subsidised loans,
sponsored work-related studies, health insurance schemes as well as performance bonuses.
Performance at the bank is linked with performance – measured in terms of sales of insurance
policies, number of accounts opened and so on. This may put women who work on reduced
hours at a disadvantage since they have less time available to perform like other full-time
workers. However, this is not necessarily the case – a woman working 30 hours weekly may
still perform better than a full-time worker if she works hard enough according to Sonia (a bank
employee).
E a r n i n g s D i f f e r e n c e
There appears to be a discrepancy between workers’ perceptions concerning the gender pay
gap and the social reality revealed by the quantitative research. Almost all of the qualitative
research participants regardless of sex, occupation, social class and level of education denied
that men and women receive different earnings. Michael, a University student who works as a
clerk on a part-time basis claimed that he never encountered any differences in any of the work
places where he was employed during the past five years. Victoria, who is a bank manager,
claims that there is no gender pay gap at the bank. Corinne, a journalist, does not believe that
there are gender differences in pay among those who are better qualified or among
professionals although she believes these exist among women and men in lower paid jobs
especially in the tourist industry. James, a senior tradesman with a parastatal organisation
believes that men and women who do the same work receive the same pay. According to
Celine, who worked in a fast food chain for two years, men and women employed in the same
grade are paid the same rates. David, a casual printing press worker, considers his pay similar
to other casual workers although he believes that office workers and machine operators earn
better salaries. Dorian, a deliveryman, also claims that deliverymen employed by other
companies or with the government earn the same salary he does.
At the same time there were those who hinted at gender differences in earnings that may be
due to factors beyond the standard pay rates of male and female employees occupying similar
posts and performing similar duties.

Gender Pay Review
National Commission for the Promotion of Equality
Malta September 2006 page 262 of 327
Perceived differences in pay existed in relation to different grades or between workers who
have different levels of seniority. Some of the interviewees compared their salaries with those
earned by workers employed in similar occupations with other organisations or by workers
doing similar work in different sectors. Other interviewees, however, held no opinion regarding
what others earned, largely as a result of indifference as Maria (a general hand with a
parastatal organisation) explained. Indeed, it was only recently that Maria learnt that her friend
(also employed as a general hand) has a higher income than hers as a consequence of being
employed with a Government department. On the contrary, Joseph, (as a driver with a
parastatal corporation on secondment by the government) claims that the corporation
conditions are slightly better than those offered by his employer. At the same time, Joseph
believes that drivers in the private sector have a higher income although he never enquired
about it. Maria has not done anything about her discovery yet since it was only recently that
she realised there was a discrepancy.
Contrastingly, security guards appear to receive similar rates of pay largely due to the harsh
competition prevailing among their employers. Although rates of pay vary from one company
to another by a few cents weekly, they consider themselves underpaid were it not for the large
amount of overtime work they do. However, security guards not engaged with security
companies earn better salaries since their pay is set according to established scales and
regulated accordingly. It is even more difficult for women to work the long hours of security
guards. There are guards who work 48 straight hours in remote areas day and night. Such
long hours are even difficult for married men, let alone for women with young families. As John
confesses, there was a time when working from 05:30 till 21:00 for six days weekly nearly
broke up his family and himself, ‘hardly ever seeing the three children… and could not take it
any longer’.
Noel, a project leader, believes that although about 40% of project leaders are female, these
would probably earn less than men because it is men who are assigned the higher profile
projects. Women are also more likely to be working on temporary assignments. He believes
pregnancy to be the main issue. He sees women as being in a difficult situation. A married
woman my suffer the consequences of motherhood while a single woman may be seen as too
independent and as more likely than men to make an abrupt move such as emigrating or
leaving her job for other reasons.
Comparing her job with that of other sales persons in other companies, Anthea feels she has
better working conditions. For example, other companies do not provide a company car but

Gender Pay Review
National Commission for the Promotion of Equality
Malta September 2006 page 263 of 327
pay a limited travel allowance that does not cover the commuting expenses involved. Certain
companies pay commission to employees only when they collect money from customers –
Anthea’s commission is paid irrespective of the clients’ settlement of dues. Comparing her
salary to new employees in the same company, her pay is higher due to seniority.
Corinne who worked at a fast food restaurant for two years claims that a similar chain pays
slightly higher rates. In her present work as a journalist, she considers her pay as
unsatisfactory – but does not complain in view of restructuring process presently underway at
her employer’s establishment involving cost-cutting measures and possibly employee layoffs.
Compared to journalists in her newsroom, Corinne has the highest pay due to seniority.
Journalists at her place of work receive the same pay regardless of their qualifications.
Compared to journalists working for Government controlled companies, her salary is considered
lower although she believes that journalists in the private sector receive more or less a similar
salary.
Natasha, a young freelance tourist guide, also brought up the issue of women’s disadvantaged
position. Although women and men are not paid different rates, the earnings of the tourist
guide depend on the number of hours worked (since most guides work freelance) and the
languages spoken. Guides who speak languages that are not common in Malta (such as
Japanese or Russian) demand very high rates for their services. The Maltese guides also have
to compete with foreigners in this regard.
There are more female than male guides and demand for their services depends much on the
number of languages they speak. This does not necessarily put women at a disadvantage.
However, a guide will lose work opportunities if she repeatedly refuses assignments. As
Natasha explained, as freelancers, tourist guides do not have vacation or sick leave. If an
agent calls for the guide’s services and the guide refuses on repeated occasions, the agent will
turn to someone else. This puts pregnant women and young mothers at a disadvantage since
they are more likely to be unable to work on occasions. In certain cases, where the guide is
employed on a full-time basis with an agency, she may be offered office work during her
pregnancy or early motherhood although such cases are uncommon.
Although occupations that offer opportunities for extra income among lower level jobs may be
found in both male- and female-dominated sectors, it is often more difficult for women
(especially with home/caring responsibilities) to take such opportunities. Anthea admits that it
is difficult for wives and mothers to cope with her working hours – a point shared by Carla (a

Gender Pay Review
National Commission for the Promotion of Equality
Malta September 2006 page 264 of 327
front officer with a parastatal organisation). Carla cannot imagine a married woman working
the long hours of overtime she is expected to work, and it is not uncommon for her to be
informed only one hour before that she has to work overtime. Such situation is often even
difficult for single persons employed with the same establishment.
Nevertheless, qualitative research suggests that the issue of pay discrepancy among workers
performing similar jobs does not feature as a controversial issue. None of the workers
identified pay discrepancy especially on the basis of gender as a source of injustice or
discrimination although many workers are still not content with what they earn.
P r o m o t i o n s
Promotion opportunities are another source of gender inequality in earnings. Victoria, who
started her bank career as a clerk twenty years ago, worked her way up to a managerial post.
She believes that the bank offers incentives to all those who want to continue studying.
Obtaining the desired qualifications is very often tied to promotions. Victoria appreciates the
encouragement she receives from the bank. With her prior qualifications she could not
continue advancing in her career. It would also have been difficult had she had a career break.
Victoria is married but does not have children. Therefore, although she is convinced that there
is no gender pay gap, her female colleagues might not have had the same promotion
opportunities she had. As the bank does not extend parental leave to men, it is female workers
who mostly avail themselves of career breaks. Sonia is one of these women. She is a bank
employee on unpaid parental leave. Since she started working with the bank as a clerk, she
was promoted once. Having a certificate in financial advising automatically leads to promotion.
Bank employees are encouraged to follow this course and many are the women who completed
it successfully. However, Sonia had to stop on becoming a mother although her newborn was
not the only reason she stopped. She had also failed two subjects. If Sonia is offered a
promotion, it is her family that she would consider first. If a promotion entails longer working
hours, she is inclined to refuse it. If a worker refuses a promotion more than once s/he will
probably not be considered in the future. Women with children find it difficult to work longer
hours although there also men who do not like working overtime. However, women have more
problems – with late arrival to work a common incidence among mothers who arrive late for
work because of child commitments.
Many young mothers at the bank also tend to opt for reduced working hours. The bank does
not discriminate against women who are on career breaks or who work on reduced hours.

Gender Pay Review
National Commission for the Promotion of Equality
Malta September 2006 page 265 of 327
Sonia is still informed of any training and promotion opportunities offered by the bank even
though she is on maternity leave. She also claims that the bank does not consider these
circumstances when giving promotions. Commitment is more important for the bank.
However, there were cases where women suffered the consequences of their circumstances.
After all, commitment is more difficult when one has the responsibility of a young family.
Noel, the project leader, believes that women are not promoted at the same pace as men. Men
are the promoters and they apparently feel more secure in promoting men – who are perceived
as more likely to stay long with their employer. Women leave in response to their husband’s
career or studies or as a consequence of motherhood. Women who take career breaks are
disadvantaged according to Noel as they miss opportunities for training, study and promotion
and if they return to work in their early 40’s they would also be disadvantaged due to their age.
Being a part-timer also reduces one’s chances for promotion. Michael claimed that unless he
becomes a full-timer, he will never be offered the opportunity for promotion. Since it is women
who are more likely than men to be performing part-time work, this puts more women than
men at a disadvantage.
Although lower level jobs may offer less opportunity for promotion, there are jobs that offer this
possibility. For example, Damian, a security officer, claims that those who are promoted to
senior posts (such as ‘cash in transit’) or night patrollers earn significantly more. Such a
promotion may equate to an extra Lm 100 weekly. Security work is a male-dominated sector
and Damian does not know of any woman who occupies a senior post.
N e g o t i a t i o n o f P a y
Qualitative research also indicates that most workers do not negotiate their pay. Pay rates are
either set by the government or by the management in the case of the private sector.
Otherwise, they are established by means of a collective agreement between the employer and
employees through trade union intervention. Some employees claimed that upon recruitment
they were asked what salary they expected. Damian (during his interview for a post of a
security guard) told the management that he would not work for less than what he was
earning. However his target is only reached after long hours of overtime. There were also a
few workers who were not sure whether their salary is based on a collective agreement or
whether it was established by the management alone.

Gender Pay Review
National Commission for the Promotion of Equality
Malta September 2006 page 266 of 327
Victoria was the only worker who claimed to have been involved in some form of negotiation
with the bank management – even though the bank does not normally negotiate pay.
However, when the bank was in the process of computerisation about ten years ago, the
workers involved spoke with the management. They felt that this work required more
responsibility, study, travelling abroad and longer hours of work even during weekends.
Indeed, pay was improved across all levels.
Kenneth, a maintenance worker, did not negotiate his salary. However, once he asked for a
raise and his employer accepted his request because he showed commitment. Michael (a part-
time worker with a currency exchange bureau) claims that pay is not negotiated by employees
but set by the management. As a part-timer, Michael is satisfied with his salary. However
many full-timers were unhappy with their income to the extent that during his short span with
the company, seven full-time workers resigned from their job as a result. Those employed to
replace them also resigned due to low salaries. Contrary to what literature suggests, Michael
claims that in this company, men tend to accept the pay they are offered even if they are
unhappy, while it was a woman who managed to bring about a change. She complained to the
management and threatened to leave if salaries were not raised. As a result, and probably also
due to the other resignations, the management decided to increase salaries.
Evidence from qualitative interviews suggests that both men and women change jobs to
improve their pay and conditions of work although individuals with little or no qualifications
tended to change jobs more often.
P r o s p e c t s f o r B e t t e r P a y o r P r o m o t i o n
Commitment was also a factor mentioned by a number of participants during qualitative
interviews although what employers look for when promoting their employees also depends on
the type of work involved. Michael, a part-time clerk, associates hard work and effort together
with qualifications with better pay or promotion prospects. Better pay also depends on how the
company is doing financially. In non-manual occupations, such as those of bank employees,
qualifications and promotions are directly linked with higher pay prospects. For Anthea,
qualifications are not important in her line of work. A sales representative must feature the
necessary skills to deal with people (such as shop and bar owners) and to persuade customers
to buy products – a skill that is independent of qualifications.
Gender Pay Review
National Commission for the Promotion of Equality
Malta September 2006 page 267 of 327
At the fast food restaurant where Celine used to work, all employees work on an hourly basis.
Prospects for better pay depend on promotion, which is not awarded to workers who feature no
commitment. Nevertheless, Celine claims that promotions are more a question of preferences.
A promotion was offered to her once, which she declined owing to her facing some exams in
pursuing academic studies. Since then, she claims to have been branded as lacking
commitment and was never offered another promotion again. Dorian shares such views,
claiming that promotions are given on the basis of personal preference. He sees the possibility
of promotion as remote and the possibility of earning extra pay as depending on overtime work
when it is available.
Interviewed men associated long hours of work with better income especially in the lower
income jobs where prospects for promotion are not wide. There were cases of women whose
income depended on overtime or the number of hours worked such as Carla who works a
significant number of overtime hours for a parastatal organisation where she is employed.
Natasha, a tourist guide who is a freelancer can only earn more if she works more hours.
Corinne who is a journalist also sees the possibility of increasing her pay by working everyday
instead of alternate days – an option she cannot consider. Corinne also sees promotion as a
remote possibility since her employer stopped promotions as part of a cost-cutting exercise.
There are workers whose prospects for better pay are bleak and depend only on statutory
budget increases – such as annual cost of living adjustments. For workers such as Maria and
Joseph (parastatal employees), improving their qualifications is not an option they consider
especially now that they have reached a certain age. They do not have any opportunity to
work extra hours or for promotion, event though both are willing to work more hours if given
the opportunity.
Although qualifications and further study are less associated with job improvement in the lower
occupational scales, Kenneth who is a maintenance worker claims that because he showed
commitment, his employer gave him a raise in salary. At present he is following a course in
electrical work and upon completion he is guaranteed an automatic promotion and a pay rise of
Lm 400.
E x p e n s e s I n c u r r e d B y W o r k e r s
A few of the workers interviewed incurred expenses related to their job or were at risk of
suffering financial losses due to events beyond their control. For example, certain security

Gender Pay Review
National Commission for the Promotion of Equality
Malta September 2006 page 268 of 327
companies provide uniforms to their guards while others just provide a company tie, with the
rest of the uniform purchased by the employee. Security guards also have to pay a licence
annually and to attend a work-related course that they have to pay themselves. Some
companies deploy their security guards in Gozo monthly. Martin was not informed of this
during the interview. The company pays the Gozo crossing ticket and adds 1 hour’s pay at the
end of the month. It costs Martin Lm 5 to report to work in Gozo and settlement by employer
is a frequently difficult process. Martin does not receive any petrol allowance, despite the long
journeys he has to make to report to work.
Anthea, who works as a sales representative is provided with a company car and given a petrol
allowance. However, since the company bought new cars that consume more fuel and since
the price of fuel increased over the past months, the allowance (that remained unchanged)
became insufficient to cover her commuting expenses. She is also paid a Lm 10 allowance
every three months for mobile calls expenses, also insufficient to cover the real amounts of
mobile calls made related to work. Unlike Anthea, Dorian (a deliveryman) does not incur
expenses on a regular basis, albeit he is not paid any allowances for driving heavy vehicles.
Neither is he insured against the possibility of goods being stolen from his vehicle. In the case
of theft, Dorian has to pay for any stolen goods himself. Furthermore, if he is involved in a car
accident, Dorian has to pay for the damages himself.

Gender Pay Review
National Commission for the Promotion of Equality
Malta September 2006 page 269 of 327
6 Discussion & Conclusions
6.1 A Gender Pay Gap
The research findings in Section 5 clearly point to a significant differential in earnings between
men and women in the Maltese labour market, despite the various measures taken by policy
makers in an attempt to reduce or even eliminate them. It appears that gender pay
differentials persist despite the various social, legislative and economic initiatives, implemented
to attract more women to the labour market and to enable them to participate in paid work
equally with their male counterparts. This research indicates that the measures so far were
only partly successful in addressing this persistent social anomaly. Such measures may have
standardised pay rates of men and women occupying the same grade and performing similar
duties within the same organisation. They have also contributed to reduce cases of
discrimination and unfair treatment as revealed by the study. Family-friendly measures have
succeeded in attracting more women to the labour market and enabling them to continue
working but they have also contributed to their concentration in part-time employment as well
as to a proportion of women who are officially employed but are actually on unpaid maternity
leave at home.
As highlighted in the literature, the factors underlying gender pay differentials are various
although women’s domestic and childcare responsibilities appear to have a major impact on
their lower earnings. However, other factors such as occupational segregation and
discrimination also have a considerable impact.
6.2 Labour Market Participation Patterns & Trends
The study confirms other findings such as those by the Economic and Social Research Institute
(ESRI, 2000) and Paparella (2005) that a significant proportion of the gender pay gap is due to
differences in the labour market participation patterns exhibited by women and men. Indeed
the study revealed that men not only tend to have a longer employment experience than
women but they are also more likely to be working on a full-time basis than women. While only
8.9% of men work on reduced hours or part-time, women are three times more likely not to be
engaged in full-time work. Studies (Meilland, 2000, 2001; Paparella, 2005) showed that women
are more likely than men to start working on a part-time basis and to remain in part-time
employment for longer periods than their male counterparts. This factor contributed

Gender Pay Review
National Commission for the Promotion of Equality
Malta September 2006 page 270 of 327
significantly to women’s lower earnings. As the literature shows, part-time workers tend to be
paid less than full-timers. The lower earnings of part-timers are not due to their having less
human capital or as a result of job characteristics (Anderson et al, 2001; Blank, 1990; Paci et al,
1995) but largely due to employer discrimination. Anderson et al (2001) argued that employers
tend to perceive part-timers as giving ‘a lower return on investment’. Consequently, they also
tend to offer part-timers less opportunities for training and promotion. Furthermore, it is
significant to note that while there is a concentration of women in part-time jobs, the findings
of the study reveal that in Malta male part-timers have higher earnings than females. This was
also demonstrated by Recio (2001) who claimed that in Spain, the difference between part-time
and full-time earnings is greater for women than it is for men.
6.3 Career Breaks
Although part-time work is the most common alternative to those with caring responsibilities to
interrupting a career, there are still those who opt for a career break, either by resigning or by
availing themselves of parental leave. However, the majority of both male and female
employees who participated in the study do not have this option. Although in the public sector
both males and females are entitled to parental leave, employers outside the civil service who
offer parental leave to their employees generally restrict the option to women. Consequently,
women are more likely to take career breaks than men. Their breaks also tend to be of a
longer duration, in many cases lasting for 10 years or more. While men’s career breaks tend to
be of an average duration of 15 months, it is noted that none of the male research participants
who interrupted their career did so for the purpose of caring for own children. Men tend to
interrupt their career mainly in order to further their studies. Contrastingly, women’s primary
reason for interrupting their career is childbirth and caring responsibilities.
The time that women spend away from the labour market is detrimental to their earnings as
shown by Budig and England (2001). While the availability of parental leave has its advantages
to parents especially as an alternative to giving up their job, it also has a number of
repercussions. Those on unpaid leave tend to lose on training and promotion opportunities as
well as income. Those who interrupt their career by resigning from their job to return after a
number of years are even more disadvantaged since very often they return to jobs with lower
status and pay. Budig and England (2001) calculated a penalty of around 7% per child suffered
by mothers who leave and later return to the labour market. For those mothers who stay away
from paid work for a longer time span, age may present another hurdle. However, among the

Gender Pay Review
National Commission for the Promotion of Equality
Malta September 2006 page 271 of 327
study respondents who went through a period of unemployment, women were more likely than
men to start working within 12 months although this also depended on their qualifications.
6.4 Caring & Domestic Responsibilities
More than one third of the study participants claimed to have caring responsibilities at home
while the vast majority of respondents engage in some form of domestic work. However,
women tend to devote more time to childcare and domestic work than males. Women in
clerical occupations, plant and machine operators, and, shop or market services workers as well
as women in elementary occupations tend to spend the longest time performing duties related
to house chores or childcare. Among men, it is professionals or associate professionals who
contribute mostly to domestic and family requirements. The heavier burden that women still
carry as a consequence of being the main home makers has a significant impact on their
employment patterns and trends and hence on their earnings. Women tend to choose jobs that
enable them to combine the demands of their different roles effectively. Hence, their
concentration in part-time work. They may also reject opportunities to earn a higher income
such as overtime work (Swepston, 2002; Drolet, 2002). This study also revealed that more
women than men have refused a promotion opportunity. It appears that the major deterrent to
accepting such an offer is the longer hours of work that the new job may entail, although the
nature of the tasks related to the job as well as the added responsibilities were also indicated
by a significant number of respondents.
6.5 Hours of Work
It appears that in Malta, as in the UK, employers are increasingly using ‘time’ to their advantage
either as a way of increasing productivity or to expand their service provision, making
employees work harder, longer hours according to the requirements of the organisation. These
changes in working time arrangements are increasingly making the dividing line between work
and non-work time less clear – resulting in a number of social implications (Rubery et al, 2005).
In the Maltese labour market it is men who work the longer number of hours. It is clear that the
difference in the number of hours worked by men and women accounts to a significant extent
for the pay gap between sexes. Indeed, it is significant to note that the majority of the women
participating in the study indicated that they associate more hours of work with better pay
prospects. It is estimated that men work an average of 267 hours more than women annually
regardless of educational level, sector of employment, job basis and type of occupation.

Gender Pay Review
National Commission for the Promotion of Equality
Malta September 2006 page 272 of 327
Women also tend to work less overtime than men. Men work on average just over 10 hours a
week on top of their basic hours while the average for women stands at just over 8½ hours.
As long as workers are appropriately compensated for the extra hours worked, trade unions in
the UK (Rubery et al, 2005) and in Malta have largely supported overtime opportunities
especially in the case of lower paid workers where overtime very often means earning a decent
wage. For many low-income earners, overtime or shift work provides a means of compensation
for their low pay rates. However, apart from the implications of having to endure unsociable
hours of work, a significant number of workers are not rewarded for their extra effort, with
such being a more common incidence among women. Whereas 63.9% of men are paid for
overtime, only 44.7% of women receive remuneration for working extra hours.
Although men may be putting more hours into their work than women, the amount of extra
hours being worked by both men and women is of concern, implying that a significant share of
economic activity in the Maltese labour market is taking place outside the ‘standard’ working
day. Although there were always workers whose duties require them to work ‘odd’ hours as in
the case of nurses, policemen and security guards, there appears to have been an increase in
the number of workers who are required to work nights, early mornings, weekends and
holidays. Consequently, there has been a decrease in ‘social’ time as more workers are
performing work or work related activities in their supposedly ‘free’ time (Rubery et al, 2005).
Qualitative research within this study indicated that certain categories of workers, particularly
security guards are constrained to work much longer than the average in order to secure an
average wage to the detriment of their health as well as their social and family life. Their
experience of work fits quite neatly into the employer-led model described by Rubery et al
(2005). Employers, unconstrained by state or trade union regulations, determine the conditions
and hours of work of these employees, with opportunities to manipulate their conditions of
work and pay as required by the company and as dictated by market competition – with
resultant abuse on employees. Observations of various abuses claimed by such workers are
varied, exemplified by:
� the issue of separate payments to the same employee intended to conceal the number of hours
worked;
� extra hours compensated at different pay rates as established by the employer;
� extra hours paid at the standard rate as well as the demarcation line between standard and non-
standard work time determined by the employer regardless of the standard 40-hour week.

Gender Pay Review
National Commission for the Promotion of Equality
Malta September 2006 page 273 of 327
Such workers face an alternative of working a standard 40-hour week without any overtime at
low pay rates amounting to a monthly salary nearing the minimum wage.
Although admittedly, not all Maltese employees work 70- or 80-hour weeks as in the above
case, a long work-week culture especially among men has a number of social implications. In
Malta, where wages are relatively low compared to the European average, workers are
motivated to work overtime in order to enhance their income. Furthermore since it is the male
who is still considered to be the breadwinner of the family, men tend to work longer hours
especially since in most cases, their wife would not be in paid employment. This observed
trend goes against the much stressed notion of the need for workers to achieve a work-life
balance. It is also incongruent with the declared aim of policy makers to facilitate the entry of
more women into the labour market as well as to encourage men and women to be equally
committed to family responsibilities. Husbands whose working day exceeds the 8-hour
standard considerably cannot possibly contribute much to household responsibilities and
childcare making it more difficult for their wives to take up paid employment or to work on a
full-time basis. The long working hours’ culture assumes workers are unconstrained by family
responsibilities as well as by their own personal needs. It is in complete contrast with the
concept of the dual earner family. Furthermore, long working hours are detrimental to workers’
physical and psychological health as well as to their social development.
6.6 Supplementary Earnings – Beyond the Basic Pay
Drolet (2002) showed that women’s family commitments also put them at a disadvantage when
it comes to performance-based incentives. This study revealed that women who work less
hours and whose performance is tied to work output have to work harder in order to obtain a
performance bonus, which is similar to that received by their full-time colleagues. This may
partly explain the contradiction apparent from the research findings that while more women are
entitled to commissions and performance or other types of bonuses than men, the earnings
received by women from such supplementary sources of income is less than those received by
men. As Swepston (2002) contends, these additional benefits account significantly for pay
differentials between men and women. Indeed this study’s research data suggest that while
there is a notable pay differential in the weighted mean gross basic earnings received by men
and women, the gap increases significantly when supplementary earnings are taken into
consideration. Whereas the weighted average basic monthly pay received by men is Lm 444.15
and that for women is Lm 374.28, the corresponding figures for monthly earnings including

Gender Pay Review
National Commission for the Promotion of Equality
Malta September 2006 page 274 of 327
commissions, performance bonuses and overtime stood at Lm 608.92 and Lm 467.33 for men
and women respectively. This gender pay discrepancy featured across all age groups,
occupations, sectors of activity and basis of employment except for some rare cases.
6.7 Negotiation of Pay
The study further revealed that the majority of workers did not negotiate their pay but their
earnings were established either by their employer or by a collective agreement between their
employer and a trade union. Men are more likely than women to have had their pay
established on the basis of a trade union agreement. This could also contribute to lower
earnings for women since it suggests that women are less industrially organised than men.
In non-unionised work places, there is more room for abuse especially in the private sector.
Indeed, the study indicates that workers in the private sector were more likely to be unfairly
treated by their employer, confirmed by qualitative research. Some workers were observed to
be threatened with redundancy should they join a trade union. Workers engaged in lower level
occupations within the private sector appear to be the worst hit in this regard. In cases where
workers are unionised and have their pay set in terms of a collective agreement, pay
discrepancies between men and women may be the result of gendered job evaluation or
discrimination even if this is not done consciously. Trade unions are male dominated
institutions where gender stereotypes are unlikely to be completely absent. Furthermore, they
are less likely to consider women’s disadvantaged position in the labour market as a priority.
6.8 Occupational Segregation
Occupational segregation is another factor that contributes to differences in earnings between
men and women. Both horizontal and vertical segregation (Hakim, 1979) contribute to the
crowding of women in certain jobs. As a result, their wages are affected either directly due to
their tendency to concentrate in lower paid female-dominated occupations or indirectly due to
their exclusion from higher status jobs. Although studies such as that of Blau et al (2002) have
suggested that occupational segregation declined since the 1970’s, they also revealed that both
horizontal and vertical segregation still exist. The data from the study indeed point to the
tendency for women to occupy clerical, services and sales jobs while being relatively less
present in managerial occupations, among professionals, senior officials and legislators.
Maltese women are also less likely to be engaged in elementary occupations or as plant and
machine operators and assemblers as well as in technical and associate professional jobs. The

Gender Pay Review
National Commission for the Promotion of Equality
Malta September 2006 page 275 of 327
data also show that women are more likely to be found working in the hotel and catering sector
while men dominate the services and manufacturing sectors and especially the stone quarrying
and construction sector where women are practically absent. It is observed that among clerical
as well as shop and market employees, where women are more likely to feature, men still earn
more than women. This observation is similar to that made by Dimas and Almunia (2004) who
noted that while female-dominated jobs tend to offer lower wages to both men and women,
men’s earnings still tend to be higher.
Horizontal segregation is inextricably linked with gendered stereotypes and perceptions that are
still very evident among workers. The study found that women are more likely than men to
perceive their job as being gender neutral. Both men and women still associate physical
strength as the main reason for categorising a job as being a ‘male’ job. Contrastingly, women
and men identified different characteristics with jobs that they considered to be more suitably
performed by women. While men identified communication and leadership skills with ‘female’
jobs, women indicated patience as a requisite for jobs that are more suitable for them. This
partly explains why certain jobs tend to attract one sex more than the other even if they are
open to both sexes.
However, in practice not all jobs are equally available to men and women. The research
established that employees believe that employers have a specific gender in mind when they
advertise for posts or when they recruit workers according to whether they perceive the job as
being more suitable for men or for women. Furthermore, sexist recruitment practices do not
necessarily reflect suitability. It is regrettable to observe that certain companies still exclude
women from certain jobs because of their likelihood of getting married or having children.
As revealed by the data, in the Maltese labour market women are less likely to be found in high
level occupations such as senior managerial and higher legislative posts. However, they are
also less likely to be found in low-level jobs than men. It appears that women are concentrated
in middle level occupations as exemplified by clerical work. This may be due to women having
better suited qualifications than men, thus enabling them to infiltrate the middle occupational
levels more than men. It could also suggest that men are less attracted to such jobs that may
be considered to be less appropriate for them than manual work, which is more typically ‘male’.
It is interesting to note that the highest gender discrepancies in earnings in the Maltese labour
market are between those who occupy senior managerial grades and those in elementary jobs
– job categories that feature a strong concentration of men and where the difference in
earnings among men and women is close to Lm 300 monthly. One factor that may account for

Gender Pay Review
National Commission for the Promotion of Equality
Malta September 2006 page 276 of 327
the earnings difference between male and female senior managers and directors could be the
practice of individualised contracts between employer and employee. The number of hours
worked by men could also account for the gap although in higher-level occupations it is not
uncommon for employees not to be compensated for overtime work. In elementary
occupations, the gender pay discrepancy is probably due to the longer-hours worked by men.
Among workers employed in lower level jobs, overtime work is very often welcomed as an
opportunity to make up for the relatively low rates of pay (Rubery et al, 2005), a trend which
also characterizes the Maltese labour market.
Women’s under representation in the higher occupational levels is a characteristic of virtually all
countries. Despite the social and legislative changes that took place in many countries
including Malta, women and men still do not have equal access to jobs that carry higher
responsibilities and rewards (Meilland, 2002; Dimas and Almunia, 2004). A number of factors
may contribute to this phenomenon. It may be argued that men may have a higher degree of
human capital than women. However, research shows that even in cases where women have a
relatively higher level of education they are still less likely to be found occupying the top
positions (Swepston, 2002). The gender pay review data show that the earnings of women
who are equally qualified as men are still lower than those of their male counterparts. It is only
women who are in possession of a university diploma or equivalent from an overseas institution
or who have a Master’s degree who for some reason have higher earnings than men with
similar qualifications. However among those having a Master’s degree, the discrepancy in
earnings among men and women only amounts to a mean of Lm 25 monthly.
Women also tend to concentrate in the lower paid professional fields such as teaching and
nursing while men are more likely to be engaged in higher status and better paid professions
such as law, medicine and engineering, even when there are more females than males in the
professional camp (Blau et al, 2002). One factor that possibly attracts more women to these
posts is the hours of work or the flexibility afforded by such vocations as teaching and nursing,
especially for women with family commitments. Indeed, any profession is less accessible to
women with family commitments as revealed by the data of the study. Among the study
participants, the proportion of women with caring responsibilities who were engaged in
professional work amounted to less than half of those professional women without caring
responsibilities.
Being in a top job is very often tied with either seniority or promotion. Men are more likely to
have seniority than women since they tend to spend longer employment spells with the same

Gender Pay Review
National Commission for the Promotion of Equality
Malta September 2006 page 277 of 327
employer as well as generally within the labour market. The study herein shows that men’s
average stay with the same employer stood at 9.9 years while that of women was 5.7 years.
Women are also more likely to interrupt their career for longer periods than men.
Promotion opportunities appear to be available to men to a larger extent. Among the study
participants, more men than women claimed to have been offered a promotion. Furthermore,
men are also more inclined than women to accept a promotion. While both men and women
identified longer hours of work as the main reason for refusing a promotion, women may be
more constrained not to work longer hours due to their caring responsibilities. However, this is
not the only reason behind any refusal.
Both men and women who were given a promotion consider commitment and performance as
factors that they believe their employers value as prerequisites for promotion. This suggests
that employers perceive women as being less committed or as giving a lower input than their
male counterparts. The fact that women work less hours than men and are more likely to be
engaged in part-time work is a determining factor. As discussed earlier, part-time workers are
given less opportunities for training and promotion. However the study also established that
women are less likely to receive training that is funded by their employer regardless of whether
they are full-time or part-time workers. In line with human capital theory, one may argue that
women tend to be less interested in training and promotion than men. After all, more women
have refused promotion than men. However, women’s decisions may not always be a matter of
choice although it is difficult to distinguish between constraints and choice. They may be
constrained to invest less in their career as a result of having more childcare and domestic
responsibilities than men. Their shorter job tenure, their lower experience, their career
interruptions may not be voluntary but determined by the demands of their family (Blau et al,
2002).
Furthermore, women continue to suffer the consequences of their disadvantaged position in the
labour market even after they retire. Unequal opportunities in the labour market are reflected
in the lower pensions that women receive later on in life as shown by Meilland (2002). The
number of contributions paid by an employee, as well as whether the contributions were paid
on a continuous basis are key determinants for the calculation of pension schemes. Due to
their patterns of interrupted employment, their concentration in part-time work and their
likelihood of not being employed in higher-level occupations, women are also disadvantaged
when pensions are calculated as a percentage of the best earnings during the last years of
employment.

Gender Pay Review
National Commission for the Promotion of Equality
Malta September 2006 page 278 of 327
6.9 Discrimination
Women’s lack of opportunities for training and promotion may point to employer discrimination.
A model developed by Phelps (1972 in Blau et al, 2002) suggests that statistical discrimination
may be practised by employers who decide not to employ, train or promote women on the
basis of data projecting the average woman as less productive and as more likely to resign from
her job than a man. Although women’s preferences may play a role in determining their
concentration in middle level occupations, there is evidence that points to the practice of
discrimination within the labour market (Blau et al, 2002; Rangelova, 2002). Walby and Olsen
(2002) report that occupational sex discrimination features as the most prominent factor in their
analysis of the gender pay gap.
Anti-discrimination legislation may have had some positive effects although it did not manage to
eliminate gender discrimination. This study established that relatively few workers considered
themselves to have been unfairly treated by their employer, particularly with respect to gender.
However, among those who claimed to have suffered unfair treatment, women indicated sex
discrimination as the strongest factor underlying their experience. One of the problems with
discriminatory practice is that it may be subtle, even unconscious. Women may be denied
access to training and higher paid jobs as a result of stereotyped preconceptions about their
skills, abilities, commitment and personal characteristics – preconceptions that at times are also
shared by women (Blau et al, 2002). Consequently, both employers and employees may not
always recognise discrimination. This may be reflected in the relatively low incidence of those
who reported to have been the target of gender discrimination in this study. However, it may
also point to an actual decrease in discriminatory practices in the Maltese labour market.
The perceived absence of gender discrimination is starkly evident in relation to earnings
received by men and women. Despite the grim reality portrayed by the statistical data in this
study, most of the participants regardless of gender, social class, occupation and level of
education denied that men and women receive different earnings. Research participants
pointed at differences in earnings as a result of workers occupying different grades or having
different levels of seniority. This is probably the result of pay rates for male and female
workers occupying the same grade and performing similar duties within the same workplace
standardised in response to legal requirements. The gender discrepancies in earnings that
emerge out of other factors such as occupational segregation, employer discrimination, the
concentration of women in part-time work, women’s shorter hours of work and longer career

Gender Pay Review
National Commission for the Promotion of Equality
Malta September 2006 page 279 of 327
breaks tend to be less apparent. Indeed none of the workers identified pay discrepancy
especially on the basis of gender as a source or injustice or discrimination.
6.10 Recommendations
Findings in research suggest that pay inequalities between male and female workers in the
Maltese labour market still exist even though workers seem to be unaware of the problem. It is
also clear that fighting gender pay inequality is not an easy task because the causes of pay
discrepancies are numerous. However, the findings, in support of the international literature
point to the need to develop or strengthen the necessary structures and schemes that enable
more women to engage in paid economic activities on an equal footing with men.
Legal measures taken to promote gender equality and to protect individuals against
discrimination are important as a support structure, enabling Maltese society to face the more
difficult challenge of effecting a transition within the domestic sphere. Here, stereotyped clear-
cut roles of the female carer and the male breadwinner need to be replaced by the concepts of
equality and sharing of responsibilities and opportunities.
For women to be able to participate equally and fully in the labour market and to have the
same work, training, promotion and pay opportunities as men, they have to be freed from the
conflict of combining significant work and family responsibilities. Both women and men should
be able to work and to participate in family life in a way that is acceptable to both worker and
employer. Therefore, it is essential for society to provide the necessary structures to enable an
acceptable work-life balance for both men and women. It is also crucial for both men and
women to recognise the benefits of participating equally and sharing responsibilities both in the
domestic and public sphere.
The discrepancies in the earnings of men and women have to be addressed within the wider
framework of encouraging more women to participate in paid employment as well as enabling
them to pursue a career without having to interrupt it due to the unavailability of real, viable
alternatives. Government has the responsibility to ensure that the general objectives set out in
the National Action Plan (ETC, 2004) and the National Reform Programme (MEU, 2005) are
attained. However, the inequalities in the earning of male and female workers are not directly
addressed by both NAP and NRP. It is considered enough to attract more women to the labour
market. It is assumed that this alone will automatically lead to a reduction or elimination of
gender inequalities in earnings.

Gender Pay Review
National Commission for the Promotion of Equality
Malta September 2006 page 280 of 327
Although if the number of economically active women increases, the difference in the earnings
of men and women might decrease, this also depends on the participation patterns of women
in the labour market. A larger number of women employed on a part-time basis, will not
necessarily reduce the gap. Offering opportunities for unpaid parental leave without
encouraging men to take the opportunity to participate in the upbringing of their children will
not reduce the gap. It will only mean having a higher percentage of working women on unpaid
parental leave and thus further contributing to the gender pay gap.
Therefore it is important for policy makers to:
� establish the causes underlying the low level of female participation in the Maltese labour market;
� establish what women themselves consider to be viable incentives to leave their home and enter
the labour market;
� make it more financially viable for both partners to work (although certain incentives are already
being offered);
� enable more women to take up full-time rather than part-time employment;
� encourage more men to avail themselves of parental leave;
� provide incentives to the non-state sector to offer opportunities for parental leave to both female
and male employees;
� develop structures and schemes which offer a real alternative to parental leave;
� ensure that equality and anti-discrimination laws are being respected;
� discourage on a national level the practice of individualised, performance-based contracts especially
with regards to professional and higher level employees (53);
� organise a national awareness campaign informing workers of their rights provided by protective
legislation;
� increase workers’ knowledge of equal opportunities and of ways of seeking advice or redressing
unfair treatment;
� increase the resources of ETC to be in a better position to ensure that employers are respecting
working time regulations as well as the health and safety of their employees;
53 It is common for employees on such contracts not to be entitled to family-friendly measures, thus contributing to the gender
pay gap. Such contracts also provide more opportunity to employers to discriminate against employees on the basis of sex.

Gender Pay Review
National Commission for the Promotion of Equality
Malta September 2006 page 281 of 327
� rethink its national employment policy that is based on low wages encouraging a long hours of
work culture. This has led to an employment situation where men work long hours to compensate
for their low rates of pay and women stay at home shouldering all the household and childcare
responsibilities.
Furthermore, the government as an employer should set an example to other employers where
gender equality is concerned. For example, it should have a policy of awarding tenders only to
equal opportunity employers and to employers who respect the rights and dignity of employees.
Awarding tenders to the lowest bidder, for example, may lead an employer to cut down on
employee’s wages and benefits.
Together with the other social partners, Government should seek to address the gender pay
gap more specifically by:
� encouraging more workers to become unionised;
� ensuring that more workers are covered by collective agreements;
� giving more priority to addressing the gender pay gap in collective bargaining
� encouraging the establishment of standardised pay structures outside the public sector;
� seeking to establish a system of job evaluation which enables the objective appraisal of jobs with
special attention to reduce the wage gap between male- and female-dominated sectors of
employment;
� establishing a national system of job classification that would make it possible to compare work of
equal value even across different occupational sectors;
� carrying out job evaluation exercises for both full-time and part-time employees;
� introducing measures to increase the pay of jobs that are deemed to be under evaluated;
� discouraging personalised agreements between employers and employees outside collective
agreements;
� setting and ensuring the observance of a limit to how much a person can work. Furthermore,
those whose nature of work entails working unsocial hours have to be paid a premium that reflects
these conditions;
� addressing the less obvious, underlying causes of the gender pay gap more seriously;
This involves serious discussions on how to enable more women to participate in the labour
market on a full-time basis without having to interrupt their career due to lack of support

Gender Pay Review
National Commission for the Promotion of Equality
Malta September 2006 page 282 of 327
systems. The social partners have to devise ways of making full-time work a feasible option for
both men and women without this being detrimental to
� family needs and responsibilities and
� productivity.
Among the possibilities that were considered seriously are the provision of:
C h i l d c a r e
For parents to be able to contribute to the economy they have to be partly relieved of the
conflict between the demands of their job and the demands of their family especially in the case
of small children. For childcare to be a viable option, studies have to be carried out to establish
issues such as the location (54), cost-effectiveness, affordability and service hours. Unless
childcare is affordable, the labour market will only attract women who give more priority to
their career than to income – often such women would already be in the labour force.
Childcare facility service hours pose an issue not only to parents of pre-school children but also
by those who have school age children (typically younger than 12 years).
F l e x i t i m e
This system operated in certain sectors of employment merits further investigation and research
in order to evaluate its strengths and limitations, enabling an identification of ways of
optimising its utilisation to the benefit of both workers and employers.
H om e W o r k & T e l e w o r k
Like flexitime, this system is still being explored in the Maltese labour market, featuring a
number of benefits for both workers and employers that still have to be exploited.
54 Options for location include centralisation in different areas of the islands e.g. in industrial estates, or central locations that
are easily accessible to workers on their way to work (district level) or local level options linked to the village school or
location of work. The social partners have to be sensitive to workers’ needs and seek to establish the location that the
majority of workers consider to be the most practical.

Gender Pay Review
National Commission for the Promotion of Equality
Malta September 2006 page 283 of 327
L e a v e f o r C h i l d S i c k n e s s
This option merits serious consideration in respect to all workers with young children, or at least
for those parents who provide evidence that they do not have any support from relatives in the
case of child sickness. Workers are very often constrained to avail themselves of vacation leave
or (if possible) to abuse of their own sick leave when their children are sick. For many workers
emergency vacation leave is not an option especially if it involves more than one day – a
significant contention, particularly when workers are not entitled to vacation leave (as in the
case of teachers).
Targeting Traditional Gender Roles
A joint effort between policy makers, employers, trade unions to address the gender pay gap
will only have the desired effects if it is accompanied by an equally strong drive to bring about a
change in the gendered perception of traditional gender roles. Policies dealing with:
� labour market discrimination,
� equal pay legislation,
� the provision of parental leave,
� income tax incentives and
� numerous other measures aimed at gender mainstreaming
cannot be exploited effectively unless factors arising outside the labour market (and more
specifically within the domestic sphere) are addressed seriously.
Equality legislation and anti-discrimination policies have certainly been decisive in reducing
abuse and in promoting greater parity between men and women. However, it is traditional
views about the role women and men within the family and the conflict between the demands
of work and family responsibilities that continue to be the major underlying source of gender
inequality in the labour market and consequently of the gender pay gap.
It is certainly an easier task to take legislative measures and design policy programmes than to
bring about changes in strongly ingrained cultural values and social expectations tied to the
roles of women and men in society especially since traditional social forces will seek to
perpetuate the status quo. However, as long as women continue to be perceived as
housewives/mothers and men as the breadwinners, women will continue to face difficulties and
obstacles that they cannot overcome on their own. For both men and women to be able to

Gender Pay Review
National Commission for the Promotion of Equality
Malta September 2006 page 284 of 327
contribute fully to the economy and to participate equally in both economic and family life,
drastic changes have to be implemented.
Maltese society has gone through a number of social, economic and cultural changes over the
past few decades, making the above necessary changes less difficult. However, implementing
such changes is still a bold endeavour that cannot be undertaken by the State alone. It is an
approach that has to involve civic society as well as the private sector targeting various social
groups such as:
� children and young people
� young parents
� employers
� educators
� employees as well as
� general audiences.
through a nation-wide educational campaign aimed at eradicating gender stereotyped
perceptions and practices both within the domestic and the public sphere.
6.11 Strengths & Limitations of the Study
The study presented herein draws from research with over 600 persons in employment who
participated through face-to-face interviews. The sample is deemed representative of the
realities of the Maltese labour setting, with a sample error limited to ±4.04%. Equally
significant is the reliance on qualitative interviews among a sample of the survey participants,
supplementing the findings established by the quantitative methodology, thereby enhancing the
study’s width and depth.
Whilst addressing fully the terms of reference relating to the project, the study features a series
of weaknesses. One such aspect relates to the considerations given to costs borne by research
participants, wherein quantifying the actual costs incurred by participants and the actual
compensation provided by employers relied on amounts quoted by participants without any
supporting evidence. In a similar context pay and other remuneration claimed by participants is
not supported by documented evidence – which cannot be requested from interviewees. Such
a facet only augments the potential error arising from respondents’ unwillingness to provide full
information about their earnings in view of the sensitivity such information represents.

Gender Pay Review
National Commission for the Promotion of Equality
Malta September 2006 page 285 of 327
The reliance on a totally random sample precluded research from addressing and comparing
employees in work of equal value. Whilst potentially capable of providing details of how
persons in gainful employment are engaged among Maltese enterprises (namely basis of
employment, designation and date of engagement), the listing of persons in employment as
maintained by the Employment & Training Corporation does not reflect how persons occupy
work of a specific value.
Equally significant is the study’s reliance on information provided by persons in employment
without relating to the perceptions and views of employers. In this context, the study does not
relate to the views of those who are responsible for the establishing, evaluating and regulating
wage/remuneration structures – albeit such a view was also not part of the terms of reference
of the project.
Further, the project did not consider the employees’ trade union membership – a factor that
featured as potentially a significant influence on the differences in earnings between men and
women in employment in Malta.
These weaknesses set a need for a further research, such as studies relating to the wage
structures as implemented by employers inclusive of basic wages, allowances, monetary
benefits and the provision of non-monetary benefits translated in monetary terms. Equally,
further research is indicated to establish the views of employers, assessing the level of
gendered job evaluations that may be practised throughout the Maltese human resources
management milieu. In addition, a need is felt for further investigations relating to employment
conditions and associated remuneration, involving an evaluation of all benefits received by
persons in employment, exemplified by non-monetary benefits as equated in monetary terms
(such as family friendly systems in operation by specific employers). As significant is the need
to establish the differences in earnings between men and women at work in unionised and non-
unionised contexts.

Gender Pay Review
National Commission for the Promotion of Equality
Malta September 2006 page 286 of 327
Appendix 1 Methodology – Considerations
Data Collection Process
In the context of the subject under study along with the critical requirement of reliable data
collected from participating respondents (who are very likely to exhibit indifference towards
research), personal interviews (among other methods for data collection) provide an approach
that offers the highest level of reliability of data collected. More specifically, Computer Assisted
Personal Interviews (CAPIs) provide a more economic approach in collection of sensitive and
reliable field data whilst avoiding the incurrence of costs as described above, assuring high
quality data as:
� even by the most complex study designs, no filtering error can occur during the interview
� automatic plausibility checks with feedback prevent answer inconsistencies during the interview
� the randomly generated rotation of answer guidelines avoids serial effects
� the interviewer’s influence is minimised and the interviewer’s controlling possibilities are increased.
In addition, as the interviewee is led through the catalogue of questions and the interviewer
merely takes on an explaining role, sensitive questions are also answered significantly
more frequently. At the end of the interview the data set is saved in a form that the
interviewer can no longer access (effectively sealing the interview).
Interviewers
All interviewers were selected and trained to maximise the effectiveness of the data collection
process. In this respect, selected interviewers:
� possessed a minimum of a baccalaureate standard of education in management, marketing,
sociology or human resource management related fields or equivalent;
� had a minimum experience of two years in research, communications or related areas;
� were capable to communicate clearly with different respondents who had different levels of
education and came from different walks of life.
� were trained to:
– approach interviewees and instil confidence whilst establishing a short and close rapport;

Gender Pay Review
National Commission for the Promotion of Equality
Malta September 2006 page 287 of 327
– observe and record respondent reactions to different questions, including classificatory
features of the respondent (such as respondent identity code attributed from sample frame,
contact numbers, respondent organisation sector and size);
– record any observations not directly related to any of the questions made as part of the
structured interview, and
– keep a dress code in accordance with standards for personal appearance as laid out by
Allied Consultants Limited in respect to the research context.
Interviewer training comprised:
� an introductory session relating to the scope of the survey forming part of this project and features
of such survey;
� a training session (2 hours) relating to methodology of research inclusive of recruitment of
interviewees, data collation, use of CAPI stations and transmission of data (frequencies and
timings), and any other details relating to self presentation and special care in data collection. This
session served as a refresher course to our experienced interviewers;
� a training session (3 hours) relating to the subject researched and items asked to each interviewee
and use of specific media (such as show cards). This briefing session made use of specifically
constructed presentations and presentation notes for interviewers
� a set of documents laying out methodologies and instruments, along with authorisation letters and
other associated documentation required for use in field research.
All documentation to interviewers were prepared by Allied Consultants in accordance with
instruments and methodologies as may be indicated by the client.
Participant Contact
In total, interviewer – interviewee contact involved:
� A recruitment visit/phone call, estimated averaging 3 to 5 minutes per recruited participant, with a
success rate estimated at about 15% (55);
� A personal interview that lasted a median duration of 32 minutes (n = 608);
� A second personal interview that lasted an estimated median of 8 minutes, relating to 10% of
survey participants, forming part of the quality management policy within this project.
55 Relating to the number of prospective participants accepting to participate in the survey.

Gender Pay Review
National Commission for the Promotion of Equality
Malta September 2006 page 288 of 327
Interviewing Features
All interviewing was conducted in Maltese or English languages as selected by interviewees and
in accordance with the schedule set out in Table 146. In exceptional cases and when indicated
by the survey participant, interviews were conducted at a time and place as required by the
interviewee.
Table 146 – Interviewing Schedule
Interviewing Monday Tuesday Wednesday Thursday Friday Saturday Sunday
Start 08:00 08:00 08:00 08:00 08:00 08:00 09:00
End 20:00 20:00 20:00 20:00 20:00 19:00 13:00
Field Research Quality Management
One in ten (10%) of survey participants reached by interviewers were contacted (telephonically
by a field supervisor or higher) in order to verify the results recorded for key questions and
features of the interviewing process. This quality process was undertaken after the conduct of
an interview but before the termination of the field research.
Additionally, built-in response validation and filters supported by the operating CAPI software
removed the risk of inadvertent data entry at the point of interviewing. Together with an
assortment of custom built show cards and other visual material, responses contributed by
survey participants were only recorded by interviewers as indicated by the same participants on
the apposite visual material, removing all potential sources of interviewer misinterpretations of
answers provided by interviewees.
Every interviewer working on the survey was subjected to repeated random checks regarding
the quality of work during the conduct of interviews.
All interviews were conducted in accordance with the requirements set out in
ICC/ESOMAR (56) Code of Marketing & Social Research Practice.
56 ESOMAR is the World Association of Research Professionals.
Gender Pay Review
National Commission for the Promotion of Equality
Malta September 2006 page 289 of 327
Appendix 2 Instrument (English Version)
Dear Sir/Madam
Allied Consultants are carrying out a survey among men and women in work to explore the
different aspects related to work and potential gaps in the conditions of employment between
men and women.
This questionnaire forms part of a European Union funded project for the National Commission
for the Promotion of Equality and its strategy for Gender Mainstreaming. The questionnaire
seeks to collate unique information on many of the differences featuring in the conditions of
work afforded to men and women, enabling local entities to implement positive approaches to
promote equality at work.
We shall be most grateful if you are willing to spend the 30 – 45 minutes in answering the
questions asked by our interviewer. Any information you will provide us will be treated with the
strictest of confidence and will not be seen by anyone outside Allied Consultants. It will not be
used in any way that can lead to the identification of individuals. Indeed, your response, like
many others, will be used for analysis of aggregate results from all respondents.
Nevertheless, we shall be asking you for a telephone number and few contact details, this to
enable us to return to you, should the case arise, to clarify or verify your responses. This is a
standard approach we apply in our research in order to verify that the questionnaire was
completed correctly and that the data truly reflects your responses.
Allied Consultants is a private research company and respects a strict code of data protection
and social research ethic. Our interviewer will not attempt to sell anything to you, nor will this
survey result in other persons calling on you for the sale of products/services or providing you
with advertising material.
Our interviewer will answer any other questions you may have. Whilst thanking you for your
participation, we hope that you enjoy the survey.
Yours sincerely,
Emanuel Said
Director

Gender Pay Review
National Commission for the Promotion of Equality
Malta September 2006 page 290 of 327
Administrative
Interview Date
Contact Sheet Reference:
01 Day 02 Month 03
01 to 31 04 Location of interview (town)
Introduction
Good morning/afternoon/evening. I am _____________________ from Allied Consultants. We are conducting a survey on aspects of reward for work and differences in conditions of work between men and women. Can you help us?
Result of Call Reasons for non-cooperation:
Date Time Cooperation? Not at home Refusal Other reasons*
1st call Yes No 1 2 ..
2nd call Yes No 1 2 ..
3rd call Yes No 1 2 ..
*Other reasons: 3 = no longer available (deceased, retired, abroad); 4 = requested postponement; 5 = other reasons End Attempts if Non-cooperative on 3rd call
Title Name Surname
Who is the person answering to this questionnaire
05 06 07
08 Designation at Work
09 Respondent phone number
Back Check?
Yes � � No
Method?
Phone � � Personal Visit
BACKCHECK SUPERVISOR
BACKCHECK DATE d d m m 2 0 0 6
Main Questionnaire
About You
GENDER (DO NOT PROMPT)
10 MALE � OR � FEMALE
11 Can you tell us your age last birthday?
How would you describe your status? (select one answer where applicable) 12 Married or living with partner � 1
Separated or divorced and not living with partner � 2
Widowed and not living with partner � 3
Never married and not living with partner – but living with parents � 4
Never married and not living with partner – living alone � 5
Don’t know / no answer � &

Gender Pay Review
National Commission for the Promotion of Equality
Malta September 2006 page 291 of 327
Do you have caring responsibilities at home?
13 YES � OR � NO
If no, go to 22
How would you describe these caring responsibilities? (select one answer where applicable) 14 Kids – under 2 years � 1
15 Kids – between 2 and 5 years � 2
16 Kids – between 5 and 16 years � 3
17 Others � 4
If ‘no’ to 17, go to 22
How would you describe other caring responsibilities? (select one answer where applicable) 18 Parents / others – independent � 1
19 Parents / others – dependent (immobile or with disability) � 2
20 Others � 3
21 Others Specify
How much time do you spend in domestic work / caring responsibilities on average (daily)? (select one answer where applicable) 22 < 1hr � 1
1- 3 hrs � 2
4 - 5 hrs � 3
5 - 7 hrs � 4
7 - 9 hrs � 5
>9 hours � 6
Don’t know / no answer � &
23 What is the highest level of education you attended? (please choose ONE answer)
Primary Schooling or less � 1 Post Secondary (Vocational) � 5
Secondary Schooling � 2 Diploma (University) & First Degree � 6
Secondary (Vocational) � 3 Post Graduate � 7
Post Secondary � 4
24 What is the highest level of qualifications you attained? (please choose ONE answer)
Less than O-Level equivalent � 1 University Diploma or equivalent – Overseas Institution
� 6
O-Level � 2 University Degree – Baccalaureate � 7
A-Level � 3 University Degree – Masters’ Level � 8
Vocational Certification (City & Guilds or equivalent)
� 4 University Doctoral � 9
University Diploma or equivalent – Local � 5 Other (specify) � 10
25 Others Specify
At Work
Did you experience an unemployment spell before the present job?
26 YES � OR � NO
If no, go to 29
27 How long did it take to find your present job whilst unemployed? (select one answer) less than 3 months? � 1 25 – 36 months � 6
4 – 6 months? � 2 3 years+ � 7
7 – 12 months? � 3 Regularly every season � 8
13 – 18 months? � 4 Other � 9
19 – 24 months � 5
28 Specify Others

Gender Pay Review
National Commission for the Promotion of Equality
Malta September 2006 page 292 of 327
Did you undergo any training/education in order to increase the chance of employability whilst in your present job?
29 YES � OR � NO
If NO, go to 36
Who funded your studies?(circle where appropriate) 30 Parents � 31 Employer Funded �
32 Self � 33 Other �
34 Government Scheme �
35 Specify Others
Month Starting Year Starting Total Months
36 How long have you been in employment?
37
Since starting your career in work, how many jobs did you change? In other words – what is your current job? The only job you ever had? The second job – after changing your job once? (select one answer)
My present job is the only job I ever had � 1 Sixth job � 6
My present job is the 2nd job – I changed jobs once � 2 Seventh job � 7
My present job is the 3rd job – I changed jobs twice � 3 Eight Job � 8
Fourth job � 4 Ninth Job � 9
Fifth job � 5 Tenth Job or more � 10
38 How can you describe the Company where you are presently employed? (select one answer) Government Organisation/Department � 1 Private Company/Sole trader � 4
Parastatal Company � 2 Commercial Partnership � 5
Publicly Listed Company � 3 Non-Profit Organisation � 6
39 How do you describe your Company’s sector of activity? (select one answer)
Agriculture & fishery 01 Mfg: Metal products & engineering 09 Other personal services 17 Banking, finance & insurance 02 Mfg: Leather & leather goods 10 Printing 18
Communications 03 Mfg: paper 11 Real Estate 19 Community & business 04 Mfg: Pharmaceutical 12 Recreation services 20
Government services 05 Mfg: Rubber & chemical 13 Stone quarrying & construction 21 Hotel & Catering 06 Mfg: textiles, footwear & clothing 14 Storage & warehousing 22
Mfg: Electrical products & appliances 07 Mfg: Transport Equipment 15 Transport 23
Mfg: food, beverage & tobacco Mfg: wood, cork & furniture Utility: Energy & Water supply 24
08
16 Wholesale & retail 25
Full time? Full time
(reduced hours)?
Part Time?
40 Is your present main job.. � � � 1 2 3
If ‘Full time’ go to 43
41 Why did you choose to work on such a basis? (select one answer) Still studying � 1 Could not find a full-time job � 4
Own disability/illness � 2 Other personal / family responsibilities � 5
Caring responsibilities at home � 3 Other reasons � 6
42 Specify other

Gender Pay Review
National Commission for the Promotion of Equality
Malta September 2006 page 293 of 327
Are you engaged in more than one job?
43 YES � OR � NO
44 What is the basis of your main job?
Casual Permanent – Fixed
Term Contract
Permanent –
Indefinite Contract
� � � 1 2 3
If ‘1’ or ‘3’, Skip to 47
45 What is the duration of the Contract? (select one answer) less than 3 months? � 1 25 – 36 months � 6
4 – 6 months? � 2 3 years+ � 7
7 – 12 months? � 3 Regularly every season � 8
13 – 18 months? � 4 Other � 9
19 – 24 months � 5
46 Specify other
47
How many hours do you have to work as a minimum weekly in your main job?
Hours
48 Which of the following is true in your case? (select one answer) In my present main job I seek to decrease the hours of work � 1
I am happy with the number of hours I work in my main job � 2
In my present main job I seek to increase the hours of work � 3
Don’t Know / No Answer � &
Do you work on shift?
49 YES � OR � NO
If no, go to 54
Alternate Split Permanent
50 How can you describe your basis of shift? � � �
1 2 3
If ‘2’ go to 52
51 How do you describe your type of shift? (select one answer from show card and circle near to code shown on right)
Morning / afternoons / night � 1
Morning / afternoons � 2
Day / night � 3
Are you entitled to a shift allowance?
52 YES � OR � NO
If no, go to 54
53 What is the weekly, gross shift allowance (before tax & NI)?
LM / week
Do you work for additional hours on top of the hours you stated (see Q 47)?
54 YES � OR � NO
If no, go to 62
55 How many additional hours do you work in a week on average?
Hours weekly

Gender Pay Review
National Commission for the Promotion of Equality
Malta September 2006 page 294 of 327
Are you entitled to an overtime payment?
56 YES – paid � OR YES – paid in Time
of In Lieu � OR NO �
If no, go to 62
How is your remuneration for overtime work calculated? Please provide us with the time (hours) at which you are paid for the time worked overtime on these days
Time W
orked
Equivalent
Time for
remuneration
(hours)
Not
applicable/no
answer
57 Ordinary Work days, after hours 1 hour
&
58 Ordinary Work days, night hours (after 22:00) 1 hour
&
59 Saturdays 1 hour
&
60 Sundays 1 hour
&
61 Public Holidays 1 hour
&
Do you benefit from flexitime (flexible hours, flexible work weeks)?
62 YES � OR � NO
Role & Responsibilities
63 Which of the following describes best your level of responsibility? (select one answer from show card and circle near code shown on right)
Senior Managers, Large Business Owners, Directors, High ranking Government Officials � 1
Professionals (employed or self-employed) � 2
Associate Professionals and Technical � 3
Clerical employees � 4
Skilled agriculture & fishery workers � 5
Crafts & related trades � 6
Plant & machine operator, assembly workers � 7
Elementary occupations � 8
Sales & Market Workers � 9
Which of the following describes best the role of your direct superior? (select one answer)
64 Designation
65
Senior Managers, Large Business Owners, Directors, High ranking Officials � 1
Professionals (employed or self-employed) � 2
Associate Professionals and Technical � 3
Clerical employees � 4
Skilled agriculture & fishery workers � 5
Crafts & related trades � 6
Plant & machine operator, assembly workers � 7
Elementary occupations � 8 Select Appropriate
Level
Sales & Market Workers � 9
Do you have employees reporting to you?
66 YES � OR � NO If ‘NO’, go to 75
How many employees report to you? (enter number of employees in total at each level) 67 Senior Managers, Directors, High
ranking Officials
68 Professionals (employed or self-employed)
69 Associate Professionals and Technical
70 Clerical employees
71 Skilled agriculture & fishery workers
72 Crafts & related trades
73 Plant & machine operator, assembly workers
74 Elementary occupations

Gender Pay Review
National Commission for the Promotion of Equality
Malta September 2006 page 295 of 327
75 Which of the following best describes your role’s function? (Select one answer) Administration � 1 Maintenance � 7
Customer Care � 2 Marketing � 8
Delivery / Distribution � 3 Operations � 9
Finance � 4 Sales � 10
Human Resources � 5 Production � 11
IT / ICT � 6 Others � 12
76 Specify other
Does your job require you to spend monies on job related expenses (like mobile phone, phone, internet, fuel, travel or others?
77 YES � OR � NO
If no, go to 92
Which of the following are the expenses that you have to incur? (select where applicable and indicate if these are refunded by the employer)
Circle if
Applicable
Are expenses
refunded by
employer?
78 Fixed Line Telephone � 79 � 80 Mobile Phone � 81 � 82 Internet Subscription � 83 � 84 Fuel � 85 � 86 Travel � 87 � 88 Others � 89 �
90 Specify other
91 How much is the total cost of such expenses per month?
Lm / month
For the work you do, are you paid commissions or bonuses related to your performance?
92 YES � OR � NO If no, go to 109
Which of the following describe such additional payments? (select where applicable and indicate if you received them in the past 12 months, and the estimated average you receive MONTHLY)
Circle if
Applicable
Did you receive
payment in
past 12
months?
Estimated
amount
received
monthly (Lm)
93 Commission � 94 � 95
96 Performance Bonus (not statutory) � 97 � 98
99 Production Bonus (not statutory) � 100 � 101
102 One off Bonus (not statutory) � 103 � 104
105 Others � 106 � 107
108 Specify other

Gender Pay Review
National Commission for the Promotion of Equality
Malta September 2006 page 296 of 327
Your Career
Month Starting Year Starting Total Months
109 How long have you been with this company?
Month Starting Year Starting Total Months
110 How long have you been in the present role?
Did you join this employer after a career break? (57)
111 YES � OR � NO
If ‘No’, go to 134
Did you ever avail yourself of a career break?
112 YES � OR � NO
If ‘No’, go to 134
Month Starting Year Starting Total Months
113 How long did this career break take?
Month Ending Year Ending
Were you offered any alternatives to your career break prior to setting off on your break? (circle where applicable if benefit was offered to you by your employer prior to availing of career break)
Offered
Not
Offered
114 Flexitime � � 115 Annualised Hours � � 116 Childcare facilities � � 117 After-school child care facility/programme � � 118 Childcare subsidy / allowance � � 119 Part-time work � � 120 Telework / Home work � � 121 Job Sharing � � 122 Parental leave � � 123 Short notice leave � � 124 Career break with committed/guaranteed return � � 125 Sick/emergency child care leave � � 126 Professional Guidance (childcare, elderly care) � �
What was/were the key reason/s for this career break?(circle where appropriate) 127 Family – Childbirth & childcare � 128 Dismissed from previous employment (58) �
129 Family – adults (disabled or elderly) � 130 Holiday/break �
131 Study � 132 Other reasons �
133 Specify other
Are you looking for a new job?
134 YES � OR � NO
57 Defined as a stop from work longer than 12 months or not through any statutory ‘leave entitlement’ such as maternity or
paternity leave or study leave.
58 Includes employer closing down, employer reducing workforce, employee being dismissed for disciplinary reasons

Gender Pay Review
National Commission for the Promotion of Equality
Malta September 2006 page 297 of 327
If no, go to 137
135 Why are you looking for a new job? (circle once where appropriate)
Risk or certainty of loss or termination of job � 1 Better work conditions � 5
Present job is a temporary one � 2 Additional job to increase hours of work � 6
To work for more hours in total in primary job � 3 Other reasons � 7
To work for less hours in total in primary job � 4 No reason / Don’t Know � &
136 Specify other
Leave
Are you entitled to any days off in your main job?
137 YES � OR � NO
If no, go to 155
Have you availed yourself of any days off in your main job over the past 12 months (or since starting, which ever is the shortest)?
138 YES � OR � NO
How many days of days off are available for you? (Select where applicable, indicate if you are subject to deductions if such leave is availed and the number of days available for such leave in 12 months).
Indicate if entitled
Indicate if deductions
suffered if availed
Number of days available
over 12 months
139 Vacation Leave � 140 � 141
142 Sickness Leave � 143 � 144
145 Study/Training Leave � 146 � 147
148 Maternity / Paternity Leave � 149 � 150
151 Other Leave � 152 � 153
154 Specify other
Remuneration & Pay
155 What is the basic pay that you receive excluding deductions (Tax and NI)?
Lm / month
156 What is the basic pay that you receive following tax deductions?
Lm / month
Pay Structure
Was pay negotiated with employer or found as a standard?
157 Negotiated � OR � Found as a Standard
If ‘Negotiated’ go to 160
158 If the payment system is based on a standardised system, which of the following best describes its type? (select one answer)
Public Sector Collective Agreement � 1 Industry Standard � 4
Collective Agreement – Private Sector � 2 Employer Fixed Scales � 5
Wage Regulation Order � 3 Others � 6

Gender Pay Review
National Commission for the Promotion of Equality
Malta September 2006 page 298 of 327
159 Others Specify
Worker Employer Union Others
160 � � � �
By whom was it negotiated or standardised? 1 2 3 4
161 Others Specify
Which of the following do you associate with prospects for a better pay? (please choose ONE answer per line)
No Importance At All
Very Important
Indeed
No Answer
/ Not
Applicable
162 Further Qualifications 1 2 3 4 5 & 163 Further training 1 2 3 4 5 & 164 More hours of work 1 2 3 4 5 & 165 Seniority 1 2 3 4 5 & 166 Performance 1 2 3 4 5 & 167 Union negotiation 1 2 3 4 5 & 168 Government increases of cost of living 1 2 3 4 5 & 169 Positive attitude towards work 1 2 3 4 5 & 170 Job Commitment 1 2 3 4 5 & 171 Others 1 2 3 4 5 &
172 Others Specify
Have you ever been offered a promotion?
173 YES � OR � NO
If no, go to 216
Which of the following reasons could possibly have been the reasons for your promotion? (please choose ONE answer per line)
No Impact At All
Very High
Impact
No Answer
/ Not
Applicable
174 Further Qualifications 1 2 3 4 5 & 175 Further training 1 2 3 4 5 & 176 Seniority 1 2 3 4 5 & 177 Performance 1 2 3 4 5 & 178 Government increases of cost of living 1 2 3 4 5 & 179 More hours worked 1 2 3 4 5 & 180 Union Negotiation 1 2 3 4 5 & 181 Positive attitude towards work 1 2 3 4 5 & 182 Job Commitment 1 2 3 4 5 & 183 Others 1 2 3 4 5 &
184 Others Specify
Have you ever declined a promotion offered to you?
185 YES � OR � NO
If no, go to 216
If you did not accept the promotion, what were the possible reasons? (circle where appropriate) 186 Added Responsibilities � 187 New Team Members �
188 Longer Hours � 189 Nature of Tasks �
190 New Location � 191 Pressure from family/friends �
192 New Boss � 193 Others �
194 Others Specify

Gender Pay Review
National Commission for the Promotion of Equality
Malta September 2006 page 299 of 327
When giving a promotion or further training, what factors are of most important in your opinion for the employers? (please choose ONE answer per line)
Not important At All
Very Important
Indeed
No Answer
/ Not
Applicable
195 Skills 1 2 3 4 5 & 196 Age 1 2 3 4 5 & 197 Qualifications 1 2 3 4 5 & 198 Positive attitude towards work 1 2 3 4 5 & 199 Commitment towards job 1 2 3 4 5 & 200 Gender 1 2 3 4 5 & 201 Mind set / culture 1 2 3 4 5 & 202 Lifestyle of employee 1 2 3 4 5 & 203 Family status 1 2 3 4 5 & 204 Friends 1 2 3 4 5 & 205 Connections outside company 1 2 3 4 5 & 206 Religion 1 2 3 4 5 & 207 Nationality 1 2 3 4 5 & 208 Social interests 1 2 3 4 5 & 209 Innovation & creativity 1 2 3 4 5 & 210 Logical reasoning skills 1 2 3 4 5 & 211 Friendly attitude with co-workers 1 2 3 4 5 & 212 Assertiveness 1 2 3 4 5 & 213 Communication skills 1 2 3 4 5 & 214 Others 1 2 3 4 5 &
215 Others Specify
Which of the following reasons may be considered by your employer in awarding a future promotion? (please choose ONE answer per line)
Very Unlikely
Very Likely Indeed
No Answer /
Not
Applicable
216 Further Qualifications 1 2 3 4 5 & 217 Further training 1 2 3 4 5 & 218 Seniority 1 2 3 4 5 & 219 Performance 1 2 3 4 5 & 220 Government increases of cost of living 1 2 3 4 5 & 221 More hours worked 1 2 3 4 5 & 222 Union Negotiation 1 2 3 4 5 & 223 Positive attitude towards work 1 2 3 4 5 & 224 Job Commitment 1 2 3 4 5 & 225 Others 1 2 3 4 5 &
226 Others Specify
Work at Home
Can you work at home as part of your main job?
227 YES � OR � NO
If no, go to 231 Home Work Both
� � � 228 Where do you prefer to work?
1 2 3 If ‘WORK’, go to 231
229 How many hours do you dedicate for job related work at home weekly?
Hours / weekly

Gender Pay Review
National Commission for the Promotion of Equality
Malta September 2006 page 300 of 327
230
If you had to give up working at home for your present employer, how much would you ask for as a suited remuneration to compensate for the ‘inconvenience’ in amounts of money weekly? Do not prompt – let participant mention a weekly amount of money. Select one of the following accordingly
Lm 0 � 1 Lm 20 – Lm 30 weekly � 4
Lm 0 – Lm 10 weekly � 2 Lm 30 – Lm 50 weekly � 5
Lm 10 – Lm 20 weekly � 3 Lm 50+ weekly � 6
Equality & Protection at Work
Employment Regulations (please choose ONE answer per line)
Strongly Disagree
Strongly Agree
No Answer
/ Not
Applicable
231 Legal provisions protect worker effectively 1 2 3 4 5 & 232 Legal provisions exist for protection of the worker 1 2 3 4 5 & 233 Trade unions are an effective mechanism for protecting workers 1 2 3 4 5 & 234 Employers never seek to abuse employees 1 2 3 4 5 & 235 My employer treats all employees equally 1 2 3 4 5 & 236 My employer is a fair organisation 1 2 3 4 5 & 237 Industrial tribunals operate in Malta 1 2 3 4 5 & 238 Industrial tribunals protect the rights of workers 1 2 3 4 5 & 239 Industrial tribunals protect employers 1 2 3 4 5 &
Have you ever been unfairly treated by your employer?
240 YES � OR � NO
If no, go to 278
What do you consider the key reasons for unfair treatment by your employer? (please choose ONE answer per line)
No Impact At All
Strong Impact Indeed
No Answer
/ Not
Applicable
241 Age 1 2 3 4 5 & 242 Sex 1 2 3 4 5 & 243 Disability 1 2 3 4 5 & 244 Marital Status 1 2 3 4 5 & 245 Motherhood 1 2 3 4 5 & 246 Basis of contract (e.g. part time) 1 2 3 4 5 & 247 Education 1 2 3 4 5 & 248 Others 1 2 3 4 5 &
249 Others Specify
In case of Unfair treatment, did you seek to redress the situation?
250 YES � OR � NO If no, go to 266
How? (select where applicable and indicate if these are refunded by the employer)
Circle if
Applicable
Were
expenses
refunded by
employer?
251 Complained with employer on my own � 252 � 253 Sought legal assistance by lawyer and complained formally with employer � 254 � 255 Sought assistance by a trade union/professional association � 256 � 257 Sought assistance by other people � 258 � 259 Adjusted to new conditions � 260 � 261 Sought an alternative job and quit � 262 � 263 Others � 264 �

Gender Pay Review
National Commission for the Promotion of Equality
Malta September 2006 page 301 of 327
265 Others Specify
Proceed to 278
If not redressed, why? (please choose ONE answer per line)
Strongly Disagree
Strongly Agree
No Answer /
Not
Applicable
266 Fear of losing job 1 2 3 4 5 & 267 No faith in law 1 2 3 4 5 & 268 No faith in the trade union 1 2 3 4 5 &
269 Trade union / association turned down my request/suggested not to take action
1 2 3 4 5 &
270 Legal counsel suggested to drop actions 1 2 3 4 5 & 271 Political connections of employer 1 2 3 4 5 & 272 Aspect was not in breach of law 1 2 3 4 5 & 273 Employer would not discuss / was not available 1 2 3 4 5 & 274 Fear of long term unemployment 1 2 3 4 5 & 275 Fear of further discrimination by employer 1 2 3 4 5 & 276 Other 1 2 3 4 5 &
277 Others Specify
How does your pay from your main job compare? (please choose ONE answer per line)
Much Less Paid
Much Better Paid
No Answer
/ Not
Applicable
278 Actual compared to expected -2 -1 0 1 2 &
279 Your pay compared to men in same company having the same role with the same experience
-2 -1 0 1 2 &
280 Your pay compared to women in the same company having the same role with the same experience
-2 -1 0 1 2 &
281 Your pay compared to men in same company having the same role with the same experience in full-time job
-2 -1 0 1 2 &
282
Your pay compared to women in the same company having the same role with the same experience in full-time job
-2 -1 0 1 2 &
283 Your pay compared to men in same company having the same role with the same experience in a part-time job
-2 -1 0 1 2 &
284
Your pay compared to women in the same company having the same role with the same experience in a part-time job
-2 -1 0 1 2 &
285
Your pay compared to men in a different company in the same industry having the same role with the same experience
-2 -1 0 1 2 &
286 Your pay compared to women in a different company in the same industry having the same role with the same experience
-2 -1 0 1 2 &
287 Your pay compared to men in a different company in a different industry having the same role with the same experience
-2 -1 0 1 2 &
288 Your pay compared to women in a different company in a different industry having the same role with the same experience
-2 -1 0 1 2 &

Gender Pay Review
National Commission for the Promotion of Equality
Malta September 2006 page 302 of 327
Gender Orientation
Do you consider your job to be more appropriate for: (Circle where applicable) 289 Men � 1
Women � 2
Both � 3
What are the reasons for your answers in 289? (please choose ONE answer per line) Strongly
disagree Strongly
agree
No Answer
/ Not
Applicable
290 Physical Strength 1 2 3 4 5 & 291 Job commitment 1 2 3 4 5 & 292 Patience 1 2 3 4 5 & 293 Shifts 1 2 3 4 5 & 294 Communication Skills 1 2 3 4 5 & 295 Leading Skills 1 2 3 4 5 & 296 Maturity 1 2 3 4 5 & 297 Initiative 1 2 3 4 5 & 298 Flexibility 1 2 3 4 5 & 299 Other 1 2 3 4 5 &
300 Specify Other
Does your employer offer support schemes for workers with caring responsibilities?
301 YES � OR � NO
If no, go to 311
Which of the following does your employer offer to employees with caring responsibilities? (Circle where applicable) 302 Childcare facilities – owned by employer �
303 Childcare facilities near employer (but run independently) �
304 Flexitime �
305 Reduced hours �
306 Care counselling �
307 Extended hours childcare services �
308 Emergency leave for care reasons �
309 Other �
310 Others Specify
More Equal Less
� � � 311 How much do you consider a woman as being committed to work compared to a man?
1 2 3
Do part time workers have access to training & promotion at your employer’s establishment?
312 YES � OR � NO
More Equal Less
� � � 313 In your opinion, how interested are part timers in training compared to full timers?
1 2 3
More Equal Less
314 In your opinion, how committed are part timers compared to full timers
� � �
1 2 3

Gender Pay Review
National Commission for the Promotion of Equality
Malta September 2006 page 303 of 327
This survey forms part of a large research project that relates to the same areas discussed above. Would you be willing to help us in further research by participating in other surveys?
315 YES � OR � NO
Comments
Thank you for participating in this research

Gender Pay Review
National Commission for the Promotion of Equality
Malta September 2006 page 304 of 327
Appendix 3 Sample Features
Desired Sample Characteristics
Table 147 sets out a summary of the distribution of Maltese persons in employment by gender
across different occupation groups, while Table 148 provides the same analysis of Maltese
persons in employment by gender and their sector of employment. This analysis suggests a
number of options in respect to the selection of participants in research for this project,
including:
� Equal distribution of responses across the sexes (50% women, 50% men);
� Stratification of responses across the sexes (47.9% women, 52.1% men);
� Stratification of responses across gender, occupation and sectors
In maximising the representativeness of a sample in respect to the Maltese population of
persons engaged in gainful occupations, Option (L) above provides optimised approach. The
representativeness of this sample is further augmented through post-hoc, cell-by-cell posteriori
stratification weighting of data, based on relevant published statistics available through official
sources at the time of the compilation of research.
Table 147 – Distribution of Maltese Persons in Employment by Gender and Occupation (59) as at December 2005
Men Women Total
Armed Forces 1,173 1,173
Clerks 6,934 10,031 16,965
Craft and related trades workers 19,817 263 20,080
Elementary occupations 14,168 3,839 18,007
Legislators; senior officials and managers 10,199 3,068 13,267
Plant and machine operators and assemblers 11,234 3,363 14,597
Professionals 9,448 6,739 16,187
Service workers and shop and sales workers 13,088 9,976 23,064
Skilled agricultural and fishery workers 2,914 2,914
Technicians and associate professionals 14,723 7,252 21,975
Total 103,698 44,531 148,229
Men Women Total
Armed Forces 0.8% 0.0% 0.8%
Clerks 4.7% 6.8% 11.4%
Craft and related trades workers 13.4% 0.2% 13.5%
Elementary occupations 9.6% 2.6% 12.1%
Legislators; senior officials and managers 6.9% 2.1% 9.0%
Plant and machine operators and assemblers 7.6% 2.3% 9.8%
Professionals 6.4% 4.5% 10.9%
Service workers and shop and sales workers 8.8% 6.7% 15.6%
Skilled agricultural and fishery workers 2.0% 0.0% 2.0%
Technicians and associate professionals 9.9% 4.9% 14.8%
Total 70.0% 30.0% 100.0%
Employed PersonsOccupation
OccupationEmployed Persons

Gender Pay Review
National Commission for the Promotion of Equality
Malta September 2006 page 305 of 327
Table 148 – Distribution of Maltese Persons in Employment by Gender and Sector of Activity (60) as at December 2005
Men Women Total
Agriculture, hunting & forestry 2,804 111 2,915
Fishing 533 - 533
Mining & quarrying 491 - 491
Manufacturing 21,730 5,565 27,295
Electricity, gas & water supply 2,985 309 3,294
Construction 12,456 283 12,739
Wholesale & retail trade, repairs 14,368 6,765 21,133
Hotels & restaurants 7,906 5,111 13,017
Transport, storage & communication 9,986 1,996 11,982
Financial intermediation 3,122 2,953 6,075
Real Estate, renting & business activities 5,901 2,375 8,276
Public administration 8,771 2,634 11,405
Education 3,854 7,225 11,079
Health & social work 4,954 5,625 10,579
Other community, social & personal service activities 3,651 3,579 7,230
Private households with employed persons - - -
Extra-territorial organisations & bodies 186 - 186
Total 103,698 44,531 148,229
Men Women Total
Agriculture, hunting & forestry 1.9% 0.1% 2.0%
Fishing 0.4% 0.0% 0.4%
Mining & quarrying 0.3% 0.0% 0.3%
Manufacturing 14.7% 3.8% 18.4%
Electricity, gas & water supply 2.0% 0.2% 2.2%
Construction 8.4% 0.2% 8.6%
Wholesale & retail trade, repairs 9.7% 4.6% 14.3%
Hotels & restaurants 5.3% 3.4% 8.8%
Transport, storage & communication 6.7% 1.3% 8.1%
Financial intermediation 2.1% 2.0% 4.1%
Real Estate, renting & business activities 4.0% 1.6% 5.6%
Public administration 5.9% 1.8% 7.7%
Education 2.6% 4.9% 7.5%
Health & social work 3.3% 3.8% 7.1%
Other community, social & personal service activities 2.5% 2.4% 4.9%
Private households with employed persons 0.0% 0.0% 0.0%
Extra-territorial organisations & bodies 0.1% 0.0% 0.1%
Total 70.0% 30.0% 100.0%
OccupationEmployed Persons
OccupationEmployed Persons
59 Source: Labour Force Survey. National Statistics Office © 2006
60 Source: Labour Force Survey. National Statistics Office © 2006

Gender Pay Review
National Commission for the Promotion of Equality
Malta September 2006 page 306 of 327
Characteristics of Survey Participants
Interviewing, initiated on 16 May 2006, involved the piloting of the instrument with 30 voluntary
interviewees. On 1 June 2006, a team of 22 interviewers set out on the conduct of full-scale
field work, conducting a total of 608 CAPI (61) with persons randomly selected through the
Electoral Register (issued by the Department of Information in April 2006)
These interviews related to persons in paid employment and excluded business owners or self-
employed individuals. A proportion of the interviews (10%) were back checked personally or
telephonically by different field interviewers or field supervisors in order to verify the responses
recorded during the conduct of CAPI. Of these 608 records, 21 were invalidated for a number
of reasons following the conduct of back-check verifications, leaving a total of 587 valid records.
An analysis of the characteristics of the survey participants is set out hereunder, showing how:
� 40.7% of the interviewees were women;
� The mean age of the survey participants stood at 33.7 years;
� 225 participants claimed to have caring responsibilities at home (38.3% of respondents);
� 30 participants (out of the above 225 – or 13.3%) claimed to have caring responsibilities involving
own children older than 16 years of age;
� Of the 225 participants who claimed to have caring responsibilities at home, 170 had only one type
of such responsibility at home (75.5%);
� 543 respondents recalled the amount of time spend in domestic work (Table 156), with the mean
time devoted to such work being shorter (on a weekly basis) among male respondents than their
female counterparts (Table 157);
� Time spent in domestic work varied across occupations (ISCO 1988 coding), wherein the longest
time devoted to domestic work featured among professional and associate professional
participants, while among women, the longest time devoted to domestic work featured among
clerical, plant & machine operator or shop & market service workers or women in elementary
occupations (Table 158);
� Time spent in domestic work also featured differences in age. Indeed the mean age of women
increased with increasing durations of daily domestic work, albeit no such relationship could be
observed among male research participants;
61 Computer Assisted Personal Interviews

Gender Pay Review
National Commission for the Promotion of Equality
Malta September 2006 page 307 of 327
� 21.98% of the respondents were engaged in work with Governmental institutions (which compares
very closely to the 20.5% of the gainfully employed engaged with Government institutions as
established by the Labour Force Survey in December 2005 (62);
� 84.2% of the research participants were engaged in a full-time job (63). An analysis of the job
features across gender (Table 166) showed that women more often held a part-time job as a main
job than their male counterparts;
� 85.9% of research participants occupied only one job;
� 77.5% of research participants occupied a job with an indefinite contract.
Table 149 – Summary of Research Participant Gender
348 59.3
239 40.7
587 100.0
Male
Female
Total
Valid
Frequency Valid Percent Male
59.3%
Female
40.7%
Table 150 – Research Participants’ Age Age
35.72 346 12.871
30.61 234 10.863
33.66 580 12.348
Gender
Male
Female
Total
Mean N Std. Deviation
20 30 40 50 60 70
Age
0
20
40
60
Co
un
t
Male Female
20 30 40 50 60 70
Age
62 Source: National Statistics Office. Labour Force Survey © 2006
63 In December 2005 Labour Force Survey (© National Statistics Office 2006) established that 90.3% of gainfully employed
(including self-employed) occupied a full-time job

Gender Pay Review
National Commission for the Promotion of Equality
Malta September 2006 page 308 of 327
Figure 2 – Research Sample Age Characteristics
FemaleMale
Gender
80
60
40
20
0
Ag
e
80
60
40
20
0
Ag
e
120 100 80 60 40 20 0
Frequency
120100806040200
Frequency
Table 151 – Geographic Distribution of Respondents
126 21.5
181 30.8
79 13.5
83 14.1
84 14.3
34 5.8
587 100.0
Southern Harbour
Northern Harbour
South Eastern
Western
Northern
Gozo & Comino
Total
Valid
Frequency Valid Percent
Desired Achieved
Gozo & Comino
Northern
Western
Northern Harbour
Southern Harbour
South Eastern
21.5%
13.5%
5.8%
14.3%
14.1%
30.8%
13.8%
30.7%
21.5%
13.8%
7.9%
12.3%

Gender Pay Review
National Commission for the Promotion of Equality
Malta September 2006 page 309 of 327
Table 152 – Summary of Respondent Family Status
284 48.4
13 2.2
2 .3
250 42.6
38 6.5
587 100.0
Married or living with partner
Separated, not living with partner
Widowed, not living with partner
Not married, no partner with parents
Not married, not with partner, alone
Total
Valid
Frequency Valid Percent
48.38
2.21
0.34
42.59
6.47
0 20 40
Married or living with partner
Separated, not living with partner
Widowed, not living with partner
Not married, no partner with parents
Not married, not with partner, alone
% of Respondents
Table 153 – Summary of Respondent Caring Responsibilities at Home
225 38.3
362 61.7
587 100.0
Yes
No
Total
Valid
Frequency Valid Percent
Yes
38.3%
No
61.7%
Table 154 – Analysis of Respondents’ Caring Responsibilities at Home
33 11.5% 14.7%
40 13.9% 17.8%
118 41.1% 52.4%
53 18.5% 23.6%
13 4.5% 5.8%
30 10.5% 13.3%
287 100.0% 127.6%
Responsibilities - Kids, under 2 years
Responsibilities - Kids, between 2 and 5
Responsibilities - Kids, between 6 and 16
Responsibilities - Parents / other - independent
Responsibilities - Parents / other - dependent
Others
CaringResponsibilitiesAt Home
a
Total
N Percent
Responses Percent of
Cases
a.

Gender Pay Review
National Commission for the Promotion of Equality
Malta September 2006 page 310 of 327
Table 155 – Analysis of Caring Responsibilities: An Index of the Variety of Caring Responsibilities at Home (64)
170 75.6
49 21.8
5 2.2
1 .4
225 100.0
1
2
3
4
Total
Valid
Frequency Valid Percent
75.56
21.78
2.22
0.44
0 20 40 60
1
2
3
4
% of Respondents with Responsibility at Home
Table 156 – Time Spent in Domestic Work at Home
220 37.5
203 34.6
56 9.5
30 5.1
11 1.9
23 3.9
44 7.5
587 100.0
<1hr
1-3 hrs
4-5 hrs
6-7 hrs
8-9 hrs
>9 hrs
Don't know/no answer
Total
Valid
Frequency Valid Percent
37.48
34.58
9.54
5.11
1.87
3.92
7.50
0 20
<1hr
1-3 hrs
4-5 hrs
6-7 hrs
8-9 hrs
>9 hrs
Don't know/no answer
% of Respondents Devoting Time to Domestic Work
64 An index of the responsibilities at home was created by adding up the categories of responsibilities claimed by the
respondent. Thus, a respondent claiming to have a caring responsibility related to children younger than 2 years only was
assigned a score of 1, while a respondent claiming to have a caring responsibility relating to children younger than 2 years
and between 2 and 5 years was assigned a score of 2. Only one survey participant had a score of 4 types of responsibilities
at home.
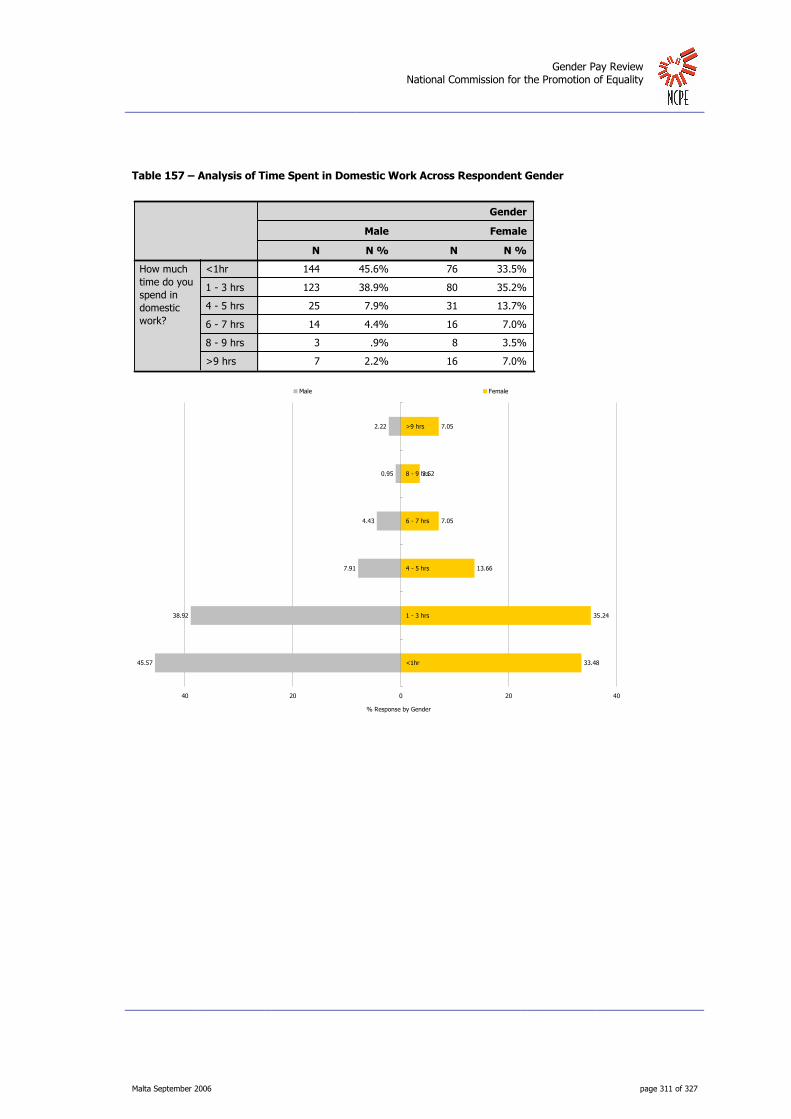
Gender Pay Review
National Commission for the Promotion of Equality
Malta September 2006 page 311 of 327
Table 157 – Analysis of Time Spent in Domestic Work Across Respondent Gender
144 45.6% 76 33.5%
123 38.9% 80 35.2%
25 7.9% 31 13.7%
14 4.4% 16 7.0%
3 .9% 8 3.5%
7 2.2% 16 7.0%
<1hr
1 - 3 hrs
4 - 5 hrs
6 - 7 hrs
8 - 9 hrs
>9 hrs
How muchtime do youspend indomesticwork?
N N %
Male
N N %
Female
Gender
45.57
38.92
7.91
4.43
0.95
2.22
33.48
35.24
13.66
7.05
3.52
7.05
402002040
<1hr
1 - 3 hrs
4 - 5 hrs
6 - 7 hrs
8 - 9 hrs
>9 hrs
Male Female
% Response by Gender

Gender Pay Review
National Commission for the Promotion of Equality
Malta September 2006 page 312 of 327
Table 158 – Analysis of Time Devoted to Domestic Work by Gender and Occupation Type (65)
1.63 2.00
2.02 1.71
2.29 2.20
1.75 2.52
1.38 .
1.78 2.57
1.78 3.47
1.65 2.15
How much time do you spendin domestic work?
Senior Managers, Largebusiness Owners, Directors
How much time do you spendin domestic work?
Professionals (employed orself employed)
How much time do you spendin domestic work?
Associate Professionals andTechnical
How much time do you spendin domestic work?
Clerical employees
How much time do you spendin domestic work?
Crafts and related trades
How much time do you spendin domestic work?
Plant and machine operator,assembly workers
How much time do you spendin domestic work?
Elementary occupations
How much time do you spendin domestic work?
Shop & Market services
Your level ofresponsibility
Mean
Male
Mean
Female
Gender
Table 159 – Analysis of Time Devoted to Domestic Work by Gender and Average Age
33.50 24.55
38.33 31.97
41.80 35.65
35.21 34.69
26.33 37.25
40.43 36.00
Age<1hr
Age1 - 3 hrs
Age4 - 5 hrs
Age6 - 7 hrs
Age8 - 9 hrs
Age>9 hrs
How muchtime do youspend indomesticwork?
Mean
Male
Mean
Female
Gender
65 ISCO 1988. Means relate to a relative scale of duration of domestic work daily, wherein 1 = < 1hr daily, 2 = 1 to 3 hours
daily, 3 = 3 – 5 hours daily, 4 = 5 – 7 hours daily, 5 = 7 – 9 hours daily, 6 = >9 hours daily.

Gender Pay Review
National Commission for the Promotion of Equality
Malta September 2006 page 313 of 327
Table 160 – Summary of Research Participants’ Educational Attainment
130 22.1
151 25.7
93 15.8
57 9.7
25 4.3
28 4.8
58 9.9
27 4.6
18 3.1
587 100.0
Less than O- Level equivalent
O-Level
A-Level
Vocational Certification (City & Guilds or equivalent)
University Diploma or equivalent -Local
University Diploma or equivalent -Overseas Institution
University Degree- Baccalaureate
University Degree- Masters' Level
Others
Total
Valid
Frequency Valid Percent
22.15
25.72
15.84
9.71
4.26
4.77
9.88
4.60
3.07
0 20
Less than O- Level equivalent
O-Level
A-Level
Vocational Certification (City & Guilds or
equivalent)
University Diploma or equivalent -Local
University Diploma or equivalent -Overseas
Institution
University Degree- Baccalaureate
University Degree- Masters' Level
Others
% of Respondents

Gender Pay Review
National Commission for the Promotion of Equality
Malta September 2006 page 314 of 327
Table 161 – Summary of Respondents’ Employer Type
129 22.0
36 6.1
37 6.3
370 63.0
8 1.4
7 1.2
587 100.0
Government Organisation/Department
Parastatal Company
Publicly Listed Company
Private Company/Sole Trader
Commercial Partnership
Non-profit Organisation
Total
Valid
Frequency Valid Percent
21.98
6.13
6.30
63.03
1.36
1.19
0 20 40 60
Government Organisation/Department
Parastatal Company
Publicly Listed Company
Private Company/Sole Trader
Commercial Partnership
Non-profit Organisation
% of Respondents

Gender Pay Review
National Commission for the Promotion of Equality
Malta September 2006 page 315 of 327
Table 162 – Summary of Research Participants’ Sector of Employment
2 .3
34 5.8
33 5.6
29 4.9
126 21.5
63 10.7
21 3.6
21 3.6
15 2.6
4 .7
12 2.0
9 1.5
26 4.4
4 .7
3 .5
57 9.7
26 4.4
4 .7
8 1.4
16 2.7
3 .5
19 3.2
12 2.0
40 6.8
587 100.0
Agriculture
Banking, finance & insurance
Communications
Community & business
Government services
Hotel and catering
Mfg: Electrical products & appliances
Mfg: food, beverage & tobacco
Mfg: Metal products & engineering
Mfg: paper
Mfg: Pharmaceutical
Mfg: Rubber & chemical
Mfg: Textiles, footwear & clothing
Mfg: Transport Equipment
Mfg: wood, cork & furniture
Other personal services
Printing
Real Estate
Recreation services
Stone quarrying & construction
Storage & warehousing
Transport
Utility: Energy & Water supply
Wholesale & retail
Total
Valid
Frequency Valid Percent

Gender Pay Review
National Commission for the Promotion of Equality
Malta September 2006 page 316 of 327
Figure 3 – Summary of Research Participants’ Sector of Employment
0.34
5.79
5.62
4.94
21.47
10.73
3.58
3.58
2.56
0.68
2.04
1.53
4.43
0.68
0.51
9.71
4.43
0.68
1.36
2.73
0.51
3.24
2.04
6.81
0 10 20
Agriculture
Banking, finance & insurance
Communications
Community & business
Government services
Hotel and catering
Mfg: Electrical products & appliances
Mfg: food, beverage & tobacco
Mfg: Metal products & engineering
Mfg: paper
Mfg: Pharmaceutical
Mfg: Rubber & chemical
Mfg: Textiles, footwear & clothing
Mfg: Transport Equipment
Mfg: wood, cork & furniture
Other personal services
Printing
Real Estate
Recreation services
Stone quarrying & construction
Storage & warehousing
Transport
Utility: Energy & Water supply
Wholesale & retail
% of Respondents
Table 163 – Summary of Research Participants’ Employer Sector of Activity (Simplified)
2 .3%
16 2.7%
126 21.5%
63 10.7%
239 40.7%
141 24.0%
587 100.0%
Agriculture & Fishery
Stone Quarrying & Construction
Governmental Services
Hotel & Catering
Services
Manufacturing
Total
SectorofActivity
Count Valid Percent
0.34
2.73
21.47
10.73
40.72
24.02
0 20 40
Agriculture & Fishery
Stone Quarrying & Construction
Governmental Services
Hotel & Catering
Services
Manufacturing
% of Respondents
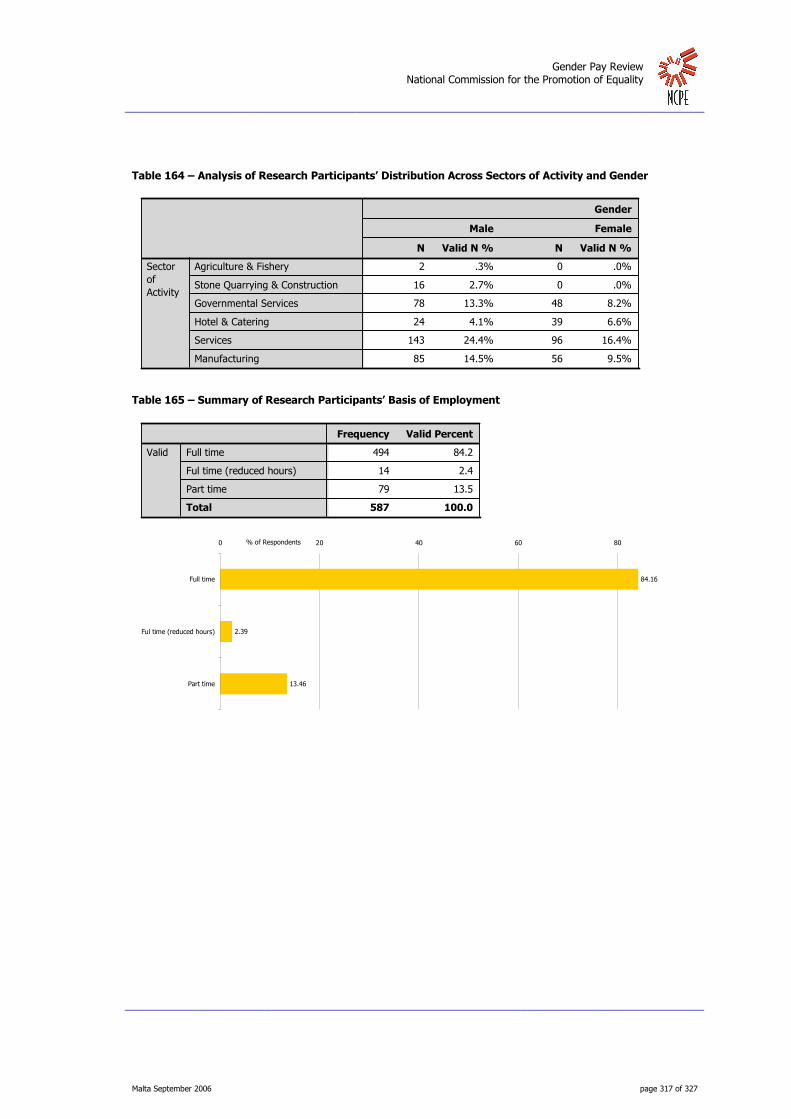
Gender Pay Review
National Commission for the Promotion of Equality
Malta September 2006 page 317 of 327
Table 164 – Analysis of Research Participants’ Distribution Across Sectors of Activity and Gender
2 .3% 0 .0%
16 2.7% 0 .0%
78 13.3% 48 8.2%
24 4.1% 39 6.6%
143 24.4% 96 16.4%
85 14.5% 56 9.5%
Agriculture & Fishery
Stone Quarrying & Construction
Governmental Services
Hotel & Catering
Services
Manufacturing
SectorofActivity
N Valid N %
Male
N Valid N %
Female
Gender
Table 165 – Summary of Research Participants’ Basis of Employment
494 84.2
14 2.4
79 13.5
587 100.0
Full time
Ful time (reduced hours)
Part time
Total
Valid
Frequency Valid Percent
84.16
2.39
13.46
0 20 40 60 80
Full time
Ful time (reduced hours)
Part time
% of Respondents

Gender Pay Review
National Commission for the Promotion of Equality
Malta September 2006 page 318 of 327
Table 166 – Analysis of Job Basis Across Participant Gender
317 91.1% 177 74.1%
1 .3% 13 5.4%
30 8.6% 49 20.5%
Full time
Ful time (reduced hours)
Part time
What is yourpresent mainjob?
N N %
Male
N N %
Female
Gender
91.1%
0.3%
8.6%
74.1%
20.5%
5.4%
80%60%40%20%0%20%40%60%80%100%
Full time
Ful time (reduced hours)
Part time
Male Female
% Response by Gender
Table 167 – Summary of Participants’ Engagement in Different Jobs
83 14.1
504 85.9
587 100.0
More than One Job
One Job Only
Total
Valid
Frequency Valid Percent
More than one job
14.1%
Only one job
85.9%

Gender Pay Review
National Commission for the Promotion of Equality
Malta September 2006 page 319 of 327
Table 168 – Analysis of Participants Holding more than One Job
40 12.6% 29 16.4%
277 87.4% 148 83.6%
0 .0% 0 .0%
1 100.0% 13 100.0%
6 20.0% 8 16.3%
24 80.0% 41 83.7%
Yes
No
Are you engaged inmore then one job?
Full time
Yes
No
Are you engaged inmore then one job?
Ful time (reducedhours)
Yes
No
Are you engaged in
more then one job?
Part time
What isyourpresentmain
job?
N N %
Male
N N %
Female
Gender
Table 169 – Summary of Participants’ Basis of Main Job
79 13.5%
53 9.0%
455 77.5%
587 100.0%
Casual
Permanent-Fixed Term Contract
Permanent-Indefinite Contract
Total
What is
the basisof your
main job?
Count Valid Percent
Permanent-Fixed Term Contract
9.0%
Casual
13.5%
Permanent-Indefinite Contract
77.5%
Table 170 – Analysis of Participants’ Job Basis Across Participants’ Gender
26 7.5% 53 22.2%
26 7.5% 27 11.3%
296 85.1% 159 66.5%
Casual
Permanent-Fixed Term Contract
Permanent-Indefinite Contract
What is thebasis of yourmain job?
N N %
Male
N N %
Female
Gender

Gender Pay Review
National Commission for the Promotion of Equality
Malta September 2006 page 320 of 327
Table 171 – Summary of Research Participants’ Jobs (ISCO 1988)
44 7.5
92 15.7
63 10.7
133 22.7
8 1.4
57 9.7
76 12.9
114 19.4
587 100.0
Senior Managers, Directors
Professionals
Associate Professionals & Technical
Clerical employees
Crafts & related trades
Plant & machine operator, assembly workers
Elementary occupations
Shop & Market services
Total
Valid
Frequency Valid Percent
Table 172 – Analysis of Research Participants’ Occupations (ISCO 1988) Across Gender (66)
Men Women Total Men Women Total
Clerks 6% 8% 14% 10.2% 12.4% 22.7%
Craft and related trades workers 1.4% 0.0% 1.4%
Elementary occupations 11% 3% 15% 9.7% 3.2% 12.9%
Legislators; senior officials and managers 8% 2% 11% 5.6% 1.9% 7.5%
Plant and machine operators and assemblers 9% 3% 12% 7.0% 2.7% 9.7%
Professionals 8% 5% 13% 9.2% 6.5% 15.7%
Service workers and shop and sales workers 11% 8% 19% 8.9% 10.6% 19.4%
Skilled agricultural and fishery workers 0.0% 0.0% 0.0%
Technicians and associate professionals 12% 6% 18% 7.3% 3.4% 10.7%
Total 64.3% 35.7% 100.0% 59.3% 40.7% 100.0%
Attained SampleOccupation
Desired Sample
Sample Error
The study is reliant on a sample of 587 interviewees. This sample is estimated to feature
±4.04% sample error when related to a total population of gainfully employed in Malta
(148,229 67).
66 Desired Sample Characteristics are based on Labour Force Survey Statistics of December 2005 © National Statistics Office
2006
67 As established by the Labour Force Survey Statistics of December 2005. © National Statistics Office 2006
Gender Pay Review
National Commission for the Promotion of Equality
Malta September 2006 page 321 of 327
Appendix 4 Bibliography
Acker J. (1990): ‘Hierarchies, Jobs Bodies: A Theory of Gendered Organisations’. Gender and
Society, Vol. 4 (2): 139-158
Acker J. (1992): ‘Gendered Institutions: From Sex Roles to Gendered Institutions’.
Contemporary Sociology 21 (5); 565-569
Anderson T., Forth J., Metcalf H. and Kirby S. (2001): ‘The Gender Pay Gap’. Final Report to the
Women and Equality Unit, London: Cabinet Office.
Arulampalam W. and Booth A. (1997): ‘Labour Market Flexibility and Skills Acquisition: Is there
a Trade-off?’, Institute for Labour Research, University of Essex, Discussion Paper 97/13
Babcock L., Laschever S., Gelfand M., Small, D. (2003): ‘Nice Girls Don’t Ask’. Harvard Business
Review, 14 (0017-8012). Dow Jones Reuters Business Interactive (Factiva).
Baldacchino G. (2003): ‘Malta’s New Labour Law – at a Glance’ in G. Baldacchino, S. Rizzo and
E. Zammit, Evolving Industrial Relations in Malta. Malta: Agenda and Workers’ Participation
Development Centre.
Barr D.A. and Boyle E.H. (2001): ‘Gender and Professional Purity: Explaining Formal and
Informal Work Rewards for Physicians in Estonia’. Gender and Society Vol. 15 (1): 29-54.
Blank R.M. (1990): `Are Part-time Jobs Bad Jobs?’, pp. 123-164 in G. Burtless (ed.) A Future of
Lousy Jobs? The Changing Structure of the US Wages. Washington DC: Brookings Institute
Blau F.D., Ferber M.A., Winkler A.E. (2002): ‘The Economics of Women, Men and Work’ (4th
ed.) US: Prentice Hall.
Briguglio L. (1977): ‘Employment and Earnings of Women in Malta.’ Commercial Courier, Vol.
31 (13): September 12.
Budig M.J. and England P. (2001): `The Wage Penalty for Motherhood’, American Sociological
Review 66: 204-25
Camilleri F. (1997): ‘Women in the Labour Market: A Maltese Perspective’. Malta: Mireva.
Camilleri-Cassar F. (2005): ‘Gender Equality in Maltese Social Policy? Graduate Women and the
Male Breadwinner Model’. Malta: Agenda.

Gender Pay Review
National Commission for the Promotion of Equality
Malta September 2006 page 322 of 327
Carley M. (2005): ‘Pay Developments – 2004’. European Industrial Relations Observatory on-
line (EIROnline): April, 2005. www.eiro.eurofound.ie/about/2005/03/update/tn0503103u.html
Commission of the European Communities (2003): ‘Gender Pay gaps in European Labour
Markets – Measurements, Analysis and Policy Implications’, Commission Staff Working Paper
SEC (2003):937
Crompton R. (ed.) (1999): ‘Restructuring Gender Relations and Employment: The Decline of the
Male Breadwinner’, Oxford: Oxford University Press.
Darmanin M. (1992) ‘The Labour Market of Schooling: Maltese Girls in Education and Economic
Planning’. Gender and Edcuation, Vol. 4, No.1/2 pp. 105-26.
Darmanin M. (2000). Keynote Paper presented at Seminar organized by the General Workers
Union on the occasion of Women’s Day, 7th March, 2000 at the Jerma Palace Hotel, Marsascala.
Deguara A. (2002): ‘Life on the Line: A Sociological Investigation of Women Working in a
Clothing Factory in Malta’. Malta: Malta University Press.
Den Dulk L., van Doore-Huiskes A. and Schippers J. (1996) ‘Work-Family Arrangements and
Gender Inequality in Europe’, Women in Management Review 11(5): 25-35.
Dex S., (1988): Women’s Attitudes Towards Work, London: Macmillan
Dimas S. and Almunia J. (2004): ‘The Social Situation in the European Union’, European
Commission, Eurostat . http://epp.eurostat.cec.eu.int.
Drolet M. (2002): ‘Can the Workplace Explain Canadian Gender Pay Differentials?’ Canadian
Public Policy – Analyse de Politiques, Vol. XXVIII, Supplement/Numero Special 1.
Duncan S. (1996): ‘The Diverse Worlds of European Patriarchy in Women of the European
Union: The Politics of Work and Daily Life’, M. Dolores Garcia-Ramon and J. Monk (1996).
London: Routledge
Equal Opportunities Commission (2002): ‘Research Findings: Attitudes to Equal Pay’,
Manchester: EOC
The Economic and Social Research Institute (ESRI) (2000): European Foundation for the
Improvement of Living and Working Conditions, Ireland – ESRI October 2000
Employment and Training Corporation (ETC) Action Plans 2002, 2005.

Gender Pay Review
National Commission for the Promotion of Equality
Malta September 2006 page 323 of 327
Employment and Training Corporation (ETC) National Action Plan for Employment (NAP) Malta,
2004
Grimshaw D. and Rubery J. (2001): ‘The Gender Pay Gap: A Research Review’, Manchester:
EOC
Hakim C. (1979): ‘Occupational Segregation: A Comparative Study of the Degree and Pattern of
the Differentiation between Men and Women’s work in Britain, the United States and other
Countries’. Research Paper Number 9, Department of Employment, London.
Harkness S. (1996): ‘The Gender Earnings Gap: Evidence from the UK’, Fiscal Studies 17:1-36
Heckert T.M. (2002): ‘Gender Differences in Anticipated Salary: Role of Salary Estimates for
Others, Job Characteristics, Career Paths and Job Inputs’ – 1.
http://www.findarticles.com/p/articles/mi_m2294/is2002_August/ai_95514607
Jacobs S. (1999): ‘Trends in Women’s Career Patterns and in Gender Occupational Mobility in
Britain’, Gender, Work and Organisation 6(1):32-46.
Joshi H. and Paci P. (1998): ‘Unequal Pay for Women and Men: Evidence from the British Birth
Cohort Studies’, Cambridge, MA:MIT Press.
Mallia H. (1997): ‘Trade Unions: Women’s Involvement in the National and International
Spheres’. Unpublished Dissertation, Workers’ Participation Development Centre, University of
Malta.
Meilland C. (2001): ‘Gender Pay Disparities Examined’ – EIROnline
http://www.eiro.eurofound.eu.int/about/2001/09/feature/fr0109106f.html
Meilland C. (2002): ‘Gender Inequality in Both Pay and Pensions’ – EIROnline
http://www.eiro.eurofound.eu.int/about/2002/09/feature/fr0209103f.html
Mittag H-J. (2002): ‘Gross Earnings in Europe: Main Results of the Structure of Earnings
Survey’. Statistics in Focus: Population and Social Conditions 12/2005.
National Commission for the Promotion of Equality for Men and Women (NCPE): 2005.
http://www.gov.mt/newsletterarticle.asp?a=91&1=2
National Council of Women Malta (NCW) (2002) – InfoWomen – Equal Pay for Work of Equal
Value. http://www.ncwmalta.com/infowomendetail.asp?I=35

Gender Pay Review
National Commission for the Promotion of Equality
Malta September 2006 page 324 of 327
National Statistics Office (NSO): (2002): ‘Structural, Poverty and Social Exclusion Indicators’,
Malta.
National Statistics Office (NSO): Labour Force Surveys 2000-2005, Malta.
O’Reilly J. and Fagan C. (1998): ‘Part-time Prospects: An International Comparison of Part-Time
Work in Europe, North America and the Pacific Rim’, London: Routledge.
Paci P., Joshi H., and Makepeace G. (1995): ‘Pay Gaps Facing Men and Women Born in 1958:
Differences within the Labour Market’, pp. 87-112 in J. Humphries and J.
Paparella D. (2005): ‘Gender Pay Gap Examined’, EIROnline
http://www.eiro.eurofound.eu.int/about/2005/02/feature/it0502102f.html
Parker L. and Allen T.D. (2001): ‘Work/Family Benefits: Variables Related to Employees’
Fairness Perceptions’, Journal of Vocational Behaviour 58(3):453-68.
Payne L. (2003): ‘Gendered Jobs’ and ‘Gendered Workers’: Barriers to Gender Equality in
Gendered Organisations. M.A. Dissertation, University of Guelph, Canada.
Pfau-Effinger B. (1998): ‘Culture or Structure as Explanations for Differences in Part-time Work
in Germany, Finaland and the Netherlands?’, in J. O’Reilly and C. Fagan (eds) Part-time
Prospects: An International Comparison of Part-Time Work in Europe, North America and the
Pacific Rim. London: Routledge.
Rangelova R. (2002): ‘Gender Labour Relations and EU Enlargement’, South East Europe
Review 3/2002. http://www.boeckler.de
Recio A. (2001): ‘Gender Pay Discrimination Examined’, EIROnline
http://www.eiro.eurofound.ie/about/2001/05/feature/es0105242f.html
Regnard P. (2005). ‘Minimum Wages 2005: Major Differences between EU Member States’,
Statistics in Focus: Population and Social Conditions 7/2005.
Ridgeway C.L. and Correll S.J. (2000): ‘Limiting Inequality Through Interaction. The end(s) of
Gender.’ Contemporary Sociology Vol. 29 (1):110-120.
Ridgeway C.L. and Correll S.J. (2004): ‘Unpacking the Gender System: A Theoretical Perspective
on Gender Beliefs and Social Relations’. Gender and Society Vol. 18 (4): 510-531.

Gender Pay Review
National Commission for the Promotion of Equality
Malta September 2006 page 325 of 327
Robinson H. (2002): ‘Changes in the Shires? Regional Differences in the Gender Pay Gap in the
Advent of the National Minimum Wage’ (work in progress) –
http://www.cf.ac.uk/carbs/econ/robinsonhj/espe.pdf
Rose M. (1994): ‘Job Satisfaction, Job Skills and Personal Skills’, in R. Penn, M. Rose and J.
Rubery (eds) Skill and Occupational Change, Oxford: Oxford University Press
Rubery J. (ed.) (1998): ‘Equal Pay in Europe? Closing the Gender Wage Gap’, London:
Macmillan.
Rubery (eds) (1999): ‘The Economics of Equal Opportunities’, Manchester: EOC
Scott J. (1999): ‘Family Change: Revolution or Backlash in Attitudes’, pp. 68-99 in S. McRae
(ed.) Population and Household Change, Oxford: Oxford University Press.
Siranni C. and Negrey C. (2000): ‘Working Time as Gendered Time’, Feminist Economics 6(1):
59-76.
Skuratowicz, E. and Hunter, L. W. (2004): ‘Where Do Women’s Jobs Come From?’, Job Re-
segregation in an American Bank. Work and Occupations 31 (1): 73-110.
Smith M. (2003): ‘Women and Employment in Europe – What can Malta learn?’ Public
Presentation at Le Meridien Phoenicia Hotel, Floriana, Malta.
http://www.etc.org.mt/aboutus/publications.htm.
Smithson J., Lewis S., Cooper C. and Dyer J. (2004): ‘Flexible Working and the Gender Pay Gap
in the Accountancy Profession’. Work, Employment and Society, 18 (1).
Stokoe, E.H. and Simthson, J. (2001): ‘Making Gender Relevant: The Construction and
Negotiation of Gender Categories in Discourse’, Discourse and Society 12(2): 217-44.
Stringer J.L. and Hopper R. (1998): ‘Generic He in Conversation?’, Quarterly Journal of Speech
84: 209-21.
Soumeli E. and Nergaard K. (2002): ‘Gender Pay Equity in Europe’. EIROnline
http://www.eiro.eurofound.ie/about/2002/study/tn0201101s.html
Swepston L. (2002): ‘Equal Remuneration for Work of Equal Value – European Perspectives’
International Labour Office, Geneva.
http://ilo.org/public/englich/region/europa/geneva/conf/malta/equal.html
Gender Pay Review
National Commission for the Promotion of Equality
Malta September 2006 page 326 of 327
Tam M. (1997): ‘Part-Time Employment: A Bridge or a Trap?’, Aldershot, VT: Avebury.
The Council of Economic Advisors (USA): ‘Explaining Trends in the Gender Wage Gap,’ June
1998
Tomaskovic-Devey D. and Skaggs S. (2002): ‘Sex Segregation, Labour Process Organisation,
and Gender Earnings Inequality’. American Journal of Sociology 108 (1): 102-128.
Walby S. and Olsen W. (2002): ‘The Impact of Women’s Position in the Labour Market on Pay
and Implications for UK Productivity’, Report to Women and Equality Unit, Department of Trade
and Industry, November 2002, London:DTI
Warren T., Rowlingson K. and Whyley C. (2001): ‘Female Finances, Gender Gaps and Gender
Asset Gaps’, Work, Employment and Society 15: 465-88.
Warren T. (2001): ‘Divergent Female Part-Time Employment in Britain and Denmark, and, the
Implications for Gender Equity’, The Sociological Review: 548-67
Whittock M., Edwards C., McLaran S. and Robinson O. (2002): ‘‘The Tender Trap’, Gender, Part-
time Nursing and the Effects of ‘Family-Friendly’ Policies on Career Advancement’, Sociology of
Health and Illness 24(3): 305-26
Wood R.G., Corcoran M.E. and Courant P.N. (1993): ‘Pay Differences Among the Highly Paid:
The Male-Female Earnings Gap in Lawyers’ Salaries’, Journal of Labour Economics 11(3): 417-
41.

Gender Pay Review
National Commission for the Promotion of Equality