Investigating Bangladeshi university students' willingness to ...
Capturing Willingness to Pay and Its Determinants for Improved
Solid Waste Management
PA K I S TA N I N S T I T U T E O F D E V E L O P M E N T E C O N O M I C S
September 2014
Usman MustafaIftikhar Ahmad
Miraj ul Haq
PID
E W
OR
KIN
G P
AP
ER
S
No
. 1
10

PIDE Working Papers
No. 110
Capturing Willingness to Pay and Its Determinants for Improved
Solid Waste Management
Usman Mustafa Pakistan Institute of Development Economics, Islamabad
Iftikhar Ahmad Pakistan Institute of Development Economics, Islamabad
and
Miraj ul Haq
Azad Jammu and Kashmir University, AJK, Pakistan
PAKISTAN INSTITUTE OF DEVELOPMENT ECONOMICS
ISLAMABAD
2014
Editorial Committee
Dr Abdul Qayyum Head
Dr Durr-e-Nayab Member
Dr Anwar Hussain Secretary
All rights reserved. No part of this publication may be reproduced, stored in a retrieval system or
transmitted in any form or by any means electronic, mechanical, photocopying, recording or
otherwise without prior permission of the Publications Division, Pakistan Institute of Development
Economics, P. O. Box 1091, Islamabad 44000.
© Pakistan Institute of Development
Economics, 2014.
Pakistan Institute of Development Economics
Islamabad, Pakistan
E-mail: [email protected]
Website: http://www.pide.org.pk
Fax: +92-51-9248065
Designed, composed, and finished at the Publications Division, PIDE.
C O N T E N T S
Page
Abstract v
1. Introduction 1
2. Quantification and Line of Action 2
3. Field Visit and Methodology of the Survey 4
4. Q alitative Assessment of P blic’s Willingness to Pay for
Better SWM in District Abbottabad 5
5. Quantitative Assessment of WTP for SWM 8
5.1. Model for CVM 8
5.2. Important Variables 10
6. Empirical Results 11
7. Conclusion 14
References 15
List of Tables
Table 1. Sample Characteristics 4
Table 2. Summery Statistics of Important Variables 10
Table 3. Marginal Effects of Binomial Logistic Regression 12
List of Figures
Figure 1. HHs WTP for Rs 50 for Improved SWM Services 6
Figure 2. HHs WTP for Rs 100 for Improved SWM Services 6
Figure 3. Factors Responsible for Non-payment for Improved SWM
Services 7
ABSTRACT
A dignified and healthy life remains a distant nightmare to the large
majority of population in developing countries including Pakistan. Large masses
living in this world particularly South Asian country (that is home to over one
fifth of the world’s population) is still striving for it. Pakistan, being a
developing country, is no exclusion to that state. The condition of sanitation and
solid waste management (SWM) in the country carriages a grave challenge to
health and hygiene. This study was carried out to show at the household’s
(HH’s) demand for improved environmental settings over valuing their
willingness to pay (WTP) for better SWM facilities. The study follows
contingent valuation method for assessing the HHs preferences for better living
standards. Primary data used in the research was gathered with the application of
tailor made questionnaire from both rural and urban regions of district
Abbottabad, Pakistan at HHs premises. The objective was to discover the
determinants of HH’s WTP for improved environment through better SWM
services; the binomial logit regression method was used. Education, income,
awareness, location and HH size were found to be influencing HH’s WTP. The
study concluded that HHs were WTP, if adequate services were delivered to
them.
Keywords: Contingent Valuation Method, Binomial Logit Regression,
Willingness to Pay, Solid Waste Management, Environment,
Pakistan
1. INTRODUCTION*
A dignified and healthy life remains a distant nightmare to the large
majority of population. Masses living in the developing world including South
Asian countries (that is home to over one fifth of the world’s population) is still
striving for it. Pakistan, being a developing country, is no exclusion to that state.
The situation of sanitation and solid waste management (SWM) in the country
poses a serious challenge to health and hygiene. Improper SWM results in air
and water pollution, soil degradation and emission of greenhouse gases.
Negligence on this part also causes certain societal issues like spread of insects,
odour, loss to scenic beauty, loss in property values and vulnerability to the
diseases as waste heaps attract animals and birds. The interminable link between
quality of life of poor families in the underdeveloped countries (especially South
Asia) and inferior state of water, sanitation and hygiene is well established
[Malik and Jehangir (2008)]. Correction to the existing worse environmental
situation is not only imperative for better life quality but it is also our moral and
heritor duty to preserve the environment for our coming generations. We must
provide them with environment; at least in a state what we inherited from our
forefathers, if not better. Based on such arguments, the sustainability issue is
now discussed almost all around the world; however, every country has its own
distinct features and environmental endowments. Hence, there is a need to take
up fresh research and take into account all costs and opportunities attached with
the environment. In this connection, the most important research question is to
know the household’s (HH’s) Willingness to Pay (WTP) for better
environmental goods and to pin point its determinants for policy implication.
Hence, in order to quantify the HHs demand for better services and find a
monetary value for it, this study processes HH’s WTP for upgraded SWM
facilities and its determinants.
As we know, willingness to pay (WTP) is the maximum amount a person
would desire to pay, exchange or sacrifice for any commodity, good or item.
There is a need to have a Choice Models to predict efficiently that how
individuals would react in a particular situation. These models help us in
identifying human qualities that affect their decision making behaviour.
The data used in the study was taken from the Environmental Fiscal Reform (EFR) project
IUCN/PIDE sponsored by Swiss Agency for Development and Cooperation.
2
Literature regarded the use of choice models as the most suitable method for
estimating consumers’ willingness to pay for quality improvements in multiple
dimensions including SWM. We will frame our analysis in the same fashion.
2. QUANTIFICATION AND LINE OF ACTION
Cost estimation is an important stage in ensuring optimal allocation of
scarce resources. Especially the problem arises with non-marketed goods in
particular with the items which belong to environment. The estimation of
monetary cost is aimed to internalise the external costs which generally are
derived from social costs instead of private cost. For environmental goods,
the absence of visible demand and supply system (which determines the
market valuation mechanism), has resulted in the development of other tools
which can be used for estimating value for these goods. Among these, the
most important valuation techniques include Contingent Valuation Method
(CVM), Averting Behaviour Approach, Hedonic Pricing and the Travel Cost
Method. Adoption of these techniques depends upon the nature of the study
and item in question.
In the current literature, CVM is the most frequently used tool for
environmental assessment. Contingent Valuation (CV) is assumed to produce
reliable estimates for the judicial assessment of damages [Arrow, et al. (1993)].
The validity of CVM to estimate monetary valuations for environmental goods
have been adequately established in the literature for Pakistan as well [Haq, et
al. (2008); Mustafa, et al. (2009 a,b); Mustafa, et al. (2010)]. It is the direct
method of enquiry based upon the stated preferences of the consumers for a
specific environmental good. CVM is a questionnaire based on valuation
technique where the consumers are given a hypothetical situation of an
improved environmental situation and are directly asked to value it by
expressing their WTP for it.
In CV surveys, HHs are being asked about their WTP if in a particular
sector a desired service level is provided [Komives, et al. (2005)]. Keeping in
view the merits of CVM, our analysis is also based on the CVM technique and
we used it to gauge HH’s WTP for improved service level for SWM. As
discussed, CV is a technique of assessing the monetary worth of non-marketed
environmental goods over survey questions that carry out person’s inclinations
about such goods [Carson and Mitchell (1995)]. In the CVM surveys, the
questions regarding the quality levels are carefully described and the
respondents are asked for their WTP for the change in service quality [Carson
and Mitchell (1995)]. The simple postulation behind this technique is to denote
or value the objective quality enhancement that the study enquires the HHs to
asses.
In order to capture HH’s WTP in the CV studies, question can be
structured in a number of ways like dichotomous choice [Mitchell and Carson
3
(1989); Mansfield (1998); Cameron and James (1987); Hoeln and Randal
(1987); Cummings, et al. (1986); Berrens, et al. (1997)], bidding games [Liu, et
al. (2000); Amin and Khondoker (2004)], payment cards [Cameron and Huppert
(1991)] or open ended questions [Mansfield (1998); Cameron and James
(1987)]. However, these methods in isolation are not capable to capture bespoke
consumer surplus i.e. a representative value of WTP for any environmental
good. Therefore, in this study a combination of the stated methods were used.
HHs were questioned in such a fashion that they were obliged to indicate their
true WTP. We used the statement of most likely limits for WTP which reduces
the opportunity of extreme over pledging [Cameron (1988)]. Such mechanism
also encourages participation and avoids protest responses [Loomis (1990)].
Moreover, with the provision of an open ended question at the end, it was tried
to overcome the starting point bias.
SWM sector was taken as an experimental field in this study. To find out
public WTP for an improved SW management situation, a tailor-made CVM
survey was conducted in Abbottabad district of Khyber Pakhtunkhwa province,
Pakistan. Keeping in view the nature of the study, the question concerning the
WTP for improved SWM services was framed very carefully. First of all
respondents were thoroughly briefed about the improved services which they
would avail under the improved SWM services system (if they adopt it). The
superior SWM services were explained as HHs would be given door to door
coverage for waste collection, the street and community waste dumps would be
taken away on regular basis and Teshil Municipal Administration (TMA)
workers would clean the streets at regular intervals. In addition, to ascertain the
people that the new system is reliable and would continue to work they were
asked the question as if twenty five percent of the HHs in the locality has
already decided to adopt the new system.
Once they were briefed about the improved SWM services, in response
they were asked that for such a system ‘would they be willing to pay nominal
amount’ (Rs 50 per month). Their responses were recorded as “Yes” or “No”. If
the HHs responded with “No”, they were asked an open ended question about
the amount which they are WTP even if lower than Rs 50. On the other hand, if
the HHs responded “Yes”, they were again asked, raising the monthly charge to
Rs 100 for same services, which was to be answered with “Yes” or “No”.
Following the second question irrespective of the answer, HHs were yet again
asked with an open ended question that what is their maximum WTP for such
services above or below the stated amount i.e. Rs 100/month. The open ended
question was aimed to capture both the lower as well as upper limits of amount,1
which respondents want to dedicate in order to acquire the said services. Hence,
by this iterative mechanism, it was tried to calculate the presumed consumer
1Other than the stated amount of either Rs 50 and Rs 100/month.
4
surplus that HHs had for such services. Moreover, the value stated in response to
the open ended question was used as their final WTP in this study. Thus, it was
tried to thoroughly capture the true bespoke value for HHs WTP for improved
SWM services.
3. FIELD VISIT AND METHODOLOGY OF THE SURVEY
As indicated above, this study is based on primary data which is collected
from rural and urban areas of district Abbottabad. For this purpose, three stage
stratified systematic random sampling techniques was adopted. In the first
stage, according to the nature of the study, total population was divided into the
interest groups i.e. rural and urban and specific sample weights (40:60) were
assigned for data collection from the rural and urban areas, respectively. In the
second stage, different strata (streets/wards in urban areas while villages in rural
areas, to cover for different income groups into the account) were formed in the
selected areas. And finally in the last stage, sample data was collected from each
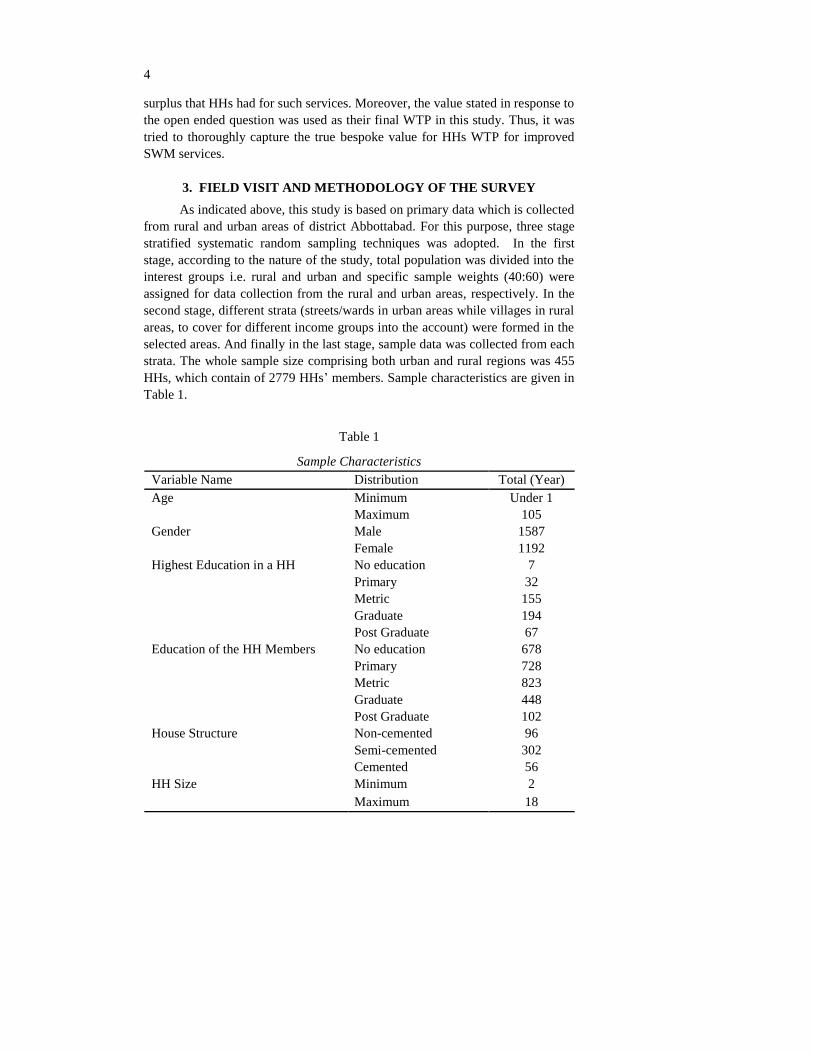
strata. The whole sample size comprising both urban and rural regions was 455
HHs, which contain of 2779 HHs’ members. Sample characteristics are given in
Table 1.
Table 1
Sample Characteristics
Variable Name Distribution Total (Year)
Age Minimum Under 1
Maximum 105
Gender Male 1587
Female 1192
Highest Education in a HH No education 7
Primary 32
Metric 155
Graduate 194
Post Graduate 67
Education of the HH Members No education 678
Primary 728
Metric 823
Graduate 448
Post Graduate 102
House Structure Non-cemented 96
Semi-cemented 302
Cemented 56
HH Size Minimum 2
Maximum 18
5
It is important to indicate here that the SW problem generally pertain to
urban area that’s why more weight was required to be given to the urban areas.
Therefore, purposively 60 percent of the HHs were selected from the urban
areas. Nevertheless, because of the rapid urbanisation and limited urban area in
Abbottabad, the surrounding designated rural area is sharing the burden of urban
population. A large segment of the population is residing in rural area but for
daily business they regularly commute to the city. Therefore, it was imperative
to assign certain weight to the rural areas as well and accordingly 40 percent of
response was collected from rural areas.
A well structured pretested questionnaire was used for data collection. In
the first portion, information regarding the socioeconomic situation of the HHs
was gathered including income of the HH, employment status and sectors they
are engaged in, their dwelling status, health issues and utilities that they are
availing. The 2nd part was dedicated to issue in question i.e. SWM and related
concerns including HH’s WTP for improved SWM services.
4. QUALITATIVE ASSESSMENT OF PUBLIC’S WILLINGNESS TO
PAY FOR BETTER SWM IN DISTRICT ABBOTTABAD
With the passage of time, governments around the world are trying to
devolve and deregulate different sectors for efficient services delivery.
However, for private sector involvement it is crucial to estimate public’s WTP
for such services. Moreover, assessment of HH’s WTP is also vital in order to
grasp consumer’s demand for different services.
As discussed earlier, in order to measure HH’s maximum WTP, an
iterative mechanism was adopted where the basic fee, for the provision of
improved services, was increased gradually. In response to the first question (i.e.
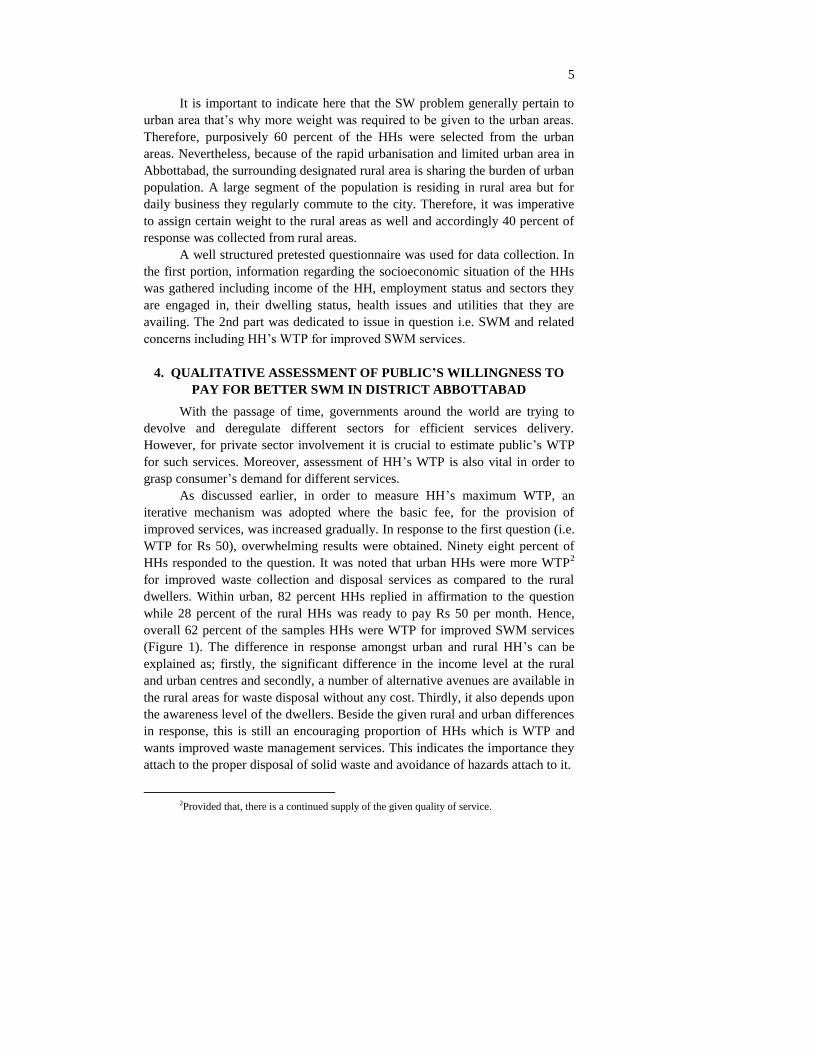
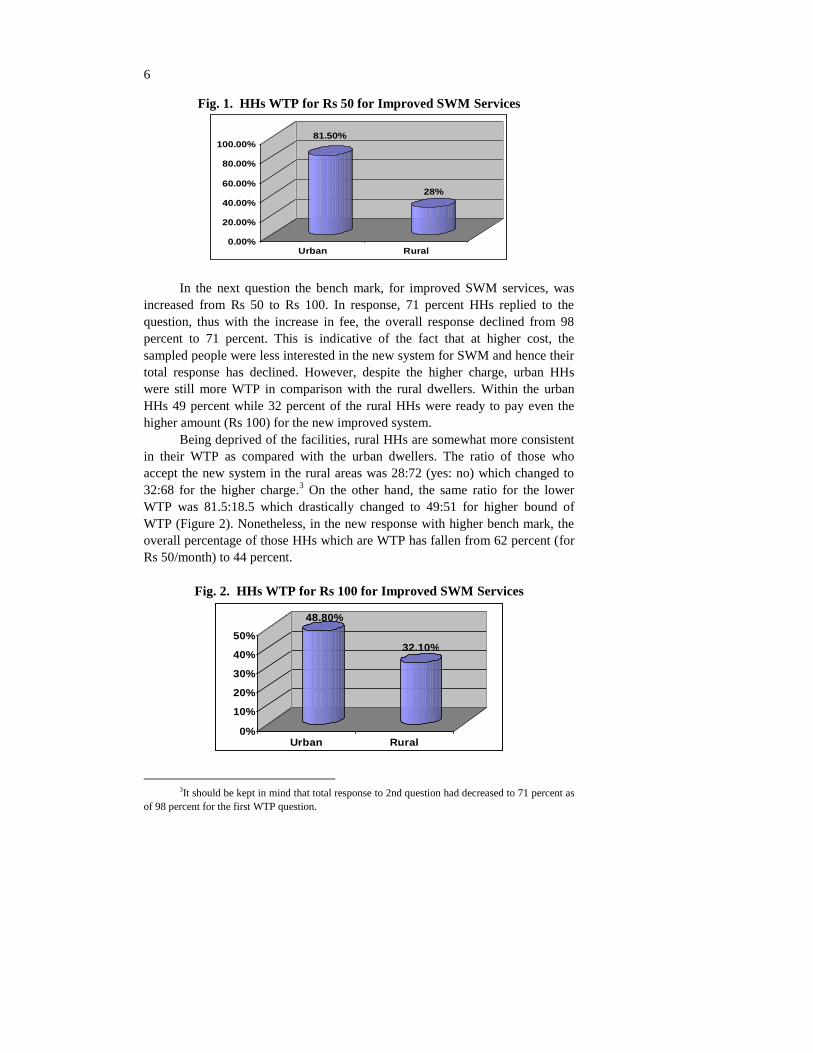
WTP for Rs 50), overwhelming results were obtained. Ninety eight percent of
HHs responded to the question. It was noted that urban HHs were more WTP2
for improved waste collection and disposal services as compared to the rural
dwellers. Within urban, 82 percent HHs replied in affirmation to the question
while 28 percent of the rural HHs was ready to pay Rs 50 per month. Hence,
overall 62 percent of the samples HHs were WTP for improved SWM services
(Figure 1). The difference in response amongst urban and rural HH’s can be
explained as; firstly, the significant difference in the income level at the rural
and urban centres and secondly, a number of alternative avenues are available in
the rural areas for waste disposal without any cost. Thirdly, it also depends upon
the awareness level of the dwellers. Beside the given rural and urban differences
in response, this is still an encouraging proportion of HHs which is WTP and
wants improved waste management services. This indicates the importance they
attach to the proper disposal of solid waste and avoidance of hazards attach to it.
2Provided that, there is a continued supply of the given quality of service.
6
Fig. 1. HHs WTP for Rs 50 for Improved SWM Services
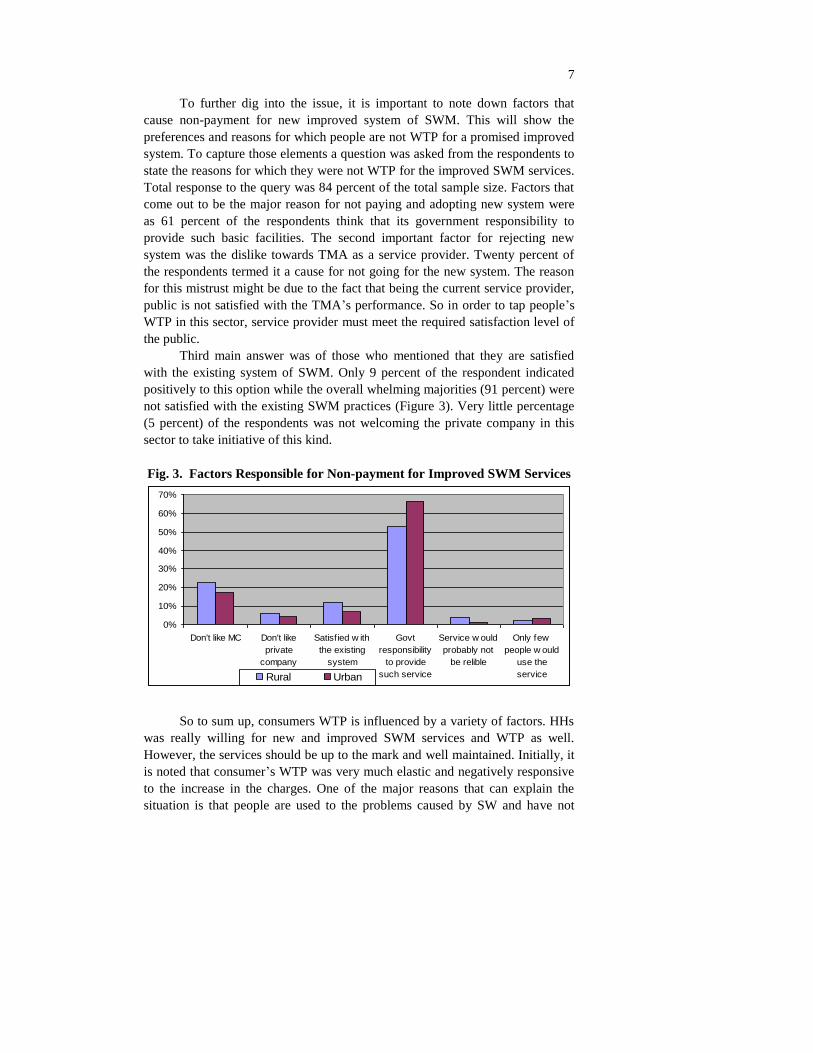
In the next question the bench mark, for improved SWM services, was
increased from Rs 50 to Rs 100. In response, 71 percent HHs replied to the
question, thus with the increase in fee, the overall response declined from 98
percent to 71 percent. This is indicative of the fact that at higher cost, the
sampled people were less interested in the new system for SWM and hence their
total response has declined. However, despite the higher charge, urban HHs
were still more WTP in comparison with the rural dwellers. Within the urban
HHs 49 percent while 32 percent of the rural HHs were ready to pay even the
higher amount (Rs 100) for the new improved system.
Being deprived of the facilities, rural HHs are somewhat more consistent
in their WTP as compared with the urban dwellers. The ratio of those who
accept the new system in the rural areas was 28:72 (yes: no) which changed to
32:68 for the higher charge.3 On the other hand, the same ratio for the lower
WTP was 81.5:18.5 which drastically changed to 49:51 for higher bound of
WTP (Figure 2). Nonetheless, in the new response with higher bench mark, the
overall percentage of those HHs which are WTP has fallen from 62 percent (for
Rs 50/month) to 44 percent.
Fig. 2. HHs WTP for Rs 100 for Improved SWM Services
3It should be kept in mind that total response to 2nd question had decreased to 71 percent as
of 98 percent for the first WTP question.
81.50%
28%
0.00%
20.00%
40.00%
60.00%
80.00%
100.00%
Urban Rural
48.80%
32.10%
0%
10%
20%
30%
40%
50%
Urban Rural
7
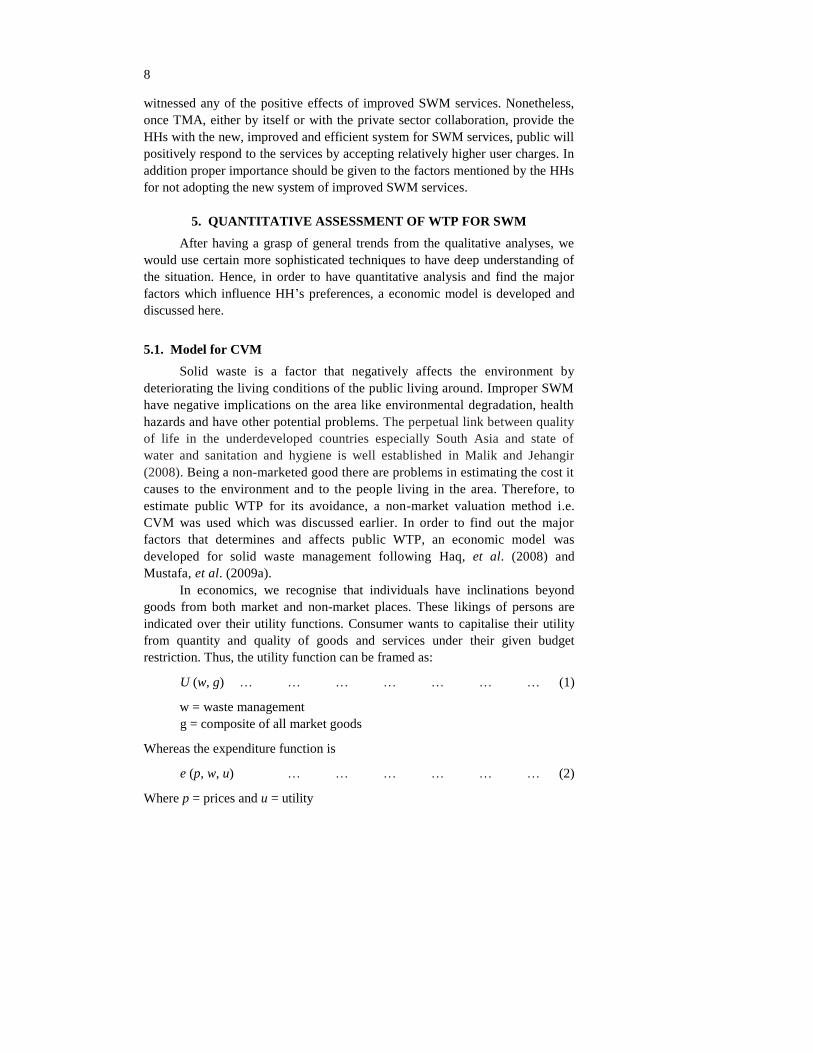
To further dig into the issue, it is important to note down factors that
cause non-payment for new improved system of SWM. This will show the
preferences and reasons for which people are not WTP for a promised improved
system. To capture those elements a question was asked from the respondents to
state the reasons for which they were not WTP for the improved SWM services.
Total response to the query was 84 percent of the total sample size. Factors that
come out to be the major reason for not paying and adopting new system were
as 61 percent of the respondents think that its government responsibility to
provide such basic facilities. The second important factor for rejecting new
system was the dislike towards TMA as a service provider. Twenty percent of
the respondents termed it a cause for not going for the new system. The reason
for this mistrust might be due to the fact that being the current service provider,
public is not satisfied with the TMA’s performance. So in order to tap people’s
WTP in this sector, service provider must meet the required satisfaction level of
the public.
Third main answer was of those who mentioned that they are satisfied
with the existing system of SWM. Only 9 percent of the respondent indicated
positively to this option while the overall whelming majorities (91 percent) were
not satisfied with the existing SWM practices (Figure 3). Very little percentage
(5 percent) of the respondents was not welcoming the private company in this
sector to take initiative of this kind.
Fig. 3. Factors Responsible for Non-payment for Improved SWM Services
So to sum up, consumers WTP is influenced by a variety of factors. HHs
was really willing for new and improved SWM services and WTP as well.
However, the services should be up to the mark and well maintained. Initially, it
is noted that consumer’s WTP was very much elastic and negatively responsive
to the increase in the charges. One of the major reasons that can explain the
situation is that people are used to the problems caused by SW and have not
0%
10%
20%
30%
40%
50%
60%
70%
Don't like MC Don't like
private
company
Satisfied w ith
the existing
system
Govt
responsibility
to provide
such service
Service w ould
probably not
be relible
Only few
people w ould
use the
serviceRural Urban
8
witnessed any of the positive effects of improved SWM services. Nonetheless,
once TMA, either by itself or with the private sector collaboration, provide the
HHs with the new, improved and efficient system for SWM services, public will
positively respond to the services by accepting relatively higher user charges. In
addition proper importance should be given to the factors mentioned by the HHs
for not adopting the new system of improved SWM services.
5. QUANTITATIVE ASSESSMENT OF WTP FOR SWM
After having a grasp of general trends from the qualitative analyses, we
would use certain more sophisticated techniques to have deep understanding of
the situation. Hence, in order to have quantitative analysis and find the major
factors which influence HH’s preferences, a economic model is developed and
discussed here.
5.1. Model for CVM
Solid waste is a factor that negatively affects the environment by
deteriorating the living conditions of the public living around. Improper SWM
have negative implications on the area like environmental degradation, health
hazards and have other potential problems. The perpetual link between quality
of life in the underdeveloped countries especially South Asia and state of
water and sanitation and hygiene is well established in Malik and Jehangir
(2008). Being a non-marketed good there are problems in estimating the cost it
causes to the environment and to the people living in the area. Therefore, to
estimate public WTP for its avoidance, a non-market valuation method i.e.
CVM was used which was discussed earlier. In order to find out the major
factors that determines and affects public WTP, an economic model was
developed for solid waste management following Haq, et al. (2008) and
Mustafa, et al. (2009a).
In economics, we recognise that individuals have inclinations beyond
goods from both market and non-market places. These likings of persons are
indicated over their utility functions. Consumer wants to capitalise their utility
from quantity and quality of goods and services under their given budget
restriction. Thus, the utility function can be framed as:
U (w, g) … … … … … … … (1)
w = waste management
g = composite of all market goods
Whereas the expenditure function is
e (p, w, u) … … … … … … (2)
Where p = prices and u = utility
9
Equation 2 the expenditure function dealings the lowest sum of cash the
buyer essentially spend to attain the agreed level of utility. This is cumulative
function of ‘p’ and ‘u’ and diminishing function of ‘w’.
Subsequently, customer wants to stay with the identical utility, it is
suitable to practice spending minimisation issue.
Min (g + Pg) … … … … … … (3)
s.t U = U (w, g)
Where price of composite goods are equal to one (Pg=1).
The exceeding minimisation problem can be resolved by adopting
Lagrange’s multiplier to obtain Hicksian demand for the analogous goods.
The Hicksian demand is assumed by:
hi = hi(pw ,u*) … … … … … … (4)
Substituting the values of matching Hickisian demand in the lowest
expenditure function we can calculate the least expenditure function:
e* = e (p, w, u
*) … … … … … … (5)
Where “e” is minimum expenditure required to achieve fixed level of utility
“u*”
and using the waste management “w”, and is the function of price of other
goods, the fixed level of utility and the quality of SWM services itself.
The derivative of expenditure function with respect to price gives
corresponding Hicks Compensated demand function for good under
consideration.
∂e/∂pi = hi (pw, u*) … … … … … (6)
WTP for the change in SWM services is the integration of marginal WTP to
achieve better waste management from “w” to “w*”
WTP =
*
w
- ( , *)/ .
w
e w u w dw … … … … (7)
WTP is the full amount of money a buyer would contribute to appreciate an
enhancement in the value of life due to better SWM. The WTP for the improved
SWM is:
WTP = e (p, w, u) – e (p, w*, u) … … … … (8)
Where, “w” is a tainted level of waste management and “w*” is a better level of
SWM.
The change in spending is either rewarding excess or corresponding
surplus, if the situation is close of the initial utility, it is reimbursing and if the
situation level of utility is final then it is corresponding surplus. Now taking into
account the model findings, we can predict that HH’s WTP, including other
factors, rest on income, wealth, education level and reserve from the prevailing

10
solutions. Hence, to capture major determinants of WTP following regression
model can be finalised and would be used for estimation
WTPi = α0 + α1 (Hi) + α2 (Di) + α3 (Ai) + α4 (Vi) + ui … … (9)
Where:
WTPi = HHs’ willingness for better SWM.
Hi = Households features (Highest education level of the HH, income
level of the HH and HH size).
Di = Demographic characteristics of the Households (urban, rural).
Ai = Awareness about adverse effects of improper SWM.
Vi = Vector born Diseases.
5.2. Important Variables
In order to have brief introduction about the characteristics of the
variables that were used in the model, variables of interest are presented in
summarised form (Table 2). The mean income of sample respondent was Rs
13701 per month. Income of the HHs ranges from Rs 700 to Rs 94000 per
month, thus the sample consists of both the poor and non-poor. As there is huge
variation among the income variable, therefore, in the model, income was
converted into four quartiles and they were turned into dummies to analyse their
incremental effect on HH’s WTP for better SWM services.
Table 2
Summery Statistics of Important Variables
Variable
Obser-
vation Mean
Standard
Error Min Max
95% Conf. Interval
Min Max
Income per Month 455 13701.8 682.17 700 94000 12361.19 15042.41
Highest Education
among the HH 455 11.21 0.17 0 18 10.87 11.55
Awareness 455 0.78 0.02 0 1 0.74 0.82
HH Size 455 6.11 0.12 2 18 5.88 6.341
Disease History 455 0.36 0.02 0 1 0.318 0.407
Average WTP 455 34.46 1.96 0 200 30.61 38.32
None zero WTP 241 65.06 2.33 10 200 60.46 69.66
Another important variable discussed in the model is the education level.
The highest education among the HH members was considered to check HH’s
behaviour towards environment. In the model, it was assumed that if there are
more educated persons in a HH, their attitude towards SWM would differ from
those who have less educated persons. According to the sample, average
educational level hover around 11 years of schooling i.e. above metric. In the
education variable, there are cases for illiterates while at the same time some
HHs members have up to 18 years of education. Therefore, education levels too,
11
were converted into dummies i.e. metric, graduate and post graduate keeping the
primary or below education as the base category.
Awareness regarding the importance of SWM is another variable which
need special attention. As evident from summary statistics, 78 percent of the
HHs was aware of the hazards that result from the mismanagement of SW. This
variable was also treated as categorical variable. HH size is important
determinant of HH WTP for improved SWM facilities and is therefore included
in the analysis. Average HH size of the sample was 6.11, which ranges from 2 to
18 persons in a HH. Diseases caused by SW were kept as a single variable in the
model. Major diseases caused by SW and reported in our sample were related to
skin, asthma, hepatitis, stomach, kidney problem, malaria and diarrhoea. On
average 36 percent of the HHs had some history of diseases mainly caused due
to the mismanagement of SW.
The dependent variable in the analysis was the HH’s WTP that was
captured through CVM. It is bifurcated in two types. If we consider the overall
response and include those who have shown even zero WTP, the average WTP
comes out to be Rs 34 per month with limits ranging from zero to 200 rupees.
The reason for including those who are not willing to pay in monetary term is
that, in the CVM zero WTP is also considered a response. On the other hand, if
we want to analyse only those who have responded positively and have
indicated their WTP with some positive integer, their mean WTP is Rs 65 per
month. This WTP ranges between Rs 10 to Rs 200 per month to attain the
benefits from improved SWM system.
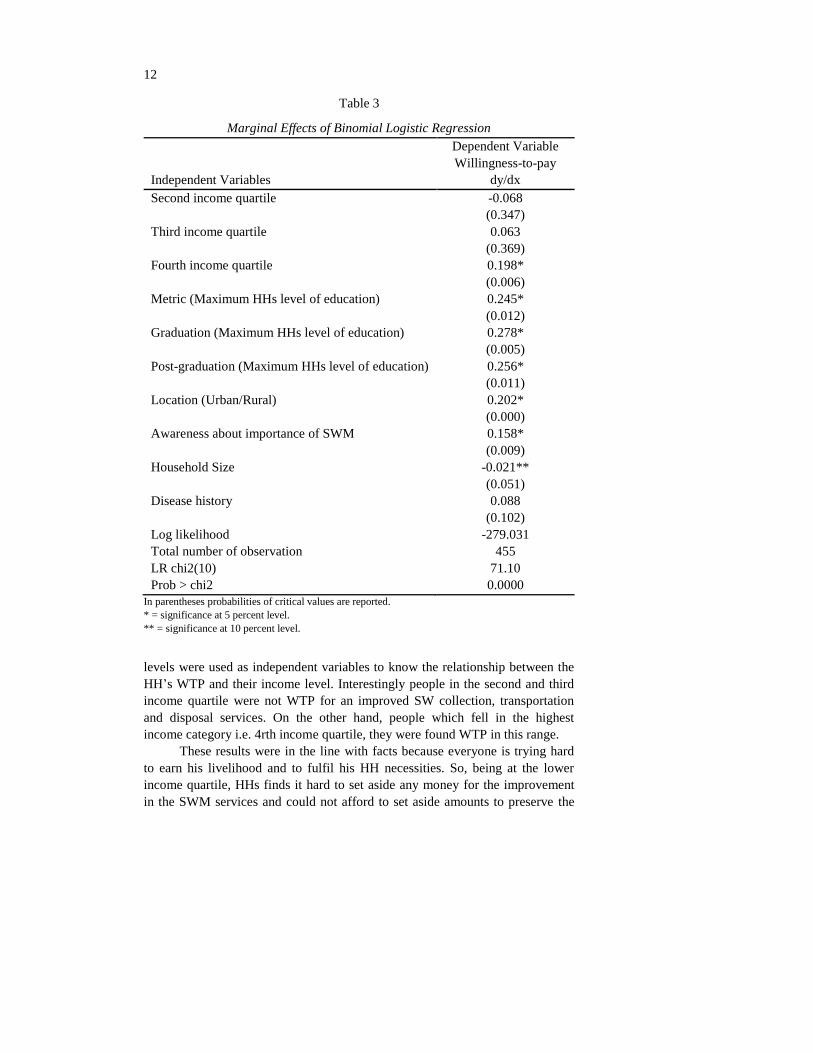
6. EMPIRICAL RESULTS
In order to estimate the above mentioned equation and to capture the
effects of different independent variables on the HHs WTP, the binomial logistic
regression technique was applied. HH’s WTP was defined in two categories i.e.
zero and one, according to the response given by the HHs during the survey.
Zero WTP depicted that HH is not WTP to pay for improved SWM services
while the integer one was showing that HH is WTP. The responses i.e. HH’s
WTP was considered as dependent variable. On the other side the factors which
influence public’s WTP (i.e. independent variables) consisted of, the highest
education level within the HHs (Metric, Graduate and Post graduate), the
Income quartiles (Q2, Q3, Q4), household size, HH’s awareness level regarding
SWM, disease history related to SW and lastly the demographic location (i.e.
the rural/urban divide). Hence, after finalising the variables, the regression
results are given at Table 3.
Income level is always conceived as an important determinant that would
influence public WTP for any service. In our analysis, HHs were divided
according to their income levels into four quartiles. In the model, the lowest
income quartile was taken as the base and the remaining three higher income
12
Table 3
Marginal Effects of Binomial Logistic Regression
Dependent Variable
Willingness-to-pay
Independent Variables dy/dx
Second income quartile -0.068
(0.347)
Third income quartile 0.063
(0.369)
Fourth income quartile 0.198*
(0.006)
Metric (Maximum HHs level of education) 0.245*
(0.012)
Graduation (Maximum HHs level of education) 0.278*
(0.005)
Post-graduation (Maximum HHs level of education) 0.256*
(0.011)
Location (Urban/Rural) 0.202*
(0.000)
Awareness about importance of SWM 0.158*
(0.009)
Household Size -0.021**
(0.051)
Disease history 0.088
(0.102)
Log likelihood -279.031
Total number of observation 455
LR chi2(10) 71.10
Prob > chi2 0.0000
In parentheses probabilities of critical values are reported.
* = significance at 5 percent level.
** = significance at 10 percent level.
levels were used as independent variables to know the relationship between the
HH’s WTP and their income level. Interestingly people in the second and third
income quartile were not WTP for an improved SW collection, transportation
and disposal services. On the other hand, people which fell in the highest
income category i.e. 4rth income quartile, they were found WTP in this range.
These results were in the line with facts because everyone is trying hard
to earn his livelihood and to fulfil his HH necessities. So, being at the lower
income quartile, HHs finds it hard to set aside any money for the improvement
in the SWM services and could not afford to set aside amounts to preserve the
13
environment. Thus, according to the regression results, for the group of HHs
which falls in the fourth income quartile, their WTP was found 19 percent
higher as of Q1, while the other who has less income (Q2, Q3) were not willing
to pay at all (Table 3).
Education is always a crucial factor in achieving higher awareness. It
positively affects the public attitudes towards health and hygiene. According to
the regression results, education significantly affects HH’s WTP. All the three
education levels (metric, Graduate and postgraduate) do have positive and
significant effect on public’s WTP. So, those who had certain level of education
were round about 25 percent more WTP as compared to others who have less or
no education.
Location is another important factor which affects HH’s living standards.
People living in the urban areas are more concerned about their surroundings
due to two reasons. First is that urban places are more congested as compare to
the rural areas and secondly they are dependent on the government agencies for
the SWM services due to lack of community ownership to the areas, as well as
absence of alternative waste reduction possibilities which do exists in the rural
areas. Moreover, there is some demonstration effect in practice as well. That’s
why, in the regression too, the rural/urban divide was an important determinant
of the HH’s WTP for better SWM services. According, to the results, people
who live in the urban areas had 20 percent higher WTP as compared to the rural
dwellers. This provides evidence in favour of the fact that public’s WTP is
strongly influenced by the location where they live.
HH’s WTP for improved SWM services is also influenced by their
awareness level. As the level of awareness increases, HH become desperate to
avoid the negative consequences associated with the unmanaged SW. It is also
clear from our estimation results that the HHs which possessed some sort of
knowledge (regarding the adverse affects of SW) they were really WTP for the
improvement in the service levels. HH’s awareness (regarding the problems
related to improper SW management) has positive and significant relationship
with their WTP for an improved SWM services. According, to our estimated
results, if HHs have some awareness regarding the adverse effects of SW they
have 15 percent higher WTP for improvements in the existing system to have
better services quality. This also provide evidence that as people would become
more aware of the negative effects of SW, they would be more willing to pay for
avoidance.
Another important variable, which has bearing on HH’s WTP and
discussed in the model, is the HH size. It is a very important factor and
affects WTP of the family. Interestingly, HH size has a significant but
negative relationship with the HH’s WTP. This negative relationship
explains that as the HH size increases, the WTP goes down. There are
several reasons for this negative significant relationship. One is that as the
HH size increases people face more economic burden and their purchasing

14
power goes down (there is a positive correlation between size of household
and poverty) that’s why they are less WTP for environmental issues.
Besides, it can also be interpreted in a way that with the increase in the
family size, HHs member increases and they have more workers to get rid of
waste properly and hence they don’t consider waste a problem. Moreover,
with the increase in size of family, the overall production of waste per head
decreases gradually. All these factors lead to negative relationship between
the two variables i.e. HH WTP and HH size.
The last variable discussed in the model, is the disease history of the HH.
Here specifically those diseases were captured and regressed which were caused
by SW or its mismanagement. The important diseases were skin diseases,
asthma, hepatitis, stomach and diarrheal diseases and malaria etc. However,
according to the regression results, no significant relationship was found
between HH’s disease history and their WTP.
7. CONCLUSION
With the application of tailor made questionnaire for CVM estimates, the
study tried to capture unbiased real WTP for better SWM services. This study
not only tried to avoid the negative influences of over pledging, start or end
point bias in valuation but also encouraged participation. The adoption of said
technique helped in finding actual contribution which HHs are ready to make so
as to get rid of adversities attached with mismanagement of SW. Furthermore,
analysis of the determinants of the HH’s WTP helped in finding out the
contributing factors which affects the HH response.
The existing system of solid waste in Abbottabad is not up to the
expectation of HHs both in amenities and value to happen the requirements of
the HHs. This study explores that 78 percent of the HHs were aware of the
importance of SW management and they are sensitive to it. It is also
encouraging to note that 62 percent of the HHs was willing to pay for improved
solid waste management services. This suggests that people were aware but they
need some light at the end of the tunnel to take practical steps and conserve the
environment. From the discussion it is clear that urban HHs are not only in need
of better SWM services as of rural but are also willing to contribute monetarily
to avoid it. On the other hand, less of the rural HHs were WTP for improved
SWM services but they are consistent in accepting levy (even of higher charges)
for better SWM services.
According to expectations, education has a significant contribution in
framing HHs behaviour towards environmental goods. Those who had certain
level of education were more WTP as compared to others. Similarly,
demographic location, awareness and higher income were the important
determinants of HH’s WTP. In addition, HHs size has a negative and significant
effect on the said variable.
15
Hence, education plays its actual role in persuading the broad
community observation towards the prospect price for living in unhygienic
conditions. Thus government should increase its investment in education and
awareness campaigns. TMA should come up with certain projects to
encourage composting either by natural methods or via aerobic composting
methods and giving licenses to the private sector. No doubt, the given
factors are imperative but service quality is of extreme importance. HHs
should be provided clean and hygienic environment to live in which will
convince the public and persuade them to share the burden of the
government through paying appropriate levy.
REFERENCES
Amin, M. and F. Khondoker (2004) A Contingent Valuation Study to Estimate
the Parental Willingness-to-pay for Childhood Diarrhoea and Gender Bias
among Rural Households in India. Health Research Policy and Systems 2:3.
Arrow, K., R. Solow, P. R. Portney, E. E. Leamer, R. Radner, and H. Schuman
(1993) Advance Notice of Proposed Rulemaking, Extension of Comment
Period and Release of Contingent Valuation Methodology Report. Federal
Register 58, 4601–14.
Berrens, R. P., A. K. Bohara, and J. Kerkvliet (1997) A Randomised Response
Approach to Dichotomous Choice Contingent Valuation. American Journal
of Agricultural Economics 79:1, 252–266.
Cameron, T. (1988) A New Paradigm for Valuing Non-Market Goods Using
Referendum Data: Maximum Likelihood Estimation by Censored Logistic
Regression. Journal of Environmental Economics and Management 15:3,
355–379.
Cameron, T. A. and D. D. Huppert (1991) Referendum Contingent Valuation
Estimates: Sensitivity to the Assignment of Offered Values. Journal of the
American Statistical Association 86:416, 910–918.
Cameron, T. A. and M. D. James (1987) Efficient Estimation Methods for
‘Close-Ended’ Contingent Valuation Surveys. Review of Economics and
Statistics 69:2, 269–76.
Carson, R. T. and R. C. Mitchell (1995) Sequencing and Nesting in Contingent
Valuation Survey. Journal of Environmental Economics and Management
28, 155–173.
Cummings, R. G., D. S. Brookshire, and W. D. Schulze (1986) Valuing
Environmental Goods: An Assessment of the Contingent Valuation Method.
Totowa, NJ: Rowman and Allanheld.
Haq, M., U. Mustafa and I. Ahmad (2008) Household’s Willingness to Pay for
Safe Drinking Water: A Case Study of Abbottabad District. The Pakistan
Development Review 46:4.
16
Hoehn, J. P. and A. Randal (1987) A Satisfactory Benefit Cost Indicator from
Contingent Valuation. Journal of Environmental Economics and
Management 14:3, 226–47.
Komives, K., F. Vivien, H. Jonathan, and W. Quentin (2005) Water Electricity,
and the Poor, Who Benefits from Utility Subsidies? World Bank.
Liu J-T, J. K. Hammitt, J-D Wang, and J-L Liu (2000) Mother’s Willingness to
Pay for Her and Her Child’s Health: A Contingent Valuation Study in
Taiwan. Health Economics 9:4, 319–326.
Loomis, J., T. Wegge, M. Hanemann, and B. Kanninen (1990) The Economic
Value of Water to Wildlife and Fisheries in the San Joaquin Val-ley: Results
of a Simulated Voter Referendum. Transcript of 55th National Association of
Wildlife and Natural Resources Conference 55, 259–68.
Malik, T. M. and M. Jahangir (2008) A Right-able Wrong Sanitation and
Hygiene in Pakistan. Islamabad: Rural Development Policy Institute (RDPI)
and Fresh Water Action Network-south Asia.
Mansfield, C. (1998) A Consistent Method for Calibrating Contingent Value
Survey Data. Southern Economic Journal 64:3, 665–681.
Mitchell, R. C. and Richard T. C. (1989) Using Surveys to Value Public Goods:
The Contingent Valuation Method. Resources for the Future. Washington,
DC.
Mustafa, U., I. Ahmad, and M. Haq (2010) Pro-Poor Environmental Fiscal
Reforms in Solid Waste Management Sector. In Peace and Sustainable
Development in South Asia: Issues and Challenges of Globalisation.
Sustainable Development Policy Research Institute (SDPI) and Sang-e-Meel.
Mustafa, U., M. Haq, and I. Ahmad (2009a) Consumer Perceptions, Practices,
Willingness to Pay and Analysis of Existing Laws for Safe Drinking Water
of Abbottabad District, Pakistan. In Lin Heng Lye, Janet E, Milne, Hope
Ashiabor, Larry Kreiser, and Kurt Deketelaere (Eds.) Critical Issues in
Environmental Taxation, Vol VII. Chapter VI. Water, Land, and Pollution
Management. Oxford University Press, London. 395–412.
Mustafa, U., M. Haq, and I. Ahmad (2009b) Environmental Fiscal Reform in
Abbottabad: Drinking Water. Technical Editors: Rebecca Roberts. Published
by International Union for Conservation of Nature (IUCN) Pakistan, Swiss
Agency for Development and Cooperation (LDC), and PIDE. iv+22 pp.
Copyright © 2022 FDOKUMEN