Capturing Variation in Welding - DiVA portal
62
Capturing Variation in Welding A method to map variation in welding production, creating a basis for production improvements Kartläggning av variation i svetsproduktion En metod för kartläggning av variation i svetsproduktion, vilken skapar en grund för produktionsförbättringar Lotta Månsson Faculty of Health, Science and Technology Degree Project for Master of Science in Engineering, Mechanical Engineering 30 hp Supervisor: Christer Burman Examinator: Jens Bergström Date: 2019-07-18
-
Upload
khangminh22 -
Category
Documents
-
view
0 -
download
0
Transcript of Capturing Variation in Welding - DiVA portal

Capturing Variation in Welding
A method to map variation in welding production, creating a basis for production improvements
Kartläggning av variation i svetsproduktion En metod för kartläggning av variation i svetsproduktion, vilken skapar en grund för produktionsförbättringar Lotta Månsson
Faculty of Health, Science and Technology
Degree Project for Master of Science in Engineering, Mechanical Engineering
30 hp
Supervisor: Christer Burman
Examinator: Jens Bergström
Date: 2019-07-18

Abstract
Weld quality is essential when manufacturing fatigue-loaded structures. Defective welds are problematic, causing increased lead times, repairs and breakdowns. Over-processing as a result of unnecessary safety margins and poor quality is another issue, leading to a more expensive process and heavier products. Knowledge about what variation in weld quality can be expected in the process enables more efficient problem solving and use of resources. Reduced variation equals increased quality. Consequently, reduced variation is both a manufacturer and customer gain. This thesis studies in what way variation in welding production can be mapped and presented, to guide towards the right improvement actions. A literature study addresses welding, weld quality, measurement methods and variation. Two empirical studies using laser scanning equipment along with staff interviews will then be conducted to develop the method to capture variation in welding. In the journey towards machine learning and elimination of operator decisions, knowledge and understanding of variation in the process is necessary. Concrete results of the empirical studies gave new and valuable information to the company. Further, the method to map, analyse and display variation was believed to be useful in several ways, both at the case company but also at other plants. The results show that knowledge about variation could have a large financial effect. By identifying the areas of over-processing and deficient quality, the process can be optimized to increase productivity. While technical issues such as equipment to collect data can be barriers, soft issues like competence, a common understanding, and visualisation of variation seem just as essential. Key words: Variation, Weld, Laser scanning, Quality, Data display, Production improvement


Sammanfattning Svetskvalitet är viktigt vid tillverkning av utmattningsbelastade strukturer. Defekta svetsar är problematiska eftersom de kan leda till ökade ledtider, fler reparationer och i värsta fall haveri. Överprocessning är en annan svårighet som leder till en mer kostsam process och tyngre produkter. Kunskap om vilken variation som kan förväntas i processen möjliggör effektivare problemlösning och resursutnyttjande. Minskad variation innebär ökad kvalitet, därför är minskad variation både en fördel för tillverkaren och kunden. I denna uppsats studeras hur variation i svetsproduktion kan kartläggas och presenteras för att vägleda till produktionsförbättringar. En litteraturstudie behandlar svetsning, svetskvalitet, mätmetoder och variation. För att utveckla metoden för variationskartläggning gjordes två empiriska studier med hjälp av laserscanningsutrustning samt intervjuer med organisationen. På vägen mot en datastyrd process och eliminering av operatörs- och ledningsbeslut krävs kunskap och förståelse för variation i processen. Konkreta resultat från de empiriska studierna gav ny och värdefull information till företaget. Vidare antas metoden för att kartlägga, analysera och presentera variation vara användbar även hos andra företag och vid annorlunda förhållanden. Resultaten visar att kunskap om variation kan ha stor ekonomisk effekt. Genom att identifiera områden med överprocessning och bristande kvalitet kan processen optimeras för att öka produktiviteten. Medan tekniska problem som utrustning för att samla in data kan vara hinder, verkar mjuka och organisatoriska problem som kompetens, en gemensam förståelse och visualisering av variation vara lika viktigt.


Contents NOMENCLATURE ............................................................................................................................................ 1
CHAPTER 1 -‐ INTRODUCTION .................................................................................................................... 2 1.1 ABOUT VOLVO CONSTRUCTION EQUIPMENT .......................................................................................................... 2 1.2 PROBLEM FORMULATION ........................................................................................................................................... 3 1.3 AIM AND GOAL .............................................................................................................................................................. 3 1.4 RESEARCH LIMITATIONS ............................................................................................................................................. 4 1.6 THESIS OUTLINE ........................................................................................................................................................... 4
CHAPTER 2 -‐ LITERATURE STUDY ........................................................................................................... 4 2.1 WELDING OF FATIGUE-‐LOADED STRUCTURES ........................................................................................................ 4 2.1.1 Weld geometry ..................................................................................................................................................... 6 2.1.2 Weld quality .......................................................................................................................................................... 6 2.1.3 Weld imperfections ............................................................................................................................................ 7 2.1.4 Welding operations in production ............................................................................................................ 10
2.2 MANUFACTURING PROCESS AT VOLVO CE ........................................................................................................... 10 2.3 MEASUREMENT METHODS ...................................................................................................................................... 12 2.3.1 Current methods ................................................................................................................................................ 12 2.3.2 Laser scanning equipment ............................................................................................................................ 13
2.4 VARIATION ................................................................................................................................................................. 14 2.4.1 Variation accumulation in welding industry ........................................................................................ 15 2.4.2 Welding cost ........................................................................................................................................................ 16 2.4.3 Data analysis ...................................................................................................................................................... 17
2.5 RESEARCH METHOD .................................................................................................................................................. 19 2.5.1 Qualitative and quantitative data ............................................................................................................. 19 2.5.2 The case study method ................................................................................................................................... 20 2.5.3 Reliability and validity ................................................................................................................................... 21 2.5.4 Interviews ............................................................................................................................................................. 21
CHAPTER 3 -‐ EMPIRICAL STUDIES ......................................................................................................... 21 3.1 WORKFLOW ............................................................................................................................................................... 22 3.2 STUDY 1 ...................................................................................................................................................................... 22 3.2.1 Background ......................................................................................................................................................... 22 3.2.2 Method ................................................................................................................................................................... 22 3.2.3 Result ...................................................................................................................................................................... 23 3.2.4 Findings ................................................................................................................................................................. 24
3.3 STUDY 2 ...................................................................................................................................................................... 24 3.3.1 Background ......................................................................................................................................................... 25 3.3.2 Method ................................................................................................................................................................... 25 3.3.3 Result and analysis ........................................................................................................................................... 26 3.3.4 Findings ................................................................................................................................................................. 37
CHAPTER 4 -‐ RESULT .................................................................................................................................. 38 4.1 VARIATION MAPPING METHOD ............................................................................................................................... 38 4.1.1 Define objective .................................................................................................................................................. 39 4.1.2 Select products and welds ............................................................................................................................. 40 4.1.3 Plan and prepare experiment ...................................................................................................................... 41

4.1.4 Collect data .......................................................................................................................................................... 41 4.1.5 Condense and analyse data .......................................................................................................................... 41 4.1.6 Display data ........................................................................................................................................................ 42 4.1.7 Draw conclusions .............................................................................................................................................. 45
CHAPTER 5 -‐ DISCUSSION ......................................................................................................................... 46 5.1 RESULTS DISCUSSION ............................................................................................................................................... 46 5.2 EMPIRICAL STUDIES DISCUSSION ........................................................................................................................... 47 5.3 INDUSTRIAL SIGNIFICANCE ...................................................................................................................................... 47 5.4 GENERALIZABILITY ................................................................................................................................................... 49 5.5 FUTURE RESEARCH ................................................................................................................................................... 49
CHAPTER 6 -‐ CONCLUSIONS ..................................................................................................................... 50
ACKNOWLEDGEMENT ................................................................................................................................ 51
REFERENCES .................................................................................................................................................. 52

1
NOMENCLATURE
GMAW Gas metal arc welding MIG Metal inert gas MAG Metal active gas GTAW Gas tungsten arc welding a Throat size r Weld toe radius b Leg length i Penetration WPS Welding procedure specification UCL Upper control limit LCL Lower control limit UTL Upper tolerance limit LTL Lower tolerance limit Cpk Process capability

2
Chapter 1 - Introduction
Weld quality is of great importance when manufacturing fatigue-loaded products. From a business perspective, quality revolves around fulfilling customer expectations. When quality is statistically measured, the purpose is to find the variation in a measurement between what the customer wants and what is produced. Quality control is designed to detect problems with a product and is a part of quality assurance [1]. Quality assurance is a systematic set of actions necessary to establish confidence that the finished product fulfils customer expectations. This includes identifying variances and improving processes [2]. An increased knowledge about the weld quality and variation enables optimization of the manufacturing process. This optimization and improvement benefits both the manufacturer and the customer. Increased productivity, shorter lead times and savings of filler material are some factors decreasing the manufacturing cost, which is beneficial for the manufacturer. Weight savings, decreased repair and less scrapping are some important customer gains. Consequently, weld quality control highly affects both cost and environmental issues [Company presentation, Thomas Stenberg CMFO Winteria, 2019-02-07]. Figure 1 illustrates the effect of reduced variation from a cost perspective.
Figure 1: Influence of reduced variation on cost
1.1 About Volvo Construction Equipment Volvo Construction Equipment is a leading manufacturer of construction equipment such as wheel loaders, excavators, haulers and more. The products and services are offered in 145 markets around the world and there are over 14,000 employees [3]. At the Arvika plant, wheel loaders have been manufactured since 1966. The most well known models, from L60 to L350 are produced here [4]. The whole production process can be experienced in Arvika, all the way from raw material to welding, painting and finally assembly of the products. This thesis work was performed in collaboration with Volvo CE in Arvika, focusing on mapping the variation in the welding process.
3
1.2 Problem formulation This thesis work will be a contributing part of a research project called VariLight, managed by Volvo in collaboration with several other companies; SSAB, Hiab and Bromma. The objective of the project is to enable light weight welded structures by reducing variation in the manufacturing processes, structure strength and load estimation. Aiming for light weight structures can reduce environmental effects by decreased fuel consumption, material usage and production resources. The goal is to study and map the sources of variation, enable further introduction to more weight-to-strength efficient material and to develop recommendations and guidelines for manufacturing and design processes with larger accuracy and reduced scatter.
1.3 Aim and goal This thesis work combines two interests at Volvo CE in Arvika. Primarily the need for a method to capture and understand variation, but also the interest in laser scanning as an evaluation method. The aim of the thesis work is to create a method to identify the baseline regarding what variations are affecting weld production and how to use that knowledge in the best way. The goal is to create a method to map, analyse and create a basis for decisions to different stakeholders. The final mapping method will be described using the Volvo CE case as an example. Specifically, the result should involve:
• Methods and instructions on how to collect data • Ways to display and use the collected data depending on the needed
information • Examples of conclusion drawing leading to improvement actions
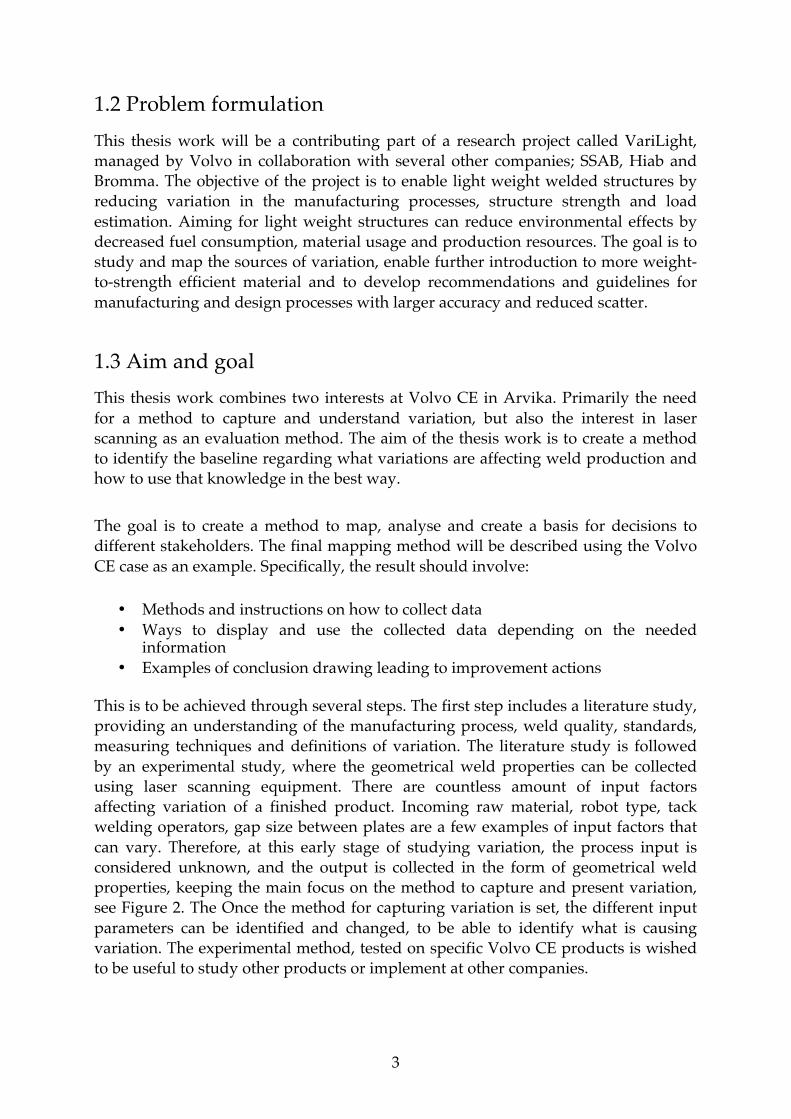
This is to be achieved through several steps. The first step includes a literature study, providing an understanding of the manufacturing process, weld quality, standards, measuring techniques and definitions of variation. The literature study is followed by an experimental study, where the geometrical weld properties can be collected using laser scanning equipment. There are countless amount of input factors affecting variation of a finished product. Incoming raw material, robot type, tack welding operators, gap size between plates are a few examples of input factors that can vary. Therefore, at this early stage of studying variation, the process input is considered unknown, and the output is collected in the form of geometrical weld properties, keeping the main focus on the method to capture and present variation, see Figure 2. The Once the method for capturing variation is set, the different input parameters can be identified and changed, to be able to identify what is causing variation. The experimental method, tested on specific Volvo CE products is wished to be useful to study other products or implement at other companies.

4
Figure 2: Overview of research focus.
.
1.4 Research limitations § The time period for the thesis was limited to 20 weeks, corresponding to 30
hp. § Due to the time frame, the number of wheel loader frames to be scanned was
20 pcs of type A, with eight welds on each frame. § The research focus is the method to collect and analyse data. Thus, the sources
of variation will not be studied. § Classified information will not be shared in the report. Products and
parameters will be named A, B, C and so on.
1.6 Thesis outline The thesis is divided into six chapters. Chapter 1 introduces the problem formulation along with the objectives and goal. Chapter 2 presents the theoretical framework. Chapter 3 describes the experimental part of the thesis, including results and findings from the Volvo CE case. The result of the variation mapping method is presented in Chapter 4. In Chapter 5, the methodology and results are discussed along with a general discussion regarding the industrial contribution and future research. The conclusions from the thesis work will be summarized in Chapter 6.
Chapter 2 - Literature study
In this chapter, the theory needed to proceed with the thesis will be presented. At first, an introduction to welding, weld quality and standards will be given. Following, the manufacturing process will be described. Later, different measurement techniques will be presented along with methods to do research, analyse data and study variation.
2.1 Welding of fatigue-loaded structures Welded joints are critical areas of fatigue-loaded structures since they are subjected to high stresses. Local stress concentrations often occur at the weld toe or weld root (see Figure 3). Therefore, it is important that the stress flow in these areas is as smooth as possible [5].

5
Gas metal arc welding Gas metal arc welding (GMAW) is a widely used method in industrial manufacturing, and the main method considered in this thesis. The method is versatile and can be used in both semi-automatic and automated operations. Many of the most common engineering metals, including carbon steel, high-strength low-alloy steel, stainless steel etc. can be welded using GMAW. The process produces an arc between the two joining plates and the continuous filler (metal electrode), see Figure 3. Contamination from the surrounding air is avoided by using a shielding gas, either inert (MIG) or active (MAG) [6].
Figure 3: Illustration of the principle of MAG welding for a fillet weld (triangular cross
section) [7].
There are several welding variables, the two most important being the wire feed speed (current) and the voltage. Different settings of these parameters will highly affect the characteristics of the arc and the weld process. Other considerable variables are travel speed, polarity, electrode diameter, electrode composition, electrode extension, electrode orientation, gas composition and gas flow rate. Most of the variables are interdependent; meaning that changing one results in needed adjustment of another [6]. Following are some important advantages of the GMAW process:
• The wire feed is continuous, enabling long welds can be produced without intermediate stops.
• Welding can be performed in all positions. • High welding speeds. • The absence of heavy slag results in minimal need for post-weld cleaning. • It is a low-hydrogen process, suitable for materials likely to undergo hydrogen
embrittlement [6].

6
Tungsten arc welding Another process for welding is gas tungsten arc welding (GTAW), often referred to as TIG (tungsten inert gas). This process uses an arc between a non-consumable tungsten electrode and the metal to create a weld pool. The process can be used with or without filler material but always with shielding gas (inert). The torch, in which the non-consumable electrode is held, is moved along the workpiece. The arc melts the surface of the metal, which is protected from the atmosphere by the shielding gas [6]. At Volvo CE, TIG welding is used as a correcting treatment in the final welding step in production.
2.1.1 Weld geometry There are several weld properties defined and used in standards and drawings. Some basic properties of a fillet weld are throat size a, leg length b, penetration i, and weld toe radius r, shown in Figure 4. The throat size a, is defined as the height of the largest isosceles triangle that can be inscribed within the fillet weld cross section. The leg length b is the distance between the weld toe and the opposite plate. The penetration i is the shortest distance between the surface of the parent metal and the root. Finally, the weld toe radius is the radius at the transition between the weld and the parent material.
Figure 4: Dimensional designations for a fillet weld and cross-section of an actual weld
sample.
2.1.2 Weld quality The use of standards is helpful to ensure product quality and understanding within an organisation [8]. In the Volvo Group, the quality level of the welded joints is divided into five weld classes: VS, VE, VD, VC and VB, where VB has the strictest requirements [9]. VS is the weld class for static strength and the rest are weld classes for fatigue strength. The weld class and other requirements to be fulfilled are given in the drawing for each weld, see example in Figure 5. Further, the drawing contains

7
all information needed for the weld process. Weld type, process, shape, dimensions etc. are given here [10].
Figure 5: Example of weld symbol including weld identity, dimensions, type and weld class.
2.1.3 Weld imperfections The Volvo standard includes several weld imperfections and the extent to which they are permitted or not. Severe discontinuities like cracks, external lack of fusion and root defects are not permitted for fatigue strength. Less severe imperfections can be permitted, but with requirements depending on the fatigue life. Table 1 concludes the imperfections mentioned in the current standard [9]. Table 1: Types of imperfections mentioned in the Volvo standard STD 181-0004
Group Number Type of imperfection
Imperfections with
common requirements on weld classes for
fatigue strength
101 Internal and external crack 102 External lack of fusion 103 Internal lack of fusion 104 End crater pipe 106 Leg deviation 107 Arc strikes
108 Bad fit-up
Imperfections with
different requirements on weld classes for
fatigue strength
201 Overlap and cold lap 202 Outer transition radius 203 Undercut 204 Underpassed throat dimension 205 Non-filled weld 206 Edge displacement 207 Single internal pore/slag inclusion 208 Inner porosities/slag inclusions 209 Single surface pore 210 Surface porosities
211 Incorrect weld toe
Root imperfections 301 Penetration bead/excessive penetration 302 Incomplete root penetration 303 Root defect
Cracks Cracking is one of the most severe discontinuities that can be present in a weld. It is usually related to the material being welded, but the weld process can also cause this problem. Some possible causes are improper joint design, too high weld depth-to-

8
width ratio, heat input too high etc. Internal cracks can be discovered using ultrasound inspection. Cracking in the heat-affected zone is a concern when welding hardenable steels. This can be caused by hardening in the heat-affected zone, high residual stresses or hydrogen embrittlement. To avoid this, the material can be preheated to decrease the cooling rate, but also go through a stress-relieving heat treatment [6]. Lack of fusion Inadequate welding technique, insufficient heat input, too large weld pool etc. can result in incomplete fusion, meaning that some of the metal pre-solidifies and leaves a gap which is not filled with molten metal [6]. End crater pipe When welding stops, craters might occur at the end of the weld resulting in a smaller throat thickness at that point. It is common to weld some distance past the end or to go backwards over the weld before stopping to prevent this problem [11]. Leg deviation Leg deviation is an imperfection where both leg lengths are not equal, see Figure 6. The set up geometry and position can influence any occurring leg deviation.
Figure 6: Leg deviation on a fillet weld [9].
Bad fit-up When the gap between plates is too large, that can lead to decreased strength and increased welding cost, therefore a maximum gap is defined in the standard [12]. Overlap and cold lap An overlap can form when molten metal travels over the surface of the plate and cools without merging with the plate. In a fillet weld, gravity will pull excessive molten metal towards the horizontal plate, causing the overlap. Possible causes for this can be too much weld metal due to a low travel speed [13]. A cold lap is a crack-like imperfection that can occur when the melted metal does not merge with the plate surface. Cold laps cause stress concentrations and can transform into cracks [14].

9
Outer transition radius The outer transition radius or weld toe radius is a critical weld property considering the fatigue life. The previously used "even transition" has been redefined using radius requirements for VD (0.3 mm), VC (1 mm) and VB (4 mm) in the standard. This has been done by translating the stress concentration factors into geometric parameters [14].
Undercut An undercut refers to a groove that is formed when the base metal melts away from the weld zone. This area, close to the weld toe or root, is not filled with metal, resulting in a notch shape, see Figure 7. Too high travel speed or current can cause this type of defect. Too much weaving could also be responsible for undercuts [13].
Figure 7: Exaggerated illustration of an undercut in a fillet weld.
Underpassed throat dimension The throat size is the height of the largest inscribed isosceles triangle in the cross section, see Figure 4. An underpassed throat size may influence the strength of both the toe side and the root side. The throat size has a bigger influence on strength for static loads than for fatigue loads, where other properties like weld toe radius play a greater role. Misalignments When two plates are welded together in the wrong position or angle, misalignments result. In that case, an applied tension load can lead to bending forces, affecting the fatigue life [14]. Porosity and slag inclusions Porosity is a condition in which gas is trapped during the solidification process. The pores produced can contain oxygen, nitrogen, hydrogen or even the shielding gas applied. To overcome this the gas flow and other process variables need to be optimized. The electrode and workpiece also need to be kept clean. Oxygen and nitrogen are also elements that, when present, affects weld properties. When the shielding gas does not work sufficiently, these elements can be absorbed from the

10
atmosphere. When they react with the metal, oxides and nitrides form that will decrease the weld metal toughness at stress concentrations [6]. Root defects Root imperfections include both excessive penetration and incomplete penetration. Root defects where there is a gap between weld and plate are not permitted in any fatigue-loaded case.
2.1.4 Welding operations in production Tack welding Tack welds are used to hold assembled components in place, ensure correct alignment and maintain the joint gap before the final welding can be performed [15]. Generally, the tack welds are short welds, disposed some distance apart from each other. Should the alignment be incorrect, the parts can be disassembled and tack welded again. Robot welding The main welding of the components is performed by a MAG robot. A robot offers consistent, quality welds without the use of excess filler material or gas. The usage of robots is advantageous from both an economic, ergonomic and efficiency perspective. Health and ergonomic problems are decreased, just as the need for training and labour investments. [16]. Final welding After the robot weld, the component reaches the final weld station. Here, any extra parts are welded on and corrective welds can be added. Critical points of the weld, causing stress concentrations, can be treated afterwards using TIG-dressing, grinding or UIT (ultrasonic impact treatment). Such treatments help to achieve smooth transitions between the weld and the parent material and also to even out any imperfections [7].
2.2 Manufacturing process at Volvo CE The heavy steel structure in the wheel loader generally consist of three parts; front frame, rear frame and boom unit, see Figure 8. All three are assembled and welded in the welding workshop at the Arvika plant. The following description of the manufacturing process is based on a guided tour through the workshop given by an employee at the plant [Supervisor, 2019-01-30].

11
Figure 8: Front frame, rear frame and boom unit of a Volvo wheel loader.
There are individual production lines in the workshop for each structure; however, the principle of the welding process is the same and is illustrated in Figure 9.
Figure 9: Illustration showing the principle of the welding process.
Goods reception and kitting Material from the supplier is received at the goods reception where it is also kitted onto carts. Each kit is a package of parts to be assembled later on the line, for example a side section. Kitting decreases the amount of material handling and makes the line more effective since the material needed will be ready to go. Some parts are welded into sub-assemblies prior to the main assembly line. Front frames The front frames of all models except the heavy L350H are welded on the same line. This is possible due to the variable fixtures available. Depending on the frame size, a specific fixture is used; this can easily be swapped when moving on to a different size. First, each side section is tack welded and then welded. Then all front frame parts are tack welded together prior to the robot weld. Finally, the frames move to the final weld station where the last details are completed. Rear frames The rear frames (except L350H) are welded on two separate lines, one for medium-size loaders and one for large-size loaders. The large-line begins with tack welding of both side sections followed by tack welding of the whole frame. It is then moved to the robot cell for welding and then the final welding is made. Two parallel lines make up the medium-line. In the back, the middle part is tack welded, robot welded and then machined (holes etc.). Moving on, the side sections

12
are tack welded and moved to the marriage station. At this station, all parts are tack welded together and then robot welded prior to the final weld. Boom unit The boom units are currently made in two stations. In the old station the boom unit is mounted and rotated, while the robot welds the middle section to the sides. Here, submerged arc welding is used. The operator at the station needs to remove slag during the process, which is not preferable from an ergonomic or safety perspective. Therefore, a fully automated MAG robot cell is replacing this station. Surface preparation When welding is complete, all parts go through surface preparation before painting. Shot blasting and shot peening are treatments where small steel beads are shot against the surface of the material. The purpose of shot blasting is to remove slag, dirt or other contaminants so that paint or coatings can adhere to the surface. Shot peening serves to enhance the mechanical properties of the material by creating a layer of compressive stresses which relieves tensile stresses in the piece. This treatment makes metal components more resistant to cracks, fatigue and corrosion [17].
2.3 Measurement methods Quality control of welds involves different measurement methods, these are often evaluated with respect to several factors. Accuracy refers to how close the measurement comes to the correct result. Precision on the other hand, tells how consistently that result can be achieved with the same method. The variation in measurements obtained when the one person does multiple measurements on the same part, under the same conditions is referred to as repeatability. Reproducibility refers to the variation in measurements obtained when several people measure the same part under the same conditions [18].
2.3.1 Current methods As of today, most weld evaluation is done with visual inspection, e.g. using handheld tools to measure weld parameters on a few points, see Figure 10 [19].
Figure 10: Handheld tools for measuring the throat size, weld toe radius and undercut.

13
In a study, it was shown that the results of these visual judgements vary notably and the precision is poor [20]. The study highlighted problems regarding both repeatability and reproducibility, since the tools themselves come with a certain amount variation, which is then increased when human judgement is added. This contributes to an increased cost, due to break downs, unnecessary repairs and large safety margins. The inconsistency in judgement of welds can lead to acceptable welds not being let through, or defect welds being accepted. In another study it was also shown that it is hard to standardize visual judgement [19]. As a summary, current evaluation methods result in large variation and an uncertainty regarding the weld quality produced at the plant. This is a large obstacle when aiming for decreased variation and related cost, which means that other methods need to be explored.
2.3.2 Laser scanning equipment The use of laser scanning as an evaluation method could decrease the level of uncertainty significantly. Laser scanning enables a continuous measurement over the weld length, controlling consistency of the weld in a new way [Company presentation, Thomas Stenberg CMFO Winteria, 2019-02-07]. The laser offers high accuracy, meaning that the variation originated from the measurement tool is reduced. The laser can be placed either on a robot or on a rail, see Figure 11. Figure 12 shows how the scanner identifies the different parameters. The dotted lines represent the plates and the largest inscribed triangle. The weld toe radius is shown as a circle.
Figure 11: Scanner on rail and close view of laser beam scanning the weld profile.

14
Figure 12: Translation from laser beam profile to weld parameters.
As the weld is scanned, the data is transferred to the software, compiling it into an instant assessment of the quality level according to the standard, see Figure 13. The subjective human judgement is eliminated to a large extent using this method, which means that variation can be further decreased.
Figure 13: Assessment of quality level along the weld.
2.4 Variation Variation is inevitably present in all real world data. It is easy to compare one value with another, but since both are subject to variation, it is difficult to know how much of the difference in the values is due to variation and how much is caused by any changes in the process. Variation can be described as "the random and miscellaneous

15
component that undermines the simple and limited comparisons" [21]. To be able to understand a set of data, one needs to distinguish between "noise" and single values (signals). Noise is naturally present in routine variation, while a single value is a signal of exceptional variation. With the aid of control charts, one can filter the noise from routine variation from the signals of exceptional variation by introducing limits. In the case of a manufacturing process with certain requirements for the finished product, standards help construct these limits of accepted values.
2.4.1 Variation accumulation in welding industry When manufacturing welded structures, variation originates from many sources and can be accumulated during the process. The result is excessively large safety margins and over-processing [5]. The chain starts with customer requirements, these will determine the product strength. Since there is always an uncertainty in customer usage and product strength, safety margins are introduced. If not, strength and load could overlap, causing failure when a customer with high demands gets a low strength product. Thus, the design process will result in structures that have higher strength than required. The strength distribution is assumed, based on historical data, so the product is already subject to variation. The designer states the requirements on the drawing, which is then used for production operations. The welding procedure specification (WPS), robot programming and complementary welding instructions are examples of operations affected to variation. Firstly, the WPS is specified. This contains information about material, wire, gas and other parameters necessary to obtain the intended weld. It has been shown that the WPS values depend on who is creating it, based on experience and earlier specifications. Since welding cannot be performed with perfect accuracy, tolerances are introduced. The variation in WPS values, plus tolerances add to the total variation. Robot welding is common and the programmer of the robot adds further variation to the chain since different operators will program based on their experience and earlier feedback. The programmers compensate for different factors like varying gap size, requirements for weld toes or equal leg length etc. The difference in compensation will contribute to the total variation. Manual welding is often needed as a complement to robot welding. Here, instructions are stated regarding where to tack weld or complete a weld the robot did not finish. Again, depending on who makes the instructions, the size and number of tack welds e.g. will vary. As a conclusion, everyone involved in the welding process, from designer to welder, will add safety margins resulting in over-processing. Finally, when quality assessment is carried out, further variation is added due to tools and subjective judgements. The whole chain of variation accumulation can be viewed in Figure 14.

16
Figure 14: Illustration of the accumulation of variation.
Defining a minimum tolerance value often results in large safety margins, to make sure that all products fulfil the requirements. Over-processing as a result of these safety margins is an issue. Figure 15 illustrates a comparison between a process with large variation and over-processing to a process where the variation is reduced. In the case with reduced variation, the mean value has come closer to the tolerance limit, which also means that over-processing is reduced [5].
Figure 15: The effect of decreased variation on over-processing.
2.4.2 Welding cost A decreased production cost while maintaining the quality level is a major gain for the manufacturer. Customers do not pay for over-processing, reducing that is important but also a barrier. There is a simple model for estimating the welding cost of over-processing using the rule of thumb. The rule states that 10 % increase in

17
throat size can lead to 20 % increase in production cost [22]. The reason is that if the throat size increases by 10 %, the cross-sectional area becomes 20% larger and so will the weld weight. The welding cost is generally proportional to the weld weight, therefore the welding cost will also increase by 20 %. The welding cost is commonly calculated with respect to four important factors: the amount of weld metal (kg), machine cost (cost/h), deposition rate (kg/h) and the factor of the total time when the arc is struck (%) [5].
2.4.3 Data analysis To extract relevant information from a set of data, an analysis method to interpret it is required [21]. Control charts A control chart is a statistical tool that illustrates the process behaviour over time. This can be used to monitor and detect variation in the process and distinguish between common and special causes of variation. The purpose is to get a better understanding of the process, which enables improvement for higher quality, lower cost and higher effective capacity. The basic control chart contains data points collected in the sample, the mean value represented by a center-line and finally the upper and lower control limits (UCL and LCL), see Figure 16. The chart can also contain tolerance limits (UTL and LTL), these are predetermined by product quality requirements unlike control limits that are statistically calculated. The control limit range is sometimes referred to as the "voice of the process", while the tolerance limit range is the "voice of the customer" [21].
Figure 16: Example of a control chart with data points, center-line, control limits and
tolerance limits.

18
Every process contains two types of variation, common cause variation and special cause variation. The instability of the points within the control limits is the natural variation of the process, as a result of common causes. Common causes are affected by design, machines, set up etc. and can only change if the process is changed. Data points that fall outside the limits are results of special causes, meaning that something has unnatural has affected the process (human errors, unplanned events etc.). Generally, the goal is to reduce common causes and eliminate special causes to improve the predictability of the process. A process can be considered as stable if the process is not affected by special causes, i.e. the data points fall within the control limits and are randomly dispersed. If the data points show trends, shifts or instability within the control limits, that is also a special cause of variation [23]. It is important to note that the term stable only refers to how predictable the process is. Therefore, a process could deviate from the target but still be considered as stable. Process capability The process capability (Cp and Cpk) is a measure used to predict how well a process performs in relation to the tolerance limits. This is done by comparing the width of the process variation to the width of the tolerance. Cp is the number of times the process variation fits within the tolerance limits. This measure does not take location into account, so Cp remains the same regardless of distance to tolerance limits. Cpk is calculated with respect to the location of the data, this is a more realistic measure of the process capability [24]. A normal requirement is that Cpk should be 1.33 or larger in order to consider the process as capable [23]. In this thesis, the imperfections and dimensions that will be investigated are described with maximum or minimum tolerance limits in the standard. The process capability will therefore be calculated with the Equation 1 and 2, meant for one-sided tolerance limits [23].
𝐶𝑝𝑘(𝐿𝑇𝐿) = 𝑥−𝐿𝑇𝐿3𝜎 (1)
𝐶𝑝𝑘(𝑈𝑇𝐿) = 𝑈𝑇𝐿−𝑥
3𝜎 (2) Design of control chart The design of control chart includes choice of sample size, control limits and frequency of sampling [25]. When selecting these parameters, production rate and cost factors might have to be considered. The sample size influences the stability of the control limits. In an experiment it was shown that the control limits change depending on the number of samples. As the sample size was increased, the control limits stabilized, concluding that a sample size of 20-30 samples is sufficient [26]. The software used with the scanning equipment assumes the data to be normally distributed. The control limits are calculated using the mean value plus/minus three standard deviations. If x is a normal random variable, the probability distribution of x will be defined as Equation 3 shows, where 𝜇 is the mean value and 𝜎 is the standard deviation [25].

19
𝑓(𝑥) = !! !!
𝑒!!!!!!!
!
−∞ < 𝑥 < ∞ (3) The normal distribution curve is shown in Figure 17. If the variable x is normally distributed, then 68,26 % of the population values will fall between the limits μ ± 1σ. 95,46 % will fall between μ ± 2σ and 99,43 % will fall between μ ± 3σ.
Figure 17: Interpretation of the standard deviation of a normal distribution.
2.5 Research method The research method provides a design for undertaking research. There are many variations of research methods, and it is not guaranteed that a specific method agrees entirely with the researcher's idea. However, the features of the methods can be used, and with modification the researcher can find a suitable strategy [27]. Research techniques are included as a part of the method and include data collection, sample selection and more [27]. In short, the research method can be described as "an action plan for getting from here to there". "Here" can be defined as some current state with initial questions. "There" is a future state with conclusions or answers to these questions [28]. The research techniques are important steps between "here" and "there". In this section, the research method and research techniques will be presented along with their advantages and disadvantages. Later, reliability and validity of the research method will be discussed.
2.5.1 Qualitative and quantitative data Both qualitative and quantitative data will be collected during the study. This type of mixed method can provide a better understanding of experimental results (quantitative data), with the use of the perspective of individuals (qualitative data) [27]. Follow-up qualitative data can also be used to explain quantitative results. For example, if an effect has been identified with quantitative data, the cause might be identified with qualitative data. For a single researcher with a limited time frame, an

20
embedded model of design is recommended. A simple model of this kind is an experiment complemented with secondary data collection (e.g. interviews). The qualitative data can be collected before, during or after the experiment depending on the need.
2.5.2 The case study method The case study research design can be used for several objectives, e.g. description of phenomena or development and testing of theories and hypotheses. For this thesis, the case study design will be particularly useful for exploration of an area where the existing knowledge is limited. The first step of the study is the definition of research questions, indicating the topic and orientation of the study. RQ 1: Mapping variation: How can variation in welding production be studied and mapped? RQ 2: Data analysis: How should the data be analysed and presented? The case study is carried out by collecting numerous types of data, including technical documents, measurements, interviews and observations. This requires the researcher to obtain necessary background information about the site and topic prior to data collection. It is also important to obtain access to useful sources of information including management and employees [29]. The data analysis step is important and can be challenging; therefore it is helpful to have some kind of strategy [28]. One way to do this is to divide the analysis into three activities; data condensation, data display and conclusion drawing/verification [30]. Data condensation implies selecting, focusing or simplifying the obtained data. This helps to structure the information towards the goal. Data display is an organized and compressed assembly of information, presented as a graph, matrix, chart etc. The type of display will highly influence how comprehensible the information will be. The display should be created in such a way that the analyst can draw conclusions or make decisions. The third activity is conclusion drawing and verification. The analyst interprets the data to find patterns, explanations or propositions. These three activities, plus data collection, can be done as an iterative, cyclic process, going back and forth. The case study method involves multiple sources of evidence, typically using both qualitative and quantitative data. Some critics mean that, in many cases, the data collection and analysis has been influenced by the researcher's view. This could result in limited validity of conclusions and findings. However, that phenomenon can occur in other research methods as well [29]. Another concern is whether the findings and conclusions from the case study design are scientifically generalizable or not. Scientific facts are usually based on multiple experiments, repeating the same experiment multiple times with the same conditions. A similar strategy can be used with multiple-case studies, to obtain a more rigid basis for generalization. Regarding

21
single-case studies, the most reasonable approach is to consider the findings as theoretically or analytically generalizable, not statistically [28]. Development of concepts or generation of theories are two types of generalizations that can be made. These findings can be valuable in other similar settings [29].
2.5.3 Reliability and validity The term reliability refers to how well the operations of the study can be repeated with the same results. Proper documentation allows a new researcher to repeat the case study and reach the same result, with minimized errors and biases. Validity, or specifically external validity indicates the generalizability of the study [28]. As mentioned in the previous section, case studies can be considered as analytically generalizable, which implies that the researcher is attempting to generalize results to broader theory.
2.5.4 Interviews When collecting data, input from the whole organisation from management to operators can be valuable. Operators normally have a lot of information that is often overlooked [25]. Interviewing is a commonly used research technique in case studies, which helps collect information from the organisation. The different types include structured, semi-structured and unstructured interviews. In structured interviews, each interviewee is asked the exact same questions in the same order. Unstructured interviews are appropriate when collecting information from key people or to get a better insight of some area. Here, each answer usually leads to the next follow-up question. Semi-structured interviews are a mix of the two mentioned earlier. There is a set of questions to be answered but the interviewer is also free to ask new questions that occur [29]. Compared to questionnaires, interviewing can give more complete and complex answers due to the possibility to explain and clarify answers. The misunderstanding of questions is decreased and it is possible to ask flexible questions. Further, the interviewee can observe the respondent and possibly get a better understanding of the viewpoints. Some disadvantages of interviews are that they can be hard to document and that the interviewer might affect validity and reliability in different ways [29].
Chapter 3 - Empirical studies
In this chapter, the experimental method will be described, including Study 1 and 2. This chapter will include results and conclusions from the experiments since these findings alone are not part of the objective of the study, but incorporated in the method. The understandings and conclusions from the case study will be useful when developing the course of action described in chapter 4. Due to classified information, what products has been investigated will not be announced and weld properties will be named parameter A, B, C and so on.

22
3.1 Workflow The literature study was followed by the practical part of the thesis. First, Study 1 was conducted to get to know the process, practice and prepare for Study 2. Study 2 consisted of a longer experiment to base the result on. Data from 20 products was collected, analysed and discussed during interviews. Finally, conclusions were drawn and the variation mapping method in the result could be defined and explained.
3.2 Study 1 The following section describes the background, method, result, analysis and main findings from Study 1.
3.2.1 Background Due to lack of initial information about the process variation, some introductory measurements had to be made. The purpose was to find some indications or patterns of variation that could be further investigated later in a more systematic and extensive experiment. Such a study would be time consuming and maybe also costly, therefore it has to be properly motivated. Another purpose of study 1 was to find new questions and problems, so that they could be resolved in an early stage. Prior to study 1, some hypotheses were stated, concluding possible product and process differences that could indicate variation. Stating hypotheses helps to focus the first study in the right direction. Following are some comparisons that could be made to reveal variation in the process:
§ Front frames/rear frames § Large frames/small frames § Right/left side of frame § Different production lines
3.2.2 Method The first laser scanning measurements had to be made on stations where the experiment did not interfere with the production flow. The products included in the first study were the ones available at the ultrasound station and the weld audit station. The available frames during study 1 were eight front frames and four rear frames. Amongst these, there were three pairs of front frames of the same model and one pair of rear frames of the same model. Since variation over time (between frame variation) is interesting, these pairs were compared. Along with this collection of data, complementary information was gathered. Interviews with personnel and own observations were made to support later decision-making. The data was analysed with some respect to the stated hypotheses, focusing on the throat size and weld toe radius at this stage.

23
3.2.3 Result Selection of welds During study 1, some observations regarding the instrumentation were made. The scanner-and rail solution is quite bulky, so the selection of welds to be measured on each frame is limited by the equipment and the frame geometry. Further, the scanner is sensitive, so the set-up conditions need to be more or less optimal to scan welds accurately. Variation When analysing the data, one thing that could be assessed in experiment 1 was the stability over one weld length (within frame variation), using the built in control chart function in the software. It was found that generally, the throat size was fairly stable and passed the requirements. Contrariwise, the weld toe radius often showed instability and almost all frames had some spots where the radius deviated from the minimum requirement. Estimating variation over time requires a larger sample than two frames. However, some indications of interesting patterns were found in two of the pairs. One rear frame model and one front frame model showed differences between the left and right side welds. Regarding the focus of analysis, it was found that minimum and mean values alone do not say much. The aim should be to describe variation range or capability. Data analysis While processing the obtained data, the following questions arose:
§ What is the definition of a "current state" or "mapping", and how should this be displayed?
§ When scanning a large sample size, how should the data be translated from one weld of some length to a point in a new control chart?
§ Should the measurements be made prior to or after blasting? Interviews To support future decision-making some semi-structured interviews were held with employees at the plant. The interviews concerned the following topics:
§ What welds are important or interesting to measure? § Is there a history of known variation patterns? § In what process step should the frames be measured?
The first interview took place at the weld audit station. The employees here control welds according to drawing specifications using handheld tools. In the interview (Weld auditor, 2019-02-26), it was concluded that to evaluate the weld toe radius, the welds should be free from slag and dirt. According to the auditor, the slag might not be fully removed with handheld tools, so the blasted condition is preferred. Regarding specific welds to be measured, the auditor referred to technical

24
documents. Finite element (FE) fatigue calculations can be used to identify critical areas affected by high stresses. Along with these, weld drawings can be useful to find welds with high requirements, often coincident with the FE-analysis. The second interview was held at the production line for front frame. The team leader (Team leader: welding front frames, 2019-03-06) means that the most useful information would be gathered after the robot welding, prior to final welding. That data could show the robot performance, and indicate whether any extra welding that is currently done is unnecessary. The team leader agreed on scanning the suggested welds in high stress areas and also pointed out other welds. However, some of these were not measurable with the scanning equipment. The last interview in study 1 was held with the corresponding team leader for small and medium rear frames (Team leader: welding medium rear frames, 2019-03-06). This team leader shared the previous leader's idea that the measurements should be done between the robot and final welding. He pointed out long welds in the middle section of the medium rear frames as relevant welds to measure since these are subject to high stresses and there had been previous irregularities in this area.
3.2.4 Findings An extensive experiment over time was needed to describe the current state. Due to the decided time frame for the experimental part of the study, only one type of frame was to be investigated. Several factors were considered when making the decision to investigate the specific front frame, in this report called Frame A. Since only one large-scale experiment was made, it was important that it would contribute with as much information as possible. Both team leaders agreed that the most useful information for their interest would be collected before final welding. However, it was decided that all measurements were to be made on blasted frames, to obtain information about the weld toe radius. The specific Frame A has several welds that allow for optimal use of instrumentation, which in turn gives more accurate results. Some assumptions regarding the frame selection were made. Since all front frames are welded on the same line, any information found on Frame A could be valuable when considering other front frames. It is also the largest line with the most products, so it is also relevant in that manner. The welds on Frame A are large so a possible point of view may be that they cost the most and should therefore be given priority.
3.3 Study 2 The following section describes the background, method, result, analysis and main findings from Study 2.

25
3.3.1 Background The purpose of study 2 was to map variation over time, to be able to present a "current state". This was achieved by scanning a larger sample of frames and collecting organisation input to find suitable data displays and the information need.
3.3.2 Method A total of 20 Frame A's were used for study 2. On each frame, four different welds were chosen, see Figure 18. Each weld was laser scanned on both the right and left side, resulting in a total of eight welds on each frame. On each weld, five geometrical weld parameters were investigated but could not be revealed due to classified information.
Figure 18: Scanned welds on the front frame.
Along with data collection, the generation of ideas on how to display the data was started. The scanning equipment software was used together with MiniTab to create different data displays. Some suggestions on how to present an overview of variation were also prepared. The ideas were then to be discussed during semi-structured interviews with the organisation. Employees on different organisation levels and of different interests were interviewed to obtain a broad view on the subject. Figure 19 shows an organisation chart with functions and stakeholders involved in welding. The blue boxes represent organisation levels that have been part of interviews.

26
Figure 19: Organisation chart including functions involved in welding.
3.3.3 Result and analysis During Study 2, a large amount of data from several welds was collected to guarantee a more than adequate database. This was necessary in order to e.g. compare welds and make sure that important information was not missed. In the end, all of the gathered data was not necessary for analysis. To get a more organized view on the different levels of variation to be considered, a "variation tree" was visualised, see Figure 20. This view was used throughout the data analysis. Three different displays were created to present variation on Frame A. Along with these, ideas on how to visualize variation without diagrams was also generated.
Figure 20: Tree showing the different levels of variation.

27
Control charts Control charts including control limits and tolerance limits were used to present variation within one weld length, variation between same weld ID over time and variation between different welds on the same frame. Figure 21 and 22 shows these displays for parameter A on weld 1. The control chart is built up from a 12 cm measurement, resulting in a couple of hundred data points per measurement. The control limits are calculated using three standard deviations and the tolerance limit is according to the standard. From Figure 22, one can conclude that parameter A seems fairly unchanging except for two peaks falling outside the control limits. Each colour represents one frame. The mean value lies about 20% above the tolerance limit, revealing that the safety margin might be too large.
Figure 21: Variation of parameter A within one weld length.
Figure 22: Variation of parameter A over time.
The control chart was also used to compare welds within a frame. Figure 23 shows parameter A on weld 1 on the right and left side of the frame. It reveals that the right side lies a bit lower than the left side. However, both sides are well above the tolerance limit so in this case the difference has limited importance.

28
Figure 23: Comparison between left and right side for parameter A.
Histograms The next displays were created using histograms. This view was used to present all levels of variation in the tree. The data points with the same value are stacked together, creating bars. In the histograms, features like distribution curves, control limits and tolerance limits can also be included. Figure 24 and 25 shows variation within one weld length for parameter A and C on weld 1. Figure 26 and 27 shows variation over time for parameter A and C including normal distribution curve and tolerance limit. Figure 26 show, as in the control charts, the large distance between LTL and LCL. Along with that, parameter A follows the normal distribution curve well, unlike parameter C that seems to consist of two peaks and distributions, see Figure 27. For parameter C, LTL falls within the control limits and there are some data points that fall below LTL. When comparing parameter A and C, it can be seen that the variation is much larger for parameter C, meaning that it is less predictable than parameter A.

29
Figure 24: Variation of parameter A within one weld length.
Figure 25: Variation of parameter C within one weld length.

30
Figure 26: Variation of parameter A over time.
Figure 27: Variation of parameter C over time.
The histogram view was also used to present variation between different weld ID’s on the same part (within frame variation over time). As an example, a comparison was made between corresponding welds on the right and the left side of a frame.

31
Figure 28 and 29 show different histogram displays of parameter A on weld 1 (same comparison as in Figure 23).
Figure 28: Comparison between left and right side (within frame variation) with all samples
in separate panels.
Figure 29: Comparison between left and right side (within frame variation) with all samples
in the same panel, including mean value lines and difference in variability.

32
Process capability charts To present the process capability for different weld parameters a capability bar chart was created, using the Cpk-index for one-sided specification limits. Figure 30 shows the capability for parameter A-E on weld 1 over time. Parameter A, D and E stand out next to parameter B and C that have significantly lower Cpk-values, lower than 1.33 that is required for a capable process.
Figure 30: Process capability chart for parameter A-E on weld 1R.
Visualisation The previously mentioned displays are all diagrams, which requires some time to process and understand. There could be a need for a display which is quick and easy to survey and that does not contain numbers, since they might not be important in all cases. Such a display could be useful to get an overview or to show the result of calculations or decisions made by a computer. Figure 31 shows a cross section view of a fillet weld, with highlighted critical and over-processed areas as an example. Visualisation tools can be used both in the design process to give context to measurement results but also in production.

33
Figure 31: Suggestion on how to present variation or a current state in an image.
Interviews One observation that was made during interviews and dialogues during Study 1 was that all functions do not seek the same information and does not have the same knowledge. Therefore, further interviews were required to find out what is interesting, what opportunities exist and what are the problems. To revise and develop the data displays for different needs, they were shown to four employees with different roles in the organisation. The first structured questions regarded whether the displays were easy or difficult to understand, if something was missing and which display is the most appropriate as the primary one. All interviewees agreed that the histogram display was simple and perspicuous. The director and team leader preferred the histogram as a first overview and the control chart as a further, deeper view. The weld coordinator thought the histogram was more understandable after viewing the control chart, because the control chart gave understanding of how the measurements had been made. The director, manager and weld coordinator were familiar with control charts and control limits, unlike the team leader that was not. However, they all found them useful and comprehensible when studying variation along the weld since the data points are in order and not clumped together as in the histogram. The team leader did not have much interest in the process capability chart. The weld coordinator and manager found it more interesting, but the director was especially curious. Following are some general feedback on the displays and suggestions on how to improve them:
§ Include tolerance limits in all displays so that there is something to relate the result to. Sometimes when tolerance limits are excluded the scale becomes too fine. Later, when comparing samples or studying the variation range, the display can be misleading. For example, when comparing Figure 28 with Figure 29, the tolerance limit sets context to the result, making it easier to decide whether the difference between sides is significant or not.

34
§ Include an explaining figure of the parameter next to the data display to clarify what has been measured, similar to Figure 4.
§ Flip the histogram 90 degrees and place next to the control chart. That way,
the reader can really understand how the two displays are related and instantly connect stacks of data points in the histogram to the actual measurement path in the control chart.
§ Include a line in the capability chart representing an "ok" Cpk-value to aim
for, determined from the best weld that can be produced. § Not everyone in the organisation wants to or is used to look at diagrams. So,
find ways to present the result without diagrams. The cross section (Figure 31) or 3D-view could be useful to get a feeling of the variation on the actual product.
Table 1 and 2 show the responses related to the initial research questions. Table 2: Interviewee responses on question 1 Interviewee What is the current state in the welding production? How
should a current state be described?
Team leader welding
Difficult question. The current state is better than five years ago. Straight weld passes are of good quality but bent passes are more difficult and show deviations more often. The existence of over-processing is known, but welders are more concerned to ensure quality than to not over-process. The current state can be described roughly, but not with data.
Weld
coordinator
The weld toe radius is the most difficult parameter to produce according to the specification. The current state is a matter of robot programming. To present a current state, several welds with the same drawing specification could be measured. Then, the "worst" and the "best" result can be presented to be able to customize the robot program accordingly. All welds with e.g. throat size a6 are welded with the same program. The problem is that the conditions vary depending on the design solution, the plates, material etc. If the conditions are not optimal, a large gap can occur which needs to be compensated for. The margin added will also be added to welds with optimal conditions, leading to over-processing. If the welding result of different conditions is known, two programs could be made. One that welds an a6 with no extra material and one that includes margins. To visualize the current state, a 3D view with welds of different colours could be used. For example, green could mean that the weld quality is good and variation is small. Blue could indicate a significant amount of over-processing, showing possible areas where the cost can be reduced. Red welds should reveal areas where the requirements are not fulfilled or where variation is large.

35
Manager fabrication
engineering
The current state is very difficult to describe and there is a large uncertainty in it. It involves everything in the process; fulfilling requirements, cost, training, controlling and so on. Worth noting is that when there is disorder or negligence in the workshop, that contributes to the incoming variation at the robot station. More training, education and follow-up is needed to get better. The variation in incoming material is also a problem in periods, so a wish is to know more about every process step and get better. Following instructions is important to eliminate as much of the operator variation as possible.
Director manufacturing
engineering
The weld toe radius is the largest problem quality-wise. A possible way to describe the current state is to find out how far from ideal state that is, regarding both quality and productivity. "How good can we be?" is an important question. Cost of poor quality and speed loss are the big contributions to the total cost of variation. When the ideal state is known, it can be compared to the current state, indicating how good the process is with respect to different factors.
Table 3: Interviewee responses on question 2 Interviewee How should the mapping method be used to obtain valuable
information?
Team leader welding
The measurements should be made after robot welding. The information is the most useful to robot programmers, which have the time to do an investigation and then change the settings to see if the result is better. The operators at the final welding station are under time pressure and often work after experience and intuition so it is better to investigate the real origin of variation and defects.
Weld coordinator
The information is the most useful to robot programmers, therefore the measurements should be done after robot welding, prior to final welding. The method should be used to find out what variation can be expected in a process with a certain design solution and certain geometric circumstances. The variation can then be compared to the tolerance limit. In a successful study, the link between the result and the welding conditions should be identified.
Manager fabrication
engineering
The information is already very valuable as it is, more employees should take part of it. The general method to capture variation could be useful to ensure that the tack welding is according to the specification, or that the incoming cast material is according to specification. Defects should be detected early in the process so that they are not propagated. Laser scanning is wanted in the future and the ideal set-up would be to place it on a robot arm. The scanning needs to be fast and deliver a signal e.g. in the form "green - ok" or "red - not ok". The scanning can be used both prior

36
to welding to control welding conditions and after welding to control result.
Director manufacturing
engineering
The method should be used to enable proactive actions to fight variation, starting with the most severe variation. It can also be used to find a couple of welds with good result and then find what conditions were significant with those welds. One idea for the future is to measure the conditions before robot welding, creating a "live-WPS". In the future, decision making on both operator and management level should be eliminated, by letting the computer handle all the data and adjust the process.
Additional displays The interviews and discussions led to two new suggestions on how to present variation and a current state. The weld coordinator underlined that the current state is a matter of how well the robots are performing. Robot programs should be optimized according to the welding conditions and the first step to achieve that could be to find the "best" and the "worst" result of welds with the same specifications. Figure 32 shows the difference between parameter A on two welds on the same frame that both have the same drawing designation. The histogram reveals that the two welds differ in both average value and variability. Weld 1R has little variation and lies well above the target while weld 3R varies a lot and does not always fall above LTL.
Figure 32: Comparison of parameter A on weld 1R and 3R.

37
After a discussion with a robot programmer and the manager it was concluded that the robot program was very similar for both welds, and that the difference is a result of incoming variation in gap size and differences in plate thicknesses. With this information, the robot programmer has evidence to support adjustments in the programs to make weld 3R better and 1R less over-processed. The weld coordinator and manager both stressed the need for quick and simple displays so use in production. After discussions, the cross section-view concept was adapted to a 3D-image of the product, see Figure 33. The 3D-image can show a product and its general result after robot welding, suitable when implementing scanning in the production to support fast decision-making. The following colours could guide the welders in the final weld station:
§ Green welds: "Ok - do nothing" § Blue welds: "Excessive dimension - look into decreasing welding" § Red welds: "Underpassed dimension - repair"
Figure 33: Example of in-production view showing OK, over-processed and critical areas on
the product.
3.3.4 Findings § There was awareness of variation but very limited knowledge regarding to
what extent. No one could present numbers or concrete information when asked about the current state. Cost and quality did not seem equally important to everyone.
§ The exact numbers and diagrams became reasons for internal discussions. For example, the distribution of Parameter A (Figure 26) might not be moved all the way down to the tolerance limit, but maybe some distance closer by decreasing safety margins.

38
§ The scanning of welds gave useful information on all organisation levels and was surprising in some cases. Capability indices were not interesting on operator level but seemed of greater importance further up in the organisation.
§ The interviewees did not agree on what display should be used as the primary display. However, they shared the idea that the control chart and histogram complemented each other, which is a sign that they both are needed.
§ All interviewees were positive to displaying the result in 3D-images. § The method should be used as a first step to find out what variation can be
expected under certain welding conditions. When variation is known, the process can be adjusted proactively instead of reactively.
§ Using the method to map variation can help the company come one step closer to a completely computer controlled process in the future.
Chapter 4 - Result
In this chapter, a method to map and analyse variation in welding will be presented. The method can be used as a tool to create a basis for decisions to different stakeholders. The findings presented in this chapter are based on the case at Volvo CE, but are intended to be valuable in other welding production as well. The general method will be described using examples and findings from study 2 in chapter 3. Due to classified information, weld properties are named parameter A, B, C and so on.
4.1 Variation mapping method In the short-term, the mapping method can be used for local improvement work of the process and to give more understanding of variation and its effect on quality, cost and productivity. The phases of the mapping method can be summarized in a flow chart, see Figure 34. The method consists of seven steps where the focus of explanation will lay on step one, two, six and seven.
Figure 34: Flow chart of the mapping method.
DeGine objective
Select products and welds
Plan and prepare
experiment Collect data
Condense and analyse
data Display data
Draw conclusions

39
4.1.1 Define objective The first step is to define the objective of the study. A well-defined objective will help set research delimitations to scale down the project, enabling time and cost savings. Different objectives will most probably result in different products and parameters to be investigated. In this thesis, three objectives have been considered, where the stakeholder is some company involved with welding production. The company might be interested in:
§ Decreasing the manufacturing cost § Increasing the product quality § Knowledge about the current state in the welding production
All three objectives are part of the main goal, which is to be able to make production improvements. The objectives will be further described, along with justification and demonstration that the method can be used with different perspectives. One also needs to decide the process to be studied. Should the measurements be made on a finished product or e.g. after robot welding in the middle of the process? This decision is often a matter of who wants the information (e.g. welder, programmer or manager). Decreasing cost Less over-processing leading to a decreased cost is a gain for both the manufacturer and the customer. Increased productivity, shorter lead times and savings of filler material are some factors decreasing the manufacturing cost, which is beneficial for the manufacturer. Less welding leading to weight savings, decreased repair and less scrapping are some important customer gains. If the goal is to save money, the focus should lay on decreasing the machine time by investigating:
§ Welds with excessive dimensions (particularly the throat size) § Defects leading to extra welding (e.g. underpassed weld toe radius or leg
deviation) Over-processing includes excessive but intended welding early in the process but also corrective welding to repair defects. In the Volvo CE case, the most important excessive dimension to consider for a fillet weld was the throat size. Some welds were found where the throat size was 20% larger than required, corresponding to a weight increase by 48 %. Weight and welding cost are roughly proportional meaning that the cost also increased by 48 %. A reduction in safety-margins in that area could lead to a significant decrease in welding cost. An area with an underpassed weld toe radius is an example of a defect where an extra weld is added. The extra weld means more material and more time invested in the product. In an interview with a welder it was understood that welders work by experience and intuition. If a weld has reoccurring defects in the same spot, it is likely that the welder decides to add an extra weld on all future welds as well, even if it is not necessary. Another way to correct weld toes was using TIG or grinding to even out the transition. These

40
methods do not add extra material to the product but the production lead time increases which is also costly. Increasing quality The quality perspective is a key factor for both manufacturer and customer. Sufficient quality means less time spent on adjusting and repairing products, which in the end is a matter of cost. From a customer perspective, the quality level will affect the fatigue life of the product. If the main goal of the study is to increase product quality, the investigation should focus on mapping:
§ Critical weld properties that highly affect the life of the product, such as weld toe radius and undercuts.
§ Properties that are known to often fall below the tolerance limit. Mapping a current state in production Mapping the current state can be useful when the status feels uncertain and the company wants to obtain an overview of the process performance. An investigation of both over-processing and fulfilling requirements should be done to find out what variation can be expected with the current process. When the mapping is done, it is easier to motivate what improvement actions should be made first. For example, if the mapping shows that the majority of the products fulfil the requirements, investments can be made to decrease the production cost. On the other hand, if there are a lot of deviations, increasing the quality is more important. In the Volvo CE case, several sources of data confirmed that the quality of the weld toe radius needs to be a priority.
4.1.2 Select products and welds When deciding what welds to investigate, several factors need to be considered. The objective (cost, quality etc.) will influence what welds should be prioritized. If the goal is to increase quality, critical (high requirement) welds and welds where defects are common should be investigated first. Here, organisation input can be very valuable. When trying to decrease the manufacturing cost, high production volume products and large welds should be investigated to make a larger impact. Other factors to consider are purely practical, like what welds are assessable with the equipment and where in the process to measure to avoid disturbance of lead times while still getting relevant output (e.g. assessing the weld toe radius). The purpose also influences where in the process the evaluation should be done. For example, if the measurements are made on a finished product, the total variation will be obtained and the question "How is the total process performing?" can be answered. Another purpose could be to find out how the robot welding is performing, then the measurements should be made directly after that operation. In the Volvo CE case, the ideal place to scan information-wise was after robot welding. However, the weld toe radius was important and could not be assessed at that station due to slag. Removing slag, plus doing a 15-minute scan would disturb the process. Disturbing the lead-time costs money, therefore such a study would have to be properly motivated from

41
an economic perspective. The decision was made to scan blasted frames at the end of the process, resulting in information about the total variation. In the Volvo CE case, a product from a large production-line was chosen. Four welds were chosen including welds that are both easy and difficult to produce.
4.1.3 Plan and prepare experiment Prior to data collection the experiment must be planned and designed. The sample size should be set so that the control limits are statistically stable. The investigator should be trained to use the equipment, to minimize errors. Operators and other involved personnel must be informed on what will be done and when. In many cases the operators can share valuable information on e.g. common defects, problematic products, problematic production lines etc. Gathering such information helps to scale down and focus the study. At Volvo CE, the researcher did testing to get practice, used discussions and observations to pick products and welds and made sure to follow safety regulations.
4.1.4 Collect data The next step is data collection. The collection can consist of quantitative data using equipment, existing data or technical documents and qualitative data from interviews, questionnaires or observations. The type of equipment depends on the geometry that is being investigated. Laser scanning offers high accuracy and can serve several different applications but might not be possible in all cases. However, the methodology of the method is general so other equipment works as well. Existing data and technical documents will be useful in almost all cases. Operator input has also been proven to add value in most cases. The amount of qualitative data to be gathered will depend on the researchers role and the size of the study.
4.1.5 Condense and analyse data After data collection, some data condensation might be necessary before moving on to analysis. Only relevant information should be analysed. For example, when using the laser scanning equipment manually, the start and stop of the movement results in "flat" measurement paths in the beginning and in the end. All welds had to be cropped prior to analysis to remove the data points where the scanner was still. The findings from interviews might also be organized. In the Volvo CE case, a large amount of data from several welds was collected to guarantee a more than adequate database. This was necessary in order to e.g. compare welds and make sure that important information was not missed. In the end, all of the gathered data was not necessary for analysis. To extract relevant information from a set of data, an analysis method to interpret it is required. Analyse the data in a suitable program, calculate control limits, capability etc. The next step is to present the data in clear displays that will serve the purpose and give useful information to everyone involved.

42
4.1.6 Display data The type of display will depend on the objective of the study and who wants the information. The general insight obtained from the Volvo CE case regarding display preference in the different organisation levels can be viewed in Figure 35. The 3D-view seemed handy in all organisation levels while the interest in other displays varied.
Figure 35: General preference of display in the organisation.
Following are descriptions and examples of useful displays for different variation and organisation levels. Within weld variation Within weld variation is the most detailed view in the variation tree. The information is probably the most relevant for employees in the actual workshop such as welders or robot programmers. If within weld variation is of interest, the viewer probably benefits from seeing the measurement path in a control chart rather than just the data points in a histogram. Control limits can be included or excluded in the control chart depending on the viewer and if the purpose is to control quality or study stability and variation. Tolerances on the other hand, should always be included. Figure 36 shows a made up control chart of some parameter. From the graph one can conclude that the process is not stable since data falls outside the control limits. Also, the tolerance limit lies within the control limits, which means that the expected variation is wider than the tolerance allows, or that the process is inaccurate (variation width is "ok" but the process does not hit the target value).

43
Figure 36: Example of instability and consequence of tolerance limits within the control
limits. Within part variation Within part variation means variation between different welds on the same part, e.g. right vs. left side or welds with the same specification but in different spots. Presenting this type of variation can be done with both control charts and histograms, and usually they complement each other. Since these comparisons are made over time, the control chart can look cluttered if the e.g. 20 paths are laid parallel. Placing the paths in series and then compare welds gives a clearer view. In the Volvo CE case, two histogram comparison views were used. For comparisons with little difference (featuring tolerances, mean values and variability), the two-panel diagram was used, see Figure 29. For comparisons with more significant differences, the more compact one-panel view seen in Figure 32 is more suitable. Between weld variation Studying variation over time, using multiple samples is the best way to find out how the process is behaving. This can be displayed in many different ways. Control charts are useful to study stability while histograms can give a better and simpler overview, see examples in Figure 22 and 26. The two displays often complement each other, the viewer might look at the histogram first and then at the measurement path in the control chart. Since there were shared opinions in the Volvo CE case regarding what display should be the primary one, another suggestion came up. A third way to present the data is to combine the two, making it even clearer how they are linked, see example in Figure 37. This display should be clear and give useful information independent of organisation level and knowledge. Common for all displays is that they should include an explaining figure.

44
Figure 37: Control chart and histogram placed next to each other, enabling deeper
understanding of how the histogram is built up. Further up in the organisation where process capability is of interest, the Cpk-chart shown in Figure 30 can be convenient. This should include a line of a Cpk-value to aim for, representing the "best" value that can be achieved in the process. The diagram shows the status for all parameters and can support decision-making. It is a fast way to know what is a problem and what is not, in just one display. Visualisation To present variation without using diagrams, 2D- and 3D-images can be used. Variation can be presented with a cross section view of the weld (Figure 31), with coloured areas showing critical areas, ok areas and over-processed areas. The same concept can be adapted to a 3D-view (Figure 33). The two concepts can also be used together, using the 3D-image as the first view. A specific weld that is critical (marked with red) can be clicked to show a 2D-cross section. The 2D-image would reveal more details of what requirement/requirements are not fulfilled, guiding the final welders where to adjust. Figure 34 shows another way to use a product image, suitable in e.g. the design department. Different colours can represent variability, e.g. green indicating little variation and stability and red indicating large variation and instability. This view is more specific and analytical, showing the variation and stability for a parameter within a product. It is more appropriate when doing improvement work, analysing parameters separately to visualise what variation outcome can be expected with the current process, design solution etc.

45
Figure 38: View of variability and stability within a product for a specific parameter.
4.1.7 Draw conclusions When the data is analysed and presented, discussion and conclusions follow. The method to capture variation gives increased knowledge about the process and helps guide to the right improvement actions. Using the Volvo CE case as a demonstration, the three main findings and improvement actions that can be taken can be seen in Table 4. The table also includes what knowledge was added by using the method compared to before. Table 4: Main findings, added knowledge and example of improvement actions
Finding Added knowledge Action
Parameter A on weld 1 measured ~120 % of target
value
The exact location and amount of over-
processing instead of just the existence of it.
Look into decreasing safety-margins in the
addressed areas without affecting quality.
Parameter C showed large variation and deviations
from tolerance limit on all welds
Variability of parameter C, location and amount of
defects.
Investigate the source of variation by changing the
process and evaluating again.
Welds with the same drawing designation differ significantly when welded
The exact influence of different design solution,
plate thickness and material on the welding
result of similar program.
Investigate the possibility to adjust robot programs
according to welding conditions. E.g. programs for ideal conditions and
non-ideal.

46
Chapter 5 - Discussion
In this chapter, the empirical studies and the result of the thesis will be discussed. Later, the contribution of the thesis to industry will be described along with the generalizability of the results. Finally, suggestions on future research will be presented.
5.1 Results discussion The interviews confirmed one of the researcher's hypotheses, which was that different levels in the organisation have different interests. At workshop level, assuring quality is the number one priority. Further up, cost play a greater role, but with quality in mind. Therefore, the method to capture variation should serve all different interests. The three objectives defined in the method were decreasing cost, increasing quality and defining a current state, which covers the interests that were discussed during interviews. Common for all three objectives is that they are all part of production improvement. An observation that was made during the study was that collecting data is relatively simple with existing modern equipment. Analysing and displaying it is more difficult. Therefore, the method placed great emphasis on the data analysis and display to make it useful on all different interests and organisation levels. The presented displays were developed together with the interviewees. Some of the researcher's ideas were confirmed (e.g. the cross-section view) and some were complemented and further developed (e.g. the combined control chart and histogram). The result is four main types of displays that are considered to cover the need on all organisation levels. An observation that was quite surprising was the lack of knowledge in the organisation about the process performance and variation. In a parallel thesis project, investigating the information flow, similar results were found [31,32]. In the study it was found that there is a general lack of knowledge about the process performance and that decisions are based on experience instead of data analysis. This phenomenon was also observed in Study 2, where welders repair by experience. The parallel thesis also addressed over-processing and safety margins as a problem, as well as short term problem solving and fragmented information. The method used to capture variation resulted in new knowledge about the process that was appreciated by different stakeholders. The existence of over-processing and certain quality issues was known, but only roughly. Exact facts as a basis for decision-making and discussions between different stakeholders are necessary to be able to choose the right improvement actions.

47
5.2 Empirical studies discussion When comparing the currently used handheld tools to laser scanning as an evaluation method, it was clear that the laser offers more accurate measurements with higher confidence. However, all measurement methods come with errors. In the experimental study, the equipment was used as carefully as possible to reduce errors but there are still a few factors that could have affected the results. There was no way to assure that the laser beam was always perpendicular to the weld direction and that the rail was parallel to the weld and plate which are possible sources of error. Further, the scanner was moved manually, resulting in an uneven velocity and non-accurate starts and stops, being the reason for the varying amount of data points for each scan. This problem can easily be solved when implementing scanning in an automated process. The researcher's role as a student affected the way that the thesis had to be carried out, especially time-wise. A lot of time was used for the introduction, theoretical framework and Study 1, which was necessary to obtain understanding and insight into the process. As a consequence, the time frame for Study 2 was limited. A wish would be to investigate another product to evaluate reliability and validity. Even though only one extensive study was conducted, it was considered enough to define and demonstrate the different steps of the mapping method described in Chapter 4. A lot of the features from the research method discussed in section 2.5 were used throughout the thesis. The analysis steps (condensation, data display and conclusion drawing/verification) were used as a cyclic process alongside with the interviews to optimize the data displays. The use of qualitative data as a complement to the quantitative data had a large impact on the final result since the organisation input proved to be very advantageous. As a student, unfamiliar with the process and the company, the organisation input helped to gather specific information used in the method but also gave a broad view on the topic as a whole. The choice of semi-structured interviews instead of structured interviews or questionnaires was successful because it generated the answers needed but also allowed for discussion on the topic, which helped to gain insight and understanding. A thinkable weakness in the qualitative part of the study is the number of interviewees. Extra interviews with other roles (e.g. robot programmer) could have given more details about the information need or constructive criticism on the displays.
5.3 Industrial significance The majority of the interviewed employees expressed that the process should be computer controlled in the future. A monitoring system controlling the weld quality could be the key to optimizing the process by decreasing the cost of poor quality [33]. Monitoring enables the company to move some of the decision making from the operators to the computer, resulting in decreased variation since it has been clear that the human factor contributes to the total variation [5]. An example of an in-process control system is the lambda sensor loop in a car. The lambda sensor is a device

48
placed in the exhaust system and that measures the amount of oxygen in the exhaust gases. In short, the sensor detects the ratio between air and fuel and generates a voltage. A computer receives the signal and corrects the fuel injector output to bring the ratio closer to ideal. This type of control makes the engine as efficient as possible and reduces emissions [34]. In the case of welding, monitoring by scanning is possible both before and after robot welding. Scanning before the robot welding to control welding conditions would create a "live-WPS", eliminating the need for a robot programmer to compensate for varying gap size or other factors affecting the welding. Scanning after welding would be a way to control the quality by signaling "OK" or "not OK". When aiming for a monitored process with proactive control, the changes need to be made one step at a time. Redirecting from reactive inspection to proactive control requires understanding and knowledge about the process as a first step [7]. The method to map variation could be that first step on the way to a computer-controlled process, see Figure 39. In the short-term, the method can be used for local improvement work, improving the process and increasing the knowledge. As the process is gradually improved and the company gains competence, monitoring may become more applicable. In the Volvo CE case, the analysis was a way to get people to understand and prioritize the right improvement actions. Finding out a current state involves finding out how far from ideal the process is, regarding both quality and productivity. If the ratio between value added and cost of poor quality (adjustments, control, wait) is known, it is easier to decide what should be done to proactively improve the process. Worth noting is that it can be cheaper to adjust than to invest in quality. Therefore, investments need to be financially justified using data. In a study about implementing in-process monitoring in welding industry it was shown that the barriers to monitoring were not only technical. Soft issues like lack of competence, a common understanding and financial effects were equally important [33]. This is yet another proof that understanding and knowledge is necessary before introducing monitoring.
Figure 39: Steps towards a computer controlled process.

49
5.4 Generalizability As mentioned in section 2.5.2, case study findings can be considered as theoretically or analytically generalizable. Development of concepts or generation of theories are findings can be valuable in other similar settings. Since variation is present all real world data it is important to gain knowledge about how it is affecting a process. Knowledge about variation enables more efficient problem solving and use of resources. In this thesis, the method was used to investigate the outer geometry of welds. However, the methodology is believed to be applicable to other settings as well. For example, in the case of the varying result of welds with same drawing designation, the incoming gap size was believed to be a cause. The variation in incoming gap size between plates has earlier been proven to affect the resulting throat size [35]. The mapping method and possibly also the laser could be used to investigate this and present gap sizes and the welding result for different welds. The new knowledge can then be used to adjust robot programs according to gap data instead of adding safety margins to all welds. The strength of the mapping method is that it is very general. It can be used straight off when studying other plants with similar structures and geometries. The methodology can be used for other applications as well but perhaps with different equipment. The fact that the method is general is both its strength and its weakness. It is a weakness in the sense that it might need to be modified and concretized to fit different applications, which can be a barrier in the implementation phase.
5.5 Future research Following are some suggestions on future research on the topic:
§ How to make big data manageable on the journey towards a computer controlled process.
§ How to visualize variation in production using images. § How to solve soft issues like competence, financial aspects and a common
understanding concerning variation and its effect on quality and productivity.

50
Chapter 6 - Conclusions
A method to map variation in welding was developed with the aim to be able to guide towards the right improvement actions. The method can be used both from an economical and quality perspective, and display the data depending on the need. The knowledge about variation can be used to prioritize improvement actions. RQ 1: Mapping variation: How can variation in welding production be studied and mapped? Answer: Variation in welding can be studied using laser scanning and the mapping method to serve different objectives. With modern technology, weld properties can be scanned with high accuracy and translated into different diagrams and images. This makes it easy to share information within the organisation and create a basis for troubleshooting and production improvements. In the future, scanning can be implemented in the process, and directly adjusting the welding procedure. RQ 2: Data analysis: How should the data be analysed and presented? Answer: The data can be analysed and presented depending on the information receiver needs using three different charts and two visualization tools. Control charts, and histograms are useful tools to present variation in a detailed way, e.g. a welder or robot programmer. Process capability charts along with images serve to give an overview of variation, enabling simple information sharing within the company. Cross-sections and 3D-views are useful both in production and further up in the organisation. The result from the study at Volvo CE contributed with new knowledge regarding variability, quality level and opportunity to reduce production cost and product weight. The main result in the form of a mapping method contributed with tools to display variation and examples on how they can be used. As a summary, understanding of variation enables:
• Cost reductions from extra welding, unnecessary machine time etc. • Easier prioritization of improvement actions in production. • A fact-based dialogue between different parties, e.g. between the purchasing
and design departments.

51
Acknowledgement
This master thesis was carried out at Volvo Construction Equipment in Arvika during 20 weeks in the spring of 2019. I would like to specially thank my supervisor Anna Ericson Öberg at Volvo CE for the valuable support, input and enthusiasm. I would also like to express my gratitude towards Per Magnusson for contributing in discussions and generating ideas. Also, thank you to Peter, Fredrik, Daniel, Mattias, Tony, Göran and Andreas for the time and help during interviews and data collection. I would also like to show my appreciation to Thomas Stenberg and Martin Engman at Winteria for the software education and help, and Christer Burman at Karlstad University for supervising during this thesis. Finally, I want to thank my dad Erik Månsson, and classmate Jim Andersson for your continuous support and input during the spring.

52
References
[1] Webber L, Wallace M. Quality Control for Dummies [Internet]. 1st ed. Chichester, UK: John Wiley and Sons Ltd; 2007. [2] ISIXSIGMA. Quality Assurance. ISIXSIGMA. Cited: 2019-04-08. Available at: https://www.isixsigma.com/dictionary/quality-assurance/ [2] Volvo CE. This is Volvo Construction Equipment. Volvo CE Global. Cited: 2019-01-29. Available at: https://www.volvoce.com/global/en/this-is-volvo-ce/ [4] Volvo CE. Location: Arvika. Volvo CE Global. Cited: 2019-01-29. Available at: https://www.volvoce.com/global/en/this-is-volvo-ce/corporate-information/our-locations/arvika/ [5] Ericson Öberg A, Åstrand E. Improved productivity by reduced variation in heavy welding industry. Gothenburg: Chalmers University of Technology; 2016 [6] O’Brien A. Welding Handbook [Internet]. 9th ed. Miami, Florida: American Welding Society; 2004. [7] Ericson Öberg A. Predictability - an enabler of weld production development. Gothenburg: Chalmers University of Technology; 2016. [8] Svenska Institutet för Standarder. Vad är en standard. Svenska Institutet för Standarder. Cited: 2019-02-04. Available at: https://www.sis.se/standarder/vad-ar-en-standard/ [9] Volvo Group. STD 181-0004 Fusion welding. Gothenburg, Sweden: Volvo Group; 2016. [10] Volvo Group. STD 181-0001 Welding of metallic material (System A). Gothenburg, Sweden: Volvo Group; 2018. [11] Regello, R. Weld Defects and How to Avoid Them [Internet]. Welders Universe; 2012. Cited: 2019-03-27. Available at: https://www.weldersuniverse.com/weld_defects.pdf [12] Welding answers. The Outrageous cost of poor fit up. Welding Answers. 2017-02-13. Cited: 2019-03-29. Available at: http://weldinganswers.com/the-outrageous-cost-of-poor-fit-up/ [13] Automated Welding Basics. Surface defects that impair welding quality. Keyence. Cited: 2019-02-05. Available at: https://www.keyence.com/ss/products/measure/welding/trouble/surface.jsp

53
[14] Jonsson B. Improving weld class systems in assessing the fatigue life of different welded joint. In Macdonald K. Fracture and Fatigue of Welded Joints and Structures [Internet]. Cambridge, UK: Woodhead Publishing Limited; 2011. p 139-166. [15] Levi E. How to perform tack welding successfully. The fabricator. 2006-04-11. Cited: 2019-02-04. Available at: https://www.thefabricator.com/article/cuttingweldprep/how-to-perform-tack-welding-successfully [16] Vaughan S. Robotic welding. The fabricator. 2005-11-08. Cited: 2019-02-04. https://www.thefabricator.com/article/automationrobotics/robotic-welding [17] Keane T. What is the difference between shot blasting and shot peening? Latem Industries LTD. 2018-01-23. Cited: 2019-03-26. Available at: https://latem.com/blog/difference-between-shot-blasting-shot-peening.htm [18] ISIXSIGMA. Lean Six Sigma Dictionary. ISIXSIGMA. Cited: 2019-02-11. Available at: https://www.isixsigma.com/dictionary/ [19] Ericson Öberg A. The Journey from Standard Change to Implemented Assessment. Gothenburg: Chalmers University of Technology; 2016. [20]Ericson Öberg A, Åstrand E. The Subjective Judgement of Weld Quality and its Effect on Production Cost. Gothenburg: Chalmers University of Technology; 2016 [21] Wheeler D J. Understanding variation. 2nd ed. Knoxville, Tennessee: SPC Press; 2000. [22] Stenbacka N. Svetsekonomi och produktivitet. Stockholm: Svetskommissionen; 2009 [23] Six SIGMA Academy. The Black Belt Memory Jogger. Goal/QPC; 2002. [24] Statistisk processtyrning. Ordlista. SPS. Cited: 2019-02-20. Available at: http://www.statistiskprocesstyrning.se/ordlista.html [25] Montgomery D C. Introduction to Statistical Quality Control [Internet]. 6th ed. USA: John Wiley & Sons; 2009. [26] McNeese B. How Much Data Do I Need to Calculate Control Limits? SPC for excel. 2016-08. Cited: 2019-03-18. Available at: https://www.spcforexcel.com/knowledge/control-chart-basics/how-much-data-do-i-need-calculate-control-limits

54
[27] Creswell J W. Research Design. 4th ed. Sage Publications; 2013. [28] Yin R K. Case Study Research: Design and Methods [Internet]. 2nd ed. Sage Publications; 1994. [29] Williamson K. Research methods for students, academics and professionals. 2nd ed. Wagga Wagga, NSW: Woodhead Publishing Ltd; 2002. [30] Miles M B, Huberman M. Qualitative Data Analysis [Internet]. 3rd ed. Sage Publications; 2013. [31] Glykeria Pantazi, E. Increased productivity by improved information flow in the NPD Process. Gothenburg: Chalmers University of Technology; 2019. [32] Santoni, G. Standardized cross-‐functional communication as a robust design tool. Gothenburg: Chalmers University of Technology; 2019. [33] Ericson Öberg, A. Sikström F. Barriers for industrial implementation of in-process monitoring of weld penetration for quality control. Gothenburg: Chalmers University of Technology; 2016 [34] FPS. What is a lambda sensor? FPS: an alliance automotive group company. Cited: 2010-05-12. Available at: https://fpsdistribution.com/what-is-lambda-sensor/ [35] Ericson Öberg A, Johansson M, Holm E, Hammersberg P, Svensson L-E. The Influence of Correct Transfer of Weld Information on Production Cost. Linköping; 2012.