Queuing in front of locks: recreational skippers' willingness to pay for passing through faster
23
Queuing in front of locks: recreational skippers’ willingness to pay for passing through faster By Jürgen Meyerhoff, Malte Grossmann 018/2007 WORKING PAPER ON MANAGEMENT IN ENVIRONMENTAL PLANNING
Transcript of Queuing in front of locks: recreational skippers' willingness to pay for passing through faster
Queuing in front of locks: recreational skippers’ willingness to pay for passing through faster
By
Jürgen Meyerhoff, Malte Grossmann
018 /2007
WORKING PAPER ON MANAGEMENT IN ENVIRONMENTAL PLANNING

Working Paper on Management in Environmental Planning 18/2007 Arbeitspapiere zum Management in der Umweltplanung 18/2007
Contact: Dr. Jürgen Meyerhoff [email protected]
Institute for Landscape and Environmental Planning Technische Universität Berlin Straße des 17. Juni 145 D- 10623 Berlin
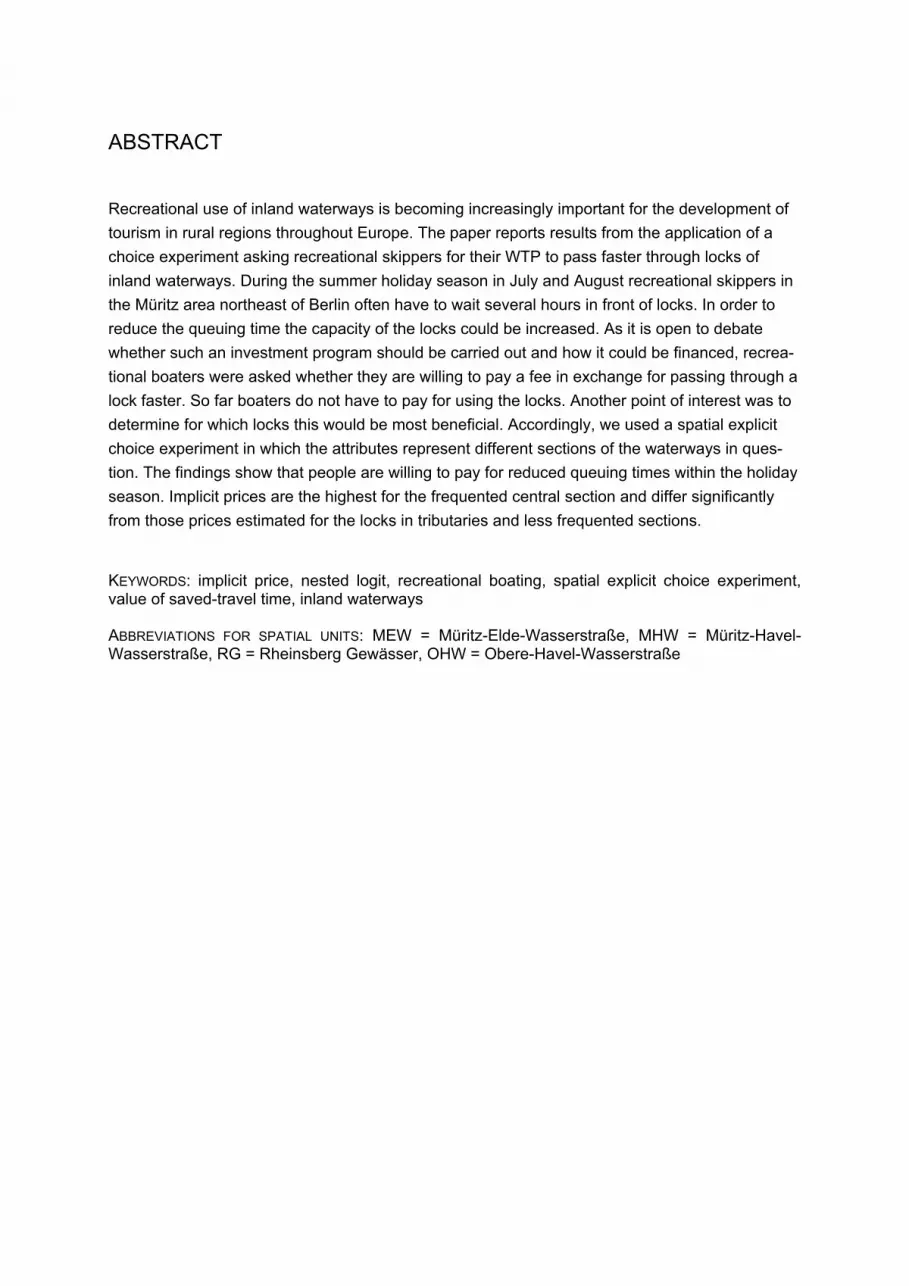
ABSTRACT
Recreational use of inland waterways is becoming increasingly important for the development of tourism in rural regions throughout Europe. The paper reports results from the application of a choice experiment asking recreational skippers for their WTP to pass faster through locks of inland waterways. During the summer holiday season in July and August recreational skippers in the Müritz area northeast of Berlin often have to wait several hours in front of locks. In order to reduce the queuing time the capacity of the locks could be increased. As it is open to debate whether such an investment program should be carried out and how it could be financed, recrea-tional boaters were asked whether they are willing to pay a fee in exchange for passing through a lock faster. So far boaters do not have to pay for using the locks. Another point of interest was to determine for which locks this would be most beneficial. Accordingly, we used a spatial explicit choice experiment in which the attributes represent different sections of the waterways in ques-tion. The findings show that people are willing to pay for reduced queuing times within the holiday season. Implicit prices are the highest for the frequented central section and differ significantly from those prices estimated for the locks in tributaries and less frequented sections. KEYWORDS: implicit price, nested logit, recreational boating, spatial explicit choice experiment, value of saved-travel time, inland waterways ABBREVIATIONS FOR SPATIAL UNITS: MEW = Müritz-Elde-Wasserstraße, MHW = Müritz-Havel-Wasserstraße, RG = Rheinsberg Gewässer, OHW = Obere-Havel-Wasserstraße

1. Introduction
During the summer holiday season in July and August recreational skippers in the Müritz area, northeast of Berlin, often have to wait several hours in front of a lock. Recreational boating has become more and more popular in this region because although not a pristine wilderness, for German standards it offers a certain degree of solitude. Moreover, the condi-tions for recreational boating have improved recently through the redemption of a driving licence for holiday cruisers, for instance.
The main objectives of this paper are twofold. First, we aim at investigating whether recrea-tional skippers experience queuing time as a drawback and, if so, whether they are willing to pay at all to increase the capacity of the locks. In transportation economics many studies are con-cerned with the value of saved travel time (VSTT) showing that people often do have a positive willingness to pay (WTP) for shorter travel times (Small & Winston, 1999). However, these studies mainly focus on time saved while commuting. But people who are on holiday might judge saved travel time, especially on a holiday cruiser, very different. Second, we wanted to determine for which locks reducing queuing time would be a priority from the respondents point of view. There-fore, we used a spatially explicit choice experiment (CE) with site-specific attributes (cf. Horne et al. 2005 for a similar approach). CEs are nowadays often used when the focus is on valuing dif-ferent attributes of a multidimensional environmental change because they can provide informa-tion about the individuals’ willingness to substitute one attribute for another (Stewart & Kahn, 2006). However, in the present case the attributes, i.e., the spatial units, only differ with respect to the sites at which the management actions could take place. The spatial units of the waterway system under investigation are the Müritz-Havel-Wasserstraße (MHW), the Rheinsberg Gewässer (RG), and the Obere-Havel-Wasserstraße (OHW). The levels of the site-specific attributes each time represent the time savings achievable due to enlarged locks. The implicit prices for reduced queuing time were used in order to determine in which spatial units respondents would prefer reduced queuing time. Moreover, respondents were also asked in front of which locks they had to wait longest. Based on this information we intended to calculate lock specific implicit prices. They may indicate at which specific lock reduced queuing time is valued the most.
The paper proceeds as follows. In Section 2 we present some background information about recreational boating in the Müritz region. Section 3 briefly introduces the econometric specification and the implicit price used for policy analysis. Subsequently, Section 4 gives the design and ad-ministration of the survey and Section 5 presents the estimated models and the implicit prices. Finally, Section 6 concludes.
2. Background information
The Lakes Region in the north-eastern Federal German States of Mecklenburg Vorpom-merania and Brandenburg is characterised by a multitude of lakes and natural rivers which
Working Paper on Management in Environmental Planning 18/2007
2
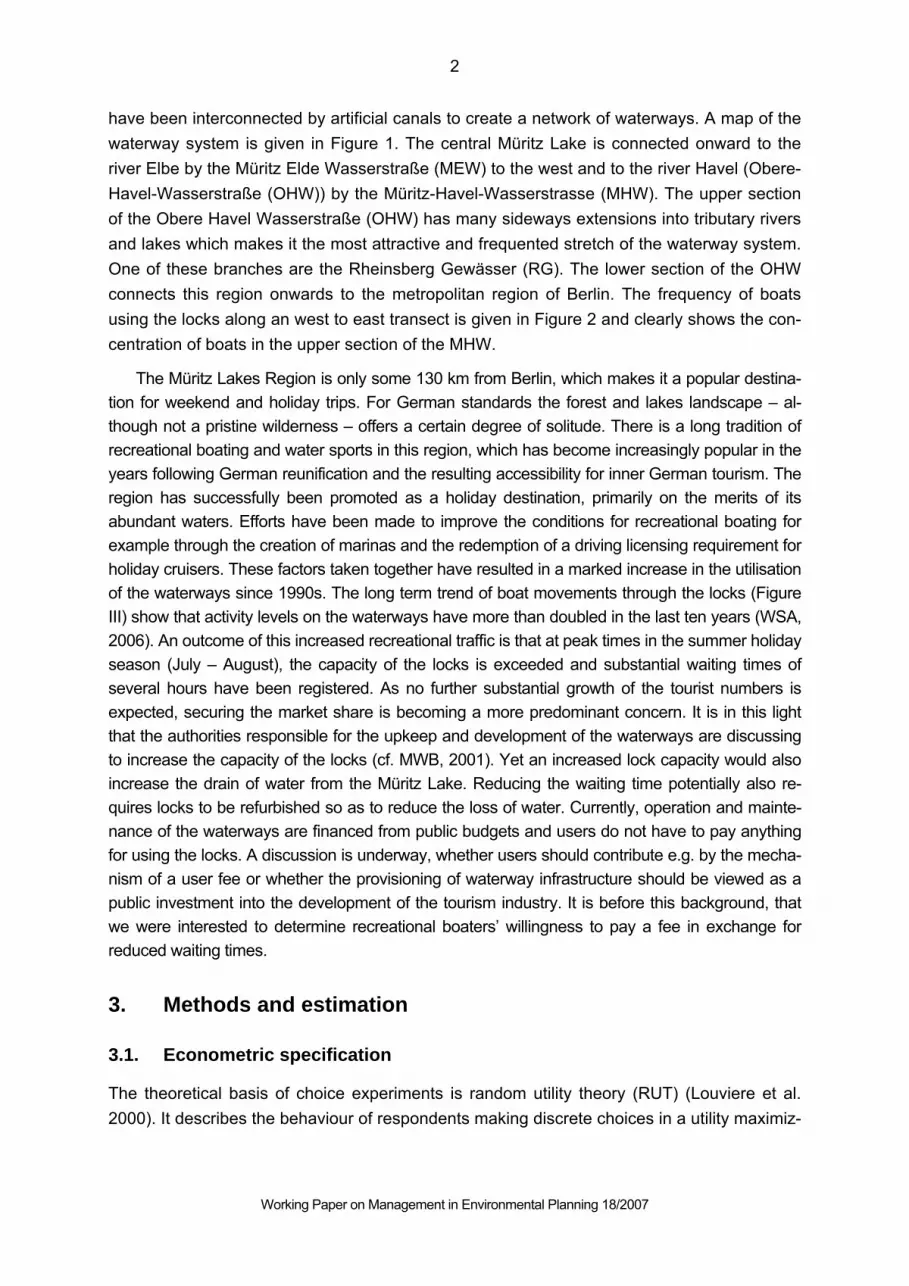
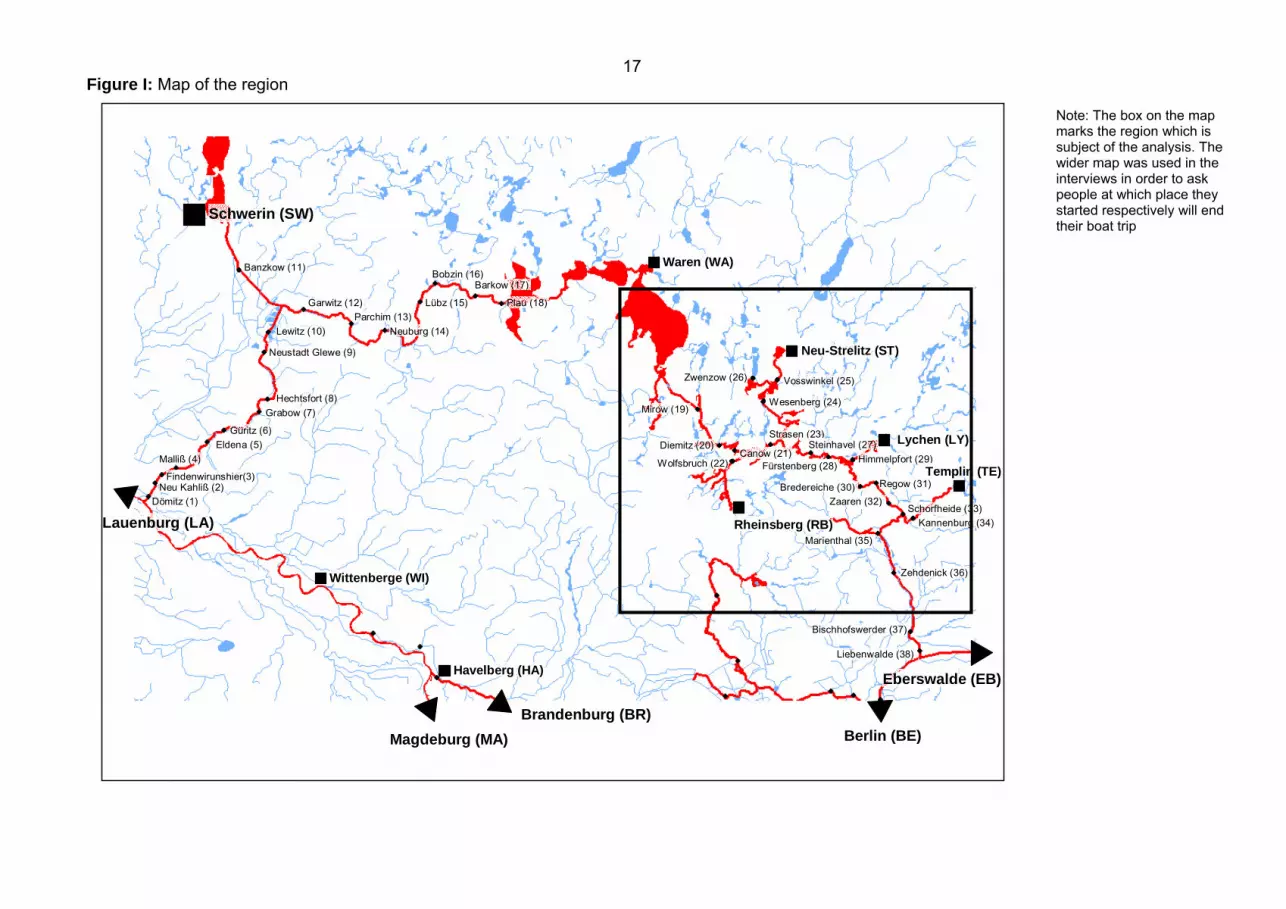
have been interconnected by artificial canals to create a network of waterways. A map of the waterway system is given in Figure 1. The central Müritz Lake is connected onward to the river Elbe by the Müritz Elde Wasserstraße (MEW) to the west and to the river Havel (Obere-Havel-Wasserstraße (OHW)) by the Müritz-Havel-Wasserstrasse (MHW). The upper section of the Obere Havel Wasserstraße (OHW) has many sideways extensions into tributary rivers and lakes which makes it the most attractive and frequented stretch of the waterway system. One of these branches are the Rheinsberg Gewässer (RG). The lower section of the OHW connects this region onwards to the metropolitan region of Berlin. The frequency of boats using the locks along an west to east transect is given in Figure 2 and clearly shows the con-centration of boats in the upper section of the MHW.
The Müritz Lakes Region is only some 130 km from Berlin, which makes it a popular destina-tion for weekend and holiday trips. For German standards the forest and lakes landscape – al-though not a pristine wilderness – offers a certain degree of solitude. There is a long tradition of recreational boating and water sports in this region, which has become increasingly popular in the years following German reunification and the resulting accessibility for inner German tourism. The region has successfully been promoted as a holiday destination, primarily on the merits of its abundant waters. Efforts have been made to improve the conditions for recreational boating for example through the creation of marinas and the redemption of a driving licensing requirement for holiday cruisers. These factors taken together have resulted in a marked increase in the utilisation of the waterways since 1990s. The long term trend of boat movements through the locks (Figure III) show that activity levels on the waterways have more than doubled in the last ten years (WSA, 2006). An outcome of this increased recreational traffic is that at peak times in the summer holiday season (July – August), the capacity of the locks is exceeded and substantial waiting times of several hours have been registered. As no further substantial growth of the tourist numbers is expected, securing the market share is becoming a more predominant concern. It is in this light that the authorities responsible for the upkeep and development of the waterways are discussing to increase the capacity of the locks (cf. MWB, 2001). Yet an increased lock capacity would also increase the drain of water from the Müritz Lake. Reducing the waiting time potentially also re-quires locks to be refurbished so as to reduce the loss of water. Currently, operation and mainte-nance of the waterways are financed from public budgets and users do not have to pay anything for using the locks. A discussion is underway, whether users should contribute e.g. by the mecha-nism of a user fee or whether the provisioning of waterway infrastructure should be viewed as a public investment into the development of the tourism industry. It is before this background, that we were interested to determine recreational boaters’ willingness to pay a fee in exchange for reduced waiting times.
3. Methods and estimation
3.1. Econometric specification
The theoretical basis of choice experiments is random utility theory (RUT) (Louviere et al. 2000). It describes the behaviour of respondents making discrete choices in a utility maximiz-

Working Paper on Management in Environmental Planning 18/2007
3
ing framework. According to RUT, the ith respondent is assumed to obtain utility Uij from the jth alternative in choice set C. Uij is supposed to be a function of both the attributes of the alternatives (Xjk representing the kth attribute value of the jth alternative) and characteristics of the individual, Si. The conditional indirect utility function is comprised of a deterministic component (Vij) and a random error component (εij):
.),( ijiijijij SXVU ε+= (1)
Selection of an alternative h over other alternatives implies that the utility of that alternative (Uih) is greater than the utility of the other alternatives (Uih > Uij):
ih ih ih ij ij
ih ij ij ih
P Pr ob(V V ), j C, j h
Prob(V V ), j C, j h.
= + ε > + ε ∀ ∈ ≠
= − > ε − ε ∀ ∈ ≠ (2)
The random errors εij for all j in C are assumed to be independently and identically distributed (IID). Furthermore, if they are in accordance with the extreme value (Gumbel) distribution the probability of choosing h takes the form
∑∈
=
Cjij
ihih V
VP)exp(
)exp(μ
μ (3)
where μ is a scale parameter which is commonly normalised to 1 for any one data set. Gen-erally estimated the conditional indirect utility function is:
kmbbaannij SSSXXXXASCV βββββββ +++++++++= ......332211 (4)
where the alternative specific constant (ASC) captures the influence on choice of unobserved attributes relative to specific alternatives. The number of attributes is n and the number of respondent-specific characteristics is k. The coefficients β1 to βn are attached to the vector of attributes and the coefficients βa to βm are attached to the vector respondent-specific charac-teristics. The latter enter as interactions with the ASC or the attributes.
However, the validity of the Conditional Logit (CL) is limited to cases where the inde-pendence from irrelevant alternatives (IIA) assumption is satisfied. It implies that the prob-ability of choosing one alternative over another is independent of the presence/absence of any other alternatives. As the IIA property is often violated in practise, models have been developed which move away from the assumption of IIA between all alternatives (Swait 2006; Train 2003; Winkelmann & Boes 2006). One approach to bypass the limitation of the CL is to allow for correlations among the error terms within different subsets of classes of alternatives by estimating a nested logit model. The rationale of the nested logit is to partition the set of alternatives faced by a decision maker into subsets respectively nests. For alterna-
Working Paper on Management in Environmental Planning 18/2007
4
tives in the same nest, the ratio of probabilities is independent of the attributes or existence of all other alternatives, that is, IIA holds within each nest. But IIA is not expected to hold in general for alternatives in different nests (Hensher et al. 2005).
Policy Analysis
Choice experiments do not only allow to estimate welfare measures for a number of policies that fall within the range of attribute levels considered in the choice set. In contrast to the contingent valuation they also allow to calculate an implicit price (IP), also known as a part-worth (Bennett & Adamowicz 2001). Implicit prices are useful for management decisions be-cause they provide information about the value of marginal changes in environmental quality and they can also be used to identify the relative importance people place on different attrib-utes. If utility is a linear function of all attributes the implicit price is calculated as follows:
IP = -βAttribute/βMoney (5)
where βAttribute represents the coefficient of the Ath non-monetary attribute, and βMoney repre-sents the coefficient for the monetary attribute. The estimates of implicit prices are made on a ceteris paribus basis. Accordingly, they indicate the willingness to pay of respondents for a change in the attribute of concern, given that everything else is held constant. Implicit prices can be used to compare models directly between models because the scalar variance terms are cancelled out of the equations and the confounding effect of the error variance is elimi-nated (Bennett & Adamowicz 2001: 64)
4. Design and administration of the survey
In the choice experiment we used three sections of the waterways in question as attributes. The sections are the Müritz-Havel-Wasserstraße (MHW), the Rheinsberg Gewässer (RG) and the Obere-Havel-Wasserstrasse (OHW). Two of them, the MHW and the OHW section, comprise each time six locks and the third one (RG) comprises one lock (see map in Figure I). The levels of the attributes represent reduced queuing times in front of the corresponding locks. In addition to the three site-specific attributes the fourth attribute was a fee to be paid each time a lock is used. Table 1 reports the attributes of the choice experiment and their levels. They would result in a complete factorial design of (43 * 21) * (43 * 21) different combi-nations. As this number would be too large, a fractional factorial main effects design was used in order to minimize the number of choice combinations presented to respondents. Us-ing a main effects design we assume that interactions among the attributes are not statisti-cally significant (cf. Louviere et al. 2000). The design was obtained using SAS macros (based on D-optimality, Kuhfeld 2005). This resulted in 24 choice cards which were blocked into six groups of four cards each time. Assigning choice cards to blocks was part of the ex-perimental design.

Working Paper on Management in Environmental Planning 18/2007
5
Table 1: Attributes and levels
Attribute Level Expected influence on choice
QT_RG (Rheinsberg Gewässer); waiting time in hours
1.0 / 1.5 / 2.5 / 3.0 +
QT_MHW (Müritz-Havel-Wasserstrasse) waiting time in hours
1.0 / 1.5 / 2.5 / 3.0 +
QT_OHW (Obere-Havel-Wasserstrasse) waiting time in hours
0.5 / 1.0 +
Fee per boat per lock use in € 0.5 / 1.0 / 2.5 / 4.0 -
Note: Current situation during holiday season (July and August) underlined; use of locks is free of charge. QT = queuing time
The questionnaire opened with some general questions about respondents current boating trip. For example, people were asked for how many days their current trip will last, how many people were travelling on the boat and whether they were travelling with their own boat. Afterwards peo-ple were shown a map of the wider region comprising the waterways with all locks and the main cities in this area. The map was used to determine at which location people had started their trip and at which location they will end it. Moreover, they were asked whether they had or will navigate on branches of the main waterway. The next section of the questionnaire aimed at respondents experience with queuing time in front of locks. First, they were asked how long their longest queu-ing time was in this area within the last years. Second, they presented the statement “Queuing time in front of a look is lost time” and asked to rate it on a five-point scale ranging from “com-pletely agree” to “completely disagree”. People may assess the time spent waiting in front of a lock very differently. We expected broad heterogeneity because people are on holiday and there-fore do assess waiting time differently from time saved while commuting. For example, some may see the queuing time as an opportunity to have a rest or to buy some food when a supermarket is close to the lock. People on a trip of several days may differ in their perception daytripers who want to pass a lock in order to reach a lake for a day of swimming. Also the next question tried to capture this heterogeneity by asking boaters after how many hours they find the waiting time too long. Finally, respondents were asked to determine in front of which locks, shown on the map, they had to wait too long according to their threshold during their current trip.
Prior to answering the choice tasks, respondents were informed about the opportunities to de-crease the waiting time by enlarging the capacity of the locks. They were also informed about the consequences for water management and the necessity of installing water saving technologies. As the investment program could not be financed solely by public money, respondents were told that users would have to pay a fee per boat for using the locks. Afterwards, the interviewers pre-sented an example of a choice card and explained the information given on the choice cards (see Figure IV for an example). Subsequently, respondents were presented a series of four choice cards each showing the current situation and hypothetical situations with each time varying queu-ing time and a fee that would have to be paid per lock and boat. Before the interview ended the

Working Paper on Management in Environmental Planning 18/2007
6
number of people living in the respondent’s household and the monthly net household income were requested.
At the end of July and during August 2006 altogether 420 recreational skippers were inter-viewed mainly at the locks in Demitz and Strasen. When a boat arrived at a lock, the captain, i.e., the person who is responsible for the boat, was asked whether she or he is willing to participate in an interview about queuing time at locks and their evaluation. Interviewers were located both up-stream and downstream so that people travelling in both directions could be interviewed. The in-terviews were carried out on weekdays as well as at the weekend on different daytimes. However, as the sampling was dependent on the arriving of the boats it is very likely that the interviewed boaters do not represent a random sample of those who travel on the rivers and canales during the summer holiday season. This has to be kept in mind when conclusions are drawn from the results. Table 2 characterises the sample used in the analysis. Due to missing values, especially for income, the useable sample amounts to 311 interviews. 26% of the respondents indicated that waiting in front of a lock was a waste of time. The average waiting time considered to be too long was 1.4 hours. Almost all respondents had experienced waiting time. The median of the longest experienced waiting time was 2 hours.
Table 2: Descriptive statistics
Variable Mean Median Min Max
Number of days travelling 14.88 7.00 1.00 183.00
First time boating in this region (yes=1/no=0)
0.37 0 0 1
People on board 3.39 3.00 1 11
Own boat (yes=1/no=0) 0.48 0 0 1
Longest queuing time so far (in hours) 2.00 2.00 0.12 10
Travelled distance in kilometres 157.69 122.60 12.8 459.40
Income (household net income) 3,275.72 3.250.00 500.00 6,500.00
Numlock (number of locks used) 14.84 12.00 2.00 48.00
Waitwast (waiting time is waisted time, yes = 1, no = 0)
0.26 0 0.00 1.00
Toomuch (duration after that queuing would be to long – in minutes)
84.05 60.00 15.00 360.00
Mirow (lock waited to long at) 0.23 0 0.00 1.00
Diemitz (lock waited to long at) 0.26 0 0.00 1.00
Canow (lock waited to long at) 0.07 0 0.00 1.00
Strasen (lock waited to long at) 0.11 0 0.00 1.00
Steinhavel (lock waited to long at) 0.04 0 0.00 1.00
Furstenb (lock waited to long at) 0.02 0 0.00 1.00
Wolfsbr (lock waited to long at) 0.05 0 0.00 1.00
N = 311
Working Paper on Management in Environmental Planning 18/2007
7
5. Models estimated
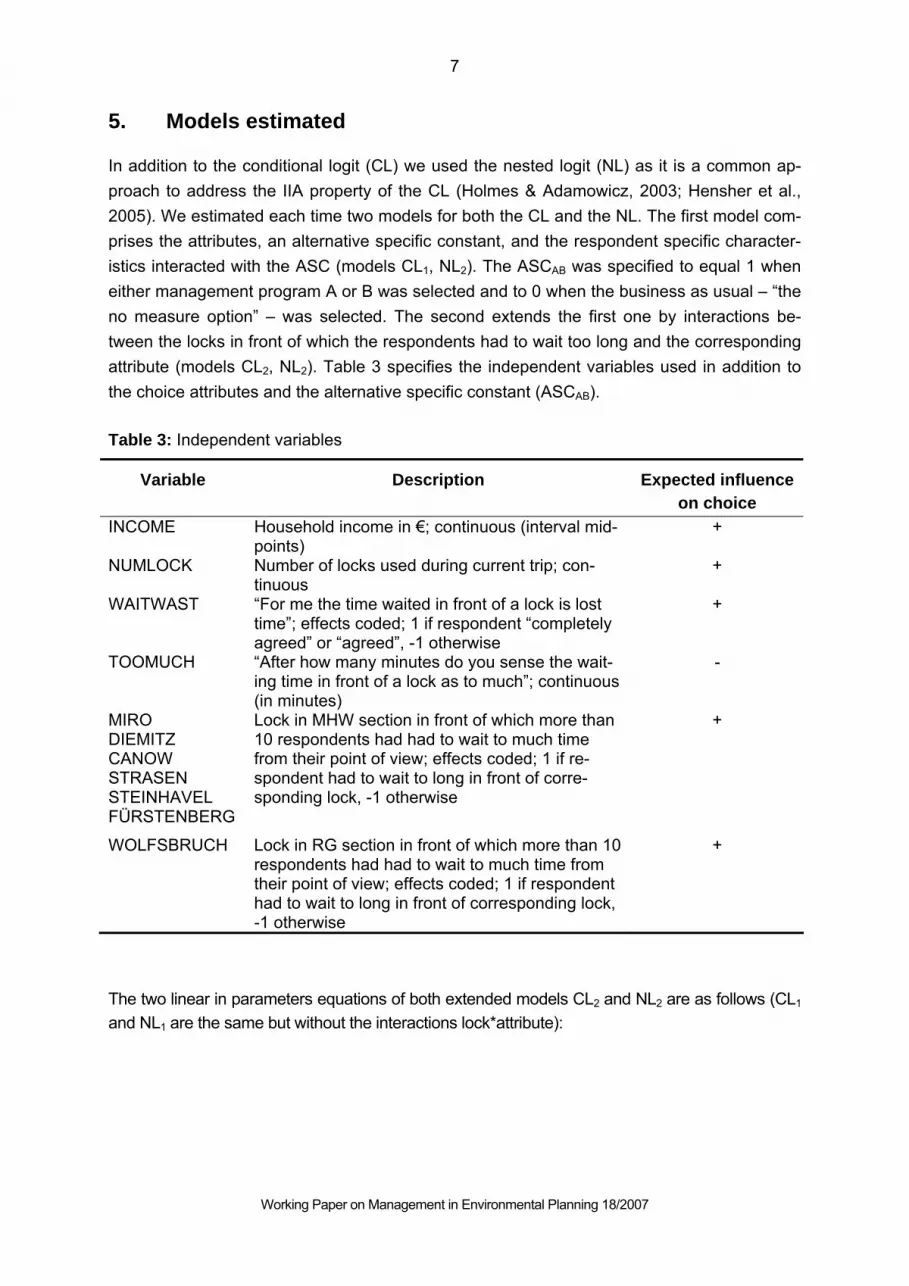
In addition to the conditional logit (CL) we used the nested logit (NL) as it is a common ap-proach to address the IIA property of the CL (Holmes & Adamowicz, 2003; Hensher et al., 2005). We estimated each time two models for both the CL and the NL. The first model com-prises the attributes, an alternative specific constant, and the respondent specific character-istics interacted with the ASC (models CL1, NL2). The ASCAB was specified to equal 1 when either management program A or B was selected and to 0 when the business as usual – “the no measure option” – was selected. The second extends the first one by interactions be-tween the locks in front of which the respondents had to wait too long and the corresponding attribute (models CL2, NL2). Table 3 specifies the independent variables used in addition to the choice attributes and the alternative specific constant (ASCAB).
Table 3: Independent variables
Variable Description Expected influenceon choice
INCOME Household income in €; continuous (interval mid-points)
+
NUMLOCK Number of locks used during current trip; con-tinuous
+
WAITWAST “For me the time waited in front of a lock is lost time”; effects coded; 1 if respondent “completely agreed” or “agreed”, -1 otherwise
+
TOOMUCH “After how many minutes do you sense the wait-ing time in front of a lock as to much”; continuous (in minutes)
-
MIRO DIEMITZ CANOW STRASEN STEINHAVEL FÜRSTENBERG
Lock in MHW section in front of which more than 10 respondents had had to wait to much time from their point of view; effects coded; 1 if re-spondent had to wait to long in front of corre-sponding lock, -1 otherwise
+
WOLFSBRUCH Lock in RG section in front of which more than 10 respondents had had to wait to much time from their point of view; effects coded; 1 if respondent had to wait to long in front of corresponding lock, -1 otherwise
+
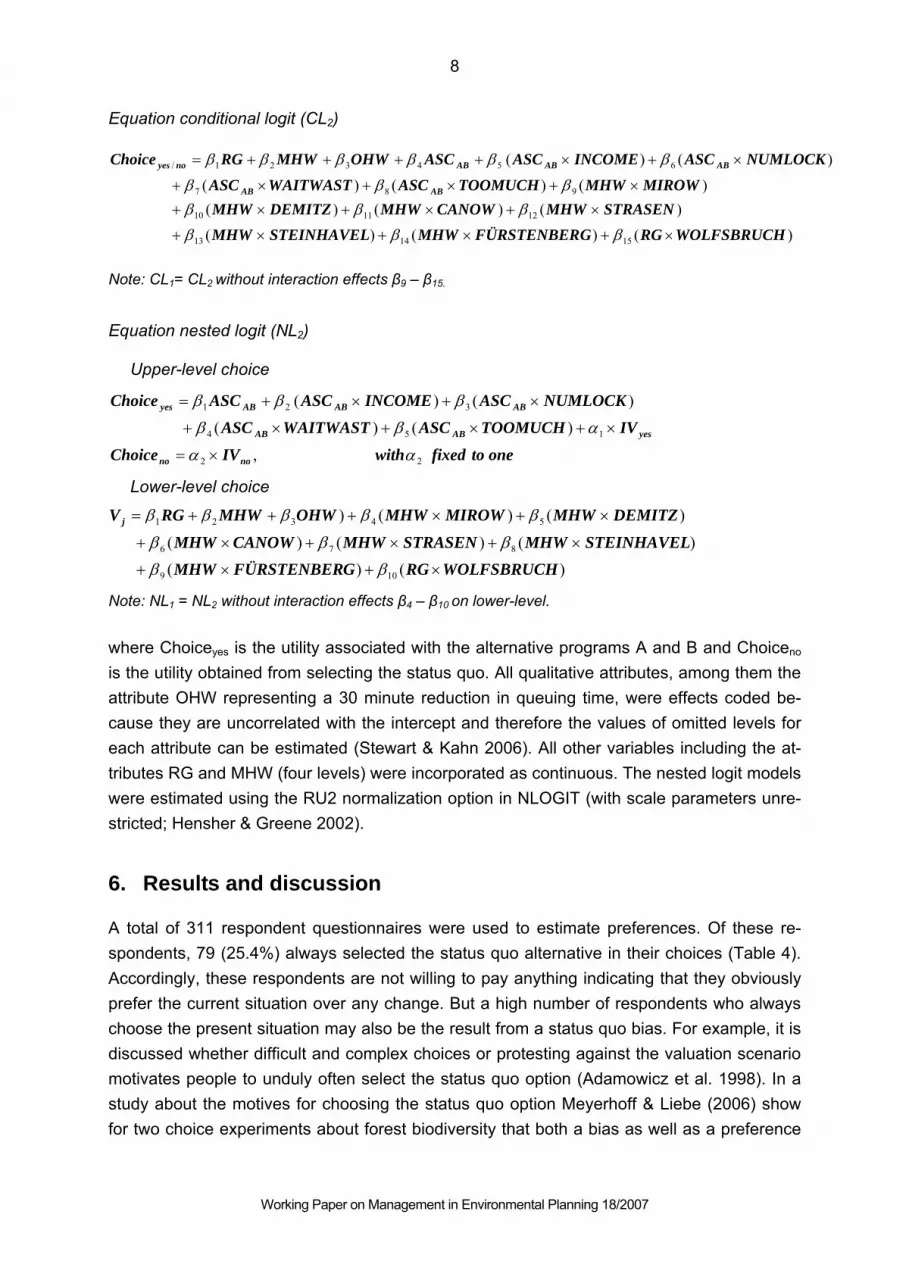
The two linear in parameters equations of both extended models CL2 and NL2 are as follows (CL1 and NL1 are the same but without the interactions lock*attribute):
Working Paper on Management in Environmental Planning 18/2007
8
Equation conditional logit (CL2)
)()()()()()(
)()()()()(
151413
121110
987
654321/
WOLFSBRUCHRGGFÜRSTENBERMHWSTEINHAVELMHWSTRASENMHWCANOWMHWDEMITZMHW
MIROWMHWTOOMUCHASCWAITWASTASCNUMLOCKASCINCOMEASCASCOHWMHWRGChoice
ABAB
ABABABnoyes
×+×+×+
×+×+×+×+×+×+
×+×++++=
ββββββ
βββ
ββββββ
Note: CL1= CL2 without interaction effects β9 – β15.
Equation nested logit (NL2)
Upper-level choice
onetofixedwithIVChoice
IVTOOMUCHASCWAITWASTASC
NUMLOCKASCINCOMEASCASCChoice
nono
yesABAB
ABABAByes
22
154
321
,
)()(
)()(
αα
αββ
βββ
×=
×+×+×+
×+×+=
Lower-level choice
)()()()()(
)()()
109
876
54321
WOLFSBRUCHRGGFÜRSTENBERMHWSTEINHAVELMHWSTRASENMHWCANOWMHW
DEMITZMHWMIROWMHWOHWMHWRGV j
×+×+
×+×+×+
×+×+++=
βββββ
βββββ
Note: NL1 = NL2 without interaction effects β4 – β10 on lower-level.
where Choiceyes is the utility associated with the alternative programs A and B and Choiceno is the utility obtained from selecting the status quo. All qualitative attributes, among them the attribute OHW representing a 30 minute reduction in queuing time, were effects coded be-cause they are uncorrelated with the intercept and therefore the values of omitted levels for each attribute can be estimated (Stewart & Kahn 2006). All other variables including the at-tributes RG and MHW (four levels) were incorporated as continuous. The nested logit models were estimated using the RU2 normalization option in NLOGIT (with scale parameters unre-stricted; Hensher & Greene 2002).
6. Results and discussion
A total of 311 respondent questionnaires were used to estimate preferences. Of these re-spondents, 79 (25.4%) always selected the status quo alternative in their choices (Table 4). Accordingly, these respondents are not willing to pay anything indicating that they obviously prefer the current situation over any change. But a high number of respondents who always choose the present situation may also be the result from a status quo bias. For example, it is discussed whether difficult and complex choices or protesting against the valuation scenario motivates people to unduly often select the status quo option (Adamowicz et al. 1998). In a study about the motives for choosing the status quo option Meyerhoff & Liebe (2006) show for two choice experiments about forest biodiversity that both a bias as well as a preference
Working Paper on Management in Environmental Planning 18/2007
9
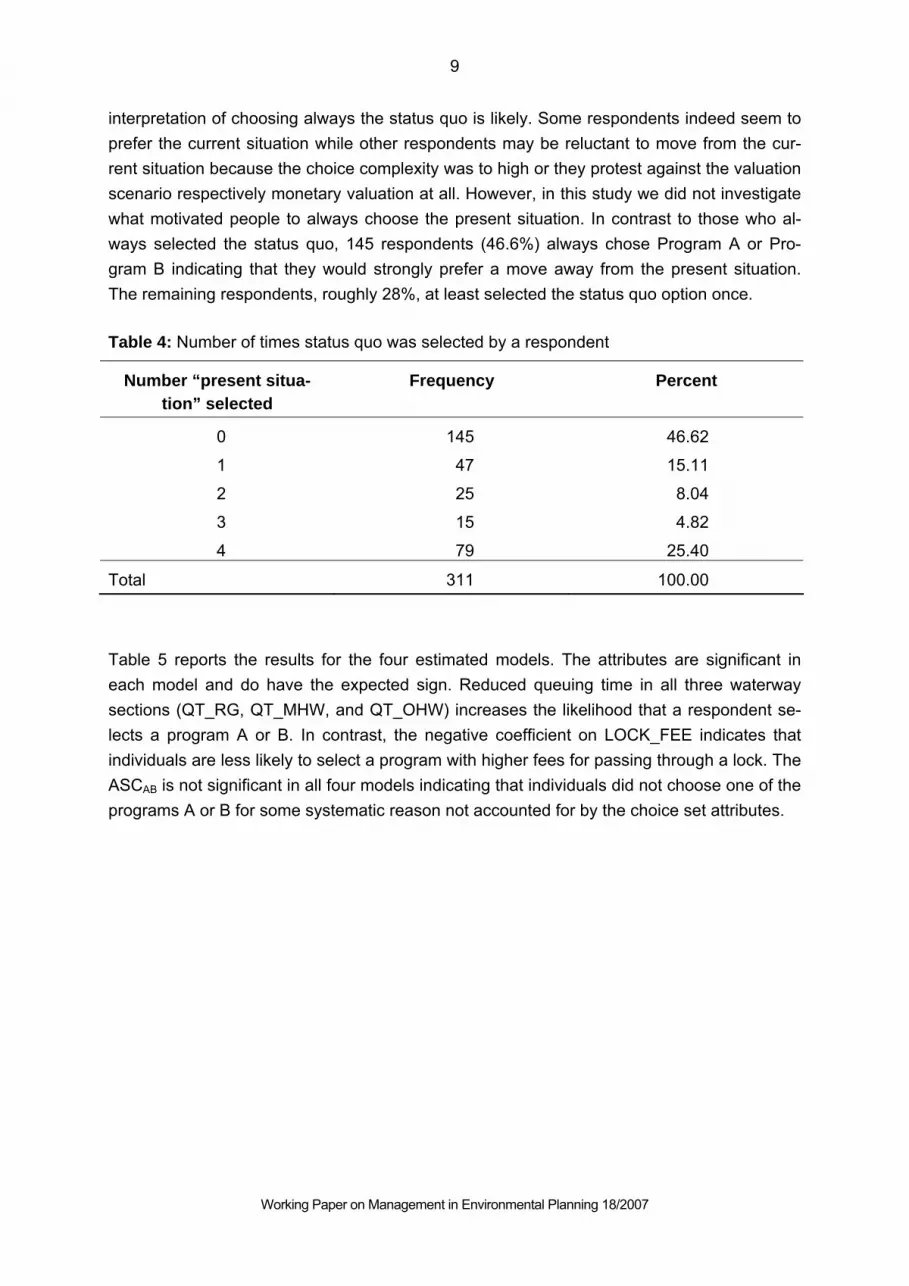
interpretation of choosing always the status quo is likely. Some respondents indeed seem to prefer the current situation while other respondents may be reluctant to move from the cur-rent situation because the choice complexity was to high or they protest against the valuation scenario respectively monetary valuation at all. However, in this study we did not investigate what motivated people to always choose the present situation. In contrast to those who al-ways selected the status quo, 145 respondents (46.6%) always chose Program A or Pro-gram B indicating that they would strongly prefer a move away from the present situation. The remaining respondents, roughly 28%, at least selected the status quo option once.
Table 4: Number of times status quo was selected by a respondent
Number “present situa-tion” selected
Frequency Percent
0 145 46.62
1 47 15.11
2 25 8.04
3 15 4.82
4 79 25.40
Total 311 100.00
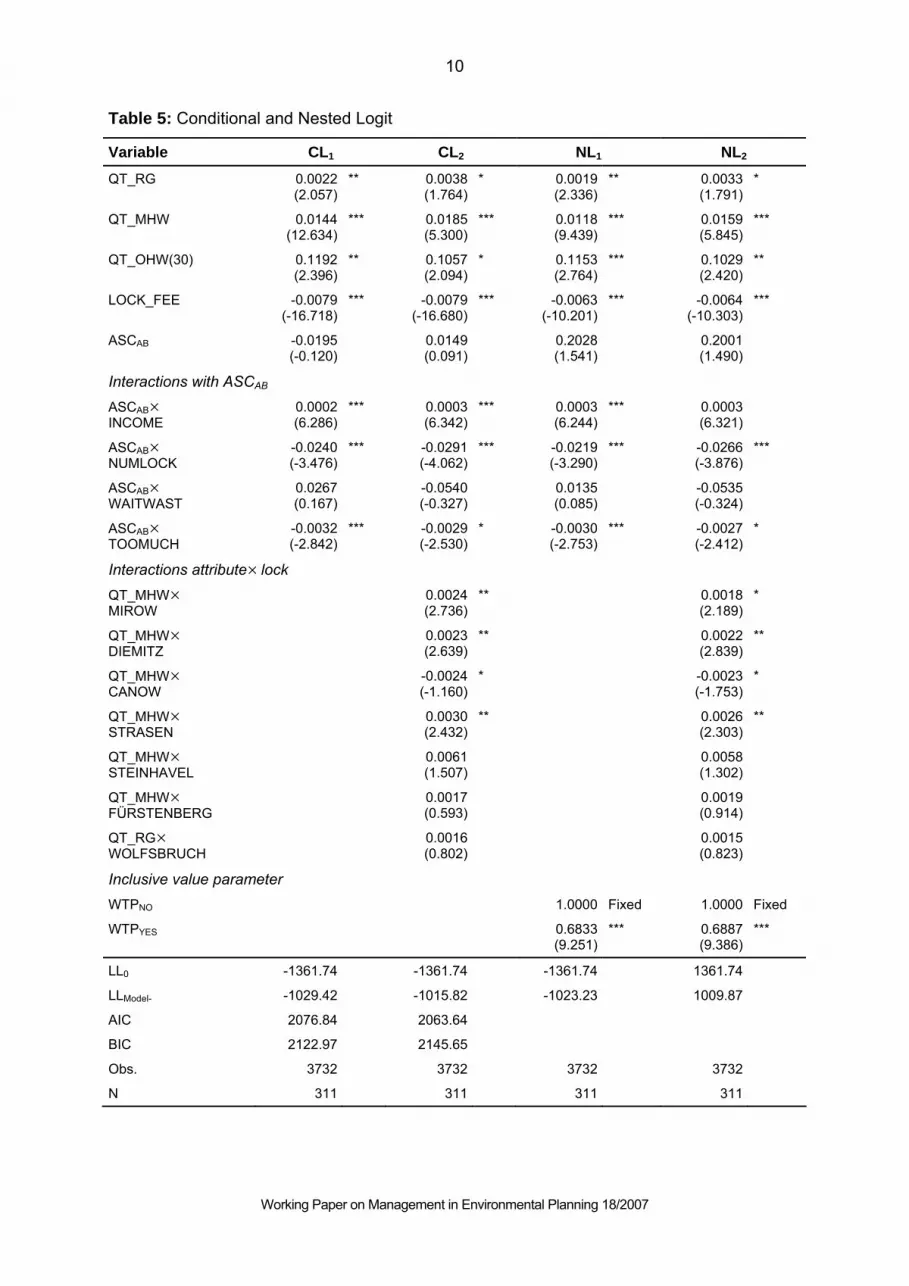
Table 5 reports the results for the four estimated models. The attributes are significant in each model and do have the expected sign. Reduced queuing time in all three waterway sections (QT_RG, QT_MHW, and QT_OHW) increases the likelihood that a respondent se-lects a program A or B. In contrast, the negative coefficient on LOCK_FEE indicates that individuals are less likely to select a program with higher fees for passing through a lock. The ASCAB is not significant in all four models indicating that individuals did not choose one of the programs A or B for some systematic reason not accounted for by the choice set attributes.
Working Paper on Management in Environmental Planning 18/2007
10
Table 5: Conditional and Nested Logit
Variable CL1 CL2 NL1 NL2 QT_RG 0.0022
(2.057) ** 0.0038
(1.764)* 0.0019
(2.336)** 0.0033
(1.791) *
QT_MHW 0.0144 (12.634)
*** 0.0185(5.300)
*** 0.0118(9.439)
*** 0.0159 (5.845)
***
QT_OHW(30) 0.1192 (2.396)
** 0.1057(2.094)
* 0.1153(2.764)
*** 0.1029 (2.420)
**
LOCK_FEE -0.0079 (-16.718)
*** -0.0079(-16.680)
*** -0.0063(-10.201)
*** -0.0064 (-10.303)
***
ASCAB -0.0195 (-0.120)
0.0149(0.091)
0.2028(1.541)
0.2001 (1.490)
Interactions with ASCAB ASCAB× INCOME
0.0002 (6.286)
*** 0.0003(6.342)
*** 0.0003(6.244)
*** 0.0003 (6.321)
ASCAB× NUMLOCK
-0.0240 (-3.476)
*** -0.0291(-4.062)
*** -0.0219(-3.290)
*** -0.0266 (-3.876)
***
ASCAB× WAITWAST
0.0267 (0.167)
-0.0540(-0.327)
0.0135(0.085)
-0.0535 (-0.324)
ASCAB× TOOMUCH
-0.0032 (-2.842)
*** -0.0029(-2.530)
* -0.0030(-2.753)
*** -0.0027 (-2.412)
*
Interactions attribute× lock QT_MHW× MIROW
0.0024(2.736)
** 0.0018 (2.189)
*
QT_MHW× DIEMITZ
0.0023(2.639)
** 0.0022 (2.839)
**
QT_MHW× CANOW
-0.0024(-1.160)
* -0.0023 (-1.753)
*
QT_MHW× STRASEN
0.0030(2.432)
** 0.0026 (2.303)
**
QT_MHW× STEINHAVEL
0.0061(1.507)
0.0058 (1.302)
QT_MHW× FÜRSTENBERG
0.0017(0.593)
0.0019 (0.914)
QT_RG× WOLFSBRUCH
0.0016(0.802)
0.0015 (0.823)
Inclusive value parameter WTPNO 1.0000 Fixed 1.0000 Fixed
WTPYES 0.6833(9.251)
*** 0.6887 (9.386)
***
LL0 -1361.74 -1361.74 -1361.74 1361.74
LLModel- -1029.42 -1015.82 -1023.23 1009.87
AIC 2076.84 2063.64
BIC 2122.97 2145.65
Obs. 3732 3732 3732 3732
N 311 311 311 311

Working Paper on Management in Environmental Planning 18/2007
11
Three of the four respondents-specific variables, interacted with the ASCAB, are significant. Only the attitude towards queuing time, i.e. whether people feel that the time waited in front of a lock is wasted time, is not significant. This applies to all four models regardless of the econometric speci-fication. Respondents who think that queuing time is “not lost time” are not more likely to chose one of the alternative programs respondents compared to those who do think that it is lost time. Among the significant interactions is one that reveals an unexpected sign, i.e. the number of locks used negatively influences the selection of an alternative program. We expected that the more often people use locks the more likely they are to chose an improvement to the current situation because those people would benefit the most from reduced queuing times. However, the negative sign might indicate that the more often people use locks the more they are in disfavour of im-provements because the total amount of fees they would have to pay would be higher. A second explanation might be that long distance travellers (“passed many locks”) may be less distracted by waiting times then short distance travellers, who, for example, pass locks only to access a certain lake for a daytrip. The other two significant interactions imply that respondents with higher in-comes are more likely not to choose the status quo. In contrast, those with a higher tolerance for queuing times, i.e., people who start to complain at longer queuing times, are more likely to select the status quo.
Among the group of interactions “lock*attribute” four are significant but only three show the expected positive sign (MIROW, DIEMITZ, STRASEN). The probability that a respondent agrees to pay for locks with increased capacity and water saving technology is higher if the respondents had to wait too long at this locations. For the interaction CANOW the sign is negative. An explanation for this unexpected sign is that at the lock in CANOW, in compari-son to the other locks, many restaurants and shops are present. On the one hand people had to wait too long but as they could use this time for having dinner or for shopping they might value the queuing time at this lock different from the queuing time at the other locks.
A comparison of both the CL and the NL estimations reveals only minor differences. In all models the same variables are significant and show the same signs. However, the inclusive value parameter WTPyes is significant indicating that the NL fits the data better.1 Moreover, the coefficients of the inclusive value are between 0 and 1 indicating consistency with ran-dom utility theory (Train 2003).
Table 6 gives the implicit prices in Euro cent for a 30 minute reduction in queuing time based on the CL1 and the NL1 models. The reported 95% confidence intervals were calcu-lated using the Krinsky & Robb (1986) bootstrapping procedure from 1000 draws. As the attribute QT_OHK has only two levels representing a reduction of 30 minutes we multiplied the implicit price of the other two attributes with 30 in order to be able to compare the prices with each other. The highest implicit price results from reduced queuing time in the MHW section. The WTP value for a 30 minute reduction is € 0.69 cents (CL1) respectively € 0.56 1 The IIA property of the CL was tested using the Hausman and McFadden test contained within NLOGIT 8.0. The test results indicate that it is significantly violated. Moreover, the better fit of the

Working Paper on Management in Environmental Planning 18/2007
12
(NL1). Evidently lower mean WTP values result from reduced waiting time in the OHW sec-tion. Here the values are € 0.13 (CL1) respectively € 0.18 (NL1) per minute reduced queuing time. Similar low values for reduced queuing time will result from a capacity increase in the RG section. Here the implicit prise based on CL1 is € 0.15 and based on the NL1 € 0.18 for 30 minutes less queuing time.
Table 6: Implicit price for reduced waiting time per lock in different waterway sections (in Euro cent per 30 minutes)
Implicit price CL1 NL1
QT_RG 14.863
(-2.445 – 31.659) 9.117
(1.377 – 17.051)
QT_MHW 69.437
(43.409 – 96.975) 56.227
(46.846 – 66.363)
QT_OHW 13.251
(1.079 – 26.761) 18.413
(5.409 – 32.695)
Note: Confidence intervals in parentheses calculated according to Krinsky & Robb (1986)
A question that is of interest for resource management is whether these values differ signifi-cantly among the three spatial units or not. Moreover, it is also interesting to investigate whether the implicit prices differ between both the conditional and nested logit, because the nested logit fits the data better. As a test of equivalence based only on whether confidence intervals overlap or not may be not sufficient, we used the complete combinatorial approach proposed by Poe et al (2005).2 Table 7 reports in the upper part the results of the test of equivalence between the spatial units independently for the CL and the NL estimation. Whether the implicit prices based on the CL and the NL are equivalent is reported in the lower part of Table 7.
The mean WTP values for 30 minutes less queuing time differ obviously between the MHW section and the other two spatial units but do not vary much between the RG and the OHW section. This is confirmed by the test of equivalence. The implicit prices differ between the MHW and the OHW and the MHW and the RG in both estimations. But between the OHW and the RG branch they do not differ significantly. Finally, we can not reject the null hypothesis of equivalence from the CL and the NL estimation. The implicit prices do not differ for any of the three waterway sections. Although the NL better fits the data it does not have a significant influence on the implicit prices. A similar result was, for instance, reported by Han-ley et al. (2002) from choice experiments about recreation demand.
nested logit is supported by likelihood ratio tests (CL1 -> NL1: χ2 = 12.38, df. 1, p < 0.01; CL2 -> NL2: χ2 = 11.90, df. 1, p < 0.01). 2 The test was conducted with the code provided by Bill Greene on the LIMDEP-discussion list.

Working Paper on Management in Environmental Planning 18/2007
13
Table 7: Test of equivalence for 30 minutes reduced queuing time
Null hypothesis Rejected at 5% significance level
Conditional Logit 1 H0: IP_MHW = IP_OHW Yes H0: IP_MHW = IP_RG Yes H0: IP_OHW = IP_RG No
Nested Logit 1 H0: IP_MHW = IP_OHW Yes H0: IP_MHW = IP_RG Yes H0: IP_OHW = IP_RG No
CL1 versus NL1 H0: IP_RGCL = IP_RGNL No H0: IP_MHWCL = IP_MHWNL No H0: IP_OHWCL = IP_OHWNL No
Table 8 reports the lock-specific implicit prices for those locks for which the interaction term between the waterway section and the dummy for the lock at which boaters had to wait too long are significant. The lock specific value can be calculated by adding the coefficient of the main effect and the coefficient of the interaction.
Table 8: Lock specific implicit prices in MHW section
Lock CL2 NL2 Test of equivalence
H0 rejected
QT_MHW SECTION
2.338 (1.450 – 3.197)
2.482 (1.664 – 3.334)
MIROW 2.637
(1.728 – 3.572) 2.776
(1.929 – 3.731) IPMHW = IPMirow no
DIEMITZ 2.634
(1.724 – 3.532) 2.846
(2.029 – 3.758) IPMHW = IPDiem No
CANOW 2.036
(0.967 – 3.108) 2.139
(1.181 – 3.192) IPMHW = IPCanow no
STRASEN 2.713
(1.707 – 3.716) 2.908
(1.987 – 3.898) IPMHW = IPStra no
Lock specific implicit price is calculated by adding main effect and interaction effect
Again, we used the test of equivalence proposed by Poe et al (2005) to test whether the lock-specific WTP values significantly differ from the implicit price estimated for the corresponding
Working Paper on Management in Environmental Planning 18/2007
14
spatial unit. As significant interactions were only found for locks in the MHW section, only lock specific WTP values are compared to the implicit price of QT_MHW. As the last column of Table 8 shows, the null hypothesis of no difference between the implicit prices can not be rejected for any of the four lock specific values.
7. Conclusion
The objective of this paper was to investigate whether recreational skippers in the Müritz region northeast of Berlin, Germany, are willing to pay in order to reduce queuing times in front of locks. Moreover, using a spatially explicit choice experiment, we intended to deter-mine in which part of the waterway system people would prefer to increase lock capacities. Our findings show that respondents are willing to pay for reduced queuing times. Implicit prices are the highest for highly frequented central section of the waterway system (Müritz-Havel-Wasserstrasse) and differ significantly from those estimated for the locks in the other two spatial units, the Rheinsberg Gewässer and the Obere-Havel-Wasserstraße. These two sections represent highly frequented tributaries and less frequented sections respectively. The implicit prices for these two sections differ neither according to the CL nor the NL esti-mation. One reason for this finding could be that the spatial units were not specified appro-priate and therefore the spatial units may not properly reflect recreational boaters’ use of the waterways.
Using information about the locks at which respondents had to wait above their threshold we estimated lock-specific implicit prices for the Müritz-Havel-Wasserstrasse. But although some of the interactions were significant, the lock-specific prices do not differ significantly from the implicit price for the whole section. Therefore, based on the survey data, we can not determine single locks within this waterway section for which reducing queuing time would be of higher priority. A next step in the analysis that might shed more light on the value of saved queuing time would be to use mixed logit models as it is done in transportation studies (Hess et al., 2005).
Acknowledgement
The authors would like to thank Jacob Möhring for the excellent organisation of the survey and Ulf Liebe for valuable comments on an earlier version of this paper. Funding for this re-search, which was part of the project ‘GLOWA Elbe: Impacts of Global Change on the Water Cycle in the Elbe Region - Risks and Options’ (Fkz. O\LW0307), was provided by the Federal Ministry of Education and Research in Germany.

Working Paper on Management in Environmental Planning 18/2007
15
References
Adamowicz, W. L., Boxall, P., et al. (1998). Stated Preference Approaches to Measuring Passiv Use Values: Chocie Experiments versus Contingent Valuation. American Journal of Agricultural Economics 80(1): 64-75.
Bennett, J., Adamowicz, W. L. (2001). Some Fundamentals of Environmental Choice Model-ling. The Choice Modelling Approach To Environmental Evaluation. J. Bennett & R. K. Blamey. Cheltenham, Edward Elgar: 37-69.
Hanley, N., Wright, R. E., Koop, G. (2002). Modelling recreation demand using choice ex-periments: climbing in Scotland. Environmental and Resource Economics 22 (449-466.
Hensher, D. A., Greene, C. R. J. (2002). Specification and Estimation of the Nested Logit Model: Alternative Normalisations. Transportation Research Part B 36(1): 1-17.
Hensher, D. A., Rose, J. M., Greene, W. H. (2005). Applied Choice Analysis. A Primer. Cambridge University Press: Cambridge.
Hess, S., Bierlaire, M., Polak, J. W. (2005). Estimation of Value of Travel-Time Savings Us-ing Mixed Logit Models. Transportation Research Part A 39, 221-236.
Holmes, T. P., Adamowicz, W. L. (2003). Attribute-Based Methods. In Champ, P. A., Boyle, K. J., Brown, T. C. (Eds.), A Primer on Nonmarket Valuation. Kluwer: Dordrecht
Horne, P., C. P. Boxall, Adamowicz, W. L. (2005). Multiple-use Management of Forest Rec-reation Sites: A Spatially Explicit Choice Experiment. Forest Ecology and Management 207(1-2): 189-199.
Kling, C. L., Thomson, C. J. (1996). The Implications of Model Specification for Welfare Es-timation in Nested Logit Models. American Journal of Agricultural Economics 78: 103-114.
Kuhfeld, W. F. (2005). Marketing Research Methods in SAS. Experimental Design, Choice, Conjoint, and Graphical Techniques. Cary, NC, SAS-Institute TS-722.
Krinsky, I. Robb, L. (1986). On approximating the statistical properties of elasticities. The Review of Economics and Statistics 68: 715-719.
Louviere, J. J., Hensher, D. A., Swait, J. D. (2000). Stated Choice Methods. Analysis and Application. Cambridge, Cambridge University Press.
Meyerhoff, J., Liebe, U. (2006): Status-Quo Effect in Choice Modeling: Protest Beliefs, Atti-tudes, and Task Complexity. Paper presented at the 3rd World Congress of Environ-mental and Resource Economists in Kyoto, July 2006.
Ministerium für Wirtschaft des Landes Brandenburg (MWB) (2001): Handlungsempfehlungen zur Weiterentwicklung des Wassertourismus im Land Brandenburg.
PLANCO (2000). Entwicklung eines Verfahrens zur Bewertung von Investitionsmaßnahmen an Nebenwasserstraßen. Berichte im Auftrag des Bundesministeriums für Verkehr, Bau und Wohnungswesen.
Poe, G. L., Giraud, K. L., et al. (2005). Computational Methods for Measuring the Difference of Empirical Distributions. American Journal of Agricultural Economics 87(2): 353-365.

Working Paper on Management in Environmental Planning 18/2007
16
Stewart, S., Kahn, J. R. (2006). An Introduction to Choice Modeling for Non-market Valua-tion. In Alberini, A., Kahn, J. R. (eds.), Handbook on Contingent Valuation. Edward Elgar: Cheltenham.
Swait, J. D. (2006). Advanced Choice Models. In Kanninen, B. (ed.), Valuing Environmental Amenities Using Stated Choice Studies. Springer: Dordrecht.
Train, K. E. (2003). Discrete Choice Methods with Simulation. Cambridge, Cambgridge Uni-versity Press.
Winkelmann, R., Boes, S. (2006). Aalysis of Microdata. Berlin, Springer. WSA (2006). Verkehrsstatistik 2005 für die Wasserstraßen. Wasser- und Schiffahrtsamt E-
berswalde.
17Figure I: Map of the region
Mirow (19)
Diemitz (20)Canow (21)
Wolfsbruch (22)
Strasen (23)
Wesenberg (24)
Vosswinkel (25)Zwenzow (26)
Steinhavel (27)
Fürstenberg (28)Himmelpfort (29)
Bredereiche (30) Regow (31)
Zaaren (32)
Marienthal (35)
Schorfheide (33)Kannenburg (34)
Zehdenick (36)
Bischhofswerder (37)
Liebenwalde (38)
Plau (18)
Barkow (17)Bobzin (16)
Lübz (15)
Neuburg (14)Parchim (13)
Garwitz (12)
Banzkow (11)
Lewitz (10)
Neustadt Glewe (9)
Grabow (7)Hechtsfort (8)
Güritz (6)Eldena (5)
Malliß (4)
Neu Kahliß (2)Dömitz (1)
Findenwirunshier(3)
Schwerin (SW)
Waren (WA)
Neu-Strelitz (ST)
Rheinsberg (RB)
Wittenberge (WI)
Lychen (LY)
Templin (TE)
Havelberg (HA)
Brandenburg (BR)Magdeburg (MA)
Lauenburg (LA)
Berlin (BE)
Eberswalde (EB)
Note: The box on the map marks the region which is subject of the analysis. The wider map was used in the interviews in order to ask people at which place they started respectively will end their boat trip
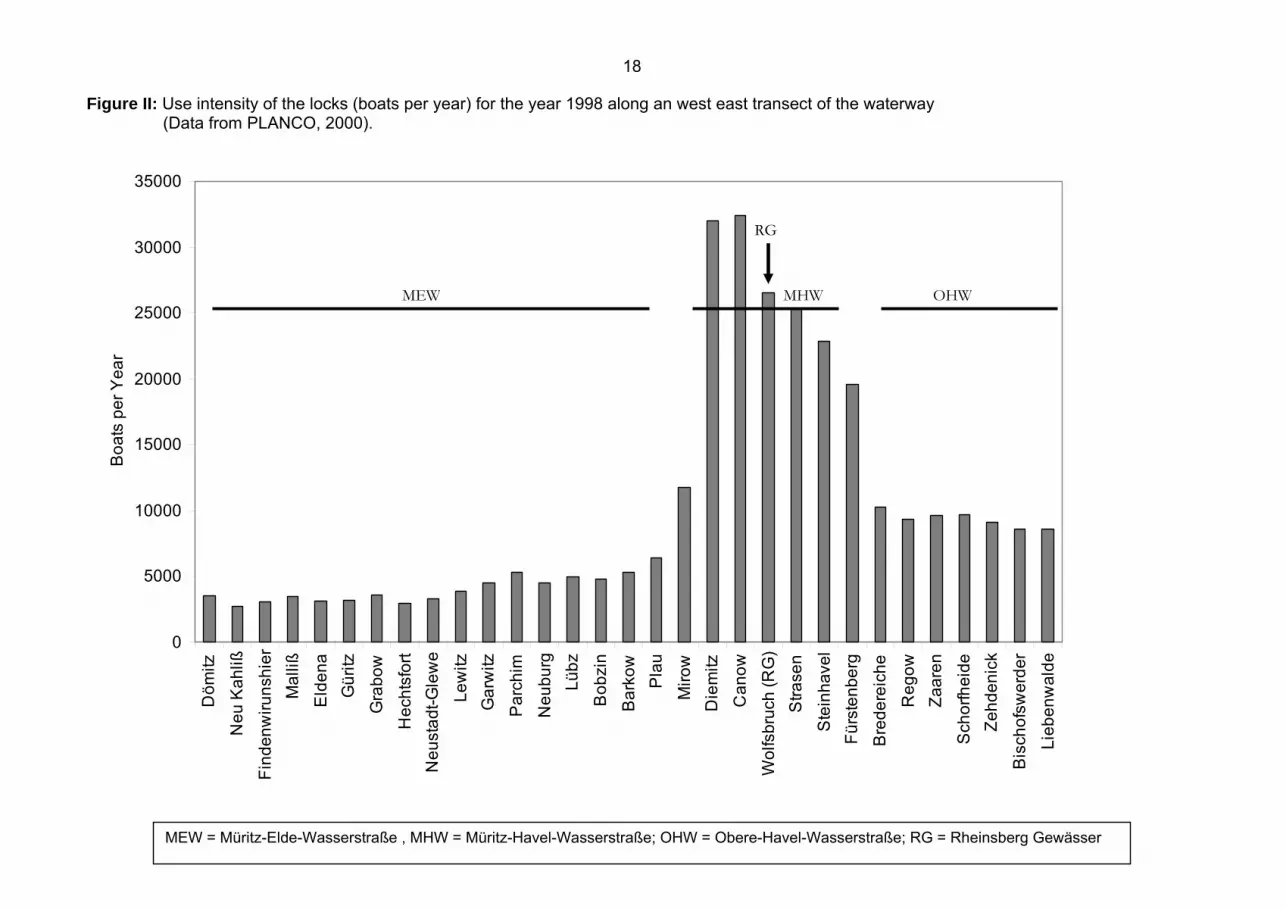
18 Figure II: Use intensity of the locks (boats per year) for the year 1998 along an west east transect of the waterway
(Data from PLANCO, 2000).
0
5000
10000
15000
20000
25000
30000
35000D
ömitz
Neu
Kah
liß
Find
enw
iruns
hier
Mal
liß
Eld
ena
Gür
itz
Gra
bow
Hec
htsf
ort
Neu
stad
t-Gle
we
Lew
itzG
arw
itz
Par
chim
Neu
burg
Lübz
Bob
zin
Bar
kow
Pla
u
Miro
wD
iem
itz
Can
ow
Wol
fsbr
uch
(RG
)S
trase
n
Ste
inha
vel
Fürs
tenb
erg
Bre
dere
iche
Reg
owZa
aren
Sch
orfh
eide
Zehd
enic
k
Bis
chof
swer
der
Lieb
enw
alde
Boa
ts p
er Y
ear
MEW MHW OHW
RG
MEW = Müritz-Elde-Wasserstraße , MHW = Müritz-Havel-Wasserstraße; OHW = Obere-Havel-Wasserstraße; RG = Rheinsberg Gewässer

19 Figure III: Increases in the utilisation of lock at Demitz (MHW) and at Bedereiche (OHW) for the period 1992-2005 (WSA, 2006)
0
10000
20000
30000
40000
50000
1992
1993
1994
1995
1996
1997
1998
1999
2000
2001
2002
2003
2004
2005
Num
ber o
f boa
ts u
sing
lock
DiemitzBedereiche

20Figure IV: Example of a Choice Card
[Block4 Run2]
No measures Program A Program B
Fee per lock use: 0,00 €
Waiting time in hours: Waiting time in hours:Waiting time in hours:
Fee per lock use: 2,50 €Fee per lock use: 0,50 €
3h per lock6 locks
Müritz
Havel
Rheinsberg
Fürstenberg
3h per lock1 lock
1h per lock6 locks
2½h per lock6 locks
Müritz
Havel
Rheinsberg
Fürstenberg
1h per lock1 lock
½h per lock6 locks
1½h per locks6 locks
Müritz
Havel
Rheinsberg
Fürstenberg
3h per locks1 lock
1h per locks6 locks
The presented waiting time in hours can occur during the summer holiday season (July and August).
I choose