QueueVadis : Queuing Analytics using Smartphones
12
QueueVadis * : Queuing Analytics using Smartphones Tadashi Okoshi † , Yu Lu ‡ , Chetna Vig ¶ , Youngki Lee § , Rajesh Krishna Balan § and Archan Misra § † Graduate School of Media and Governance, Keio University ‡ Institute for Infocomm Research, A*STAR ¶ Department of Electrical and Computer Engineering, University of California, Davis § School of Information Systems, Singapore Management University ABSTRACT We present QueueVadis, a system that addresses the problem of estimating, in real-time, the properties of queues at commonplace urban locations, such as coffee shops, taxi stands and movie the- aters. Abjuring the use of any queuing-specific infrastructure sen- sors, QueueVadis uses participatory mobile sensing to detect both (i) the individual-level queuing episodes for any arbitrarily-shaped queue (by a characteristic locomotive signature of short bursts of “shuffling forward” between periods of “standing”) and (ii) the aggregate-level queue properties (such as expected wait or service times) via appropriate statistical aggregation of multi-person data. Moreover, for venues where multiple queues are too close to be sep- arated via location estimates, QueueVadis also uses a novel disam- biguation technique to separate users into multiple distinct queues. User studies, performed with 138 cumulative total users observed at 23 different real-world queues across Singapore and Japan, show that QueueVadis is able to (a) identify all individual queuing episodes, (b) predict service and wait times fairly accurately (with median es- timation errors in the 10%-20% range), independent of the queue’s shape, (c) separate users in multiple proximate queues with close to 80% accuracy and (d) provide reasonable estimates when the par- ticipation rate (the fraction of QueueVadis-equipped people in the queue) is modest. 1. INTRODUCTION Queuing is one of the more mundane, but frustrating, rites of daily life in bustling urban centers of Asia (such as Singapore, Tokyo or Shanghai): we often encounter significant queuing delays multiple times a day, while having meals in a variety of food and beverage (F&B) establishments, withdrawing money (at ATMs), availing of public transport (at bus stops & taxi stands), purchas- ing groceries (at store checkout counters) and watching movies (at movie theaters). Clearly, accurate, near real-time estimates of such individual and aggregated queuing delays, at the tens of thousands of retail establishments, movie theaters and taxi/bus stands dot- ting a city, can enable useful new urban applications such as: (a) Where To Go?, where an office worker searches for the food stall (among multiple nearby food courts) with the shortest wait time or (b) Waiting Worth It, where an F&B retailer in a mall pushes * A play on “QuoVadis", Latin for “Where are you going?" Permission to make digital or hard copies of all or part of this work for personal or classroom use is granted without fee provided that copies are not made or distributed for profit or commercial advantage and that copies bear this notice and the full cita- tion on the first page. Copyrights for components of this work owned by others than ACM must be honored. Abstracting with credit is permitted. To copy otherwise, or re- publish, to post on servers or to redistribute to lists, requires prior specific permission and/or a fee. Request permissions from [email protected]. IPSN ’15 April 14 - 16 2015, Seattle, WA, USA Copyright is held by the owner/author(s). Publication rights licensed to ACM. ACM 978-1-4503-3475-4/15/04 ...$15.00. http://dx.doi.org/10.1145/2737095.2737120. a specific discount to a queuing customer who has been queuing longer than 10 minutes. This paper describes QueueVadis, a partic- ipatory sensing-based system that first uses an individual’s smart- phone sensors to identify individual queuing episodes. It then uses the properties of multiple such queuing episodes (from different individuals) to (a) separate individuals across multiple queues (cur- rently based on the trajectory trace of entire queuing episodes) and (b) derive robust estimates of queue properties (specifically the ser- vice time and the overall waiting time). This participatory paradigm offers an alternative to infrastructure-based solutions, such as use of video camera-based analytics [17, 12] or store-specific Wi-Fi APs [15]). In particular, our experience suggests that deploying any infrastructure (even if fairly inexpensive), ubiquitously across hundreds of retail establishments or taxi stands, is extremely hard, especially for the specific “narrow” problem of queuing-analytics. In contrast, QueueVadis can be embedded in venue-specific mobile Apps (that often exist for malls, campuses etc.) to opportunistically collect individual-level sensor data–we show that QueueVadis pro- vides useful estimates even with participation rates as low as 10%. Our key challenges, approaches and contributions are as follows. A Movement-based Queuing Classifier: To enable identifica- tion of queuing behavior without any infrastructural aids, we de- velop a two-tier activity classification model for smartphones that exploits the repetitive micro activity sequence of queuing, con- sisting principally of “standing’, interspersed with short bursts of “stepping forward”. We implement this basic model efficiently on commodity smartphones; moreover, to monitor individual queuing behavior with very low energy overhead, we use coarse-grained lo- cation triggers to activate such classifiers. Adaptation to Varying Queue Service Times: Based on em- pirical queue observations, collected at over 39 real-world loca- tions across two Asian cities (Singapore and Tokyo), we found that queues exhibit significant variability, in terms of service rate and overall queuing delay. Moreover, even within a single queue, there were both short (few minutes) and longer time-scale (hour of the day) variation in these metrics. To detect queuing accu- rately and robustly across such variations, the QueueVadis client employs multiple concurrent tier-2 classifiers (operating at differ- ent timescales). Robustness to Human Behavioral Artifacts: Our empirical measurements also showed two important usage-based artifacts: queue shape / orientation and premature leaving behavior. We found that users line up at different queues within a single crowded venue, such as a food court, in various organic shapes: sometimes in a straight-line, but often in a randomly curvy and even ‘snaking’ (with 180deg turns) fashion. Moreover, in queues such as at F&B stores and taxi-stands, users can occasionally leave a queue prema- turely (often out of impatience). We show that our QueueVadis client’s orientation-independent technique for classifying behav- ior achieves robust queuing detection across a variety of real-world
Transcript of QueueVadis : Queuing Analytics using Smartphones

QueueVadis∗: Queuing Analytics using Smartphones
Tadashi Okoshi†, Yu Lu‡, Chetna Vig¶, Youngki Lee§, Rajesh Krishna Balan§ and Archan Misra§
†Graduate School of Media and Governance, Keio University‡Institute for Infocomm Research, A*STAR
¶Department of Electrical and Computer Engineering, University of California, Davis§School of Information Systems, Singapore Management University
ABSTRACTWe present QueueVadis, a system that addresses the problem ofestimating, in real-time, the properties of queues at commonplaceurban locations, such as coffee shops, taxi stands and movie the-aters. Abjuring the use of any queuing-specific infrastructure sen-sors, QueueVadis uses participatory mobile sensing to detect both(i) the individual-level queuing episodes for any arbitrarily-shapedqueue (by a characteristic locomotive signature of short bursts of“shuffling forward” between periods of “standing”) and (ii) theaggregate-level queue properties (such as expected wait or servicetimes) via appropriate statistical aggregation of multi-person data.Moreover, for venues where multiple queues are too close to be sep-arated via location estimates, QueueVadis also uses a novel disam-biguation technique to separate users into multiple distinct queues.User studies, performed with 138 cumulative total users observedat 23 different real-world queues across Singapore and Japan, showthat QueueVadis is able to (a) identify all individual queuing episodes,(b) predict service and wait times fairly accurately (with median es-timation errors in the 10%-20% range), independent of the queue’sshape, (c) separate users in multiple proximate queues with close to80% accuracy and (d) provide reasonable estimates when the par-ticipation rate (the fraction of QueueVadis-equipped people in thequeue) is modest.
1. INTRODUCTIONQueuing is one of the more mundane, but frustrating, rites of
daily life in bustling urban centers of Asia (such as Singapore,Tokyo or Shanghai): we often encounter significant queuing delaysmultiple times a day, while having meals in a variety of food andbeverage (F&B) establishments, withdrawing money (at ATMs),availing of public transport (at bus stops & taxi stands), purchas-ing groceries (at store checkout counters) and watching movies (atmovie theaters). Clearly, accurate, near real-time estimates of suchindividual and aggregated queuing delays, at the tens of thousandsof retail establishments, movie theaters and taxi/bus stands dot-ting a city, can enable useful new urban applications such as: (a)Where To Go?, where an office worker searches for the food stall(among multiple nearby food courts) with the shortest wait timeor (b) Waiting Worth It, where an F&B retailer in a mall pushes
∗ A play on “QuoVadis", Latin for “Where are you going?"
Permission to make digital or hard copies of all or part of this work for personal orclassroom use is granted without fee provided that copies are not made or distributedfor profit or commercial advantage and that copies bear this notice and the full cita-tion on the first page. Copyrights for components of this work owned by others thanACM must be honored. Abstracting with credit is permitted. To copy otherwise, or re-publish, to post on servers or to redistribute to lists, requires prior specific permissionand/or a fee. Request permissions from [email protected] ’15 April 14 - 16 2015, Seattle, WA, USACopyright is held by the owner/author(s). Publication rights licensed to ACM.ACM 978-1-4503-3475-4/15/04 ...$15.00.http://dx.doi.org/10.1145/2737095.2737120.
a specific discount to a queuing customer who has been queuinglonger than 10 minutes. This paper describes QueueVadis, a partic-ipatory sensing-based system that first uses an individual’s smart-phone sensors to identify individual queuing episodes. It then usesthe properties of multiple such queuing episodes (from differentindividuals) to (a) separate individuals across multiple queues (cur-rently based on the trajectory trace of entire queuing episodes) and(b) derive robust estimates of queue properties (specifically the ser-vice time and the overall waiting time). This participatory paradigmoffers an alternative to infrastructure-based solutions, such as useof video camera-based analytics [17, 12] or store-specific Wi-FiAPs [15]). In particular, our experience suggests that deployingany infrastructure (even if fairly inexpensive), ubiquitously acrosshundreds of retail establishments or taxi stands, is extremely hard,especially for the specific “narrow” problem of queuing-analytics.In contrast, QueueVadis can be embedded in venue-specific mobileApps (that often exist for malls, campuses etc.) to opportunisticallycollect individual-level sensor data–we show that QueueVadis pro-vides useful estimates even with participation rates as low as 10%.
Our key challenges, approaches and contributions are as follows.A Movement-based Queuing Classifier: To enable identifica-
tion of queuing behavior without any infrastructural aids, we de-velop a two-tier activity classification model for smartphones thatexploits the repetitive micro activity sequence of queuing, con-sisting principally of “standing’, interspersed with short bursts of“stepping forward”. We implement this basic model efficiently oncommodity smartphones; moreover, to monitor individual queuingbehavior with very low energy overhead, we use coarse-grained lo-cation triggers to activate such classifiers.
Adaptation to Varying Queue Service Times: Based on em-pirical queue observations, collected at over 39 real-world loca-tions across two Asian cities (Singapore and Tokyo), we foundthat queues exhibit significant variability, in terms of service rateand overall queuing delay. Moreover, even within a single queue,there were both short (few minutes) and longer time-scale (hourof the day) variation in these metrics. To detect queuing accu-rately and robustly across such variations, the QueueVadis clientemploys multiple concurrent tier-2 classifiers (operating at differ-ent timescales).
Robustness to Human Behavioral Artifacts: Our empiricalmeasurements also showed two important usage-based artifacts:queue shape / orientation and premature leaving behavior. Wefound that users line up at different queues within a single crowdedvenue, such as a food court, in various organic shapes: sometimesin a straight-line, but often in a randomly curvy and even ‘snaking’(with 180deg turns) fashion. Moreover, in queues such as at F&Bstores and taxi-stands, users can occasionally leave a queue prema-turely (often out of impatience). We show that our QueueVadisclient’s orientation-independent technique for classifying behav-ior achieves robust queuing detection across a variety of real-world

queue shapes and orientations. Moreover, by utilizing appropriatestatistical filtering of outliers, the QueueVadis server can identifyand eliminate spurious estimates from individuals who depart pre-maturely.
Handling Low Participatory Rates: A participatory systemsuch as QueueVadis must deal with the bootstrapping problem, pro-viding reasonably useful service and wait time estimates even whenthe fraction of individuals with “participatory probes” is relativelylow. To achieve this, QueueVadis utilizes a unique approach of ob-taining multiple service time estimates from the time intervals be-tween successive “shuffle forward” activities of each participatingindividual–the multiplicity of such observations helps QueueVadisbe very resilient to wide variations in the participation rate (thestandard deviation of service time estimates show only a 12.7% in-crease, when the fraction of queuing individuals with QueueVadisdrops from 100% to 10%).
Multiple Queues in Close Proximity: Across public venues inAsia, multiple queues occur in very close proximity (e.g, F&B out-lets in a food court), often separated by less than 1–2 meters. Identi-fying multiple distinct queues, and separating individuals into thesequeues, is a non-trivial challenge indoors, as practical RF-basedtechniques (e.g., the Wi-Fi AP based approach in [15]) currentlyhave location errors of ±4–5 meters [3] or higher. To address thischallenge, QueueVadis utilizes a novel classification technique toidentify the number of distinct queues, and then associates eachqueuing individual to his/her corresponding queue. The classifica-tion combines (i) temporal correlation features to identify phase-shifted movement behavior among individuals in the same queue,with (ii) a coarse-grained trajectory matching technique (utilizingthe magnetic compass) to separate out queuing at multiple closelylocated queues. Experiments on real-world venues shows a disam-biguation accuracy of over 70% (for the “Where to Go?” scenario,where one can use the movement behavior over the entire queuingepisode retrospectively), even at low (20%) participation rates.
Based on extensive testing of QueueVadis across 23 differentreal-life queues in Tokyo and Singapore, we show that QueueVadisis able to infer the duration of individual queuing episodes with amedian error of less than 10% (an estimation error of 1-1.25 min-utes, given a median wait time of around 10 minutes during peakhours at F&B outlets) and provide estimates of the service and waittimes with a median error of 10-15% (a median error of approx. 9secs in detecting the onset of queuing at typical F&B outlets).
2. MOTIVATING SCENARIOSQueuing is very clearly a significant problem in various places–
note that restaurant wait times in Singapore have been known toreach 40 minutes or longer [1], while a Tokyo Disneyland attrac-tion made headlines in 2012 with a 500 minute wait time [2]! Weenvision two key use cases that can leverage upon QueueVadis’ au-tomated detection of queuing behavior:
1 Where To Go?: In this scenario, an office worker looking toget a quick lunch is trying to decide which of several queues(at multiple nearby food courts) has the shortest waiting time.To satisfy this scenario, QueueVadis must estimate the waittimes of all of the queues in the area.
2 Waiting Worth It: In this scenario, a coffee shop in a mallwould like to identify the specific individuals who have beenwaiting for longer than 10 minutes, and push them an addi-tional discount, so as to minimize customer dissatisfaction.
These two scenarios capture the fundamental objectives that drivethe design of QueueVadis. They differ in their accuracy and recencyrequirements: (a) Where To Go? will be effective with relativelycoarser ballpark estimates of queue wait times (users are unlikely
to require precise wait-times); (b) Waiting Worth It, on the otherhand, requires more accurate and relatively real-time estimates de-rived from users currently in the queue. Moreover, Waiting WorthIt also requires the identity of the specific queuing individual–thisis extremely hard to do reliably, in crowded urban spaces, usinginfrastructure-based approaches such as video analytics.
3. UNDERSTANDING REAL QUEUESBefore building QueueVadis, we analyze the properties of human-
generated queues, based on extensive observations made in Singa-pore and Tokyo. We begin with a concise description of the fun-damental queue properties that we desire to study, followed by ananalysis of queuing at real-world locations, in terms of the varia-tions observed in those properties and in the orientation/trajectoryof individuals who physically queue at those locations.
3.1 Mathematical Queue PropertiesFrom queuing theory, we identify the following key parameters
of any single queue:1 Service time ( 1
µ ): The service time is a random variable thatdenotes the amount of time taken by the currently-servedcustomer to complete her transaction.
2 Wait time (Tw): This random variable denotes the total timetaken by a newly arriving customer to complete the desiredtransaction — note that it includes the queuing time (Tq) andthe service time. In other words, for any individual customeri, Tw(i) = Tq(i)+ 1
µ (i).In addition to these parameters, the dynamics of the queue are gov-erned by the arrival rate (number of arrivals per second) of cus-tomers (denoted as λ). In practice, we cannot observe (at least ina participatory manner), the true arrival rate λ, or the number ofpeople (Nq) currently in the queue. We now study the variation inthese properties, as observed empirically at a variety of real-worldlocations.
3.2 Variations in Real-World QueuesWe videotaped the evolution of queues (as well as the movement
patterns of each individual person) at 39 venues across Singaporeand Tokyo (on multiple days, spanning several months), including5 airport check-in counters, 5 airport boarding areas, 10 F&B lo-cations, 10 movie ticketing venues, 7 taxi stations, and 2 differentamusement park ride areas. Table 1 shows the different types ofqueues we explicitly observed, along with the characteristic func-tions performed at the respective service counters, as well as thecomputed values for: a) the service time statistics (avg, min, max,stdev) for each type of queue, and b) the duration of the contigu-ous stepping and standing activities (avg, min, max, stdev) duringqueuing activity. (At each queue venue, the stepping and stand-ing activity durations of at least 50 samples by 10 different peoplewere measured–e.g., numbers in “Airport check-in” are based on250 samples from 5 venues.)
3.2.1 Service Times for Different Queuing TypesAs may be expected, there is a clearly a wide variation in the av-
erage values of service times ( 1µ ) across different categories/types
of queues (e.g., movie theater queues move fast, while airport check-in takes over 1.5 minutes). Even in the same category, two differentqueues could have significantly different mean values–e.g., in thecase of the two amusement park queues, one has users steppingforward (implicitly indicating that a visitor entered the attraction)once every 8 secs, whereas the other queue shows similar steppingforward movement every 4 secs. Also, for certain specific queues,there is a significant variation in the service times (when observed

People’s Movements in the Queue (s)Location Queue Type Characteristics Service Interval (s) Stepping Standing
(number of venues) Min. Ave. Max. Stdev. Min. Ave. Max. Stdev. Min. Ave. Max. Stdev.
Singapore Airport check-in (5) V, N, P, Sel 10.7 102.1 421.7 136.9 1.7 5.7 16.0 2.8 2.0 55.3 203.0 42.7Singapore Airport boarding (5) V, Sec 4.3 7.8 15.6 2.9 0.5 2.9 9.1 1.6 0.7 5.3 14.5 3.0Singapore Food and beverage (5) P, Sel 10.3 32.9 77.0 17.8 0.6 2.2 4.4 0.9 1.5 20.0 54.6 12.7Singapore Movie ticketing (5) P, Sel 5.0 7.9 11.5 2.3 1.3 3.4 10.2 1.7 1.2 21.5 42.0 13.6Singapore Taxi station (2) Sel 9.6 50.8 85.4 27.8 1.2 2.2 3.6 0.7 19.5 46.8 88.6 20.3Singapore Amusement park ride 1 V N/A N/A N/A N/A 1.0 8.0 30.6 6.0 1.0 7.9 37.5 6.2Singapore Amusement park ride 2 V N/A N/A N/A N/A 1.0 4.4 21.7 4.0 1.1 53.4 145.0 46.1
Tokyo Food and beverage (5) P, Sel 19.0 51.9 128.2 28.4 1.7 3.1 5.1 0.9 1.7 37.1 132.0 30.1Tokyo Movie ticketing (5) P, Sel 6.5 23.1 39.9 15.3 1.2 2.4 4.2 1.8 1.1 30.5 67.6 23.3Tokyo Taxi station (5) Sel 8.6 15.9 47.2 8.5 0.6 2.6 5.1 1.1 1.4 13.3 66.8 11.7
For the Characteristics column, V = Validation (checking of tickets etc.), N = Negotiations (baggage allowance, flight routingetc.), P = Purchase (exchange of money), Sec = Security (security check of documents, items, etc), and Sel = Selection (pickingspecific seats, food products, etc.). N/A = Not Available due to difficulty in observation
Table 1: Taxonomy of Queues
over a multi-day time period)— a classic example is the airportcheck-in queue, where the standard deviation in the service time(136.9 secs) exceeds the average value (102.1 secs).
3.2.2 Temporal Variation in Service TimeWe also collected additional longitudinal data at multiple times
(both off-peak and peak periods) on different days, over a 1 weekspan, at the beverage stall in the food court of a Singapore-baseduniversity. Figure 1 plots the service time and its standard devia-tion, experienced by 15 consecutive people queuing, at three dif-ferent days (Monday, Wednesday & Friday) during the morningsession, whereas Table 2 plots the mean values of service time atdifferent times on a normal working day. Clearly, even for a spe-cific queue, the service time is still highly unpredictable even overshorter timescales. For example, in Figure 1, we observe that theservice time on Monday varied by a factor of 9 (20sec-180sec), andon Friday by a factor of 7 (20sec-140sec). Moreover, the servicetime distribution (and mean) exhibits clear time-of-the-day effectsas well: from Table 2, we observe that service during lunch is muchfaster and less variable (mean of 27.6 sec and std. deviation of 9.2sec), compared to service during breakfast or dinner times.
0"20"40"60"80"
100"120"140"160"180"200"
1" 2" 3" 4" 5" 6" 7" 8" 9" 10" 11" 12" 13" 14" 15"
Service'Time'(Sec)
15'Consecu4ve'Customers
Monday" Wednesday" Friday"
Figure 1: Service Time Variation (F&B@Uni 9:30-10am)
Time of Day Service Time (secs)Min Max Mean Std. Dev.
Breakfast (9:30-10am) 15 174 52.5 36.7Lunch (12:30-1pm) 15 40 27.6 9.2Dinner (7-7:30pm) 8 97 46.4 25.6
Table 2: Time-of-Day Variations in Service Time
3.2.3 Diversity of Queue OrientationsTo understand the behavior of multiple proximate queues, we
empirically recorded, over a period of 1 hour during the busy lunch
period, the evolution of all the queues that formed in the food courtof the university in Singapore. Figure 2 shows a schematic of thelayout of the food court (with the different food stalls arrangedalong the periphery and the rectangular island in the center), alongwith the orientation/shape of the queues that formed for the dif-ferent stalls (each stall is roughly 2.5-3 meters wide). The figuresshows that, in dense environments, where the tight layout of ta-bles and the sheer volume of crowds create some natural barriers toqueuing, the queues evolve in an organic fashion, rather in orderlystraight-lines. In certain cases (e.g., at the ‘Malay’ food stall), thequeue exhibited a horseshoe pattern, doubling back on itself. Wealso see that nearby queues exhibit discernibly different queuingtrajectories, an observation that we shall further explore (in Sec-tion 8) for disambiguating among multiple queues.
Chinese Indian Taiwanese
Food Stalls Seating Direction of Queue
JapaneseFish
SoupWestern Thai Korean Yong
Tau FuDuckRice
Seafood
Malay
Fruits
Dim Sum
Pizza
Drinks
Figure 2: Multiple University Food Court Queues (12:15-1pm)
3.2.4 Queue Joining/Leaving BehaviorWe also carefully analyzed the video traces for situations where
an individual either cut-in to the queue (joining at an intermediatepoint), or left preemptively (before reaching the end of the queue).Overall, from the approx. 210 individuals (with an overall ob-servation duration of over 80 minutes) that we visually analyzed,we found such incidents to be rare–only 1.46% of the users (i.e.,3 users) left the queue preemptively, while a similar number (3users) cut-in to the queue (only at the airport). This suggests thatout of order arrival or departures are uncommon in most “normal”queues. However, in several cases, we observed the phenomenon of“group-driven lingering", where individuals would wait at the ser-vice counter for other members of their group to finish their trans-actions, before leaving the queuing area together.
4. QUEUEVADISThis section introduces the QueueVadis system architecture, for
detecting individual queuing episodes and analysis of aggregatequeue properties. We first outline our design goals and then de-scribe the overall QueueVadis architecture.
4.1 Design Goals & AssumptionBased on the realization that real-world queues exhibit a lot of
diversity, across multiple attributes, we focused on the followinggoals for QueueVadis:
• Supporting In-Service, Physical Queues of Arbitrary Shape:QueueVadis seeks to monitor and estimate properties of in-service, physical queues of arbitrary shape, that capture themajority of queues commonly observed at restaurants, foodcourts, movie theaters, supermarkets, taxi stands and similarvenues. We explicitly do not focus on virtual queues (e.g,.deli-style queues where individuals take a number and thenwait to be called), both because such queues have no distin-guishing physical movement characteristics, and because thequeue size is directly available from the corresponding in-frastructural component (e.g., the ticket dispensing machine).• Adaptation to Varying Service Times: As real world queues
show significant variance in service times, QueueVadis’ clas-sification logic should be able to accommodate large (at leasttwo orders of magnitude) variations in 1
µ .• Disambiguation for Multiple Proximate Queues: The Queue-
Vadis server should be able to identify if two customers arequeuing in the same or different queues, which occur in closeproximity (making them difficult to separate out on the basisof practical localization technologies).• Robustness to Variable Participation Rate: QueueVadis’ abil-
ity to provide estimates for queuing and service times shoulddegrade gracefully, as the set of observed samples (the pro-portion of queuing customers who use QueueVadis) becomessmaller. Moreover, the ability to perform queue disambigua-tion should be robust to changes in the participation rate.• Minimize Detection Latency: To support scenarios such as
Waiting Worth it, QueueVadis must be able to quickly detectthe onset and the end of a queuing episode, while avoidingspurious oscillations (between “queuing” and “non-queuing”)and false positives.• Resource Efficiency: The QueueVadis client should mini-
mize the energy overheads associated with the sampling andprocessing of sensor (accelerometer and magnetic compass)data, by either modifying the processing pipeline and/or lim-iting the duration during which such queuing-related sensingis activated.• Use No Additional Infrastructure: As stated in the introduc-
tion, one of the key goals of QueueVadis is to explore the pos-sibility of smartphone-based queue detection. Venue owners(malls, airports, etc.) can use QueueVadis with their existingapplications (which they are already developing) to obtainqueue detection capabilities without additional infrastruc-tural investments (and associated feasibility, tendering, in-stallation, and support costs). However, QueueVadis is com-plementary to, and thus backward and forward compatiblewith, infrastructure-based queue detection solutions.
QueueVadis’ design assumes (but does not mandate) the exis-tence of an external service that can track a user’s location at coarse-grained granularity (e.g., with ±8− 10 meter accuracy). This hasbeen empirically demonstrated to be possible in many public spaces.Such location monitoring serves as a useful trigger for the Queue-Vadis client– QueueVadis is triggered only when the user is in thevicinity of locations where queuing is plausible (e..g, near or at thefood court, near the taxi stand), and is kept dormant when the useris at other implausible locations (e.g., working inside her office, orat the gym).
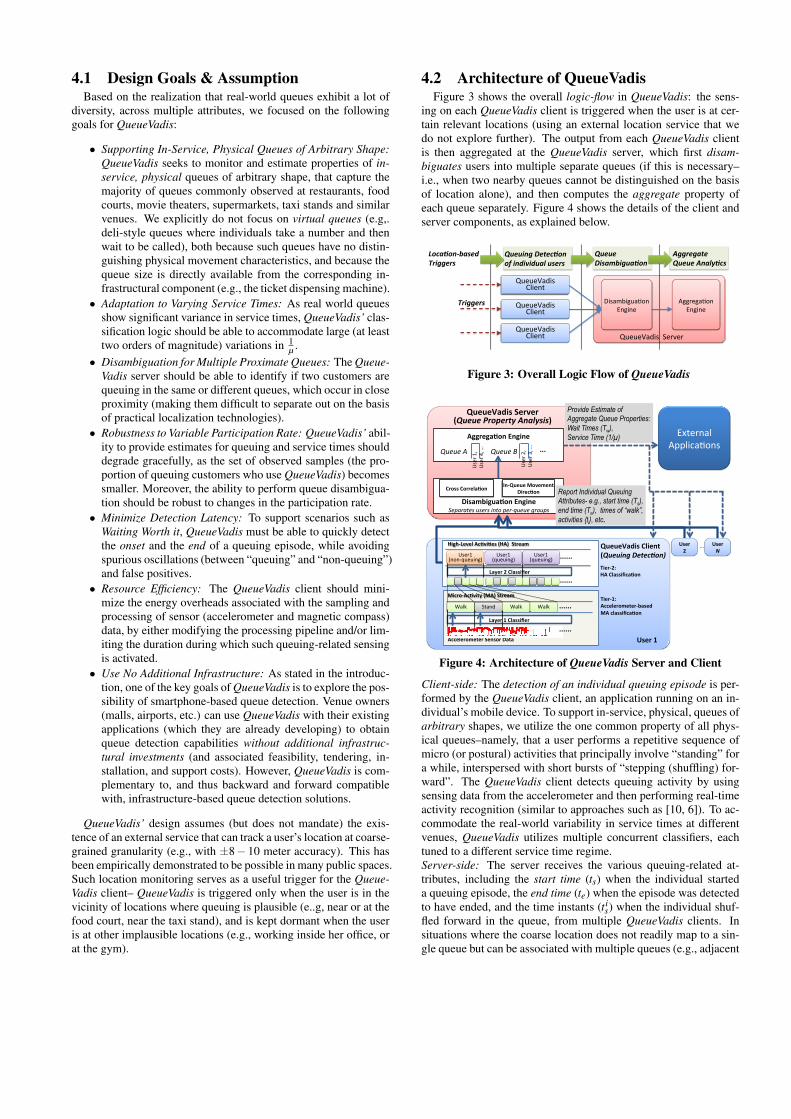
4.2 Architecture of QueueVadisFigure 3 shows the overall logic-flow in QueueVadis: the sens-
ing on each QueueVadis client is triggered when the user is at cer-tain relevant locations (using an external location service that wedo not explore further). The output from each QueueVadis clientis then aggregated at the QueueVadis server, which first disam-biguates users into multiple separate queues (if this is necessary–i.e., when two nearby queues cannot be distinguished on the basisof location alone), and then computes the aggregate property ofeach queue separately. Figure 4 shows the details of the client andserver components, as explained below.
QueueVadis)Client)
Queuing'Detec+on'of'individual'users�
Queue'Disambigua+on�
Aggregate'Queue'Analy+cs�
Disambigua2on)Engine)
Aggrega2on)Engine)
Loca+on9based'Triggers�
QueueVadis)Client)
QueueVadis)Client)
Triggers�
QueueVadis))Server�
))))�Figure 3: Overall Logic Flow of QueueVadis
Accelerometer)Sensor)Data User)1
High6Level)Ac9vi9es)(HA)))Stream
User1&(non*queuing)&
QueueVadis)Client)(Queuing'Detec+on) Tier62: HA)Classifica9on
Tier61:) Accelerometer6based)MA)classifica9on
QueueVadis)Server)(Queue'Property'Analysis)
Disambigua9on)Engine Separates(users(into(per-queue(groups
Provide Estimate of Aggregate Queue Properties: Wait Times (Tw), Service Time (1/µ) Aggrega9on)Engine)
)
Report Individual Queuing Attributes- e.g., start time (Ts), end time (Te), times of “walk”, activities {ti}, etc.
External&Applica8ons&
User)2
User)N
...�
Queue(A Queue(B
User&1
,&&User&4
,&…&
User&2
,&&User&3
,&…&
Cross)Correla9on� In6Queue)Movement)Direc9on�
......�
...�
User1&(queuing)&
User1&(queuing)&
Layer)1)Classifier
Walk& Stand& Walk& Walk& ......�
......�
Layer)2)Classifier
Micro6Ac9vity)(MA))Stream
......�
Figure 4: Architecture of QueueVadis Server and Client
Client-side: The detection of an individual queuing episode is per-formed by the QueueVadis client, an application running on an in-dividual’s mobile device. To support in-service, physical, queues ofarbitrary shapes, we utilize the one common property of all phys-ical queues–namely, that a user performs a repetitive sequence ofmicro (or postural) activities that principally involve “standing” fora while, interspersed with short bursts of “stepping (shuffling) for-ward”. The QueueVadis client detects queuing activity by usingsensing data from the accelerometer and then performing real-timeactivity recognition (similar to approaches such as [10, 6]). To ac-commodate the real-world variability in service times at differentvenues, QueueVadis utilizes multiple concurrent classifiers, eachtuned to a different service time regime.Server-side: The server receives the various queuing-related at-tributes, including the start time (ts) when the individual starteda queuing episode, the end time (te) when the episode was detectedto have ended, and the time instants (t i
s) when the individual shuf-fled forward in the queue, from multiple QueueVadis clients. Insituations where the coarse location does not readily map to a sin-gle queue but can be associated with multiple queues (e.g., adjacent
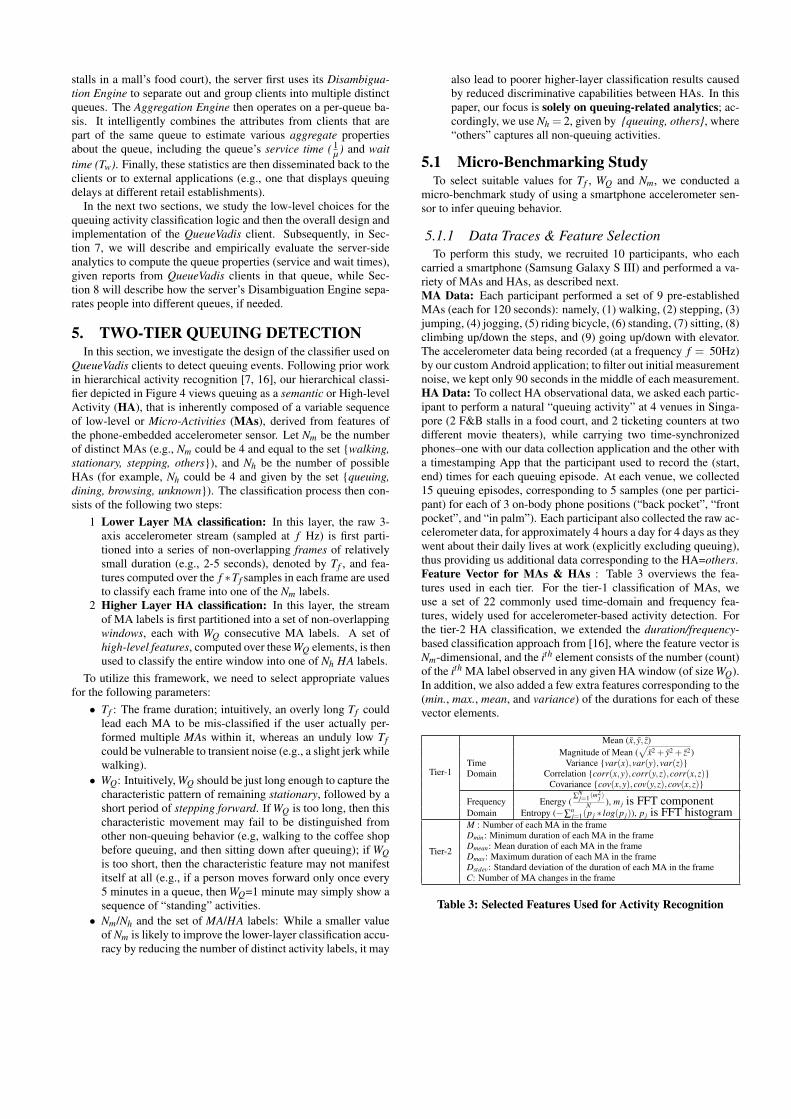
stalls in a mall’s food court), the server first uses its Disambigua-tion Engine to separate out and group clients into multiple distinctqueues. The Aggregation Engine then operates on a per-queue ba-sis. It intelligently combines the attributes from clients that arepart of the same queue to estimate various aggregate propertiesabout the queue, including the queue’s service time ( 1
µ ) and waittime (Tw). Finally, these statistics are then disseminated back to theclients or to external applications (e.g., one that displays queuingdelays at different retail establishments).
In the next two sections, we study the low-level choices for thequeuing activity classification logic and then the overall design andimplementation of the QueueVadis client. Subsequently, in Sec-tion 7, we will describe and empirically evaluate the server-sideanalytics to compute the queue properties (service and wait times),given reports from QueueVadis clients in that queue, while Sec-tion 8 will describe how the server’s Disambiguation Engine sepa-rates people into different queues, if needed.
5. TWO-TIER QUEUING DETECTIONIn this section, we investigate the design of the classifier used on
QueueVadis clients to detect queuing events. Following prior workin hierarchical activity recognition [7, 16], our hierarchical classi-fier depicted in Figure 4 views queuing as a semantic or High-levelActivity (HA), that is inherently composed of a variable sequenceof low-level or Micro-Activities (MAs), derived from features ofthe phone-embedded accelerometer sensor. Let Nm be the numberof distinct MAs (e.g., Nm could be 4 and equal to the set {walking,stationary, stepping, others}), and Nh be the number of possibleHAs (for example, Nh could be 4 and given by the set {queuing,dining, browsing, unknown}). The classification process then con-sists of the following two steps:
1 Lower Layer MA classification: In this layer, the raw 3-axis accelerometer stream (sampled at f Hz) is first parti-tioned into a series of non-overlapping frames of relativelysmall duration (e.g., 2-5 seconds), denoted by Tf , and fea-tures computed over the f ∗Tf samples in each frame are usedto classify each frame into one of the Nm labels.
2 Higher Layer HA classification: In this layer, the streamof MA labels is first partitioned into a set of non-overlappingwindows, each with WQ consecutive MA labels. A set ofhigh-level features, computed over these WQ elements, is thenused to classify the entire window into one of Nh HA labels.
To utilize this framework, we need to select appropriate valuesfor the following parameters:• Tf : The frame duration; intuitively, an overly long Tf could
lead each MA to be mis-classified if the user actually per-formed multiple MAs within it, whereas an unduly low Tfcould be vulnerable to transient noise (e.g., a slight jerk whilewalking).• WQ: Intuitively, WQ should be just long enough to capture the
characteristic pattern of remaining stationary, followed by ashort period of stepping forward. If WQ is too long, then thischaracteristic movement may fail to be distinguished fromother non-queuing behavior (e.g, walking to the coffee shopbefore queuing, and then sitting down after queuing); if WQis too short, then the characteristic feature may not manifestitself at all (e.g., if a person moves forward only once every5 minutes in a queue, then WQ=1 minute may simply show asequence of “standing” activities.• Nm/Nh and the set of MA/HA labels: While a smaller value
of Nm is likely to improve the lower-layer classification accu-racy by reducing the number of distinct activity labels, it may
also lead to poorer higher-layer classification results causedby reduced discriminative capabilities between HAs. In thispaper, our focus is solely on queuing-related analytics; ac-cordingly, we use Nh = 2, given by {queuing, others}, where“others” captures all non-queuing activities.
5.1 Micro-Benchmarking StudyTo select suitable values for Tf , WQ and Nm, we conducted a
micro-benchmark study of using a smartphone accelerometer sen-sor to infer queuing behavior.
5.1.1 Data Traces & Feature SelectionTo perform this study, we recruited 10 participants, who each
carried a smartphone (Samsung Galaxy S III) and performed a va-riety of MAs and HAs, as described next.MA Data: Each participant performed a set of 9 pre-establishedMAs (each for 120 seconds): namely, (1) walking, (2) stepping, (3)jumping, (4) jogging, (5) riding bicycle, (6) standing, (7) sitting, (8)climbing up/down the steps, and (9) going up/down with elevator.The accelerometer data being recorded (at a frequency f = 50Hz)by our custom Android application; to filter out initial measurementnoise, we kept only 90 seconds in the middle of each measurement.HA Data: To collect HA observational data, we asked each partic-ipant to perform a natural “queuing activity” at 4 venues in Singa-pore (2 F&B stalls in a food court, and 2 ticketing counters at twodifferent movie theaters), while carrying two time-synchronizedphones–one with our data collection application and the other witha timestamping App that the participant used to record the (start,end) times for each queuing episode. At each venue, we collected15 queuing episodes, corresponding to 5 samples (one per partici-pant) for each of 3 on-body phone positions (“back pocket”, “frontpocket”, and “in palm”). Each participant also collected the raw ac-celerometer data, for approximately 4 hours a day for 4 days as theywent about their daily lives at work (explicitly excluding queuing),thus providing us additional data corresponding to the HA=others.Feature Vector for MAs & HAs : Table 3 overviews the fea-tures used in each tier. For the tier-1 classification of MAs, weuse a set of 22 commonly used time-domain and frequency fea-tures, widely used for accelerometer-based activity detection. Forthe tier-2 HA classification, we extended the duration/frequency-based classification approach from [16], where the feature vector isNm-dimensional, and the ith element consists of the number (count)of the ith MA label observed in any given HA window (of size WQ).In addition, we also added a few extra features corresponding to the(min., max., mean, and variance) of the durations for each of thesevector elements.
Tier-1
Mean (x, y, z)Magnitude of Mean (
√x2 + y2 + z2)
Time Variance {var(x),var(y),var(z)}Domain Correlation {corr(x,y),corr(y,z),corr(x,z)}
Covariance {cov(x,y),cov(y,z),cov(x,z)}
Frequency Energy (∑
Nj=1(m
2j )
N ), m j is FFT componentDomain Entropy (−∑
nj=1(p j ∗ log(p j)), p j is FFT histogram
Tier-2
M : Number of each MA in the frameDmin: Minimum duration of each MA in the frameDmean: Mean duration of each MA in the frameDmax: Maximum duration of each MA in the frameDstdev: Standard deviation of the duration of each MA in the frameC: Number of MA changes in the frame
Table 3: Selected Features Used for Activity Recognition

5.1.2 Parameters for MA and HA DetectionWe experimented with three different sets of MA labels:
1 MA-2, a coarse-grained set of 2 MA labels, consisting of just{Stationary (sitting, standing) and Moving (all others)}.
2 MA-3, a medium-grained set of 3 MA labels, consisting ofjust {Stationary (standing), Moving (stepping, walking), andOthers (all others)}.
3 MA-4, a fine-grained set of 4 MA labels, consisting of the ac-tivities {Stationary (standing), Stepping, Walking, and Oth-ers (all others)},
These three choices for MA labels helps us to understand how theHA classification accuracy would change, given finer or coarsergrained locomotive labels at the lower-tier.
5.1.3 MA & HA AccuracyFigure 5 shows the MA-level accuracy for the all MA labels, as
a function of the frame length Tf . The results are obtained throughan 100-fold cross validation study performed using the J48 clas-sifier implemented in Weka[9]. The results show that the classi-fication accuracy for MA-2 is clearly superior to MA-3 and MA-4 (as expected), remaining above 97% for all values of Tf . Theclassification accuracy for MA-3 and MA-4, on the other hand,increases as the frame size is increased, reaching approximately84.1% (MA-3 when Tf = 3secs) and approximately 76.4% (MA-4when Tf = 3secs) as their peaks.
0"
10"
20"
30"
40"
50"
60"
70"
80"
90"
100"
0.5" 1" 1.5" 2" 2.5" 3" 3.5" 4"
Cross%V
alida+
on%Correctne
ss%Rate%(%
)�
Tf%values%(seconds)�
MA2"MA3"MA4"
Figure 5: MA Detection Accuracy vs. Frame Length
We next plot, in Figure 6, the choice that the MA labels has onthe higher-layer ‘queuing detection’ accuracy vs. the window sizeWQ; we use Tf = 3secs, which provided the overall highest MA-level accuracy in MA detection). Given that different types of real-world queues have significantly different service times (observed inSection 3.2.1), we expect that the impact of WQ will be different fordifferent queue types. Accordingly, the accuracy values are plottedseparately for two different types of queuing venues in Singapore:F&B & Movie Ticketing). We observe two important characteris-tics:
a) When we focus on HA classification accuracy, MA-3 andMA-4 based classification outperform MA-2 (clearly describ-ing MAs in terms of moving vs. stationary does not help toseparate queuing behavior as strongly), often providing clas-sification accuracy gains of 10-20%. This motivates us tochoose MA-3 as our preferred set of MA labels in the subse-quent design and implementation of QueueVadis.
b) The optimal choice of the window size WQ (based on the bestcross validation rate) depends on the category (type) of thequeue, and we clearly see that the accuracy can be poor if WQis too small. Intuitively, for queues with larger service times,WQ must be larger, as the user will exhibit the characteristic“stepping” movement only over longer time intervals. Evenfor the same queuing type, the highest accuracy occurs at
50#
55#
60#
65#
70#
75#
80#
85#
90#
95#
100#
10# 15# 20# 25# 30# 35# 40# 45# 50# 55#
Cross%V
alida+
on%Correctne
ss%Rate%(%
)�
Wq%Values%(Number%of%+er91%frames)�
MA3#
MA4#
MA2#
50#
55#
60#
65#
70#
75#
80#
85#
90#
95#
100#
10# 15# 20# 25# 30# 35# 40# 45# 50# 55#
Cross%V
alida+
on%Correctne
ss%Rate%(%
)�
Wq#Values%(Number%of%+er91%frames)�
MA3#
MA4#
MA2#
(a) F&B (b) Ticketing
Figure 6: HA Detection Accuracy vs. Window Size
different values of WQ, due to the short and medium term (asobserved in Figure 1) fluctuations in service times.
5.2 Key TakeawaysOur detailed micro-study of MA and HA classification at multi-
ple queuing venues leads to a few interesting design choices for theclassifier in the QueueVadis’ client:• Micro-Activity Settings: We choose i) Tf = 3secs, ii) and Nm =
3, given by {Stationary, Moving, Others}, as the most robustparameter choices for queuing detection.• Choice of WQ: We realize that there is no unique and optimal
choice for WQ, even for a single queue type, as the servicetimes can show high variance. Hence, we shall next describehow the QueueVadis client uses multiple, concurrent layer-2classifiers, each tuned to a specific WQ.
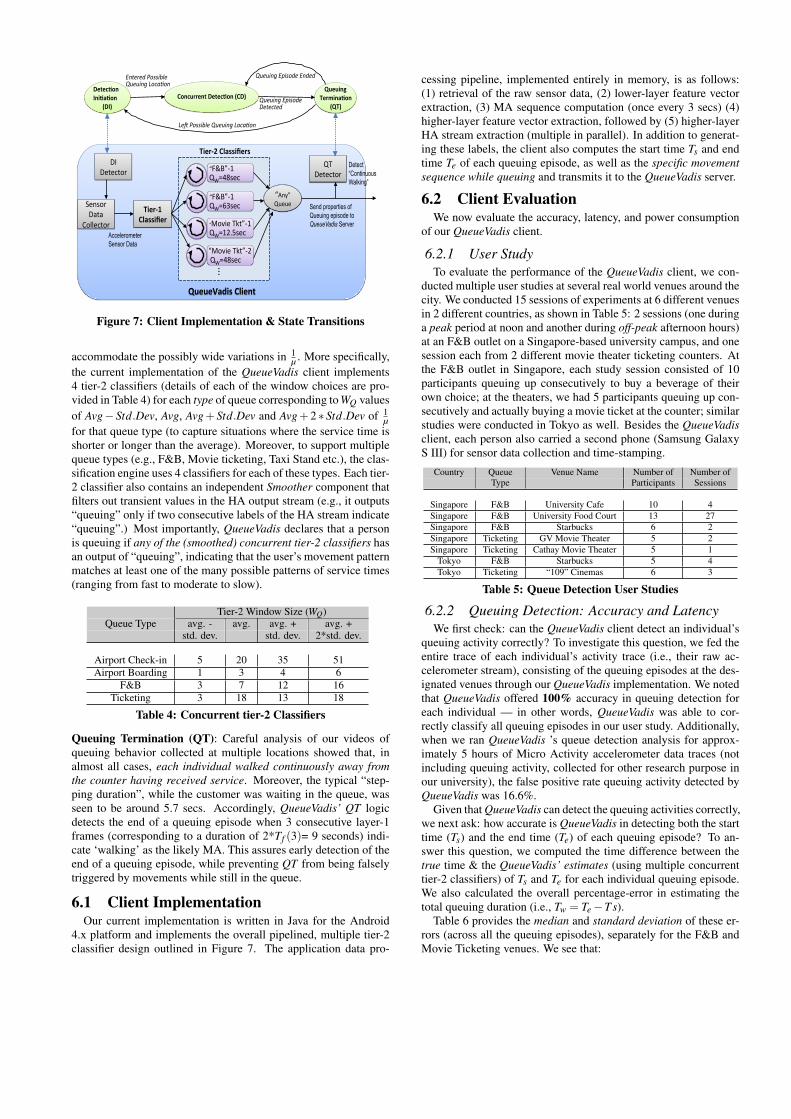
6. QUEUEVADIS CLIENTIn this section, we describe how the QueueVadis client oper-
ates on a personal mobile device to detect an individual’s queu-ing episodes. The QueueVadis client operates in three-states, illus-trated in Figure 7: Detection Initiation (DI) , Concurrent Detection(CD) and Queuing Termination (QT). In the standard operationalparadigm, QueueVadis starts off in the low-energy DI state (withthe accelerometer sensor and the classifier logic turned off) andremains there until it receives external “location triggers”, indicat-ing that the individual may potentially be queuing. At that time,QueueVadis transitions to the CD state, where it activates the ac-celerometer sensor and the classifier, so as to detect the onset of aqueuing activity. Once a queuing activity is detected, QueueVadistransitions to the QT state, where it now instead begins to look formarkers that the ongoing queuing activity has ended, at which pointit transitions back to the DI state.Detection Initiation (DI): QueueVadis assumes the existence of anexternal location tracking system, that triggers the transition to theCD state, only when an individual’s location suggests that queuingmay be possible. In our experimental system deployed on the SMUcampus, we currently have such a Wi-Fi based location system op-erationally deployed. As an episode of queuing is highly likely tooccur on or near only certain locations (e.g., the food court on thecampus or at the movieplex), we expect the QueueVadis client tostay in the low-power DI state for most of the day (e.g., when theuser is working in her office or riding on the bus).Concurrent Detection (CD): When the individual is at locationswhere queuing may be possible, the QueueVadis client activates thetwo-tier classifier described previously. One important differencefrom past work is that the QueueVadis client activates multiple tier-2 (HA) classifiers, each with a different value of WQ in parallel, to
QueueVadis)Client
Detec1on)Ini1a1on
(DI)
Le#$Possible$Queuing$Loca1on
Concurrent)Detec1on)(CD) Queuing)
Termina1on (QT))!!
“F&B”'1!QW=48sec!
Tier:2)Classifiers
Tier:1)Classifier
“Any”!Queue!!
Detect “Continuous Walking”
Entered$Possible$ Queuing$Loca1on
Queuing$Episode$Ended
Queuing$Episode$ Detected
Sensor!!Data!
Collector!
QT!Detector!
“F&B”'2!QW=63sec!
DI!Detector!
Send properties of Queuing episode to QueueVadis Server
Accelerometer Sensor Data
“Movie!Tkt”'1!QW=12.5sec!
“Movie!Tkt”'2!!QW=48sec!
“F&B”'1!QW=63sec!
...�
Figure 7: Client Implementation & State Transitions
accommodate the possibly wide variations in 1µ . More specifically,
the current implementation of the QueueVadis client implements4 tier-2 classifiers (details of each of the window choices are pro-vided in Table 4) for each type of queue corresponding to WQ valuesof Avg− Std.Dev, Avg, Avg+ Std.Dev and Avg+ 2 ∗ Std.Dev of 1
µfor that queue type (to capture situations where the service time isshorter or longer than the average). Moreover, to support multiplequeue types (e.g., F&B, Movie ticketing, Taxi Stand etc.), the clas-sification engine uses 4 classifiers for each of these types. Each tier-2 classifier also contains an independent Smoother component thatfilters out transient values in the HA output stream (e.g., it outputs“queuing” only if two consecutive labels of the HA stream indicate“queuing”.) Most importantly, QueueVadis declares that a personis queuing if any of the (smoothed) concurrent tier-2 classifiers hasan output of “queuing”, indicating that the user’s movement patternmatches at least one of the many possible patterns of service times(ranging from fast to moderate to slow).
Tier-2 Window Size (WQ)Queue Type avg. - avg. avg. + avg. +
std. dev. std. dev. 2*std. dev.
Airport Check-in 5 20 35 51Airport Boarding 1 3 4 6
F&B 3 7 12 16Ticketing 3 18 13 18
Table 4: Concurrent tier-2 Classifiers
Queuing Termination (QT): Careful analysis of our videos ofqueuing behavior collected at multiple locations showed that, inalmost all cases, each individual walked continuously away fromthe counter having received service. Moreover, the typical “step-ping duration”, while the customer was waiting in the queue, wasseen to be around 5.7 secs. Accordingly, QueueVadis’ QT logicdetects the end of a queuing episode when 3 consecutive layer-1frames (corresponding to a duration of 2*Tf (3)= 9 seconds) indi-cate ‘walking’ as the likely MA. This assures early detection of theend of a queuing episode, while preventing QT from being falselytriggered by movements while still in the queue.
6.1 Client ImplementationOur current implementation is written in Java for the Android
4.x platform and implements the overall pipelined, multiple tier-2classifier design outlined in Figure 7. The application data pro-
cessing pipeline, implemented entirely in memory, is as follows:(1) retrieval of the raw sensor data, (2) lower-layer feature vectorextraction, (3) MA sequence computation (once every 3 secs) (4)higher-layer feature vector extraction, followed by (5) higher-layerHA stream extraction (multiple in parallel). In addition to generat-ing these labels, the client also computes the start time Ts and endtime Te of each queuing episode, as well as the specific movementsequence while queuing and transmits it to the QueueVadis server.
6.2 Client EvaluationWe now evaluate the accuracy, latency, and power consumption
of our QueueVadis client.
6.2.1 User StudyTo evaluate the performance of the QueueVadis client, we con-
ducted multiple user studies at several real world venues around thecity. We conducted 15 sessions of experiments at 6 different venuesin 2 different countries, as shown in Table 5: 2 sessions (one duringa peak period at noon and another during off-peak afternoon hours)at an F&B outlet on a Singapore-based university campus, and onesession each from 2 different movie theater ticketing counters. Atthe F&B outlet in Singapore, each study session consisted of 10participants queuing up consecutively to buy a beverage of theirown choice; at the theaters, we had 5 participants queuing up con-secutively and actually buying a movie ticket at the counter; similarstudies were conducted in Tokyo as well. Besides the QueueVadisclient, each person also carried a second phone (Samsung GalaxyS III) for sensor data collection and time-stamping.
Country Queue Venue Name Number of Number ofType Participants Sessions
Singapore F&B University Cafe 10 4Singapore F&B University Food Court 13 27Singapore F&B Starbucks 6 2Singapore Ticketing GV Movie Theater 5 2Singapore Ticketing Cathay Movie Theater 5 1
Tokyo F&B Starbucks 5 4Tokyo Ticketing “109” Cinemas 6 3
Table 5: Queue Detection User Studies
6.2.2 Queuing Detection: Accuracy and LatencyWe first check: can the QueueVadis client detect an individual’s
queuing activity correctly? To investigate this question, we fed theentire trace of each individual’s activity trace (i.e., their raw ac-celerometer stream), consisting of the queuing episodes at the des-ignated venues through our QueueVadis implementation. We notedthat QueueVadis offered 100% accuracy in queuing detection foreach individual — in other words, QueueVadis was able to cor-rectly classify all queuing episodes in our user study. Additionally,when we ran QueueVadis ’s queue detection analysis for approx-imately 5 hours of Micro Activity accelerometer data traces (notincluding queuing activity, collected for other research purpose inour university), the false positive rate queuing activity detected byQueueVadis was 16.6%.
Given that QueueVadis can detect the queuing activities correctly,we next ask: how accurate is QueueVadis in detecting both the starttime (Ts) and the end time (Te) of each queuing episode? To an-swer this question, we computed the time difference between thetrue time & the QueueVadis’ estimates (using multiple concurrenttier-2 classifiers) of Ts and Te for each individual queuing episode.We also calculated the overall percentage-error in estimating thetotal queuing duration (i.e., Tw = Te−T s).
Table 6 provides the median and standard deviation of these er-rors (across all the queuing episodes), separately for the F&B andMovie Ticketing venues. We see that:

Error F&B Venues Ticketing VenuesMedian Std. Dev. Median Std. Dev.
Ts (secs) 9.2 47.1 7.7 100.9Te (secs) 4.0 92.1 1.5 2.8Tw (%) 4.8 30.2 4.1 27.6
Table 6: Estimation Err. (Start, End) and Tot. Queuing Times
• The estimation errors for start and end times are typicallyvery low–less than or equal to 10 secs, indicating that theCD and DT logic in the QueueVadis client is quite success-ful in detecting important queuing-related events. However,the errors in estimating Ts are larger than those for estimat-ing Te. This is due to the fact that QueueVadis’ QT compo-nent provides early detection of the end of a queuing episode,by using 3 consecutive frames (=9 secs) of walking, therebybounding this detection latency. On the other hand, Ts re-quires detection of 2 consecutive windows of activity, andcan be incorrect by, on average, a window size of WQ
2 frames.• The overall estimation error for the total queuing duration is
also low–less than 10%. This suggests that the QueueVadisclient is pretty effective in estimating the real queuing delayexperienced by a user. In particular, given that the total waittime at the F&B venue was approx. 4 minutes (240 secs)and 10 minutes at Theaters, a 10% estimation error wouldtranslate to errors of less than minute at F&B and 2 minutesat Theater. We believe that this level of accuracy should beacceptable for most people in the Where To Go? & WaitingWorth It scenarios.
It is important to point out that the estimation errors were muchhigher (by a factor of at least 5-6) when we experimented with vari-ants of the QueueVadis client that did not have multiple concurrenttier-2 classifiers, but instead either used only one classifier or atmost one classifier per queue type.
6.2.3 Energy ConsumptionTo quantify the potential energy overheads of the QueueVadis
client, we measured its average power consumption (measured overa test duration of 10 minutes using the Monsoon power monitor[11]and repeated twice) on a Galaxy SIII phone in 5 typical scenarios–each with a varying number of concurrent tier-2 (HA) classifiers.From Figure 8, we see that QueueVadis consumes 29.245 mW whenwe only enable its accelerometer sensors, and the energy numberslightly increases to 31.85 mW when both HA and MA classifiersare running. When QueueVadis runs 16 HA classifiers concur-rently, it consumes 34.005 mW, indicating that our use of multipleconcurrent classifiers imposes insignificant energy overheads.
0"5"10"15"20"25"30"35"
Sensing'Only Sensing'+'MA'Classifier
Sensing'+'MA'+'1'HA'
Classifier
Sensing'+'MA'+'4'HA'
Classifiers
Sensing'+'MA'+'16'HA'Classifiers
Power'Con
sump=
on'(m
W)
Figure 8: QueueVadis Avg. Power Consumption
Moreover, we also studied the usefulness of relying on coarselocation triggers to selectively activate QueueVadis. We conducteda user study with 8 participants (5 in Tokyo and 3 in Singapore),
where each participant carried a QueueVadis client-enabled devicefor 8 hours during the daytime, and also logged their high-levellocation as they went about their daily activities. Assuming thatQueueVadis would be activated whenever the participant approacheda potential queuing location (e.g., food service counters, coffeeshops or automated teller machines), our real-world traces showedthe largest activation duration (among the 8 participants) to be 25minutes, over the 8 hours. Even assuming a QueueVadis client with16 concurrent HA classifiers, the corresponding energy consump-tion is approximately 14.2 milliWatt-hours (mWh), or less than0.5% of Galaxy S3’s battery capacity (7.98Wh).
7. AGGREGATE PROPERTIES OF A QUEUEWe now focus on the QueueVadis server’s ability to compute the
aggregate properties of a specific queue, based on reports providedby corresponding QueueVadis clients. More specifically, we areinterested in two key properties of a queue of direct relevance toour Where To Go? and Waiting Worth It scenarios: (a) the totalwait time Tw that a person is likely to experience and (b) the servicetime 1
µ experienced by the customer at the service counter.
7.1 Estimating Service TimesGiven our empirical evidence of the variability of service times,
even in a single queue, the QueueVadis server focuses on comput-ing various statistical properties (such as the mean and variance) ofthe random variable 1
µ , as opposed to a single estimate of the ser-vice time. We have investigated two different algorithms for com-puting the distribution of the service times of a particular queue:• Departure-driven Detection Algorithm (DDA): Here, we de-
rive the service times based only on the end time (Te) of eachindividual’s queuing episode. In particular, when the QTcomponent of the QueueVadis client detects the end of anindividual’s queuing episode, it sends the Te estimate to theQueueVadis server. If the server now receives these valuesfrom two successive individuals (denoted by customers i andi+ 1), then the service time experienced by the i+ 1th cus-tomer can be estimated as Te(i+ 1)−Te(i). This approach,however: a) works only if each successive customer in thequeue has the QueueVadis client; b) assumes that the queueis never empty, i.e., the service for customer i+ 1 starts im-mediately after the departure of customer i.• Activity-centric Detection Algorithm (ADA): This is a more
sophisticated technique, based on the assumption that a queu-ing individual, say customer i, will typically remain station-ary in the queue (while the person at the counter is beingserved), and will move forward only when the customer be-ing served leaves, and the person currently at the head of thequeue moves to the service counter. Accordingly, if t1 andt2 denote the successive times (frames) where the individualexhibits a new stepping movement (and is thus stationary forthe entire duration (t1, t2)), then, from the perspective of thisindividual, the service time can be approximated as t2−t1. Inour proposed algorithm, each QueueVadis client periodicallytransmits its set of t2− t1 values to the QueueVadis server.On receiving and aggregating such sets of values from multi-ple clients, the server can then estimate the relevant statisticsfor 1
µ . This approach has the advantage of being practicalas it is applicable even when only a subset of the queuingcustomers have the QueueVadis client. On the other hand,as this approach may be sensitive to ‘noise’ in the micro-activity (movement) pattern (e.g., a queuing customer canoften not move forward each time the queue advances, but

0""
50""
100""
150""
200""
250""
300""
350""
400""
450""
Ground"Truth" DDA" ADA"
Service'Time'μ'(s)�
0""
20""
40""
60""
80""
100""
120""
140""
160""
180""
200""
Ground"Truth" DDA" ADA"
Service'Time'μ'(s)�
0""
50""
100""
150""
200""
250""
300""
350""
400""
Ground"Truth" DDA" ADA"
Service'Time'μ'(s)�
0""
20""
40""
60""
80""
100""
120""
140""
Ground"Truth" DDA" ADA"
Service'Time'μ'(s)�
(a) F&B Peak (Singapore) (b) F&B Off-Peak (Singapore) (c) F&B Peak (Tokyo) (d) Ticketing (Tokyo)Each bar represents 0th, 25th, 50th, 75th, and 100th percentiles in the distribution from the bottom to the top.
Figure 9: Box Plots of Service Times ( 1µ ) at 4 Locations: Ground Truth vs. Estimates
0""
100""
200""
300""
400""
500""
600""
700""
800""
900""
1,000""
Ground"Truth" HDA"
Wait%T
ime%Tw
%(s)�
0""
50""
100""
150""
200""
250""
300""
350""
Ground"Truth" HDA"
Wait%T
ime%Tw
%(s)
0""
100""
200""
300""
400""
500""
600""
700""
800""
900""
1,000""
Ground"Truth" HDA"
Wait%T
ime%Tw
%(s)
0""
50""
100""
150""
200""
250""
300""
350""
400""
450""
500""
Ground"Truth" HDA"
Wait%T
ime%Tw
%(s)
(a) F&B Peak (Singapore) (b) F&B Off-Peak (Singapore) (c) F&B Peak (Tokyo) (d) Ticketing (Tokyo)Each bar represents 0th, 25th, 50th, 75th, and 100th percentiles in the distribution from the bottom to the top.
Figure 10: Box Plots of Wait Times (Tw) at 4 Locations: Ground Truth vs. Estimates
take multiple steps after several customers have been served),ADA eliminates outliers, by discarding the bottom and top 5percentile readings.
7.1.1 Evaluation ResultsFigure 9 plots the boxplots of the service times computed in 3
different ways: the video-annotated ground truth and the two al-gorithms presented in Section 7.1, for the four location/times dis-cussed before. We see that:• The DDA algorithm is not very robust, as it often overesti-
mates (and also underestimates) the service time. This errorarises because consumers, in real life, often do not walk awayimmediately after receiving service, but instead wait for theirfriends to finish purchasing before walking away together.This leads to an overestimate of their service time (and anunderestimate of the next person’s service time).• The ADA algorithm, on the other hand, proves to be remark-
ably robust in estimating the distribution of service times,and in fact, typically provides mean estimates within 5-10seconds of the ground truth.
Robustness to Low Participation Rates: ADA is particularly at-tractive as it does not require all queuing participants to have theQueueVadis system. We studied the statistics of the estimated meanof the service times computed by ADA vs. the ground truth, whenonly a fraction of the queuing individuals were assumed to haveQueueVadis clients. To perform this study, we computed the meanof the ADA estimates over all possible combinations (correspond-ing to the specified fraction) of the queuing individuals, and alsocomputed the variance of this mean estimate. Table 7 plots thesevalues for an F&B outlet in Singapore, and also demonstrates thatADA can provide robust estimates in practical situations, whereonly a small fraction of the queuing individuals may be expected tohave QueueVadis.
GroundTruth
Fraction of the Individual with QueueVadisTruth 100% 80% 60% 40% 20% 10%
Mean (sec) 25.01 21.81 21.54 22.02 22.17 21.24 22.70
Mean Stdev. N/A 11.53 11.21 11.32 11.29 10.34 12.99
Table 7: Service Time ( 1µ ) vs. fraction of QueueVadis users
7.2 Estimating the Total Wait TimeTo estimate the total wait time, we devised the History-Driven
Estimation algorithm (HDA). In HDA, the QueueVadis server re-ceives the estimated total wait time Tw(i) from the ith customer andaggregates all these reports from multiple customers. It then com-putes a weighted “moving average” of these Tw(i) values (givinggreater weightage to recently departing customers) to predict thewait time likely to be experienced. HDA can possibly suffers fromtwo drawbacks: (i) as the fraction of customers with QueueVadisclients decreases, the Tw(i) reports get more sporadic, causing itsaccuracy to degrade; (ii) it implicitly assumes that the queue arrivalrate (λ) remains constant. In particular, if there is a sudden surgein the number of people who’ve joined the queue, HDA will con-tinue to underestimate the true queuing delay, until these peoplecomplete their transaction and leave the queue.
7.2.1 Evaluation ResultsWe now study the difference between the true and estimated total
wait times (Tw), based on the HDA method proposed in Section 7.2.Figure 10 plots the boxplots of the true and estimated wait times(computed by the HDA technique) for the four venues/locations.We see that HDA’s estimated wait times tally quite well with thereal wait times in all 4 cases, with errors in the median values beingaround 10-15% in all cases. This indicates that our queue estima-tion technique can prove to be fairly useful to users for both theWhere To Go? and Waiting Worth It scenarios.

7.3 Robustness to Various Queue ShapesTo quantitatively study how QueueVadis works across different
real-world queue shapes, we classified our 106 queues into 3 classes:(i) Straight-line, where the users queued in a straight line (e.g., theFruits and the Drinks queue in Figure 2); (ii) Snaking, where thequeues had 180◦ turns where the user’s movement got reversed(e.g., the Malay queue in Figure 2 and 2 movie theater ticketingqueues) and (iii) Arbitrary, where the queues had a more free-formshape with one or more acute-angled turns (e.g., the Indian and theWestern queue in Figure 2). Figure 11 plots the percentage error inthe wait time estimates Tw (as box plots) for each queue class (withthe number of distinct queues for each class). Since the median es-timation errors are uniformly low (less than 10%) for all 3 classes,we posit that QueueVadis works across arbitrary queue shapes.
0"10"20"30"40"50"60"70"80"90"100"
Straight(line,(43) Snaking,(27) Arbitrary,(36)
Wait,T
ime,Error,R
ate,(%
)�
Each bar represents 0th, 25th, 50th, 75th, and 100th percentilesin the distribution from the bottom to the top.
Figure 11: Wait Time Errors (Different Queue Shapes)
7.4 Handling Premature DeparturesWe also studied QueueVadis’ ability to handle situations where
a user leaves a queue prematurely (even though Section 3.2.4 showthis to be a rare event). 4 users left a queue prematurely (users 1, 2,3 & 4 leaving when they had 1, 2, 3 & 4 people ahead of them in thequeue, respectively); each user repeated this behavior on 5 differentoccasions. Separately, we manually recorded the true Tw value ofthe individual immediately in front of the user, as an appropriateestimate of the Tw that the user would have experienced if she hadcompleted the service transaction after queuing. Table 8 shows thatthe mean Tw values estimated by QueueVadis for each prematurelydeparting user gets smaller, expectedly, smaller (compared to Twof the person in front who completed queuing), the earlier a userdeparts prematurely from the queue.
More importantly, we computed the average Tw (using only groundtruth observations who had completed queuing) to be 183.3 secs,while the average Tw of the prematurely departing users was muchsmaller (149.3 secs). However, after applying QueueVadis’ outlierelimination logic to all Tw readings (consisting of both ‘completedqueuing’ and ‘prematurely departing’ users), Tw was estimated tobe 160.9 msec (i.e., ∼ 10% lower than the true value), even forour extreme scenario where half of the queuing instances consistedof premature departures: this demonstrates our robustness to theoccasional case of an individual leaving a queue mid-stream.
Number of people in front when leaving1 2 3 4
Average (Tw) 186.6 (218.4) 102.3(152.0) 108.1(175.0) 80.6 (176.8)
Table 8: Wait Time: Premature (vs. Complete Queuing)
8. DISAMBIGUATION ENGINEThe final piece in the QueueVadis puzzle is the Disambiguation
Engine, which detects if two customers are queuing in the same
or different queues (so as to assign an individual’s service or waittime estimates to the correct queue). The proposed disambiguationengine combines two orthogonal principles: (i) phase-shifted simi-larity in the movement patterns between people in the same queue,and (ii) similarity/differences of directions of movement trajecto-ries of people in the same/different queues, respectively.
8.1 Cross-Correlation of MA streamsIn this approach, we look at the (standing, movement) sequences
of a pair of individuals as two time series and measure their cross-correlation function. Our intuition is that individuals in the samequeue will exhibit, albeit ideally, time-shifted copies of the sameunderlying movement sequence (as everyone will move forwardwhen the person at the head of the queue gets dequeued). Morespecifically, the cross-correlation component of the QueueVadis server’sdisambiguation engine uses the MA-2 set of micro-activity labels,provided to it by participating QueueVadis clients, as our focus hereis on purely looking for movement similarities (and not on identify-ing queuing, as that has already been performed by the QueueVadisclient). In particular, given two sequences of such time series, Xand Y , the cross-correlation function is computed as:
cXY (k) =
N−k∑
t=1XtYt+k k = 0, · · · ,N−1
N∑
t=1−kXtYt+k k =−1, · · · ,−(N−1)
(1)
Figure 12 illustrates cross-correlation between two such pairs ofconsecutively queuing customers (one pair in the same queue, theother pair in adjacent but distinct queues) at SMU’s food court–wecan see that (due to the similar phase-shifted movement pattern inthe same queue), the maximum correlation value is much higher(approx. 0.6) for the same-queue pair, as opposed to the different-queue pair (approx. 0.35) whose movements are less-synchronized.
Figure 12: Cross-Correlation (Pair in Same vs. Diff. Queue)
Through extensive empirical studies over our datasets, we sawthat a high and unimodal cross-correlation peak always exists forcustomers in the same queue, whereas relatively low and multi-modal peak is often observed for different queue customers. Ac-cordingly, the disambiguation engine uses two cross-correlationfeatures over CXY to classify incoming pairs of queuing users: a)the largest cross-correlation value, denoted by cXY (τ
∗)=maxcXY (.);and b) RXY , the fractional difference between the first and secondpeak (denoted as cXY (τ
′)) in cXY (.), computed as: cXY (τ)−cXY (τ′)
cXY (τ′).
Table 9 summarizes the classification accuracy achieved using aNaive Bayes classifier over MA-2 streams collected at 6 differentvenues in Singapore (4 food court F&B stalls, 1 movie theater tick-eting counter, and 1 Starbucks) from 41 real-world queuing indi-viduals. Results are reported using a 10-fold cross validation study

over 114 pairs of MA-2 streams (61 pairs in the same queue and53 in different queues). Note that all the “same queue" trainingdata are collected from consecutive customers or only one addi-tional customer between them. Subsequently, to study the effectof varying the participation rate, we conducted additional studies,collecting 3 sessions’ data from 10 users queuing in a single queue.Table 10 plots the accuracy (recall) of such queue disambiguation,as a function of K, the number of intermediate users between a pairof queuing individuals. (Specifically, a "0" means that the two indi-viduals queue consecutively, while "1" means that the individualsare separately by a single other user). We see that this precisiondecreases rapidly with K, falling below 50% when 3 or more peo-ple separate the pair, reflecting the lack of synchronized movement(in real world queues) among people who are separated by morethan 2 individuals. Thus, in practice, the correlation classifier pro-vides a very reliable positive indicator of co-queuing (for users whoqueue consecutively or are separated by 1-2 individuals), but can-not definitively indicate that users are in separate queues.
Predicted Class AccuracySame Queue Diff. Queue (%)
ClassSame Queue 47 14 77.04Diff. Queue 3 50 93.34
Table 9: Confusion Matrix of the Naive Bayes Model
No. of Intermed. People (K) 0 1 2 3 4
Classification Accuracy 0.83 0.73 0.55 0.34 0.21
Table 10: Same-Queue Classification Accuracy vs. K
8.2 Direction of In-Queue MovementTo bolster the queue disambiguation accuracy, we investigate
an alternative feature–the trajectory, or sequence of directions, inwhich a user moves while queuing. This method is motivated byFigure 2, which suggests that, in the real-world, different queues inthe same space have distinct trajectories. In this approach, we thusutilize the smartphone-embedded magnetic compass sensor to ob-serve the directional component of an individual user’s trajectoryduring those frames that are classified (using the MA-3 classifier)as “step” (a probably reliable indicator of the direction of a user’s‘shuffle forward’ in-queue movement). Moreover, to accommodatethe noise in the compass data, we quantize the readings into ‘45deg’ octants–an individual’s sequence of movements is then rep-resented as a sequence of values D = [d1,d2, . . . , ], where the ith
element indicates the directionality of the ith stepping activity, withdi ∈ {1, . . . ,8},∀i. We further convert each sequence D into a vec-tor S = [s1,s2, . . . ,s8], where the 8 elements represent the fractionof each direction’s movement count. Figure 13 illustrates this quan-tized representation of the trajectory of two queuing individuals.
Figure 13: Movement-Orientation Based Similarity MeasuresThe similarity in the trajectory of a pair of individuals i and j is
then expressed via the similarity between S( j) and S(k) (using the
dot product of S( j) and S(k)). Table 11 lists the same queue clas-sification accuracy using the Direction of In-Queue Movement ap-proach, computed by varying the percentage of QueueVadis-equippedusers (average of all combinations). Table 12 summarizes the clas-sification accuracy achieved by combining the Cross-Correlationapproach and the Direction of In-Queue Movement approach. Note1: the “same queue” training data is collected from the customerswho have a variable number of intermediate people between them.Note 2: the disambiguation accuracies reported here use the trajec-tory of the entire queuing episode (which can last several minutes).Hence, this approach cannot directly address the “Waiting WorthIt” scenario, where the disambiguation must be performed imme-diately after the queuing onset: this issue remains an open problem.
Frac. of People with QueueVadis 100% 80% 60% 40% 20%
Classification Accuracy 0.78 0.74 0.71 0.63 0.60
Table 11: Same-Queue Classification Accuracy (Compass-based) vs. Participation Rate
Predicted Class AccuracySame Queue Diff. Queue (%)
ClassSame Queue 72 28 72Diff. Queue 17 42 73.7
Table 12: Confusion Matrix of the Two Approaches Combined
9. DISCUSSIONWhile QueueVadis performs reasonably, across a variety of queues
(of different types, and with different shapes) even in dense urbanspaces (e.g., foodcourts in malls or university campuses), there areseveral issues that QueueVadis can tackle in the future:• We have not considered queues that are dynamically reconfigured–
e.g., at airport security, the opening of a lane can make peo-ple in an existing queue walk briskly for up to 15 seconds.This brisk walking motion will confuse QueueVadis’ activitydetection mechanisms.• We have also not evaluated QueueVadis in scenarios with
group or herding dynamics. A bus stop offers an exampleof such a queue, where a tour group might board a bus to-gether (and thus exit the queue almost simultaneously).• In our experiments, we observed that individuals usually had
their smartphone inside their pockets or held it in their hands.It is possible that users may use their smartphone more ac-tively (e.g., Tweeting their friends) and habitually while queu-ing, thereby reducing the activity classification accuracy. How-ever, such usage may also offer opportunities for finer-grainedsensing–e.g., provide more accurate compass-based direc-tional estimates when the phone is being used.
10. RELATED WORKMobile Sensing & Activity Recognition: Approaches such asCenceMe [10], Jigsaw [8] and Escort [6] have applied feature-based classification on mobile phone accelerometer data to clas-sify everyday locomotive activities (such as sitting, standing andwalking). Hierarchical activity models have been used, in both su-pervised and unsupervised learning based approaches, to recognizesemantic Activities of Daily Living (ADLs), from underlying loco-motive and gestural signatures-e.g., Huynh et. al [7] used LDA-based topic models to discover common recurring MA patterns fordifferent ADLs. QueueVadis’ two-tier classification model is bor-rowed from the SAMMPLE framework [16], which classified HAsin home and office environments.

Mobile Sensing-based Queue Detection: LineKing [4] was oneof the first smartphone systems to detect human waiting behavior& wait times in specific places such as a coffee shop. It used waittimes as a proxy for queuing delay (assuming that all people inthe coffee shop are queuing by default). The more-recent Queue-Sense approach [13] adopts a participatory mechanism similar toours: it identifies relationships among multiple queuing individu-als, using accelerometer and compass sensor data. One of the ma-jor design differences is that QueueSense’s individual queuing ac-tivity recognition relies on collaborative exchanges with neighbor-ing nodes via Bluetooth, whereas a QueueVadis client simply relieson its own sensor data. Like QueueVadis, QueueSense also modi-fied the classification interval for different queue types. In general,QueueVadis’ evaluation tackled several additional real-world arti-facts, such as low participation rates, multiple close-range queues,highly variable queuing delays and premature user departures. Morerecently, Wang et. al [15] used the signal strength evolution of a Wi-Fi AP to deduce the in-queue movement behavior of an individual,and thus infer individual queuing delays. This infrastructure-basedapproach did not, however, investigate the challenge of multipledistinct queues in close proximity.Other Queue Estimation Systems: Video analytics has been usedto infer queue lengths and wait times (e.g., [5, 14]) at fixed, well-known locations (such as a stadium entrance). However, these sys-tems are hard to deploy ubiquitously.
11. CONCLUSIONIn this paper, we presented QueueVadis, a two-tier energy-efficient
queue detection system that can provide both the aggregate-leveland the individual-level queue properties (even when multiple queuesare too close to be distinguished purely by location) using just cell-phone sensor data. We implemented and tested QueueVadis withdifferent types of real-world queues; our results show that Queue-Vadis provides practically useful estimates of the current wait andservice times with a relatively small median error. In particular,for F&B venues, we found that the estimation error for total waittimes is 1 minute (making a scenario such as “Where To Go?” fea-sible); moreover, the start time of a queuing episode is estimatedwith a median error less than 10 seconds (making services such as“Waiting Worth It” feasible, when the users are already associatedunambiguously to a single queue).
12. ACKNOWLEDGMENTWe thank the anonymous reviewers and especially our shepherd,
Marco Zuniga, for their help in improving the paper’s presenta-tion and technical content. In addition, we especially thank Vi-gneshwaran Subbaraju for his data collection and activity recog-nition software, Rahul Majethia for helping to collect and ana-lyze preliminary queuing data, Takuya Takimoto for helping toconduct user studies in Japan, and Jin Nakazawa and HideyukiTokuda for their advice in refining the content of the paper. Fi-nally, the authors gratefully acknowledge the support of the stu-dents and staff of LiveLabs and Hide Tokuda lab for helping tocollect large amounts of queuing data. This work was supportedpartially by Singapore Ministry of Education Academic ResearchFund Tier 2 under research grant MOE2011-T2-1001, partially bythe National Research Foundation, Prime Minister’s Office, Singa-pore, under the IDM Futures Funding Initiative , and partially bythe Ministry of Education, Culture, Sports, Science and Technol-ogy (MEXT, Japan) Grant-in-Aid for the “Research and Develop-ment for Big Data Use and Application” and for the “Program forLeading Graduate Schools”.
13. REFERENCES[1] 11 longest queue restaurants in singapore (with no
reservation). http://sethlui.com/longest-queue-restaurants-singapore/.
[2] 500 mminute waiting time at toy story mania in tokyo disneysea. http://nlab.itmedia.co.jp/nl/articles/1207/16/news009.html.
[3] Balan, R. K., Misra, A., and Lee, Y. LiveLabs: Building anin-situ real-time mobile experimentation testbed. Proc. ofHotMobile, Santa Barbara, CA, 2014.
[4] Bulut, F., Yilmaz, Y., Demirbas, M., Ferhatosmanoglu, N.,and Ferhatosmanoglu, H. Lineking: Crowdsourced linewait-time estimation using smartphones. Proc. ofMobiCASE, Seattle, WA, Oct. 2012.
[5] Chan, A., Liang, Z.-S., and Vasconcelos, N. Privacypreserving crowd monitoring: Counting people withoutpeople models or tracking. Proc. of IEEE CVPR, Anchorage,AL, June 2008.
[6] Constandache, I., Bao, X., Azizyan, M., andRoy Choudhury, R. Did you see bob? using mobile phones tolocate people. Proc. of MobiCom, Chicago, IL, Sept. 2010.
[7] Huynh, T., Fritz, M., and Schiele, B. Discovery of activitypatterns using topic models. Proc. of UbiComp, Seoul,Korea, 2008.
[8] Lu, H., Yang, J., Liu, Z., Lane, N., Choudhury, T., andCampbell, A. The jigsaw continuous sensing engine formobile phone applications. Proc. of SenSys, Zurich,Switzerland, Oct. 2010.
[9] Machine Learning Group at the University of Waikato. Weka3: Data Mining Software in Java.http://www.cs.waikato.ac.nz/ml/weka/.
[10] Miluzzo, E., Lane, N. D., Fodor, K., Peterson, R., Lu, H.,Musolesi, M., Eisenman, S. B., Zheng, X., andCampbell, A. T. Sensing meets mobile social networks: thedesign, implementation and evaluation of the cencemeapplication. Proc. of SenSys, 2008.
[11] Monsoon Solutions Inc. Monsoon Power Moniter. http://www.msoon.com/LabEquipment/PowerMonitor/.
[12] Parameswaran, V., Shet, V., and Ramesh, V. Design andvalidation of a system for people queue statistics estimation.Video Analytics for Business Intelligence, pages 355–373.Springer, 2012.
[13] Qiang, L., Han, Q., Cheng, X., and Sun, L. Queuesense:Collaborative recognition of queuing on mobile phones.2014 IEEE International Conference on Sensing,Communications and Networking (SECON), 2014.
[14] Segen, J. and Pingali, G. A camera-based system for trackingpeople in real time. Proc. of ICPR, Vienna, Austria, 1996.
[15] Wang, Y., Yang, J., Chen, Y., Liu, H., Gruteser, M., andMartin, R. P. Tracking human queues using single-pointsignal monitoring. Proc. of MobiSys, Bretton Woods, NH,June 2014.
[16] Yan, Z., Chakraborty, D., Misra, A., Jeung, H., andAberer, K. Sammple: Detecting semantic indoor activities inpractical settings using locomotive signatures. Proc. ofISWC, Zurich, Switzerland, June 2012.
[17] Zhang, Z., Venetianer, P. L., Lipton, A. J., et al. A robusthuman detection and tracking system using ahuman-model-based camera calibration. The EighthInternational Workshop on Visual Surveillance, 2008.