IBM Digital Analytics Benchmark
14
1 IBM Digital Analytics Benchmark Cyber Monday Report 2013
-
Upload
someshituniv -
Category
Documents
-
view
1 -
download
0
Transcript of IBM Digital Analytics Benchmark
1
IBM Digital Analytics Benchmark
Cyber Monday Report 2013
Cyber Monday Report 2013
2
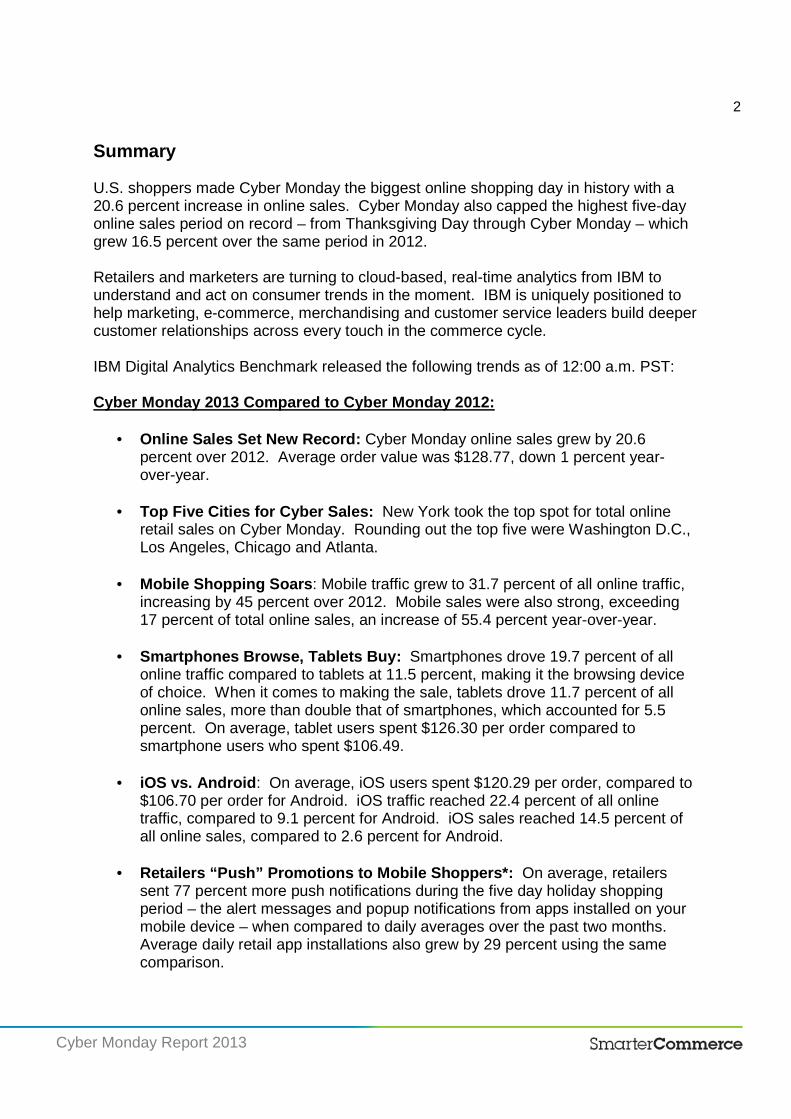
Summary U.S. shoppers made Cyber Monday the biggest online shopping day in history with a 20.6 percent increase in online sales. Cyber Monday also capped the highest fiveday online sales period on record – from Thanksgiving Day through Cyber Monday – which grew 16.5 percent over the same period in 2012. Retailers and marketers are turning to cloudbased, realtime analytics from IBM to understand and act on consumer trends in the moment. IBM is uniquely positioned to help marketing, ecommerce, merchandising and customer service leaders build deeper customer relationships across every touch in the commerce cycle. IBM Digital Analytics Benchmark released the following trends as of 12:00 a.m. PST: Cyber Monday 2013 Compared to Cyber Monday 2012:
• Online Sales Set New Record: Cyber Monday online sales grew by 20.6 percent over 2012. Average order value was $128.77, down 1 percent yearoveryear.
• Top Five Cities for Cyber Sales: New York took the top spot for total online retail sales on Cyber Monday. Rounding out the top five were Washington D.C., Los Angeles, Chicago and Atlanta.
• Mobile Shopping Soars: Mobile traffic grew to 31.7 percent of all online traffic, increasing by 45 percent over 2012. Mobile sales were also strong, exceeding 17 percent of total online sales, an increase of 55.4 percent yearoveryear.
• Smartphones Browse, Tablets Buy: Smartphones drove 19.7 percent of all online traffic compared to tablets at 11.5 percent, making it the browsing device of choice. When it comes to making the sale, tablets drove 11.7 percent of all online sales, more than double that of smartphones, which accounted for 5.5 percent. On average, tablet users spent $126.30 per order compared to smartphone users who spent $106.49.
• iOS vs. Android: On average, iOS users spent $120.29 per order, compared to $106.70 per order for Android. iOS traffic reached 22.4 percent of all online traffic, compared to 9.1 percent for Android. iOS sales reached 14.5 percent of all online sales, compared to 2.6 percent for Android.
• Retailers “Push” Promotions to Mobile Shoppers*: On average, retailers sent 77 percent more push notifications during the five day holiday shopping period – the alert messages and popup notifications from apps installed on your mobile device – when compared to daily averages over the past two months. Average daily retail app installations also grew by 29 percent using the same comparison.
Cyber Monday Report 2013
3
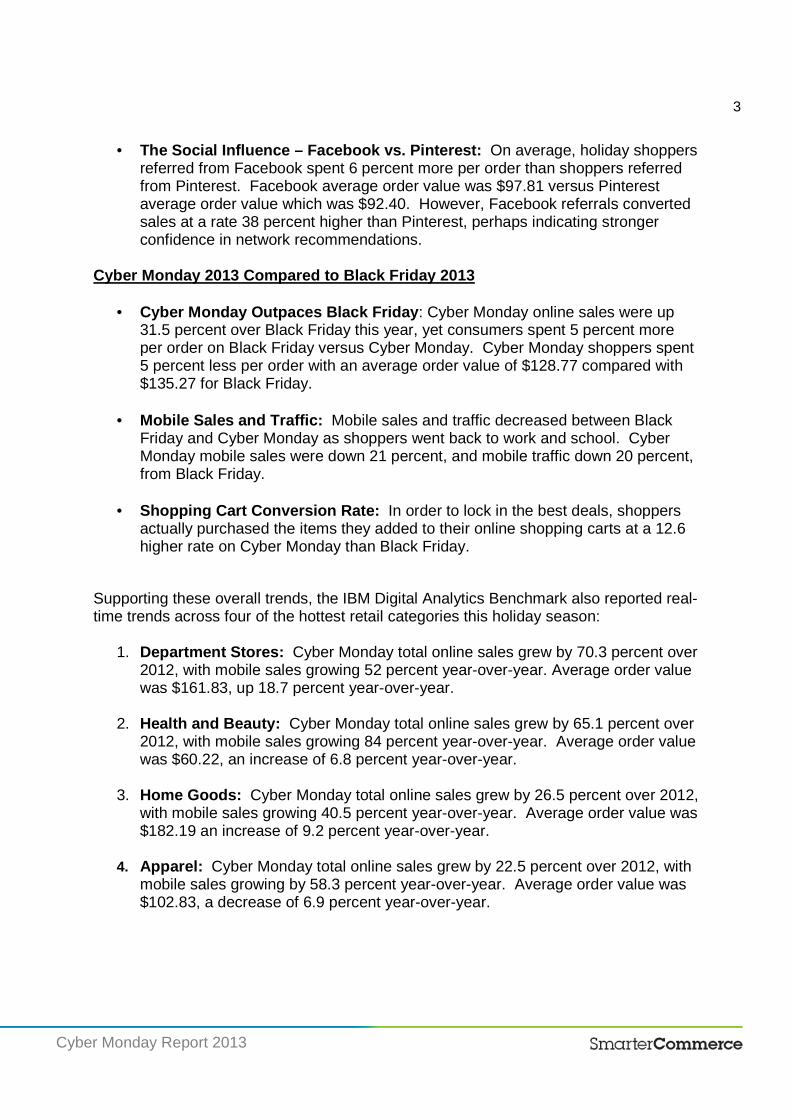
• The Social Influence – Facebook vs. Pinterest: On average, holiday shoppers referred from Facebook spent 6 percent more per order than shoppers referred from Pinterest. Facebook average order value was $97.81 versus Pinterest average order value which was $92.40. However, Facebook referrals converted sales at a rate 38 percent higher than Pinterest, perhaps indicating stronger confidence in network recommendations.
Cyber Monday 2013 Compared to Black Friday 2013
• Cyber Monday Outpaces Black Friday: Cyber Monday online sales were up 31.5 percent over Black Friday this year, yet consumers spent 5 percent more per order on Black Friday versus Cyber Monday. Cyber Monday shoppers spent 5 percent less per order with an average order value of $128.77 compared with $135.27 for Black Friday.
• Mobile Sales and Traffic: Mobile sales and traffic decreased between Black Friday and Cyber Monday as shoppers went back to work and school. Cyber Monday mobile sales were down 21 percent, and mobile traffic down 20 percent, from Black Friday.
• Shopping Cart Conversion Rate: In order to lock in the best deals, shoppers actually purchased the items they added to their online shopping carts at a 12.6 higher rate on Cyber Monday than Black Friday.
Supporting these overall trends, the IBM Digital Analytics Benchmark also reported realtime trends across four of the hottest retail categories this holiday season:
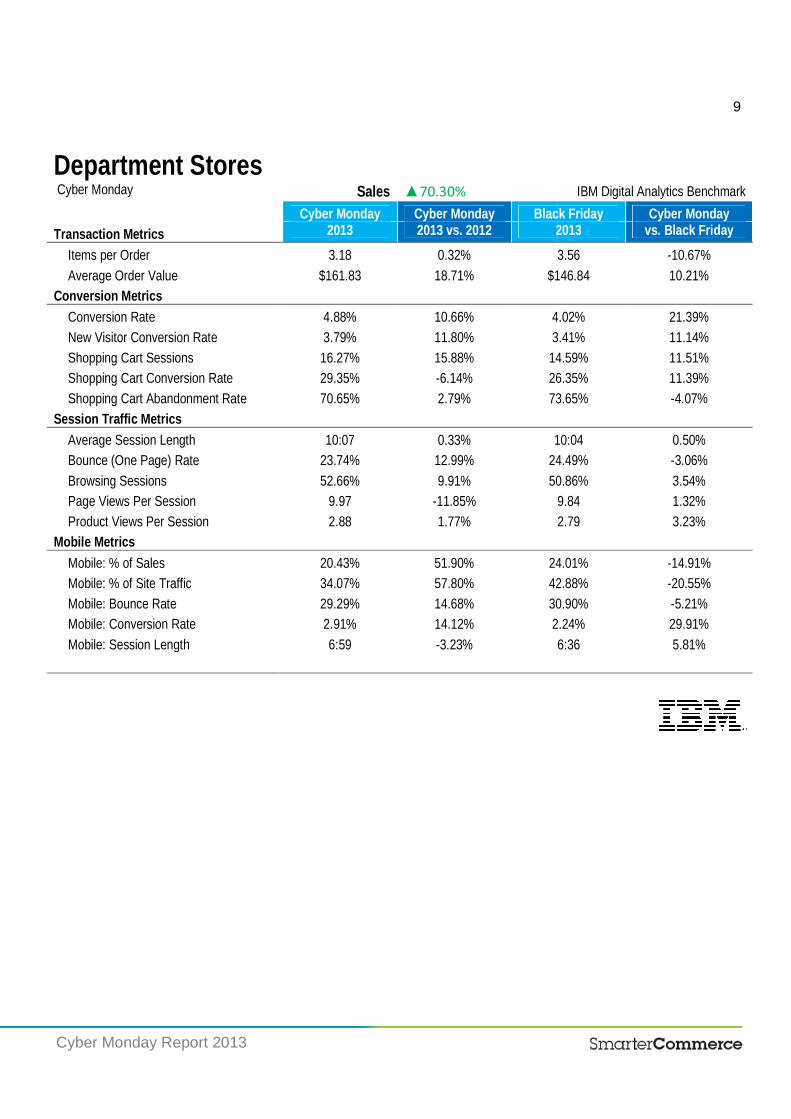
1. Department Stores: Cyber Monday total online sales grew by 70.3 percent over 2012, with mobile sales growing 52 percent yearoveryear. Average order value was $161.83, up 18.7 percent yearoveryear.
2. Health and Beauty: Cyber Monday total online sales grew by 65.1 percent over 2012, with mobile sales growing 84 percent yearoveryear. Average order value was $60.22, an increase of 6.8 percent yearoveryear.
3. Home Goods: Cyber Monday total online sales grew by 26.5 percent over 2012, with mobile sales growing 40.5 percent yearoveryear. Average order value was $182.19 an increase of 9.2 percent yearoveryear.
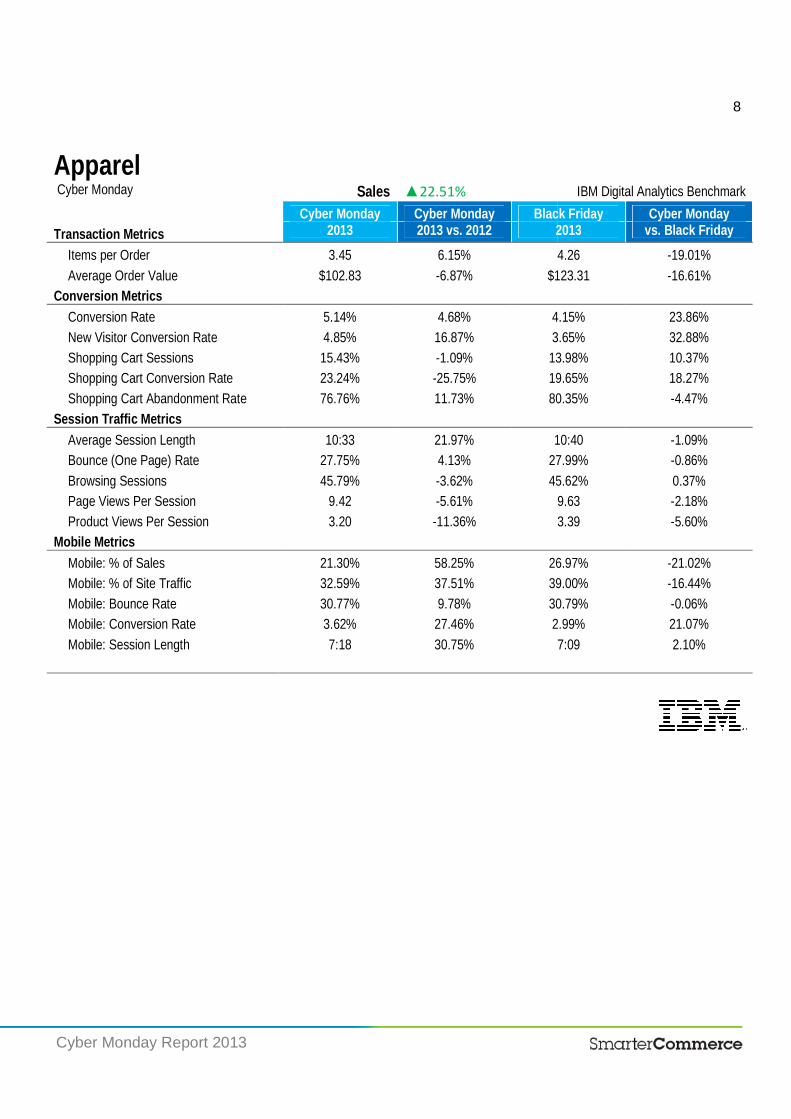
4. Apparel: Cyber Monday total online sales grew by 22.5 percent over 2012, with mobile sales growing by 58.3 percent yearoveryear. Average order value was $102.83, a decrease of 6.9 percent yearoveryear.

Cyber Monday Report 2013
US Retail
Top Major Cities Total Online Retail Sales
Thanksgiving
1. New York, New York
2. Atlanta, Georgia
3. Chicago, Illinois
4. Los Angeles, California
5. Washington, District Of Columbia
6. Dallas, Texas
7. Newark, New Jersey
8. Houston, Texas
9. Philadelphia, Pennsylvania
10. Phoenix, Arizona
Cities represented above consist of the top 100 most populous U.S. cities according to data obtained by the U.S. Census Bureau in 2012.
Top States Total Online Retail Sales
Thanksgiving
1. California
2. New York
3. Texas
4. Florida
5. Illinois
6. Pennsylvania
7. New Jersey
8. Georgia
9. Ohio
10. Michigan
IBM Digital Analytics Benchmark
Black Friday Cyber Monday
1. New York, New York 1. New York, New York
2. Atlanta, Georgia 2. Washington, District Of Columbia
3. Los Angeles, California 3. Los Angeles, California
4. Washington, District Of Columbia 4. Chicago, Illinois
Columbia 5. Chicago, Illinois 5. Atlanta, Georgia
6. Newark, New Jersey 6. Newark, New Jersey
7. Dallas, Texas 7. Philadelphia, Pennsylvania
8. Philadelphia, Pennsylvania 8. Dallas, Texas
9. Houston, Texas 9. Houston, Texas
10. Phoenix, Arizona 10. Tampa, Florida
Cities represented above consist of the top 100 most populous U.S. cities according to data obtained by the U.S. Census Bureau in 2012.
IBM Digital Analytics Benchmark
Black Friday Cyber Monday
1. New York 1. New York
2. California 2. California
3. Texas 3.Texas
4. Florida 4. Florida
5. Georgia 5. Pennsylvania
6. New Jersey 6. New Jersey
7. Pennsylvania 7. Illinois
8. Illinois 8. Georgia
9. Ohio 9. Ohio
10. Michigan 10. Virginia
4
IBM Digital Analytics Benchmark
Cyber Monday
1. New York, New York
2. Washington, District Of Columbia
3. Los Angeles, California
4. Chicago, Illinois
5. Atlanta, Georgia
6. Newark, New Jersey
7. Philadelphia, Pennsylvania
8. Dallas, Texas
9. Houston, Texas
10. Tampa, Florida
IBM Digital Analytics Benchmark
Monday
1. New York
2. California
5. Pennsylvania
6. New Jersey
10. Virginia
Cyber Monday Report 2013
US Retail Cyber Monday
Transaction Metrics
Items per Order
Average Order Value
Conversion Metrics
Conversion Rate
New Visitor Conversion Rate
Shopping Cart Sessions
Shopping Cart Conversion Rate
Shopping Cart Abandonment Rate
Session Traffic Metrics
Average Session Length
Bounce (One Page) Rate
Browsing Sessions
Page Views Per Session
Product Views Per Session
Mobile Metrics
Mobile: % of Sales
Mobile: % of Site Traffic
Mobile: Bounce Rate
Mobile: Conversion Rate
Mobile: Session Length
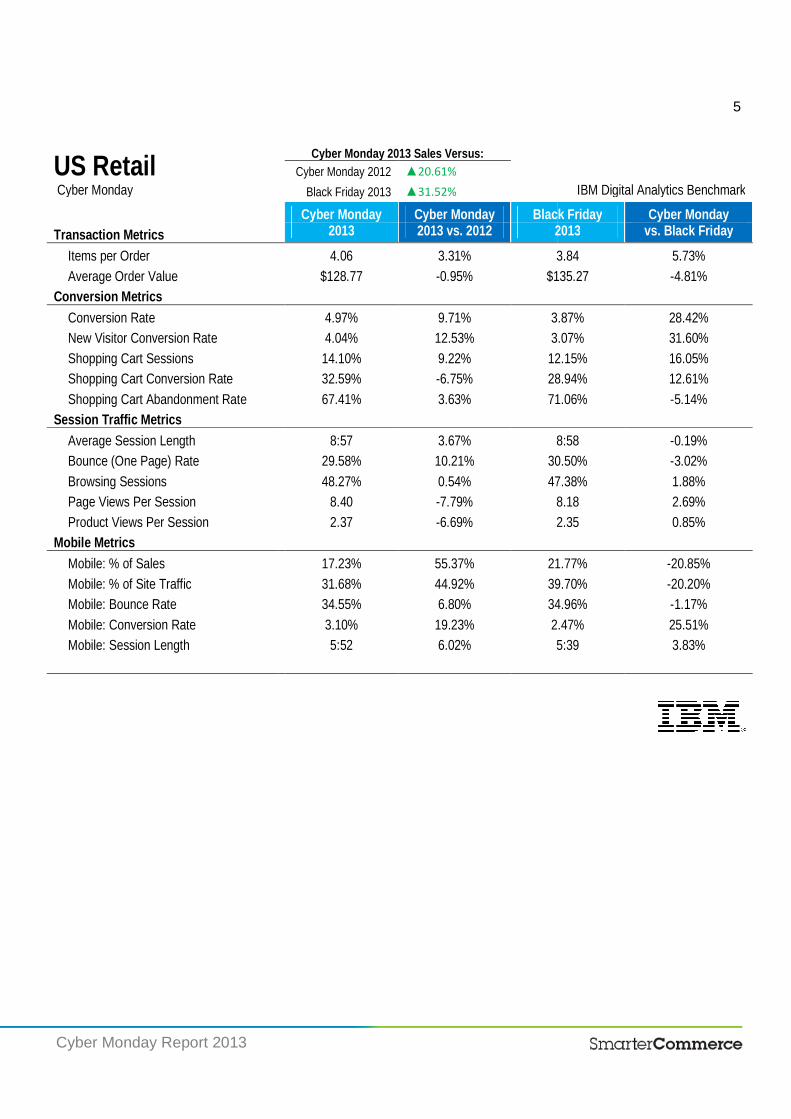
Cyber Monday 2013 Sales Versus:
Cyber Monday 2012 ▲20.61%
Black Friday 2013 ▲31.52%
Cyber Monday Cyber Monday Black Friday2013 2013 vs. 2012 2013
4.06 3.31% 3.84
$128.77 -0.95% $135.27
4.97% 9.71% 3.87%
4.04% 12.53% 3.07%
14.10% 9.22% 12.15%
32.59% -6.75% 28.94%
67.41% 3.63% 71.06%
8:57 3.67% 8:58
29.58% 10.21% 30.50%
48.27% 0.54% 47.38%
8.40 -7.79% 8.18
2.37 -6.69% 2.35
17.23% 55.37% 21.77%
31.68% 44.92% 39.70%
34.55% 6.80% 34.96%
3.10% 19.23% 2.47%
5:52 6.02% 5:39
5
IBM Digital Analytics Benchmark
Black Friday Cyber Monday 2013 vs. Black Friday
3.84 5.73%
$135.27 -4.81%
3.87% 28.42%
3.07% 31.60%
12.15% 16.05%
28.94% 12.61%
71.06% -5.14%
8:58 -0.19%
30.50% -3.02%
47.38% 1.88%
8.18 2.69%
2.35 0.85%
21.77% -20.85%
39.70% -20.20%
34.96% -1.17%
2.47% 25.51%
5:39 3.83%
Cyber Monday Report 2013
US Retail
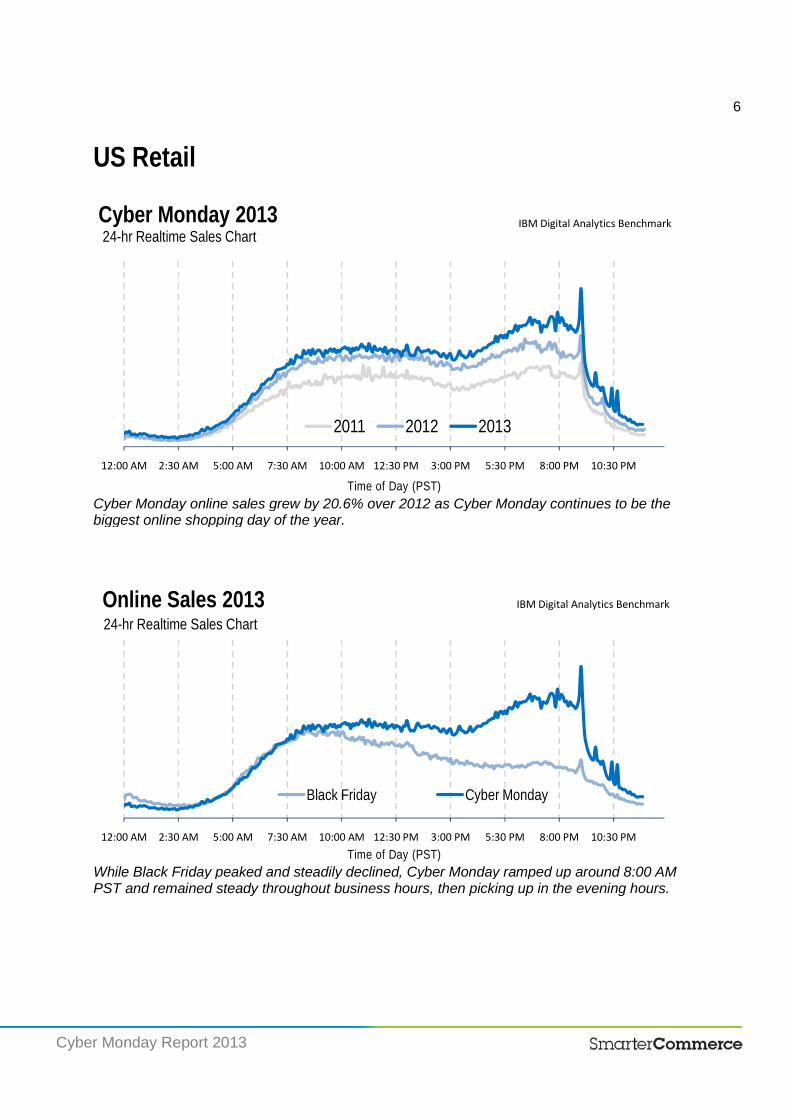
Cyber Monday online sales grew by 20.6% over 2012 as Cyber Monday continues to be the biggest online shopping day of the year.
While Black Friday peaked and steadily declined, Cyber Monday ramped up around 8:00 AM PST and remained steady through
12:00 AM 2:30 AM 5:00 AM 7:30 AM
Cyber Monday 201324-hr Realtime Sales Chart
12:00 AM 2:30 AM 5:00 AM 7:30 AM
Online Sales 201324-hr Realtime Sales Chart
Cyber Monday online sales grew by 20.6% over 2012 as Cyber Monday continues to be the biggest online shopping day of the year.
While Black Friday peaked and steadily declined, Cyber Monday ramped up around 8:00 AM PST and remained steady throughout business hours, then picking up in the evening hours.
7:30 AM 10:00 AM 12:30 PM 3:00 PM 5:30 PM 8:00 PM
Time of Day (PST)
2011 2012 2013
IBM Digital
7:30 AM 10:00 AM 12:30 PM 3:00 PM 5:30 PM 8:00 PM
Time of Day (PST)
Black Friday Cyber Monday
IBM Digital
6
Cyber Monday online sales grew by 20.6% over 2012 as Cyber Monday continues to be the
While Black Friday peaked and steadily declined, Cyber Monday ramped up around 8:00 AM
business hours, then picking up in the evening hours.
8:00 PM 10:30 PM
IBM Digital Analytics Benchmark
8:00 PM 10:30 PM
IBM Digital Analytics Benchmark
Cyber Monday Report 2013
US Retail
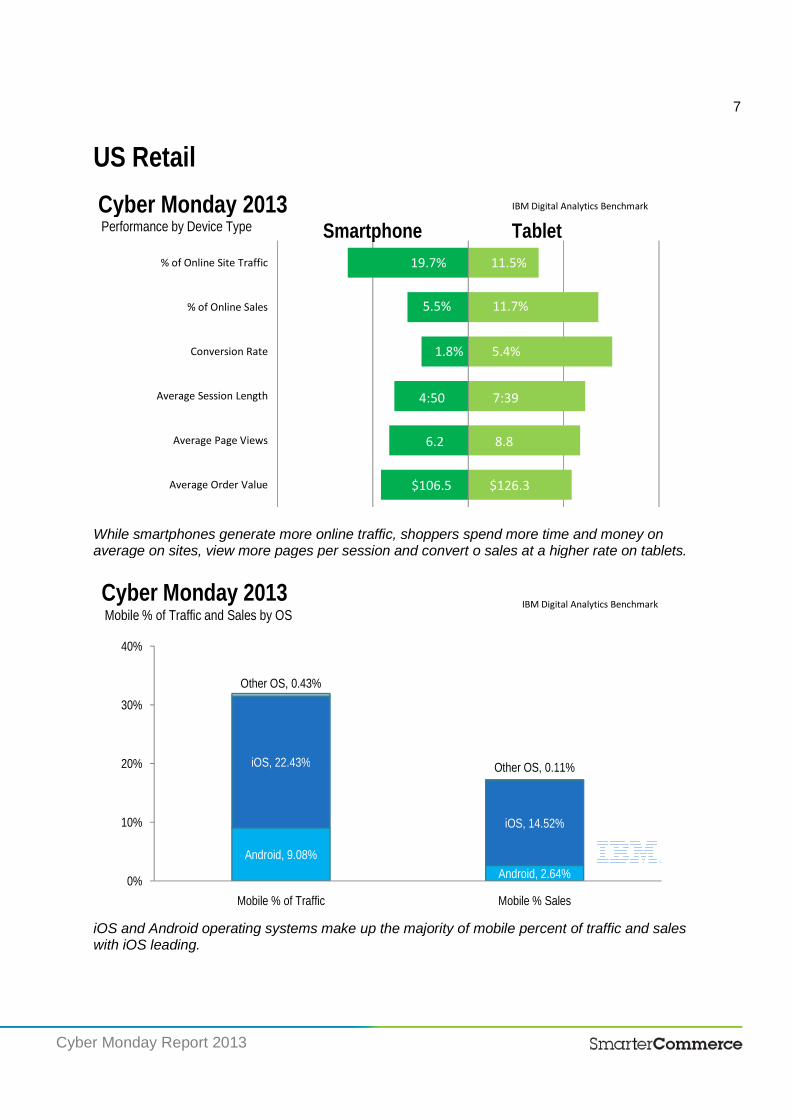
While smartphones generate more online traffic, shoppers spend more time and money on average on sites, view more pages per session and convert o sales at a higher rate on tablets.
iOS and Android operating systems make up the majority of mobile percent of traffic and sales with iOS leading.
Average Order Value
Average Page Views
Average Session Length
Conversion Rate
% of Online Sales
% of Online Site Traffic
Cyber Monday 2013Performance by Device Type
Android, 9.08%
iOS, 22.43%
Other OS, 0.43%
0%
10%
20%
30%
40%
Mobile % of Traffic
Cyber Monday 2013Mobile % of Traffic and Sales by OS
While smartphones generate more online traffic, shoppers spend more time and money on average on sites, view more pages per session and convert o sales at a higher rate on tablets.
OS and Android operating systems make up the majority of mobile percent of traffic and sales
Cyber Monday 2013Smartphone Tablet
IBM Digital
19.7% 11.5%
5.5% 11.7%
1.8% 5.4%
4:50 7:39
6.2 8.8
$106.5 $126.3
Android, 9.08%
Android, 2.64%
iOS, 22.43%
iOS, 14.52%
Other OS, 0.43%
Other OS, 0.11%
Mobile % of Traffic Mobile % Sales
Cyber Monday 2013of Traffic and Sales by OS
IBM Digital
7
While smartphones generate more online traffic, shoppers spend more time and money on average on sites, view more pages per session and convert o sales at a higher rate on tablets.
OS and Android operating systems make up the majority of mobile percent of traffic and sales
Smartphone Tablet
IBM Digital Analytics Benchmark
Android, 2.64%
iOS, 14.52%
Other OS, 0.11%
Mobile % Sales
IBM Digital Analytics Benchmark
Cyber Monday Report 2013
Apparel Cyber Monday
Transaction Metrics
Items per Order
Average Order Value
Conversion Metrics
Conversion Rate
New Visitor Conversion Rate
Shopping Cart Sessions
Shopping Cart Conversion Rate
Shopping Cart Abandonment Rate
Session Traffic Metrics
Average Session Length
Bounce (One Page) Rate
Browsing Sessions
Page Views Per Session
Product Views Per Session
Mobile Metrics
Mobile: % of Sales
Mobile: % of Site Traffic
Mobile: Bounce Rate
Mobile: Conversion Rate
Mobile: Session Length
Sales ▲22.51%
Cyber Monday Cyber Monday Black Friday2013 2013 vs. 2012 2013
3.45 6.15%
$102.83 -6.87% $123.31
5.14% 4.68% 4.15%
4.85% 16.87% 3.65%
15.43% -1.09% 13.98%
23.24% -25.75% 19.65%
76.76% 11.73% 80.35%
10:33 21.97% 10:40
27.75% 4.13% 27.99%
45.79% -3.62% 45.62%
9.42 -5.61%
3.20 -11.36%
21.30% 58.25% 26.97%
32.59% 37.51% 39.00%
30.77% 9.78% 30.79%
3.62% 27.46% 2.99%
7:18 30.75%
8
IBM Digital Analytics Benchmark
Black Friday Cyber Monday 2013 vs. Black Friday
4.26 -19.01%
$123.31 -16.61%
4.15% 23.86%
3.65% 32.88%
13.98% 10.37%
19.65% 18.27%
80.35% -4.47%
10:40 -1.09%
27.99% -0.86%
45.62% 0.37%
9.63 -2.18%
3.39 -5.60%
26.97% -21.02%
39.00% -16.44%
30.79% -0.06%
2.99% 21.07%
7:09 2.10%
Cyber Monday Report 2013
Department Stores Cyber Monday
Transaction Metrics
Items per Order
Average Order Value
Conversion Metrics
Conversion Rate
New Visitor Conversion Rate
Shopping Cart Sessions
Shopping Cart Conversion Rate
Shopping Cart Abandonment Rate
Session Traffic Metrics
Average Session Length
Bounce (One Page) Rate
Browsing Sessions
Page Views Per Session
Product Views Per Session
Mobile Metrics
Mobile: % of Sales
Mobile: % of Site Traffic
Mobile: Bounce Rate
Mobile: Conversion Rate
Mobile: Session Length
Sales ▲70.30%
Cyber Monday Cyber Monday Black Friday2013 2013 vs. 2012 2013
3.18 0.32%
$161.83 18.71% $146.84
4.88% 10.66% 4.02%
3.79% 11.80% 3.41%
16.27% 15.88% 14.59%
29.35% -6.14% 26.35%
70.65% 2.79% 73.65%
10:07 0.33% 10:04
23.74% 12.99% 24.49%
52.66% 9.91% 50.86%
9.97 -11.85%
2.88 1.77%
20.43% 51.90% 24.01%
34.07% 57.80% 42.88%
29.29% 14.68% 30.90%
2.91% 14.12% 2.24%
6:59 -3.23%
9
IBM Digital Analytics Benchmark
Black Friday Cyber Monday 2013 vs. Black Friday
3.56 -10.67%
$146.84 10.21%
4.02% 21.39%
3.41% 11.14%
14.59% 11.51%
26.35% 11.39%
73.65% -4.07%
10:04 0.50%
24.49% -3.06%
50.86% 3.54%
9.84 1.32%
2.79 3.23%
24.01% -14.91%
42.88% -20.55%
30.90% -5.21%
2.24% 29.91%
6:36 5.81%

Cyber Monday Report 2013
Health and Beauty Cyber Monday
Transaction Metrics
Items per Order
Average Order Value
Conversion Metrics
Conversion Rate
New Visitor Conversion Rate
Shopping Cart Sessions
Shopping Cart Conversion Rate
Shopping Cart Abandonment Rate
Session Traffic Metrics
Average Session Length
Bounce (One Page) Rate
Browsing Sessions
Page Views Per Session
Product Views Per Session
Mobile Metrics
Mobile: % of Sales
Mobile: % of Site Traffic
Mobile: Bounce Rate
Mobile: Conversion Rate
Mobile: Session Length
Sales ▲65.09%
Cyber Monday Cyber Monday Black Friday2013 2013 vs. 2012 2013
7.52 -10.26%
$60.22 6.83% $66.31
8.85% 8.19% 5.68%
8.22% 18.61% 5.05%
25.86% 8.93% 18.54%
34.21% -0.64% 30.58%
65.79% 0.34% 69.42%
9:25 7.21%
28.52% 10.54% 33.96%
49.91% 25.34% 49.94%
9.99 -5.04%
1.81 7.74%
23.17% 84.33% 29.16%
38.56% 52.53% 47.71%
36.18% 11.22% 40.54%
5.53% 31.04% 3.73%
5:30 7.49%
10
IBM Digital Analytics Benchmark
Black Friday Cyber Monday 2013 vs. Black Friday
7.59 -0.92%
$66.31 -9.18%
5.68% 55.81%
5.05% 62.77%
18.54% 39.48%
30.58% 11.87%
69.42% -5.23%
8:06 16.26%
33.96% -16.02%
49.94% -0.06%
8.38 19.21%
1.61 12.42%
29.16% -20.54%
47.71% -19.18%
40.54% -10.75%
3.73% 48.26%
4:27 23.60%

Cyber Monday Report 2013
Home Cyber Monday
Transaction Metrics
Items per Order
Average Order Value
Conversion Metrics
Conversion Rate
New Visitor Conversion Rate
Shopping Cart Sessions
Shopping Cart Conversion Rate
Shopping Cart Abandonment Rate
Session Traffic Metrics
Average Session Length
Bounce (One Page) Rate
Browsing Sessions
Page Views Per Session
Product Views Per Session
Mobile Metrics
Mobile: % of Sales
Mobile: % of Site Traffic
Mobile: Bounce Rate
Mobile: Conversion Rate
Mobile: Session Length
Sales ▲26.45%
Cyber Monday Cyber Monday Black Friday2013 2013 vs. 2012 2013
3.05 -0.97%
$182.19 9.23% $207.80
3.79% -0.79% 2.78%
2.71% 2.26% 1.99%
9.61% -4.38% 8.00%
39.34% 3.96% 34.67%
60.66% -2.41% 65.33%
7:25 -7.29%
30.00% 8.11% 30.27%
45.95% -4.87% 44.60%
6.59 -5.04%
2.03 -5.58%
17.61% 40.54% 19.10%
30.54% 34.12% 38.67%
35.67% 5.13% 33.48%
2.62% 11.97% 2.09%
4:36 -0.36%
11
IBM Digital Analytics Benchmark
Black Friday Cyber Monday 2013 vs. Black Friday
3.28 -7.01%
$207.80 -12.32%
2.78% 36.33%
1.99% 36.18%
8.00% 20.13%
34.67% 13.47%
65.33% -7.15%
7:50 -5.32%
30.27% -0.89%
44.60% 3.03%
6.35 3.78%
1.84 10.33%
19.10% -7.80%
38.67% -21.02%
33.48% 6.54%
2.09% 25.36%
4:39 -1.08%
Cyber Monday Report 2013
12
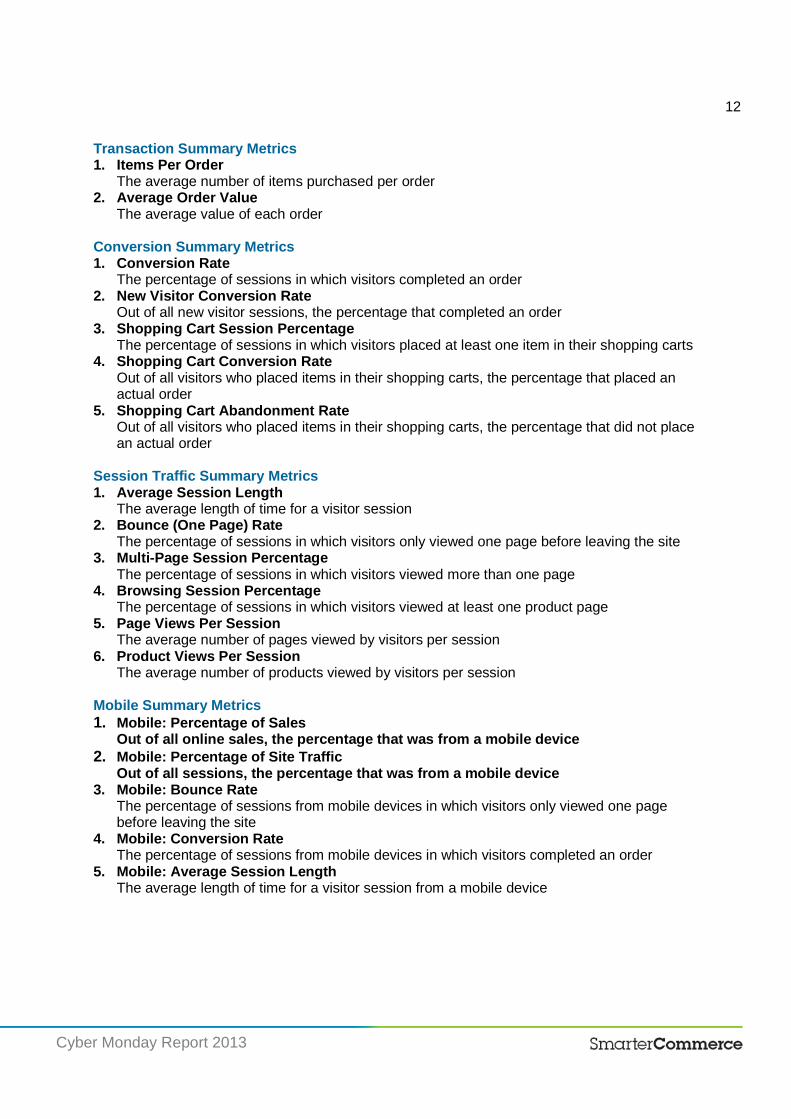
Transaction Summary Metrics 1. Items Per Order
The average number of items purchased per order 2. Average Order Value
The average value of each order Conversion Summary Metrics 1. Conversion Rate
The percentage of sessions in which visitors completed an order 2. New Visitor Conversion Rate
Out of all new visitor sessions, the percentage that completed an order 3. Shopping Cart Session Percentage
The percentage of sessions in which visitors placed at least one item in their shopping carts 4. Shopping Cart Conversion Rate
Out of all visitors who placed items in their shopping carts, the percentage that placed an actual order
5. Shopping Cart Abandonment Rate Out of all visitors who placed items in their shopping carts, the percentage that did not place an actual order
Session Traffic Summary Metrics 1. Average Session Length
The average length of time for a visitor session 2. Bounce (One Page) Rate
The percentage of sessions in which visitors only viewed one page before leaving the site 3. MultiPage Session Percentage
The percentage of sessions in which visitors viewed more than one page 4. Browsing Session Percentage
The percentage of sessions in which visitors viewed at least one product page 5. Page Views Per Session
The average number of pages viewed by visitors per session 6. Product Views Per Session
The average number of products viewed by visitors per session Mobile Summary Metrics
1. Mobile: Percentage of Sales Out of all online sales, the percentage that was from a mobile device
2. Mobile: Percentage of Site Traffic Out of all sessions, the percentage that was from a mobile device
3. Mobile: Bounce Rate The percentage of sessions from mobile devices in which visitors only viewed one page before leaving the site
4. Mobile: Conversion Rate The percentage of sessions from mobile devices in which visitors completed an order
5. Mobile: Average Session Length The average length of time for a visitor session from a mobile device
Cyber Monday Report 2013
13
About IBM Digital Analytics Benchmark IBM Digital Analytics Benchmark is part of the cloudbased IBM Digital Analytics solution and enables users to accurately measure their online marketing resultsincluding ecommerce salesagainst that of their peers. Benchmark is the only realtime, selfservice solution that delivers aggregated and anonymous competitive data for key performance indicators, showing how a site performs compared to its industry vertical and subvertical peers and competitors. Key performance indicators span traffic, engagement, channels, sales and conversion metrics including mobile, social and more.
About IBM Enterprise Marketing Management The IBM Enterprise Marketing Management (EMM) Suite is an endtoend, integrated set of capabilities designed exclusively for the needs of marketing organizations. Integrating and streamlining all aspects of marketing, IBM’s EMM Suite empowers organizations and individuals to turn their passion for marketing into valuable customer relationships and more profitable, efficient, timely, and measurable business outcomes. Delivered on premises or in the Cloud, the IBM EMM Suite of software solutions gives marketers the tools and insight they need to create individual customer value at every touch. The IBM EMM Suite helps marketers to understand customer wants and needs and leverage that understanding to engage buyers in highly relevant, interactive dialogs across digital, social, and traditional marketing channels.
About IBM Smarter Commerce
IBM Smarter Commerce puts the customer at the center of your business by viewing the brand experience through your customer’s eyes. At the same time, it optimizes within and across all brand touchpoints to create a deeper brand relationship with your customer while improving operational excellence for you. It leverages heightened customer insight and automated execution to enable you to consistently deliver personalized, highlyrelevant, seamless customer engagement to increase satisfaction, loyalty, and brand advocacy and improve asset utilization to drive profitable growth.
For More Information
To learn more about IBM Digital Analytics Benchmark, please contact your IBM marketing representative or IBM Business Partner or visit the following website: http://www01.ibm.com/software/marketingsolutions/benchmark/ Source Data The data in this report is delivered by the IBM Digital Analytics Benchmark which tracks millions of transactions and terabytes of data from approximately 800 U.S. retail websites. All data is aggregated and anonymous. *Denotes data from Xtify, an IBM company. Xtify is a leading provider of multichannel mobile messaging solutions. The Xtify platform provides marketers and developers access to enterprise tools to manage complex database or automated event driven campaigns
Cyber Monday Report 2013
14
© Copyright IBM Corporation 2013
IBM Corporation Software Group Route 100 Somers, NY 10589
Produced in the United States of America December 2013
IBM, the IBM logo, ibm.com and Smarter Commerce are trademarks of International Business Machines Corp., registered in many jurisdictions worldwide. Other product and service names might be trademarks of IBM or other companies. A current list of IBM trademarks is available on the Web at “Copyright and trademark information” at www.ibm.com/legal/copytrade.shtml.
This document is current as of the initial date of publication and may be changed by IBM at any time. Not all offerings are available in every country in which IBM operates.
THE INFORMATION IN THIS DOCUMENT IS PROVIDED “AS IS” WITHOUT ANY WARRANTY, EXPRESS OR IMPLIED, INCLUDING WITHOUT ANY WARRANTIES OF MERCHANTABILITY, FITNESS FOR A PARTICULAR PURPOSE AND ANY WARRANTY OR CONDITION OF NON-INFRINGEMENT. IBM products are warranted according to the terms and conditions of the agreements under which they are provided.