Cognos Analytics
172
PRINCETON UNIVERSITY Center for Data, Analytics and Reporting (CeDAR) Authored by: CeDAR, Business & Outreach Team Updated: November 2018 V 2.0
-
Upload
khangminh22 -
Category
Documents
-
view
0 -
download
0
Transcript of Cognos Analytics
PRINCETON UNIVERSITY Center for Data, Analytics and Reporting (CeDAR)
Authored by: CeDAR, Business & Outreach Team Updated: November 2018 V 2.0

Contents Notes ............................................................................................................................................................. 5
Preface .......................................................................................................................................................... 6
Introduction .................................................................................................................................................. 7
What’s New and Different ......................................................................................................................... 7
About the Warehouse ............................................................................................................................... 8
The CeDAR Website................................................................................................................................... 9
Logging into Cognos Analytics ................................................................................................................. 10
Additional Ways to Enter the Information Warehouse ....................................................................... 11
User Experience .......................................................................................................................................... 12
The Welcome Portal ................................................................................................................................ 12
My Content, Team Content, Packages, and Folders ................................................................................ 14
Recent Items ........................................................................................................................................... 14
Search and Find Content ......................................................................................................................... 15
Narrow Your Search with Filters .......................................................................................................... 15
Save Your Search ................................................................................................................................. 16
Navigation ............................................................................................................................................... 16
Welcome Menu (Page Switcher) ......................................................................................................... 17
More/Set as Home .............................................................................................................................. 17
Home Button ....................................................................................................................................... 17
Notifications ........................................................................................................................................ 18
Personal Menu .................................................................................................................................... 19
Exploring Content ................................................................................................................................ 19
Viewing and Interacting with Content ..................................................................................................... 20
The Action Menu ................................................................................................................................. 21
Properties of Report ................................................................................................................................ 22
Password Protecting PDF Documents ..................................................................................................... 24
Prompts ................................................................................................................................................... 25
Drill Through Reports .............................................................................................................................. 26
Report Options ........................................................................................................................................ 27
Subscriptions ........................................................................................................................................... 27
Subscribing to Reports ........................................................................................................................ 27
Notifications ........................................................................................................................................ 28
Schedules ................................................................................................................................................ 28
Managing Your Schedules and Subscriptions ...................................................................................... 29
Report Views ........................................................................................................................................... 29
Editing Reports ........................................................................................................................................ 30
Report Output Options ............................................................................................................................ 30
Interactivity Mode ................................................................................................................................... 31
Report Versions ....................................................................................................................................... 31
Bursting Reports ...................................................................................................................................... 32
Reporting in Cognos Analytics - Overview ................................................................................................... 35
Modifying Existing Reports ...................................................................................................................... 35
Report Function Mapping ....................................................................................................................... 36
Creating a Report .................................................................................................................................... 38
Templates and Themes ........................................................................................................................... 38
Choosing a Package ................................................................................................................................. 39
Reporting Interface ................................................................................................................................. 40
............................................................................................................................................................ 40
Data Pane ............................................................................................................................................ 41
The Toolbox ......................................................................................................................................... 42
Pages Pane .......................................................................................................................................... 43
Queries and Conditions ....................................................................................................................... 43
Report Specification ............................................................................................................................ 44
View Tabular Data ............................................................................................................................... 44
Exploring Page Views ........................................................................................................................... 45
Properties Pane ................................................................................................................................... 47
More Options ...................................................................................................................................... 48
On-Demand Toolbar ............................................................................................................................ 49
Turning Interactivity Mode On/Off .......................................................................................................... 50
Creating and Modifying Reports .................................................................................................................. 51
Creating a New Report in Cognos Analytics ............................................................................................ 51
Validating a Report .................................................................................................................................. 53
Running a Report ..................................................................................................................................... 54
Saving Report Output .............................................................................................................................. 55
Saving a Report ........................................................................................................................................ 55
Removing a Column ................................................................................................................................ 56
Source Tab VS Data Items Tab ............................................................................................................... 56
Sorting ..................................................................................................................................................... 57
Multiple Sorts within a Report............................................................................................................. 58
Removing a Sort .................................................................................................................................. 59

Hiding Columns ....................................................................................................................................... 60
Rearranging Columns .............................................................................................................................. 62
Adding a Column ..................................................................................................................................... 63
Singletons ................................................................................................................................................ 64
Grouping and Aggregation .......................................................................................................................... 66
Grouping a List Report ............................................................................................................................. 66
Level Spanning ......................................................................................................................................... 69
Sections ................................................................................................................................................... 72
Page Breaks ............................................................................................................................................. 74
Calculations ................................................................................................................................................. 78
Adding a Calculated Column ................................................................................................................... 78
Understanding Aggregation .................................................................................................................... 80
Adding Summary Totals to a Footer (Totaling a Column) ........................................................................ 81
Remove the Summary Footer ................................................................................................................. 83
Grouped Summary Footers ..................................................................................................................... 84
Summary Calculation without Detail and Find the Average .................................................................... 86
Visualizations ............................................................................................................................................... 90
Pie Chart .................................................................................................................................................. 90
Stacked Bar Chart - with Attributes ........................................................................................................ 91
Filters ........................................................................................................................................................... 93
Concepts .................................................................................................................................................. 93
Opening the Filters Dialog Window ......................................................................................................... 95
The Usage Area ................................................................................................................................... 96
The Application Area ........................................................................................................................... 96
Filter Expression Actions ..................................................................................................................... 97
The Filters Dialog Window ....................................................................................................................... 97
Detail Filter Expression ............................................................................................................................ 97
Source Tab ........................................................................................................................................... 98
Data Items Tab .................................................................................................................................... 98
Query Items Tab .................................................................................................................................. 98
Functions Tab ...................................................................................................................................... 99
Parameters Tab ................................................................................................................................... 99
Macros Tab .......................................................................................................................................... 99
Filtering on a Single Item from the Source Tab ..................................................................................... 101
Filtering on a Single Item from the Data Items Tab ............................................................................... 105
Usage (Required, Optional, Disabled) ................................................................................................ 107
Filtering on Multiple Items – Using “In” ................................................................................................ 110
Filtering on a Date Range – Using “Between” ....................................................................................... 112
Filtering Text – Using “Starts With” ....................................................................................................... 113
Filtering Text – Using “Contains” ........................................................................................................... 115
Filtering Using “Like” and Wildcards ..................................................................................................... 116
Creating a Custom Filter ........................................................................................................................ 118
Prompts ..................................................................................................................................................... 119
Parameters and Prompts ....................................................................................................................... 119
Building a Parameter Filter .................................................................................................................... 121
Prompt Pages with Prompts .................................................................................................................. 124
Identify and Explore the Query and Parameter Filter............................................................................ 130
Prompts – Selecting Multiple Items in the Same Prompt ...................................................................... 131
Prompt Button ....................................................................................................................................... 134
Formatting Reports ................................................................................................................................... 136
Building a Report ................................................................................................................................... 136
Data formats.......................................................................................................................................... 137
Text Formats ......................................................................................................................................... 139
Adding Headers and Footers ................................................................................................................. 141
Formatting the Title ............................................................................................................................... 143
Adding a New Page ................................................................................................................................ 145
Understanding the ‘Select Ancestor’ Button ......................................................................................... 146
Drill Throughs ........................................................................................................................................ 148
Crosstab Reports ....................................................................................................................................... 150
Converting a List Report into a Crosstab ............................................................................................... 151
Crosstab Princeton Template ................................................................................................................ 154
Nested Crosstabs ................................................................................................................................... 155
Crosstab with Totals .............................................................................................................................. 157
Creating a Mail Merge/Letter .................................................................................................................... 158
Notes
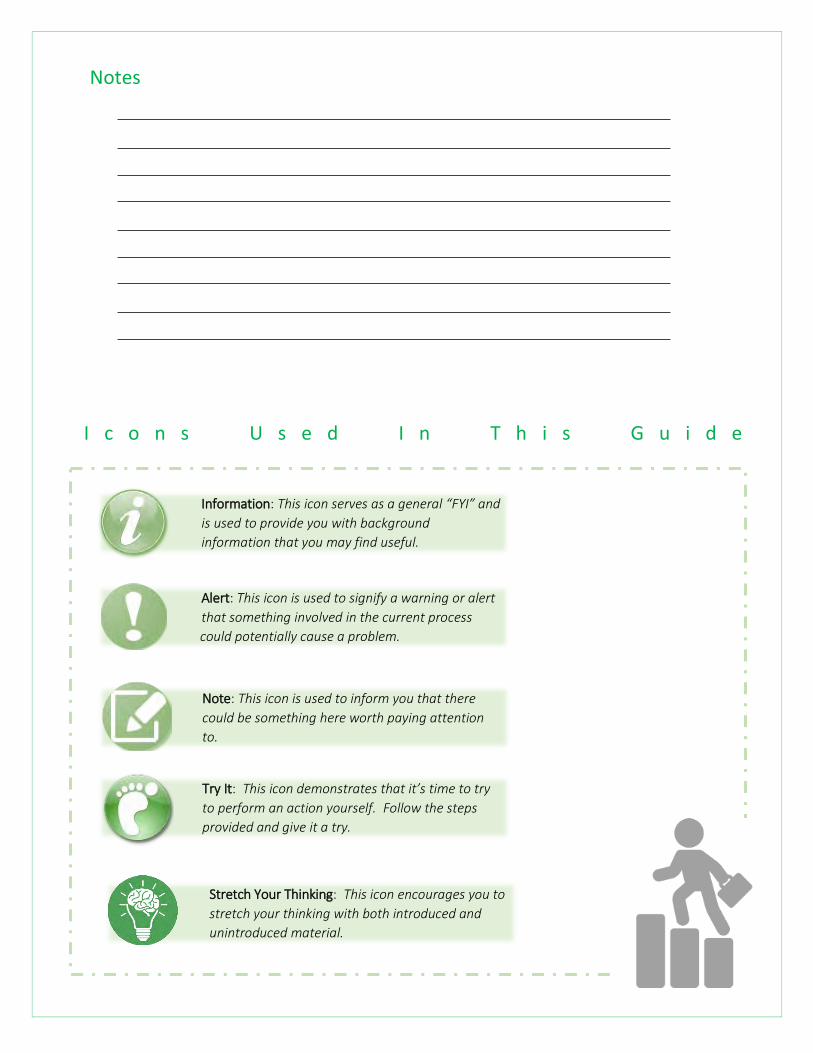
I c o n s U s e d I n T h i s G u i d e
Stretch Your Thinking: This icon encourages you to stretch your thinking with both introduced and unintroduced material.
Note: This icon is used to inform you that there could be something here worth paying attention to.
Alert: This icon is used to signify a warning or alert that something involved in the current process could potentially cause a problem.
Information: This icon serves as a general “FYI” and is used to provide you with background information that you may find useful.
Try It: This icon demonstrates that it’s time to try to perform an action yourself. Follow the steps provided and give it a try.

Content in this document is based on fictitious data sets represented in CeDAR’s Training Package Page 6
Preface Implemented at Princeton in 2005, the Cognos BI suite integrates with many Princeton applications to provide business intelligence services, including reporting abilities to PeopleSoft HR, PeopleSoft Financials, and PeopleSoft Student, as well as other non-PeopleSoft related applications including Labor Accounting, Time Collection, and University Housing. The Information Warehouse utilizes Princeton’s LDAP environment to provide authentication.
Specific departments within the University community take ownership and govern the data in the Information Warehouse. To acquire access to a specific package, please contact the appropriate package custodian. For further information about accessing and/or using data, please refer to CeDAR’s website: https://cedar.princeton.edu/access-use-data.
• Information in Princeton’s Information Warehouse is current as of the close of business the day before
• Cognos Analytics is a web-based reporting solution that allows data consumers to create and run reports
• Cognos Analytics can work with any of the following browsers (see below for detailed chart): o Internet Explorer o Firefox o Chrome o Safari
• Microsoft Edge is NOT a supported web browser • Please refer to IBM’s site for a detailed list of recommended browsers and other supported
software: https://www.ibm.com/software/reports/compatibility/clarity-reports/report/html/prereqsForProduct?deliverableId=87ECD4B031EF11E8B9DA1016CAD92E2B#sw-14
Content in this book is based on completely fictitious data sets represented in CeDAR’s Training Package in the Information Warehouse
Content in this document is based on fictitious data sets represented in CeDAR’s Training Package Page 7
Introduction Welcome to Cognos Analytics! Princeton University has recently upgraded to the latest release of IBM’s Cognos BI tool, (Cognos 11), which offers a completely redesigned user interface without changing the majority of the functionality behind the scenes.
The first thing you will notice when you login to Cognos Analytics is that IBM has decided to retire the interface that’s long been perceived to be outdated and far from the look and feel of other modern applications. IBM has now provided a slick, modern, and user-focused interface, which has more emphasis on self-service and user experience while still delivering the strong BI capability for which it is well renowned.
This tool features a consistent user experience while moving from capability to capability. The new portal, the reporting piece, and dashboarding are inside of a single browser tab united by a common look and feel.
In addition to all of the original functionality offered in previous versions of Cognos, Version 11 offers many new and exciting features, which this user guide will lead you through.
What’s New and Different For those who have been working with past versions of Cognos, here are some of the new features to look forward to in Cognos Analytics, which depending on your level of permissions for a particular package, you may or may not experience:
• Completely redesigned interface, which replaces Cognos Connection, Report Studio, Query Studio, and Workspace Advanced
• My Folders and Public Folders have been renamed • New and improved search functionality • Fly-out menus to explore content of folder(s) • Ability for users to interact with data upon running reports (contingent on security permissions) • Ability for users to upload data (contingent on security permissions) • Dashboard and storyboarding functionality (contingent on security permissions) • Subscriptions for end users in lieu of (and/or in addition to) schedules

Content in this document is based on fictitious data sets represented in CeDAR’s Training Package Page 8
About the Warehouse The Princeton University “Information Warehouse” describes the reporting data repository available to the Princeton Community. Consumers of this data can access reports through the IBM tool, Cognos Analytics. Data sets inside the Information Warehouse (IW) accurately represent information in each one’s corresponding source, or source system. However, on a nightly basis, all source systems (such as PeopleSoft Financials or Time Collection) feed their data into IW reports. Thus, information inside the IW will be incongruent to the same information found in the corresponding source system by a difference of twenty-four hours.
Content in this document is based on fictitious data sets represented in CeDAR’s Training Package Page 9
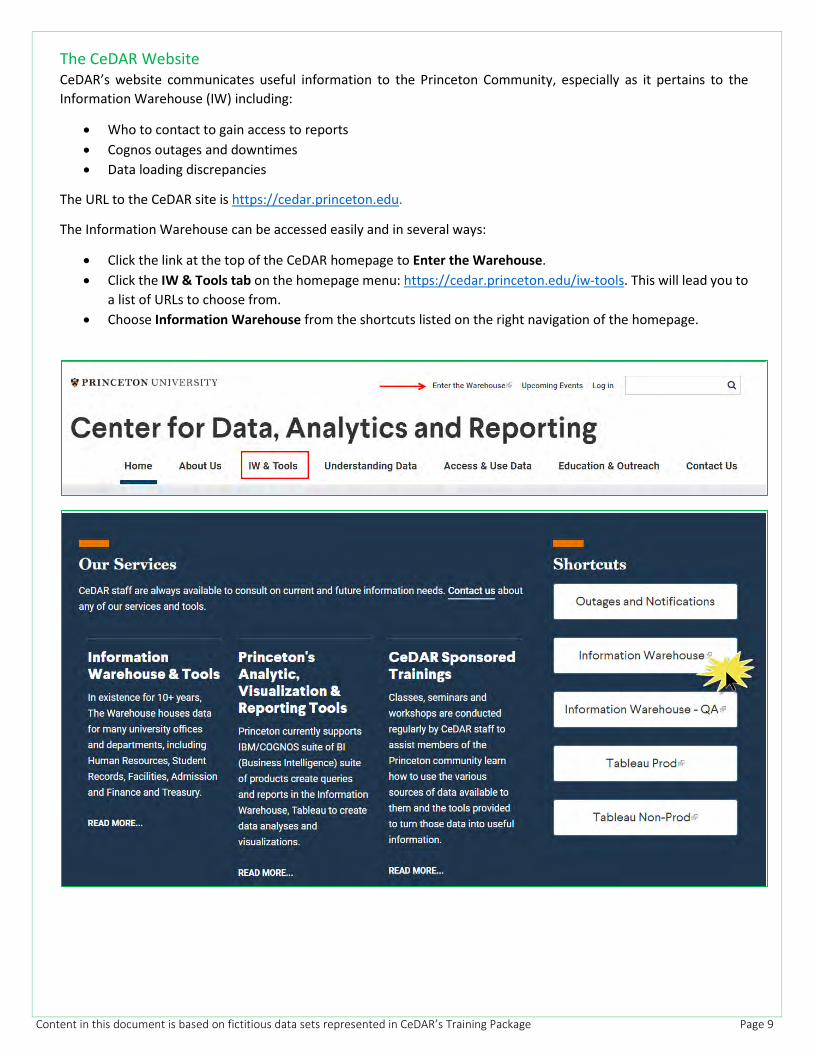
The CeDAR Website CeDAR’s website communicates useful information to the Princeton Community, especially as it pertains to the Information Warehouse (IW) including:
• Who to contact to gain access to reports • Cognos outages and downtimes • Data loading discrepancies
The URL to the CeDAR site is https://cedar.princeton.edu.
The Information Warehouse can be accessed easily and in several ways:
• Click the link at the top of the CeDAR homepage to Enter the Warehouse. • Click the IW & Tools tab on the homepage menu: https://cedar.princeton.edu/iw-tools. This will lead you to
a list of URLs to choose from. • Choose Information Warehouse from the shortcuts listed on the right navigation of the homepage.

Content in this document is based on fictitious data sets represented in CeDAR’s Training Package Page 10
Logging into Cognos Analytics To log into Cognos Analytics (the Information Warehouse), choose any of the methods on the previous page. You will need to authenticate with a valid Princeton NetID and password to enter the Warehouse.
Logging into the Information Warehouse from an offsite location (off of the Princeton Network) will require you to use a Princeton Secure Remote Access (SRA/VPN) Connection.
Content in this document is based on fictitious data sets represented in CeDAR’s Training Package Page 11
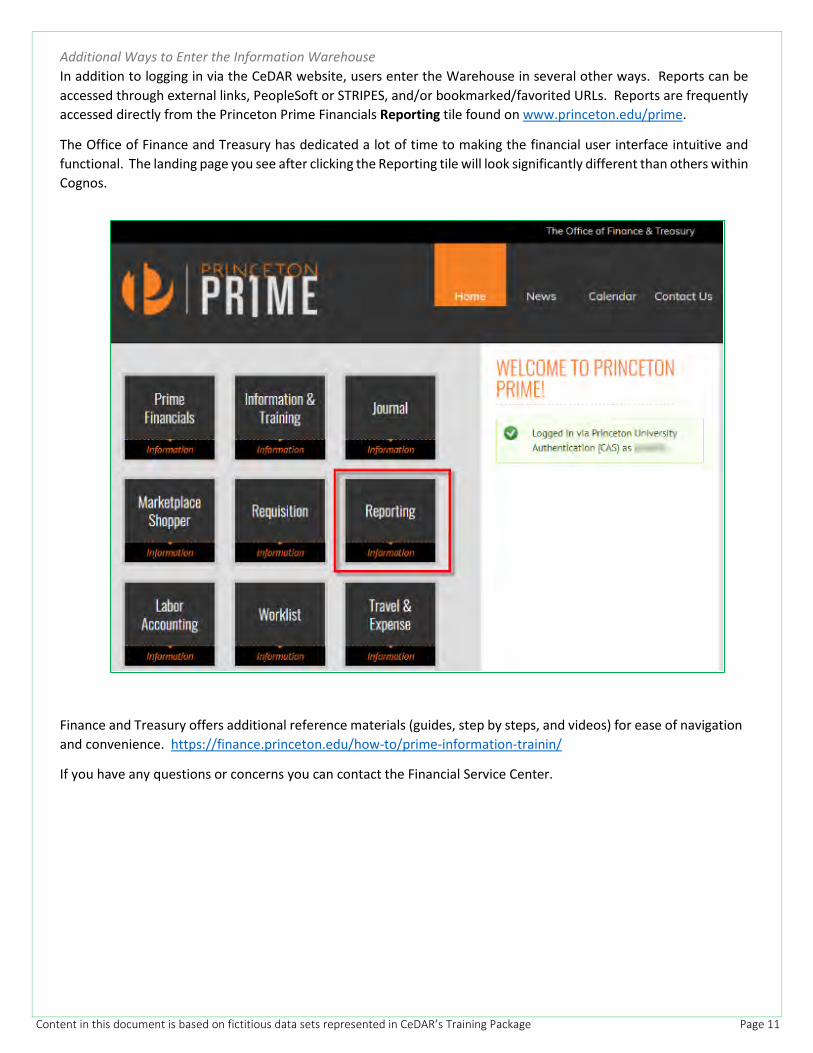
Additional Ways to Enter the Information Warehouse In addition to logging in via the CeDAR website, users enter the Warehouse in several other ways. Reports can be accessed through external links, PeopleSoft or STRIPES, and/or bookmarked/favorited URLs. Reports are frequently accessed directly from the Princeton Prime Financials Reporting tile found on www.princeton.edu/prime.
The Office of Finance and Treasury has dedicated a lot of time to making the financial user interface intuitive and functional. The landing page you see after clicking the Reporting tile will look significantly different than others within Cognos.
Finance and Treasury offers additional reference materials (guides, step by steps, and videos) for ease of navigation and convenience. https://finance.princeton.edu/how-to/prime-information-trainin/
If you have any questions or concerns you can contact the Financial Service Center.
Content in this document is based on fictitious data sets represented in CeDAR’s Training Package Page 12
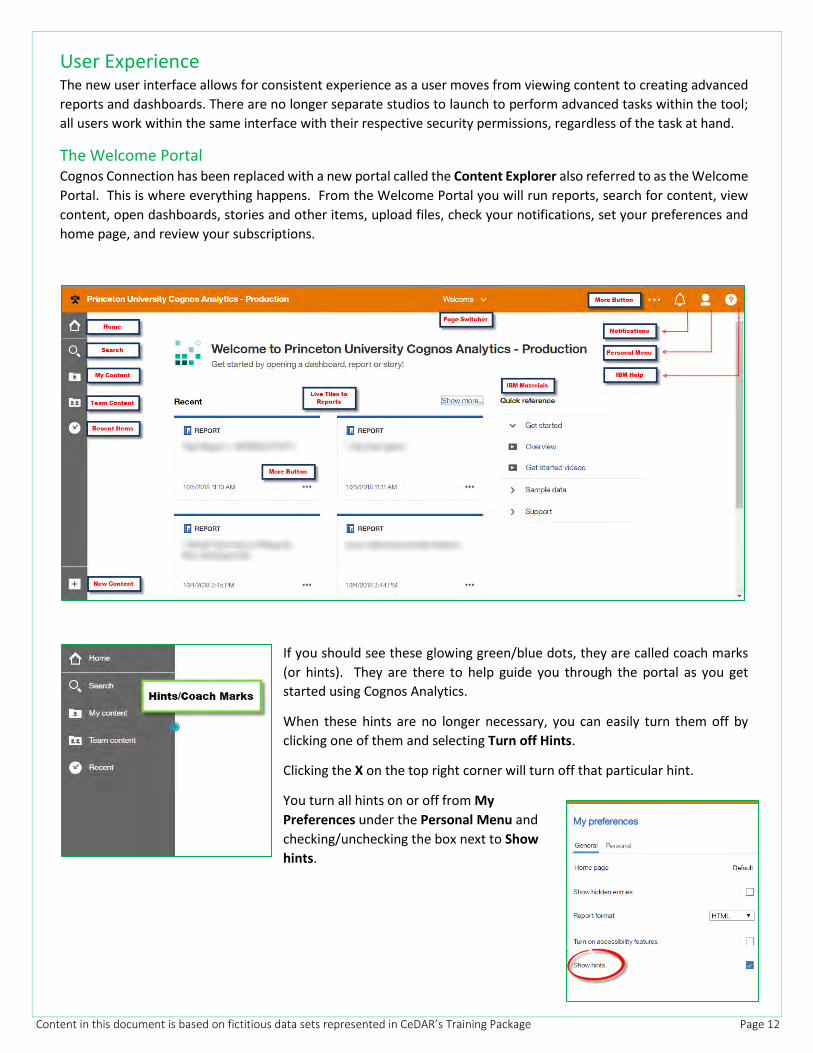
User Experience The new user interface allows for consistent experience as a user moves from viewing content to creating advanced reports and dashboards. There are no longer separate studios to launch to perform advanced tasks within the tool; all users work within the same interface with their respective security permissions, regardless of the task at hand.
The Welcome Portal Cognos Connection has been replaced with a new portal called the Content Explorer also referred to as the Welcome Portal. This is where everything happens. From the Welcome Portal you will run reports, search for content, view content, open dashboards, stories and other items, upload files, check your notifications, set your preferences and home page, and review your subscriptions.
If you should see these glowing green/blue dots, they are called coach marks (or hints). They are there to help guide you through the portal as you get started using Cognos Analytics.
When these hints are no longer necessary, you can easily turn them off by clicking one of them and selecting Turn off Hints.
Clicking the X on the top right corner will turn off that particular hint.
You turn all hints on or off from My Preferences under the Personal Menu and checking/unchecking the box next to Show hints.
Content in this document is based on fictitious data sets represented in CeDAR’s Training Package Page 13
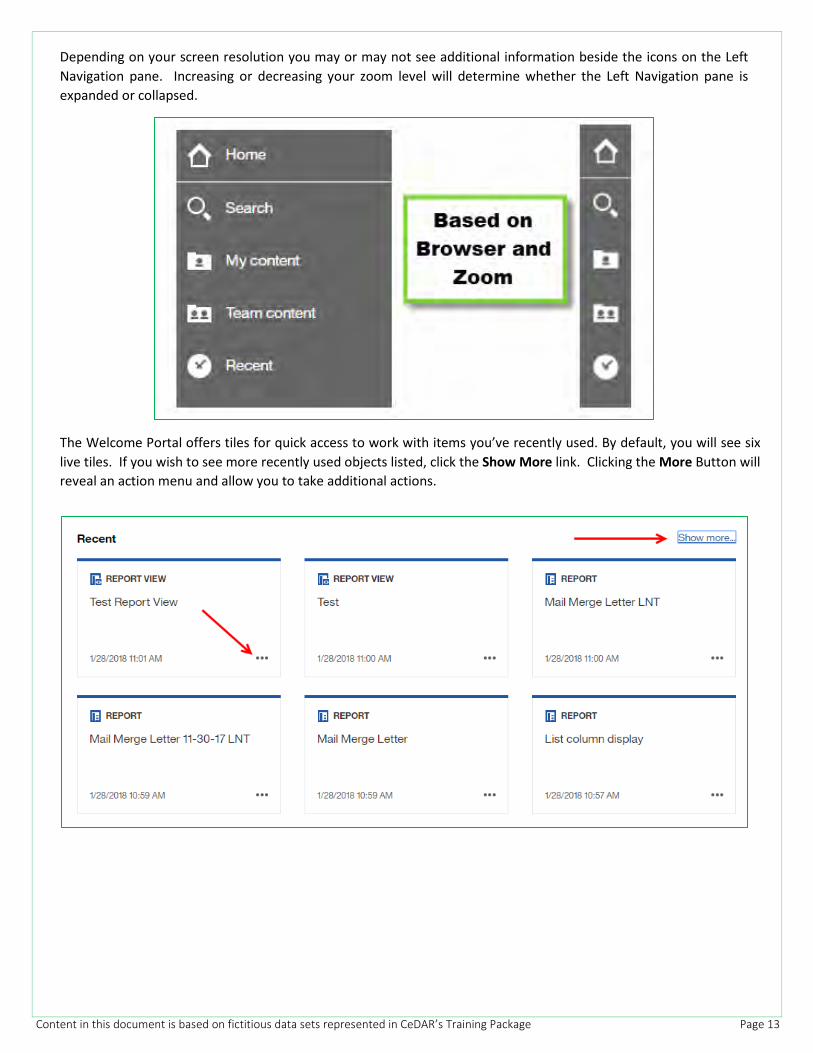
Depending on your screen resolution you may or may not see additional information beside the icons on the Left Navigation pane. Increasing or decreasing your zoom level will determine whether the Left Navigation pane is expanded or collapsed.
The Welcome Portal offers tiles for quick access to work with items you’ve recently used. By default, you will see six live tiles. If you wish to see more recently used objects listed, click the Show More link. Clicking the More Button will reveal an action menu and allow you to take additional actions.
Content in this document is based on fictitious data sets represented in CeDAR’s Training Package Page 14
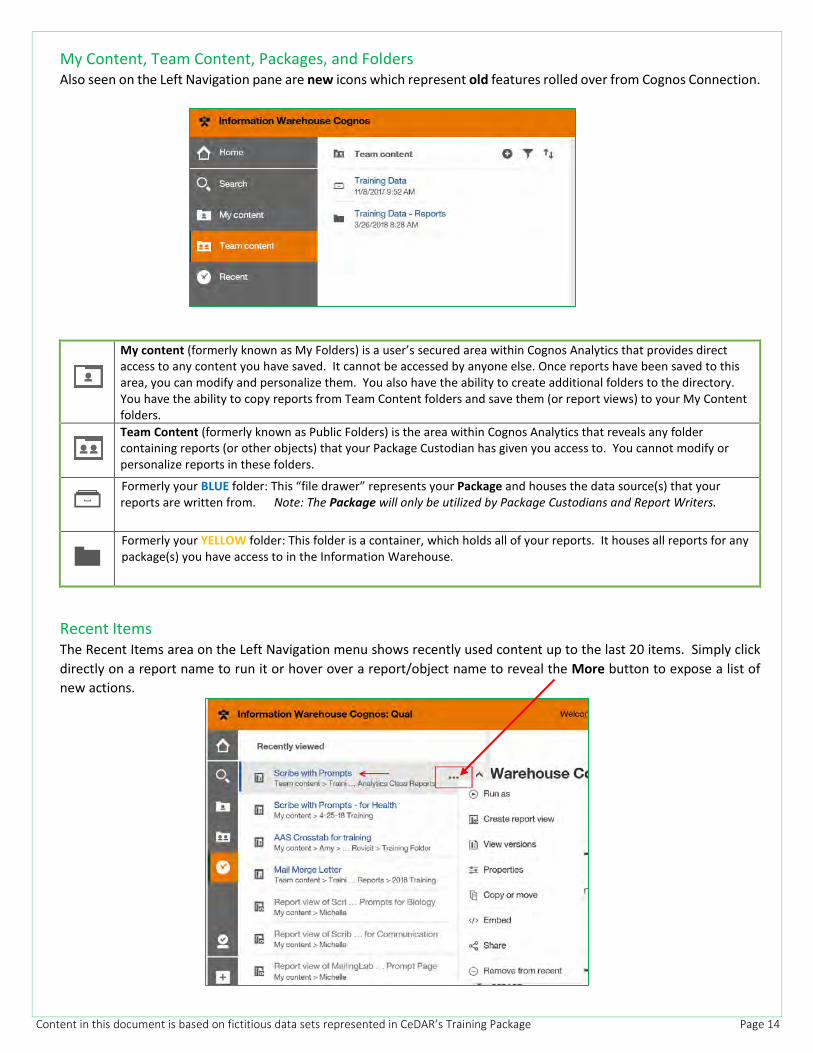
My Content, Team Content, Packages, and Folders Also seen on the Left Navigation pane are new icons which represent old features rolled over from Cognos Connection.
My content (formerly known as My Folders) is a user’s secured area within Cognos Analytics that provides direct access to any content you have saved. It cannot be accessed by anyone else. Once reports have been saved to this area, you can modify and personalize them. You also have the ability to create additional folders to the directory. You have the ability to copy reports from Team Content folders and save them (or report views) to your My Content folders.
Team Content (formerly known as Public Folders) is the area within Cognos Analytics that reveals any folder containing reports (or other objects) that your Package Custodian has given you access to. You cannot modify or personalize reports in these folders.
Formerly your BLUE folder: This “file drawer” represents your Package and houses the data source(s) that your reports are written from. Note: The Package will only be utilized by Package Custodians and Report Writers.
Formerly your YELLOW folder: This folder is a container, which holds all of your reports. It houses all reports for any package(s) you have access to in the Information Warehouse.
Recent Items The Recent Items area on the Left Navigation menu shows recently used content up to the last 20 items. Simply click directly on a report name to run it or hover over a report/object name to reveal the More button to expose a list of new actions.

Content in this document is based on fictitious data sets represented in CeDAR’s Training Package Page 15
Search and Find Content Whether you’re looking for reports, dashboards, stories, data, files, folders, packages or other items, you can find any object you’re looking for by opening your My Content or Team Content folders, or by checking your Recent list. However, the Search is a quick, easy way to find exactly what you’re looking for.
To find items, type keywords into the Search field and click Enter. You can also search for text including table or column labels, XML report specifications, URL items, shortcuts, templates, and more.
Search does not return results for content that’s archived, but you can access archived content from a report that’s listed in one of your folders.
Narrow Your Search with Filters If your search returns too many results, you can click the Filter icon to narrow your criteria.
The option to filter is only available after you perform an initial search.

Content in this document is based on fictitious data sets represented in CeDAR’s Training Package Page 16
Save Your Search After you search and the results are listed, you can Save your search for future use. If filter options were included in your search, these options are also saved and listed under Saved Searches.
The option to Save is only available after you perform an initial search.
Navigation The changes to the user interface affect how you move around in the tool. Here are some navigation tips!

Content in this document is based on fictitious data sets represented in CeDAR’s Training Package Page 17
Welcome Menu (Page Switcher) The Cognos Analytics Welcome Portal is the default Home page. Clicking the drop-down on the Welcome Menu/Page Switcher and selecting Welcome will always return you to this landing page, which may not necessarily be your “home page”.
More/Set as Home You are encouraged to click the More button anytime you see it, especially as you get acclimated with the new user interface. Depending on where you are in navigation, capabilities behind the More button could change.
If you prefer, it is possible to make other content (like reports or dashboards) your Home Page. Click the More button on the application toolbar and select Set as home.
Home Button The Home button will return you to your home screen in a single click. This is a more direct route to your home page than using the switcher if you have chosen a new home page.
You can switch your home page from the Welcome Portal to a report or dashboard.

Content in this document is based on fictitious data sets represented in CeDAR’s Training Package Page 18
Cognos Analytics offers the ability to have multiple objects open at the same time (in the current session) making it easy to quickly switch between them. Once a report has been run, it will remain open in the tray.
You can close objects that are open in the tray by clicking the to the right of the object name.
Clicking back to an open report from the tray (or list of live tiles while it is still active in the list) will not “re-run” the report or allow you to choose new prompts. It will only return you to the report’s last generated output. If
you need to re-run your report, you will first need to close the active report from the tray as demonstrated above or reset your prompts.
Notifications Alerts are denoted as numerical characters next to the Notification (bell) icon. As subscribed reports finish executing, the number of alerts will increase and a new number on the bell will be revealed.

Content in this document is based on fictitious data sets represented in CeDAR’s Training Package Page 19
Personal Menu Use this area to adjust settings related to you as the user, to change preference settings, to easily make any modifications to your schedule and subscriptions, and to logout.
Exploring Content Also new, is a change to the former “folder-based” structure of Cognos Connection (previous version of the tool) to a fly-out menu that lets users explore content within their folder(s) as well as perform other administrative tasks depending on permissions.
Hovering over a report (or other object in the content pane) will reveal the More button. The More button provides an Action menu, which houses many of the tasks you can perform for that particular report/object.

Content in this document is based on fictitious data sets represented in CeDAR’s Training Package Page 20
Clicking around and exploring is the best way to become acclimated with the tool as well as discover how things work in the new user interface.
Use the breadcrumbs to navigate within the content and get out of a buried destination within your folder directory.
Use the Filter button to narrow the contents being viewed in the pane.
By clicking the Sort button, you can also sort content in ascending or descending order by name or last modified date.
Resize the content pane by clicking and dragging the two small lines on the border of the pane to the desired location.
Viewing and Interacting with Content When you find a report you would like to run, you have several options:
(A) Navigate to the desired report from My Content or Team Content on the Left Navigation menu and click directly on the report name. (B) From this same navigation, hover over the desired report and click the More button to the right of the report. Choose Run as and select a method to run the report to a specific output type. (C) If you’d like to run a report that you’ve recently worked with, click in the white space of the live tile on the Welcome Portal. (D) Click the More button on the bottom right of the live tile.
Once a report has been opened in a current session, it will remain open in your Welcome Menu/Page Switcher and held in memory until you close it (or the session). Clicking on an already-opened report
from the live-tiles or Welcome Menu will launch the report with its last generated output.
(E) Navigate to a report via the Recent icon on the Left Navigation menu.
Content in this document is based on fictitious data sets represented in CeDAR’s Training Package Page 21
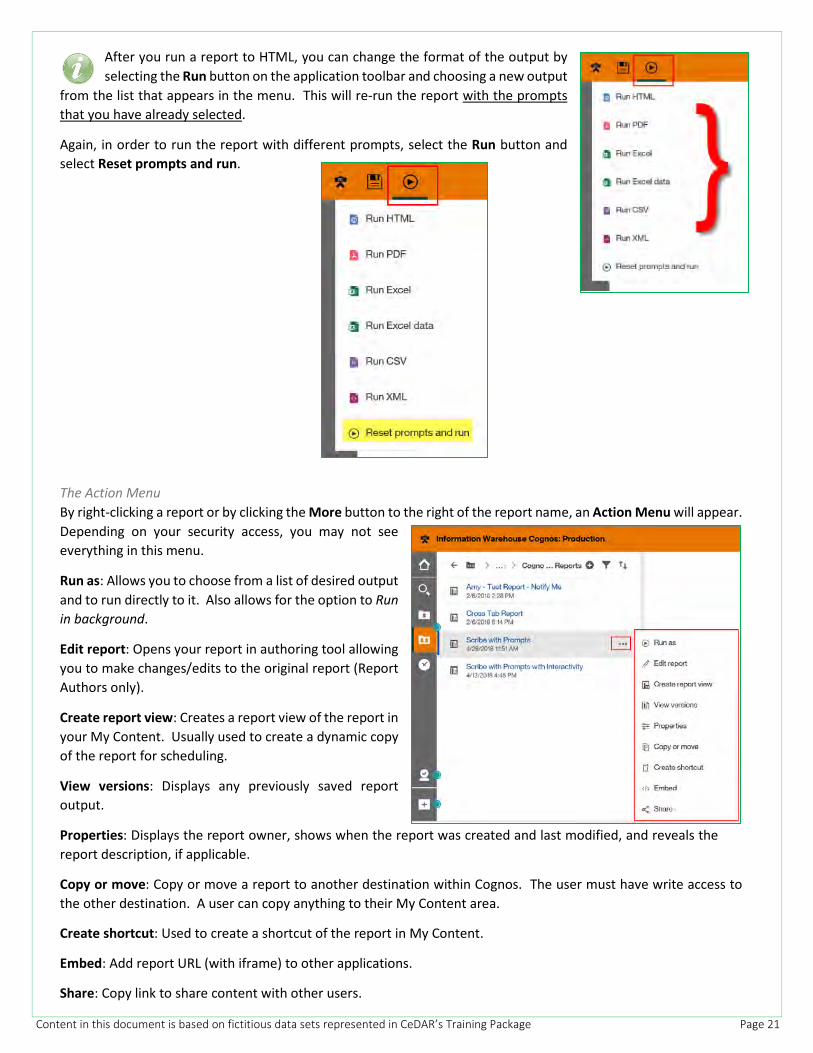
After you run a report to HTML, you can change the format of the output by selecting the Run button on the application toolbar and choosing a new output
from the list that appears in the menu. This will re-run the report with the prompts that you have already selected.
Again, in order to run the report with different prompts, select the Run button and select Reset prompts and run.
The Action Menu By right-clicking a report or by clicking the More button to the right of the report name, an Action Menu will appear. Depending on your security access, you may not see everything in this menu.
Run as: Allows you to choose from a list of desired output and to run directly to it. Also allows for the option to Run in background.
Edit report: Opens your report in authoring tool allowing you to make changes/edits to the original report (Report Authors only).
Create report view: Creates a report view of the report in your My Content. Usually used to create a dynamic copy of the report for scheduling.
View versions: Displays any previously saved report output.
Properties: Displays the report owner, shows when the report was created and last modified, and reveals the report description, if applicable.
Copy or move: Copy or move a report to another destination within Cognos. The user must have write access to the other destination. A user can copy anything to their My Content area.
Create shortcut: Used to create a shortcut of the report in My Content.
Embed: Add report URL (with iframe) to other applications.
Share: Copy link to share content with other users.
Content in this document is based on fictitious data sets represented in CeDAR’s Training Package Page 22
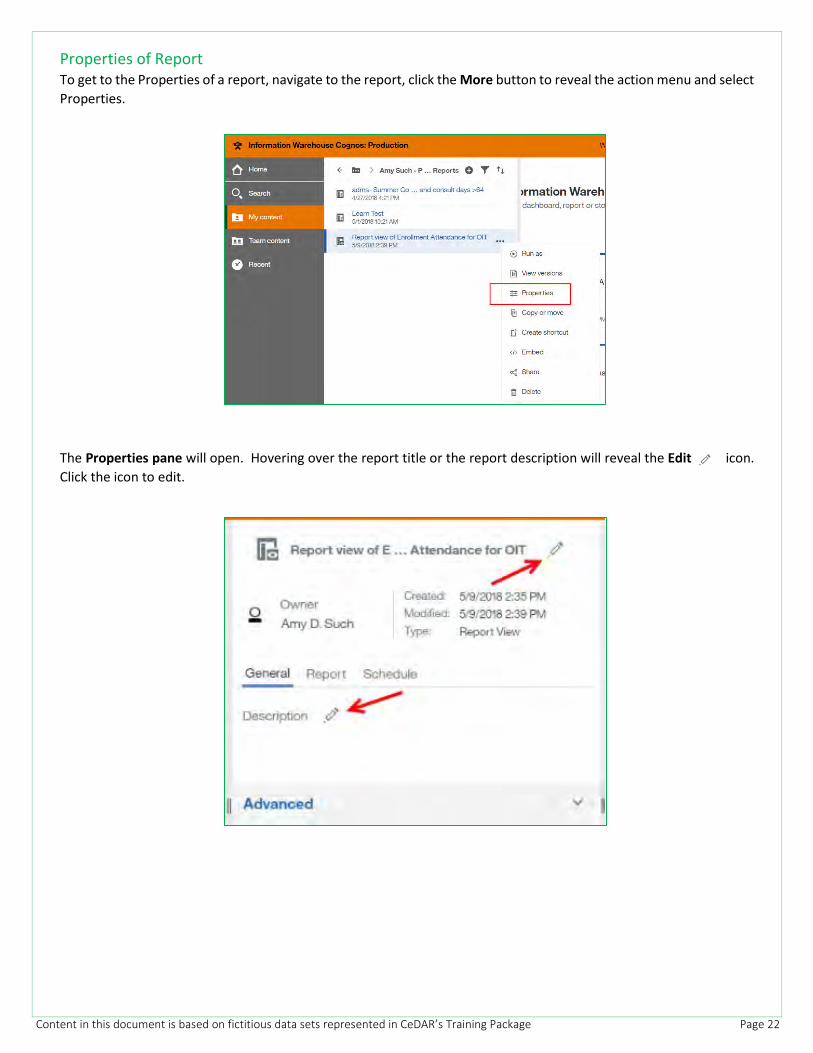
Properties of Report To get to the Properties of a report, navigate to the report, click the More button to reveal the action menu and select Properties.
The Properties pane will open. Hovering over the report title or the report description will reveal the Edit icon. Click the icon to edit.
Content in this document is based on fictitious data sets represented in CeDAR’s Training Package Page 23
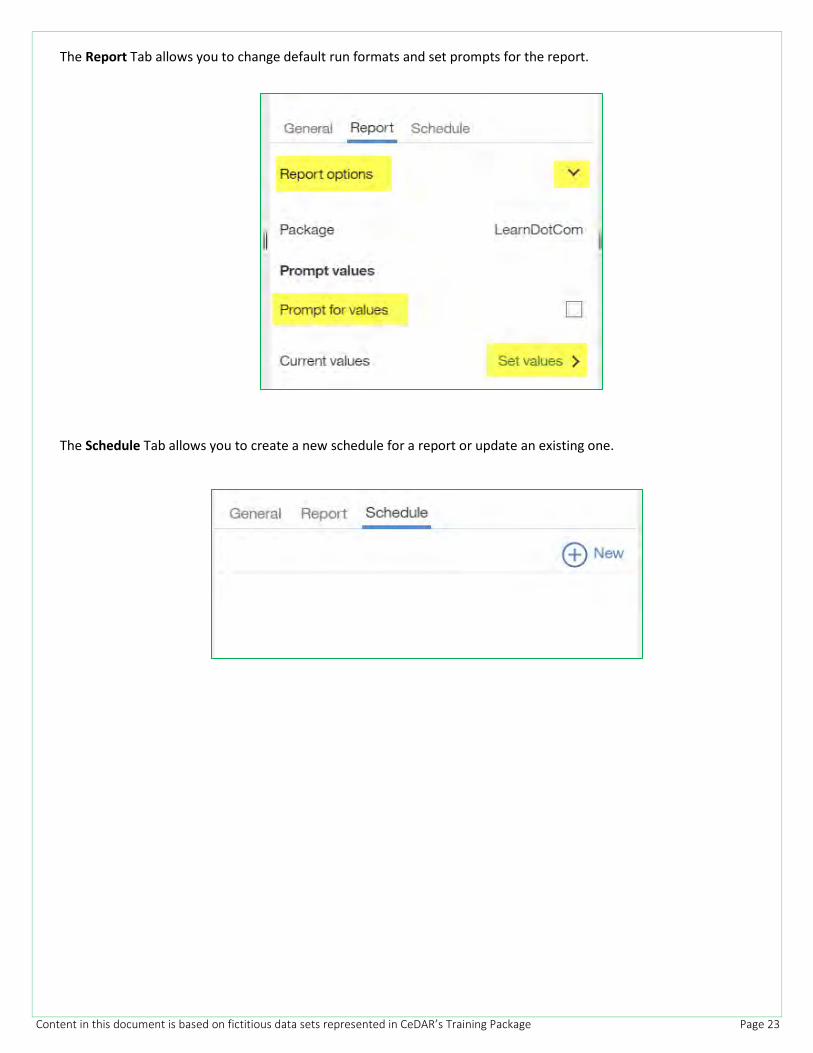
The Report Tab allows you to change default run formats and set prompts for the report.
The Schedule Tab allows you to create a new schedule for a report or update an existing one.
Content in this document is based on fictitious data sets represented in CeDAR’s Training Package Page 24
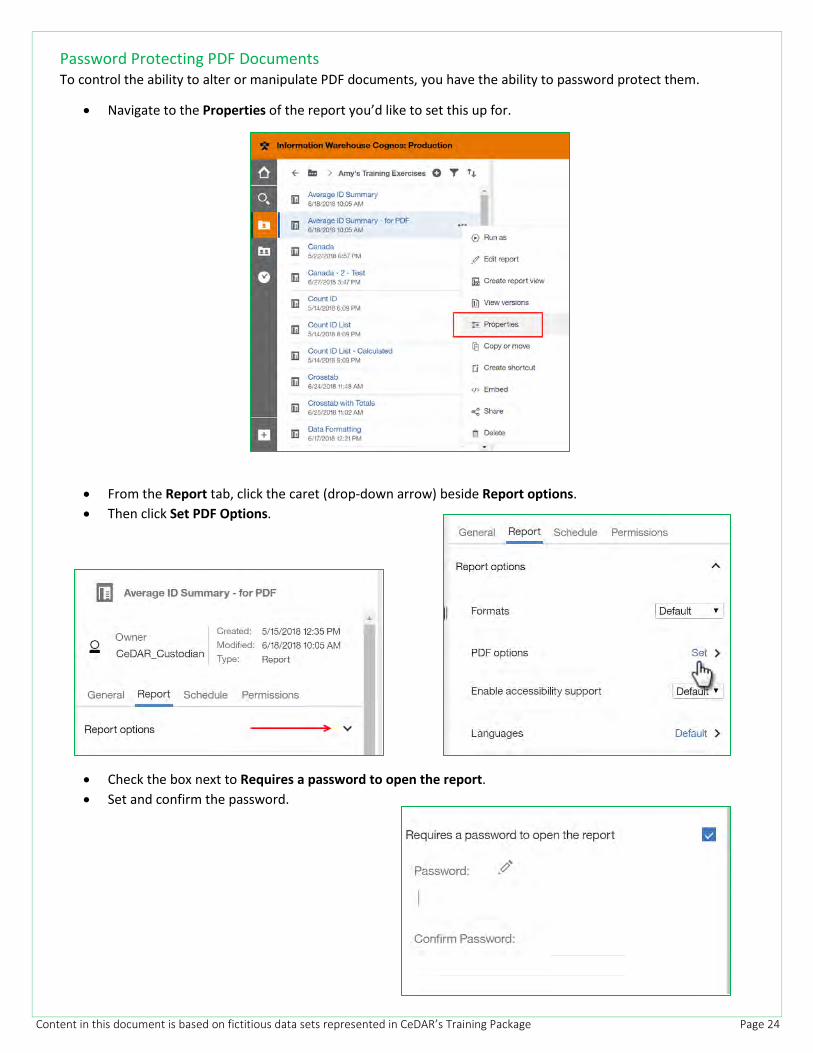
Password Protecting PDF Documents To control the ability to alter or manipulate PDF documents, you have the ability to password protect them.
• Navigate to the Properties of the report you’d like to set this up for.
• From the Report tab, click the caret (drop-down arrow) beside Report options. • Then click Set PDF Options.
• Check the box next to Requires a password to open the report. • Set and confirm the password.
Content in this document is based on fictitious data sets represented in CeDAR’s Training Package Page 25
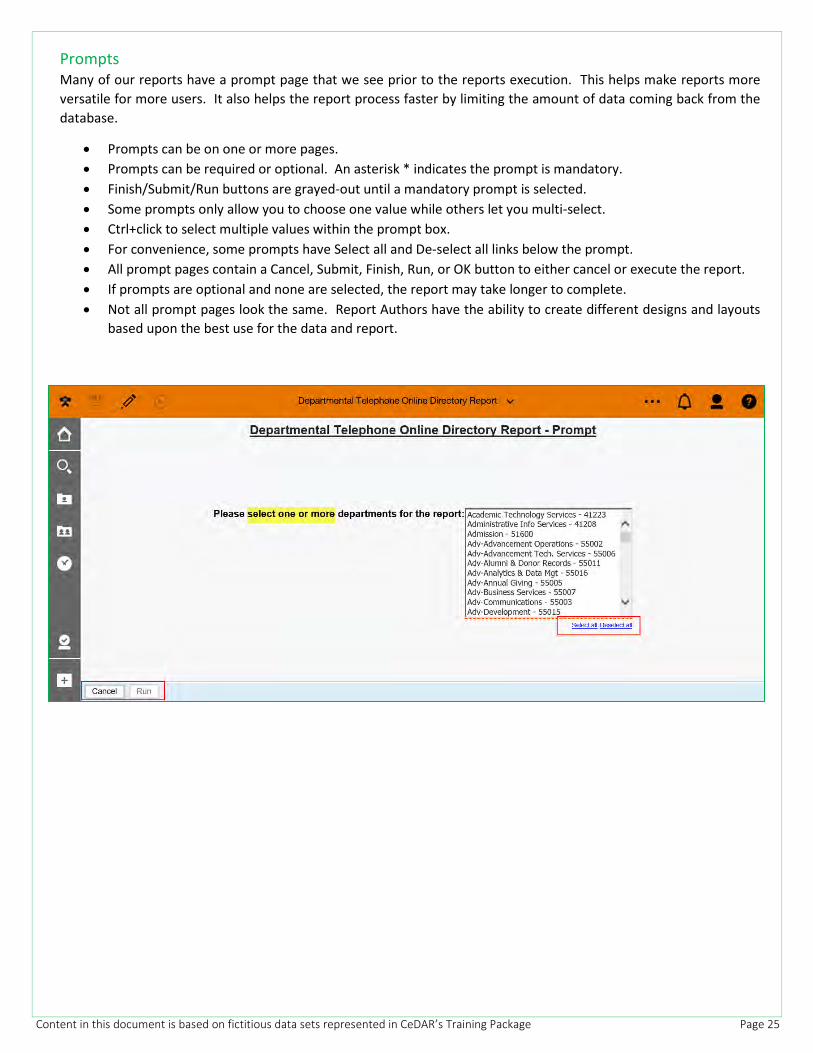
Prompts Many of our reports have a prompt page that we see prior to the reports execution. This helps make reports more versatile for more users. It also helps the report process faster by limiting the amount of data coming back from the database.
• Prompts can be on one or more pages. • Prompts can be required or optional. An asterisk * indicates the prompt is mandatory. • Finish/Submit/Run buttons are grayed-out until a mandatory prompt is selected. • Some prompts only allow you to choose one value while others let you multi-select. • Ctrl+click to select multiple values within the prompt box. • For convenience, some prompts have Select all and De-select all links below the prompt. • All prompt pages contain a Cancel, Submit, Finish, Run, or OK button to either cancel or execute the report. • If prompts are optional and none are selected, the report may take longer to complete. • Not all prompt pages look the same. Report Authors have the ability to create different designs and layouts
based upon the best use for the data and report.
Content in this document is based on fictitious data sets represented in CeDAR’s Training Package Page 26
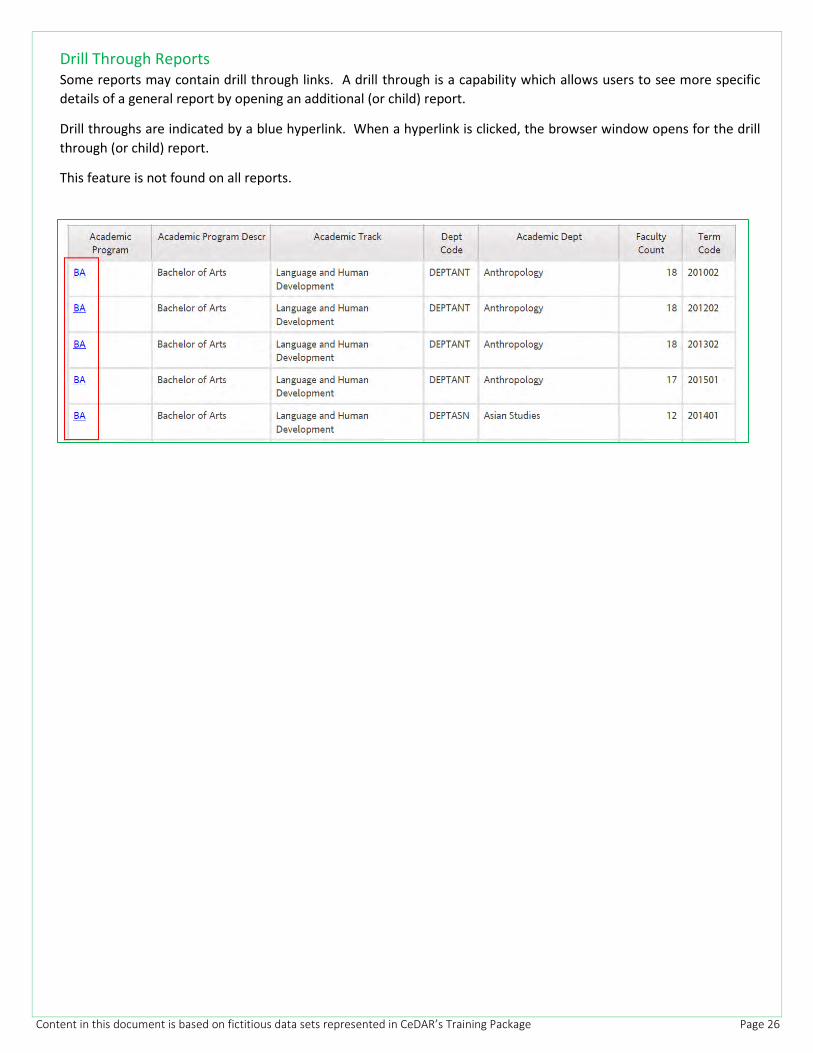
Drill Through Reports Some reports may contain drill through links. A drill through is a capability which allows users to see more specific details of a general report by opening an additional (or child) report.
Drill throughs are indicated by a blue hyperlink. When a hyperlink is clicked, the browser window opens for the drill through (or child) report.
This feature is not found on all reports.
Content in this document is based on fictitious data sets represented in CeDAR’s Training Package Page 27
Report Options While the interface looks to be the same, now that the report has run, you do have more options to explore. For instance, you have the option to subscribe to the report that is open, save it as a report view, make edits to it in Reporting (if you are a report author), run it to another output type, and work with the report in full interactivity mode (if this feature has been turned on for the particular report you are working with). The options available to you depend on the type of report you’re viewing as well as the permissions that have been set for you in Cognos.
Choose the options that best suit your needs for viewing frequency and personalization. If you want to see and typically run a report on a regular basis, subscribe to it. If it’s really important or somewhere you’ll visit or start from each day, you can set it as your home page. If you entered prompt and parameter values in the past and you would like to save them so you don’t have to enter them each time you go to run the report, save the report as a report view. If you choose to edit the report, the report opens in Reporting with all the tools you need, right there in the same window. Depending on the item type, the appropriate actions are available in the viewer.
Subscriptions In past versions of Cognos, users were able to use the Scheduling mechanism to schedule their reports to run in regular intervals. In many cases, this particular task served the purpose of sending the report to a wide distribution.
While the ability to schedule does still exist, Cognos Analytics has now vastly simplified this process through the use of its new feature called Subscriptions. Subscriptions are the new instrument available when viewing a report which allows the user to more quickly schedule a personal copy (or report view) of the report.
*See section on Report Views
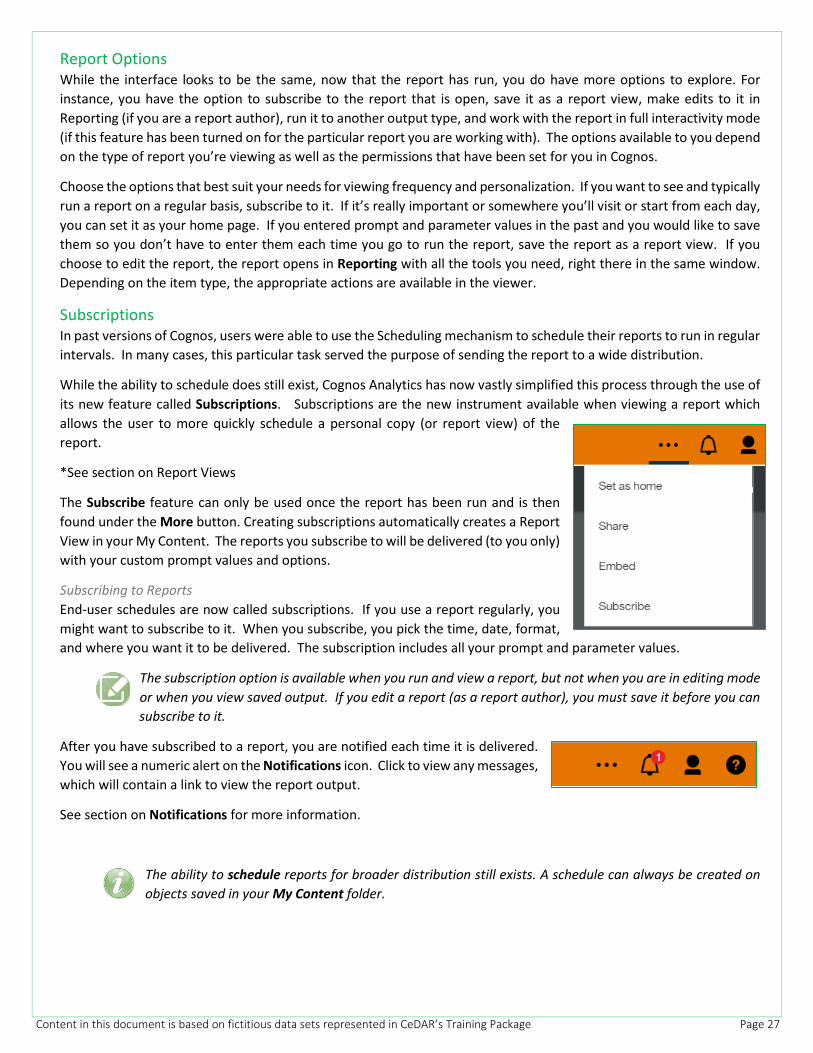
The Subscribe feature can only be used once the report has been run and is then found under the More button. Creating subscriptions automatically creates a Report View in your My Content. The reports you subscribe to will be delivered (to you only) with your custom prompt values and options.
Subscribing to Reports End-user schedules are now called subscriptions. If you use a report regularly, you might want to subscribe to it. When you subscribe, you pick the time, date, format, and where you want it to be delivered. The subscription includes all your prompt and parameter values.
The subscription option is available when you run and view a report, but not when you are in editing mode or when you view saved output. If you edit a report (as a report author), you must save it before you can
subscribe to it.
After you have subscribed to a report, you are notified each time it is delivered. You will see a numeric alert on the Notifications icon. Click to view any messages, which will contain a link to view the report output.
See section on Notifications for more information.
The ability to schedule reports for broader distribution still exists. A schedule can always be created on objects saved in your My Content folder.

Content in this document is based on fictitious data sets represented in CeDAR’s Training Package Page 28
Notifications Notifications help you stay on top of important data. If you subscribe to a report or a report view, you are notified each time your subscription is delivered. If you view saved output and you want to know when there’s a new version of the report, you can tap the Notify Me button.
The Notify Me button is available from the More button in the application toolbar only when you view a saved output version of a report. If you request to be notified when someone runs the report, you get a notification with a link to the updated version.
When you subscribe, if you choose the Save the report on the system delivery option, you receive a notification with a link to the new report version. To view a list of all your notifications, click the Notifications button on the application toolbar.
Schedules Whether you need to run your report on a daily basis or only every so often, the Scheduling Tool in Cognos Analytics makes it possible to schedule your reports to run automatically, as frequently as you need.
Your original report can only have one schedule associated with it, so it is a best practice to create a Report View (or multiple report views, as needed), which keeps the original report intact and allows you to create as many unique schedules for each report view as necessary. Each schedule can have a different frequency, distribution, and delivery option attached to it. *See section below on Report Views
To create a new schedule on a report or report view:
• Navigate to the Properties of the report. • Click the Schedule tab and click . • Enter appropriate criteria in the top half of the Schedule Creator.
Once you have chosen how often you would like your schedule to run, pay special attention the options that follow:
Format: Choose from a list of output types
Delivery: Choose to send report by email, print the report, or save the report.
Prompts: Set or clear prompt values
PDF: Choose the layout and password protect a PDF (if desired)
• Click Create
Content in this document is based on fictitious data sets represented in CeDAR’s Training Package Page 29
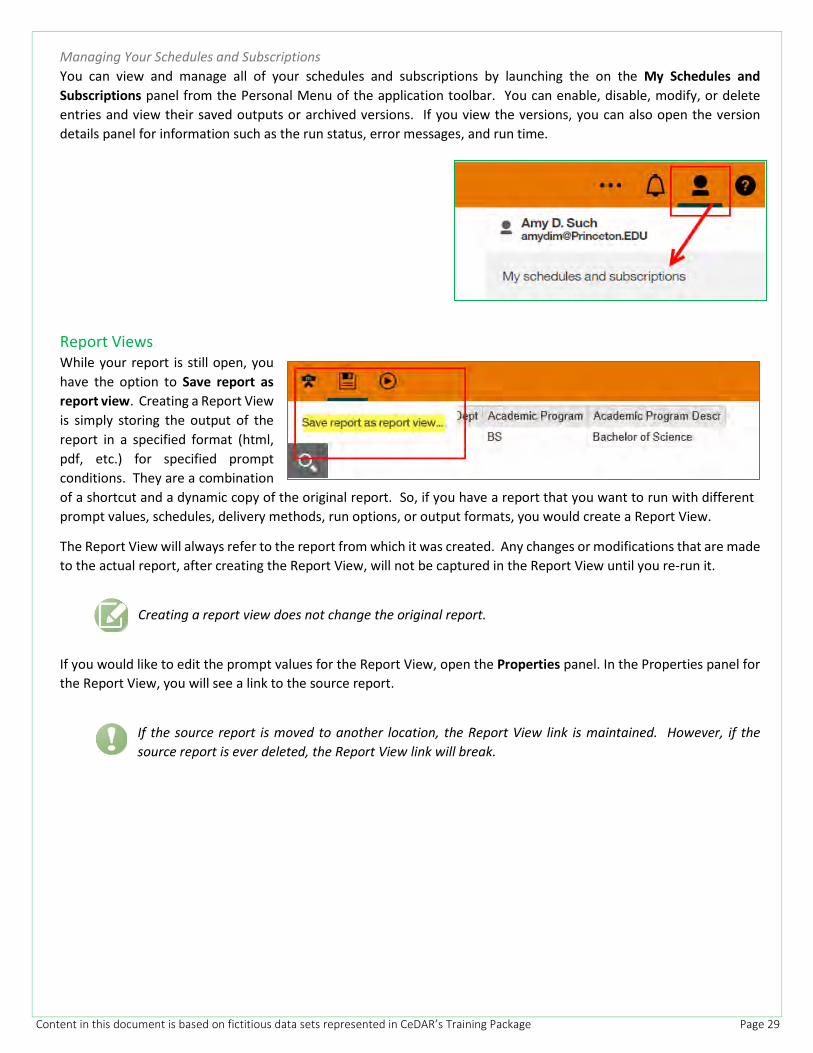
Managing Your Schedules and Subscriptions You can view and manage all of your schedules and subscriptions by launching the on the My Schedules and Subscriptions panel from the Personal Menu of the application toolbar. You can enable, disable, modify, or delete entries and view their saved outputs or archived versions. If you view the versions, you can also open the version details panel for information such as the run status, error messages, and run time.
Report Views While your report is still open, you have the option to Save report as report view. Creating a Report View is simply storing the output of the report in a specified format (html, pdf, etc.) for specified prompt conditions. They are a combination of a shortcut and a dynamic copy of the original report. So, if you have a report that you want to run with different prompt values, schedules, delivery methods, run options, or output formats, you would create a Report View.
The Report View will always refer to the report from which it was created. Any changes or modifications that are made to the actual report, after creating the Report View, will not be captured in the Report View until you re-run it.
Creating a report view does not change the original report.
If you would like to edit the prompt values for the Report View, open the Properties panel. In the Properties panel for the Report View, you will see a link to the source report.
If the source report is moved to another location, the Report View link is maintained. However, if the source report is ever deleted, the Report View link will break.
Content in this document is based on fictitious data sets represented in CeDAR’s Training Package Page 30
Editing Reports In previous versions of Cognos, in order to edit a report, you would have to launch Report Studio. In Cognos Analytics, after you have run your report, Report Authors will see an Edit icon. Clicking this opens Reporting and, barring your permission, allows you to make changes to your report in authoring mode.
See section on Reporting in Cognos Analytics for more information.
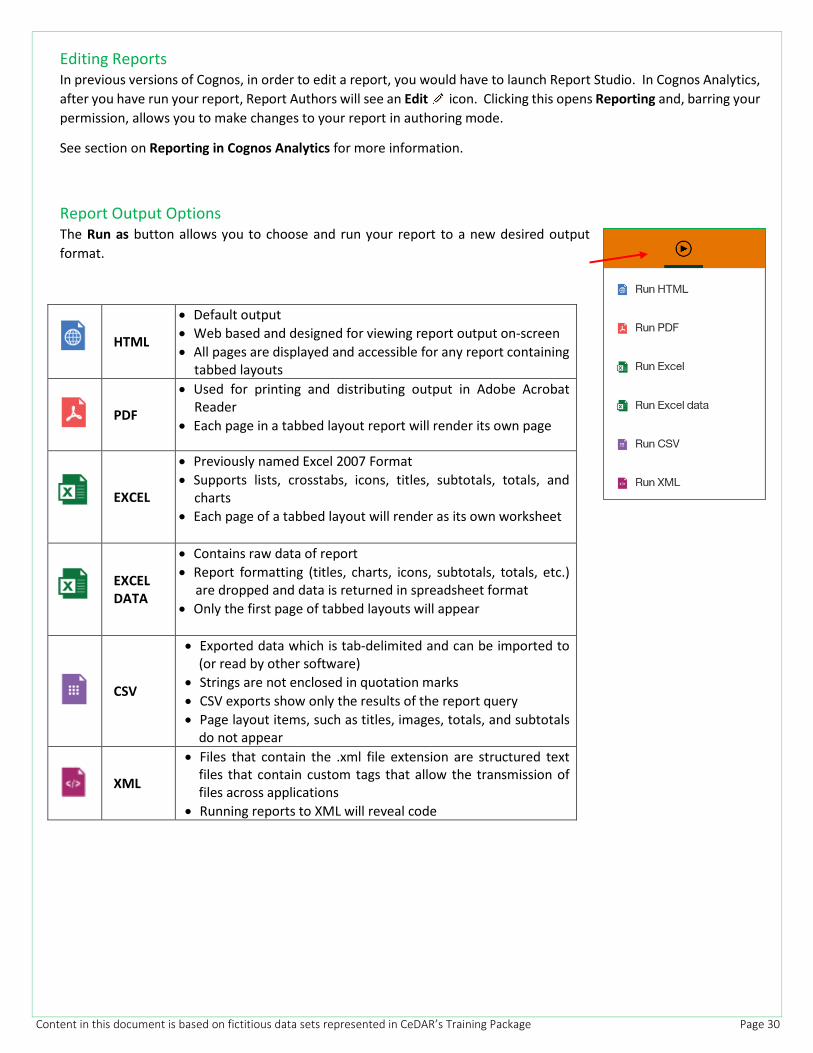
Report Output Options The Run as button allows you to choose and run your report to a new desired output format.
HTML
• Default output • Web based and designed for viewing report output on-screen • All pages are displayed and accessible for any report containing
tabbed layouts
• Used for printing and distributing output in Adobe Acrobat Reader
• Each page in a tabbed layout report will render its own page
EXCEL
• Previously named Excel 2007 Format • Supports lists, crosstabs, icons, titles, subtotals, totals, and
charts • Each page of a tabbed layout will render as its own worksheet
EXCEL DATA
• Contains raw data of report • Report formatting (titles, charts, icons, subtotals, totals, etc.) are dropped and data is returned in spreadsheet format • Only the first page of tabbed layouts will appear
CSV
• Exported data which is tab-delimited and can be imported to (or read by other software) • Strings are not enclosed in quotation marks • CSV exports show only the results of the report query • Page layout items, such as titles, images, totals, and subtotals do not appear
XML
• Files that contain the .xml file extension are structured text files that contain custom tags that allow the transmission of files across applications • Running reports to XML will reveal code
Content in this document is based on fictitious data sets represented in CeDAR’s Training Package Page 31
Interactivity Mode Interactive reports provide, as the name suggests, interactivity in the report output and will have context sensitive menus that will appear above the object. For example, in a report with Interactivity Mode turned on, you may be able to:
• Change the sort order • Set or edit filters • Change the aggregation • Group a column • Change the type of data container (i.e. to a chart) • Save the changes as a new report • Interact with charts
There are interactive and non-interactive reports. All upgraded reports (those that originated from previous versions of Cognos that have been moved into Cognos Analytics) were brought over with interactivity mode turned off. If necessary, however, these changes can be made at a report level (or at the package level), by your package custodian.
At the discretion of your Package Custodian, reports written in Cognos Analytics may or may not be created with Interactivity Mode turned on.
Report Versions If you run reports, you will see the latest data from the data source. However, when you view report versions and outputs, such as when a report you subscribe to is delivered, you’re viewing the data that was captured when you saved the version or view of the report.
Report outputs are generated by subscriptions, schedules, multiple formats, bursting, and delivery methods that include save, print, and email. In many instances, you are notified and receive a link to view report output, but you can also view saved and archived versions for reports in your content lists.
To view report versions and archived versions:
For a report in a content list, click the More button and then select report versions.
To save a report version:
In the application bar, when you view a report, click the Save button. You may also have the Save as option of saving the report version under a different name or in a different location.
To delete saved outputs for report versions:
For a report in a content list, click the More button. Select View versions and click on an entry in the list. Then select delete.
Deleting removes all saved output formats of the version.
Content in this document is based on fictitious data sets represented in CeDAR’s Training Package. Page 32
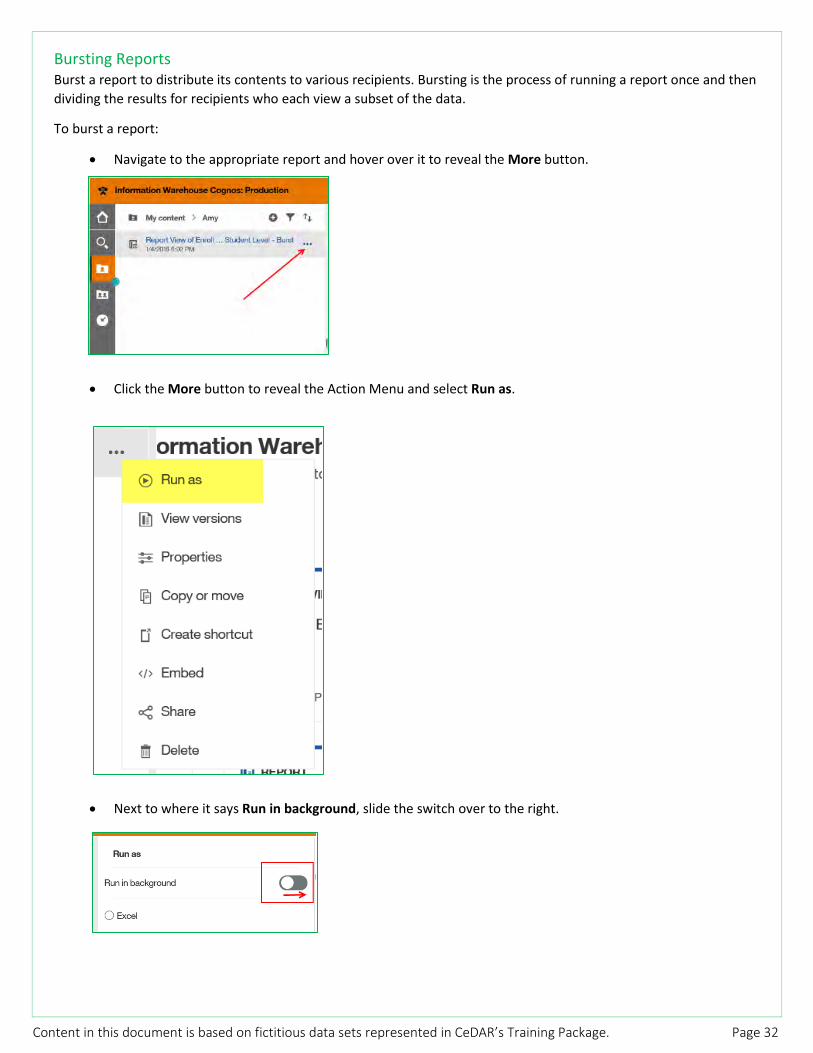
Bursting Reports Burst a report to distribute its contents to various recipients. Bursting is the process of running a report once and then dividing the results for recipients who each view a subset of the data.
To burst a report:
• Navigate to the appropriate report and hover over it to reveal the More button.
• Click the More button to reveal the Action Menu and select Run as.
• Next to where it says Run in background, slide the switch over to the right.

Content in this document is based on fictitious data sets represented in CeDAR’s Training Package. Page 33
• Place a checkmark in the box next to PDF (or any other output you desire) • Scroll to the bottom to find the Advanced section that is now revealed and expand it.
Choosing Later here will allow you to set a time/date for the report to be bursted. *Current Best Practice!
• Place a checkmark in the box next to Burst the report. • Expand the Delivery section to reveal Delivery options.
• Place a checkmark in the box next to Send report by email. • Place a checkmark in the box next to Attach the report. • Edit the Recipients and the Subject. • Scroll down and click Done. • After returning to the Run as screen, click Run. • Enter Prompts as appropriate.

Content in this document is based on fictitious data sets represented in CeDAR’s Training Package. Page 34
Reporting in Cognos Analytics
Content in this document is based on fictitious data sets represented in CeDAR’s Training Package. Page 35
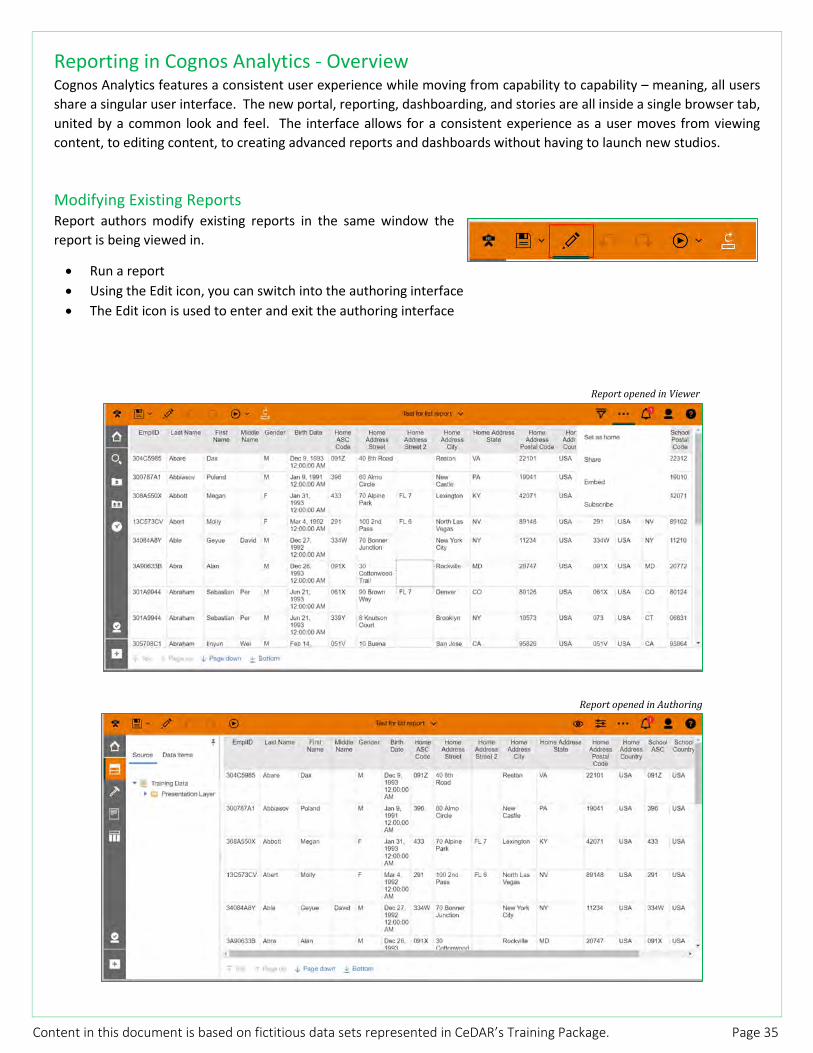
Reporting in Cognos Analytics - Overview Cognos Analytics features a consistent user experience while moving from capability to capability – meaning, all users share a singular user interface. The new portal, reporting, dashboarding, and stories are all inside a single browser tab, united by a common look and feel. The interface allows for a consistent experience as a user moves from viewing content, to editing content, to creating advanced reports and dashboards without having to launch new studios.
Modifying Existing Reports Report authors modify existing reports in the same window the report is being viewed in.
• Run a report • Using the Edit icon, you can switch into the authoring interface • The Edit icon is used to enter and exit the authoring interface
Report opened in Viewer
Report opened in Authoring

Content in this document is based on fictitious data sets represented in CeDAR’s Training Package. Page 36
Report Function Mapping Here are a list of features and functions that will appear in the Reporting interface:

Content in this document is based on fictitious data sets represented in CeDAR’s Training Package. Page 37

Content in this document is based on fictitious data sets represented in CeDAR’s Training Package. Page 38
Creating a Report In Cognos Analytics you create a report right from the same browser.
• From the Left Navigation menu, click the New button. • From the pop-up menu, select Report.
Templates and Themes Cognos Analytics includes numerous basic report templates and color themes that can be chosen. Within the list of templates, you will find several Princeton standards. While you are encouraged to choose a Princeton template, you can also choose from a blank list or crosstab or create your own.

Content in this document is based on fictitious data sets represented in CeDAR’s Training Package. Page 39
Choosing a Package A Package in Cognos Analytics refers to the connection to the database for any given data set. It contains a business view of the data that is used to create reports.
• Packages are denoted by an icon resembling a file drawer • No reports are ever saved to a “file drawer” or package
To choose a package, click the Add Report Data button.
A dialog box will open listing any package(s) in which you have access.
After you choose a package, your source data will load on the Left Navigation allowing you to choose from query items to query your data.
Content in this document is based on fictitious data sets represented in CeDAR’s Training Package. Page 40
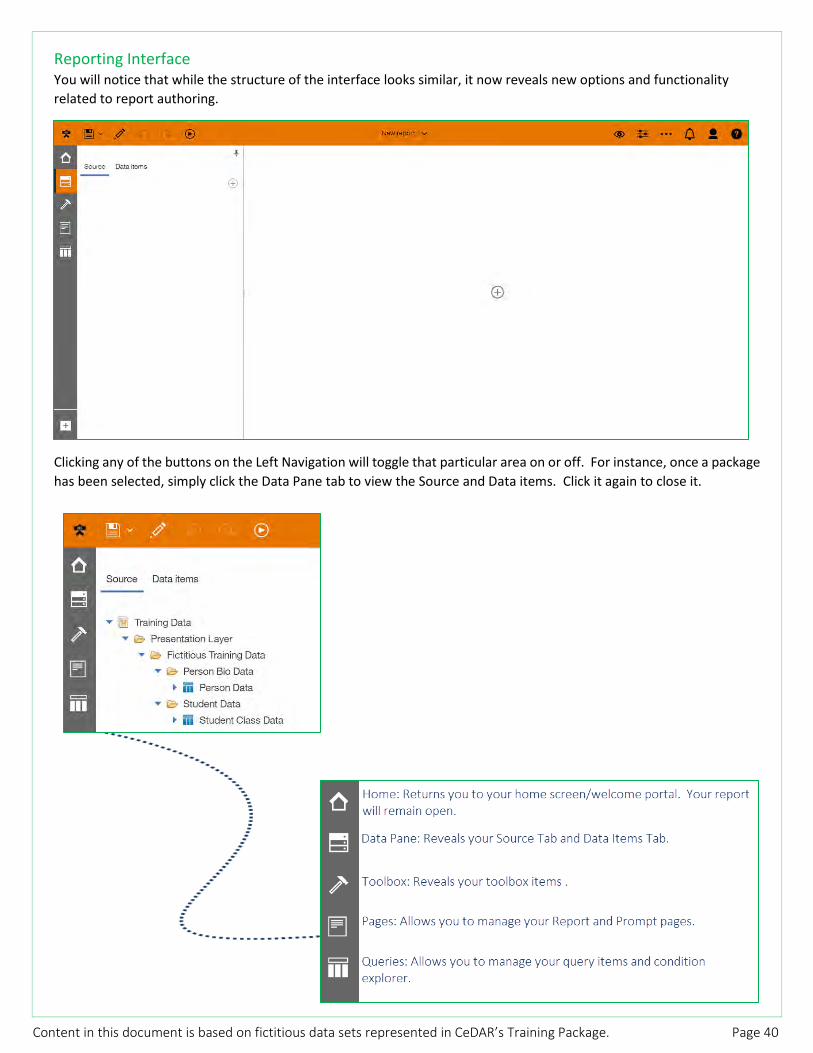
Reporting Interface You will notice that while the structure of the interface looks similar, it now reveals new options and functionality related to report authoring.
Clicking any of the buttons on the Left Navigation will toggle that particular area on or off. For instance, once a package has been selected, simply click the Data Pane tab to view the Source and Data items. Click it again to close it.

Content in this document is based on fictitious data sets represented in CeDAR’s Training Package. Page 41
Data Pane After your Package opens, it is visible on the data pane. Use the Data Pane to add data, modify, or view the data source.
Select the Source tab to view the entire metadata tree.
Select the Data Items Tab to view the queries and data items used in the report. You can add existing query items to a report from this tab.

Content in this document is based on fictitious data sets represented in CeDAR’s Training Package. Page 42
The Toolbox The toolbox contains all available report objects to add to a report, such as graphics, text, and query calculations.
Toolbox items are now organized into different groups.
You can quickly search for an item in the toolbox.
Items that you use most often can be added to the Pinned group. Items in the Pinned group appear around the Add Objects menu when you create a new report.
To remove or re-order pinned items, right-click the item.
To add an item to the Pinned group, right-click the item and click Add to Pinned Toolbox Items.
To expand or collapse the view of the toolbox when items are displayed as a tree, click the buttons on the top, right.
To change the view of the toolbox so they appear as icons, click the grid in the top-right corner.

Content in this document is based on fictitious data sets represented in CeDAR’s Training Package. Page 43
Pages Pane Use the Pages Pane to view or create new report pages and prompt pages, as well as to create and modify classes.
Available objects depend upon what is in focus.
• Click the button to add a new page. • When Prompt Pages are selected, the button is used to insert a new prompt page.
Queries and Conditions Use the Query Explorer to create or modify queries and to perform complex tasks, such as defining union joins and writing SQL statements.
Right-Click the Query to View Tabular Data
Available objects depend upon what is in focus.
Click the to add a new query.
The Queries Pane/Query Explorer contains a Conditional Explorer, which is used to work with variables to define conditions in a report.

Content in this document is based on fictitious data sets represented in CeDAR’s Training Package. Page 44
Report Specification The report specification defines the queries and prompts that are used to retrieve data and the layouts and styles used to present the data.
Right-clicking the Report option from the Pages Pane or Query Explorer will help you find the report specification.
From here you can also:
• Copy report to clipboard (to save reports locally)
• Open report from clipboard (pending permission)
• Show generated SQL/MDX
View Tabular Data To ensure that the results you expect to see are showing up, you can view only the tabular data of a query.
• Navigate to the Query Explorer
• Right-click the query
• Select View tabular data
Content in this document is based on fictitious data sets represented in CeDAR’s Training Package. Page 45
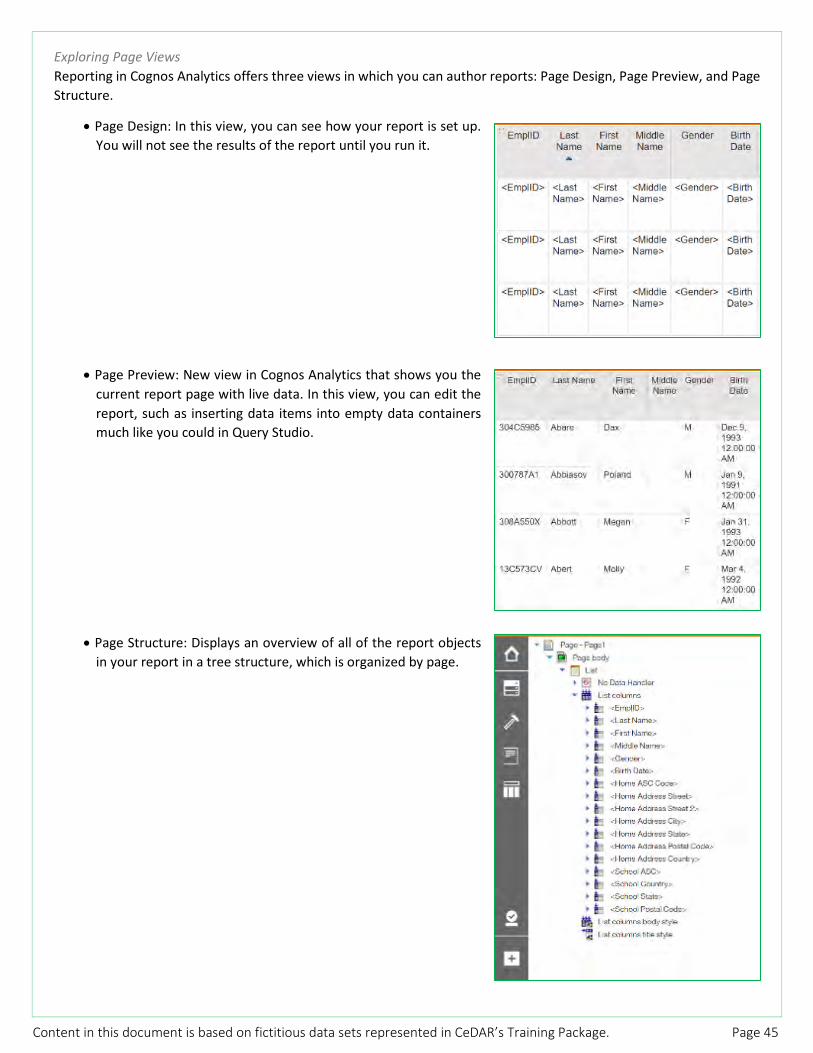
Exploring Page Views Reporting in Cognos Analytics offers three views in which you can author reports: Page Design, Page Preview, and Page Structure.
• Page Design: In this view, you can see how your report is set up. You will not see the results of the report until you run it.
• Page Preview: New view in Cognos Analytics that shows you the current report page with live data. In this view, you can edit the report, such as inserting data items into empty data containers much like you could in Query Studio.
• Page Structure: Displays an overview of all of the report objects in your report in a tree structure, which is organized by page.

Content in this document is based on fictitious data sets represented in CeDAR’s Training Package. Page 46
Using a tree structure is useful for locating the objects on a page and troubleshooting problems with nested objects.
To switch between views, click the Page Views button on the application toolbar.
To change the default view, click the More button and select Options.
• Change the view under Start Page View.
Content in this document is based on fictitious data sets represented in CeDAR’s Training Package. Page 47
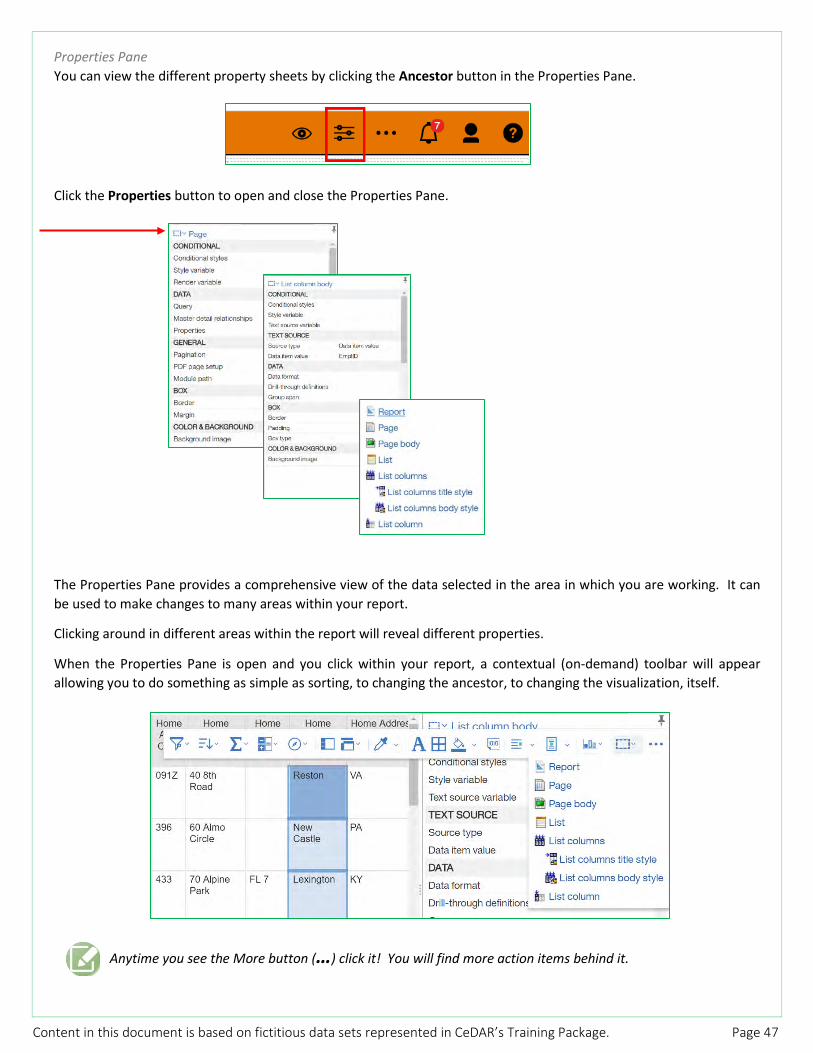
Properties Pane You can view the different property sheets by clicking the Ancestor button in the Properties Pane.
Click the Properties button to open and close the Properties Pane.
The Properties Pane provides a comprehensive view of the data selected in the area in which you are working. It can be used to make changes to many areas within your report.
Clicking around in different areas within the report will reveal different properties.
When the Properties Pane is open and you click within your report, a contextual (on-demand) toolbar will appear allowing you to do something as simple as sorting, to changing the ancestor, to changing the visualization, itself.
Anytime you see the More button (…) click it! You will find more action items behind it.

Content in this document is based on fictitious data sets represented in CeDAR’s Training Package. Page 48
Interactivity Mode can be turned on or off using the Properties Pane within the report.
Use the Ancestor button to navigate to the Report page.
More Options The More button on the top menu of the Reporting interface reveals additional options to assist you with manipulating your reports to achieve the expected outcome.
Locked/Unlocked: To manipulate the content of some objects, you may need to unlock the object.
Options: Adjust default for page views and on-demand toolbars as well as other advanced settings.
Layout Components: Allows you to create reusable layout objects within reports and share those objects in other reports.
Conditional Styles: Add conditional styles to your report to better identify exceptional or unexpected results. A conditional style is a format, such as cell shading or font color that is applied to objects if a specified condition is true.
Clear all Parameters: Click to clear stored parameter values.
When adding Measure fields to list reports, Report Studio was good about adding facts together for you. In Cognos Analytics, there is an automatic group and summary applied along with totals. You may or may not find this helpful.
• To turn this functionality off you need to be in Edit mode. • Click More > Options • Click on the Report Tab • Uncheck the box next to Automatic group and summary behavior for lists
Content in this document is based on fictitious data sets represented in CeDAR’s Training Package. Page 49
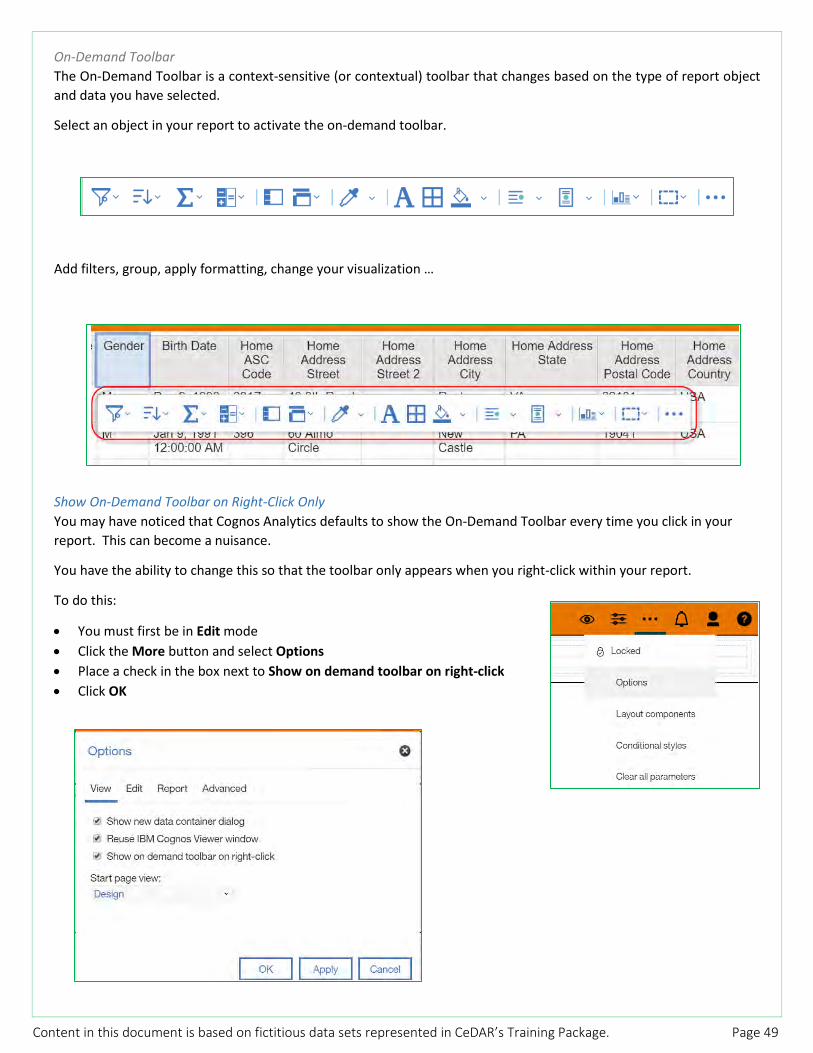
On-Demand Toolbar The On-Demand Toolbar is a context-sensitive (or contextual) toolbar that changes based on the type of report object and data you have selected.
Select an object in your report to activate the on-demand toolbar.
Add filters, group, apply formatting, change your visualization …
Show On-Demand Toolbar on Right-Click Only You may have noticed that Cognos Analytics defaults to show the On-Demand Toolbar every time you click in your report. This can become a nuisance.
You have the ability to change this so that the toolbar only appears when you right-click within your report.
To do this:
• You must first be in Edit mode • Click the More button and select Options • Place a check in the box next to Show on demand toolbar on right-click • Click OK
Content in this document is based on fictitious data sets represented in CeDAR’s Training Package. Page 50
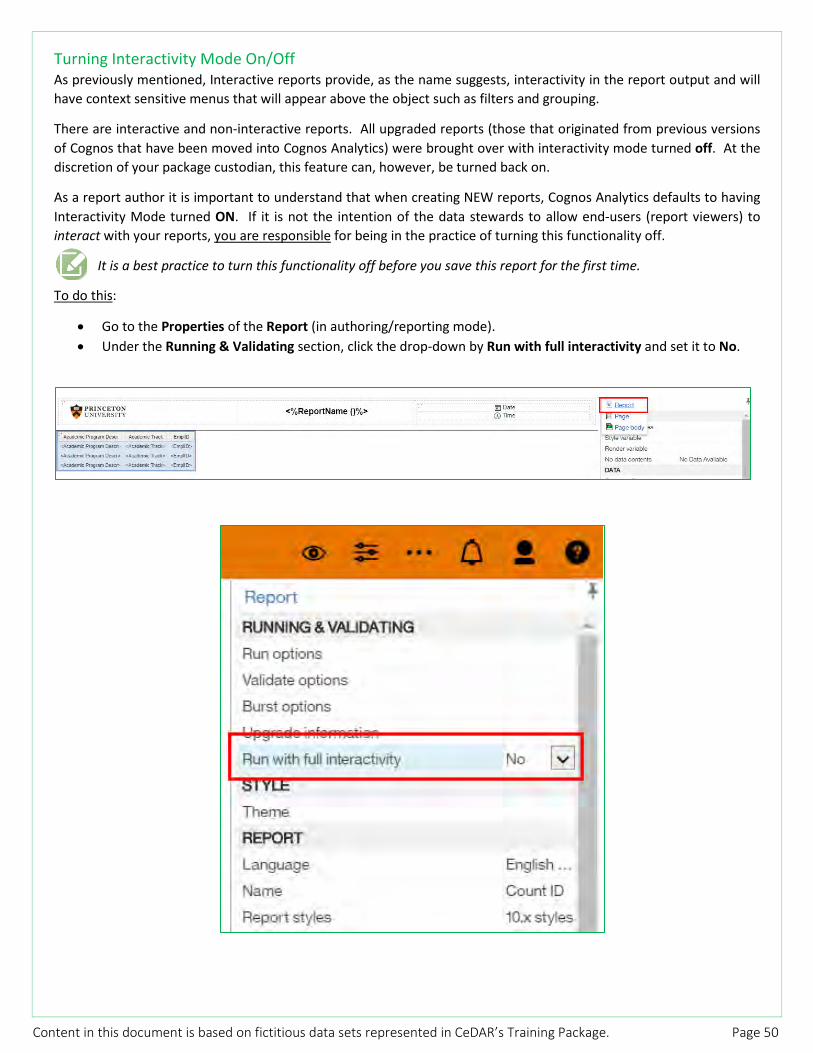
Turning Interactivity Mode On/Off As previously mentioned, Interactive reports provide, as the name suggests, interactivity in the report output and will have context sensitive menus that will appear above the object such as filters and grouping.
There are interactive and non-interactive reports. All upgraded reports (those that originated from previous versions of Cognos that have been moved into Cognos Analytics) were brought over with interactivity mode turned off. At the discretion of your package custodian, this feature can, however, be turned back on.
As a report author it is important to understand that when creating NEW reports, Cognos Analytics defaults to having Interactivity Mode turned ON. If it is not the intention of the data stewards to allow end-users (report viewers) to interact with your reports, you are responsible for being in the practice of turning this functionality off.
It is a best practice to turn this functionality off before you save this report for the first time.
To do this:
• Go to the Properties of the Report (in authoring/reporting mode). • Under the Running & Validating section, click the drop-down by Run with full interactivity and set it to No.
Content in this document is based on fictitious data sets represented in CeDAR’s Training Package. Page 51
Creating and Modifying Reports In this section, we will create a new report, explore the data model, and make modifications.
Creating a New Report in Cognos Analytics
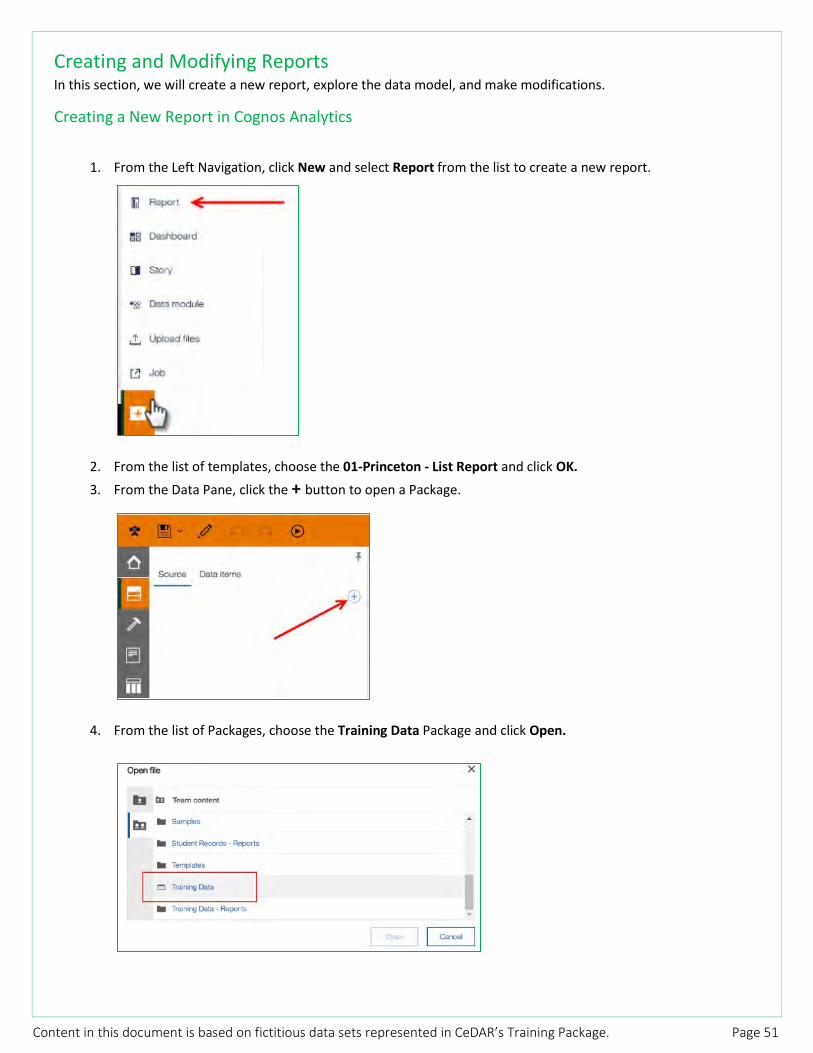
1. From the Left Navigation, click New and select Report from the list to create a new report.
2. From the list of templates, choose the 01-Princeton - List Report and click OK. 3. From the Data Pane, click the + button to open a Package.
4. From the list of Packages, choose the Training Data Package and click Open.

Content in this document is based on fictitious data sets represented in CeDAR’s Training Package. Page 52
5. Expand the data model to expose query subjects (or tables) and query items (or fields) with each of them.
6. Open the Person Data table by clicking the little blue carrot or double-clicking the name. 7. Bring the following fields into your report:
• EmplID • Last Name • First Name
To add fields to the report, double-click individual Query Items or ctrl+click to do a multi-select and drag the entire selection to the table to the right until you see a blinking, black insertion point as shown below:
8. Add the following additional items to the report: • Home Address Street • Home Address City • Home Address State • Home Address Postal Code • School ASC

Content in this document is based on fictitious data sets represented in CeDAR’s Training Package. Page 53
Validating a Report Validate your report to ensure it contains no errors.
To validate your report:
1. From the Left Navigation, click the Pages icon. 2. Right-click the word Report. 3. Choose Validate report.
You will get a visual indication that the report is valid.
4. Click OK.
Content in this document is based on fictitious data sets represented in CeDAR’s Training Package. Page 54
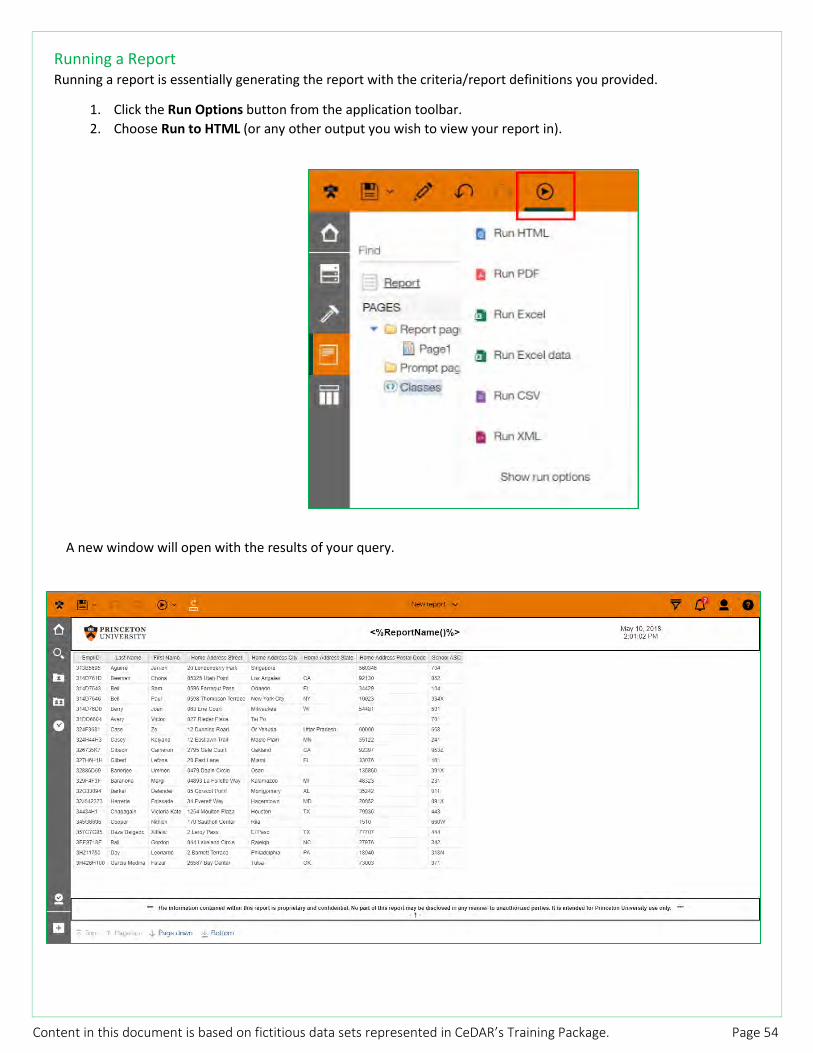
Running a Report Running a report is essentially generating the report with the criteria/report definitions you provided.
1. Click the Run Options button from the application toolbar. 2. Choose Run to HTML (or any other output you wish to view your report in).
A new window will open with the results of your query.

Content in this document is based on fictitious data sets represented in CeDAR’s Training Package. Page 55
Saving Report Output You’re viewing the results in the Report Results window. From here, you have the option to save report output.
1. From the application toolbar, click the Save as button.
The Save as dialog box will open prompting you to choose from the Team Content folder or the My Content folder.
2. Select the My Content folder. 3. In the Save as: field, name the report Personal Bio
Info Report OUTPUT.
The report output is now saved in your My Content folder.
4. Close the Results Window.
Saving a Report To save the current report, make sure the Report Results window is closed and that the actual report is the one active.
1. From the application toolbar, click the Save as button.
The Save as dialog box will open prompting you to choose from the Team Content folder or the My Content folder.
2. Select the My Content folder. 3. In the Save as: field, name the report Personal Bio
Info Report.
The report is now saved with the new file name under your My Content folder.
If you have already saved a report and continued to modify it, clicking directly on the Save button will overwrite what you have already saved. Clicking the drop-down arrow beside the Save button will reveal a list of other options in the event you wish to save the report with another file name.
Content in this document is based on fictitious data sets represented in CeDAR’s Training Package. Page 56
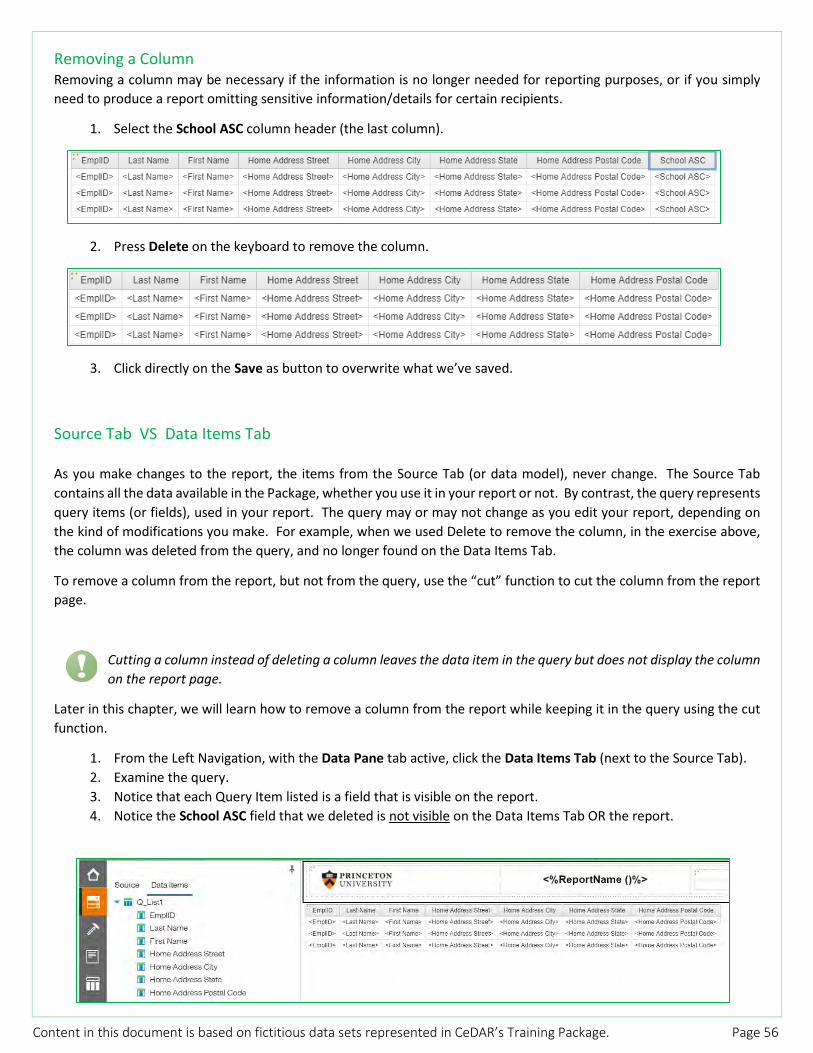
Removing a Column Removing a column may be necessary if the information is no longer needed for reporting purposes, or if you simply need to produce a report omitting sensitive information/details for certain recipients.
1. Select the School ASC column header (the last column).
2. Press Delete on the keyboard to remove the column.
3. Click directly on the Save as button to overwrite what we’ve saved.
Source Tab VS Data Items Tab As you make changes to the report, the items from the Source Tab (or data model), never change. The Source Tab contains all the data available in the Package, whether you use it in your report or not. By contrast, the query represents query items (or fields), used in your report. The query may or may not change as you edit your report, depending on the kind of modifications you make. For example, when we used Delete to remove the column, in the exercise above, the column was deleted from the query, and no longer found on the Data Items Tab.
To remove a column from the report, but not from the query, use the “cut” function to cut the column from the report page.
Cutting a column instead of deleting a column leaves the data item in the query but does not display the column on the report page.
Later in this chapter, we will learn how to remove a column from the report while keeping it in the query using the cut function.
1. From the Left Navigation, with the Data Pane tab active, click the Data Items Tab (next to the Source Tab). 2. Examine the query. 3. Notice that each Query Item listed is a field that is visible on the report. 4. Notice the School ASC field that we deleted is not visible on the Data Items Tab OR the report.

Content in this document is based on fictitious data sets represented in CeDAR’s Training Package. Page 57
5. Click back onto the Source Tab. 6. Scroll through the Query Items listed in the Person Data Query
Subject. Notice items that do not appear in the report are still in the data model, including the column we deleted from the report.
Sorting You can sort items to view them in a preferred order. By default, Cognos Analytics retrieves items in the order defined in the data source.
In this exercise, we will sort the report data, add a multiple sort, and remove a sort.
1. Click the column heading of the Last Name field. 2. From the contextual toolbar that appears, click the Sort icon.
3. From the drop-down menu, click Ascending.

Content in this document is based on fictitious data sets represented in CeDAR’s Training Package. Page 58
4. Notice the sorting indicator now revealed on the column header.
When the point of the triangle/caret points up, the column is being sorted in ascending order, from A to Z, or from smallest to largest for numeric data. When the point is down, the column is being sorted in descending order, from
Z to A, or from largest to smallest.
5. Click Run to run the report and analyze. 6. Close the Report Results window. 7. Save the report.
Multiple Sorts within a Report More than one column can be sorted within the same report. Additionally, one column can be sorted in reverse order of the other column(s) if desired.
Currently, the primary sort is an ascending sort on Last Name.
We will now change First Name to sort in descending order within Last Name.
1. Highlight the First Name column heading. 2. From the drop-down arrow beside the Sort icon on the contextual toolbar, select Edit Layout Sorting.
3. Drag the First Name field from the Data Items window and place it under Last Name in the Detailed Sort List in the Groups pane on the right.
Content in this document is based on fictitious data sets represented in CeDAR’s Training Package. Page 59
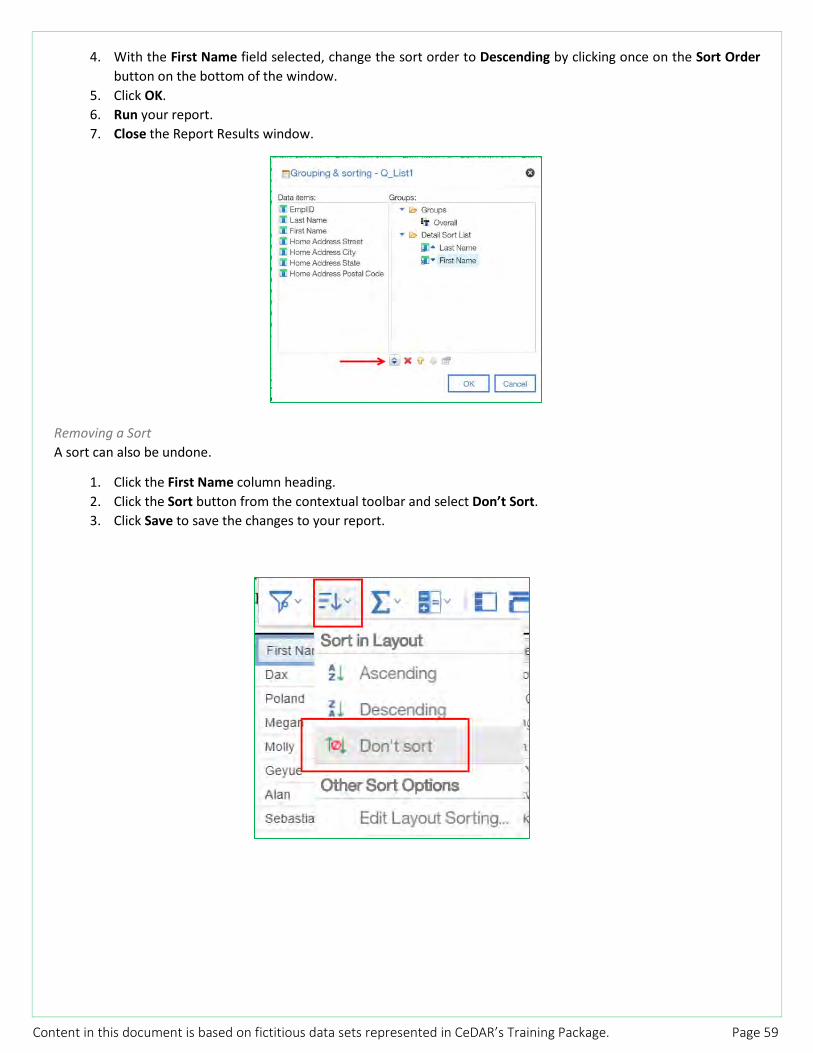
4. With the First Name field selected, change the sort order to Descending by clicking once on the Sort Order button on the bottom of the window.
5. Click OK. 6. Run your report. 7. Close the Report Results window.
Removing a Sort A sort can also be undone.
1. Click the First Name column heading. 2. Click the Sort button from the contextual toolbar and select Don’t Sort. 3. Click Save to save the changes to your report.
Content in this document is based on fictitious data sets represented in CeDAR’s Training Package. Page 60
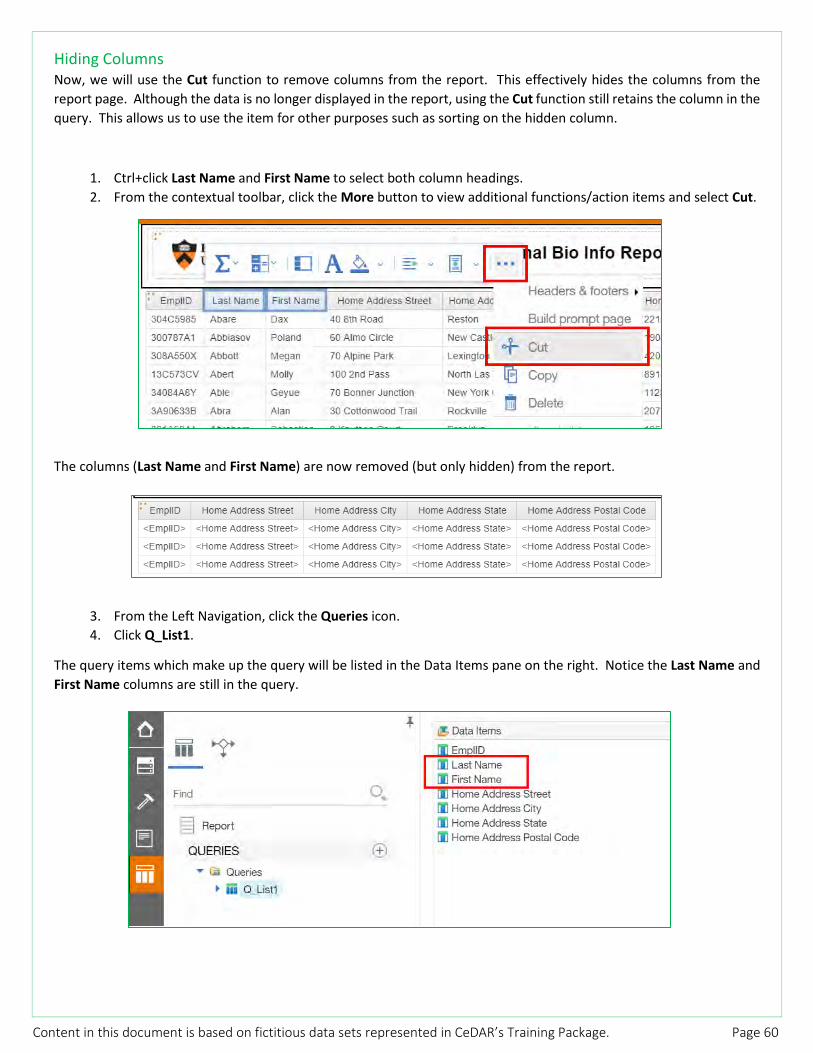
Hiding Columns Now, we will use the Cut function to remove columns from the report. This effectively hides the columns from the report page. Although the data is no longer displayed in the report, using the Cut function still retains the column in the query. This allows us to use the item for other purposes such as sorting on the hidden column.
1. Ctrl+click Last Name and First Name to select both column headings. 2. From the contextual toolbar, click the More button to view additional functions/action items and select Cut.
The columns (Last Name and First Name) are now removed (but only hidden) from the report.
3. From the Left Navigation, click the Queries icon. 4. Click Q_List1.
The query items which make up the query will be listed in the Data Items pane on the right. Notice the Last Name and First Name columns are still in the query.

Content in this document is based on fictitious data sets represented in CeDAR’s Training Package. Page 61
5. Run the report.
The report is still sorted by Last Name even though the column has been hidden.
6. Close the Report Results window.
Deleting a column (via keyboard or icon) removes the column from the report page and the data item from the query.
Cutting a column by clicking the Cut icon removes the column from the report, but leaves the data item in the query. Use Cut for those times when you need to leave an item in the query, but do not wish to show it on the report page.
Content in this document is based on fictitious data sets represented in CeDAR’s Training Package. Page 62
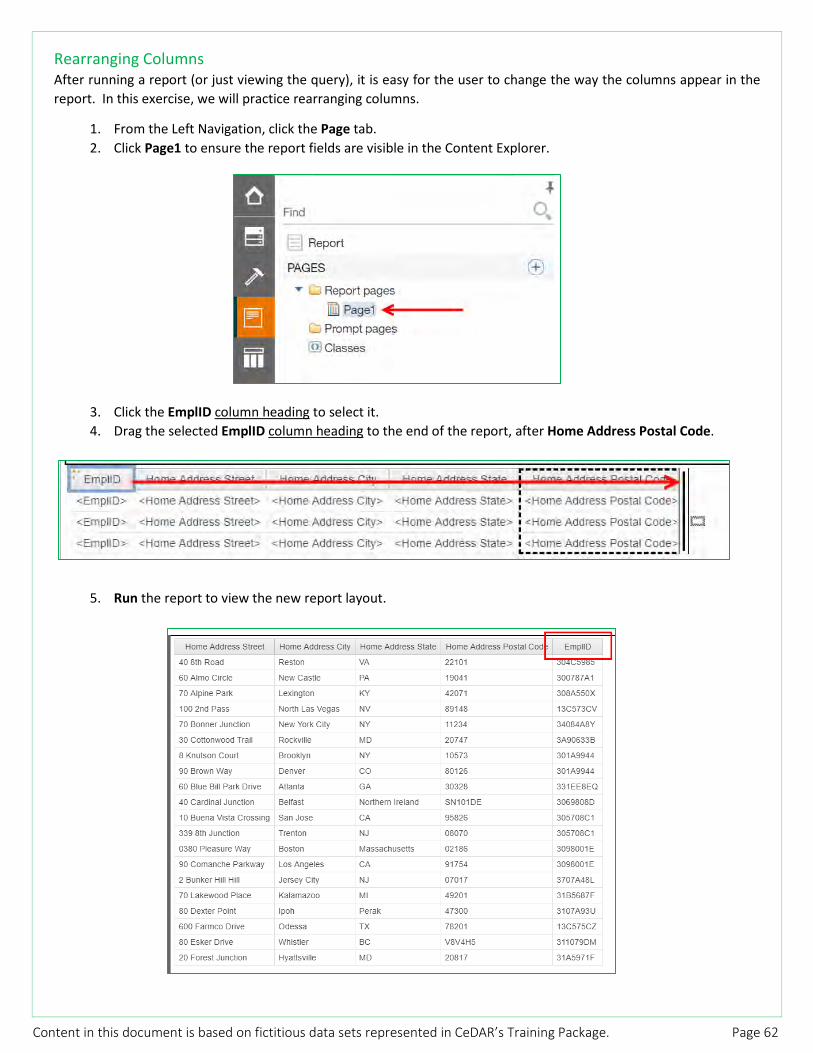
Rearranging Columns After running a report (or just viewing the query), it is easy for the user to change the way the columns appear in the report. In this exercise, we will practice rearranging columns.
1. From the Left Navigation, click the Page tab. 2. Click Page1 to ensure the report fields are visible in the Content Explorer.
3. Click the EmplID column heading to select it. 4. Drag the selected EmplID column heading to the end of the report, after Home Address Postal Code.
5. Run the report to view the new report layout.

Content in this document is based on fictitious data sets represented in CeDAR’s Training Package. Page 63
6. Close the Report Results window. 7. Save the report.
Adding a Column Increasing the information in a report is easily accomplished by adding new columns to the report. There are several ways to add columns to a report.
• Double-clicking on the item • Right-clicking on the item and choosing Insert • Clicking and dragging the item to the report
1. From the Left Navigation, click the Data icon.
Select the field to the right of where you would like the field to appear:
2. Select the Home Street Address column heading. 3. Right-click the Gender field and click Insert.
The Gender field will be inserted as the first column in the report.
The new column will be placed before the selected column. If no column is selected, the new column will be placed at the end of the report.
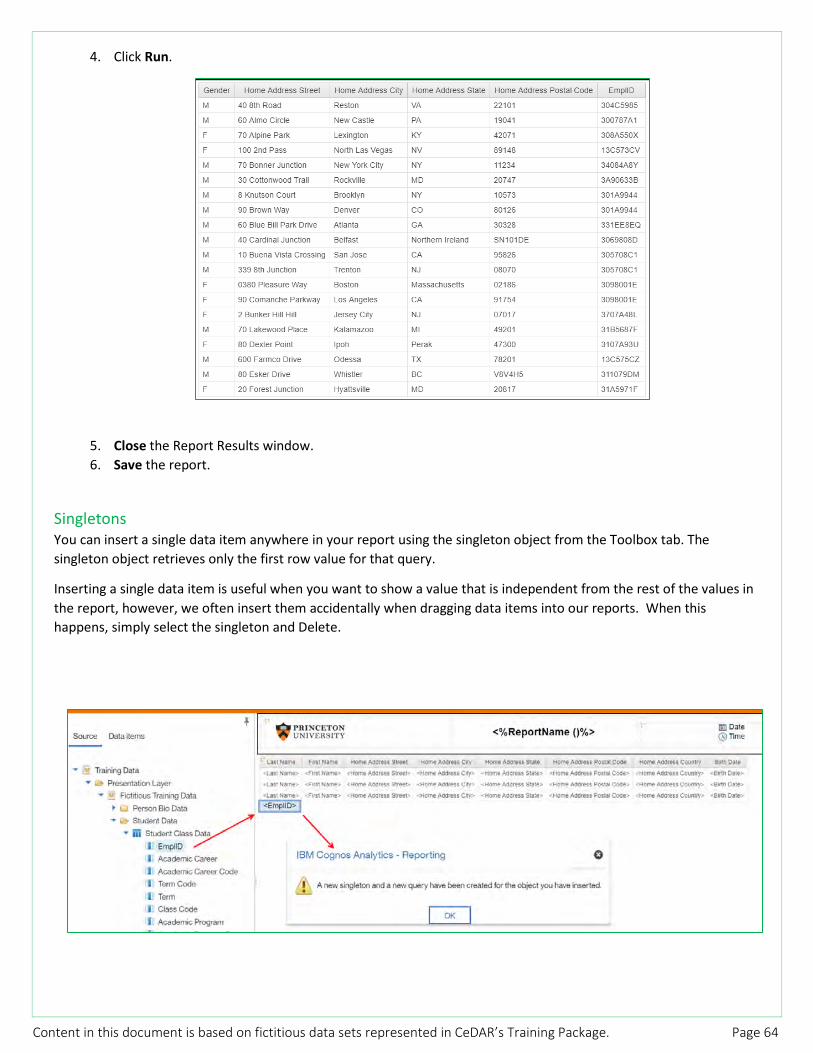
Content in this document is based on fictitious data sets represented in CeDAR’s Training Package. Page 64
4. Click Run.
5. Close the Report Results window. 6. Save the report.
Singletons You can insert a single data item anywhere in your report using the singleton object from the Toolbox tab. The singleton object retrieves only the first row value for that query.
Inserting a single data item is useful when you want to show a value that is independent from the rest of the values in the report, however, we often insert them accidentally when dragging data items into our reports. When this happens, simply select the singleton and Delete.

Content in this document is based on fictitious data sets represented in CeDAR’s Training Package. Page 65
1. Navigate to Team Content > Training Data - Reports > Cognos Analytics Class Reports > Exercise 1: Personal
Data Report to Edit. 2. Delete the Middle Name Column. 3. Add the Birthdate field and make it appear as the second column of the report. 4. Add the two hidden fields (Last Name and First Name) back into the report from the Data Items Tab. 5. Remove the Sort on Last Name. 6. Instead, sort Ascending on Birthdate. 7. Hide the Birthdate column. 8. Save the Report as “Personal Data Report - Exercise”. 9. Run the Report.
10. Close the Report.
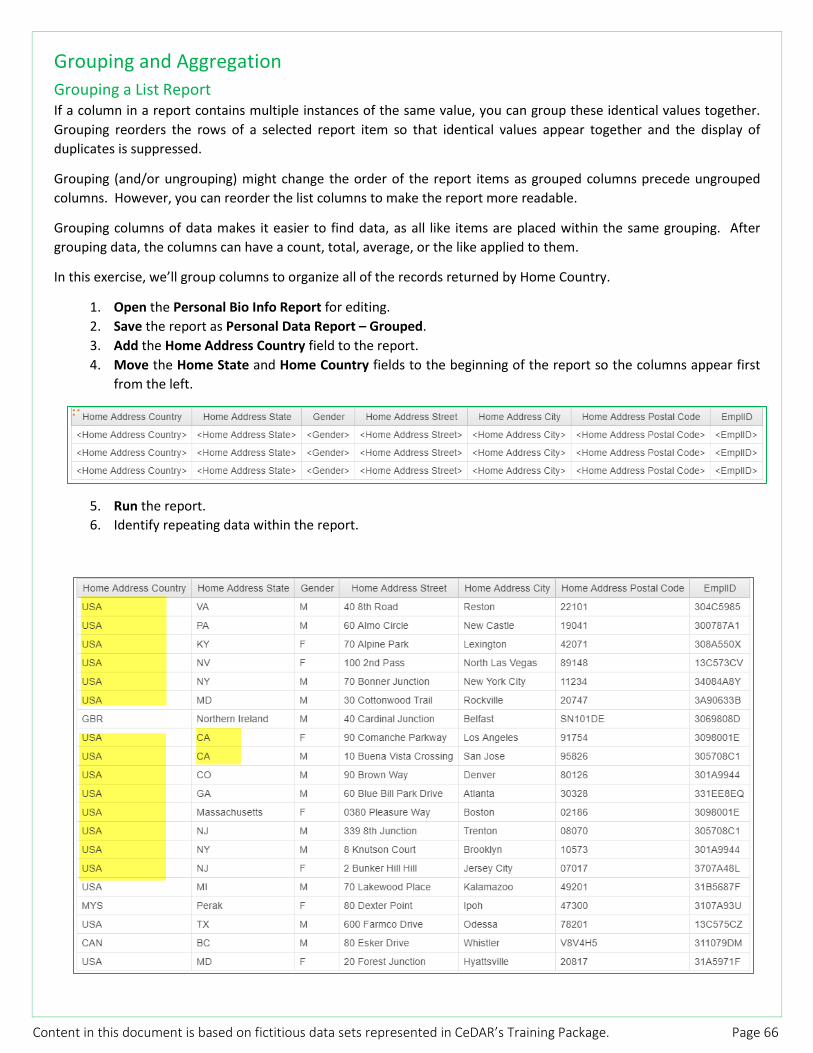
Content in this document is based on fictitious data sets represented in CeDAR’s Training Package. Page 66
Grouping and Aggregation Grouping a List Report If a column in a report contains multiple instances of the same value, you can group these identical values together. Grouping reorders the rows of a selected report item so that identical values appear together and the display of duplicates is suppressed.
Grouping (and/or ungrouping) might change the order of the report items as grouped columns precede ungrouped columns. However, you can reorder the list columns to make the report more readable.
Grouping columns of data makes it easier to find data, as all like items are placed within the same grouping. After grouping data, the columns can have a count, total, average, or the like applied to them.
In this exercise, we’ll group columns to organize all of the records returned by Home Country.
1. Open the Personal Bio Info Report for editing. 2. Save the report as Personal Data Report – Grouped. 3. Add the Home Address Country field to the report. 4. Move the Home State and Home Country fields to the beginning of the report so the columns appear first
from the left.
5. Run the report. 6. Identify repeating data within the report.

Content in this document is based on fictitious data sets represented in CeDAR’s Training Package. Page 67
7. Close the Report Results window. 8. Click once on the Home Address Country column. 9. From the contextual toolbar, click the Group/Ungroup Icon.
A visual indication/icon will appear in the List Column Body.
10. Run the report.
The first column has been grouped.
11. From the bottom of the window, click the button that says Bottom to jump to the end of the report.
Notice how content has been grouped by Country.
12. Close the Report Results window. 13. Click Save.
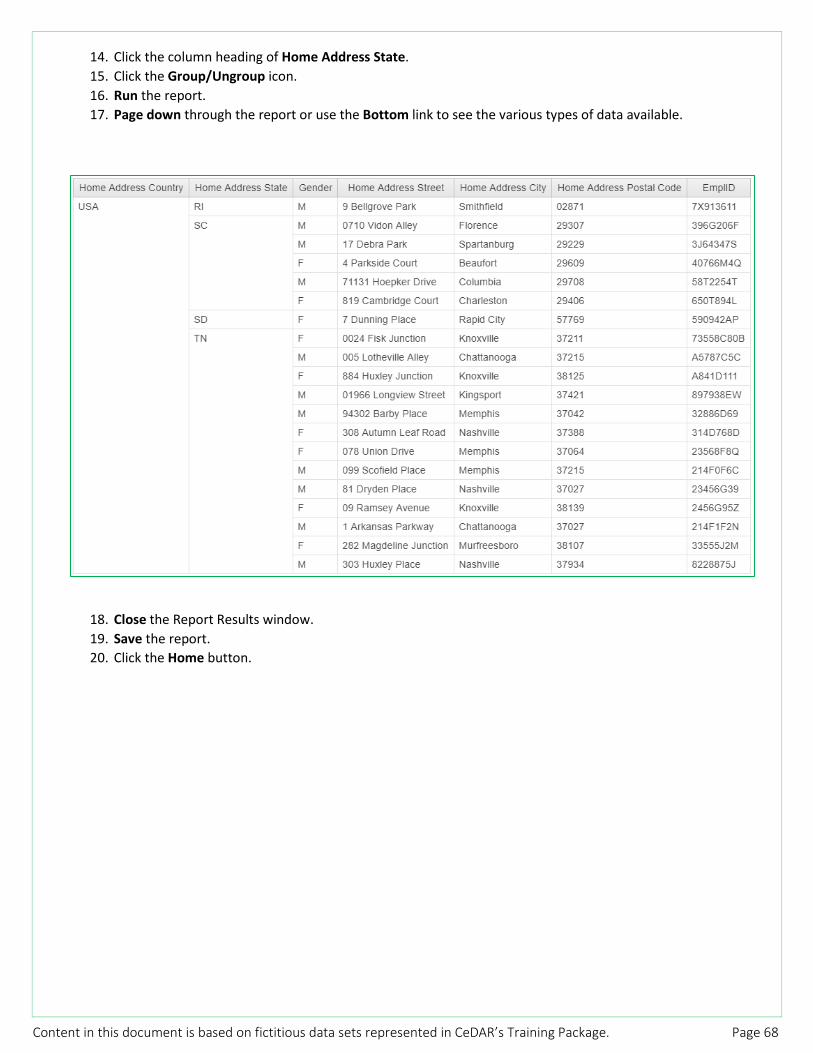
Content in this document is based on fictitious data sets represented in CeDAR’s Training Package. Page 68
14. Click the column heading of Home Address State. 15. Click the Group/Ungroup icon. 16. Run the report. 17. Page down through the report or use the Bottom link to see the various types of data available.
18. Close the Report Results window. 19. Save the report. 20. Click the Home button.
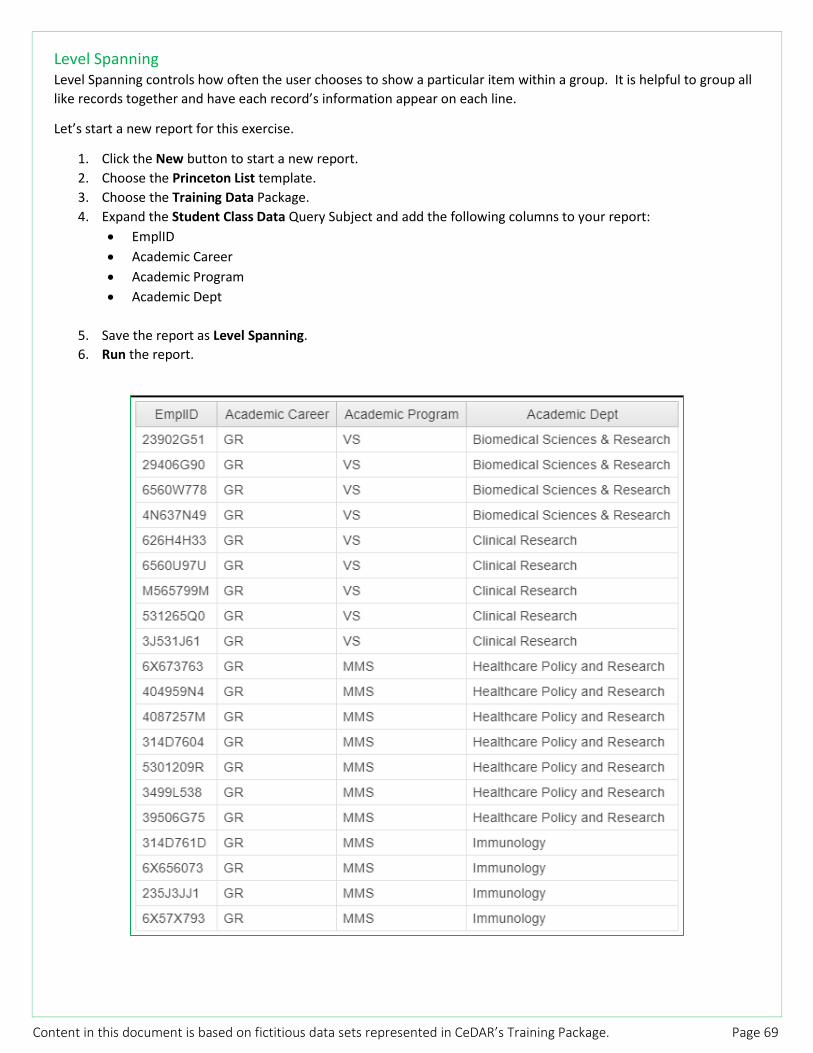
Content in this document is based on fictitious data sets represented in CeDAR’s Training Package. Page 69
Level Spanning Level Spanning controls how often the user chooses to show a particular item within a group. It is helpful to group all like records together and have each record’s information appear on each line.
Let’s start a new report for this exercise.
1. Click the New button to start a new report. 2. Choose the Princeton List template. 3. Choose the Training Data Package. 4. Expand the Student Class Data Query Subject and add the following columns to your report:
• EmplID • Academic Career • Academic Program • Academic Dept
5. Save the report as Level Spanning. 6. Run the report.

Content in this document is based on fictitious data sets represented in CeDAR’s Training Package. Page 70
7. Close the Report Results window. 8. Group the last three columns together. 9. Run the report.
The records are now grouped – first by Academic Career, then by Academic Program, and finally by Academic Department.
10. Close the Report Results window.
In order for the Academic Program to repeat each time the Academic Department changes, the Level Span association must be changed.
11. Highlight the Academic Program column body and click the Properties button.

Content in this document is based on fictitious data sets represented in CeDAR’s Training Package. Page 71
12. Under the Data section, locate the Group Span area in the Properties pane. 13. Click the word Group Span to activate a menu. 14. Click the drop-down arrow to reveal a list of query items (other grouped fields) to choose from. 15. Choose Academic Dept from the list.
16. Run the report and notice how the report has changed.
Each time the Academic Dept changes, the Academic Program repeats.
17. Close the Report Results window. 18. Save the report.
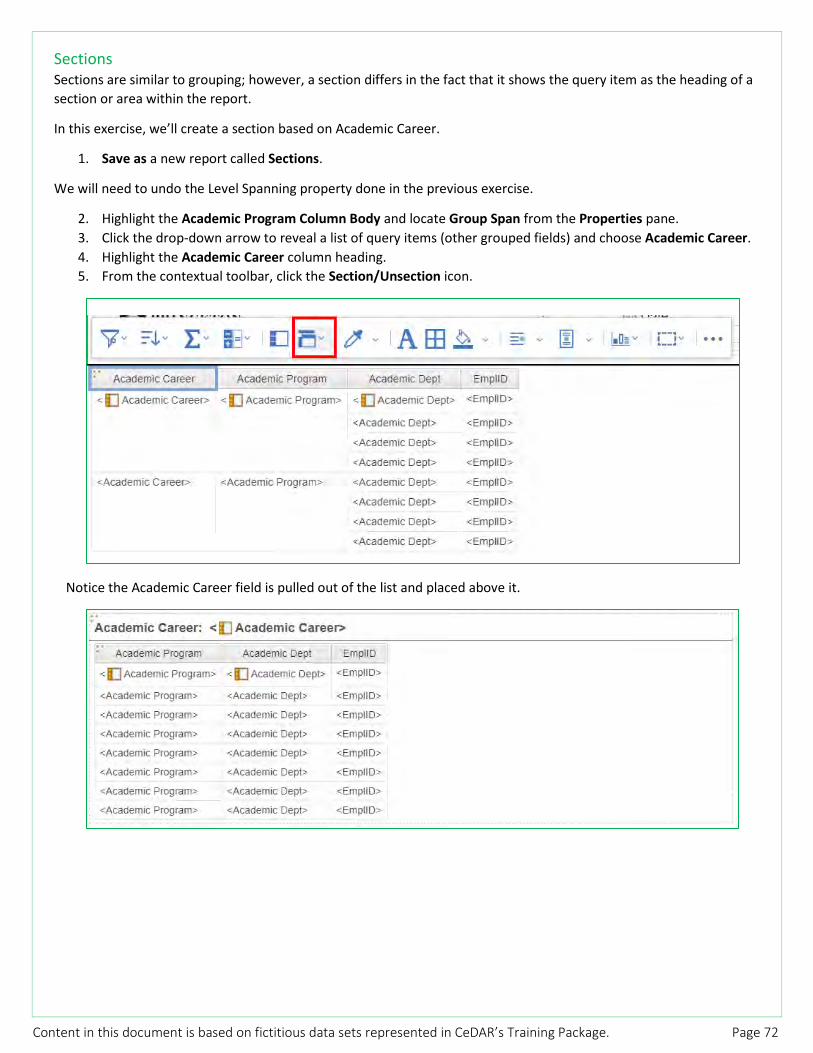
Content in this document is based on fictitious data sets represented in CeDAR’s Training Package. Page 72
Sections Sections are similar to grouping; however, a section differs in the fact that it shows the query item as the heading of a section or area within the report.
In this exercise, we’ll create a section based on Academic Career.
1. Save as a new report called Sections.
We will need to undo the Level Spanning property done in the previous exercise.
2. Highlight the Academic Program Column Body and locate Group Span from the Properties pane. 3. Click the drop-down arrow to reveal a list of query items (other grouped fields) and choose Academic Career. 4. Highlight the Academic Career column heading. 5. From the contextual toolbar, click the Section/Unsection icon.
Notice the Academic Career field is pulled out of the list and placed above it.
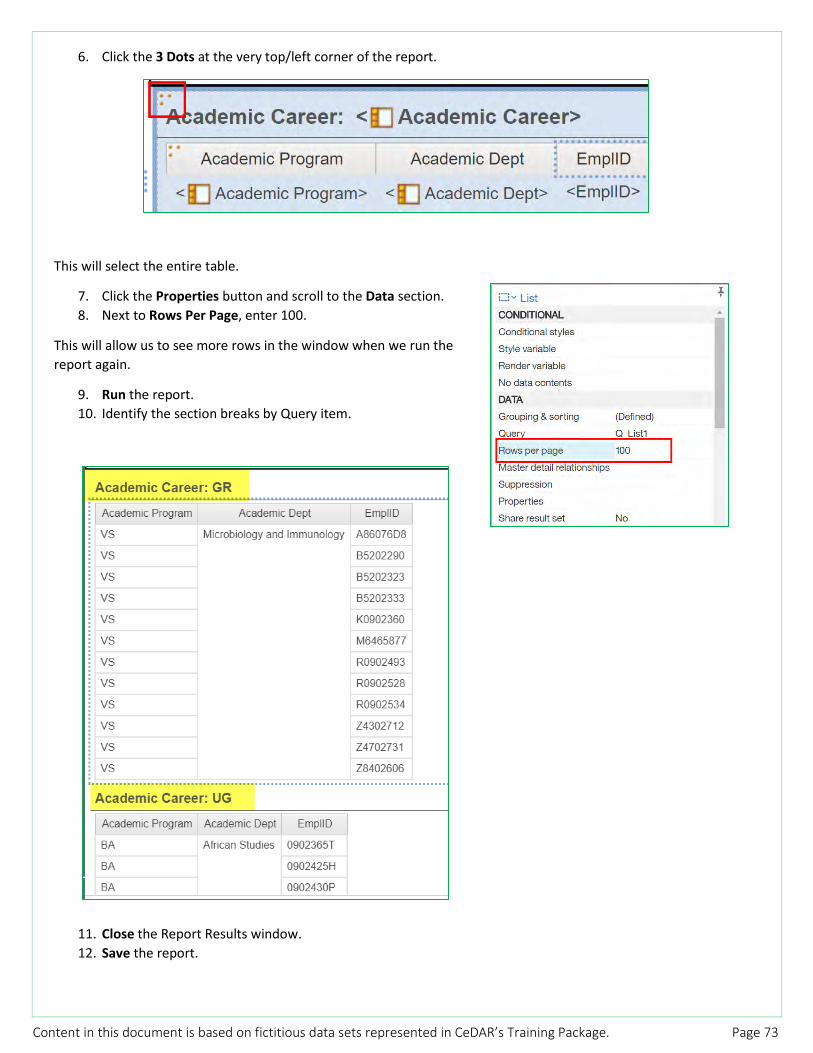
Content in this document is based on fictitious data sets represented in CeDAR’s Training Package. Page 73
6. Click the 3 Dots at the very top/left corner of the report.
This will select the entire table.
7. Click the Properties button and scroll to the Data section. 8. Next to Rows Per Page, enter 100.
This will allow us to see more rows in the window when we run the report again.
9. Run the report. 10. Identify the section breaks by Query item.
11. Close the Report Results window. 12. Save the report.
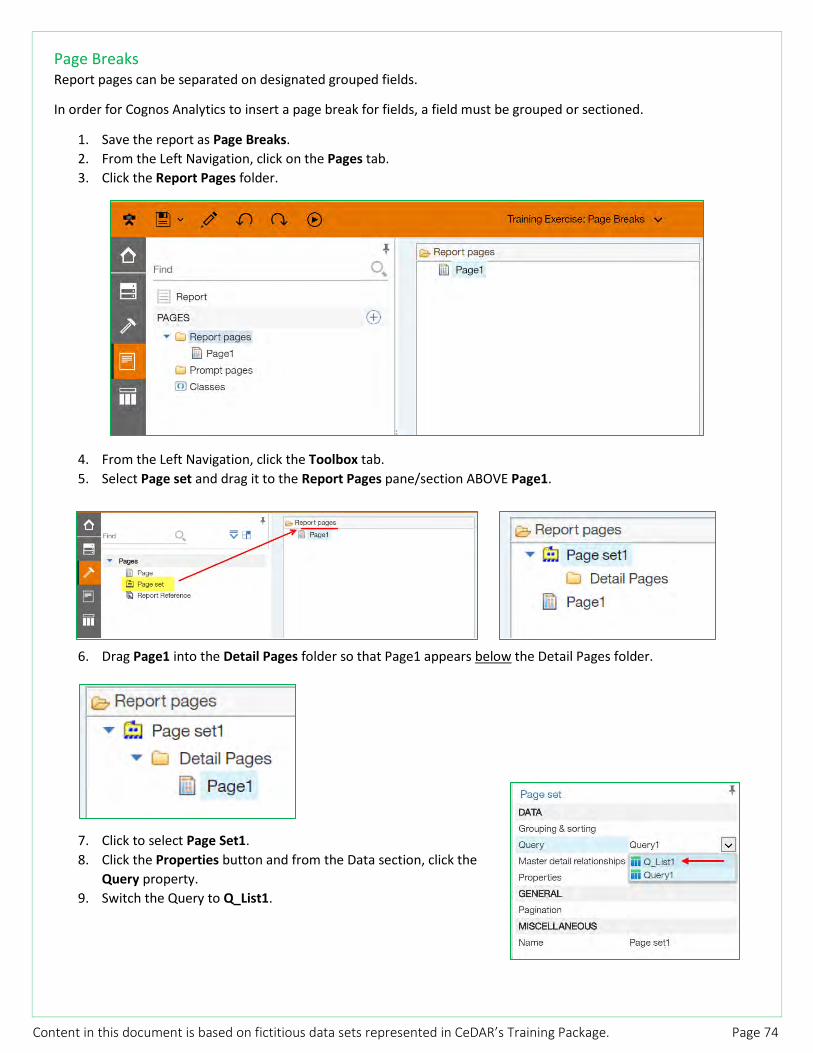
Content in this document is based on fictitious data sets represented in CeDAR’s Training Package. Page 74
Page Breaks Report pages can be separated on designated grouped fields.
In order for Cognos Analytics to insert a page break for fields, a field must be grouped or sectioned.
1. Save the report as Page Breaks. 2. From the Left Navigation, click on the Pages tab. 3. Click the Report Pages folder.
4. From the Left Navigation, click the Toolbox tab. 5. Select Page set and drag it to the Report Pages pane/section ABOVE Page1.
6. Drag Page1 into the Detail Pages folder so that Page1 appears below the Detail Pages folder.
7. Click to select Page Set1. 8. Click the Properties button and from the Data section, click the
Query property. 9. Switch the Query to Q_List1.

Content in this document is based on fictitious data sets represented in CeDAR’s Training Package. Page 75
10. Also from the Data section in the Properties pane, click the Grouping and Sorting property. 11. Click the More button to reveal a dialog box to help us group by Academic Career.
12. From the Data Items section, drag Academic Career into the Groups section under Overall. 13. Click OK.

Content in this document is based on fictitious data sets represented in CeDAR’s Training Package. Page 76
14. Run the report. The report is no longer on-going. At the end of each Academic Career, you will now have to Page Down to view the next set.
15. Close the Report Results window. 16. Save the report.
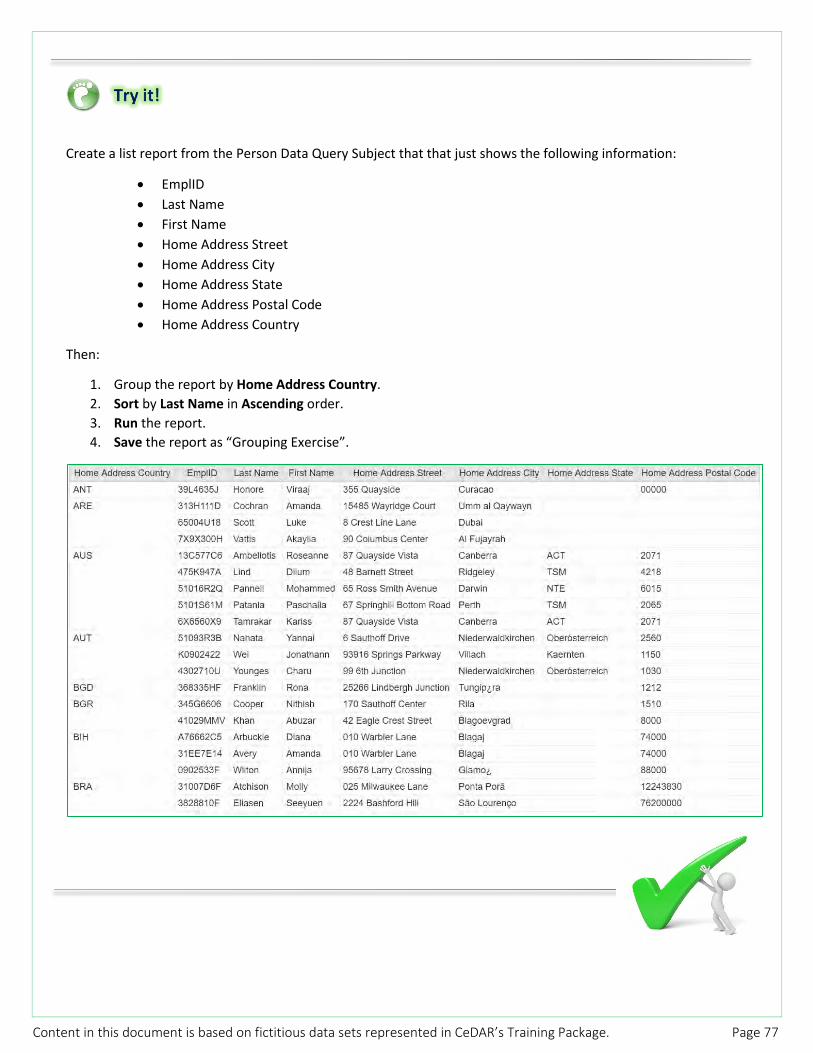
Content in this document is based on fictitious data sets represented in CeDAR’s Training Package. Page 77
Create a list report from the Person Data Query Subject that that just shows the following information:
• EmplID • Last Name • First Name • Home Address Street • Home Address City • Home Address State • Home Address Postal Code • Home Address Country
Then:
1. Group the report by Home Address Country. 2. Sort by Last Name in Ascending order. 3. Run the report. 4. Save the report as “Grouping Exercise”.
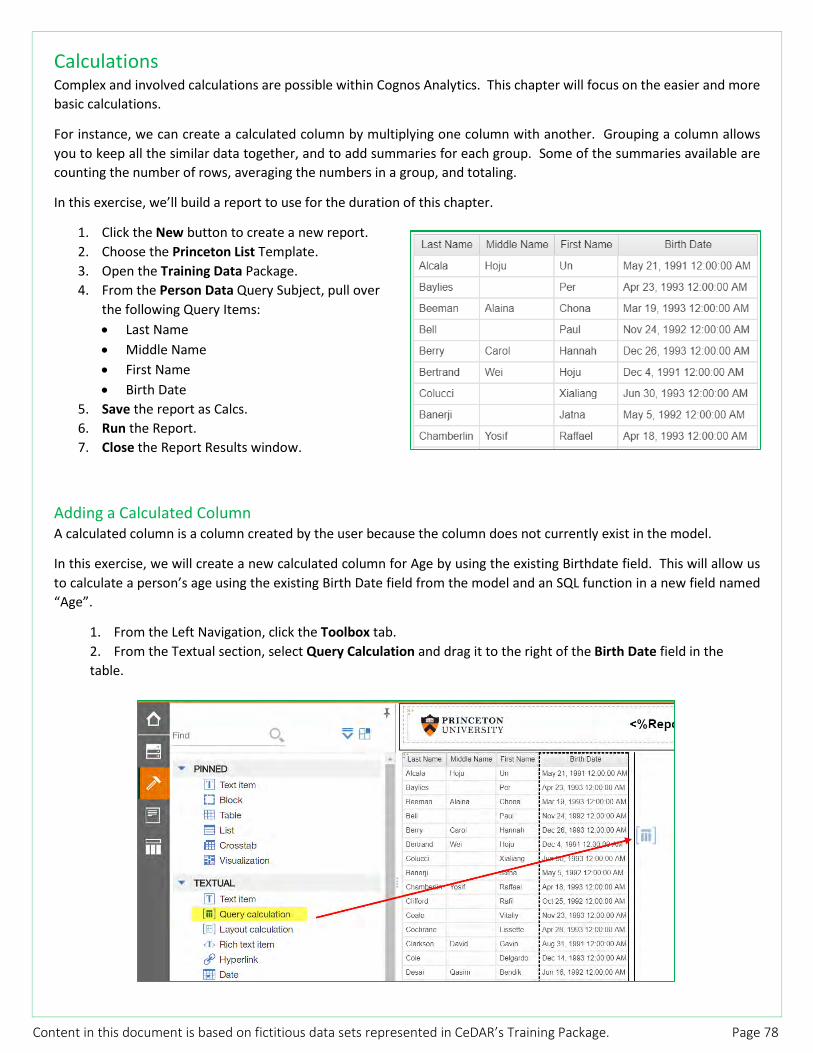
Content in this document is based on fictitious data sets represented in CeDAR’s Training Package. Page 78
Calculations Complex and involved calculations are possible within Cognos Analytics. This chapter will focus on the easier and more basic calculations.
For instance, we can create a calculated column by multiplying one column with another. Grouping a column allows you to keep all the similar data together, and to add summaries for each group. Some of the summaries available are counting the number of rows, averaging the numbers in a group, and totaling.
In this exercise, we’ll build a report to use for the duration of this chapter.
1. Click the New button to create a new report. 2. Choose the Princeton List Template. 3. Open the Training Data Package. 4. From the Person Data Query Subject, pull over
the following Query Items: • Last Name • Middle Name • First Name • Birth Date
5. Save the report as Calcs. 6. Run the Report. 7. Close the Report Results window.
Adding a Calculated Column A calculated column is a column created by the user because the column does not currently exist in the model.
In this exercise, we will create a new calculated column for Age by using the existing Birthdate field. This will allow us to calculate a person’s age using the existing Birth Date field from the model and an SQL function in a new field named “Age”.
1. From the Left Navigation, click the Toolbox tab. 2. From the Textual section, select Query Calculation and drag it to the right of the Birth Date field in the table.

Content in this document is based on fictitious data sets represented in CeDAR’s Training Package. Page 79
3. In the Data Item Expression window, in the Name field, type Age. 4. Click the Functions tab and open the Business Date/Time Functions folder.
5. Scroll down to find _years_between. 6. Double-click it to add it to the Expressions Definition area on the right. 7. Open the Common Functions folder and then expand the folder A-C. 8. Double-click the current_date function to add it to the Expressions Definition area on the right. 9. Type a comma and a space after current_date to separate functions.
10. Click the Data Items Tab and locate Birth Date. 11. Double-click Birth Date to add it to the Expression Definition area on the right. 12. Type a closed parenthesis ) after Birth Date. 13. Click the Validate button to ensure there are no errors with your calculation. 14. Click OK.

Content in this document is based on fictitious data sets represented in CeDAR’s Training Package. Page 80
15. Run the report.
16. Close the Report Results window. 17. Click Save.
Understanding Aggregation What is Aggregation?
Aggregation is the summarization of grouped items. By default, Cognos Analytics automatically groups non-numeric (text or date) data and summarizes numeric data. This means that the numbers you see in your reports are probably a summarization of the raw data from the database.
The user can turn automatic aggregation off at the report level by clicking the Queries icon from the Left Navigation, selecting the query, and then, on the Properties pane, find the section where it says Auto Group and Summarization and set it to No.
Types of Aggregation:
Some of the common types of aggregation are:
• Total: Sums the items in the group • Average: Averages the items in the group • Minimum: Shows the smallest number in the group • Maximum: Shows the largest number in the group • Count: Counts the number of items in the group

Content in this document is based on fictitious data sets represented in CeDAR’s Training Package. Page 81
The default type of aggregation for each numeric data item is set in the package.
Adding Summary Totals to a Footer (Totaling a Column) You can also create additional aggregates within the report. You can group the report and add summaries to the group footers.
An ungrouped report will show counts, totals, etc. for the entire report. However, if the report is grouped, and then counts, totals, etc., are added, the report will show the summaries for each individual group and for the report as a whole.
In this exercise, we’ll total the EmplIDs for the entire report.
1. Create a new list report with the Student Data Query Subject with the following fields: • Academic Program Descr • Academic Track • EmplID
2. Save the Report as Calculated ID. 3. Highlight the EmplID List Column Body.
4. Click Properties (to activate the Properties pane).
5. In the Properties pane, scroll down to the Data Item section and set the Detail Aggregation setting to
Count.
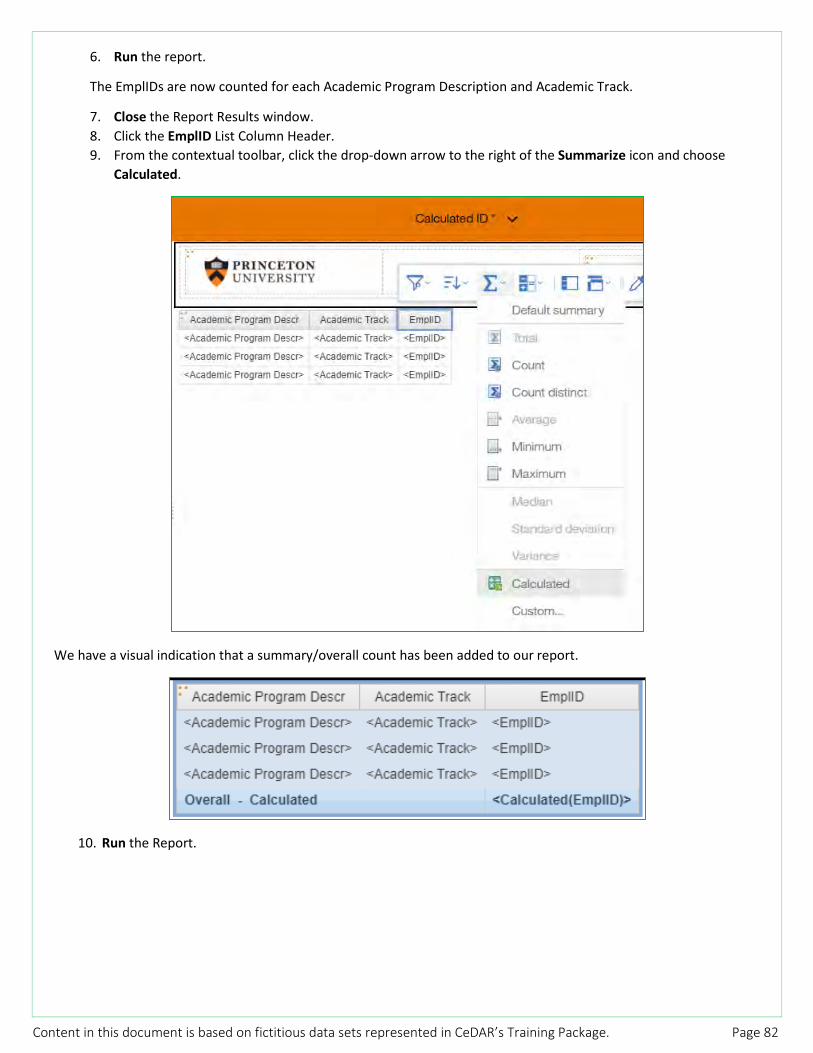
Content in this document is based on fictitious data sets represented in CeDAR’s Training Package. Page 82
6. Run the report.
The EmplIDs are now counted for each Academic Program Description and Academic Track.
7. Close the Report Results window. 8. Click the EmplID List Column Header. 9. From the contextual toolbar, click the drop-down arrow to the right of the Summarize icon and choose
Calculated.
We have a visual indication that a summary/overall count has been added to our report.
10. Run the Report.
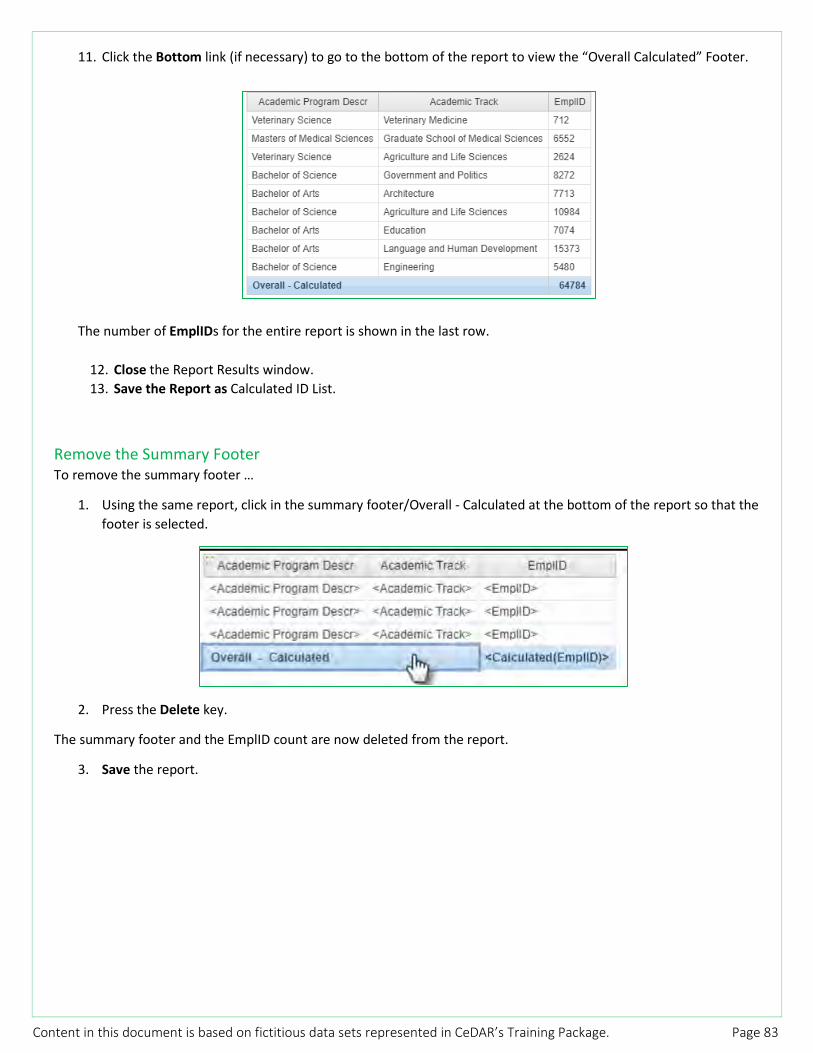
Content in this document is based on fictitious data sets represented in CeDAR’s Training Package. Page 83
11. Click the Bottom link (if necessary) to go to the bottom of the report to view the “Overall Calculated” Footer.
The number of EmplIDs for the entire report is shown in the last row.
12. Close the Report Results window. 13. Save the Report as Calculated ID List.
Remove the Summary Footer To remove the summary footer …
1. Using the same report, click in the summary footer/Overall - Calculated at the bottom of the report so that the footer is selected.
2. Press the Delete key.
The summary footer and the EmplID count are now deleted from the report.
3. Save the report.

Content in this document is based on fictitious data sets represented in CeDAR’s Training Package. Page 84
Grouped Summary Footers In this exercise, we’ll perform a count per individual group.
1. Use the Calculated ID List report. 2. Group the Academic Program Description and the Academic Track fields (by selecting each of the column
fields and hitting the Group/Ungroup button).
3. Highlight the EmplID List Column Body. 4. In the Properties pane, set the Detail Aggregation to Count (if it’s not already set). 5. Highlight the EmplID Column Header. 6. From the contextual menu, click the drop-down menu to the right of the Summarize icon and choose
Calculated.
A new footer is added to the table:
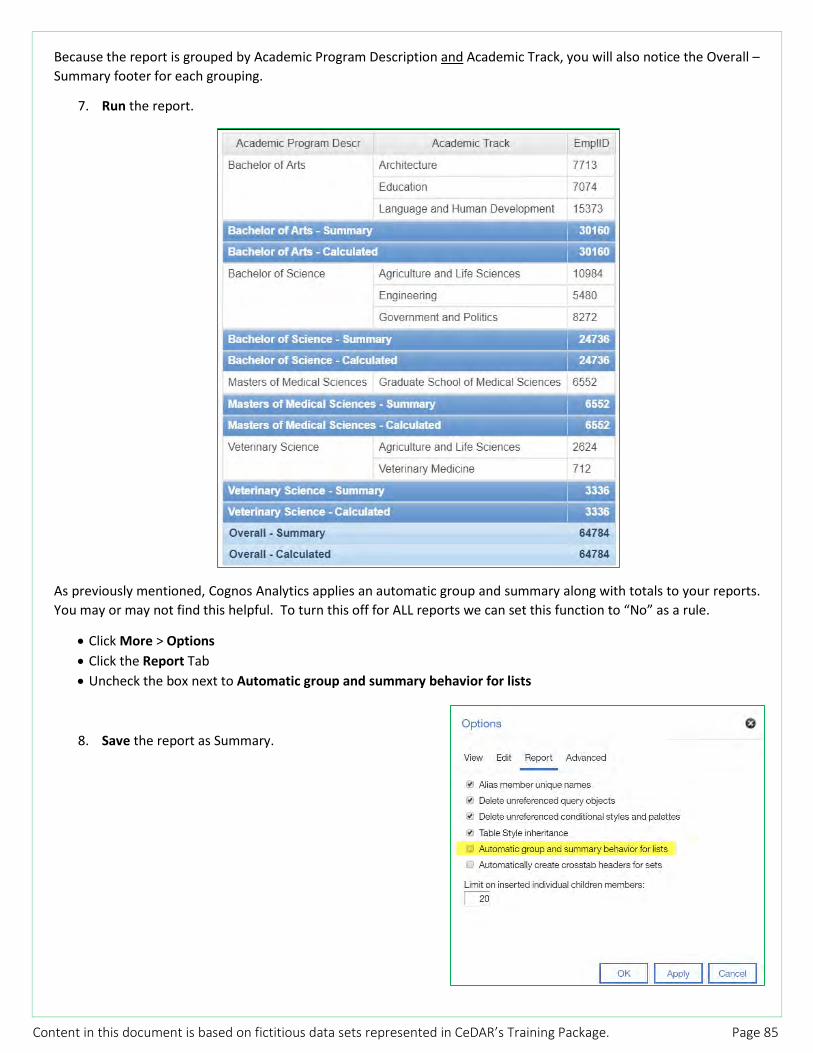
Content in this document is based on fictitious data sets represented in CeDAR’s Training Package. Page 85
Because the report is grouped by Academic Program Description and Academic Track, you will also notice the Overall – Summary footer for each grouping.
7. Run the report.
As previously mentioned, Cognos Analytics applies an automatic group and summary along with totals to your reports. You may or may not find this helpful. To turn this off for ALL reports we can set this function to “No” as a rule.
• Click More > Options • Click the Report Tab • Uncheck the box next to Automatic group and summary behavior for lists
8. Save the report as Summary.
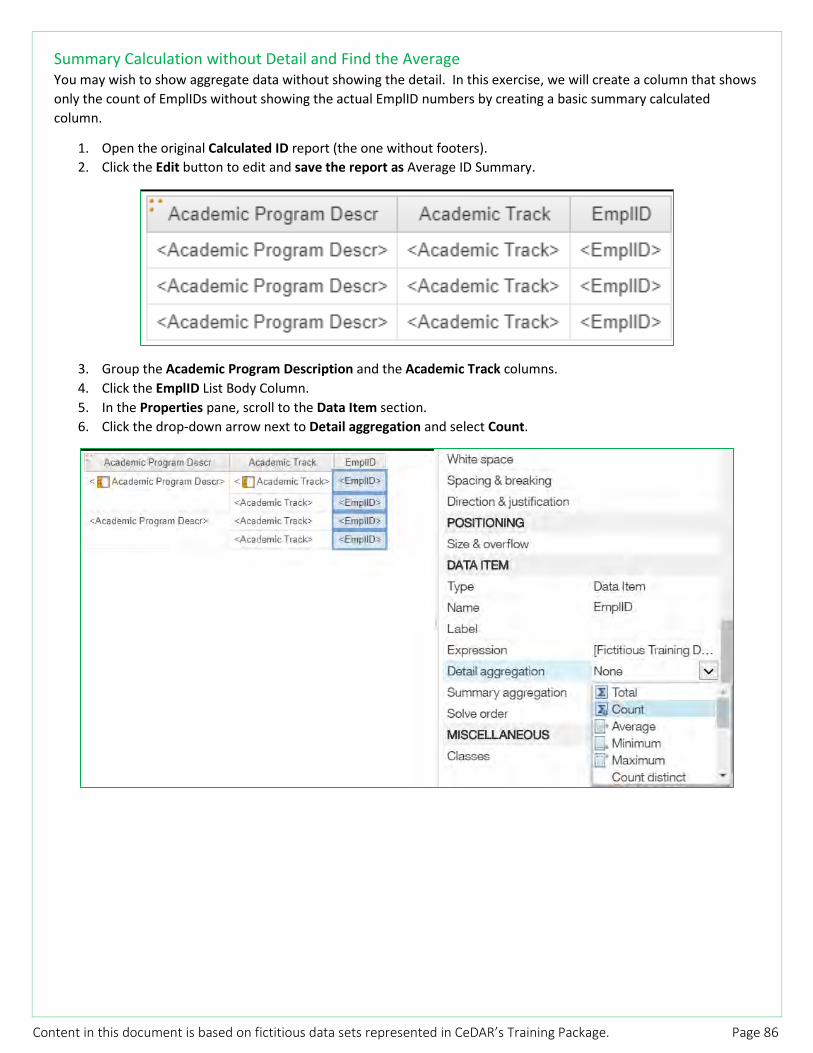
Content in this document is based on fictitious data sets represented in CeDAR’s Training Package. Page 86
Summary Calculation without Detail and Find the Average You may wish to show aggregate data without showing the detail. In this exercise, we will create a column that shows only the count of EmplIDs without showing the actual EmplID numbers by creating a basic summary calculated column.
1. Open the original Calculated ID report (the one without footers). 2. Click the Edit button to edit and save the report as Average ID Summary.
3. Group the Academic Program Description and the Academic Track columns. 4. Click the EmplID List Body Column. 5. In the Properties pane, scroll to the Data Item section. 6. Click the drop-down arrow next to Detail aggregation and select Count.

Content in this document is based on fictitious data sets represented in CeDAR’s Training Package. Page 87
7. Select the EmplID Column Heading. 8. In the Properties pane, scroll up to the Text Source section. 9. From the Source Type field, click the drop-down arrow and select Text.
10. The table will update and the EmplID field will prompt you to double-click to edit the column header text.
11. In the Text window, type in “Count of IDs” 12. Click OK. 13. Run the report.
Instead of showing each individual EmplID, Cognos Analytics summarizes by counting the number of EmplID’s associated with each Academic Program Description and Academic Track.
14. Close the Report Results window. 15. Save the report.
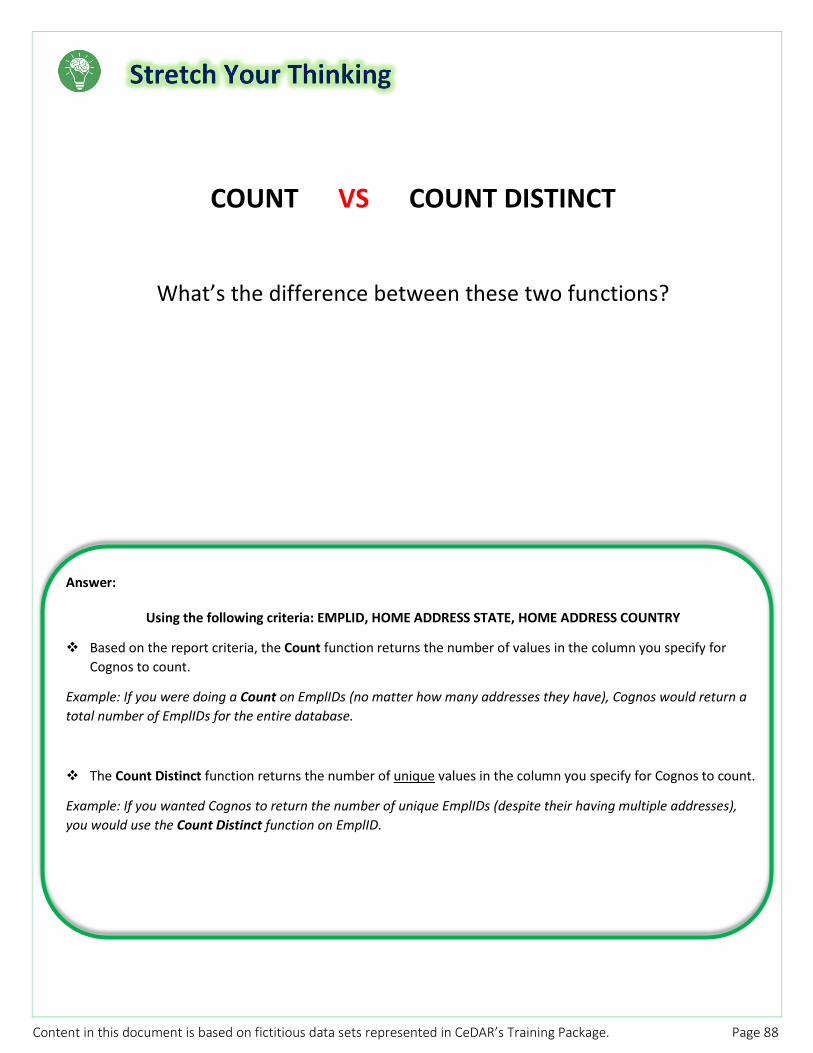
Content in this document is based on fictitious data sets represented in CeDAR’s Training Package. Page 88
COUNT VS COUNT DISTINCT
What’s the difference between these two functions?
Answer:
Using the following criteria: EMPLID, HOME ADDRESS STATE, HOME ADDRESS COUNTRY
Based on the report criteria, the Count function returns the number of values in the column you specify for Cognos to count.
Example: If you were doing a Count on EmplIDs (no matter how many addresses they have), Cognos would return a total number of EmplIDs for the entire database.
The Count Distinct function returns the number of unique values in the column you specify for Cognos to count.
Example: If you wanted Cognos to return the number of unique EmplIDs (despite their having multiple addresses), you would use the Count Distinct function on EmplID.
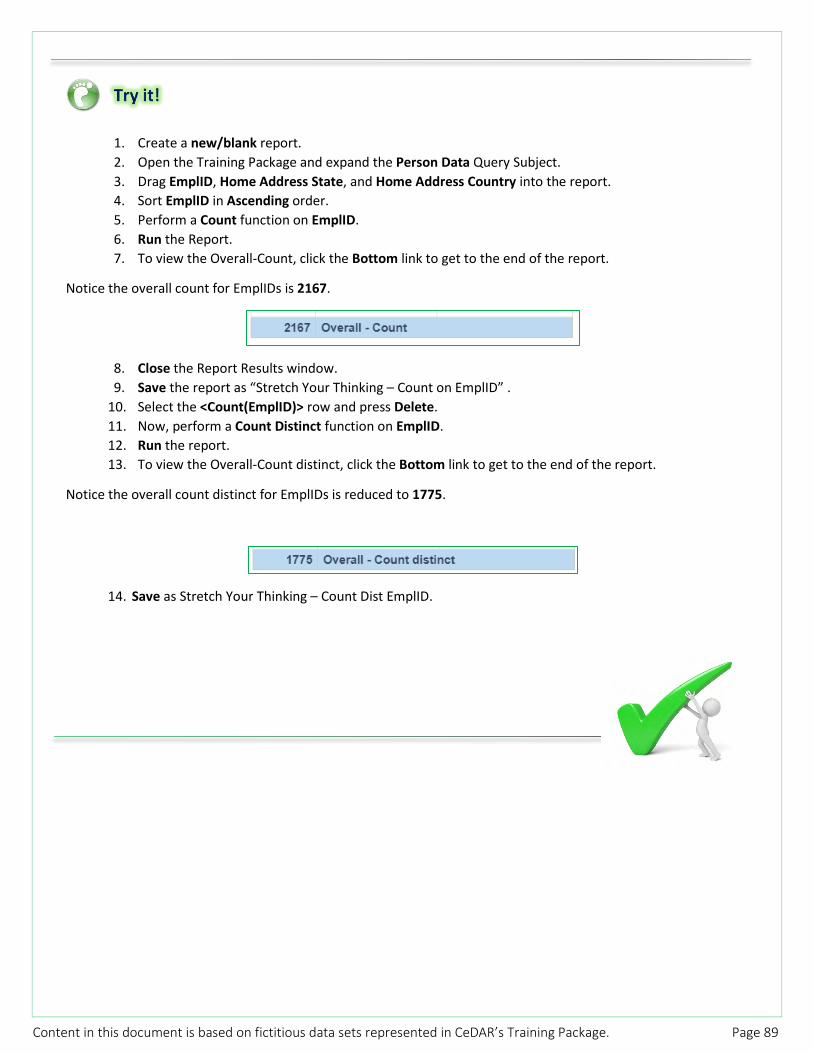
Content in this document is based on fictitious data sets represented in CeDAR’s Training Package. Page 89
1. Create a new/blank report. 2. Open the Training Package and expand the Person Data Query Subject. 3. Drag EmplID, Home Address State, and Home Address Country into the report. 4. Sort EmplID in Ascending order. 5. Perform a Count function on EmplID. 6. Run the Report. 7. To view the Overall-Count, click the Bottom link to get to the end of the report.
Notice the overall count for EmplIDs is 2167.
8. Close the Report Results window. 9. Save the report as “Stretch Your Thinking – Count on EmplID” .
10. Select the <Count(EmplID)> row and press Delete. 11. Now, perform a Count Distinct function on EmplID. 12. Run the report. 13. To view the Overall-Count distinct, click the Bottom link to get to the end of the report.
Notice the overall count distinct for EmplIDs is reduced to 1775.
14. Save as Stretch Your Thinking – Count Dist EmplID.

Content in this document is based on fictitious data sets represented in CeDAR’s Training Package. Page 90
Visualizations A visualization is the presentation of data in a pictorial or graphical format. It enables users/decision makers to see analytics presented visually, so they can grasp difficult concepts or identify new patterns.
Pie Chart A pie chart is a circular statistical graphic, which is divided into slices to illustrate numerical proportion. It shows how parts make up and compare to a whole.
1. Create a new blank report. 2. Open the Training Package. 3. Click the in the middle of the content explorer. 4. Choose Visualization.
The visualization Gallery will open, prompting you to choose a visualization type.
5. Choose Pie. 6. Accept the defaults by clicking OK in the Object and Query Names dialog box. 7. Expand the Courses and Classes Query Subject to reveal the Department query. 8. Ctrl + click Academic Program and Faculty Count and drag them over into the pie.
Your data items are strategically placed into the appropriate areas.

Content in this document is based on fictitious data sets represented in CeDAR’s Training Package. Page 91
9. Click Run.
The faculty count for each Academic Program is displayed in 4 respective parts.
10. In the Report Results window, hover over each piece of the pie. 11. Close the Report Results window. 12. From the Application Toolbar, click the Page Views icon and select Page Preview.
This will allow you to view your results without running the report.
13. Save the report as Pie Chart.
Stacked Bar Chart - with Attributes In Report Studio (previous versions of Cognos), to perform a Count on an attribute (like EmplID), you had to go into your Properties and change the Detail Aggregation.
As we’ve seen in prior exercises, in Reporting (Cognos 11), you still need to go into the Properties of the report and change the Detail Aggregation from Summarize to Count.
However, be cautious when working with a crosstab/measures. When you run your report following the steps above, your report will not return data unless you also change the Summary Aggregation to Total.
This is worth mentioning for the following reason: When you skip that last step with a crosstab, you will be able to run your report – even though you’re not getting any data back in the Measures area. When you’re trying to add an attribute (like EmplID) to a visualization (like a stacked bar chart), Cognos will automatically throw an error at you. With visualizations, you must be proactive!
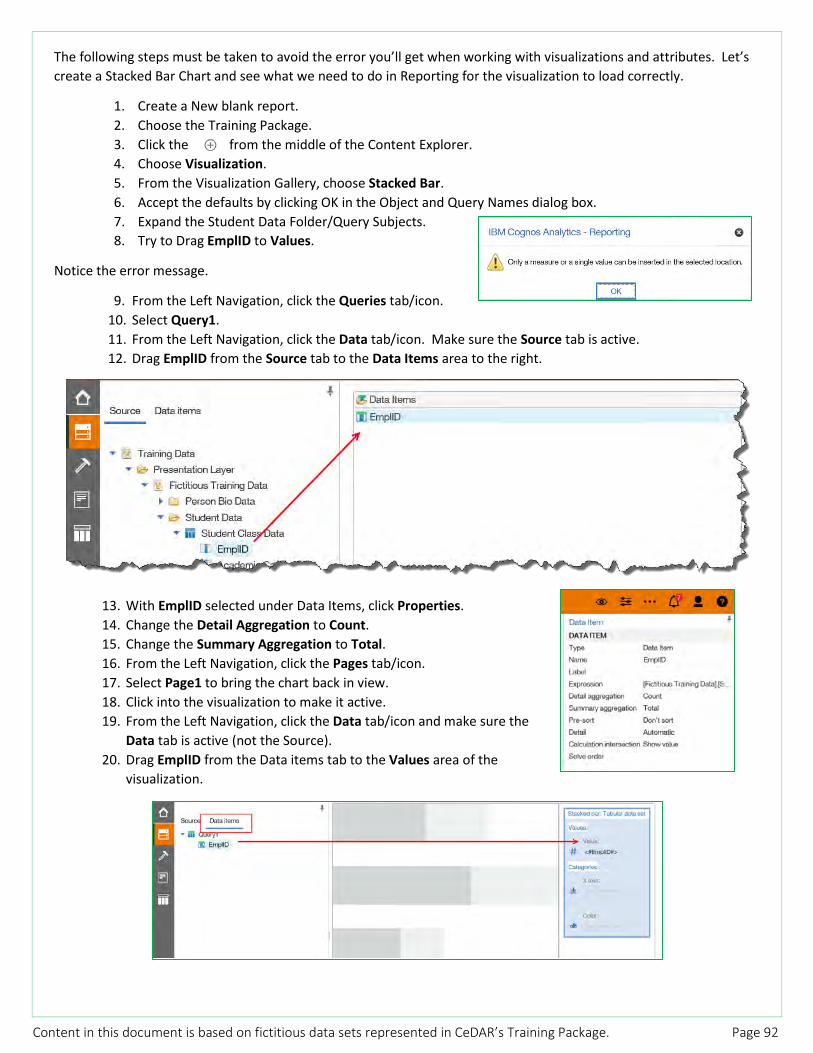
Content in this document is based on fictitious data sets represented in CeDAR’s Training Package. Page 92
The following steps must be taken to avoid the error you’ll get when working with visualizations and attributes. Let’s create a Stacked Bar Chart and see what we need to do in Reporting for the visualization to load correctly.
1. Create a New blank report. 2. Choose the Training Package. 3. Click the from the middle of the Content Explorer. 4. Choose Visualization. 5. From the Visualization Gallery, choose Stacked Bar. 6. Accept the defaults by clicking OK in the Object and Query Names dialog box. 7. Expand the Student Data Folder/Query Subjects. 8. Try to Drag EmplID to Values.
Notice the error message.
9. From the Left Navigation, click the Queries tab/icon. 10. Select Query1. 11. From the Left Navigation, click the Data tab/icon. Make sure the Source tab is active. 12. Drag EmplID from the Source tab to the Data Items area to the right.
13. With EmplID selected under Data Items, click Properties. 14. Change the Detail Aggregation to Count. 15. Change the Summary Aggregation to Total. 16. From the Left Navigation, click the Pages tab/icon. 17. Select Page1 to bring the chart back in view. 18. Click into the visualization to make it active. 19. From the Left Navigation, click the Data tab/icon and make sure the
Data tab is active (not the Source). 20. Drag EmplID from the Data items tab to the Values area of the
visualization.
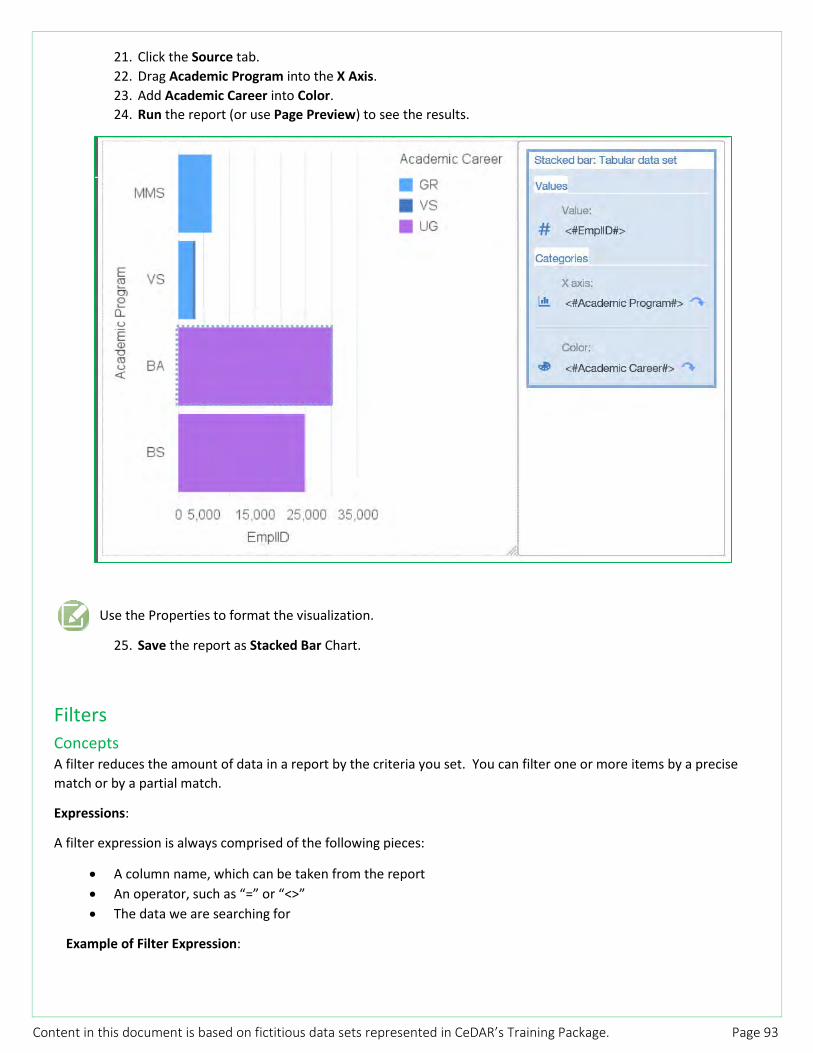
Content in this document is based on fictitious data sets represented in CeDAR’s Training Package. Page 93
21. Click the Source tab. 22. Drag Academic Program into the X Axis. 23. Add Academic Career into Color. 24. Run the report (or use Page Preview) to see the results.
Use the Properties to format the visualization.
25. Save the report as Stacked Bar Chart.
Filters Concepts A filter reduces the amount of data in a report by the criteria you set. You can filter one or more items by a precise match or by a partial match.
Expressions:
A filter expression is always comprised of the following pieces:
• A column name, which can be taken from the report • An operator, such as “=” or “<>” • The data we are searching for
Example of Filter Expression:
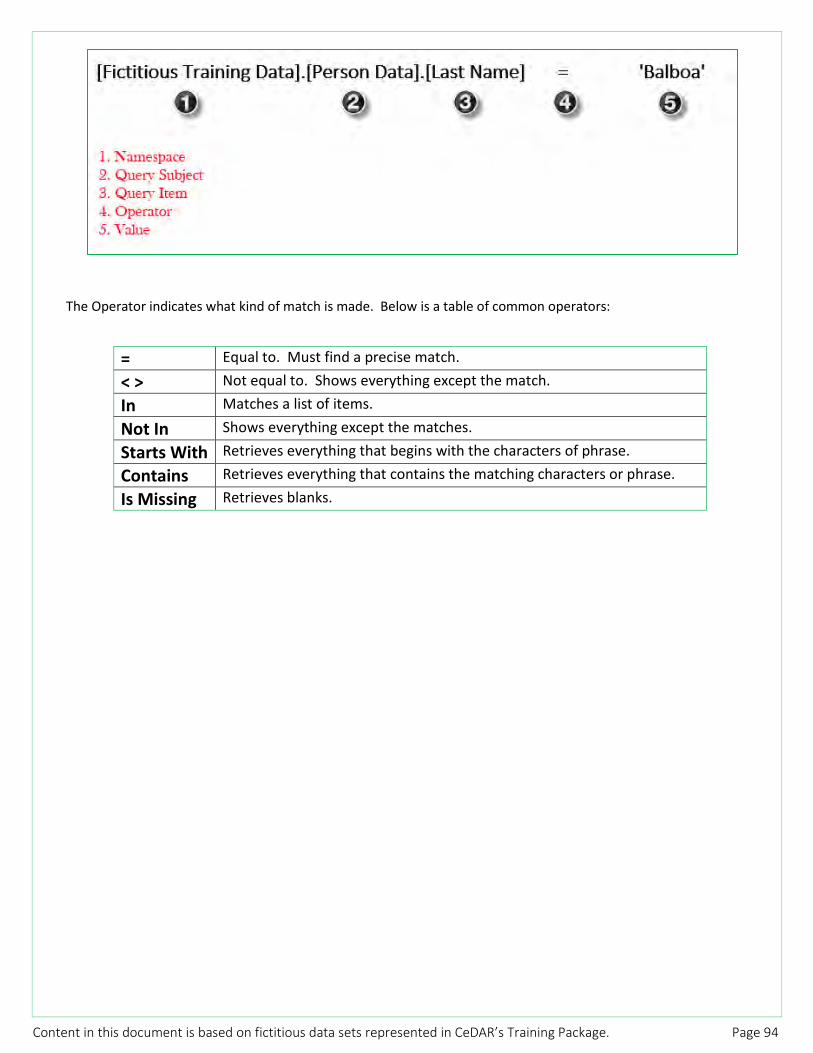
Content in this document is based on fictitious data sets represented in CeDAR’s Training Package. Page 94
The Operator indicates what kind of match is made. Below is a table of common operators:
= Equal to. Must find a precise match.
< > Not equal to. Shows everything except the match.
In Matches a list of items.
Not In Shows everything except the matches.
Starts With Retrieves everything that begins with the characters of phrase.
Contains Retrieves everything that contains the matching characters or phrase.
Is Missing Retrieves blanks.

Content in this document is based on fictitious data sets represented in CeDAR’s Training Package. Page 95
Opening the Filters Dialog Window Let’s take a look at and get familiar with the Filters dialog window.
Start a new List report.
1. From the Person Data Query Subject, bring the following fields into the report: • Last Name • First Name • Home Address Street • Home Address City • Home Address State • Home Address Postal Code • Home Address Country • Birth Date
2. Select the entire table (click the three dots on the top left corner of the first field).
3. From the contextual toolbar, click the Filters icon and choose Edit Filters.
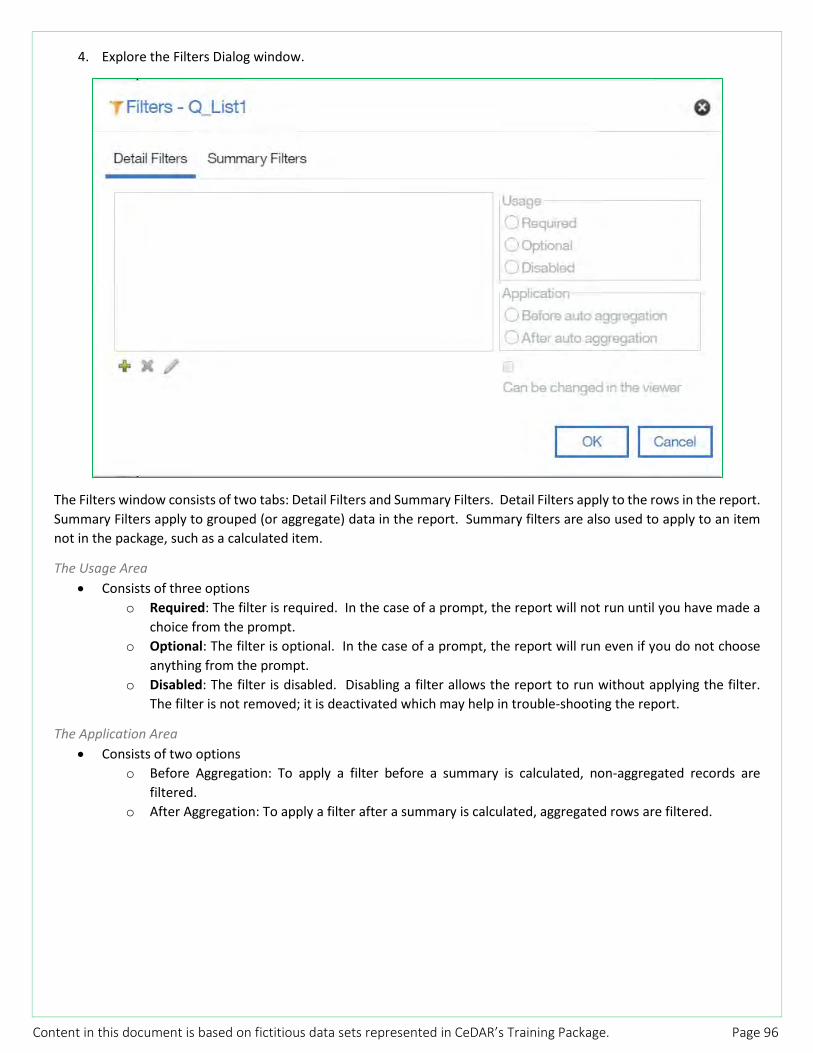
Content in this document is based on fictitious data sets represented in CeDAR’s Training Package. Page 96
4. Explore the Filters Dialog window.
The Filters window consists of two tabs: Detail Filters and Summary Filters. Detail Filters apply to the rows in the report. Summary Filters apply to grouped (or aggregate) data in the report. Summary filters are also used to apply to an item not in the package, such as a calculated item.
The Usage Area • Consists of three options
o Required: The filter is required. In the case of a prompt, the report will not run until you have made a choice from the prompt.
o Optional: The filter is optional. In the case of a prompt, the report will run even if you do not choose anything from the prompt.
o Disabled: The filter is disabled. Disabling a filter allows the report to run without applying the filter. The filter is not removed; it is deactivated which may help in trouble-shooting the report.
The Application Area • Consists of two options
o Before Aggregation: To apply a filter before a summary is calculated, non-aggregated records are filtered.
o After Aggregation: To apply a filter after a summary is calculated, aggregated rows are filtered.
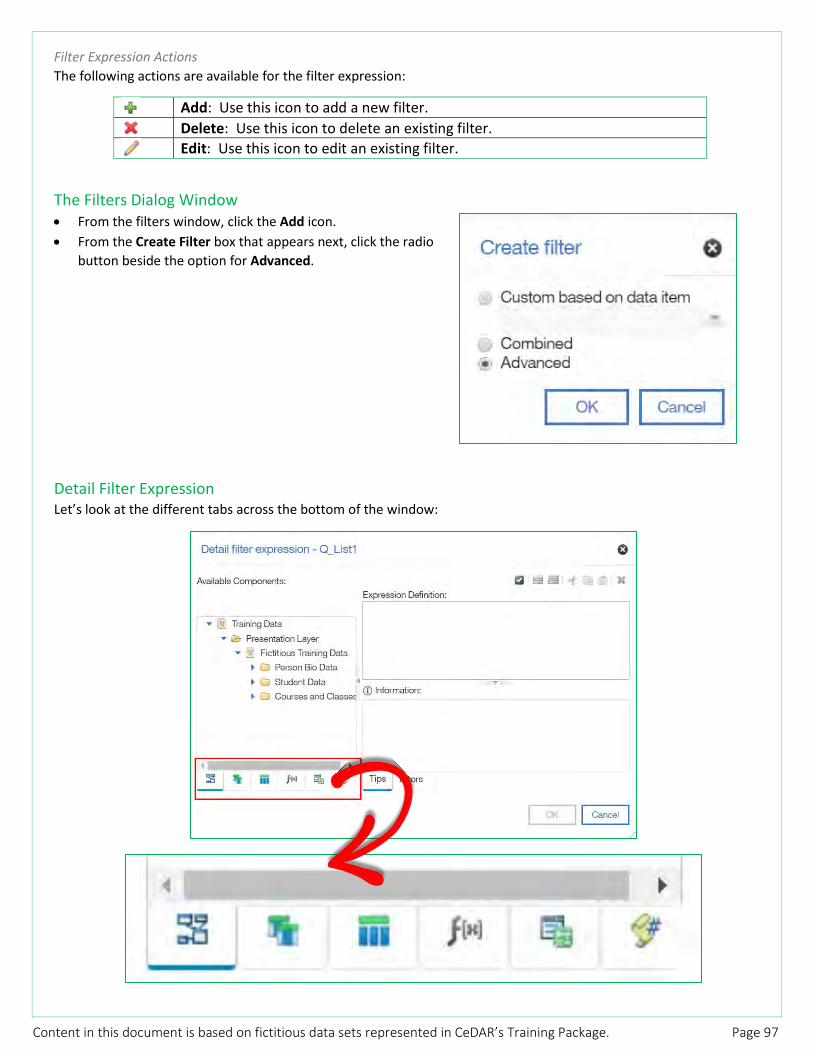
Content in this document is based on fictitious data sets represented in CeDAR’s Training Package. Page 97
Filter Expression Actions The following actions are available for the filter expression:
Add: Use this icon to add a new filter. Delete: Use this icon to delete an existing filter. Edit: Use this icon to edit an existing filter.
The Filters Dialog Window • From the filters window, click the Add icon. • From the Create Filter box that appears next, click the radio
button beside the option for Advanced.
Detail Filter Expression Let’s look at the different tabs across the bottom of the window:

Content in this document is based on fictitious data sets represented in CeDAR’s Training Package. Page 98
Source Tab The Source tab allows you to filter on any item in the package.
Data Items Tab The Data Items tab allows you to filter on items in the report.
Query Items Tab The Query Items tab allows you to filter on items from other queries in your report.
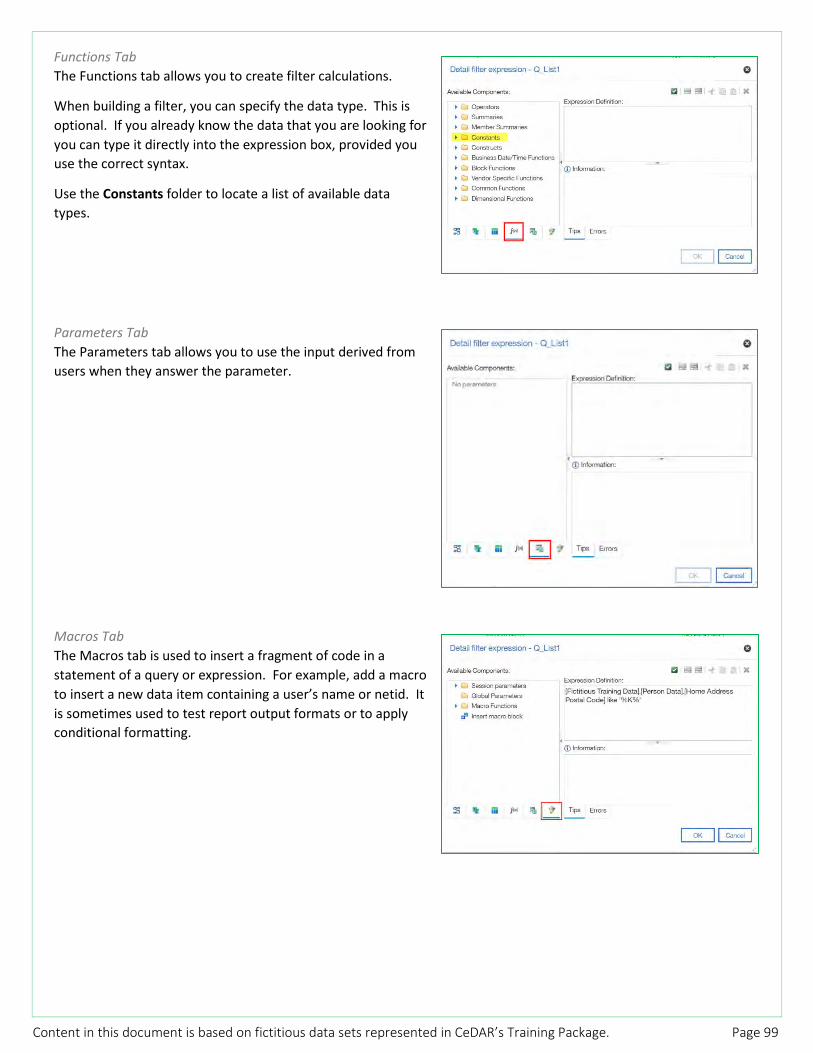
Content in this document is based on fictitious data sets represented in CeDAR’s Training Package. Page 99
Functions Tab The Functions tab allows you to create filter calculations.
When building a filter, you can specify the data type. This is optional. If you already know the data that you are looking for you can type it directly into the expression box, provided you use the correct syntax.
Use the Constants folder to locate a list of available data types.
Parameters Tab The Parameters tab allows you to use the input derived from users when they answer the parameter.
Macros Tab The Macros tab is used to insert a fragment of code in a statement of a query or expression. For example, add a macro to insert a new data item containing a user’s name or netid. It is sometimes used to test report output formats or to apply conditional formatting.
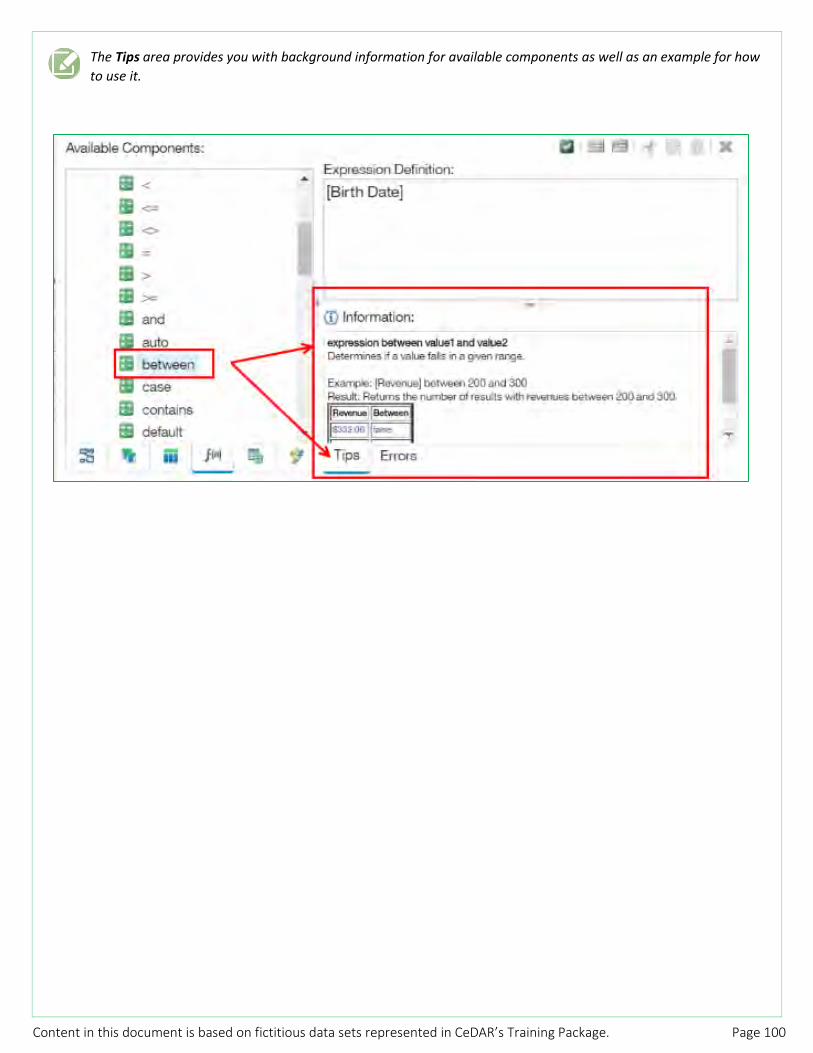
Content in this document is based on fictitious data sets represented in CeDAR’s Training Package. Page 100
The Tips area provides you with background information for available components as well as an example for how to use it.

Content in this document is based on fictitious data sets represented in CeDAR’s Training Package. Page 101
Filtering on a Single Item from the Source Tab Cognos Analytics provides the flexibility to either filter on an item in the model or on an item in the report. The Source tab is the location to use to filter on an item in the model.
1. Close out of the Filter Dialog window to get back to the report window. 1. Save the report as Pre Filter 2. Run the report to view it before any filters are applied.
3. Close the Report Results window. 4. Select the table. 5. From the contextual toolbar, click the Filters icon and choose Edit Filters. 6. Click the Add button. 7. Choose Advanced and click OK. 8. From the Source tab, navigate to the Student Data folder and double-click Academic Career from within the
Student Class Data Query Subject.
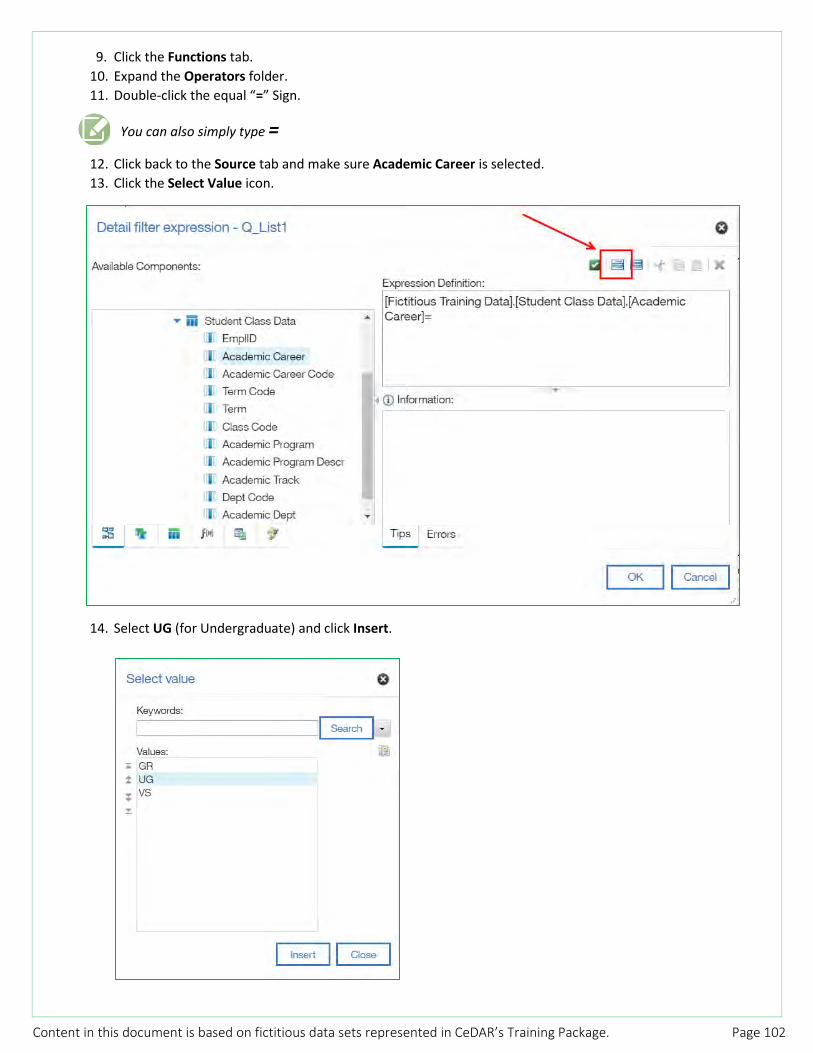
Content in this document is based on fictitious data sets represented in CeDAR’s Training Package. Page 102
9. Click the Functions tab. 10. Expand the Operators folder. 11. Double-click the equal “=” Sign.
You can also simply type =
12. Click back to the Source tab and make sure Academic Career is selected. 13. Click the Select Value icon.
14. Select UG (for Undergraduate) and click Insert.

Content in this document is based on fictitious data sets represented in CeDAR’s Training Package. Page 103
Spacing within the expression does not matter. Only spacing between single quotes ‘ ’ matters as whatever is between the single quotes is the exact string on which Cognos will search the records in the Database.
15. In the Detail Filter Expression window, click the Validate icon.
When the validation process is complete and successful, you will see a “no errors” message in the Information/Errors window.
16. Click OK.
The new filter will appear in the Filters window in the Detail Filters tab.
17. Click OK. 18. Run the report.

Content in this document is based on fictitious data sets represented in CeDAR’s Training Package. Page 104
19. Close the Report Results window. 20. From the Student Data folder, Student Class Data Query Subject, add Academic Career to the last column. 21. Run the report.
You will see the applied filter!
*Thinking Back *
If we wanted to see this same report (with the filter applied)
but omit the Academic Career column from the report,
what steps would we take?
22. Save the report as Post Filter Report.
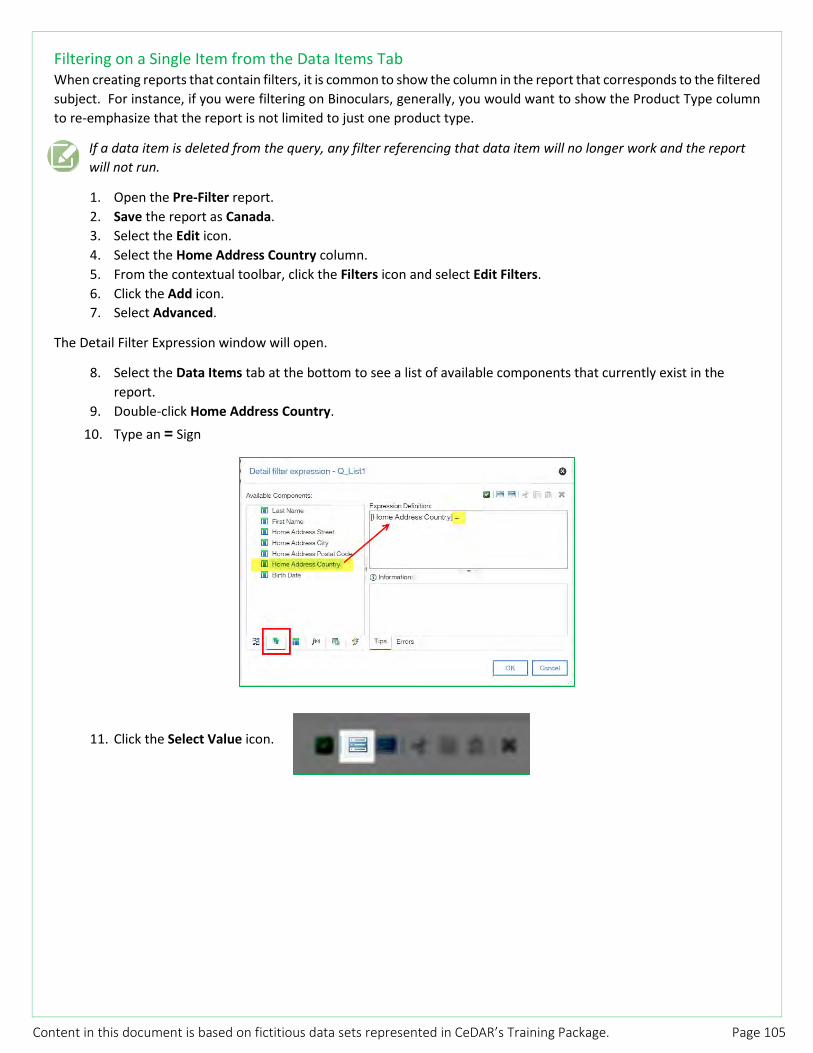
Content in this document is based on fictitious data sets represented in CeDAR’s Training Package. Page 105
Filtering on a Single Item from the Data Items Tab When creating reports that contain filters, it is common to show the column in the report that corresponds to the filtered subject. For instance, if you were filtering on Binoculars, generally, you would want to show the Product Type column to re-emphasize that the report is not limited to just one product type.
If a data item is deleted from the query, any filter referencing that data item will no longer work and the report will not run.
1. Open the Pre-Filter report. 2. Save the report as Canada. 3. Select the Edit icon. 4. Select the Home Address Country column. 5. From the contextual toolbar, click the Filters icon and select Edit Filters. 6. Click the Add icon. 7. Select Advanced.
The Detail Filter Expression window will open.
8. Select the Data Items tab at the bottom to see a list of available components that currently exist in the report.
9. Double-click Home Address Country. 10. Type an = Sign
11. Click the Select Value icon.
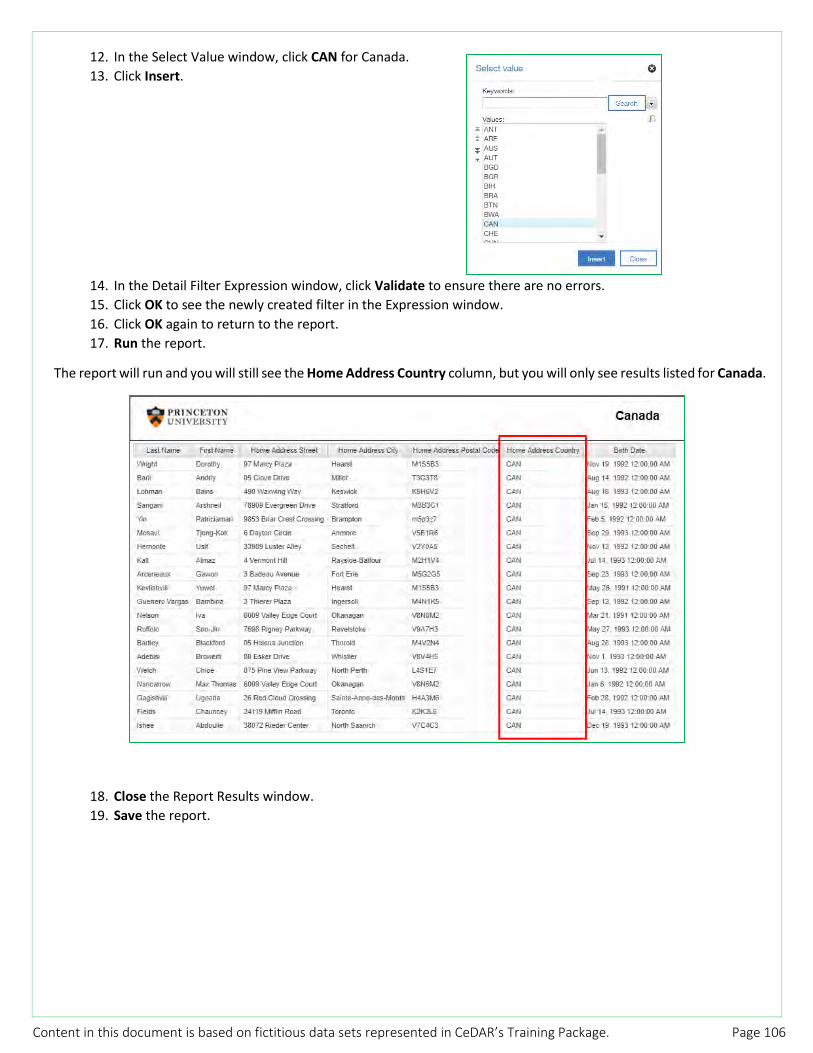
Content in this document is based on fictitious data sets represented in CeDAR’s Training Package. Page 106
12. In the Select Value window, click CAN for Canada. 13. Click Insert.
14. In the Detail Filter Expression window, click Validate to ensure there are no errors. 15. Click OK to see the newly created filter in the Expression window. 16. Click OK again to return to the report. 17. Run the report.
The report will run and you will still see the Home Address Country column, but you will only see results listed for Canada.
18. Close the Report Results window. 19. Save the report.

Content in this document is based on fictitious data sets represented in CeDAR’s Training Package. Page 107
Usage (Required, Optional, Disabled) As mentioned earlier, after a filter is created, there are three choices available: Required, Optional, and Disabled.
The previous report defaulted to Required, which means the filter that was created ([Home Address Country] = ‘CAN’) is required or necessary. However, the filtering option can be changed to Optional or Disabled.
Required means the filter definition must be used.
Choosing Optional means the filter does not have to be used in order for the report to run. In the case of a prompt, the report will run even if you do not choose anything from the prompt.
Choosing Disabled allows the user to run the report as if there was no filter. Therefore, debugging or trouble-shooting is easy and convenient, as the filter is temporarily “turned off”.
In this exercise, we’ll set the filter we created in the last exercise ([Home Address Country] = ‘CAN’) to “disabled”.
1. With the Canada report still open, let’s continue to edit. 2. Select the Home Address Country column. 3. From the contextual toolbar, click the Filters icon and select Edit Filter. 4. Make sure the Detail Filters tab is selected. 5. Highlight the Canada filter. 6. Under the Usage section, choose Disabled.
7. Click OK. 8. Run the report.

Content in this document is based on fictitious data sets represented in CeDAR’s Training Package. Page 108
You will notice that all countries are now showing; that the filter is disabled.
9. Close the Report Results window. 10. Change the filter back to Required. 11. Save the report. 12. Close the report.
Clicking the Query tab from the Left Navigation will reveal Data Items and Filters. You can manage these things from this area.
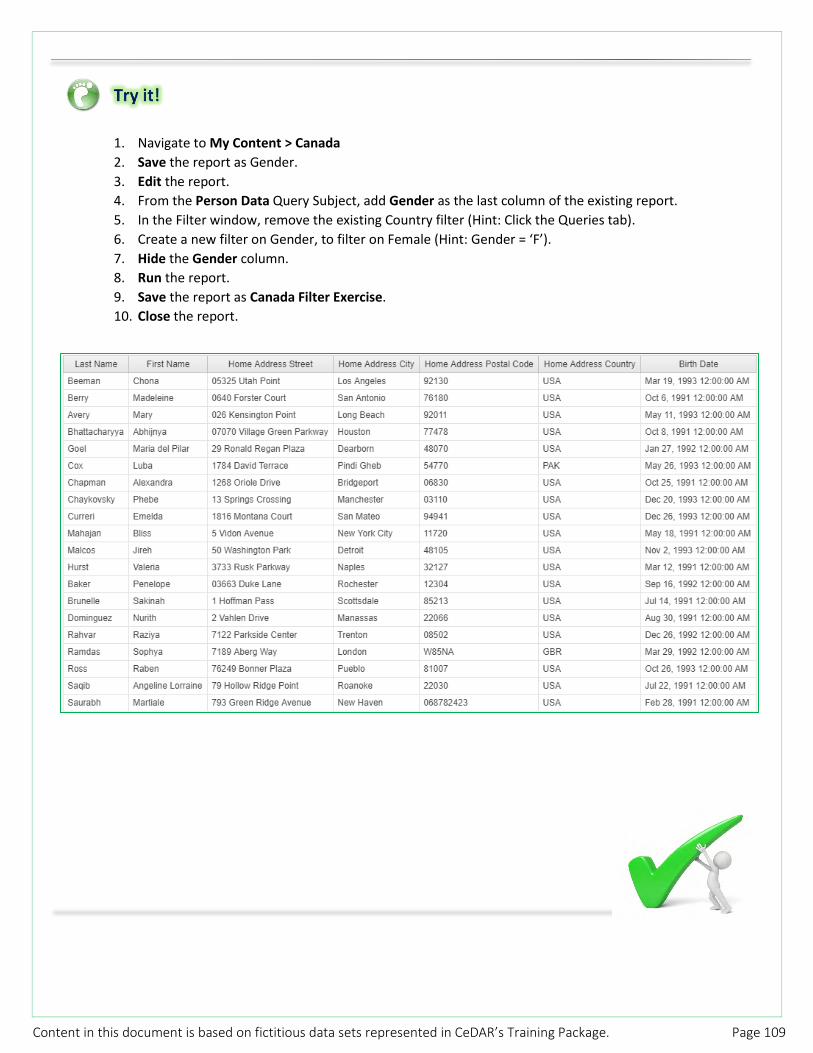
Content in this document is based on fictitious data sets represented in CeDAR’s Training Package. Page 109
1. Navigate to My Content > Canada 2. Save the report as Gender. 3. Edit the report. 4. From the Person Data Query Subject, add Gender as the last column of the existing report. 5. In the Filter window, remove the existing Country filter (Hint: Click the Queries tab). 6. Create a new filter on Gender, to filter on Female (Hint: Gender = ‘F’). 7. Hide the Gender column. 8. Run the report. 9. Save the report as Canada Filter Exercise. 10. Close the report.

Content in this document is based on fictitious data sets represented in CeDAR’s Training Package. Page 110
Filtering on Multiple Items – Using “In” When using the equal sign “=”, the expression can only equal one item. However, if you want to create a filter that can look for multiple items, it is most effective to use an “in” statement that allows you to filter on multiple items.
In this exercise, we’ll apply a filter that returns only Canada and Egypt.
1. Open the Canada report for editing. 2. Save the report as Multiple Countries. 3. Edit the filter (make sure it’s usage is Required then click the Pencil/Edit icon. 4. Place your cursor at the end of the current filter statement and delete =’CAN’. 5. After [Home Address Country], type the word IN. 6. On the left, under Person Data, single-click Home Address Country. 7. Click the Multiple Values icon.
8. Select both CAN and EGY by CTRL+clicking. 9. Add the selection to the pane on the right using the yellow arrow in the middle.
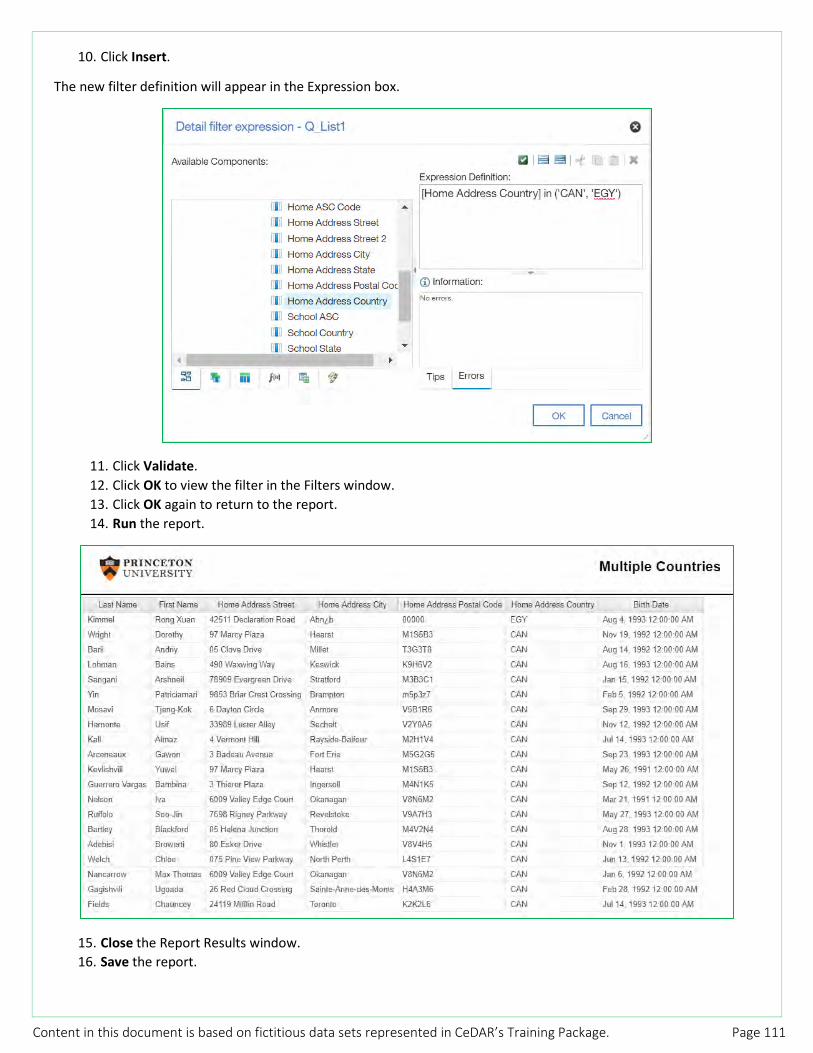
Content in this document is based on fictitious data sets represented in CeDAR’s Training Package. Page 111
10. Click Insert.
The new filter definition will appear in the Expression box.
11. Click Validate. 12. Click OK to view the filter in the Filters window. 13. Click OK again to return to the report. 14. Run the report.
15. Close the Report Results window. 16. Save the report.

Content in this document is based on fictitious data sets represented in CeDAR’s Training Package. Page 112
Filtering on a Date Range – Using “Between” The “between” expression allows the user to look for anything that happened within a range of dates, such as a start and end date.
In this exercise, we will filter on a range of dates.
1. Open the Pre-Filter report for editing and Save it as Filter by Dates. 2. Select the table. 3. From the contextual toolbar, click the Filters icon and select Edit Filters. 4. Click the Add icon. 5. Select Advanced. 6. From the Source tab, expand the Person Bio Query Subject to locate Birth Date and double-click to add it to
the Expression Definition box. 7. Your cursor should be at the end of the expression definition, enter a single space.
8. Type the following: between 1980-09-16 and 1999-12-31.
When using date-type fields in an expression, (like the Birth Date field), single quotes are not needed. Single quotes are needed for character-type fields, (like Name).
9. Click Validate to ensure there are no errors. 10. Click OK. 11. Click OK to close the Filters Window.
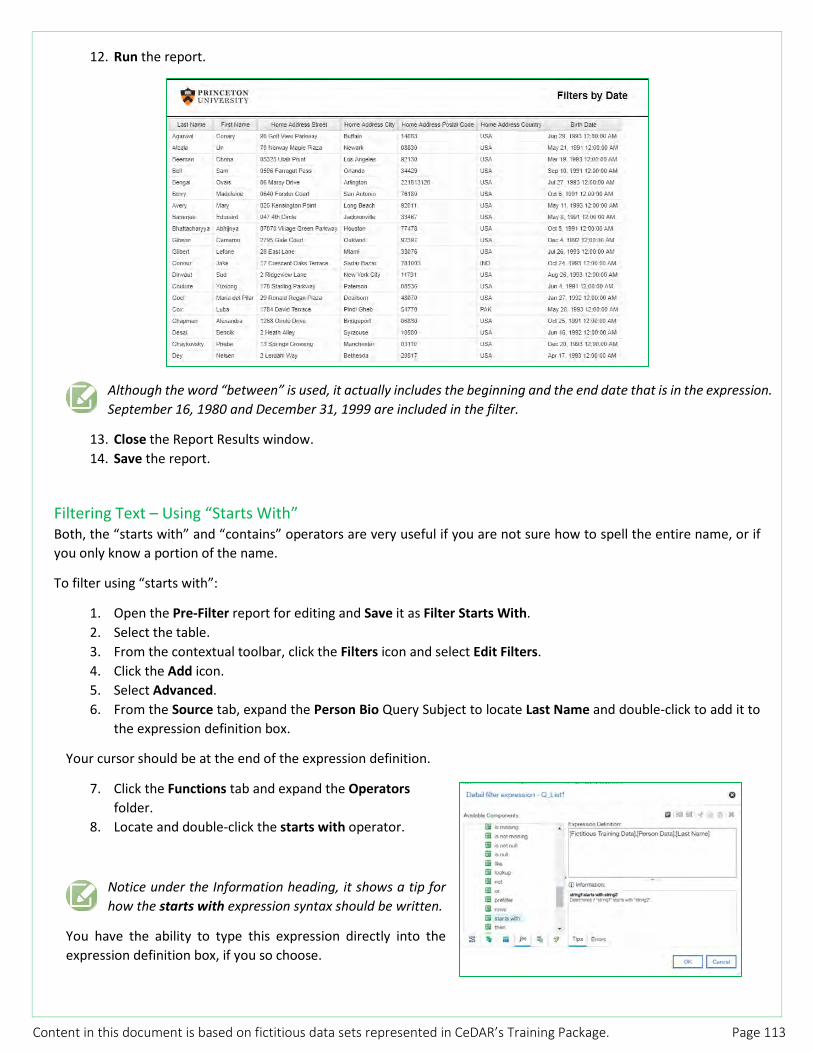
Content in this document is based on fictitious data sets represented in CeDAR’s Training Package. Page 113
12. Run the report.
Although the word “between” is used, it actually includes the beginning and the end date that is in the expression. September 16, 1980 and December 31, 1999 are included in the filter.
13. Close the Report Results window. 14. Save the report.
Filtering Text – Using “Starts With” Both, the “starts with” and “contains” operators are very useful if you are not sure how to spell the entire name, or if you only know a portion of the name.
To filter using “starts with”:
1. Open the Pre-Filter report for editing and Save it as Filter Starts With. 2. Select the table. 3. From the contextual toolbar, click the Filters icon and select Edit Filters. 4. Click the Add icon. 5. Select Advanced. 6. From the Source tab, expand the Person Bio Query Subject to locate Last Name and double-click to add it to
the expression definition box.
Your cursor should be at the end of the expression definition.
7. Click the Functions tab and expand the Operators folder.
8. Locate and double-click the starts with operator.
Notice under the Information heading, it shows a tip for how the starts with expression syntax should be written.
You have the ability to type this expression directly into the expression definition box, if you so choose.

Content in this document is based on fictitious data sets represented in CeDAR’s Training Package. Page 114
9. Position your cursor immediately after the starts with expression. 10. Open the Constants folder. 11. Double-click String.
12. Position your cursor between the single quotes. 13. Type am.
Whatever appears in the string, (in this case: am), must exactly match the record stored in the database table.
14. Click Validate. 15. If there are no errors, click OK to see the newly created filter. 16. Click OK. 17. Run the report to see all the people whose last names start with the letters “am”.
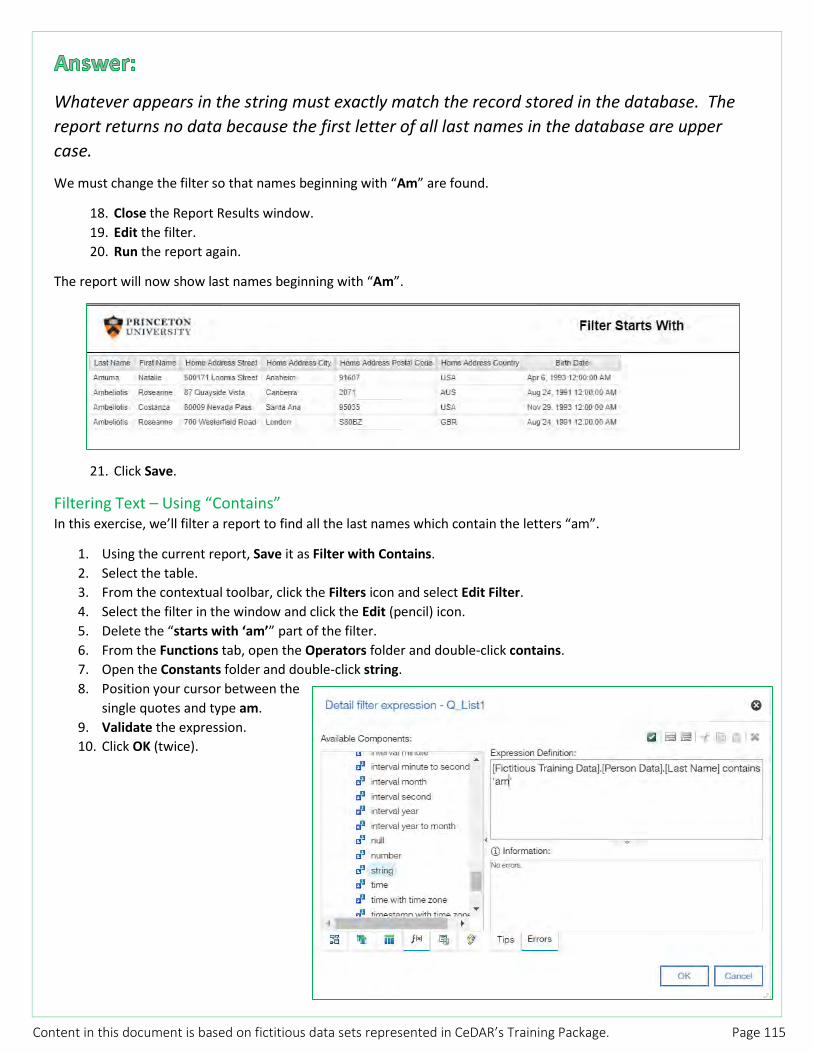
Content in this document is based on fictitious data sets represented in CeDAR’s Training Package. Page 115
Whatever appears in the string must exactly match the record stored in the database. The report returns no data because the first letter of all last names in the database are upper case.
We must change the filter so that names beginning with “Am” are found.
18. Close the Report Results window. 19. Edit the filter. 20. Run the report again.
The report will now show last names beginning with “Am”.
21. Click Save.
Filtering Text – Using “Contains” In this exercise, we’ll filter a report to find all the last names which contain the letters “am”.
1. Using the current report, Save it as Filter with Contains. 2. Select the table. 3. From the contextual toolbar, click the Filters icon and select Edit Filter. 4. Select the filter in the window and click the Edit (pencil) icon. 5. Delete the “starts with ‘am’” part of the filter. 6. From the Functions tab, open the Operators folder and double-click contains. 7. Open the Constants folder and double-click string. 8. Position your cursor between the
single quotes and type am. 9. Validate the expression. 10. Click OK (twice).

Content in this document is based on fictitious data sets represented in CeDAR’s Training Package. Page 116
11. Run the report to see all the last names that contain the letters ‘am’.
12. Close the Report Results window. 13. Click Save.
Filtering Using “Like” and Wildcards When trying to retrieve records that match a certain pattern, use the “Like” operator. You can use the “Like” operator in two different formats.
With a Wildcard %
• Using the percentage sign (%) allows you to match any string, of any length, including strings with zero length.
With an Underscore _
• Using an underscore (_) allows you to match on any single character.
In this exercise, we’ll apply a filter to return only records for people who live in a Postal Code which begins with “K”.
1. Using the previous report, Save it as Multiple Postal Codes. 2. Edit the filter. 3. From the Detail Filters tab, single-click the filter [Last Name] Contains ‘am’. Set the Usage to Disabled. 4. Click the Add icon.
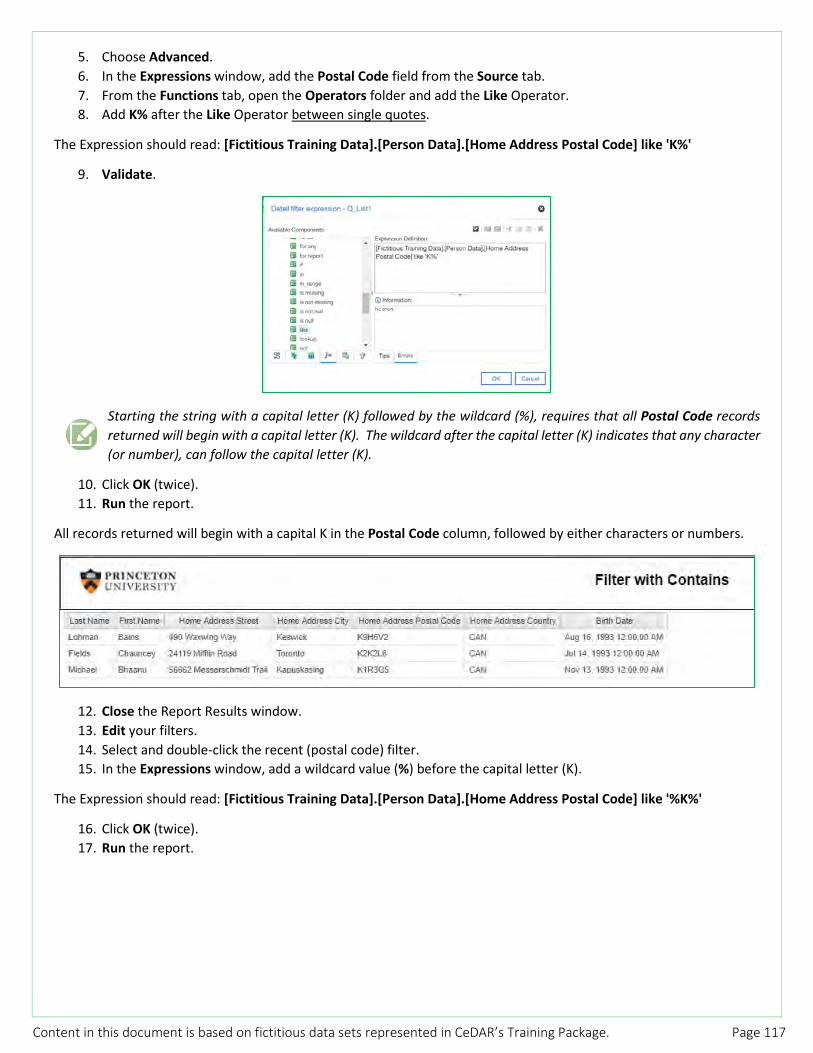
Content in this document is based on fictitious data sets represented in CeDAR’s Training Package. Page 117
5. Choose Advanced. 6. In the Expressions window, add the Postal Code field from the Source tab. 7. From the Functions tab, open the Operators folder and add the Like Operator. 8. Add K% after the Like Operator between single quotes.
The Expression should read: [Fictitious Training Data].[Person Data].[Home Address Postal Code] like 'K%'
9. Validate.
Starting the string with a capital letter (K) followed by the wildcard (%), requires that all Postal Code records returned will begin with a capital letter (K). The wildcard after the capital letter (K) indicates that any character (or number), can follow the capital letter (K).
10. Click OK (twice). 11. Run the report.
All records returned will begin with a capital K in the Postal Code column, followed by either characters or numbers.
12. Close the Report Results window. 13. Edit your filters. 14. Select and double-click the recent (postal code) filter. 15. In the Expressions window, add a wildcard value (%) before the capital letter (K).
The Expression should read: [Fictitious Training Data].[Person Data].[Home Address Postal Code] like '%K%'
16. Click OK (twice). 17. Run the report.

Content in this document is based on fictitious data sets represented in CeDAR’s Training Package. Page 118
Notice that more records appear now. Editing the filter to contain a wildcard before the capital letter (K) returns Postal Code records that do not begin with a capital K, but contain a capital K somewhere in the record.
Creating a Custom Filter Not all filters need to go through the process we’ve been following to create them. In some cases, we can filter on a particular field by creating a custom filter and selecting the value(s) we want.
1. Open the Pre-Filter report to edit. 2. Select the Home Address Country column header. 3. From the contextual toolbar, click the Filters icon. 4. From the drop-down, click Create Custom Filter.
A list of specific values for this particular column/field will appear.
5. Scroll to find USA. If USA is not found in the list when scrolling, use the Find feature and type all or part of ‘USA’.
6. Use the plus sign to add USA over to the column on the right.
7. Click OK. 8. Save the report as Custom Filter.

Content in this document is based on fictitious data sets represented in CeDAR’s Training Package. Page 119
Prompts Parameters and Prompts In Cognos Analytics, we use parameters and prompts to provide dynamic limits on a query.
When you create a filter in the filter window, your filter criteria remains static. Prompts allow the user to change their criteria each time they run the report. The filter dynamically changes when the user responds to the prompt.
A parameter is a placeholder that requires a value to determine what data to report on. This placeholder is a parameterized filter. Prompts ask the user to provide a value (or values) for the corresponding parameter. Prompts can be placed on a Prompt Page.
Every prompt will have an associated parameterized filter in the query. It is not necessary for every prompt to have a prompt page created.
In this chapter, we will explore three ways of creating parameters:
• Modifying an existing filter to create a parameterized filter • Creating a prompt page and then adding prompts onto the page • Using the “Building a Page” button
Modifying an existing filter to create a parameterized filter:
If you create a parameter for an item on the report, when the report is run, the user will be prompted to specify a value. Once a value is entered, the report runs containing the information according to the given value in the prompt.
Creating a prompt page and adding prompts onto the page:
If you add a prompt page to your report, the prompt page appears when you run the report. The prompt page can contain multiple prompts, and the prompts can be for items that are not on the report. The properties of a prompt on a prompt page can be changed to optional.
Prompt items can be added directly onto a report page. Drag the prompt object from the toolbox tab onto the report page next to a list, crosstab, or chart. When the report is run, the report appears with a prompt on the page, letting the user narrow the focus after the viewing of the initial report. (If you add a prompt directly onto a report page, the user will either need to set the prompt to automatically submit the selection, or add a “Finish” prompt button to the report so that the report will generate using the new criteria.)
Prompts are located in the Toolbox tab on the Left Navigation, under the Prompting section.
When the user selects items on a report and creates a prompt page, Cognos Analytics will choose an appropriate prompt type. However, if the user adds a prompt item to a report or prompt page, the user can choose any type of prompt available in the toolbox, according to their needs.

Content in this document is based on fictitious data sets represented in CeDAR’s Training Package. Page 120
The various prompt types and values are listed below:
Text Box Prompt Inserts a text box prompt control where users type in values. Use this control when you know exactly what data item you want to enter, such as a name or chart string.
Value Prompt Inserts a value prompt control where users select one or more values from a list. Use this control to show a list of possible values from which users can choose. The maximum number of items that can appear in a list is 5000.
Select & Search Prompt
Inserts an advanced prompt control where users search for values. Use this control instead of a value prompt if the list of values is very long, which can slow down performance.
Date & Time Prompt
Inserts a date and time prompt control where users select a date and time value. Use this control to filter a date/time or timestamp column. This control is useful for specifying ranges.
Date Prompt Inserts a date prompt control where users select a date value. Use this control to filter a data column to retrieve records for a specific day, a set of days, or a range of days.
Time Prompt Inserts a time prompt control where users select a time value. Use this control to restrict a report to a particular time or time range.
Interval Prompt Inserts an advanced prompt control where users enter time duration values. Use this control to retrieve data that is related to the passage of time.
Tree Prompt Inserts a data-driven prompt control that shows hierarchical information where users select one or more members.
Generated Prompt
Inserts a prompt control that acts as a placeholder. The report server will replace this control with an appropriate generated prompt control as if it was on a generated prompt page.
Prompt Button Inserts a predefined button used in prompt pages. Its usage changes according to its type property, which can be set to “Cancel”, “Back”, “Next”, “Finish”, or “Reprompt”.

Content in this document is based on fictitious data sets represented in CeDAR’s Training Package. Page 121
Building a Parameter Filter Let’s get started with prompts by building a parameter filter.
1. Open the Gender report for editing. 2. Save the report as Gender Parameter. 3. Run the report.
This report is a little hard to interpret. When we finished this report before, we filtered it to show only females. So that is all that’s being returned here. It’s hard to tell, since we cut the field from the view.
4. Close the Report Results window. 5. Edit the filter. (Select table, from the contextual toolbar, click the Filters icon, choose Edit Filters, select the
filter, click the pencil/edit button) 6. In the Expression window,
remove the single quotes on each side of the letter F and replace with question marks: ?F?
Placing question marks after the = changes the filter into a parameter filter.

Content in this document is based on fictitious data sets represented in CeDAR’s Training Package. Page 122
8. Click Validate.
You will notice that because the filter is now a parameter filter, validating the expression will open a prompt window.
9. Select a value (it doesn’t matter which). 10. Click OK.
The Information window will show No errors.
11. Click OK to return to the Filters window. 12. Click OK.
Let’s make the Gender field visible in our report to prove our upcoming results.
13. Click the Data Pane tab from the Left Navigation. 14. From this tab, click the Data Items tab (to the right of Source).
15. Select the Gender Query Item and move it to the end of your report. 16. Run the report. 17. Click the drop-down arrow in the prompt window. 18. Select Male. 19. Click OK.

Content in this document is based on fictitious data sets represented in CeDAR’s Training Package. Page 123
20. Close the Report Results window. 21. Save the report.
Because the prompt type is a parameter filter, we will not see any prompt pages listed under the Prompt Pages section of the Pages tab from the Left Navigation.

Content in this document is based on fictitious data sets represented in CeDAR’s Training Package. Page 124
Prompt Pages with Prompts In this lesson, we will continue to work with prompts.
1. Use the Pre Filter report (open to edit). 2. Save the report as Prompt Page. 3. From the Left Navigation, select the Pages icon/tab. 4. Click the Prompt pages folder.
As long as the Prompt Pages folder is selected and the Prompt Pages pane (to the right) is visible, clicking the + sign next to the word PAGES will add a new Prompt page. Likewise, if the Report Pages folder is selected, clicking the + sign next to the word PAGES will add a new Report page.
5. Click the + Sign next to the word PAGES to add a new prompt page.
A prompt page will appear in the Prompt Page pane.
6. Double-click PromptPage1 to open the prompt page to begin building it. 7. Click the + Sign in the middle of the window to activate a shortcut to the
Pinned section of the Toolbox pane. 8. Select Table. 9. Set the number of columns to “1” and the number of rows to “5”.
10. Click OK.

Content in this document is based on fictitious data sets represented in CeDAR’s Training Package. Page 125
11. From the Left Navigation, click the Toolbox tab and then expand the Textual section.
12. Select and drag over a Text Item into the first row in the table. This is so we can provide some instructions as to what the prompt will be doing.
13. In the Text Item window, type: Choose a Country 14. Click OK. 15. From the Left Navigation, under the Prompting section, select and drag over a Value Prompt into the third row
of the table.
A Prompt Wizard will open.
16. Name the new prompt: Country Prompt. 17. Click Next >.
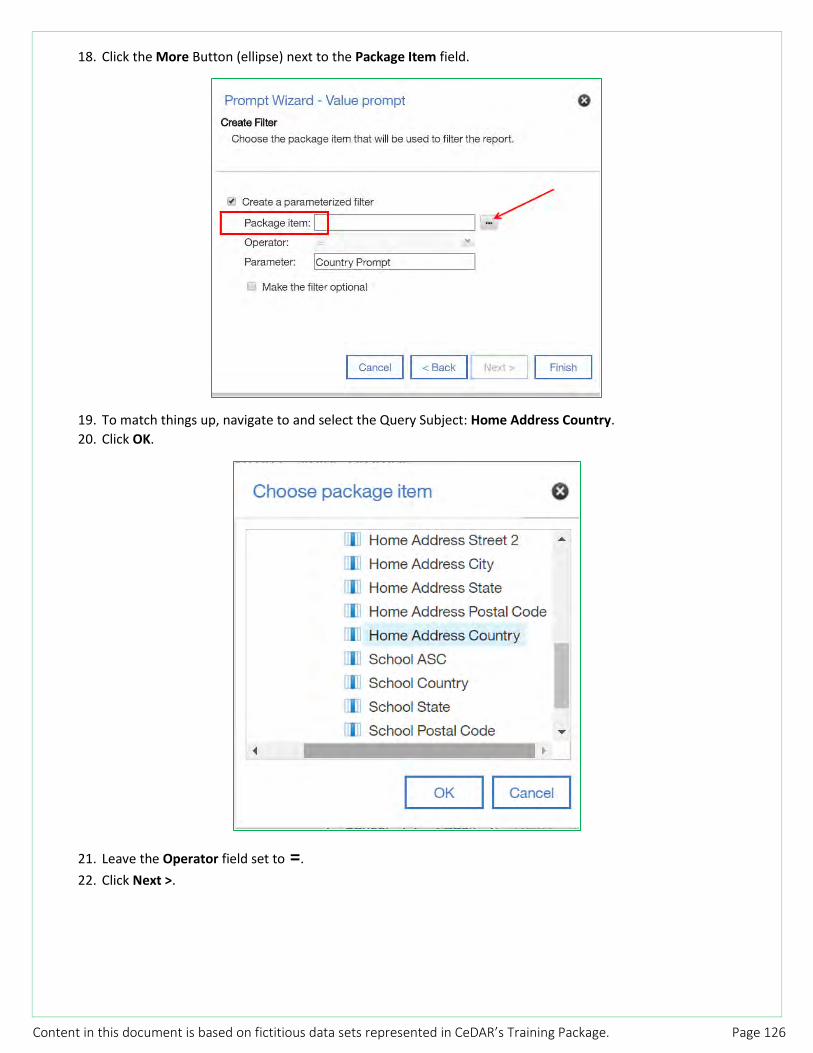
Content in this document is based on fictitious data sets represented in CeDAR’s Training Package. Page 126
18. Click the More Button (ellipse) next to the Package Item field.
19. To match things up, navigate to and select the Query Subject: Home Address Country. 20. Click OK.
21. Leave the Operator field set to =. 22. Click Next >.
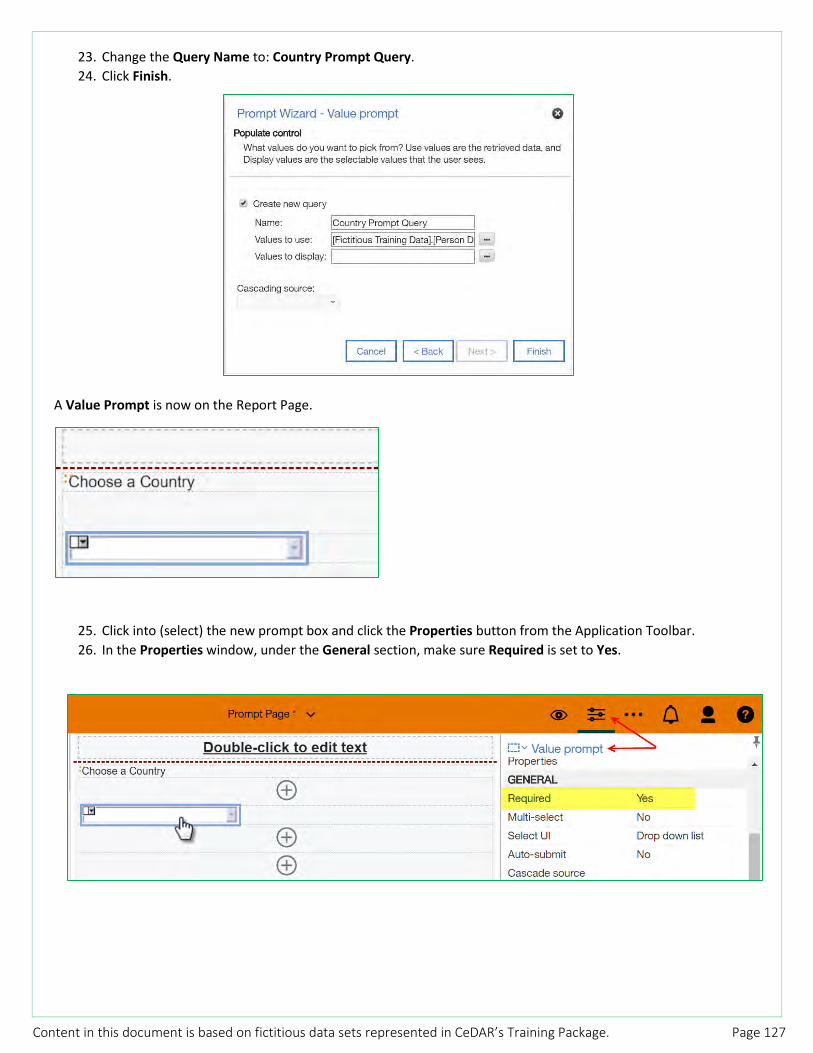
Content in this document is based on fictitious data sets represented in CeDAR’s Training Package. Page 127
23. Change the Query Name to: Country Prompt Query. 24. Click Finish.
A Value Prompt is now on the Report Page.
25. Click into (select) the new prompt box and click the Properties button from the Application Toolbar. 26. In the Properties window, under the General section, make sure Required is set to Yes.
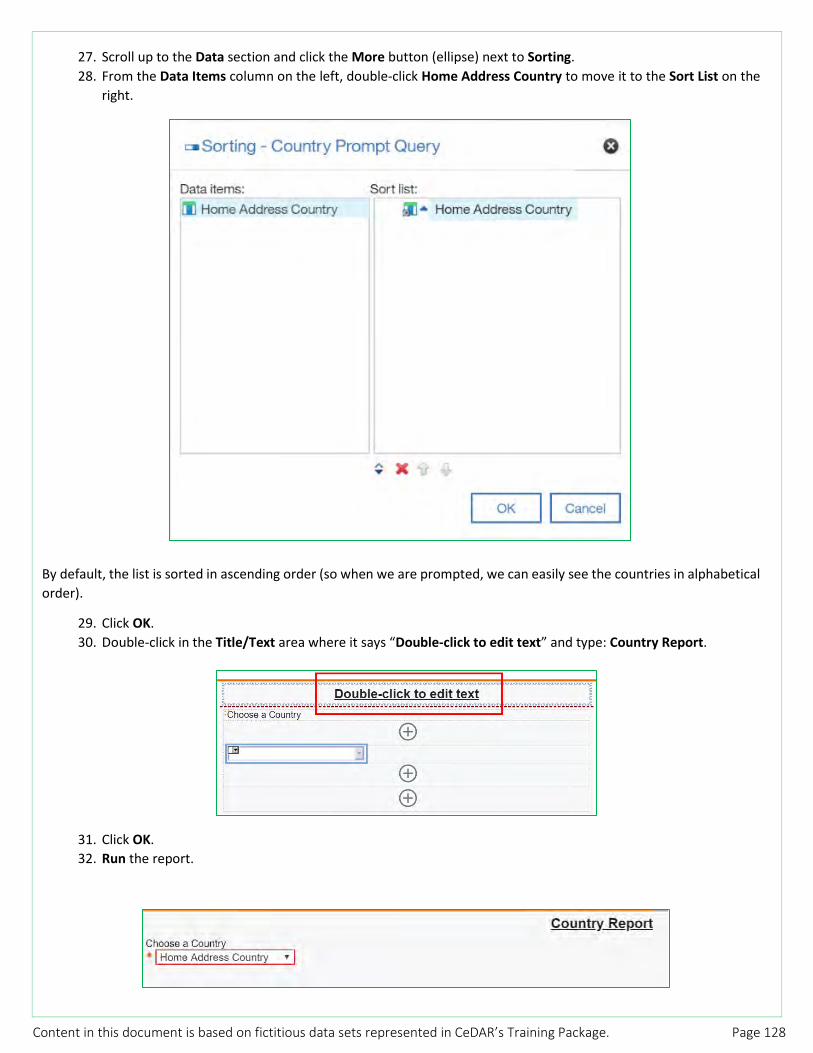
Content in this document is based on fictitious data sets represented in CeDAR’s Training Package. Page 128
27. Scroll up to the Data section and click the More button (ellipse) next to Sorting. 28. From the Data Items column on the left, double-click Home Address Country to move it to the Sort List on the
right.
By default, the list is sorted in ascending order (so when we are prompted, we can easily see the countries in alphabetical order).
29. Click OK. 30. Double-click in the Title/Text area where it says “Double-click to edit text” and type: Country Report.
31. Click OK. 32. Run the report.
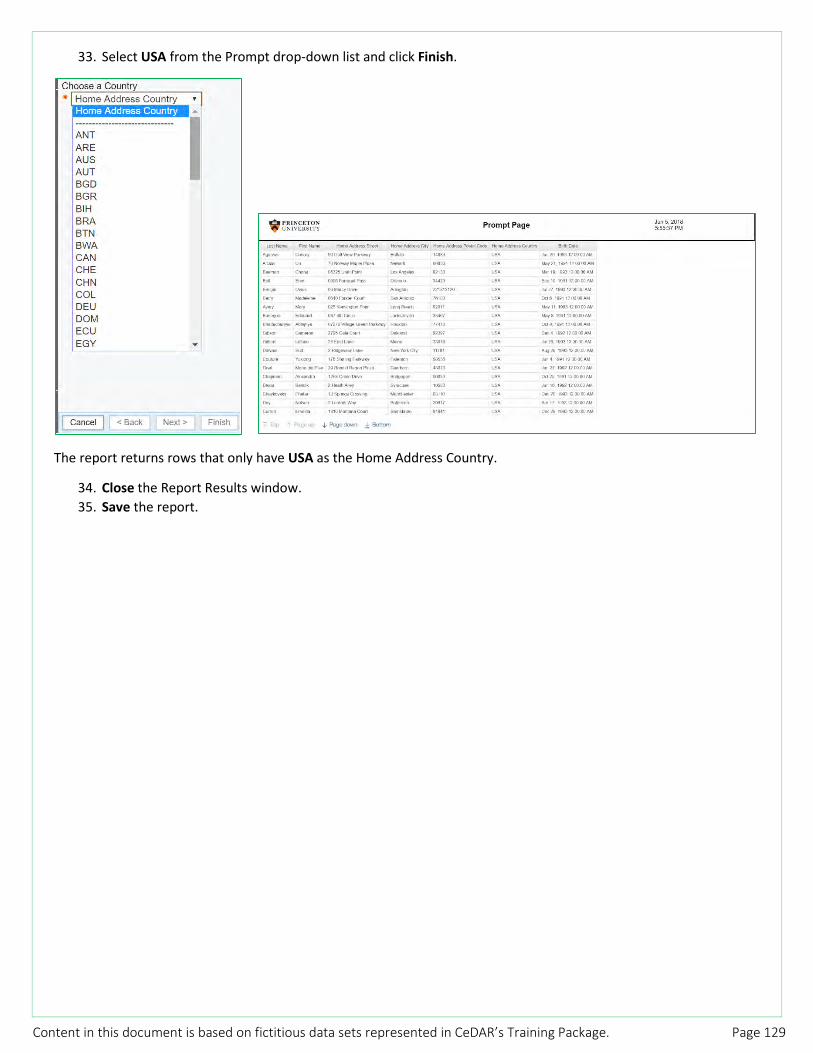
Content in this document is based on fictitious data sets represented in CeDAR’s Training Package. Page 129
33. Select USA from the Prompt drop-down list and click Finish.
The report returns rows that only have USA as the Home Address Country.
34. Close the Report Results window. 35. Save the report.

Content in this document is based on fictitious data sets represented in CeDAR’s Training Package. Page 130
Identify and Explore the Query and Parameter Filter When a prompt is created on a prompt page, an additional query is created by default. The Prompt also has a Parameterized Filter, which is created automatically.
Each time you build a prompt page, a filter is created so that the report data is narrowed down according to the user’s prompt response.
Using the Prompt Page report, explore the Queries tab from the Left Navigation:
1. From the Left Navigation, click the Queries tab. 2. Click the first Query (Q_List1) to select it and notice the list of data items that appear on the right. Also notice
the filter listed under the Detail Filters section.
3. From the Detail Filters section, double-click the Filter. 4. Notice the question marks in the syntax of the
expression. The question marks around Home Address Country indicate a prompt.
5. Now click the prompt we created (under Q_List1). Notice the changes to the Data Items and Detail Filters sections.
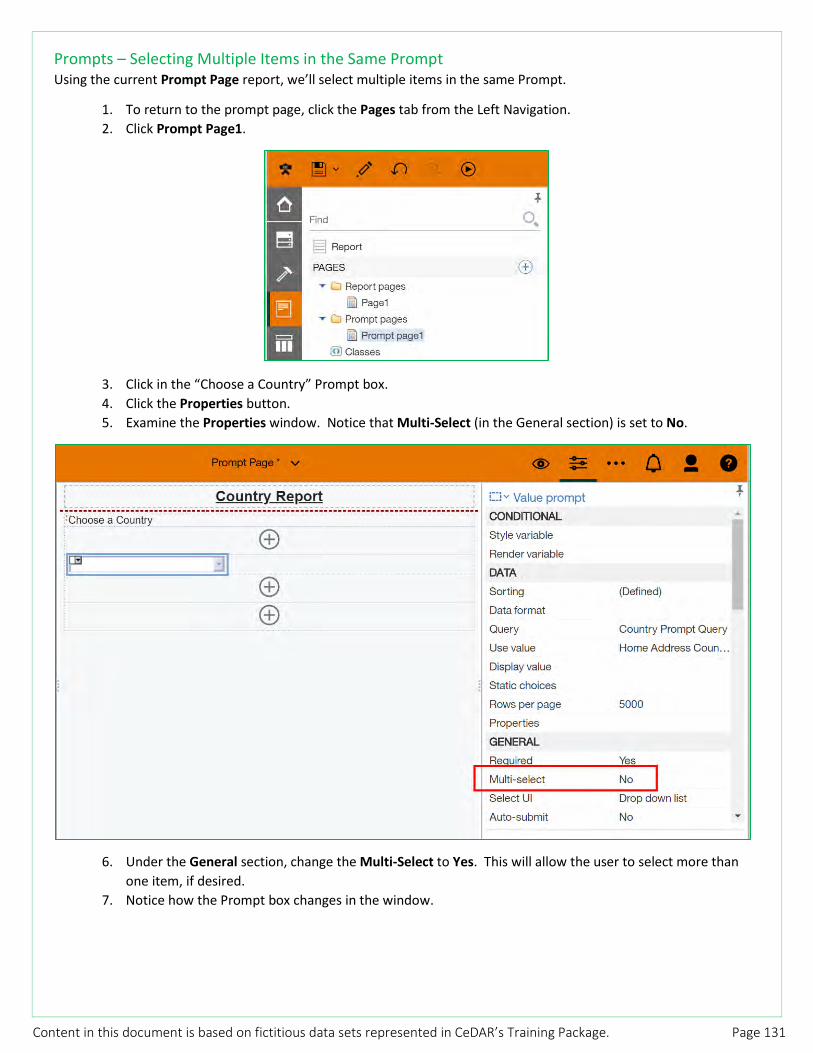
Content in this document is based on fictitious data sets represented in CeDAR’s Training Package. Page 131
Prompts – Selecting Multiple Items in the Same Prompt Using the current Prompt Page report, we’ll select multiple items in the same Prompt.
1. To return to the prompt page, click the Pages tab from the Left Navigation. 2. Click Prompt Page1.
3. Click in the “Choose a Country” Prompt box. 4. Click the Properties button. 5. Examine the Properties window. Notice that Multi-Select (in the General section) is set to No.
6. Under the General section, change the Multi-Select to Yes. This will allow the user to select more than one item, if desired.
7. Notice how the Prompt box changes in the window.

Content in this document is based on fictitious data sets represented in CeDAR’s Training Package. Page 132
8. From the Left Navigation, click the Queries tab. 9. Under the Queries section, click Q-List1.
10. Double-click the Filter.
We need to change the operator in the Parameterized filter so that the user can select more than one value with the associated prompt.
11. Change the Operator from “ = “ to “in”.
12. Click OK to return to the Filters window. 13. Click to the Pages tab from the Left Navigation and click Page1 to return to the Report page.
You will be prompted to choose a prompt here in order to validate the report. Choose any prompt. However, whatever prompt you choose here will be held in memory when you run your report.
14. Run the report. 15. When the Prompt window appears, hold down the ctrl key and click ANT, CAN, and USA. 16. Click Finish. 17. Click Page Down to find other countries in the list.
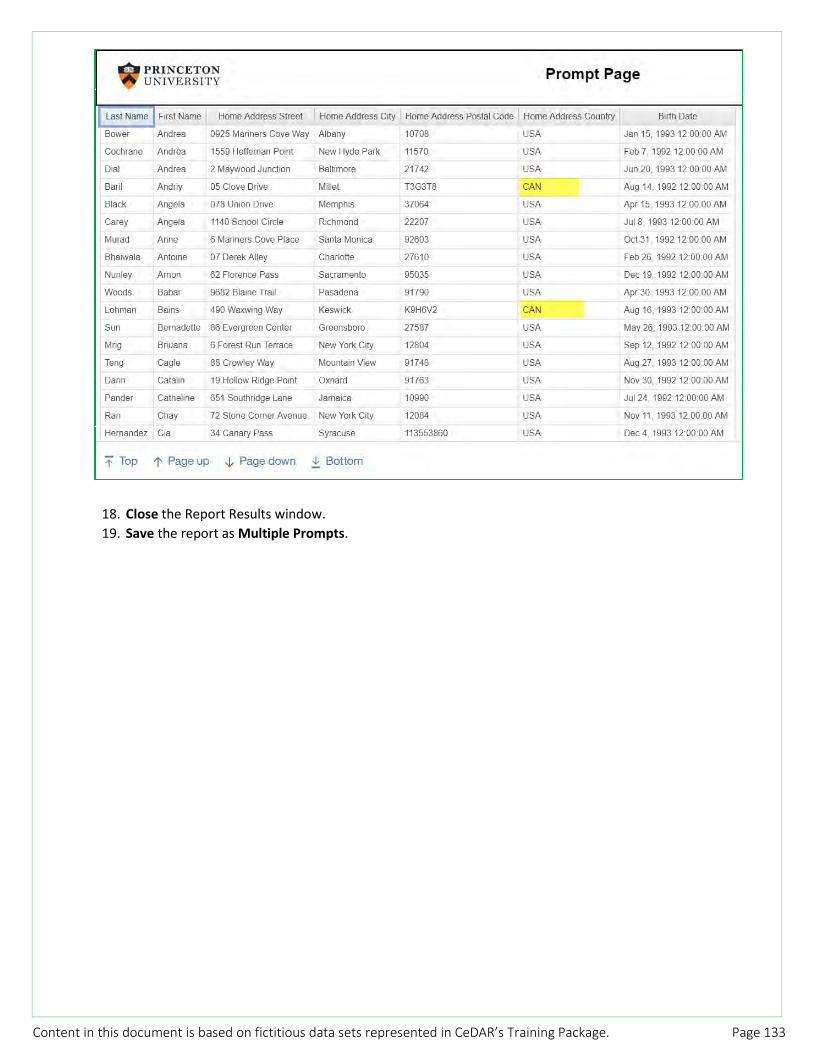
Content in this document is based on fictitious data sets represented in CeDAR’s Training Package. Page 133
18. Close the Report Results window. 19. Save the report as Multiple Prompts.
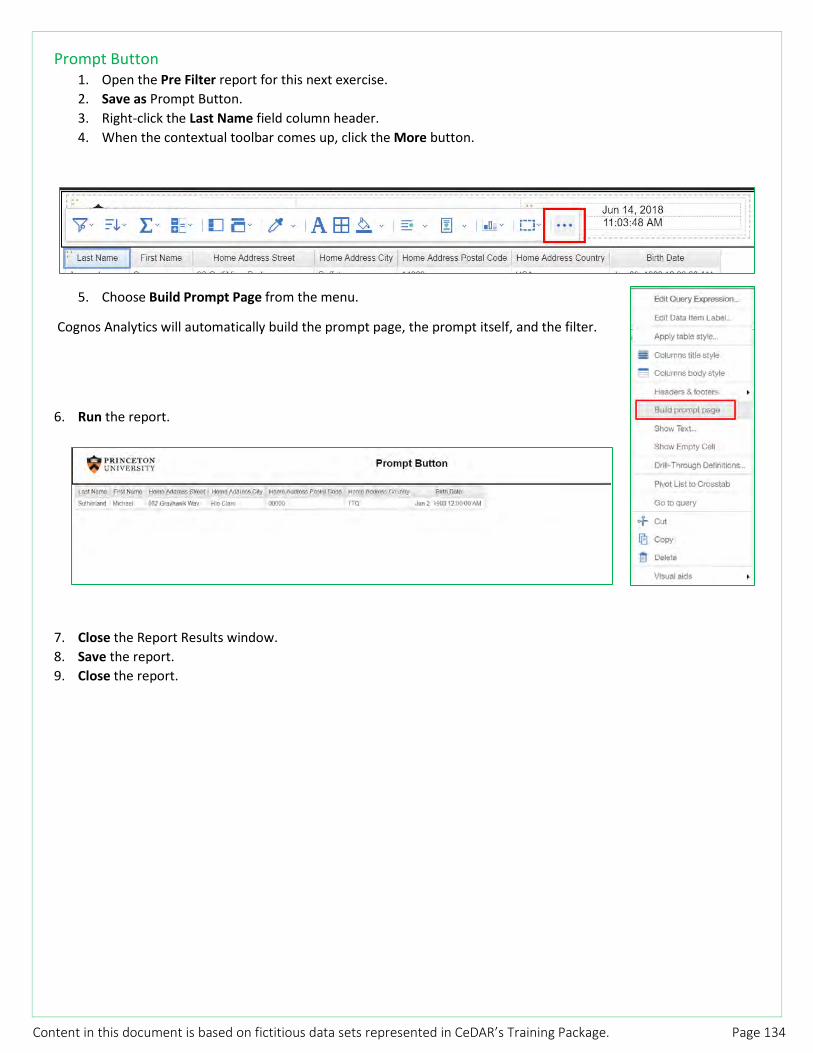
Content in this document is based on fictitious data sets represented in CeDAR’s Training Package. Page 134
Prompt Button 1. Open the Pre Filter report for this next exercise. 2. Save as Prompt Button. 3. Right-click the Last Name field column header. 4. When the contextual toolbar comes up, click the More button.
5. Choose Build Prompt Page from the menu.
Cognos Analytics will automatically build the prompt page, the prompt itself, and the filter.
6. Run the report.
7. Close the Report Results window. 8. Save the report. 9. Close the report.
Content in this document is based on fictitious data sets represented in CeDAR’s Training Package. Page 135
1. Can you create a filter on something that is not visible in the report?
2. If a filter has been applied to a report you’re trying to run, but you would like to trouble-shoot and run it without the filter -- is there a way to run the report without it being applied?
3. What would the appropriate Operator be in an expression used to filter on more than one item in a column? Is there more than one you can use?
Answers:
1. Yes. A filter can be created by using fields from either the Data Items or Source Tab. If the field used in the Filter is from the Data items tab, it is a field you have pulled into your report. You can CUT the field to make it disappear from your report but still be filtered on. You can also filter on an item that you have NOT brought into your report using the Source Tab in the Filter Expression box.
2. To run a report and not have the filter applied, you can disable the particular filter in the Filters window.
3. The Operator “IN” is needed to filter on more than one item in a column. Example: [Home Address Country] in (‘CAN’, ‘USA’) -- think of “in the list of” *If you use the operator “=” it will only return one item from a column. *If you use the operator “BETWEEN” it will only return values between a range (as in a range of birthdays).
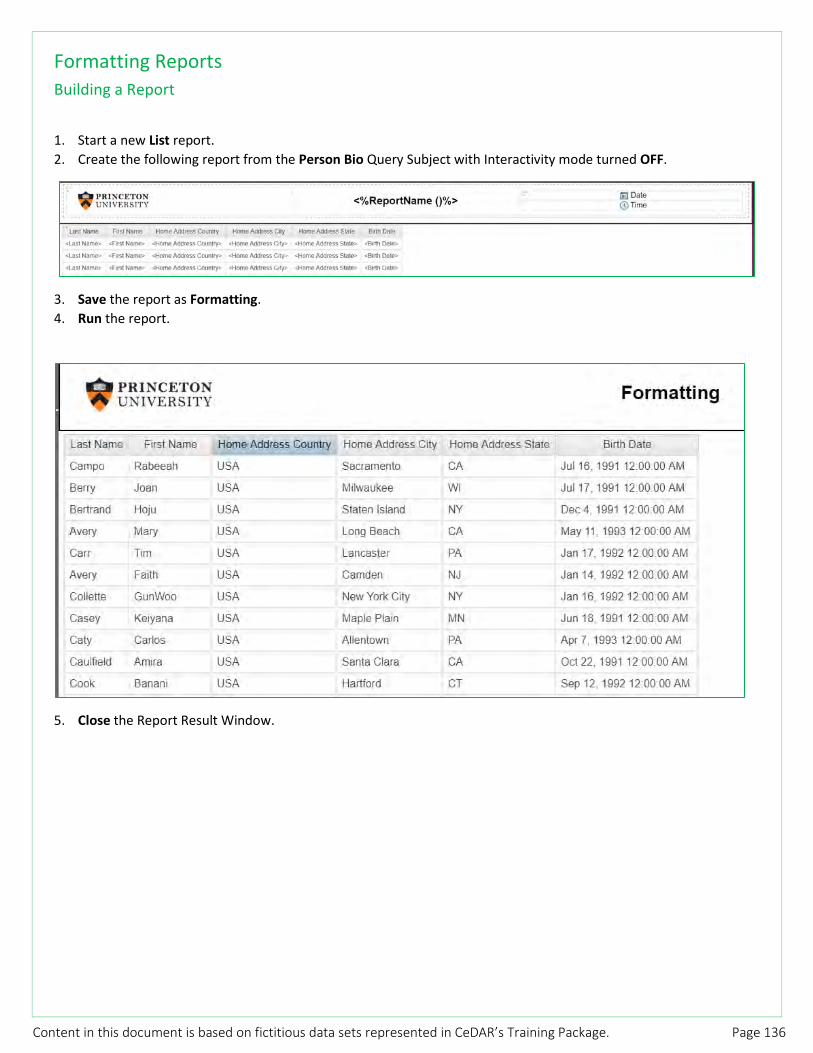
Content in this document is based on fictitious data sets represented in CeDAR’s Training Package. Page 136
Formatting Reports Building a Report
1. Start a new List report. 2. Create the following report from the Person Bio Query Subject with Interactivity mode turned OFF.
3. Save the report as Formatting. 4. Run the report.
5. Close the Report Result Window.
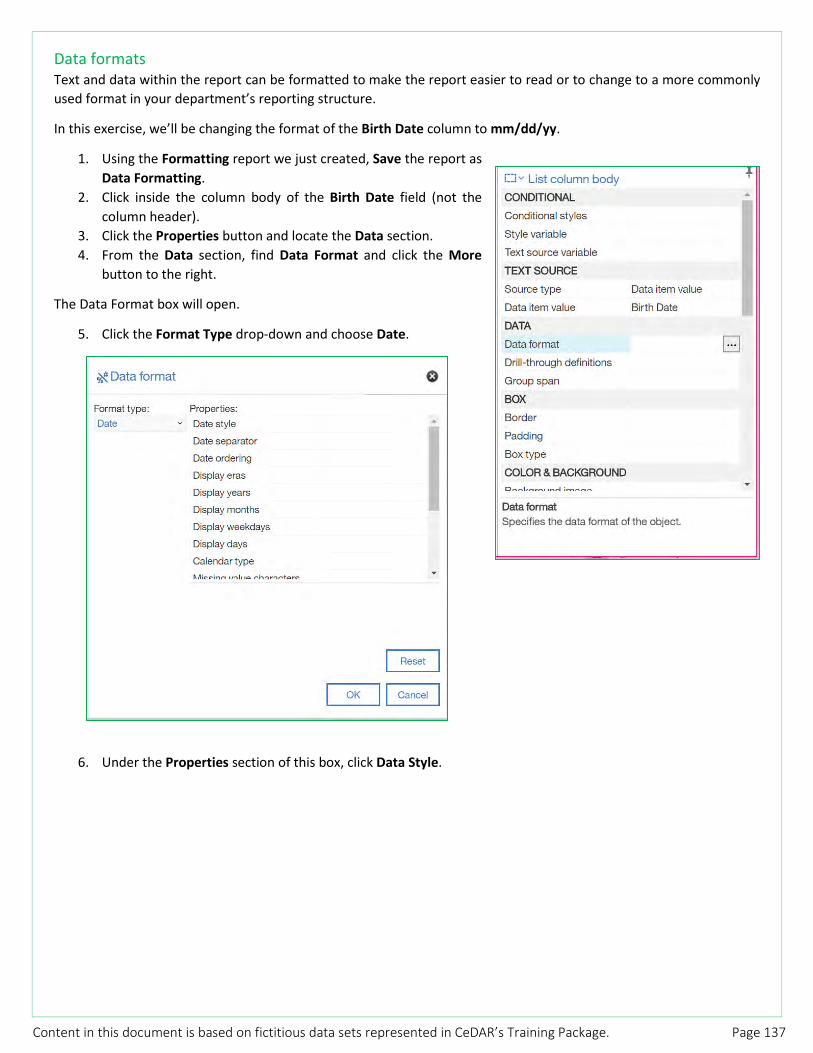
Content in this document is based on fictitious data sets represented in CeDAR’s Training Package. Page 137
Data formats Text and data within the report can be formatted to make the report easier to read or to change to a more commonly used format in your department’s reporting structure.
In this exercise, we’ll be changing the format of the Birth Date column to mm/dd/yy.
1. Using the Formatting report we just created, Save the report as Data Formatting.
2. Click inside the column body of the Birth Date field (not the column header).
3. Click the Properties button and locate the Data section. 4. From the Data section, find Data Format and click the More
button to the right.
The Data Format box will open.
5. Click the Format Type drop-down and choose Date.
6. Under the Properties section of this box, click Data Style.

Content in this document is based on fictitious data sets represented in CeDAR’s Training Package. Page 138
A drop-down arrow will appear on the right.
7. Choose Short and click OK. 8. Run the report.
9. Close the Report Results window. 10. Save the report.
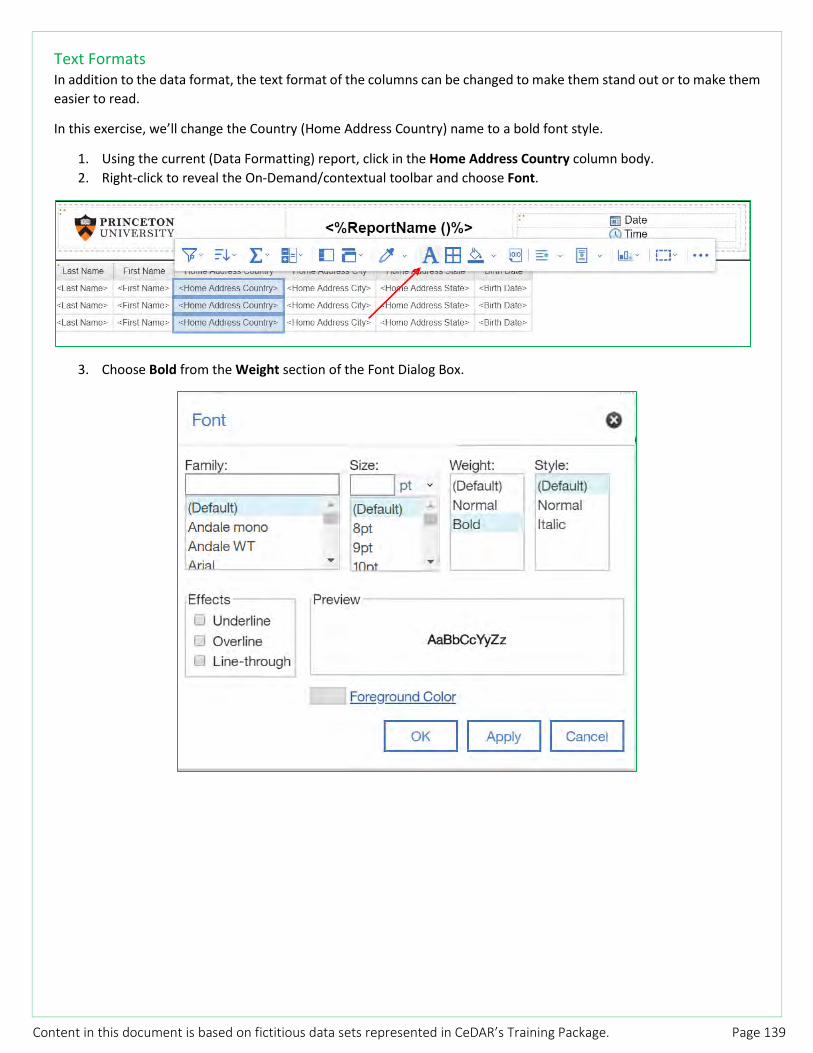
Content in this document is based on fictitious data sets represented in CeDAR’s Training Package. Page 139
Text Formats In addition to the data format, the text format of the columns can be changed to make them stand out or to make them easier to read.
In this exercise, we’ll change the Country (Home Address Country) name to a bold font style.
1. Using the current (Data Formatting) report, click in the Home Address Country column body. 2. Right-click to reveal the On-Demand/contextual toolbar and choose Font.
3. Choose Bold from the Weight section of the Font Dialog Box.

Content in this document is based on fictitious data sets represented in CeDAR’s Training Package. Page 140
4. Run the report.
5. Close the Report Results window. 6. Save the report as Formatting Text.
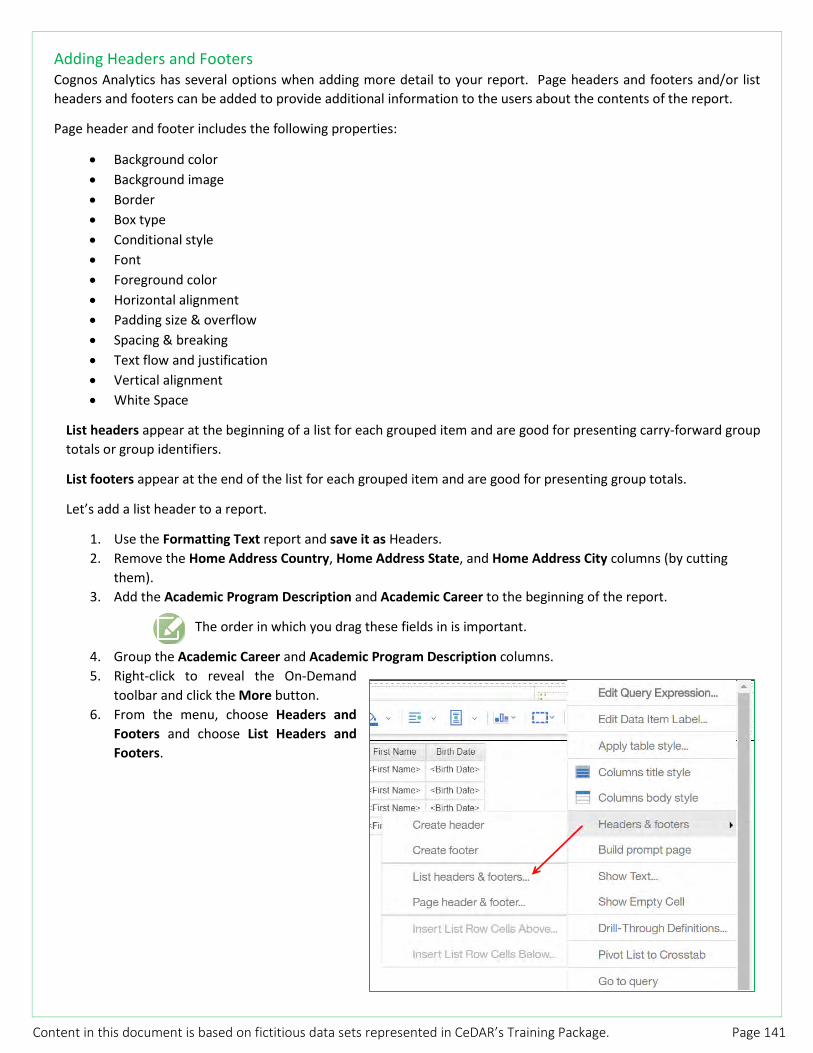
Content in this document is based on fictitious data sets represented in CeDAR’s Training Package. Page 141
Adding Headers and Footers Cognos Analytics has several options when adding more detail to your report. Page headers and footers and/or list headers and footers can be added to provide additional information to the users about the contents of the report.
Page header and footer includes the following properties:
• Background color • Background image • Border • Box type • Conditional style • Font • Foreground color • Horizontal alignment • Padding size & overflow • Spacing & breaking • Text flow and justification • Vertical alignment • White Space
List headers appear at the beginning of a list for each grouped item and are good for presenting carry-forward group totals or group identifiers.
List footers appear at the end of the list for each grouped item and are good for presenting group totals.
Let’s add a list header to a report.
1. Use the Formatting Text report and save it as Headers. 2. Remove the Home Address Country, Home Address State, and Home Address City columns (by cutting
them). 3. Add the Academic Program Description and Academic Career to the beginning of the report.
The order in which you drag these fields in is important.
4. Group the Academic Career and Academic Program Description columns. 5. Right-click to reveal the On-Demand
toolbar and click the More button. 6. From the menu, choose Headers and
Footers and choose List Headers and Footers.
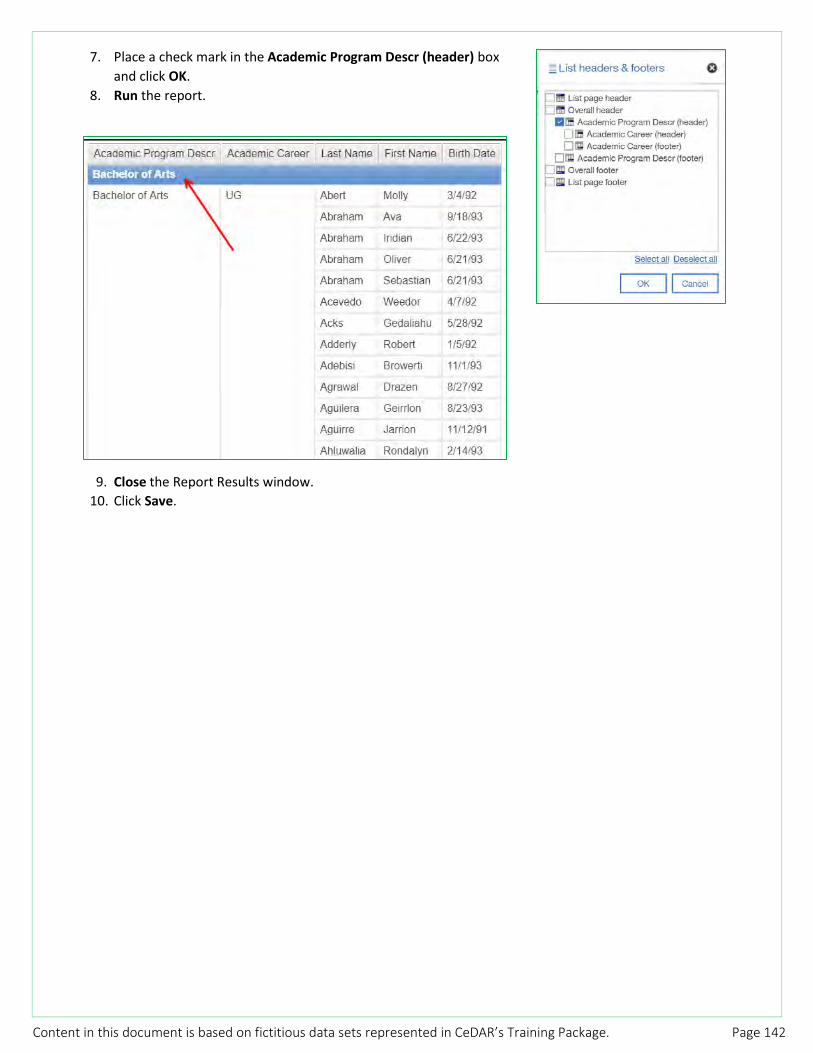
Content in this document is based on fictitious data sets represented in CeDAR’s Training Package. Page 142
7. Place a check mark in the Academic Program Descr (header) box and click OK.
8. Run the report.
9. Close the Report Results window. 10. Click Save.
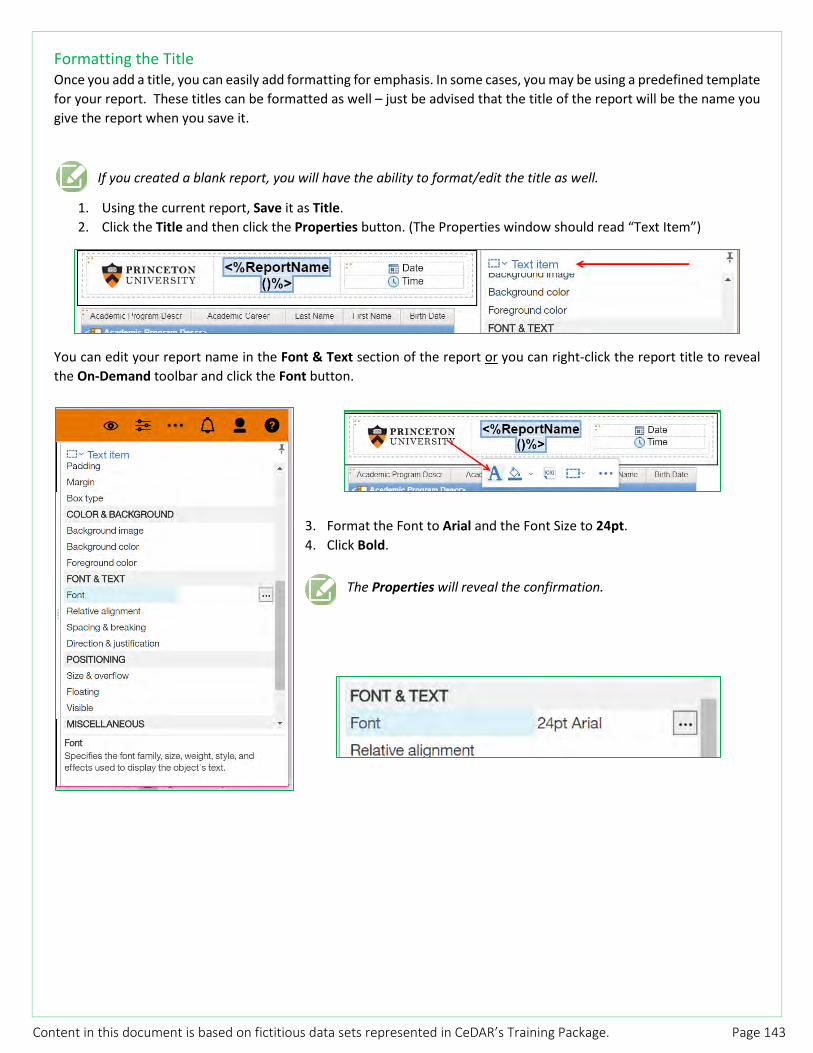
Content in this document is based on fictitious data sets represented in CeDAR’s Training Package. Page 143
Formatting the Title Once you add a title, you can easily add formatting for emphasis. In some cases, you may be using a predefined template for your report. These titles can be formatted as well – just be advised that the title of the report will be the name you give the report when you save it.
If you created a blank report, you will have the ability to format/edit the title as well.
1. Using the current report, Save it as Title. 2. Click the Title and then click the Properties button. (The Properties window should read “Text Item”)
You can edit your report name in the Font & Text section of the report or you can right-click the report title to reveal the On-Demand toolbar and click the Font button.
3. Format the Font to Arial and the Font Size to 24pt. 4. Click Bold.
The Properties will reveal the confirmation.

Content in this document is based on fictitious data sets represented in CeDAR’s Training Package. Page 144
5. Click OK. 6. Run the report. 7. Save the report.

Content in this document is based on fictitious data sets represented in CeDAR’s Training Package. Page 145
Adding a New Page Adding a new page enables you, as a report user, to add the page either as a title page before the body of the report, or as a secondary page that may serve as an additional reporting page, or as a summary.
Let’s add an Introduction Title Page.
1. Use the current report and Save it as Title Page. 2. From the Left Navigation, click the Pages tab. 3. With the Report Pages section selected, click the + button to add a new page. 4. Click and drag the newly created Page 2 above Page 1.
5. Double-click Page 2. 6. From the Properties window, scroll to the Miscellaneous section
and locate the Name field. 7. Rename Page2 to “Title Page”. 8. Under the Report Pages heading, double-click the Title Page.
9. Click the + button in the middle to add a Table with 1 column and 3 rows.
10. Click OK. 11. Save the report.

Content in this document is based on fictitious data sets represented in CeDAR’s Training Package. Page 146
Understanding the ‘Select Ancestor’ Button The Ancestor button allows the user to select a group of related elements in a report, to change their properties individually or as a whole.
In this exercise, we’ll make the entire table one type of format.
1. Using the current report, Title Page, click into the 3rd row of the table on the Title Page.
2. Click Properties.
Notice the Ancestor is set to the Table Cell level.
3. Click the Select Ancestor button.
All ancestors above the Table Cell level will appear.
4. Select Table (different from Table Cell).
The entire table will now be selected.
5. From the Font & Text section in the Properties pane, make the Font Bold and set the Horizontal Alignment to Center.
6. Click the Toolbox tab.

Content in this document is based on fictitious data sets represented in CeDAR’s Training Package. Page 147
7. Drag over a Text item and place it in the third row of the table.
8. Type “Students by Academic Program” in the text box and click OK.
The text is automatically bold and centered within the table.
9. Drag a second Text Item to the first row in the table. 10. Type “Princeton University”. 11. Run the report.
The title page displays first.
12. Click Page Down to see the next page of the report.
13. Close the Report Results window. 14. Save the report.

Content in this document is based on fictitious data sets represented in CeDAR’s Training Package. Page 148
Drill Throughs A Drill through is an operation which makes it possible to move from one report to another using the same analysis context. Drill throughs link two (or more) reports containing related information and appear in the source report as blue hyperlinks. Users click the hyperlink to select the value they want passed to the target report from the source report.
1. Navigate to Team Content > Training Data Reports > Cognos Analytics Class Reports > Drill Through – Parent Report.
2. Analyze the data.
We want to dig a little deeper. We’d like to be able to click on a particular student’s last name and see what their Academic Program Description is, which happens to be listed in another report we’ve written (hypothetically).
3. Select the Last Name Field Column (not header). 4. Right-click to reveal the On-Demand toolbar and click the More button. 5. Choose Drill Through Definitions.
The Drill-Through Definitions box opens up with the Target report tab active.
6. Click the Plus button to add a new drill through.

Content in this document is based on fictitious data sets represented in CeDAR’s Training Package. Page 149
7. Click the More button to navigate to/select the Drill Through – Child report. 8. Click OK.
The Last Names will now show a blue link.
9. Run the report. 10. Click the link of a Last Name in the list to drill through to the next report.
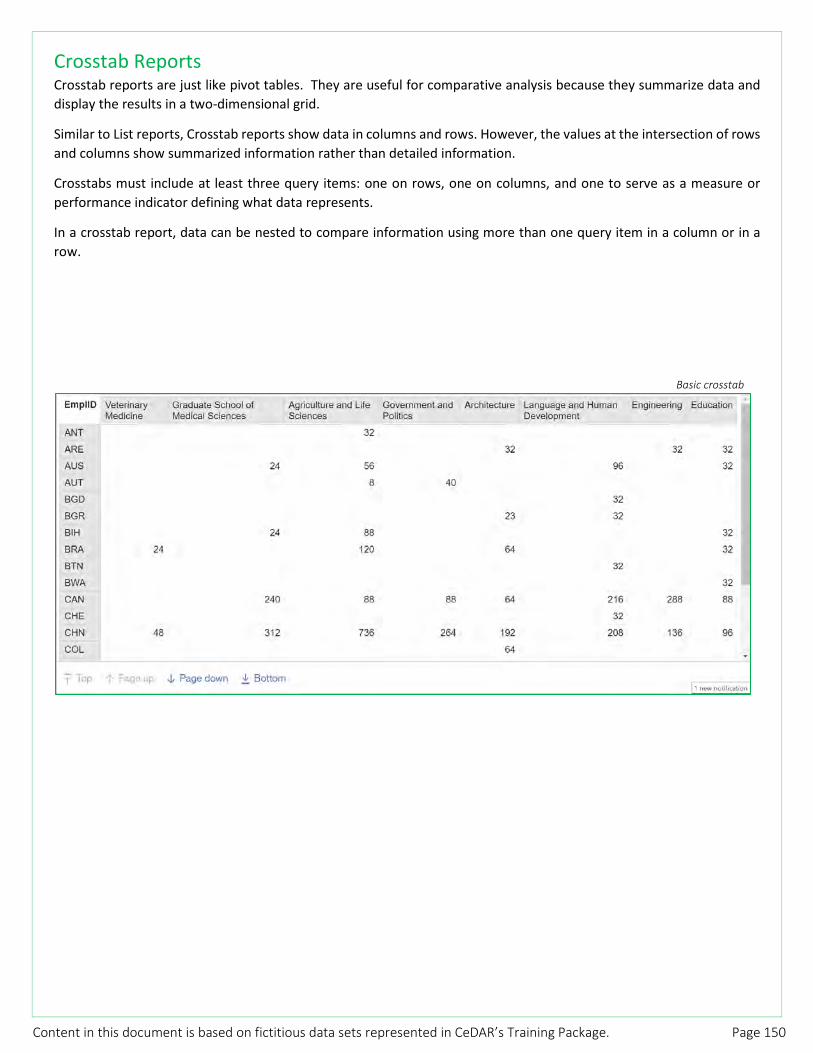
Content in this document is based on fictitious data sets represented in CeDAR’s Training Package. Page 150
Crosstab Reports Crosstab reports are just like pivot tables. They are useful for comparative analysis because they summarize data and display the results in a two-dimensional grid.
Similar to List reports, Crosstab reports show data in columns and rows. However, the values at the intersection of rows and columns show summarized information rather than detailed information.
Crosstabs must include at least three query items: one on rows, one on columns, and one to serve as a measure or performance indicator defining what data represents.
In a crosstab report, data can be nested to compare information using more than one query item in a column or in a row.
Basic crosstab
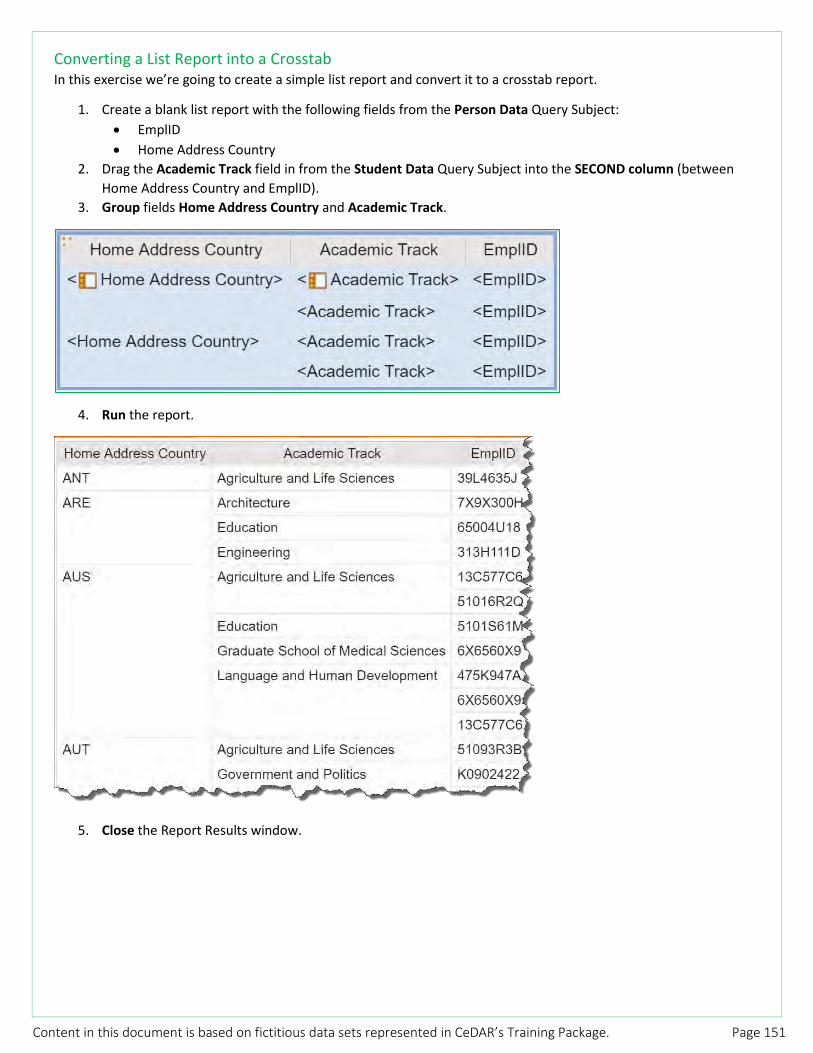
Content in this document is based on fictitious data sets represented in CeDAR’s Training Package. Page 151
Converting a List Report into a Crosstab In this exercise we’re going to create a simple list report and convert it to a crosstab report.
1. Create a blank list report with the following fields from the Person Data Query Subject: • EmplID • Home Address Country
2. Drag the Academic Track field in from the Student Data Query Subject into the SECOND column (between Home Address Country and EmplID).
3. Group fields Home Address Country and Academic Track.
4. Run the report.
5. Close the Report Results window.

Content in this document is based on fictitious data sets represented in CeDAR’s Training Package. Page 152
6. Select the EmplID List Column Body. 7. In the Properties pane, scroll to the Data Item section. 8. Set the Detail Aggregation to Count. 9. Set the Aggregate Summary to Total.
This step is crucial if we’re to convert this list report to a crosstab.
10. Click the Academic Track List Column Header. 11. Right-click to reveal the On-Demand toolbar. 12. Click the More button to reveal more menu options. 13. Select Pivot List to Crosstab.

Content in this document is based on fictitious data sets represented in CeDAR’s Training Package. Page 153
14. The report layout has changed from a list report to a crosstab with Academic Track as the Column, Home Address Country as the Row, and EmplID as the measure.
15. Sort Ascending on Home Address Country.
16. Run the report.
17. Close the Report Results window. 18. Save this report as Crosstab.
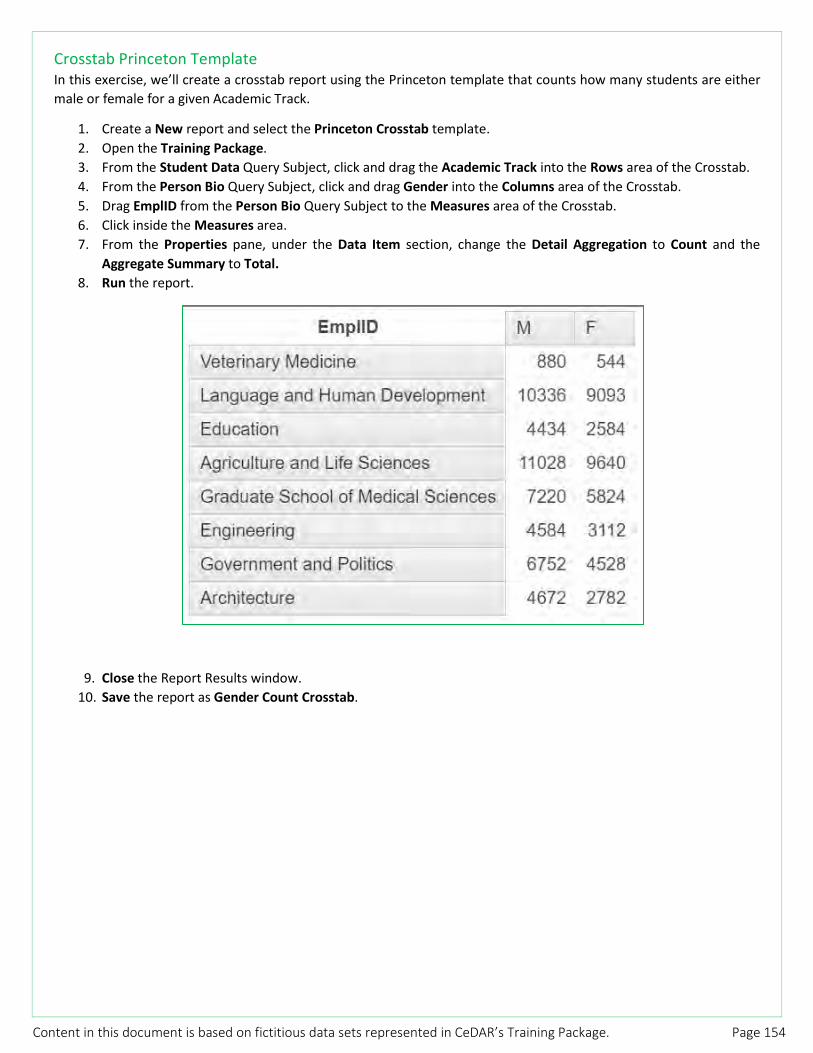
Content in this document is based on fictitious data sets represented in CeDAR’s Training Package. Page 154
Crosstab Princeton Template In this exercise, we’ll create a crosstab report using the Princeton template that counts how many students are either male or female for a given Academic Track.
1. Create a New report and select the Princeton Crosstab template. 2. Open the Training Package. 3. From the Student Data Query Subject, click and drag the Academic Track into the Rows area of the Crosstab. 4. From the Person Bio Query Subject, click and drag Gender into the Columns area of the Crosstab. 5. Drag EmplID from the Person Bio Query Subject to the Measures area of the Crosstab. 6. Click inside the Measures area. 7. From the Properties pane, under the Data Item section, change the Detail Aggregation to Count and the
Aggregate Summary to Total. 8. Run the report.
9. Close the Report Results window. 10. Save the report as Gender Count Crosstab.

Content in this document is based on fictitious data sets represented in CeDAR’s Training Package. Page 155
Nested Crosstabs In this exercise, we’ll nest data in a crosstab report to compare information using more than one query item in a column or row.
1. Open the Crosstab report. 2. Save it as Nested Crosstab.
In this report, the Home Address Country data item represents the rows and Academic Track data item represents the columns.
3. Right-click the header row to reveal the On-Demand toolbar and select the Swap Rows and Columns icon.
At this time, after making the swap, the Academic Track data item represents the rows and the Home Address Country data item represents the columns.
4. From the Source tab, click and drag the Academic Department data item into the report beside Academic Track.
The columns are now nested.

Content in this document is based on fictitious data sets represented in CeDAR’s Training Package. Page 156
5. Run the report and scroll to see all the countries.
6. Close the Report Results window. 7. Save the report.

Content in this document is based on fictitious data sets represented in CeDAR’s Training Package. Page 157
Crosstab with Totals Let’s add totals to the current report.
1. Use the Nested Crosstab report. 2. Select the Measure area of the report. 3. Right-click to reveal the On-Demand toolbar and click the Summarize icon.
4. Select Total.
Totals are now added to the report.
5. Run the report.
6. Close the Report Results window. 7. Save the report as Crosstab with Totals.

Content in this document is based on fictitious data sets represented in CeDAR’s Training Package. Page 158
Creating a Mail Merge/Letter 1. Create a New report with a blank template. 2. From the report type options, choose Table. 3. Format the table with 1 column and 10 rows. 4. Click OK.
You’ll notice each row is populated with the Add button which allows you to bring data into your table.
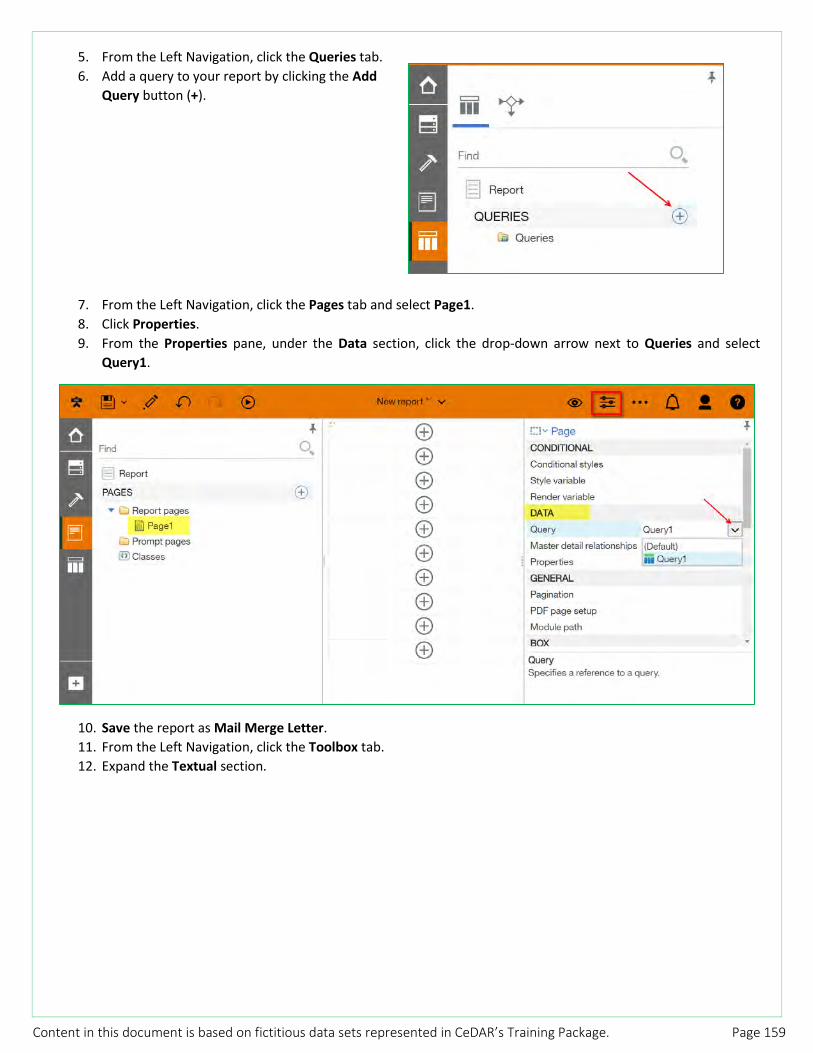
Content in this document is based on fictitious data sets represented in CeDAR’s Training Package. Page 159
5. From the Left Navigation, click the Queries tab. 6. Add a query to your report by clicking the Add
Query button (+).
7. From the Left Navigation, click the Pages tab and select Page1. 8. Click Properties. 9. From the Properties pane, under the Data section, click the drop-down arrow next to Queries and select
Query1.
10. Save the report as Mail Merge Letter. 11. From the Left Navigation, click the Toolbox tab. 12. Expand the Textual section.

Content in this document is based on fictitious data sets represented in CeDAR’s Training Package. Page 160
13. Click and drag Date over to the first row in the report.
14. Right-click to reveal the On-demand toolbar and click the drop-down beside the Alignment button. 15. Select Right to change the Date field from the Default alignment to Right-alignment.
16. From the Toolbox tab, drag a Text item into the second row. 17. In the text box, insert at least 20 spaces.
This will create an open space within the report.
18. Click OK.

Content in this document is based on fictitious data sets represented in CeDAR’s Training Package. Page 161
19. From the Data Pane tab, navigate to the Training Package. 20. From the Person Bio Data Query Subject, expand the Person Data folder. 21. Drag First Name and Last Name into Row 3 of the table.
22. To create a salutation on our letter, double-click the First Name field to open the Data Item Expression window. 23. Place your cursor at the beginning of the filter expression window and type ‘Dear ’ (**making sure there’s a
space inserted before the single closing quote). 24. To insert a space between the word “Dear” and <First Name>, click the Functions tab and scroll to find ||.
Double-click || to bring it into the expression. 25. Place your cursor at the end of the expression and add an additional || followed by a single quote, a space, and
another single quote.
Your expression should look like this: 'Dear ' || [Fictitious Training Data].[Person Data].[First Name] || ' '
26. Click the Validate button to ensure there are no errors.
27. Click OK. 28. Double-click the Last Name field to open the Data item expression window.
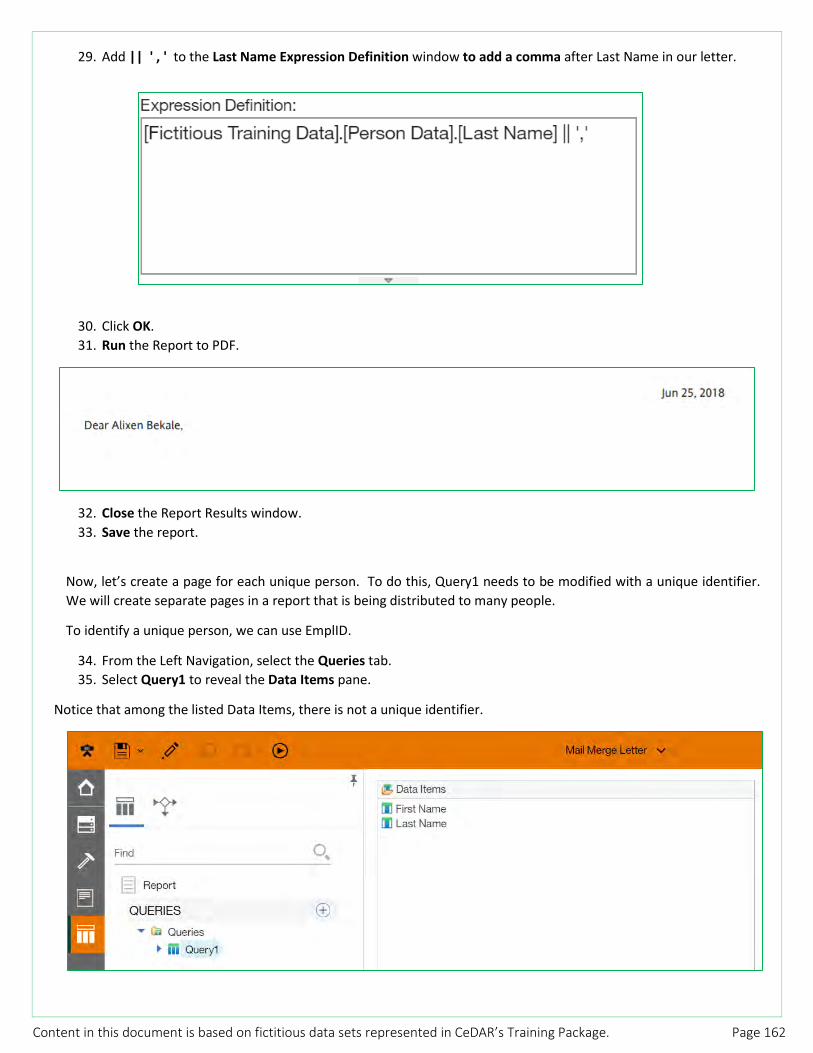
Content in this document is based on fictitious data sets represented in CeDAR’s Training Package. Page 162
29. Add || ' , ' to the Last Name Expression Definition window to add a comma after Last Name in our letter.
30. Click OK. 31. Run the Report to PDF.
32. Close the Report Results window. 33. Save the report.
Now, let’s create a page for each unique person. To do this, Query1 needs to be modified with a unique identifier. We will create separate pages in a report that is being distributed to many people.
To identify a unique person, we can use EmplID.
34. From the Left Navigation, select the Queries tab. 35. Select Query1 to reveal the Data Items pane.
Notice that among the listed Data Items, there is not a unique identifier.
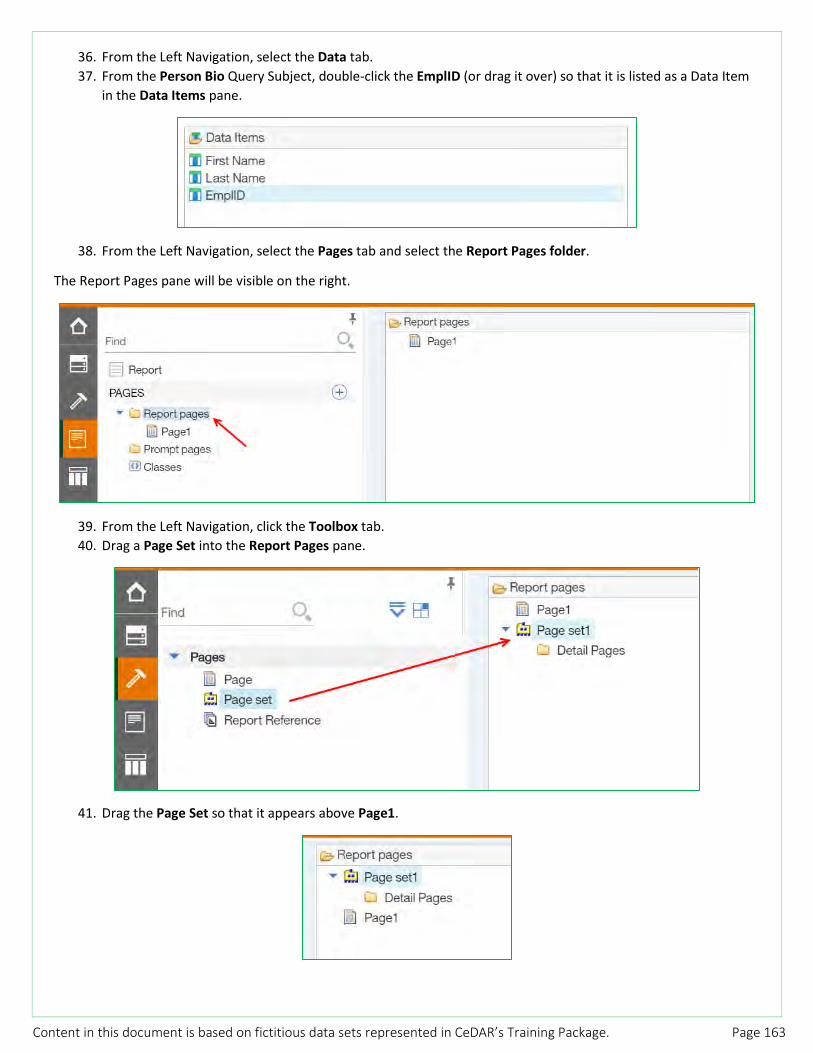
Content in this document is based on fictitious data sets represented in CeDAR’s Training Package. Page 163
36. From the Left Navigation, select the Data tab. 37. From the Person Bio Query Subject, double-click the EmplID (or drag it over) so that it is listed as a Data Item
in the Data Items pane.
38. From the Left Navigation, select the Pages tab and select the Report Pages folder.
The Report Pages pane will be visible on the right.
39. From the Left Navigation, click the Toolbox tab. 40. Drag a Page Set into the Report Pages pane.
41. Drag the Page Set so that it appears above Page1.
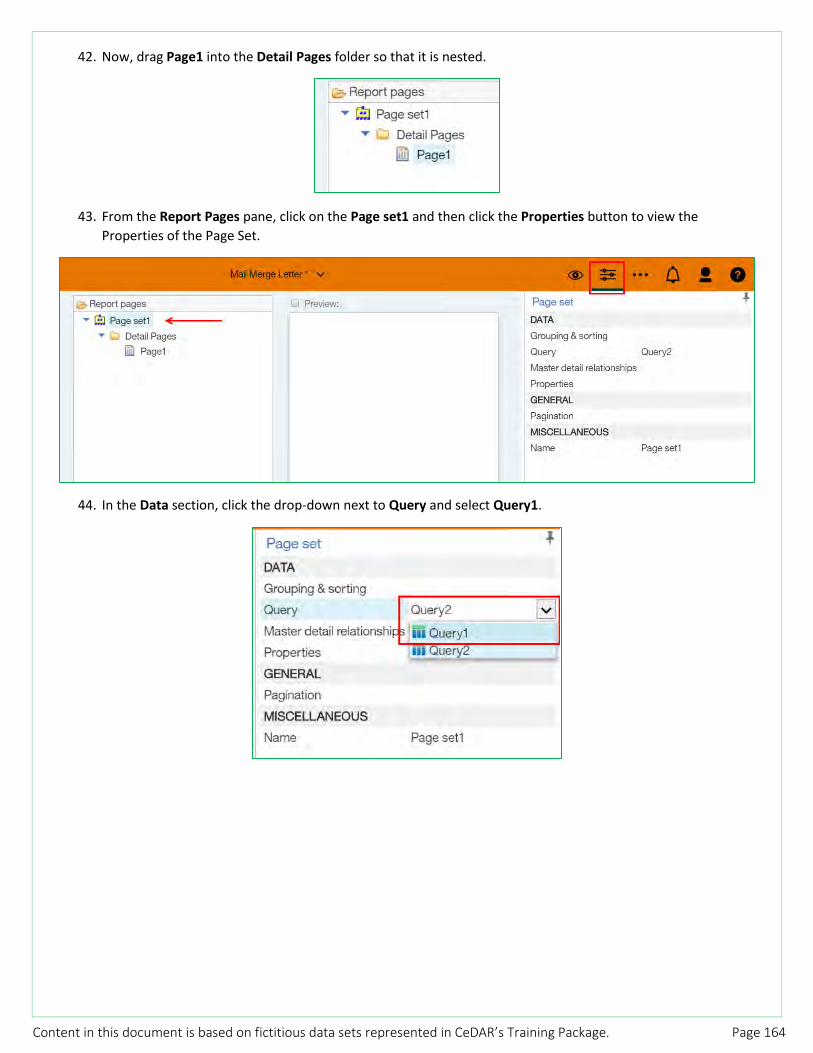
Content in this document is based on fictitious data sets represented in CeDAR’s Training Package. Page 164
42. Now, drag Page1 into the Detail Pages folder so that it is nested.
43. From the Report Pages pane, click on the Page set1 and then click the Properties button to view the Properties of the Page Set.
44. In the Data section, click the drop-down next to Query and select Query1.
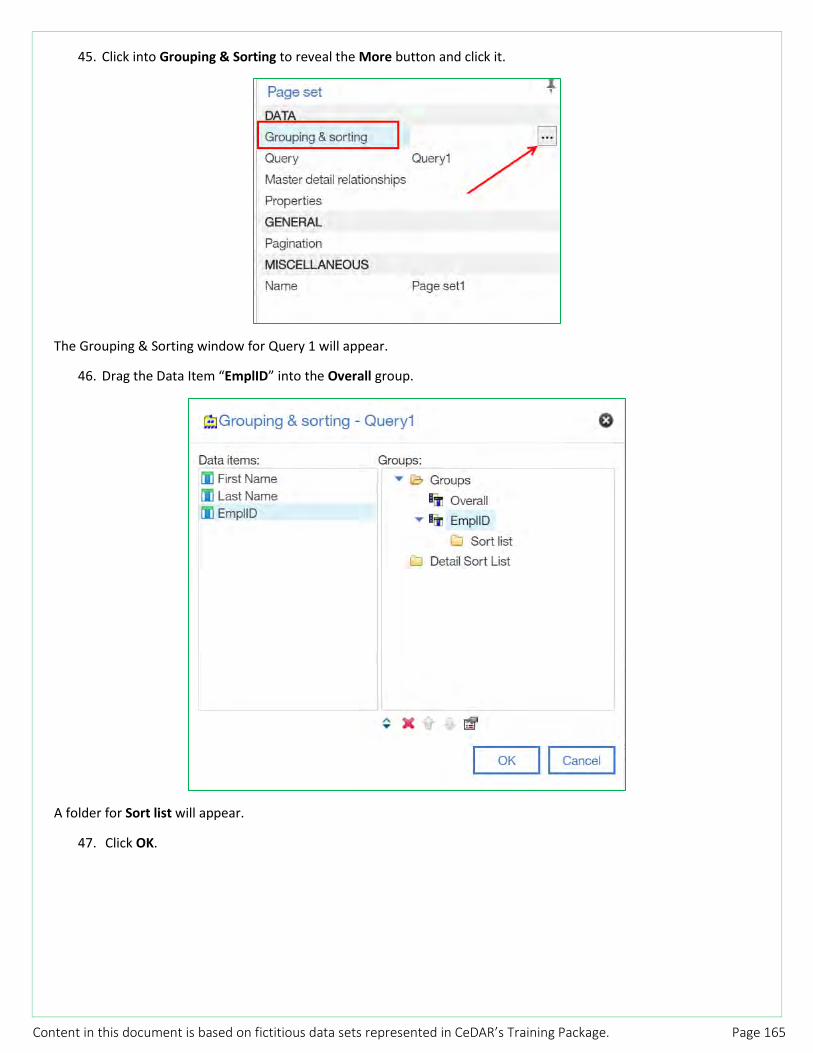
Content in this document is based on fictitious data sets represented in CeDAR’s Training Package. Page 165
45. Click into Grouping & Sorting to reveal the More button and click it.
The Grouping & Sorting window for Query 1 will appear.
46. Drag the Data Item “EmplID” into the Overall group.
A folder for Sort list will appear.
47. Click OK.

Content in this document is based on fictitious data sets represented in CeDAR’s Training Package. Page 166
48. From the Left Navigation, click the Pages tab and select Page1. 49. Select and then right-click in the second row (where we added a blank row) to reveal the On-Demand
Toolbar. 50. Click the More button to reveal the contextual menu and select Copy.
51. Paste the copied row into Row 4 by using the On-Demand toolbar (or keyboard shortcut: CTRL V). 52. From the Left Navigation, click the Toolbox tab and insert a Text Item into Row 5. 53. In the Text window, type the following: Welcome to the University Community. We hope you will join us for
opening ceremonies on Sept. 3 at 11am in the University Assembly Hall. 54. Click OK. 55. From the Application Toolbar, click the Page Views button and set
the view to Page Preview.
This allows us to see, at a glance, a preview of our report without running it.
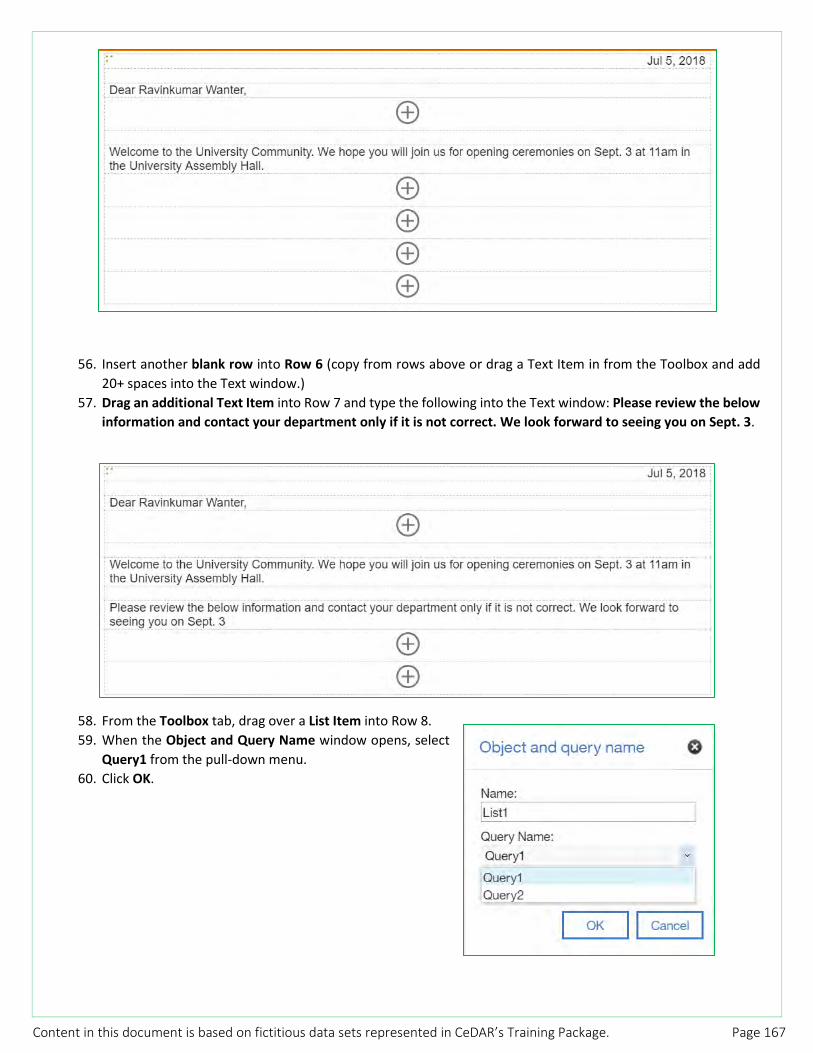
Content in this document is based on fictitious data sets represented in CeDAR’s Training Package. Page 167
56. Insert another blank row into Row 6 (copy from rows above or drag a Text Item in from the Toolbox and add 20+ spaces into the Text window.)
57. Drag an additional Text Item into Row 7 and type the following into the Text window: Please review the below information and contact your department only if it is not correct. We look forward to seeing you on Sept. 3.
58. From the Toolbox tab, drag over a List Item into Row 8. 59. When the Object and Query Name window opens, select
Query1 from the pull-down menu. 60. Click OK.

Content in this document is based on fictitious data sets represented in CeDAR’s Training Package. Page 168
61. From the Left Navigation, select the Data tab and expand the Student Class Data Query Subject. 62. Using the CTRL key, (CTRL + Click)
• Academic Program • Academic Program Descr • Academic Track • Academic Dept
63. Drag these fields into the List. 64. Run the Report.
65. Close the Report Results window. 66. Save the report.
Let’s add some space (a row) between the last paragraph and the List. To do this:
67. Select the entire List. 68. Right-click to reveal the On-Demand Toolbar and click the More button. 69. Select Insert > Rows above
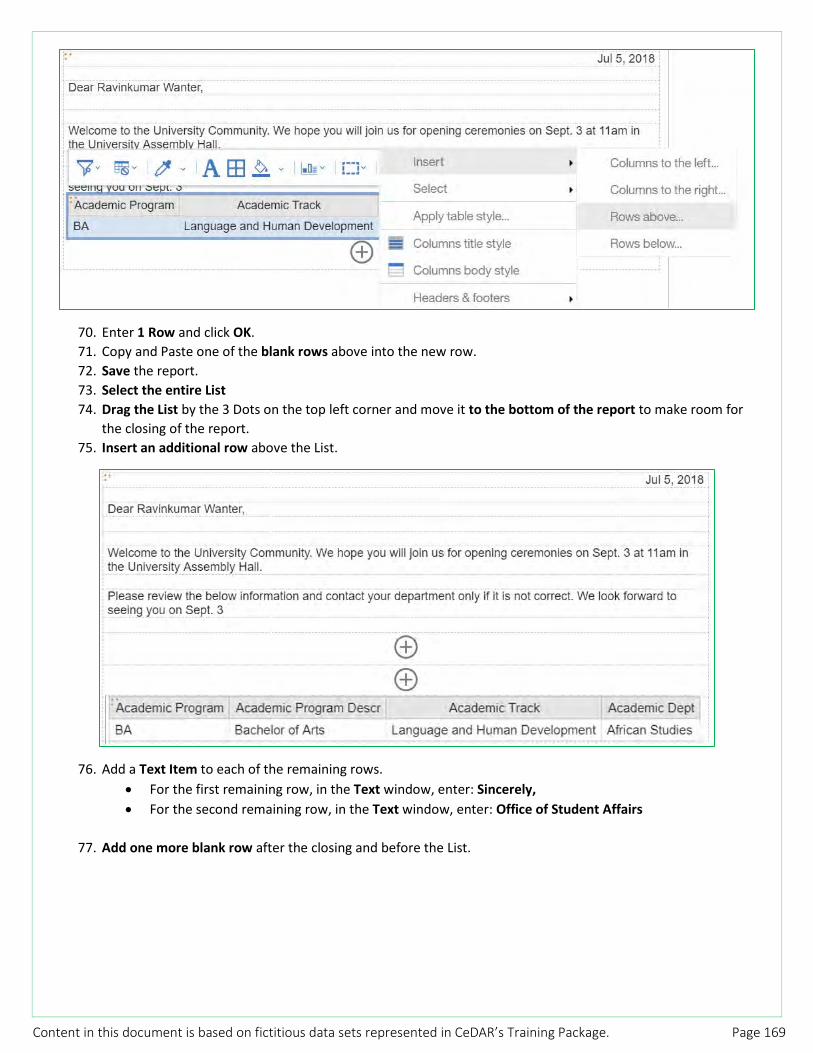
Content in this document is based on fictitious data sets represented in CeDAR’s Training Package. Page 169
70. Enter 1 Row and click OK. 71. Copy and Paste one of the blank rows above into the new row. 72. Save the report. 73. Select the entire List 74. Drag the List by the 3 Dots on the top left corner and move it to the bottom of the report to make room for
the closing of the report. 75. Insert an additional row above the List.
76. Add a Text Item to each of the remaining rows. • For the first remaining row, in the Text window, enter: Sincerely, • For the second remaining row, in the Text window, enter: Office of Student Affairs
77. Add one more blank row after the closing and before the List.
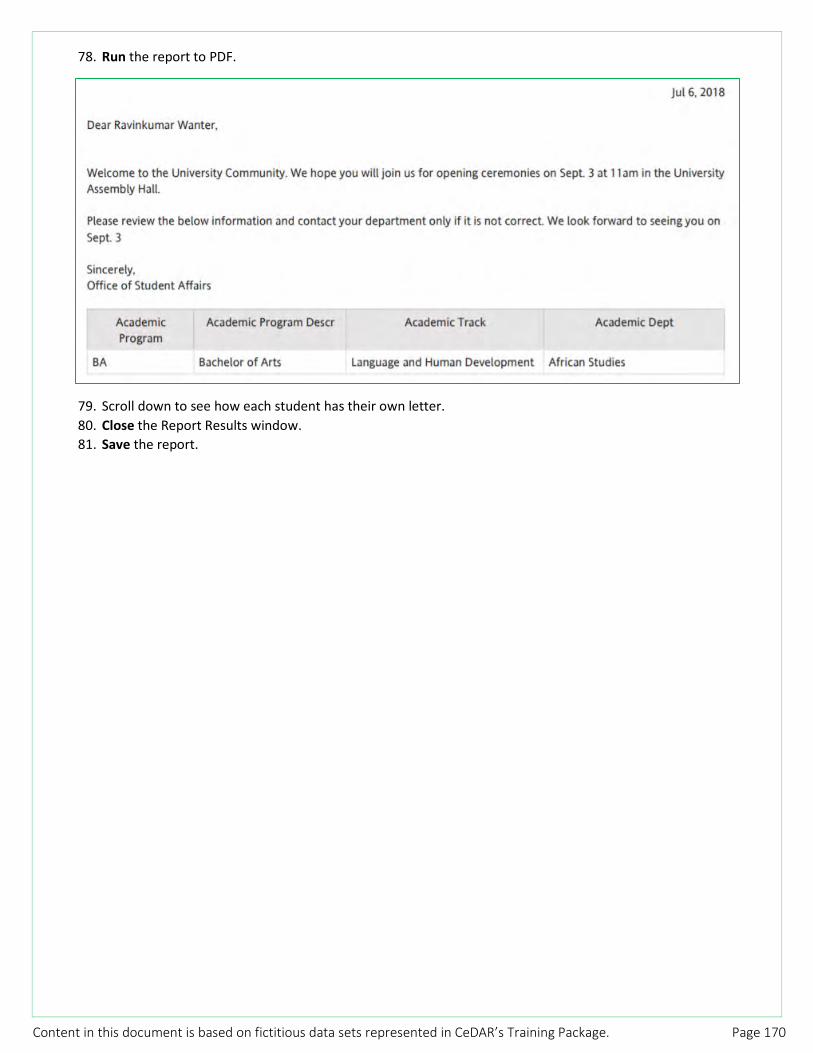
Content in this document is based on fictitious data sets represented in CeDAR’s Training Package. Page 170
78. Run the report to PDF.
79. Scroll down to see how each student has their own letter. 80. Close the Report Results window. 81. Save the report.
Content in this document is based on fictitious data sets represented in CeDAR’s Training Package. Page 171
Thank you for attending!
Additional documentation is being developed. As an
addendum to this guide, we will be including a chapter on
Dashboards as well as working with uploaded spreadsheets.
Questions?
Please feel free to email me directly, [email protected]